Eminence, KY Map & Demographics
Eminence Map
Eminence Overview
$24,139
PER CAPITA INCOME
$69,194
AVG FAMILY INCOME
$48,793
AVG HOUSEHOLD INCOME
29.1%
WAGE / INCOME GAP [ % ]
70.9¢/ $1
WAGE / INCOME GAP [ $ ]
0.43
INEQUALITY / GINI INDEX
2,705
TOTAL POPULATION
1,327
MALE POPULATION
1,378
FEMALE POPULATION
96.30
MALES / 100 FEMALES
103.84
FEMALES / 100 MALES
36.6
MEDIAN AGE
3.2
AVG FAMILY SIZE
2.5
AVG HOUSEHOLD SIZE
1,234
LABOR FORCE [ PEOPLE ]
59.9%
PERCENT IN LABOR FORCE
6.6%
UNEMPLOYMENT RATE
Eminence Zip Codes
Eminence Area Codes
Income in Eminence
Income Overview in Eminence
Per Capita Income in Eminence is $24,139, while median incomes of families and households are $69,194 and $48,793 respectively.
| Characteristic | Number | Measure |
| Per Capita Income | 2,705 | $24,139 |
| Median Family Income | 676 | $69,194 |
| Mean Family Income | 676 | $79,220 |
| Median Household Income | 1,062 | $48,793 |
| Mean Household Income | 1,062 | $64,482 |
| Income Deficit | 676 | $0 |
| Wage / Income Gap (%) | 2,705 | 29.08% |
| Wage / Income Gap ($) | 2,705 | 70.92¢ per $1 |
| Gini / Inequality Index | 2,705 | 0.43 |
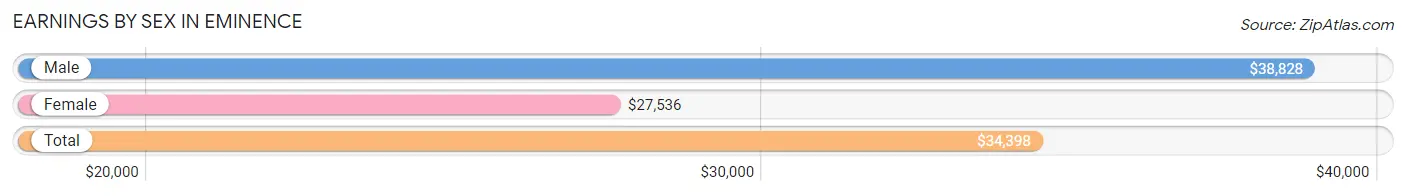
Earnings by Sex in Eminence
Average Earnings in Eminence are $34,398, $38,828 for men and $27,536 for women, a difference of 29.1%.
| Sex | Number | Average Earnings |
| Male | 720 (54.7%) | $38,828 |
| Female | 597 (45.3%) | $27,536 |
| Total | 1,317 (100.0%) | $34,398 |
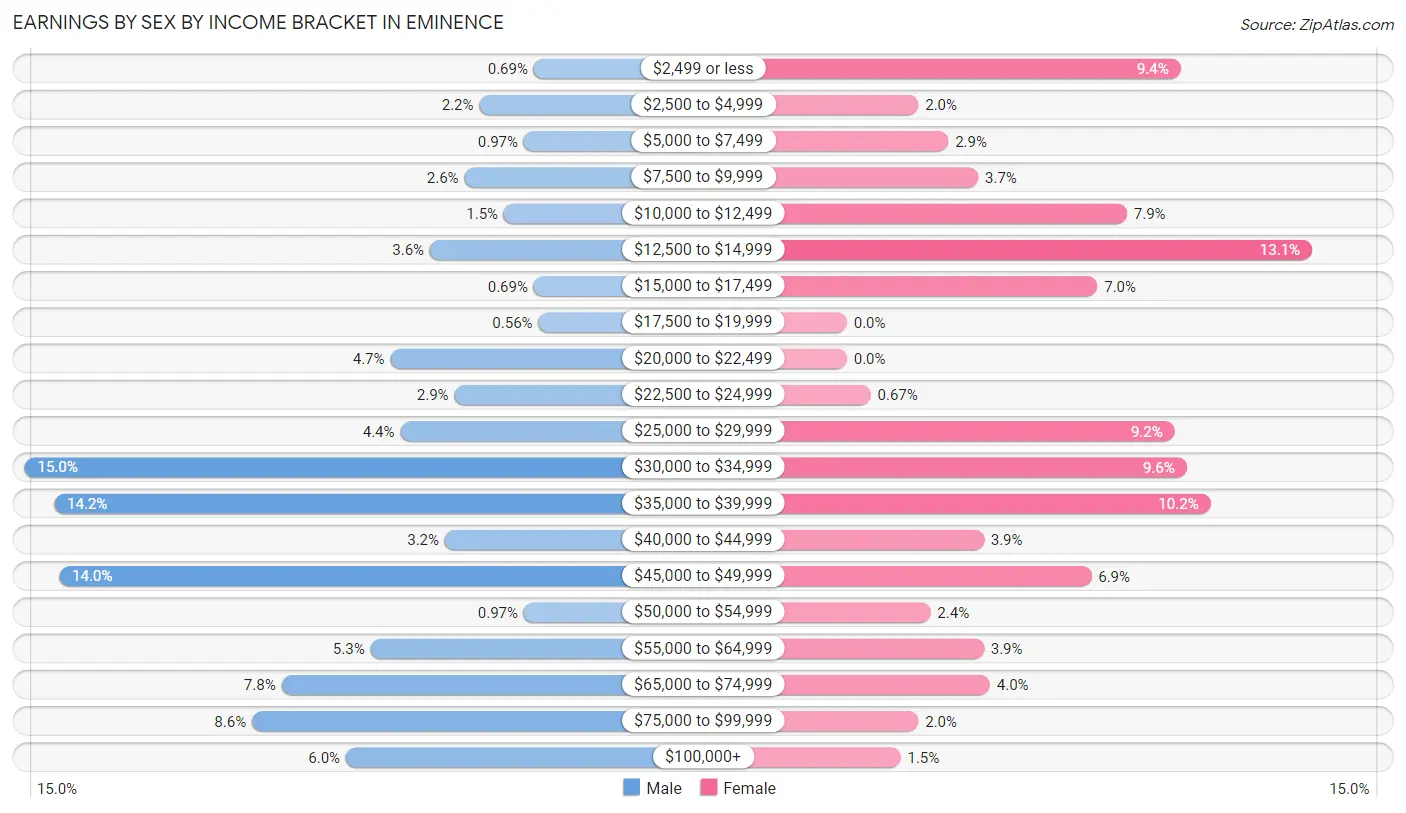
Earnings by Sex by Income Bracket in Eminence
The most common earnings brackets in Eminence are $30,000 to $34,999 for men (108 | 15.0%) and $12,500 to $14,999 for women (78 | 13.1%).
| Income | Male | Female |
| $2,499 or less | 5 (0.7%) | 56 (9.4%) |
| $2,500 to $4,999 | 16 (2.2%) | 12 (2.0%) |
| $5,000 to $7,499 | 7 (1.0%) | 17 (2.9%) |
| $7,500 to $9,999 | 19 (2.6%) | 22 (3.7%) |
| $10,000 to $12,499 | 11 (1.5%) | 47 (7.9%) |
| $12,500 to $14,999 | 26 (3.6%) | 78 (13.1%) |
| $15,000 to $17,499 | 5 (0.7%) | 42 (7.0%) |
| $17,500 to $19,999 | 4 (0.6%) | 0 (0.0%) |
| $20,000 to $22,499 | 34 (4.7%) | 0 (0.0%) |
| $22,500 to $24,999 | 21 (2.9%) | 4 (0.7%) |
| $25,000 to $29,999 | 32 (4.4%) | 55 (9.2%) |
| $30,000 to $34,999 | 108 (15.0%) | 57 (9.6%) |
| $35,000 to $39,999 | 102 (14.2%) | 61 (10.2%) |
| $40,000 to $44,999 | 23 (3.2%) | 23 (3.8%) |
| $45,000 to $49,999 | 101 (14.0%) | 41 (6.9%) |
| $50,000 to $54,999 | 7 (1.0%) | 14 (2.4%) |
| $55,000 to $64,999 | 38 (5.3%) | 23 (3.8%) |
| $65,000 to $74,999 | 56 (7.8%) | 24 (4.0%) |
| $75,000 to $99,999 | 62 (8.6%) | 12 (2.0%) |
| $100,000+ | 43 (6.0%) | 9 (1.5%) |
| Total | 720 (100.0%) | 597 (100.0%) |
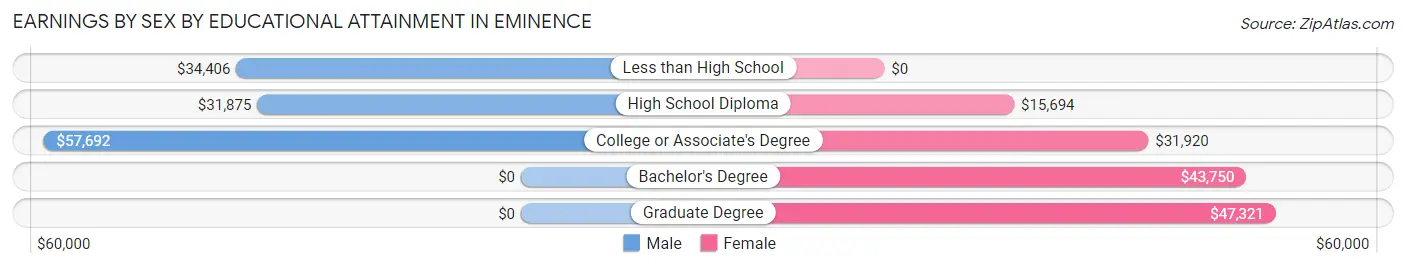
Earnings by Sex by Educational Attainment in Eminence
Average earnings in Eminence are $37,667 for men and $30,268 for women, a difference of 19.6%. Men with an educational attainment of college or associate's degree enjoy the highest average annual earnings of $57,692, while those with high school diploma education earn the least with $31,875. Women with an educational attainment of graduate degree earn the most with the average annual earnings of $47,321, while those with high school diploma education have the smallest earnings of $15,694.
| Educational Attainment | Male Income | Female Income |
| Less than High School | $34,406 | $0 |
| High School Diploma | $31,875 | $15,694 |
| College or Associate's Degree | $57,692 | $31,920 |
| Bachelor's Degree | - | - |
| Graduate Degree | - | - |
| Total | $37,667 | $30,268 |
Family Income in Eminence
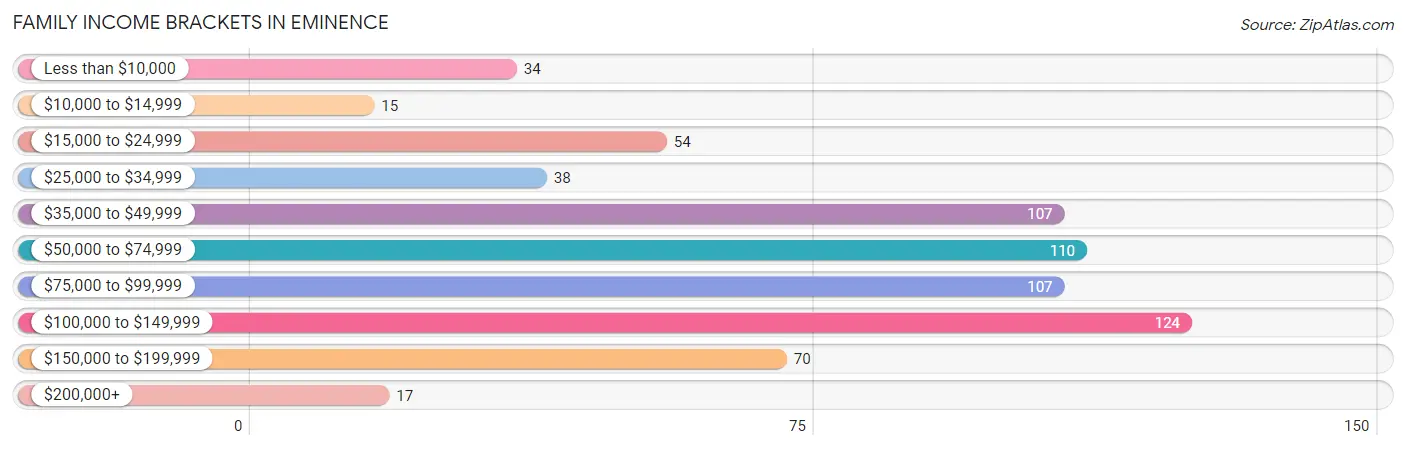
Family Income Brackets in Eminence
According to the Eminence family income data, there are 124 families falling into the $100,000 to $149,999 income range, which is the most common income bracket and makes up 18.3% of all families. Conversely, the $10,000 to $14,999 income bracket is the least frequent group with only 15 families (2.2%) belonging to this category.
| Income Bracket | # Families | % Families |
| Less than $10,000 | 34 | 5.0% |
| $10,000 to $14,999 | 15 | 2.2% |
| $15,000 to $24,999 | 54 | 8.0% |
| $25,000 to $34,999 | 38 | 5.6% |
| $35,000 to $49,999 | 107 | 15.8% |
| $50,000 to $74,999 | 110 | 16.3% |
| $75,000 to $99,999 | 107 | 15.8% |
| $100,000 to $149,999 | 124 | 18.3% |
| $150,000 to $199,999 | 70 | 10.4% |
| $200,000+ | 17 | 2.5% |
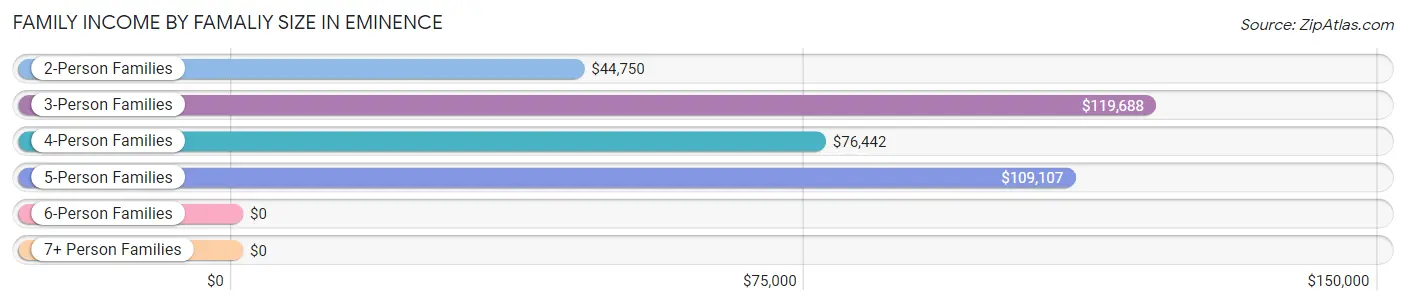
Family Income by Famaliy Size in Eminence
3-person families (106 | 15.7%) account for the highest median family income in Eminence with $119,688 per family, while 3-person families (106 | 15.7%) have the highest median income of $39,896 per family member.
| Income Bracket | # Families | Median Income |
| 2-Person Families | 309 (45.7%) | $44,750 |
| 3-Person Families | 106 (15.7%) | $119,688 |
| 4-Person Families | 121 (17.9%) | $76,442 |
| 5-Person Families | 116 (17.2%) | $109,107 |
| 6-Person Families | 13 (1.9%) | $0 |
| 7+ Person Families | 11 (1.6%) | $0 |
| Total | 676 (100.0%) | $69,194 |
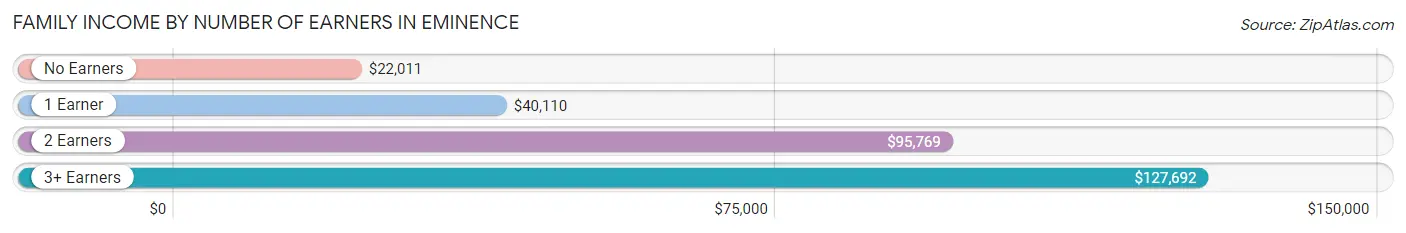
Family Income by Number of Earners in Eminence
The median family income in Eminence is $69,194, with families comprising 3+ earners (98) having the highest median family income of $127,692, while families with no earners (115) have the lowest median family income of $22,011, accounting for 14.5% and 17.0% of families, respectively.
| Number of Earners | # Families | Median Income |
| No Earners | 115 (17.0%) | $22,011 |
| 1 Earner | 203 (30.0%) | $40,110 |
| 2 Earners | 260 (38.5%) | $95,769 |
| 3+ Earners | 98 (14.5%) | $127,692 |
| Total | 676 (100.0%) | $69,194 |
Household Income in Eminence
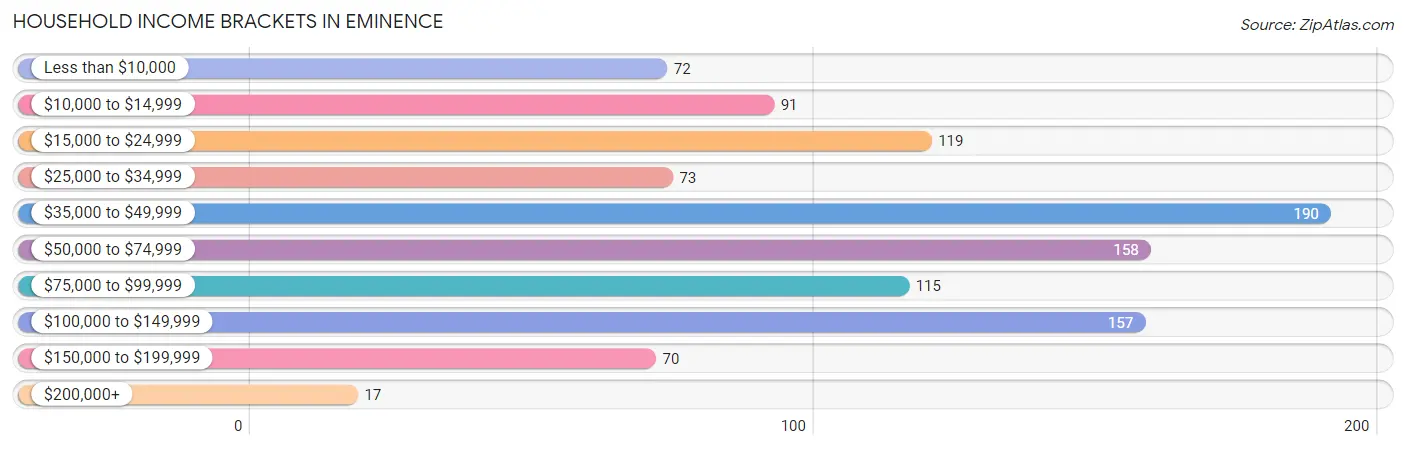
Household Income Brackets in Eminence
With 190 households falling in the category, the $35,000 to $49,999 income range is the most frequent in Eminence, accounting for 17.9% of all households. In contrast, only 17 households (1.6%) fall into the $200,000+ income bracket, making it the least populous group.
| Income Bracket | # Households | % Households |
| Less than $10,000 | 72 | 6.8% |
| $10,000 to $14,999 | 91 | 8.6% |
| $15,000 to $24,999 | 119 | 11.2% |
| $25,000 to $34,999 | 73 | 6.9% |
| $35,000 to $49,999 | 190 | 17.9% |
| $50,000 to $74,999 | 158 | 14.9% |
| $75,000 to $99,999 | 115 | 10.8% |
| $100,000 to $149,999 | 157 | 14.8% |
| $150,000 to $199,999 | 70 | 6.6% |
| $200,000+ | 17 | 1.6% |
Household Income by Householder Age in Eminence
The median household income in Eminence is $48,793, with the highest median household income of $56,458 found in the 45 to 64 years age bracket for the primary householder. A total of 443 households (41.7%) fall into this category. Meanwhile, the 15 to 24 years age bracket for the primary householder has the lowest median household income of $41,103, with 92 households (8.7%) in this group.
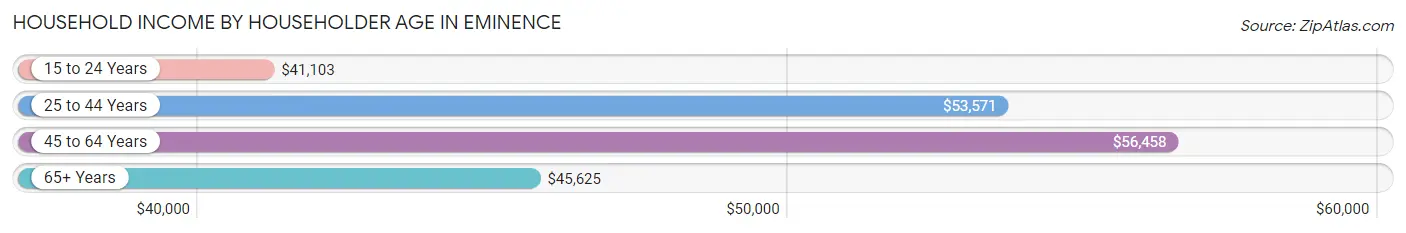
| Income Bracket | # Households | Median Income |
| 15 to 24 Years | 92 (8.7%) | $41,103 |
| 25 to 44 Years | 326 (30.7%) | $53,571 |
| 45 to 64 Years | 443 (41.7%) | $56,458 |
| 65+ Years | 201 (18.9%) | $45,625 |
| Total | 1,062 (100.0%) | $48,793 |
Poverty in Eminence
Income Below Poverty by Sex and Age in Eminence
With 12.7% poverty level for males and 27.7% for females among the residents of Eminence, 5 year old males and under 5 year old females are the most vulnerable to poverty, with 15 males (44.1%) and 54 females (52.4%) in their respective age groups living below the poverty level.
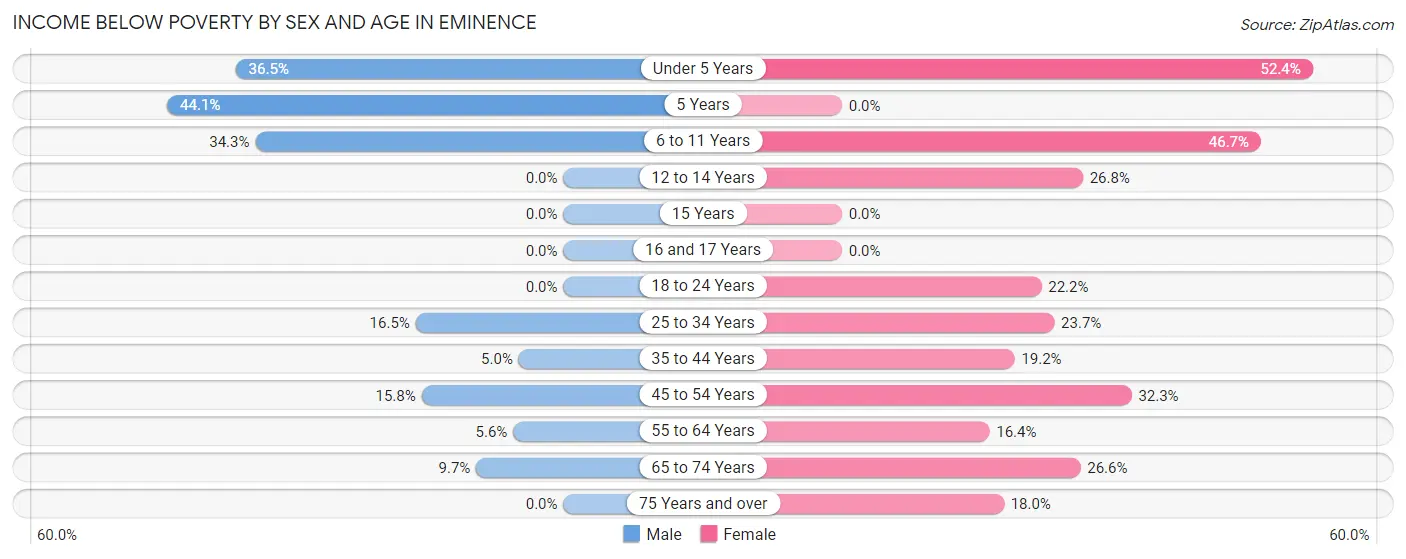
| Age Bracket | Male | Female |
| Under 5 Years | 27 (36.5%) | 54 (52.4%) |
| 5 Years | 15 (44.1%) | 0 (0.0%) |
| 6 to 11 Years | 47 (34.3%) | 63 (46.7%) |
| 12 to 14 Years | 0 (0.0%) | 11 (26.8%) |
| 15 Years | 0 (0.0%) | 0 (0.0%) |
| 16 and 17 Years | 0 (0.0%) | 0 (0.0%) |
| 18 to 24 Years | 0 (0.0%) | 32 (22.2%) |
| 25 to 34 Years | 25 (16.5%) | 35 (23.6%) |
| 35 to 44 Years | 9 (5.0%) | 40 (19.2%) |
| 45 to 54 Years | 27 (15.8%) | 70 (32.3%) |
| 55 to 64 Years | 9 (5.6%) | 23 (16.4%) |
| 65 to 74 Years | 10 (9.7%) | 34 (26.6%) |
| 75 Years and over | 0 (0.0%) | 11 (18.0%) |
| Total | 169 (12.7%) | 373 (27.7%) |
Income Above Poverty by Sex and Age in Eminence
According to the poverty statistics in Eminence, males aged 12 to 14 years and females aged 16 and 17 years are the age groups that are most secure financially, with 100.0% of males and 100.0% of females in these age groups living above the poverty line.
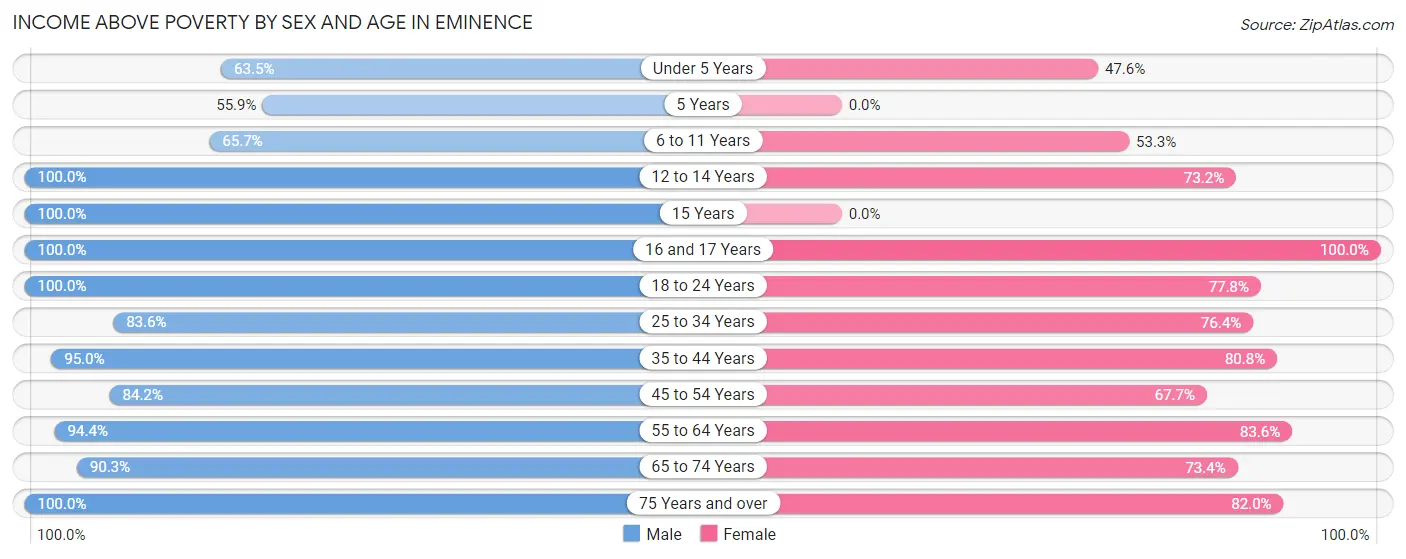
| Age Bracket | Male | Female |
| Under 5 Years | 47 (63.5%) | 49 (47.6%) |
| 5 Years | 19 (55.9%) | 0 (0.0%) |
| 6 to 11 Years | 90 (65.7%) | 72 (53.3%) |
| 12 to 14 Years | 72 (100.0%) | 30 (73.2%) |
| 15 Years | 16 (100.0%) | 0 (0.0%) |
| 16 and 17 Years | 52 (100.0%) | 20 (100.0%) |
| 18 to 24 Years | 96 (100.0%) | 112 (77.8%) |
| 25 to 34 Years | 127 (83.6%) | 113 (76.3%) |
| 35 to 44 Years | 172 (95.0%) | 168 (80.8%) |
| 45 to 54 Years | 144 (84.2%) | 147 (67.7%) |
| 55 to 64 Years | 152 (94.4%) | 117 (83.6%) |
| 65 to 74 Years | 93 (90.3%) | 94 (73.4%) |
| 75 Years and over | 78 (100.0%) | 50 (82.0%) |
| Total | 1,158 (87.3%) | 972 (72.3%) |
Income Below Poverty Among Married-Couple Families in Eminence
The poverty statistics for married-couple families in Eminence show that 2.2% or 11 of the total 504 families live below the poverty line. Families with 5 or more children have the highest poverty rate of 100.0%, comprising of 11 families. On the other hand, families with no children have the lowest poverty rate of 0.0%, which includes 0 families.
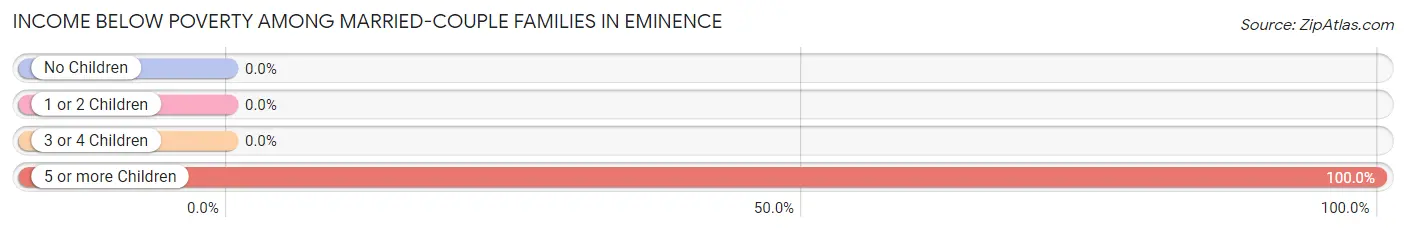
| Children | Above Poverty | Below Poverty |
| No Children | 228 (100.0%) | 0 (0.0%) |
| 1 or 2 Children | 202 (100.0%) | 0 (0.0%) |
| 3 or 4 Children | 63 (100.0%) | 0 (0.0%) |
| 5 or more Children | 0 (0.0%) | 11 (100.0%) |
| Total | 493 (97.8%) | 11 (2.2%) |
Income Below Poverty Among Single-Parent Households in Eminence
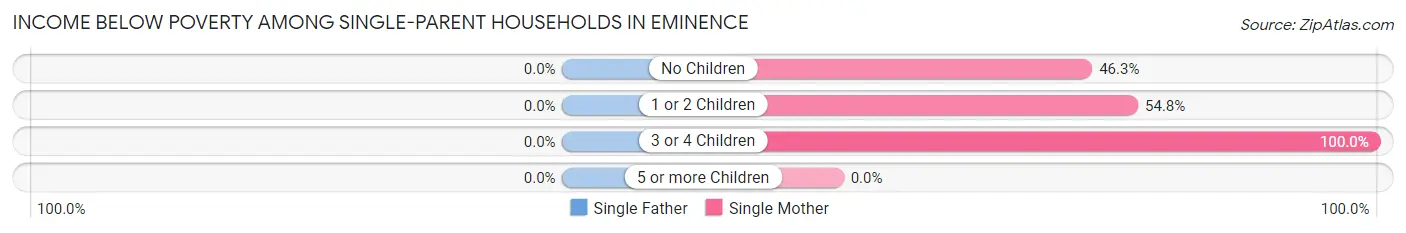
| Children | Single Father | Single Mother |
| No Children | 0 (0.0%) | 25 (46.3%) |
| 1 or 2 Children | 0 (0.0%) | 34 (54.8%) |
| 3 or 4 Children | 0 (0.0%) | 23 (100.0%) |
| 5 or more Children | 0 (0.0%) | 0 (0.0%) |
| Total | 0 (0.0%) | 82 (59.0%) |
Income Below Poverty Among Married-Couple vs Single-Parent Households in Eminence
The poverty data for Eminence shows that 11 of the married-couple family households (2.2%) and 82 of the single-parent households (47.7%) are living below the poverty level. Within the married-couple family households, those with 5 or more children have the highest poverty rate, with 11 households (100.0%) falling below the poverty line. Among the single-parent households, those with 3 or 4 children have the highest poverty rate, with 23 household (100.0%) living below poverty.
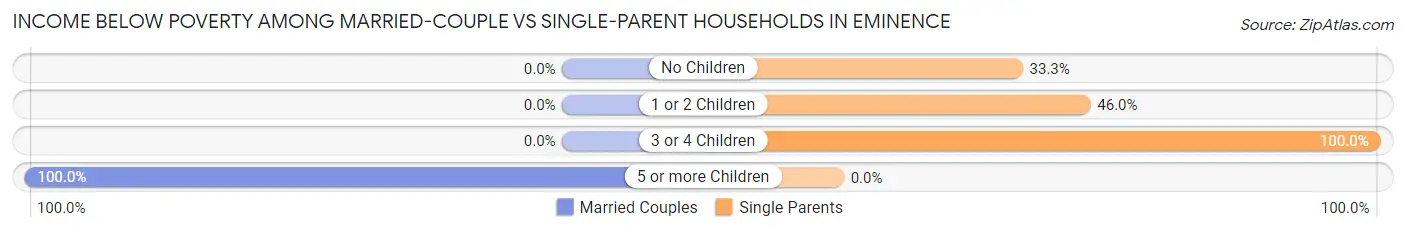
| Children | Married-Couple Families | Single-Parent Households |
| No Children | 0 (0.0%) | 25 (33.3%) |
| 1 or 2 Children | 0 (0.0%) | 34 (46.0%) |
| 3 or 4 Children | 0 (0.0%) | 23 (100.0%) |
| 5 or more Children | 11 (100.0%) | 0 (0.0%) |
| Total | 11 (2.2%) | 82 (47.7%) |
Race in Eminence
The most populous races in Eminence are White / Caucasian (2,088 | 77.2%), Two or more Races (292 | 10.8%), and Hispanic or Latino (281 | 10.4%).
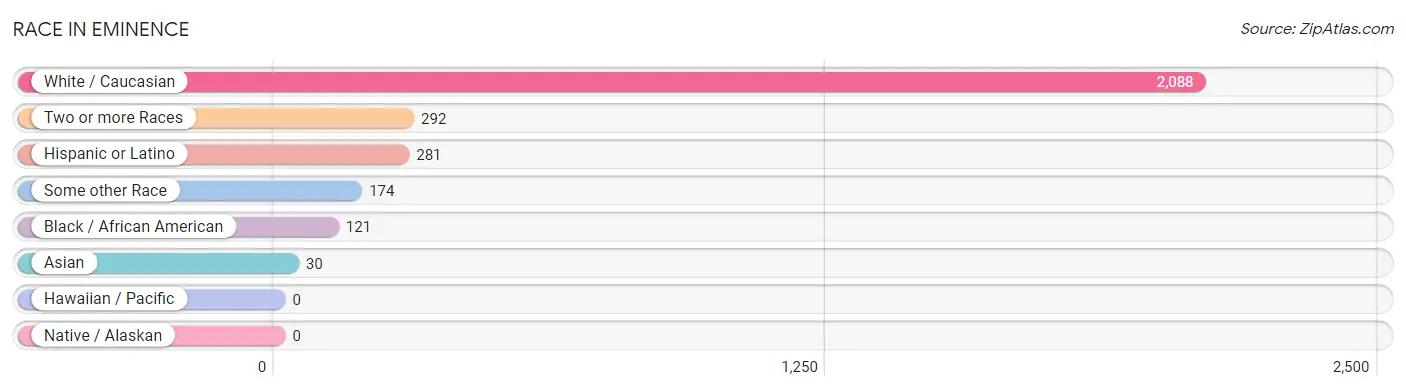
| Race | # Population | % Population |
| Asian | 30 | 1.1% |
| Black / African American | 121 | 4.5% |
| Hawaiian / Pacific | 0 | 0.0% |
| Hispanic or Latino | 281 | 10.4% |
| Native / Alaskan | 0 | 0.0% |
| White / Caucasian | 2,088 | 77.2% |
| Two or more Races | 292 | 10.8% |
| Some other Race | 174 | 6.4% |
| Total | 2,705 | 100.0% |
Ancestry in Eminence
The most populous ancestries reported in Eminence are English (496 | 18.3%), Irish (320 | 11.8%), Mexican (260 | 9.6%), German (256 | 9.5%), and American (244 | 9.0%), together accounting for 58.3% of all Eminence residents.
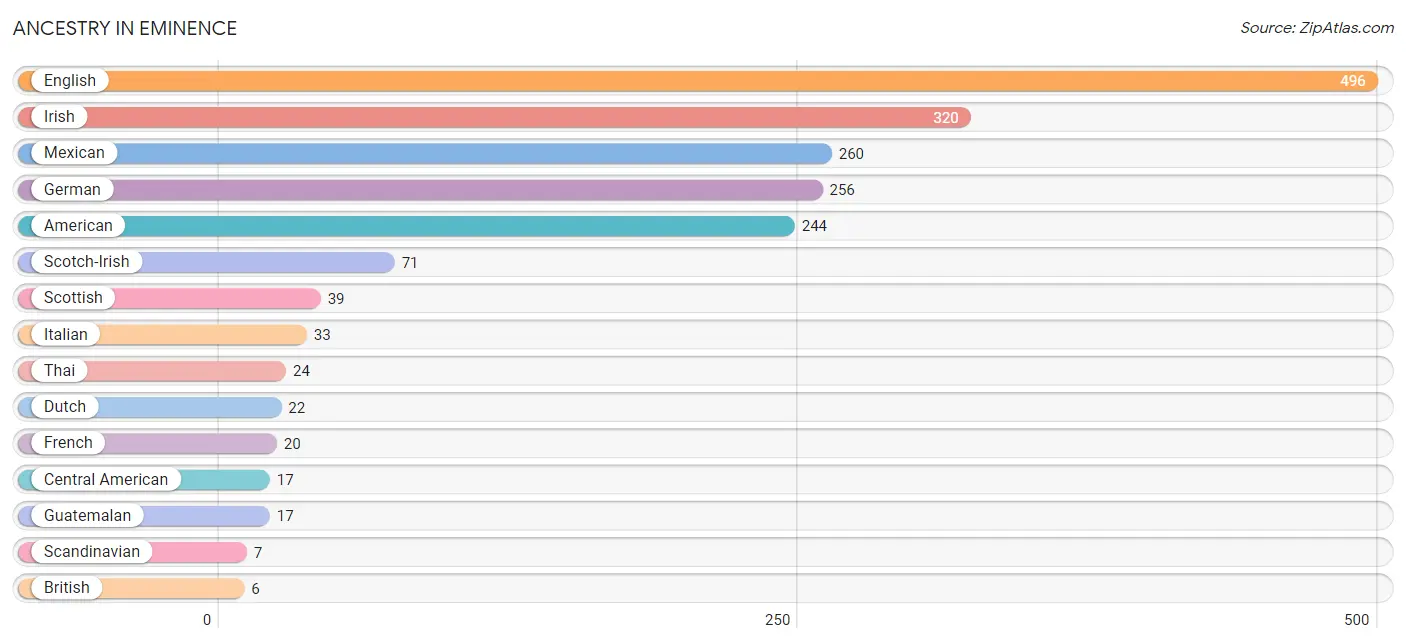
| Ancestry | # Population | % Population |
| American | 244 | 9.0% |
| British | 6 | 0.2% |
| Central American | 17 | 0.6% |
| Chippewa | 1 | 0.0% |
| Czech | 5 | 0.2% |
| Dutch | 22 | 0.8% |
| English | 496 | 18.3% |
| Ethiopian | 1 | 0.0% |
| French | 20 | 0.7% |
| French Canadian | 5 | 0.2% |
| German | 256 | 9.5% |
| Guatemalan | 17 | 0.6% |
| Indian (Asian) | 3 | 0.1% |
| Irish | 320 | 11.8% |
| Italian | 33 | 1.2% |
| Korean | 5 | 0.2% |
| Mexican | 260 | 9.6% |
| Scandinavian | 7 | 0.3% |
| Scotch-Irish | 71 | 2.6% |
| Scottish | 39 | 1.4% |
| Subsaharan African | 1 | 0.0% |
| Swedish | 4 | 0.2% |
| Thai | 24 | 0.9% |
| Welsh | 6 | 0.2% | View All 24 Rows |
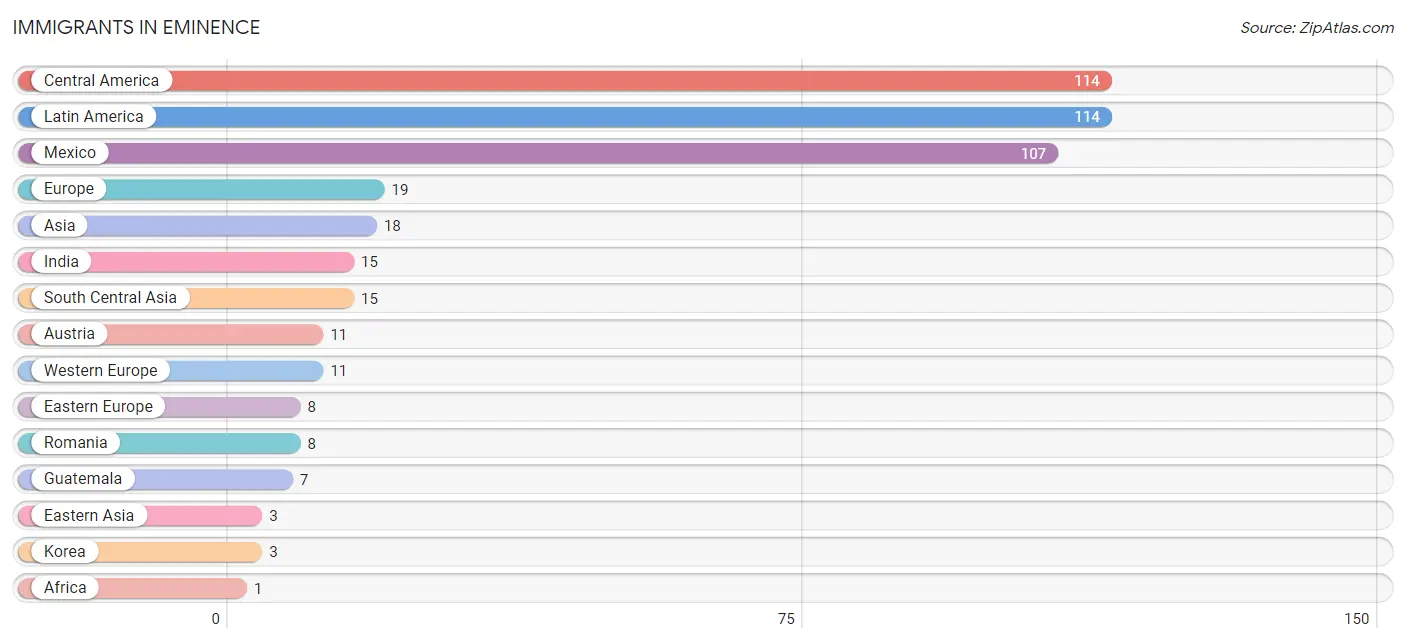
Immigrants in Eminence
The most numerous immigrant groups reported in Eminence came from Central America (114 | 4.2%), Latin America (114 | 4.2%), Mexico (107 | 4.0%), Europe (19 | 0.7%), and Asia (18 | 0.7%), together accounting for 13.8% of all Eminence residents.
| Immigration Origin | # Population | % Population |
| Africa | 1 | 0.0% |
| Asia | 18 | 0.7% |
| Austria | 11 | 0.4% |
| Canada | 1 | 0.0% |
| Central America | 114 | 4.2% |
| Eastern Africa | 1 | 0.0% |
| Eastern Asia | 3 | 0.1% |
| Eastern Europe | 8 | 0.3% |
| Ethiopia | 1 | 0.0% |
| Europe | 19 | 0.7% |
| Guatemala | 7 | 0.3% |
| India | 15 | 0.5% |
| Korea | 3 | 0.1% |
| Latin America | 114 | 4.2% |
| Mexico | 107 | 4.0% |
| Romania | 8 | 0.3% |
| South Central Asia | 15 | 0.5% |
| Western Europe | 11 | 0.4% | View All 18 Rows |
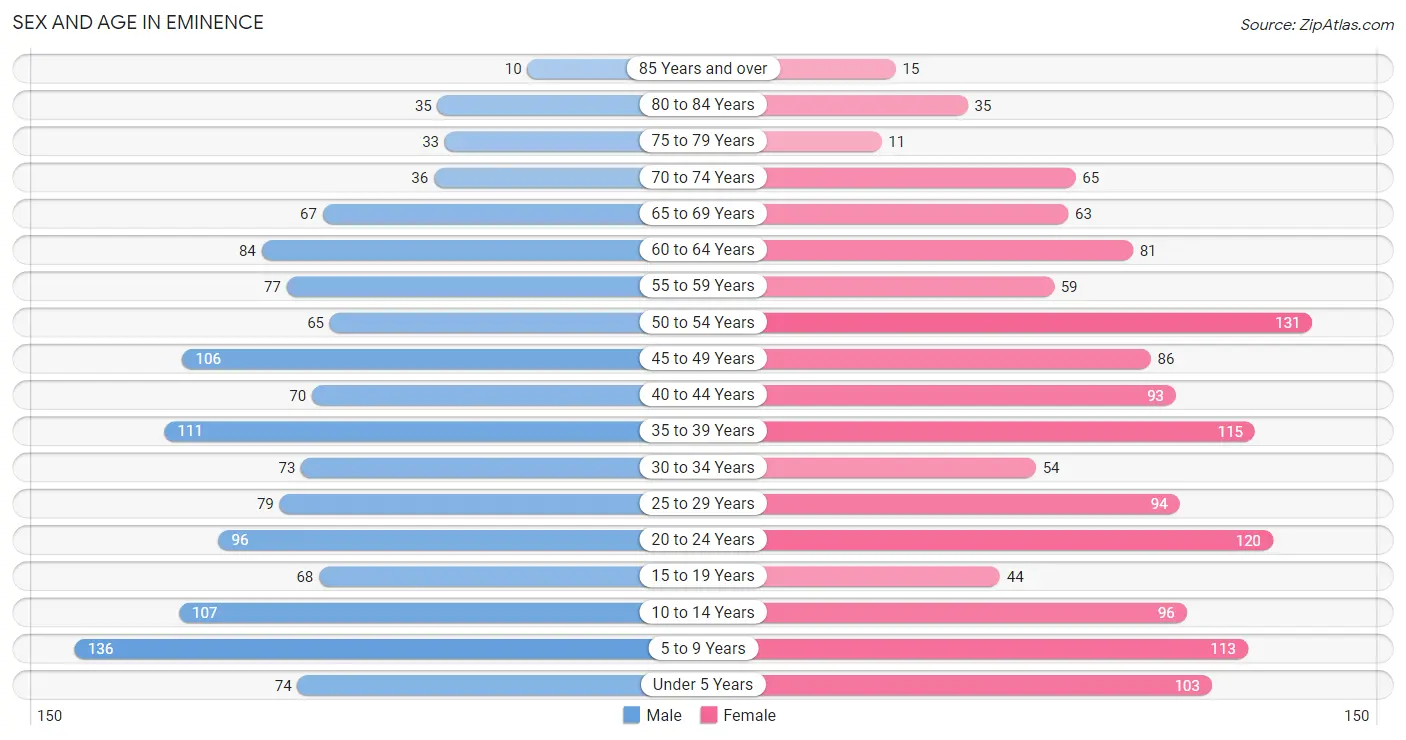
Sex and Age in Eminence
Sex and Age in Eminence
The most populous age groups in Eminence are 5 to 9 Years (136 | 10.2%) for men and 50 to 54 Years (131 | 9.5%) for women.
| Age Bracket | Male | Female |
| Under 5 Years | 74 (5.6%) | 103 (7.5%) |
| 5 to 9 Years | 136 (10.2%) | 113 (8.2%) |
| 10 to 14 Years | 107 (8.1%) | 96 (7.0%) |
| 15 to 19 Years | 68 (5.1%) | 44 (3.2%) |
| 20 to 24 Years | 96 (7.2%) | 120 (8.7%) |
| 25 to 29 Years | 79 (5.9%) | 94 (6.8%) |
| 30 to 34 Years | 73 (5.5%) | 54 (3.9%) |
| 35 to 39 Years | 111 (8.4%) | 115 (8.4%) |
| 40 to 44 Years | 70 (5.3%) | 93 (6.8%) |
| 45 to 49 Years | 106 (8.0%) | 86 (6.2%) |
| 50 to 54 Years | 65 (4.9%) | 131 (9.5%) |
| 55 to 59 Years | 77 (5.8%) | 59 (4.3%) |
| 60 to 64 Years | 84 (6.3%) | 81 (5.9%) |
| 65 to 69 Years | 67 (5.1%) | 63 (4.6%) |
| 70 to 74 Years | 36 (2.7%) | 65 (4.7%) |
| 75 to 79 Years | 33 (2.5%) | 11 (0.8%) |
| 80 to 84 Years | 35 (2.6%) | 35 (2.5%) |
| 85 Years and over | 10 (0.7%) | 15 (1.1%) |
| Total | 1,327 (100.0%) | 1,378 (100.0%) |
Families and Households in Eminence
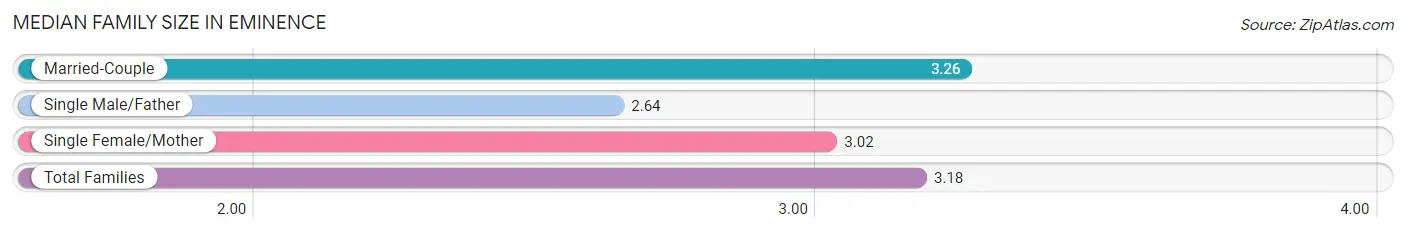
Median Family Size in Eminence
The median family size in Eminence is 3.18 persons per family, with married-couple families (504 | 74.6%) accounting for the largest median family size of 3.26 persons per family. On the other hand, single male/father families (33 | 4.9%) represent the smallest median family size with 2.64 persons per family.
| Family Type | # Families | Family Size |
| Married-Couple | 504 (74.6%) | 3.26 |
| Single Male/Father | 33 (4.9%) | 2.64 |
| Single Female/Mother | 139 (20.6%) | 3.02 |
| Total Families | 676 (100.0%) | 3.18 |
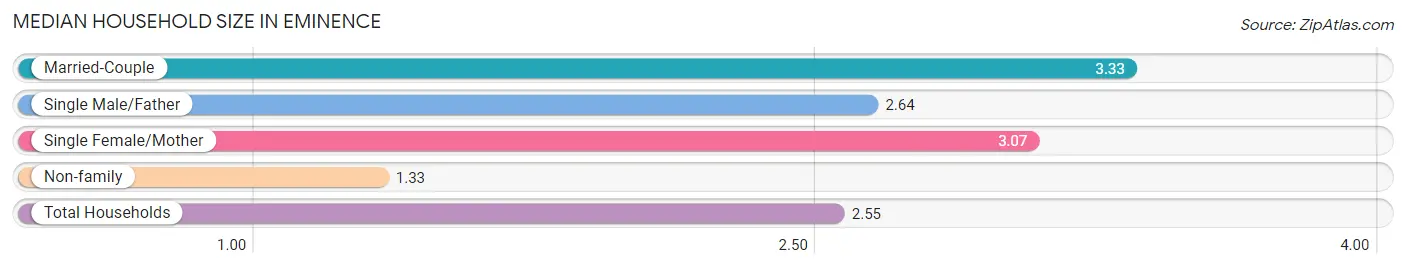
Median Household Size in Eminence
The median household size in Eminence is 2.55 persons per household, with married-couple households (504 | 47.5%) accounting for the largest median household size of 3.33 persons per household. non-family households (386 | 36.3%) represent the smallest median household size with 1.33 persons per household.
| Household Type | # Households | Household Size |
| Married-Couple | 504 (47.5%) | 3.33 |
| Single Male/Father | 33 (3.1%) | 2.64 |
| Single Female/Mother | 139 (13.1%) | 3.07 |
| Non-family | 386 (36.3%) | 1.33 |
| Total Households | 1,062 (100.0%) | 2.55 |
Household Size by Marriage Status in Eminence
Out of a total of 1,062 households in Eminence, 676 (63.6%) are family households, while 386 (36.3%) are nonfamily households. The most numerous type of family households are 2-person households, comprising 288, and the most common type of nonfamily households are 1-person households, comprising 286.
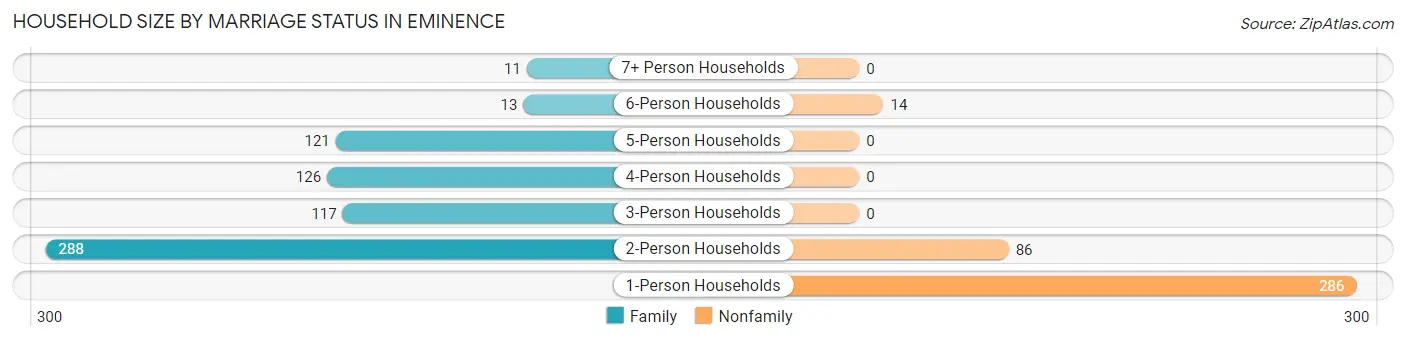
| Household Size | Family Households | Nonfamily Households |
| 1-Person Households | - | 286 (26.9%) |
| 2-Person Households | 288 (27.1%) | 86 (8.1%) |
| 3-Person Households | 117 (11.0%) | 0 (0.0%) |
| 4-Person Households | 126 (11.9%) | 0 (0.0%) |
| 5-Person Households | 121 (11.4%) | 0 (0.0%) |
| 6-Person Households | 13 (1.2%) | 14 (1.3%) |
| 7+ Person Households | 11 (1.0%) | 0 (0.0%) |
| Total | 676 (63.6%) | 386 (36.3%) |
Female Fertility in Eminence
Fertility by Age in Eminence
| Age Bracket | Women with Births | Births / 1,000 Women |
| 15 to 19 years | 0 (0.0%) | 0.0 |
| 20 to 34 years | 0 (0.0%) | 0.0 |
| 35 to 50 years | 0 (0.0%) | 0.0 |
| Total | 0 (0.0%) | 0.0 |
Fertility by Age by Marriage Status in Eminence
| Age Bracket | Married | Unmarried |
| 15 to 19 years | 0 (0.0%) | 0 (0.0%) |
| 20 to 34 years | 0 (0.0%) | 0 (0.0%) |
| 35 to 50 years | 0 (0.0%) | 0 (0.0%) |
| Total | 0 (0.0%) | 0 (0.0%) |
Fertility by Education in Eminence
| Educational Attainment | Women with Births | Births / 1,000 Women |
| Less than High School | 0 (0.0%) | 0.0 |
| High School Diploma | 0 (0.0%) | 0.0 |
| College or Associate's Degree | 0 (0.0%) | 0.0 |
| Bachelor's Degree | 0 (0.0%) | 0.0 |
| Graduate Degree | 0 (0.0%) | 0.0 |
| Total | 0 (0.0%) | 0.0 |
Fertility by Education by Marriage Status in Eminence
| Educational Attainment | Married | Unmarried |
| Less than High School | 0 (0.0%) | 0 (0.0%) |
| High School Diploma | 0 (0.0%) | 0 (0.0%) |
| College or Associate's Degree | 0 (0.0%) | 0 (0.0%) |
| Bachelor's Degree | 0 (0.0%) | 0 (0.0%) |
| Graduate Degree | 0 (0.0%) | 0 (0.0%) |
| Total | 0 (0.0%) | 0 (0.0%) |
Employment Characteristics in Eminence
Employment by Class of Employer in Eminence
Among the 1,141 employed individuals in Eminence, private company employees (840 | 73.6%), state government employees (80 | 7.0%), and not-for-profit organizations (66 | 5.8%) make up the most common classes of employment.
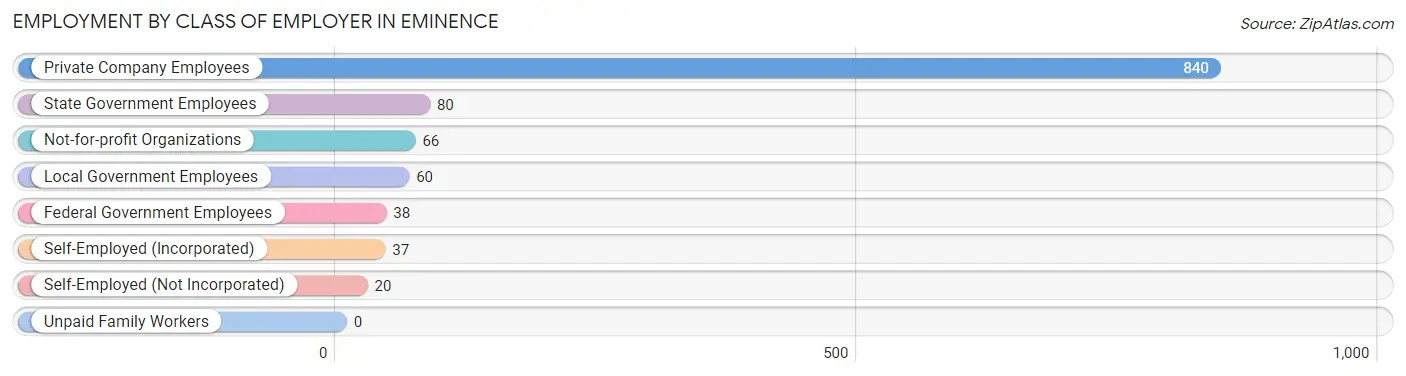
| Employer Class | # Employees | % Employees |
| Private Company Employees | 840 | 73.6% |
| Self-Employed (Incorporated) | 37 | 3.2% |
| Self-Employed (Not Incorporated) | 20 | 1.8% |
| Not-for-profit Organizations | 66 | 5.8% |
| Local Government Employees | 60 | 5.3% |
| State Government Employees | 80 | 7.0% |
| Federal Government Employees | 38 | 3.3% |
| Unpaid Family Workers | 0 | 0.0% |
| Total | 1,141 | 100.0% |
Employment Status by Age in Eminence
According to the labor force statistics for Eminence, out of the total population over 16 years of age (2,060), 59.9% or 1,234 individuals are in the labor force, with 6.6% or 81 of them unemployed. The age group with the highest labor force participation rate is 25 to 29 years, with 93.6% or 162 individuals in the labor force. Within the labor force, the 16 to 19 years age range has the highest percentage of unemployed individuals, with 46.7% or 14 of them being unemployed.
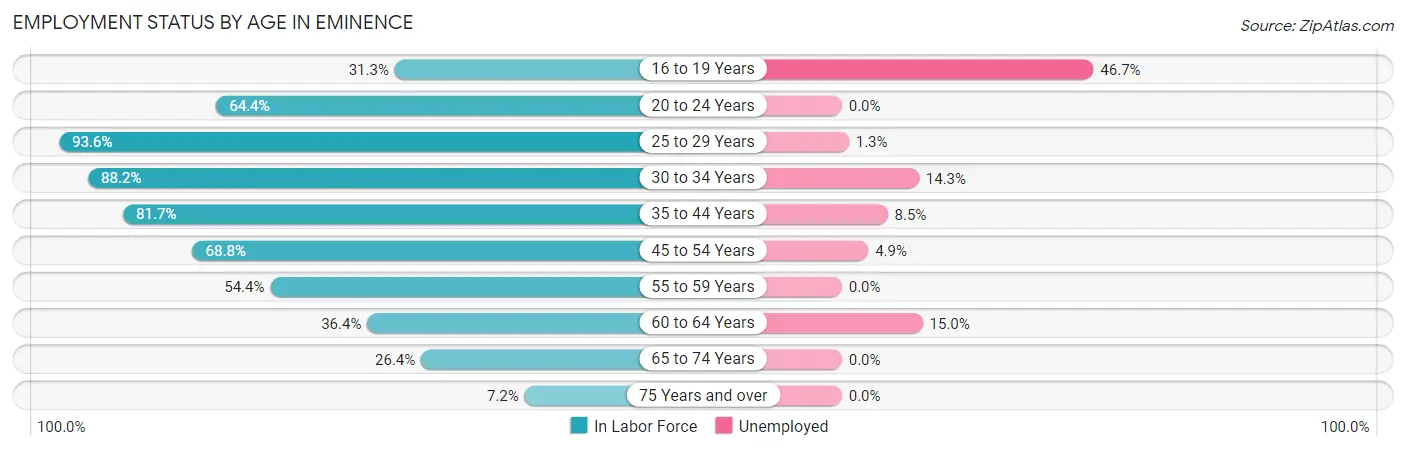
| Age Bracket | In Labor Force | Unemployed |
| 16 to 19 Years | 30 (31.3%) | 14 (46.7%) |
| 20 to 24 Years | 139 (64.4%) | 0 (0.0%) |
| 25 to 29 Years | 162 (93.6%) | 2 (1.3%) |
| 30 to 34 Years | 112 (88.2%) | 16 (14.3%) |
| 35 to 44 Years | 318 (81.7%) | 27 (8.5%) |
| 45 to 54 Years | 267 (68.8%) | 13 (4.9%) |
| 55 to 59 Years | 74 (54.4%) | 0 (0.0%) |
| 60 to 64 Years | 60 (36.4%) | 9 (15.0%) |
| 65 to 74 Years | 61 (26.4%) | 0 (0.0%) |
| 75 Years and over | 10 (7.2%) | 0 (0.0%) |
| Total | 1,234 (59.9%) | 81 (6.6%) |
Employment Status by Educational Attainment in Eminence
According to labor force statistics for Eminence, 72.1% of individuals (994) out of the total population between 25 and 64 years of age (1,378) are in the labor force, with 6.8% or 68 of them being unemployed. The group with the highest labor force participation rate are those with the educational attainment of high school diploma, with 77.0% or 405 individuals in the labor force. Within the labor force, individuals with college / associate degree education have the highest percentage of unemployment, with 16.2% or 48 of them being unemployed.
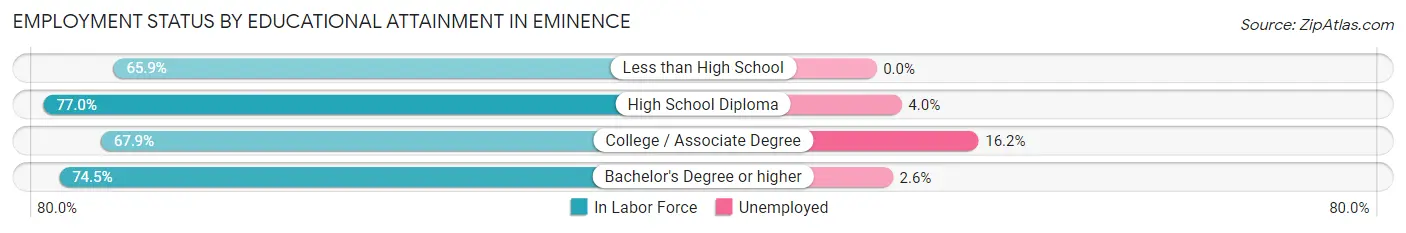
| Educational Attainment | In Labor Force | Unemployed |
| Less than High School | 135 (65.9%) | 0 (0.0%) |
| High School Diploma | 405 (77.0%) | 21 (4.0%) |
| College / Associate Degree | 298 (67.9%) | 71 (16.2%) |
| Bachelor's Degree or higher | 155 (74.5%) | 5 (2.6%) |
| Total | 994 (72.1%) | 94 (6.8%) |
Employment Occupations by Sex in Eminence
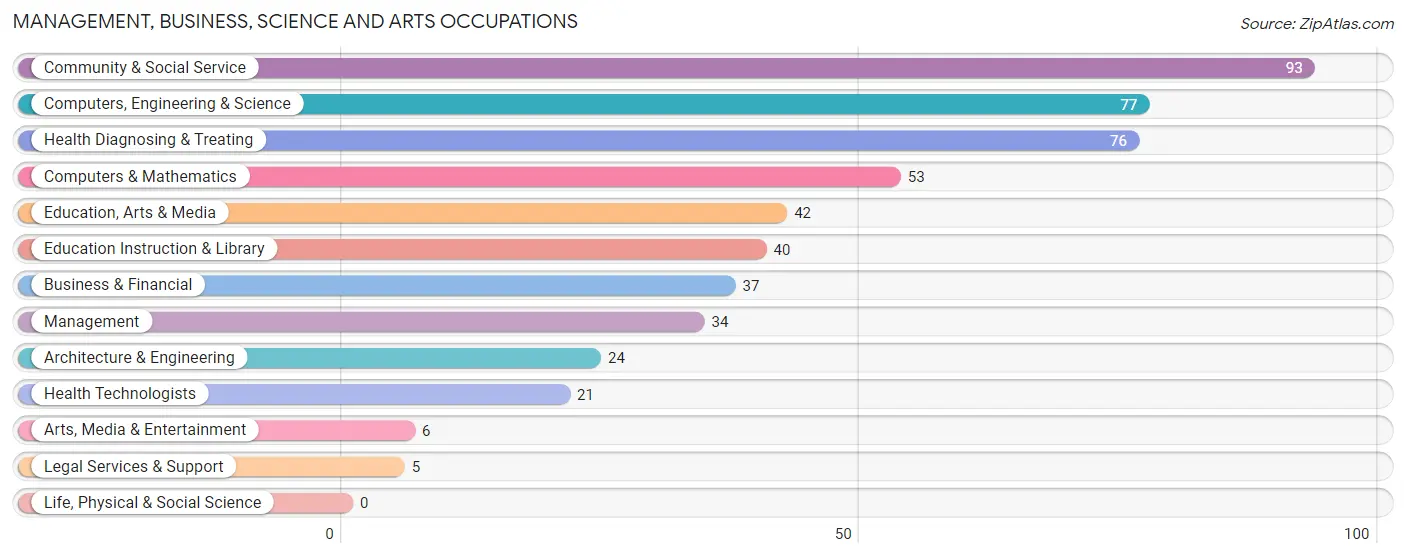
Management, Business, Science and Arts Occupations
The most common Management, Business, Science and Arts occupations in Eminence are Community & Social Service (93 | 8.1%), Computers, Engineering & Science (77 | 6.7%), Health Diagnosing & Treating (76 | 6.6%), Computers & Mathematics (53 | 4.6%), and Education, Arts & Media (42 | 3.7%).
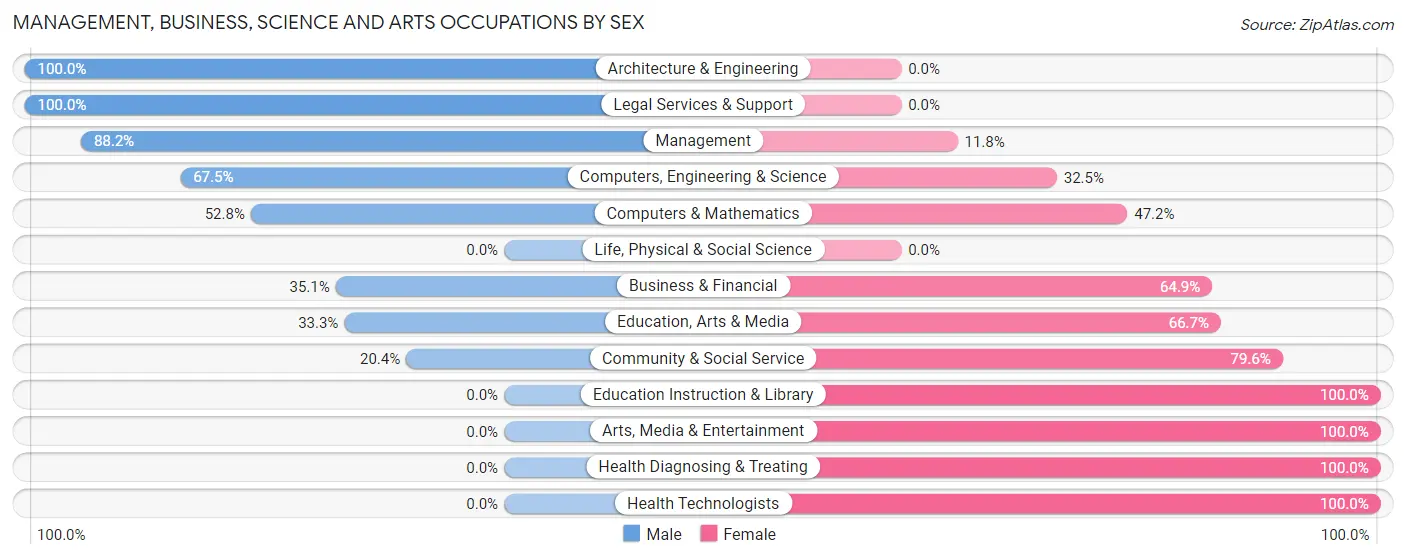
Management, Business, Science and Arts Occupations by Sex
Within the Management, Business, Science and Arts occupations in Eminence, the most male-oriented occupations are Architecture & Engineering (100.0%), Legal Services & Support (100.0%), and Management (88.2%), while the most female-oriented occupations are Education Instruction & Library (100.0%), Arts, Media & Entertainment (100.0%), and Health Diagnosing & Treating (100.0%).
| Occupation | Male | Female |
| Management | 30 (88.2%) | 4 (11.8%) |
| Business & Financial | 13 (35.1%) | 24 (64.9%) |
| Computers, Engineering & Science | 52 (67.5%) | 25 (32.5%) |
| Computers & Mathematics | 28 (52.8%) | 25 (47.2%) |
| Architecture & Engineering | 24 (100.0%) | 0 (0.0%) |
| Life, Physical & Social Science | 0 (0.0%) | 0 (0.0%) |
| Community & Social Service | 19 (20.4%) | 74 (79.6%) |
| Education, Arts & Media | 14 (33.3%) | 28 (66.7%) |
| Legal Services & Support | 5 (100.0%) | 0 (0.0%) |
| Education Instruction & Library | 0 (0.0%) | 40 (100.0%) |
| Arts, Media & Entertainment | 0 (0.0%) | 6 (100.0%) |
| Health Diagnosing & Treating | 0 (0.0%) | 76 (100.0%) |
| Health Technologists | 0 (0.0%) | 21 (100.0%) |
| Total (Category) | 114 (36.0%) | 203 (64.0%) |
| Total (Overall) | 698 (61.0%) | 446 (39.0%) |
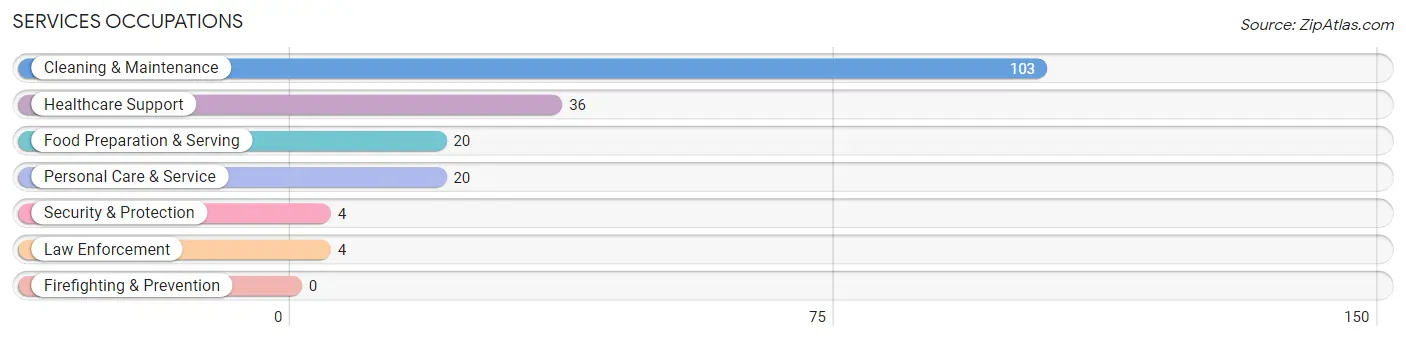
Services Occupations
The most common Services occupations in Eminence are Cleaning & Maintenance (103 | 9.0%), Healthcare Support (36 | 3.2%), Food Preparation & Serving (20 | 1.8%), Personal Care & Service (20 | 1.8%), and Security & Protection (4 | 0.4%).
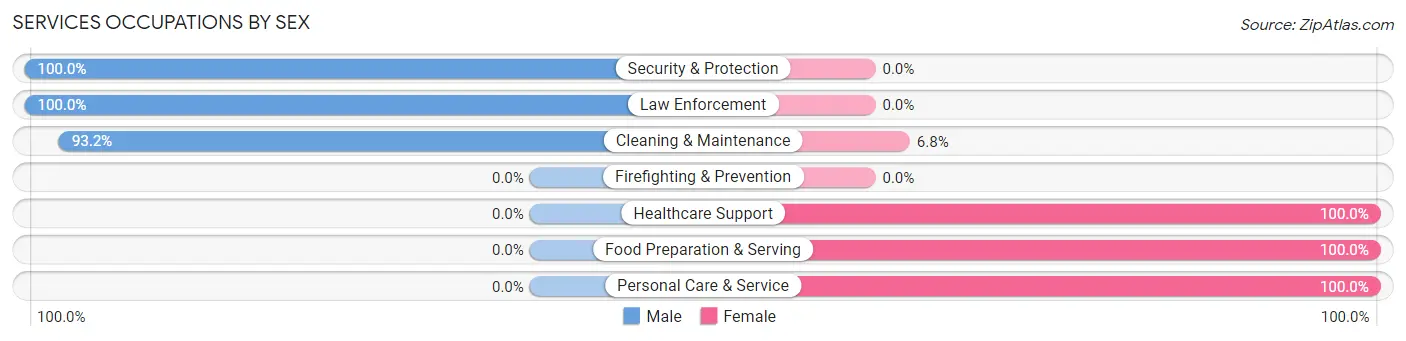
Services Occupations by Sex
Within the Services occupations in Eminence, the most male-oriented occupations are Security & Protection (100.0%), Law Enforcement (100.0%), and Cleaning & Maintenance (93.2%), while the most female-oriented occupations are Healthcare Support (100.0%), Food Preparation & Serving (100.0%), and Personal Care & Service (100.0%).
| Occupation | Male | Female |
| Healthcare Support | 0 (0.0%) | 36 (100.0%) |
| Security & Protection | 4 (100.0%) | 0 (0.0%) |
| Firefighting & Prevention | 0 (0.0%) | 0 (0.0%) |
| Law Enforcement | 4 (100.0%) | 0 (0.0%) |
| Food Preparation & Serving | 0 (0.0%) | 20 (100.0%) |
| Cleaning & Maintenance | 96 (93.2%) | 7 (6.8%) |
| Personal Care & Service | 0 (0.0%) | 20 (100.0%) |
| Total (Category) | 100 (54.6%) | 83 (45.4%) |
| Total (Overall) | 698 (61.0%) | 446 (39.0%) |
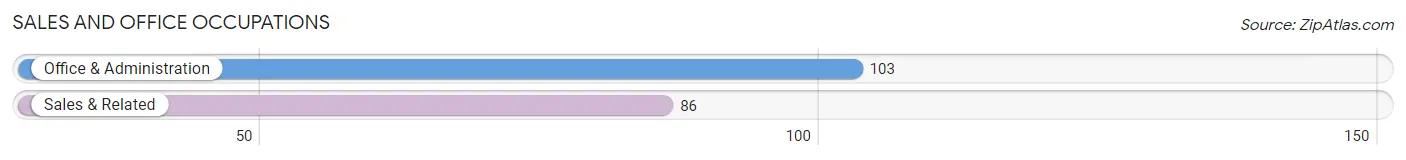
Sales and Office Occupations
The most common Sales and Office occupations in Eminence are Office & Administration (103 | 9.0%), and Sales & Related (86 | 7.5%).
Sales and Office Occupations by Sex
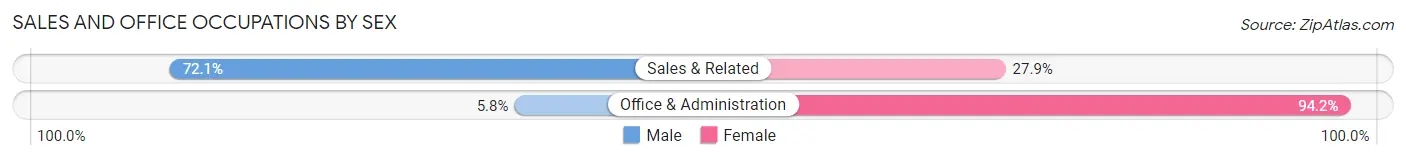
| Occupation | Male | Female |
| Sales & Related | 62 (72.1%) | 24 (27.9%) |
| Office & Administration | 6 (5.8%) | 97 (94.2%) |
| Total (Category) | 68 (36.0%) | 121 (64.0%) |
| Total (Overall) | 698 (61.0%) | 446 (39.0%) |
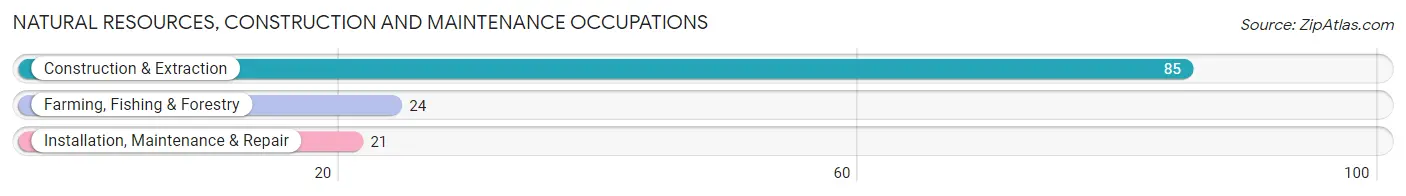
Natural Resources, Construction and Maintenance Occupations
The most common Natural Resources, Construction and Maintenance occupations in Eminence are Construction & Extraction (85 | 7.4%), Farming, Fishing & Forestry (24 | 2.1%), and Installation, Maintenance & Repair (21 | 1.8%).
Natural Resources, Construction and Maintenance Occupations by Sex
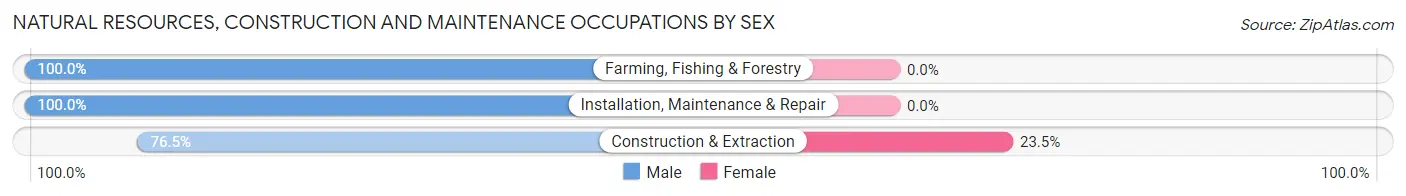
| Occupation | Male | Female |
| Farming, Fishing & Forestry | 24 (100.0%) | 0 (0.0%) |
| Construction & Extraction | 65 (76.5%) | 20 (23.5%) |
| Installation, Maintenance & Repair | 21 (100.0%) | 0 (0.0%) |
| Total (Category) | 110 (84.6%) | 20 (15.4%) |
| Total (Overall) | 698 (61.0%) | 446 (39.0%) |
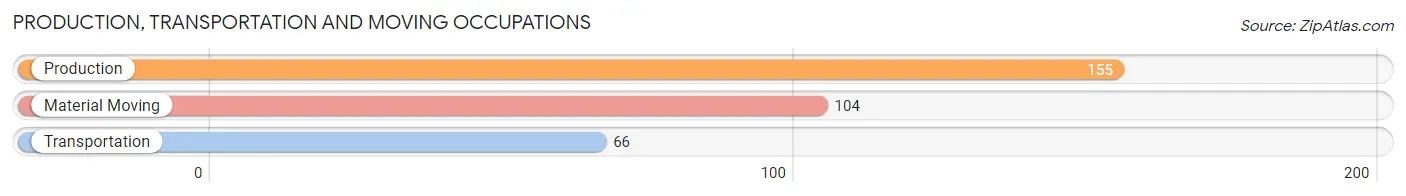
Production, Transportation and Moving Occupations
The most common Production, Transportation and Moving occupations in Eminence are Production (155 | 13.6%), Material Moving (104 | 9.1%), and Transportation (66 | 5.8%).
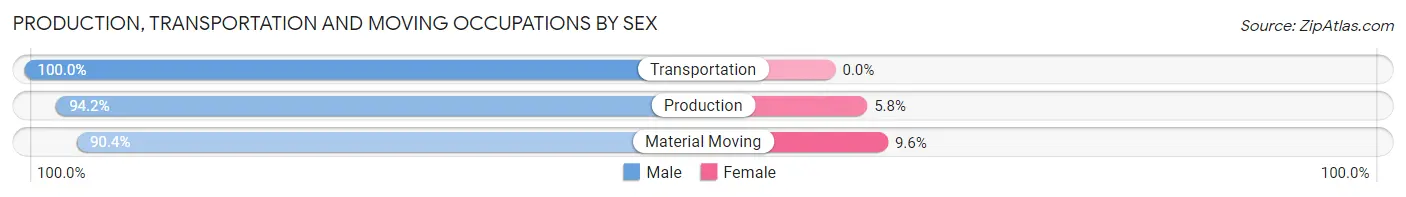
Production, Transportation and Moving Occupations by Sex
| Occupation | Male | Female |
| Production | 146 (94.2%) | 9 (5.8%) |
| Transportation | 66 (100.0%) | 0 (0.0%) |
| Material Moving | 94 (90.4%) | 10 (9.6%) |
| Total (Category) | 306 (94.2%) | 19 (5.9%) |
| Total (Overall) | 698 (61.0%) | 446 (39.0%) |
Employment Industries by Sex in Eminence
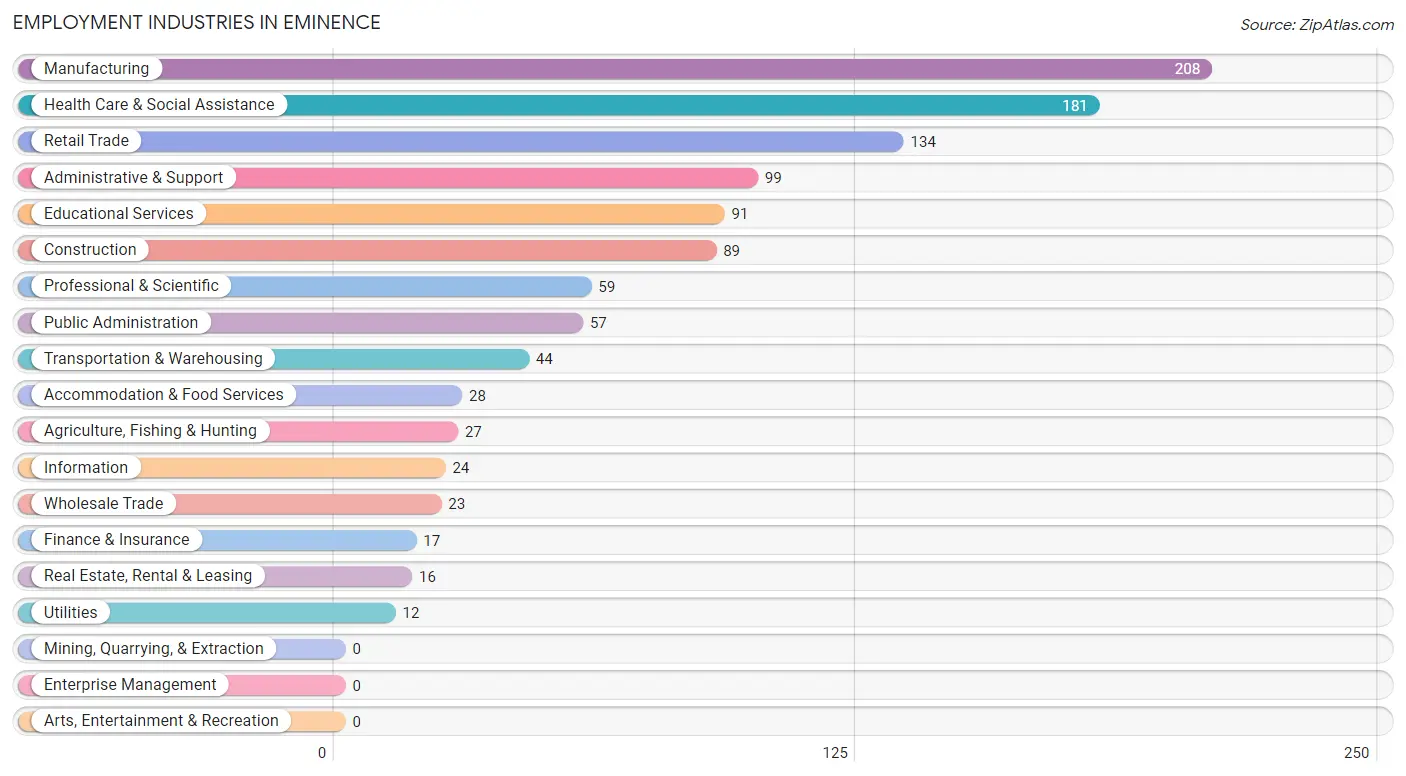
Employment Industries in Eminence
The major employment industries in Eminence include Manufacturing (208 | 18.2%), Health Care & Social Assistance (181 | 15.8%), Retail Trade (134 | 11.7%), Administrative & Support (99 | 8.6%), and Educational Services (91 | 8.0%).
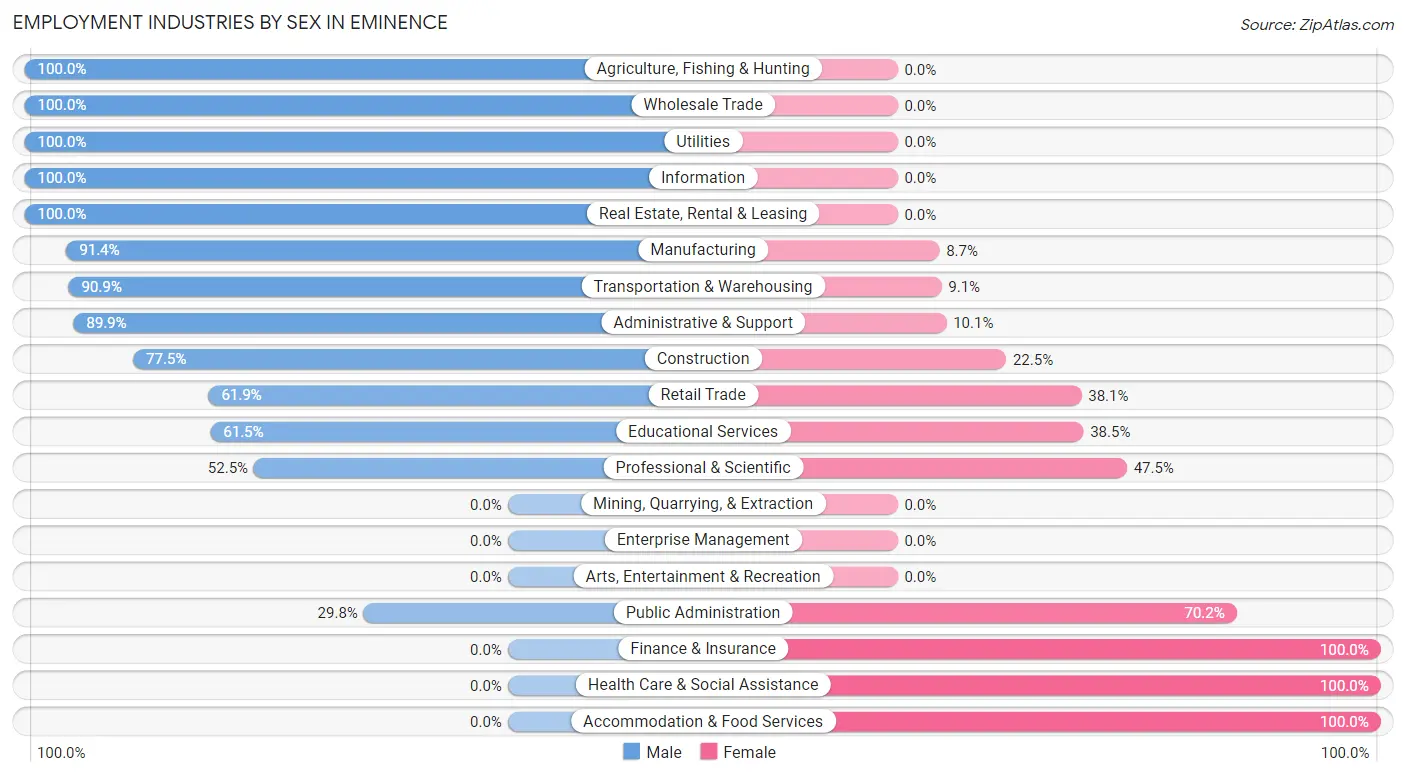
Employment Industries by Sex in Eminence
The Eminence industries that see more men than women are Agriculture, Fishing & Hunting (100.0%), Wholesale Trade (100.0%), and Utilities (100.0%), whereas the industries that tend to have a higher number of women are Finance & Insurance (100.0%), Health Care & Social Assistance (100.0%), and Accommodation & Food Services (100.0%).
| Industry | Male | Female |
| Agriculture, Fishing & Hunting | 27 (100.0%) | 0 (0.0%) |
| Mining, Quarrying, & Extraction | 0 (0.0%) | 0 (0.0%) |
| Construction | 69 (77.5%) | 20 (22.5%) |
| Manufacturing | 190 (91.3%) | 18 (8.6%) |
| Wholesale Trade | 23 (100.0%) | 0 (0.0%) |
| Retail Trade | 83 (61.9%) | 51 (38.1%) |
| Transportation & Warehousing | 40 (90.9%) | 4 (9.1%) |
| Utilities | 12 (100.0%) | 0 (0.0%) |
| Information | 24 (100.0%) | 0 (0.0%) |
| Finance & Insurance | 0 (0.0%) | 17 (100.0%) |
| Real Estate, Rental & Leasing | 16 (100.0%) | 0 (0.0%) |
| Professional & Scientific | 31 (52.5%) | 28 (47.5%) |
| Enterprise Management | 0 (0.0%) | 0 (0.0%) |
| Administrative & Support | 89 (89.9%) | 10 (10.1%) |
| Educational Services | 56 (61.5%) | 35 (38.5%) |
| Health Care & Social Assistance | 0 (0.0%) | 181 (100.0%) |
| Arts, Entertainment & Recreation | 0 (0.0%) | 0 (0.0%) |
| Accommodation & Food Services | 0 (0.0%) | 28 (100.0%) |
| Public Administration | 17 (29.8%) | 40 (70.2%) |
| Total | 698 (61.0%) | 446 (39.0%) |
Education in Eminence
School Enrollment in Eminence
The most common levels of schooling among the 679 students in Eminence are middle school (198 | 29.2%), elementary school (152 | 22.4%), and high school (94 | 13.8%).
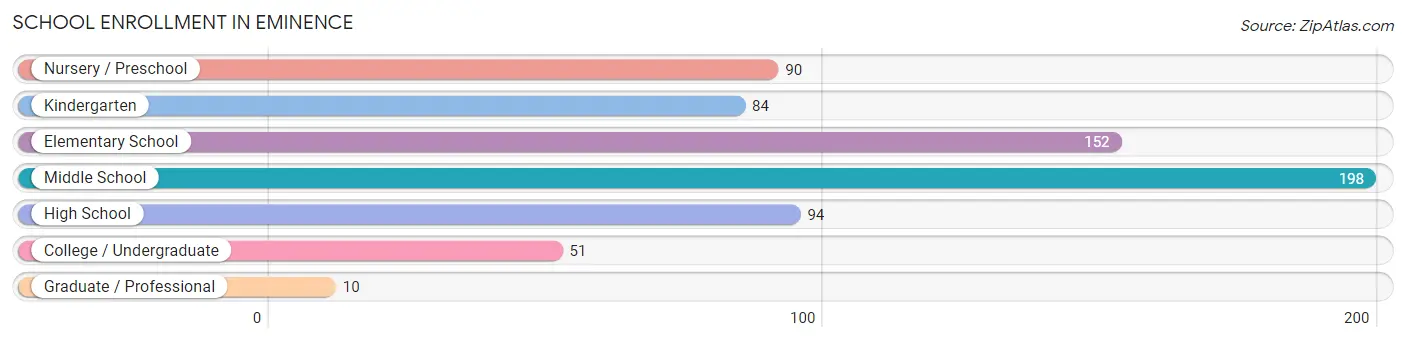
| School Level | # Students | % Students |
| Nursery / Preschool | 90 | 13.3% |
| Kindergarten | 84 | 12.4% |
| Elementary School | 152 | 22.4% |
| Middle School | 198 | 29.2% |
| High School | 94 | 13.8% |
| College / Undergraduate | 51 | 7.5% |
| Graduate / Professional | 10 | 1.5% |
| Total | 679 | 100.0% |
School Enrollment by Age by Funding Source in Eminence
Out of a total of 679 students who are enrolled in schools in Eminence, 100 (14.7%) attend a private institution, while the remaining 579 (85.3%) are enrolled in public schools. The age group of 35 years and over has the highest likelihood of being enrolled in private schools, with 6 (60.0% in the age bracket) enrolled. Conversely, the age group of 3 to 4 year olds has the lowest likelihood of being enrolled in a private school, with 75 (100.0% in the age bracket) attending a public institution.
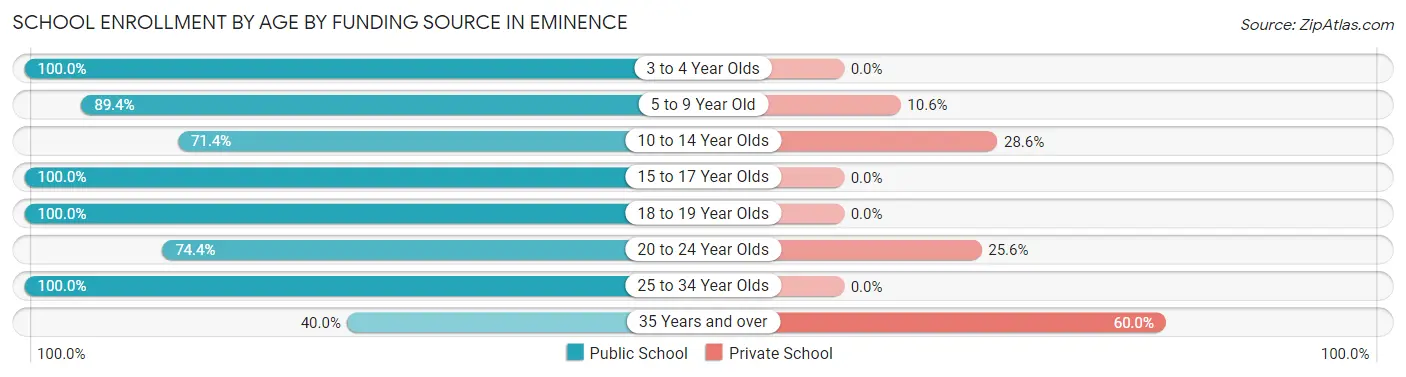
| Age Bracket | Public School | Private School |
| 3 to 4 Year Olds | 75 (100.0%) | 0 (0.0%) |
| 5 to 9 Year Old | 220 (89.4%) | 26 (10.6%) |
| 10 to 14 Year Olds | 145 (71.4%) | 58 (28.6%) |
| 15 to 17 Year Olds | 88 (100.0%) | 0 (0.0%) |
| 18 to 19 Year Olds | 10 (100.0%) | 0 (0.0%) |
| 20 to 24 Year Olds | 29 (74.4%) | 10 (25.6%) |
| 25 to 34 Year Olds | 8 (100.0%) | 0 (0.0%) |
| 35 Years and over | 4 (40.0%) | 6 (60.0%) |
| Total | 579 (85.3%) | 100 (14.7%) |
Educational Attainment by Field of Study in Eminence
Business (78 | 28.4%), education (42 | 15.3%), arts & humanities (39 | 14.2%), bio, nature & agricultural (29 | 10.5%), and literature & languages (24 | 8.7%) are the most common fields of study among 275 individuals in Eminence who have obtained a bachelor's degree or higher.
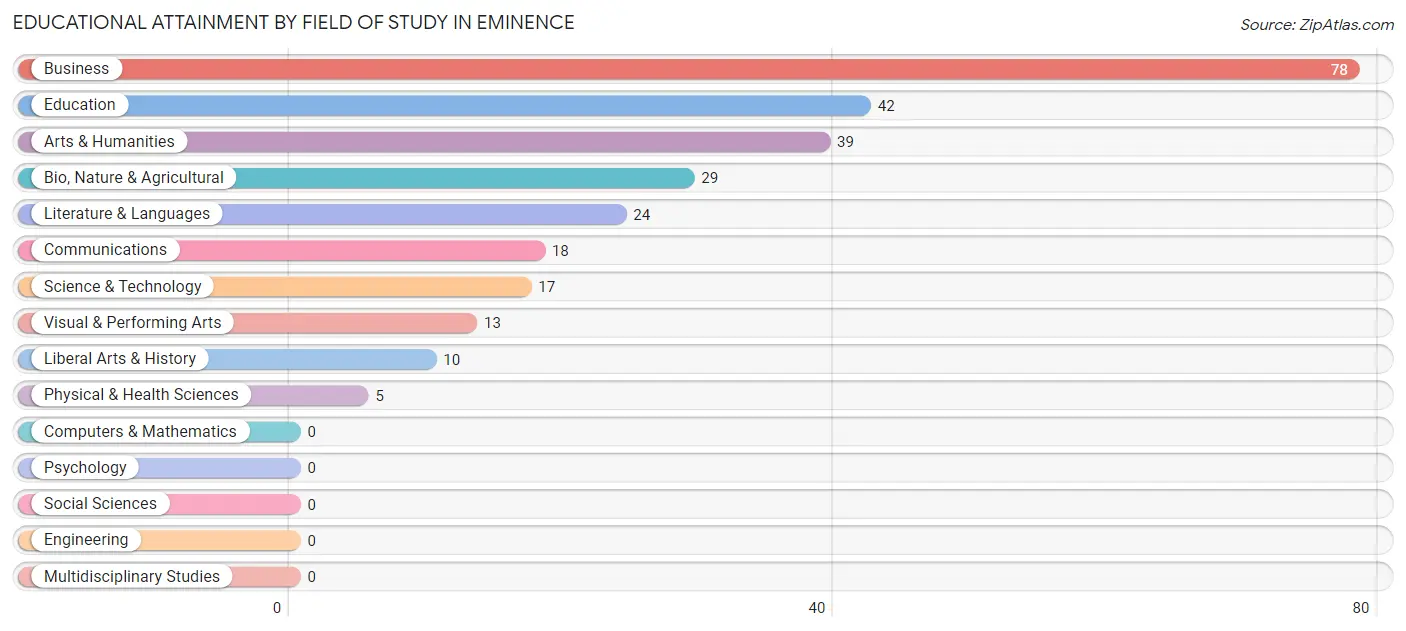
| Field of Study | # Graduates | % Graduates |
| Computers & Mathematics | 0 | 0.0% |
| Bio, Nature & Agricultural | 29 | 10.5% |
| Physical & Health Sciences | 5 | 1.8% |
| Psychology | 0 | 0.0% |
| Social Sciences | 0 | 0.0% |
| Engineering | 0 | 0.0% |
| Multidisciplinary Studies | 0 | 0.0% |
| Science & Technology | 17 | 6.2% |
| Business | 78 | 28.4% |
| Education | 42 | 15.3% |
| Literature & Languages | 24 | 8.7% |
| Liberal Arts & History | 10 | 3.6% |
| Visual & Performing Arts | 13 | 4.7% |
| Communications | 18 | 6.6% |
| Arts & Humanities | 39 | 14.2% |
| Total | 275 | 100.0% |
Transportation & Commute in Eminence
Vehicle Availability by Sex in Eminence
The most prevalent vehicle ownership categories in Eminence are males with 3 vehicles (239, accounting for 34.2%) and females with 3 vehicles (155, making up 53.9%).
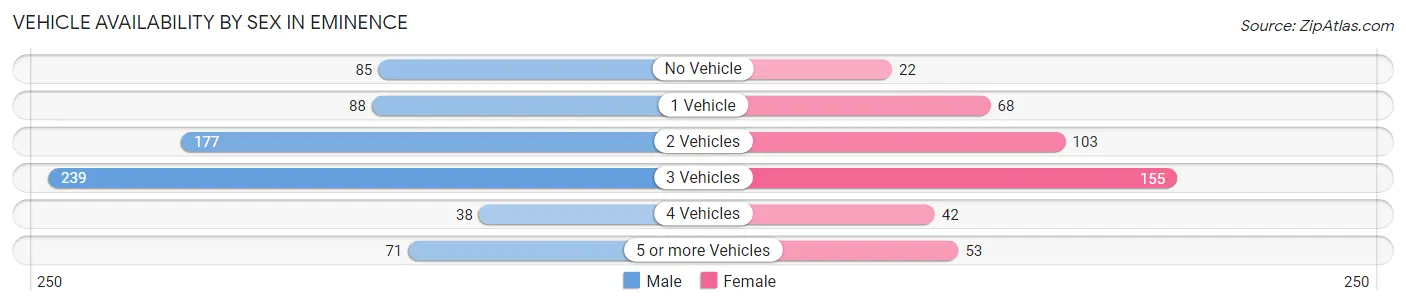
| Vehicles Available | Male | Female |
| No Vehicle | 85 (12.2%) | 22 (5.0%) |
| 1 Vehicle | 88 (12.6%) | 68 (15.3%) |
| 2 Vehicles | 177 (25.4%) | 103 (23.3%) |
| 3 Vehicles | 239 (34.2%) | 155 (35.0%) |
| 4 Vehicles | 38 (5.4%) | 42 (9.5%) |
| 5 or more Vehicles | 71 (10.2%) | 53 (12.0%) |
| Total | 698 (100.0%) | 443 (100.0%) |
Commute Time in Eminence
The most frequently occuring commute durations in Eminence are 45 to 59 minutes (252 commuters, 23.7%), 20 to 24 minutes (192 commuters, 18.0%), and 10 to 14 minutes (138 commuters, 13.0%).
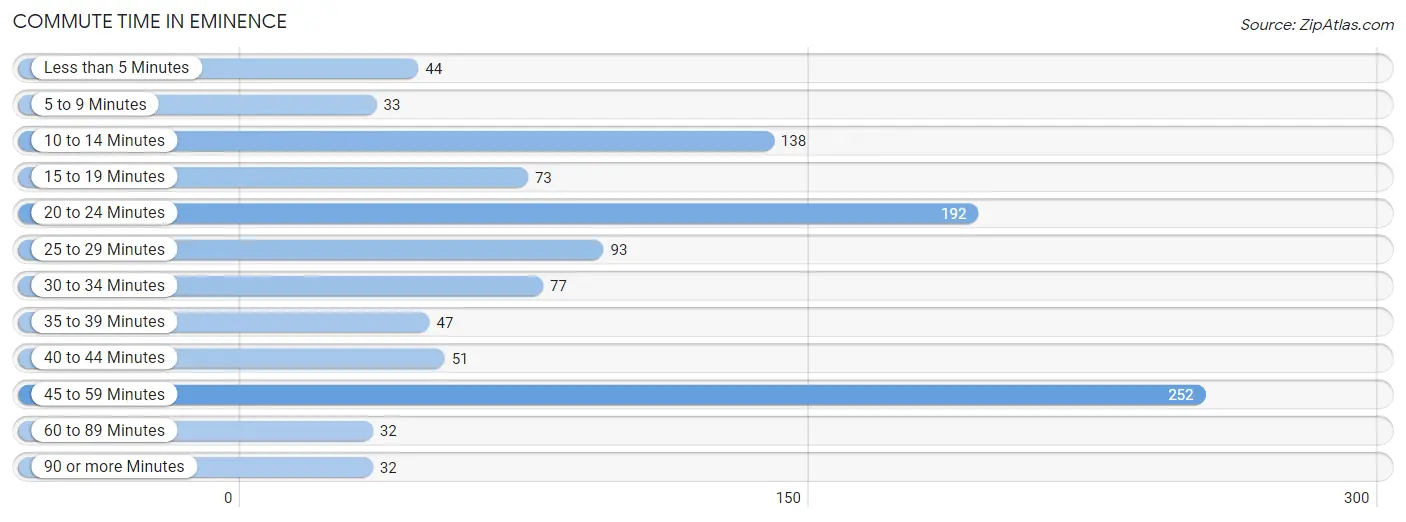
| Commute Time | # Commuters | % Commuters |
| Less than 5 Minutes | 44 | 4.1% |
| 5 to 9 Minutes | 33 | 3.1% |
| 10 to 14 Minutes | 138 | 13.0% |
| 15 to 19 Minutes | 73 | 6.9% |
| 20 to 24 Minutes | 192 | 18.0% |
| 25 to 29 Minutes | 93 | 8.7% |
| 30 to 34 Minutes | 77 | 7.2% |
| 35 to 39 Minutes | 47 | 4.4% |
| 40 to 44 Minutes | 51 | 4.8% |
| 45 to 59 Minutes | 252 | 23.7% |
| 60 to 89 Minutes | 32 | 3.0% |
| 90 or more Minutes | 32 | 3.0% |
Commute Time by Sex in Eminence
The most common commute times in Eminence are 45 to 59 minutes (174 commuters, 26.3%) for males and 45 to 59 minutes (78 commuters, 19.4%) for females.
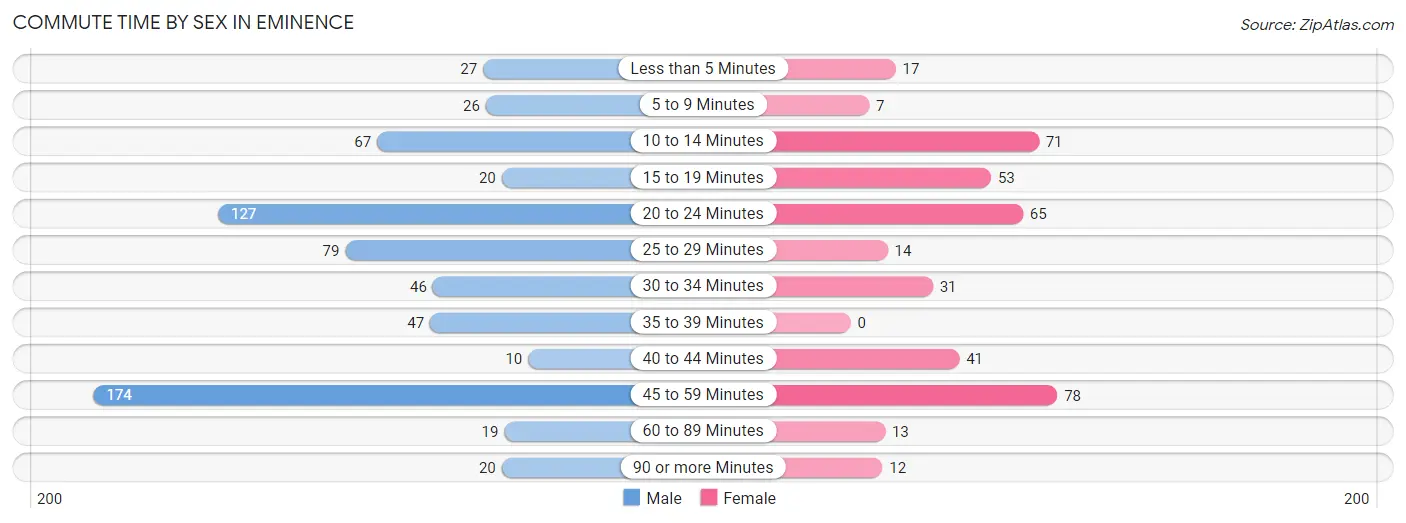
| Commute Time | Male | Female |
| Less than 5 Minutes | 27 (4.1%) | 17 (4.2%) |
| 5 to 9 Minutes | 26 (3.9%) | 7 (1.7%) |
| 10 to 14 Minutes | 67 (10.1%) | 71 (17.7%) |
| 15 to 19 Minutes | 20 (3.0%) | 53 (13.2%) |
| 20 to 24 Minutes | 127 (19.2%) | 65 (16.2%) |
| 25 to 29 Minutes | 79 (11.9%) | 14 (3.5%) |
| 30 to 34 Minutes | 46 (7.0%) | 31 (7.7%) |
| 35 to 39 Minutes | 47 (7.1%) | 0 (0.0%) |
| 40 to 44 Minutes | 10 (1.5%) | 41 (10.2%) |
| 45 to 59 Minutes | 174 (26.3%) | 78 (19.4%) |
| 60 to 89 Minutes | 19 (2.9%) | 13 (3.2%) |
| 90 or more Minutes | 20 (3.0%) | 12 (3.0%) |
Time of Departure to Work by Sex in Eminence
The most frequent times of departure to work in Eminence are 12:00 AM to 4:59 AM (161, 24.3%) for males and 7:00 AM to 7:29 AM (77, 19.2%) for females.
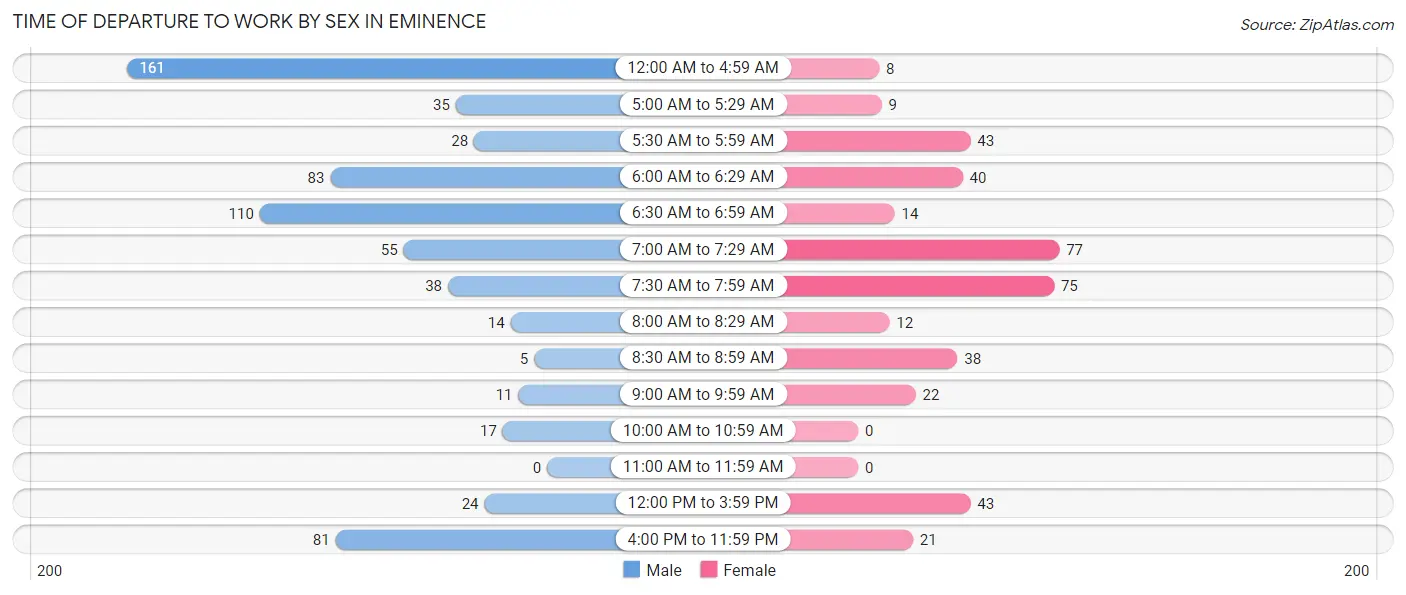
| Time of Departure | Male | Female |
| 12:00 AM to 4:59 AM | 161 (24.3%) | 8 (2.0%) |
| 5:00 AM to 5:29 AM | 35 (5.3%) | 9 (2.2%) |
| 5:30 AM to 5:59 AM | 28 (4.2%) | 43 (10.7%) |
| 6:00 AM to 6:29 AM | 83 (12.5%) | 40 (10.0%) |
| 6:30 AM to 6:59 AM | 110 (16.6%) | 14 (3.5%) |
| 7:00 AM to 7:29 AM | 55 (8.3%) | 77 (19.2%) |
| 7:30 AM to 7:59 AM | 38 (5.7%) | 75 (18.7%) |
| 8:00 AM to 8:29 AM | 14 (2.1%) | 12 (3.0%) |
| 8:30 AM to 8:59 AM | 5 (0.8%) | 38 (9.5%) |
| 9:00 AM to 9:59 AM | 11 (1.7%) | 22 (5.5%) |
| 10:00 AM to 10:59 AM | 17 (2.6%) | 0 (0.0%) |
| 11:00 AM to 11:59 AM | 0 (0.0%) | 0 (0.0%) |
| 12:00 PM to 3:59 PM | 24 (3.6%) | 43 (10.7%) |
| 4:00 PM to 11:59 PM | 81 (12.2%) | 21 (5.2%) |
| Total | 662 (100.0%) | 402 (100.0%) |
Housing Occupancy in Eminence
Occupancy by Ownership in Eminence
Of the total 1,062 dwellings in Eminence, owner-occupied units account for 608 (57.3%), while renter-occupied units make up 454 (42.7%).
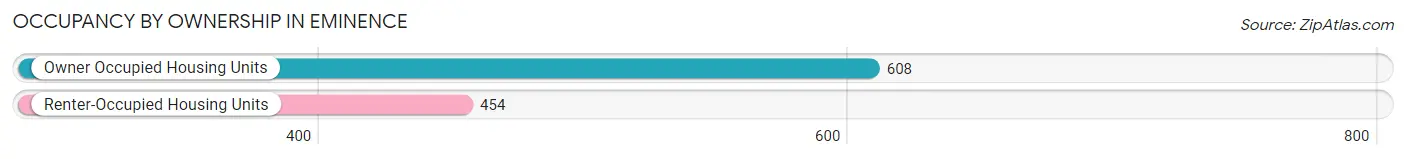
| Occupancy | # Housing Units | % Housing Units |
| Owner Occupied Housing Units | 608 | 57.3% |
| Renter-Occupied Housing Units | 454 | 42.7% |
| Total Occupied Housing Units | 1,062 | 100.0% |
Occupancy by Household Size in Eminence
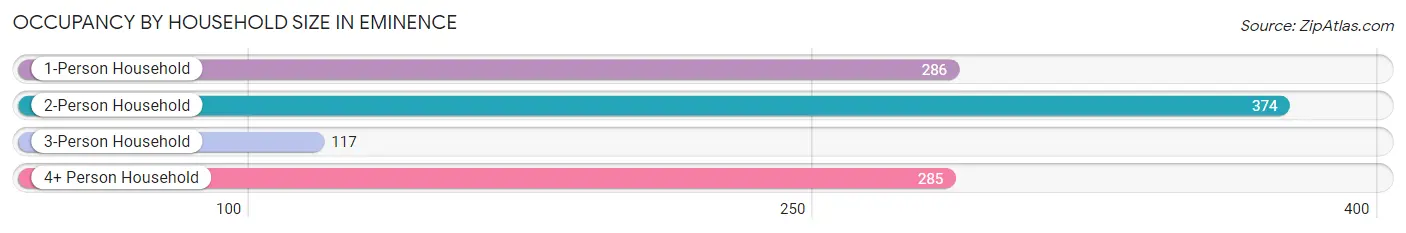
| Household Size | # Housing Units | % Housing Units |
| 1-Person Household | 286 | 26.9% |
| 2-Person Household | 374 | 35.2% |
| 3-Person Household | 117 | 11.0% |
| 4+ Person Household | 285 | 26.8% |
| Total Housing Units | 1,062 | 100.0% |
Occupancy by Ownership by Household Size in Eminence
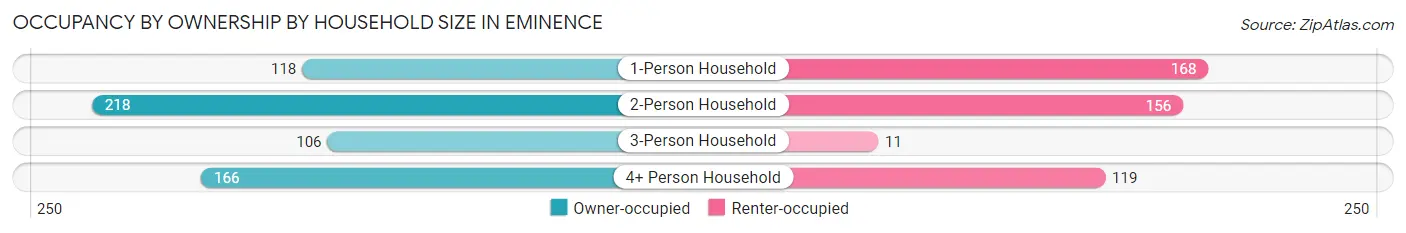
| Household Size | Owner-occupied | Renter-occupied |
| 1-Person Household | 118 (41.3%) | 168 (58.7%) |
| 2-Person Household | 218 (58.3%) | 156 (41.7%) |
| 3-Person Household | 106 (90.6%) | 11 (9.4%) |
| 4+ Person Household | 166 (58.3%) | 119 (41.7%) |
| Total Housing Units | 608 (57.3%) | 454 (42.7%) |
Occupancy by Educational Attainment in Eminence
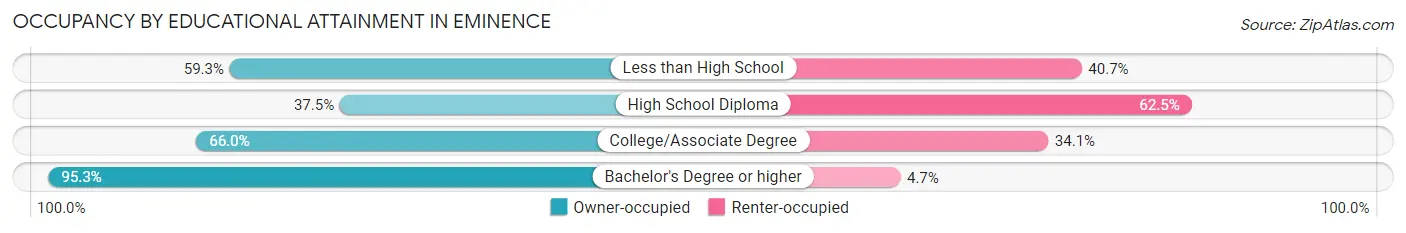
| Household Size | Owner-occupied | Renter-occupied |
| Less than High School | 86 (59.3%) | 59 (40.7%) |
| High School Diploma | 166 (37.5%) | 277 (62.5%) |
| College/Associate Degree | 215 (65.9%) | 111 (34.1%) |
| Bachelor's Degree or higher | 141 (95.3%) | 7 (4.7%) |
Occupancy by Age of Householder in Eminence
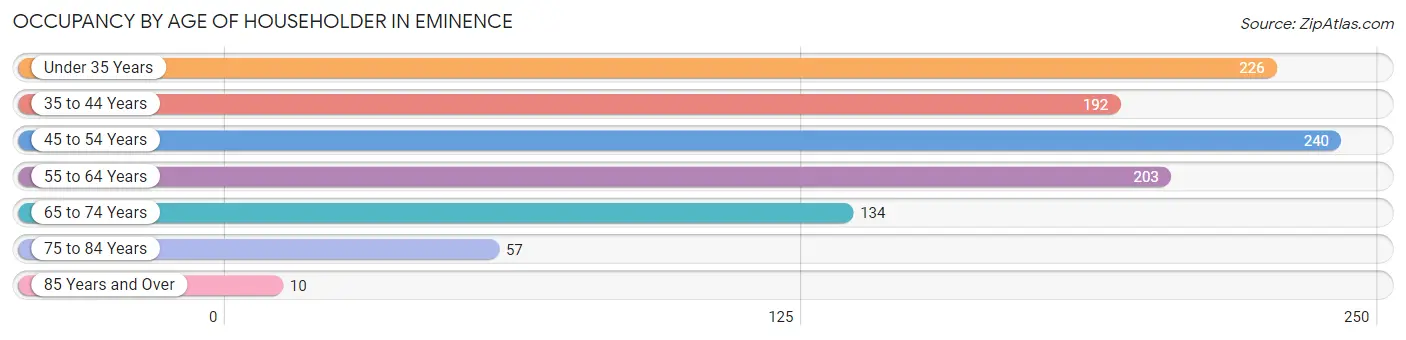
| Age Bracket | # Households | % Households |
| Under 35 Years | 226 | 21.3% |
| 35 to 44 Years | 192 | 18.1% |
| 45 to 54 Years | 240 | 22.6% |
| 55 to 64 Years | 203 | 19.1% |
| 65 to 74 Years | 134 | 12.6% |
| 75 to 84 Years | 57 | 5.4% |
| 85 Years and Over | 10 | 0.9% |
| Total | 1,062 | 100.0% |
Housing Finances in Eminence
Median Income by Occupancy in Eminence
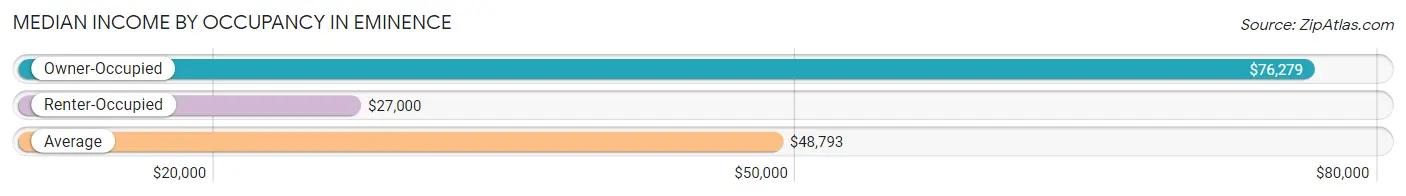
| Occupancy Type | # Households | Median Income |
| Owner-Occupied | 608 (57.3%) | $76,279 |
| Renter-Occupied | 454 (42.7%) | $27,000 |
| Average | 1,062 (100.0%) | $48,793 |
Occupancy by Householder Income Bracket in Eminence
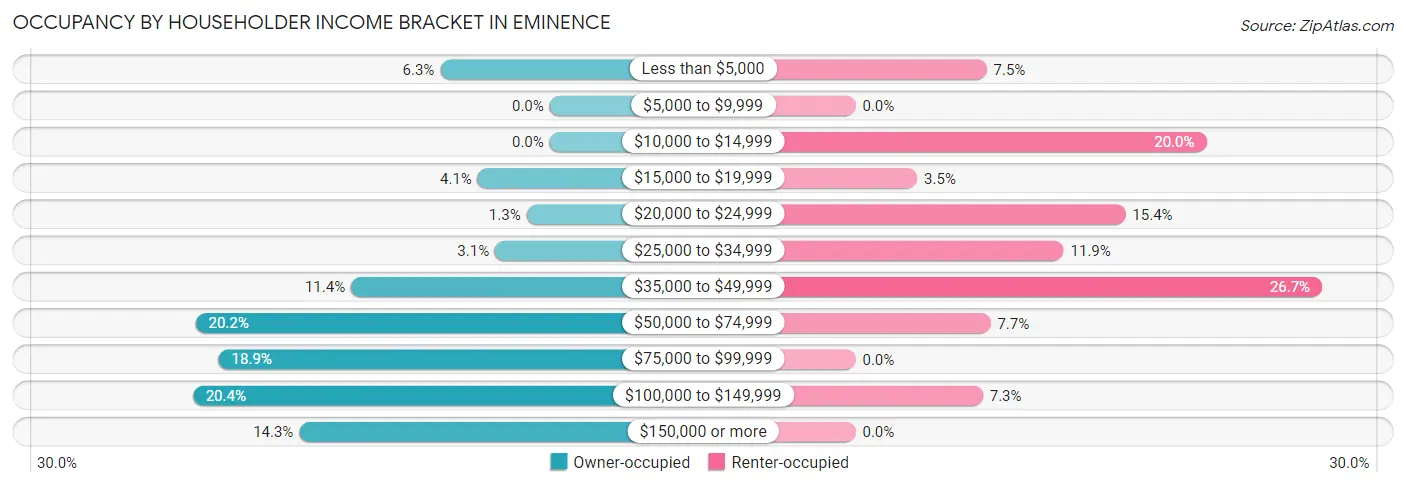
| Income Bracket | Owner-occupied | Renter-occupied |
| Less than $5,000 | 38 (6.2%) | 34 (7.5%) |
| $5,000 to $9,999 | 0 (0.0%) | 0 (0.0%) |
| $10,000 to $14,999 | 0 (0.0%) | 91 (20.0%) |
| $15,000 to $19,999 | 25 (4.1%) | 16 (3.5%) |
| $20,000 to $24,999 | 8 (1.3%) | 70 (15.4%) |
| $25,000 to $34,999 | 19 (3.1%) | 54 (11.9%) |
| $35,000 to $49,999 | 69 (11.4%) | 121 (26.7%) |
| $50,000 to $74,999 | 123 (20.2%) | 35 (7.7%) |
| $75,000 to $99,999 | 115 (18.9%) | 0 (0.0%) |
| $100,000 to $149,999 | 124 (20.4%) | 33 (7.3%) |
| $150,000 or more | 87 (14.3%) | 0 (0.0%) |
| Total | 608 (100.0%) | 454 (100.0%) |
Monthly Housing Cost Tiers in Eminence
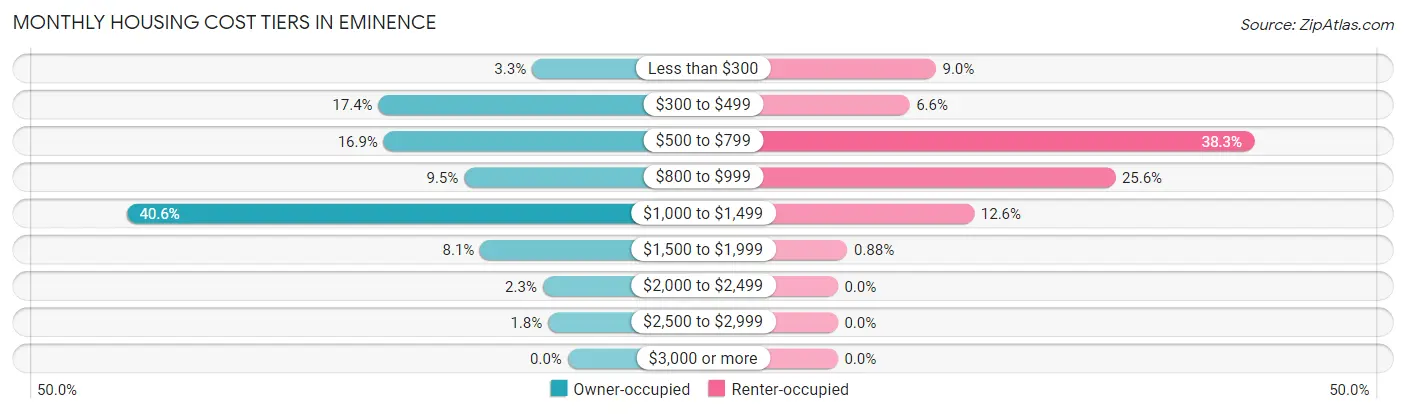
| Monthly Cost | Owner-occupied | Renter-occupied |
| Less than $300 | 20 (3.3%) | 41 (9.0%) |
| $300 to $499 | 106 (17.4%) | 30 (6.6%) |
| $500 to $799 | 103 (16.9%) | 174 (38.3%) |
| $800 to $999 | 58 (9.5%) | 116 (25.6%) |
| $1,000 to $1,499 | 247 (40.6%) | 57 (12.6%) |
| $1,500 to $1,999 | 49 (8.1%) | 4 (0.9%) |
| $2,000 to $2,499 | 14 (2.3%) | 0 (0.0%) |
| $2,500 to $2,999 | 11 (1.8%) | 0 (0.0%) |
| $3,000 or more | 0 (0.0%) | 0 (0.0%) |
| Total | 608 (100.0%) | 454 (100.0%) |
Physical Housing Characteristics in Eminence
Housing Structures in Eminence
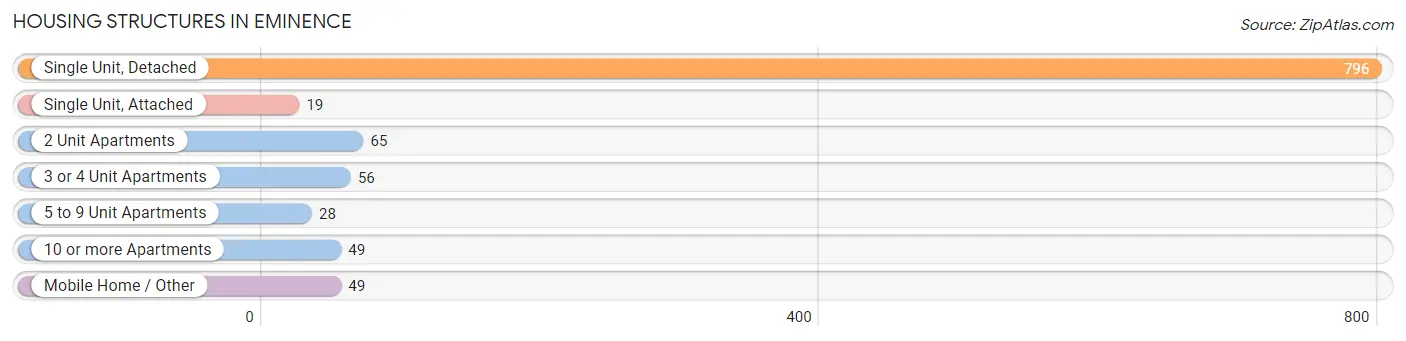
| Structure Type | # Housing Units | % Housing Units |
| Single Unit, Detached | 796 | 75.0% |
| Single Unit, Attached | 19 | 1.8% |
| 2 Unit Apartments | 65 | 6.1% |
| 3 or 4 Unit Apartments | 56 | 5.3% |
| 5 to 9 Unit Apartments | 28 | 2.6% |
| 10 or more Apartments | 49 | 4.6% |
| Mobile Home / Other | 49 | 4.6% |
| Total | 1,062 | 100.0% |
Housing Structures by Occupancy in Eminence
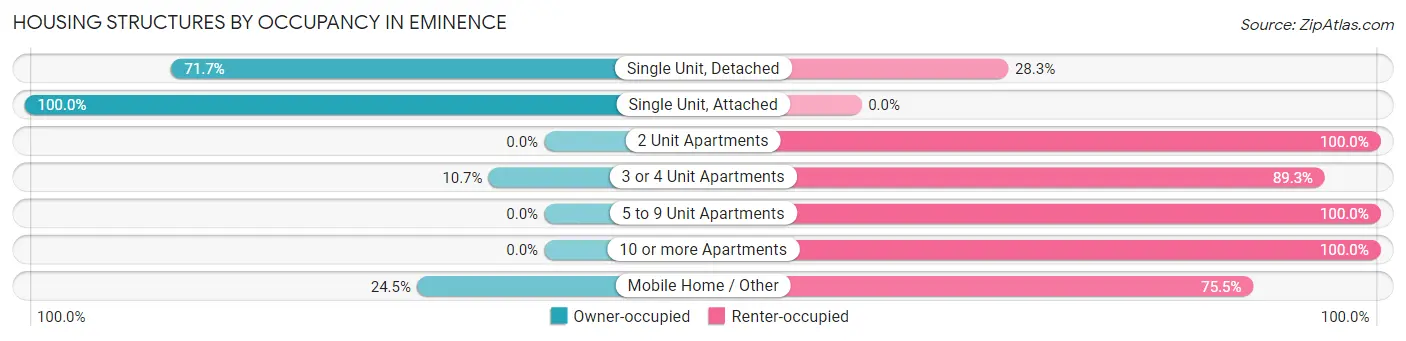
| Structure Type | Owner-occupied | Renter-occupied |
| Single Unit, Detached | 571 (71.7%) | 225 (28.3%) |
| Single Unit, Attached | 19 (100.0%) | 0 (0.0%) |
| 2 Unit Apartments | 0 (0.0%) | 65 (100.0%) |
| 3 or 4 Unit Apartments | 6 (10.7%) | 50 (89.3%) |
| 5 to 9 Unit Apartments | 0 (0.0%) | 28 (100.0%) |
| 10 or more Apartments | 0 (0.0%) | 49 (100.0%) |
| Mobile Home / Other | 12 (24.5%) | 37 (75.5%) |
| Total | 608 (57.3%) | 454 (42.7%) |
Housing Structures by Number of Rooms in Eminence
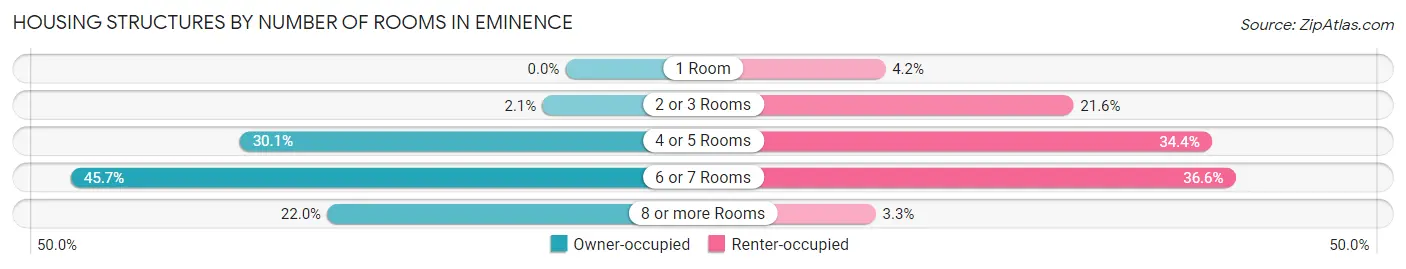
| Number of Rooms | Owner-occupied | Renter-occupied |
| 1 Room | 0 (0.0%) | 19 (4.2%) |
| 2 or 3 Rooms | 13 (2.1%) | 98 (21.6%) |
| 4 or 5 Rooms | 183 (30.1%) | 156 (34.4%) |
| 6 or 7 Rooms | 278 (45.7%) | 166 (36.6%) |
| 8 or more Rooms | 134 (22.0%) | 15 (3.3%) |
| Total | 608 (100.0%) | 454 (100.0%) |
Housing Structure by Heating Type in Eminence
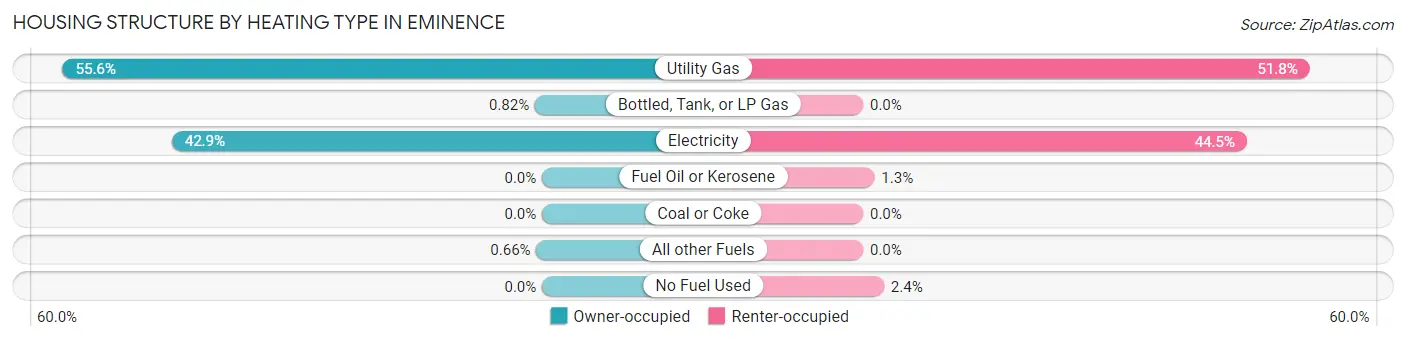
| Heating Type | Owner-occupied | Renter-occupied |
| Utility Gas | 338 (55.6%) | 235 (51.8%) |
| Bottled, Tank, or LP Gas | 5 (0.8%) | 0 (0.0%) |
| Electricity | 261 (42.9%) | 202 (44.5%) |
| Fuel Oil or Kerosene | 0 (0.0%) | 6 (1.3%) |
| Coal or Coke | 0 (0.0%) | 0 (0.0%) |
| All other Fuels | 4 (0.7%) | 0 (0.0%) |
| No Fuel Used | 0 (0.0%) | 11 (2.4%) |
| Total | 608 (100.0%) | 454 (100.0%) |
Household Vehicle Usage in Eminence
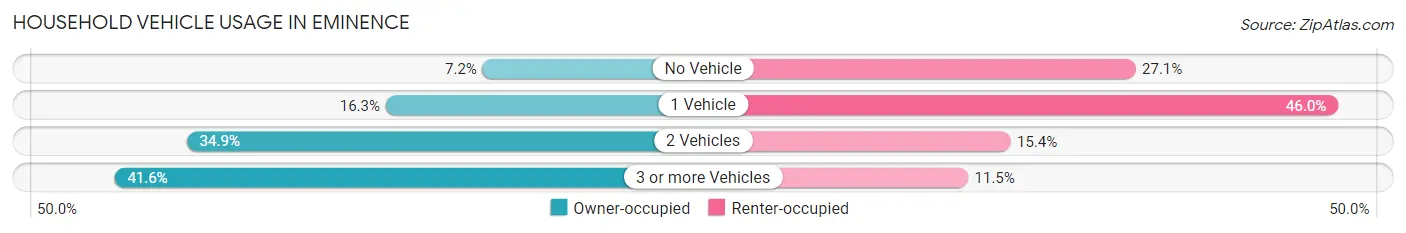
| Vehicles per Household | Owner-occupied | Renter-occupied |
| No Vehicle | 44 (7.2%) | 123 (27.1%) |
| 1 Vehicle | 99 (16.3%) | 209 (46.0%) |
| 2 Vehicles | 212 (34.9%) | 70 (15.4%) |
| 3 or more Vehicles | 253 (41.6%) | 52 (11.5%) |
| Total | 608 (100.0%) | 454 (100.0%) |
Real Estate & Mortgages in Eminence
Real Estate and Mortgage Overview in Eminence
| Characteristic | Without Mortgage | With Mortgage |
| Housing Units | 232 | 376 |
| Median Property Value | $144,400 | $170,000 |
| Median Household Income | $60,588 | $75 |
| Monthly Housing Costs | $484 | $0 |
| Real Estate Taxes | $1,194 | $48 |
Property Value by Mortgage Status in Eminence
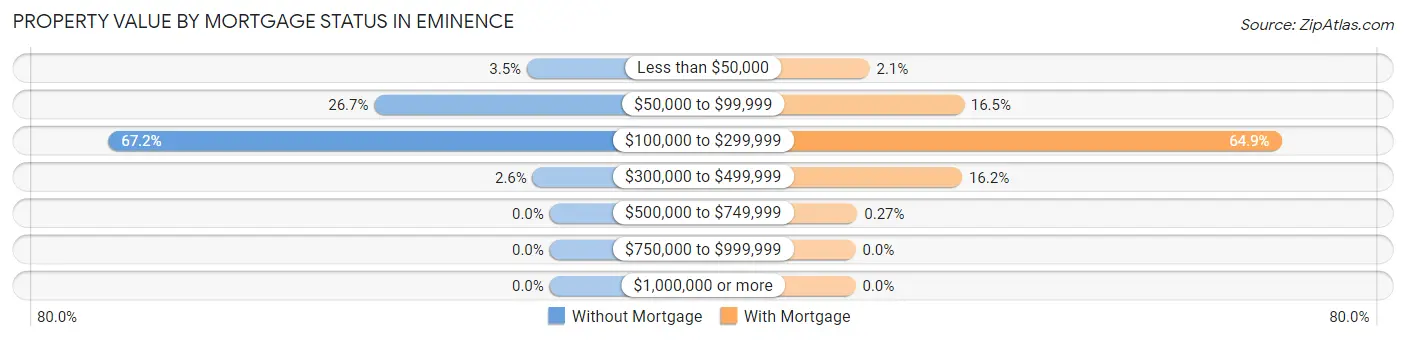
| Property Value | Without Mortgage | With Mortgage |
| Less than $50,000 | 8 (3.5%) | 8 (2.1%) |
| $50,000 to $99,999 | 62 (26.7%) | 62 (16.5%) |
| $100,000 to $299,999 | 156 (67.2%) | 244 (64.9%) |
| $300,000 to $499,999 | 6 (2.6%) | 61 (16.2%) |
| $500,000 to $749,999 | 0 (0.0%) | 1 (0.3%) |
| $750,000 to $999,999 | 0 (0.0%) | 0 (0.0%) |
| $1,000,000 or more | 0 (0.0%) | 0 (0.0%) |
| Total | 232 (100.0%) | 376 (100.0%) |
Household Income by Mortgage Status in Eminence
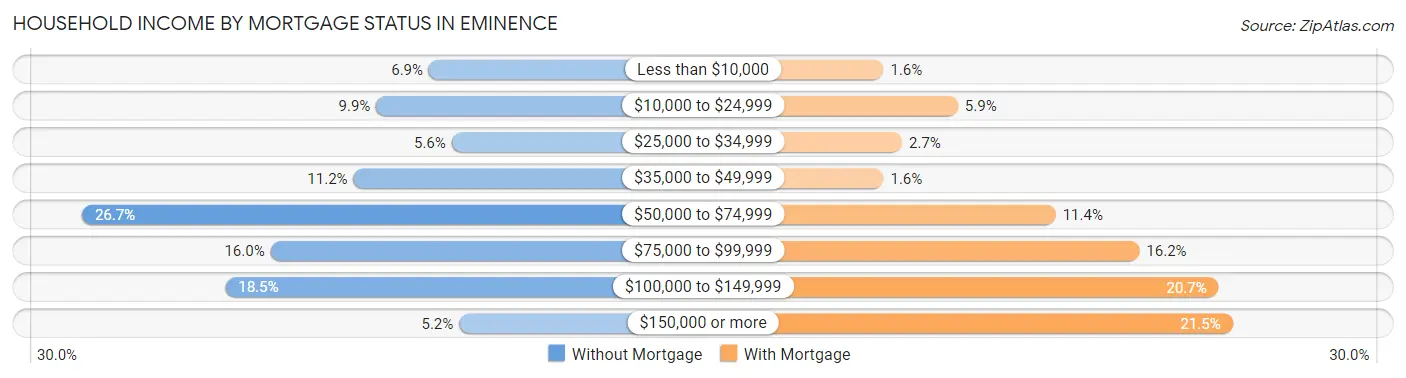
| Household Income | Without Mortgage | With Mortgage |
| Less than $10,000 | 16 (6.9%) | 6 (1.6%) |
| $10,000 to $24,999 | 23 (9.9%) | 22 (5.9%) |
| $25,000 to $34,999 | 13 (5.6%) | 10 (2.7%) |
| $35,000 to $49,999 | 26 (11.2%) | 6 (1.6%) |
| $50,000 to $74,999 | 62 (26.7%) | 43 (11.4%) |
| $75,000 to $99,999 | 37 (16.0%) | 61 (16.2%) |
| $100,000 to $149,999 | 43 (18.5%) | 78 (20.7%) |
| $150,000 or more | 12 (5.2%) | 81 (21.5%) |
| Total | 232 (100.0%) | 376 (100.0%) |
Property Value to Household Income Ratio in Eminence
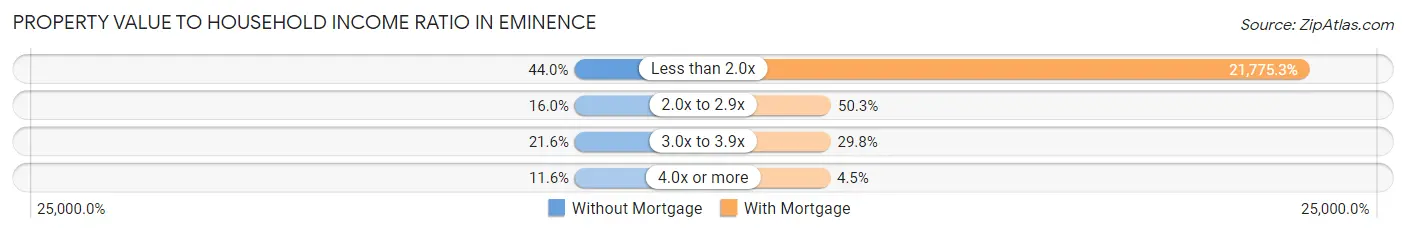
| Value-to-Income Ratio | Without Mortgage | With Mortgage |
| Less than 2.0x | 102 (44.0%) | 81,875 (21,775.3%) |
| 2.0x to 2.9x | 37 (16.0%) | 189 (50.3%) |
| 3.0x to 3.9x | 50 (21.5%) | 112 (29.8%) |
| 4.0x or more | 27 (11.6%) | 17 (4.5%) |
| Total | 232 (100.0%) | 376 (100.0%) |
Real Estate Taxes by Mortgage Status in Eminence
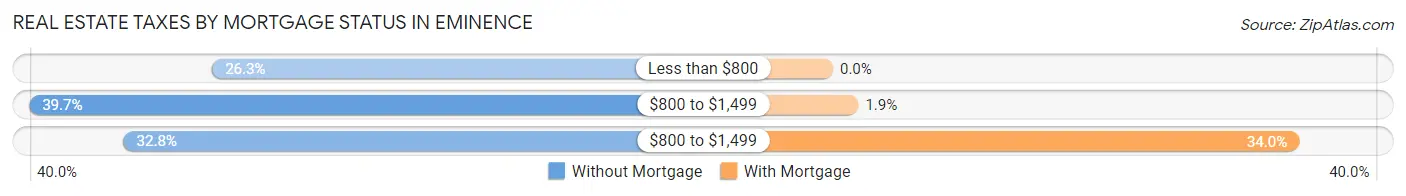
| Property Taxes | Without Mortgage | With Mortgage |
| Less than $800 | 61 (26.3%) | 0 (0.0%) |
| $800 to $1,499 | 92 (39.7%) | 7 (1.9%) |
| $800 to $1,499 | 76 (32.8%) | 128 (34.0%) |
| Total | 232 (100.0%) | 376 (100.0%) |
Health & Disability in Eminence
Health Insurance Coverage by Age in Eminence
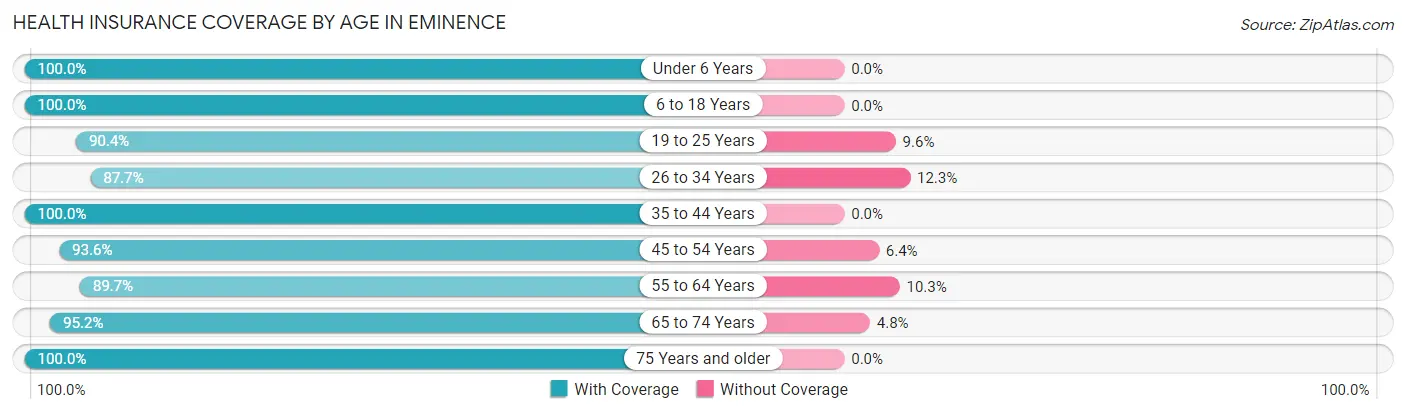
| Age Bracket | With Coverage | Without Coverage |
| Under 6 Years | 211 (100.0%) | 0 (0.0%) |
| 6 to 18 Years | 516 (100.0%) | 0 (0.0%) |
| 19 to 25 Years | 236 (90.4%) | 25 (9.6%) |
| 26 to 34 Years | 229 (87.7%) | 32 (12.3%) |
| 35 to 44 Years | 389 (100.0%) | 0 (0.0%) |
| 45 to 54 Years | 363 (93.6%) | 25 (6.4%) |
| 55 to 64 Years | 270 (89.7%) | 31 (10.3%) |
| 65 to 74 Years | 220 (95.2%) | 11 (4.8%) |
| 75 Years and older | 139 (100.0%) | 0 (0.0%) |
| Total | 2,573 (95.4%) | 124 (4.6%) |
Health Insurance Coverage by Citizenship Status in Eminence
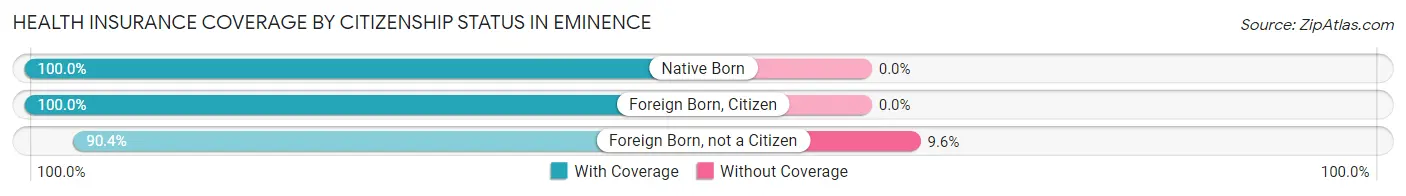
| Citizenship Status | With Coverage | Without Coverage |
| Native Born | 211 (100.0%) | 0 (0.0%) |
| Foreign Born, Citizen | 516 (100.0%) | 0 (0.0%) |
| Foreign Born, not a Citizen | 236 (90.4%) | 25 (9.6%) |
Health Insurance Coverage by Household Income in Eminence
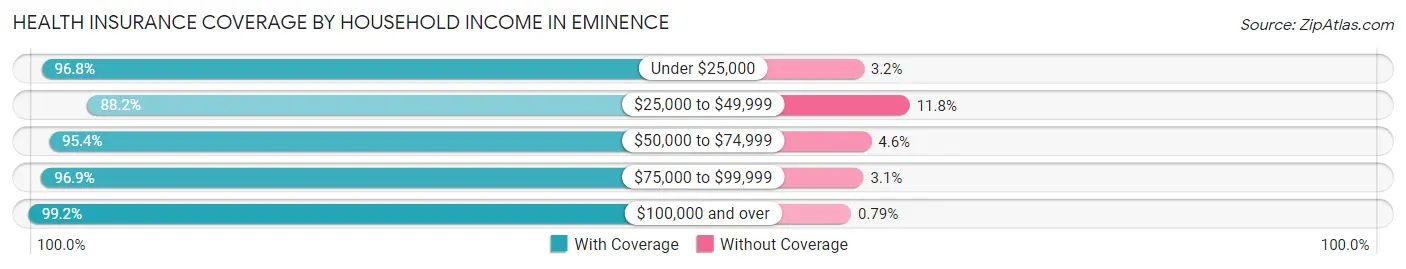
| Household Income | With Coverage | Without Coverage |
| Under $25,000 | 426 (96.8%) | 14 (3.2%) |
| $25,000 to $49,999 | 546 (88.2%) | 73 (11.8%) |
| $50,000 to $74,999 | 415 (95.4%) | 20 (4.6%) |
| $75,000 to $99,999 | 308 (96.9%) | 10 (3.1%) |
| $100,000 and over | 878 (99.2%) | 7 (0.8%) |
Public vs Private Health Insurance Coverage by Age in Eminence
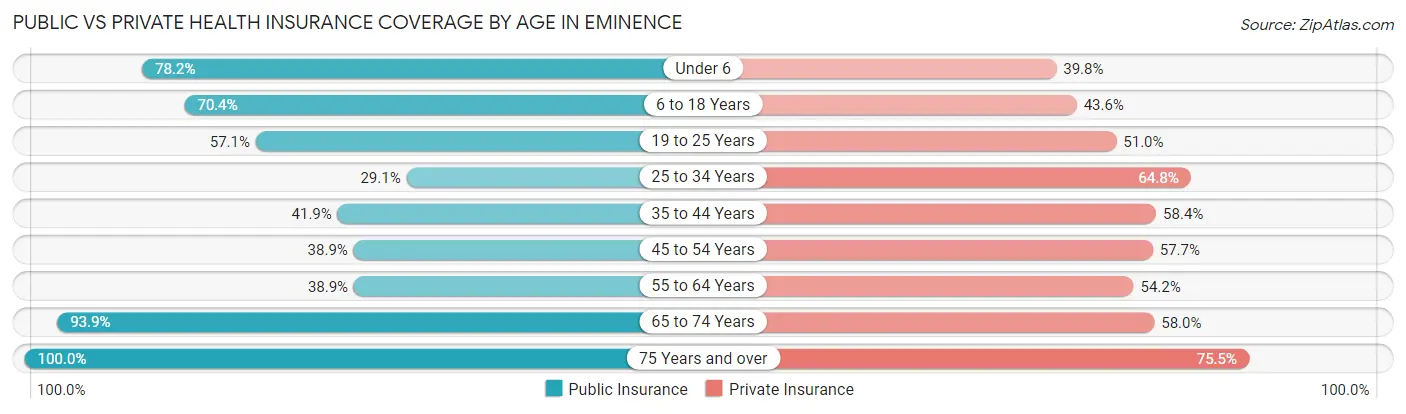
| Age Bracket | Public Insurance | Private Insurance |
| Under 6 | 165 (78.2%) | 84 (39.8%) |
| 6 to 18 Years | 363 (70.4%) | 225 (43.6%) |
| 19 to 25 Years | 149 (57.1%) | 133 (51.0%) |
| 25 to 34 Years | 76 (29.1%) | 169 (64.7%) |
| 35 to 44 Years | 163 (41.9%) | 227 (58.4%) |
| 45 to 54 Years | 151 (38.9%) | 224 (57.7%) |
| 55 to 64 Years | 117 (38.9%) | 163 (54.1%) |
| 65 to 74 Years | 217 (93.9%) | 134 (58.0%) |
| 75 Years and over | 139 (100.0%) | 105 (75.5%) |
| Total | 1,540 (57.1%) | 1,464 (54.3%) |
Disability Status by Sex by Age in Eminence
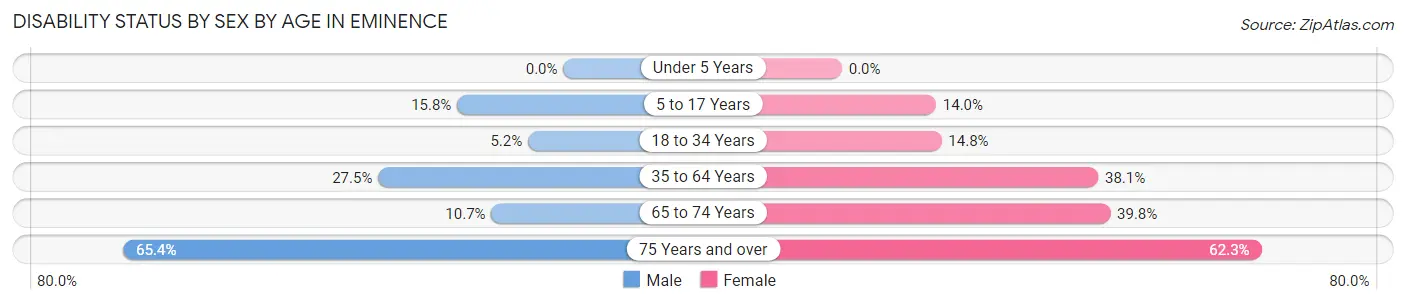
| Age Bracket | Male | Female |
| Under 5 Years | 0 (0.0%) | 0 (0.0%) |
| 5 to 17 Years | 49 (15.8%) | 32 (14.0%) |
| 18 to 34 Years | 13 (5.2%) | 42 (14.8%) |
| 35 to 64 Years | 141 (27.5%) | 215 (38.1%) |
| 65 to 74 Years | 11 (10.7%) | 51 (39.8%) |
| 75 Years and over | 51 (65.4%) | 38 (62.3%) |
Disability Class by Sex by Age in Eminence
Disability Class: Hearing Difficulty
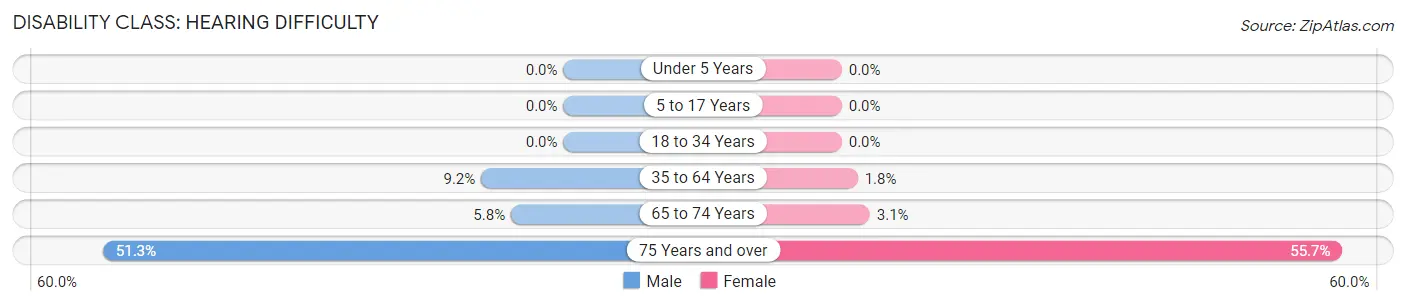
| Age Bracket | Male | Female |
| Under 5 Years | 0 (0.0%) | 0 (0.0%) |
| 5 to 17 Years | 0 (0.0%) | 0 (0.0%) |
| 18 to 34 Years | 0 (0.0%) | 0 (0.0%) |
| 35 to 64 Years | 47 (9.2%) | 10 (1.8%) |
| 65 to 74 Years | 6 (5.8%) | 4 (3.1%) |
| 75 Years and over | 40 (51.3%) | 34 (55.7%) |
Disability Class: Vision Difficulty
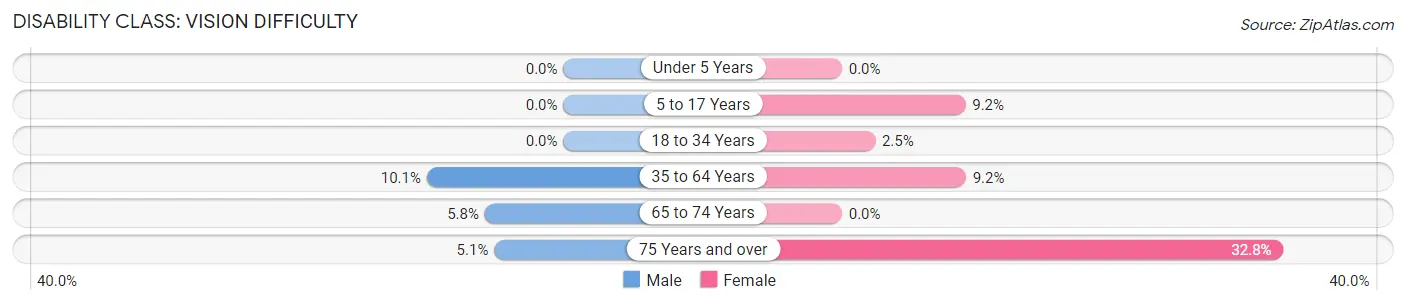
| Age Bracket | Male | Female |
| Under 5 Years | 0 (0.0%) | 0 (0.0%) |
| 5 to 17 Years | 0 (0.0%) | 21 (9.2%) |
| 18 to 34 Years | 0 (0.0%) | 7 (2.5%) |
| 35 to 64 Years | 52 (10.1%) | 52 (9.2%) |
| 65 to 74 Years | 6 (5.8%) | 0 (0.0%) |
| 75 Years and over | 4 (5.1%) | 20 (32.8%) |
Disability Class: Cognitive Difficulty
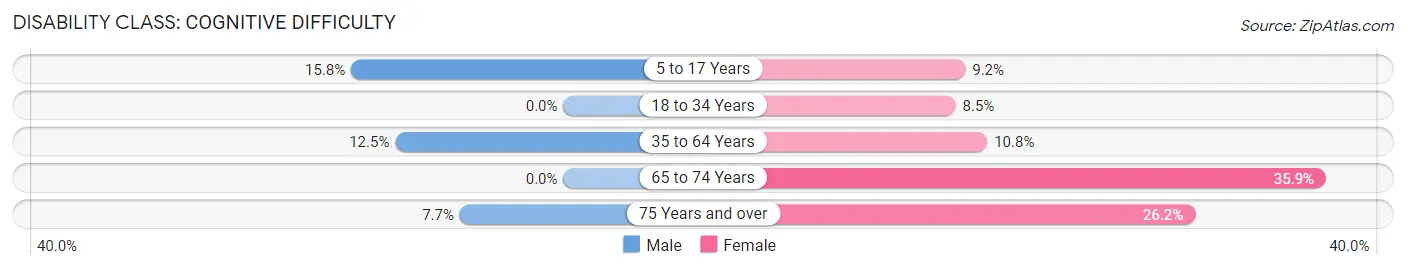
| Age Bracket | Male | Female |
| 5 to 17 Years | 49 (15.8%) | 21 (9.2%) |
| 18 to 34 Years | 0 (0.0%) | 24 (8.5%) |
| 35 to 64 Years | 64 (12.5%) | 61 (10.8%) |
| 65 to 74 Years | 0 (0.0%) | 46 (35.9%) |
| 75 Years and over | 6 (7.7%) | 16 (26.2%) |
Disability Class: Ambulatory Difficulty
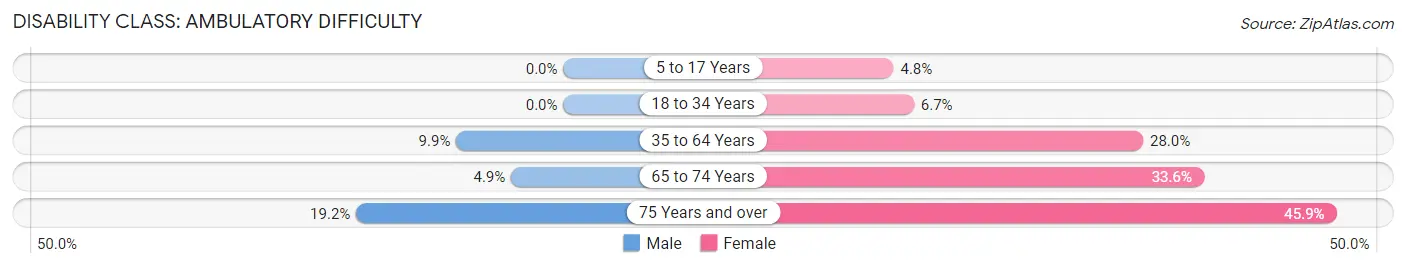
| Age Bracket | Male | Female |
| 5 to 17 Years | 0 (0.0%) | 11 (4.8%) |
| 18 to 34 Years | 0 (0.0%) | 19 (6.7%) |
| 35 to 64 Years | 51 (9.9%) | 158 (28.0%) |
| 65 to 74 Years | 5 (4.9%) | 43 (33.6%) |
| 75 Years and over | 15 (19.2%) | 28 (45.9%) |
Disability Class: Self-Care Difficulty
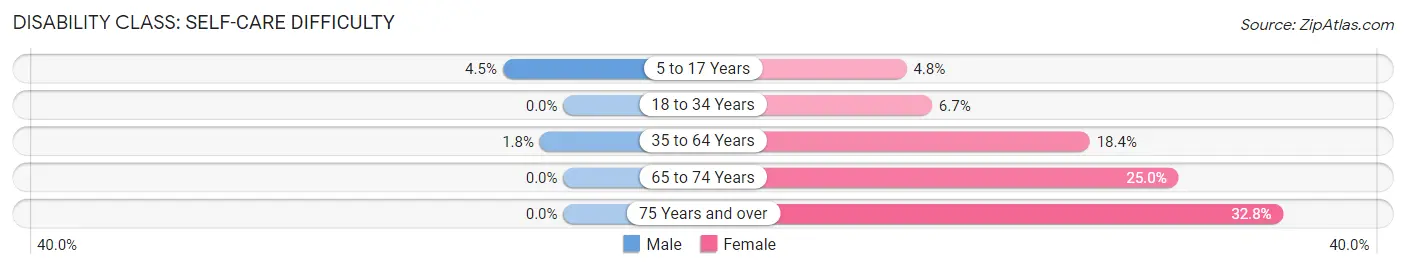
| Age Bracket | Male | Female |
| 5 to 17 Years | 14 (4.5%) | 11 (4.8%) |
| 18 to 34 Years | 0 (0.0%) | 19 (6.7%) |
| 35 to 64 Years | 9 (1.8%) | 104 (18.4%) |
| 65 to 74 Years | 0 (0.0%) | 32 (25.0%) |
| 75 Years and over | 0 (0.0%) | 20 (32.8%) |
Technology Access in Eminence
Computing Device Access in Eminence
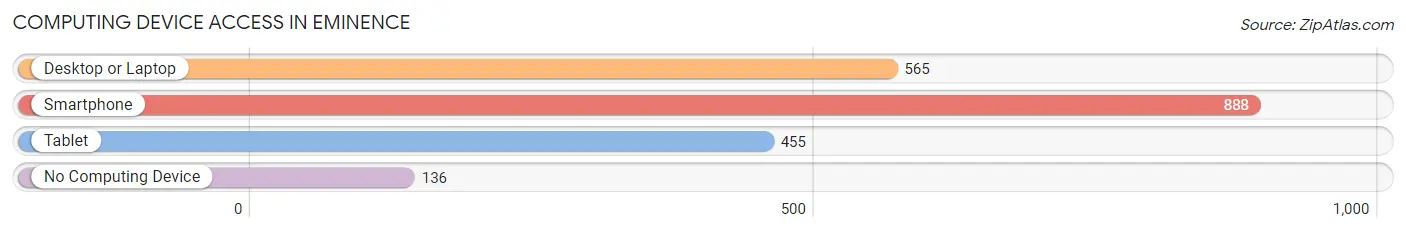
| Device Type | # Households | % Households |
| Desktop or Laptop | 565 | 53.2% |
| Smartphone | 888 | 83.6% |
| Tablet | 455 | 42.8% |
| No Computing Device | 136 | 12.8% |
| Total | 1,062 | 100.0% |
Internet Access in Eminence
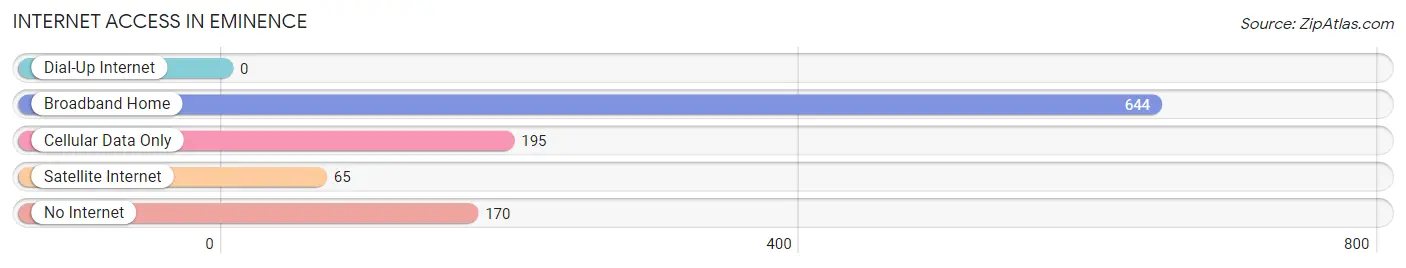
| Internet Type | # Households | % Households |
| Dial-Up Internet | 0 | 0.0% |
| Broadband Home | 644 | 60.6% |
| Cellular Data Only | 195 | 18.4% |
| Satellite Internet | 65 | 6.1% |
| No Internet | 170 | 16.0% |
| Total | 1,062 | 100.0% |
Eminence Summary
Eminence is a small city located in Henry County, Kentucky, United States. It is situated on the Kentucky River, about 25 miles northeast of Louisville. The population was 1,619 at the 2010 census. Eminence is the county seat of Henry County and is part of the Louisville/Jefferson County Metropolitan Statistical Area.
History
Eminence was founded in 1817 by William and John Craig, two brothers from Virginia. The town was named after the Latin word for excellence, and was intended to be a center of commerce and industry. The Craig brothers built a grist mill and a saw mill on the Kentucky River, and the town quickly grew. By 1820, Eminence had a population of over 500 people.
In 1822, the Kentucky General Assembly established Henry County, and Eminence was chosen as the county seat. The town was incorporated in 1824, and the first courthouse was built in 1825.
In the mid-1800s, Eminence was a major stop on the Louisville and Nashville Railroad. The railroad brought new businesses and industries to the town, and the population grew to over 1,000 by the late 1800s.
Geography
Eminence is located at 38°25'25" North, 85°7'25" West (38.423750, -85.123611). According to the United States Census Bureau, the city has a total area of 1.2 square miles (3.1 km2), all land.
Economy
Eminence is a small city with a limited economy. The main industries in the area are agriculture, manufacturing, and tourism.
Agriculture is the main industry in Eminence. The area is known for its tobacco, corn, and soybean production. There are also several dairy farms in the area.
Manufacturing is also an important part of the local economy. Eminence is home to several small factories, including a furniture factory, a plastics factory, and a metal fabrication plant.
Tourism is also an important part of the local economy. Eminence is home to several historic sites, including the Eminence Historic District, the Eminence Cemetery, and the Eminence Bridge. The city is also home to several parks, including the Eminence City Park and the Eminence Nature Preserve.
Demographics
As of the census of 2010, there were 1,619 people, 690 households, and 441 families residing in the city. The population density was 1,346.8 people per square mile (519.7/km2). There were 745 housing units at an average density of 619.2 per square mile (238.7/km2). The racial makeup of the city was 95.2% White, 1.3% African American, 0.2% Native American, 0.4% Asian, 0.1% Pacific Islander, 1.2% from other races, and 1.6% from two or more races. Hispanic or Latino of any race were 2.7% of the population.
There were 690 households, out of which 28.3% had children under the age of 18 living with them, 44.3% were married couples living together, 14.3% had a female householder with no husband present, and 36.2% were non-families. 32.2% of all households were made up of individuals, and 15.2% had someone living alone who was 65 years of age or older. The average household size was 2.33 and the average family size was 2.93.
In the city, the population was spread out, with 24.2% under the age of 18, 8.2% from 18 to 24, 27.2% from 25 to 44, 22.7% from 45 to 64, and 17.7% who were 65 years of age or older. The median age was 38 years. For every 100 females, there were 87.2 males. For every 100 females age 18 and over, there were 83.2 males.
The median income for a household in the city was $30,938, and the median income for a family was $37,500. Males had a median income of $30,000 versus $21,250 for females. The per capita income for the city was $16,945. About 11.2% of families and 14.2% of the population were below the poverty line, including 19.2% of those under age 18 and 11.2% of those age 65 or over.
Common Questions
What is Per Capita Income in Eminence?
Per Capita income in Eminence is $24,139.
What is the Median Family Income in Eminence?
Median Family Income in Eminence is $69,194.
What is the Median Household income in Eminence?
Median Household Income in Eminence is $48,793.
What is Income or Wage Gap in Eminence?
Income or Wage Gap in Eminence is 29.1%.
Women in Eminence earn 70.9 cents for every dollar earned by a man.
What is Inequality or Gini Index in Eminence?
Inequality or Gini Index in Eminence is 0.43.
What is the Total Population of Eminence?
Total Population of Eminence is 2,705.
What is the Total Male Population of Eminence?
Total Male Population of Eminence is 1,327.
What is the Total Female Population of Eminence?
Total Female Population of Eminence is 1,378.
What is the Ratio of Males per 100 Females in Eminence?
There are 96.30 Males per 100 Females in Eminence.
What is the Ratio of Females per 100 Males in Eminence?
There are 103.84 Females per 100 Males in Eminence.
What is the Median Population Age in Eminence?
Median Population Age in Eminence is 36.6 Years.
What is the Average Family Size in Eminence
Average Family Size in Eminence is 3.2 People.
What is the Average Household Size in Eminence
Average Household Size in Eminence is 2.5 People.
How Large is the Labor Force in Eminence?
There are 1,234 People in the Labor Forcein in Eminence.
What is the Percentage of People in the Labor Force in Eminence?
59.9% of People are in the Labor Force in Eminence.
What is the Unemployment Rate in Eminence?
Unemployment Rate in Eminence is 6.6%.