Heritage Creek, KY Map & Demographics
Heritage Creek Map
Heritage Creek Overview
$34,262
PER CAPITA INCOME
$88,750
AVG FAMILY INCOME
$85,469
AVG HOUSEHOLD INCOME
19.6%
WAGE / INCOME GAP [ % ]
80.4¢/ $1
WAGE / INCOME GAP [ $ ]
$2,469
FAMILY INCOME DEFICIT
0.33
INEQUALITY / GINI INDEX
1,109
TOTAL POPULATION
485
MALE POPULATION
624
FEMALE POPULATION
77.72
MALES / 100 FEMALES
128.66
FEMALES / 100 MALES
45.4
MEDIAN AGE
3.0
AVG FAMILY SIZE
2.5
AVG HOUSEHOLD SIZE
585
LABOR FORCE [ PEOPLE ]
64.4%
PERCENT IN LABOR FORCE
2.4%
UNEMPLOYMENT RATE
Heritage Creek Area Codes
Income in Heritage Creek
Income Overview in Heritage Creek
Per Capita Income in Heritage Creek is $34,262, while median incomes of families and households are $88,750 and $85,469 respectively.
| Characteristic | Number | Measure |
| Per Capita Income | 1,109 | $34,262 |
| Median Family Income | 300 | $88,750 |
| Mean Family Income | 300 | $92,664 |
| Median Household Income | 437 | $85,469 |
| Mean Household Income | 437 | $87,152 |
| Income Deficit | 300 | $2,469 |
| Wage / Income Gap (%) | 1,109 | 19.60% |
| Wage / Income Gap ($) | 1,109 | 80.40¢ per $1 |
| Gini / Inequality Index | 1,109 | 0.33 |
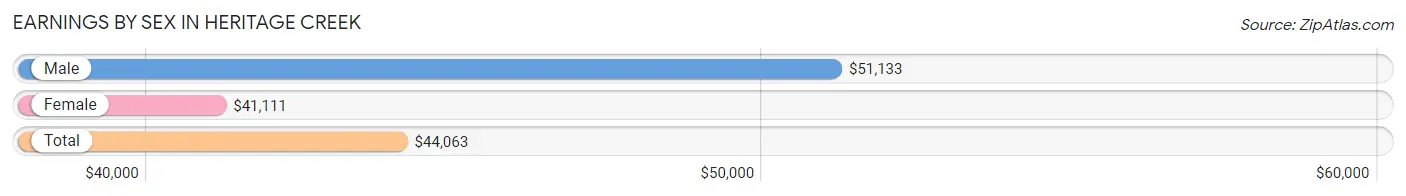
Earnings by Sex in Heritage Creek
Average Earnings in Heritage Creek are $44,063, $51,133 for men and $41,111 for women, a difference of 19.6%.
| Sex | Number | Average Earnings |
| Male | 311 (51.4%) | $51,133 |
| Female | 294 (48.6%) | $41,111 |
| Total | 605 (100.0%) | $44,063 |
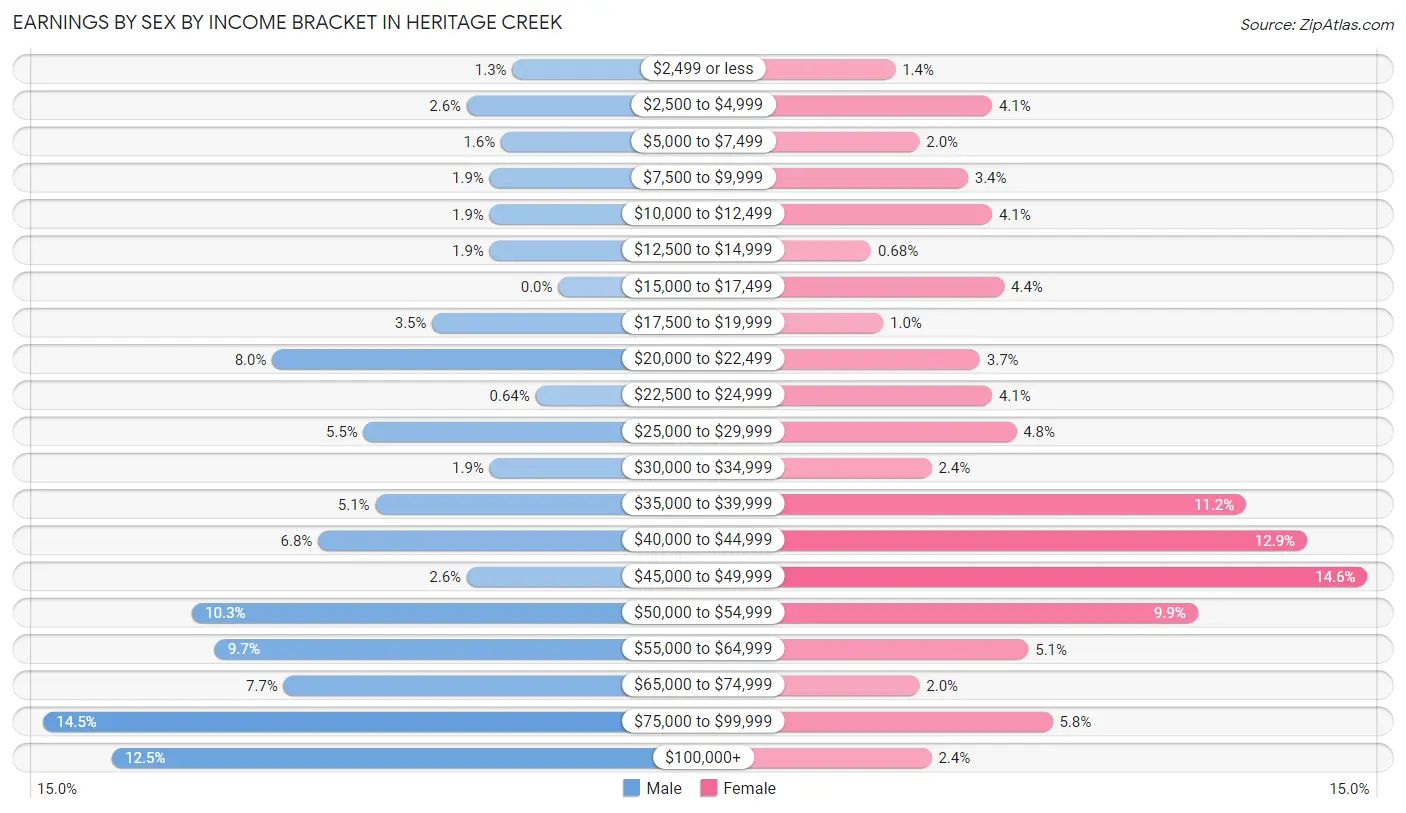
Earnings by Sex by Income Bracket in Heritage Creek
The most common earnings brackets in Heritage Creek are $75,000 to $99,999 for men (45 | 14.5%) and $45,000 to $49,999 for women (43 | 14.6%).
| Income | Male | Female |
| $2,499 or less | 4 (1.3%) | 4 (1.4%) |
| $2,500 to $4,999 | 8 (2.6%) | 12 (4.1%) |
| $5,000 to $7,499 | 5 (1.6%) | 6 (2.0%) |
| $7,500 to $9,999 | 6 (1.9%) | 10 (3.4%) |
| $10,000 to $12,499 | 6 (1.9%) | 12 (4.1%) |
| $12,500 to $14,999 | 6 (1.9%) | 2 (0.7%) |
| $15,000 to $17,499 | 0 (0.0%) | 13 (4.4%) |
| $17,500 to $19,999 | 11 (3.5%) | 3 (1.0%) |
| $20,000 to $22,499 | 25 (8.0%) | 11 (3.7%) |
| $22,500 to $24,999 | 2 (0.6%) | 12 (4.1%) |
| $25,000 to $29,999 | 17 (5.5%) | 14 (4.8%) |
| $30,000 to $34,999 | 6 (1.9%) | 7 (2.4%) |
| $35,000 to $39,999 | 16 (5.1%) | 33 (11.2%) |
| $40,000 to $44,999 | 21 (6.8%) | 38 (12.9%) |
| $45,000 to $49,999 | 8 (2.6%) | 43 (14.6%) |
| $50,000 to $54,999 | 32 (10.3%) | 29 (9.9%) |
| $55,000 to $64,999 | 30 (9.7%) | 15 (5.1%) |
| $65,000 to $74,999 | 24 (7.7%) | 6 (2.0%) |
| $75,000 to $99,999 | 45 (14.5%) | 17 (5.8%) |
| $100,000+ | 39 (12.5%) | 7 (2.4%) |
| Total | 311 (100.0%) | 294 (100.0%) |
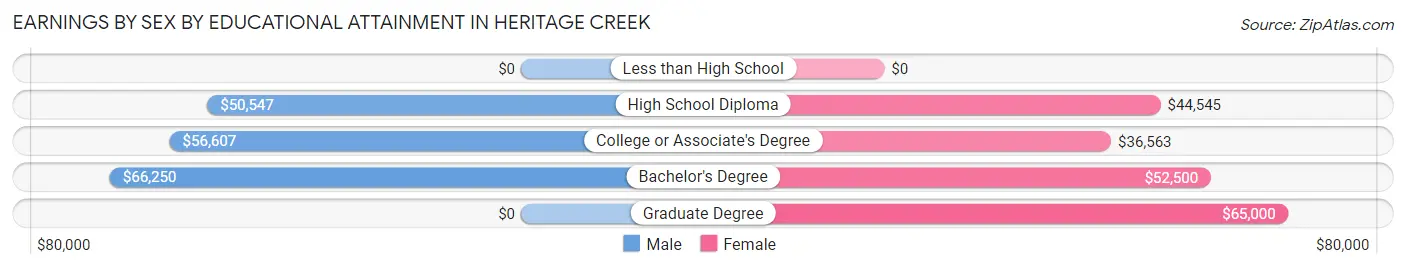
Earnings by Sex by Educational Attainment in Heritage Creek
Average earnings in Heritage Creek are $52,266 for men and $43,438 for women, a difference of 16.9%. Men with an educational attainment of bachelor's degree enjoy the highest average annual earnings of $66,250, while those with high school diploma education earn the least with $50,547. Women with an educational attainment of graduate degree earn the most with the average annual earnings of $65,000, while those with college or associate's degree education have the smallest earnings of $36,563.
| Educational Attainment | Male Income | Female Income |
| Less than High School | - | - |
| High School Diploma | $50,547 | $44,545 |
| College or Associate's Degree | $56,607 | $36,563 |
| Bachelor's Degree | $66,250 | $52,500 |
| Graduate Degree | - | - |
| Total | $52,266 | $43,438 |
Family Income in Heritage Creek
Family Income Brackets in Heritage Creek
According to the Heritage Creek family income data, there are 84 families falling into the $100,000 to $149,999 income range, which is the most common income bracket and makes up 28.0% of all families.
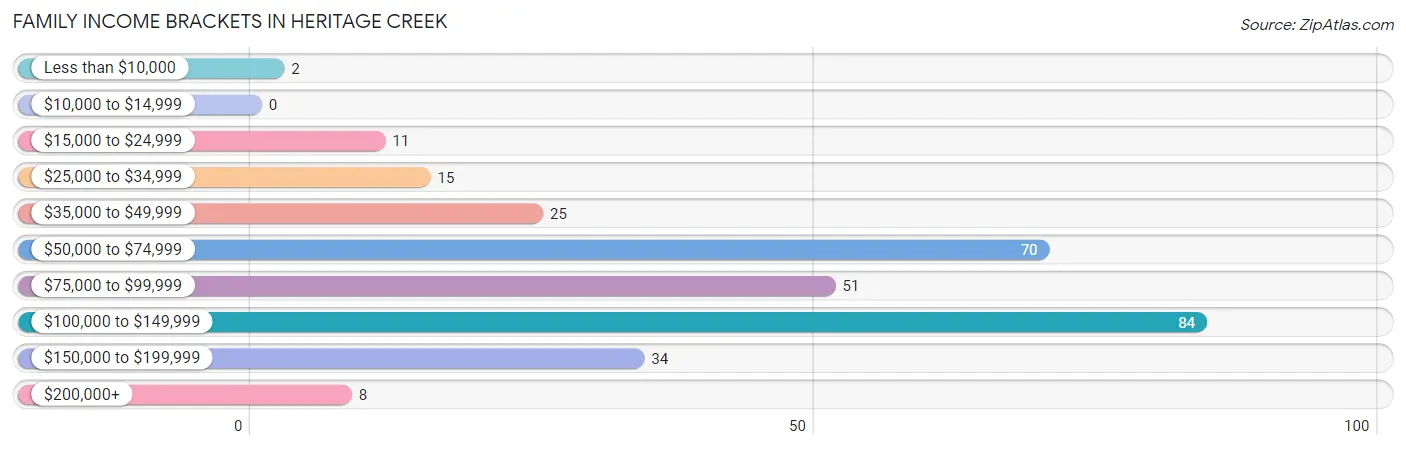
| Income Bracket | # Families | % Families |
| Less than $10,000 | 2 | 0.7% |
| $10,000 to $14,999 | 0 | 0.0% |
| $15,000 to $24,999 | 11 | 3.7% |
| $25,000 to $34,999 | 15 | 5.0% |
| $35,000 to $49,999 | 25 | 8.3% |
| $50,000 to $74,999 | 70 | 23.3% |
| $75,000 to $99,999 | 51 | 17.0% |
| $100,000 to $149,999 | 84 | 28.0% |
| $150,000 to $199,999 | 34 | 11.3% |
| $200,000+ | 8 | 2.7% |
Family Income by Famaliy Size in Heritage Creek
5-person families (24 | 8.0%) account for the highest median family income in Heritage Creek with $122,500 per family, while 2-person families (129 | 43.0%) have the highest median income of $36,406 per family member.
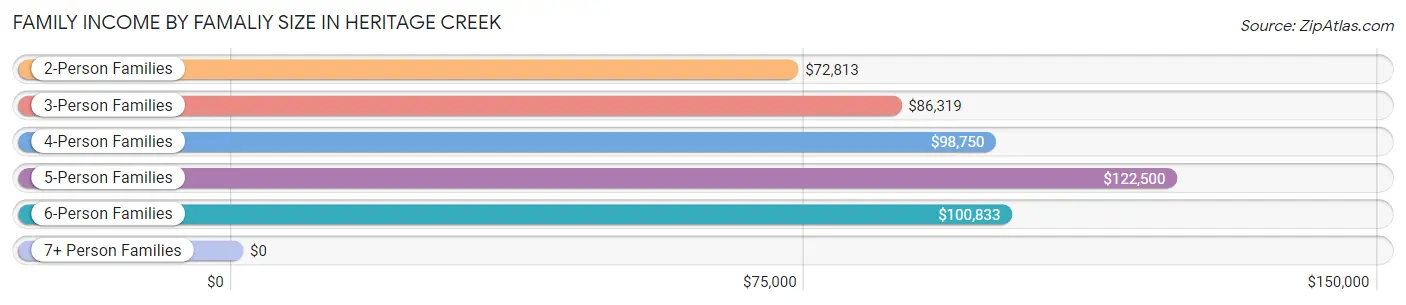
| Income Bracket | # Families | Median Income |
| 2-Person Families | 129 (43.0%) | $72,813 |
| 3-Person Families | 99 (33.0%) | $86,319 |
| 4-Person Families | 40 (13.3%) | $98,750 |
| 5-Person Families | 24 (8.0%) | $122,500 |
| 6-Person Families | 8 (2.7%) | $100,833 |
| 7+ Person Families | 0 (0.0%) | $0 |
| Total | 300 (100.0%) | $88,750 |
Family Income by Number of Earners in Heritage Creek
The median family income in Heritage Creek is $88,750, with families comprising 3+ earners (42) having the highest median family income of $150,556, while families with no earners (44) have the lowest median family income of $45,625, accounting for 14.0% and 14.7% of families, respectively.
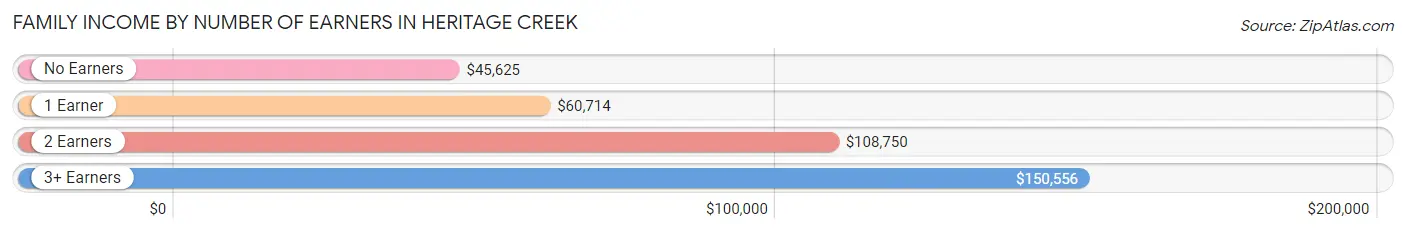
| Number of Earners | # Families | Median Income |
| No Earners | 44 (14.7%) | $45,625 |
| 1 Earner | 92 (30.7%) | $60,714 |
| 2 Earners | 122 (40.7%) | $108,750 |
| 3+ Earners | 42 (14.0%) | $150,556 |
| Total | 300 (100.0%) | $88,750 |
Household Income in Heritage Creek
Household Income Brackets in Heritage Creek
With 117 households falling in the category, the $100,000 to $149,999 income range is the most frequent in Heritage Creek, accounting for 26.8% of all households.
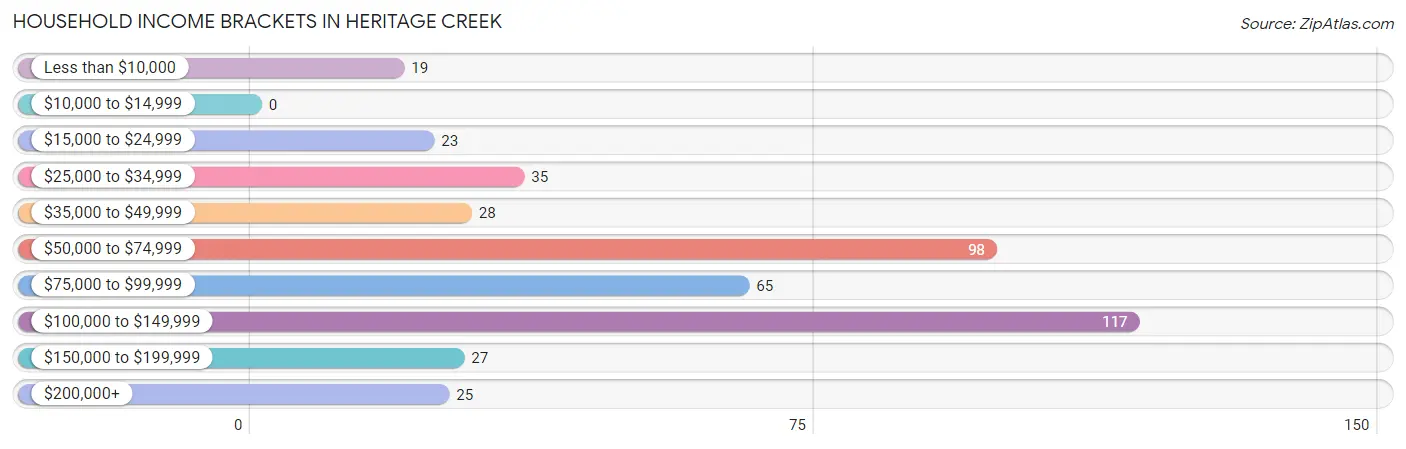
| Income Bracket | # Households | % Households |
| Less than $10,000 | 19 | 4.3% |
| $10,000 to $14,999 | 0 | 0.0% |
| $15,000 to $24,999 | 23 | 5.3% |
| $25,000 to $34,999 | 35 | 8.0% |
| $35,000 to $49,999 | 28 | 6.4% |
| $50,000 to $74,999 | 98 | 22.4% |
| $75,000 to $99,999 | 65 | 14.9% |
| $100,000 to $149,999 | 117 | 26.8% |
| $150,000 to $199,999 | 27 | 6.2% |
| $200,000+ | 25 | 5.7% |
Household Income by Householder Age in Heritage Creek
The median household income in Heritage Creek is $85,469, with the highest median household income of $110,417 found in the 25 to 44 years age bracket for the primary householder. A total of 116 households (26.5%) fall into this category. Meanwhile, the 15 to 24 years age bracket for the primary householder has the lowest median household income of $0, with 2 households (0.5%) in this group.
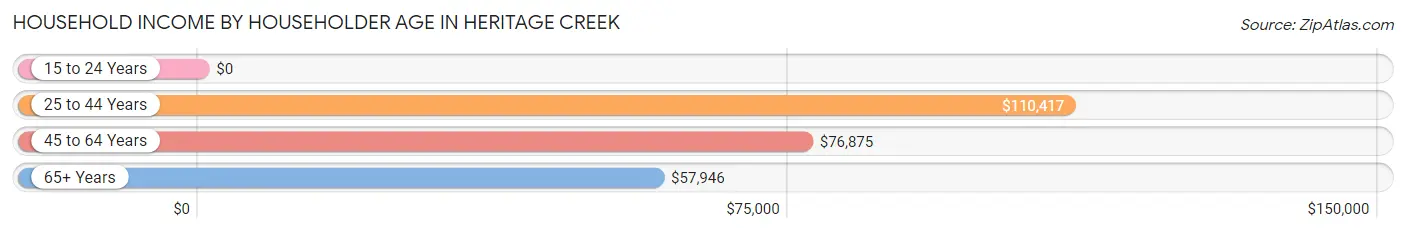
| Income Bracket | # Households | Median Income |
| 15 to 24 Years | 2 (0.5%) | $0 |
| 25 to 44 Years | 116 (26.5%) | $110,417 |
| 45 to 64 Years | 180 (41.2%) | $76,875 |
| 65+ Years | 139 (31.8%) | $57,946 |
| Total | 437 (100.0%) | $85,469 |
Poverty in Heritage Creek
Income Below Poverty by Sex and Age in Heritage Creek
With 3.2% poverty level for males and 8.5% for females among the residents of Heritage Creek, 65 to 74 year old males and 12 to 14 year old females are the most vulnerable to poverty, with 11 males (16.2%) and 12 females (44.4%) in their respective age groups living below the poverty level.
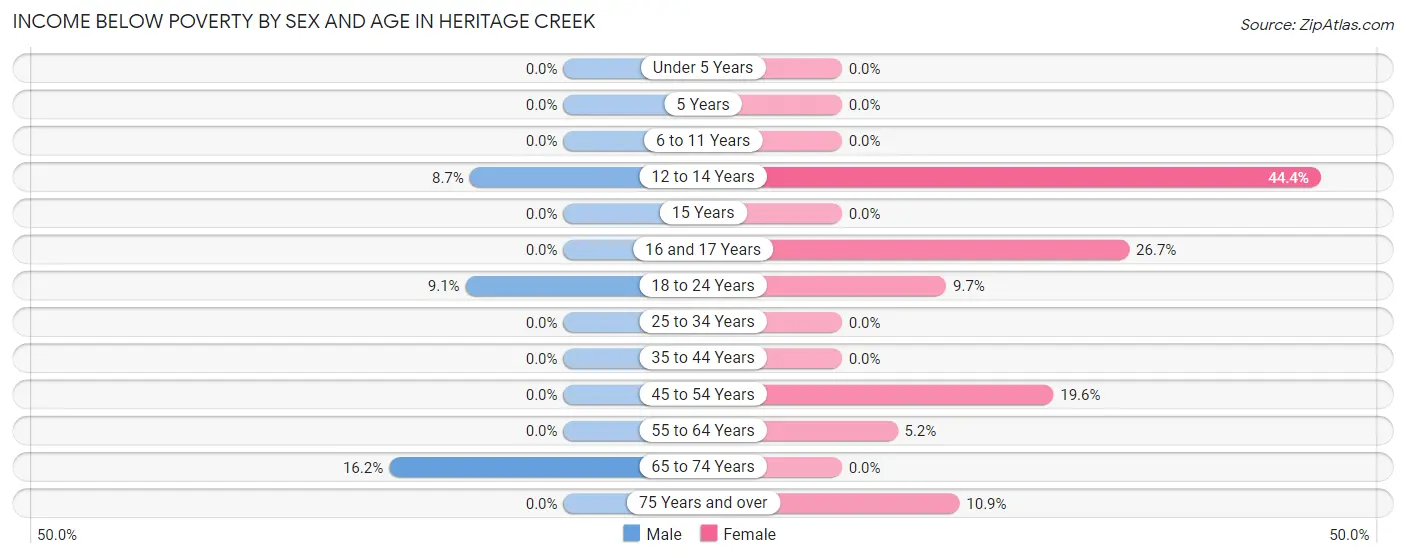
| Age Bracket | Male | Female |
| Under 5 Years | 0 (0.0%) | 0 (0.0%) |
| 5 Years | 0 (0.0%) | 0 (0.0%) |
| 6 to 11 Years | 0 (0.0%) | 0 (0.0%) |
| 12 to 14 Years | 2 (8.7%) | 12 (44.4%) |
| 15 Years | 0 (0.0%) | 0 (0.0%) |
| 16 and 17 Years | 0 (0.0%) | 8 (26.7%) |
| 18 to 24 Years | 2 (9.1%) | 3 (9.7%) |
| 25 to 34 Years | 0 (0.0%) | 0 (0.0%) |
| 35 to 44 Years | 0 (0.0%) | 0 (0.0%) |
| 45 to 54 Years | 0 (0.0%) | 21 (19.6%) |
| 55 to 64 Years | 0 (0.0%) | 3 (5.2%) |
| 65 to 74 Years | 11 (16.2%) | 0 (0.0%) |
| 75 Years and over | 0 (0.0%) | 6 (10.9%) |
| Total | 15 (3.2%) | 53 (8.5%) |
Income Above Poverty by Sex and Age in Heritage Creek
According to the poverty statistics in Heritage Creek, males aged under 5 years and females aged under 5 years are the age groups that are most secure financially, with 100.0% of males and 100.0% of females in these age groups living above the poverty line.
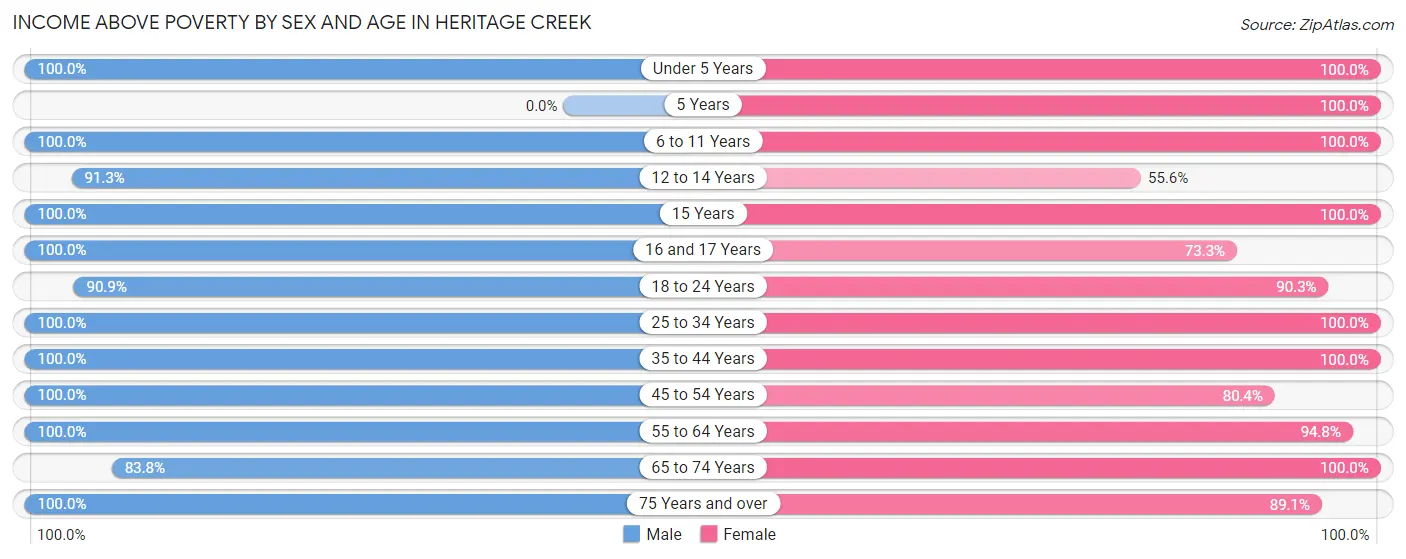
| Age Bracket | Male | Female |
| Under 5 Years | 14 (100.0%) | 52 (100.0%) |
| 5 Years | 0 (0.0%) | 7 (100.0%) |
| 6 to 11 Years | 33 (100.0%) | 23 (100.0%) |
| 12 to 14 Years | 21 (91.3%) | 15 (55.6%) |
| 15 Years | 3 (100.0%) | 8 (100.0%) |
| 16 and 17 Years | 13 (100.0%) | 22 (73.3%) |
| 18 to 24 Years | 20 (90.9%) | 28 (90.3%) |
| 25 to 34 Years | 66 (100.0%) | 59 (100.0%) |
| 35 to 44 Years | 66 (100.0%) | 63 (100.0%) |
| 45 to 54 Years | 106 (100.0%) | 86 (80.4%) |
| 55 to 64 Years | 44 (100.0%) | 55 (94.8%) |
| 65 to 74 Years | 57 (83.8%) | 104 (100.0%) |
| 75 Years and over | 17 (100.0%) | 49 (89.1%) |
| Total | 460 (96.8%) | 571 (91.5%) |
Income Below Poverty Among Married-Couple Families in Heritage Creek
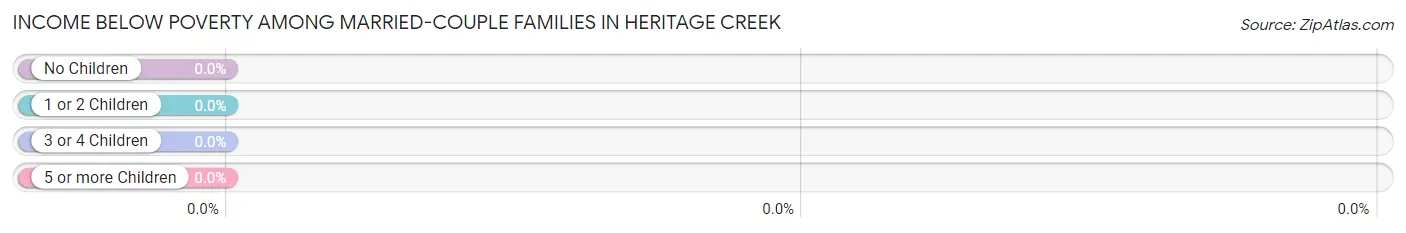
| Children | Above Poverty | Below Poverty |
| No Children | 151 (100.0%) | 0 (0.0%) |
| 1 or 2 Children | 53 (100.0%) | 0 (0.0%) |
| 3 or 4 Children | 19 (100.0%) | 0 (0.0%) |
| 5 or more Children | 0 (0.0%) | 0 (0.0%) |
| Total | 223 (100.0%) | 0 (0.0%) |
Income Below Poverty Among Single-Parent Households in Heritage Creek
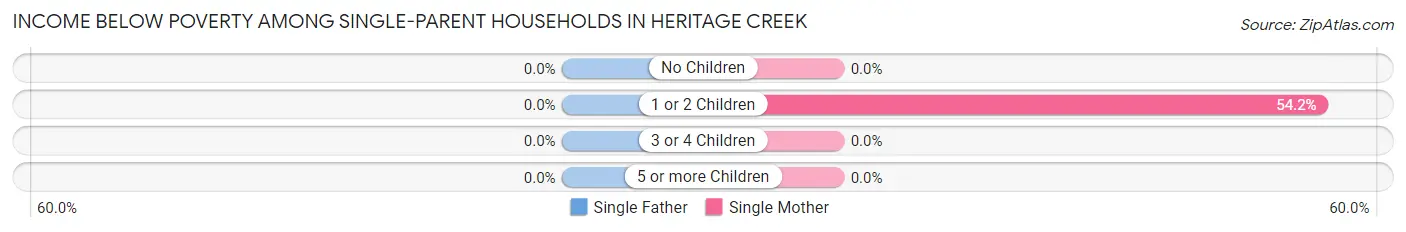
| Children | Single Father | Single Mother |
| No Children | 0 (0.0%) | 0 (0.0%) |
| 1 or 2 Children | 0 (0.0%) | 13 (54.2%) |
| 3 or 4 Children | 0 (0.0%) | 0 (0.0%) |
| 5 or more Children | 0 (0.0%) | 0 (0.0%) |
| Total | 0 (0.0%) | 13 (23.2%) |
Income Below Poverty Among Married-Couple vs Single-Parent Households in Heritage Creek
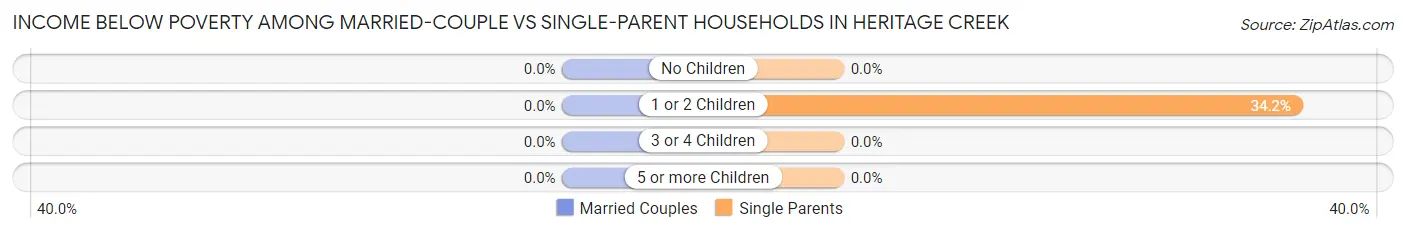
| Children | Married-Couple Families | Single-Parent Households |
| No Children | 0 (0.0%) | 0 (0.0%) |
| 1 or 2 Children | 0 (0.0%) | 13 (34.2%) |
| 3 or 4 Children | 0 (0.0%) | 0 (0.0%) |
| 5 or more Children | 0 (0.0%) | 0 (0.0%) |
| Total | 0 (0.0%) | 13 (16.9%) |
Race in Heritage Creek
The most populous races in Heritage Creek are White / Caucasian (921 | 83.1%), Black / African American (148 | 13.4%), and Hispanic or Latino (53 | 4.8%).
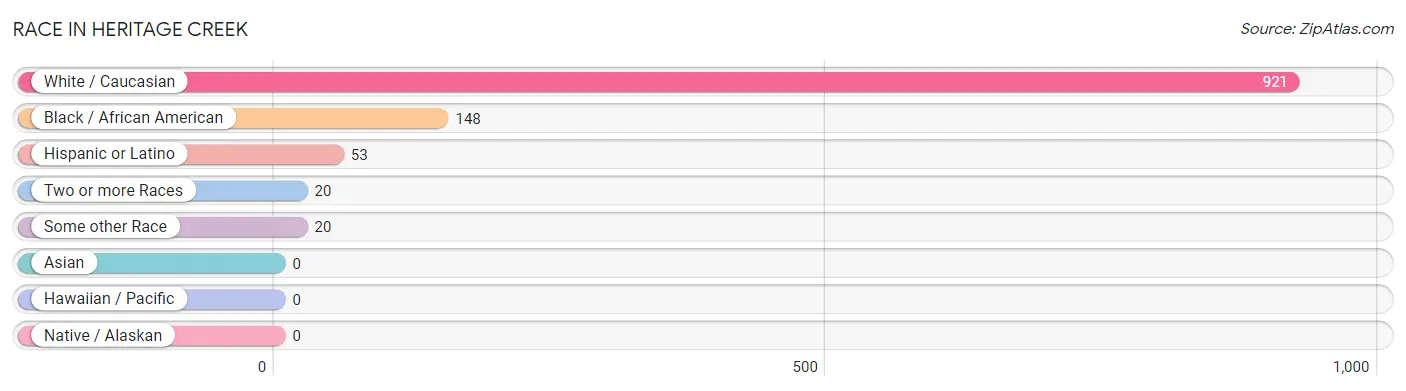
| Race | # Population | % Population |
| Asian | 0 | 0.0% |
| Black / African American | 148 | 13.4% |
| Hawaiian / Pacific | 0 | 0.0% |
| Hispanic or Latino | 53 | 4.8% |
| Native / Alaskan | 0 | 0.0% |
| White / Caucasian | 921 | 83.1% |
| Two or more Races | 20 | 1.8% |
| Some other Race | 20 | 1.8% |
| Total | 1,109 | 100.0% |
Ancestry in Heritage Creek
The most populous ancestries reported in Heritage Creek are English (230 | 20.7%), Irish (151 | 13.6%), German (119 | 10.7%), American (56 | 5.1%), and Subsaharan African (43 | 3.9%), together accounting for 54.0% of all Heritage Creek residents.
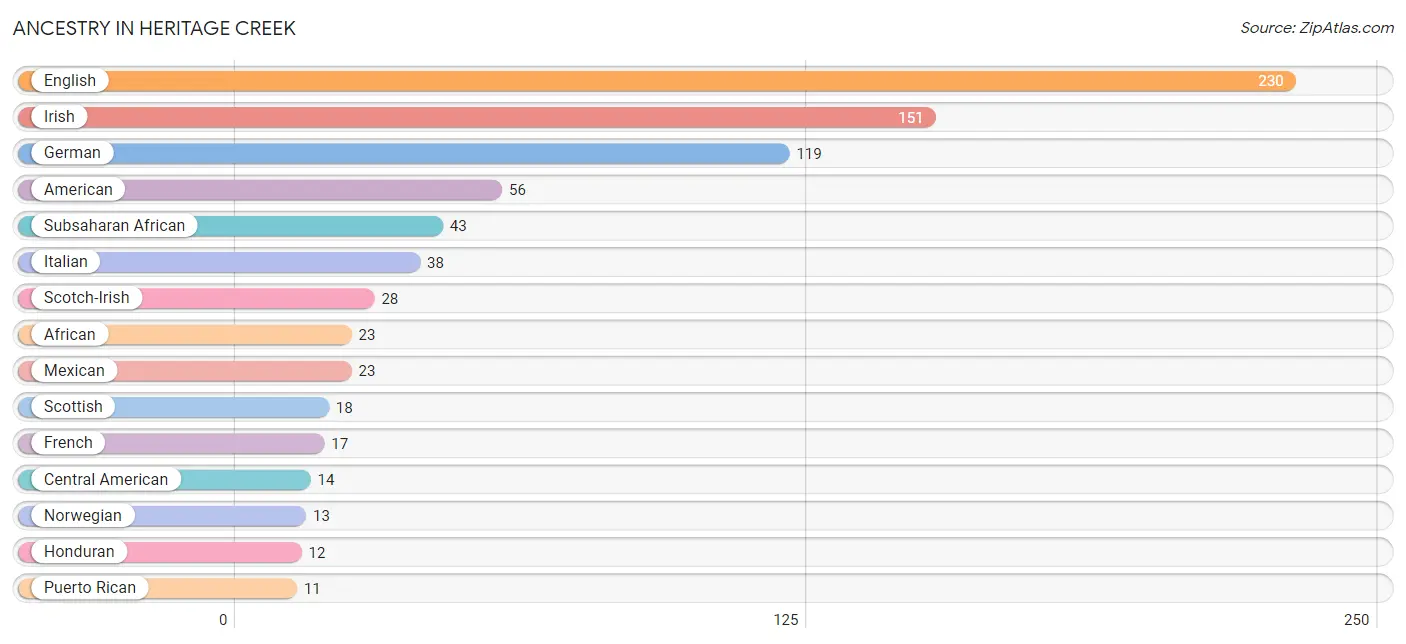
| Ancestry | # Population | % Population |
| African | 23 | 2.1% |
| American | 56 | 5.1% |
| Arab | 3 | 0.3% |
| Central American | 14 | 1.3% |
| Cherokee | 2 | 0.2% |
| Cuban | 5 | 0.4% |
| Dutch | 8 | 0.7% |
| English | 230 | 20.7% |
| French | 17 | 1.5% |
| French Canadian | 3 | 0.3% |
| German | 119 | 10.7% |
| Guatemalan | 2 | 0.2% |
| Honduran | 12 | 1.1% |
| Hungarian | 3 | 0.3% |
| Irish | 151 | 13.6% |
| Italian | 38 | 3.4% |
| Mexican | 23 | 2.1% |
| Norwegian | 13 | 1.2% |
| Pakistani | 8 | 0.7% |
| Polish | 9 | 0.8% |
| Puerto Rican | 11 | 1.0% |
| Scotch-Irish | 28 | 2.5% |
| Scottish | 18 | 1.6% |
| Subsaharan African | 43 | 3.9% |
| Swedish | 5 | 0.4% |
| Swiss | 3 | 0.3% |
| Ukrainian | 3 | 0.3% | View All 27 Rows |
Immigrants in Heritage Creek
The most numerous immigrant groups reported in Heritage Creek came from Africa (20 | 1.8%), Latin America (13 | 1.2%), Middle Africa (12 | 1.1%), Central America (8 | 0.7%), and Western Africa (8 | 0.7%), together accounting for 5.5% of all Heritage Creek residents.
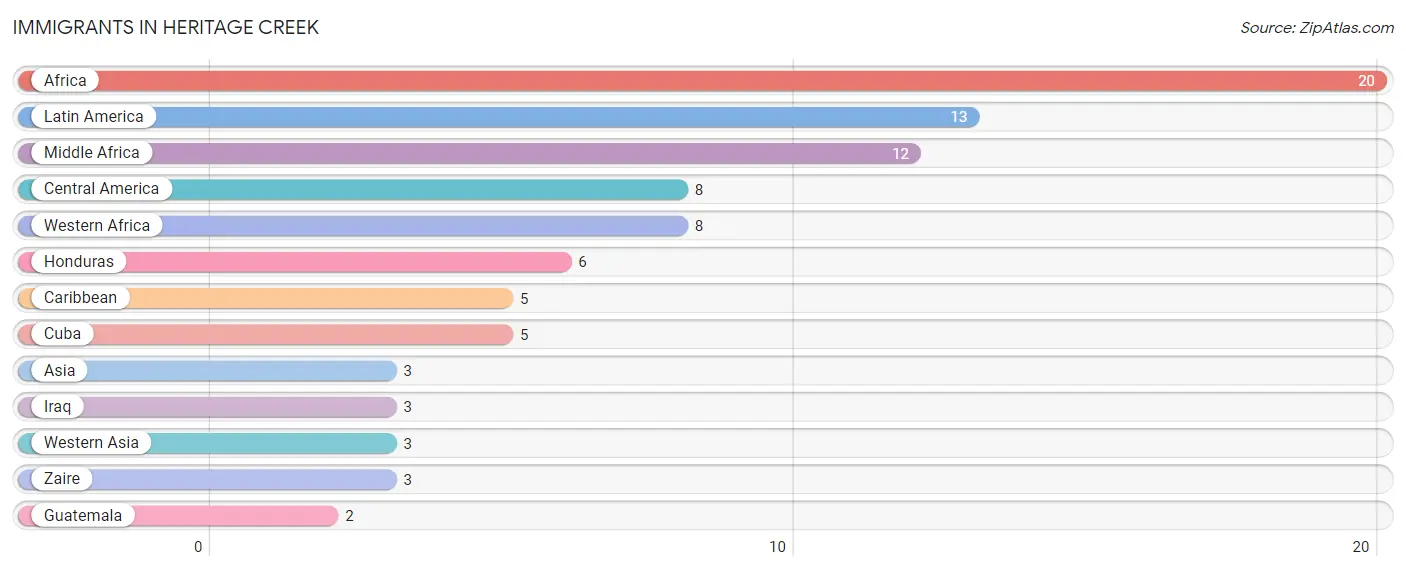
| Immigration Origin | # Population | % Population |
| Africa | 20 | 1.8% |
| Asia | 3 | 0.3% |
| Caribbean | 5 | 0.4% |
| Central America | 8 | 0.7% |
| Cuba | 5 | 0.4% |
| Guatemala | 2 | 0.2% |
| Honduras | 6 | 0.5% |
| Iraq | 3 | 0.3% |
| Latin America | 13 | 1.2% |
| Middle Africa | 12 | 1.1% |
| Western Africa | 8 | 0.7% |
| Western Asia | 3 | 0.3% |
| Zaire | 3 | 0.3% | View All 13 Rows |
Sex and Age in Heritage Creek
Sex and Age in Heritage Creek
The most populous age groups in Heritage Creek are 50 to 54 Years (59 | 12.2%) for men and 45 to 49 Years (66 | 10.6%) for women.
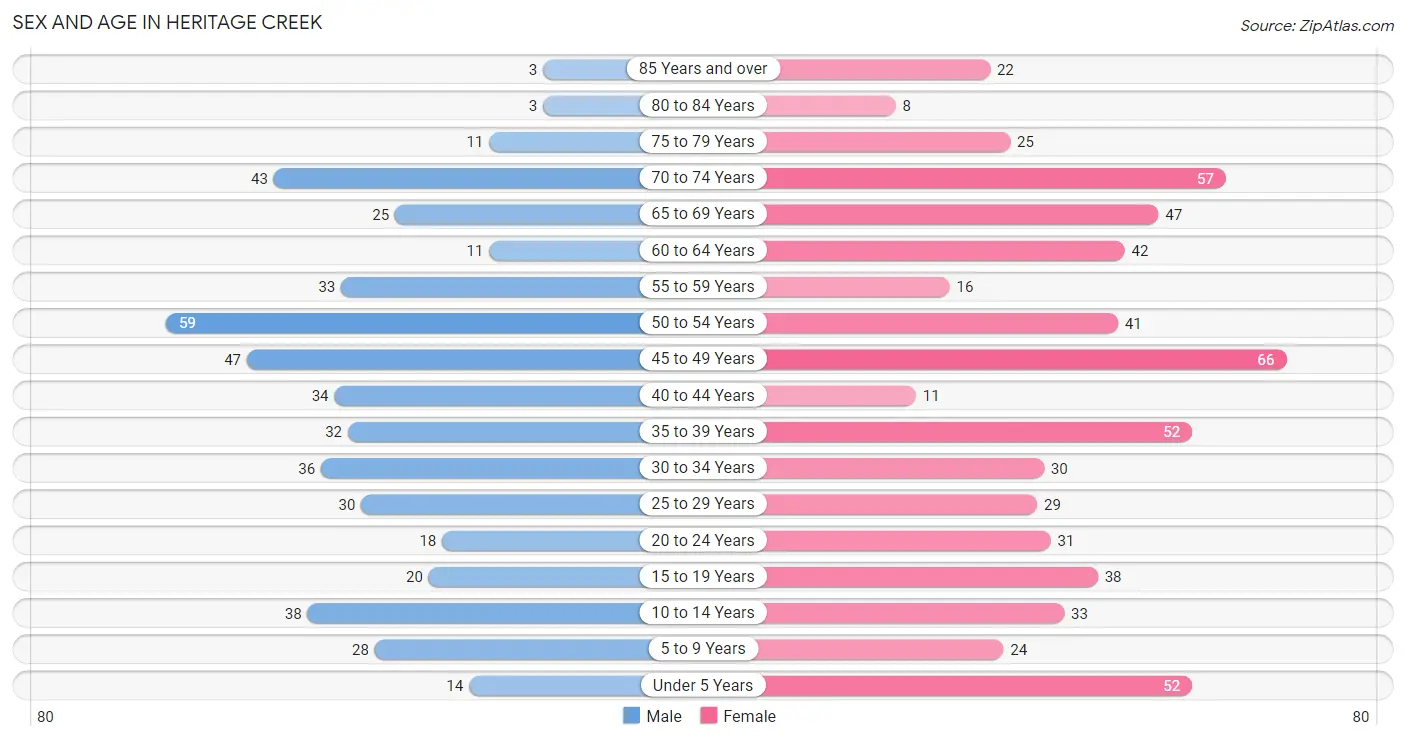
| Age Bracket | Male | Female |
| Under 5 Years | 14 (2.9%) | 52 (8.3%) |
| 5 to 9 Years | 28 (5.8%) | 24 (3.8%) |
| 10 to 14 Years | 38 (7.8%) | 33 (5.3%) |
| 15 to 19 Years | 20 (4.1%) | 38 (6.1%) |
| 20 to 24 Years | 18 (3.7%) | 31 (5.0%) |
| 25 to 29 Years | 30 (6.2%) | 29 (4.6%) |
| 30 to 34 Years | 36 (7.4%) | 30 (4.8%) |
| 35 to 39 Years | 32 (6.6%) | 52 (8.3%) |
| 40 to 44 Years | 34 (7.0%) | 11 (1.8%) |
| 45 to 49 Years | 47 (9.7%) | 66 (10.6%) |
| 50 to 54 Years | 59 (12.2%) | 41 (6.6%) |
| 55 to 59 Years | 33 (6.8%) | 16 (2.6%) |
| 60 to 64 Years | 11 (2.3%) | 42 (6.7%) |
| 65 to 69 Years | 25 (5.1%) | 47 (7.5%) |
| 70 to 74 Years | 43 (8.9%) | 57 (9.1%) |
| 75 to 79 Years | 11 (2.3%) | 25 (4.0%) |
| 80 to 84 Years | 3 (0.6%) | 8 (1.3%) |
| 85 Years and over | 3 (0.6%) | 22 (3.5%) |
| Total | 485 (100.0%) | 624 (100.0%) |
Families and Households in Heritage Creek
Median Family Size in Heritage Creek
The median family size in Heritage Creek is 3.00 persons per family, with single female/mother families (56 | 18.7%) accounting for the largest median family size of 3.68 persons per family. On the other hand, single male/father families (21 | 7.0%) represent the smallest median family size with 2.52 persons per family.
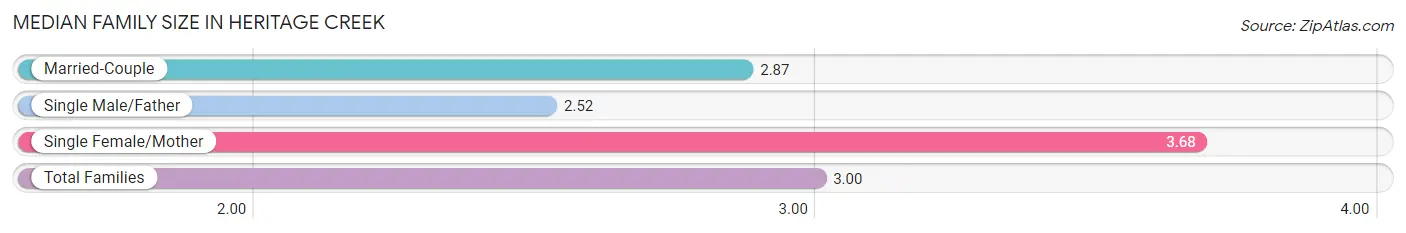
| Family Type | # Families | Family Size |
| Married-Couple | 223 (74.3%) | 2.87 |
| Single Male/Father | 21 (7.0%) | 2.52 |
| Single Female/Mother | 56 (18.7%) | 3.68 |
| Total Families | 300 (100.0%) | 3.00 |
Median Household Size in Heritage Creek
The median household size in Heritage Creek is 2.54 persons per household, with single female/mother households (56 | 12.8%) accounting for the largest median household size of 3.8 persons per household. non-family households (137 | 31.4%) represent the smallest median household size with 1.25 persons per household.
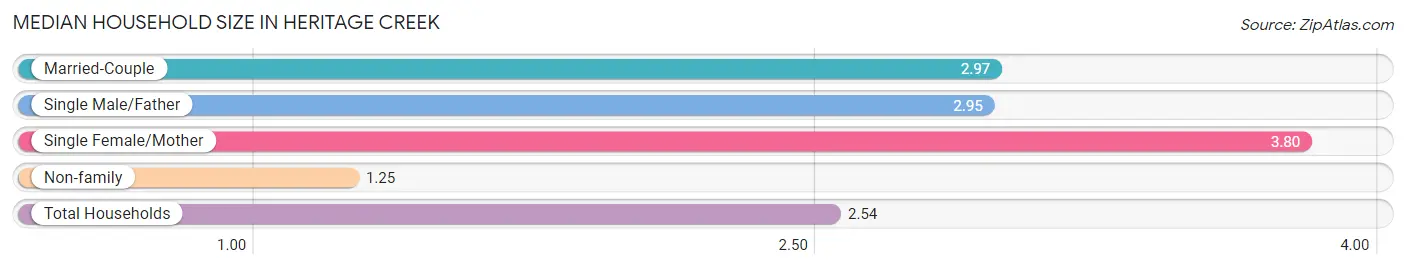
| Household Type | # Households | Household Size |
| Married-Couple | 223 (51.0%) | 2.97 |
| Single Male/Father | 21 (4.8%) | 2.95 |
| Single Female/Mother | 56 (12.8%) | 3.80 |
| Non-family | 137 (31.4%) | 1.25 |
| Total Households | 437 (100.0%) | 2.54 |
Household Size by Marriage Status in Heritage Creek
Out of a total of 437 households in Heritage Creek, 300 (68.6%) are family households, while 137 (31.4%) are nonfamily households. The most numerous type of family households are 2-person households, comprising 129, and the most common type of nonfamily households are 1-person households, comprising 110.
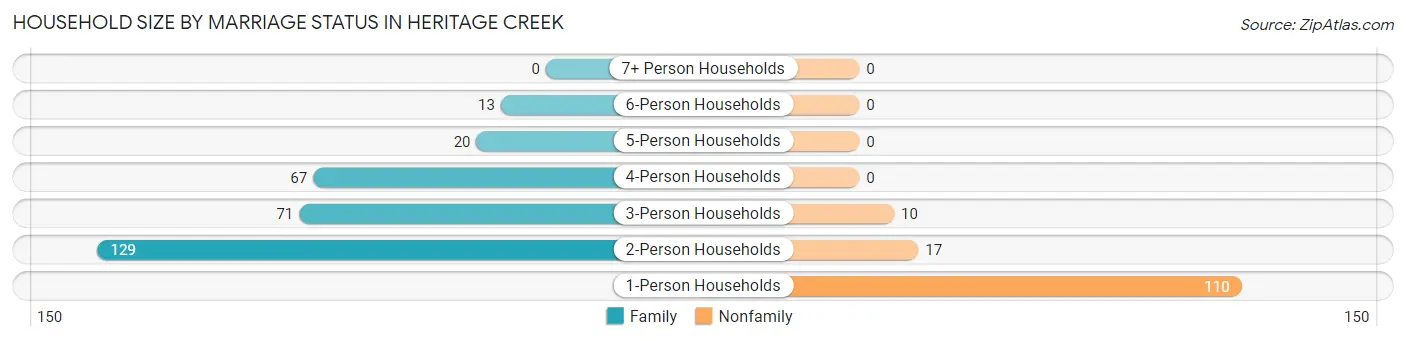
| Household Size | Family Households | Nonfamily Households |
| 1-Person Households | - | 110 (25.2%) |
| 2-Person Households | 129 (29.5%) | 17 (3.9%) |
| 3-Person Households | 71 (16.3%) | 10 (2.3%) |
| 4-Person Households | 67 (15.3%) | 0 (0.0%) |
| 5-Person Households | 20 (4.6%) | 0 (0.0%) |
| 6-Person Households | 13 (3.0%) | 0 (0.0%) |
| 7+ Person Households | 0 (0.0%) | 0 (0.0%) |
| Total | 300 (68.6%) | 137 (31.4%) |
Female Fertility in Heritage Creek
Fertility by Age in Heritage Creek
Average fertility rate in Heritage Creek is 23.0 births per 1,000 women. Women in the age bracket of 20 to 34 years have the highest fertility rate with 44.0 births per 1,000 women. Women in the age bracket of 20 to 34 years acount for 66.7% of all women with births.
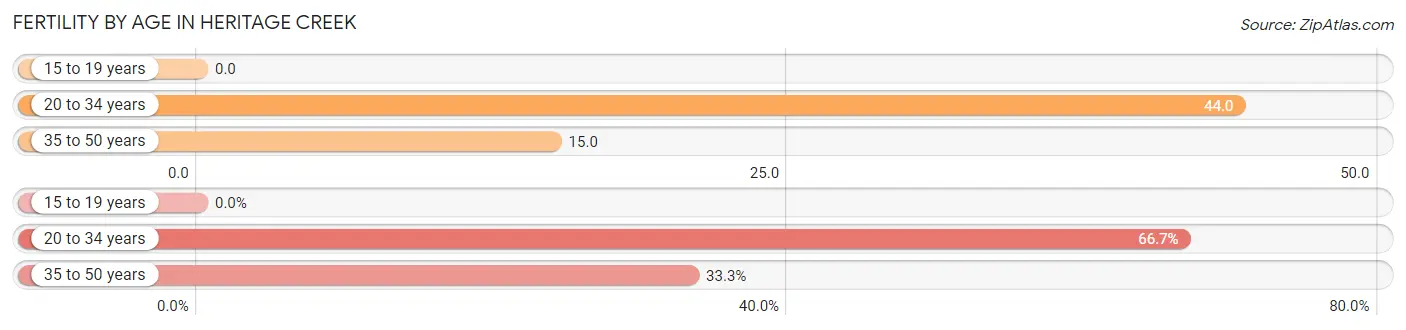
| Age Bracket | Women with Births | Births / 1,000 Women |
| 15 to 19 years | 0 (0.0%) | 0.0 |
| 20 to 34 years | 4 (66.7%) | 44.0 |
| 35 to 50 years | 2 (33.3%) | 15.0 |
| Total | 6 (100.0%) | 23.0 |
Fertility by Age by Marriage Status in Heritage Creek
66.7% of women with births (6) in Heritage Creek are married. The highest percentage of unmarried women with births falls into 35 to 50 years age bracket with 100.0% of them unmarried at the time of birth, while the lowest percentage of unmarried women with births belong to 20 to 34 years age bracket with 0.0% of them unmarried.
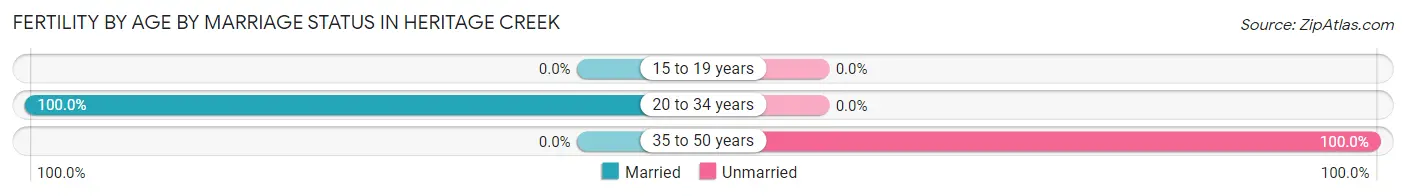
| Age Bracket | Married | Unmarried |
| 15 to 19 years | 0 (0.0%) | 0 (0.0%) |
| 20 to 34 years | 4 (100.0%) | 0 (0.0%) |
| 35 to 50 years | 0 (0.0%) | 2 (100.0%) |
| Total | 4 (66.7%) | 2 (33.3%) |
Fertility by Education in Heritage Creek
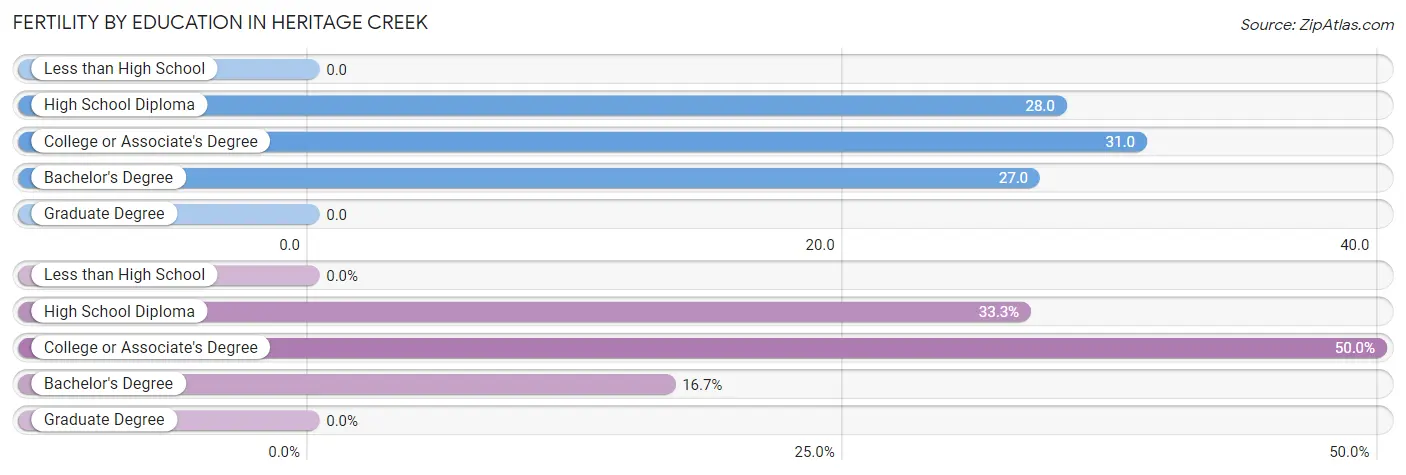
| Educational Attainment | Women with Births | Births / 1,000 Women |
| Less than High School | 0 (0.0%) | 0.0 |
| High School Diploma | 2 (33.3%) | 28.0 |
| College or Associate's Degree | 3 (50.0%) | 31.0 |
| Bachelor's Degree | 1 (16.7%) | 27.0 |
| Graduate Degree | 0 (0.0%) | 0.0 |
| Total | 6 (100.0%) | 23.0 |
Fertility by Education by Marriage Status in Heritage Creek
33.3% of women with births in Heritage Creek are unmarried. Women with the educational attainment of college or associate's degree are most likely to be married with 100.0% of them married at childbirth, while women with the educational attainment of high school diploma are least likely to be married with 100.0% of them unmarried at childbirth.
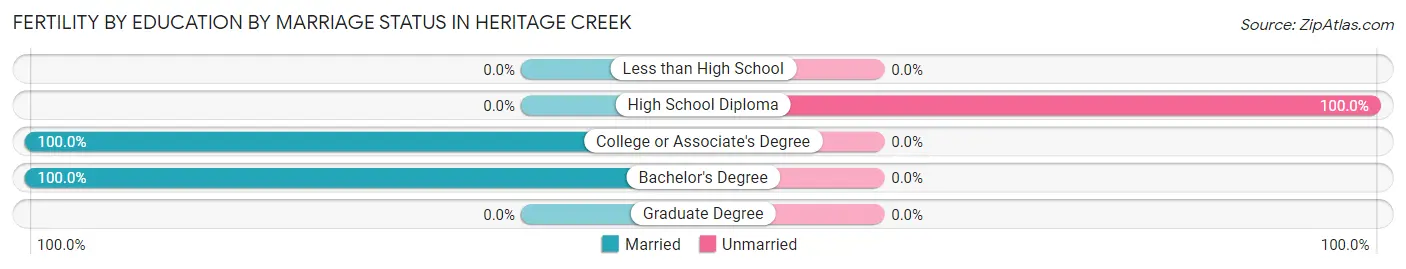
| Educational Attainment | Married | Unmarried |
| Less than High School | 0 (0.0%) | 0 (0.0%) |
| High School Diploma | 0 (0.0%) | 2 (100.0%) |
| College or Associate's Degree | 3 (100.0%) | 0 (0.0%) |
| Bachelor's Degree | 1 (100.0%) | 0 (0.0%) |
| Graduate Degree | 0 (0.0%) | 0 (0.0%) |
| Total | 4 (66.7%) | 2 (33.3%) |
Employment Characteristics in Heritage Creek
Employment by Class of Employer in Heritage Creek
Among the 568 employed individuals in Heritage Creek, private company employees (447 | 78.7%), not-for-profit organizations (46 | 8.1%), and local government employees (35 | 6.2%) make up the most common classes of employment.
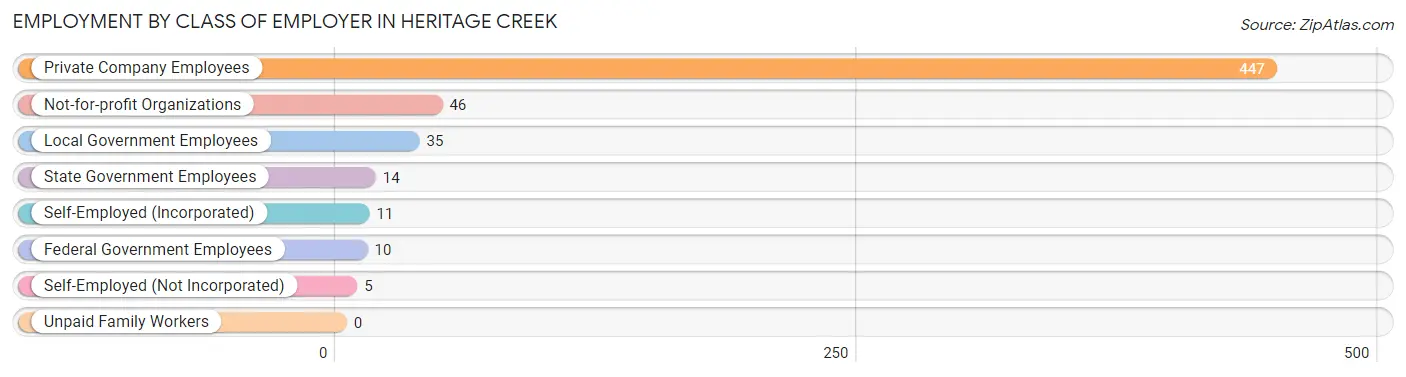
| Employer Class | # Employees | % Employees |
| Private Company Employees | 447 | 78.7% |
| Self-Employed (Incorporated) | 11 | 1.9% |
| Self-Employed (Not Incorporated) | 5 | 0.9% |
| Not-for-profit Organizations | 46 | 8.1% |
| Local Government Employees | 35 | 6.2% |
| State Government Employees | 14 | 2.5% |
| Federal Government Employees | 10 | 1.8% |
| Unpaid Family Workers | 0 | 0.0% |
| Total | 568 | 100.0% |
Employment Status by Age in Heritage Creek
According to the labor force statistics for Heritage Creek, out of the total population over 16 years of age (909), 64.4% or 585 individuals are in the labor force, with 2.4% or 14 of them unemployed. The age group with the highest labor force participation rate is 30 to 34 years, with 100.0% or 66 individuals in the labor force. Within the labor force, the 16 to 19 years age range has the highest percentage of unemployed individuals, with 27.6% or 8 of them being unemployed.
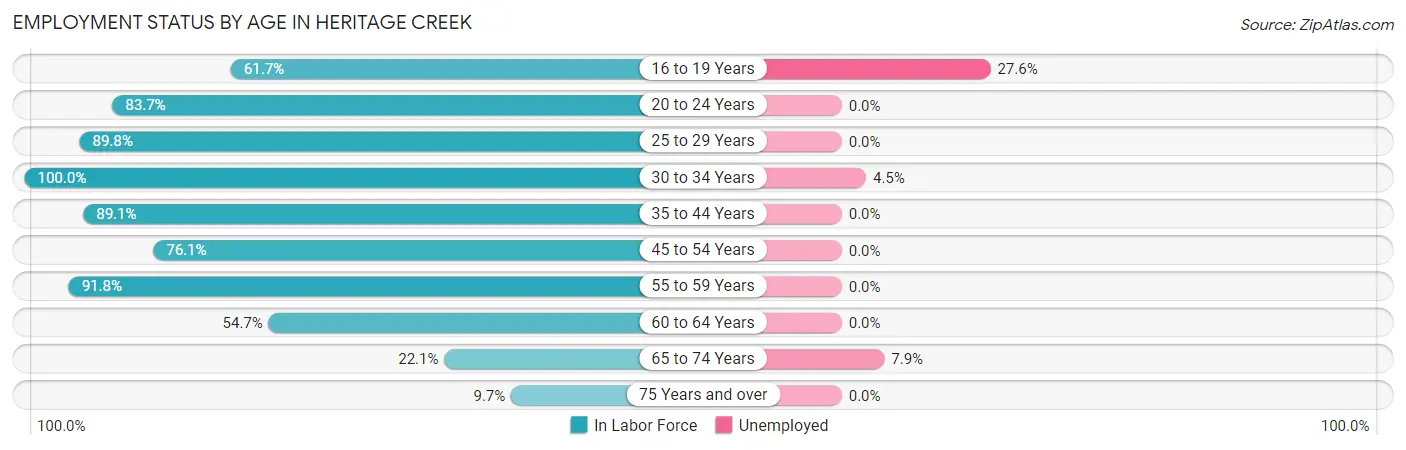
| Age Bracket | In Labor Force | Unemployed |
| 16 to 19 Years | 29 (61.7%) | 8 (27.6%) |
| 20 to 24 Years | 41 (83.7%) | 0 (0.0%) |
| 25 to 29 Years | 53 (89.8%) | 0 (0.0%) |
| 30 to 34 Years | 66 (100.0%) | 3 (4.5%) |
| 35 to 44 Years | 115 (89.1%) | 0 (0.0%) |
| 45 to 54 Years | 162 (76.1%) | 0 (0.0%) |
| 55 to 59 Years | 45 (91.8%) | 0 (0.0%) |
| 60 to 64 Years | 29 (54.7%) | 0 (0.0%) |
| 65 to 74 Years | 38 (22.1%) | 3 (7.9%) |
| 75 Years and over | 7 (9.7%) | 0 (0.0%) |
| Total | 585 (64.4%) | 14 (2.4%) |
Employment Status by Educational Attainment in Heritage Creek
According to labor force statistics for Heritage Creek, 82.6% of individuals (470) out of the total population between 25 and 64 years of age (569) are in the labor force, with 0.6% or 3 of them being unemployed. The group with the highest labor force participation rate are those with the educational attainment of bachelor's degree or higher, with 94.0% or 142 individuals in the labor force. Within the labor force, individuals with college / associate degree education have the highest percentage of unemployment, with 1.8% or 3 of them being unemployed.
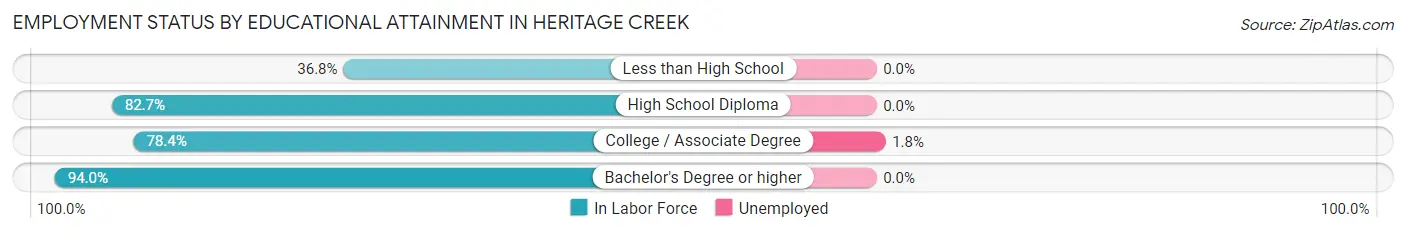
| Educational Attainment | In Labor Force | Unemployed |
| Less than High School | 7 (36.8%) | 0 (0.0%) |
| High School Diploma | 158 (82.7%) | 0 (0.0%) |
| College / Associate Degree | 163 (78.4%) | 4 (1.8%) |
| Bachelor's Degree or higher | 142 (94.0%) | 0 (0.0%) |
| Total | 470 (82.6%) | 3 (0.6%) |
Employment Occupations by Sex in Heritage Creek
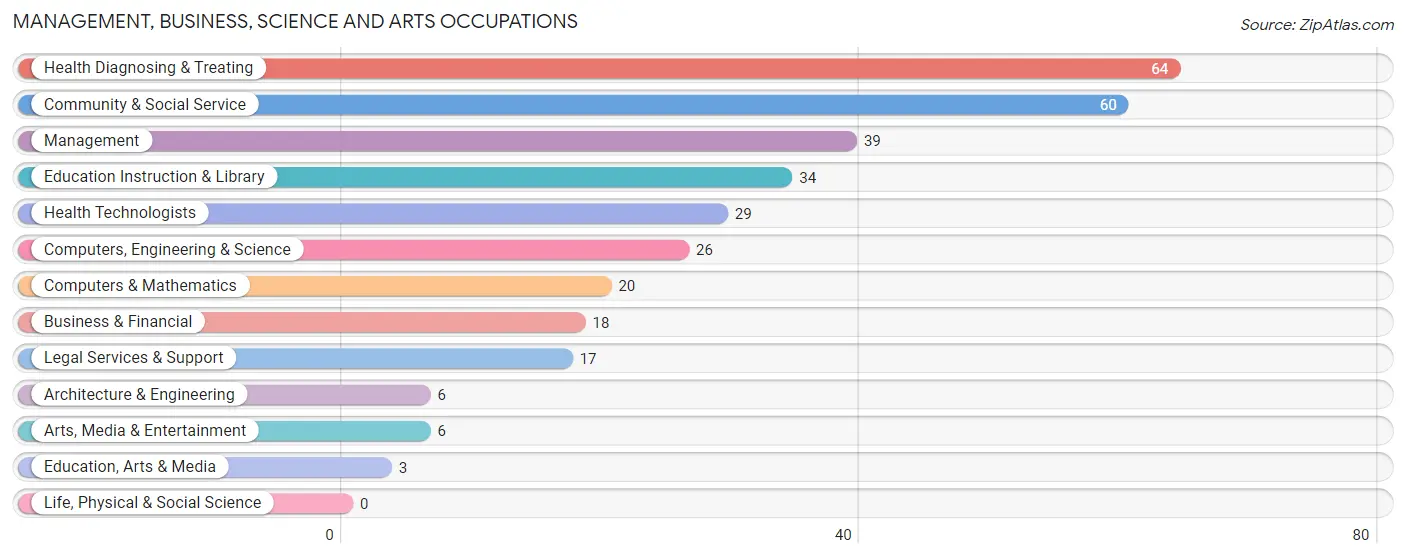
Management, Business, Science and Arts Occupations
The most common Management, Business, Science and Arts occupations in Heritage Creek are Health Diagnosing & Treating (64 | 11.2%), Community & Social Service (60 | 10.5%), Management (39 | 6.8%), Education Instruction & Library (34 | 5.9%), and Health Technologists (29 | 5.1%).
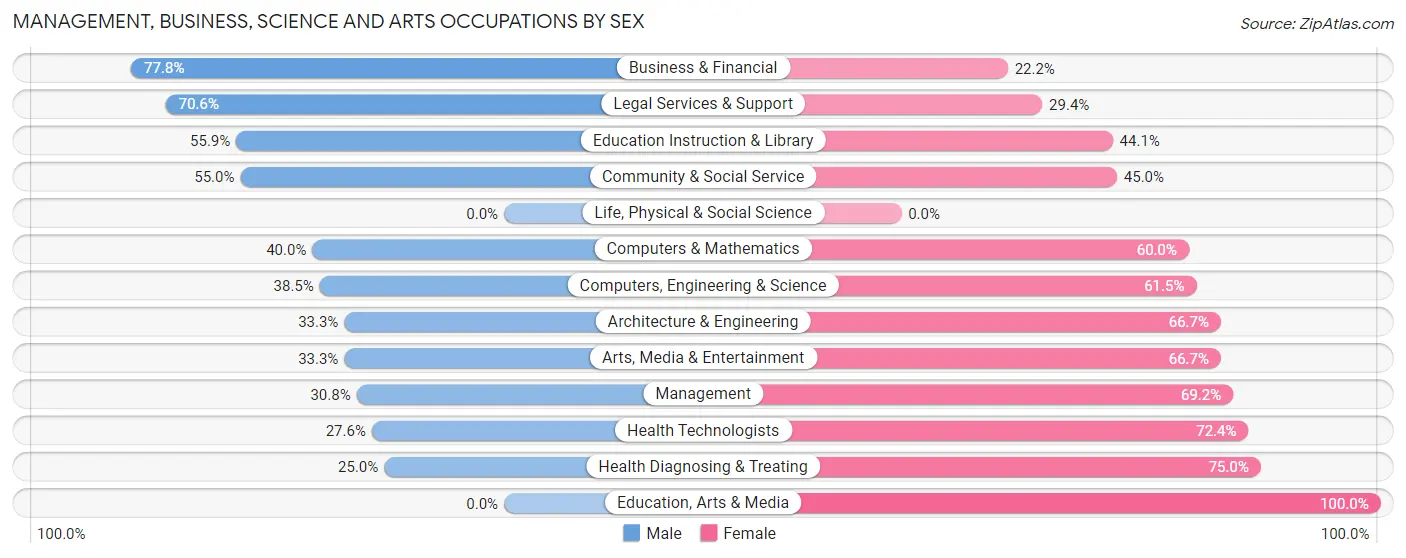
Management, Business, Science and Arts Occupations by Sex
Within the Management, Business, Science and Arts occupations in Heritage Creek, the most male-oriented occupations are Business & Financial (77.8%), Legal Services & Support (70.6%), and Education Instruction & Library (55.9%), while the most female-oriented occupations are Education, Arts & Media (100.0%), Health Diagnosing & Treating (75.0%), and Health Technologists (72.4%).
| Occupation | Male | Female |
| Management | 12 (30.8%) | 27 (69.2%) |
| Business & Financial | 14 (77.8%) | 4 (22.2%) |
| Computers, Engineering & Science | 10 (38.5%) | 16 (61.5%) |
| Computers & Mathematics | 8 (40.0%) | 12 (60.0%) |
| Architecture & Engineering | 2 (33.3%) | 4 (66.7%) |
| Life, Physical & Social Science | 0 (0.0%) | 0 (0.0%) |
| Community & Social Service | 33 (55.0%) | 27 (45.0%) |
| Education, Arts & Media | 0 (0.0%) | 3 (100.0%) |
| Legal Services & Support | 12 (70.6%) | 5 (29.4%) |
| Education Instruction & Library | 19 (55.9%) | 15 (44.1%) |
| Arts, Media & Entertainment | 2 (33.3%) | 4 (66.7%) |
| Health Diagnosing & Treating | 16 (25.0%) | 48 (75.0%) |
| Health Technologists | 8 (27.6%) | 21 (72.4%) |
| Total (Category) | 85 (41.1%) | 122 (58.9%) |
| Total (Overall) | 289 (50.6%) | 282 (49.4%) |
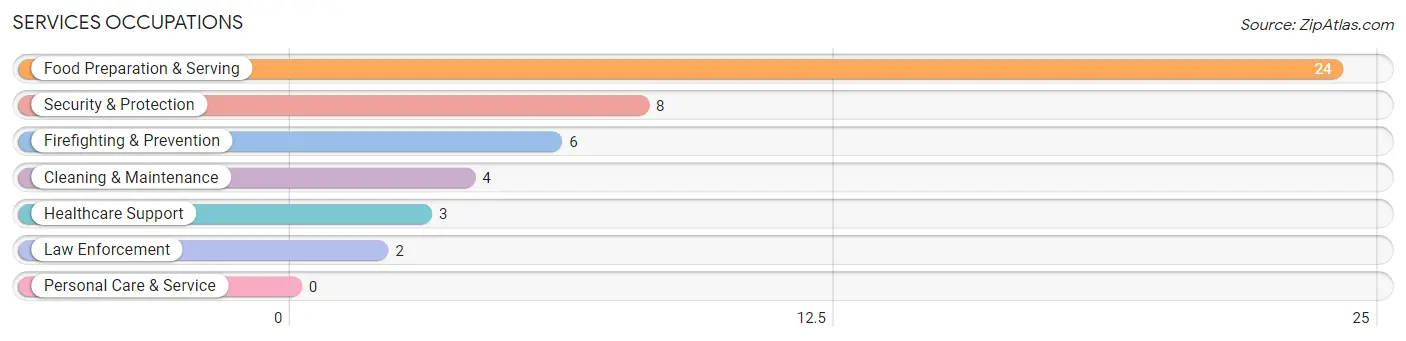
Services Occupations
The most common Services occupations in Heritage Creek are Food Preparation & Serving (24 | 4.2%), Security & Protection (8 | 1.4%), Firefighting & Prevention (6 | 1.1%), Cleaning & Maintenance (4 | 0.7%), and Healthcare Support (3 | 0.5%).
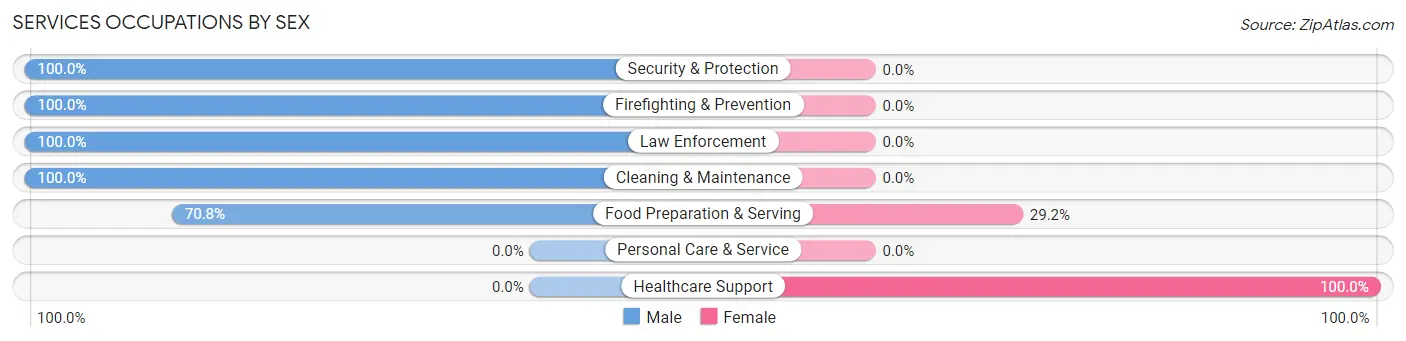
Services Occupations by Sex
Within the Services occupations in Heritage Creek, the most male-oriented occupations are Security & Protection (100.0%), Firefighting & Prevention (100.0%), and Law Enforcement (100.0%), while the most female-oriented occupations are Healthcare Support (100.0%), and Food Preparation & Serving (29.2%).
| Occupation | Male | Female |
| Healthcare Support | 0 (0.0%) | 3 (100.0%) |
| Security & Protection | 8 (100.0%) | 0 (0.0%) |
| Firefighting & Prevention | 6 (100.0%) | 0 (0.0%) |
| Law Enforcement | 2 (100.0%) | 0 (0.0%) |
| Food Preparation & Serving | 17 (70.8%) | 7 (29.2%) |
| Cleaning & Maintenance | 4 (100.0%) | 0 (0.0%) |
| Personal Care & Service | 0 (0.0%) | 0 (0.0%) |
| Total (Category) | 29 (74.4%) | 10 (25.6%) |
| Total (Overall) | 289 (50.6%) | 282 (49.4%) |
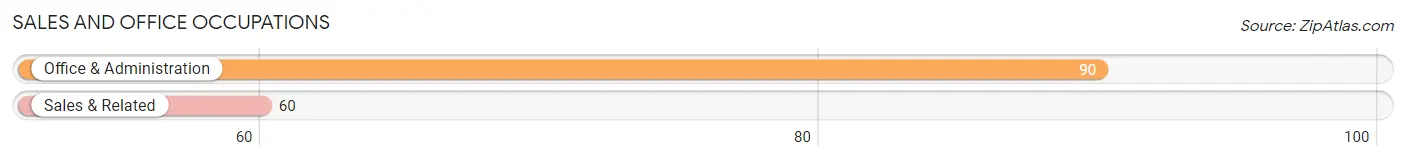
Sales and Office Occupations
The most common Sales and Office occupations in Heritage Creek are Office & Administration (90 | 15.8%), and Sales & Related (60 | 10.5%).
Sales and Office Occupations by Sex
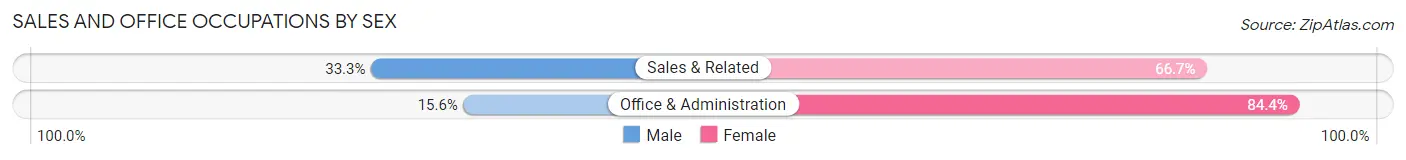
| Occupation | Male | Female |
| Sales & Related | 20 (33.3%) | 40 (66.7%) |
| Office & Administration | 14 (15.6%) | 76 (84.4%) |
| Total (Category) | 34 (22.7%) | 116 (77.3%) |
| Total (Overall) | 289 (50.6%) | 282 (49.4%) |
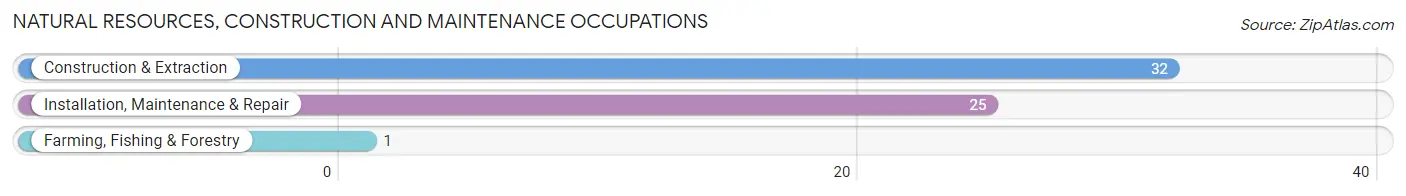
Natural Resources, Construction and Maintenance Occupations
The most common Natural Resources, Construction and Maintenance occupations in Heritage Creek are Construction & Extraction (32 | 5.6%), Installation, Maintenance & Repair (25 | 4.4%), and Farming, Fishing & Forestry (1 | 0.2%).
Natural Resources, Construction and Maintenance Occupations by Sex
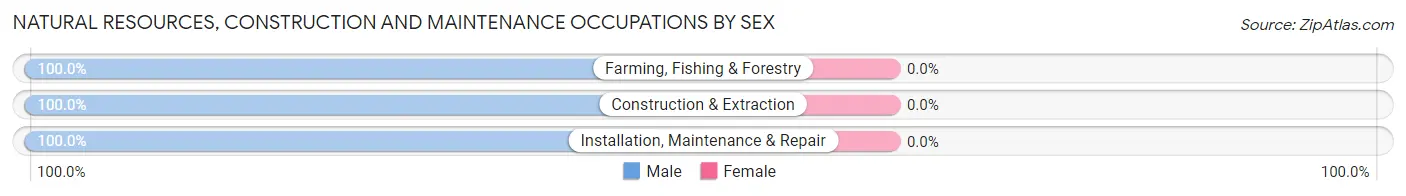
| Occupation | Male | Female |
| Farming, Fishing & Forestry | 1 (100.0%) | 0 (0.0%) |
| Construction & Extraction | 32 (100.0%) | 0 (0.0%) |
| Installation, Maintenance & Repair | 25 (100.0%) | 0 (0.0%) |
| Total (Category) | 58 (100.0%) | 0 (0.0%) |
| Total (Overall) | 289 (50.6%) | 282 (49.4%) |
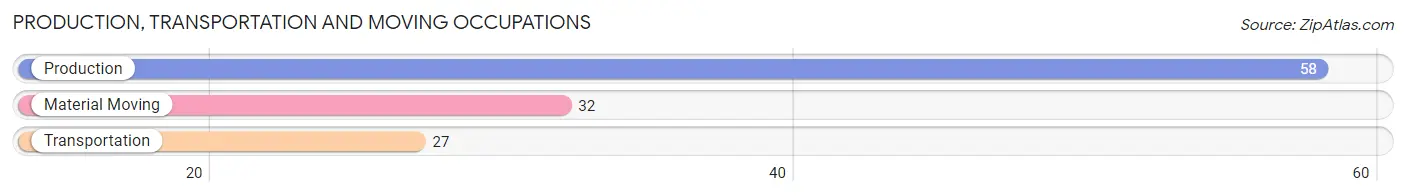
Production, Transportation and Moving Occupations
The most common Production, Transportation and Moving occupations in Heritage Creek are Production (58 | 10.2%), Material Moving (32 | 5.6%), and Transportation (27 | 4.7%).
Production, Transportation and Moving Occupations by Sex
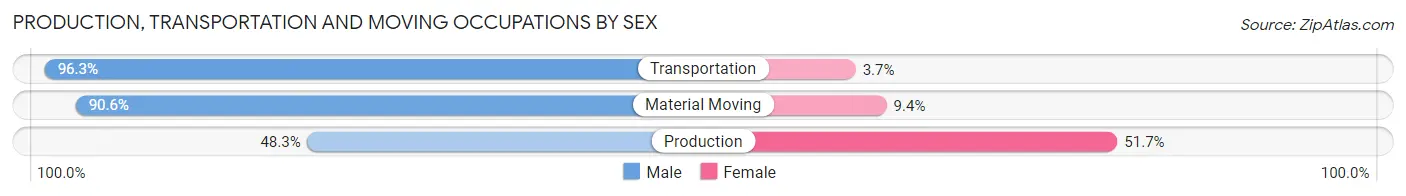
| Occupation | Male | Female |
| Production | 28 (48.3%) | 30 (51.7%) |
| Transportation | 26 (96.3%) | 1 (3.7%) |
| Material Moving | 29 (90.6%) | 3 (9.4%) |
| Total (Category) | 83 (70.9%) | 34 (29.1%) |
| Total (Overall) | 289 (50.6%) | 282 (49.4%) |
Employment Industries by Sex in Heritage Creek
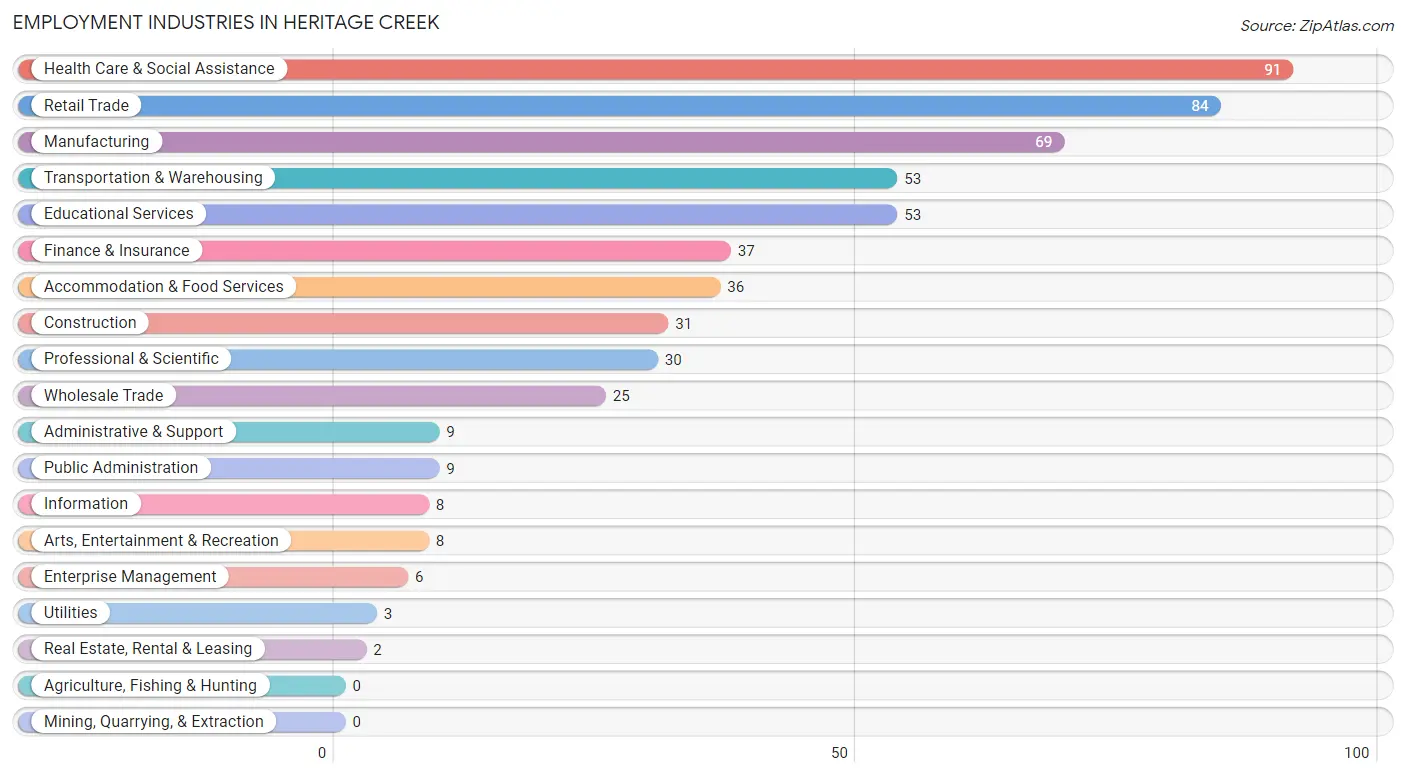
Employment Industries in Heritage Creek
The major employment industries in Heritage Creek include Health Care & Social Assistance (91 | 15.9%), Retail Trade (84 | 14.7%), Manufacturing (69 | 12.1%), Transportation & Warehousing (53 | 9.3%), and Educational Services (53 | 9.3%).
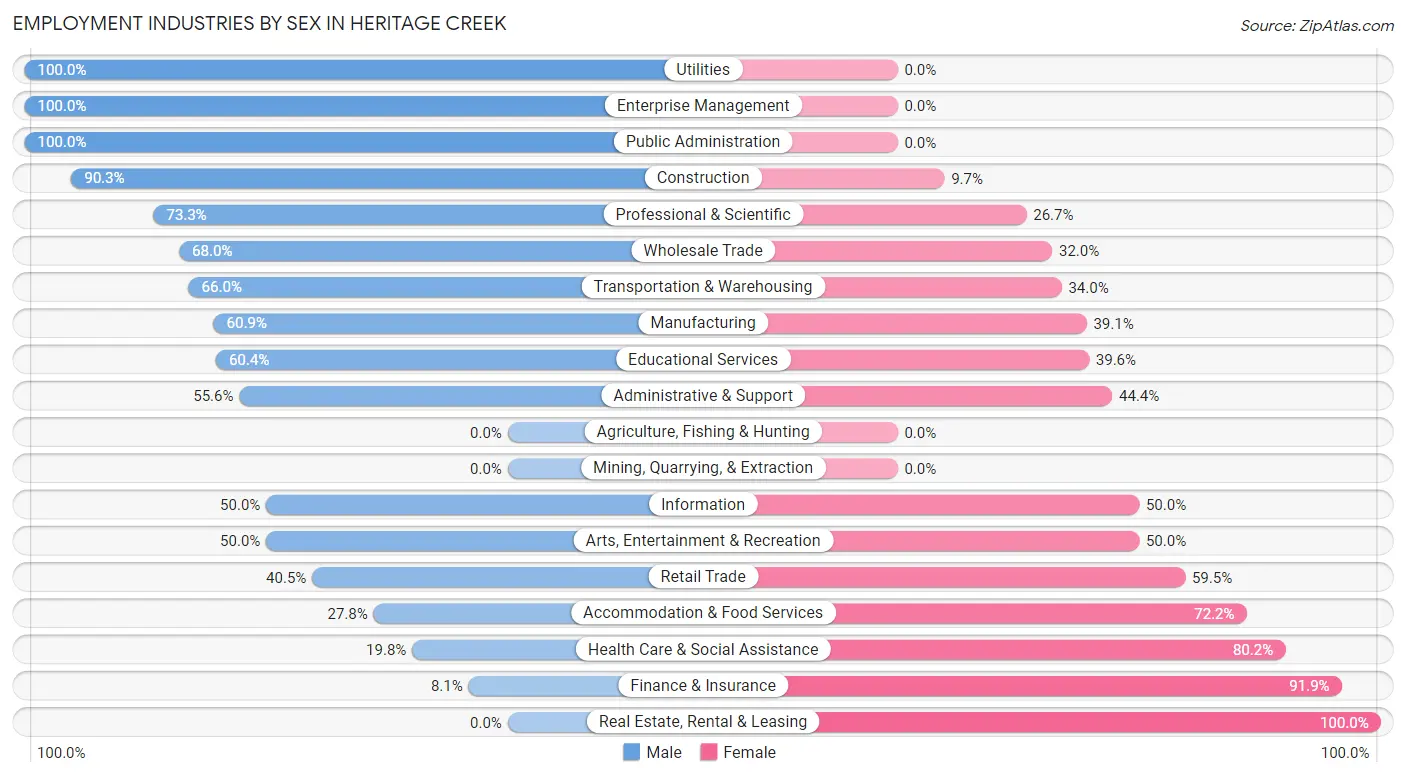
Employment Industries by Sex in Heritage Creek
The Heritage Creek industries that see more men than women are Utilities (100.0%), Enterprise Management (100.0%), and Public Administration (100.0%), whereas the industries that tend to have a higher number of women are Real Estate, Rental & Leasing (100.0%), Finance & Insurance (91.9%), and Health Care & Social Assistance (80.2%).
| Industry | Male | Female |
| Agriculture, Fishing & Hunting | 0 (0.0%) | 0 (0.0%) |
| Mining, Quarrying, & Extraction | 0 (0.0%) | 0 (0.0%) |
| Construction | 28 (90.3%) | 3 (9.7%) |
| Manufacturing | 42 (60.9%) | 27 (39.1%) |
| Wholesale Trade | 17 (68.0%) | 8 (32.0%) |
| Retail Trade | 34 (40.5%) | 50 (59.5%) |
| Transportation & Warehousing | 35 (66.0%) | 18 (34.0%) |
| Utilities | 3 (100.0%) | 0 (0.0%) |
| Information | 4 (50.0%) | 4 (50.0%) |
| Finance & Insurance | 3 (8.1%) | 34 (91.9%) |
| Real Estate, Rental & Leasing | 0 (0.0%) | 2 (100.0%) |
| Professional & Scientific | 22 (73.3%) | 8 (26.7%) |
| Enterprise Management | 6 (100.0%) | 0 (0.0%) |
| Administrative & Support | 5 (55.6%) | 4 (44.4%) |
| Educational Services | 32 (60.4%) | 21 (39.6%) |
| Health Care & Social Assistance | 18 (19.8%) | 73 (80.2%) |
| Arts, Entertainment & Recreation | 4 (50.0%) | 4 (50.0%) |
| Accommodation & Food Services | 10 (27.8%) | 26 (72.2%) |
| Public Administration | 9 (100.0%) | 0 (0.0%) |
| Total | 289 (50.6%) | 282 (49.4%) |
Education in Heritage Creek
School Enrollment in Heritage Creek
The most common levels of schooling among the 217 students in Heritage Creek are high school (63 | 29.0%), middle school (55 | 25.4%), and college / undergraduate (38 | 17.5%).
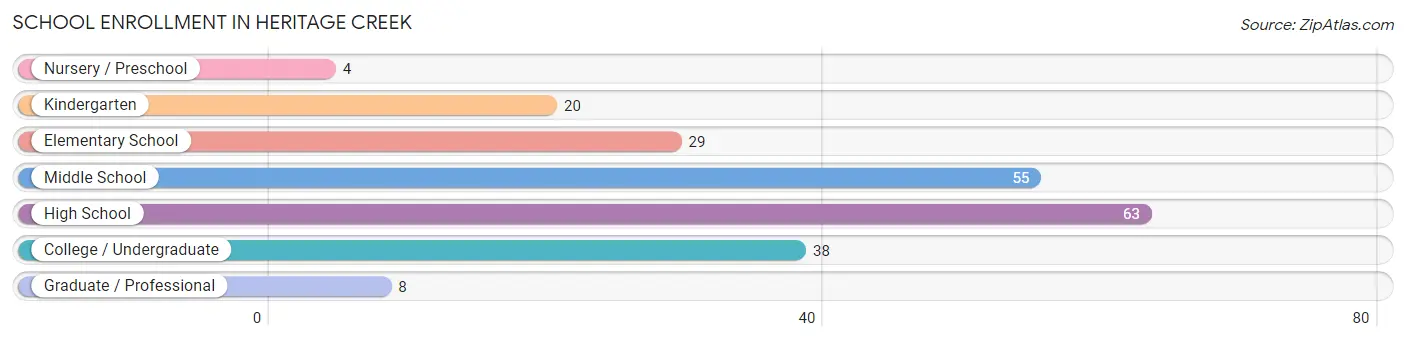
| School Level | # Students | % Students |
| Nursery / Preschool | 4 | 1.8% |
| Kindergarten | 20 | 9.2% |
| Elementary School | 29 | 13.4% |
| Middle School | 55 | 25.4% |
| High School | 63 | 29.0% |
| College / Undergraduate | 38 | 17.5% |
| Graduate / Professional | 8 | 3.7% |
| Total | 217 | 100.0% |
School Enrollment by Age by Funding Source in Heritage Creek
Out of a total of 217 students who are enrolled in schools in Heritage Creek, 44 (20.3%) attend a private institution, while the remaining 173 (79.7%) are enrolled in public schools. The age group of 3 to 4 year olds has the highest likelihood of being enrolled in private schools, with 4 (100.0% in the age bracket) enrolled. Conversely, the age group of 18 to 19 year olds has the lowest likelihood of being enrolled in a private school, with 2 (100.0% in the age bracket) attending a public institution.
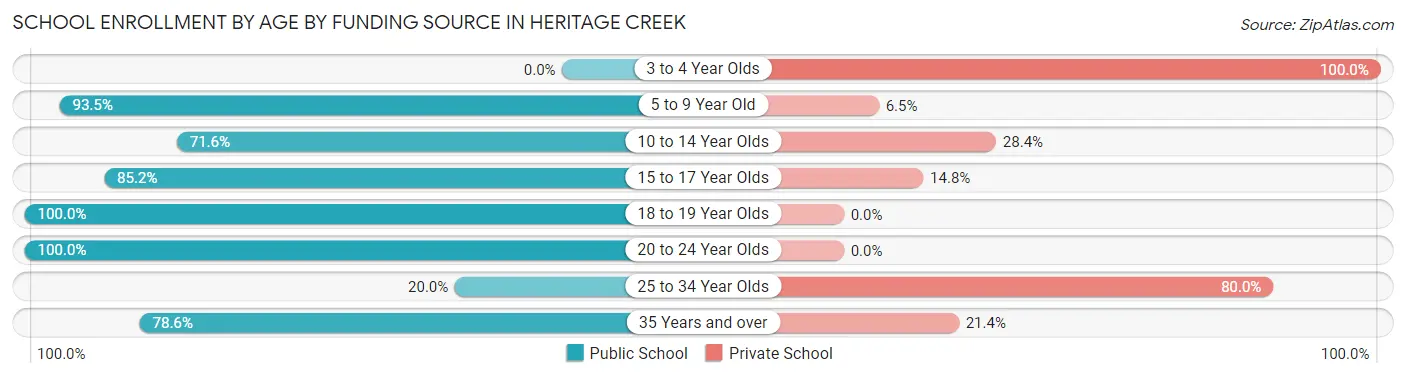
| Age Bracket | Public School | Private School |
| 3 to 4 Year Olds | 0 (0.0%) | 4 (100.0%) |
| 5 to 9 Year Old | 43 (93.5%) | 3 (6.5%) |
| 10 to 14 Year Olds | 48 (71.6%) | 19 (28.4%) |
| 15 to 17 Year Olds | 46 (85.2%) | 8 (14.8%) |
| 18 to 19 Year Olds | 2 (100.0%) | 0 (0.0%) |
| 20 to 24 Year Olds | 11 (100.0%) | 0 (0.0%) |
| 25 to 34 Year Olds | 1 (20.0%) | 4 (80.0%) |
| 35 Years and over | 22 (78.6%) | 6 (21.4%) |
| Total | 173 (79.7%) | 44 (20.3%) |
Educational Attainment by Field of Study in Heritage Creek
Business (30 | 14.9%), liberal arts & history (29 | 14.4%), computers & mathematics (28 | 13.9%), physical & health sciences (20 | 10.0%), and engineering (20 | 10.0%) are the most common fields of study among 201 individuals in Heritage Creek who have obtained a bachelor's degree or higher.
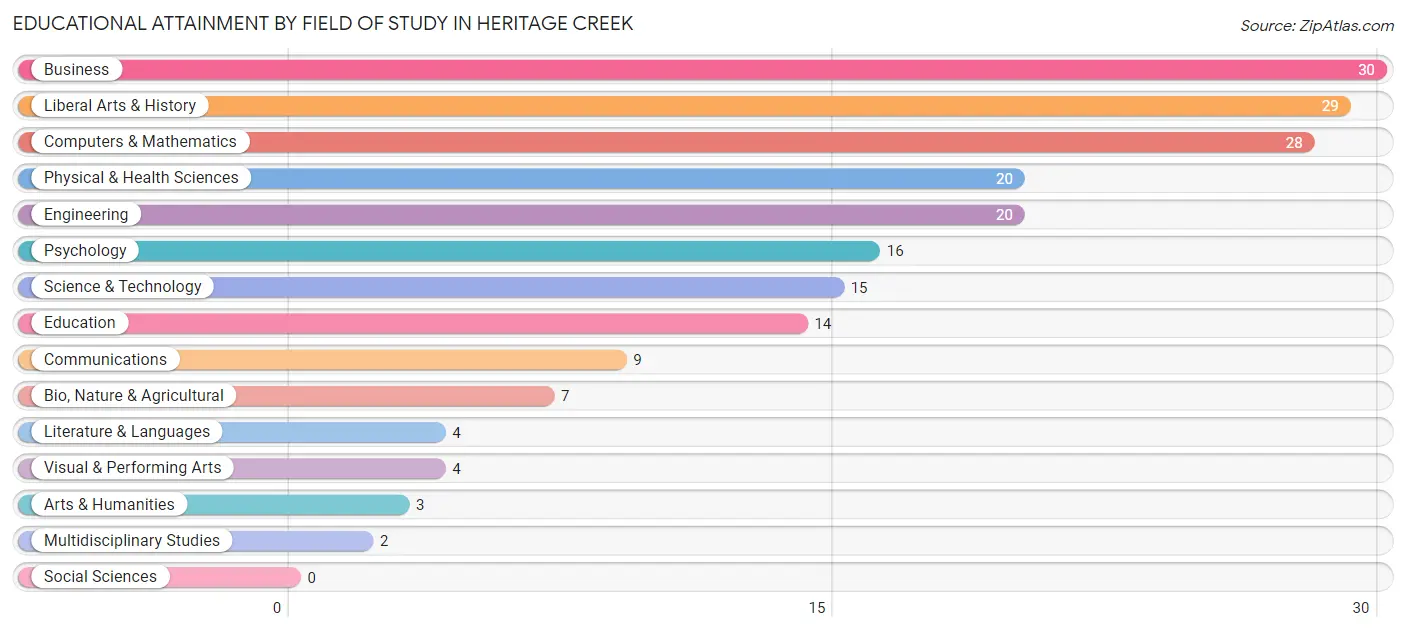
| Field of Study | # Graduates | % Graduates |
| Computers & Mathematics | 28 | 13.9% |
| Bio, Nature & Agricultural | 7 | 3.5% |
| Physical & Health Sciences | 20 | 10.0% |
| Psychology | 16 | 8.0% |
| Social Sciences | 0 | 0.0% |
| Engineering | 20 | 10.0% |
| Multidisciplinary Studies | 2 | 1.0% |
| Science & Technology | 15 | 7.5% |
| Business | 30 | 14.9% |
| Education | 14 | 7.0% |
| Literature & Languages | 4 | 2.0% |
| Liberal Arts & History | 29 | 14.4% |
| Visual & Performing Arts | 4 | 2.0% |
| Communications | 9 | 4.5% |
| Arts & Humanities | 3 | 1.5% |
| Total | 201 | 100.0% |
Transportation & Commute in Heritage Creek
Vehicle Availability by Sex in Heritage Creek
The most prevalent vehicle ownership categories in Heritage Creek are males with 2 vehicles (127, accounting for 43.9%) and females with 2 vehicles (133, making up 45.5%).
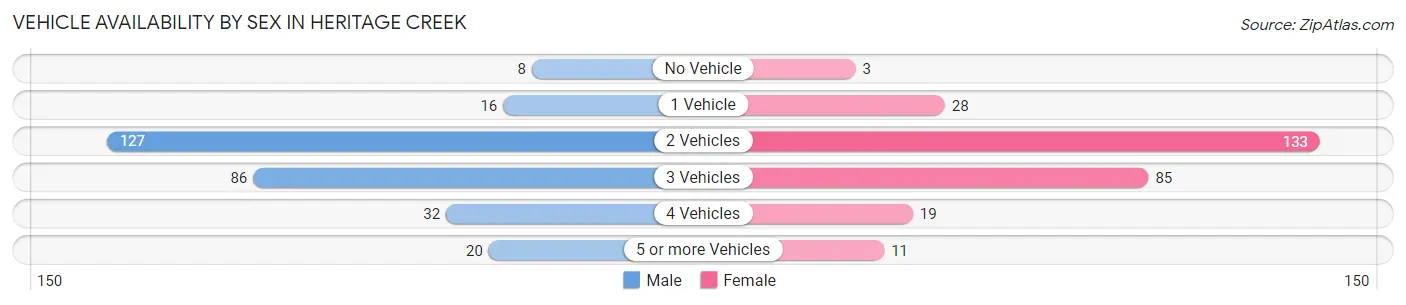
| Vehicles Available | Male | Female |
| No Vehicle | 8 (2.8%) | 3 (1.1%) |
| 1 Vehicle | 16 (5.5%) | 28 (10.0%) |
| 2 Vehicles | 127 (43.9%) | 133 (47.7%) |
| 3 Vehicles | 86 (29.8%) | 85 (30.5%) |
| 4 Vehicles | 32 (11.1%) | 19 (6.8%) |
| 5 or more Vehicles | 20 (6.9%) | 11 (3.9%) |
| Total | 289 (100.0%) | 279 (100.0%) |
Commute Time in Heritage Creek
The most frequently occuring commute durations in Heritage Creek are 20 to 24 minutes (168 commuters, 33.7%), 15 to 19 minutes (80 commuters, 16.1%), and 30 to 34 minutes (72 commuters, 14.5%).
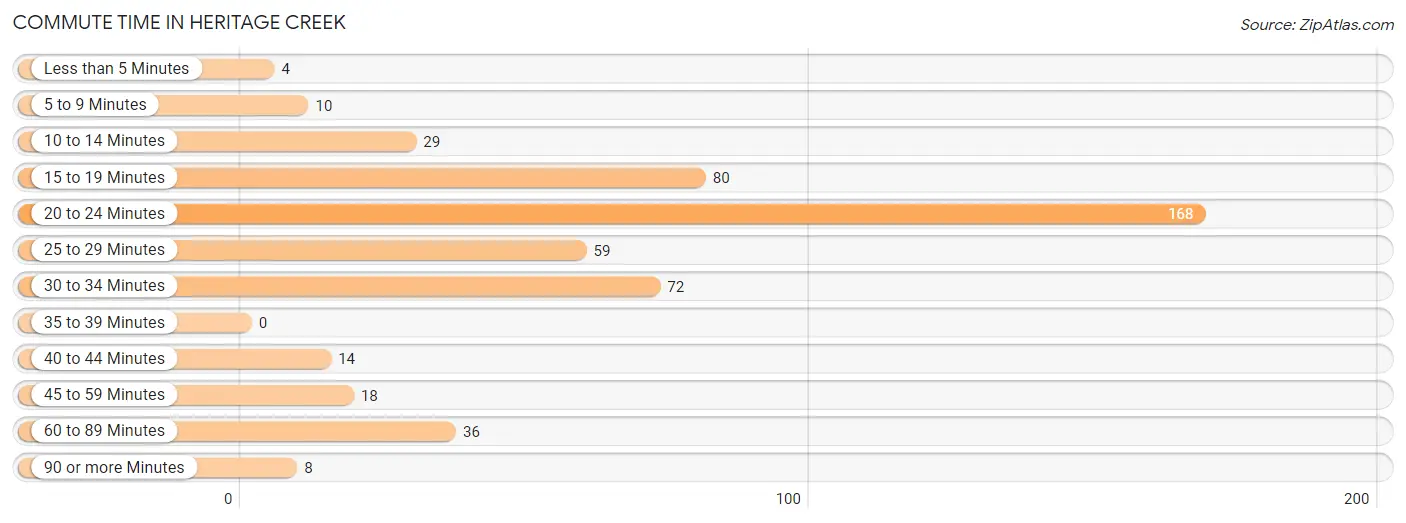
| Commute Time | # Commuters | % Commuters |
| Less than 5 Minutes | 4 | 0.8% |
| 5 to 9 Minutes | 10 | 2.0% |
| 10 to 14 Minutes | 29 | 5.8% |
| 15 to 19 Minutes | 80 | 16.1% |
| 20 to 24 Minutes | 168 | 33.7% |
| 25 to 29 Minutes | 59 | 11.8% |
| 30 to 34 Minutes | 72 | 14.5% |
| 35 to 39 Minutes | 0 | 0.0% |
| 40 to 44 Minutes | 14 | 2.8% |
| 45 to 59 Minutes | 18 | 3.6% |
| 60 to 89 Minutes | 36 | 7.2% |
| 90 or more Minutes | 8 | 1.6% |
Commute Time by Sex in Heritage Creek
The most common commute times in Heritage Creek are 20 to 24 minutes (96 commuters, 36.4%) for males and 20 to 24 minutes (72 commuters, 30.8%) for females.
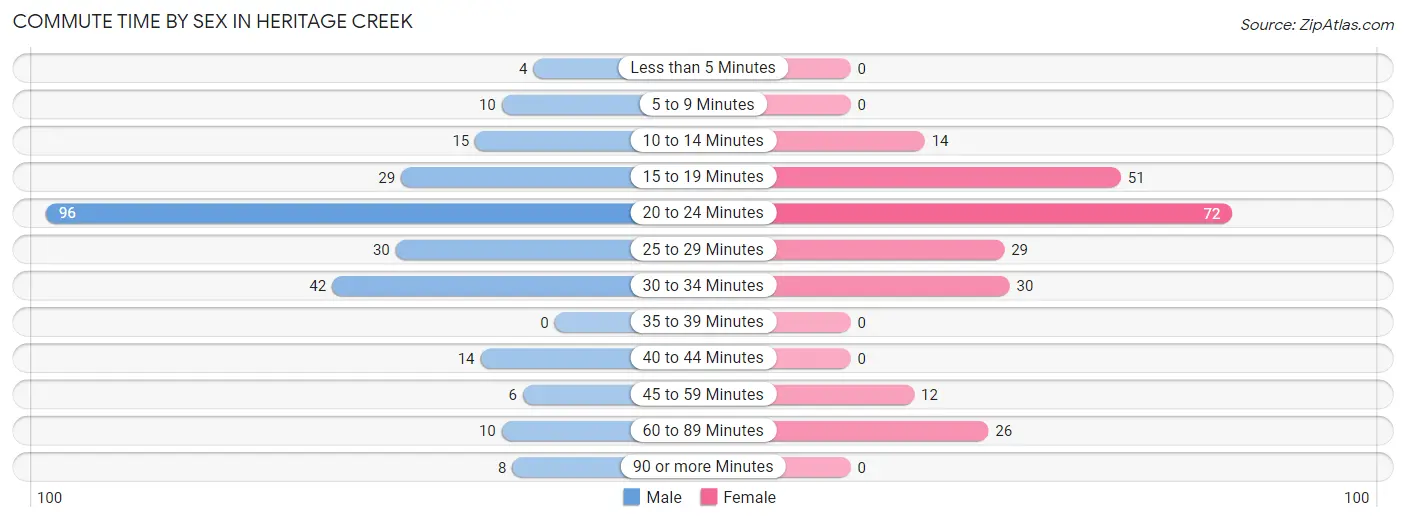
| Commute Time | Male | Female |
| Less than 5 Minutes | 4 (1.5%) | 0 (0.0%) |
| 5 to 9 Minutes | 10 (3.8%) | 0 (0.0%) |
| 10 to 14 Minutes | 15 (5.7%) | 14 (6.0%) |
| 15 to 19 Minutes | 29 (11.0%) | 51 (21.8%) |
| 20 to 24 Minutes | 96 (36.4%) | 72 (30.8%) |
| 25 to 29 Minutes | 30 (11.4%) | 29 (12.4%) |
| 30 to 34 Minutes | 42 (15.9%) | 30 (12.8%) |
| 35 to 39 Minutes | 0 (0.0%) | 0 (0.0%) |
| 40 to 44 Minutes | 14 (5.3%) | 0 (0.0%) |
| 45 to 59 Minutes | 6 (2.3%) | 12 (5.1%) |
| 60 to 89 Minutes | 10 (3.8%) | 26 (11.1%) |
| 90 or more Minutes | 8 (3.0%) | 0 (0.0%) |
Time of Departure to Work by Sex in Heritage Creek
The most frequent times of departure to work in Heritage Creek are 12:00 AM to 4:59 AM (52, 19.7%) for males and 6:30 AM to 6:59 AM (40, 17.1%) for females.
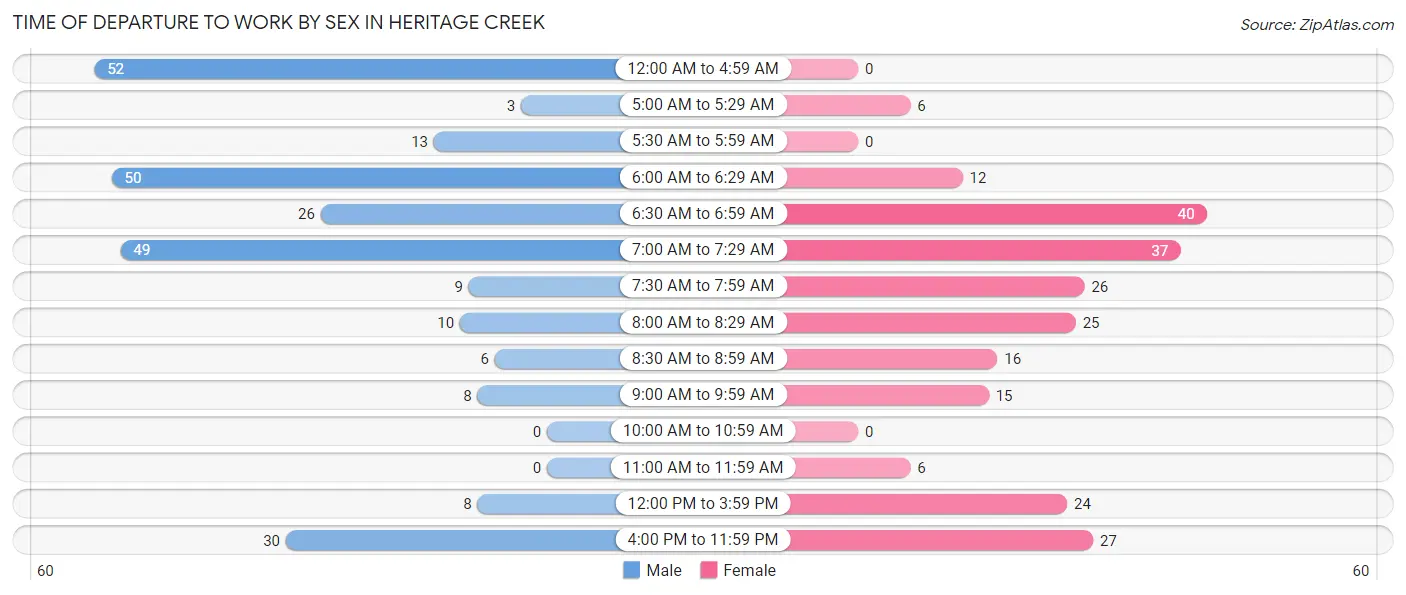
| Time of Departure | Male | Female |
| 12:00 AM to 4:59 AM | 52 (19.7%) | 0 (0.0%) |
| 5:00 AM to 5:29 AM | 3 (1.1%) | 6 (2.6%) |
| 5:30 AM to 5:59 AM | 13 (4.9%) | 0 (0.0%) |
| 6:00 AM to 6:29 AM | 50 (18.9%) | 12 (5.1%) |
| 6:30 AM to 6:59 AM | 26 (9.9%) | 40 (17.1%) |
| 7:00 AM to 7:29 AM | 49 (18.6%) | 37 (15.8%) |
| 7:30 AM to 7:59 AM | 9 (3.4%) | 26 (11.1%) |
| 8:00 AM to 8:29 AM | 10 (3.8%) | 25 (10.7%) |
| 8:30 AM to 8:59 AM | 6 (2.3%) | 16 (6.8%) |
| 9:00 AM to 9:59 AM | 8 (3.0%) | 15 (6.4%) |
| 10:00 AM to 10:59 AM | 0 (0.0%) | 0 (0.0%) |
| 11:00 AM to 11:59 AM | 0 (0.0%) | 6 (2.6%) |
| 12:00 PM to 3:59 PM | 8 (3.0%) | 24 (10.3%) |
| 4:00 PM to 11:59 PM | 30 (11.4%) | 27 (11.5%) |
| Total | 264 (100.0%) | 234 (100.0%) |
Housing Occupancy in Heritage Creek
Occupancy by Ownership in Heritage Creek
Of the total 437 dwellings in Heritage Creek, owner-occupied units account for 431 (98.6%), while renter-occupied units make up 6 (1.4%).
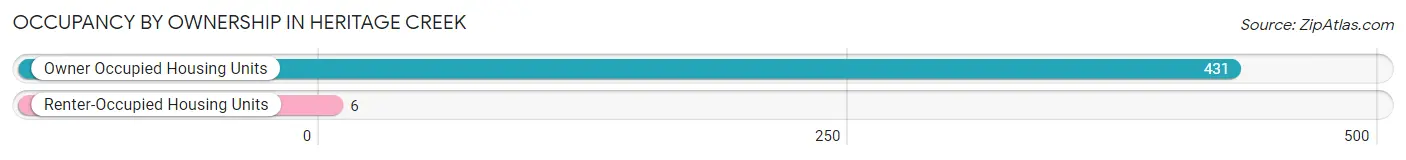
| Occupancy | # Housing Units | % Housing Units |
| Owner Occupied Housing Units | 431 | 98.6% |
| Renter-Occupied Housing Units | 6 | 1.4% |
| Total Occupied Housing Units | 437 | 100.0% |
Occupancy by Household Size in Heritage Creek
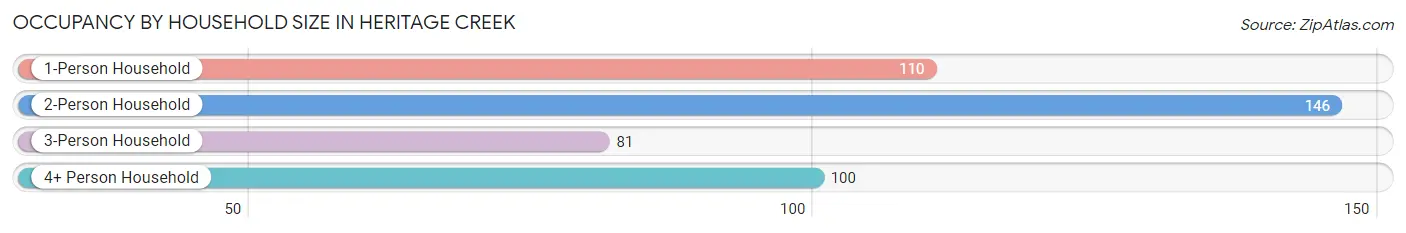
| Household Size | # Housing Units | % Housing Units |
| 1-Person Household | 110 | 25.2% |
| 2-Person Household | 146 | 33.4% |
| 3-Person Household | 81 | 18.5% |
| 4+ Person Household | 100 | 22.9% |
| Total Housing Units | 437 | 100.0% |
Occupancy by Ownership by Household Size in Heritage Creek
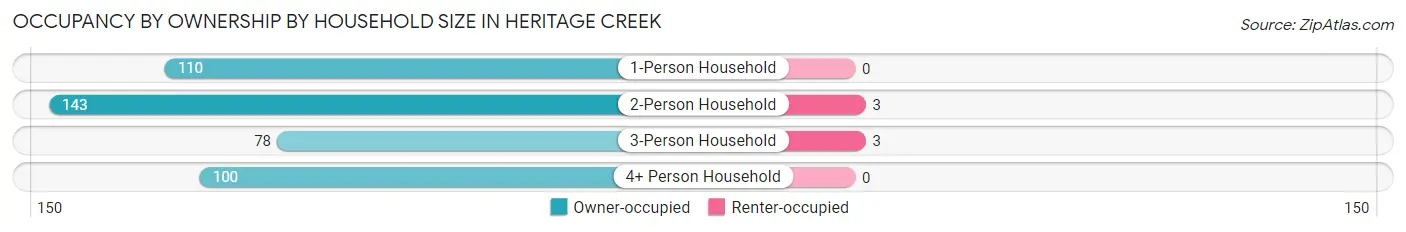
| Household Size | Owner-occupied | Renter-occupied |
| 1-Person Household | 110 (100.0%) | 0 (0.0%) |
| 2-Person Household | 143 (98.0%) | 3 (2.1%) |
| 3-Person Household | 78 (96.3%) | 3 (3.7%) |
| 4+ Person Household | 100 (100.0%) | 0 (0.0%) |
| Total Housing Units | 431 (98.6%) | 6 (1.4%) |
Occupancy by Educational Attainment in Heritage Creek
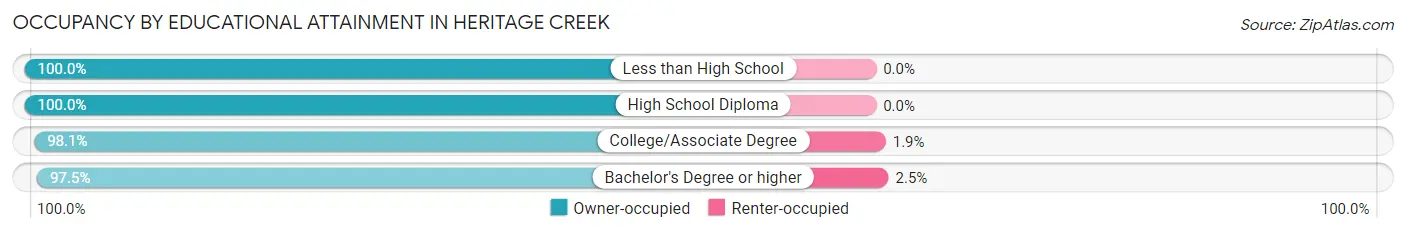
| Household Size | Owner-occupied | Renter-occupied |
| Less than High School | 29 (100.0%) | 0 (0.0%) |
| High School Diploma | 129 (100.0%) | 0 (0.0%) |
| College/Associate Degree | 154 (98.1%) | 3 (1.9%) |
| Bachelor's Degree or higher | 119 (97.5%) | 3 (2.5%) |
Occupancy by Age of Householder in Heritage Creek
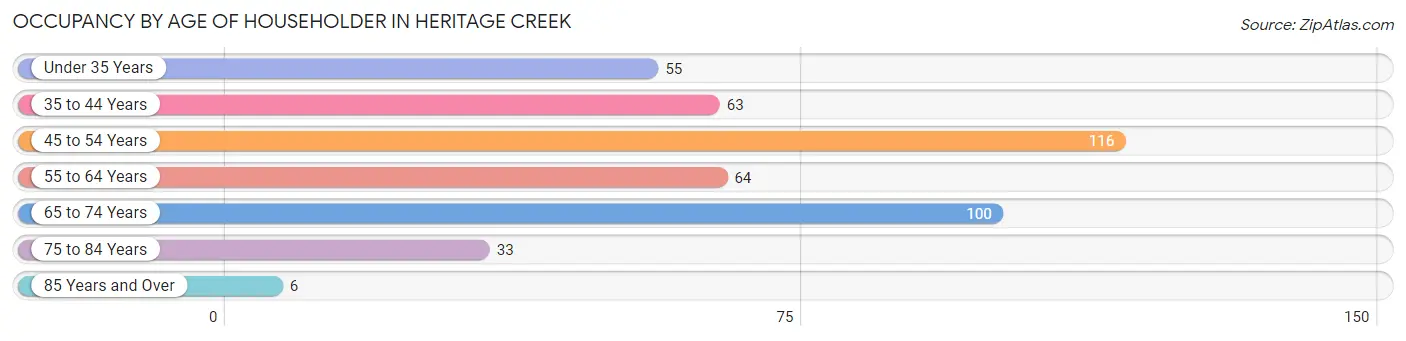
| Age Bracket | # Households | % Households |
| Under 35 Years | 55 | 12.6% |
| 35 to 44 Years | 63 | 14.4% |
| 45 to 54 Years | 116 | 26.5% |
| 55 to 64 Years | 64 | 14.6% |
| 65 to 74 Years | 100 | 22.9% |
| 75 to 84 Years | 33 | 7.5% |
| 85 Years and Over | 6 | 1.4% |
| Total | 437 | 100.0% |
Housing Finances in Heritage Creek
Median Income by Occupancy in Heritage Creek
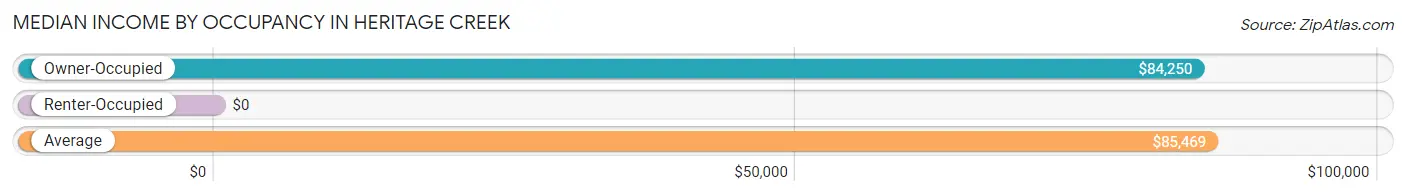
| Occupancy Type | # Households | Median Income |
| Owner-Occupied | 431 (98.6%) | $84,250 |
| Renter-Occupied | 6 (1.4%) | $0 |
| Average | 437 (100.0%) | $85,469 |
Occupancy by Householder Income Bracket in Heritage Creek
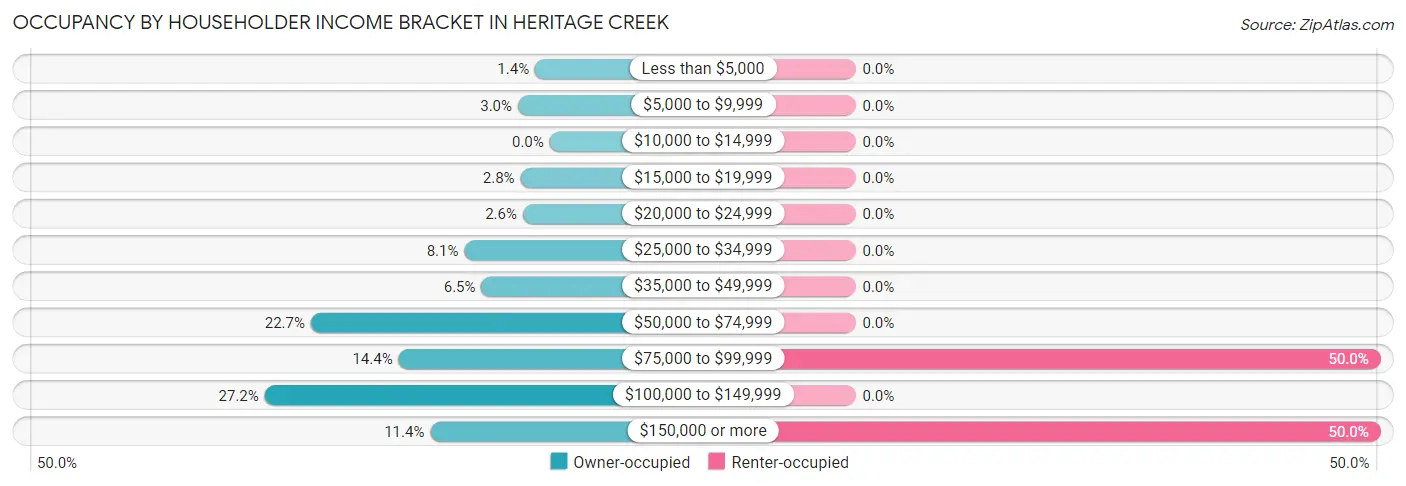
| Income Bracket | Owner-occupied | Renter-occupied |
| Less than $5,000 | 6 (1.4%) | 0 (0.0%) |
| $5,000 to $9,999 | 13 (3.0%) | 0 (0.0%) |
| $10,000 to $14,999 | 0 (0.0%) | 0 (0.0%) |
| $15,000 to $19,999 | 12 (2.8%) | 0 (0.0%) |
| $20,000 to $24,999 | 11 (2.5%) | 0 (0.0%) |
| $25,000 to $34,999 | 35 (8.1%) | 0 (0.0%) |
| $35,000 to $49,999 | 28 (6.5%) | 0 (0.0%) |
| $50,000 to $74,999 | 98 (22.7%) | 0 (0.0%) |
| $75,000 to $99,999 | 62 (14.4%) | 3 (50.0%) |
| $100,000 to $149,999 | 117 (27.2%) | 0 (0.0%) |
| $150,000 or more | 49 (11.4%) | 3 (50.0%) |
| Total | 431 (100.0%) | 6 (100.0%) |
Monthly Housing Cost Tiers in Heritage Creek
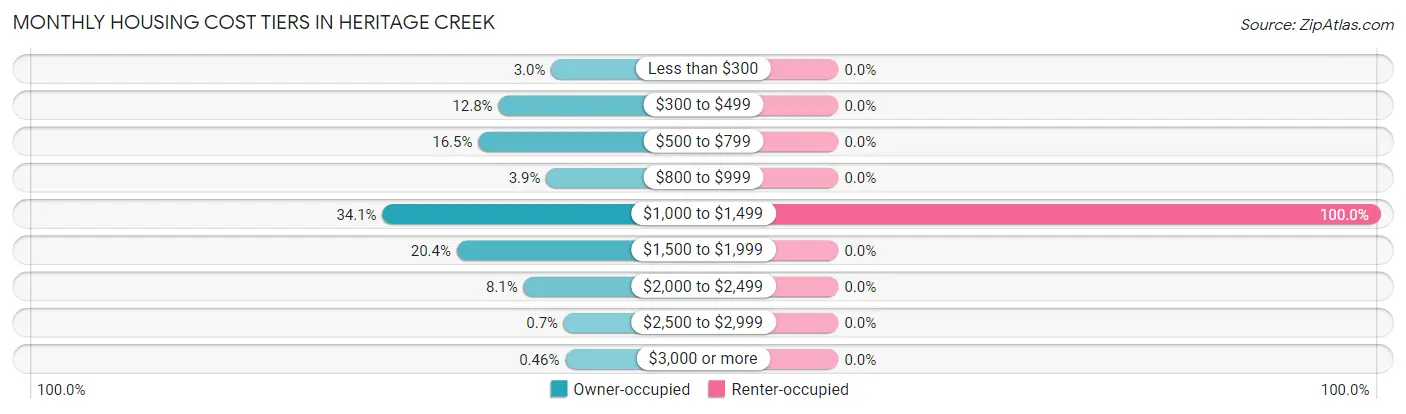
| Monthly Cost | Owner-occupied | Renter-occupied |
| Less than $300 | 13 (3.0%) | 0 (0.0%) |
| $300 to $499 | 55 (12.8%) | 0 (0.0%) |
| $500 to $799 | 71 (16.5%) | 0 (0.0%) |
| $800 to $999 | 17 (3.9%) | 0 (0.0%) |
| $1,000 to $1,499 | 147 (34.1%) | 6 (100.0%) |
| $1,500 to $1,999 | 88 (20.4%) | 0 (0.0%) |
| $2,000 to $2,499 | 35 (8.1%) | 0 (0.0%) |
| $2,500 to $2,999 | 3 (0.7%) | 0 (0.0%) |
| $3,000 or more | 2 (0.5%) | 0 (0.0%) |
| Total | 431 (100.0%) | 6 (100.0%) |
Physical Housing Characteristics in Heritage Creek
Housing Structures in Heritage Creek
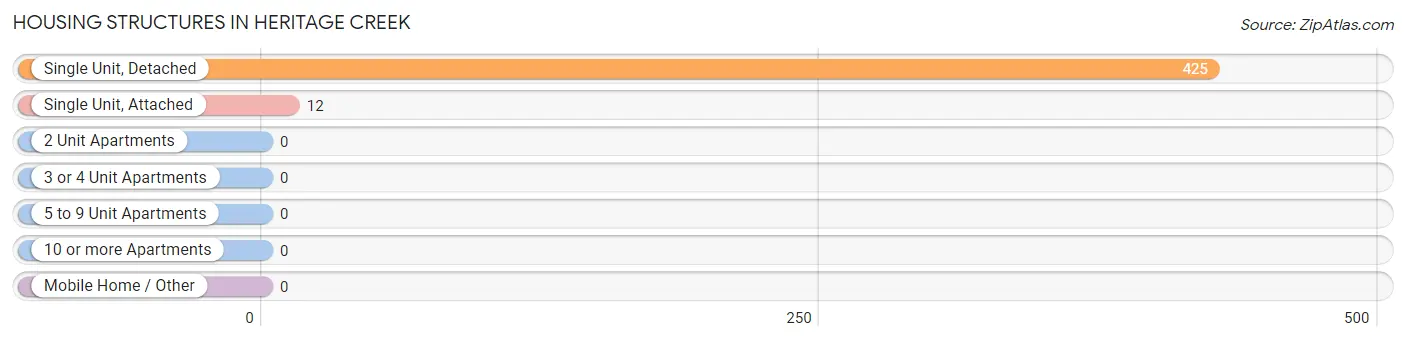
| Structure Type | # Housing Units | % Housing Units |
| Single Unit, Detached | 425 | 97.3% |
| Single Unit, Attached | 12 | 2.8% |
| 2 Unit Apartments | 0 | 0.0% |
| 3 or 4 Unit Apartments | 0 | 0.0% |
| 5 to 9 Unit Apartments | 0 | 0.0% |
| 10 or more Apartments | 0 | 0.0% |
| Mobile Home / Other | 0 | 0.0% |
| Total | 437 | 100.0% |
Housing Structures by Occupancy in Heritage Creek
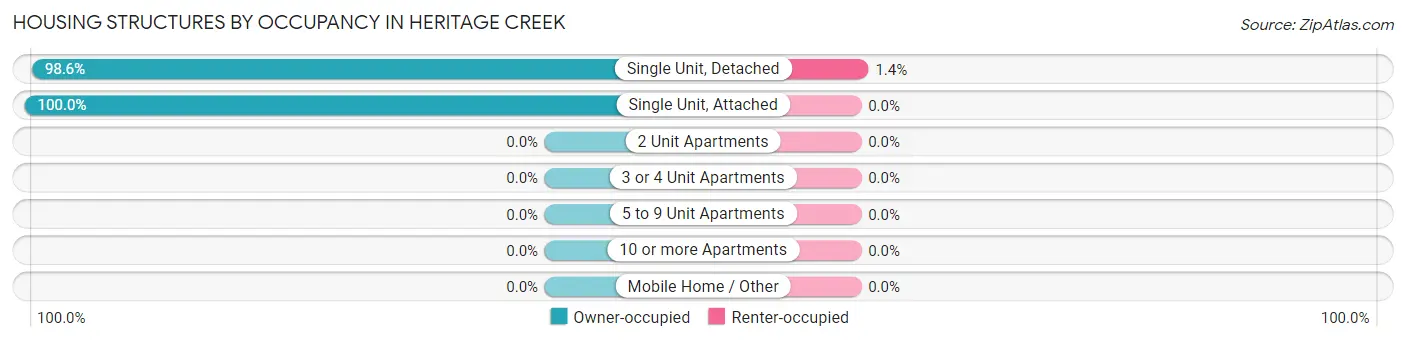
| Structure Type | Owner-occupied | Renter-occupied |
| Single Unit, Detached | 419 (98.6%) | 6 (1.4%) |
| Single Unit, Attached | 12 (100.0%) | 0 (0.0%) |
| 2 Unit Apartments | 0 (0.0%) | 0 (0.0%) |
| 3 or 4 Unit Apartments | 0 (0.0%) | 0 (0.0%) |
| 5 to 9 Unit Apartments | 0 (0.0%) | 0 (0.0%) |
| 10 or more Apartments | 0 (0.0%) | 0 (0.0%) |
| Mobile Home / Other | 0 (0.0%) | 0 (0.0%) |
| Total | 431 (98.6%) | 6 (1.4%) |
Housing Structures by Number of Rooms in Heritage Creek
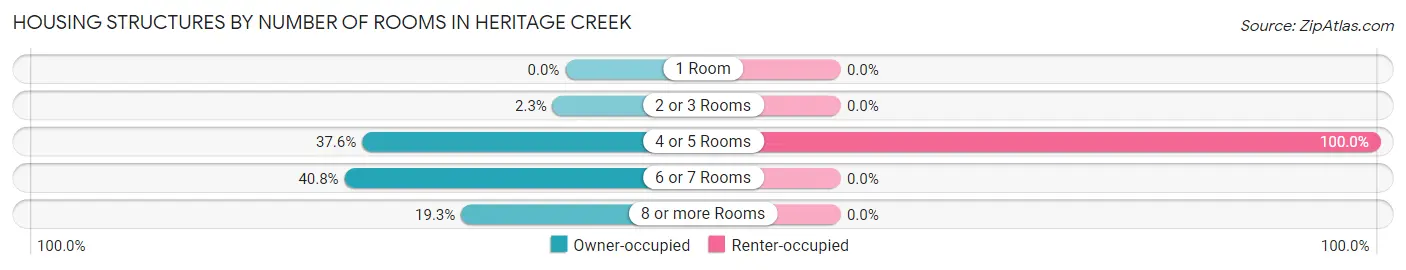
| Number of Rooms | Owner-occupied | Renter-occupied |
| 1 Room | 0 (0.0%) | 0 (0.0%) |
| 2 or 3 Rooms | 10 (2.3%) | 0 (0.0%) |
| 4 or 5 Rooms | 162 (37.6%) | 6 (100.0%) |
| 6 or 7 Rooms | 176 (40.8%) | 0 (0.0%) |
| 8 or more Rooms | 83 (19.3%) | 0 (0.0%) |
| Total | 431 (100.0%) | 6 (100.0%) |
Housing Structure by Heating Type in Heritage Creek
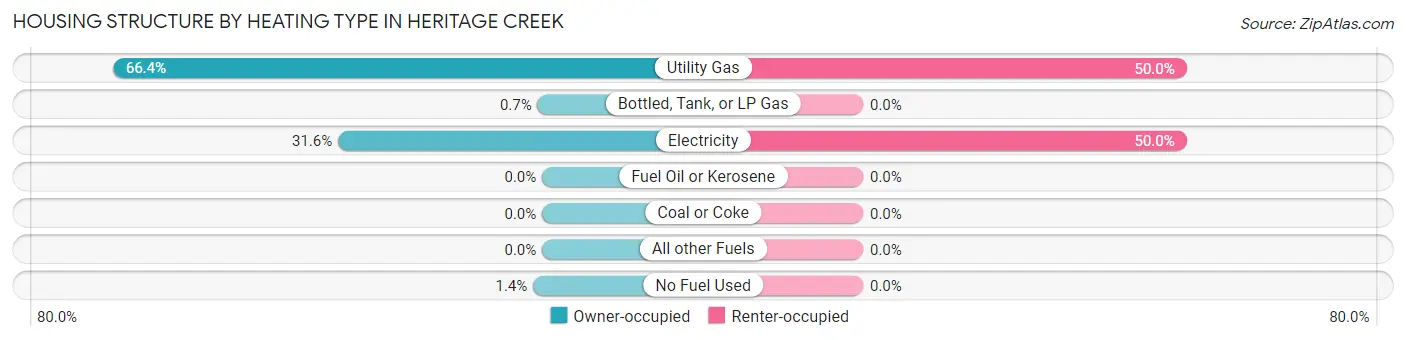
| Heating Type | Owner-occupied | Renter-occupied |
| Utility Gas | 286 (66.4%) | 3 (50.0%) |
| Bottled, Tank, or LP Gas | 3 (0.7%) | 0 (0.0%) |
| Electricity | 136 (31.6%) | 3 (50.0%) |
| Fuel Oil or Kerosene | 0 (0.0%) | 0 (0.0%) |
| Coal or Coke | 0 (0.0%) | 0 (0.0%) |
| All other Fuels | 0 (0.0%) | 0 (0.0%) |
| No Fuel Used | 6 (1.4%) | 0 (0.0%) |
| Total | 431 (100.0%) | 6 (100.0%) |
Household Vehicle Usage in Heritage Creek
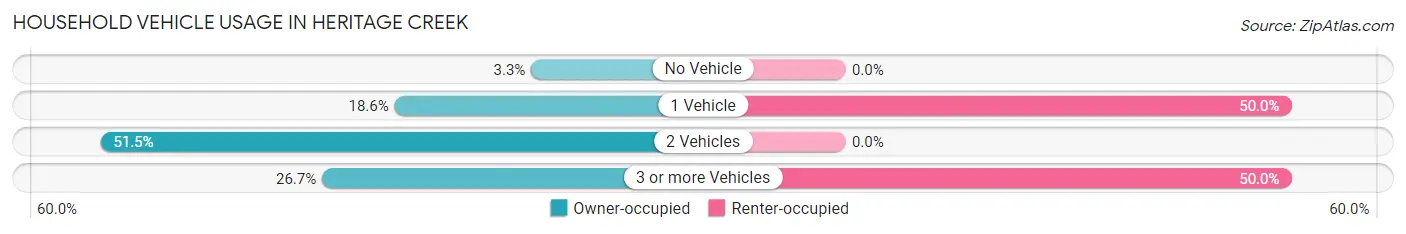
| Vehicles per Household | Owner-occupied | Renter-occupied |
| No Vehicle | 14 (3.3%) | 0 (0.0%) |
| 1 Vehicle | 80 (18.6%) | 3 (50.0%) |
| 2 Vehicles | 222 (51.5%) | 0 (0.0%) |
| 3 or more Vehicles | 115 (26.7%) | 3 (50.0%) |
| Total | 431 (100.0%) | 6 (100.0%) |
Real Estate & Mortgages in Heritage Creek
Real Estate and Mortgage Overview in Heritage Creek
| Characteristic | Without Mortgage | With Mortgage |
| Housing Units | 111 | 320 |
| Median Property Value | $223,000 | $220,000 |
| Median Household Income | $51,875 | $46 |
| Monthly Housing Costs | $503 | $2 |
| Real Estate Taxes | $1,858 | $0 |
Property Value by Mortgage Status in Heritage Creek
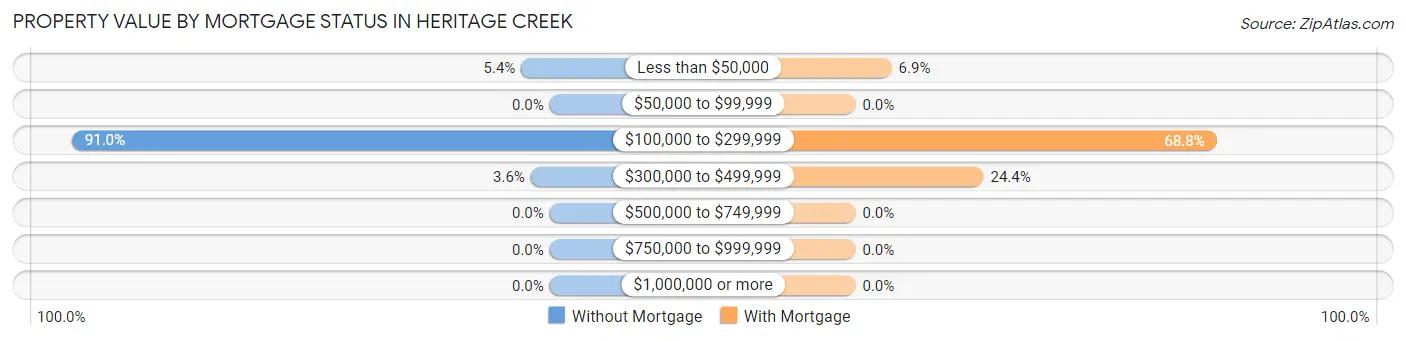
| Property Value | Without Mortgage | With Mortgage |
| Less than $50,000 | 6 (5.4%) | 22 (6.9%) |
| $50,000 to $99,999 | 0 (0.0%) | 0 (0.0%) |
| $100,000 to $299,999 | 101 (91.0%) | 220 (68.8%) |
| $300,000 to $499,999 | 4 (3.6%) | 78 (24.4%) |
| $500,000 to $749,999 | 0 (0.0%) | 0 (0.0%) |
| $750,000 to $999,999 | 0 (0.0%) | 0 (0.0%) |
| $1,000,000 or more | 0 (0.0%) | 0 (0.0%) |
| Total | 111 (100.0%) | 320 (100.0%) |
Household Income by Mortgage Status in Heritage Creek
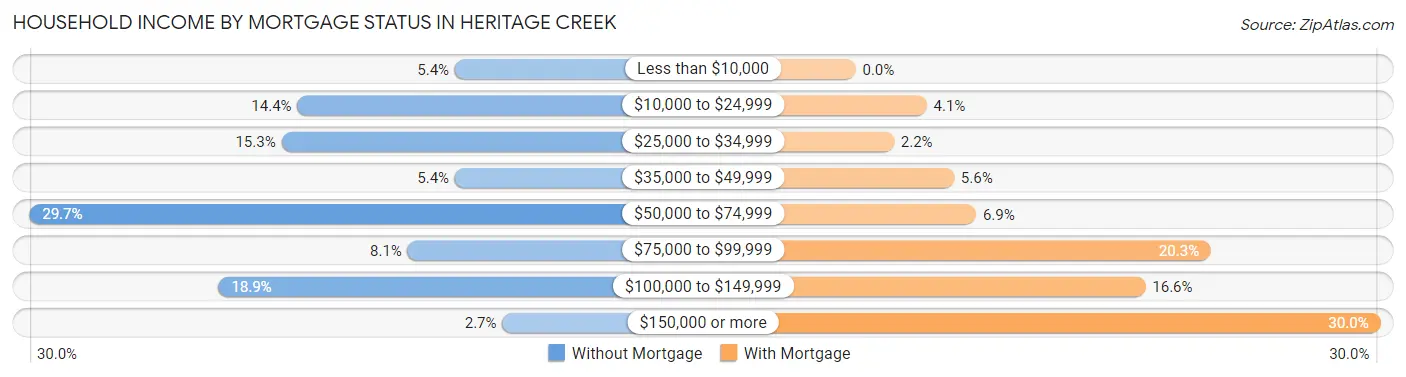
| Household Income | Without Mortgage | With Mortgage |
| Less than $10,000 | 6 (5.4%) | 0 (0.0%) |
| $10,000 to $24,999 | 16 (14.4%) | 13 (4.1%) |
| $25,000 to $34,999 | 17 (15.3%) | 7 (2.2%) |
| $35,000 to $49,999 | 6 (5.4%) | 18 (5.6%) |
| $50,000 to $74,999 | 33 (29.7%) | 22 (6.9%) |
| $75,000 to $99,999 | 9 (8.1%) | 65 (20.3%) |
| $100,000 to $149,999 | 21 (18.9%) | 53 (16.6%) |
| $150,000 or more | 3 (2.7%) | 96 (30.0%) |
| Total | 111 (100.0%) | 320 (100.0%) |
Property Value to Household Income Ratio in Heritage Creek
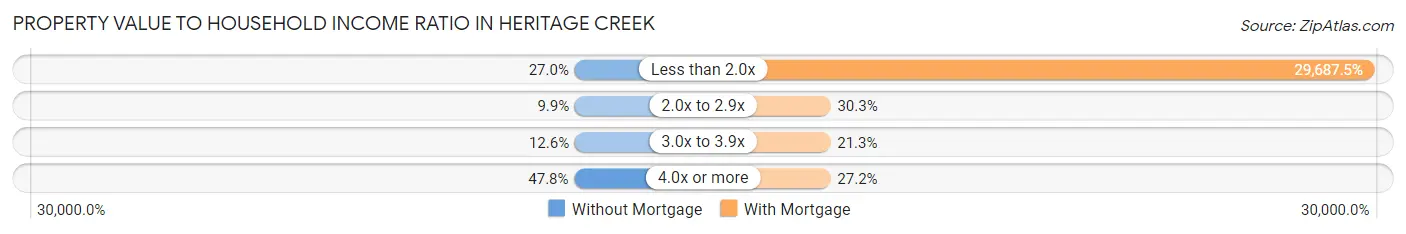
| Value-to-Income Ratio | Without Mortgage | With Mortgage |
| Less than 2.0x | 30 (27.0%) | 95,000 (29,687.5%) |
| 2.0x to 2.9x | 11 (9.9%) | 97 (30.3%) |
| 3.0x to 3.9x | 14 (12.6%) | 68 (21.2%) |
| 4.0x or more | 53 (47.7%) | 87 (27.2%) |
| Total | 111 (100.0%) | 320 (100.0%) |
Real Estate Taxes by Mortgage Status in Heritage Creek
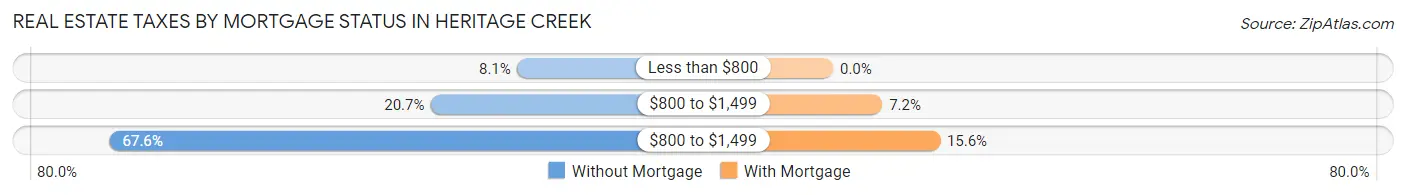
| Property Taxes | Without Mortgage | With Mortgage |
| Less than $800 | 9 (8.1%) | 0 (0.0%) |
| $800 to $1,499 | 23 (20.7%) | 23 (7.2%) |
| $800 to $1,499 | 75 (67.6%) | 50 (15.6%) |
| Total | 111 (100.0%) | 320 (100.0%) |
Health & Disability in Heritage Creek
Health Insurance Coverage by Age in Heritage Creek
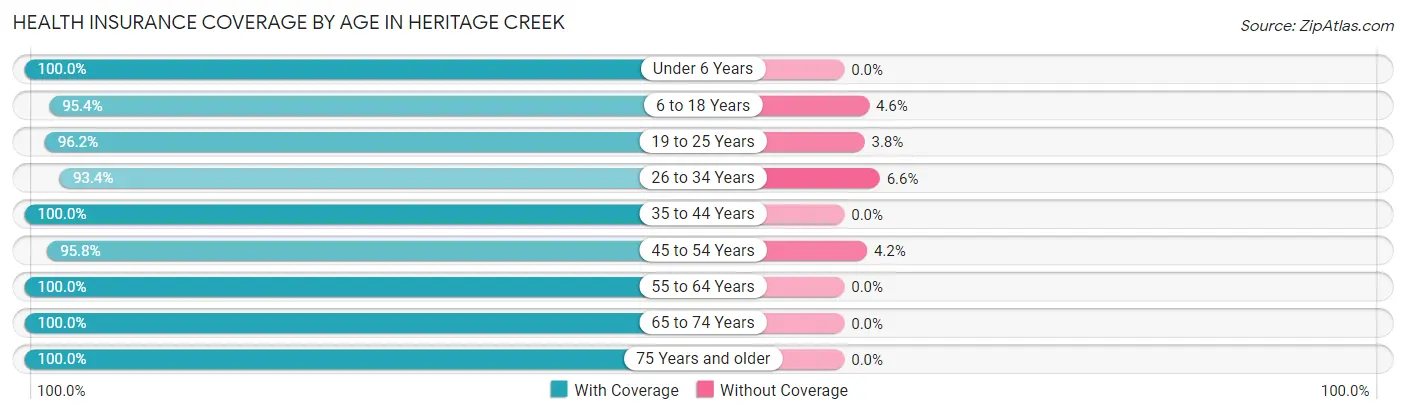
| Age Bracket | With Coverage | Without Coverage |
| Under 6 Years | 73 (100.0%) | 0 (0.0%) |
| 6 to 18 Years | 166 (95.4%) | 8 (4.6%) |
| 19 to 25 Years | 51 (96.2%) | 2 (3.8%) |
| 26 to 34 Years | 113 (93.4%) | 8 (6.6%) |
| 35 to 44 Years | 129 (100.0%) | 0 (0.0%) |
| 45 to 54 Years | 204 (95.8%) | 9 (4.2%) |
| 55 to 64 Years | 102 (100.0%) | 0 (0.0%) |
| 65 to 74 Years | 172 (100.0%) | 0 (0.0%) |
| 75 Years and older | 72 (100.0%) | 0 (0.0%) |
| Total | 1,082 (97.6%) | 27 (2.4%) |
Health Insurance Coverage by Citizenship Status in Heritage Creek
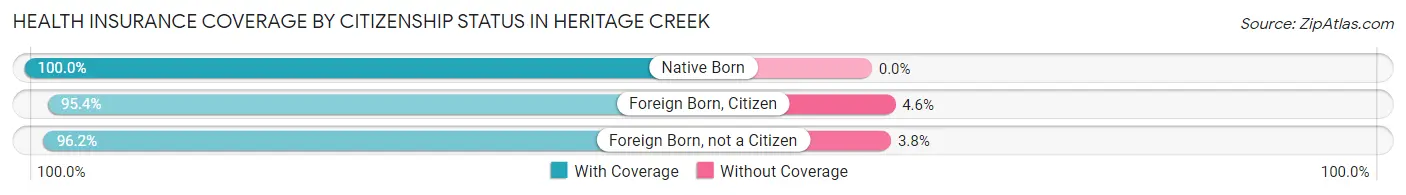
| Citizenship Status | With Coverage | Without Coverage |
| Native Born | 73 (100.0%) | 0 (0.0%) |
| Foreign Born, Citizen | 166 (95.4%) | 8 (4.6%) |
| Foreign Born, not a Citizen | 51 (96.2%) | 2 (3.8%) |
Health Insurance Coverage by Household Income in Heritage Creek
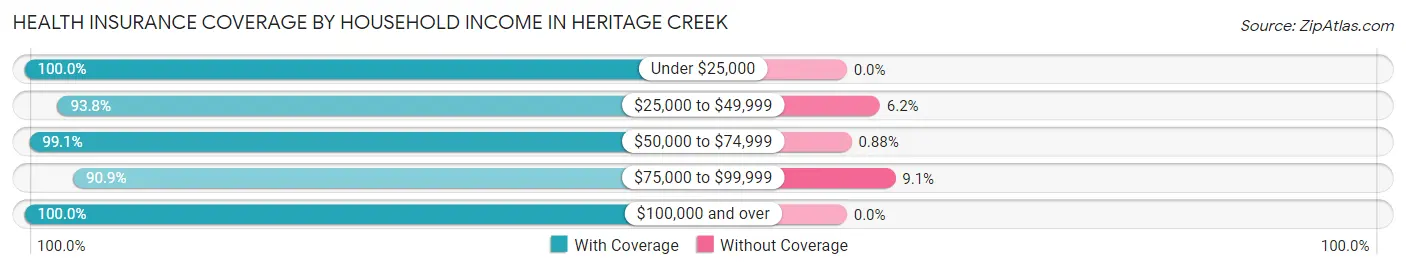
| Household Income | With Coverage | Without Coverage |
| Under $25,000 | 66 (100.0%) | 0 (0.0%) |
| $25,000 to $49,999 | 91 (93.8%) | 6 (6.2%) |
| $50,000 to $74,999 | 224 (99.1%) | 2 (0.9%) |
| $75,000 to $99,999 | 190 (90.9%) | 19 (9.1%) |
| $100,000 and over | 511 (100.0%) | 0 (0.0%) |
Public vs Private Health Insurance Coverage by Age in Heritage Creek
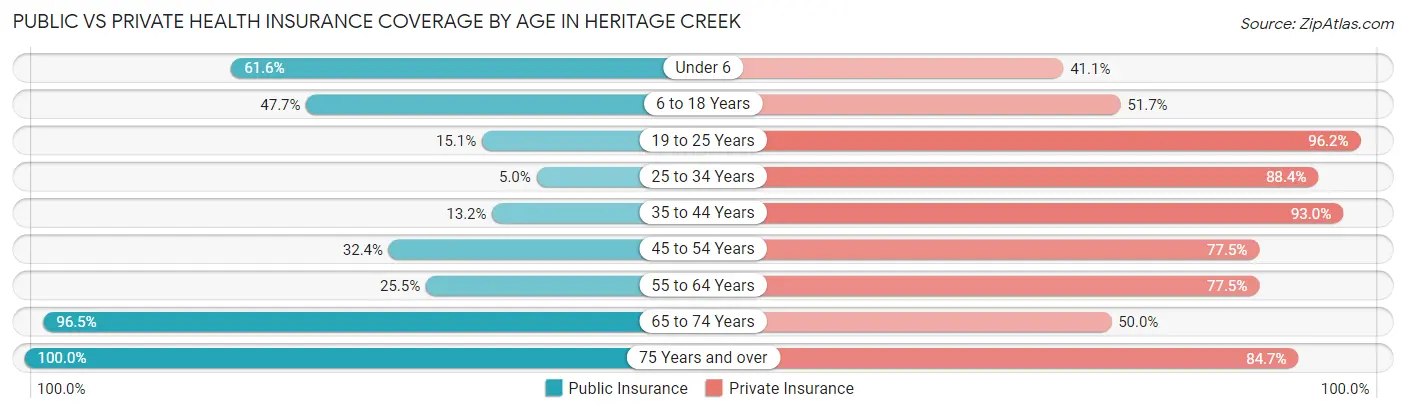
| Age Bracket | Public Insurance | Private Insurance |
| Under 6 | 45 (61.6%) | 30 (41.1%) |
| 6 to 18 Years | 83 (47.7%) | 90 (51.7%) |
| 19 to 25 Years | 8 (15.1%) | 51 (96.2%) |
| 25 to 34 Years | 6 (5.0%) | 107 (88.4%) |
| 35 to 44 Years | 17 (13.2%) | 120 (93.0%) |
| 45 to 54 Years | 69 (32.4%) | 165 (77.5%) |
| 55 to 64 Years | 26 (25.5%) | 79 (77.4%) |
| 65 to 74 Years | 166 (96.5%) | 86 (50.0%) |
| 75 Years and over | 72 (100.0%) | 61 (84.7%) |
| Total | 492 (44.4%) | 789 (71.2%) |
Disability Status by Sex by Age in Heritage Creek
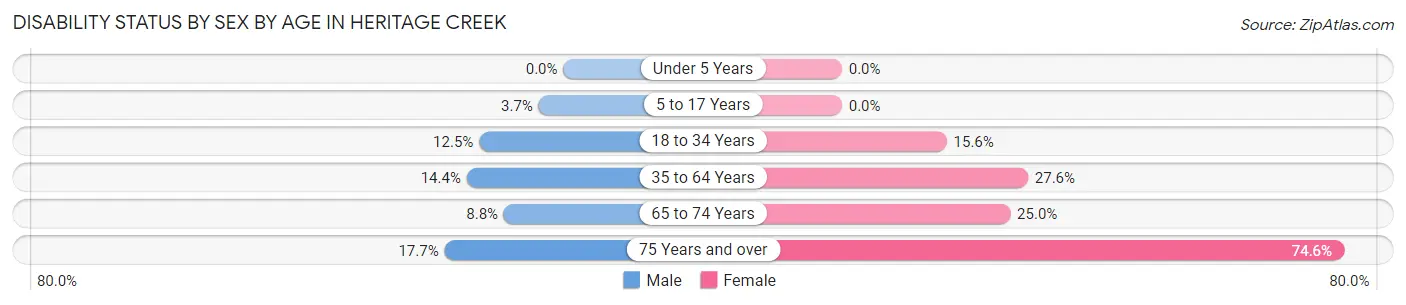
| Age Bracket | Male | Female |
| Under 5 Years | 0 (0.0%) | 0 (0.0%) |
| 5 to 17 Years | 3 (3.7%) | 0 (0.0%) |
| 18 to 34 Years | 11 (12.5%) | 14 (15.6%) |
| 35 to 64 Years | 31 (14.3%) | 63 (27.6%) |
| 65 to 74 Years | 6 (8.8%) | 26 (25.0%) |
| 75 Years and over | 3 (17.6%) | 41 (74.6%) |
Disability Class by Sex by Age in Heritage Creek
Disability Class: Hearing Difficulty
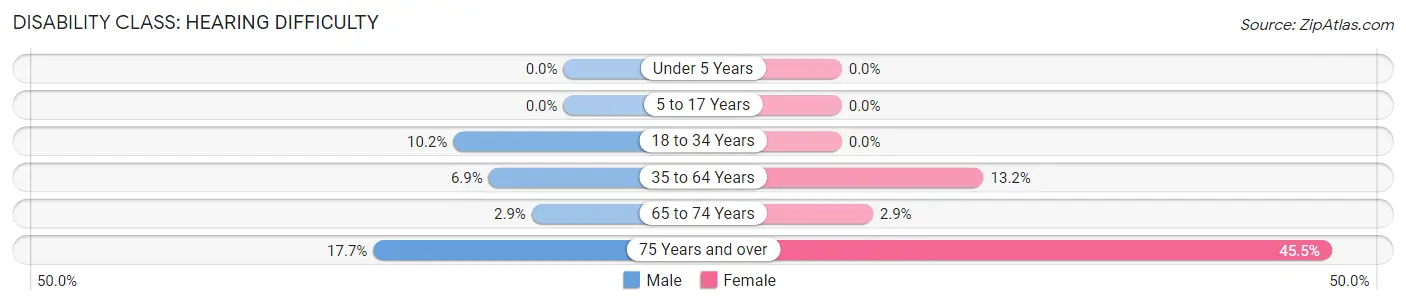
| Age Bracket | Male | Female |
| Under 5 Years | 0 (0.0%) | 0 (0.0%) |
| 5 to 17 Years | 0 (0.0%) | 0 (0.0%) |
| 18 to 34 Years | 9 (10.2%) | 0 (0.0%) |
| 35 to 64 Years | 15 (6.9%) | 30 (13.2%) |
| 65 to 74 Years | 2 (2.9%) | 3 (2.9%) |
| 75 Years and over | 3 (17.6%) | 25 (45.5%) |
Disability Class: Vision Difficulty
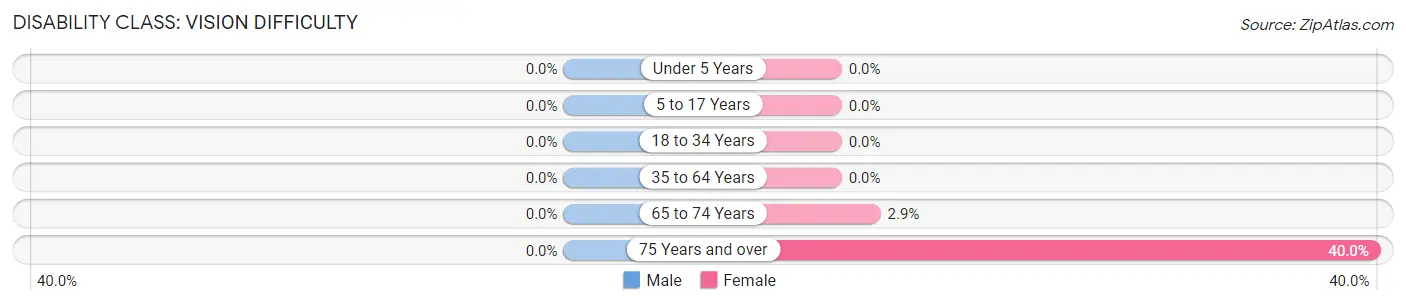
| Age Bracket | Male | Female |
| Under 5 Years | 0 (0.0%) | 0 (0.0%) |
| 5 to 17 Years | 0 (0.0%) | 0 (0.0%) |
| 18 to 34 Years | 0 (0.0%) | 0 (0.0%) |
| 35 to 64 Years | 0 (0.0%) | 0 (0.0%) |
| 65 to 74 Years | 0 (0.0%) | 3 (2.9%) |
| 75 Years and over | 0 (0.0%) | 22 (40.0%) |
Disability Class: Cognitive Difficulty
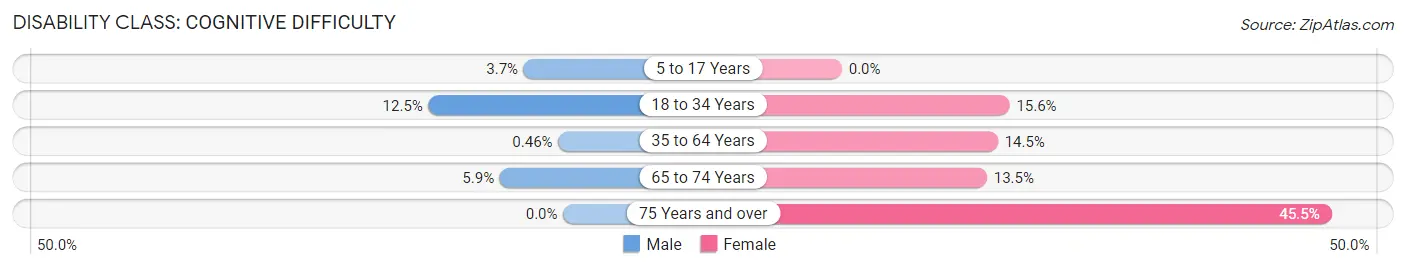
| Age Bracket | Male | Female |
| 5 to 17 Years | 3 (3.7%) | 0 (0.0%) |
| 18 to 34 Years | 11 (12.5%) | 14 (15.6%) |
| 35 to 64 Years | 1 (0.5%) | 33 (14.5%) |
| 65 to 74 Years | 4 (5.9%) | 14 (13.5%) |
| 75 Years and over | 0 (0.0%) | 25 (45.5%) |
Disability Class: Ambulatory Difficulty
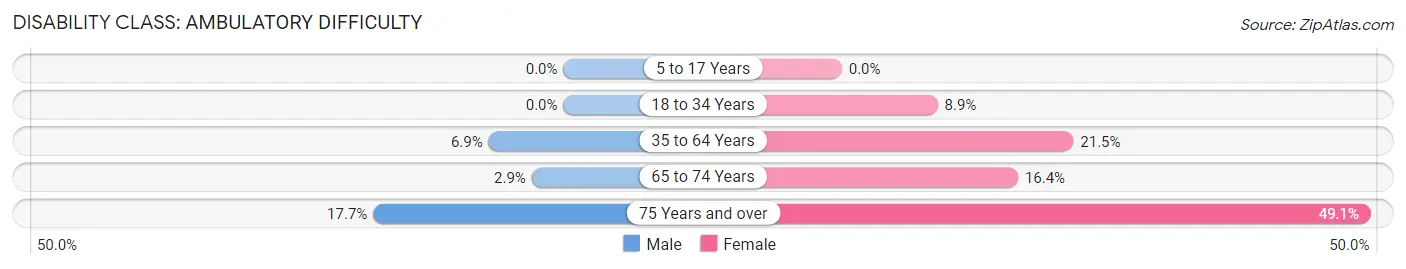
| Age Bracket | Male | Female |
| 5 to 17 Years | 0 (0.0%) | 0 (0.0%) |
| 18 to 34 Years | 0 (0.0%) | 8 (8.9%) |
| 35 to 64 Years | 15 (6.9%) | 49 (21.5%) |
| 65 to 74 Years | 2 (2.9%) | 17 (16.4%) |
| 75 Years and over | 3 (17.6%) | 27 (49.1%) |
Disability Class: Self-Care Difficulty
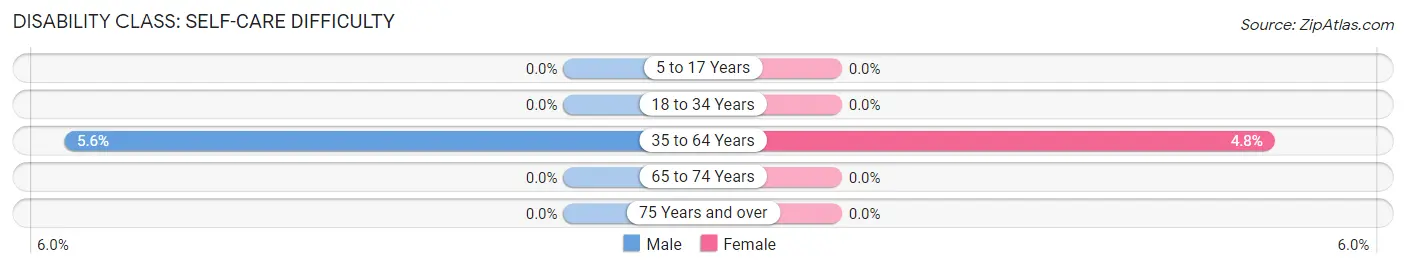
| Age Bracket | Male | Female |
| 5 to 17 Years | 0 (0.0%) | 0 (0.0%) |
| 18 to 34 Years | 0 (0.0%) | 0 (0.0%) |
| 35 to 64 Years | 12 (5.6%) | 11 (4.8%) |
| 65 to 74 Years | 0 (0.0%) | 0 (0.0%) |
| 75 Years and over | 0 (0.0%) | 0 (0.0%) |
Technology Access in Heritage Creek
Computing Device Access in Heritage Creek
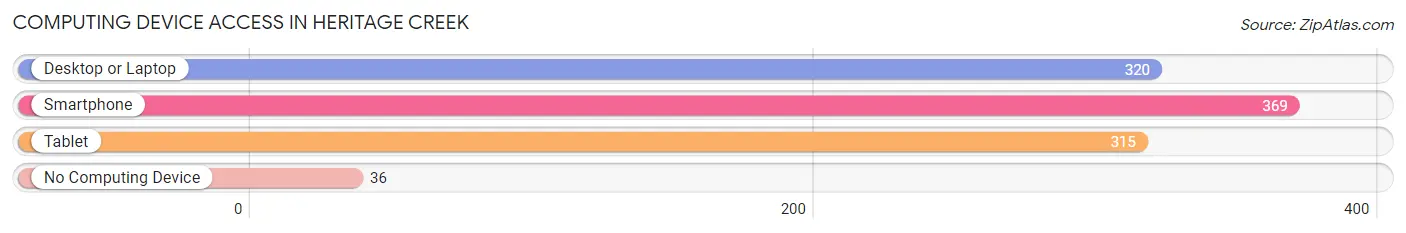
| Device Type | # Households | % Households |
| Desktop or Laptop | 320 | 73.2% |
| Smartphone | 369 | 84.4% |
| Tablet | 315 | 72.1% |
| No Computing Device | 36 | 8.2% |
| Total | 437 | 100.0% |
Internet Access in Heritage Creek
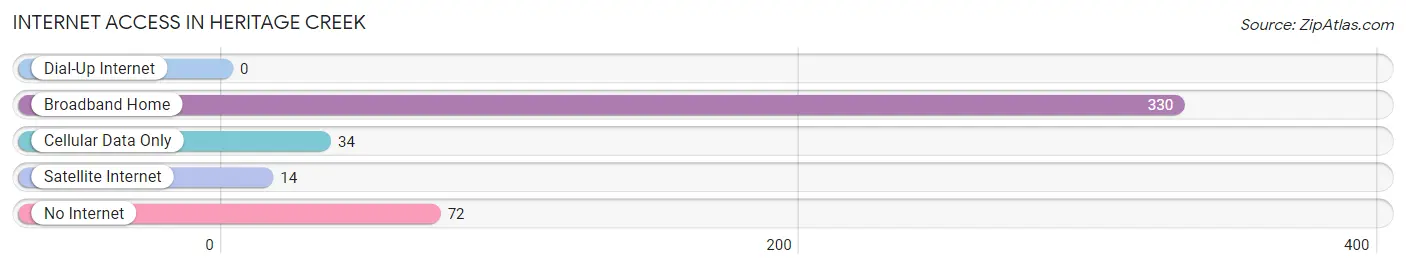
| Internet Type | # Households | % Households |
| Dial-Up Internet | 0 | 0.0% |
| Broadband Home | 330 | 75.5% |
| Cellular Data Only | 34 | 7.8% |
| Satellite Internet | 14 | 3.2% |
| No Internet | 72 | 16.5% |
| Total | 437 | 100.0% |
Heritage Creek Summary
Heritage Creek is a small unincorporated community located in the state of Kentucky, in the United States of America. It is situated in the western part of the state, in the county of Warren. The community is located along the banks of the Green River, and is home to a population of approximately 1,000 people.
History
Heritage Creek was first settled in the early 1800s by a group of settlers from the nearby town of Bowling Green. The settlers were looking for a place to call home and found the area to be ideal for farming and raising livestock. The community was originally known as “Heritage”, but the name was changed to “Heritage Creek” in the late 1800s.
The community was largely agricultural in nature, with the majority of the population engaged in farming and raising livestock. The area was also known for its timber industry, with the Green River providing an abundance of timber for the local economy.
In the early 1900s, the community began to experience a period of growth and development. The railroad was extended to the area, providing a means of transportation for goods and people. The community also saw the construction of a number of businesses, including a general store, a post office, and a bank.
Geography
Heritage Creek is located in the western part of the state of Kentucky, in the county of Warren. The community is situated along the banks of the Green River, and is surrounded by rolling hills and forests. The area is known for its scenic beauty, and is home to a variety of wildlife, including deer, turkey, and other small game.
The climate in Heritage Creek is generally mild, with temperatures ranging from the mid-50s in the winter to the mid-80s in the summer. The area receives an average of 45 inches of precipitation per year, with most of it falling in the form of rain.
Economy
The economy of Heritage Creek is largely based on agriculture and timber. The area is home to a number of farms, which produce a variety of crops, including corn, soybeans, and wheat. The timber industry is also an important part of the local economy, with the Green River providing an abundance of timber for the local mills.
In addition to agriculture and timber, the community is also home to a number of small businesses, including a general store, a post office, and a bank. The area is also home to a number of recreational activities, including fishing, hunting, and camping.
Demographics
As of the 2010 census, the population of Heritage Creek was 1,000 people. The racial makeup of the community was 97.2% White, 0.7% African American, 0.3% Native American, 0.2% Asian, and 1.6% from other races. The median household income was $37,500, and the median age was 38.7 years.
Conclusion
Heritage Creek is a small unincorporated community located in the western part of the state of Kentucky. The community is situated along the banks of the Green River, and is home to a population of approximately 1,000 people. The economy of Heritage Creek is largely based on agriculture and timber, and the area is also home to a number of small businesses. The racial makeup of the community is predominantly White, with a median household income of $37,500 and a median age of 38.7 years.
Common Questions
What is Per Capita Income in Heritage Creek?
Per Capita income in Heritage Creek is $34,262.
What is the Median Family Income in Heritage Creek?
Median Family Income in Heritage Creek is $88,750.
What is the Median Household income in Heritage Creek?
Median Household Income in Heritage Creek is $85,469.
What is Income or Wage Gap in Heritage Creek?
Income or Wage Gap in Heritage Creek is 19.6%.
Women in Heritage Creek earn 80.4 cents for every dollar earned by a man.
What is Family Income Deficit in Heritage Creek?
Family Income Deficit in Heritage Creek is $2,469.
Families that are below poverty line in Heritage Creek earn $2,469 less on average than the poverty threshold level.
What is Inequality or Gini Index in Heritage Creek?
Inequality or Gini Index in Heritage Creek is 0.33.
What is the Total Population of Heritage Creek?
Total Population of Heritage Creek is 1,109.
What is the Total Male Population of Heritage Creek?
Total Male Population of Heritage Creek is 485.
What is the Total Female Population of Heritage Creek?
Total Female Population of Heritage Creek is 624.
What is the Ratio of Males per 100 Females in Heritage Creek?
There are 77.72 Males per 100 Females in Heritage Creek.
What is the Ratio of Females per 100 Males in Heritage Creek?
There are 128.66 Females per 100 Males in Heritage Creek.
What is the Median Population Age in Heritage Creek?
Median Population Age in Heritage Creek is 45.4 Years.
What is the Average Family Size in Heritage Creek
Average Family Size in Heritage Creek is 3.0 People.
What is the Average Household Size in Heritage Creek
Average Household Size in Heritage Creek is 2.5 People.
How Large is the Labor Force in Heritage Creek?
There are 585 People in the Labor Forcein in Heritage Creek.
What is the Percentage of People in the Labor Force in Heritage Creek?
64.4% of People are in the Labor Force in Heritage Creek.
What is the Unemployment Rate in Heritage Creek?
Unemployment Rate in Heritage Creek is 2.4%.