Crestview Hills, KY Map & Demographics
Crestview Hills Map

Crestview Hills Overview
$46,457
PER CAPITA INCOME
$118,816
AVG FAMILY INCOME
$107,857
AVG HOUSEHOLD INCOME
14.8%
WAGE / INCOME GAP [ % ]
85.2¢/ $1
WAGE / INCOME GAP [ $ ]
0.41
INEQUALITY / GINI INDEX
3,212
TOTAL POPULATION
1,741
MALE POPULATION
1,471
FEMALE POPULATION
118.35
MALES / 100 FEMALES
84.49
FEMALES / 100 MALES
39.2
MEDIAN AGE
2.9
AVG FAMILY SIZE
2.4
AVG HOUSEHOLD SIZE
1,877
LABOR FORCE [ PEOPLE ]
66.2%
PERCENT IN LABOR FORCE
5.4%
UNEMPLOYMENT RATE
Crestview Hills Area Codes
Income in Crestview Hills
Income Overview in Crestview Hills
Per Capita Income in Crestview Hills is $46,457, while median incomes of families and households are $118,816 and $107,857 respectively.
| Characteristic | Number | Measure |
| Per Capita Income | 3,212 | $46,457 |
| Median Family Income | 786 | $118,816 |
| Mean Family Income | 786 | $138,728 |
| Median Household Income | 1,204 | $107,857 |
| Mean Household Income | 1,204 | $119,922 |
| Income Deficit | 786 | $0 |
| Wage / Income Gap (%) | 3,212 | 14.78% |
| Wage / Income Gap ($) | 3,212 | 85.22¢ per $1 |
| Gini / Inequality Index | 3,212 | 0.41 |
Earnings by Sex in Crestview Hills
Average Earnings in Crestview Hills are $42,409, $47,835 for men and $40,765 for women, a difference of 14.8%.
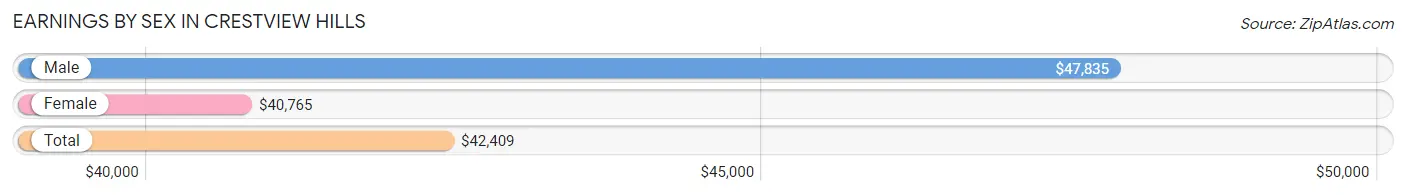
| Sex | Number | Average Earnings |
| Male | 1,049 (53.6%) | $47,835 |
| Female | 909 (46.4%) | $40,765 |
| Total | 1,958 (100.0%) | $42,409 |
Earnings by Sex by Income Bracket in Crestview Hills
The most common earnings brackets in Crestview Hills are $100,000+ for men (285 | 27.2%) and $100,000+ for women (194 | 21.3%).
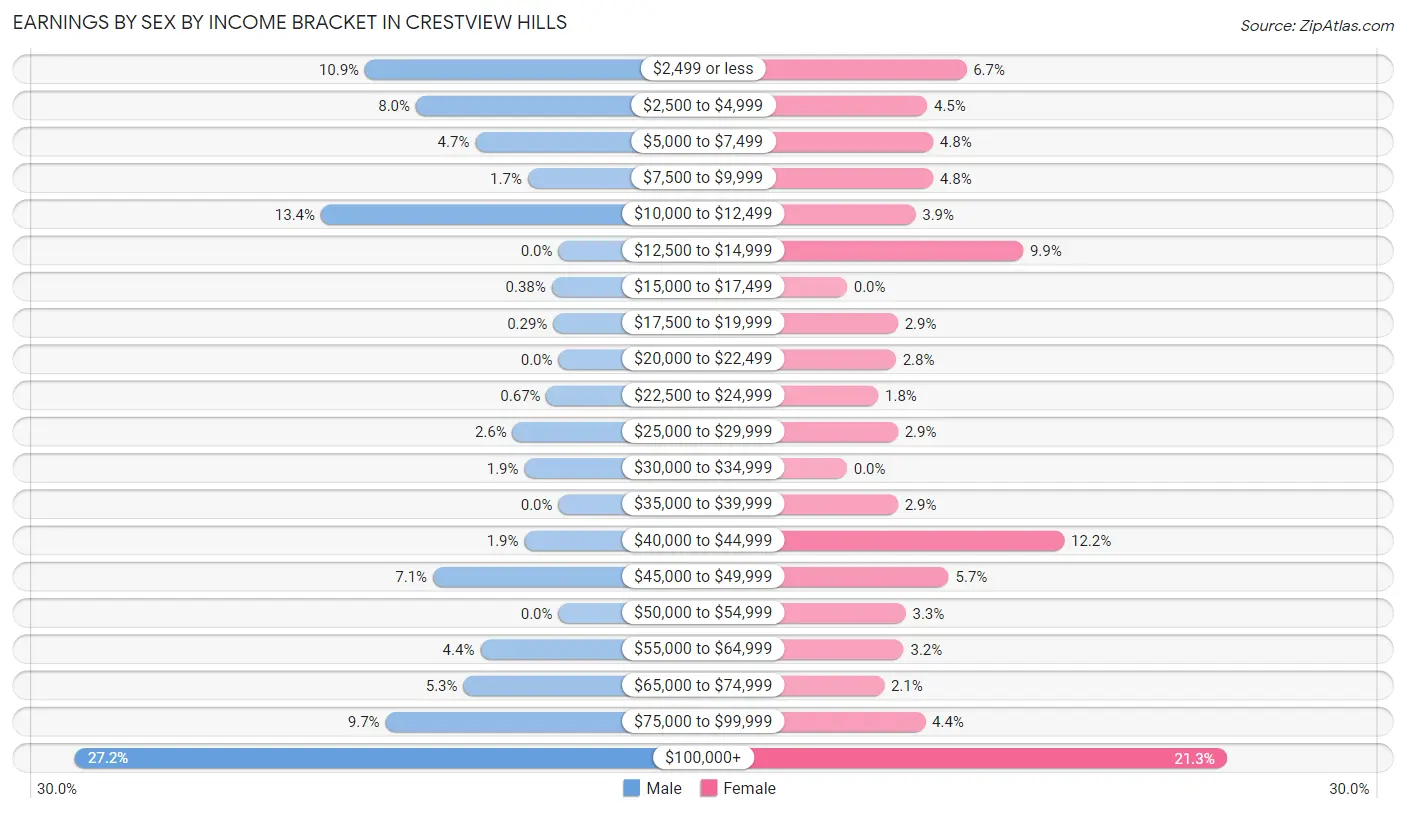
| Income | Male | Female |
| $2,499 or less | 114 (10.9%) | 61 (6.7%) |
| $2,500 to $4,999 | 84 (8.0%) | 41 (4.5%) |
| $5,000 to $7,499 | 49 (4.7%) | 44 (4.8%) |
| $7,500 to $9,999 | 18 (1.7%) | 44 (4.8%) |
| $10,000 to $12,499 | 140 (13.4%) | 35 (3.8%) |
| $12,500 to $14,999 | 0 (0.0%) | 90 (9.9%) |
| $15,000 to $17,499 | 4 (0.4%) | 0 (0.0%) |
| $17,500 to $19,999 | 3 (0.3%) | 26 (2.9%) |
| $20,000 to $22,499 | 0 (0.0%) | 25 (2.8%) |
| $22,500 to $24,999 | 7 (0.7%) | 16 (1.8%) |
| $25,000 to $29,999 | 27 (2.6%) | 26 (2.9%) |
| $30,000 to $34,999 | 20 (1.9%) | 0 (0.0%) |
| $35,000 to $39,999 | 0 (0.0%) | 26 (2.9%) |
| $40,000 to $44,999 | 20 (1.9%) | 111 (12.2%) |
| $45,000 to $49,999 | 74 (7.0%) | 52 (5.7%) |
| $50,000 to $54,999 | 0 (0.0%) | 30 (3.3%) |
| $55,000 to $64,999 | 46 (4.4%) | 29 (3.2%) |
| $65,000 to $74,999 | 56 (5.3%) | 19 (2.1%) |
| $75,000 to $99,999 | 102 (9.7%) | 40 (4.4%) |
| $100,000+ | 285 (27.2%) | 194 (21.3%) |
| Total | 1,049 (100.0%) | 909 (100.0%) |
Earnings by Sex by Educational Attainment in Crestview Hills
Average earnings in Crestview Hills are $83,167 for men and $48,029 for women, a difference of 42.2%. Men with an educational attainment of graduate degree enjoy the highest average annual earnings of $130,966, while those with high school diploma education earn the least with $47,703. Women with an educational attainment of graduate degree earn the most with the average annual earnings of $63,580, while those with high school diploma education have the smallest earnings of $41,618.
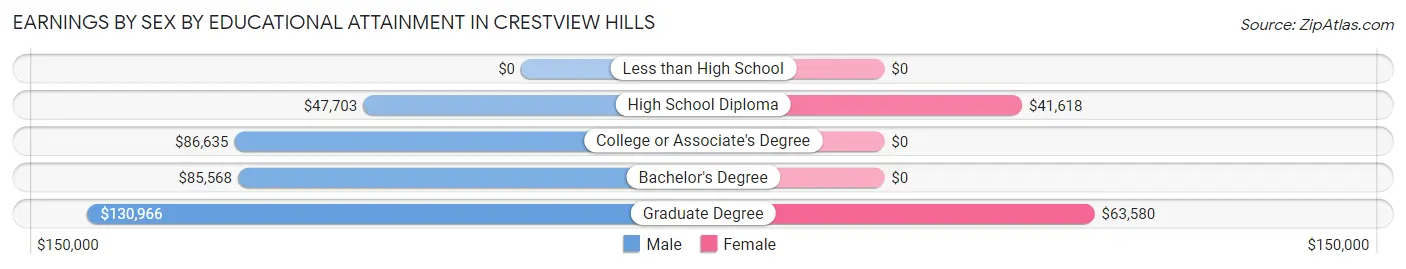
| Educational Attainment | Male Income | Female Income |
| Less than High School | - | - |
| High School Diploma | $47,703 | $41,618 |
| College or Associate's Degree | $86,635 | $0 |
| Bachelor's Degree | $85,568 | $0 |
| Graduate Degree | $130,966 | $63,580 |
| Total | $83,167 | $48,029 |
Family Income in Crestview Hills
Family Income Brackets in Crestview Hills
According to the Crestview Hills family income data, there are 167 families falling into the $100,000 to $149,999 income range, which is the most common income bracket and makes up 21.2% of all families.
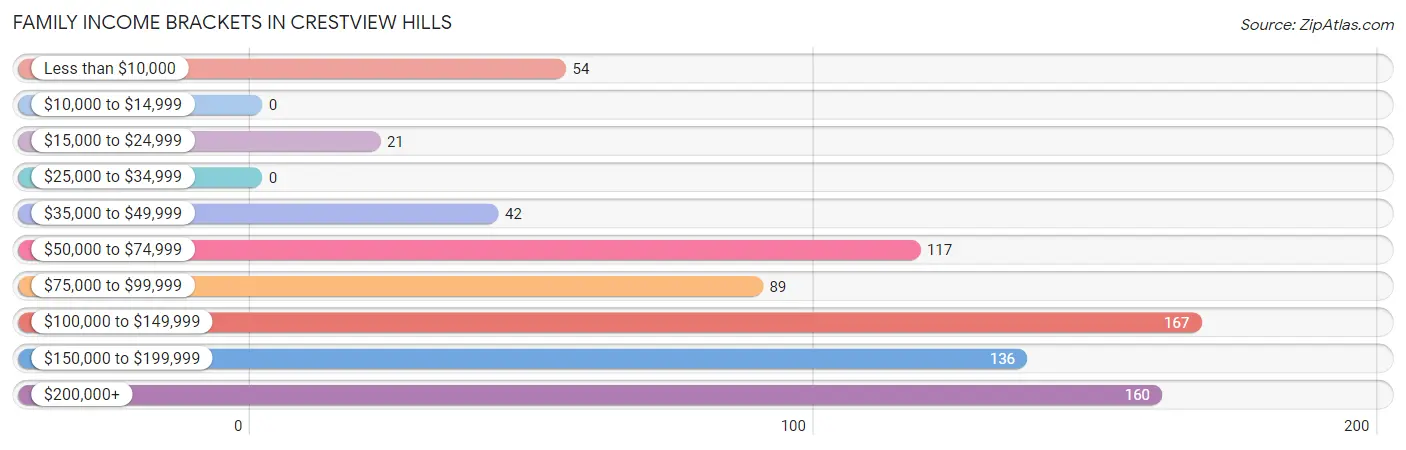
| Income Bracket | # Families | % Families |
| Less than $10,000 | 54 | 6.9% |
| $10,000 to $14,999 | 0 | 0.0% |
| $15,000 to $24,999 | 21 | 2.7% |
| $25,000 to $34,999 | 0 | 0.0% |
| $35,000 to $49,999 | 42 | 5.3% |
| $50,000 to $74,999 | 117 | 14.9% |
| $75,000 to $99,999 | 89 | 11.3% |
| $100,000 to $149,999 | 167 | 21.2% |
| $150,000 to $199,999 | 136 | 17.3% |
| $200,000+ | 160 | 20.4% |
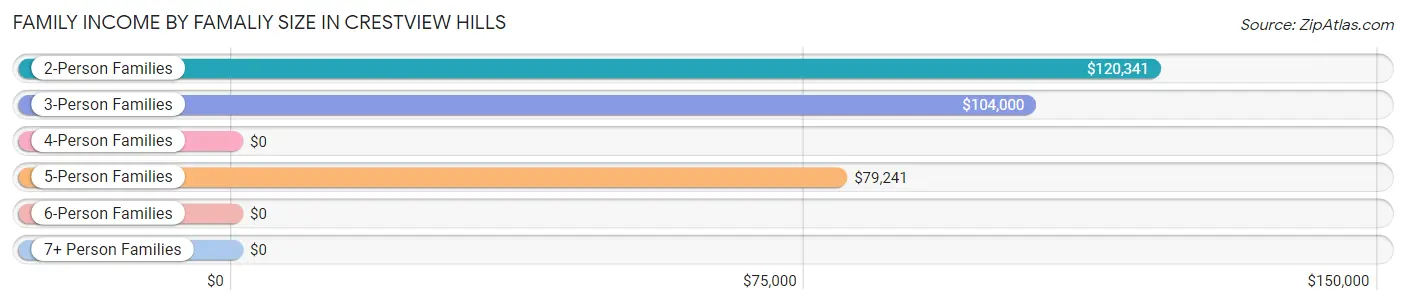
Family Income by Famaliy Size in Crestview Hills
2-person families (360 | 45.8%) account for the highest median family income in Crestview Hills with $120,341 per family, while 2-person families (360 | 45.8%) have the highest median income of $60,170 per family member.
| Income Bracket | # Families | Median Income |
| 2-Person Families | 360 (45.8%) | $120,341 |
| 3-Person Families | 214 (27.2%) | $104,000 |
| 4-Person Families | 173 (22.0%) | $0 |
| 5-Person Families | 39 (5.0%) | $79,241 |
| 6-Person Families | 0 (0.0%) | $0 |
| 7+ Person Families | 0 (0.0%) | $0 |
| Total | 786 (100.0%) | $118,816 |
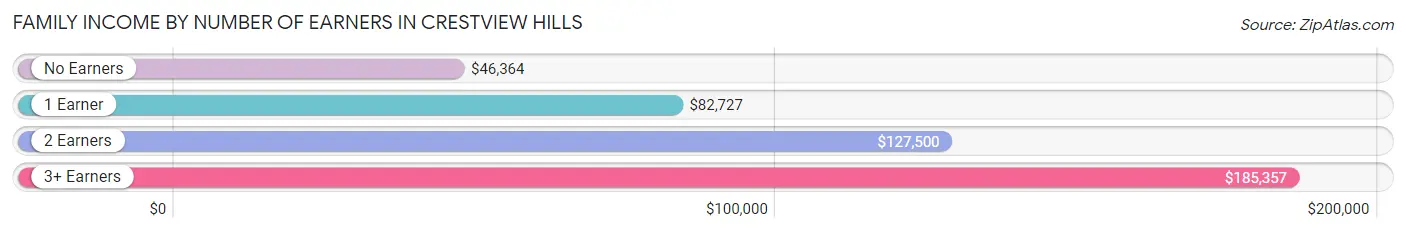
Family Income by Number of Earners in Crestview Hills
The median family income in Crestview Hills is $118,816, with families comprising 3+ earners (170) having the highest median family income of $185,357, while families with no earners (198) have the lowest median family income of $46,364, accounting for 21.6% and 25.2% of families, respectively.
| Number of Earners | # Families | Median Income |
| No Earners | 198 (25.2%) | $46,364 |
| 1 Earner | 100 (12.7%) | $82,727 |
| 2 Earners | 318 (40.5%) | $127,500 |
| 3+ Earners | 170 (21.6%) | $185,357 |
| Total | 786 (100.0%) | $118,816 |
Household Income in Crestview Hills
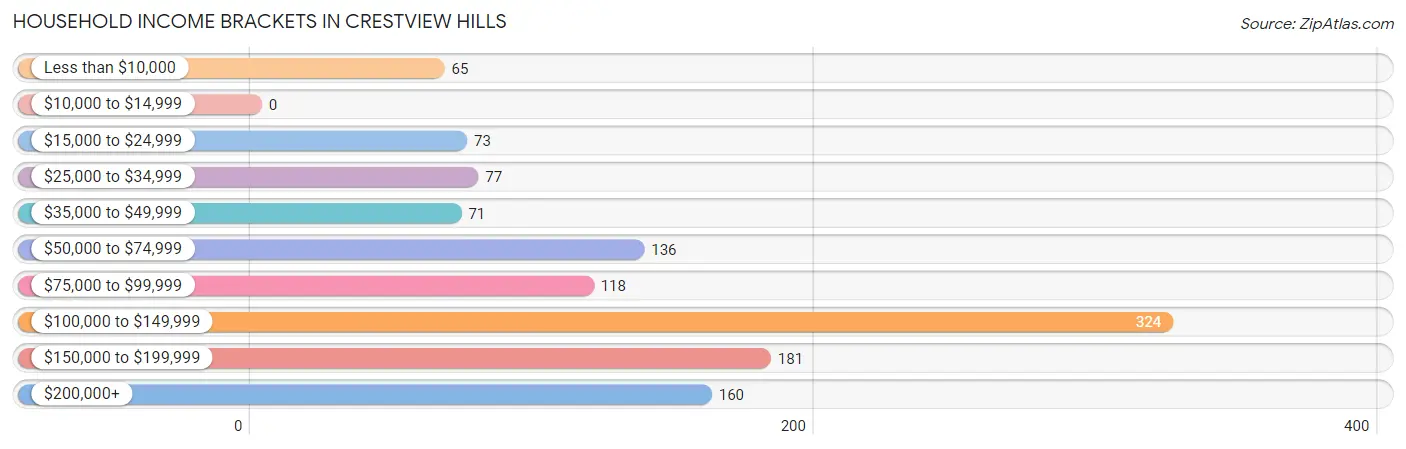
Household Income Brackets in Crestview Hills
With 324 households falling in the category, the $100,000 to $149,999 income range is the most frequent in Crestview Hills, accounting for 26.9% of all households.
| Income Bracket | # Households | % Households |
| Less than $10,000 | 65 | 5.4% |
| $10,000 to $14,999 | 0 | 0.0% |
| $15,000 to $24,999 | 73 | 6.1% |
| $25,000 to $34,999 | 77 | 6.4% |
| $35,000 to $49,999 | 71 | 5.9% |
| $50,000 to $74,999 | 136 | 11.3% |
| $75,000 to $99,999 | 118 | 9.8% |
| $100,000 to $149,999 | 324 | 26.9% |
| $150,000 to $199,999 | 181 | 15.0% |
| $200,000+ | 160 | 13.3% |
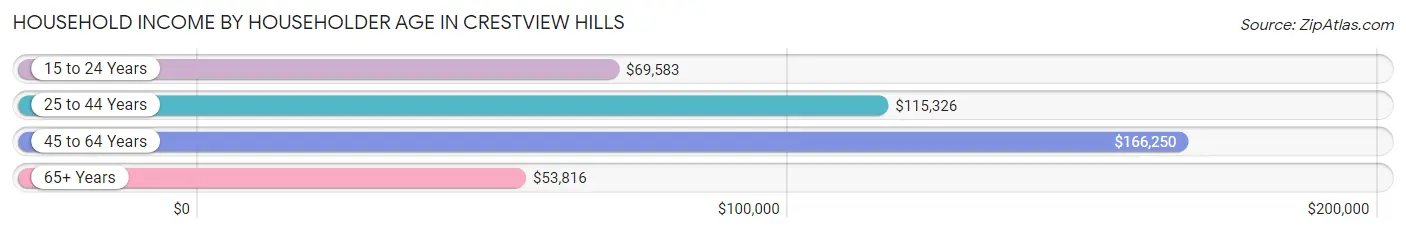
Household Income by Householder Age in Crestview Hills
The median household income in Crestview Hills is $107,857, with the highest median household income of $166,250 found in the 45 to 64 years age bracket for the primary householder. A total of 410 households (34.1%) fall into this category. Meanwhile, the 65+ years age bracket for the primary householder has the lowest median household income of $53,816, with 460 households (38.2%) in this group.
| Income Bracket | # Households | Median Income |
| 15 to 24 Years | 42 (3.5%) | $69,583 |
| 25 to 44 Years | 292 (24.2%) | $115,326 |
| 45 to 64 Years | 410 (34.1%) | $166,250 |
| 65+ Years | 460 (38.2%) | $53,816 |
| Total | 1,204 (100.0%) | $107,857 |
Poverty in Crestview Hills
Income Below Poverty by Sex and Age in Crestview Hills
With 7.9% poverty level for males and 9.7% for females among the residents of Crestview Hills, 6 to 11 year old males and 12 to 14 year old females are the most vulnerable to poverty, with 41 males (48.8%) and 57 females (100.0%) in their respective age groups living below the poverty level.
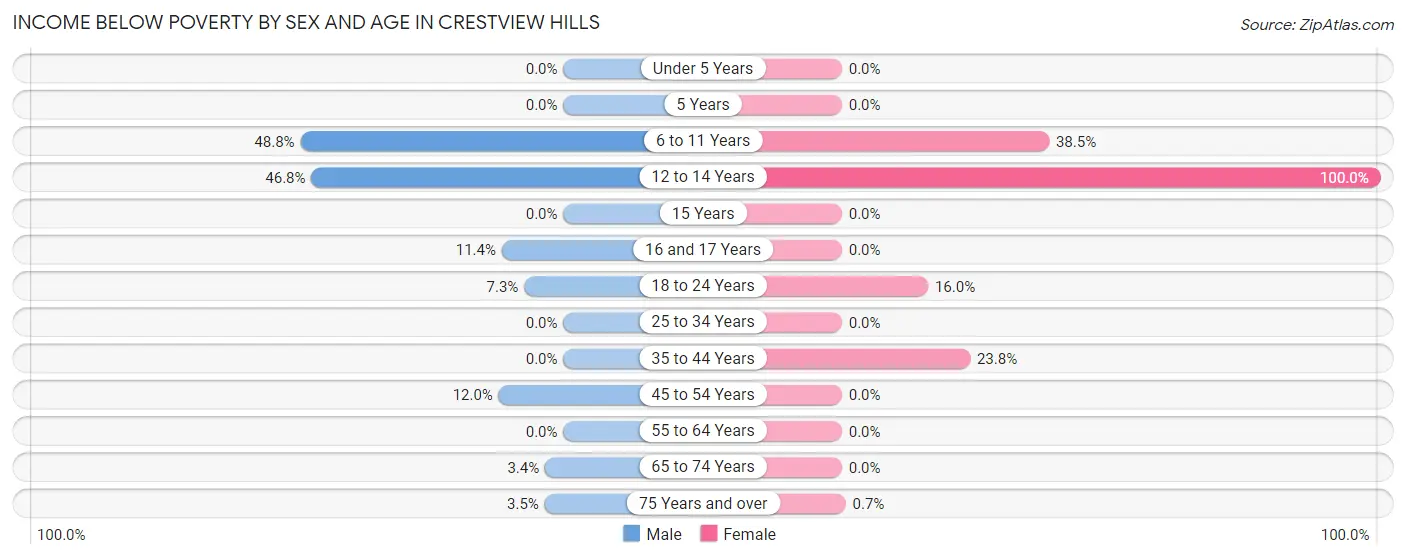
| Age Bracket | Male | Female |
| Under 5 Years | 0 (0.0%) | 0 (0.0%) |
| 5 Years | 0 (0.0%) | 0 (0.0%) |
| 6 to 11 Years | 41 (48.8%) | 5 (38.5%) |
| 12 to 14 Years | 29 (46.8%) | 57 (100.0%) |
| 15 Years | 0 (0.0%) | 0 (0.0%) |
| 16 and 17 Years | 4 (11.4%) | 0 (0.0%) |
| 18 to 24 Years | 16 (7.3%) | 12 (16.0%) |
| 25 to 34 Years | 0 (0.0%) | 0 (0.0%) |
| 35 to 44 Years | 0 (0.0%) | 54 (23.8%) |
| 45 to 54 Years | 21 (12.0%) | 0 (0.0%) |
| 55 to 64 Years | 0 (0.0%) | 0 (0.0%) |
| 65 to 74 Years | 5 (3.4%) | 0 (0.0%) |
| 75 Years and over | 5 (3.5%) | 1 (0.7%) |
| Total | 121 (7.9%) | 129 (9.7%) |
Income Above Poverty by Sex and Age in Crestview Hills
According to the poverty statistics in Crestview Hills, males aged under 5 years and females aged under 5 years are the age groups that are most secure financially, with 100.0% of males and 100.0% of females in these age groups living above the poverty line.
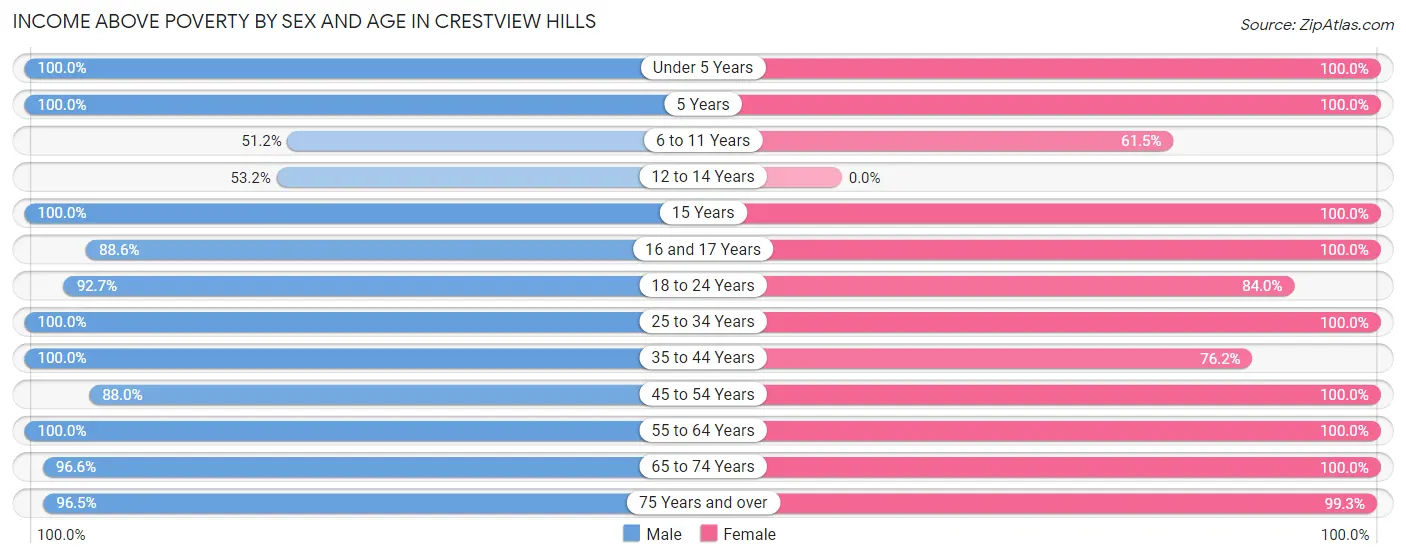
| Age Bracket | Male | Female |
| Under 5 Years | 109 (100.0%) | 35 (100.0%) |
| 5 Years | 4 (100.0%) | 5 (100.0%) |
| 6 to 11 Years | 43 (51.2%) | 8 (61.5%) |
| 12 to 14 Years | 33 (53.2%) | 0 (0.0%) |
| 15 Years | 4 (100.0%) | 4 (100.0%) |
| 16 and 17 Years | 31 (88.6%) | 56 (100.0%) |
| 18 to 24 Years | 204 (92.7%) | 63 (84.0%) |
| 25 to 34 Years | 143 (100.0%) | 92 (100.0%) |
| 35 to 44 Years | 194 (100.0%) | 173 (76.2%) |
| 45 to 54 Years | 154 (88.0%) | 191 (100.0%) |
| 55 to 64 Years | 206 (100.0%) | 167 (100.0%) |
| 65 to 74 Years | 142 (96.6%) | 260 (100.0%) |
| 75 Years and over | 139 (96.5%) | 141 (99.3%) |
| Total | 1,406 (92.1%) | 1,195 (90.3%) |
Income Below Poverty Among Married-Couple Families in Crestview Hills
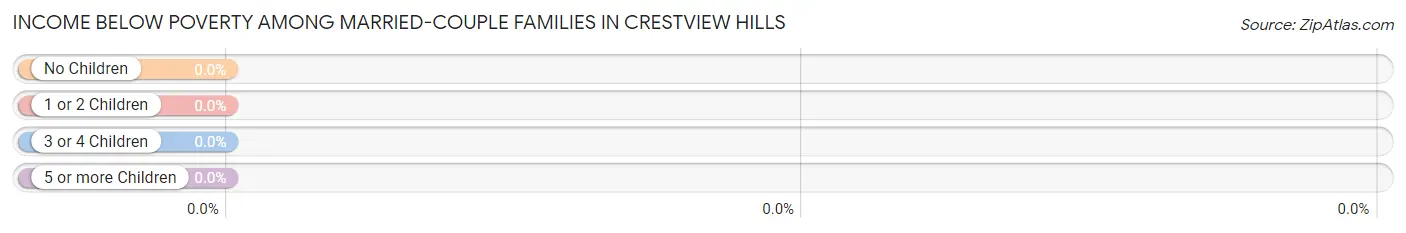
| Children | Above Poverty | Below Poverty |
| No Children | 432 (100.0%) | 0 (0.0%) |
| 1 or 2 Children | 175 (100.0%) | 0 (0.0%) |
| 3 or 4 Children | 39 (100.0%) | 0 (0.0%) |
| 5 or more Children | 0 (0.0%) | 0 (0.0%) |
| Total | 646 (100.0%) | 0 (0.0%) |
Income Below Poverty Among Single-Parent Households in Crestview Hills
According to the poverty data in Crestview Hills, 14.8% or 4 single-father households and 47.8% or 54 single-mother households are living below the poverty line. Among single-father households, those with 3 or 4 children have the highest poverty rate, with 4 households (100.0%) experiencing poverty. Likewise, among single-mother households, those with 3 or 4 children have the highest poverty rate, with 54 households (100.0%) falling below the poverty line.
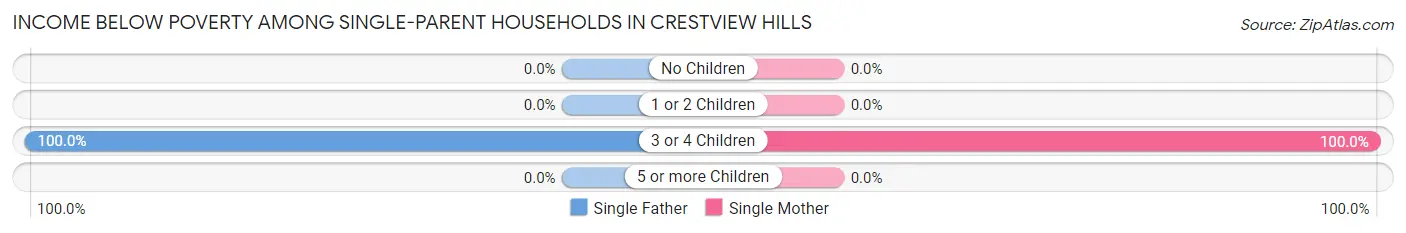
| Children | Single Father | Single Mother |
| No Children | 0 (0.0%) | 0 (0.0%) |
| 1 or 2 Children | 0 (0.0%) | 0 (0.0%) |
| 3 or 4 Children | 4 (100.0%) | 54 (100.0%) |
| 5 or more Children | 0 (0.0%) | 0 (0.0%) |
| Total | 4 (14.8%) | 54 (47.8%) |
Income Below Poverty Among Married-Couple vs Single-Parent Households in Crestview Hills
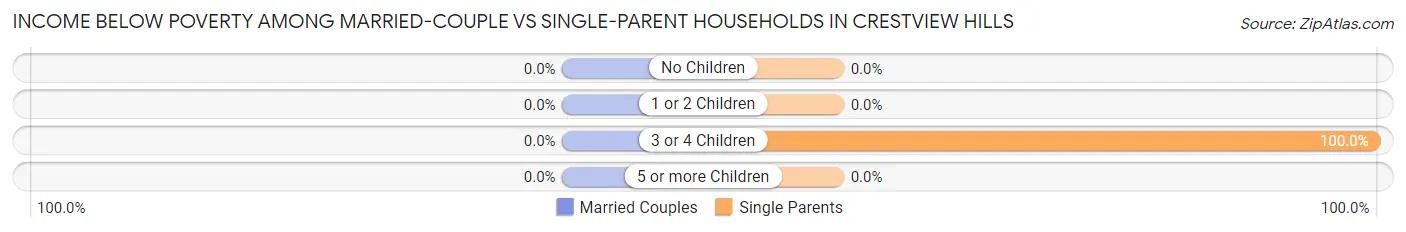
| Children | Married-Couple Families | Single-Parent Households |
| No Children | 0 (0.0%) | 0 (0.0%) |
| 1 or 2 Children | 0 (0.0%) | 0 (0.0%) |
| 3 or 4 Children | 0 (0.0%) | 58 (100.0%) |
| 5 or more Children | 0 (0.0%) | 0 (0.0%) |
| Total | 0 (0.0%) | 58 (41.4%) |
Race in Crestview Hills
The most populous races in Crestview Hills are White / Caucasian (2,915 | 90.7%), Black / African American (210 | 6.5%), and Asian (44 | 1.4%).
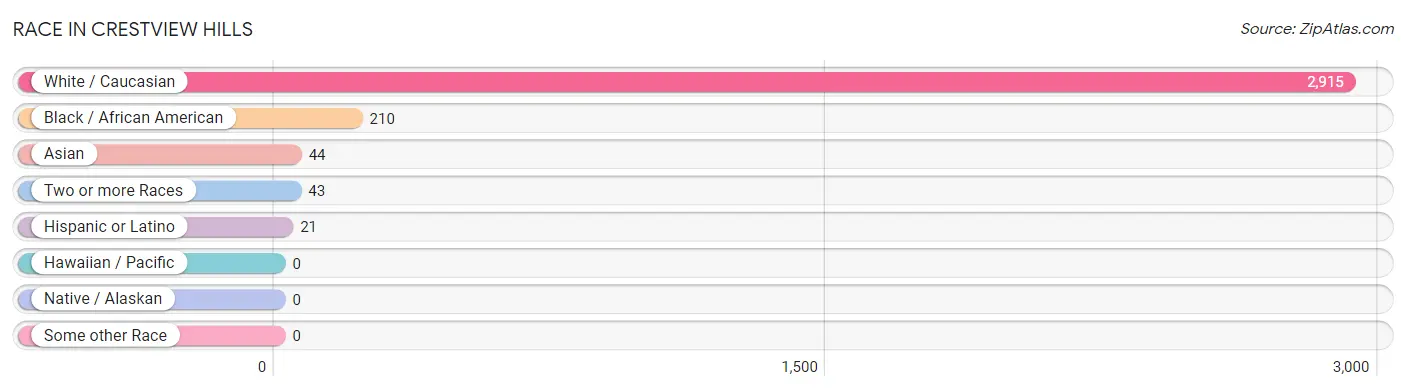
| Race | # Population | % Population |
| Asian | 44 | 1.4% |
| Black / African American | 210 | 6.5% |
| Hawaiian / Pacific | 0 | 0.0% |
| Hispanic or Latino | 21 | 0.6% |
| Native / Alaskan | 0 | 0.0% |
| White / Caucasian | 2,915 | 90.7% |
| Two or more Races | 43 | 1.3% |
| Some other Race | 0 | 0.0% |
| Total | 3,212 | 100.0% |
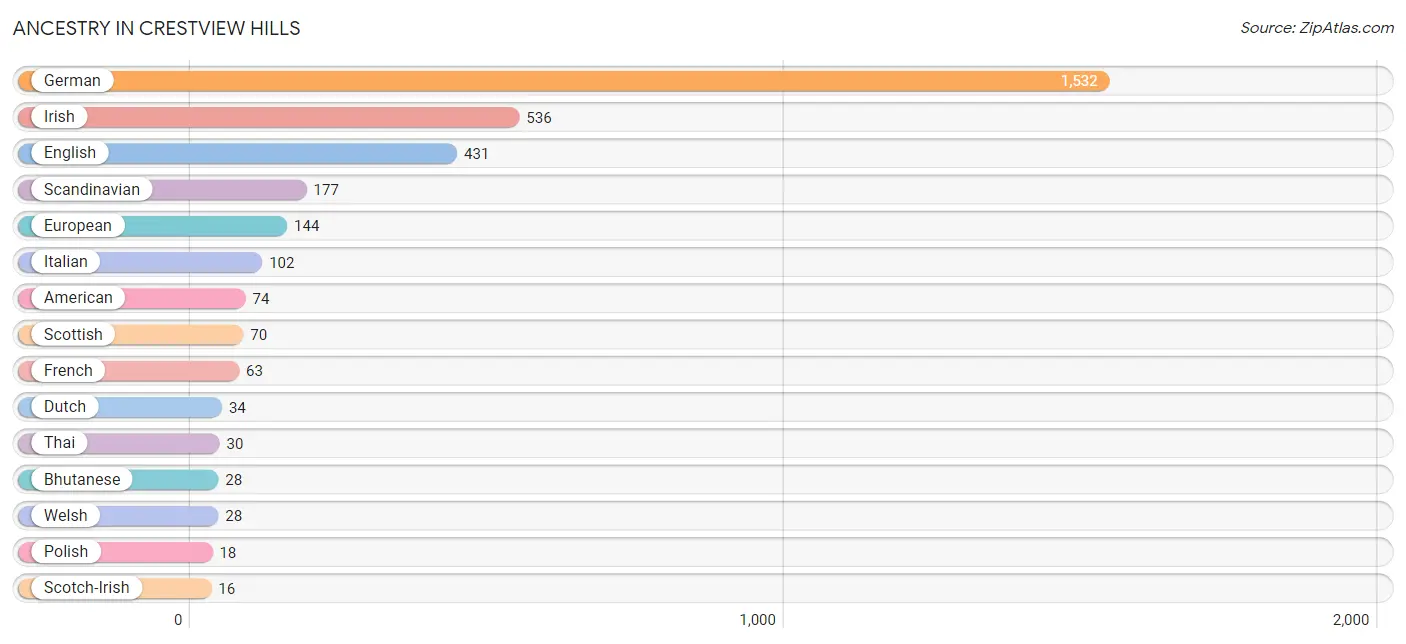
Ancestry in Crestview Hills
The most populous ancestries reported in Crestview Hills are German (1,532 | 47.7%), Irish (536 | 16.7%), English (431 | 13.4%), Scandinavian (177 | 5.5%), and European (144 | 4.5%), together accounting for 87.8% of all Crestview Hills residents.
| Ancestry | # Population | % Population |
| American | 74 | 2.3% |
| Arab | 15 | 0.5% |
| Bhutanese | 28 | 0.9% |
| British | 5 | 0.2% |
| Burmese | 9 | 0.3% |
| Cherokee | 9 | 0.3% |
| Czech | 13 | 0.4% |
| Danish | 5 | 0.2% |
| Dutch | 34 | 1.1% |
| Eastern European | 3 | 0.1% |
| English | 431 | 13.4% |
| European | 144 | 4.5% |
| French | 63 | 2.0% |
| French Canadian | 6 | 0.2% |
| German | 1,532 | 47.7% |
| Irish | 536 | 16.7% |
| Italian | 102 | 3.2% |
| Norwegian | 14 | 0.4% |
| Polish | 18 | 0.6% |
| Puerto Rican | 12 | 0.4% |
| Scandinavian | 177 | 5.5% |
| Scotch-Irish | 16 | 0.5% |
| Scottish | 70 | 2.2% |
| Swedish | 16 | 0.5% |
| Swiss | 7 | 0.2% |
| Syrian | 15 | 0.5% |
| Thai | 30 | 0.9% |
| Ukrainian | 5 | 0.2% |
| Welsh | 28 | 0.9% | View All 29 Rows |
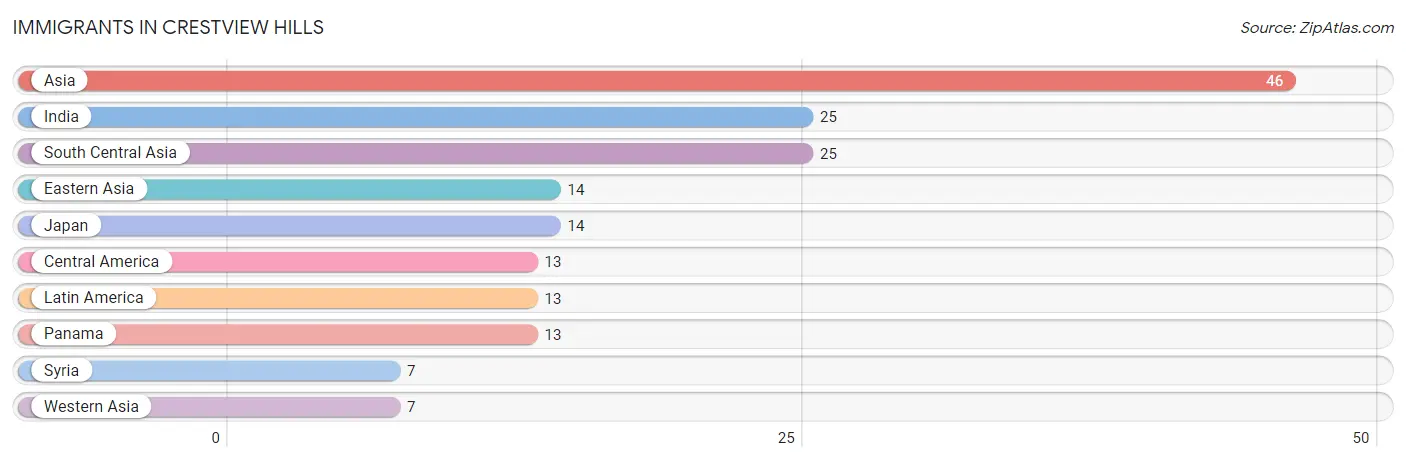
Immigrants in Crestview Hills
The most numerous immigrant groups reported in Crestview Hills came from Asia (46 | 1.4%), India (25 | 0.8%), South Central Asia (25 | 0.8%), Eastern Asia (14 | 0.4%), and Japan (14 | 0.4%), together accounting for 3.9% of all Crestview Hills residents.
| Immigration Origin | # Population | % Population |
| Asia | 46 | 1.4% |
| Central America | 13 | 0.4% |
| Eastern Asia | 14 | 0.4% |
| India | 25 | 0.8% |
| Japan | 14 | 0.4% |
| Latin America | 13 | 0.4% |
| Panama | 13 | 0.4% |
| South Central Asia | 25 | 0.8% |
| Syria | 7 | 0.2% |
| Western Asia | 7 | 0.2% | View All 10 Rows |
Sex and Age in Crestview Hills
Sex and Age in Crestview Hills
The most populous age groups in Crestview Hills are 15 to 19 Years (267 | 15.3%) for men and 35 to 39 Years (159 | 10.8%) for women.
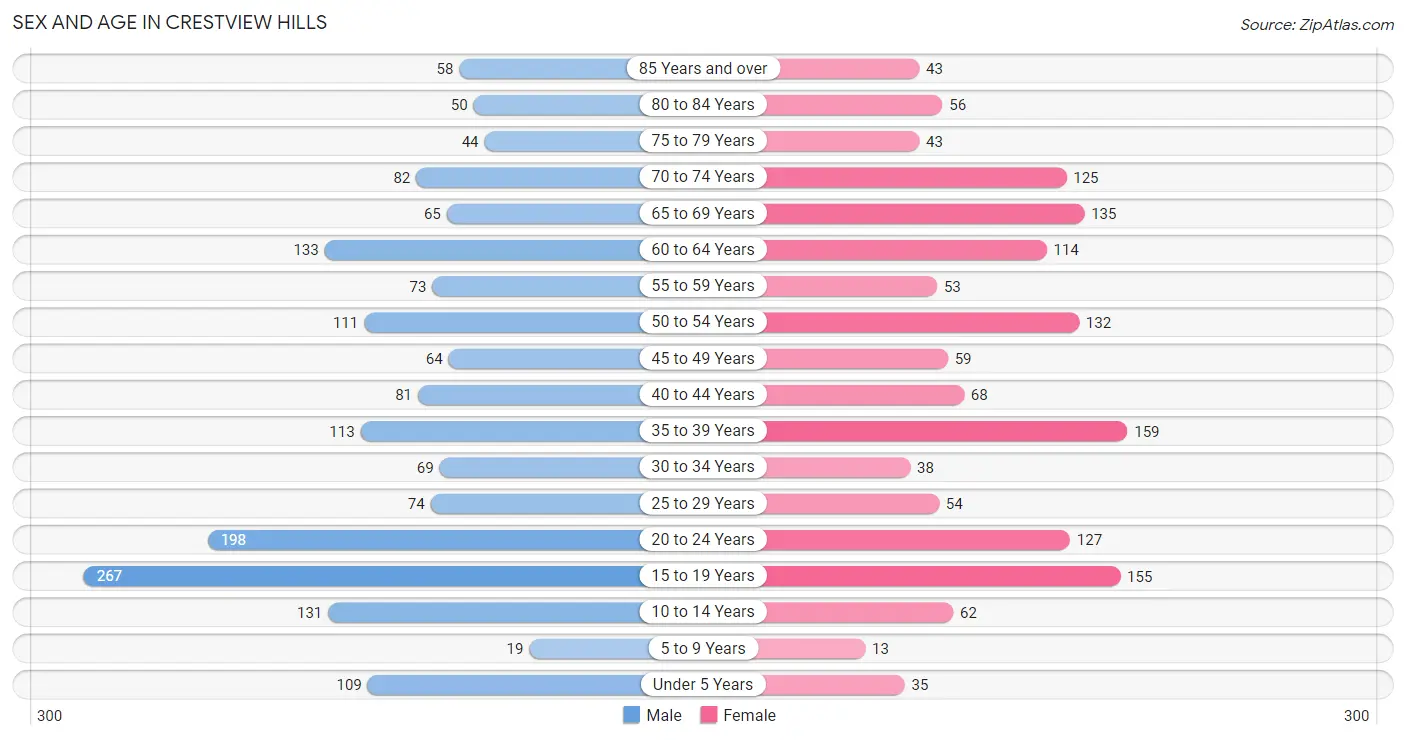
| Age Bracket | Male | Female |
| Under 5 Years | 109 (6.3%) | 35 (2.4%) |
| 5 to 9 Years | 19 (1.1%) | 13 (0.9%) |
| 10 to 14 Years | 131 (7.5%) | 62 (4.2%) |
| 15 to 19 Years | 267 (15.3%) | 155 (10.5%) |
| 20 to 24 Years | 198 (11.4%) | 127 (8.6%) |
| 25 to 29 Years | 74 (4.3%) | 54 (3.7%) |
| 30 to 34 Years | 69 (4.0%) | 38 (2.6%) |
| 35 to 39 Years | 113 (6.5%) | 159 (10.8%) |
| 40 to 44 Years | 81 (4.6%) | 68 (4.6%) |
| 45 to 49 Years | 64 (3.7%) | 59 (4.0%) |
| 50 to 54 Years | 111 (6.4%) | 132 (9.0%) |
| 55 to 59 Years | 73 (4.2%) | 53 (3.6%) |
| 60 to 64 Years | 133 (7.6%) | 114 (7.7%) |
| 65 to 69 Years | 65 (3.7%) | 135 (9.2%) |
| 70 to 74 Years | 82 (4.7%) | 125 (8.5%) |
| 75 to 79 Years | 44 (2.5%) | 43 (2.9%) |
| 80 to 84 Years | 50 (2.9%) | 56 (3.8%) |
| 85 Years and over | 58 (3.3%) | 43 (2.9%) |
| Total | 1,741 (100.0%) | 1,471 (100.0%) |
Families and Households in Crestview Hills
Median Family Size in Crestview Hills
The median family size in Crestview Hills is 2.92 persons per family, with single female/mother families (113 | 14.4%) accounting for the largest median family size of 3.34 persons per family. On the other hand, married-couple families (646 | 82.2%) represent the smallest median family size with 2.84 persons per family.
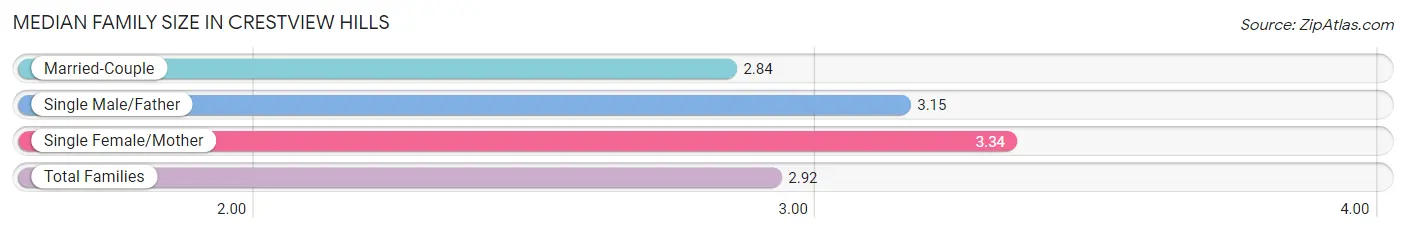
| Family Type | # Families | Family Size |
| Married-Couple | 646 (82.2%) | 2.84 |
| Single Male/Father | 27 (3.4%) | 3.15 |
| Single Female/Mother | 113 (14.4%) | 3.34 |
| Total Families | 786 (100.0%) | 2.92 |
Median Household Size in Crestview Hills
The median household size in Crestview Hills is 2.35 persons per household, with single female/mother households (113 | 9.4%) accounting for the largest median household size of 3.63 persons per household. non-family households (418 | 34.7%) represent the smallest median household size with 1.18 persons per household.
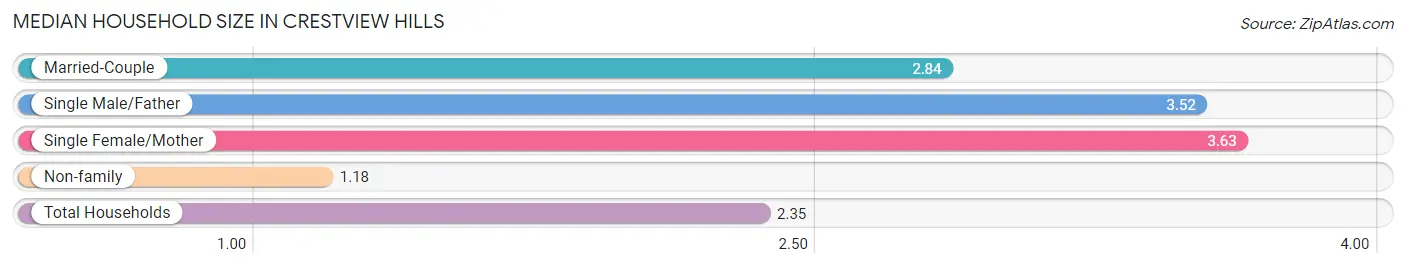
| Household Type | # Households | Household Size |
| Married-Couple | 646 (53.6%) | 2.84 |
| Single Male/Father | 27 (2.2%) | 3.52 |
| Single Female/Mother | 113 (9.4%) | 3.63 |
| Non-family | 418 (34.7%) | 1.18 |
| Total Households | 1,204 (100.0%) | 2.35 |
Household Size by Marriage Status in Crestview Hills
Out of a total of 1,204 households in Crestview Hills, 786 (65.3%) are family households, while 418 (34.7%) are nonfamily households. The most numerous type of family households are 2-person households, comprising 355, and the most common type of nonfamily households are 1-person households, comprising 376.
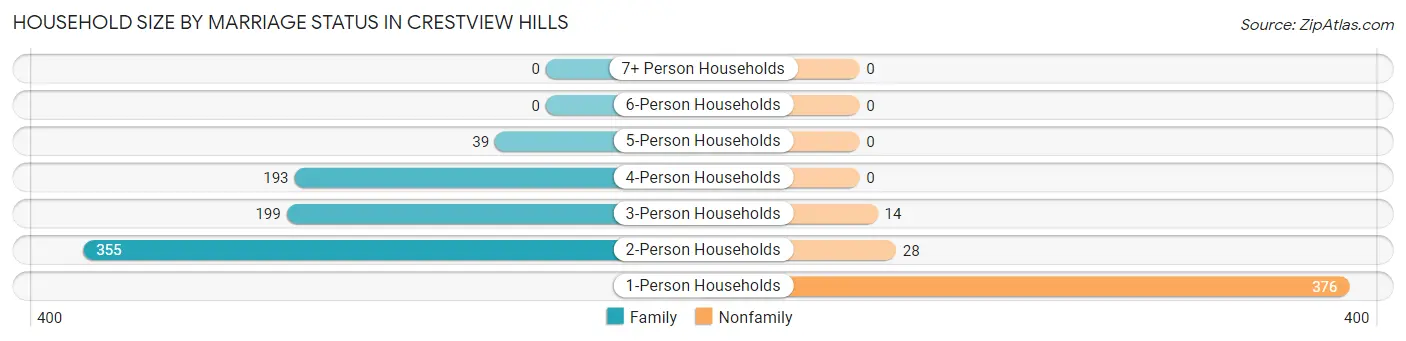
| Household Size | Family Households | Nonfamily Households |
| 1-Person Households | - | 376 (31.2%) |
| 2-Person Households | 355 (29.5%) | 28 (2.3%) |
| 3-Person Households | 199 (16.5%) | 14 (1.2%) |
| 4-Person Households | 193 (16.0%) | 0 (0.0%) |
| 5-Person Households | 39 (3.2%) | 0 (0.0%) |
| 6-Person Households | 0 (0.0%) | 0 (0.0%) |
| 7+ Person Households | 0 (0.0%) | 0 (0.0%) |
| Total | 786 (65.3%) | 418 (34.7%) |
Female Fertility in Crestview Hills
Fertility by Age in Crestview Hills
Average fertility rate in Crestview Hills is 74.0 births per 1,000 women. Women in the age bracket of 20 to 34 years have the highest fertility rate with 96.0 births per 1,000 women. Women in the age bracket of 35 to 50 years acount for 57.1% of all women with births.
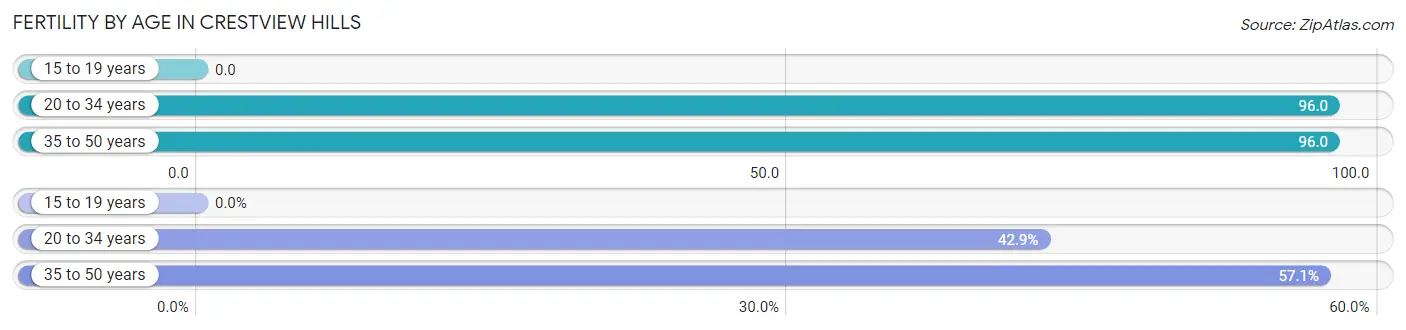
| Age Bracket | Women with Births | Births / 1,000 Women |
| 15 to 19 years | 0 (0.0%) | 0.0 |
| 20 to 34 years | 21 (42.9%) | 96.0 |
| 35 to 50 years | 28 (57.1%) | 96.0 |
| Total | 49 (100.0%) | 74.0 |
Fertility by Age by Marriage Status in Crestview Hills
91.8% of women with births (49) in Crestview Hills are married. The highest percentage of unmarried women with births falls into 20 to 34 years age bracket with 19.1% of them unmarried at the time of birth, while the lowest percentage of unmarried women with births belong to 35 to 50 years age bracket with 0.0% of them unmarried.
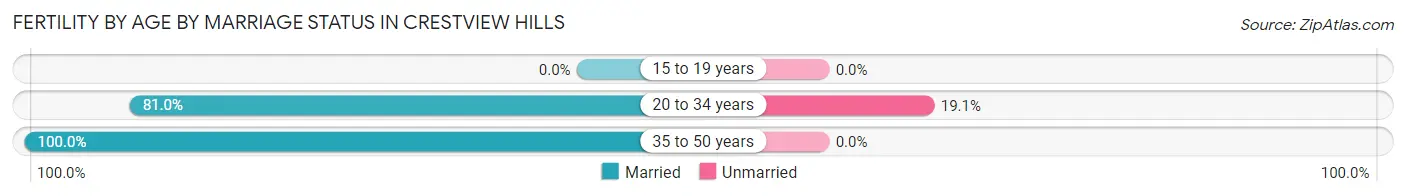
| Age Bracket | Married | Unmarried |
| 15 to 19 years | 0 (0.0%) | 0 (0.0%) |
| 20 to 34 years | 17 (80.9%) | 4 (19.1%) |
| 35 to 50 years | 28 (100.0%) | 0 (0.0%) |
| Total | 45 (91.8%) | 4 (8.2%) |
Fertility by Education in Crestview Hills
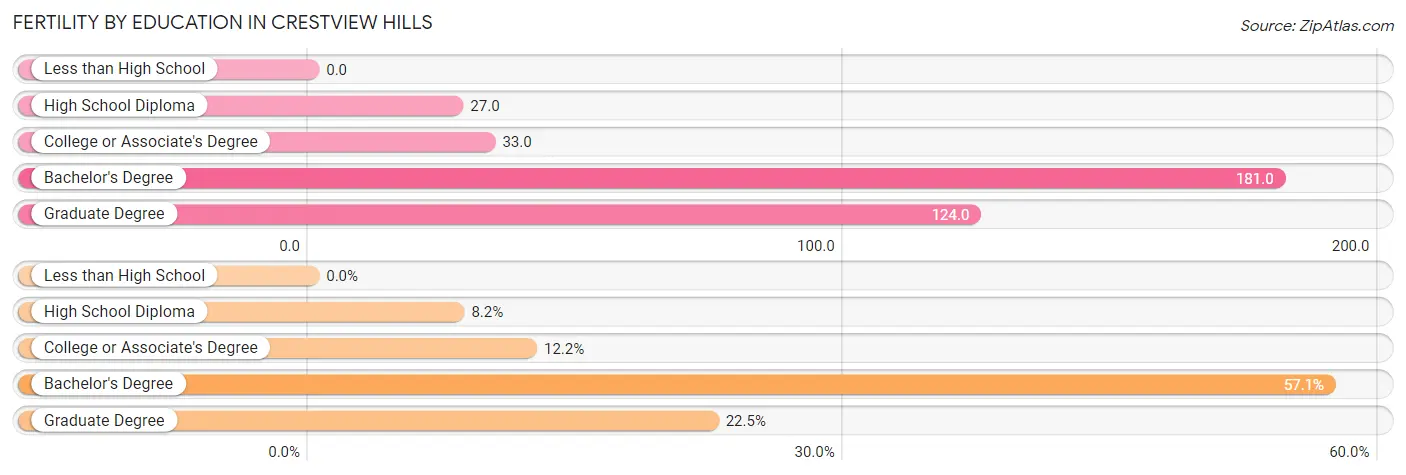
| Educational Attainment | Women with Births | Births / 1,000 Women |
| Less than High School | 0 (0.0%) | 0.0 |
| High School Diploma | 4 (8.2%) | 27.0 |
| College or Associate's Degree | 6 (12.2%) | 33.0 |
| Bachelor's Degree | 28 (57.1%) | 181.0 |
| Graduate Degree | 11 (22.5%) | 124.0 |
| Total | 49 (100.0%) | 74.0 |
Fertility by Education by Marriage Status in Crestview Hills
8.2% of women with births in Crestview Hills are unmarried. Women with the educational attainment of college or associate's degree are most likely to be married with 100.0% of them married at childbirth, while women with the educational attainment of high school diploma are least likely to be married with 100.0% of them unmarried at childbirth.
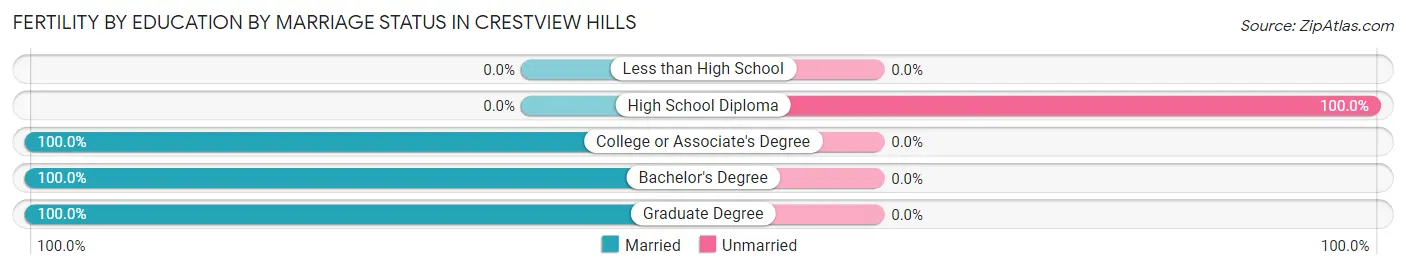
| Educational Attainment | Married | Unmarried |
| Less than High School | 0 (0.0%) | 0 (0.0%) |
| High School Diploma | 0 (0.0%) | 4 (100.0%) |
| College or Associate's Degree | 6 (100.0%) | 0 (0.0%) |
| Bachelor's Degree | 28 (100.0%) | 0 (0.0%) |
| Graduate Degree | 11 (100.0%) | 0 (0.0%) |
| Total | 45 (91.8%) | 4 (8.2%) |
Employment Characteristics in Crestview Hills
Employment by Class of Employer in Crestview Hills
Among the 1,751 employed individuals in Crestview Hills, private company employees (1,408 | 80.4%), not-for-profit organizations (172 | 9.8%), and self-employed (incorporated) (72 | 4.1%) make up the most common classes of employment.
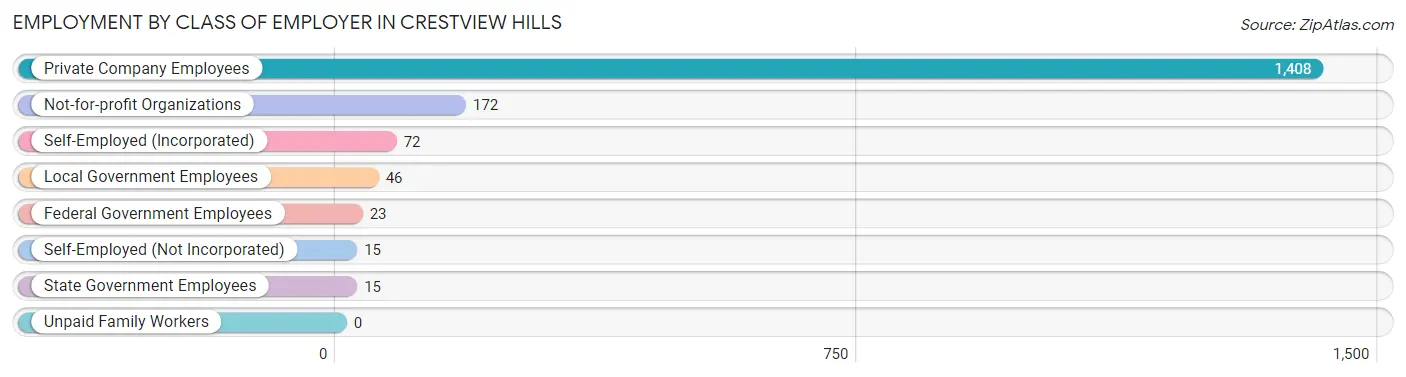
| Employer Class | # Employees | % Employees |
| Private Company Employees | 1,408 | 80.4% |
| Self-Employed (Incorporated) | 72 | 4.1% |
| Self-Employed (Not Incorporated) | 15 | 0.9% |
| Not-for-profit Organizations | 172 | 9.8% |
| Local Government Employees | 46 | 2.6% |
| State Government Employees | 15 | 0.9% |
| Federal Government Employees | 23 | 1.3% |
| Unpaid Family Workers | 0 | 0.0% |
| Total | 1,751 | 100.0% |
Employment Status by Age in Crestview Hills
According to the labor force statistics for Crestview Hills, out of the total population over 16 years of age (2,835), 66.2% or 1,877 individuals are in the labor force, with 5.4% or 101 of them unemployed. The age group with the highest labor force participation rate is 30 to 34 years, with 100.0% or 107 individuals in the labor force. Within the labor force, the 20 to 24 years age range has the highest percentage of unemployed individuals, with 19.8% or 47 of them being unemployed.
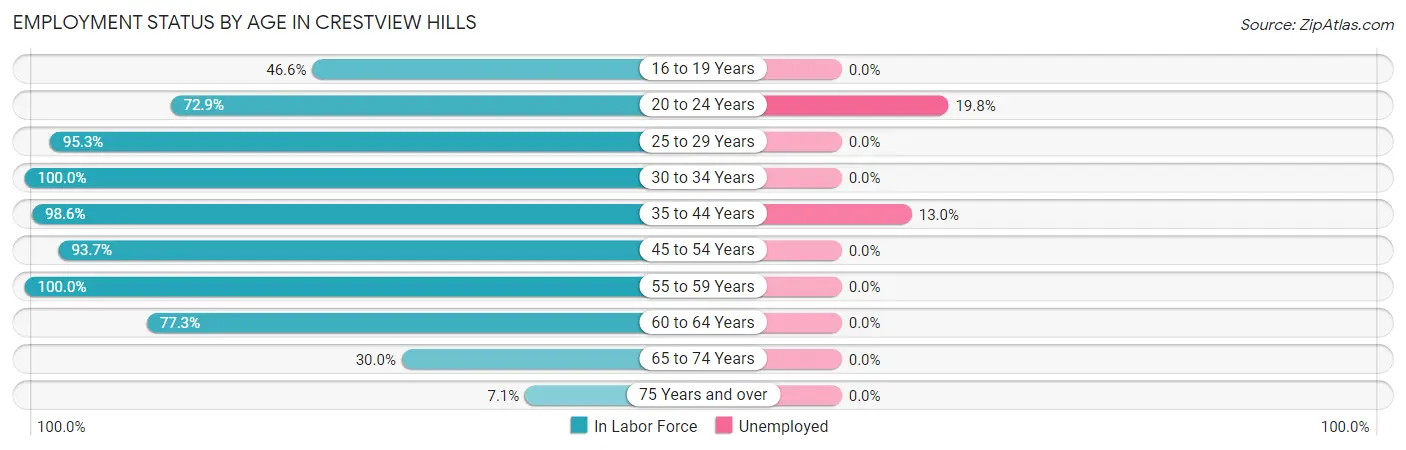
| Age Bracket | In Labor Force | Unemployed |
| 16 to 19 Years | 193 (46.6%) | 0 (0.0%) |
| 20 to 24 Years | 237 (72.9%) | 47 (19.8%) |
| 25 to 29 Years | 122 (95.3%) | 0 (0.0%) |
| 30 to 34 Years | 107 (100.0%) | 0 (0.0%) |
| 35 to 44 Years | 415 (98.6%) | 54 (13.0%) |
| 45 to 54 Years | 343 (93.7%) | 0 (0.0%) |
| 55 to 59 Years | 126 (100.0%) | 0 (0.0%) |
| 60 to 64 Years | 191 (77.3%) | 0 (0.0%) |
| 65 to 74 Years | 122 (30.0%) | 0 (0.0%) |
| 75 Years and over | 21 (7.1%) | 0 (0.0%) |
| Total | 1,877 (66.2%) | 101 (5.4%) |
Employment Status by Educational Attainment in Crestview Hills
According to labor force statistics for Crestview Hills, 93.5% of individuals (1,304) out of the total population between 25 and 64 years of age (1,395) are in the labor force, with 4.1% or 53 of them being unemployed. The group with the highest labor force participation rate are those with the educational attainment of bachelor's degree or higher, with 99.2% or 781 individuals in the labor force. Within the labor force, individuals with high school diploma education have the highest percentage of unemployment, with 17.9% or 54 of them being unemployed.
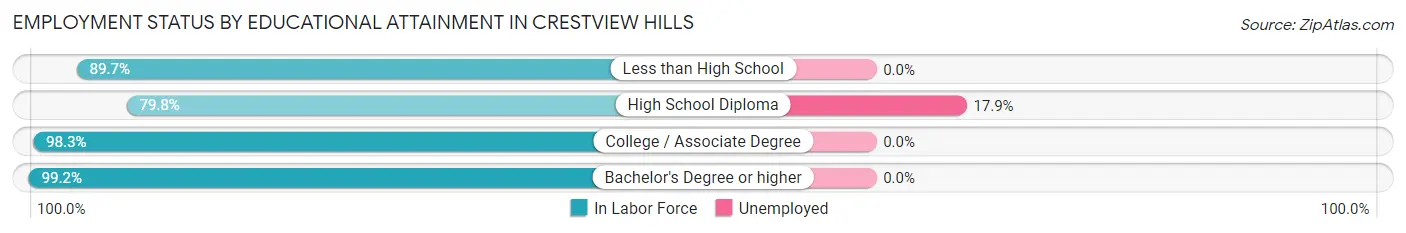
| Educational Attainment | In Labor Force | Unemployed |
| Less than High School | 52 (89.7%) | 0 (0.0%) |
| High School Diploma | 301 (79.8%) | 67 (17.9%) |
| College / Associate Degree | 170 (98.3%) | 0 (0.0%) |
| Bachelor's Degree or higher | 781 (99.2%) | 0 (0.0%) |
| Total | 1,304 (93.5%) | 57 (4.1%) |
Employment Occupations by Sex in Crestview Hills
Management, Business, Science and Arts Occupations
The most common Management, Business, Science and Arts occupations in Crestview Hills are Management (364 | 20.5%), Community & Social Service (140 | 7.9%), Health Diagnosing & Treating (116 | 6.5%), Health Technologists (92 | 5.2%), and Business & Financial (85 | 4.8%).

Management, Business, Science and Arts Occupations by Sex
Within the Management, Business, Science and Arts occupations in Crestview Hills, the most male-oriented occupations are Computers & Mathematics (100.0%), Arts, Media & Entertainment (85.7%), and Computers, Engineering & Science (83.3%), while the most female-oriented occupations are Health Diagnosing & Treating (95.7%), Health Technologists (94.6%), and Education Instruction & Library (91.4%).
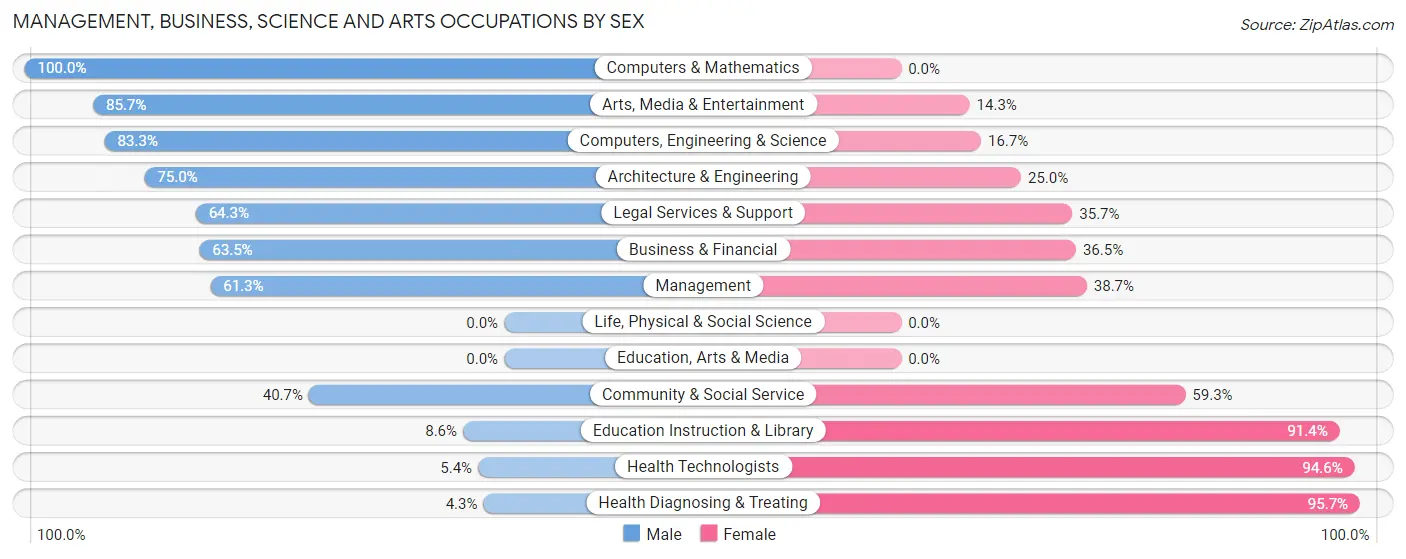
| Occupation | Male | Female |
| Management | 223 (61.3%) | 141 (38.7%) |
| Business & Financial | 54 (63.5%) | 31 (36.5%) |
| Computers, Engineering & Science | 70 (83.3%) | 14 (16.7%) |
| Computers & Mathematics | 28 (100.0%) | 0 (0.0%) |
| Architecture & Engineering | 42 (75.0%) | 14 (25.0%) |
| Life, Physical & Social Science | 0 (0.0%) | 0 (0.0%) |
| Community & Social Service | 57 (40.7%) | 83 (59.3%) |
| Education, Arts & Media | 0 (0.0%) | 0 (0.0%) |
| Legal Services & Support | 27 (64.3%) | 15 (35.7%) |
| Education Instruction & Library | 6 (8.6%) | 64 (91.4%) |
| Arts, Media & Entertainment | 24 (85.7%) | 4 (14.3%) |
| Health Diagnosing & Treating | 5 (4.3%) | 111 (95.7%) |
| Health Technologists | 5 (5.4%) | 87 (94.6%) |
| Total (Category) | 409 (51.8%) | 380 (48.2%) |
| Total (Overall) | 919 (51.7%) | 857 (48.2%) |
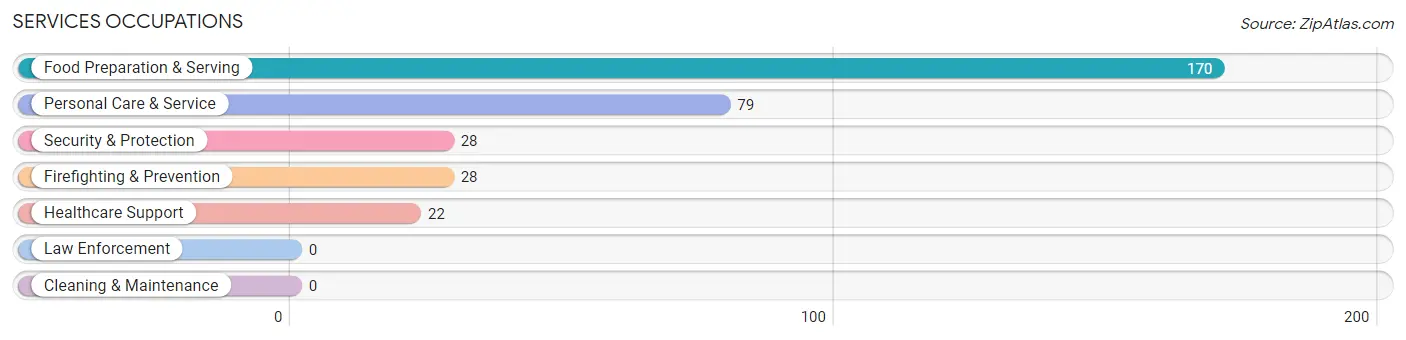
Services Occupations
The most common Services occupations in Crestview Hills are Food Preparation & Serving (170 | 9.6%), Personal Care & Service (79 | 4.4%), Security & Protection (28 | 1.6%), Firefighting & Prevention (28 | 1.6%), and Healthcare Support (22 | 1.2%).
Services Occupations by Sex
Within the Services occupations in Crestview Hills, the most male-oriented occupations are Security & Protection (100.0%), Firefighting & Prevention (100.0%), and Personal Care & Service (35.4%), while the most female-oriented occupations are Healthcare Support (100.0%), Food Preparation & Serving (67.1%), and Personal Care & Service (64.6%).
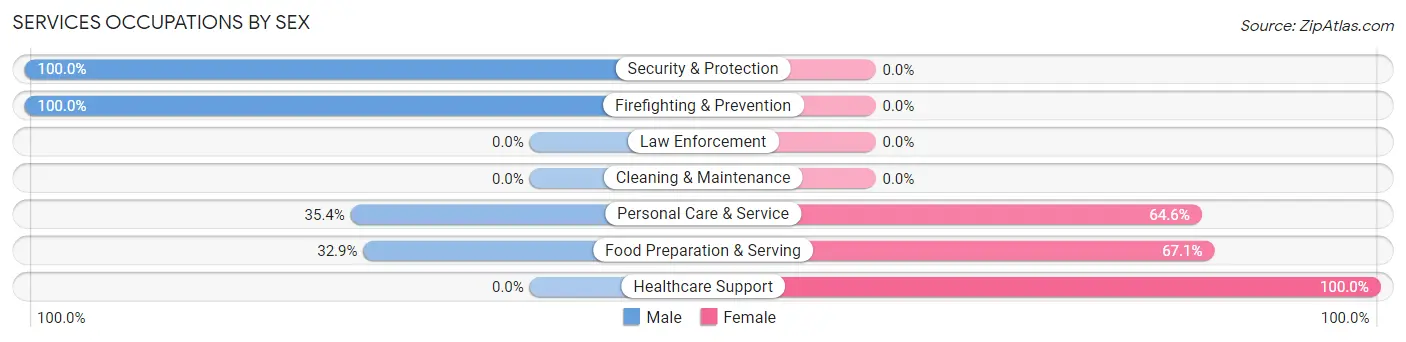
| Occupation | Male | Female |
| Healthcare Support | 0 (0.0%) | 22 (100.0%) |
| Security & Protection | 28 (100.0%) | 0 (0.0%) |
| Firefighting & Prevention | 28 (100.0%) | 0 (0.0%) |
| Law Enforcement | 0 (0.0%) | 0 (0.0%) |
| Food Preparation & Serving | 56 (32.9%) | 114 (67.1%) |
| Cleaning & Maintenance | 0 (0.0%) | 0 (0.0%) |
| Personal Care & Service | 28 (35.4%) | 51 (64.6%) |
| Total (Category) | 112 (37.5%) | 187 (62.5%) |
| Total (Overall) | 919 (51.7%) | 857 (48.2%) |
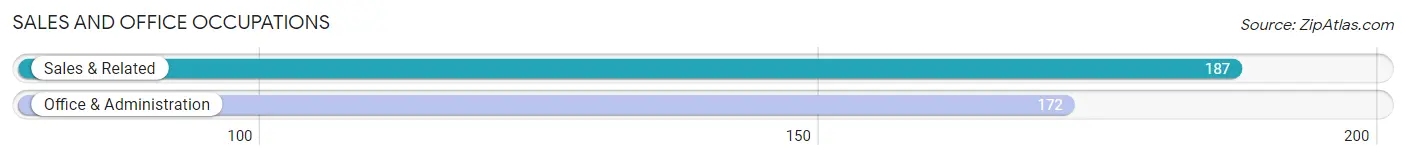
Sales and Office Occupations
The most common Sales and Office occupations in Crestview Hills are Sales & Related (187 | 10.5%), and Office & Administration (172 | 9.7%).
Sales and Office Occupations by Sex
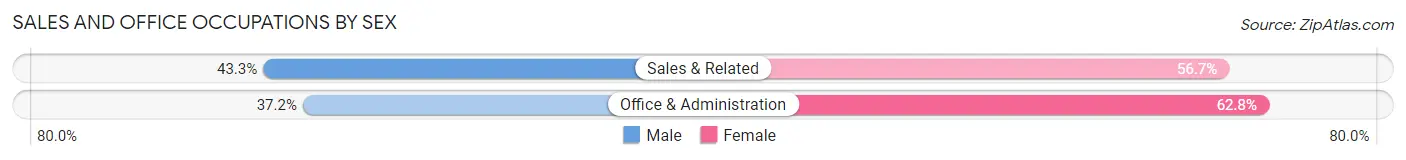
| Occupation | Male | Female |
| Sales & Related | 81 (43.3%) | 106 (56.7%) |
| Office & Administration | 64 (37.2%) | 108 (62.8%) |
| Total (Category) | 145 (40.4%) | 214 (59.6%) |
| Total (Overall) | 919 (51.7%) | 857 (48.2%) |
Natural Resources, Construction and Maintenance Occupations
The most common Natural Resources, Construction and Maintenance occupations in Crestview Hills are Construction & Extraction (46 | 2.6%), and Installation, Maintenance & Repair (4 | 0.2%).
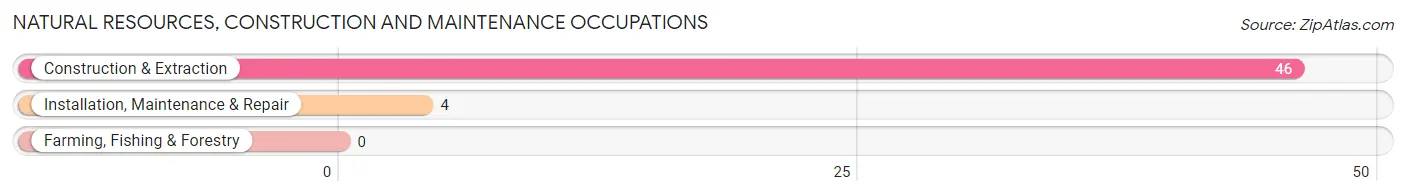
Natural Resources, Construction and Maintenance Occupations by Sex
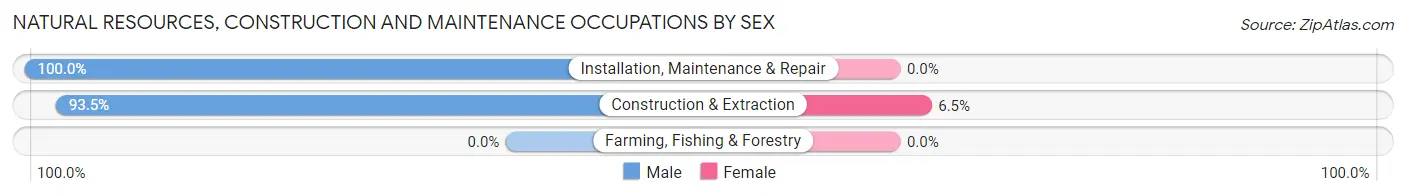
| Occupation | Male | Female |
| Farming, Fishing & Forestry | 0 (0.0%) | 0 (0.0%) |
| Construction & Extraction | 43 (93.5%) | 3 (6.5%) |
| Installation, Maintenance & Repair | 4 (100.0%) | 0 (0.0%) |
| Total (Category) | 47 (94.0%) | 3 (6.0%) |
| Total (Overall) | 919 (51.7%) | 857 (48.2%) |
Production, Transportation and Moving Occupations
The most common Production, Transportation and Moving occupations in Crestview Hills are Production (179 | 10.1%), Material Moving (79 | 4.4%), and Transportation (21 | 1.2%).
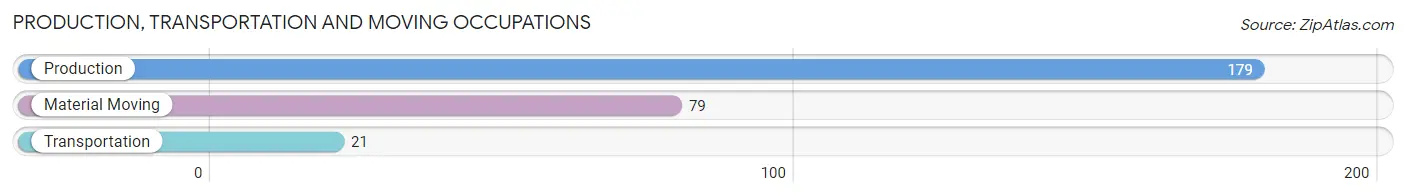
Production, Transportation and Moving Occupations by Sex
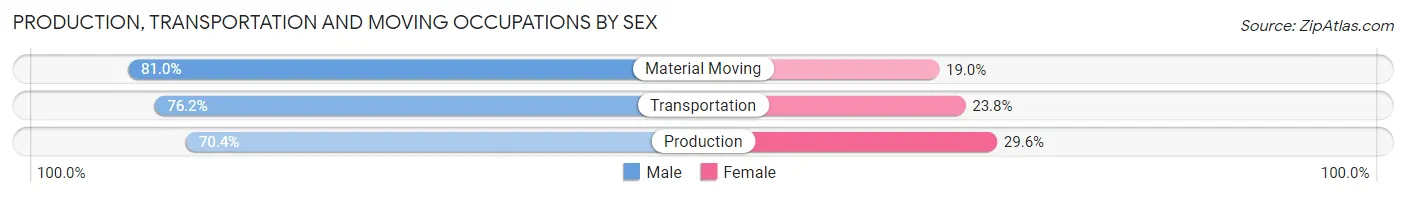
| Occupation | Male | Female |
| Production | 126 (70.4%) | 53 (29.6%) |
| Transportation | 16 (76.2%) | 5 (23.8%) |
| Material Moving | 64 (81.0%) | 15 (19.0%) |
| Total (Category) | 206 (73.8%) | 73 (26.2%) |
| Total (Overall) | 919 (51.7%) | 857 (48.2%) |
Employment Industries by Sex in Crestview Hills
Employment Industries in Crestview Hills
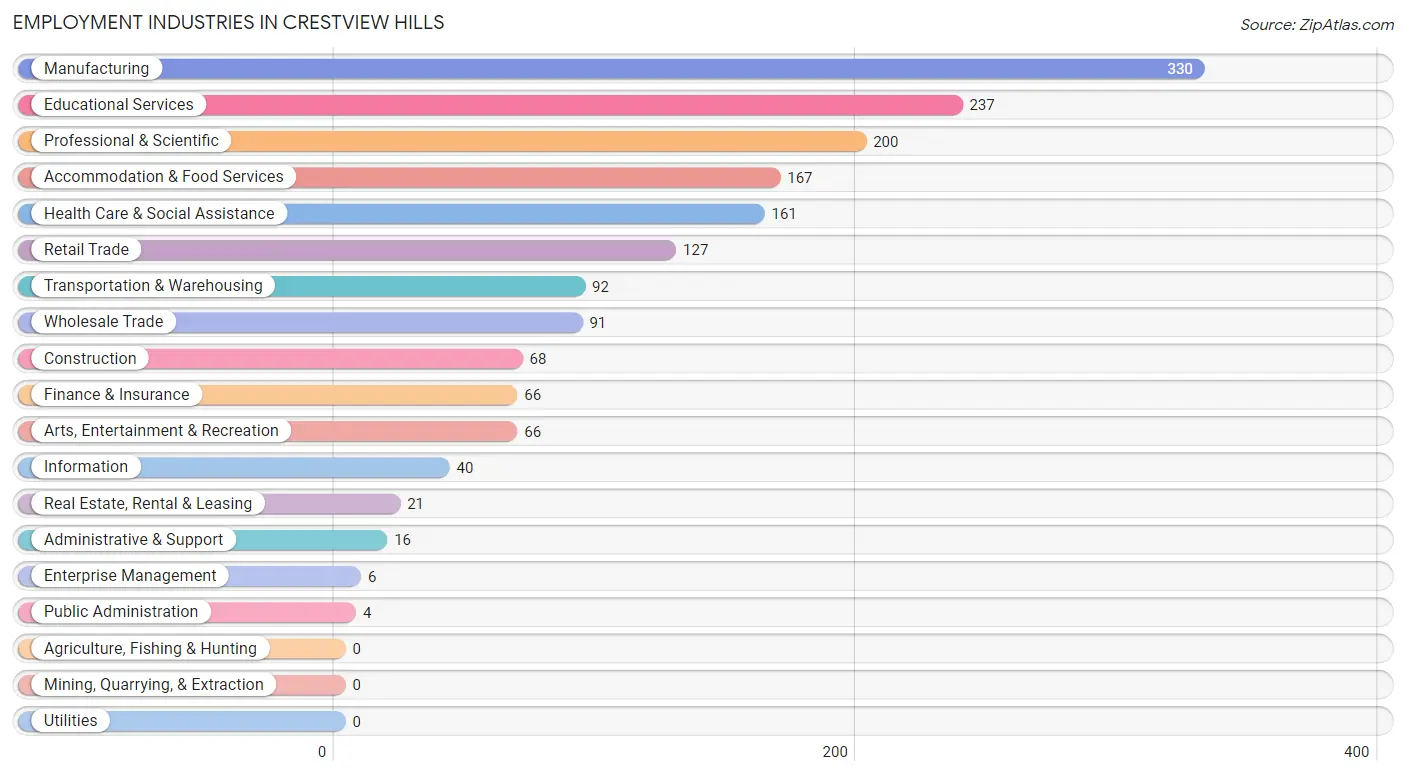
The major employment industries in Crestview Hills include Manufacturing (330 | 18.6%), Educational Services (237 | 13.3%), Professional & Scientific (200 | 11.3%), Accommodation & Food Services (167 | 9.4%), and Health Care & Social Assistance (161 | 9.1%).
Employment Industries by Sex in Crestview Hills
The Crestview Hills industries that see more men than women are Information (100.0%), Enterprise Management (100.0%), and Administrative & Support (100.0%), whereas the industries that tend to have a higher number of women are Real Estate, Rental & Leasing (100.0%), Public Administration (100.0%), and Health Care & Social Assistance (78.9%).
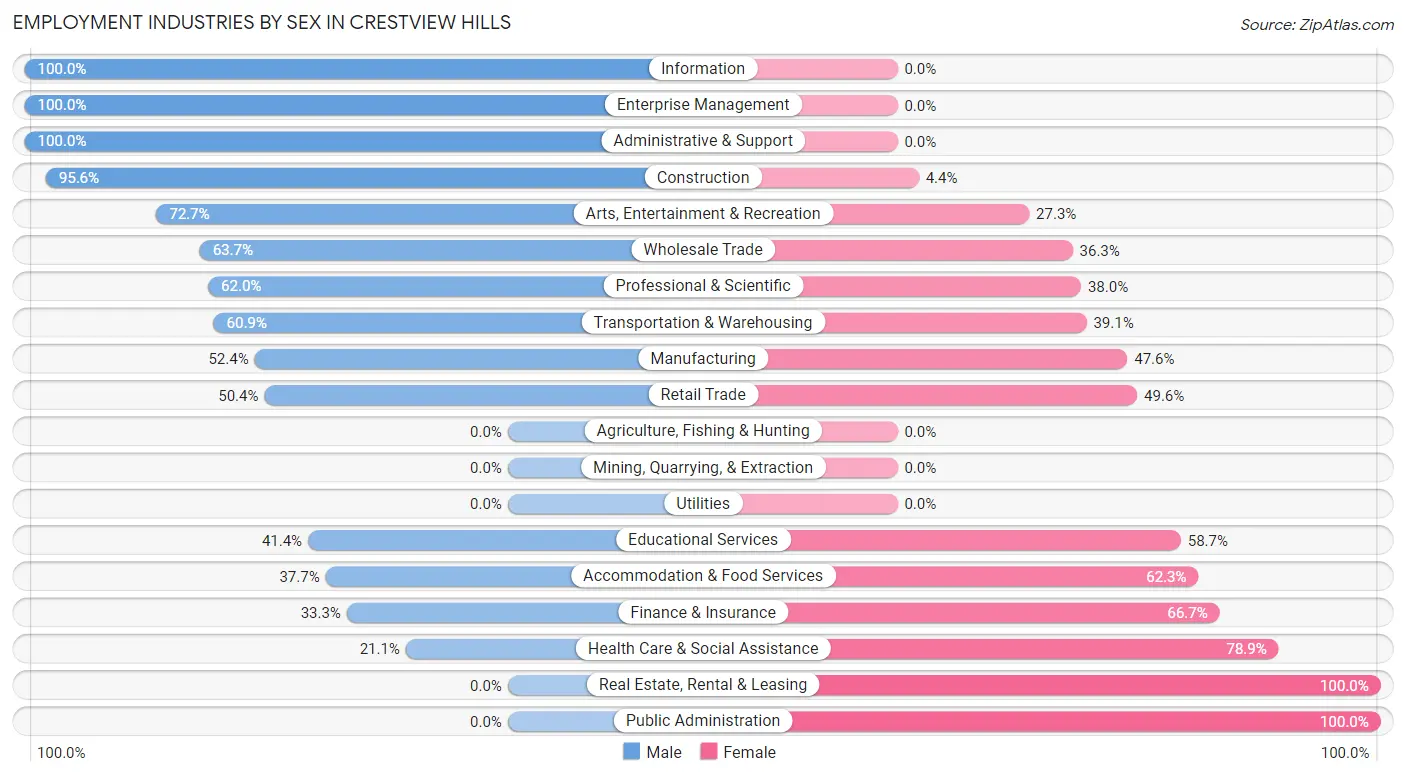
| Industry | Male | Female |
| Agriculture, Fishing & Hunting | 0 (0.0%) | 0 (0.0%) |
| Mining, Quarrying, & Extraction | 0 (0.0%) | 0 (0.0%) |
| Construction | 65 (95.6%) | 3 (4.4%) |
| Manufacturing | 173 (52.4%) | 157 (47.6%) |
| Wholesale Trade | 58 (63.7%) | 33 (36.3%) |
| Retail Trade | 64 (50.4%) | 63 (49.6%) |
| Transportation & Warehousing | 56 (60.9%) | 36 (39.1%) |
| Utilities | 0 (0.0%) | 0 (0.0%) |
| Information | 40 (100.0%) | 0 (0.0%) |
| Finance & Insurance | 22 (33.3%) | 44 (66.7%) |
| Real Estate, Rental & Leasing | 0 (0.0%) | 21 (100.0%) |
| Professional & Scientific | 124 (62.0%) | 76 (38.0%) |
| Enterprise Management | 6 (100.0%) | 0 (0.0%) |
| Administrative & Support | 16 (100.0%) | 0 (0.0%) |
| Educational Services | 98 (41.3%) | 139 (58.7%) |
| Health Care & Social Assistance | 34 (21.1%) | 127 (78.9%) |
| Arts, Entertainment & Recreation | 48 (72.7%) | 18 (27.3%) |
| Accommodation & Food Services | 63 (37.7%) | 104 (62.3%) |
| Public Administration | 0 (0.0%) | 4 (100.0%) |
| Total | 919 (51.7%) | 857 (48.2%) |
Education in Crestview Hills
School Enrollment in Crestview Hills
The most common levels of schooling among the 975 students in Crestview Hills are college / undergraduate (529 | 54.3%), high school (179 | 18.4%), and middle school (164 | 16.8%).
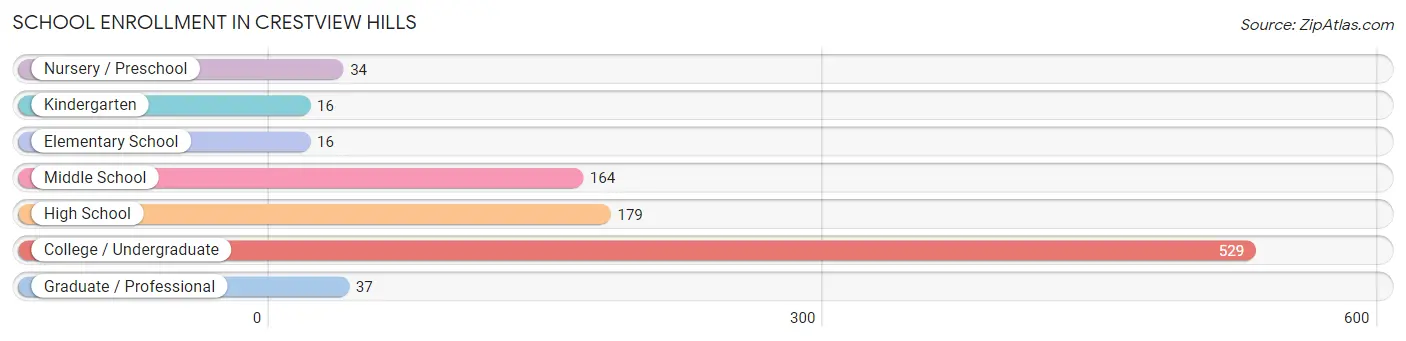
| School Level | # Students | % Students |
| Nursery / Preschool | 34 | 3.5% |
| Kindergarten | 16 | 1.6% |
| Elementary School | 16 | 1.6% |
| Middle School | 164 | 16.8% |
| High School | 179 | 18.4% |
| College / Undergraduate | 529 | 54.3% |
| Graduate / Professional | 37 | 3.8% |
| Total | 975 | 100.0% |
School Enrollment by Age by Funding Source in Crestview Hills
Out of a total of 975 students who are enrolled in schools in Crestview Hills, 198 (20.3%) attend a private institution, while the remaining 777 (79.7%) are enrolled in public schools. The age group of 3 to 4 year olds has the highest likelihood of being enrolled in private schools, with 29 (85.3% in the age bracket) enrolled. Conversely, the age group of 10 to 14 year olds has the lowest likelihood of being enrolled in a private school, with 193 (100.0% in the age bracket) attending a public institution.
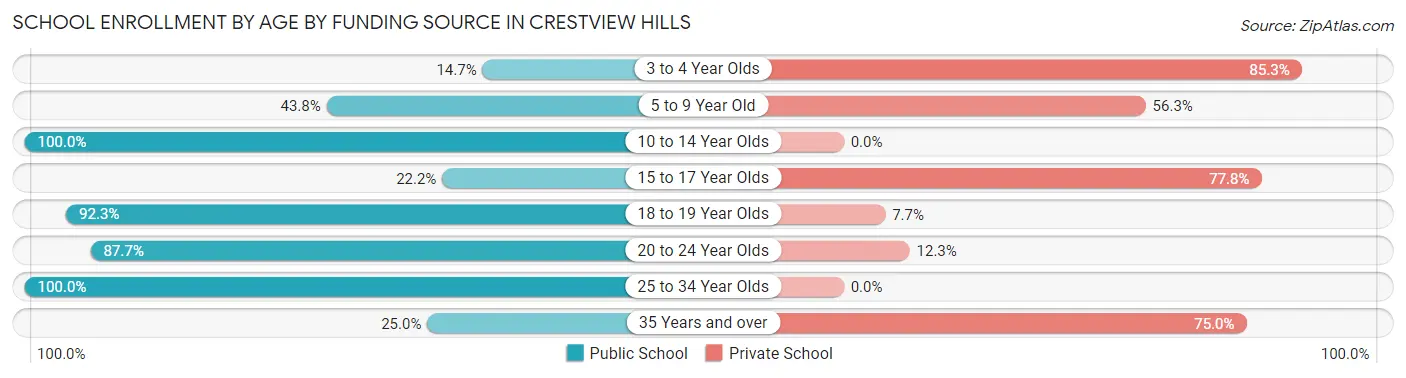
| Age Bracket | Public School | Private School |
| 3 to 4 Year Olds | 5 (14.7%) | 29 (85.3%) |
| 5 to 9 Year Old | 14 (43.8%) | 18 (56.2%) |
| 10 to 14 Year Olds | 193 (100.0%) | 0 (0.0%) |
| 15 to 17 Year Olds | 22 (22.2%) | 77 (77.8%) |
| 18 to 19 Year Olds | 298 (92.3%) | 25 (7.7%) |
| 20 to 24 Year Olds | 200 (87.7%) | 28 (12.3%) |
| 25 to 34 Year Olds | 38 (100.0%) | 0 (0.0%) |
| 35 Years and over | 7 (25.0%) | 21 (75.0%) |
| Total | 777 (79.7%) | 198 (20.3%) |
Educational Attainment by Field of Study in Crestview Hills
Business (301 | 26.0%), liberal arts & history (127 | 11.0%), arts & humanities (120 | 10.3%), education (102 | 8.8%), and engineering (84 | 7.2%) are the most common fields of study among 1,159 individuals in Crestview Hills who have obtained a bachelor's degree or higher.
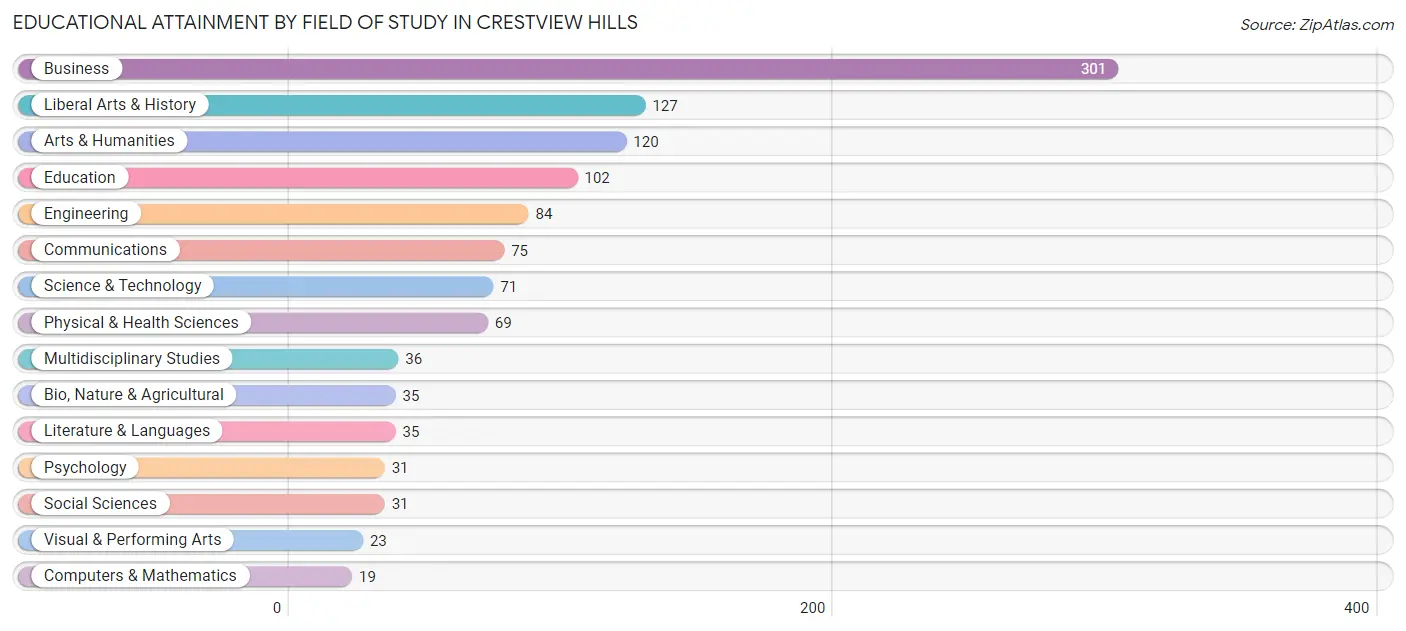
| Field of Study | # Graduates | % Graduates |
| Computers & Mathematics | 19 | 1.6% |
| Bio, Nature & Agricultural | 35 | 3.0% |
| Physical & Health Sciences | 69 | 5.9% |
| Psychology | 31 | 2.7% |
| Social Sciences | 31 | 2.7% |
| Engineering | 84 | 7.2% |
| Multidisciplinary Studies | 36 | 3.1% |
| Science & Technology | 71 | 6.1% |
| Business | 301 | 26.0% |
| Education | 102 | 8.8% |
| Literature & Languages | 35 | 3.0% |
| Liberal Arts & History | 127 | 11.0% |
| Visual & Performing Arts | 23 | 2.0% |
| Communications | 75 | 6.5% |
| Arts & Humanities | 120 | 10.3% |
| Total | 1,159 | 100.0% |
Transportation & Commute in Crestview Hills
Vehicle Availability by Sex in Crestview Hills
The most prevalent vehicle ownership categories in Crestview Hills are males with 2 vehicles (361, accounting for 44.8%) and females with 2 vehicles (401, making up 48.7%).
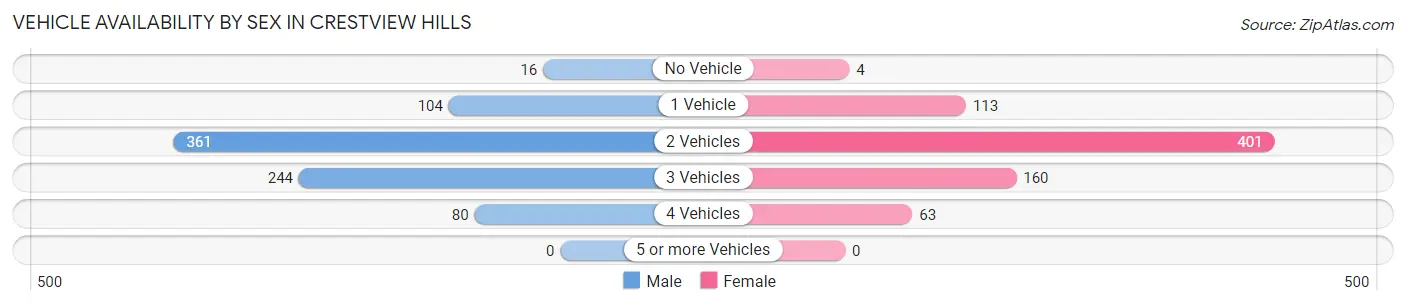
| Vehicles Available | Male | Female |
| No Vehicle | 16 (2.0%) | 4 (0.5%) |
| 1 Vehicle | 104 (12.9%) | 113 (15.2%) |
| 2 Vehicles | 361 (44.8%) | 401 (54.1%) |
| 3 Vehicles | 244 (30.3%) | 160 (21.6%) |
| 4 Vehicles | 80 (9.9%) | 63 (8.5%) |
| 5 or more Vehicles | 0 (0.0%) | 0 (0.0%) |
| Total | 805 (100.0%) | 741 (100.0%) |
Commute Time in Crestview Hills
The most frequently occuring commute durations in Crestview Hills are 10 to 14 minutes (425 commuters, 27.8%), 5 to 9 minutes (301 commuters, 19.7%), and 20 to 24 minutes (272 commuters, 17.8%).
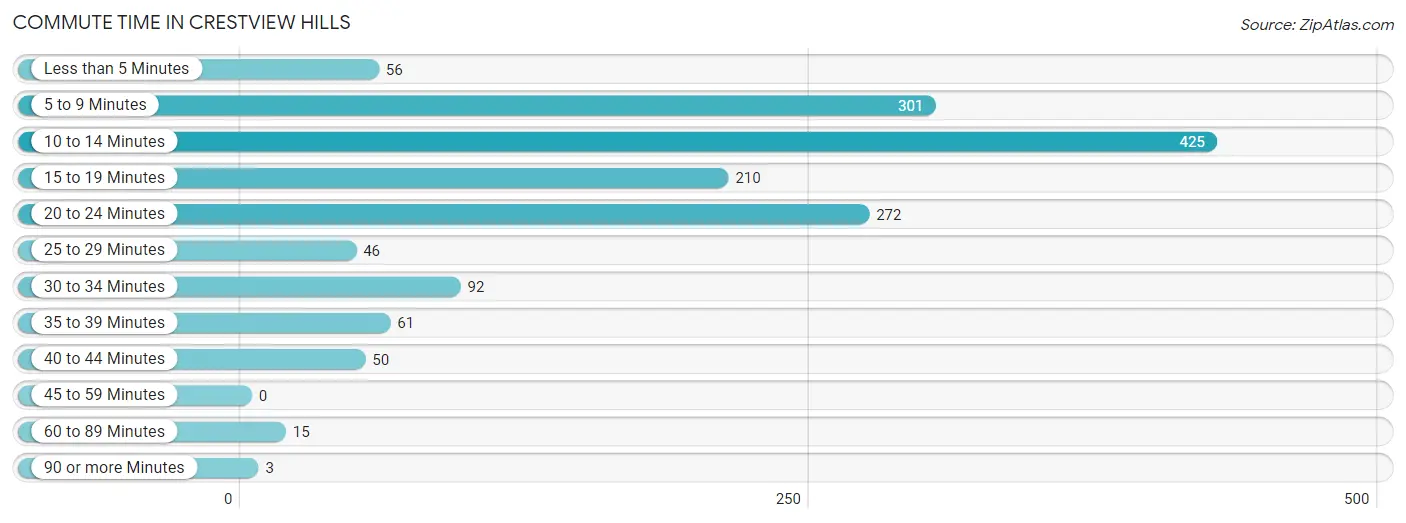
| Commute Time | # Commuters | % Commuters |
| Less than 5 Minutes | 56 | 3.7% |
| 5 to 9 Minutes | 301 | 19.7% |
| 10 to 14 Minutes | 425 | 27.8% |
| 15 to 19 Minutes | 210 | 13.7% |
| 20 to 24 Minutes | 272 | 17.8% |
| 25 to 29 Minutes | 46 | 3.0% |
| 30 to 34 Minutes | 92 | 6.0% |
| 35 to 39 Minutes | 61 | 4.0% |
| 40 to 44 Minutes | 50 | 3.3% |
| 45 to 59 Minutes | 0 | 0.0% |
| 60 to 89 Minutes | 15 | 1.0% |
| 90 or more Minutes | 3 | 0.2% |
Commute Time by Sex in Crestview Hills
The most common commute times in Crestview Hills are 20 to 24 minutes (192 commuters, 24.3%) for males and 10 to 14 minutes (274 commuters, 37.0%) for females.
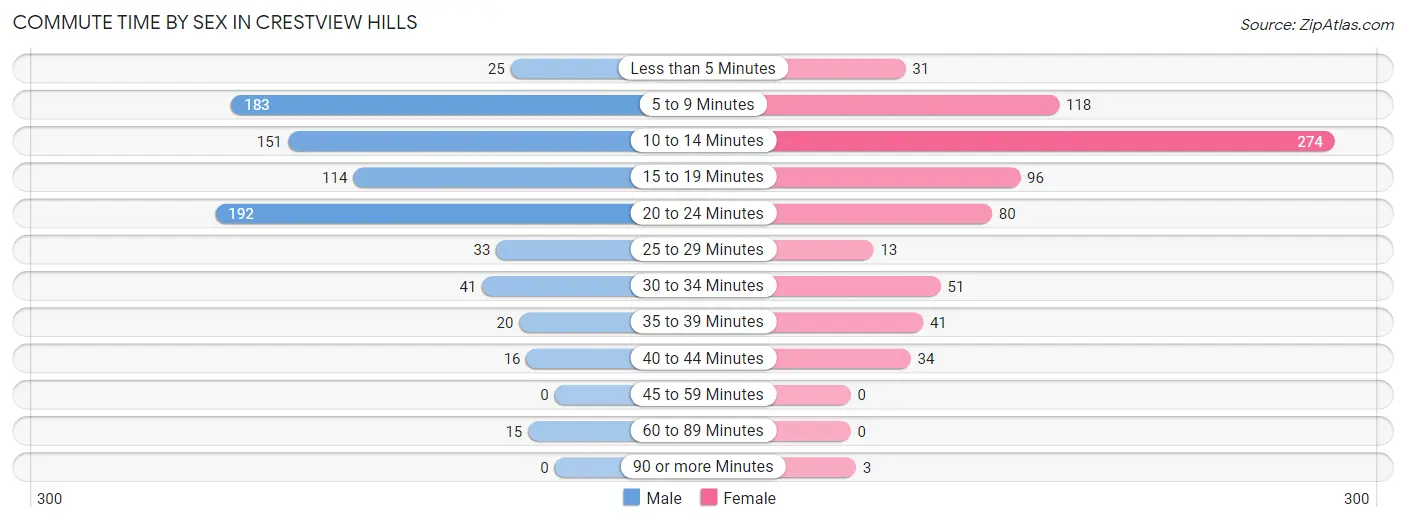
| Commute Time | Male | Female |
| Less than 5 Minutes | 25 (3.2%) | 31 (4.2%) |
| 5 to 9 Minutes | 183 (23.2%) | 118 (15.9%) |
| 10 to 14 Minutes | 151 (19.1%) | 274 (37.0%) |
| 15 to 19 Minutes | 114 (14.4%) | 96 (13.0%) |
| 20 to 24 Minutes | 192 (24.3%) | 80 (10.8%) |
| 25 to 29 Minutes | 33 (4.2%) | 13 (1.8%) |
| 30 to 34 Minutes | 41 (5.2%) | 51 (6.9%) |
| 35 to 39 Minutes | 20 (2.5%) | 41 (5.5%) |
| 40 to 44 Minutes | 16 (2.0%) | 34 (4.6%) |
| 45 to 59 Minutes | 0 (0.0%) | 0 (0.0%) |
| 60 to 89 Minutes | 15 (1.9%) | 0 (0.0%) |
| 90 or more Minutes | 0 (0.0%) | 3 (0.4%) |
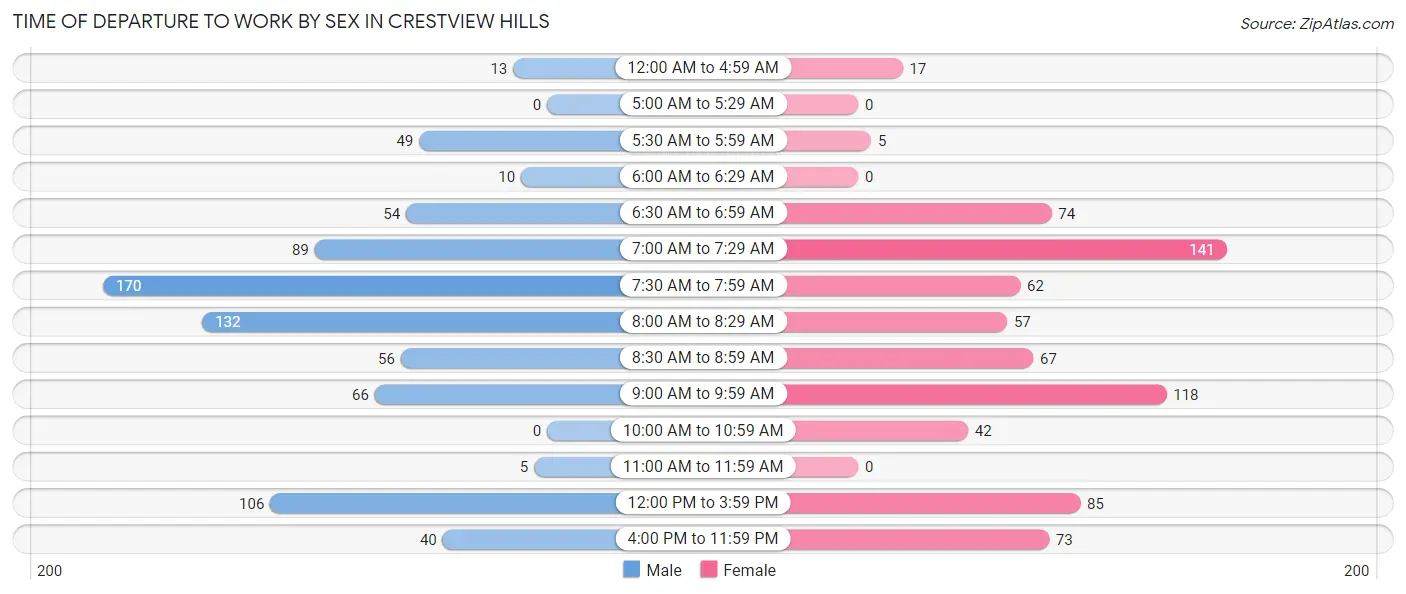
Time of Departure to Work by Sex in Crestview Hills
The most frequent times of departure to work in Crestview Hills are 7:30 AM to 7:59 AM (170, 21.5%) for males and 7:00 AM to 7:29 AM (141, 19.0%) for females.
| Time of Departure | Male | Female |
| 12:00 AM to 4:59 AM | 13 (1.7%) | 17 (2.3%) |
| 5:00 AM to 5:29 AM | 0 (0.0%) | 0 (0.0%) |
| 5:30 AM to 5:59 AM | 49 (6.2%) | 5 (0.7%) |
| 6:00 AM to 6:29 AM | 10 (1.3%) | 0 (0.0%) |
| 6:30 AM to 6:59 AM | 54 (6.8%) | 74 (10.0%) |
| 7:00 AM to 7:29 AM | 89 (11.3%) | 141 (19.0%) |
| 7:30 AM to 7:59 AM | 170 (21.5%) | 62 (8.4%) |
| 8:00 AM to 8:29 AM | 132 (16.7%) | 57 (7.7%) |
| 8:30 AM to 8:59 AM | 56 (7.1%) | 67 (9.0%) |
| 9:00 AM to 9:59 AM | 66 (8.4%) | 118 (15.9%) |
| 10:00 AM to 10:59 AM | 0 (0.0%) | 42 (5.7%) |
| 11:00 AM to 11:59 AM | 5 (0.6%) | 0 (0.0%) |
| 12:00 PM to 3:59 PM | 106 (13.4%) | 85 (11.5%) |
| 4:00 PM to 11:59 PM | 40 (5.1%) | 73 (9.9%) |
| Total | 790 (100.0%) | 741 (100.0%) |
Housing Occupancy in Crestview Hills
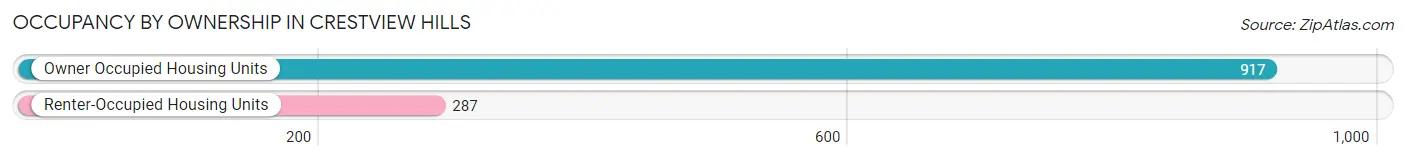
Occupancy by Ownership in Crestview Hills
Of the total 1,204 dwellings in Crestview Hills, owner-occupied units account for 917 (76.2%), while renter-occupied units make up 287 (23.8%).
| Occupancy | # Housing Units | % Housing Units |
| Owner Occupied Housing Units | 917 | 76.2% |
| Renter-Occupied Housing Units | 287 | 23.8% |
| Total Occupied Housing Units | 1,204 | 100.0% |
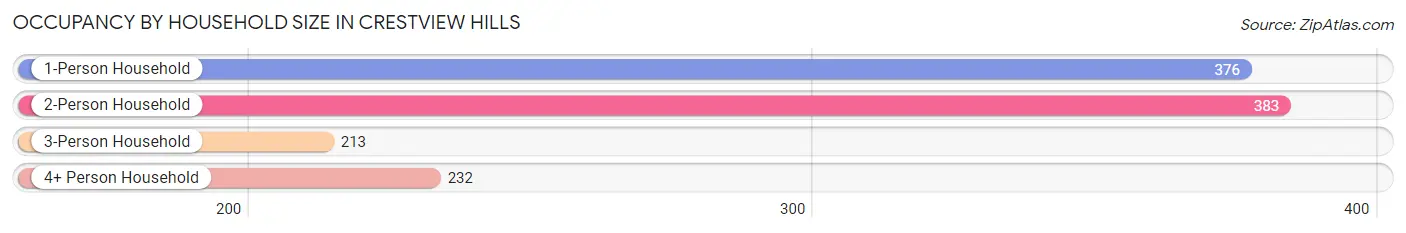
Occupancy by Household Size in Crestview Hills
| Household Size | # Housing Units | % Housing Units |
| 1-Person Household | 376 | 31.2% |
| 2-Person Household | 383 | 31.8% |
| 3-Person Household | 213 | 17.7% |
| 4+ Person Household | 232 | 19.3% |
| Total Housing Units | 1,204 | 100.0% |
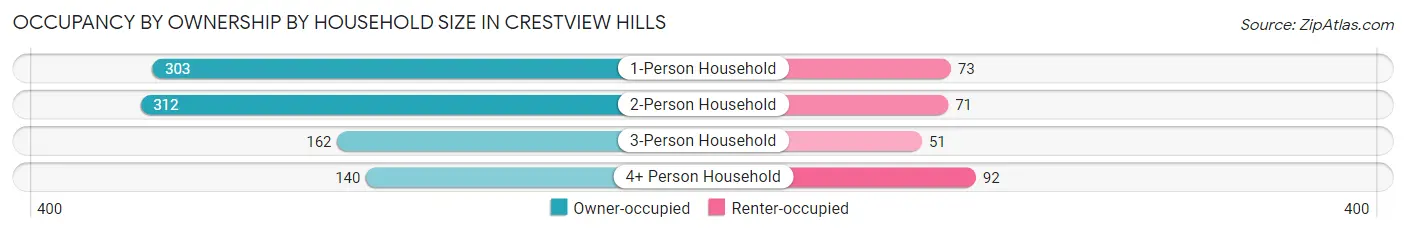
Occupancy by Ownership by Household Size in Crestview Hills
| Household Size | Owner-occupied | Renter-occupied |
| 1-Person Household | 303 (80.6%) | 73 (19.4%) |
| 2-Person Household | 312 (81.5%) | 71 (18.5%) |
| 3-Person Household | 162 (76.1%) | 51 (23.9%) |
| 4+ Person Household | 140 (60.3%) | 92 (39.7%) |
| Total Housing Units | 917 (76.2%) | 287 (23.8%) |
Occupancy by Educational Attainment in Crestview Hills
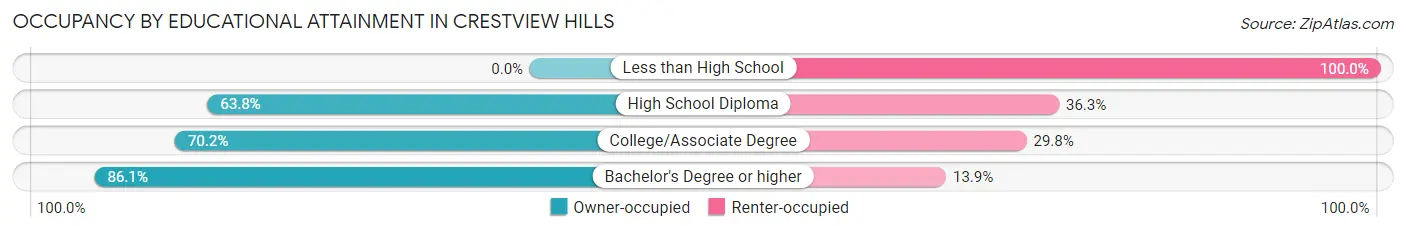
| Household Size | Owner-occupied | Renter-occupied |
| Less than High School | 0 (0.0%) | 14 (100.0%) |
| High School Diploma | 204 (63.7%) | 116 (36.2%) |
| College/Associate Degree | 160 (70.2%) | 68 (29.8%) |
| Bachelor's Degree or higher | 553 (86.1%) | 89 (13.9%) |
Occupancy by Age of Householder in Crestview Hills
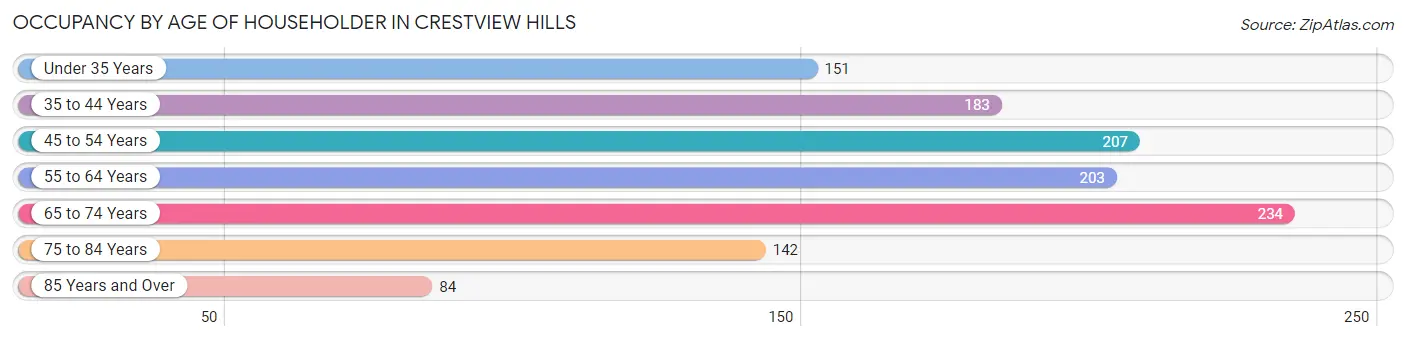
| Age Bracket | # Households | % Households |
| Under 35 Years | 151 | 12.5% |
| 35 to 44 Years | 183 | 15.2% |
| 45 to 54 Years | 207 | 17.2% |
| 55 to 64 Years | 203 | 16.9% |
| 65 to 74 Years | 234 | 19.4% |
| 75 to 84 Years | 142 | 11.8% |
| 85 Years and Over | 84 | 7.0% |
| Total | 1,204 | 100.0% |
Housing Finances in Crestview Hills
Median Income by Occupancy in Crestview Hills
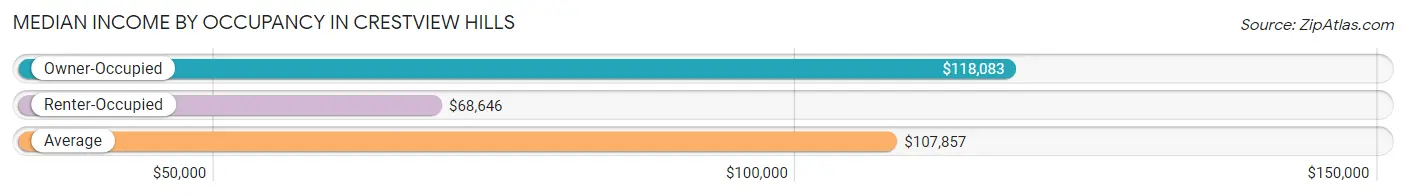
| Occupancy Type | # Households | Median Income |
| Owner-Occupied | 917 (76.2%) | $118,083 |
| Renter-Occupied | 287 (23.8%) | $68,646 |
| Average | 1,204 (100.0%) | $107,857 |
Occupancy by Householder Income Bracket in Crestview Hills
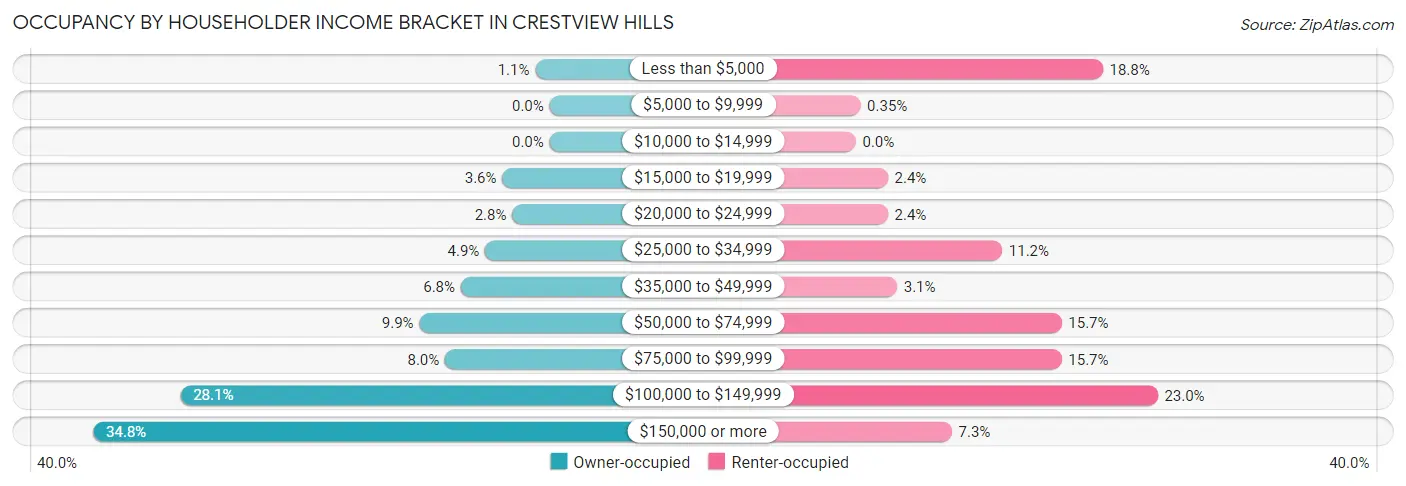
| Income Bracket | Owner-occupied | Renter-occupied |
| Less than $5,000 | 10 (1.1%) | 54 (18.8%) |
| $5,000 to $9,999 | 0 (0.0%) | 1 (0.4%) |
| $10,000 to $14,999 | 0 (0.0%) | 0 (0.0%) |
| $15,000 to $19,999 | 33 (3.6%) | 7 (2.4%) |
| $20,000 to $24,999 | 26 (2.8%) | 7 (2.4%) |
| $25,000 to $34,999 | 45 (4.9%) | 32 (11.2%) |
| $35,000 to $49,999 | 62 (6.8%) | 9 (3.1%) |
| $50,000 to $74,999 | 91 (9.9%) | 45 (15.7%) |
| $75,000 to $99,999 | 73 (8.0%) | 45 (15.7%) |
| $100,000 to $149,999 | 258 (28.1%) | 66 (23.0%) |
| $150,000 or more | 319 (34.8%) | 21 (7.3%) |
| Total | 917 (100.0%) | 287 (100.0%) |
Monthly Housing Cost Tiers in Crestview Hills
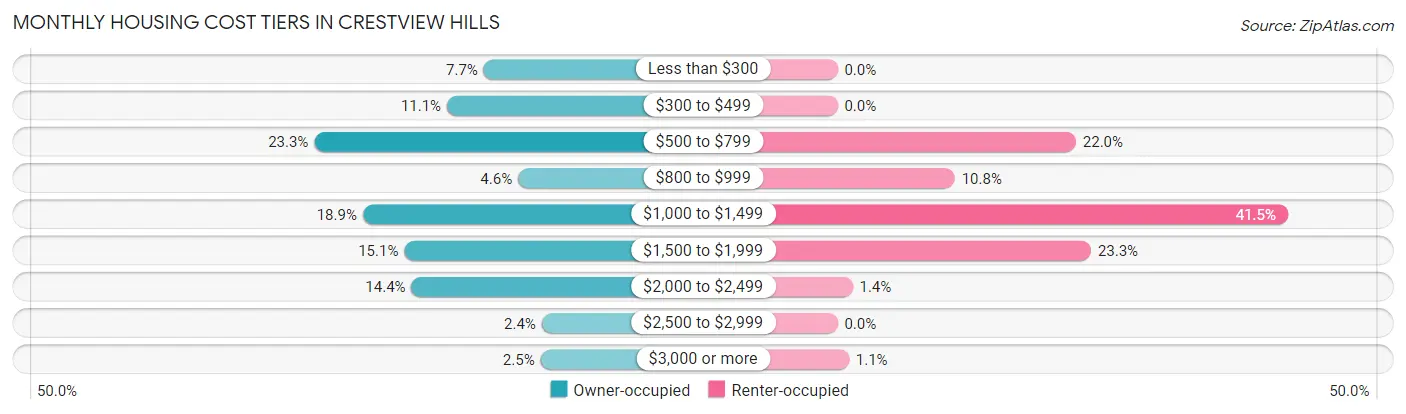
| Monthly Cost | Owner-occupied | Renter-occupied |
| Less than $300 | 71 (7.7%) | 0 (0.0%) |
| $300 to $499 | 102 (11.1%) | 0 (0.0%) |
| $500 to $799 | 214 (23.3%) | 63 (22.0%) |
| $800 to $999 | 42 (4.6%) | 31 (10.8%) |
| $1,000 to $1,499 | 173 (18.9%) | 119 (41.5%) |
| $1,500 to $1,999 | 138 (15.0%) | 67 (23.3%) |
| $2,000 to $2,499 | 132 (14.4%) | 4 (1.4%) |
| $2,500 to $2,999 | 22 (2.4%) | 0 (0.0%) |
| $3,000 or more | 23 (2.5%) | 3 (1.1%) |
| Total | 917 (100.0%) | 287 (100.0%) |
Physical Housing Characteristics in Crestview Hills
Housing Structures in Crestview Hills
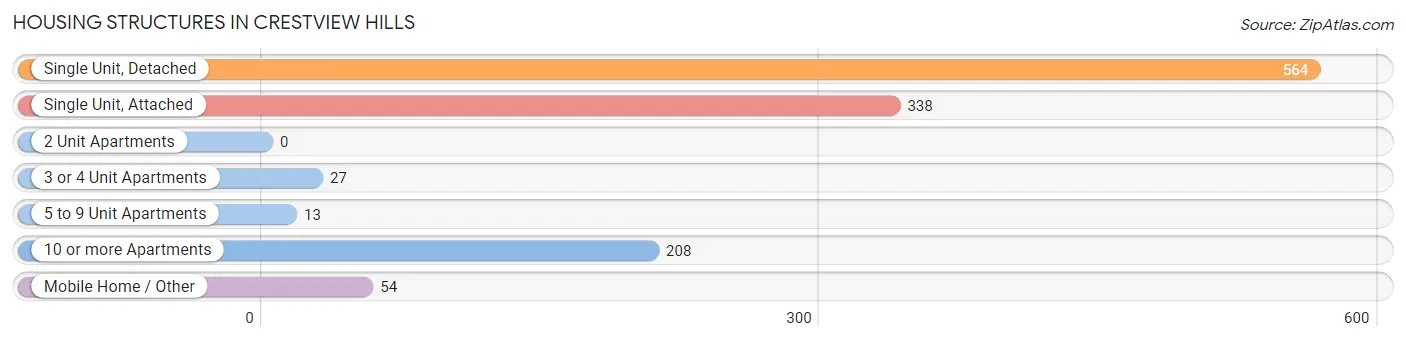
| Structure Type | # Housing Units | % Housing Units |
| Single Unit, Detached | 564 | 46.8% |
| Single Unit, Attached | 338 | 28.1% |
| 2 Unit Apartments | 0 | 0.0% |
| 3 or 4 Unit Apartments | 27 | 2.2% |
| 5 to 9 Unit Apartments | 13 | 1.1% |
| 10 or more Apartments | 208 | 17.3% |
| Mobile Home / Other | 54 | 4.5% |
| Total | 1,204 | 100.0% |
Housing Structures by Occupancy in Crestview Hills
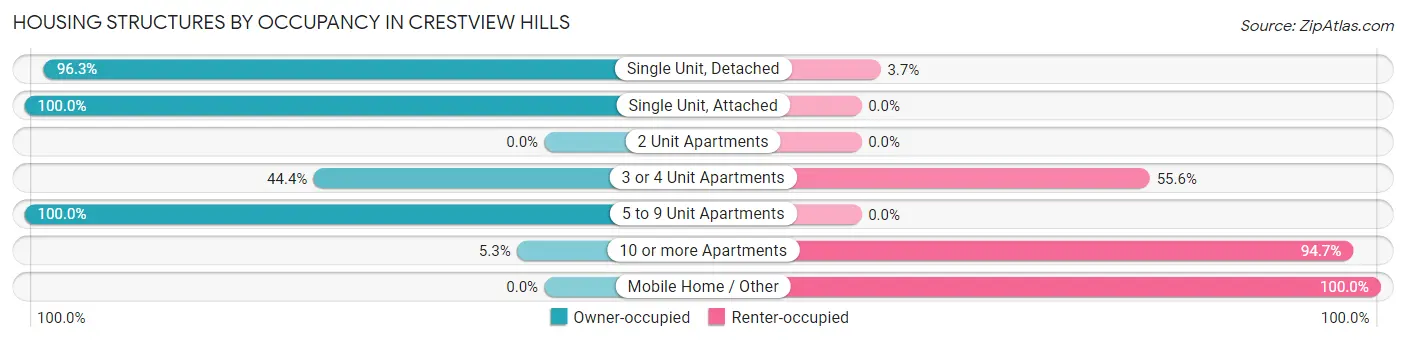
| Structure Type | Owner-occupied | Renter-occupied |
| Single Unit, Detached | 543 (96.3%) | 21 (3.7%) |
| Single Unit, Attached | 338 (100.0%) | 0 (0.0%) |
| 2 Unit Apartments | 0 (0.0%) | 0 (0.0%) |
| 3 or 4 Unit Apartments | 12 (44.4%) | 15 (55.6%) |
| 5 to 9 Unit Apartments | 13 (100.0%) | 0 (0.0%) |
| 10 or more Apartments | 11 (5.3%) | 197 (94.7%) |
| Mobile Home / Other | 0 (0.0%) | 54 (100.0%) |
| Total | 917 (76.2%) | 287 (23.8%) |
Housing Structures by Number of Rooms in Crestview Hills
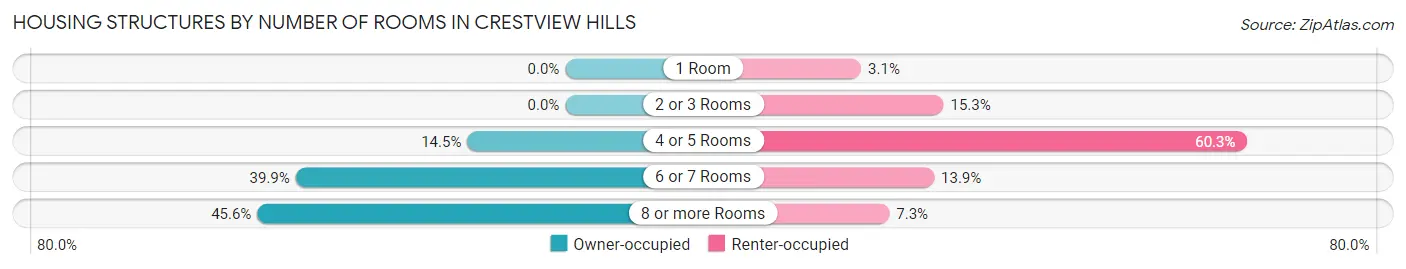
| Number of Rooms | Owner-occupied | Renter-occupied |
| 1 Room | 0 (0.0%) | 9 (3.1%) |
| 2 or 3 Rooms | 0 (0.0%) | 44 (15.3%) |
| 4 or 5 Rooms | 133 (14.5%) | 173 (60.3%) |
| 6 or 7 Rooms | 366 (39.9%) | 40 (13.9%) |
| 8 or more Rooms | 418 (45.6%) | 21 (7.3%) |
| Total | 917 (100.0%) | 287 (100.0%) |
Housing Structure by Heating Type in Crestview Hills
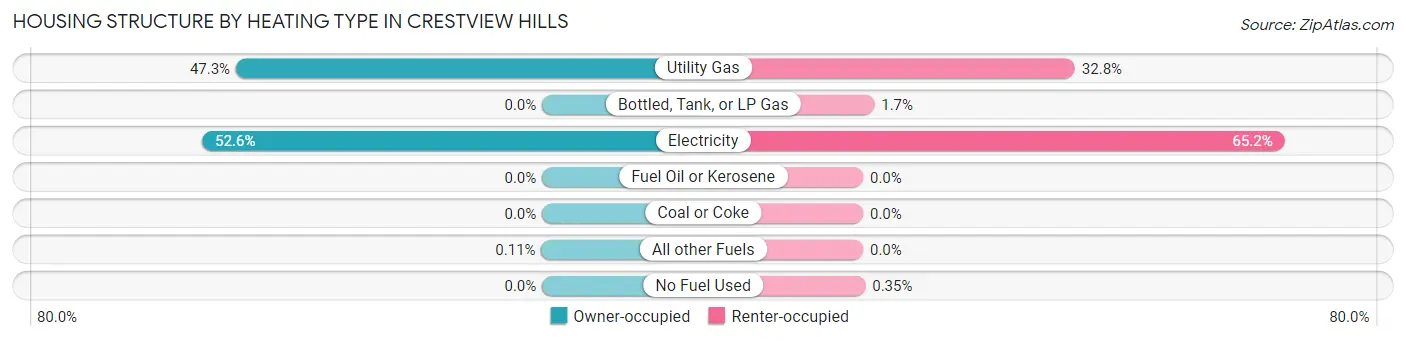
| Heating Type | Owner-occupied | Renter-occupied |
| Utility Gas | 434 (47.3%) | 94 (32.8%) |
| Bottled, Tank, or LP Gas | 0 (0.0%) | 5 (1.7%) |
| Electricity | 482 (52.6%) | 187 (65.2%) |
| Fuel Oil or Kerosene | 0 (0.0%) | 0 (0.0%) |
| Coal or Coke | 0 (0.0%) | 0 (0.0%) |
| All other Fuels | 1 (0.1%) | 0 (0.0%) |
| No Fuel Used | 0 (0.0%) | 1 (0.4%) |
| Total | 917 (100.0%) | 287 (100.0%) |
Household Vehicle Usage in Crestview Hills
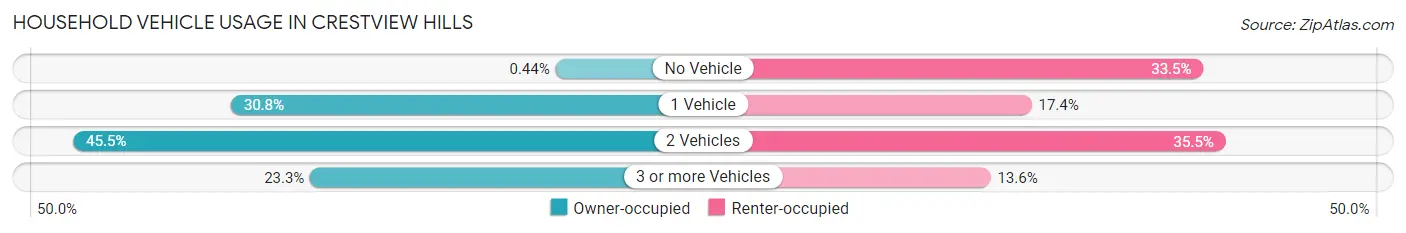
| Vehicles per Household | Owner-occupied | Renter-occupied |
| No Vehicle | 4 (0.4%) | 96 (33.5%) |
| 1 Vehicle | 282 (30.7%) | 50 (17.4%) |
| 2 Vehicles | 417 (45.5%) | 102 (35.5%) |
| 3 or more Vehicles | 214 (23.3%) | 39 (13.6%) |
| Total | 917 (100.0%) | 287 (100.0%) |
Real Estate & Mortgages in Crestview Hills
Real Estate and Mortgage Overview in Crestview Hills
| Characteristic | Without Mortgage | With Mortgage |
| Housing Units | 426 | 491 |
| Median Property Value | $224,300 | $290,100 |
| Median Household Income | $73,214 | $256 |
| Monthly Housing Costs | $540 | $23 |
| Real Estate Taxes | $1,942 | $22 |
Property Value by Mortgage Status in Crestview Hills
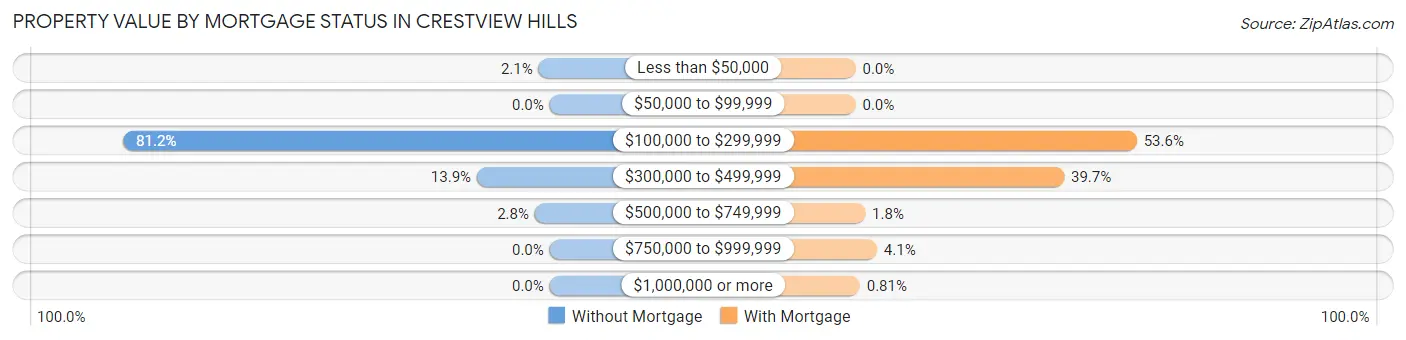
| Property Value | Without Mortgage | With Mortgage |
| Less than $50,000 | 9 (2.1%) | 0 (0.0%) |
| $50,000 to $99,999 | 0 (0.0%) | 0 (0.0%) |
| $100,000 to $299,999 | 346 (81.2%) | 263 (53.6%) |
| $300,000 to $499,999 | 59 (13.9%) | 195 (39.7%) |
| $500,000 to $749,999 | 12 (2.8%) | 9 (1.8%) |
| $750,000 to $999,999 | 0 (0.0%) | 20 (4.1%) |
| $1,000,000 or more | 0 (0.0%) | 4 (0.8%) |
| Total | 426 (100.0%) | 491 (100.0%) |
Household Income by Mortgage Status in Crestview Hills
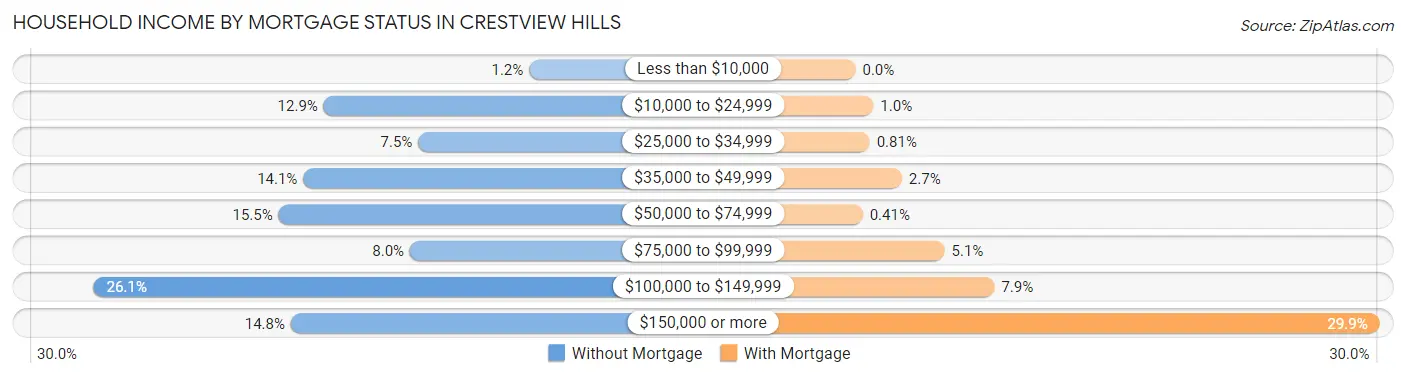
| Household Income | Without Mortgage | With Mortgage |
| Less than $10,000 | 5 (1.2%) | 0 (0.0%) |
| $10,000 to $24,999 | 55 (12.9%) | 5 (1.0%) |
| $25,000 to $34,999 | 32 (7.5%) | 4 (0.8%) |
| $35,000 to $49,999 | 60 (14.1%) | 13 (2.6%) |
| $50,000 to $74,999 | 66 (15.5%) | 2 (0.4%) |
| $75,000 to $99,999 | 34 (8.0%) | 25 (5.1%) |
| $100,000 to $149,999 | 111 (26.1%) | 39 (7.9%) |
| $150,000 or more | 63 (14.8%) | 147 (29.9%) |
| Total | 426 (100.0%) | 491 (100.0%) |
Property Value to Household Income Ratio in Crestview Hills
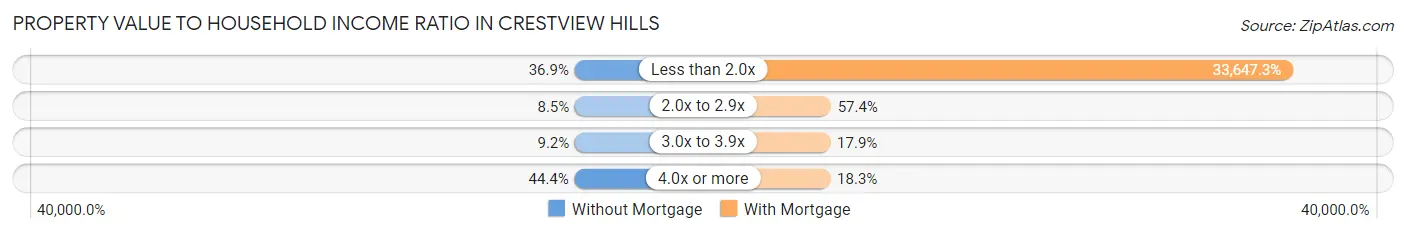
| Value-to-Income Ratio | Without Mortgage | With Mortgage |
| Less than 2.0x | 157 (36.8%) | 165,208 (33,647.3%) |
| 2.0x to 2.9x | 36 (8.5%) | 282 (57.4%) |
| 3.0x to 3.9x | 39 (9.1%) | 88 (17.9%) |
| 4.0x or more | 189 (44.4%) | 90 (18.3%) |
| Total | 426 (100.0%) | 491 (100.0%) |
Real Estate Taxes by Mortgage Status in Crestview Hills
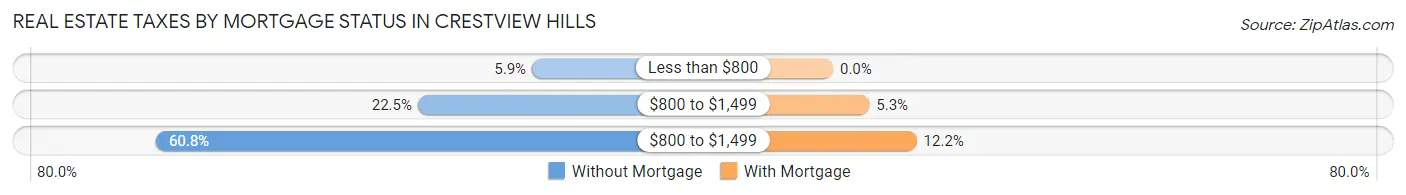
| Property Taxes | Without Mortgage | With Mortgage |
| Less than $800 | 25 (5.9%) | 0 (0.0%) |
| $800 to $1,499 | 96 (22.5%) | 26 (5.3%) |
| $800 to $1,499 | 259 (60.8%) | 60 (12.2%) |
| Total | 426 (100.0%) | 491 (100.0%) |
Health & Disability in Crestview Hills
Health Insurance Coverage by Age in Crestview Hills
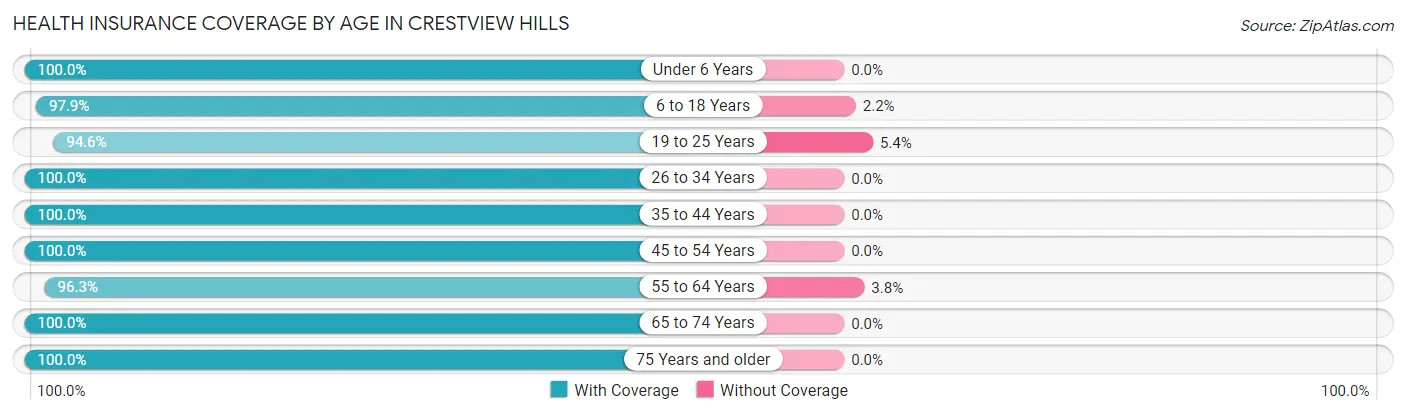
| Age Bracket | With Coverage | Without Coverage |
| Under 6 Years | 153 (100.0%) | 0 (0.0%) |
| 6 to 18 Years | 500 (97.9%) | 11 (2.1%) |
| 19 to 25 Years | 441 (94.6%) | 25 (5.4%) |
| 26 to 34 Years | 221 (100.0%) | 0 (0.0%) |
| 35 to 44 Years | 421 (100.0%) | 0 (0.0%) |
| 45 to 54 Years | 366 (100.0%) | 0 (0.0%) |
| 55 to 64 Years | 359 (96.3%) | 14 (3.7%) |
| 65 to 74 Years | 407 (100.0%) | 0 (0.0%) |
| 75 Years and older | 286 (100.0%) | 0 (0.0%) |
| Total | 3,154 (98.4%) | 50 (1.6%) |
Health Insurance Coverage by Citizenship Status in Crestview Hills
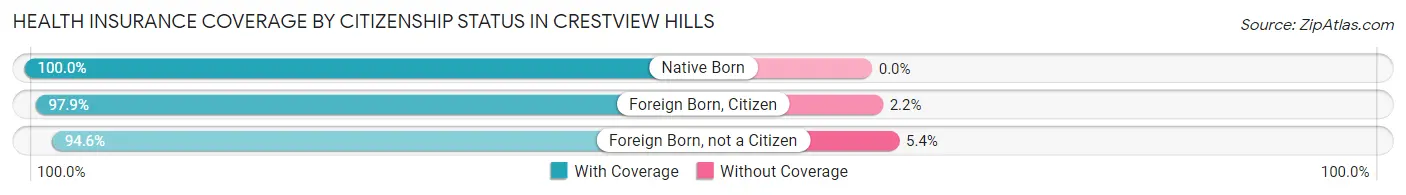
| Citizenship Status | With Coverage | Without Coverage |
| Native Born | 153 (100.0%) | 0 (0.0%) |
| Foreign Born, Citizen | 500 (97.9%) | 11 (2.1%) |
| Foreign Born, not a Citizen | 441 (94.6%) | 25 (5.4%) |
Health Insurance Coverage by Household Income in Crestview Hills
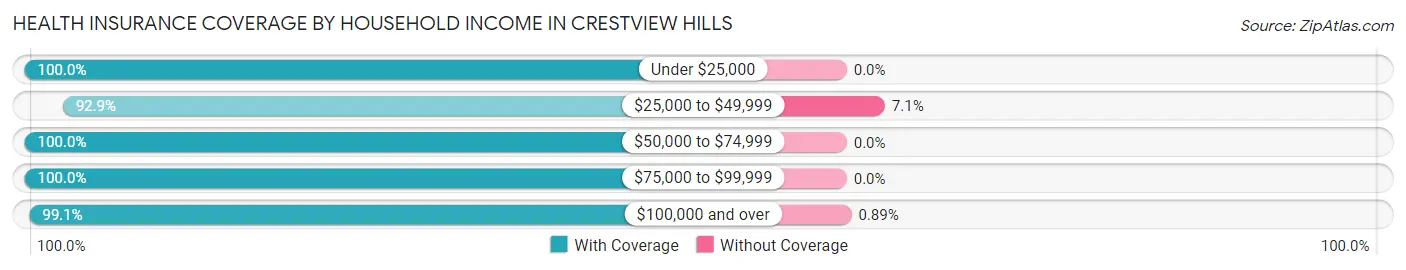
| Household Income | With Coverage | Without Coverage |
| Under $25,000 | 298 (100.0%) | 0 (0.0%) |
| $25,000 to $49,999 | 182 (92.9%) | 14 (7.1%) |
| $50,000 to $74,999 | 304 (100.0%) | 0 (0.0%) |
| $75,000 to $99,999 | 346 (100.0%) | 0 (0.0%) |
| $100,000 and over | 1,675 (99.1%) | 15 (0.9%) |
Public vs Private Health Insurance Coverage by Age in Crestview Hills
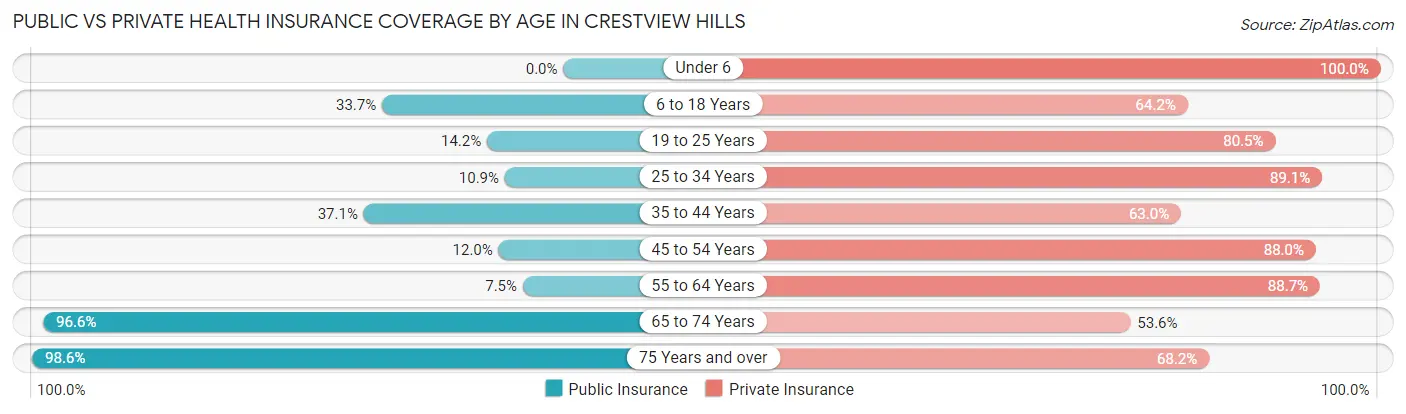
| Age Bracket | Public Insurance | Private Insurance |
| Under 6 | 0 (0.0%) | 153 (100.0%) |
| 6 to 18 Years | 172 (33.7%) | 328 (64.2%) |
| 19 to 25 Years | 66 (14.2%) | 375 (80.5%) |
| 25 to 34 Years | 24 (10.9%) | 197 (89.1%) |
| 35 to 44 Years | 156 (37.0%) | 265 (62.9%) |
| 45 to 54 Years | 44 (12.0%) | 322 (88.0%) |
| 55 to 64 Years | 28 (7.5%) | 331 (88.7%) |
| 65 to 74 Years | 393 (96.6%) | 218 (53.6%) |
| 75 Years and over | 282 (98.6%) | 195 (68.2%) |
| Total | 1,165 (36.4%) | 2,384 (74.4%) |
Disability Status by Sex by Age in Crestview Hills
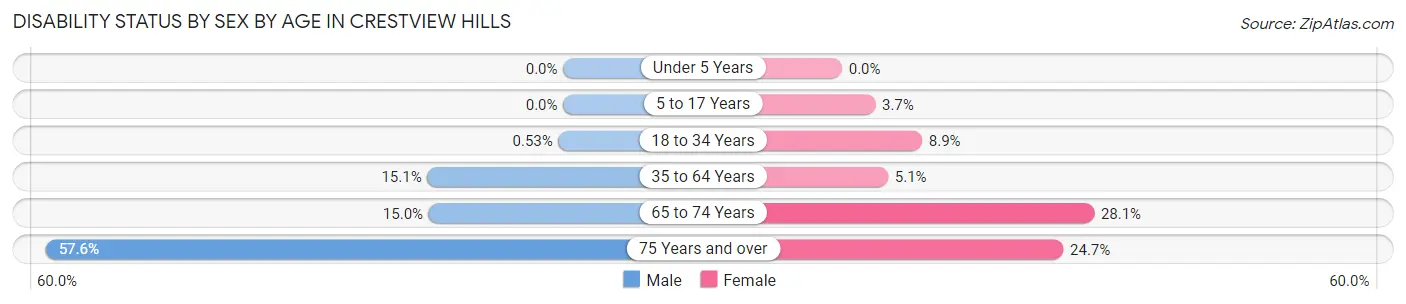
| Age Bracket | Male | Female |
| Under 5 Years | 0 (0.0%) | 0 (0.0%) |
| 5 to 17 Years | 0 (0.0%) | 5 (3.7%) |
| 18 to 34 Years | 3 (0.5%) | 28 (8.9%) |
| 35 to 64 Years | 87 (15.1%) | 30 (5.1%) |
| 65 to 74 Years | 22 (15.0%) | 73 (28.1%) |
| 75 Years and over | 83 (57.6%) | 35 (24.6%) |
Disability Class by Sex by Age in Crestview Hills
Disability Class: Hearing Difficulty
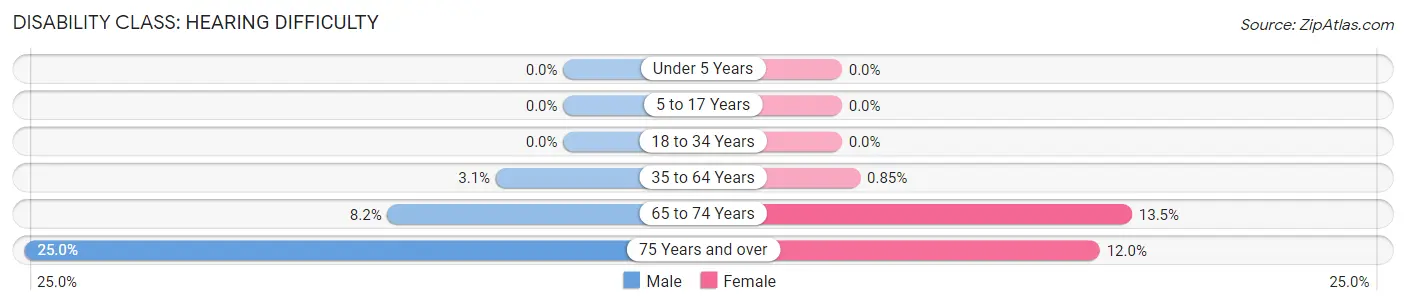
| Age Bracket | Male | Female |
| Under 5 Years | 0 (0.0%) | 0 (0.0%) |
| 5 to 17 Years | 0 (0.0%) | 0 (0.0%) |
| 18 to 34 Years | 0 (0.0%) | 0 (0.0%) |
| 35 to 64 Years | 18 (3.1%) | 5 (0.9%) |
| 65 to 74 Years | 12 (8.2%) | 35 (13.5%) |
| 75 Years and over | 36 (25.0%) | 17 (12.0%) |
Disability Class: Vision Difficulty
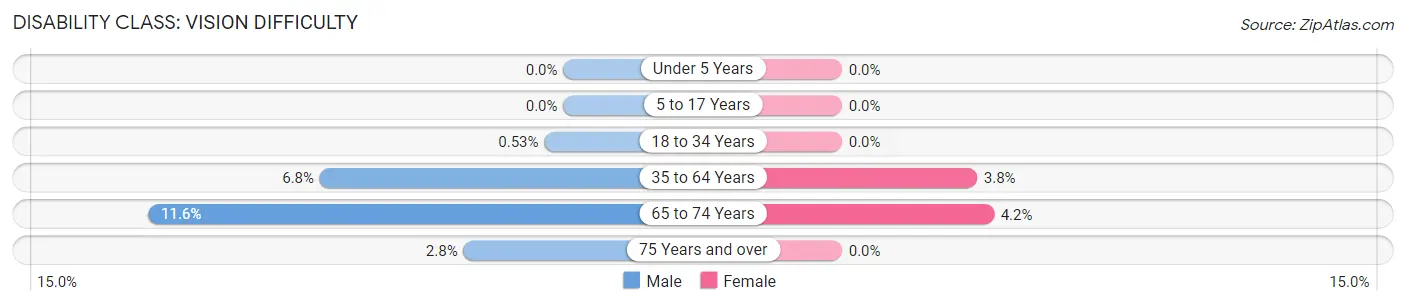
| Age Bracket | Male | Female |
| Under 5 Years | 0 (0.0%) | 0 (0.0%) |
| 5 to 17 Years | 0 (0.0%) | 0 (0.0%) |
| 18 to 34 Years | 3 (0.5%) | 0 (0.0%) |
| 35 to 64 Years | 39 (6.8%) | 22 (3.8%) |
| 65 to 74 Years | 17 (11.6%) | 11 (4.2%) |
| 75 Years and over | 4 (2.8%) | 0 (0.0%) |
Disability Class: Cognitive Difficulty
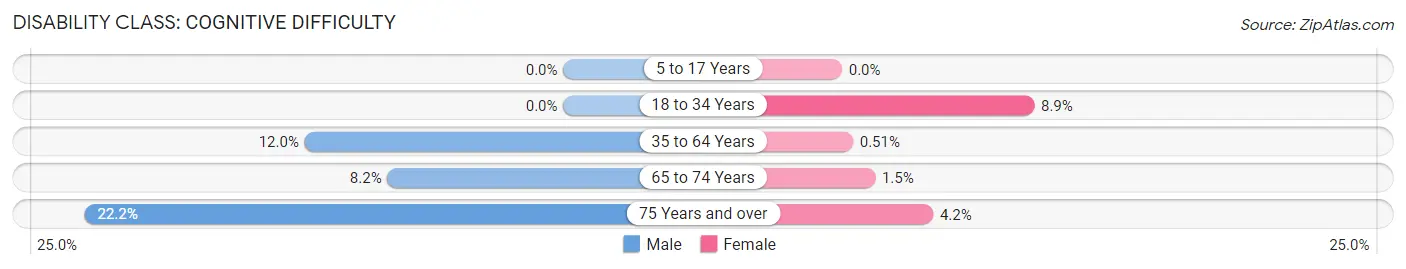
| Age Bracket | Male | Female |
| 5 to 17 Years | 0 (0.0%) | 0 (0.0%) |
| 18 to 34 Years | 0 (0.0%) | 28 (8.9%) |
| 35 to 64 Years | 69 (12.0%) | 3 (0.5%) |
| 65 to 74 Years | 12 (8.2%) | 4 (1.5%) |
| 75 Years and over | 32 (22.2%) | 6 (4.2%) |
Disability Class: Ambulatory Difficulty
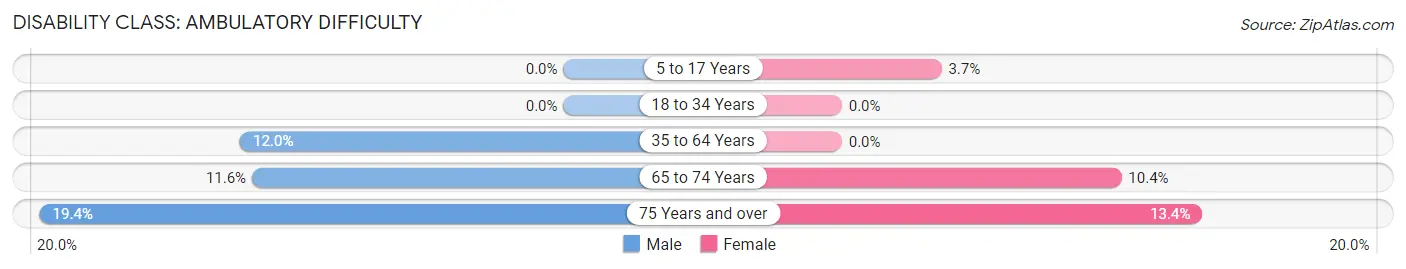
| Age Bracket | Male | Female |
| 5 to 17 Years | 0 (0.0%) | 5 (3.7%) |
| 18 to 34 Years | 0 (0.0%) | 0 (0.0%) |
| 35 to 64 Years | 69 (12.0%) | 0 (0.0%) |
| 65 to 74 Years | 17 (11.6%) | 27 (10.4%) |
| 75 Years and over | 28 (19.4%) | 19 (13.4%) |
Disability Class: Self-Care Difficulty
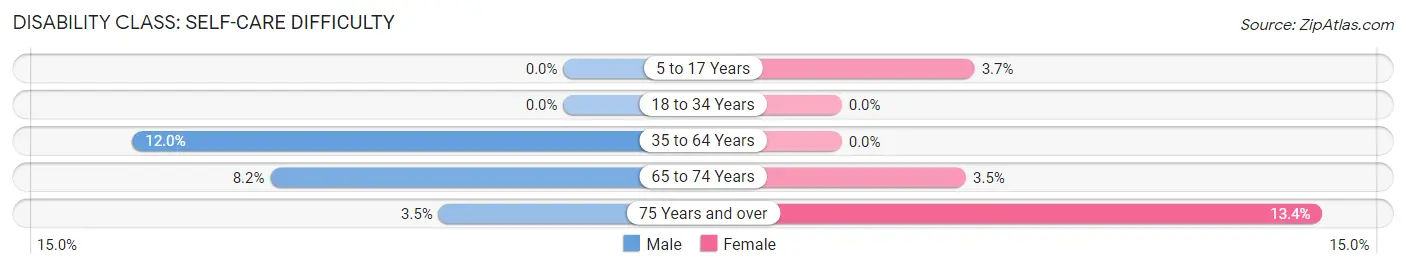
| Age Bracket | Male | Female |
| 5 to 17 Years | 0 (0.0%) | 5 (3.7%) |
| 18 to 34 Years | 0 (0.0%) | 0 (0.0%) |
| 35 to 64 Years | 69 (12.0%) | 0 (0.0%) |
| 65 to 74 Years | 12 (8.2%) | 9 (3.5%) |
| 75 Years and over | 5 (3.5%) | 19 (13.4%) |
Technology Access in Crestview Hills
Computing Device Access in Crestview Hills
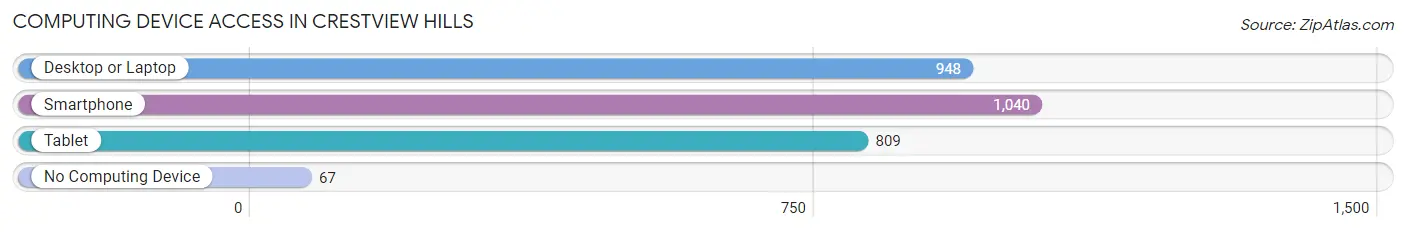
| Device Type | # Households | % Households |
| Desktop or Laptop | 948 | 78.7% |
| Smartphone | 1,040 | 86.4% |
| Tablet | 809 | 67.2% |
| No Computing Device | 67 | 5.6% |
| Total | 1,204 | 100.0% |
Internet Access in Crestview Hills
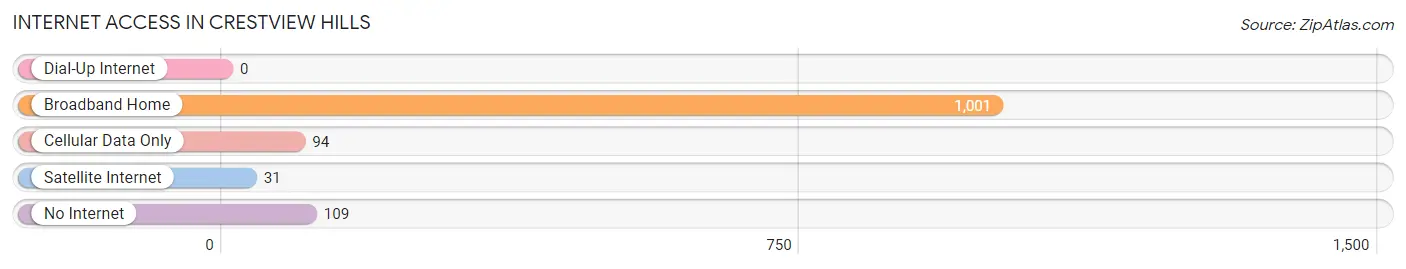
| Internet Type | # Households | % Households |
| Dial-Up Internet | 0 | 0.0% |
| Broadband Home | 1,001 | 83.1% |
| Cellular Data Only | 94 | 7.8% |
| Satellite Internet | 31 | 2.6% |
| No Internet | 109 | 9.0% |
| Total | 1,204 | 100.0% |
Crestview Hills Summary
Crestview Hills is a city located in northern Kentucky, in the United States. It is part of the Cincinnati metropolitan area and is located in Kenton County. The city has a population of 4,817 as of the 2010 census.
History
Crestview Hills was founded in the 1950s as a planned community. The city was incorporated in 1959 and was named after the nearby hills. The city was designed to be a residential community, and it has remained that way ever since.
The city was originally part of the larger city of Fort Thomas, but it was separated in 1959. The city was designed to be a residential community, and it has remained that way ever since.
Geography
Crestview Hills is located in northern Kentucky, in the United States. It is part of the Cincinnati metropolitan area and is located in Kenton County. The city has a total area of 2.2 square miles, all of which is land.
The city is located on the Ohio River, and it is bordered by the cities of Fort Thomas, Newport, and Wilder. The city is located near the I-275 and I-471 highways, which provide access to the rest of the Cincinnati metropolitan area.
Economy
Crestview Hills is primarily a residential community, and the city does not have a large industrial or commercial base. The city does have some retail businesses, including a grocery store, a pharmacy, and a few restaurants.
The city is home to several corporate headquarters, including the headquarters of the Kroger Company, the parent company of the grocery store chain. The city is also home to the headquarters of the Ashland Oil Company, a petroleum refining and marketing company.
Demographics
As of the 2010 census, the city had a population of 4,817. The racial makeup of the city was 94.3% White, 2.2% African American, 0.2% Native American, 1.2% Asian, 0.1% Pacific Islander, 0.7% from other races, and 1.4% from two or more races. Hispanic or Latino of any race were 2.2% of the population.
The median income for a household in the city was $68,958, and the median income for a family was $77,958. The per capita income for the city was $31,958. About 3.2% of families and 4.2% of the population were below the poverty line, including 5.2% of those under age 18 and 4.2% of those age 65 or over.
Conclusion
Crestview Hills is a small city located in northern Kentucky, in the United States. It is part of the Cincinnati metropolitan area and is located in Kenton County. The city has a population of 4,817 as of the 2010 census. The city was founded in the 1950s as a planned community and has remained a primarily residential community ever since. The city is home to several corporate headquarters, including the headquarters of the Kroger Company and the Ashland Oil Company. The city has a median income of $68,958 and a per capita income of $31,958.
Common Questions
What is Per Capita Income in Crestview Hills?
Per Capita income in Crestview Hills is $46,457.
What is the Median Family Income in Crestview Hills?
Median Family Income in Crestview Hills is $118,816.
What is the Median Household income in Crestview Hills?
Median Household Income in Crestview Hills is $107,857.
What is Income or Wage Gap in Crestview Hills?
Income or Wage Gap in Crestview Hills is 14.8%.
Women in Crestview Hills earn 85.2 cents for every dollar earned by a man.
What is Inequality or Gini Index in Crestview Hills?
Inequality or Gini Index in Crestview Hills is 0.41.
What is the Total Population of Crestview Hills?
Total Population of Crestview Hills is 3,212.
What is the Total Male Population of Crestview Hills?
Total Male Population of Crestview Hills is 1,741.
What is the Total Female Population of Crestview Hills?
Total Female Population of Crestview Hills is 1,471.
What is the Ratio of Males per 100 Females in Crestview Hills?
There are 118.35 Males per 100 Females in Crestview Hills.
What is the Ratio of Females per 100 Males in Crestview Hills?
There are 84.49 Females per 100 Males in Crestview Hills.
What is the Median Population Age in Crestview Hills?
Median Population Age in Crestview Hills is 39.2 Years.
What is the Average Family Size in Crestview Hills
Average Family Size in Crestview Hills is 2.9 People.
What is the Average Household Size in Crestview Hills
Average Household Size in Crestview Hills is 2.4 People.
How Large is the Labor Force in Crestview Hills?
There are 1,877 People in the Labor Forcein in Crestview Hills.
What is the Percentage of People in the Labor Force in Crestview Hills?
66.2% of People are in the Labor Force in Crestview Hills.
What is the Unemployment Rate in Crestview Hills?
Unemployment Rate in Crestview Hills is 5.4%.