Marion, KY Map & Demographics
Marion Map
Marion Overview
$25,336
PER CAPITA INCOME
$54,375
AVG FAMILY INCOME
$38,023
AVG HOUSEHOLD INCOME
60.6%
WAGE / INCOME GAP [ % ]
39.4¢/ $1
WAGE / INCOME GAP [ $ ]
$15,836
FAMILY INCOME DEFICIT
0.46
INEQUALITY / GINI INDEX
2,905
TOTAL POPULATION
1,429
MALE POPULATION
1,476
FEMALE POPULATION
96.82
MALES / 100 FEMALES
103.29
FEMALES / 100 MALES
47.4
MEDIAN AGE
3.4
AVG FAMILY SIZE
2.4
AVG HOUSEHOLD SIZE
1,034
LABOR FORCE [ PEOPLE ]
43.1%
PERCENT IN LABOR FORCE
2.5%
UNEMPLOYMENT RATE
Marion Zip Codes
Marion Area Codes
Income in Marion
Income Overview in Marion
Per Capita Income in Marion is $25,336, while median incomes of families and households are $54,375 and $38,023 respectively.
| Characteristic | Number | Measure |
| Per Capita Income | 2,905 | $25,336 |
| Median Family Income | 560 | $54,375 |
| Mean Family Income | 560 | $67,045 |
| Median Household Income | 1,119 | $38,023 |
| Mean Household Income | 1,119 | $54,855 |
| Income Deficit | 560 | $15,836 |
| Wage / Income Gap (%) | 2,905 | 60.56% |
| Wage / Income Gap ($) | 2,905 | 39.44¢ per $1 |
| Gini / Inequality Index | 2,905 | 0.46 |
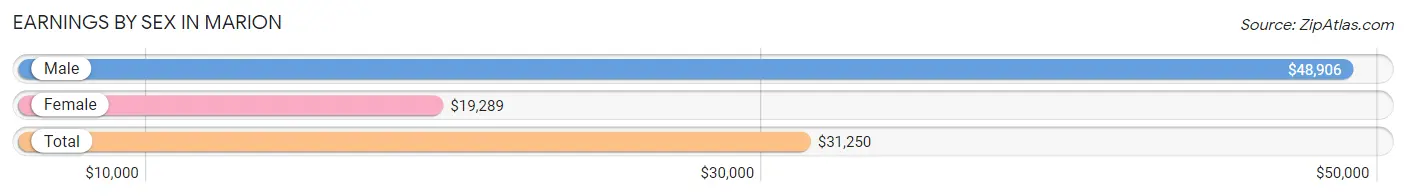
Earnings by Sex in Marion
Average Earnings in Marion are $31,250, $48,906 for men and $19,289 for women, a difference of 60.6%.
| Sex | Number | Average Earnings |
| Male | 702 (60.7%) | $48,906 |
| Female | 455 (39.3%) | $19,289 |
| Total | 1,157 (100.0%) | $31,250 |
Earnings by Sex by Income Bracket in Marion
The most common earnings brackets in Marion are $65,000 to $74,999 for men (137 | 19.5%) and $12,500 to $14,999 for women (88 | 19.3%).
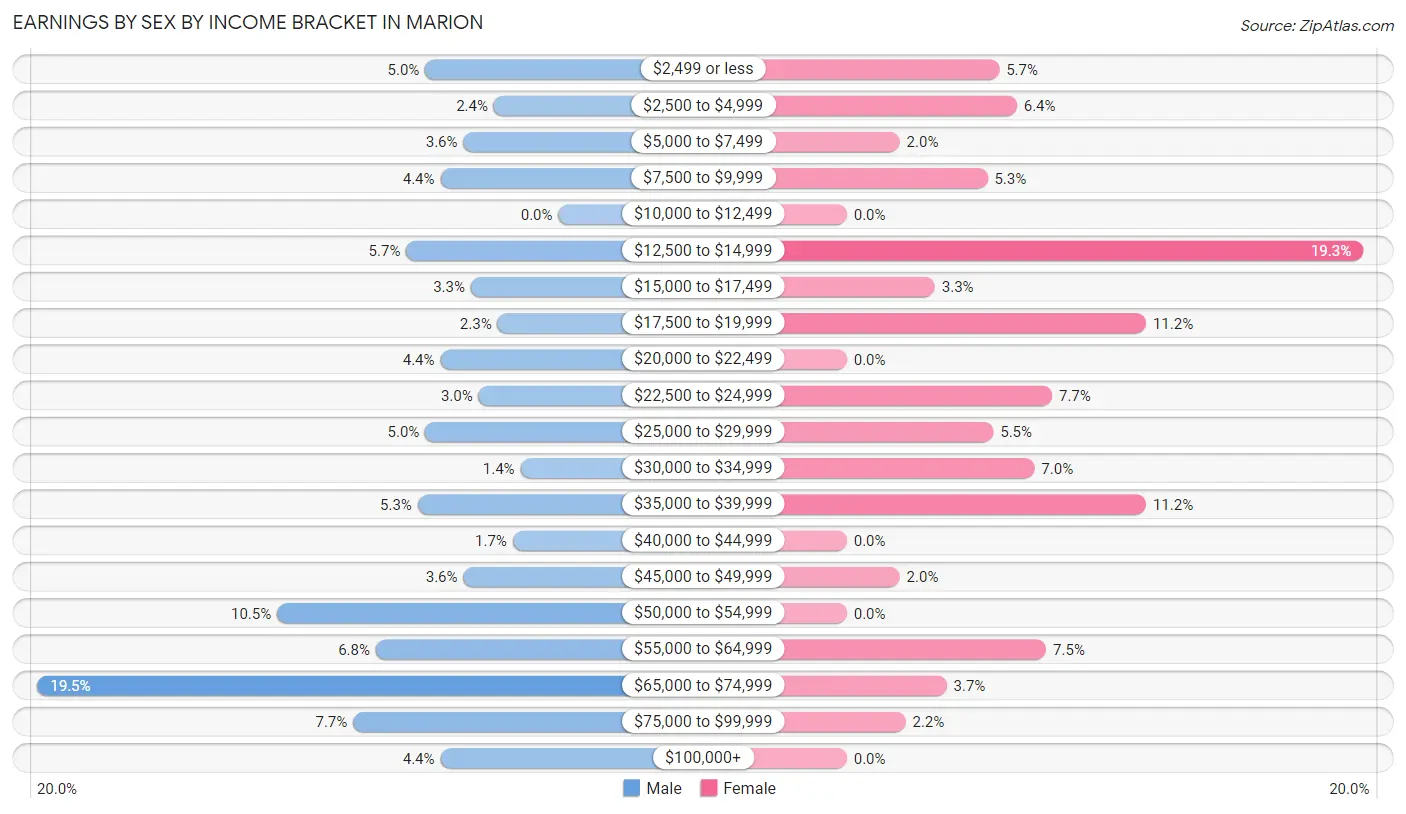
| Income | Male | Female |
| $2,499 or less | 35 (5.0%) | 26 (5.7%) |
| $2,500 to $4,999 | 17 (2.4%) | 29 (6.4%) |
| $5,000 to $7,499 | 25 (3.6%) | 9 (2.0%) |
| $7,500 to $9,999 | 31 (4.4%) | 24 (5.3%) |
| $10,000 to $12,499 | 0 (0.0%) | 0 (0.0%) |
| $12,500 to $14,999 | 40 (5.7%) | 88 (19.3%) |
| $15,000 to $17,499 | 23 (3.3%) | 15 (3.3%) |
| $17,500 to $19,999 | 16 (2.3%) | 51 (11.2%) |
| $20,000 to $22,499 | 31 (4.4%) | 0 (0.0%) |
| $22,500 to $24,999 | 21 (3.0%) | 35 (7.7%) |
| $25,000 to $29,999 | 35 (5.0%) | 25 (5.5%) |
| $30,000 to $34,999 | 10 (1.4%) | 32 (7.0%) |
| $35,000 to $39,999 | 37 (5.3%) | 51 (11.2%) |
| $40,000 to $44,999 | 12 (1.7%) | 0 (0.0%) |
| $45,000 to $49,999 | 25 (3.6%) | 9 (2.0%) |
| $50,000 to $54,999 | 74 (10.5%) | 0 (0.0%) |
| $55,000 to $64,999 | 48 (6.8%) | 34 (7.5%) |
| $65,000 to $74,999 | 137 (19.5%) | 17 (3.7%) |
| $75,000 to $99,999 | 54 (7.7%) | 10 (2.2%) |
| $100,000+ | 31 (4.4%) | 0 (0.0%) |
| Total | 702 (100.0%) | 455 (100.0%) |
Earnings by Sex by Educational Attainment in Marion
Average earnings in Marion are $51,094 for men and $25,563 for women, a difference of 50.0%. Men with an educational attainment of high school diploma enjoy the highest average annual earnings of $55,128, while those with less than high school education earn the least with $16,739. Women with an educational attainment of bachelor's degree earn the most with the average annual earnings of $37,857, while those with college or associate's degree education have the smallest earnings of $27,212.
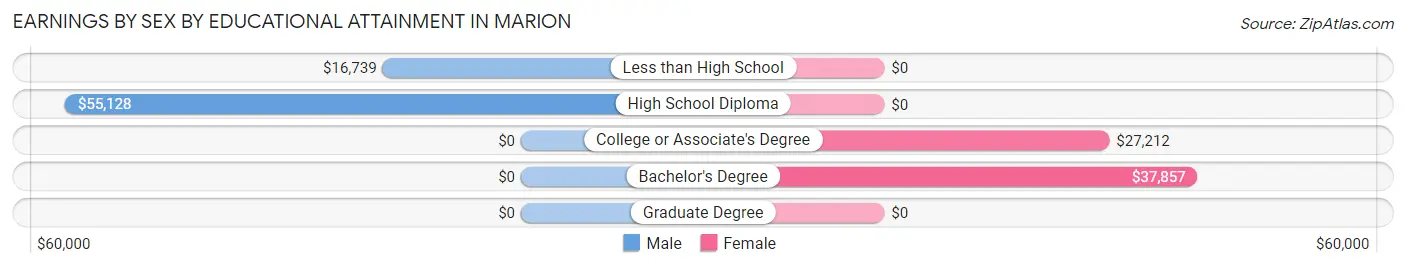
| Educational Attainment | Male Income | Female Income |
| Less than High School | $16,739 | $0 |
| High School Diploma | $55,128 | $0 |
| College or Associate's Degree | - | - |
| Bachelor's Degree | - | - |
| Graduate Degree | - | - |
| Total | $51,094 | $25,563 |
Family Income in Marion
Family Income Brackets in Marion
According to the Marion family income data, there are 157 families falling into the $75,000 to $99,999 income range, which is the most common income bracket and makes up 28.0% of all families.
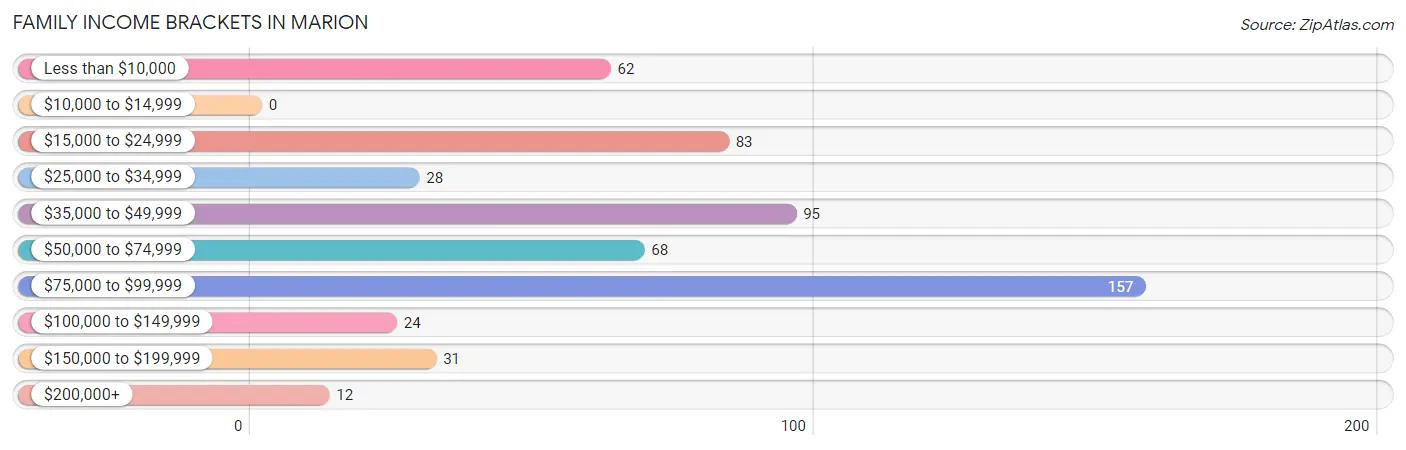
| Income Bracket | # Families | % Families |
| Less than $10,000 | 62 | 11.1% |
| $10,000 to $14,999 | 0 | 0.0% |
| $15,000 to $24,999 | 83 | 14.8% |
| $25,000 to $34,999 | 28 | 5.0% |
| $35,000 to $49,999 | 95 | 17.0% |
| $50,000 to $74,999 | 68 | 12.1% |
| $75,000 to $99,999 | 157 | 28.0% |
| $100,000 to $149,999 | 24 | 4.3% |
| $150,000 to $199,999 | 31 | 5.5% |
| $200,000+ | 12 | 2.1% |
Family Income by Famaliy Size in Marion
4-person families (58 | 10.4%) account for the highest median family income in Marion with $77,000 per family, while 2-person families (288 | 51.4%) have the highest median income of $26,719 per family member.
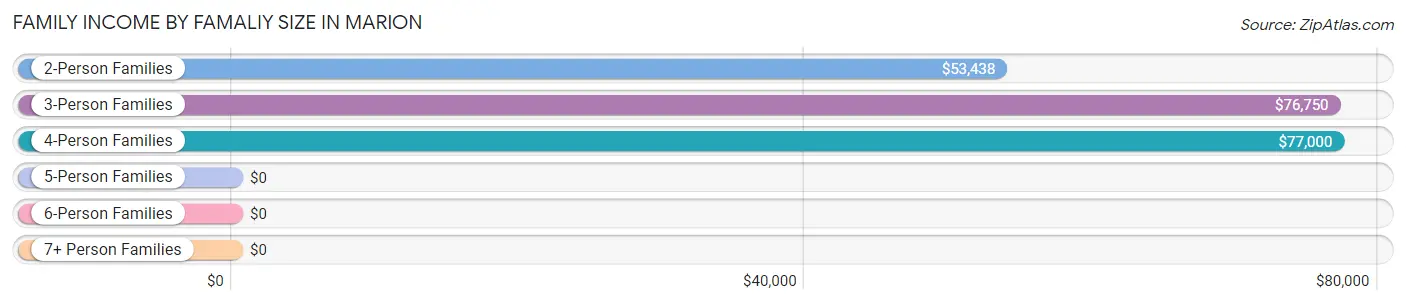
| Income Bracket | # Families | Median Income |
| 2-Person Families | 288 (51.4%) | $53,438 |
| 3-Person Families | 163 (29.1%) | $76,750 |
| 4-Person Families | 58 (10.4%) | $77,000 |
| 5-Person Families | 36 (6.4%) | $0 |
| 6-Person Families | 12 (2.1%) | $0 |
| 7+ Person Families | 3 (0.5%) | $0 |
| Total | 560 (100.0%) | $54,375 |
Family Income by Number of Earners in Marion
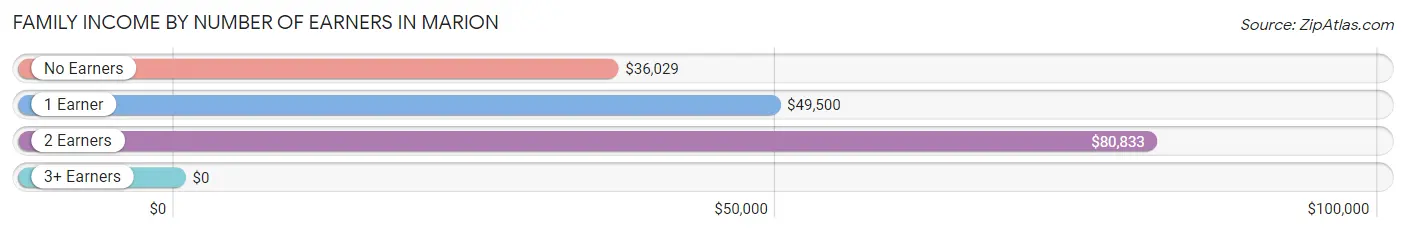
| Number of Earners | # Families | Median Income |
| No Earners | 114 (20.4%) | $36,029 |
| 1 Earner | 308 (55.0%) | $49,500 |
| 2 Earners | 126 (22.5%) | $80,833 |
| 3+ Earners | 12 (2.1%) | $0 |
| Total | 560 (100.0%) | $54,375 |
Household Income in Marion
Household Income Brackets in Marion
With 216 households falling in the category, the $75,000 to $99,999 income range is the most frequent in Marion, accounting for 19.3% of all households. In contrast, only 8 households (0.7%) fall into the $150,000 to $199,999 income bracket, making it the least populous group.
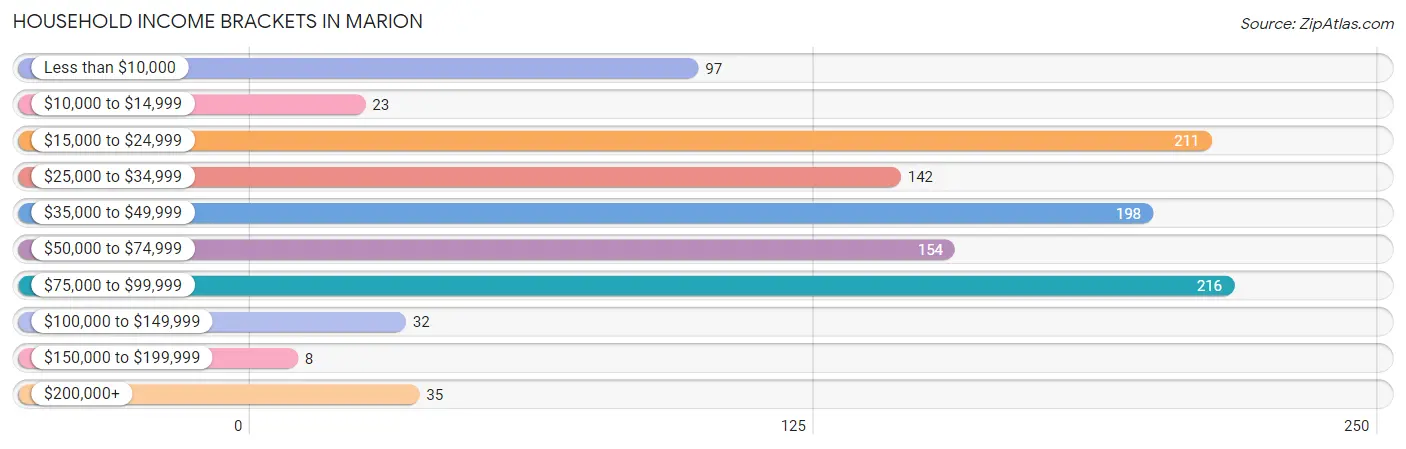
| Income Bracket | # Households | % Households |
| Less than $10,000 | 97 | 8.7% |
| $10,000 to $14,999 | 23 | 2.1% |
| $15,000 to $24,999 | 211 | 18.9% |
| $25,000 to $34,999 | 142 | 12.7% |
| $35,000 to $49,999 | 198 | 17.7% |
| $50,000 to $74,999 | 154 | 13.8% |
| $75,000 to $99,999 | 216 | 19.3% |
| $100,000 to $149,999 | 32 | 2.9% |
| $150,000 to $199,999 | 8 | 0.7% |
| $200,000+ | 35 | 3.1% |
Household Income by Householder Age in Marion
The median household income in Marion is $38,023, with the highest median household income of $44,457 found in the 25 to 44 years age bracket for the primary householder. A total of 142 households (12.7%) fall into this category. Meanwhile, the 15 to 24 years age bracket for the primary householder has the lowest median household income of $0, with 76 households (6.8%) in this group.
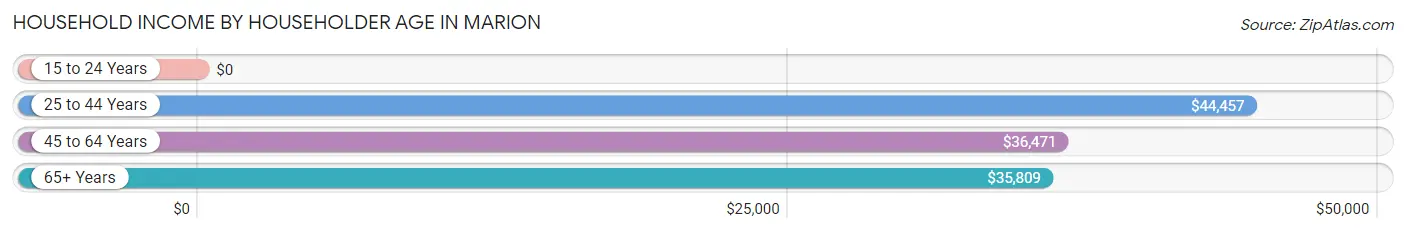
| Income Bracket | # Households | Median Income |
| 15 to 24 Years | 76 (6.8%) | $0 |
| 25 to 44 Years | 142 (12.7%) | $44,457 |
| 45 to 64 Years | 392 (35.0%) | $36,471 |
| 65+ Years | 509 (45.5%) | $35,809 |
| Total | 1,119 (100.0%) | $38,023 |
Poverty in Marion
Income Below Poverty by Sex and Age in Marion
With 21.6% poverty level for males and 19.7% for females among the residents of Marion, 16 and 17 year old males and 12 to 14 year old females are the most vulnerable to poverty, with 4 males (100.0%) and 4 females (100.0%) in their respective age groups living below the poverty level.
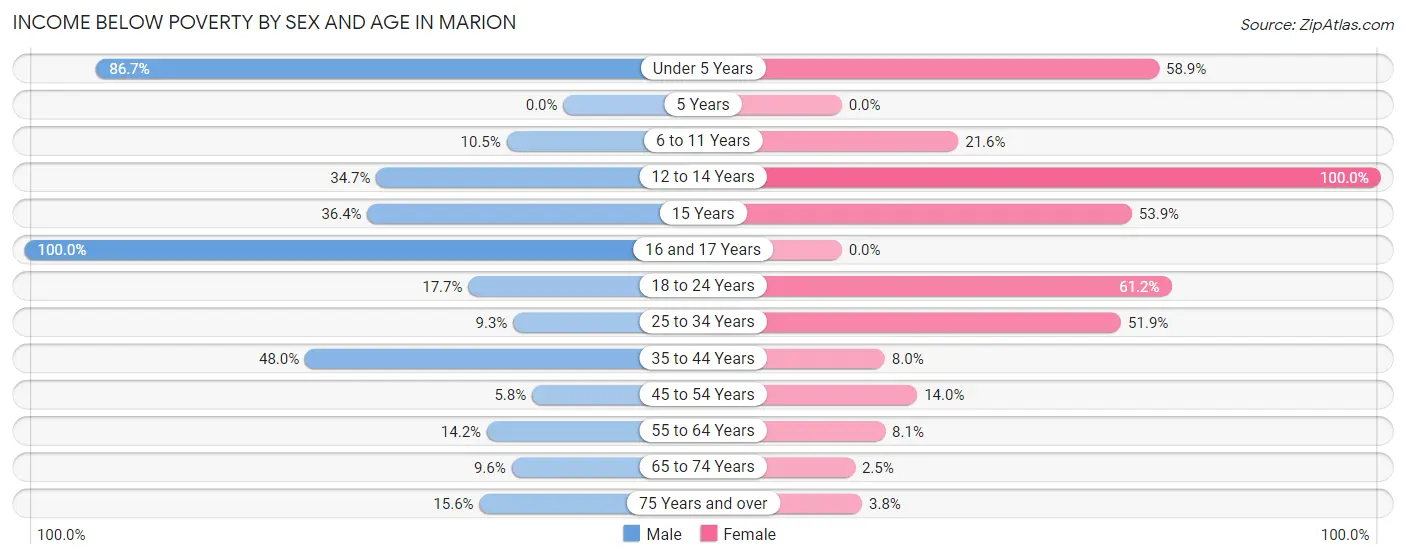
| Age Bracket | Male | Female |
| Under 5 Years | 104 (86.7%) | 43 (58.9%) |
| 5 Years | 0 (0.0%) | 0 (0.0%) |
| 6 to 11 Years | 10 (10.5%) | 16 (21.6%) |
| 12 to 14 Years | 25 (34.7%) | 4 (100.0%) |
| 15 Years | 4 (36.4%) | 14 (53.8%) |
| 16 and 17 Years | 4 (100.0%) | 0 (0.0%) |
| 18 to 24 Years | 24 (17.6%) | 96 (61.2%) |
| 25 to 34 Years | 11 (9.3%) | 28 (51.8%) |
| 35 to 44 Years | 35 (47.9%) | 14 (8.0%) |
| 45 to 54 Years | 15 (5.8%) | 28 (14.0%) |
| 55 to 64 Years | 22 (14.2%) | 14 (8.1%) |
| 65 to 74 Years | 15 (9.6%) | 5 (2.5%) |
| 75 Years and over | 12 (15.6%) | 8 (3.8%) |
| Total | 281 (21.6%) | 270 (19.7%) |
Income Above Poverty by Sex and Age in Marion
According to the poverty statistics in Marion, males aged 5 years and females aged 5 years are the age groups that are most secure financially, with 100.0% of males and 100.0% of females in these age groups living above the poverty line.
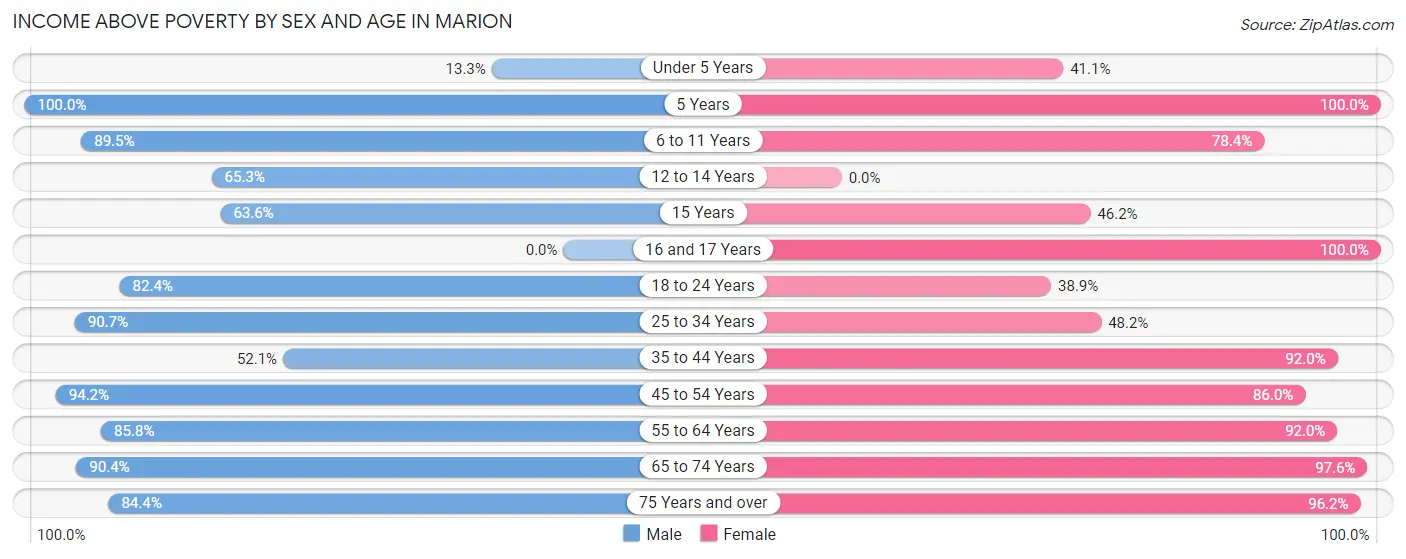
| Age Bracket | Male | Female |
| Under 5 Years | 16 (13.3%) | 30 (41.1%) |
| 5 Years | 25 (100.0%) | 7 (100.0%) |
| 6 to 11 Years | 85 (89.5%) | 58 (78.4%) |
| 12 to 14 Years | 47 (65.3%) | 0 (0.0%) |
| 15 Years | 7 (63.6%) | 12 (46.2%) |
| 16 and 17 Years | 0 (0.0%) | 8 (100.0%) |
| 18 to 24 Years | 112 (82.4%) | 61 (38.9%) |
| 25 to 34 Years | 107 (90.7%) | 26 (48.1%) |
| 35 to 44 Years | 38 (52.0%) | 161 (92.0%) |
| 45 to 54 Years | 243 (94.2%) | 172 (86.0%) |
| 55 to 64 Years | 133 (85.8%) | 160 (91.9%) |
| 65 to 74 Years | 141 (90.4%) | 199 (97.6%) |
| 75 Years and over | 65 (84.4%) | 204 (96.2%) |
| Total | 1,019 (78.4%) | 1,098 (80.3%) |
Income Below Poverty Among Married-Couple Families in Marion
The poverty statistics for married-couple families in Marion show that 15.2% or 46 of the total 302 families live below the poverty line. Families with 3 or 4 children have the highest poverty rate of 82.9%, comprising of 34 families. On the other hand, families with 1 or 2 children have the lowest poverty rate of 0.0%, which includes 0 families.
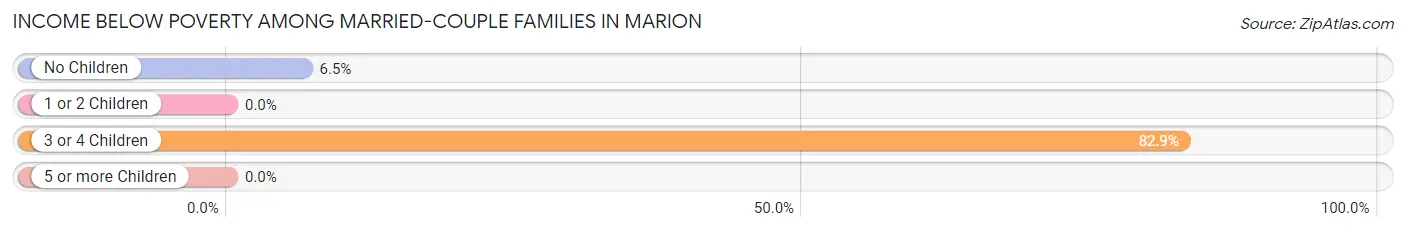
| Children | Above Poverty | Below Poverty |
| No Children | 173 (93.5%) | 12 (6.5%) |
| 1 or 2 Children | 76 (100.0%) | 0 (0.0%) |
| 3 or 4 Children | 7 (17.1%) | 34 (82.9%) |
| 5 or more Children | 0 (0.0%) | 0 (0.0%) |
| Total | 256 (84.8%) | 46 (15.2%) |
Income Below Poverty Among Single-Parent Households in Marion
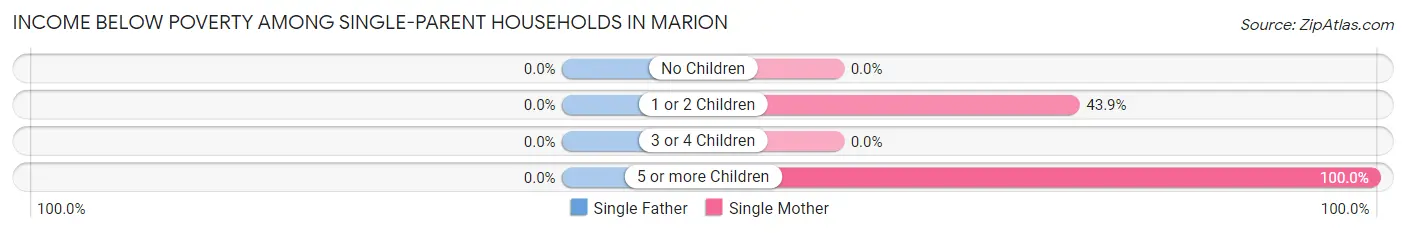
| Children | Single Father | Single Mother |
| No Children | 0 (0.0%) | 0 (0.0%) |
| 1 or 2 Children | 0 (0.0%) | 54 (43.9%) |
| 3 or 4 Children | 0 (0.0%) | 0 (0.0%) |
| 5 or more Children | 0 (0.0%) | 3 (100.0%) |
| Total | 0 (0.0%) | 57 (25.0%) |
Income Below Poverty Among Married-Couple vs Single-Parent Households in Marion
The poverty data for Marion shows that 46 of the married-couple family households (15.2%) and 57 of the single-parent households (22.1%) are living below the poverty level. Within the married-couple family households, those with 3 or 4 children have the highest poverty rate, with 34 households (82.9%) falling below the poverty line. Among the single-parent households, those with 5 or more children have the highest poverty rate, with 3 household (100.0%) living below poverty.
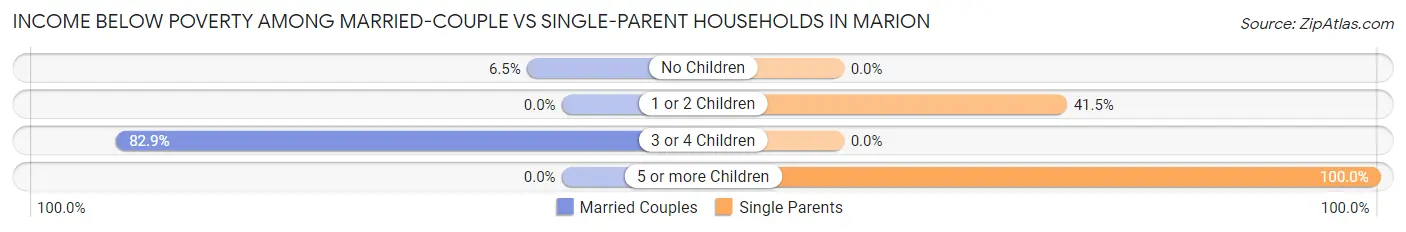
| Children | Married-Couple Families | Single-Parent Households |
| No Children | 12 (6.5%) | 0 (0.0%) |
| 1 or 2 Children | 0 (0.0%) | 54 (41.5%) |
| 3 or 4 Children | 34 (82.9%) | 0 (0.0%) |
| 5 or more Children | 0 (0.0%) | 3 (100.0%) |
| Total | 46 (15.2%) | 57 (22.1%) |
Race in Marion
The most populous races in Marion are White / Caucasian (2,726 | 93.8%), Hispanic or Latino (107 | 3.7%), and Two or more Races (87 | 3.0%).
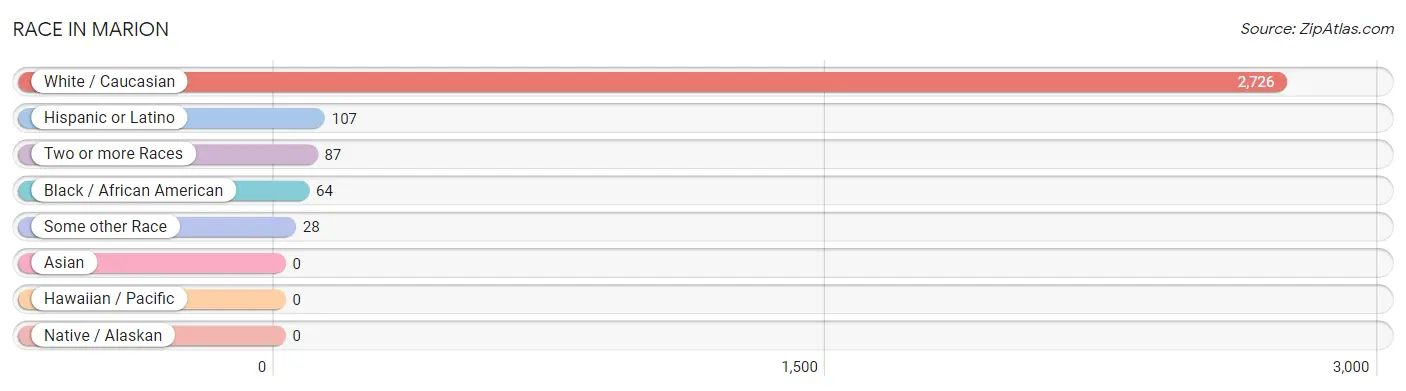
| Race | # Population | % Population |
| Asian | 0 | 0.0% |
| Black / African American | 64 | 2.2% |
| Hawaiian / Pacific | 0 | 0.0% |
| Hispanic or Latino | 107 | 3.7% |
| Native / Alaskan | 0 | 0.0% |
| White / Caucasian | 2,726 | 93.8% |
| Two or more Races | 87 | 3.0% |
| Some other Race | 28 | 1.0% |
| Total | 2,905 | 100.0% |
Ancestry in Marion
The most populous ancestries reported in Marion are Irish (502 | 17.3%), American (306 | 10.5%), European (301 | 10.4%), English (293 | 10.1%), and German (244 | 8.4%), together accounting for 56.7% of all Marion residents.
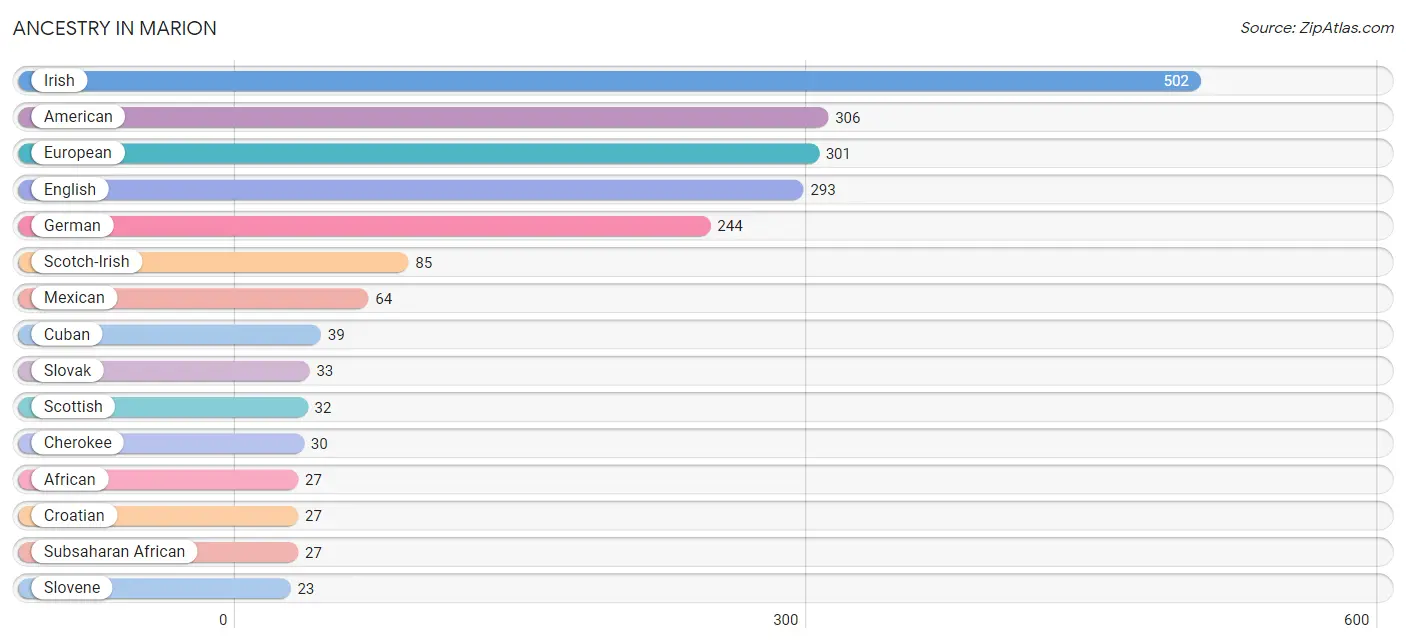
| Ancestry | # Population | % Population |
| African | 27 | 0.9% |
| American | 306 | 10.5% |
| Blackfeet | 13 | 0.4% |
| Central American | 4 | 0.1% |
| Cherokee | 30 | 1.0% |
| Creek | 11 | 0.4% |
| Croatian | 27 | 0.9% |
| Cuban | 39 | 1.3% |
| English | 293 | 10.1% |
| European | 301 | 10.4% |
| French | 10 | 0.3% |
| German | 244 | 8.4% |
| Guatemalan | 4 | 0.1% |
| Irish | 502 | 17.3% |
| Italian | 8 | 0.3% |
| Jamaican | 3 | 0.1% |
| Mexican | 64 | 2.2% |
| Polish | 10 | 0.3% |
| Russian | 10 | 0.3% |
| Scotch-Irish | 85 | 2.9% |
| Scottish | 32 | 1.1% |
| Slovak | 33 | 1.1% |
| Slovene | 23 | 0.8% |
| Subsaharan African | 27 | 0.9% |
| Swedish | 11 | 0.4% |
| Welsh | 14 | 0.5% | View All 26 Rows |
Immigrants in Marion
The most numerous immigrant groups reported in Marion came from Czechoslovakia (23 | 0.8%), Eastern Europe (23 | 0.8%), Europe (23 | 0.8%), Central America (4 | 0.1%), and Guatemala (4 | 0.1%), together accounting for 2.6% of all Marion residents.
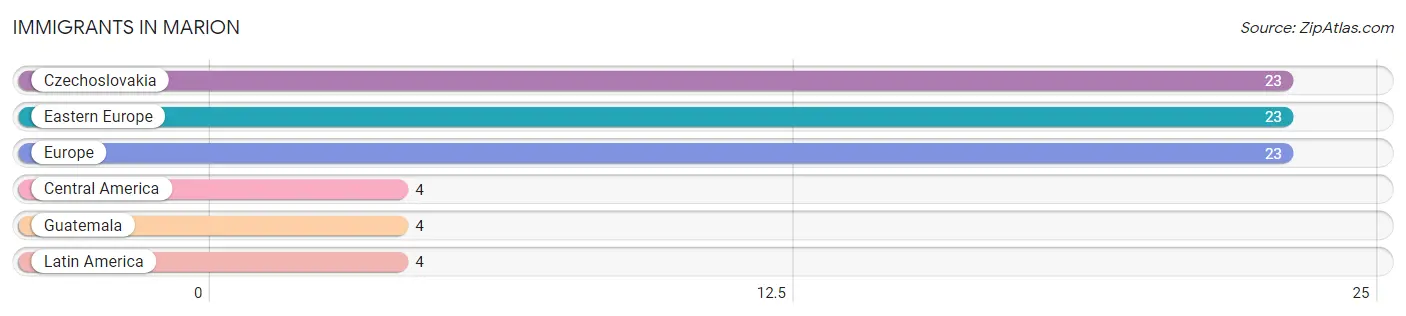
| Immigration Origin | # Population | % Population |
| Central America | 4 | 0.1% |
| Czechoslovakia | 23 | 0.8% |
| Eastern Europe | 23 | 0.8% |
| Europe | 23 | 0.8% |
| Guatemala | 4 | 0.1% |
| Latin America | 4 | 0.1% | View All 6 Rows |
Sex and Age in Marion
Sex and Age in Marion
The most populous age groups in Marion are 50 to 54 Years (161 | 11.3%) for men and 20 to 24 Years (131 | 8.9%) for women.
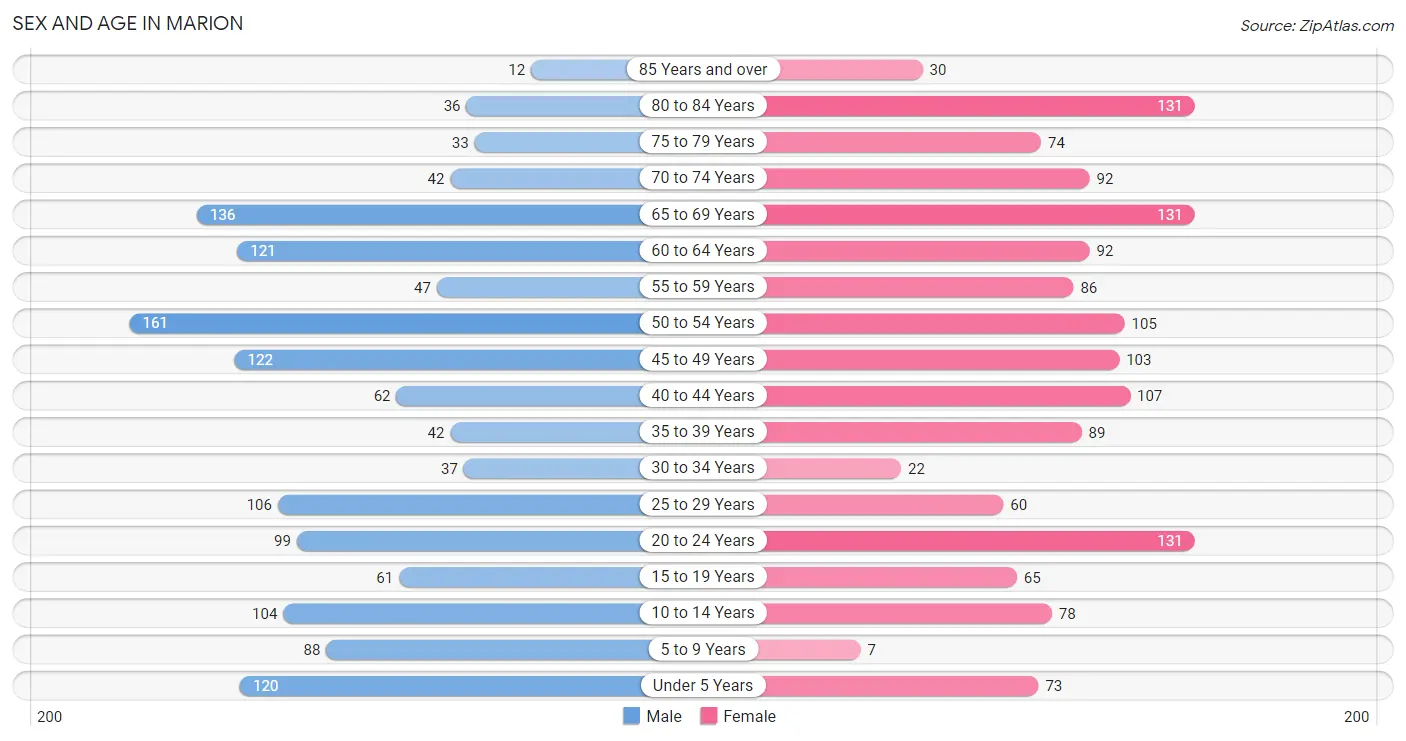
| Age Bracket | Male | Female |
| Under 5 Years | 120 (8.4%) | 73 (5.0%) |
| 5 to 9 Years | 88 (6.2%) | 7 (0.5%) |
| 10 to 14 Years | 104 (7.3%) | 78 (5.3%) |
| 15 to 19 Years | 61 (4.3%) | 65 (4.4%) |
| 20 to 24 Years | 99 (6.9%) | 131 (8.9%) |
| 25 to 29 Years | 106 (7.4%) | 60 (4.1%) |
| 30 to 34 Years | 37 (2.6%) | 22 (1.5%) |
| 35 to 39 Years | 42 (2.9%) | 89 (6.0%) |
| 40 to 44 Years | 62 (4.3%) | 107 (7.2%) |
| 45 to 49 Years | 122 (8.5%) | 103 (7.0%) |
| 50 to 54 Years | 161 (11.3%) | 105 (7.1%) |
| 55 to 59 Years | 47 (3.3%) | 86 (5.8%) |
| 60 to 64 Years | 121 (8.5%) | 92 (6.2%) |
| 65 to 69 Years | 136 (9.5%) | 131 (8.9%) |
| 70 to 74 Years | 42 (2.9%) | 92 (6.2%) |
| 75 to 79 Years | 33 (2.3%) | 74 (5.0%) |
| 80 to 84 Years | 36 (2.5%) | 131 (8.9%) |
| 85 Years and over | 12 (0.8%) | 30 (2.0%) |
| Total | 1,429 (100.0%) | 1,476 (100.0%) |
Families and Households in Marion
Median Family Size in Marion
The median family size in Marion is 3.41 persons per family, with married-couple families (302 | 53.9%) accounting for the largest median family size of 3.6 persons per family. On the other hand, single male/father families (30 | 5.4%) represent the smallest median family size with 3.17 persons per family.
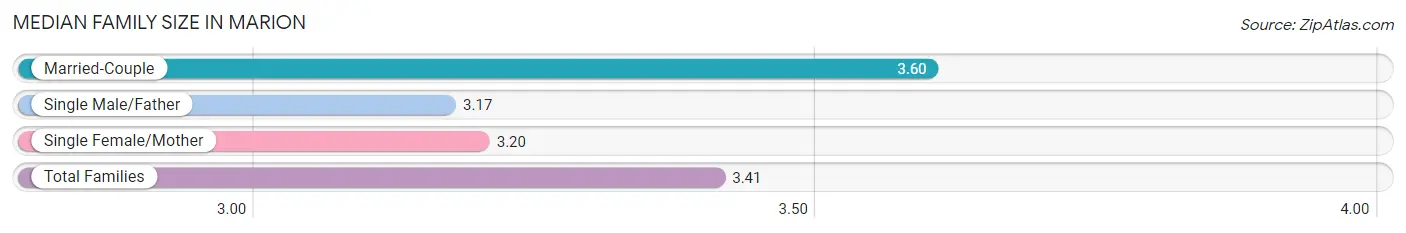
| Family Type | # Families | Family Size |
| Married-Couple | 302 (53.9%) | 3.60 |
| Single Male/Father | 30 (5.4%) | 3.17 |
| Single Female/Mother | 228 (40.7%) | 3.20 |
| Total Families | 560 (100.0%) | 3.41 |
Median Household Size in Marion
The median household size in Marion is 2.38 persons per household, with single male/father households (30 | 2.7%) accounting for the largest median household size of 4.8 persons per household. non-family households (559 | 50.0%) represent the smallest median household size with 1.09 persons per household.
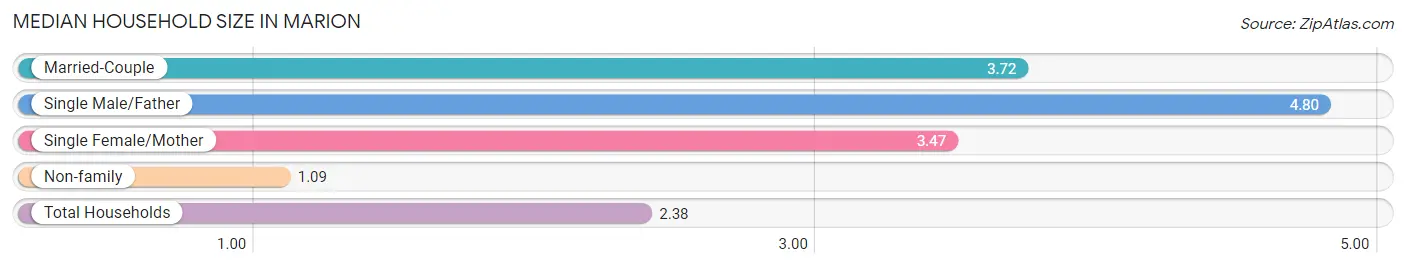
| Household Type | # Households | Household Size |
| Married-Couple | 302 (27.0%) | 3.72 |
| Single Male/Father | 30 (2.7%) | 4.80 |
| Single Female/Mother | 228 (20.4%) | 3.47 |
| Non-family | 559 (50.0%) | 1.09 |
| Total Households | 1,119 (100.0%) | 2.38 |
Household Size by Marriage Status in Marion
Out of a total of 1,119 households in Marion, 560 (50.0%) are family households, while 559 (50.0%) are nonfamily households. The most numerous type of family households are 2-person households, comprising 255, and the most common type of nonfamily households are 1-person households, comprising 530.
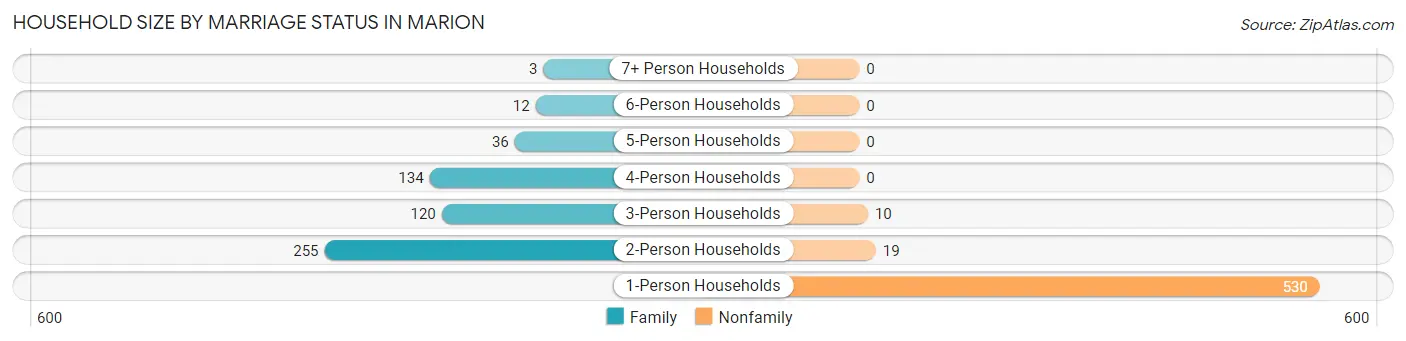
| Household Size | Family Households | Nonfamily Households |
| 1-Person Households | - | 530 (47.4%) |
| 2-Person Households | 255 (22.8%) | 19 (1.7%) |
| 3-Person Households | 120 (10.7%) | 10 (0.9%) |
| 4-Person Households | 134 (12.0%) | 0 (0.0%) |
| 5-Person Households | 36 (3.2%) | 0 (0.0%) |
| 6-Person Households | 12 (1.1%) | 0 (0.0%) |
| 7+ Person Households | 3 (0.3%) | 0 (0.0%) |
| Total | 560 (50.0%) | 559 (50.0%) |
Female Fertility in Marion
Fertility by Age in Marion
Average fertility rate in Marion is 104.0 births per 1,000 women. Women in the age bracket of 20 to 34 years have the highest fertility rate with 239.0 births per 1,000 women. Women in the age bracket of 20 to 34 years acount for 82.3% of all women with births.
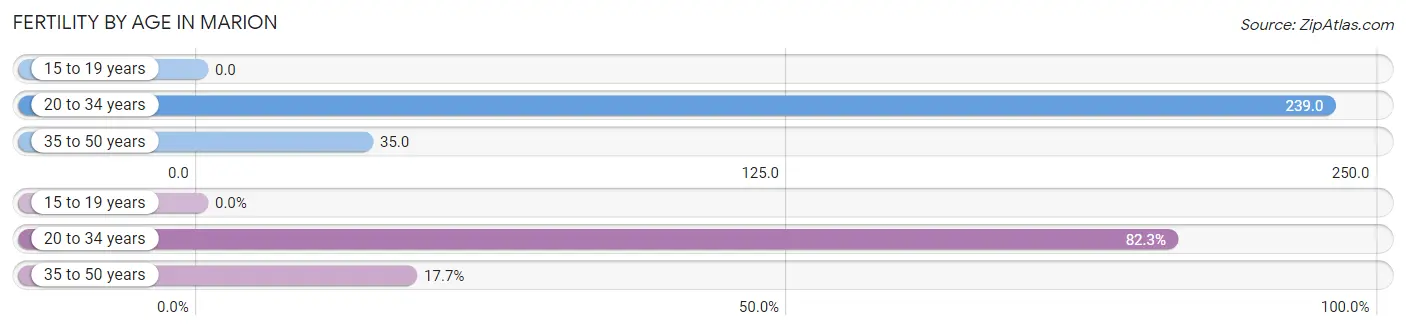
| Age Bracket | Women with Births | Births / 1,000 Women |
| 15 to 19 years | 0 (0.0%) | 0.0 |
| 20 to 34 years | 51 (82.3%) | 239.0 |
| 35 to 50 years | 11 (17.7%) | 35.0 |
| Total | 62 (100.0%) | 104.0 |
Fertility by Age by Marriage Status in Marion
67.7% of women with births (62) in Marion are married. The highest percentage of unmarried women with births falls into 20 to 34 years age bracket with 39.2% of them unmarried at the time of birth, while the lowest percentage of unmarried women with births belong to 35 to 50 years age bracket with 0.0% of them unmarried.
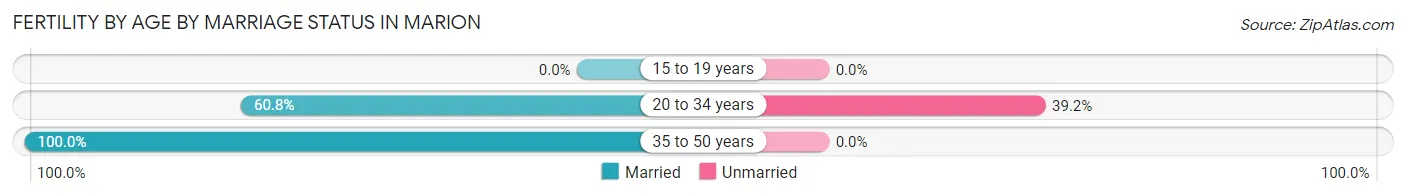
| Age Bracket | Married | Unmarried |
| 15 to 19 years | 0 (0.0%) | 0 (0.0%) |
| 20 to 34 years | 31 (60.8%) | 20 (39.2%) |
| 35 to 50 years | 11 (100.0%) | 0 (0.0%) |
| Total | 42 (67.7%) | 20 (32.3%) |
Fertility by Education in Marion
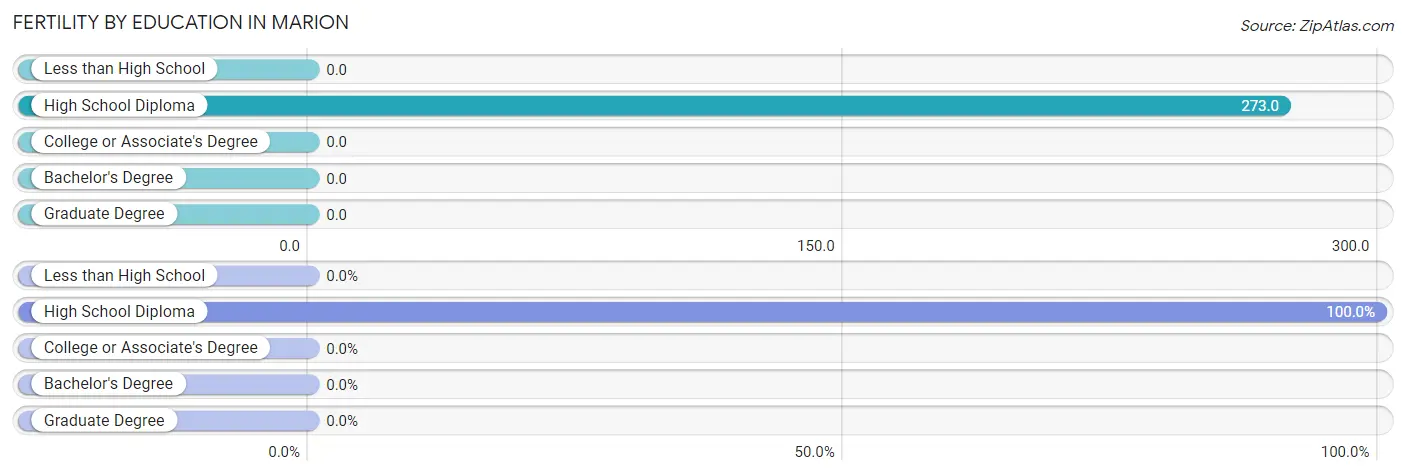
| Educational Attainment | Women with Births | Births / 1,000 Women |
| Less than High School | 0 (0.0%) | 0.0 |
| High School Diploma | 62 (100.0%) | 273.0 |
| College or Associate's Degree | 0 (0.0%) | 0.0 |
| Bachelor's Degree | 0 (0.0%) | 0.0 |
| Graduate Degree | 0 (0.0%) | 0.0 |
| Total | 62 (100.0%) | 104.0 |
Fertility by Education by Marriage Status in Marion
32.3% of women with births in Marion are unmarried. Women with the educational attainment of high school diploma are most likely to be married with 67.7% of them married at childbirth, while women with the educational attainment of high school diploma are least likely to be married with 32.3% of them unmarried at childbirth.
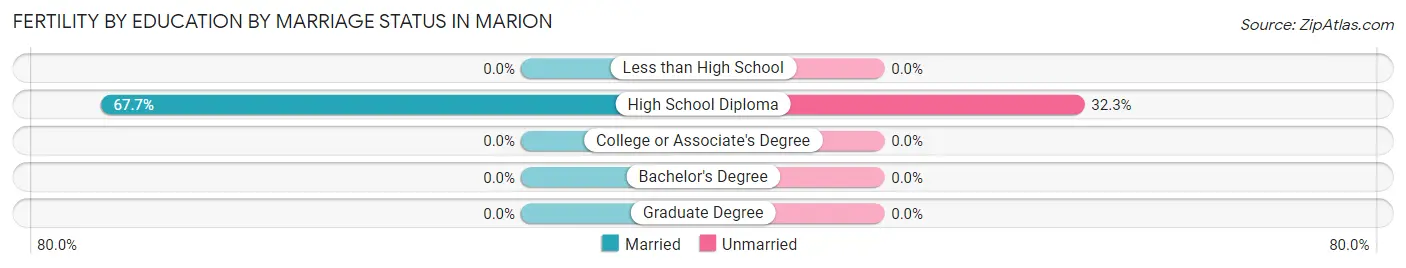
| Educational Attainment | Married | Unmarried |
| Less than High School | 0 (0.0%) | 0 (0.0%) |
| High School Diploma | 42 (67.7%) | 20 (32.3%) |
| College or Associate's Degree | 0 (0.0%) | 0 (0.0%) |
| Bachelor's Degree | 0 (0.0%) | 0 (0.0%) |
| Graduate Degree | 0 (0.0%) | 0 (0.0%) |
| Total | 42 (67.7%) | 20 (32.3%) |
Employment Characteristics in Marion
Employment by Class of Employer in Marion
Among the 999 employed individuals in Marion, private company employees (786 | 78.7%), state government employees (93 | 9.3%), and self-employed (incorporated) (51 | 5.1%) make up the most common classes of employment.
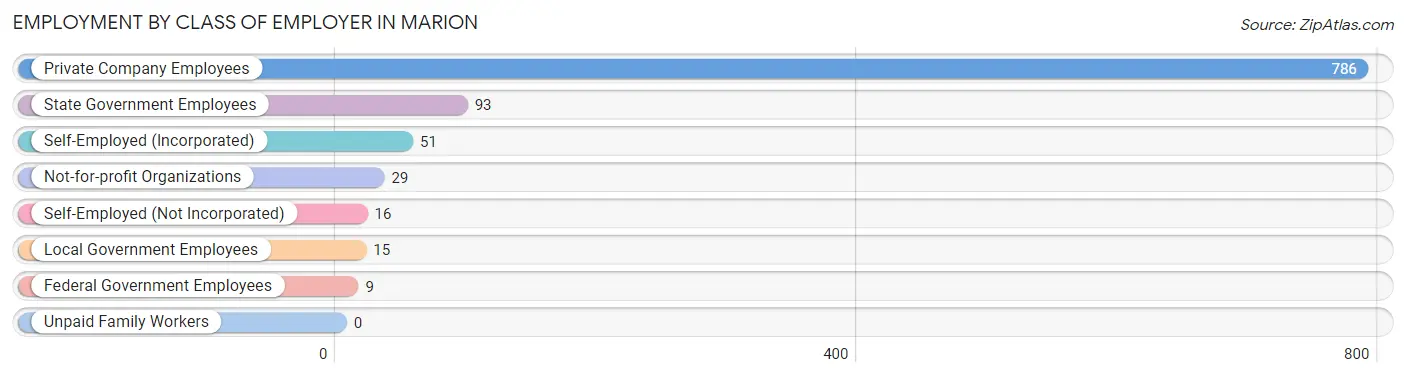
| Employer Class | # Employees | % Employees |
| Private Company Employees | 786 | 78.7% |
| Self-Employed (Incorporated) | 51 | 5.1% |
| Self-Employed (Not Incorporated) | 16 | 1.6% |
| Not-for-profit Organizations | 29 | 2.9% |
| Local Government Employees | 15 | 1.5% |
| State Government Employees | 93 | 9.3% |
| Federal Government Employees | 9 | 0.9% |
| Unpaid Family Workers | 0 | 0.0% |
| Total | 999 | 100.0% |
Employment Status by Age in Marion
According to the labor force statistics for Marion, out of the total population over 16 years of age (2,398), 43.1% or 1,034 individuals are in the labor force, with 2.5% or 26 of them unemployed. The age group with the highest labor force participation rate is 16 to 19 years, with 87.6% or 78 individuals in the labor force. Within the labor force, the 20 to 24 years age range has the highest percentage of unemployed individuals, with 19.3% or 26 of them being unemployed.
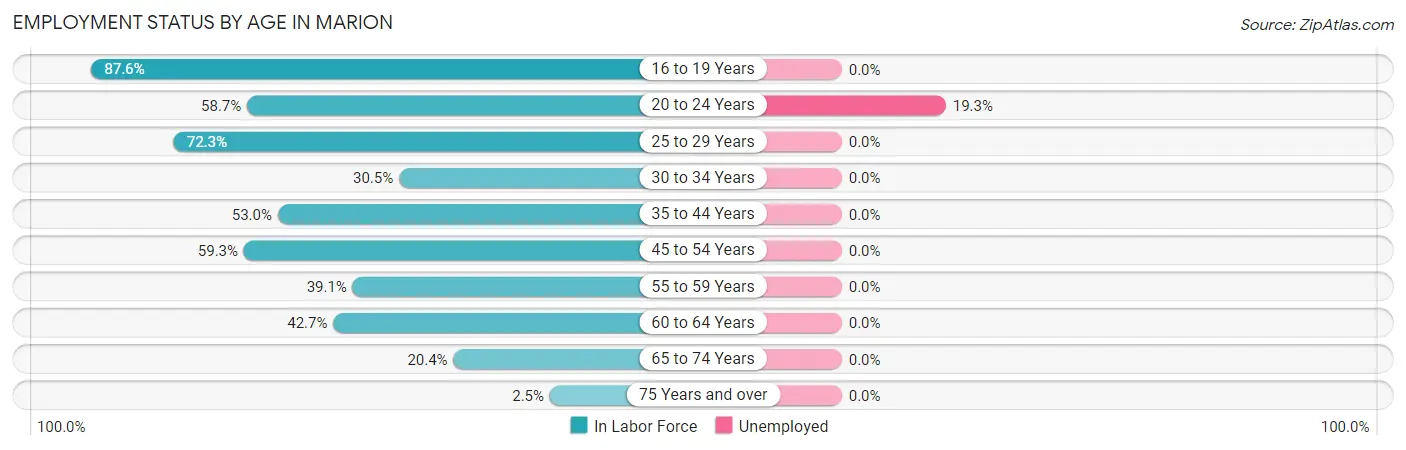
| Age Bracket | In Labor Force | Unemployed |
| 16 to 19 Years | 78 (87.6%) | 0 (0.0%) |
| 20 to 24 Years | 135 (58.7%) | 26 (19.3%) |
| 25 to 29 Years | 120 (72.3%) | 0 (0.0%) |
| 30 to 34 Years | 18 (30.5%) | 0 (0.0%) |
| 35 to 44 Years | 159 (53.0%) | 0 (0.0%) |
| 45 to 54 Years | 291 (59.3%) | 0 (0.0%) |
| 55 to 59 Years | 52 (39.1%) | 0 (0.0%) |
| 60 to 64 Years | 91 (42.7%) | 0 (0.0%) |
| 65 to 74 Years | 82 (20.4%) | 0 (0.0%) |
| 75 Years and over | 8 (2.5%) | 0 (0.0%) |
| Total | 1,034 (43.1%) | 26 (2.5%) |
Employment Status by Educational Attainment in Marion
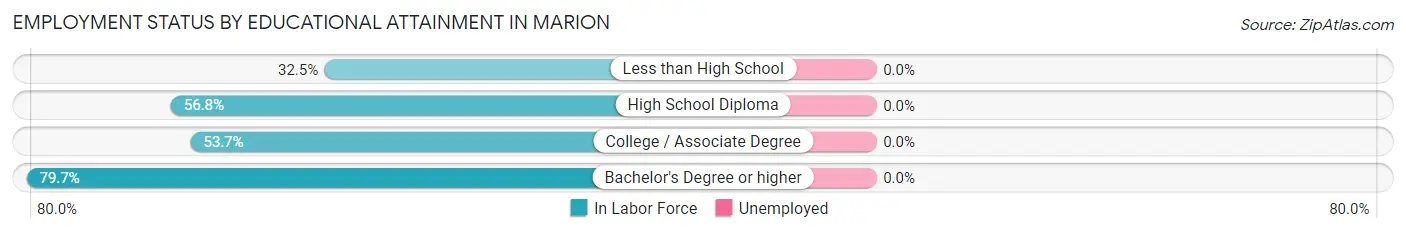
| Educational Attainment | In Labor Force | Unemployed |
| Less than High School | 62 (32.5%) | 0 (0.0%) |
| High School Diploma | 385 (56.8%) | 0 (0.0%) |
| College / Associate Degree | 225 (53.7%) | 0 (0.0%) |
| Bachelor's Degree or higher | 59 (79.7%) | 0 (0.0%) |
| Total | 731 (53.7%) | 0 (0.0%) |
Employment Occupations by Sex in Marion
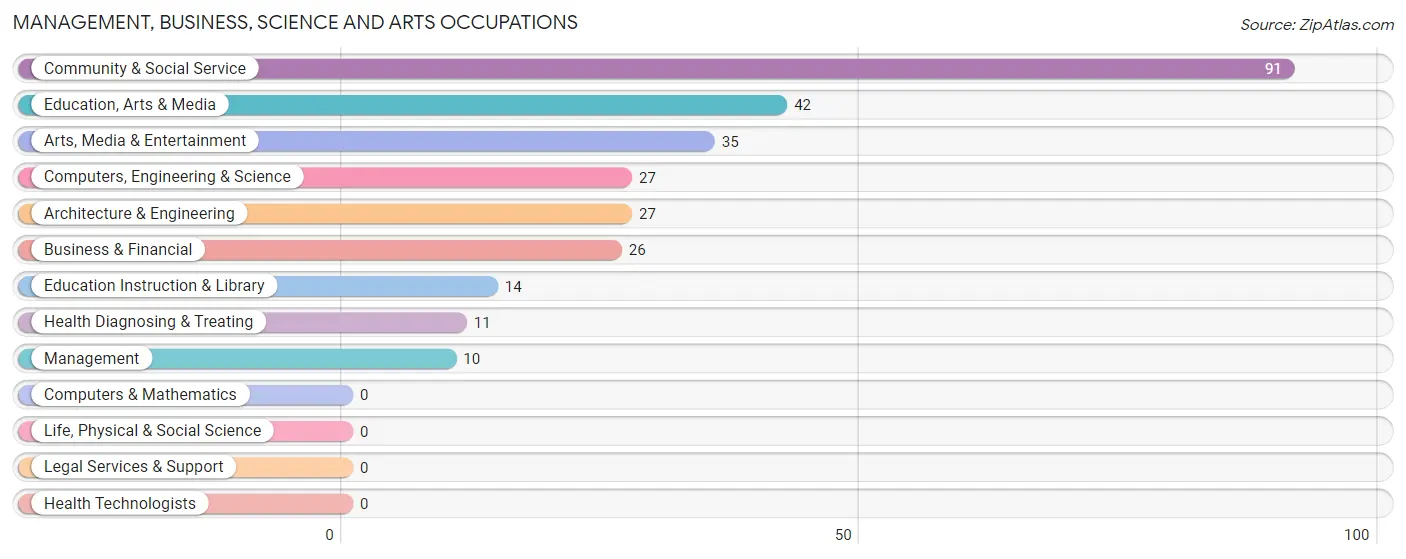
Management, Business, Science and Arts Occupations
The most common Management, Business, Science and Arts occupations in Marion are Community & Social Service (91 | 9.0%), Education, Arts & Media (42 | 4.2%), Arts, Media & Entertainment (35 | 3.5%), Computers, Engineering & Science (27 | 2.7%), and Architecture & Engineering (27 | 2.7%).
Management, Business, Science and Arts Occupations by Sex
Within the Management, Business, Science and Arts occupations in Marion, the most male-oriented occupations are Computers, Engineering & Science (100.0%), Architecture & Engineering (100.0%), and Arts, Media & Entertainment (100.0%), while the most female-oriented occupations are Management (100.0%), Business & Financial (100.0%), and Education, Arts & Media (80.9%).
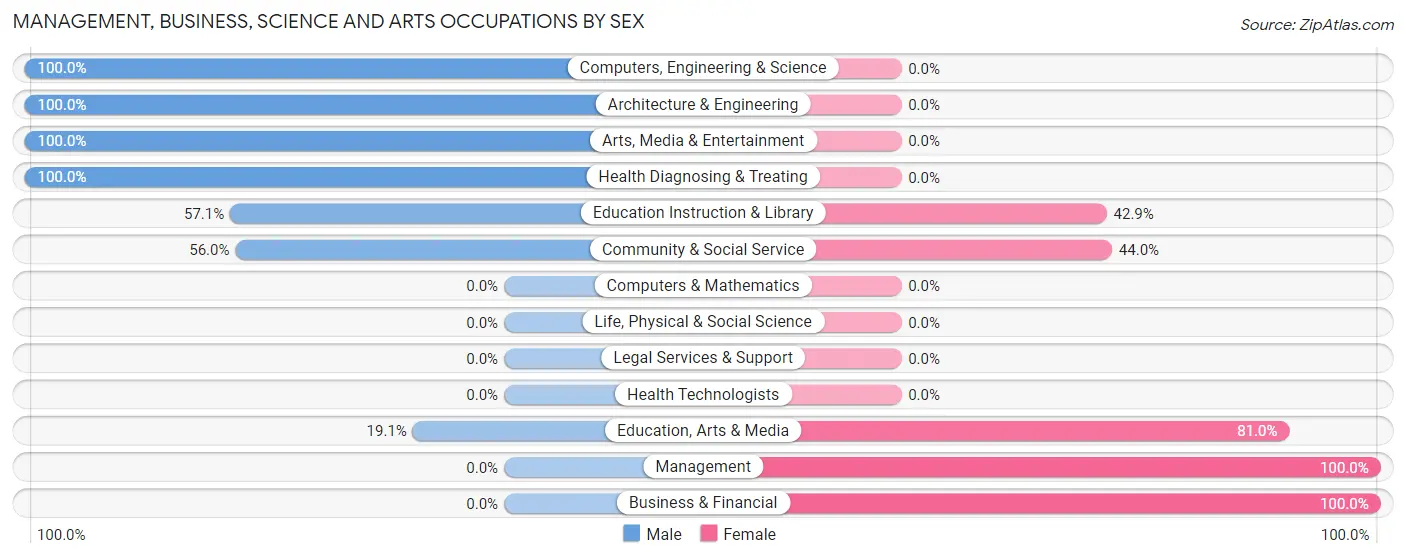
| Occupation | Male | Female |
| Management | 0 (0.0%) | 10 (100.0%) |
| Business & Financial | 0 (0.0%) | 26 (100.0%) |
| Computers, Engineering & Science | 27 (100.0%) | 0 (0.0%) |
| Computers & Mathematics | 0 (0.0%) | 0 (0.0%) |
| Architecture & Engineering | 27 (100.0%) | 0 (0.0%) |
| Life, Physical & Social Science | 0 (0.0%) | 0 (0.0%) |
| Community & Social Service | 51 (56.0%) | 40 (44.0%) |
| Education, Arts & Media | 8 (19.1%) | 34 (80.9%) |
| Legal Services & Support | 0 (0.0%) | 0 (0.0%) |
| Education Instruction & Library | 8 (57.1%) | 6 (42.9%) |
| Arts, Media & Entertainment | 35 (100.0%) | 0 (0.0%) |
| Health Diagnosing & Treating | 11 (100.0%) | 0 (0.0%) |
| Health Technologists | 0 (0.0%) | 0 (0.0%) |
| Total (Category) | 89 (53.9%) | 76 (46.1%) |
| Total (Overall) | 625 (62.0%) | 383 (38.0%) |
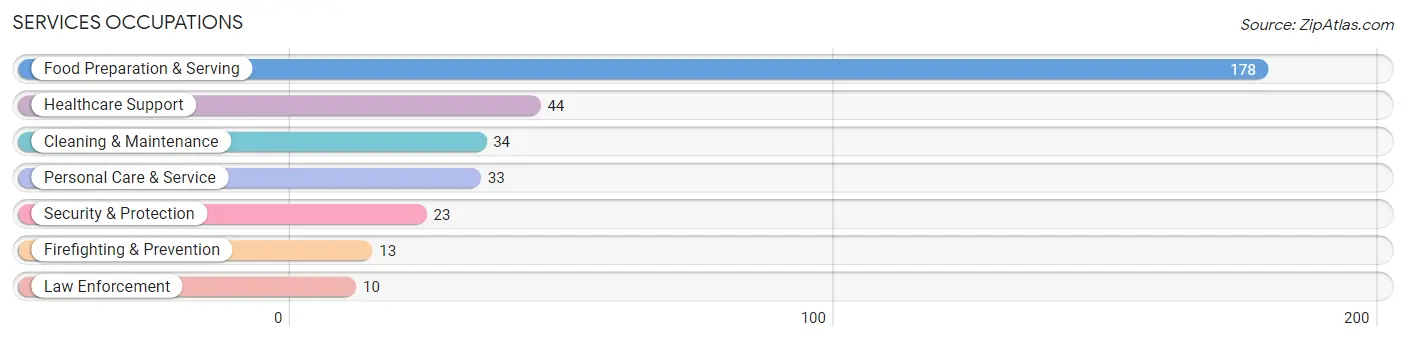
Services Occupations
The most common Services occupations in Marion are Food Preparation & Serving (178 | 17.7%), Healthcare Support (44 | 4.4%), Cleaning & Maintenance (34 | 3.4%), Personal Care & Service (33 | 3.3%), and Security & Protection (23 | 2.3%).
Services Occupations by Sex
Within the Services occupations in Marion, the most male-oriented occupations are Security & Protection (100.0%), Firefighting & Prevention (100.0%), and Law Enforcement (100.0%), while the most female-oriented occupations are Cleaning & Maintenance (55.9%), Food Preparation & Serving (48.3%), and Healthcare Support (29.5%).
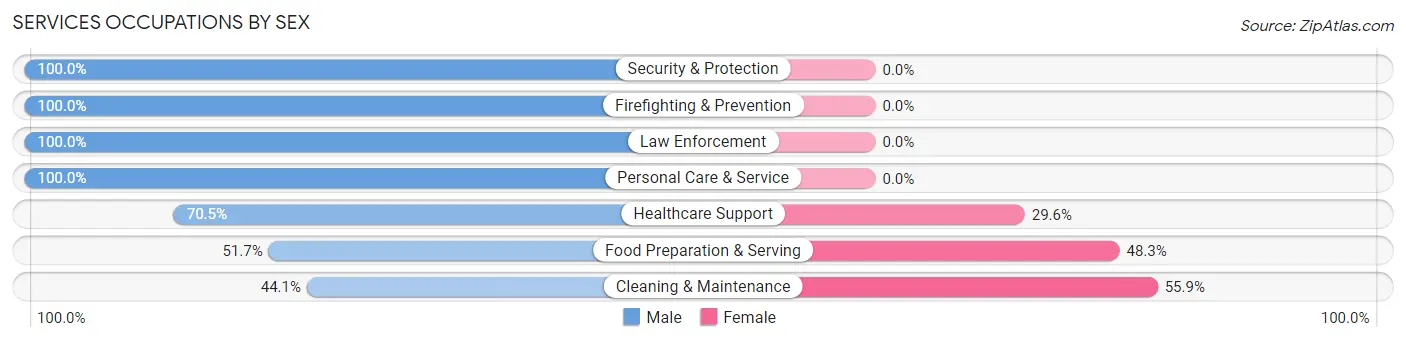
| Occupation | Male | Female |
| Healthcare Support | 31 (70.5%) | 13 (29.5%) |
| Security & Protection | 23 (100.0%) | 0 (0.0%) |
| Firefighting & Prevention | 13 (100.0%) | 0 (0.0%) |
| Law Enforcement | 10 (100.0%) | 0 (0.0%) |
| Food Preparation & Serving | 92 (51.7%) | 86 (48.3%) |
| Cleaning & Maintenance | 15 (44.1%) | 19 (55.9%) |
| Personal Care & Service | 33 (100.0%) | 0 (0.0%) |
| Total (Category) | 194 (62.2%) | 118 (37.8%) |
| Total (Overall) | 625 (62.0%) | 383 (38.0%) |
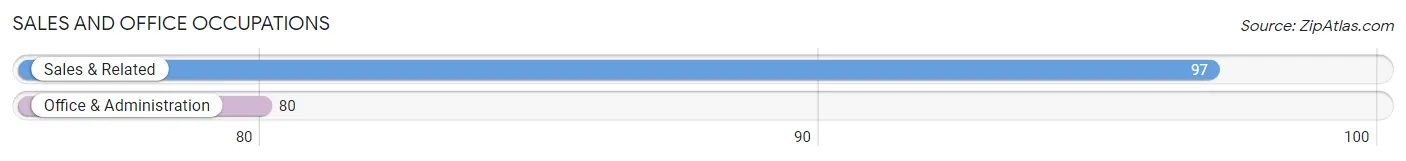
Sales and Office Occupations
The most common Sales and Office occupations in Marion are Sales & Related (97 | 9.6%), and Office & Administration (80 | 7.9%).
Sales and Office Occupations by Sex
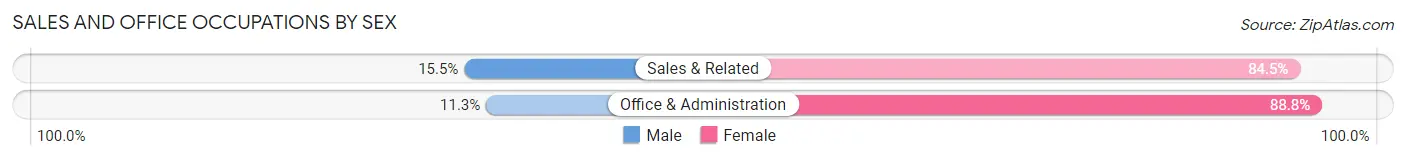
| Occupation | Male | Female |
| Sales & Related | 15 (15.5%) | 82 (84.5%) |
| Office & Administration | 9 (11.3%) | 71 (88.7%) |
| Total (Category) | 24 (13.6%) | 153 (86.4%) |
| Total (Overall) | 625 (62.0%) | 383 (38.0%) |
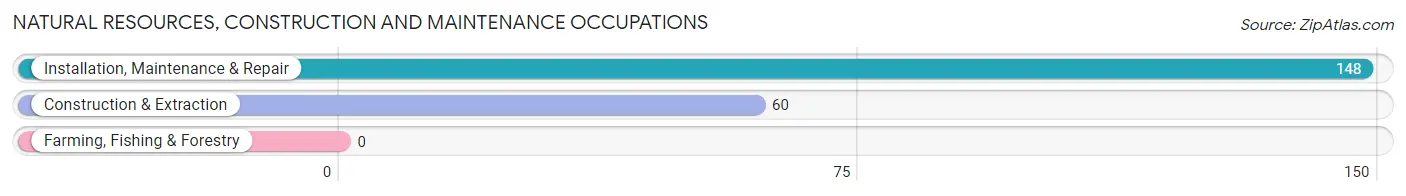
Natural Resources, Construction and Maintenance Occupations
The most common Natural Resources, Construction and Maintenance occupations in Marion are Installation, Maintenance & Repair (148 | 14.7%), and Construction & Extraction (60 | 5.9%).
Natural Resources, Construction and Maintenance Occupations by Sex
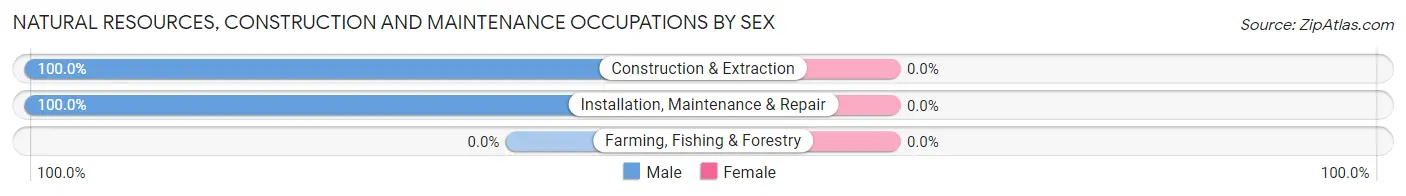
| Occupation | Male | Female |
| Farming, Fishing & Forestry | 0 (0.0%) | 0 (0.0%) |
| Construction & Extraction | 60 (100.0%) | 0 (0.0%) |
| Installation, Maintenance & Repair | 148 (100.0%) | 0 (0.0%) |
| Total (Category) | 208 (100.0%) | 0 (0.0%) |
| Total (Overall) | 625 (62.0%) | 383 (38.0%) |
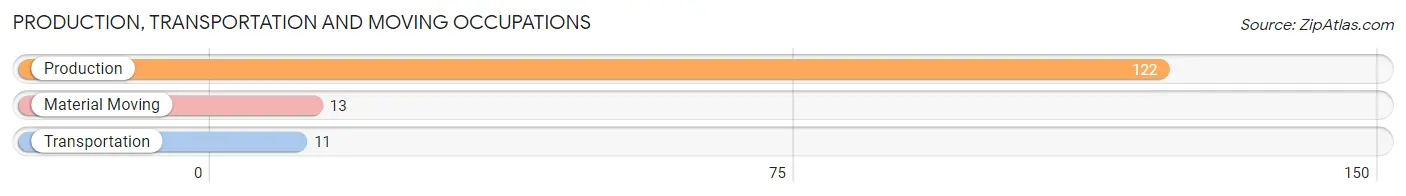
Production, Transportation and Moving Occupations
The most common Production, Transportation and Moving occupations in Marion are Production (122 | 12.1%), Material Moving (13 | 1.3%), and Transportation (11 | 1.1%).
Production, Transportation and Moving Occupations by Sex
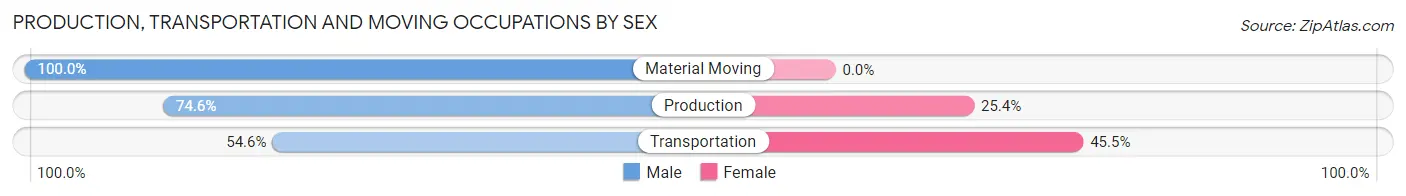
| Occupation | Male | Female |
| Production | 91 (74.6%) | 31 (25.4%) |
| Transportation | 6 (54.5%) | 5 (45.5%) |
| Material Moving | 13 (100.0%) | 0 (0.0%) |
| Total (Category) | 110 (75.3%) | 36 (24.7%) |
| Total (Overall) | 625 (62.0%) | 383 (38.0%) |
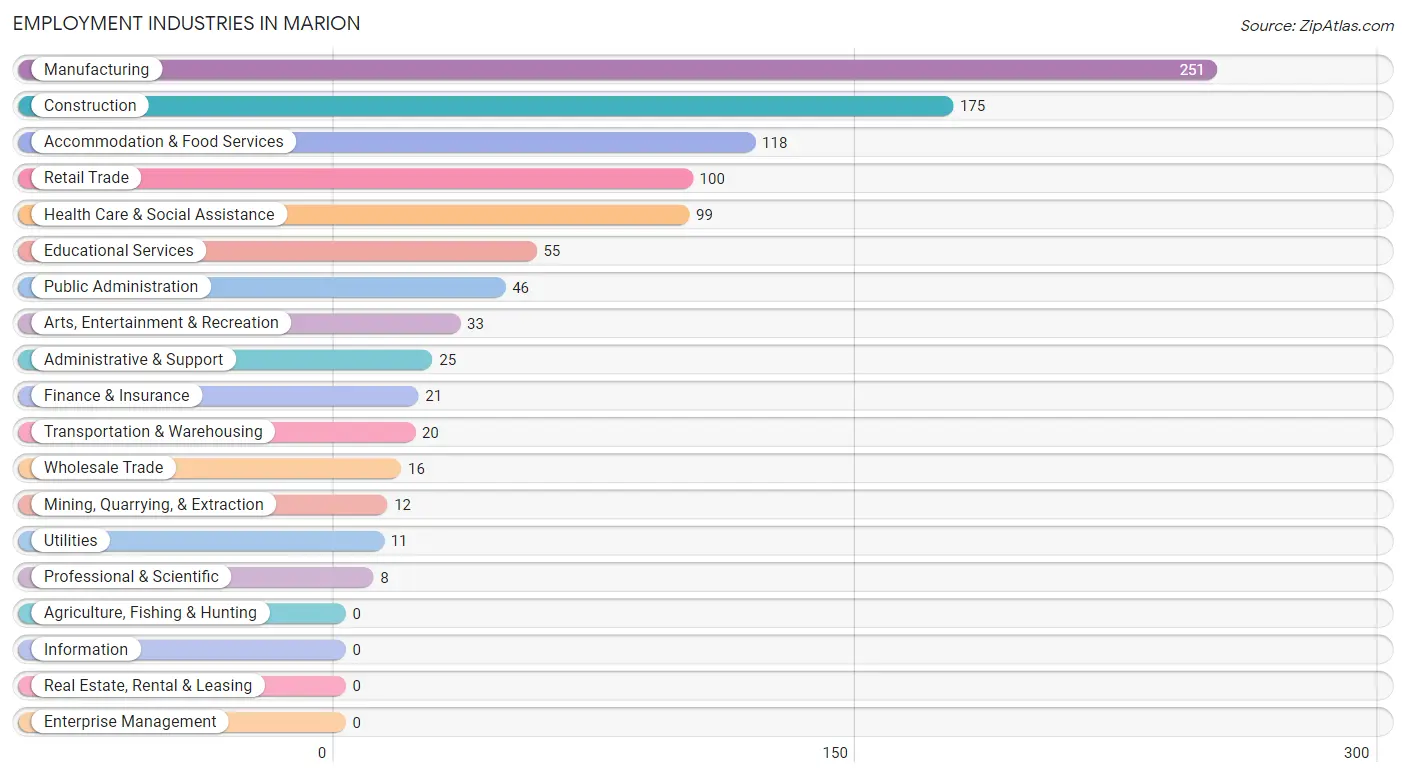
Employment Industries by Sex in Marion
Employment Industries in Marion
The major employment industries in Marion include Manufacturing (251 | 24.9%), Construction (175 | 17.4%), Accommodation & Food Services (118 | 11.7%), Retail Trade (100 | 9.9%), and Health Care & Social Assistance (99 | 9.8%).
Employment Industries by Sex in Marion
The Marion industries that see more men than women are Mining, Quarrying, & Extraction (100.0%), Arts, Entertainment & Recreation (100.0%), and Construction (93.1%), whereas the industries that tend to have a higher number of women are Utilities (100.0%), Finance & Insurance (100.0%), and Professional & Scientific (100.0%).
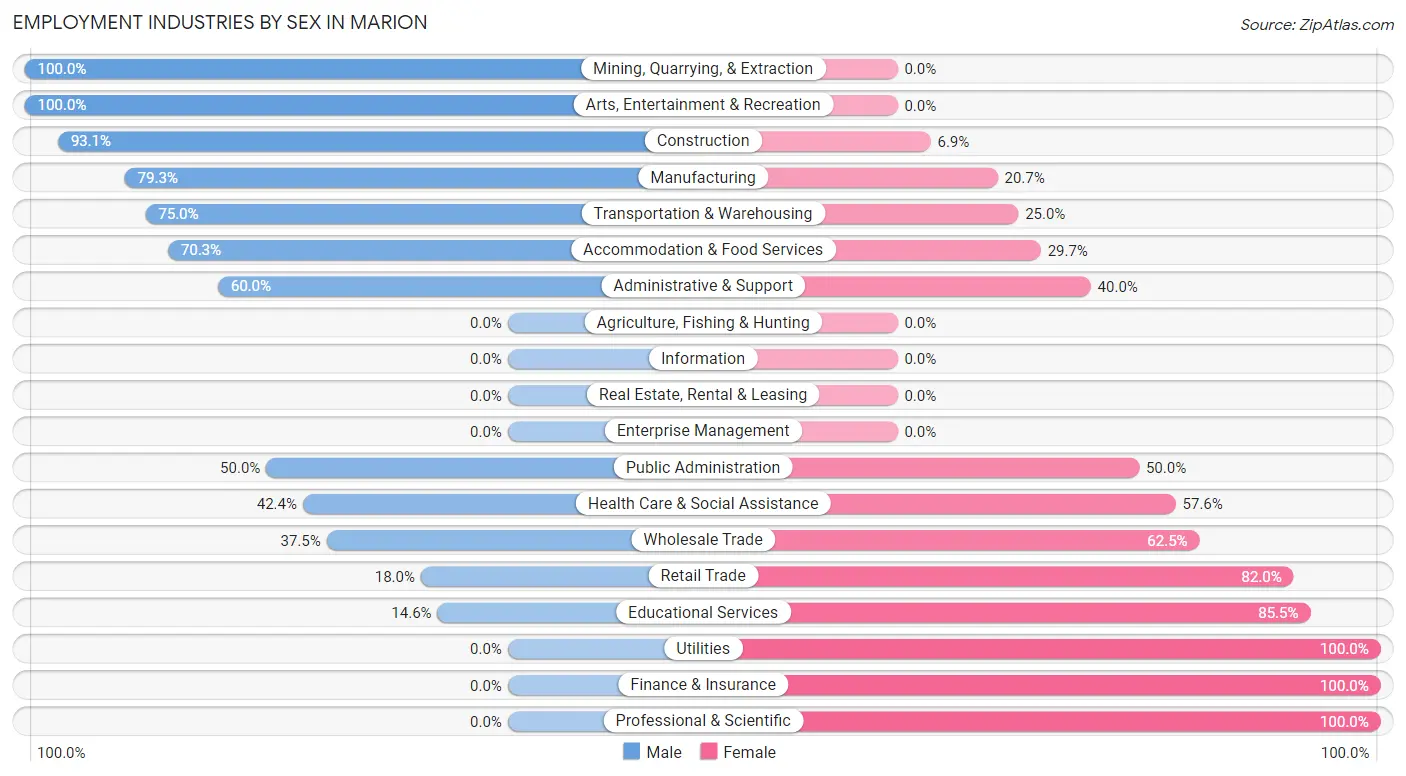
| Industry | Male | Female |
| Agriculture, Fishing & Hunting | 0 (0.0%) | 0 (0.0%) |
| Mining, Quarrying, & Extraction | 12 (100.0%) | 0 (0.0%) |
| Construction | 163 (93.1%) | 12 (6.9%) |
| Manufacturing | 199 (79.3%) | 52 (20.7%) |
| Wholesale Trade | 6 (37.5%) | 10 (62.5%) |
| Retail Trade | 18 (18.0%) | 82 (82.0%) |
| Transportation & Warehousing | 15 (75.0%) | 5 (25.0%) |
| Utilities | 0 (0.0%) | 11 (100.0%) |
| Information | 0 (0.0%) | 0 (0.0%) |
| Finance & Insurance | 0 (0.0%) | 21 (100.0%) |
| Real Estate, Rental & Leasing | 0 (0.0%) | 0 (0.0%) |
| Professional & Scientific | 0 (0.0%) | 8 (100.0%) |
| Enterprise Management | 0 (0.0%) | 0 (0.0%) |
| Administrative & Support | 15 (60.0%) | 10 (40.0%) |
| Educational Services | 8 (14.5%) | 47 (85.5%) |
| Health Care & Social Assistance | 42 (42.4%) | 57 (57.6%) |
| Arts, Entertainment & Recreation | 33 (100.0%) | 0 (0.0%) |
| Accommodation & Food Services | 83 (70.3%) | 35 (29.7%) |
| Public Administration | 23 (50.0%) | 23 (50.0%) |
| Total | 625 (62.0%) | 383 (38.0%) |
Education in Marion
School Enrollment in Marion
The most common levels of schooling among the 429 students in Marion are middle school (154 | 35.9%), high school (115 | 26.8%), and college / undergraduate (65 | 15.1%).
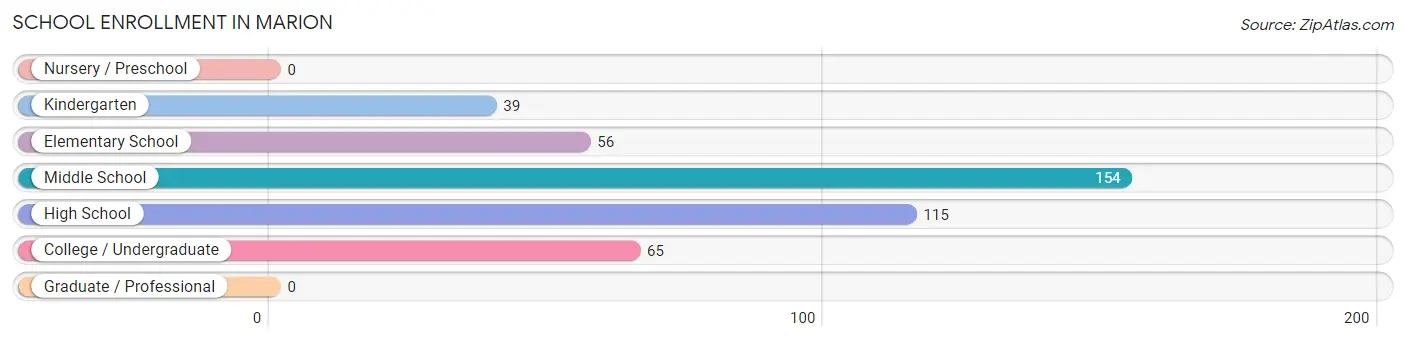
| School Level | # Students | % Students |
| Nursery / Preschool | 0 | 0.0% |
| Kindergarten | 39 | 9.1% |
| Elementary School | 56 | 13.1% |
| Middle School | 154 | 35.9% |
| High School | 115 | 26.8% |
| College / Undergraduate | 65 | 15.1% |
| Graduate / Professional | 0 | 0.0% |
| Total | 429 | 100.0% |
School Enrollment by Age by Funding Source in Marion
Out of a total of 429 students who are enrolled in schools in Marion, 17 (4.0%) attend a private institution, while the remaining 412 (96.0%) are enrolled in public schools. The age group of 25 to 34 year olds has the highest likelihood of being enrolled in private schools, with 5 (100.0% in the age bracket) enrolled. Conversely, the age group of 5 to 9 year old has the lowest likelihood of being enrolled in a private school, with 95 (100.0% in the age bracket) attending a public institution.
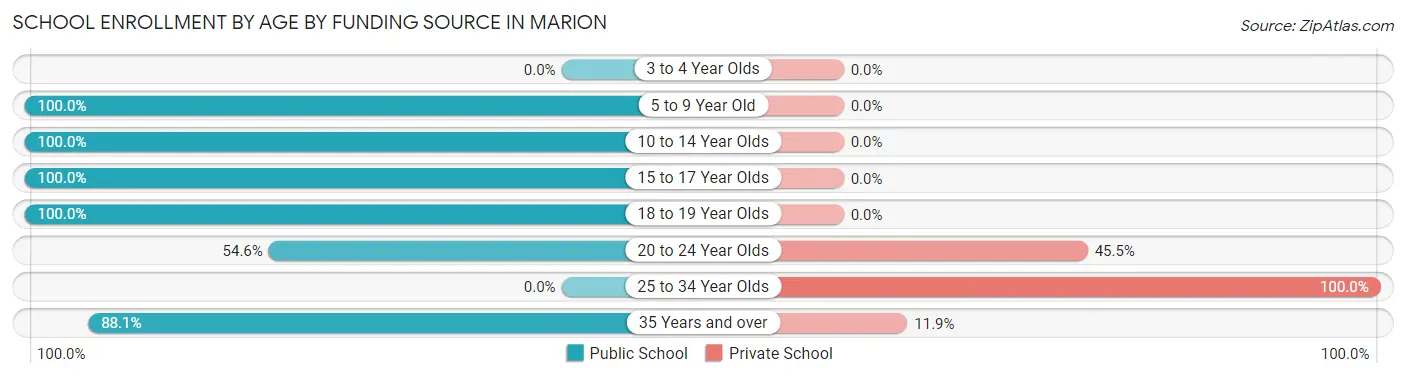
| Age Bracket | Public School | Private School |
| 3 to 4 Year Olds | 0 (0.0%) | 0 (0.0%) |
| 5 to 9 Year Old | 95 (100.0%) | 0 (0.0%) |
| 10 to 14 Year Olds | 182 (100.0%) | 0 (0.0%) |
| 15 to 17 Year Olds | 49 (100.0%) | 0 (0.0%) |
| 18 to 19 Year Olds | 28 (100.0%) | 0 (0.0%) |
| 20 to 24 Year Olds | 6 (54.5%) | 5 (45.5%) |
| 25 to 34 Year Olds | 0 (0.0%) | 5 (100.0%) |
| 35 Years and over | 52 (88.1%) | 7 (11.9%) |
| Total | 412 (96.0%) | 17 (4.0%) |
Educational Attainment by Field of Study in Marion
Business (72 | 39.8%), arts & humanities (45 | 24.9%), education (30 | 16.6%), engineering (23 | 12.7%), and visual & performing arts (6 | 3.3%) are the most common fields of study among 181 individuals in Marion who have obtained a bachelor's degree or higher.
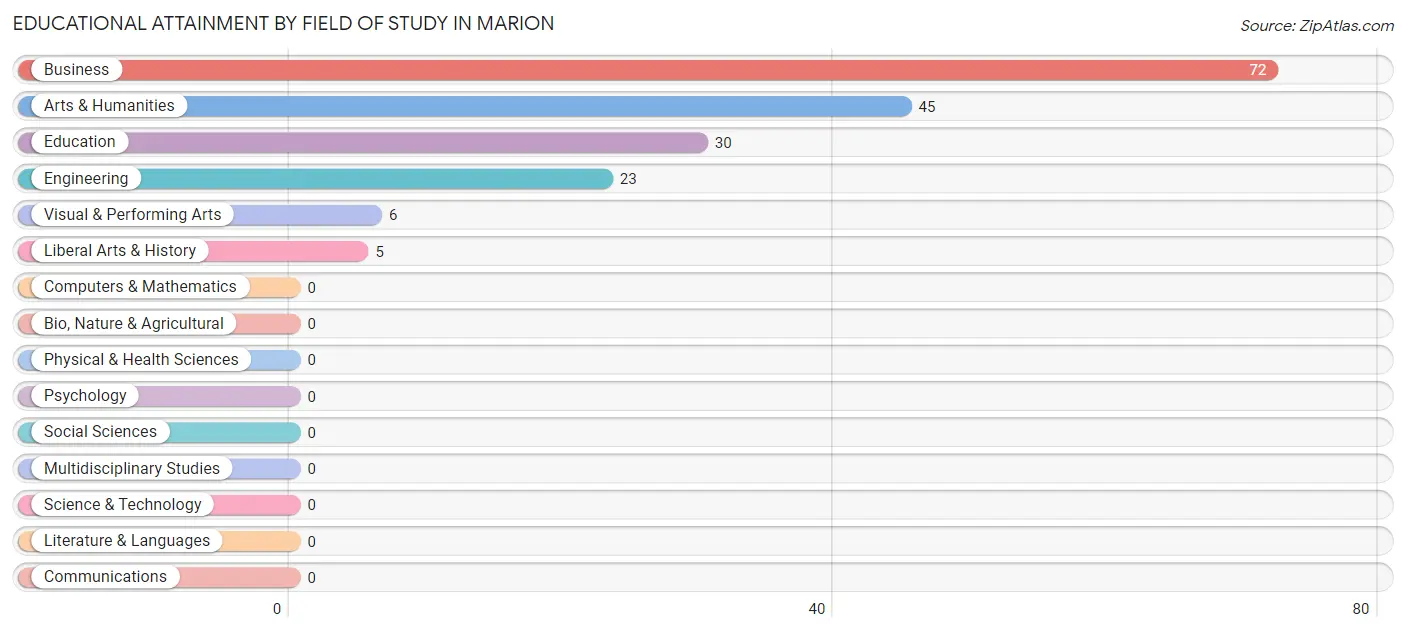
| Field of Study | # Graduates | % Graduates |
| Computers & Mathematics | 0 | 0.0% |
| Bio, Nature & Agricultural | 0 | 0.0% |
| Physical & Health Sciences | 0 | 0.0% |
| Psychology | 0 | 0.0% |
| Social Sciences | 0 | 0.0% |
| Engineering | 23 | 12.7% |
| Multidisciplinary Studies | 0 | 0.0% |
| Science & Technology | 0 | 0.0% |
| Business | 72 | 39.8% |
| Education | 30 | 16.6% |
| Literature & Languages | 0 | 0.0% |
| Liberal Arts & History | 5 | 2.8% |
| Visual & Performing Arts | 6 | 3.3% |
| Communications | 0 | 0.0% |
| Arts & Humanities | 45 | 24.9% |
| Total | 181 | 100.0% |
Transportation & Commute in Marion
Vehicle Availability by Sex in Marion
The most prevalent vehicle ownership categories in Marion are males with 2 vehicles (243, accounting for 38.9%) and females with 2 vehicles (120, making up 65.0%).
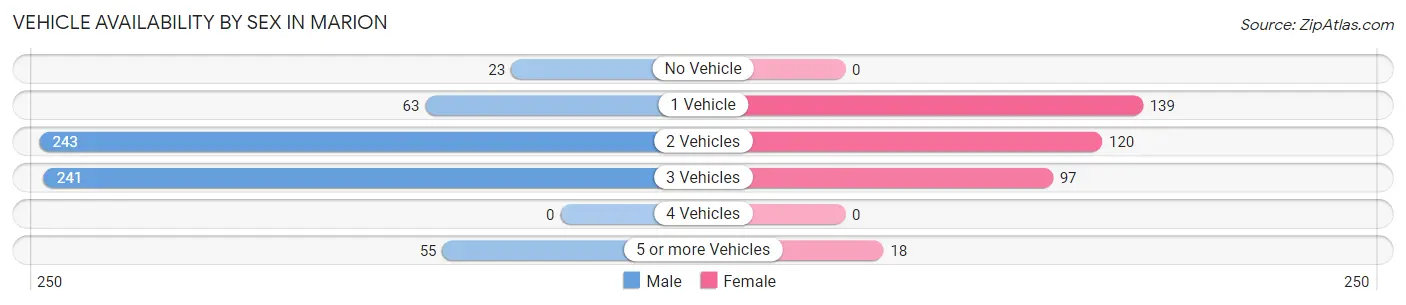
| Vehicles Available | Male | Female |
| No Vehicle | 23 (3.7%) | 0 (0.0%) |
| 1 Vehicle | 63 (10.1%) | 139 (37.2%) |
| 2 Vehicles | 243 (38.9%) | 120 (32.1%) |
| 3 Vehicles | 241 (38.6%) | 97 (25.9%) |
| 4 Vehicles | 0 (0.0%) | 0 (0.0%) |
| 5 or more Vehicles | 55 (8.8%) | 18 (4.8%) |
| Total | 625 (100.0%) | 374 (100.0%) |
Commute Time in Marion
The most frequently occuring commute durations in Marion are 5 to 9 minutes (292 commuters, 30.7%), 45 to 59 minutes (161 commuters, 16.9%), and 20 to 24 minutes (116 commuters, 12.2%).
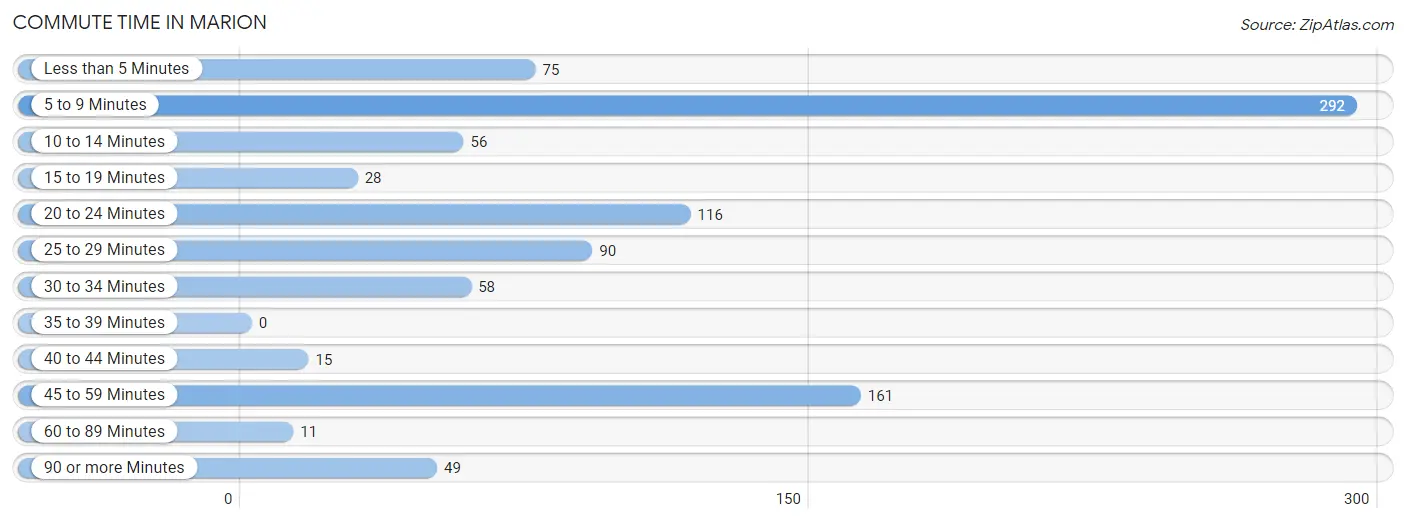
| Commute Time | # Commuters | % Commuters |
| Less than 5 Minutes | 75 | 7.9% |
| 5 to 9 Minutes | 292 | 30.7% |
| 10 to 14 Minutes | 56 | 5.9% |
| 15 to 19 Minutes | 28 | 2.9% |
| 20 to 24 Minutes | 116 | 12.2% |
| 25 to 29 Minutes | 90 | 9.5% |
| 30 to 34 Minutes | 58 | 6.1% |
| 35 to 39 Minutes | 0 | 0.0% |
| 40 to 44 Minutes | 15 | 1.6% |
| 45 to 59 Minutes | 161 | 16.9% |
| 60 to 89 Minutes | 11 | 1.2% |
| 90 or more Minutes | 49 | 5.1% |
Commute Time by Sex in Marion
The most common commute times in Marion are 5 to 9 minutes (163 commuters, 26.6%) for males and 5 to 9 minutes (129 commuters, 38.1%) for females.
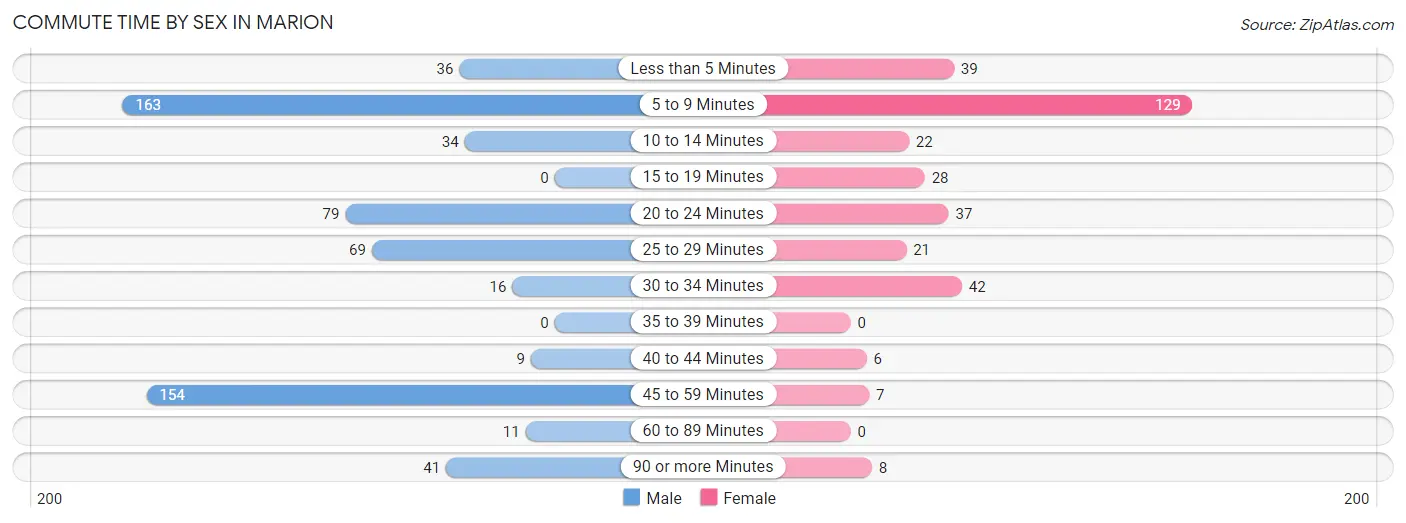
| Commute Time | Male | Female |
| Less than 5 Minutes | 36 (5.9%) | 39 (11.5%) |
| 5 to 9 Minutes | 163 (26.6%) | 129 (38.1%) |
| 10 to 14 Minutes | 34 (5.6%) | 22 (6.5%) |
| 15 to 19 Minutes | 0 (0.0%) | 28 (8.3%) |
| 20 to 24 Minutes | 79 (12.9%) | 37 (10.9%) |
| 25 to 29 Minutes | 69 (11.3%) | 21 (6.2%) |
| 30 to 34 Minutes | 16 (2.6%) | 42 (12.4%) |
| 35 to 39 Minutes | 0 (0.0%) | 0 (0.0%) |
| 40 to 44 Minutes | 9 (1.5%) | 6 (1.8%) |
| 45 to 59 Minutes | 154 (25.2%) | 7 (2.1%) |
| 60 to 89 Minutes | 11 (1.8%) | 0 (0.0%) |
| 90 or more Minutes | 41 (6.7%) | 8 (2.4%) |
Time of Departure to Work by Sex in Marion
The most frequent times of departure to work in Marion are 12:00 AM to 4:59 AM (245, 40.0%) for males and 6:00 AM to 6:29 AM (78, 23.0%) for females.
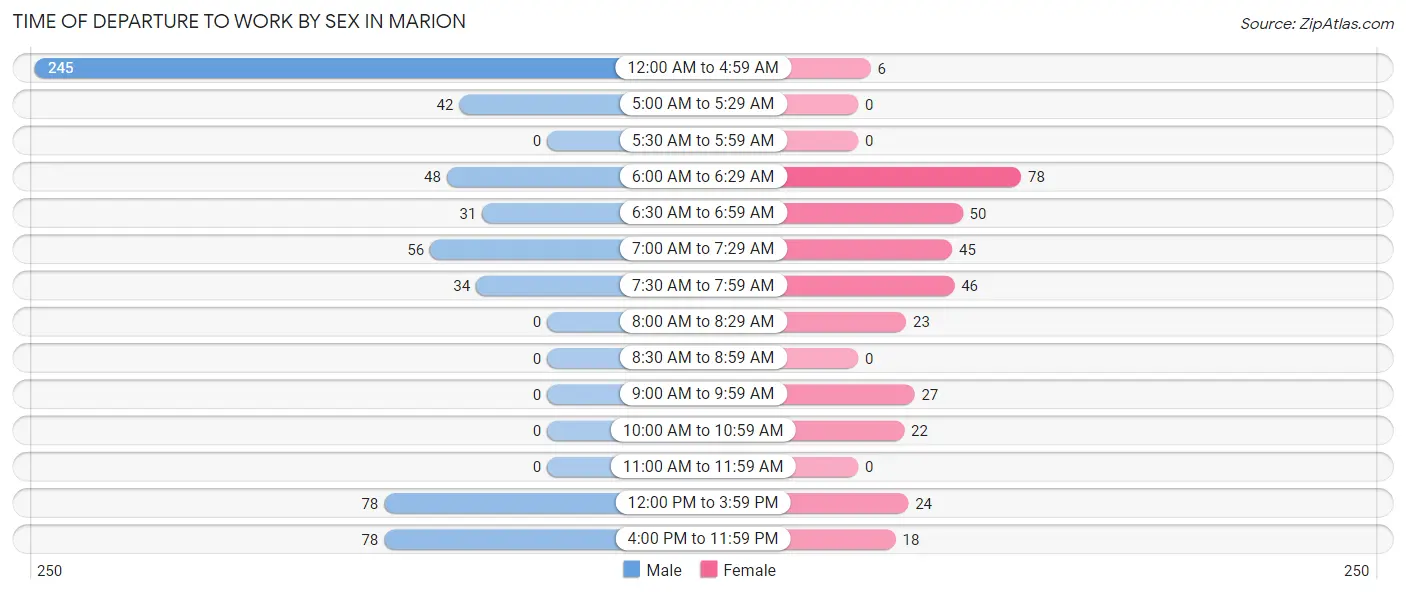
| Time of Departure | Male | Female |
| 12:00 AM to 4:59 AM | 245 (40.0%) | 6 (1.8%) |
| 5:00 AM to 5:29 AM | 42 (6.9%) | 0 (0.0%) |
| 5:30 AM to 5:59 AM | 0 (0.0%) | 0 (0.0%) |
| 6:00 AM to 6:29 AM | 48 (7.8%) | 78 (23.0%) |
| 6:30 AM to 6:59 AM | 31 (5.1%) | 50 (14.7%) |
| 7:00 AM to 7:29 AM | 56 (9.1%) | 45 (13.3%) |
| 7:30 AM to 7:59 AM | 34 (5.6%) | 46 (13.6%) |
| 8:00 AM to 8:29 AM | 0 (0.0%) | 23 (6.8%) |
| 8:30 AM to 8:59 AM | 0 (0.0%) | 0 (0.0%) |
| 9:00 AM to 9:59 AM | 0 (0.0%) | 27 (8.0%) |
| 10:00 AM to 10:59 AM | 0 (0.0%) | 22 (6.5%) |
| 11:00 AM to 11:59 AM | 0 (0.0%) | 0 (0.0%) |
| 12:00 PM to 3:59 PM | 78 (12.8%) | 24 (7.1%) |
| 4:00 PM to 11:59 PM | 78 (12.8%) | 18 (5.3%) |
| Total | 612 (100.0%) | 339 (100.0%) |
Housing Occupancy in Marion
Occupancy by Ownership in Marion
Of the total 1,119 dwellings in Marion, owner-occupied units account for 762 (68.1%), while renter-occupied units make up 357 (31.9%).
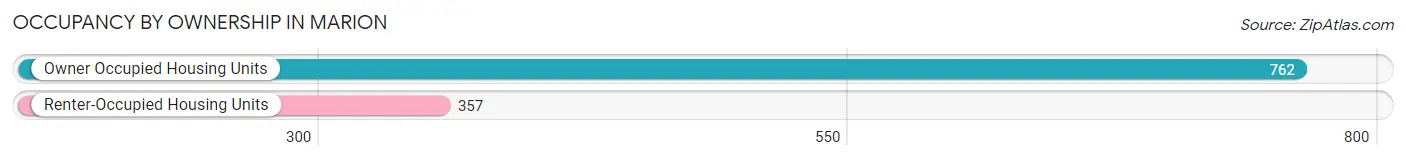
| Occupancy | # Housing Units | % Housing Units |
| Owner Occupied Housing Units | 762 | 68.1% |
| Renter-Occupied Housing Units | 357 | 31.9% |
| Total Occupied Housing Units | 1,119 | 100.0% |
Occupancy by Household Size in Marion
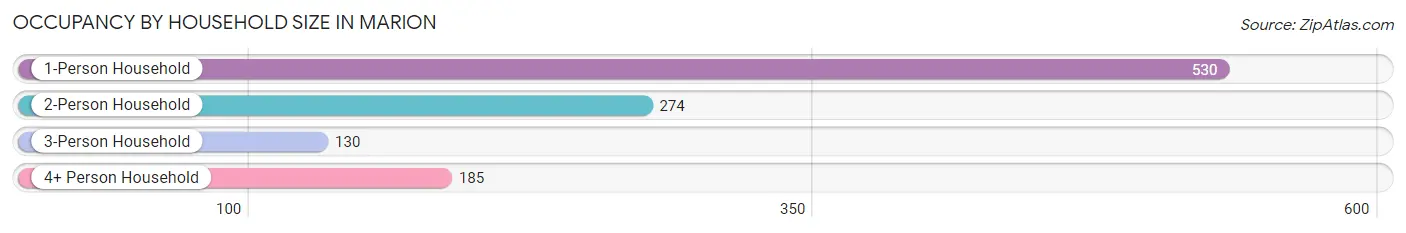
| Household Size | # Housing Units | % Housing Units |
| 1-Person Household | 530 | 47.4% |
| 2-Person Household | 274 | 24.5% |
| 3-Person Household | 130 | 11.6% |
| 4+ Person Household | 185 | 16.5% |
| Total Housing Units | 1,119 | 100.0% |
Occupancy by Ownership by Household Size in Marion
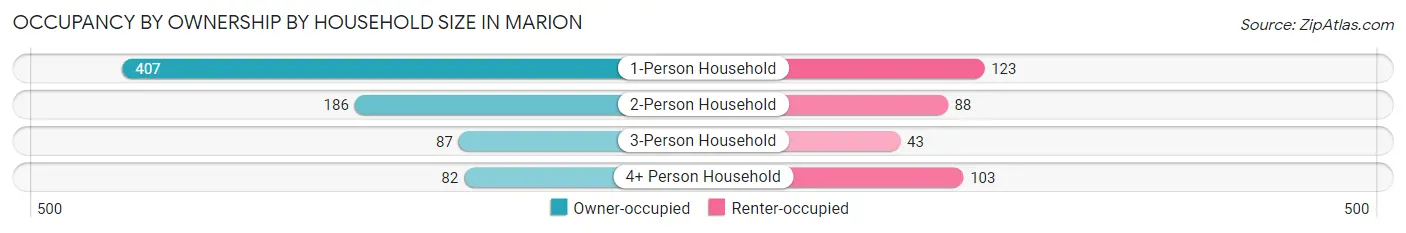
| Household Size | Owner-occupied | Renter-occupied |
| 1-Person Household | 407 (76.8%) | 123 (23.2%) |
| 2-Person Household | 186 (67.9%) | 88 (32.1%) |
| 3-Person Household | 87 (66.9%) | 43 (33.1%) |
| 4+ Person Household | 82 (44.3%) | 103 (55.7%) |
| Total Housing Units | 762 (68.1%) | 357 (31.9%) |
Occupancy by Educational Attainment in Marion
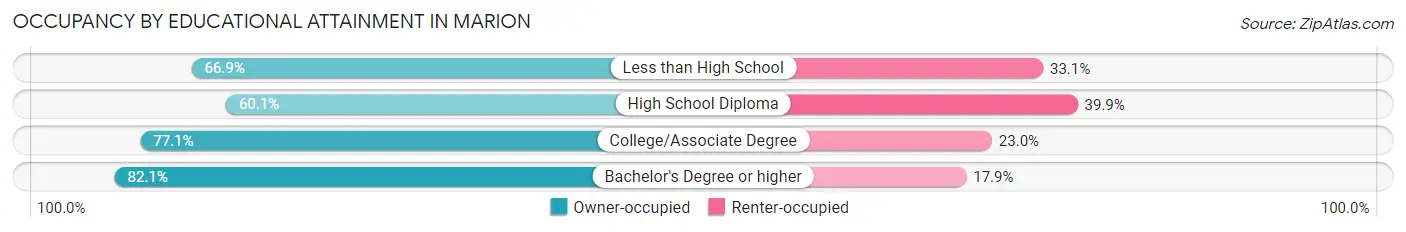
| Household Size | Owner-occupied | Renter-occupied |
| Less than High School | 91 (66.9%) | 45 (33.1%) |
| High School Diploma | 331 (60.1%) | 220 (39.9%) |
| College/Associate Degree | 225 (77.0%) | 67 (23.0%) |
| Bachelor's Degree or higher | 115 (82.1%) | 25 (17.9%) |
Occupancy by Age of Householder in Marion
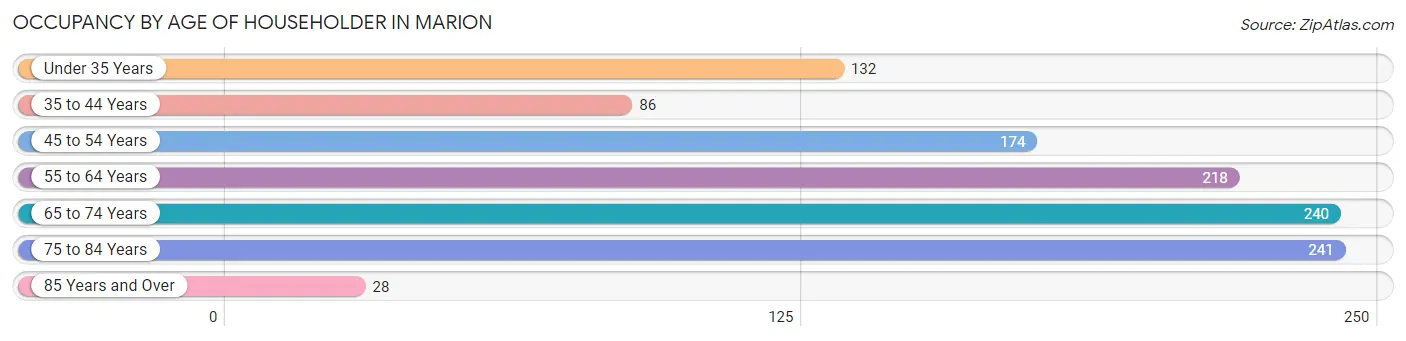
| Age Bracket | # Households | % Households |
| Under 35 Years | 132 | 11.8% |
| 35 to 44 Years | 86 | 7.7% |
| 45 to 54 Years | 174 | 15.5% |
| 55 to 64 Years | 218 | 19.5% |
| 65 to 74 Years | 240 | 21.4% |
| 75 to 84 Years | 241 | 21.5% |
| 85 Years and Over | 28 | 2.5% |
| Total | 1,119 | 100.0% |
Housing Finances in Marion
Median Income by Occupancy in Marion
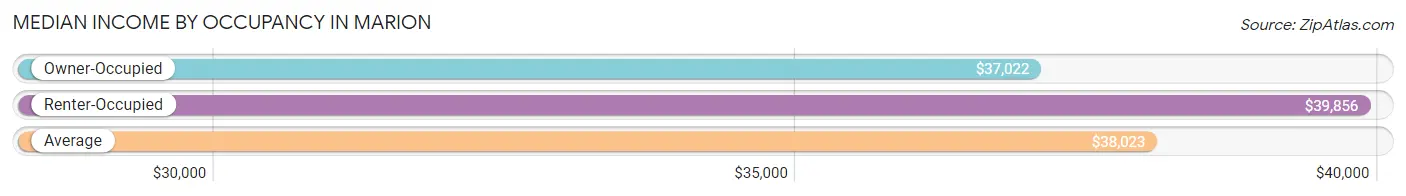
| Occupancy Type | # Households | Median Income |
| Owner-Occupied | 762 (68.1%) | $37,022 |
| Renter-Occupied | 357 (31.9%) | $39,856 |
| Average | 1,119 (100.0%) | $38,023 |
Occupancy by Householder Income Bracket in Marion
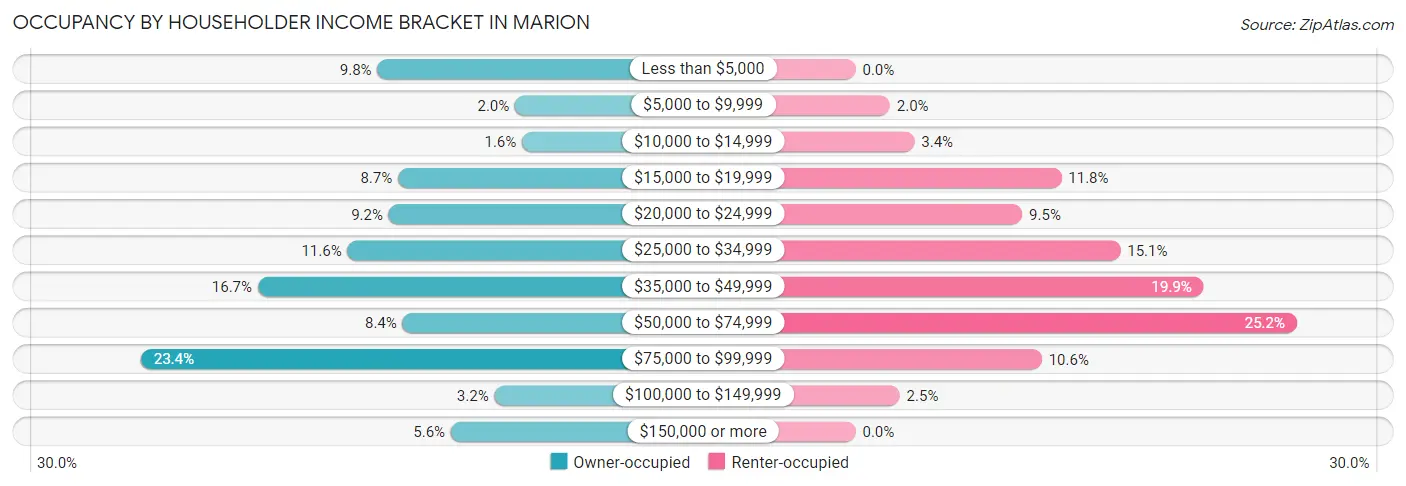
| Income Bracket | Owner-occupied | Renter-occupied |
| Less than $5,000 | 75 (9.8%) | 0 (0.0%) |
| $5,000 to $9,999 | 15 (2.0%) | 7 (2.0%) |
| $10,000 to $14,999 | 12 (1.6%) | 12 (3.4%) |
| $15,000 to $19,999 | 66 (8.7%) | 42 (11.8%) |
| $20,000 to $24,999 | 70 (9.2%) | 34 (9.5%) |
| $25,000 to $34,999 | 88 (11.6%) | 54 (15.1%) |
| $35,000 to $49,999 | 127 (16.7%) | 71 (19.9%) |
| $50,000 to $74,999 | 64 (8.4%) | 90 (25.2%) |
| $75,000 to $99,999 | 178 (23.4%) | 38 (10.6%) |
| $100,000 to $149,999 | 24 (3.2%) | 9 (2.5%) |
| $150,000 or more | 43 (5.6%) | 0 (0.0%) |
| Total | 762 (100.0%) | 357 (100.0%) |
Monthly Housing Cost Tiers in Marion
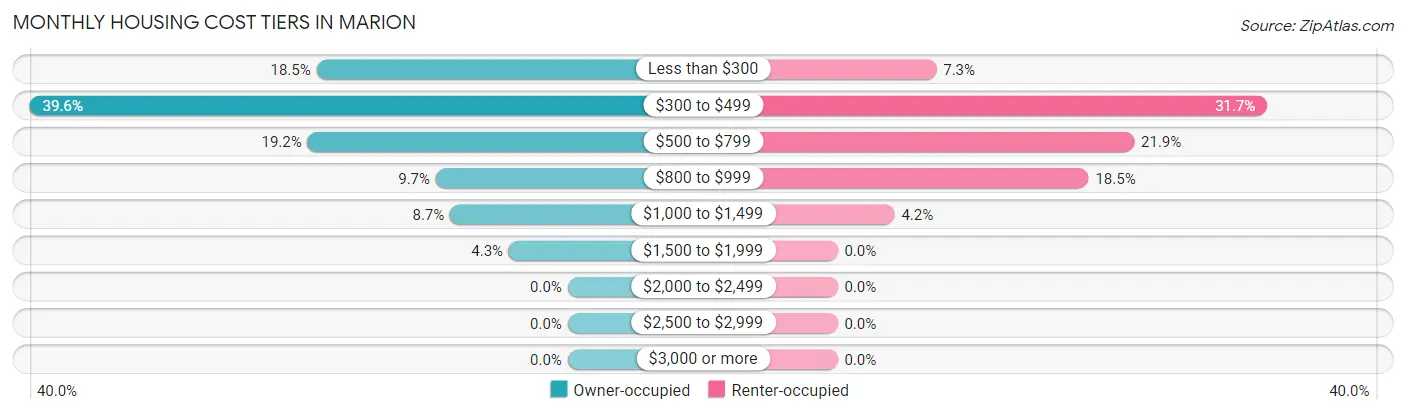
| Monthly Cost | Owner-occupied | Renter-occupied |
| Less than $300 | 141 (18.5%) | 26 (7.3%) |
| $300 to $499 | 302 (39.6%) | 113 (31.7%) |
| $500 to $799 | 146 (19.2%) | 78 (21.8%) |
| $800 to $999 | 74 (9.7%) | 66 (18.5%) |
| $1,000 to $1,499 | 66 (8.7%) | 15 (4.2%) |
| $1,500 to $1,999 | 33 (4.3%) | 0 (0.0%) |
| $2,000 to $2,499 | 0 (0.0%) | 0 (0.0%) |
| $2,500 to $2,999 | 0 (0.0%) | 0 (0.0%) |
| $3,000 or more | 0 (0.0%) | 0 (0.0%) |
| Total | 762 (100.0%) | 357 (100.0%) |
Physical Housing Characteristics in Marion
Housing Structures in Marion
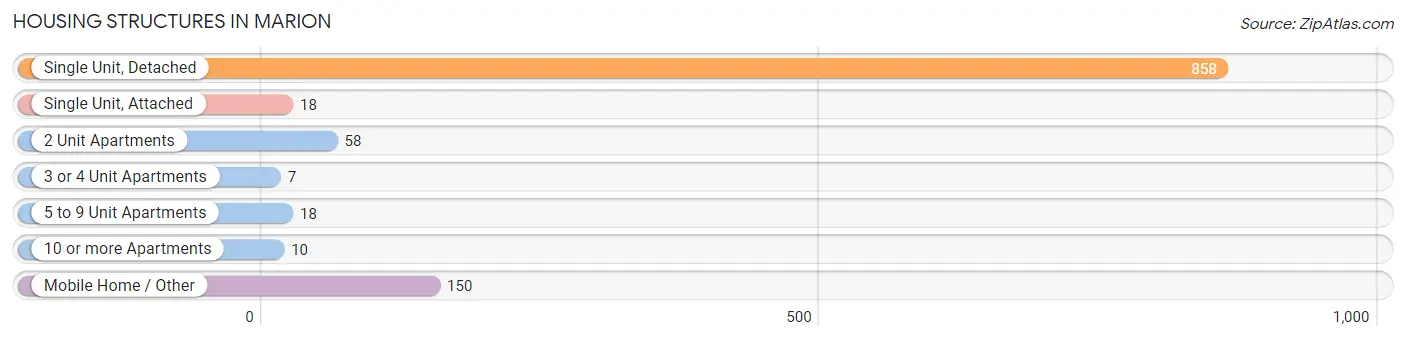
| Structure Type | # Housing Units | % Housing Units |
| Single Unit, Detached | 858 | 76.7% |
| Single Unit, Attached | 18 | 1.6% |
| 2 Unit Apartments | 58 | 5.2% |
| 3 or 4 Unit Apartments | 7 | 0.6% |
| 5 to 9 Unit Apartments | 18 | 1.6% |
| 10 or more Apartments | 10 | 0.9% |
| Mobile Home / Other | 150 | 13.4% |
| Total | 1,119 | 100.0% |
Housing Structures by Occupancy in Marion
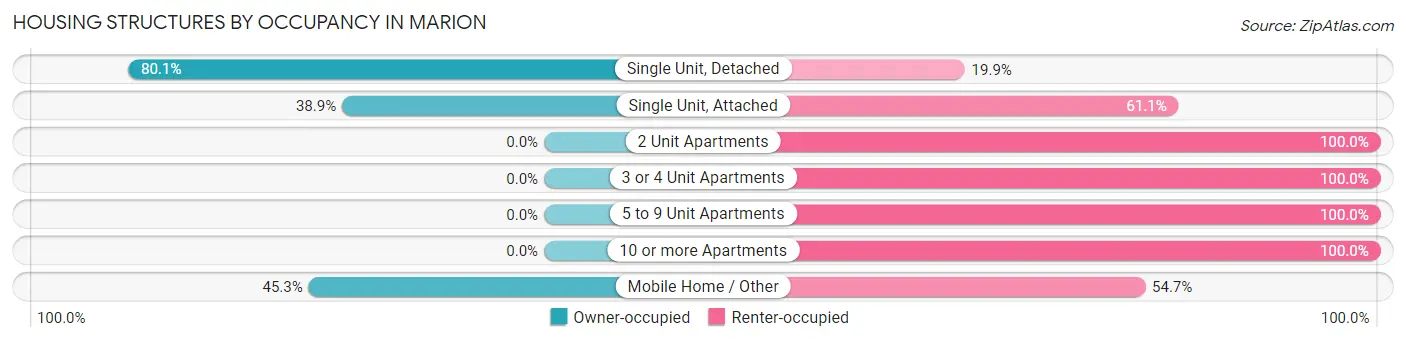
| Structure Type | Owner-occupied | Renter-occupied |
| Single Unit, Detached | 687 (80.1%) | 171 (19.9%) |
| Single Unit, Attached | 7 (38.9%) | 11 (61.1%) |
| 2 Unit Apartments | 0 (0.0%) | 58 (100.0%) |
| 3 or 4 Unit Apartments | 0 (0.0%) | 7 (100.0%) |
| 5 to 9 Unit Apartments | 0 (0.0%) | 18 (100.0%) |
| 10 or more Apartments | 0 (0.0%) | 10 (100.0%) |
| Mobile Home / Other | 68 (45.3%) | 82 (54.7%) |
| Total | 762 (68.1%) | 357 (31.9%) |
Housing Structures by Number of Rooms in Marion
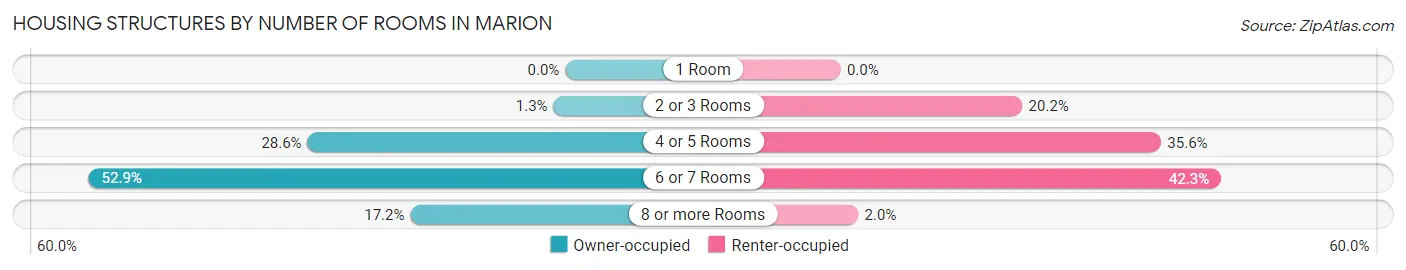
| Number of Rooms | Owner-occupied | Renter-occupied |
| 1 Room | 0 (0.0%) | 0 (0.0%) |
| 2 or 3 Rooms | 10 (1.3%) | 72 (20.2%) |
| 4 or 5 Rooms | 218 (28.6%) | 127 (35.6%) |
| 6 or 7 Rooms | 403 (52.9%) | 151 (42.3%) |
| 8 or more Rooms | 131 (17.2%) | 7 (2.0%) |
| Total | 762 (100.0%) | 357 (100.0%) |
Housing Structure by Heating Type in Marion
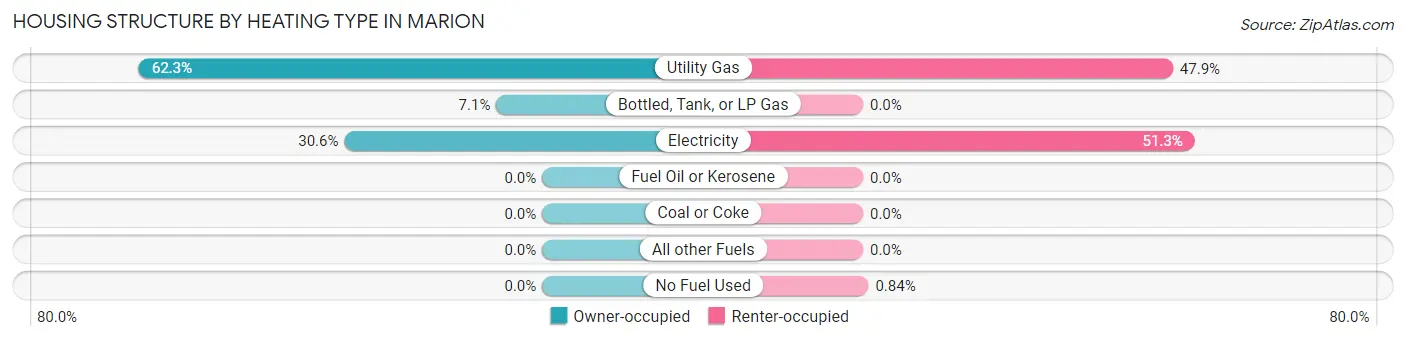
| Heating Type | Owner-occupied | Renter-occupied |
| Utility Gas | 475 (62.3%) | 171 (47.9%) |
| Bottled, Tank, or LP Gas | 54 (7.1%) | 0 (0.0%) |
| Electricity | 233 (30.6%) | 183 (51.3%) |
| Fuel Oil or Kerosene | 0 (0.0%) | 0 (0.0%) |
| Coal or Coke | 0 (0.0%) | 0 (0.0%) |
| All other Fuels | 0 (0.0%) | 0 (0.0%) |
| No Fuel Used | 0 (0.0%) | 3 (0.8%) |
| Total | 762 (100.0%) | 357 (100.0%) |
Household Vehicle Usage in Marion
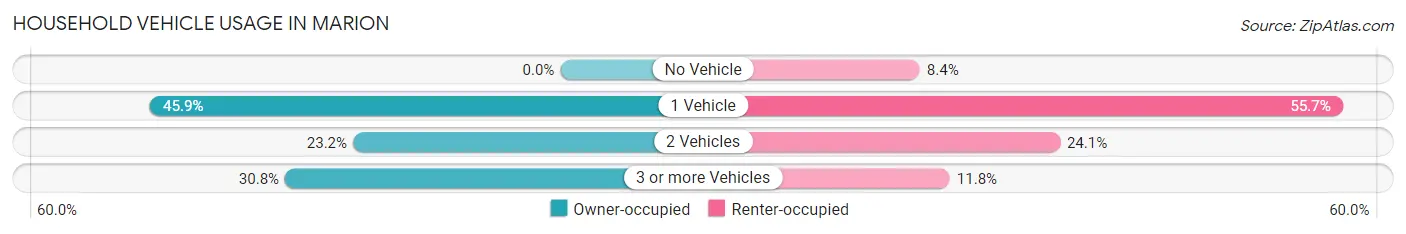
| Vehicles per Household | Owner-occupied | Renter-occupied |
| No Vehicle | 0 (0.0%) | 30 (8.4%) |
| 1 Vehicle | 350 (45.9%) | 199 (55.7%) |
| 2 Vehicles | 177 (23.2%) | 86 (24.1%) |
| 3 or more Vehicles | 235 (30.8%) | 42 (11.8%) |
| Total | 762 (100.0%) | 357 (100.0%) |
Real Estate & Mortgages in Marion
Real Estate and Mortgage Overview in Marion
| Characteristic | Without Mortgage | With Mortgage |
| Housing Units | 474 | 288 |
| Median Property Value | $96,900 | $79,100 |
| Median Household Income | $35,750 | $17 |
| Monthly Housing Costs | $359 | $0 |
| Real Estate Taxes | $535 | $23 |
Property Value by Mortgage Status in Marion
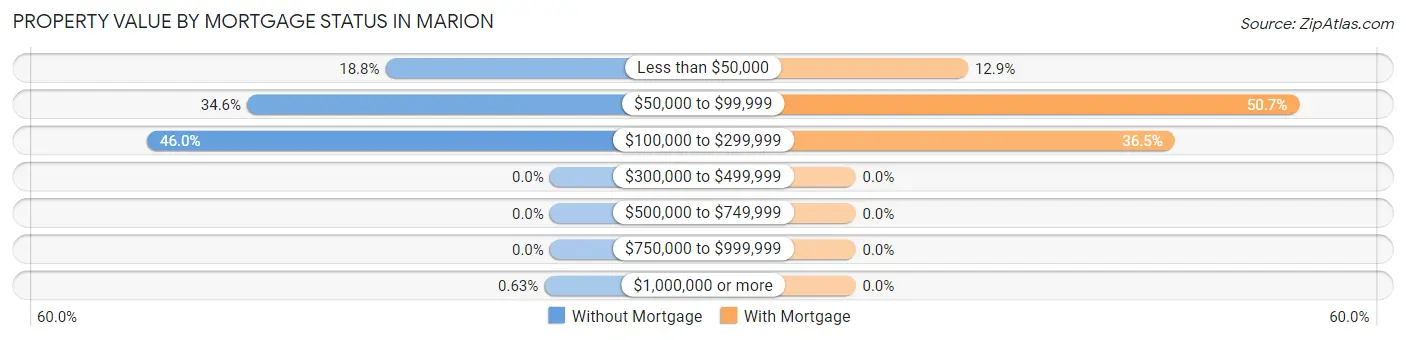
| Property Value | Without Mortgage | With Mortgage |
| Less than $50,000 | 89 (18.8%) | 37 (12.9%) |
| $50,000 to $99,999 | 164 (34.6%) | 146 (50.7%) |
| $100,000 to $299,999 | 218 (46.0%) | 105 (36.5%) |
| $300,000 to $499,999 | 0 (0.0%) | 0 (0.0%) |
| $500,000 to $749,999 | 0 (0.0%) | 0 (0.0%) |
| $750,000 to $999,999 | 0 (0.0%) | 0 (0.0%) |
| $1,000,000 or more | 3 (0.6%) | 0 (0.0%) |
| Total | 474 (100.0%) | 288 (100.0%) |
Household Income by Mortgage Status in Marion
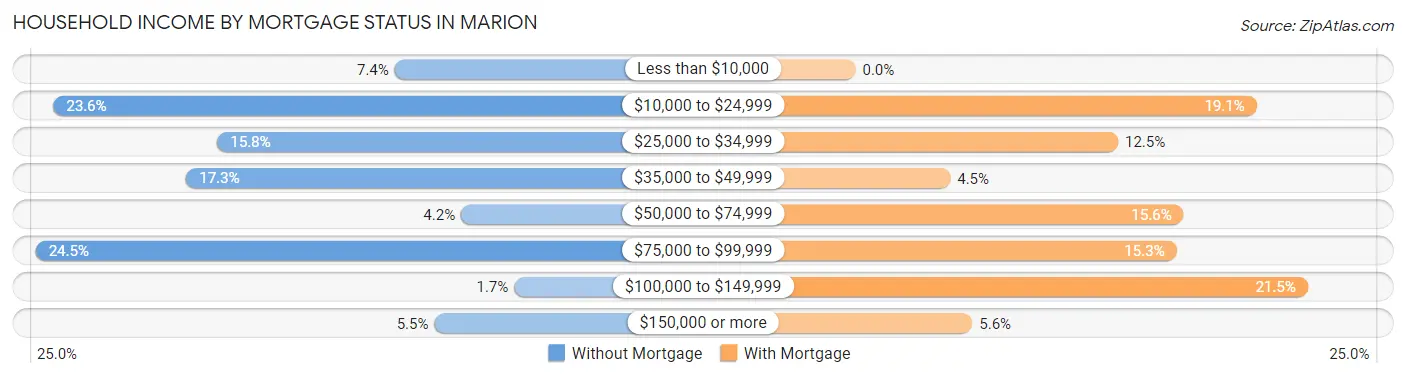
| Household Income | Without Mortgage | With Mortgage |
| Less than $10,000 | 35 (7.4%) | 0 (0.0%) |
| $10,000 to $24,999 | 112 (23.6%) | 55 (19.1%) |
| $25,000 to $34,999 | 75 (15.8%) | 36 (12.5%) |
| $35,000 to $49,999 | 82 (17.3%) | 13 (4.5%) |
| $50,000 to $74,999 | 20 (4.2%) | 45 (15.6%) |
| $75,000 to $99,999 | 116 (24.5%) | 44 (15.3%) |
| $100,000 to $149,999 | 8 (1.7%) | 62 (21.5%) |
| $150,000 or more | 26 (5.5%) | 16 (5.6%) |
| Total | 474 (100.0%) | 288 (100.0%) |
Property Value to Household Income Ratio in Marion
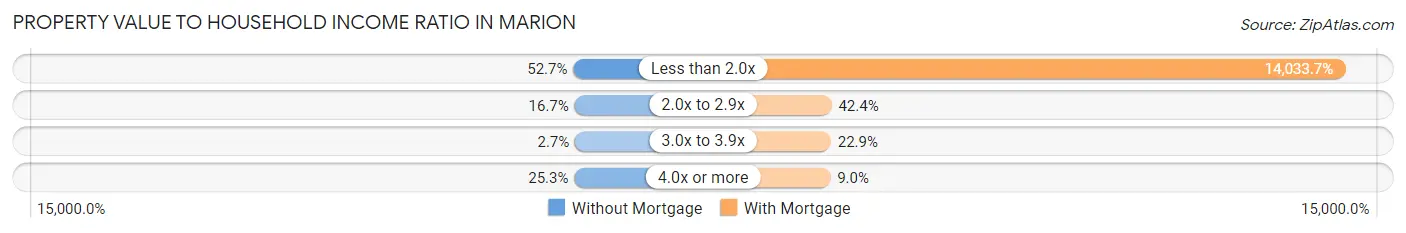
| Value-to-Income Ratio | Without Mortgage | With Mortgage |
| Less than 2.0x | 250 (52.7%) | 40,417 (14,033.7%) |
| 2.0x to 2.9x | 79 (16.7%) | 122 (42.4%) |
| 3.0x to 3.9x | 13 (2.7%) | 66 (22.9%) |
| 4.0x or more | 120 (25.3%) | 26 (9.0%) |
| Total | 474 (100.0%) | 288 (100.0%) |
Real Estate Taxes by Mortgage Status in Marion
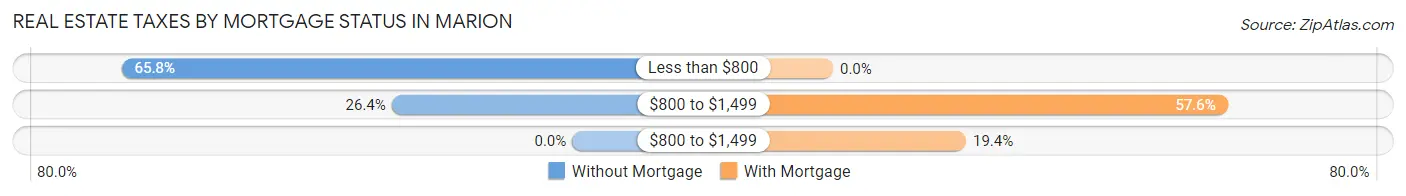
| Property Taxes | Without Mortgage | With Mortgage |
| Less than $800 | 312 (65.8%) | 0 (0.0%) |
| $800 to $1,499 | 125 (26.4%) | 166 (57.6%) |
| $800 to $1,499 | 0 (0.0%) | 56 (19.4%) |
| Total | 474 (100.0%) | 288 (100.0%) |
Health & Disability in Marion
Health Insurance Coverage by Age in Marion
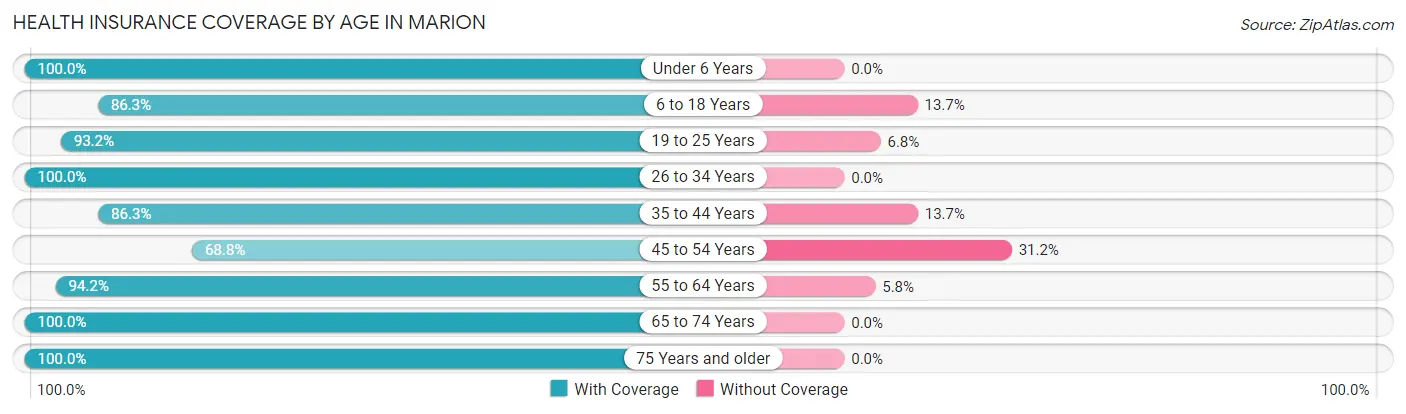
| Age Bracket | With Coverage | Without Coverage |
| Under 6 Years | 225 (100.0%) | 0 (0.0%) |
| 6 to 18 Years | 278 (86.3%) | 44 (13.7%) |
| 19 to 25 Years | 262 (93.2%) | 19 (6.8%) |
| 26 to 34 Years | 156 (100.0%) | 0 (0.0%) |
| 35 to 44 Years | 214 (86.3%) | 34 (13.7%) |
| 45 to 54 Years | 315 (68.8%) | 143 (31.2%) |
| 55 to 64 Years | 310 (94.2%) | 19 (5.8%) |
| 65 to 74 Years | 360 (100.0%) | 0 (0.0%) |
| 75 Years and older | 289 (100.0%) | 0 (0.0%) |
| Total | 2,409 (90.3%) | 259 (9.7%) |
Health Insurance Coverage by Citizenship Status in Marion
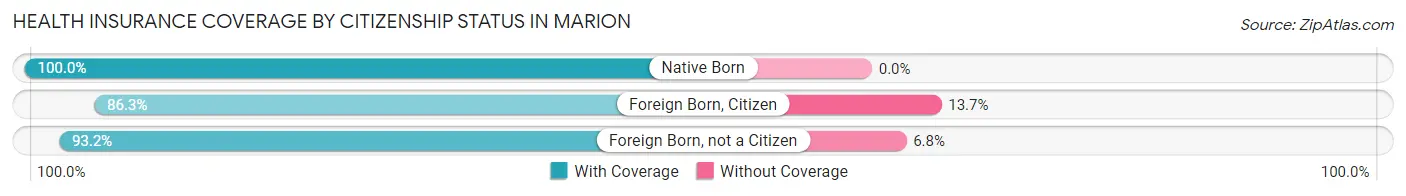
| Citizenship Status | With Coverage | Without Coverage |
| Native Born | 225 (100.0%) | 0 (0.0%) |
| Foreign Born, Citizen | 278 (86.3%) | 44 (13.7%) |
| Foreign Born, not a Citizen | 262 (93.2%) | 19 (6.8%) |
Health Insurance Coverage by Household Income in Marion
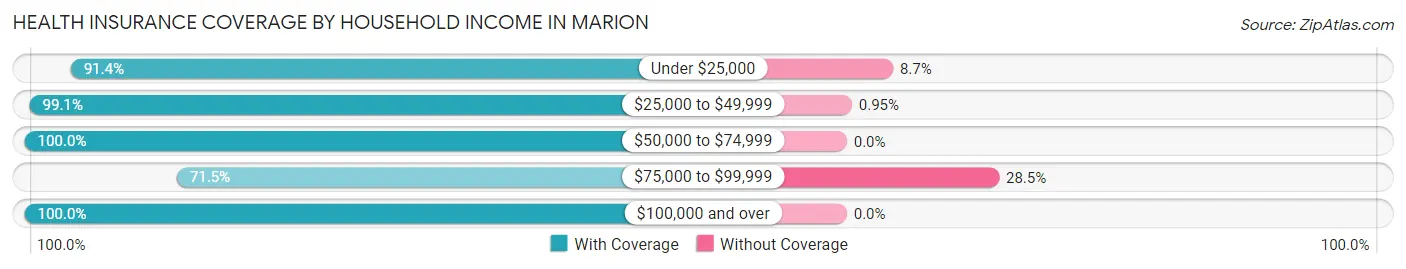
| Household Income | With Coverage | Without Coverage |
| Under $25,000 | 486 (91.3%) | 46 (8.6%) |
| $25,000 to $49,999 | 732 (99.1%) | 7 (0.9%) |
| $50,000 to $74,999 | 417 (100.0%) | 0 (0.0%) |
| $75,000 to $99,999 | 516 (71.5%) | 206 (28.5%) |
| $100,000 and over | 258 (100.0%) | 0 (0.0%) |
Public vs Private Health Insurance Coverage by Age in Marion
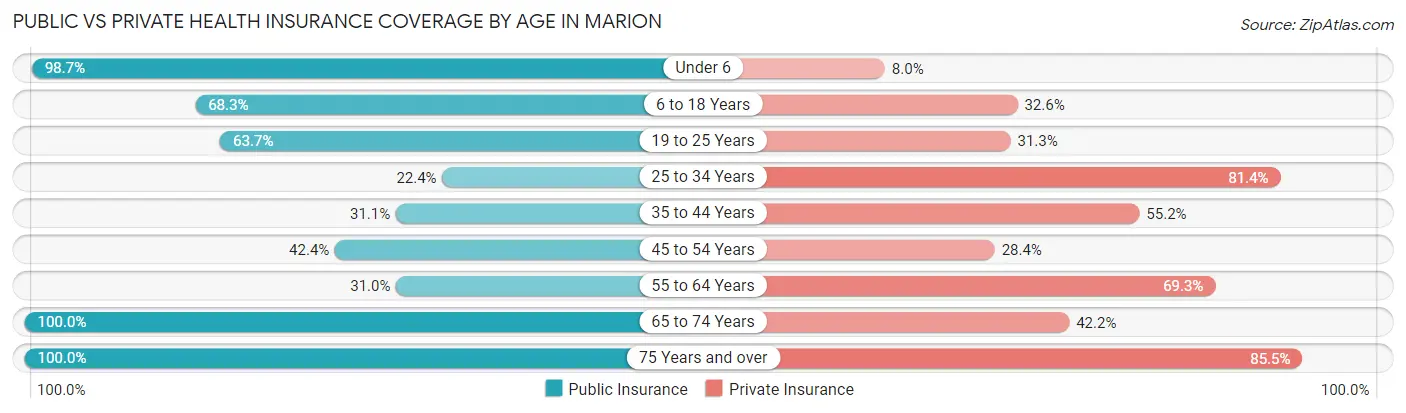
| Age Bracket | Public Insurance | Private Insurance |
| Under 6 | 222 (98.7%) | 18 (8.0%) |
| 6 to 18 Years | 220 (68.3%) | 105 (32.6%) |
| 19 to 25 Years | 179 (63.7%) | 88 (31.3%) |
| 25 to 34 Years | 35 (22.4%) | 127 (81.4%) |
| 35 to 44 Years | 77 (31.0%) | 137 (55.2%) |
| 45 to 54 Years | 194 (42.4%) | 130 (28.4%) |
| 55 to 64 Years | 102 (31.0%) | 228 (69.3%) |
| 65 to 74 Years | 360 (100.0%) | 152 (42.2%) |
| 75 Years and over | 289 (100.0%) | 247 (85.5%) |
| Total | 1,678 (62.9%) | 1,232 (46.2%) |
Disability Status by Sex by Age in Marion
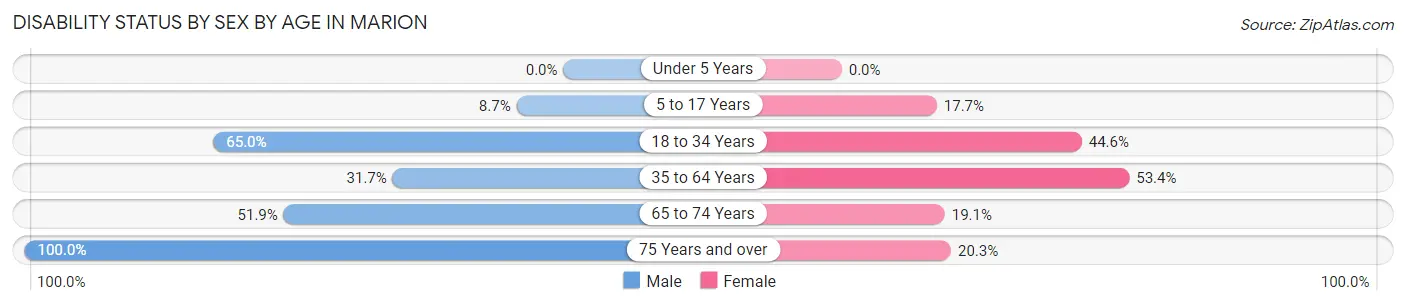
| Age Bracket | Male | Female |
| Under 5 Years | 0 (0.0%) | 0 (0.0%) |
| 5 to 17 Years | 18 (8.7%) | 21 (17.6%) |
| 18 to 34 Years | 165 (65.0%) | 94 (44.6%) |
| 35 to 64 Years | 154 (31.7%) | 293 (53.4%) |
| 65 to 74 Years | 81 (51.9%) | 39 (19.1%) |
| 75 Years and over | 77 (100.0%) | 43 (20.3%) |
Disability Class by Sex by Age in Marion
Disability Class: Hearing Difficulty
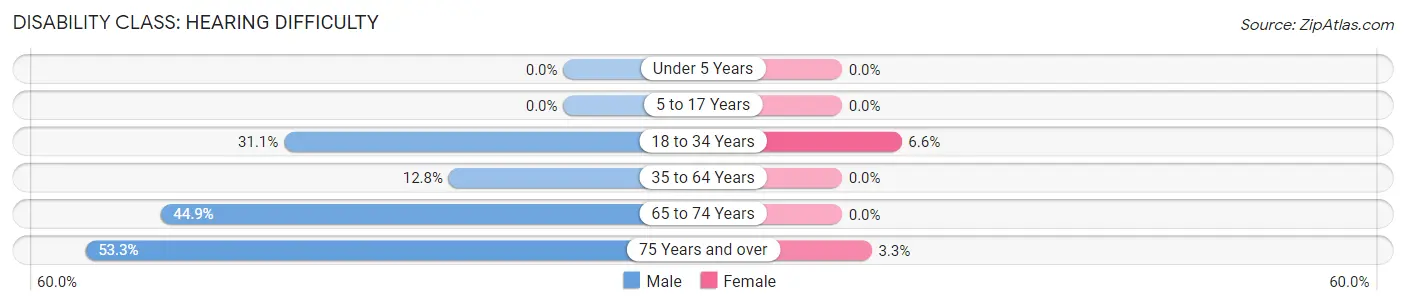
| Age Bracket | Male | Female |
| Under 5 Years | 0 (0.0%) | 0 (0.0%) |
| 5 to 17 Years | 0 (0.0%) | 0 (0.0%) |
| 18 to 34 Years | 79 (31.1%) | 14 (6.6%) |
| 35 to 64 Years | 62 (12.8%) | 0 (0.0%) |
| 65 to 74 Years | 70 (44.9%) | 0 (0.0%) |
| 75 Years and over | 41 (53.2%) | 7 (3.3%) |
Disability Class: Vision Difficulty
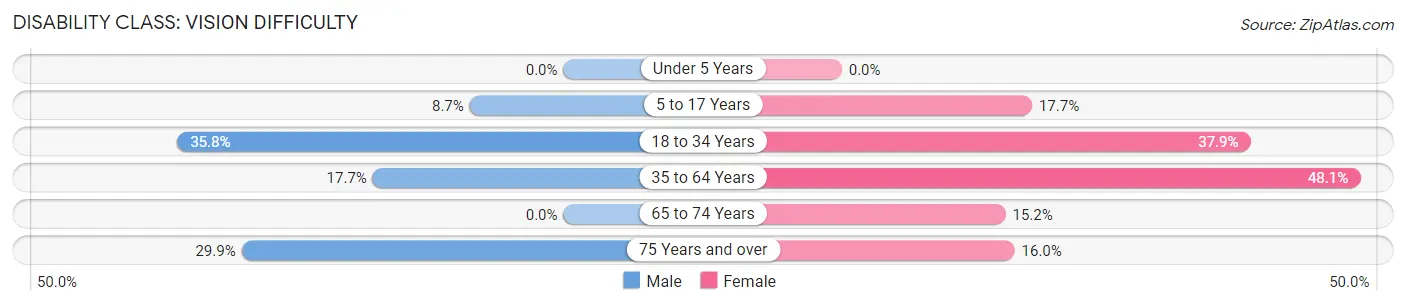
| Age Bracket | Male | Female |
| Under 5 Years | 0 (0.0%) | 0 (0.0%) |
| 5 to 17 Years | 18 (8.7%) | 21 (17.6%) |
| 18 to 34 Years | 91 (35.8%) | 80 (37.9%) |
| 35 to 64 Years | 86 (17.7%) | 264 (48.1%) |
| 65 to 74 Years | 0 (0.0%) | 31 (15.2%) |
| 75 Years and over | 23 (29.9%) | 34 (16.0%) |
Disability Class: Cognitive Difficulty
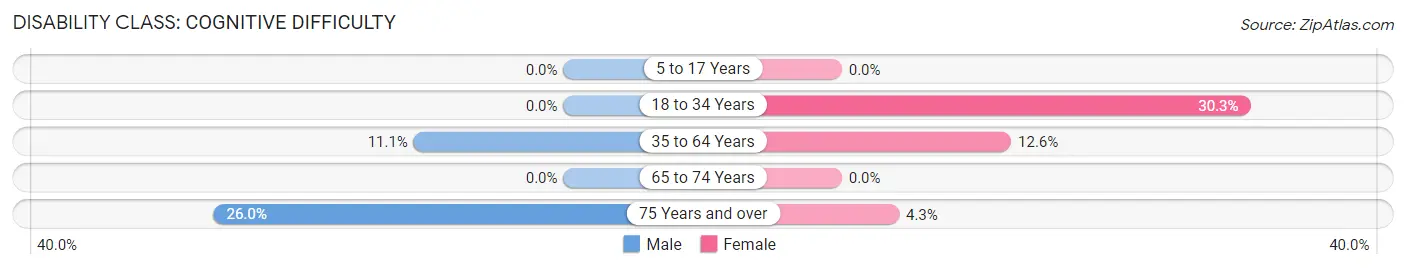
| Age Bracket | Male | Female |
| 5 to 17 Years | 0 (0.0%) | 0 (0.0%) |
| 18 to 34 Years | 0 (0.0%) | 64 (30.3%) |
| 35 to 64 Years | 54 (11.1%) | 69 (12.6%) |
| 65 to 74 Years | 0 (0.0%) | 0 (0.0%) |
| 75 Years and over | 20 (26.0%) | 9 (4.3%) |
Disability Class: Ambulatory Difficulty
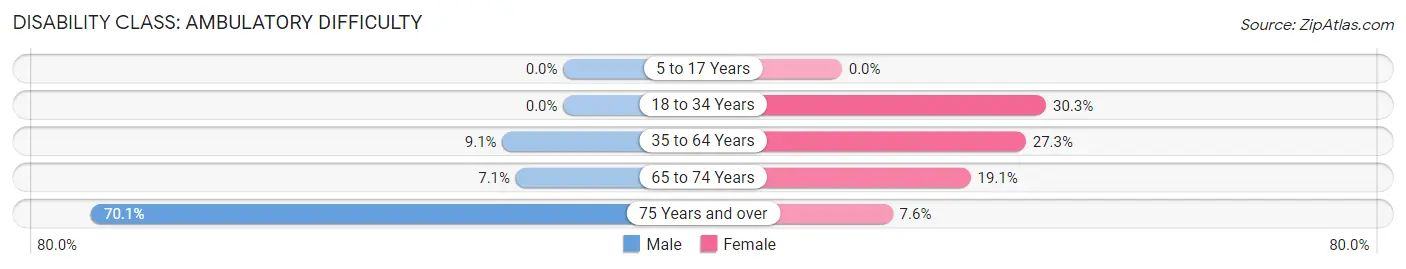
| Age Bracket | Male | Female |
| 5 to 17 Years | 0 (0.0%) | 0 (0.0%) |
| 18 to 34 Years | 0 (0.0%) | 64 (30.3%) |
| 35 to 64 Years | 44 (9.0%) | 150 (27.3%) |
| 65 to 74 Years | 11 (7.0%) | 39 (19.1%) |
| 75 Years and over | 54 (70.1%) | 16 (7.5%) |
Disability Class: Self-Care Difficulty
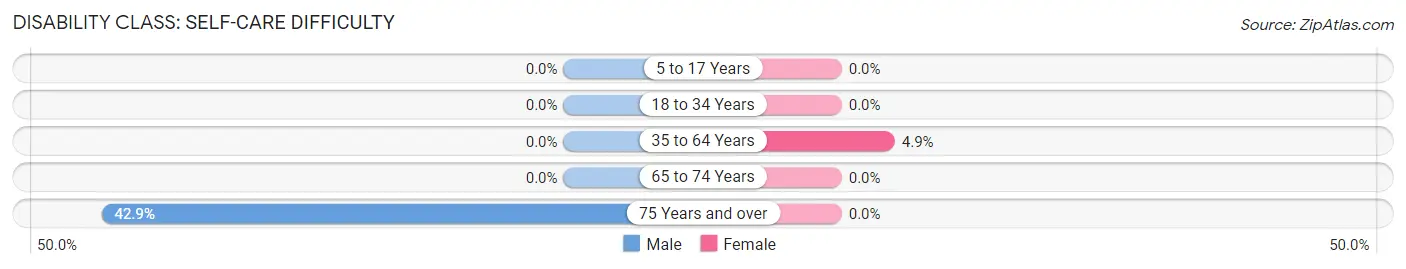
| Age Bracket | Male | Female |
| 5 to 17 Years | 0 (0.0%) | 0 (0.0%) |
| 18 to 34 Years | 0 (0.0%) | 0 (0.0%) |
| 35 to 64 Years | 0 (0.0%) | 27 (4.9%) |
| 65 to 74 Years | 0 (0.0%) | 0 (0.0%) |
| 75 Years and over | 33 (42.9%) | 0 (0.0%) |
Technology Access in Marion
Computing Device Access in Marion
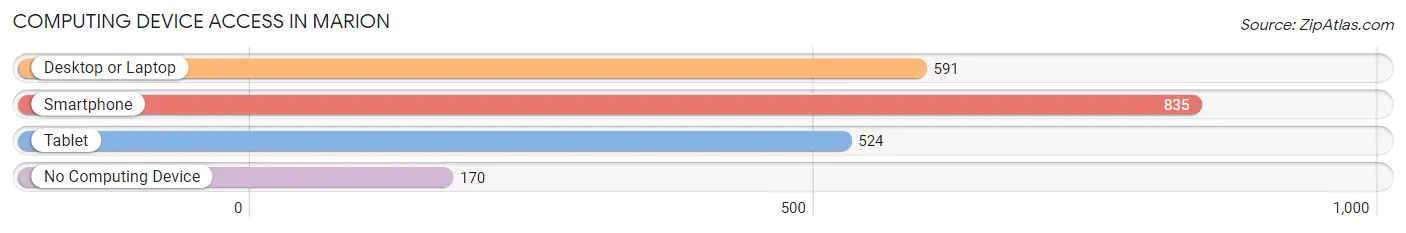
| Device Type | # Households | % Households |
| Desktop or Laptop | 591 | 52.8% |
| Smartphone | 835 | 74.6% |
| Tablet | 524 | 46.8% |
| No Computing Device | 170 | 15.2% |
| Total | 1,119 | 100.0% |
Internet Access in Marion
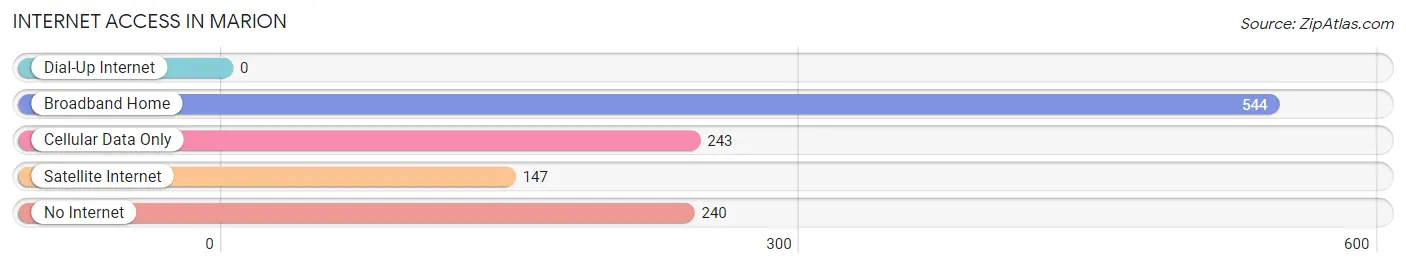
| Internet Type | # Households | % Households |
| Dial-Up Internet | 0 | 0.0% |
| Broadband Home | 544 | 48.6% |
| Cellular Data Only | 243 | 21.7% |
| Satellite Internet | 147 | 13.1% |
| No Internet | 240 | 21.4% |
| Total | 1,119 | 100.0% |
Marion Summary
Marion, Kentucky is a small city located in Crittenden County, Kentucky. It is situated on the banks of the Ohio River, and is part of the Paducah, Kentucky-Illinois Metropolitan Statistical Area. The city has a population of approximately 3,000 people, and is the county seat of Crittenden County.
History
Marion was founded in 1842 by William Marion, a local landowner. The city was originally known as Marionville, and was incorporated in 1845. The city was named after William Marion, who was a prominent local landowner and businessman.
In the late 19th century, Marion was a major center for the production of tobacco. The city was also home to several large tobacco warehouses, and was a major hub for the tobacco industry in the region.
In the early 20th century, Marion was a major center for the production of coal. The city was home to several large coal mines, and was a major hub for the coal industry in the region.
Geography
Marion is located in the western part of Crittenden County, Kentucky. The city is situated on the banks of the Ohio River, and is part of the Paducah, Kentucky-Illinois Metropolitan Statistical Area. The city has a total area of 2.2 square miles, all of which is land.
The climate in Marion is humid subtropical, with hot, humid summers and mild winters. The average annual temperature is around 62 degrees Fahrenheit, and the average annual precipitation is around 45 inches.
Economy
Marion’s economy is largely based on agriculture and manufacturing. The city is home to several large agricultural operations, including a large poultry farm and a large dairy farm. The city is also home to several large manufacturing operations, including a large paper mill and a large furniture factory.
The city is also home to several small businesses, including restaurants, retail stores, and service providers.
Demographics
As of the 2010 census, the population of Marion was 3,039. The racial makeup of the city was 92.3% White, 4.2% African American, 0.3% Native American, 0.3% Asian, 0.1% Pacific Islander, and 2.8% from other races. The median household income in the city was $30,938, and the median family income was $37,813.
Marion is home to several churches, including the First Baptist Church, the First United Methodist Church, and the Church of Christ. The city is also home to several schools, including Marion Elementary School, Marion Middle School, and Marion High School.
Conclusion
Marion, Kentucky is a small city located in Crittenden County, Kentucky. It is situated on the banks of the Ohio River, and is part of the Paducah, Kentucky-Illinois Metropolitan Statistical Area. The city has a population of approximately 3,000 people, and is the county seat of Crittenden County. The city’s economy is largely based on agriculture and manufacturing, and the city is home to several churches and schools. The racial makeup of the city is predominantly white, with a small percentage of African Americans, Native Americans, Asians, and Pacific Islanders. The median household income in the city is $30,938, and the median family income is $37,813.
Common Questions
What is Per Capita Income in Marion?
Per Capita income in Marion is $25,336.
What is the Median Family Income in Marion?
Median Family Income in Marion is $54,375.
What is the Median Household income in Marion?
Median Household Income in Marion is $38,023.
What is Income or Wage Gap in Marion?
Income or Wage Gap in Marion is 60.6%.
Women in Marion earn 39.4 cents for every dollar earned by a man.
What is Family Income Deficit in Marion?
Family Income Deficit in Marion is $15,836.
Families that are below poverty line in Marion earn $15,836 less on average than the poverty threshold level.
What is Inequality or Gini Index in Marion?
Inequality or Gini Index in Marion is 0.46.
What is the Total Population of Marion?
Total Population of Marion is 2,905.
What is the Total Male Population of Marion?
Total Male Population of Marion is 1,429.
What is the Total Female Population of Marion?
Total Female Population of Marion is 1,476.
What is the Ratio of Males per 100 Females in Marion?
There are 96.82 Males per 100 Females in Marion.
What is the Ratio of Females per 100 Males in Marion?
There are 103.29 Females per 100 Males in Marion.
What is the Median Population Age in Marion?
Median Population Age in Marion is 47.4 Years.
What is the Average Family Size in Marion
Average Family Size in Marion is 3.4 People.
What is the Average Household Size in Marion
Average Household Size in Marion is 2.4 People.
How Large is the Labor Force in Marion?
There are 1,034 People in the Labor Forcein in Marion.
What is the Percentage of People in the Labor Force in Marion?
43.1% of People are in the Labor Force in Marion.
What is the Unemployment Rate in Marion?
Unemployment Rate in Marion is 2.5%.