Burlington, KY Map & Demographics
Burlington Map
Burlington Overview
$39,170
PER CAPITA INCOME
$114,282
AVG FAMILY INCOME
$96,683
AVG HOUSEHOLD INCOME
26.4%
WAGE / INCOME GAP [ % ]
73.6¢/ $1
WAGE / INCOME GAP [ $ ]
0.35
INEQUALITY / GINI INDEX
18,264
TOTAL POPULATION
9,323
MALE POPULATION
8,941
FEMALE POPULATION
104.27
MALES / 100 FEMALES
95.90
FEMALES / 100 MALES
37.7
MEDIAN AGE
3.2
AVG FAMILY SIZE
2.7
AVG HOUSEHOLD SIZE
10,177
LABOR FORCE [ PEOPLE ]
69.3%
PERCENT IN LABOR FORCE
3.0%
UNEMPLOYMENT RATE
Burlington Zip Codes
Burlington Area Codes
Income in Burlington
Income Overview in Burlington
Per Capita Income in Burlington is $39,170, while median incomes of families and households are $114,282 and $96,683 respectively.
| Characteristic | Number | Measure |
| Per Capita Income | 18,264 | $39,170 |
| Median Family Income | 4,610 | $114,282 |
| Mean Family Income | 4,610 | $120,293 |
| Median Household Income | 6,527 | $96,683 |
| Mean Household Income | 6,527 | $107,357 |
| Income Deficit | 4,610 | $0 |
| Wage / Income Gap (%) | 18,264 | 26.38% |
| Wage / Income Gap ($) | 18,264 | 73.62¢ per $1 |
| Gini / Inequality Index | 18,264 | 0.35 |
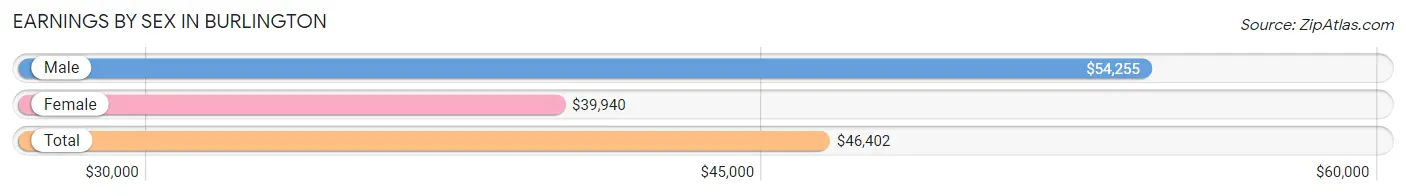
Earnings by Sex in Burlington
Average Earnings in Burlington are $46,402, $54,255 for men and $39,940 for women, a difference of 26.4%.
| Sex | Number | Average Earnings |
| Male | 6,097 (54.5%) | $54,255 |
| Female | 5,079 (45.5%) | $39,940 |
| Total | 11,176 (100.0%) | $46,402 |
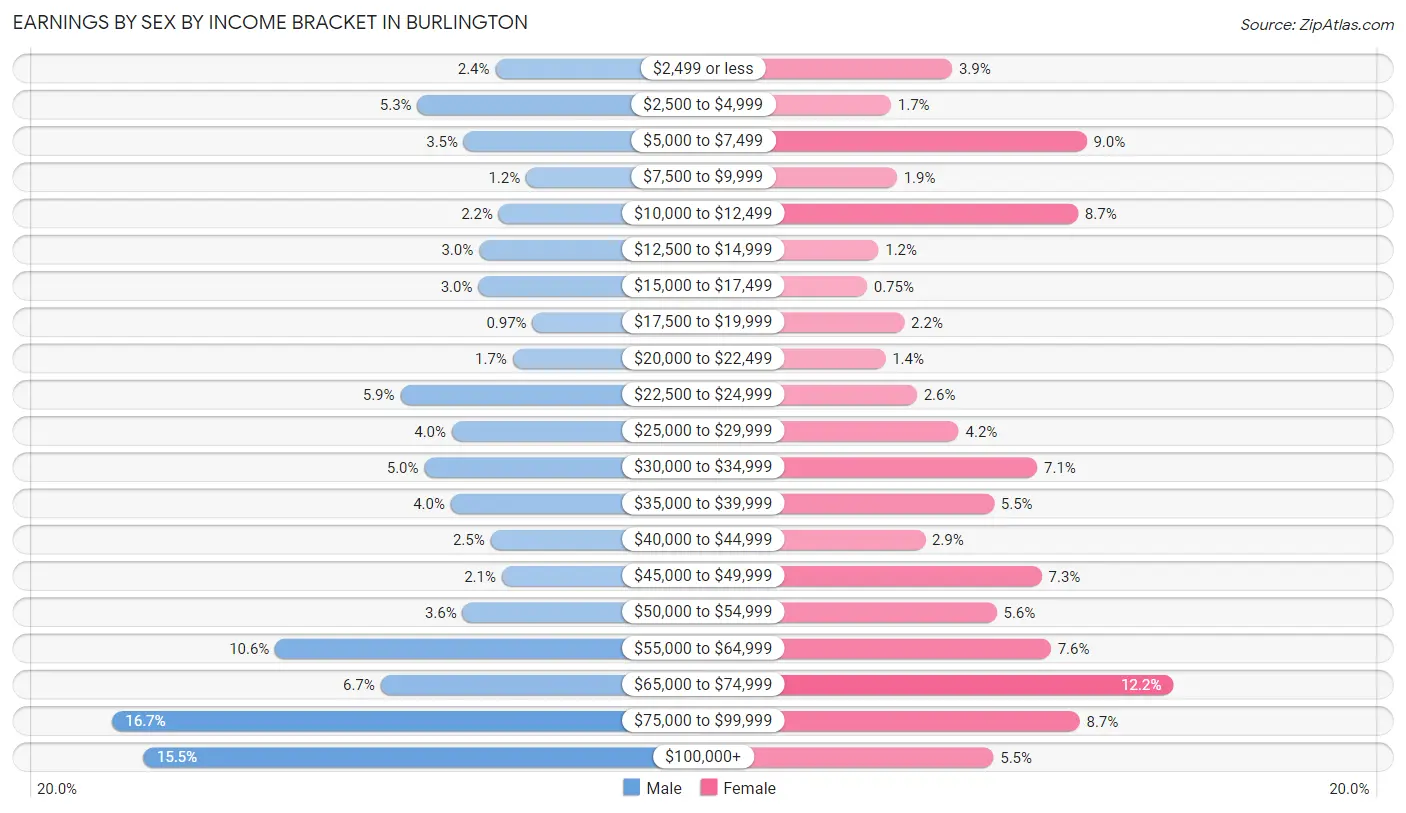
Earnings by Sex by Income Bracket in Burlington
The most common earnings brackets in Burlington are $75,000 to $99,999 for men (1,019 | 16.7%) and $65,000 to $74,999 for women (621 | 12.2%).
| Income | Male | Female |
| $2,499 or less | 144 (2.4%) | 200 (3.9%) |
| $2,500 to $4,999 | 322 (5.3%) | 84 (1.7%) |
| $5,000 to $7,499 | 216 (3.5%) | 456 (9.0%) |
| $7,500 to $9,999 | 74 (1.2%) | 95 (1.9%) |
| $10,000 to $12,499 | 136 (2.2%) | 440 (8.7%) |
| $12,500 to $14,999 | 181 (3.0%) | 60 (1.2%) |
| $15,000 to $17,499 | 183 (3.0%) | 38 (0.7%) |
| $17,500 to $19,999 | 59 (1.0%) | 109 (2.1%) |
| $20,000 to $22,499 | 104 (1.7%) | 73 (1.4%) |
| $22,500 to $24,999 | 361 (5.9%) | 133 (2.6%) |
| $25,000 to $29,999 | 243 (4.0%) | 213 (4.2%) |
| $30,000 to $34,999 | 306 (5.0%) | 362 (7.1%) |
| $35,000 to $39,999 | 246 (4.0%) | 280 (5.5%) |
| $40,000 to $44,999 | 155 (2.5%) | 149 (2.9%) |
| $45,000 to $49,999 | 129 (2.1%) | 371 (7.3%) |
| $50,000 to $54,999 | 219 (3.6%) | 285 (5.6%) |
| $55,000 to $64,999 | 647 (10.6%) | 388 (7.6%) |
| $65,000 to $74,999 | 406 (6.7%) | 621 (12.2%) |
| $75,000 to $99,999 | 1,019 (16.7%) | 443 (8.7%) |
| $100,000+ | 947 (15.5%) | 279 (5.5%) |
| Total | 6,097 (100.0%) | 5,079 (100.0%) |
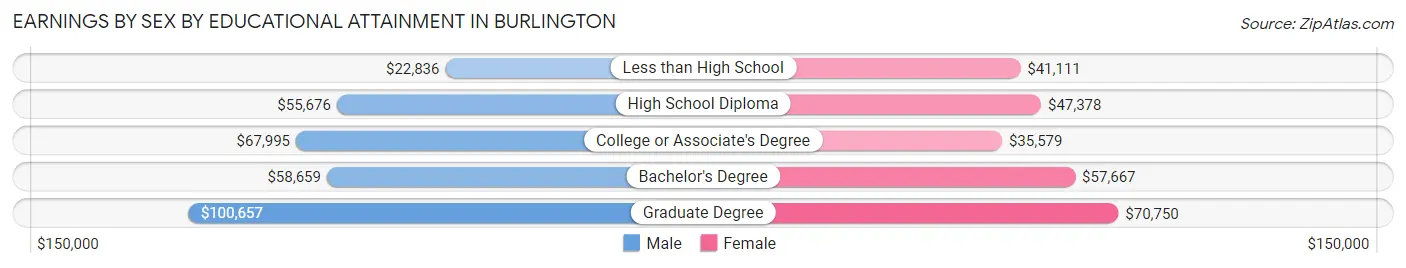
Earnings by Sex by Educational Attainment in Burlington
Average earnings in Burlington are $60,243 for men and $49,108 for women, a difference of 18.5%. Men with an educational attainment of graduate degree enjoy the highest average annual earnings of $100,657, while those with less than high school education earn the least with $22,836. Women with an educational attainment of graduate degree earn the most with the average annual earnings of $70,750, while those with college or associate's degree education have the smallest earnings of $35,579.
| Educational Attainment | Male Income | Female Income |
| Less than High School | $22,836 | $41,111 |
| High School Diploma | $55,676 | $47,378 |
| College or Associate's Degree | $67,995 | $35,579 |
| Bachelor's Degree | $58,659 | $57,667 |
| Graduate Degree | $100,657 | $70,750 |
| Total | $60,243 | $49,108 |
Family Income in Burlington
Family Income Brackets in Burlington
According to the Burlington family income data, there are 1,678 families falling into the $100,000 to $149,999 income range, which is the most common income bracket and makes up 36.4% of all families.
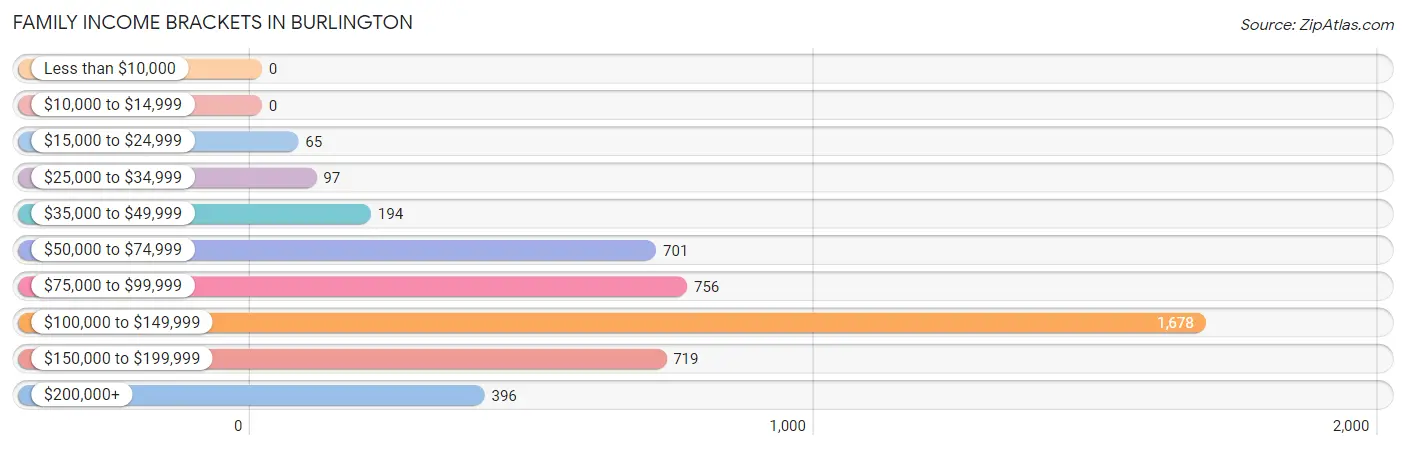
| Income Bracket | # Families | % Families |
| Less than $10,000 | 0 | 0.0% |
| $10,000 to $14,999 | 0 | 0.0% |
| $15,000 to $24,999 | 65 | 1.4% |
| $25,000 to $34,999 | 97 | 2.1% |
| $35,000 to $49,999 | 194 | 4.2% |
| $50,000 to $74,999 | 701 | 15.2% |
| $75,000 to $99,999 | 756 | 16.4% |
| $100,000 to $149,999 | 1,678 | 36.4% |
| $150,000 to $199,999 | 719 | 15.6% |
| $200,000+ | 396 | 8.6% |
Family Income by Famaliy Size in Burlington
5-person families (281 | 6.1%) account for the highest median family income in Burlington with $161,083 per family, while 2-person families (1,645 | 35.7%) have the highest median income of $52,368 per family member.
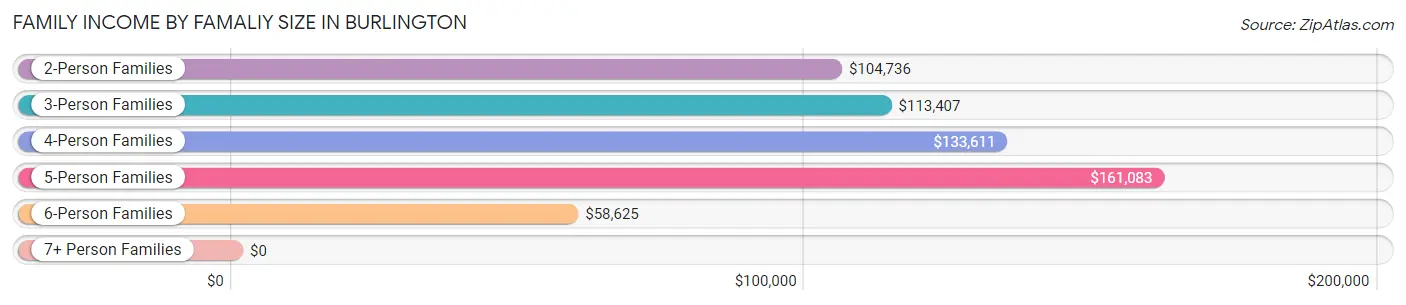
| Income Bracket | # Families | Median Income |
| 2-Person Families | 1,645 (35.7%) | $104,736 |
| 3-Person Families | 1,299 (28.2%) | $113,407 |
| 4-Person Families | 1,244 (27.0%) | $133,611 |
| 5-Person Families | 281 (6.1%) | $161,083 |
| 6-Person Families | 109 (2.4%) | $58,625 |
| 7+ Person Families | 32 (0.7%) | $0 |
| Total | 4,610 (100.0%) | $114,282 |
Family Income by Number of Earners in Burlington
The median family income in Burlington is $114,282, with families comprising 3+ earners (1,162) having the highest median family income of $144,779, while families with no earners (359) have the lowest median family income of $54,918, accounting for 25.2% and 7.8% of families, respectively.
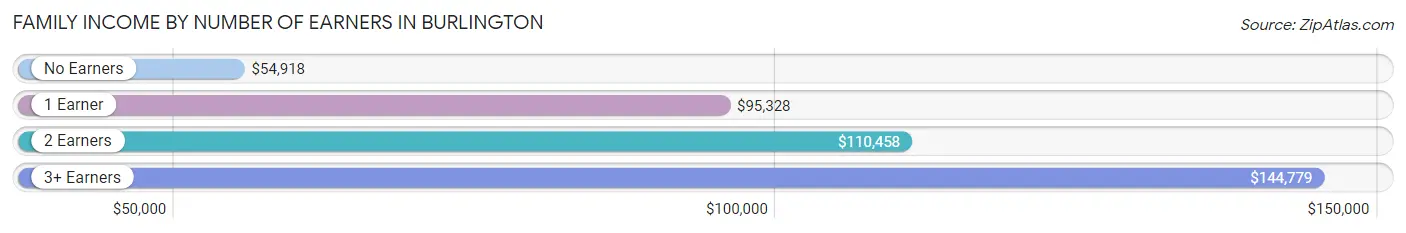
| Number of Earners | # Families | Median Income |
| No Earners | 359 (7.8%) | $54,918 |
| 1 Earner | 1,210 (26.3%) | $95,328 |
| 2 Earners | 1,879 (40.8%) | $110,458 |
| 3+ Earners | 1,162 (25.2%) | $144,779 |
| Total | 4,610 (100.0%) | $114,282 |
Household Income in Burlington
Household Income Brackets in Burlington
With 1,801 households falling in the category, the $100,000 to $149,999 income range is the most frequent in Burlington, accounting for 27.6% of all households. In contrast, only 78 households (1.2%) fall into the less than $10,000 income bracket, making it the least populous group.
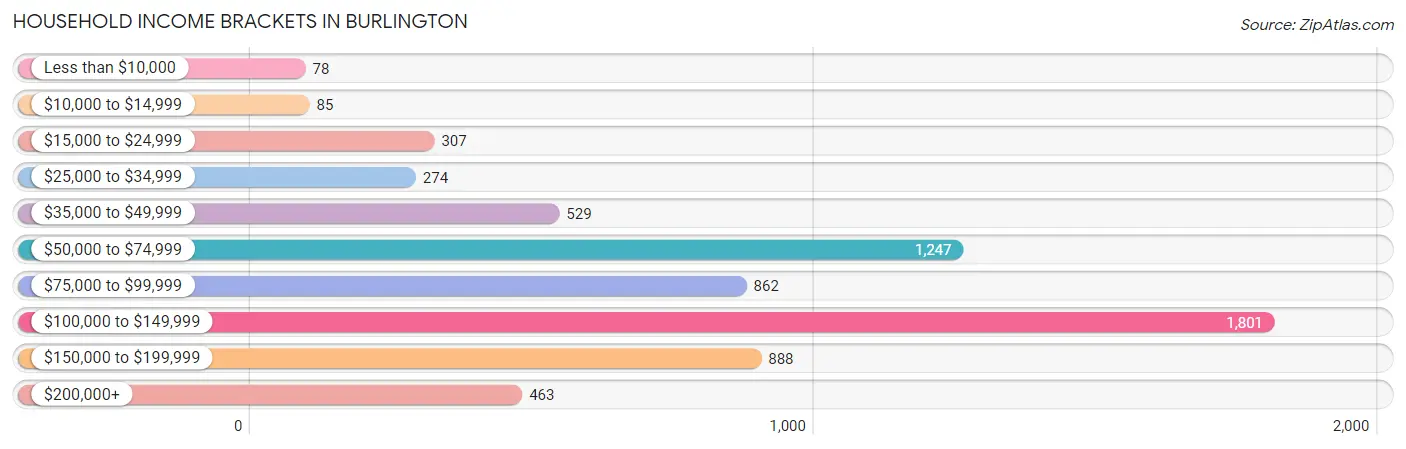
| Income Bracket | # Households | % Households |
| Less than $10,000 | 78 | 1.2% |
| $10,000 to $14,999 | 85 | 1.3% |
| $15,000 to $24,999 | 307 | 4.7% |
| $25,000 to $34,999 | 274 | 4.2% |
| $35,000 to $49,999 | 529 | 8.1% |
| $50,000 to $74,999 | 1,247 | 19.1% |
| $75,000 to $99,999 | 862 | 13.2% |
| $100,000 to $149,999 | 1,801 | 27.6% |
| $150,000 to $199,999 | 888 | 13.6% |
| $200,000+ | 463 | 7.1% |
Household Income by Householder Age in Burlington
The median household income in Burlington is $96,683, with the highest median household income of $113,795 found in the 45 to 64 years age bracket for the primary householder. A total of 2,882 households (44.2%) fall into this category. Meanwhile, the 65+ years age bracket for the primary householder has the lowest median household income of $59,464, with 1,535 households (23.5%) in this group.
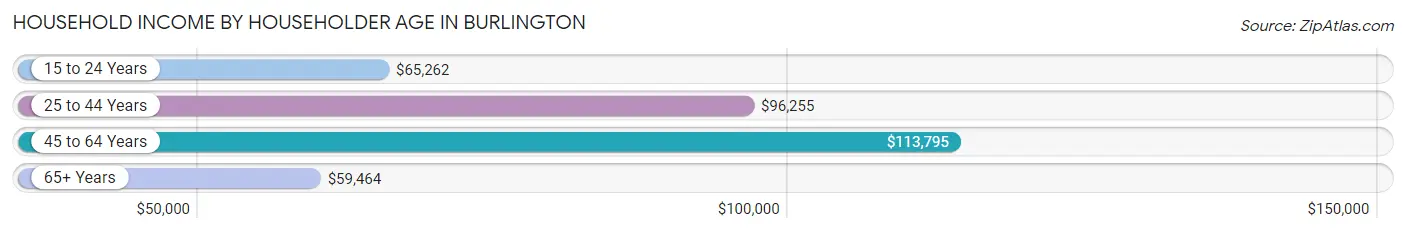
| Income Bracket | # Households | Median Income |
| 15 to 24 Years | 109 (1.7%) | $65,262 |
| 25 to 44 Years | 2,001 (30.7%) | $96,255 |
| 45 to 64 Years | 2,882 (44.2%) | $113,795 |
| 65+ Years | 1,535 (23.5%) | $59,464 |
| Total | 6,527 (100.0%) | $96,683 |
Poverty in Burlington
Income Below Poverty by Sex and Age in Burlington
With 4.1% poverty level for males and 5.1% for females among the residents of Burlington, 16 and 17 year old males and 6 to 11 year old females are the most vulnerable to poverty, with 77 males (28.0%) and 86 females (13.3%) in their respective age groups living below the poverty level.
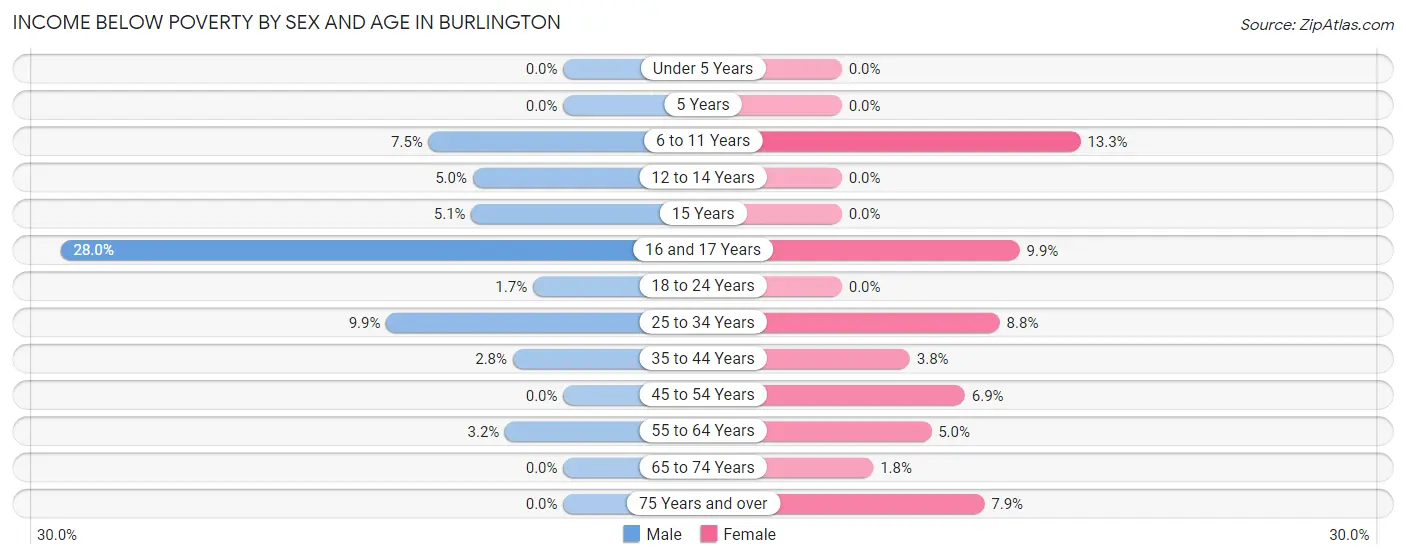
| Age Bracket | Male | Female |
| Under 5 Years | 0 (0.0%) | 0 (0.0%) |
| 5 Years | 0 (0.0%) | 0 (0.0%) |
| 6 to 11 Years | 66 (7.5%) | 86 (13.3%) |
| 12 to 14 Years | 12 (5.0%) | 0 (0.0%) |
| 15 Years | 19 (5.1%) | 0 (0.0%) |
| 16 and 17 Years | 77 (28.0%) | 19 (9.9%) |
| 18 to 24 Years | 15 (1.7%) | 0 (0.0%) |
| 25 to 34 Years | 118 (9.9%) | 90 (8.8%) |
| 35 to 44 Years | 28 (2.8%) | 44 (3.8%) |
| 45 to 54 Years | 0 (0.0%) | 110 (6.9%) |
| 55 to 64 Years | 34 (3.2%) | 48 (5.0%) |
| 65 to 74 Years | 0 (0.0%) | 15 (1.8%) |
| 75 Years and over | 0 (0.0%) | 39 (7.9%) |
| Total | 369 (4.1%) | 451 (5.1%) |
Income Above Poverty by Sex and Age in Burlington
According to the poverty statistics in Burlington, males aged under 5 years and females aged under 5 years are the age groups that are most secure financially, with 100.0% of males and 100.0% of females in these age groups living above the poverty line.
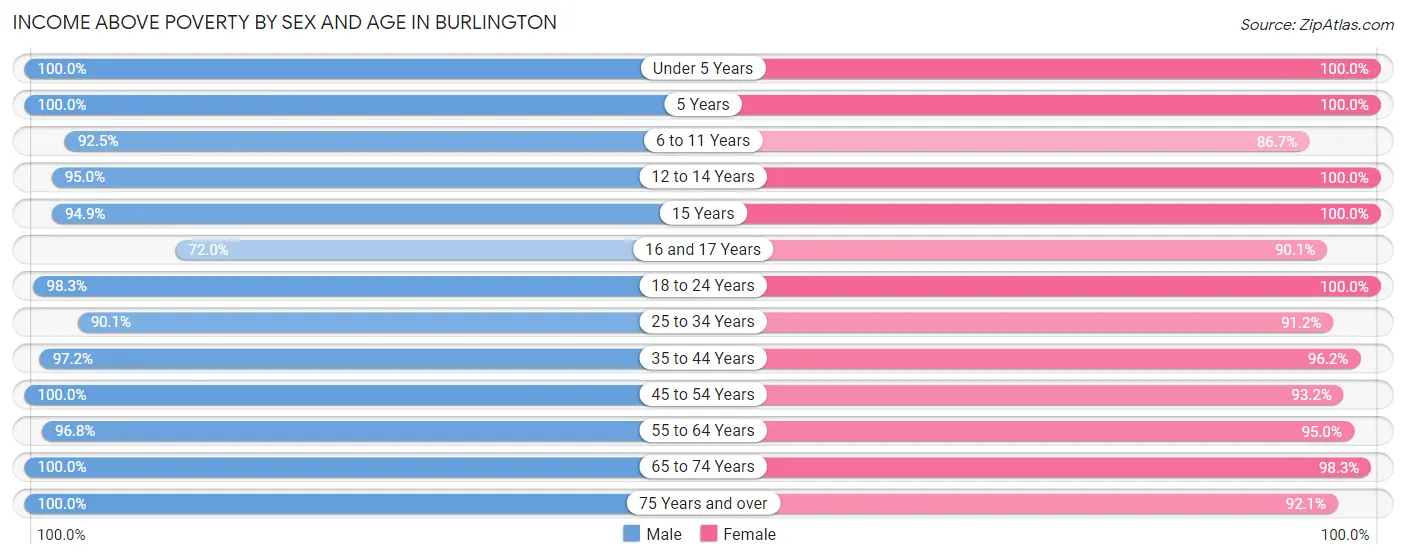
| Age Bracket | Male | Female |
| Under 5 Years | 428 (100.0%) | 372 (100.0%) |
| 5 Years | 18 (100.0%) | 117 (100.0%) |
| 6 to 11 Years | 814 (92.5%) | 561 (86.7%) |
| 12 to 14 Years | 226 (95.0%) | 262 (100.0%) |
| 15 Years | 352 (94.9%) | 165 (100.0%) |
| 16 and 17 Years | 198 (72.0%) | 173 (90.1%) |
| 18 to 24 Years | 875 (98.3%) | 956 (100.0%) |
| 25 to 34 Years | 1,079 (90.1%) | 934 (91.2%) |
| 35 to 44 Years | 970 (97.2%) | 1,116 (96.2%) |
| 45 to 54 Years | 1,606 (100.0%) | 1,495 (93.1%) |
| 55 to 64 Years | 1,016 (96.8%) | 916 (95.0%) |
| 65 to 74 Years | 735 (100.0%) | 842 (98.3%) |
| 75 Years and over | 248 (100.0%) | 452 (92.1%) |
| Total | 8,565 (95.9%) | 8,361 (94.9%) |
Income Below Poverty Among Married-Couple Families in Burlington
The poverty statistics for married-couple families in Burlington show that 0.8% or 31 of the total 3,897 families live below the poverty line. Families with 3 or 4 children have the highest poverty rate of 5.8%, comprising of 14 families. On the other hand, families with no children have the lowest poverty rate of 0.0%, which includes 0 families.
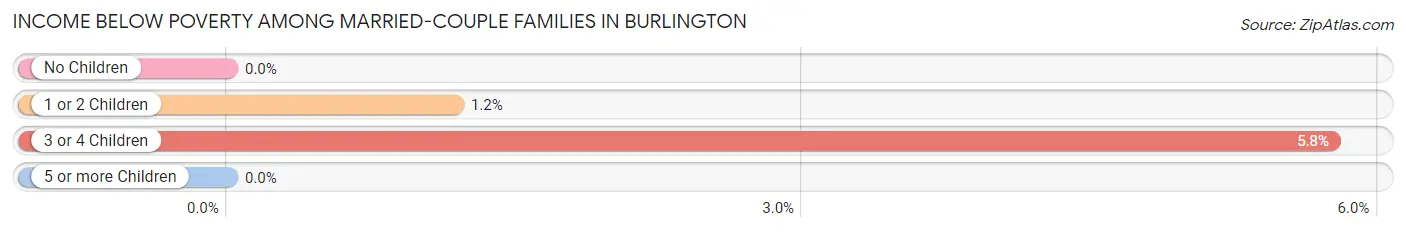
| Children | Above Poverty | Below Poverty |
| No Children | 2,194 (100.0%) | 0 (0.0%) |
| 1 or 2 Children | 1,426 (98.8%) | 17 (1.2%) |
| 3 or 4 Children | 229 (94.2%) | 14 (5.8%) |
| 5 or more Children | 17 (100.0%) | 0 (0.0%) |
| Total | 3,866 (99.2%) | 31 (0.8%) |
Income Below Poverty Among Single-Parent Households in Burlington
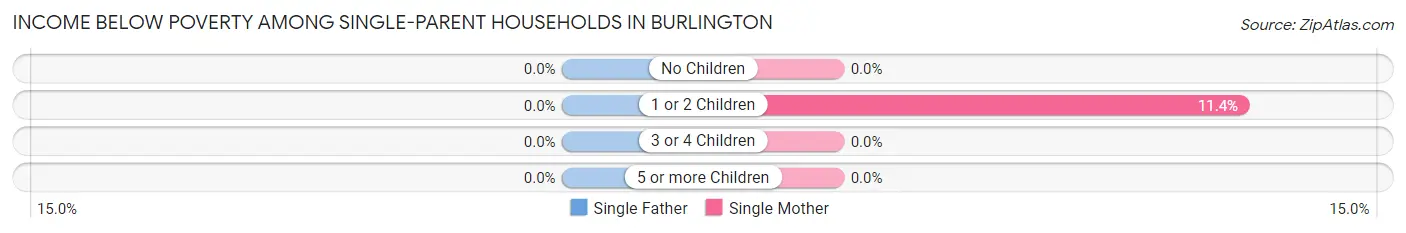
| Children | Single Father | Single Mother |
| No Children | 0 (0.0%) | 0 (0.0%) |
| 1 or 2 Children | 0 (0.0%) | 21 (11.4%) |
| 3 or 4 Children | 0 (0.0%) | 0 (0.0%) |
| 5 or more Children | 0 (0.0%) | 0 (0.0%) |
| Total | 0 (0.0%) | 21 (4.9%) |
Income Below Poverty Among Married-Couple vs Single-Parent Households in Burlington
The poverty data for Burlington shows that 31 of the married-couple family households (0.8%) and 21 of the single-parent households (2.9%) are living below the poverty level. Within the married-couple family households, those with 3 or 4 children have the highest poverty rate, with 14 households (5.8%) falling below the poverty line. Among the single-parent households, those with 1 or 2 children have the highest poverty rate, with 21 household (6.4%) living below poverty.
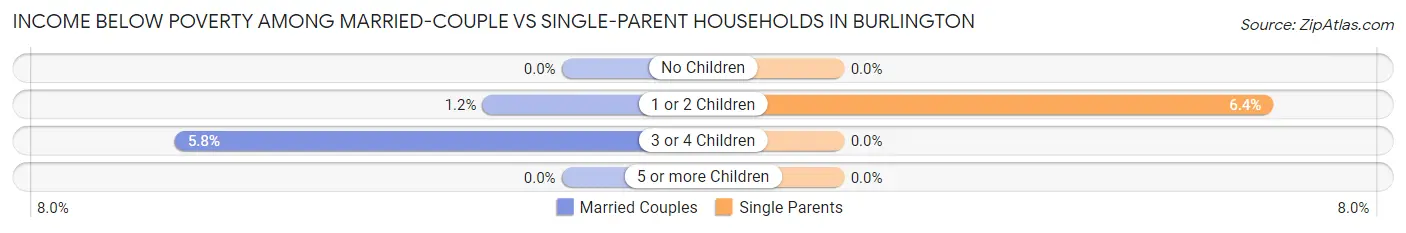
| Children | Married-Couple Families | Single-Parent Households |
| No Children | 0 (0.0%) | 0 (0.0%) |
| 1 or 2 Children | 17 (1.2%) | 21 (6.4%) |
| 3 or 4 Children | 14 (5.8%) | 0 (0.0%) |
| 5 or more Children | 0 (0.0%) | 0 (0.0%) |
| Total | 31 (0.8%) | 21 (2.9%) |
Race in Burlington
The most populous races in Burlington are White / Caucasian (16,499 | 90.3%), Hispanic or Latino (943 | 5.2%), and Two or more Races (631 | 3.5%).
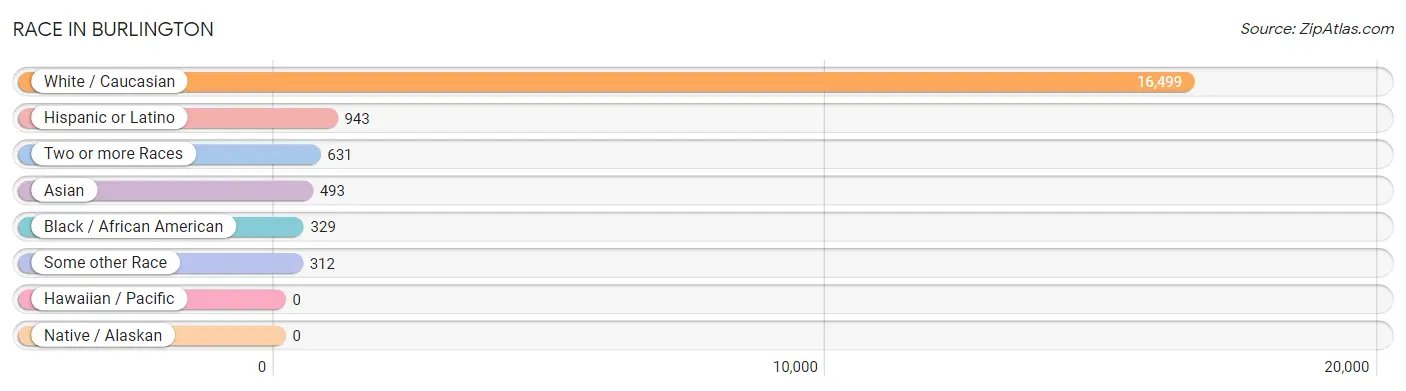
| Race | # Population | % Population |
| Asian | 493 | 2.7% |
| Black / African American | 329 | 1.8% |
| Hawaiian / Pacific | 0 | 0.0% |
| Hispanic or Latino | 943 | 5.2% |
| Native / Alaskan | 0 | 0.0% |
| White / Caucasian | 16,499 | 90.3% |
| Two or more Races | 631 | 3.5% |
| Some other Race | 312 | 1.7% |
| Total | 18,264 | 100.0% |
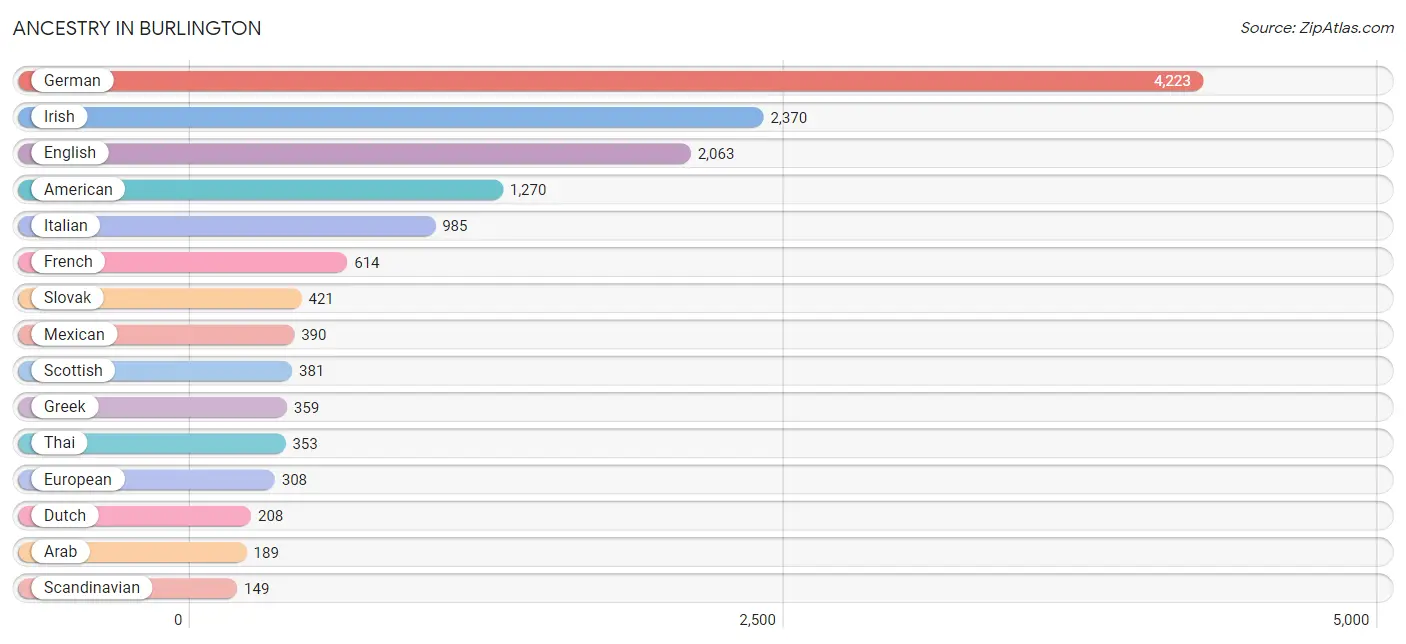
Ancestry in Burlington
The most populous ancestries reported in Burlington are German (4,223 | 23.1%), Irish (2,370 | 13.0%), English (2,063 | 11.3%), American (1,270 | 7.0%), and Italian (985 | 5.4%), together accounting for 59.7% of all Burlington residents.
| Ancestry | # Population | % Population |
| African | 87 | 0.5% |
| American | 1,270 | 7.0% |
| Arab | 189 | 1.0% |
| Australian | 26 | 0.1% |
| Bhutanese | 48 | 0.3% |
| Blackfeet | 62 | 0.3% |
| British | 84 | 0.5% |
| Bulgarian | 18 | 0.1% |
| Canadian | 48 | 0.3% |
| Central American | 114 | 0.6% |
| Cherokee | 33 | 0.2% |
| Chilean | 5 | 0.0% |
| Croatian | 15 | 0.1% |
| Cuban | 26 | 0.1% |
| Dutch | 208 | 1.1% |
| Egyptian | 61 | 0.3% |
| English | 2,063 | 11.3% |
| European | 308 | 1.7% |
| Finnish | 24 | 0.1% |
| French | 614 | 3.4% |
| French Canadian | 103 | 0.6% |
| German | 4,223 | 23.1% |
| Greek | 359 | 2.0% |
| Guatemalan | 41 | 0.2% |
| Honduran | 12 | 0.1% |
| Hungarian | 15 | 0.1% |
| Indian (Asian) | 26 | 0.1% |
| Indonesian | 7 | 0.0% |
| Irish | 2,370 | 13.0% |
| Italian | 985 | 5.4% |
| Korean | 78 | 0.4% |
| Latvian | 25 | 0.1% |
| Mexican | 390 | 2.1% |
| Moroccan | 128 | 0.7% |
| Norwegian | 31 | 0.2% |
| Panamanian | 6 | 0.0% |
| Polish | 92 | 0.5% |
| Potawatomi | 4 | 0.0% |
| Puerto Rican | 118 | 0.6% |
| Russian | 97 | 0.5% |
| Salvadoran | 55 | 0.3% |
| Scandinavian | 149 | 0.8% |
| Scotch-Irish | 90 | 0.5% |
| Scottish | 381 | 2.1% |
| Slovak | 421 | 2.3% |
| South American | 146 | 0.8% |
| Sri Lankan | 30 | 0.2% |
| Subsaharan African | 96 | 0.5% |
| Swedish | 142 | 0.8% |
| Thai | 353 | 1.9% |
| Ukrainian | 33 | 0.2% |
| Venezuelan | 141 | 0.8% |
| Welsh | 60 | 0.3% |
| Yugoslavian | 96 | 0.5% |
| Zimbabwean | 9 | 0.1% | View All 55 Rows |
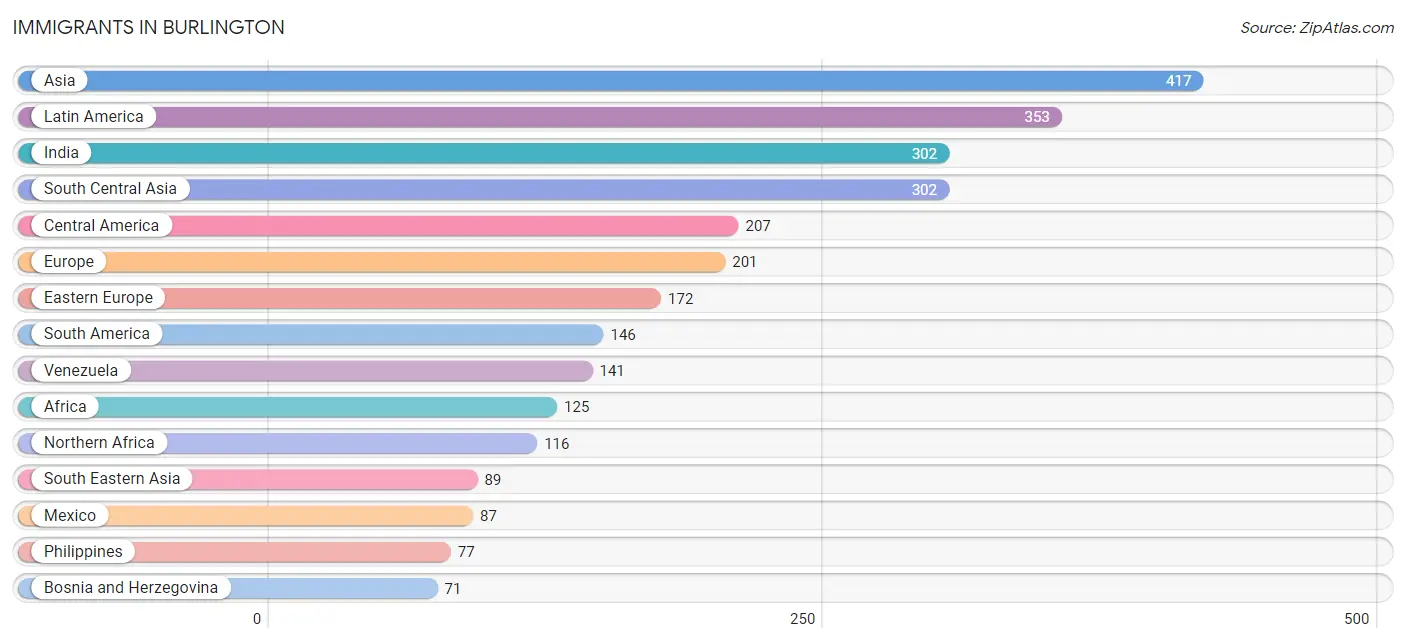
Immigrants in Burlington
The most numerous immigrant groups reported in Burlington came from Asia (417 | 2.3%), Latin America (353 | 1.9%), India (302 | 1.7%), South Central Asia (302 | 1.7%), and Central America (207 | 1.1%), together accounting for 8.6% of all Burlington residents.
| Immigration Origin | # Population | % Population |
| Africa | 125 | 0.7% |
| Asia | 417 | 2.3% |
| Australia | 11 | 0.1% |
| Belize | 13 | 0.1% |
| Bosnia and Herzegovina | 71 | 0.4% |
| Bulgaria | 18 | 0.1% |
| Canada | 15 | 0.1% |
| Central America | 207 | 1.1% |
| Chile | 5 | 0.0% |
| China | 26 | 0.1% |
| Eastern Africa | 9 | 0.1% |
| Eastern Asia | 26 | 0.1% |
| Eastern Europe | 172 | 0.9% |
| Egypt | 61 | 0.3% |
| El Salvador | 55 | 0.3% |
| Europe | 201 | 1.1% |
| Guatemala | 41 | 0.2% |
| Honduras | 5 | 0.0% |
| India | 302 | 1.7% |
| Latin America | 353 | 1.9% |
| Mexico | 87 | 0.5% |
| Morocco | 55 | 0.3% |
| Northern Africa | 116 | 0.6% |
| Northern Europe | 29 | 0.2% |
| Oceania | 11 | 0.1% |
| Panama | 6 | 0.0% |
| Philippines | 77 | 0.4% |
| Russia | 66 | 0.4% |
| Scotland | 29 | 0.2% |
| South America | 146 | 0.8% |
| South Central Asia | 302 | 1.7% |
| South Eastern Asia | 89 | 0.5% |
| Ukraine | 17 | 0.1% |
| Venezuela | 141 | 0.8% |
| Vietnam | 12 | 0.1% |
| Zimbabwe | 9 | 0.1% | View All 36 Rows |
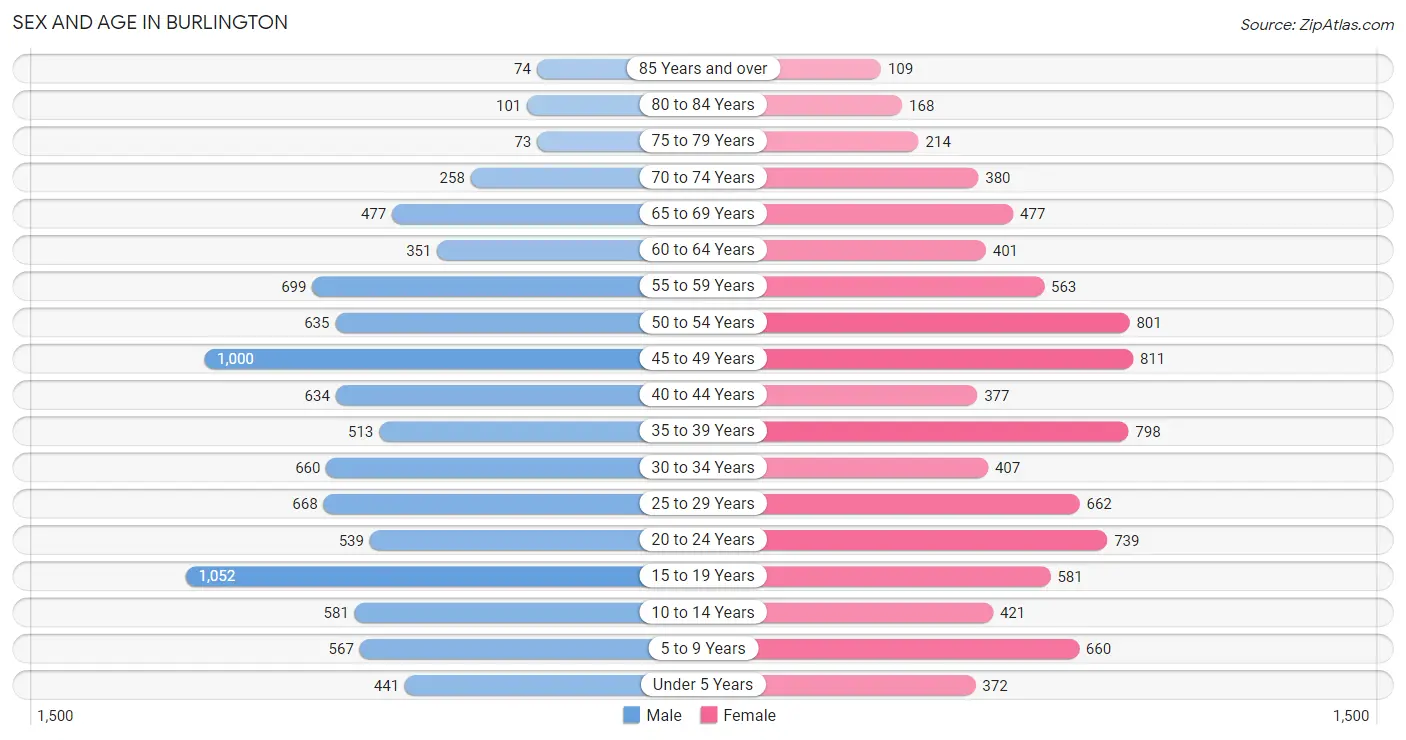
Sex and Age in Burlington
Sex and Age in Burlington
The most populous age groups in Burlington are 15 to 19 Years (1,052 | 11.3%) for men and 45 to 49 Years (811 | 9.1%) for women.
| Age Bracket | Male | Female |
| Under 5 Years | 441 (4.7%) | 372 (4.2%) |
| 5 to 9 Years | 567 (6.1%) | 660 (7.4%) |
| 10 to 14 Years | 581 (6.2%) | 421 (4.7%) |
| 15 to 19 Years | 1,052 (11.3%) | 581 (6.5%) |
| 20 to 24 Years | 539 (5.8%) | 739 (8.3%) |
| 25 to 29 Years | 668 (7.2%) | 662 (7.4%) |
| 30 to 34 Years | 660 (7.1%) | 407 (4.5%) |
| 35 to 39 Years | 513 (5.5%) | 798 (8.9%) |
| 40 to 44 Years | 634 (6.8%) | 377 (4.2%) |
| 45 to 49 Years | 1,000 (10.7%) | 811 (9.1%) |
| 50 to 54 Years | 635 (6.8%) | 801 (9.0%) |
| 55 to 59 Years | 699 (7.5%) | 563 (6.3%) |
| 60 to 64 Years | 351 (3.8%) | 401 (4.5%) |
| 65 to 69 Years | 477 (5.1%) | 477 (5.3%) |
| 70 to 74 Years | 258 (2.8%) | 380 (4.3%) |
| 75 to 79 Years | 73 (0.8%) | 214 (2.4%) |
| 80 to 84 Years | 101 (1.1%) | 168 (1.9%) |
| 85 Years and over | 74 (0.8%) | 109 (1.2%) |
| Total | 9,323 (100.0%) | 8,941 (100.0%) |
Families and Households in Burlington
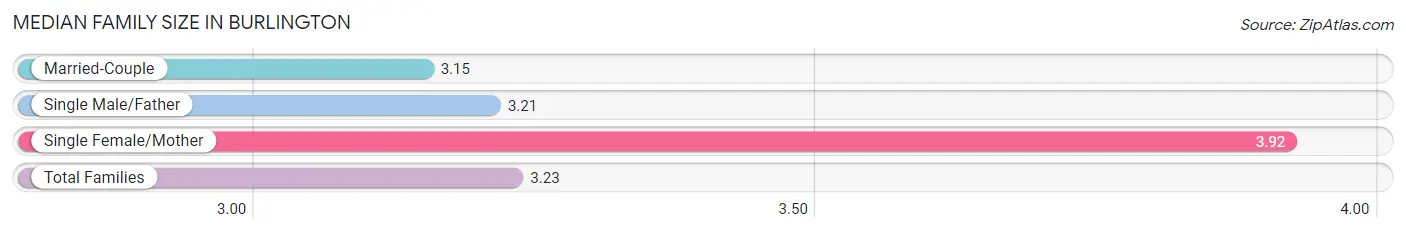
Median Family Size in Burlington
The median family size in Burlington is 3.23 persons per family, with single female/mother families (433 | 9.4%) accounting for the largest median family size of 3.92 persons per family. On the other hand, married-couple families (3,897 | 84.5%) represent the smallest median family size with 3.15 persons per family.
| Family Type | # Families | Family Size |
| Married-Couple | 3,897 (84.5%) | 3.15 |
| Single Male/Father | 280 (6.1%) | 3.21 |
| Single Female/Mother | 433 (9.4%) | 3.92 |
| Total Families | 4,610 (100.0%) | 3.23 |
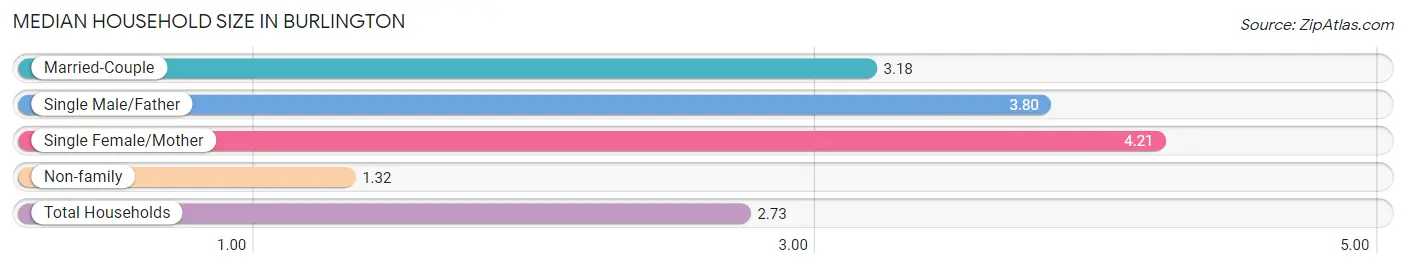
Median Household Size in Burlington
The median household size in Burlington is 2.73 persons per household, with single female/mother households (433 | 6.6%) accounting for the largest median household size of 4.21 persons per household. non-family households (1,917 | 29.4%) represent the smallest median household size with 1.32 persons per household.
| Household Type | # Households | Household Size |
| Married-Couple | 3,897 (59.7%) | 3.18 |
| Single Male/Father | 280 (4.3%) | 3.80 |
| Single Female/Mother | 433 (6.6%) | 4.21 |
| Non-family | 1,917 (29.4%) | 1.32 |
| Total Households | 6,527 (100.0%) | 2.73 |
Household Size by Marriage Status in Burlington
Out of a total of 6,527 households in Burlington, 4,610 (70.6%) are family households, while 1,917 (29.4%) are nonfamily households. The most numerous type of family households are 2-person households, comprising 1,513, and the most common type of nonfamily households are 1-person households, comprising 1,507.
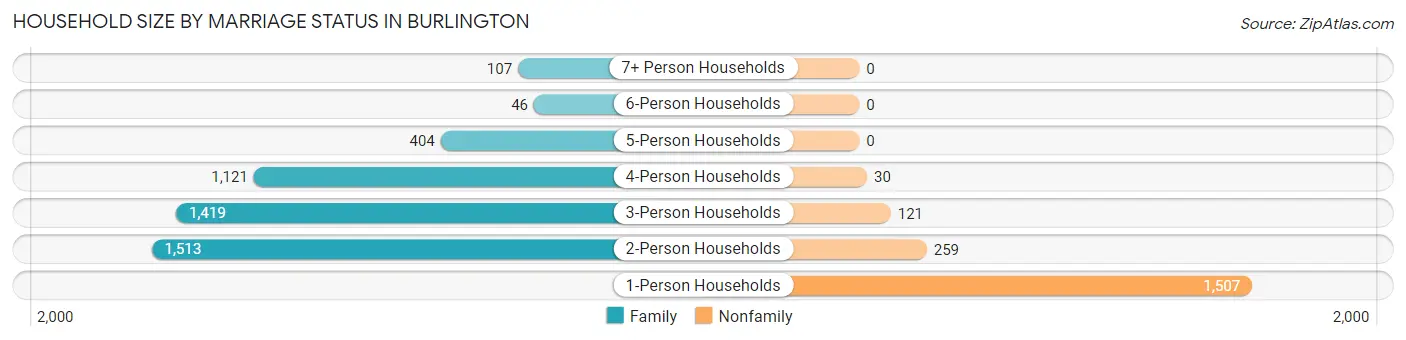
| Household Size | Family Households | Nonfamily Households |
| 1-Person Households | - | 1,507 (23.1%) |
| 2-Person Households | 1,513 (23.2%) | 259 (4.0%) |
| 3-Person Households | 1,419 (21.7%) | 121 (1.8%) |
| 4-Person Households | 1,121 (17.2%) | 30 (0.5%) |
| 5-Person Households | 404 (6.2%) | 0 (0.0%) |
| 6-Person Households | 46 (0.7%) | 0 (0.0%) |
| 7+ Person Households | 107 (1.6%) | 0 (0.0%) |
| Total | 4,610 (70.6%) | 1,917 (29.4%) |
Female Fertility in Burlington
Fertility by Age in Burlington
Average fertility rate in Burlington is 53.0 births per 1,000 women. Women in the age bracket of 20 to 34 years have the highest fertility rate with 85.0 births per 1,000 women. Women in the age bracket of 20 to 34 years acount for 63.0% of all women with births.
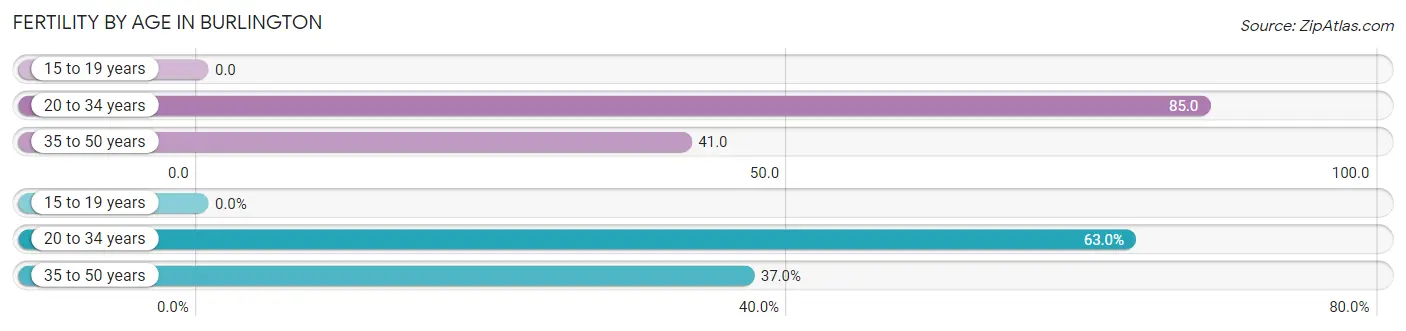
| Age Bracket | Women with Births | Births / 1,000 Women |
| 15 to 19 years | 0 (0.0%) | 0.0 |
| 20 to 34 years | 153 (63.0%) | 85.0 |
| 35 to 50 years | 90 (37.0%) | 41.0 |
| Total | 243 (100.0%) | 53.0 |
Fertility by Age by Marriage Status in Burlington
86.0% of women with births (243) in Burlington are married. The highest percentage of unmarried women with births falls into 20 to 34 years age bracket with 22.2% of them unmarried at the time of birth, while the lowest percentage of unmarried women with births belong to 35 to 50 years age bracket with 0.0% of them unmarried.
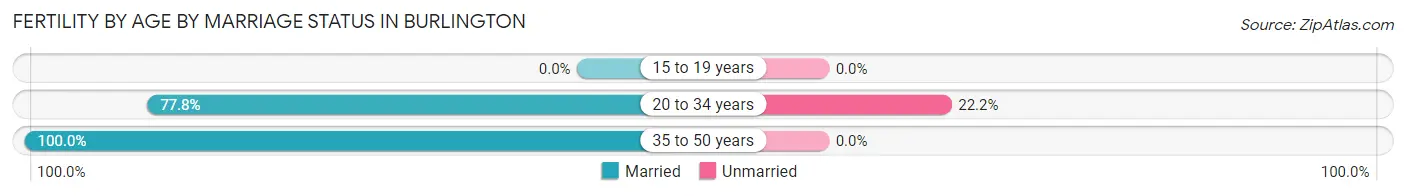
| Age Bracket | Married | Unmarried |
| 15 to 19 years | 0 (0.0%) | 0 (0.0%) |
| 20 to 34 years | 119 (77.8%) | 34 (22.2%) |
| 35 to 50 years | 90 (100.0%) | 0 (0.0%) |
| Total | 209 (86.0%) | 34 (14.0%) |
Fertility by Education in Burlington
Average fertility rate in Burlington is 53.0 births per 1,000 women. Women with the education attainment of graduate degree have the highest fertility rate of 241.0 births per 1,000 women, while women with the education attainment of high school diploma have the lowest fertility at 10.0 births per 1,000 women. Women with the education attainment of bachelor's degree represent 35.8% of all women with births.
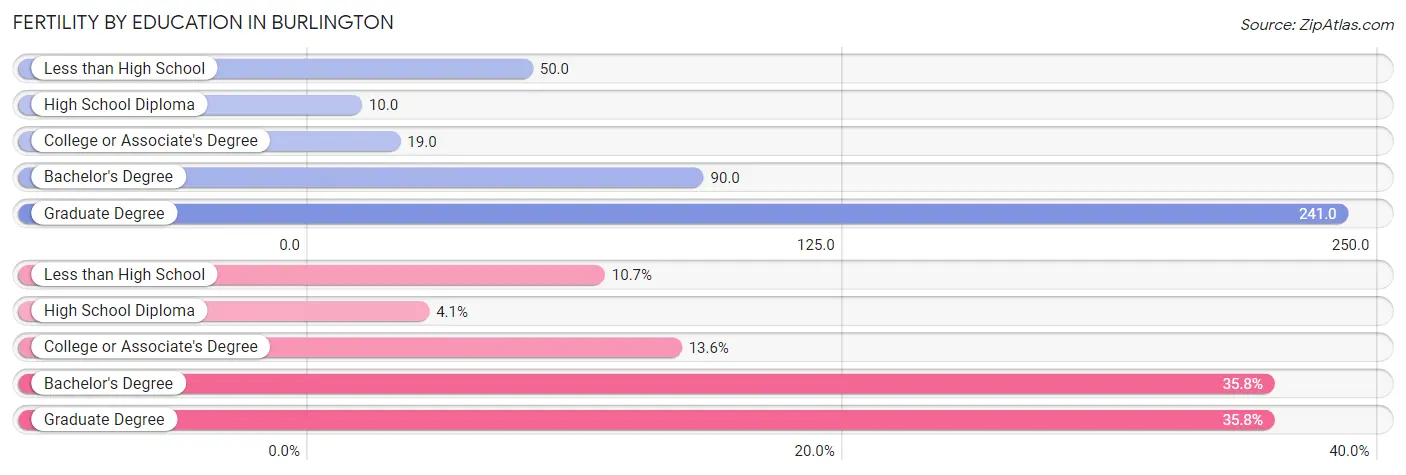
| Educational Attainment | Women with Births | Births / 1,000 Women |
| Less than High School | 26 (10.7%) | 50.0 |
| High School Diploma | 10 (4.1%) | 10.0 |
| College or Associate's Degree | 33 (13.6%) | 19.0 |
| Bachelor's Degree | 87 (35.8%) | 90.0 |
| Graduate Degree | 87 (35.8%) | 241.0 |
| Total | 243 (100.0%) | 53.0 |
Fertility by Education by Marriage Status in Burlington
14.0% of women with births in Burlington are unmarried. Women with the educational attainment of less than high school are most likely to be married with 100.0% of them married at childbirth, while women with the educational attainment of high school diploma are least likely to be married with 100.0% of them unmarried at childbirth.
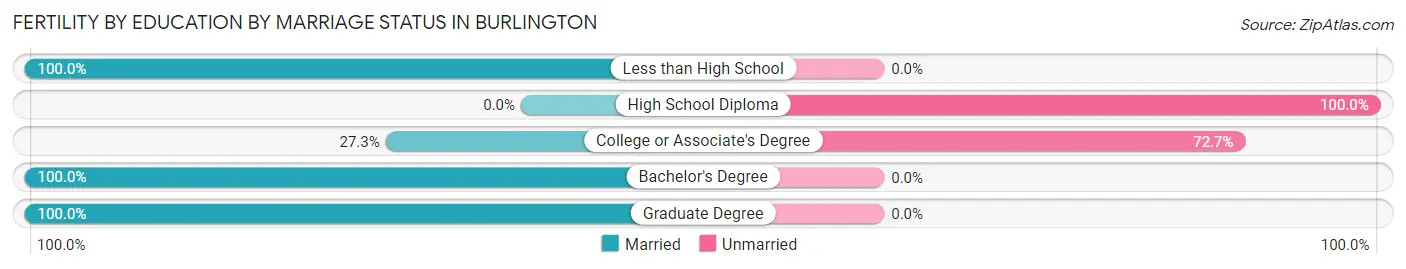
| Educational Attainment | Married | Unmarried |
| Less than High School | 26 (100.0%) | 0 (0.0%) |
| High School Diploma | 0 (0.0%) | 10 (100.0%) |
| College or Associate's Degree | 9 (27.3%) | 24 (72.7%) |
| Bachelor's Degree | 87 (100.0%) | 0 (0.0%) |
| Graduate Degree | 87 (100.0%) | 0 (0.0%) |
| Total | 209 (86.0%) | 34 (14.0%) |
Employment Characteristics in Burlington
Employment by Class of Employer in Burlington
Among the 9,736 employed individuals in Burlington, private company employees (7,627 | 78.3%), not-for-profit organizations (677 | 7.0%), and local government employees (510 | 5.2%) make up the most common classes of employment.
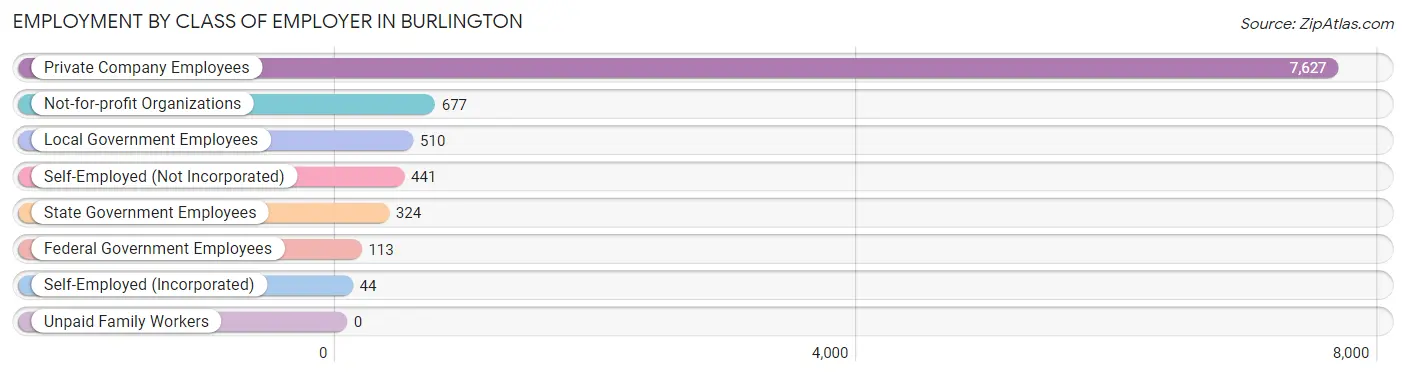
| Employer Class | # Employees | % Employees |
| Private Company Employees | 7,627 | 78.3% |
| Self-Employed (Incorporated) | 44 | 0.4% |
| Self-Employed (Not Incorporated) | 441 | 4.5% |
| Not-for-profit Organizations | 677 | 7.0% |
| Local Government Employees | 510 | 5.2% |
| State Government Employees | 324 | 3.3% |
| Federal Government Employees | 113 | 1.2% |
| Unpaid Family Workers | 0 | 0.0% |
| Total | 9,736 | 100.0% |
Employment Status by Age in Burlington
According to the labor force statistics for Burlington, out of the total population over 16 years of age (14,686), 69.3% or 10,177 individuals are in the labor force, with 3.0% or 305 of them unemployed. The age group with the highest labor force participation rate is 45 to 54 years, with 89.2% or 2,896 individuals in the labor force. Within the labor force, the 20 to 24 years age range has the highest percentage of unemployed individuals, with 8.6% or 80 of them being unemployed.
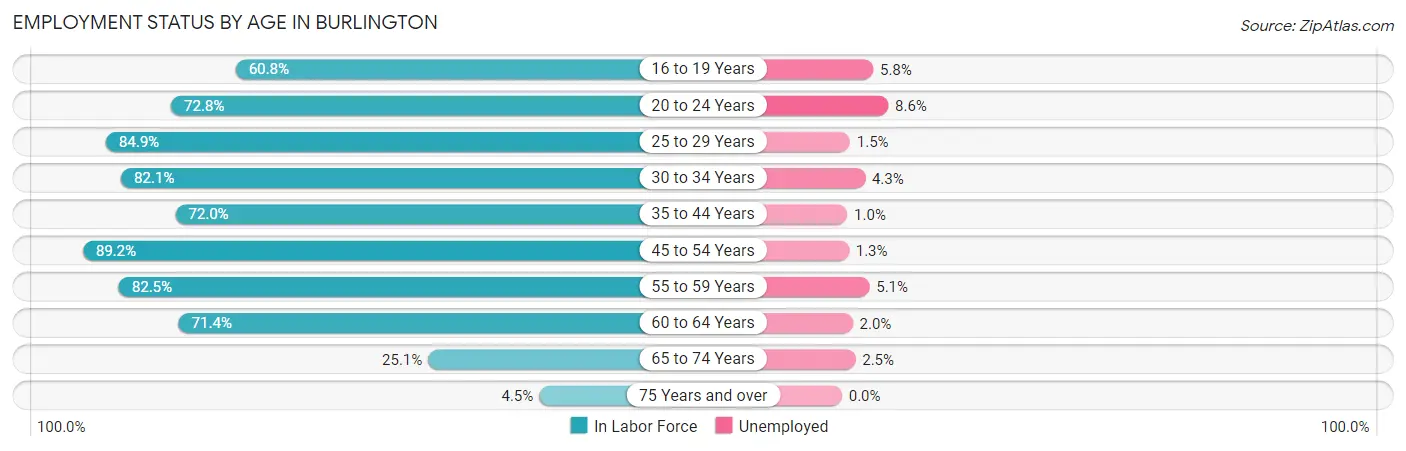
| Age Bracket | In Labor Force | Unemployed |
| 16 to 19 Years | 667 (60.8%) | 39 (5.8%) |
| 20 to 24 Years | 930 (72.8%) | 80 (8.6%) |
| 25 to 29 Years | 1,129 (84.9%) | 17 (1.5%) |
| 30 to 34 Years | 876 (82.1%) | 38 (4.3%) |
| 35 to 44 Years | 1,672 (72.0%) | 17 (1.0%) |
| 45 to 54 Years | 2,896 (89.2%) | 38 (1.3%) |
| 55 to 59 Years | 1,041 (82.5%) | 53 (5.1%) |
| 60 to 64 Years | 537 (71.4%) | 11 (2.0%) |
| 65 to 74 Years | 400 (25.1%) | 10 (2.5%) |
| 75 Years and over | 33 (4.5%) | 0 (0.0%) |
| Total | 10,177 (69.3%) | 305 (3.0%) |
Employment Status by Educational Attainment in Burlington
According to labor force statistics for Burlington, 81.7% of individuals (8,154) out of the total population between 25 and 64 years of age (9,980) are in the labor force, with 2.1% or 171 of them being unemployed. The group with the highest labor force participation rate are those with the educational attainment of bachelor's degree or higher, with 93.1% or 2,873 individuals in the labor force. Within the labor force, individuals with college / associate degree education have the highest percentage of unemployment, with 3.3% or 82 of them being unemployed.
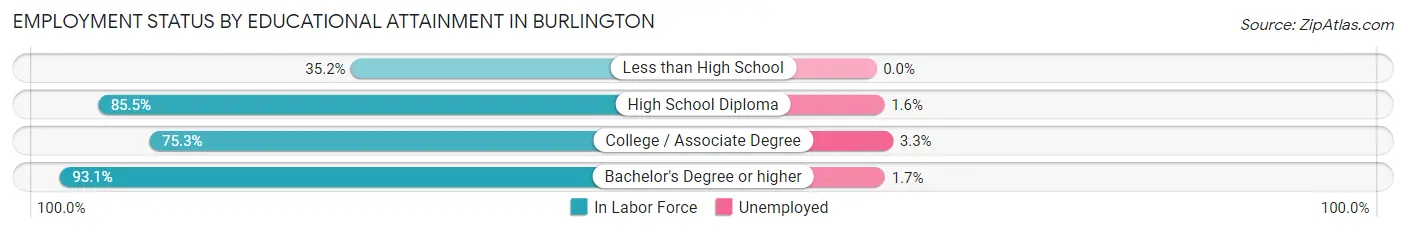
| Educational Attainment | In Labor Force | Unemployed |
| Less than High School | 197 (35.2%) | 0 (0.0%) |
| High School Diploma | 2,597 (85.5%) | 49 (1.6%) |
| College / Associate Degree | 2,483 (75.3%) | 109 (3.3%) |
| Bachelor's Degree or higher | 2,873 (93.1%) | 52 (1.7%) |
| Total | 8,154 (81.7%) | 210 (2.1%) |
Employment Occupations by Sex in Burlington
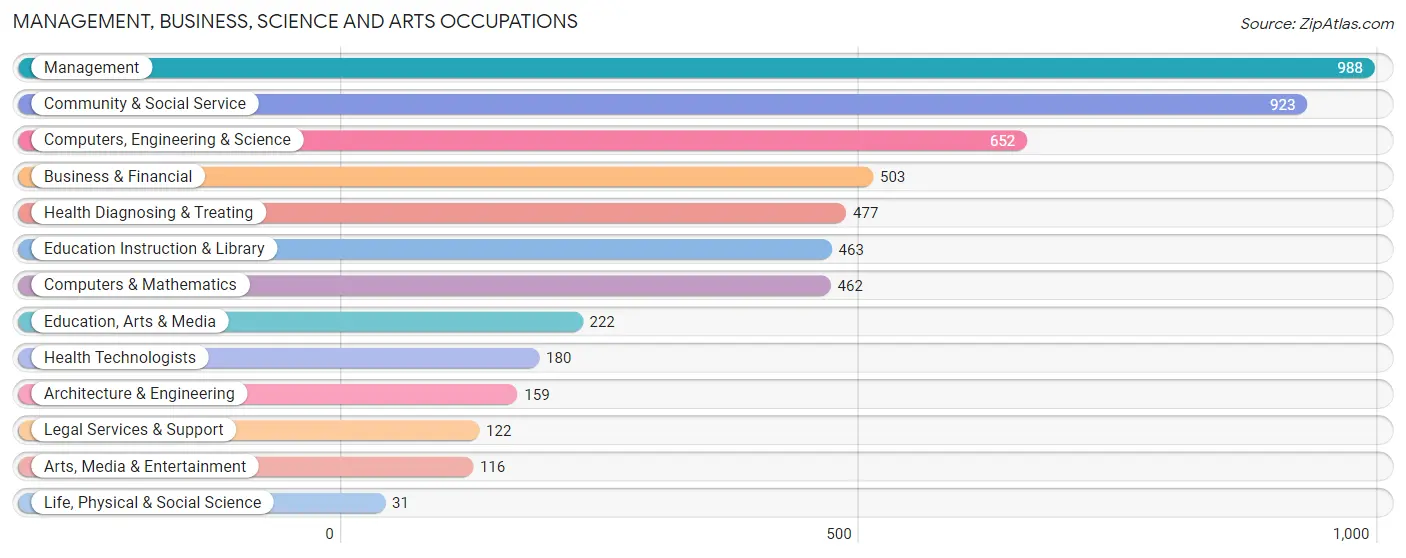
Management, Business, Science and Arts Occupations
The most common Management, Business, Science and Arts occupations in Burlington are Management (988 | 10.0%), Community & Social Service (923 | 9.3%), Computers, Engineering & Science (652 | 6.6%), Business & Financial (503 | 5.1%), and Health Diagnosing & Treating (477 | 4.8%).
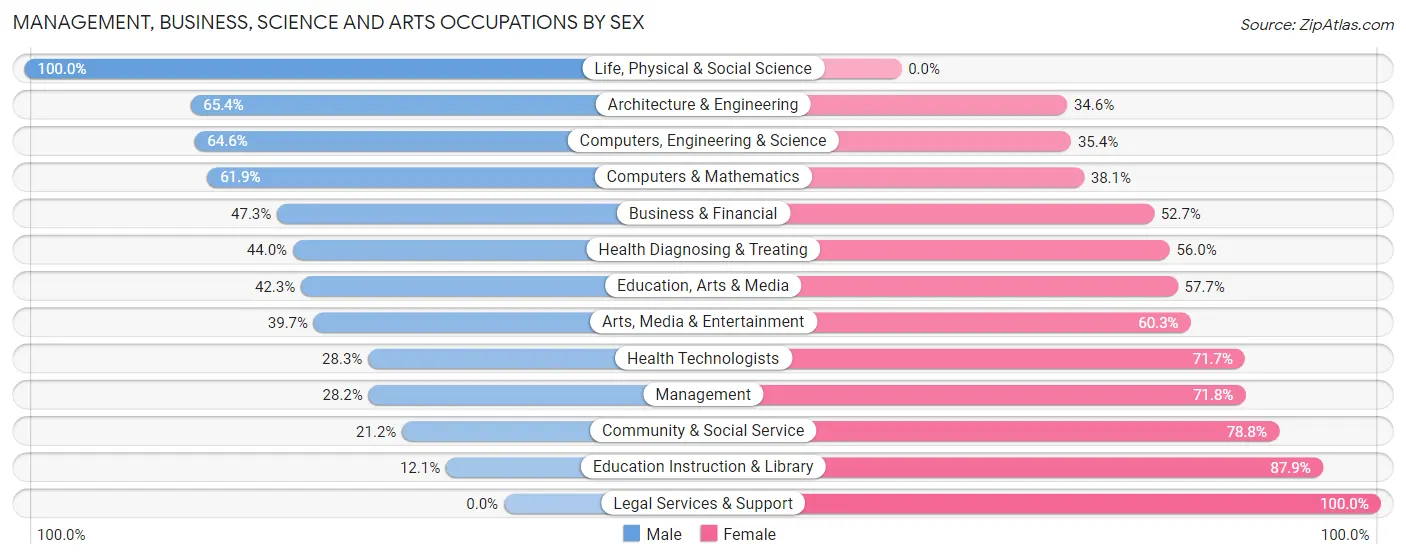
Management, Business, Science and Arts Occupations by Sex
Within the Management, Business, Science and Arts occupations in Burlington, the most male-oriented occupations are Life, Physical & Social Science (100.0%), Architecture & Engineering (65.4%), and Computers, Engineering & Science (64.6%), while the most female-oriented occupations are Legal Services & Support (100.0%), Education Instruction & Library (87.9%), and Community & Social Service (78.8%).
| Occupation | Male | Female |
| Management | 279 (28.2%) | 709 (71.8%) |
| Business & Financial | 238 (47.3%) | 265 (52.7%) |
| Computers, Engineering & Science | 421 (64.6%) | 231 (35.4%) |
| Computers & Mathematics | 286 (61.9%) | 176 (38.1%) |
| Architecture & Engineering | 104 (65.4%) | 55 (34.6%) |
| Life, Physical & Social Science | 31 (100.0%) | 0 (0.0%) |
| Community & Social Service | 196 (21.2%) | 727 (78.8%) |
| Education, Arts & Media | 94 (42.3%) | 128 (57.7%) |
| Legal Services & Support | 0 (0.0%) | 122 (100.0%) |
| Education Instruction & Library | 56 (12.1%) | 407 (87.9%) |
| Arts, Media & Entertainment | 46 (39.7%) | 70 (60.3%) |
| Health Diagnosing & Treating | 210 (44.0%) | 267 (56.0%) |
| Health Technologists | 51 (28.3%) | 129 (71.7%) |
| Total (Category) | 1,344 (37.9%) | 2,199 (62.1%) |
| Total (Overall) | 5,313 (53.8%) | 4,567 (46.2%) |
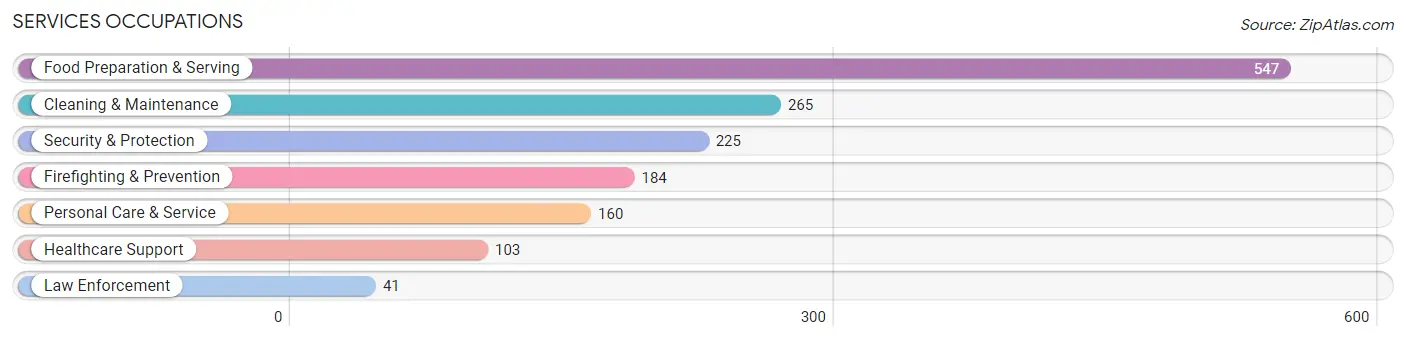
Services Occupations
The most common Services occupations in Burlington are Food Preparation & Serving (547 | 5.5%), Cleaning & Maintenance (265 | 2.7%), Security & Protection (225 | 2.3%), Firefighting & Prevention (184 | 1.9%), and Personal Care & Service (160 | 1.6%).
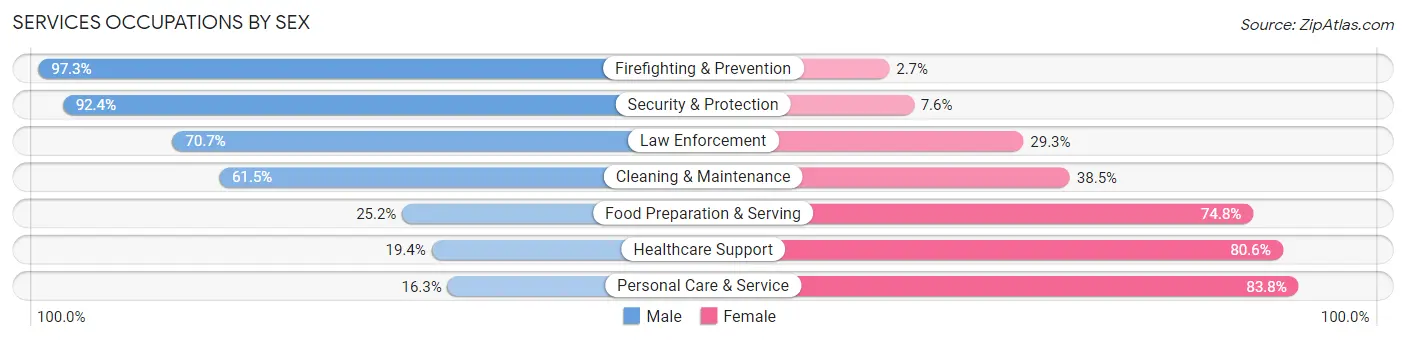
Services Occupations by Sex
Within the Services occupations in Burlington, the most male-oriented occupations are Firefighting & Prevention (97.3%), Security & Protection (92.4%), and Law Enforcement (70.7%), while the most female-oriented occupations are Personal Care & Service (83.8%), Healthcare Support (80.6%), and Food Preparation & Serving (74.8%).
| Occupation | Male | Female |
| Healthcare Support | 20 (19.4%) | 83 (80.6%) |
| Security & Protection | 208 (92.4%) | 17 (7.6%) |
| Firefighting & Prevention | 179 (97.3%) | 5 (2.7%) |
| Law Enforcement | 29 (70.7%) | 12 (29.3%) |
| Food Preparation & Serving | 138 (25.2%) | 409 (74.8%) |
| Cleaning & Maintenance | 163 (61.5%) | 102 (38.5%) |
| Personal Care & Service | 26 (16.3%) | 134 (83.8%) |
| Total (Category) | 555 (42.7%) | 745 (57.3%) |
| Total (Overall) | 5,313 (53.8%) | 4,567 (46.2%) |
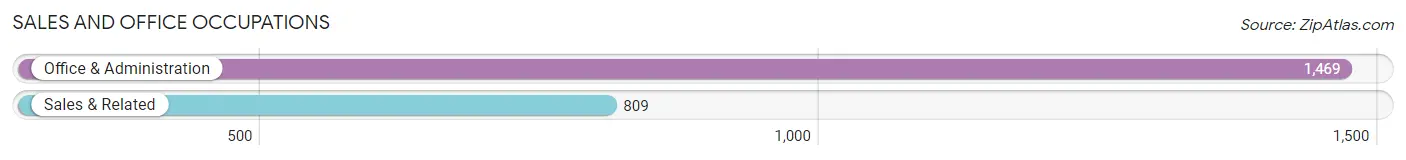
Sales and Office Occupations
The most common Sales and Office occupations in Burlington are Office & Administration (1,469 | 14.9%), and Sales & Related (809 | 8.2%).
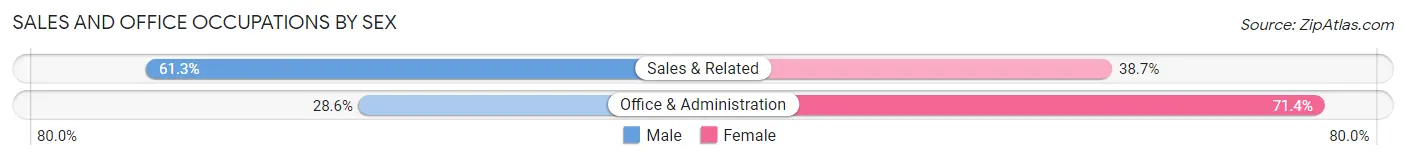
Sales and Office Occupations by Sex
| Occupation | Male | Female |
| Sales & Related | 496 (61.3%) | 313 (38.7%) |
| Office & Administration | 420 (28.6%) | 1,049 (71.4%) |
| Total (Category) | 916 (40.2%) | 1,362 (59.8%) |
| Total (Overall) | 5,313 (53.8%) | 4,567 (46.2%) |
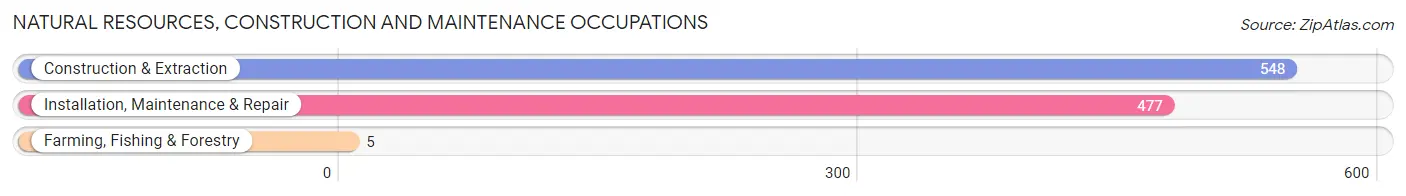
Natural Resources, Construction and Maintenance Occupations
The most common Natural Resources, Construction and Maintenance occupations in Burlington are Construction & Extraction (548 | 5.6%), Installation, Maintenance & Repair (477 | 4.8%), and Farming, Fishing & Forestry (5 | 0.1%).
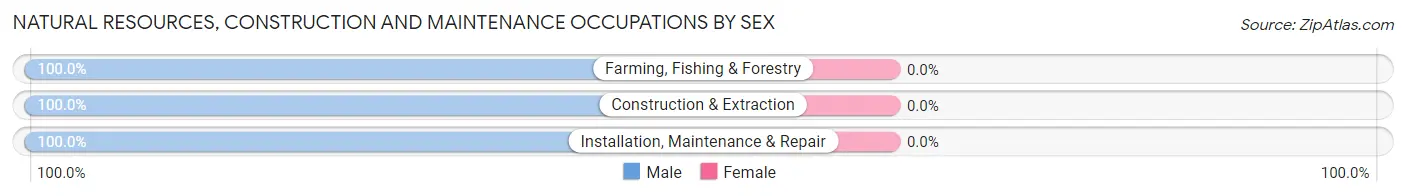
Natural Resources, Construction and Maintenance Occupations by Sex
| Occupation | Male | Female |
| Farming, Fishing & Forestry | 5 (100.0%) | 0 (0.0%) |
| Construction & Extraction | 548 (100.0%) | 0 (0.0%) |
| Installation, Maintenance & Repair | 477 (100.0%) | 0 (0.0%) |
| Total (Category) | 1,030 (100.0%) | 0 (0.0%) |
| Total (Overall) | 5,313 (53.8%) | 4,567 (46.2%) |
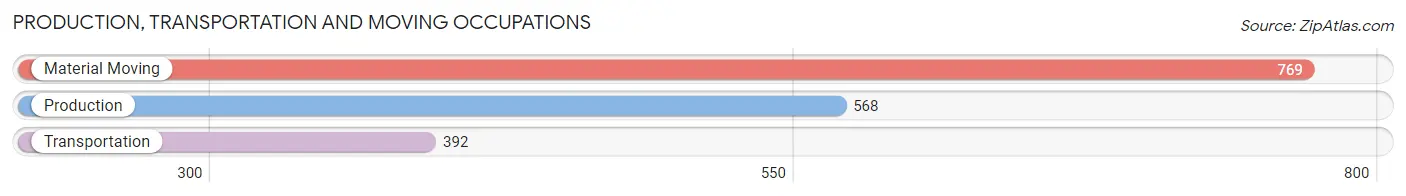
Production, Transportation and Moving Occupations
The most common Production, Transportation and Moving occupations in Burlington are Material Moving (769 | 7.8%), Production (568 | 5.8%), and Transportation (392 | 4.0%).
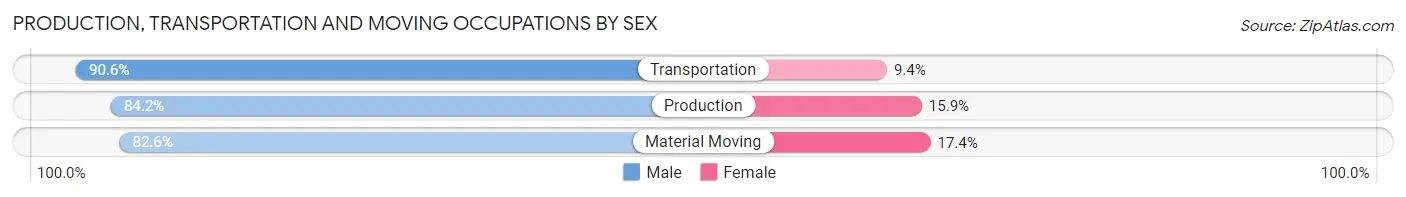
Production, Transportation and Moving Occupations by Sex
| Occupation | Male | Female |
| Production | 478 (84.2%) | 90 (15.9%) |
| Transportation | 355 (90.6%) | 37 (9.4%) |
| Material Moving | 635 (82.6%) | 134 (17.4%) |
| Total (Category) | 1,468 (84.9%) | 261 (15.1%) |
| Total (Overall) | 5,313 (53.8%) | 4,567 (46.2%) |
Employment Industries by Sex in Burlington
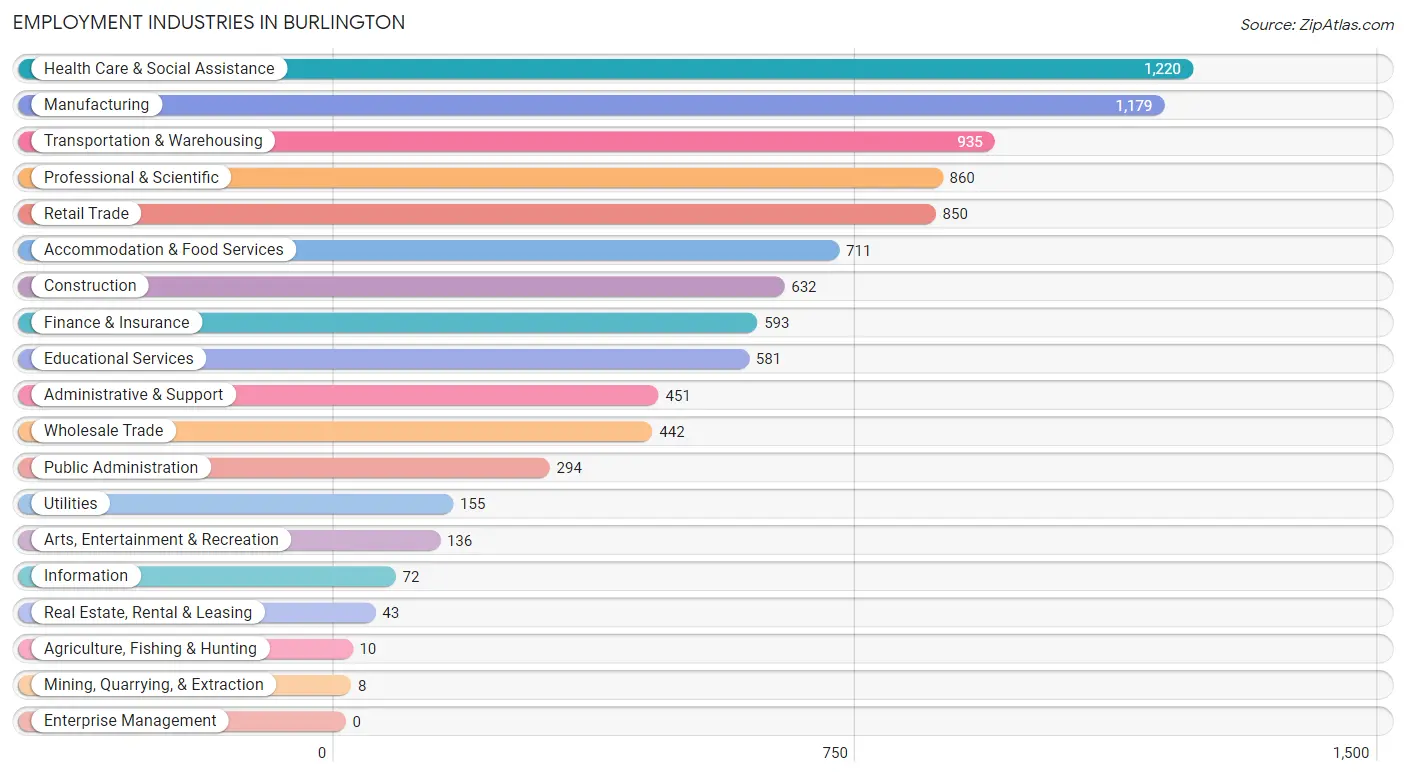
Employment Industries in Burlington
The major employment industries in Burlington include Health Care & Social Assistance (1,220 | 12.3%), Manufacturing (1,179 | 11.9%), Transportation & Warehousing (935 | 9.5%), Professional & Scientific (860 | 8.7%), and Retail Trade (850 | 8.6%).
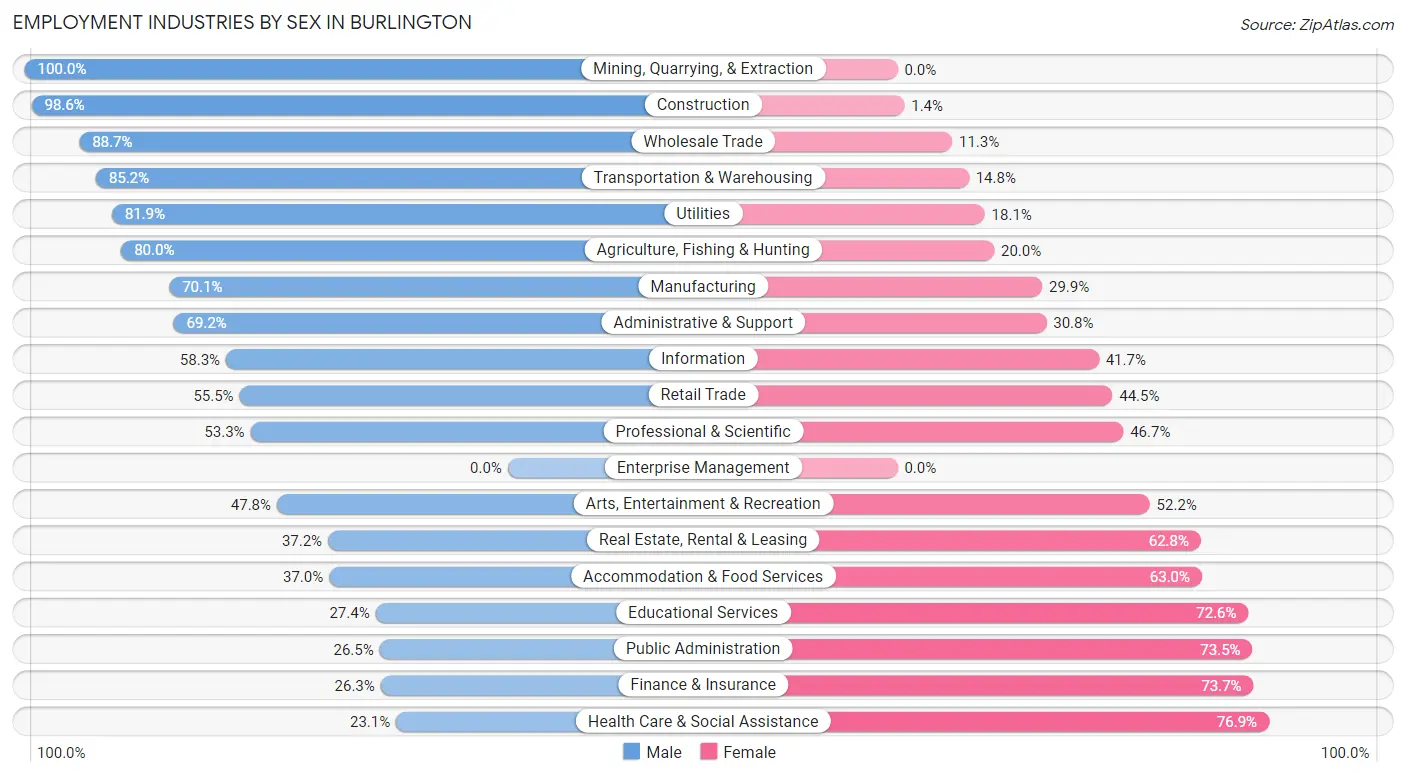
Employment Industries by Sex in Burlington
The Burlington industries that see more men than women are Mining, Quarrying, & Extraction (100.0%), Construction (98.6%), and Wholesale Trade (88.7%), whereas the industries that tend to have a higher number of women are Health Care & Social Assistance (76.9%), Finance & Insurance (73.7%), and Public Administration (73.5%).
| Industry | Male | Female |
| Agriculture, Fishing & Hunting | 8 (80.0%) | 2 (20.0%) |
| Mining, Quarrying, & Extraction | 8 (100.0%) | 0 (0.0%) |
| Construction | 623 (98.6%) | 9 (1.4%) |
| Manufacturing | 826 (70.1%) | 353 (29.9%) |
| Wholesale Trade | 392 (88.7%) | 50 (11.3%) |
| Retail Trade | 472 (55.5%) | 378 (44.5%) |
| Transportation & Warehousing | 797 (85.2%) | 138 (14.8%) |
| Utilities | 127 (81.9%) | 28 (18.1%) |
| Information | 42 (58.3%) | 30 (41.7%) |
| Finance & Insurance | 156 (26.3%) | 437 (73.7%) |
| Real Estate, Rental & Leasing | 16 (37.2%) | 27 (62.8%) |
| Professional & Scientific | 458 (53.3%) | 402 (46.7%) |
| Enterprise Management | 0 (0.0%) | 0 (0.0%) |
| Administrative & Support | 312 (69.2%) | 139 (30.8%) |
| Educational Services | 159 (27.4%) | 422 (72.6%) |
| Health Care & Social Assistance | 282 (23.1%) | 938 (76.9%) |
| Arts, Entertainment & Recreation | 65 (47.8%) | 71 (52.2%) |
| Accommodation & Food Services | 263 (37.0%) | 448 (63.0%) |
| Public Administration | 78 (26.5%) | 216 (73.5%) |
| Total | 5,313 (53.8%) | 4,567 (46.2%) |
Education in Burlington
School Enrollment in Burlington
The most common levels of schooling among the 4,710 students in Burlington are high school (1,220 | 25.9%), elementary school (1,123 | 23.8%), and college / undergraduate (1,092 | 23.2%).
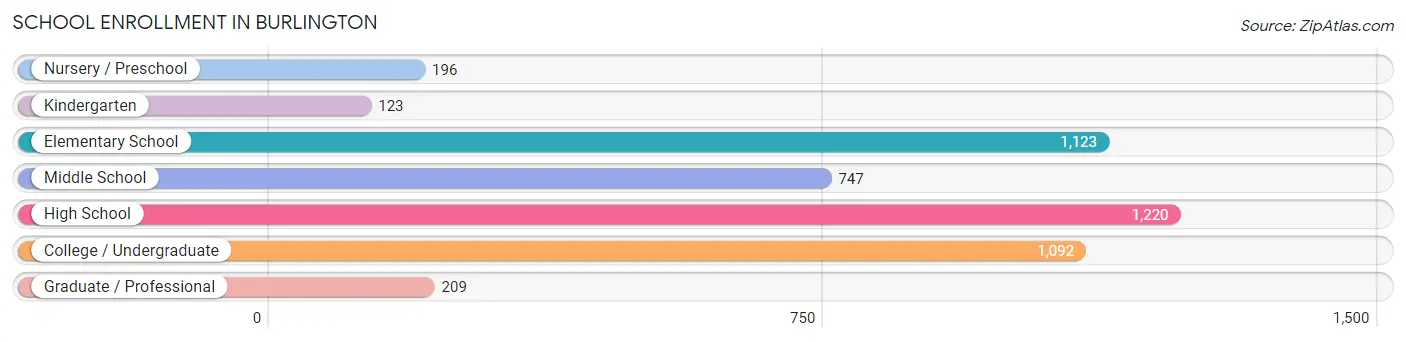
| School Level | # Students | % Students |
| Nursery / Preschool | 196 | 4.2% |
| Kindergarten | 123 | 2.6% |
| Elementary School | 1,123 | 23.8% |
| Middle School | 747 | 15.9% |
| High School | 1,220 | 25.9% |
| College / Undergraduate | 1,092 | 23.2% |
| Graduate / Professional | 209 | 4.4% |
| Total | 4,710 | 100.0% |
School Enrollment by Age by Funding Source in Burlington
Out of a total of 4,710 students who are enrolled in schools in Burlington, 636 (13.5%) attend a private institution, while the remaining 4,074 (86.5%) are enrolled in public schools. The age group of 25 to 34 year olds has the highest likelihood of being enrolled in private schools, with 96 (41.7% in the age bracket) enrolled. Conversely, the age group of 10 to 14 year olds has the lowest likelihood of being enrolled in a private school, with 941 (95.1% in the age bracket) attending a public institution.
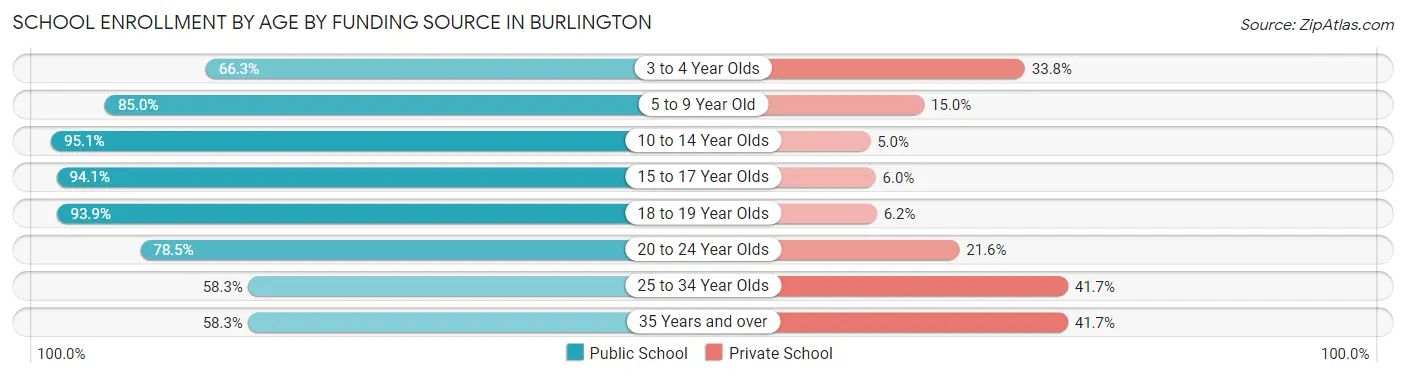
| Age Bracket | Public School | Private School |
| 3 to 4 Year Olds | 53 (66.2%) | 27 (33.8%) |
| 5 to 9 Year Old | 1,022 (85.0%) | 180 (15.0%) |
| 10 to 14 Year Olds | 941 (95.1%) | 49 (5.0%) |
| 15 to 17 Year Olds | 949 (94.1%) | 60 (5.9%) |
| 18 to 19 Year Olds | 351 (93.9%) | 23 (6.1%) |
| 20 to 24 Year Olds | 557 (78.4%) | 153 (21.5%) |
| 25 to 34 Year Olds | 134 (58.3%) | 96 (41.7%) |
| 35 Years and over | 67 (58.3%) | 48 (41.7%) |
| Total | 4,074 (86.5%) | 636 (13.5%) |
Educational Attainment by Field of Study in Burlington
Business (847 | 21.4%), education (736 | 18.6%), science & technology (379 | 9.6%), arts & humanities (375 | 9.5%), and computers & mathematics (254 | 6.4%) are the most common fields of study among 3,959 individuals in Burlington who have obtained a bachelor's degree or higher.
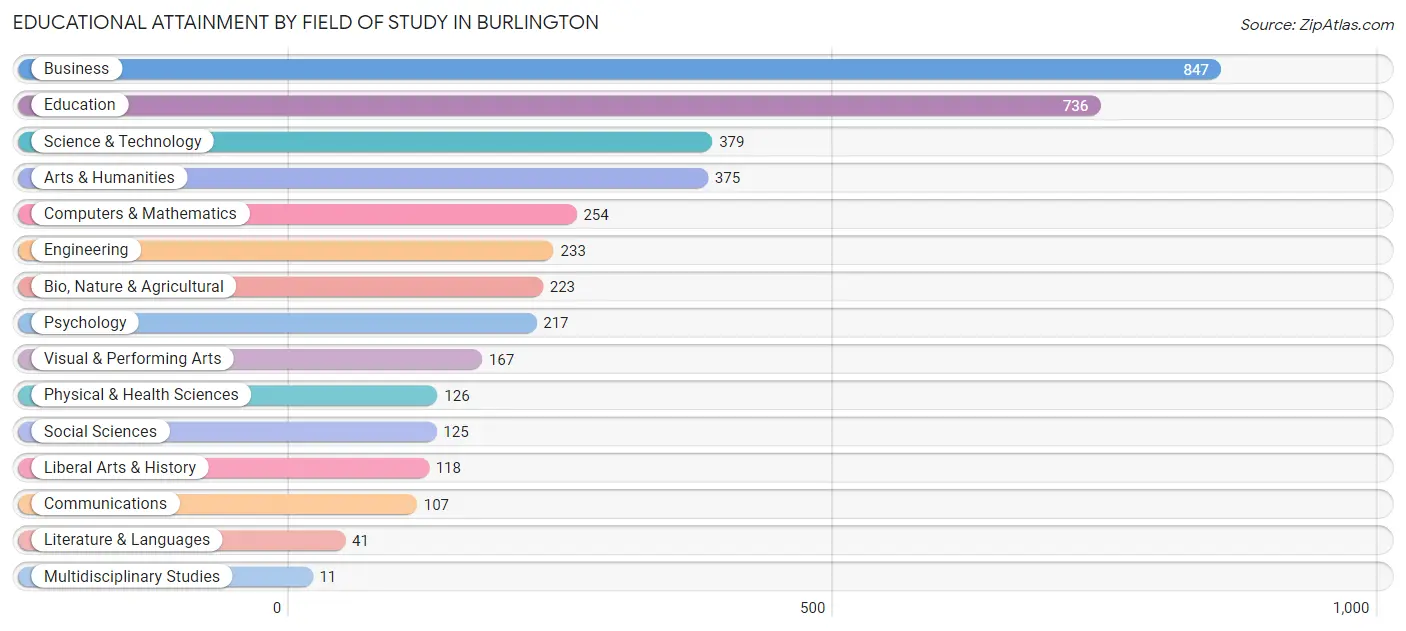
| Field of Study | # Graduates | % Graduates |
| Computers & Mathematics | 254 | 6.4% |
| Bio, Nature & Agricultural | 223 | 5.6% |
| Physical & Health Sciences | 126 | 3.2% |
| Psychology | 217 | 5.5% |
| Social Sciences | 125 | 3.2% |
| Engineering | 233 | 5.9% |
| Multidisciplinary Studies | 11 | 0.3% |
| Science & Technology | 379 | 9.6% |
| Business | 847 | 21.4% |
| Education | 736 | 18.6% |
| Literature & Languages | 41 | 1.0% |
| Liberal Arts & History | 118 | 3.0% |
| Visual & Performing Arts | 167 | 4.2% |
| Communications | 107 | 2.7% |
| Arts & Humanities | 375 | 9.5% |
| Total | 3,959 | 100.0% |
Transportation & Commute in Burlington
Vehicle Availability by Sex in Burlington
The most prevalent vehicle ownership categories in Burlington are males with 2 vehicles (2,115, accounting for 40.1%) and females with 2 vehicles (1,812, making up 47.5%).
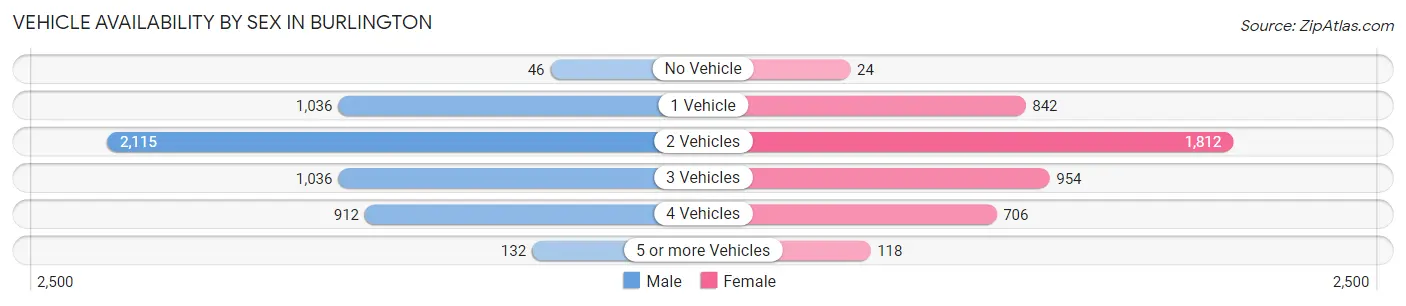
| Vehicles Available | Male | Female |
| No Vehicle | 46 (0.9%) | 24 (0.5%) |
| 1 Vehicle | 1,036 (19.6%) | 842 (18.9%) |
| 2 Vehicles | 2,115 (40.1%) | 1,812 (40.7%) |
| 3 Vehicles | 1,036 (19.6%) | 954 (21.4%) |
| 4 Vehicles | 912 (17.3%) | 706 (15.8%) |
| 5 or more Vehicles | 132 (2.5%) | 118 (2.6%) |
| Total | 5,277 (100.0%) | 4,456 (100.0%) |
Commute Time in Burlington
The most frequently occuring commute durations in Burlington are 15 to 19 minutes (2,358 commuters, 27.7%), 10 to 14 minutes (1,428 commuters, 16.8%), and 30 to 34 minutes (971 commuters, 11.4%).
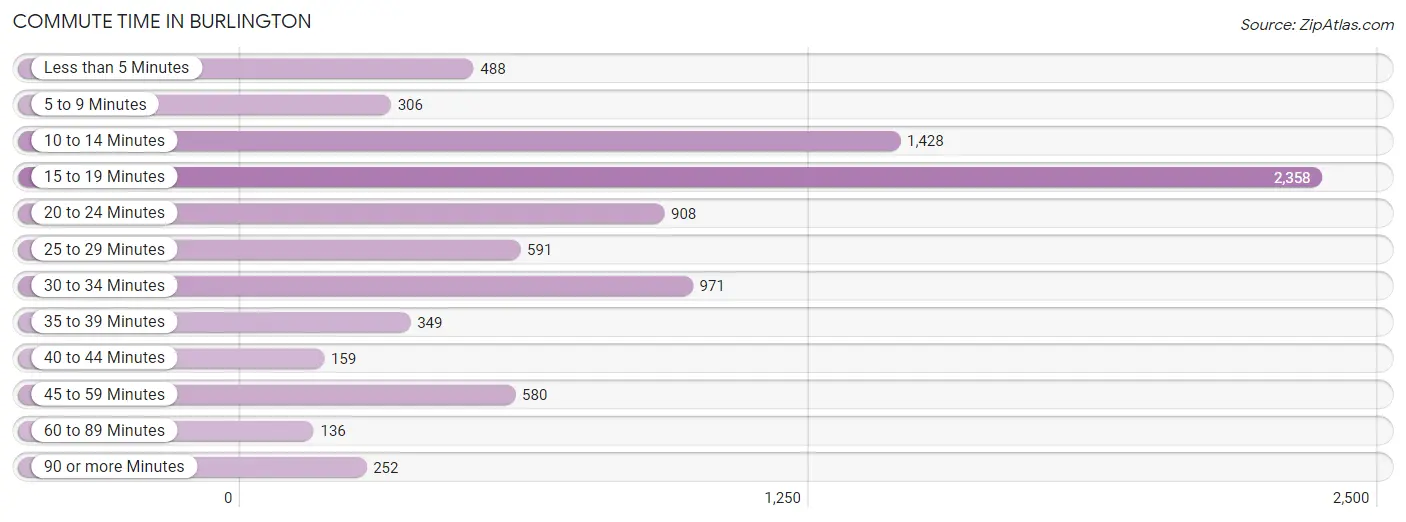
| Commute Time | # Commuters | % Commuters |
| Less than 5 Minutes | 488 | 5.7% |
| 5 to 9 Minutes | 306 | 3.6% |
| 10 to 14 Minutes | 1,428 | 16.8% |
| 15 to 19 Minutes | 2,358 | 27.7% |
| 20 to 24 Minutes | 908 | 10.6% |
| 25 to 29 Minutes | 591 | 6.9% |
| 30 to 34 Minutes | 971 | 11.4% |
| 35 to 39 Minutes | 349 | 4.1% |
| 40 to 44 Minutes | 159 | 1.9% |
| 45 to 59 Minutes | 580 | 6.8% |
| 60 to 89 Minutes | 136 | 1.6% |
| 90 or more Minutes | 252 | 3.0% |
Commute Time by Sex in Burlington
The most common commute times in Burlington are 15 to 19 minutes (1,454 commuters, 30.6%) for males and 15 to 19 minutes (904 commuters, 24.0%) for females.
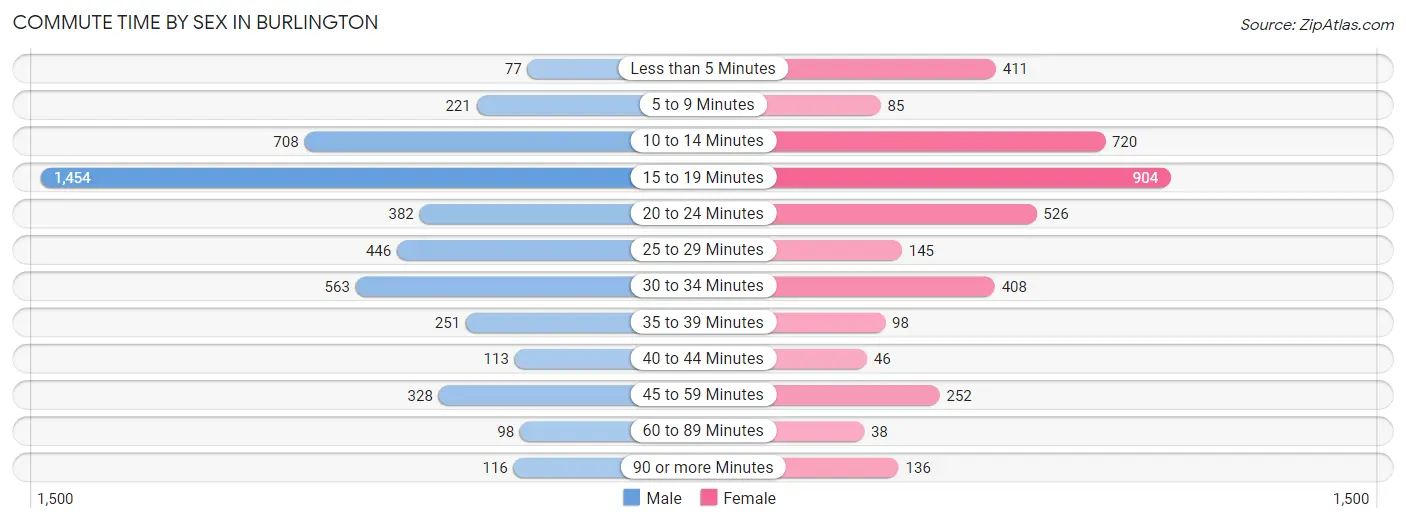
| Commute Time | Male | Female |
| Less than 5 Minutes | 77 (1.6%) | 411 (10.9%) |
| 5 to 9 Minutes | 221 (4.6%) | 85 (2.3%) |
| 10 to 14 Minutes | 708 (14.9%) | 720 (19.1%) |
| 15 to 19 Minutes | 1,454 (30.6%) | 904 (24.0%) |
| 20 to 24 Minutes | 382 (8.0%) | 526 (14.0%) |
| 25 to 29 Minutes | 446 (9.4%) | 145 (3.8%) |
| 30 to 34 Minutes | 563 (11.8%) | 408 (10.8%) |
| 35 to 39 Minutes | 251 (5.3%) | 98 (2.6%) |
| 40 to 44 Minutes | 113 (2.4%) | 46 (1.2%) |
| 45 to 59 Minutes | 328 (6.9%) | 252 (6.7%) |
| 60 to 89 Minutes | 98 (2.1%) | 38 (1.0%) |
| 90 or more Minutes | 116 (2.4%) | 136 (3.6%) |
Time of Departure to Work by Sex in Burlington
The most frequent times of departure to work in Burlington are 7:00 AM to 7:29 AM (723, 15.2%) for males and 7:00 AM to 7:29 AM (625, 16.6%) for females.
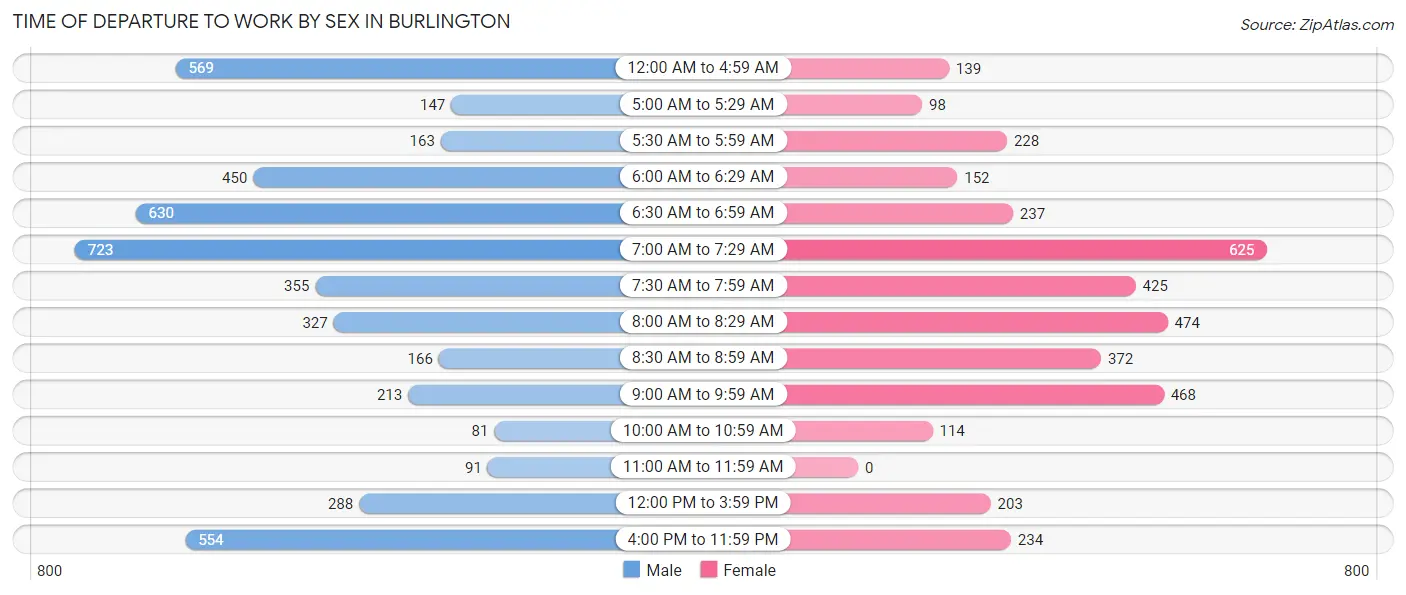
| Time of Departure | Male | Female |
| 12:00 AM to 4:59 AM | 569 (12.0%) | 139 (3.7%) |
| 5:00 AM to 5:29 AM | 147 (3.1%) | 98 (2.6%) |
| 5:30 AM to 5:59 AM | 163 (3.4%) | 228 (6.0%) |
| 6:00 AM to 6:29 AM | 450 (9.5%) | 152 (4.0%) |
| 6:30 AM to 6:59 AM | 630 (13.2%) | 237 (6.3%) |
| 7:00 AM to 7:29 AM | 723 (15.2%) | 625 (16.6%) |
| 7:30 AM to 7:59 AM | 355 (7.5%) | 425 (11.3%) |
| 8:00 AM to 8:29 AM | 327 (6.9%) | 474 (12.6%) |
| 8:30 AM to 8:59 AM | 166 (3.5%) | 372 (9.9%) |
| 9:00 AM to 9:59 AM | 213 (4.5%) | 468 (12.4%) |
| 10:00 AM to 10:59 AM | 81 (1.7%) | 114 (3.0%) |
| 11:00 AM to 11:59 AM | 91 (1.9%) | 0 (0.0%) |
| 12:00 PM to 3:59 PM | 288 (6.0%) | 203 (5.4%) |
| 4:00 PM to 11:59 PM | 554 (11.7%) | 234 (6.2%) |
| Total | 4,757 (100.0%) | 3,769 (100.0%) |
Housing Occupancy in Burlington
Occupancy by Ownership in Burlington
Of the total 6,527 dwellings in Burlington, owner-occupied units account for 5,128 (78.6%), while renter-occupied units make up 1,399 (21.4%).
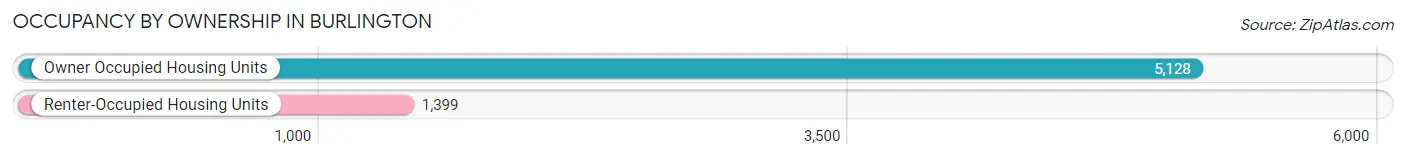
| Occupancy | # Housing Units | % Housing Units |
| Owner Occupied Housing Units | 5,128 | 78.6% |
| Renter-Occupied Housing Units | 1,399 | 21.4% |
| Total Occupied Housing Units | 6,527 | 100.0% |
Occupancy by Household Size in Burlington
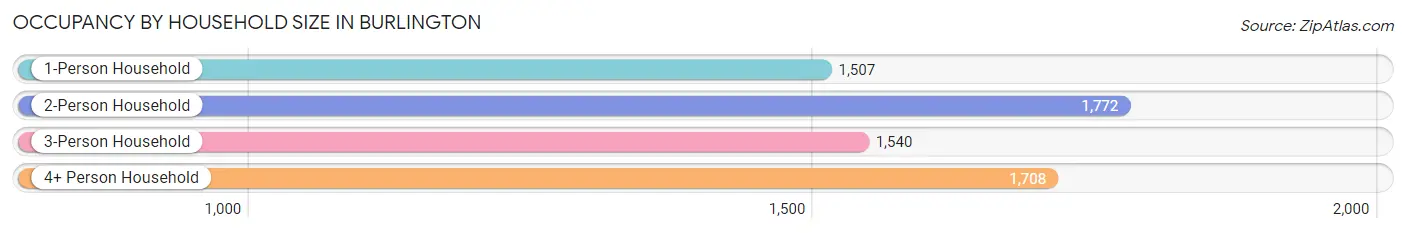
| Household Size | # Housing Units | % Housing Units |
| 1-Person Household | 1,507 | 23.1% |
| 2-Person Household | 1,772 | 27.2% |
| 3-Person Household | 1,540 | 23.6% |
| 4+ Person Household | 1,708 | 26.2% |
| Total Housing Units | 6,527 | 100.0% |
Occupancy by Ownership by Household Size in Burlington
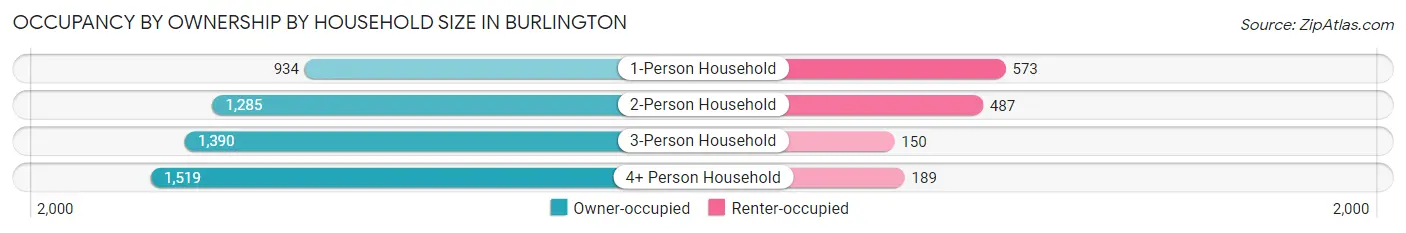
| Household Size | Owner-occupied | Renter-occupied |
| 1-Person Household | 934 (62.0%) | 573 (38.0%) |
| 2-Person Household | 1,285 (72.5%) | 487 (27.5%) |
| 3-Person Household | 1,390 (90.3%) | 150 (9.7%) |
| 4+ Person Household | 1,519 (88.9%) | 189 (11.1%) |
| Total Housing Units | 5,128 (78.6%) | 1,399 (21.4%) |
Occupancy by Educational Attainment in Burlington
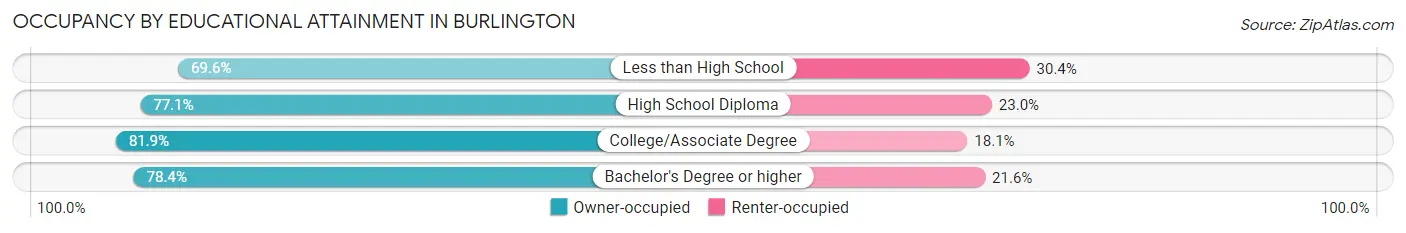
| Household Size | Owner-occupied | Renter-occupied |
| Less than High School | 183 (69.6%) | 80 (30.4%) |
| High School Diploma | 1,618 (77.0%) | 482 (23.0%) |
| College/Associate Degree | 1,463 (81.9%) | 323 (18.1%) |
| Bachelor's Degree or higher | 1,864 (78.4%) | 514 (21.6%) |
Occupancy by Age of Householder in Burlington
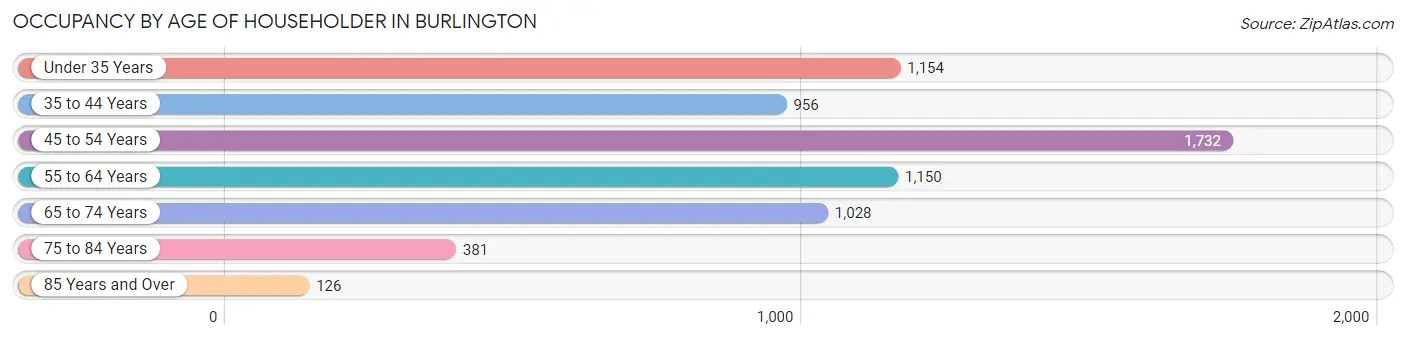
| Age Bracket | # Households | % Households |
| Under 35 Years | 1,154 | 17.7% |
| 35 to 44 Years | 956 | 14.6% |
| 45 to 54 Years | 1,732 | 26.5% |
| 55 to 64 Years | 1,150 | 17.6% |
| 65 to 74 Years | 1,028 | 15.8% |
| 75 to 84 Years | 381 | 5.8% |
| 85 Years and Over | 126 | 1.9% |
| Total | 6,527 | 100.0% |
Housing Finances in Burlington
Median Income by Occupancy in Burlington
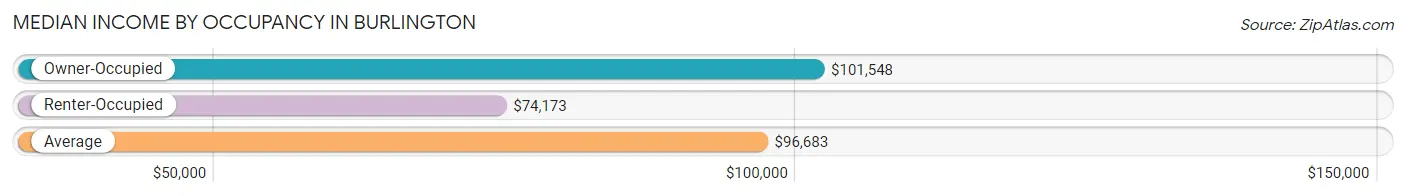
| Occupancy Type | # Households | Median Income |
| Owner-Occupied | 5,128 (78.6%) | $101,548 |
| Renter-Occupied | 1,399 (21.4%) | $74,173 |
| Average | 6,527 (100.0%) | $96,683 |
Occupancy by Householder Income Bracket in Burlington
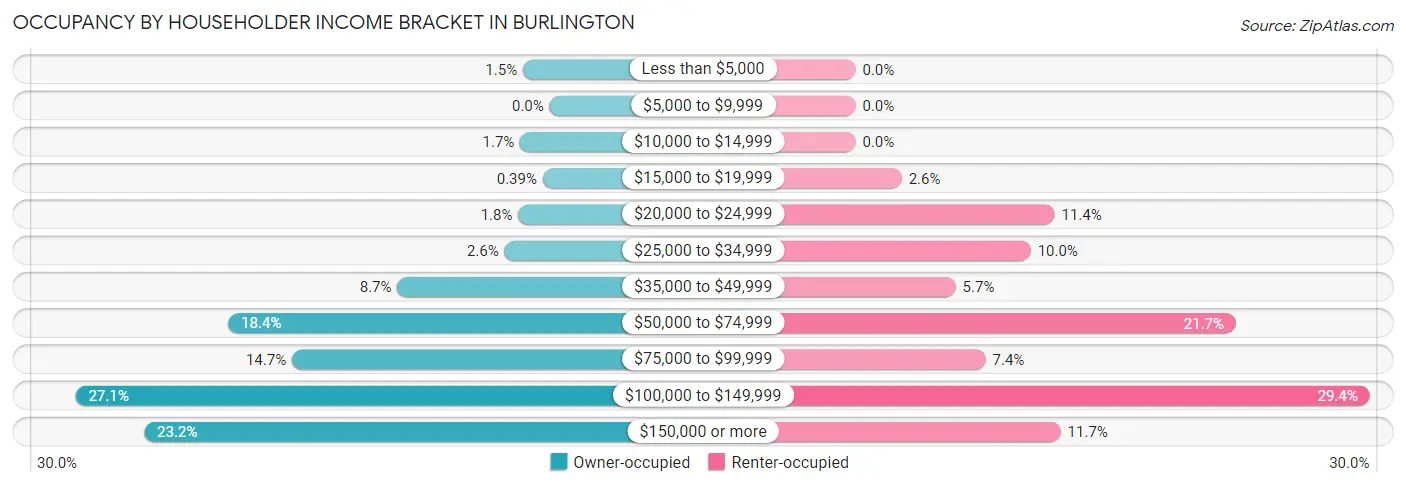
| Income Bracket | Owner-occupied | Renter-occupied |
| Less than $5,000 | 78 (1.5%) | 0 (0.0%) |
| $5,000 to $9,999 | 0 (0.0%) | 0 (0.0%) |
| $10,000 to $14,999 | 86 (1.7%) | 0 (0.0%) |
| $15,000 to $19,999 | 20 (0.4%) | 37 (2.6%) |
| $20,000 to $24,999 | 92 (1.8%) | 159 (11.4%) |
| $25,000 to $34,999 | 132 (2.6%) | 140 (10.0%) |
| $35,000 to $49,999 | 446 (8.7%) | 80 (5.7%) |
| $50,000 to $74,999 | 942 (18.4%) | 304 (21.7%) |
| $75,000 to $99,999 | 755 (14.7%) | 104 (7.4%) |
| $100,000 to $149,999 | 1,389 (27.1%) | 411 (29.4%) |
| $150,000 or more | 1,188 (23.2%) | 164 (11.7%) |
| Total | 5,128 (100.0%) | 1,399 (100.0%) |
Monthly Housing Cost Tiers in Burlington
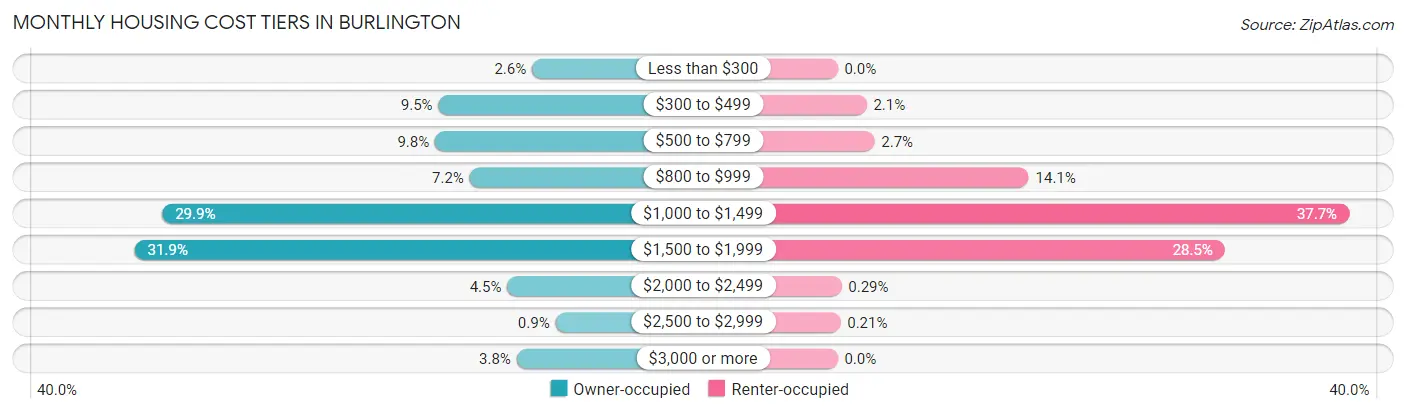
| Monthly Cost | Owner-occupied | Renter-occupied |
| Less than $300 | 135 (2.6%) | 0 (0.0%) |
| $300 to $499 | 488 (9.5%) | 30 (2.1%) |
| $500 to $799 | 501 (9.8%) | 38 (2.7%) |
| $800 to $999 | 370 (7.2%) | 197 (14.1%) |
| $1,000 to $1,499 | 1,531 (29.9%) | 527 (37.7%) |
| $1,500 to $1,999 | 1,636 (31.9%) | 399 (28.5%) |
| $2,000 to $2,499 | 228 (4.4%) | 4 (0.3%) |
| $2,500 to $2,999 | 46 (0.9%) | 3 (0.2%) |
| $3,000 or more | 193 (3.8%) | 0 (0.0%) |
| Total | 5,128 (100.0%) | 1,399 (100.0%) |
Physical Housing Characteristics in Burlington
Housing Structures in Burlington
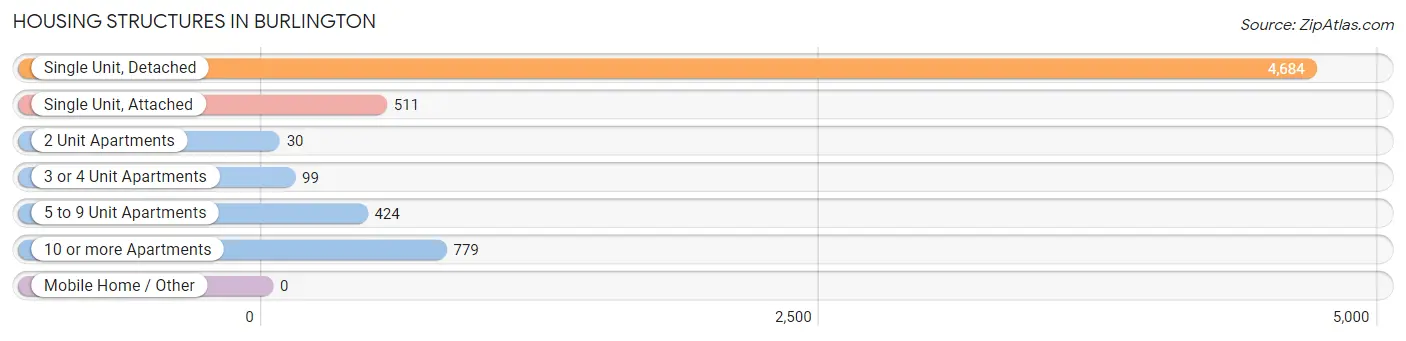
| Structure Type | # Housing Units | % Housing Units |
| Single Unit, Detached | 4,684 | 71.8% |
| Single Unit, Attached | 511 | 7.8% |
| 2 Unit Apartments | 30 | 0.5% |
| 3 or 4 Unit Apartments | 99 | 1.5% |
| 5 to 9 Unit Apartments | 424 | 6.5% |
| 10 or more Apartments | 779 | 11.9% |
| Mobile Home / Other | 0 | 0.0% |
| Total | 6,527 | 100.0% |
Housing Structures by Occupancy in Burlington
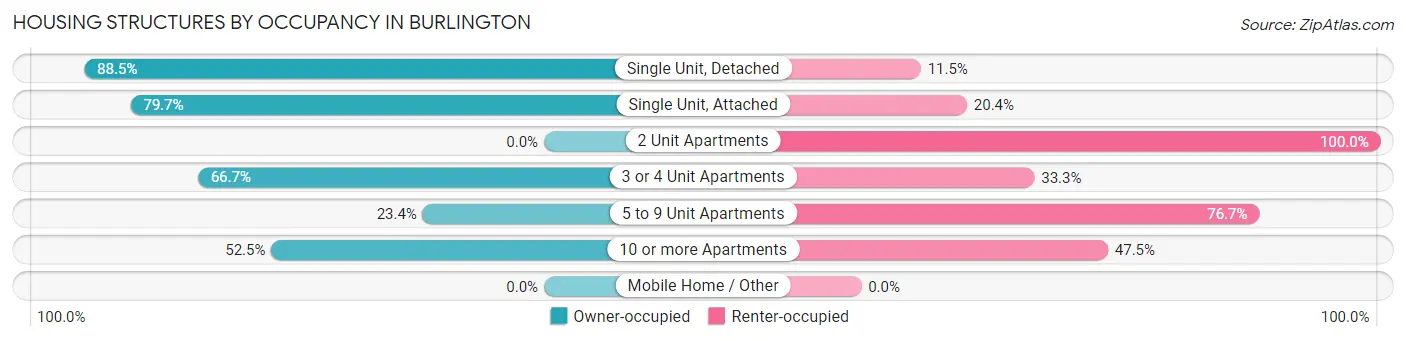
| Structure Type | Owner-occupied | Renter-occupied |
| Single Unit, Detached | 4,147 (88.5%) | 537 (11.5%) |
| Single Unit, Attached | 407 (79.6%) | 104 (20.3%) |
| 2 Unit Apartments | 0 (0.0%) | 30 (100.0%) |
| 3 or 4 Unit Apartments | 66 (66.7%) | 33 (33.3%) |
| 5 to 9 Unit Apartments | 99 (23.4%) | 325 (76.6%) |
| 10 or more Apartments | 409 (52.5%) | 370 (47.5%) |
| Mobile Home / Other | 0 (0.0%) | 0 (0.0%) |
| Total | 5,128 (78.6%) | 1,399 (21.4%) |
Housing Structures by Number of Rooms in Burlington
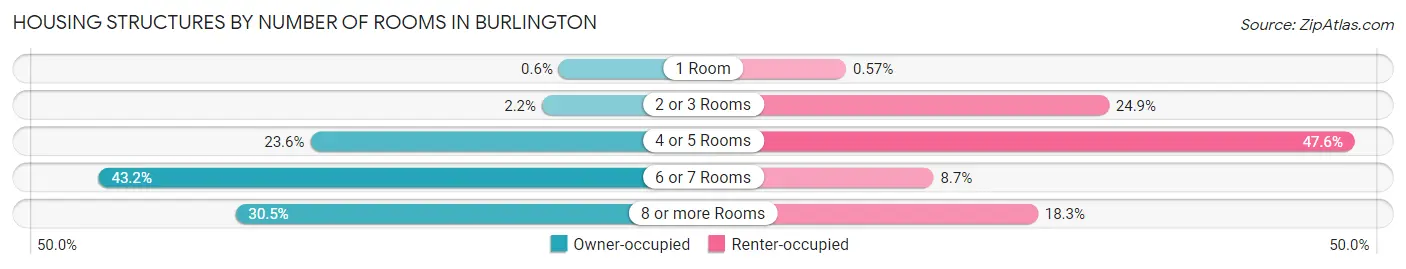
| Number of Rooms | Owner-occupied | Renter-occupied |
| 1 Room | 31 (0.6%) | 8 (0.6%) |
| 2 or 3 Rooms | 111 (2.2%) | 348 (24.9%) |
| 4 or 5 Rooms | 1,209 (23.6%) | 666 (47.6%) |
| 6 or 7 Rooms | 2,213 (43.2%) | 121 (8.6%) |
| 8 or more Rooms | 1,564 (30.5%) | 256 (18.3%) |
| Total | 5,128 (100.0%) | 1,399 (100.0%) |
Housing Structure by Heating Type in Burlington
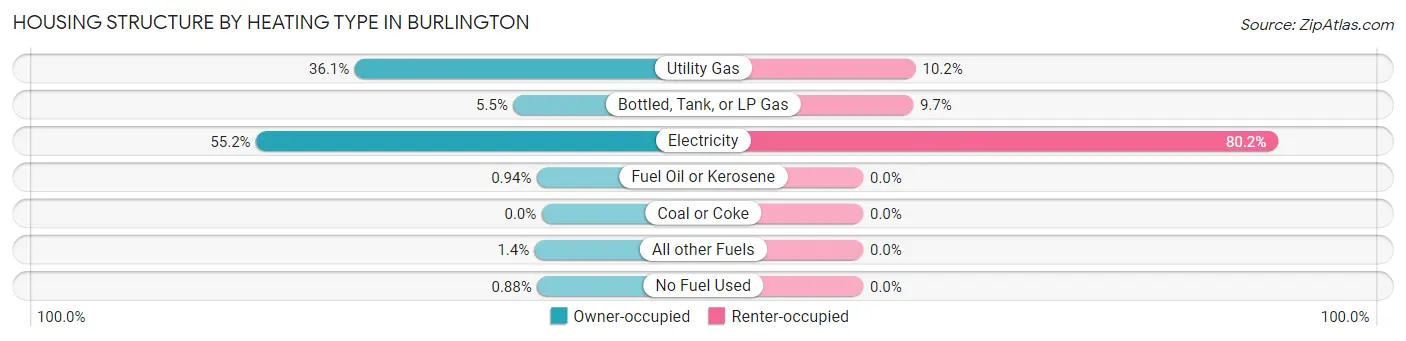
| Heating Type | Owner-occupied | Renter-occupied |
| Utility Gas | 1,853 (36.1%) | 142 (10.2%) |
| Bottled, Tank, or LP Gas | 281 (5.5%) | 135 (9.7%) |
| Electricity | 2,831 (55.2%) | 1,122 (80.2%) |
| Fuel Oil or Kerosene | 48 (0.9%) | 0 (0.0%) |
| Coal or Coke | 0 (0.0%) | 0 (0.0%) |
| All other Fuels | 70 (1.4%) | 0 (0.0%) |
| No Fuel Used | 45 (0.9%) | 0 (0.0%) |
| Total | 5,128 (100.0%) | 1,399 (100.0%) |
Household Vehicle Usage in Burlington
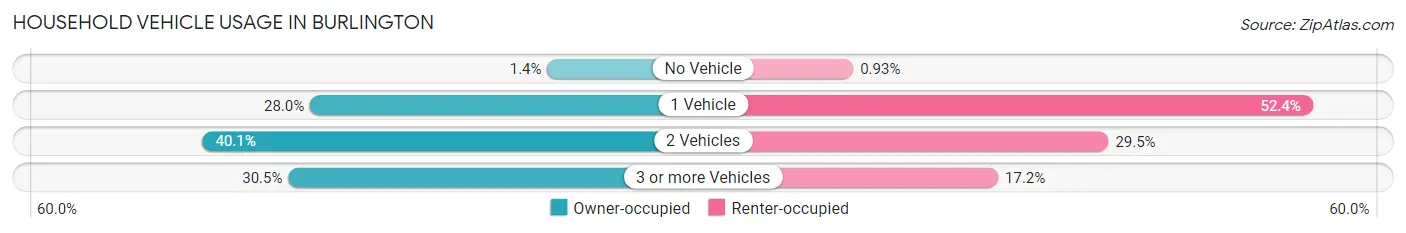
| Vehicles per Household | Owner-occupied | Renter-occupied |
| No Vehicle | 74 (1.4%) | 13 (0.9%) |
| 1 Vehicle | 1,437 (28.0%) | 733 (52.4%) |
| 2 Vehicles | 2,055 (40.1%) | 413 (29.5%) |
| 3 or more Vehicles | 1,562 (30.5%) | 240 (17.2%) |
| Total | 5,128 (100.0%) | 1,399 (100.0%) |
Real Estate & Mortgages in Burlington
Real Estate and Mortgage Overview in Burlington
| Characteristic | Without Mortgage | With Mortgage |
| Housing Units | 1,082 | 4,046 |
| Median Property Value | $195,400 | $220,000 |
| Median Household Income | $61,515 | $1,042 |
| Monthly Housing Costs | $484 | $193 |
| Real Estate Taxes | $1,508 | $68 |
Property Value by Mortgage Status in Burlington
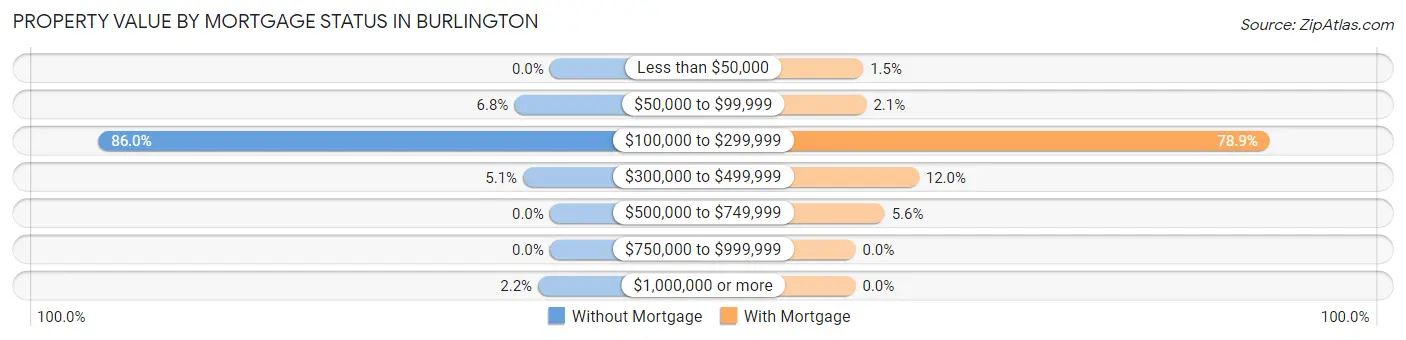
| Property Value | Without Mortgage | With Mortgage |
| Less than $50,000 | 0 (0.0%) | 59 (1.5%) |
| $50,000 to $99,999 | 73 (6.8%) | 84 (2.1%) |
| $100,000 to $299,999 | 930 (86.0%) | 3,191 (78.9%) |
| $300,000 to $499,999 | 55 (5.1%) | 487 (12.0%) |
| $500,000 to $749,999 | 0 (0.0%) | 225 (5.6%) |
| $750,000 to $999,999 | 0 (0.0%) | 0 (0.0%) |
| $1,000,000 or more | 24 (2.2%) | 0 (0.0%) |
| Total | 1,082 (100.0%) | 4,046 (100.0%) |
Household Income by Mortgage Status in Burlington
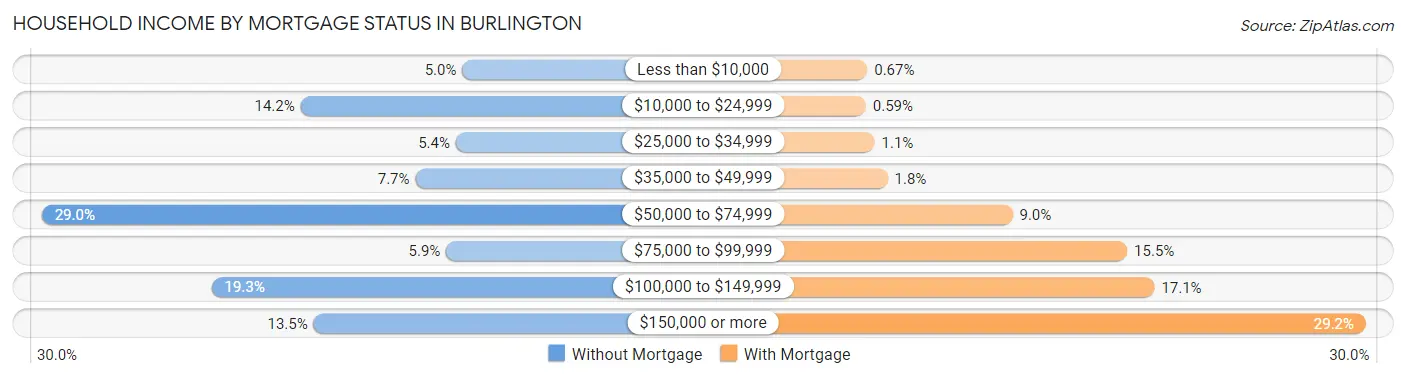
| Household Income | Without Mortgage | With Mortgage |
| Less than $10,000 | 54 (5.0%) | 27 (0.7%) |
| $10,000 to $24,999 | 154 (14.2%) | 24 (0.6%) |
| $25,000 to $34,999 | 58 (5.4%) | 44 (1.1%) |
| $35,000 to $49,999 | 83 (7.7%) | 74 (1.8%) |
| $50,000 to $74,999 | 314 (29.0%) | 363 (9.0%) |
| $75,000 to $99,999 | 64 (5.9%) | 628 (15.5%) |
| $100,000 to $149,999 | 209 (19.3%) | 691 (17.1%) |
| $150,000 or more | 146 (13.5%) | 1,180 (29.2%) |
| Total | 1,082 (100.0%) | 4,046 (100.0%) |
Property Value to Household Income Ratio in Burlington
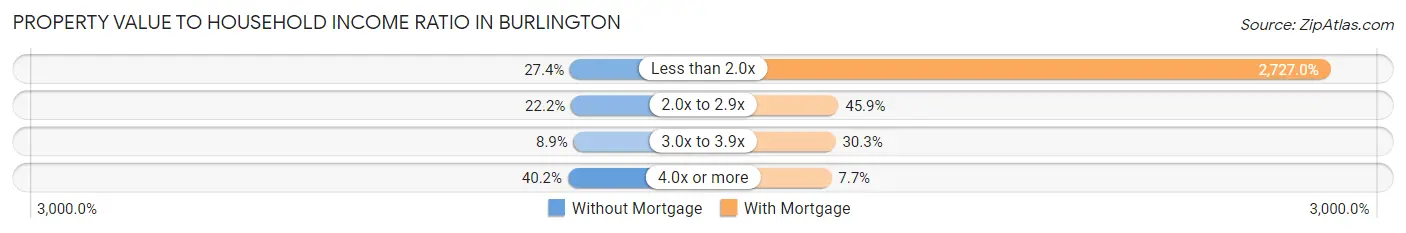
| Value-to-Income Ratio | Without Mortgage | With Mortgage |
| Less than 2.0x | 296 (27.4%) | 110,333 (2,727.0%) |
| 2.0x to 2.9x | 240 (22.2%) | 1,855 (45.9%) |
| 3.0x to 3.9x | 96 (8.9%) | 1,225 (30.3%) |
| 4.0x or more | 435 (40.2%) | 311 (7.7%) |
| Total | 1,082 (100.0%) | 4,046 (100.0%) |
Real Estate Taxes by Mortgage Status in Burlington
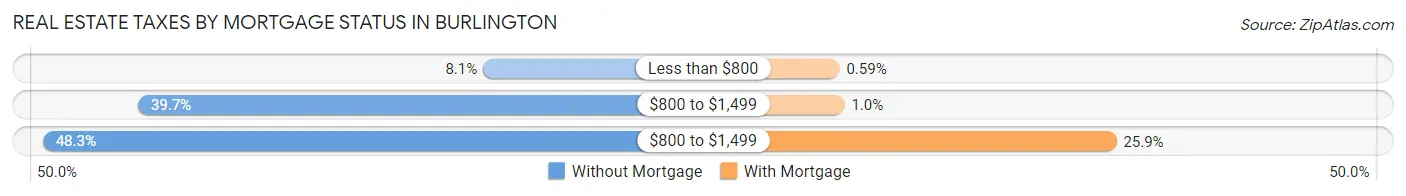
| Property Taxes | Without Mortgage | With Mortgage |
| Less than $800 | 88 (8.1%) | 24 (0.6%) |
| $800 to $1,499 | 429 (39.7%) | 42 (1.0%) |
| $800 to $1,499 | 523 (48.3%) | 1,047 (25.9%) |
| Total | 1,082 (100.0%) | 4,046 (100.0%) |
Health & Disability in Burlington
Health Insurance Coverage by Age in Burlington
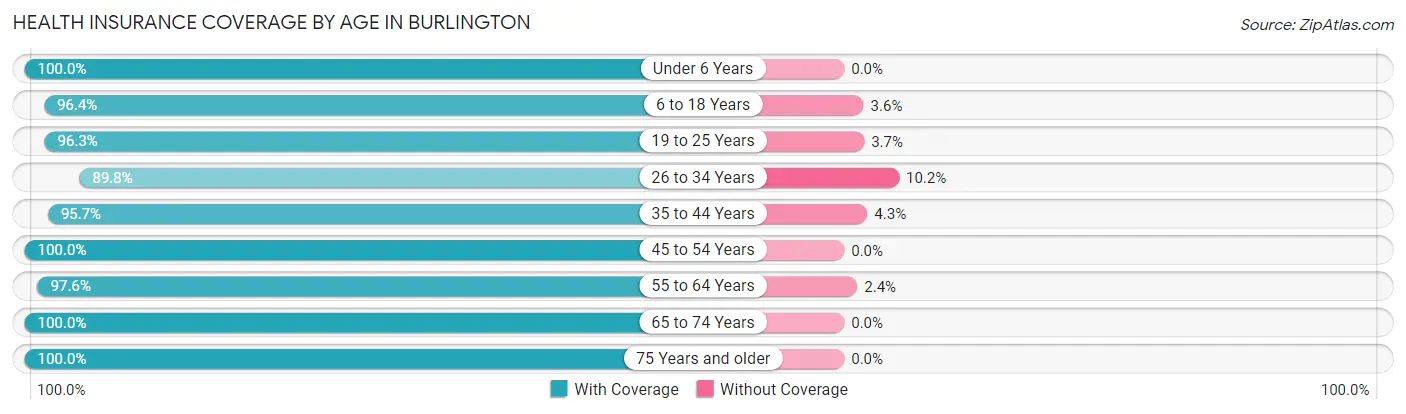
| Age Bracket | With Coverage | Without Coverage |
| Under 6 Years | 948 (100.0%) | 0 (0.0%) |
| 6 to 18 Years | 3,310 (96.4%) | 124 (3.6%) |
| 19 to 25 Years | 1,686 (96.3%) | 65 (3.7%) |
| 26 to 34 Years | 1,777 (89.8%) | 202 (10.2%) |
| 35 to 44 Years | 2,065 (95.7%) | 93 (4.3%) |
| 45 to 54 Years | 3,211 (100.0%) | 0 (0.0%) |
| 55 to 64 Years | 1,965 (97.6%) | 49 (2.4%) |
| 65 to 74 Years | 1,592 (100.0%) | 0 (0.0%) |
| 75 Years and older | 739 (100.0%) | 0 (0.0%) |
| Total | 17,293 (97.0%) | 533 (3.0%) |
Health Insurance Coverage by Citizenship Status in Burlington
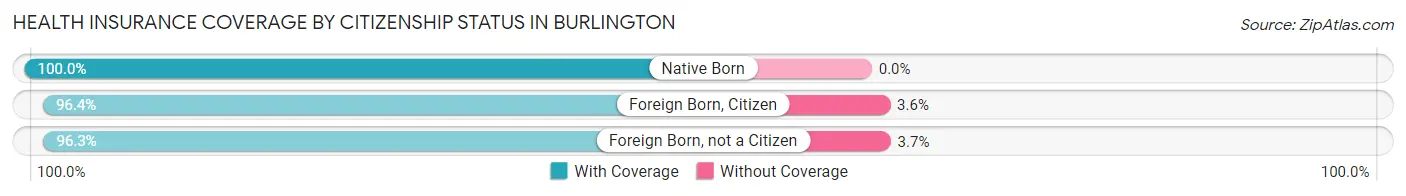
| Citizenship Status | With Coverage | Without Coverage |
| Native Born | 948 (100.0%) | 0 (0.0%) |
| Foreign Born, Citizen | 3,310 (96.4%) | 124 (3.6%) |
| Foreign Born, not a Citizen | 1,686 (96.3%) | 65 (3.7%) |
Health Insurance Coverage by Household Income in Burlington
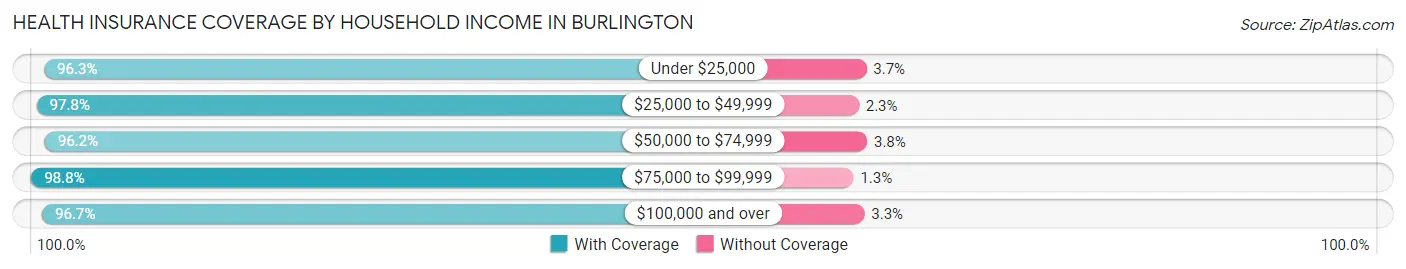
| Household Income | With Coverage | Without Coverage |
| Under $25,000 | 632 (96.3%) | 24 (3.7%) |
| $25,000 to $49,999 | 1,436 (97.8%) | 33 (2.2%) |
| $50,000 to $74,999 | 2,948 (96.2%) | 116 (3.8%) |
| $75,000 to $99,999 | 2,684 (98.8%) | 34 (1.3%) |
| $100,000 and over | 9,590 (96.7%) | 326 (3.3%) |
Public vs Private Health Insurance Coverage by Age in Burlington
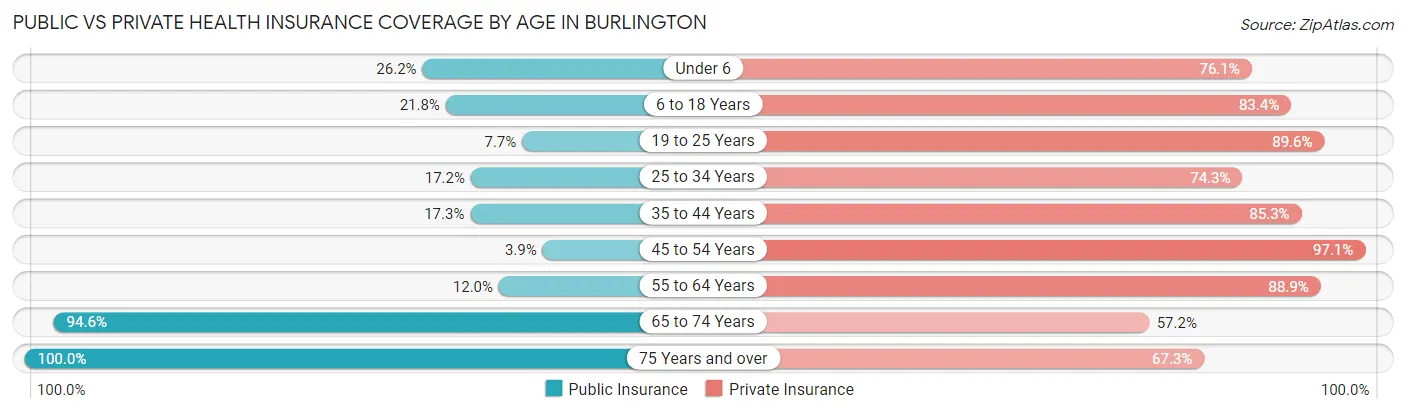
| Age Bracket | Public Insurance | Private Insurance |
| Under 6 | 248 (26.2%) | 721 (76.0%) |
| 6 to 18 Years | 750 (21.8%) | 2,863 (83.4%) |
| 19 to 25 Years | 134 (7.6%) | 1,568 (89.5%) |
| 25 to 34 Years | 340 (17.2%) | 1,471 (74.3%) |
| 35 to 44 Years | 373 (17.3%) | 1,841 (85.3%) |
| 45 to 54 Years | 124 (3.9%) | 3,119 (97.1%) |
| 55 to 64 Years | 241 (12.0%) | 1,790 (88.9%) |
| 65 to 74 Years | 1,506 (94.6%) | 910 (57.2%) |
| 75 Years and over | 739 (100.0%) | 497 (67.2%) |
| Total | 4,455 (25.0%) | 14,780 (82.9%) |
Disability Status by Sex by Age in Burlington
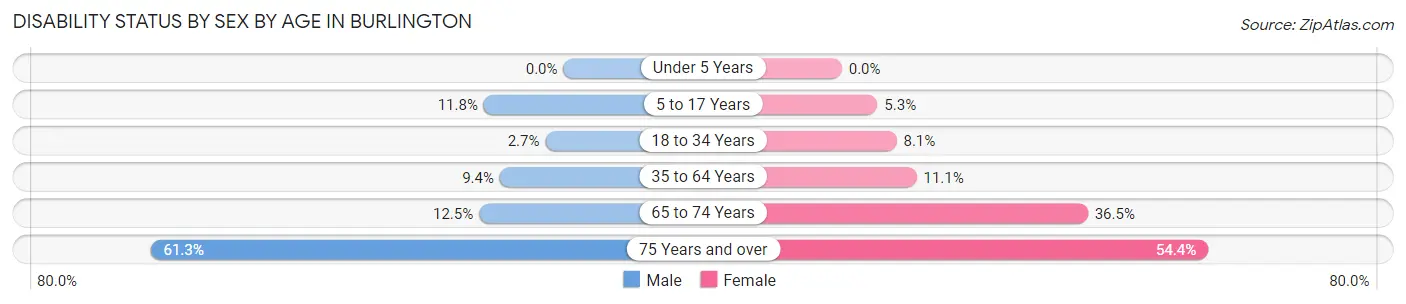
| Age Bracket | Male | Female |
| Under 5 Years | 0 (0.0%) | 0 (0.0%) |
| 5 to 17 Years | 212 (11.8%) | 76 (5.3%) |
| 18 to 34 Years | 56 (2.7%) | 161 (8.1%) |
| 35 to 64 Years | 345 (9.4%) | 414 (11.1%) |
| 65 to 74 Years | 92 (12.5%) | 313 (36.5%) |
| 75 Years and over | 152 (61.3%) | 267 (54.4%) |
Disability Class by Sex by Age in Burlington
Disability Class: Hearing Difficulty
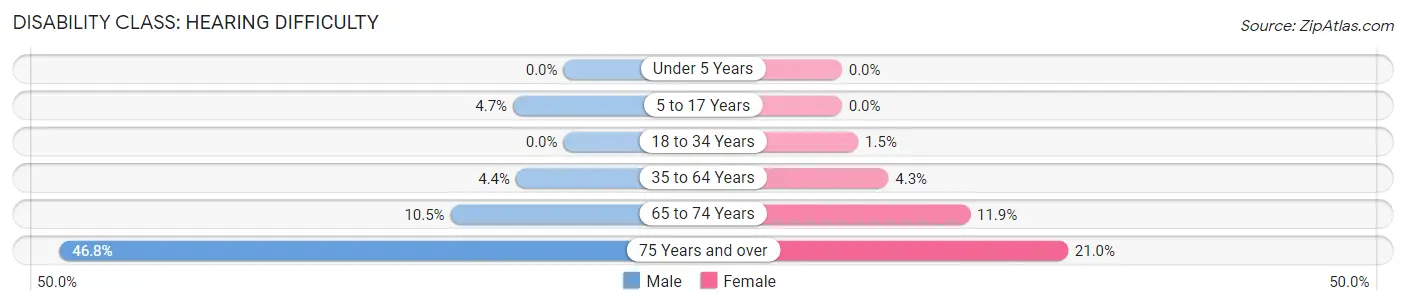
| Age Bracket | Male | Female |
| Under 5 Years | 0 (0.0%) | 0 (0.0%) |
| 5 to 17 Years | 84 (4.7%) | 0 (0.0%) |
| 18 to 34 Years | 0 (0.0%) | 30 (1.5%) |
| 35 to 64 Years | 161 (4.4%) | 161 (4.3%) |
| 65 to 74 Years | 77 (10.5%) | 102 (11.9%) |
| 75 Years and over | 116 (46.8%) | 103 (21.0%) |
Disability Class: Vision Difficulty
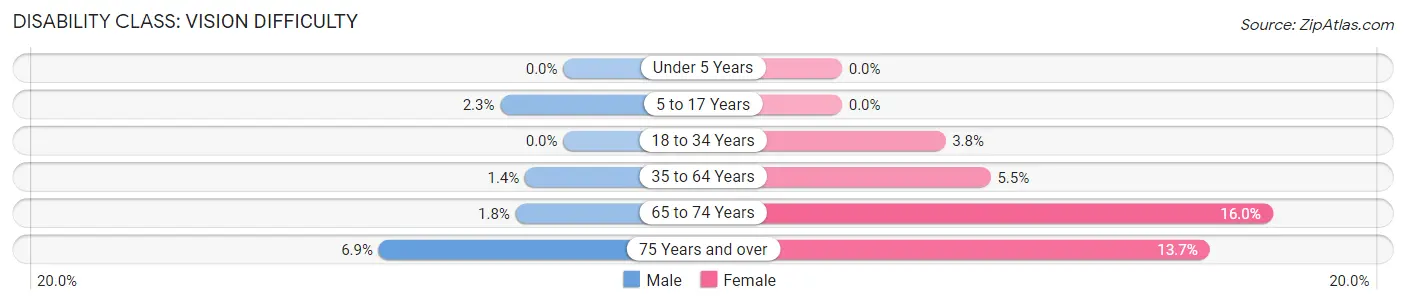
| Age Bracket | Male | Female |
| Under 5 Years | 0 (0.0%) | 0 (0.0%) |
| 5 to 17 Years | 42 (2.3%) | 0 (0.0%) |
| 18 to 34 Years | 0 (0.0%) | 76 (3.8%) |
| 35 to 64 Years | 52 (1.4%) | 206 (5.5%) |
| 65 to 74 Years | 13 (1.8%) | 137 (16.0%) |
| 75 Years and over | 17 (6.9%) | 67 (13.7%) |
Disability Class: Cognitive Difficulty
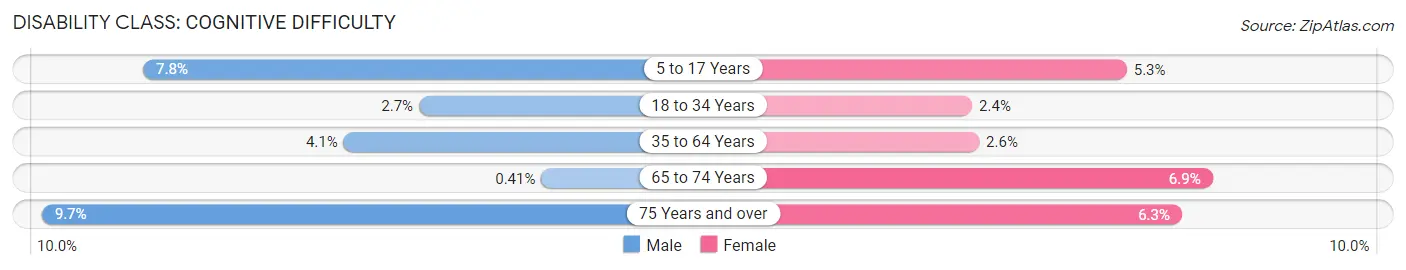
| Age Bracket | Male | Female |
| 5 to 17 Years | 140 (7.8%) | 76 (5.3%) |
| 18 to 34 Years | 56 (2.7%) | 48 (2.4%) |
| 35 to 64 Years | 149 (4.1%) | 95 (2.5%) |
| 65 to 74 Years | 3 (0.4%) | 59 (6.9%) |
| 75 Years and over | 24 (9.7%) | 31 (6.3%) |
Disability Class: Ambulatory Difficulty
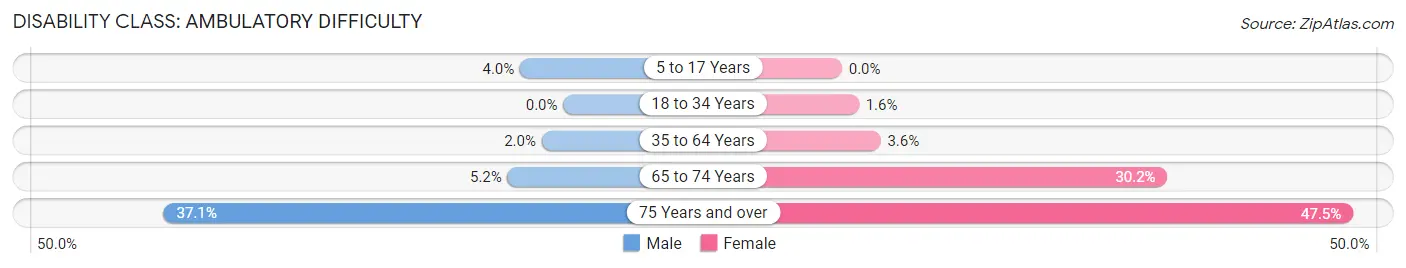
| Age Bracket | Male | Female |
| 5 to 17 Years | 72 (4.0%) | 0 (0.0%) |
| 18 to 34 Years | 0 (0.0%) | 31 (1.6%) |
| 35 to 64 Years | 73 (2.0%) | 134 (3.6%) |
| 65 to 74 Years | 38 (5.2%) | 259 (30.2%) |
| 75 Years and over | 92 (37.1%) | 233 (47.4%) |
Disability Class: Self-Care Difficulty
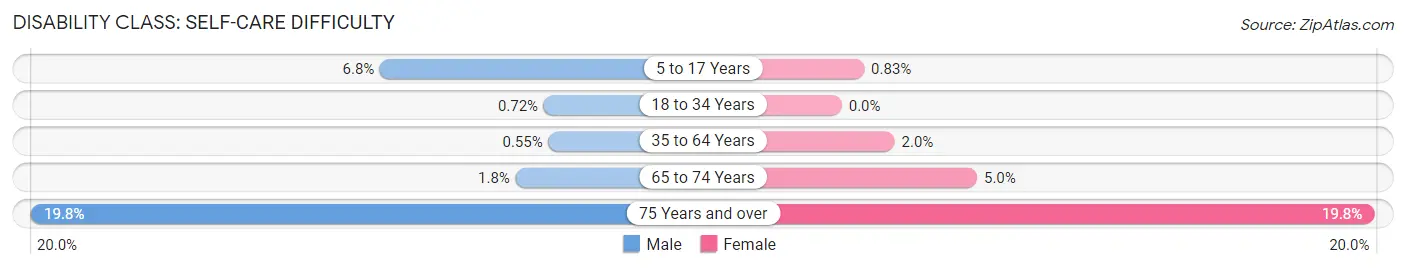
| Age Bracket | Male | Female |
| 5 to 17 Years | 122 (6.8%) | 12 (0.8%) |
| 18 to 34 Years | 15 (0.7%) | 0 (0.0%) |
| 35 to 64 Years | 20 (0.5%) | 73 (2.0%) |
| 65 to 74 Years | 13 (1.8%) | 43 (5.0%) |
| 75 Years and over | 49 (19.8%) | 97 (19.8%) |
Technology Access in Burlington
Computing Device Access in Burlington
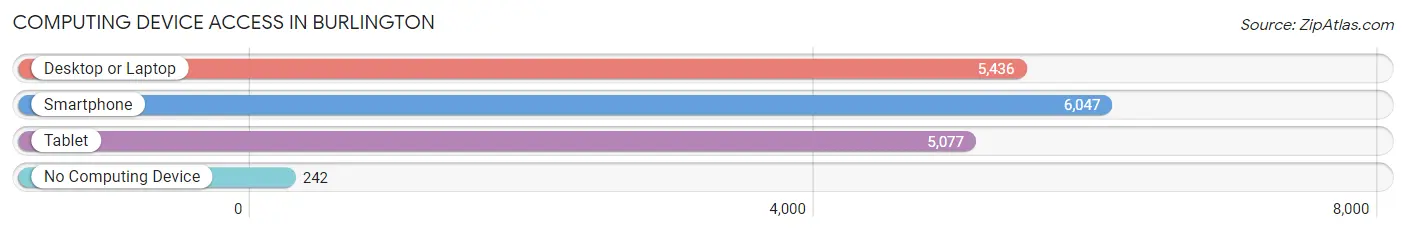
| Device Type | # Households | % Households |
| Desktop or Laptop | 5,436 | 83.3% |
| Smartphone | 6,047 | 92.6% |
| Tablet | 5,077 | 77.8% |
| No Computing Device | 242 | 3.7% |
| Total | 6,527 | 100.0% |
Internet Access in Burlington
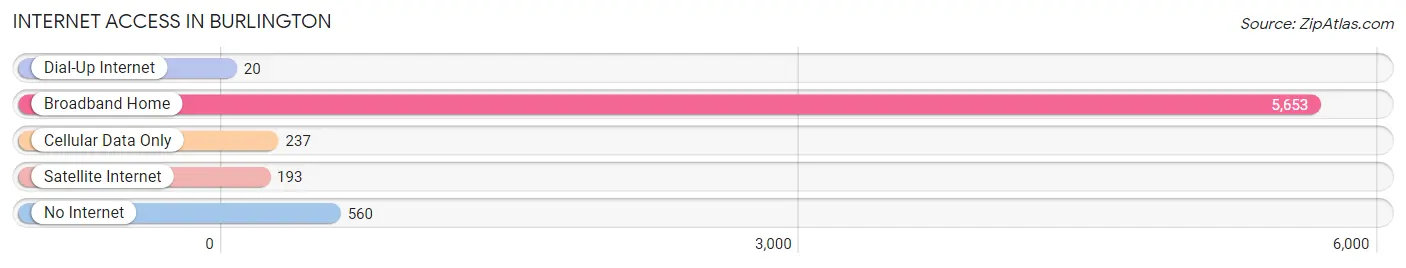
| Internet Type | # Households | % Households |
| Dial-Up Internet | 20 | 0.3% |
| Broadband Home | 5,653 | 86.6% |
| Cellular Data Only | 237 | 3.6% |
| Satellite Internet | 193 | 3.0% |
| No Internet | 560 | 8.6% |
| Total | 6,527 | 100.0% |
Burlington Summary
Burlington, Kentucky is a small city located in Boone County, Kentucky, United States. It is situated on the banks of the Ohio River, approximately 20 miles south of Cincinnati, Ohio. The city has a population of approximately 9,000 people and is part of the Cincinnati metropolitan area.
History
Burlington was first settled in 1790 by a group of settlers from Pennsylvania. The town was originally known as “Crossroads” due to its location at the intersection of two major roads. In 1815, the town was renamed Burlington after the nearby Burlington Church. The town was officially incorporated in 1845.
During the 19th century, Burlington was a major stop on the Underground Railroad, with many slaves escaping to freedom in the North. The town was also home to a large number of German immigrants, who established a thriving community.
In the early 20th century, Burlington experienced a period of growth and prosperity. The town was home to several factories, including a tobacco factory, a flour mill, and a furniture factory. The town also had a thriving business district, with several stores and restaurants.
Geography
Burlington is located in Boone County, Kentucky, on the banks of the Ohio River. The city is situated approximately 20 miles south of Cincinnati, Ohio. The city has a total area of 4.2 square miles, all of which is land.
The city is located in a hilly region, with the highest point being the summit of Burlington Hill, which has an elevation of 845 feet. The city is also located near the Big Bone Lick State Park, which is a popular destination for outdoor recreation.
Economy
Burlington’s economy is largely based on manufacturing and retail. The city is home to several factories, including a tobacco factory, a flour mill, and a furniture factory. The city also has a thriving business district, with several stores and restaurants.
The city is also home to several large employers, including the Burlington-based company, Cintas Corporation, which is a provider of uniforms and other services to businesses. The city is also home to the Burlington-based company, KFC, which is a fast-food restaurant chain.
Demographics
As of the 2010 census, Burlington had a population of 8,937 people. The racial makeup of the city was 90.2% White, 4.3% African American, 0.3% Native American, 1.2% Asian, 0.1% Pacific Islander, 1.7% from other races, and 2.4% from two or more races. Hispanic or Latino of any race were 4.2% of the population.
The median income for a household in the city was $45,945, and the median income for a family was $54,945. The per capita income for the city was $22,945. About 8.2% of families and 10.2% of the population were below the poverty line, including 14.2% of those under age 18 and 6.2% of those age 65 or over.
Common Questions
What is Per Capita Income in Burlington?
Per Capita income in Burlington is $39,170.
What is the Median Family Income in Burlington?
Median Family Income in Burlington is $114,282.
What is the Median Household income in Burlington?
Median Household Income in Burlington is $96,683.
What is Income or Wage Gap in Burlington?
Income or Wage Gap in Burlington is 26.4%.
Women in Burlington earn 73.6 cents for every dollar earned by a man.
What is Inequality or Gini Index in Burlington?
Inequality or Gini Index in Burlington is 0.35.
What is the Total Population of Burlington?
Total Population of Burlington is 18,264.
What is the Total Male Population of Burlington?
Total Male Population of Burlington is 9,323.
What is the Total Female Population of Burlington?
Total Female Population of Burlington is 8,941.
What is the Ratio of Males per 100 Females in Burlington?
There are 104.27 Males per 100 Females in Burlington.
What is the Ratio of Females per 100 Males in Burlington?
There are 95.90 Females per 100 Males in Burlington.
What is the Median Population Age in Burlington?
Median Population Age in Burlington is 37.7 Years.
What is the Average Family Size in Burlington
Average Family Size in Burlington is 3.2 People.
What is the Average Household Size in Burlington
Average Household Size in Burlington is 2.7 People.
How Large is the Labor Force in Burlington?
There are 10,177 People in the Labor Forcein in Burlington.
What is the Percentage of People in the Labor Force in Burlington?
69.3% of People are in the Labor Force in Burlington.
What is the Unemployment Rate in Burlington?
Unemployment Rate in Burlington is 3.0%.