Wickliffe, KY Map & Demographics
Wickliffe Map
Wickliffe Overview
$19,795
PER CAPITA INCOME
$39,706
AVG FAMILY INCOME
$34,250
AVG HOUSEHOLD INCOME
16.1%
WAGE / INCOME GAP [ % ]
83.9¢/ $1
WAGE / INCOME GAP [ $ ]
0.42
INEQUALITY / GINI INDEX
727
TOTAL POPULATION
377
MALE POPULATION
350
FEMALE POPULATION
107.71
MALES / 100 FEMALES
92.84
FEMALES / 100 MALES
42.8
MEDIAN AGE
3.4
AVG FAMILY SIZE
2.4
AVG HOUSEHOLD SIZE
210
LABOR FORCE [ PEOPLE ]
34.2%
PERCENT IN LABOR FORCE
Wickliffe Zip Codes
Wickliffe Area Codes
Income in Wickliffe
Income Overview in Wickliffe
Per Capita Income in Wickliffe is $19,795, while median incomes of families and households are $39,706 and $34,250 respectively.
| Characteristic | Number | Measure |
| Per Capita Income | 727 | $19,795 |
| Median Family Income | 150 | $39,706 |
| Mean Family Income | 150 | $59,191 |
| Median Household Income | 273 | $34,250 |
| Mean Household Income | 273 | $46,758 |
| Income Deficit | 150 | $0 |
| Wage / Income Gap (%) | 727 | 16.11% |
| Wage / Income Gap ($) | 727 | 83.89¢ per $1 |
| Gini / Inequality Index | 727 | 0.42 |
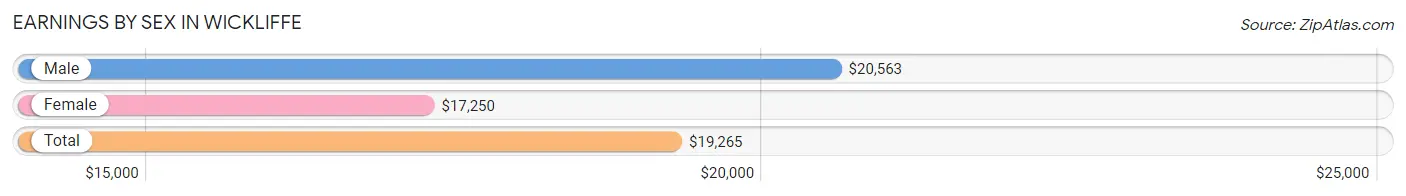
Earnings by Sex in Wickliffe
Average Earnings in Wickliffe are $19,265, $20,563 for men and $17,250 for women, a difference of 16.1%.
| Sex | Number | Average Earnings |
| Male | 155 (61.5%) | $20,563 |
| Female | 97 (38.5%) | $17,250 |
| Total | 252 (100.0%) | $19,265 |
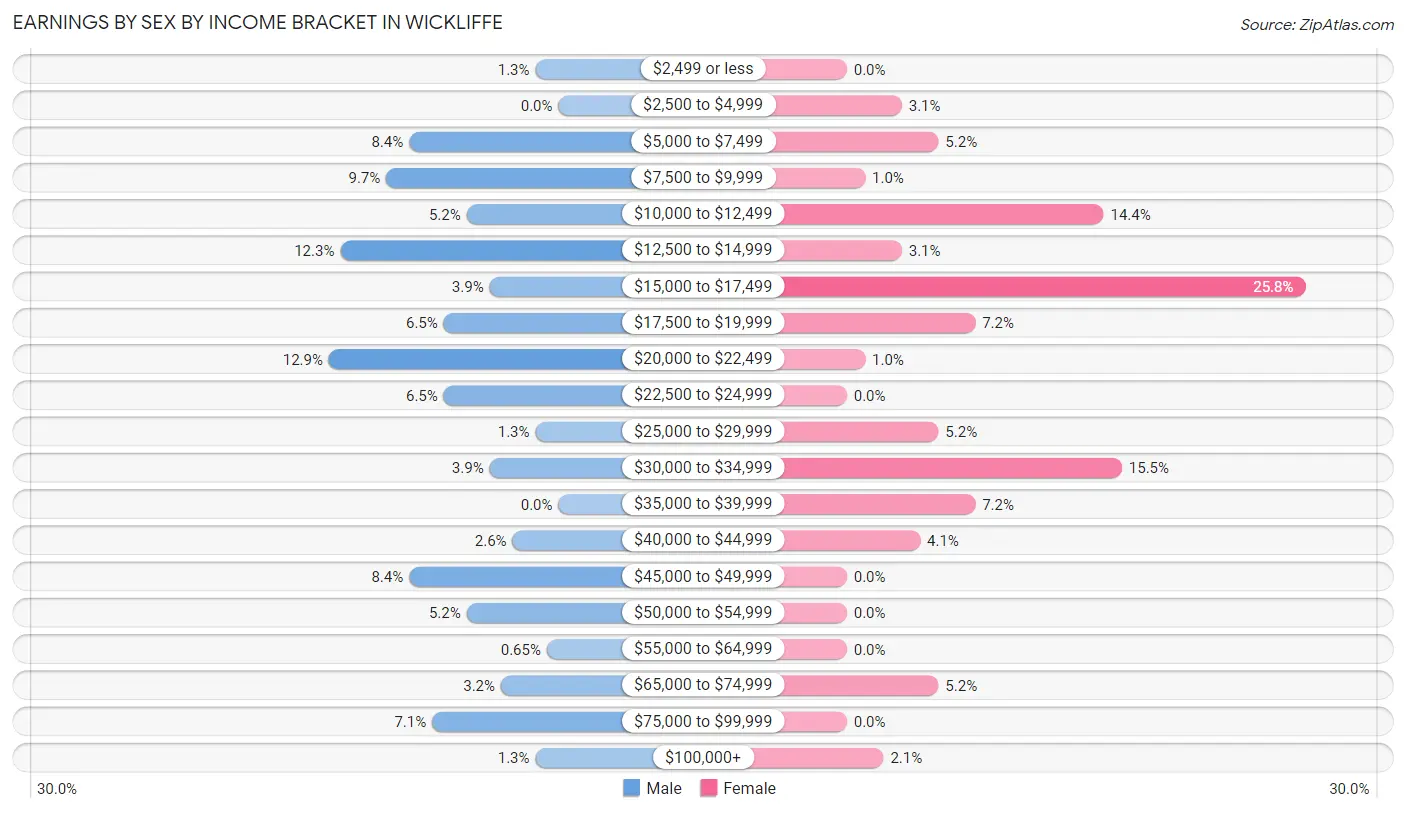
Earnings by Sex by Income Bracket in Wickliffe
The most common earnings brackets in Wickliffe are $20,000 to $22,499 for men (20 | 12.9%) and $15,000 to $17,499 for women (25 | 25.8%).
| Income | Male | Female |
| $2,499 or less | 2 (1.3%) | 0 (0.0%) |
| $2,500 to $4,999 | 0 (0.0%) | 3 (3.1%) |
| $5,000 to $7,499 | 13 (8.4%) | 5 (5.1%) |
| $7,500 to $9,999 | 15 (9.7%) | 1 (1.0%) |
| $10,000 to $12,499 | 8 (5.2%) | 14 (14.4%) |
| $12,500 to $14,999 | 19 (12.3%) | 3 (3.1%) |
| $15,000 to $17,499 | 6 (3.9%) | 25 (25.8%) |
| $17,500 to $19,999 | 10 (6.5%) | 7 (7.2%) |
| $20,000 to $22,499 | 20 (12.9%) | 1 (1.0%) |
| $22,500 to $24,999 | 10 (6.5%) | 0 (0.0%) |
| $25,000 to $29,999 | 2 (1.3%) | 5 (5.1%) |
| $30,000 to $34,999 | 6 (3.9%) | 15 (15.5%) |
| $35,000 to $39,999 | 0 (0.0%) | 7 (7.2%) |
| $40,000 to $44,999 | 4 (2.6%) | 4 (4.1%) |
| $45,000 to $49,999 | 13 (8.4%) | 0 (0.0%) |
| $50,000 to $54,999 | 8 (5.2%) | 0 (0.0%) |
| $55,000 to $64,999 | 1 (0.6%) | 0 (0.0%) |
| $65,000 to $74,999 | 5 (3.2%) | 5 (5.1%) |
| $75,000 to $99,999 | 11 (7.1%) | 0 (0.0%) |
| $100,000+ | 2 (1.3%) | 2 (2.1%) |
| Total | 155 (100.0%) | 97 (100.0%) |
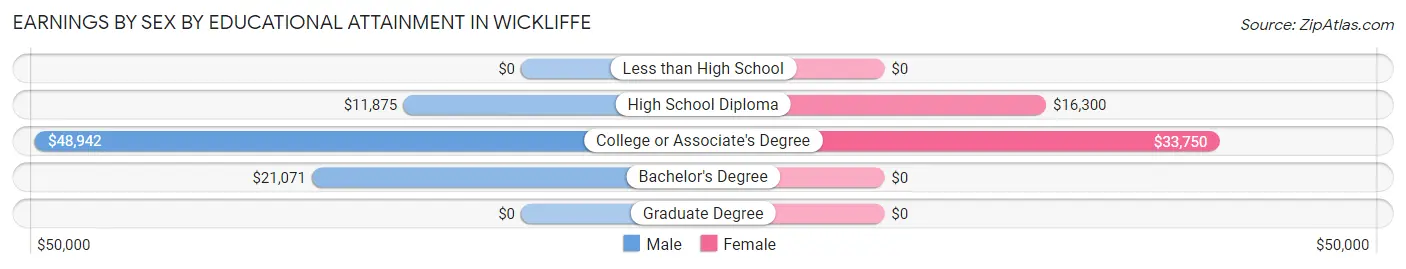
Earnings by Sex by Educational Attainment in Wickliffe
Average earnings in Wickliffe are $21,500 for men and $17,300 for women, a difference of 19.5%. Men with an educational attainment of college or associate's degree enjoy the highest average annual earnings of $48,942, while those with high school diploma education earn the least with $11,875. Women with an educational attainment of college or associate's degree earn the most with the average annual earnings of $33,750, while those with high school diploma education have the smallest earnings of $16,300.
| Educational Attainment | Male Income | Female Income |
| Less than High School | - | - |
| High School Diploma | $11,875 | $16,300 |
| College or Associate's Degree | $48,942 | $33,750 |
| Bachelor's Degree | $21,071 | $0 |
| Graduate Degree | - | - |
| Total | $21,500 | $17,300 |
Family Income in Wickliffe
Family Income Brackets in Wickliffe
According to the Wickliffe family income data, there are 44 families falling into the $15,000 to $24,999 income range, which is the most common income bracket and makes up 29.3% of all families.
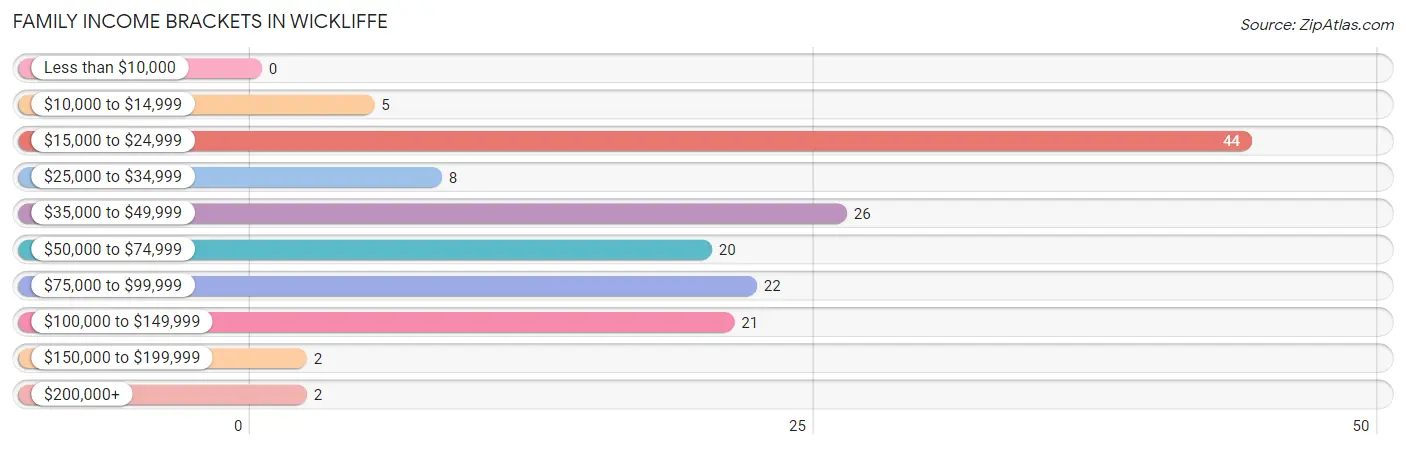
| Income Bracket | # Families | % Families |
| Less than $10,000 | 0 | 0.0% |
| $10,000 to $14,999 | 5 | 3.3% |
| $15,000 to $24,999 | 44 | 29.3% |
| $25,000 to $34,999 | 8 | 5.3% |
| $35,000 to $49,999 | 26 | 17.3% |
| $50,000 to $74,999 | 20 | 13.3% |
| $75,000 to $99,999 | 22 | 14.7% |
| $100,000 to $149,999 | 21 | 14.0% |
| $150,000 to $199,999 | 2 | 1.3% |
| $200,000+ | 2 | 1.3% |
Family Income by Famaliy Size in Wickliffe
5-person families (10 | 6.7%) account for the highest median family income in Wickliffe with $98,500 per family, while 2-person families (101 | 67.3%) have the highest median income of $19,816 per family member.
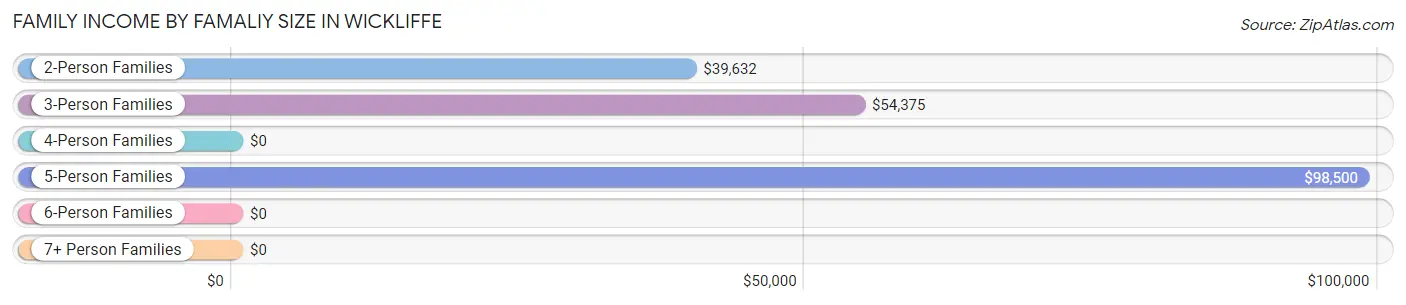
| Income Bracket | # Families | Median Income |
| 2-Person Families | 101 (67.3%) | $39,632 |
| 3-Person Families | 14 (9.3%) | $54,375 |
| 4-Person Families | 17 (11.3%) | $0 |
| 5-Person Families | 10 (6.7%) | $98,500 |
| 6-Person Families | 1 (0.7%) | $0 |
| 7+ Person Families | 7 (4.7%) | $0 |
| Total | 150 (100.0%) | $39,706 |
Family Income by Number of Earners in Wickliffe
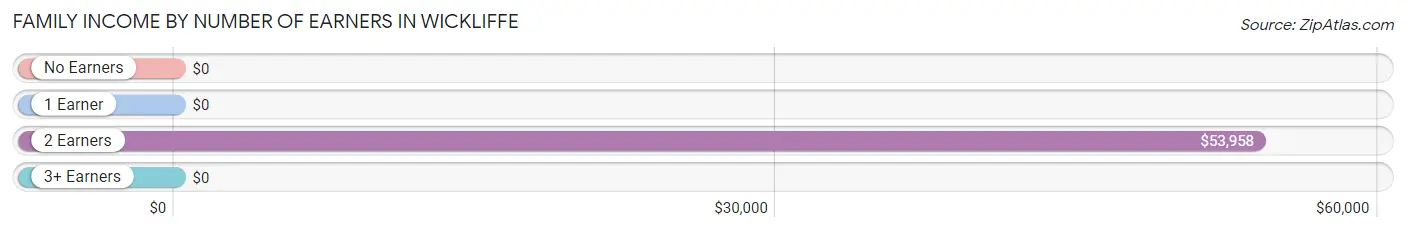
| Number of Earners | # Families | Median Income |
| No Earners | 40 (26.7%) | $0 |
| 1 Earner | 88 (58.7%) | $0 |
| 2 Earners | 15 (10.0%) | $53,958 |
| 3+ Earners | 7 (4.7%) | $0 |
| Total | 150 (100.0%) | $39,706 |
Household Income in Wickliffe
Household Income Brackets in Wickliffe
With 78 households falling in the category, the $15,000 to $24,999 income range is the most frequent in Wickliffe, accounting for 28.6% of all households.
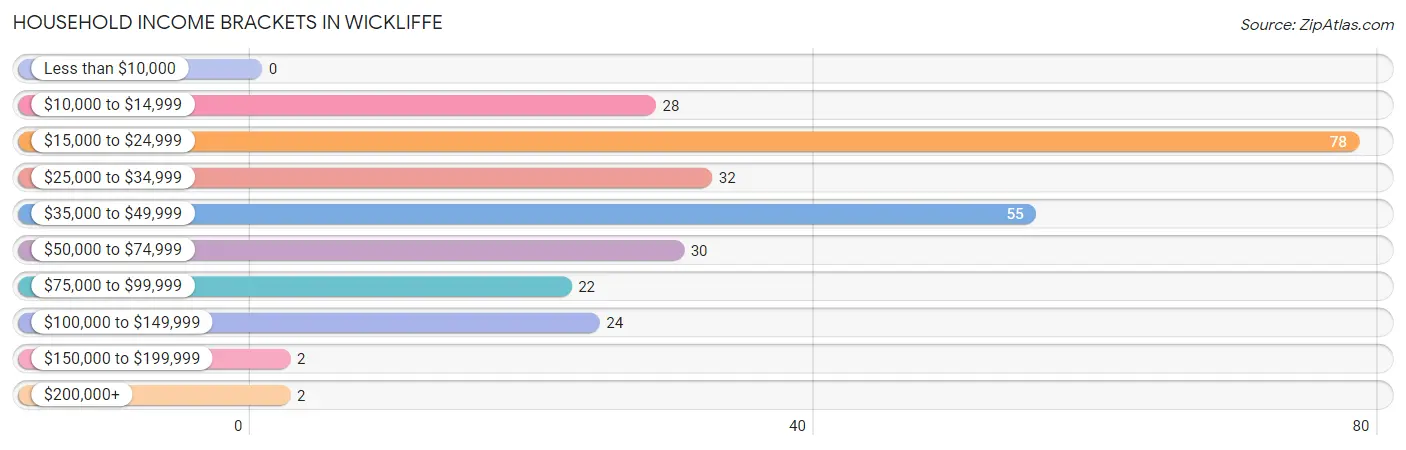
| Income Bracket | # Households | % Households |
| Less than $10,000 | 0 | 0.0% |
| $10,000 to $14,999 | 28 | 10.3% |
| $15,000 to $24,999 | 78 | 28.6% |
| $25,000 to $34,999 | 32 | 11.7% |
| $35,000 to $49,999 | 55 | 20.1% |
| $50,000 to $74,999 | 30 | 11.0% |
| $75,000 to $99,999 | 22 | 8.1% |
| $100,000 to $149,999 | 24 | 8.8% |
| $150,000 to $199,999 | 2 | 0.7% |
| $200,000+ | 2 | 0.7% |
Household Income by Householder Age in Wickliffe
The median household income in Wickliffe is $34,250, with the highest median household income of $38,500 found in the 65+ years age bracket for the primary householder. A total of 116 households (42.5%) fall into this category. Meanwhile, the 15 to 24 years age bracket for the primary householder has the lowest median household income of $0, with 7 households (2.6%) in this group.
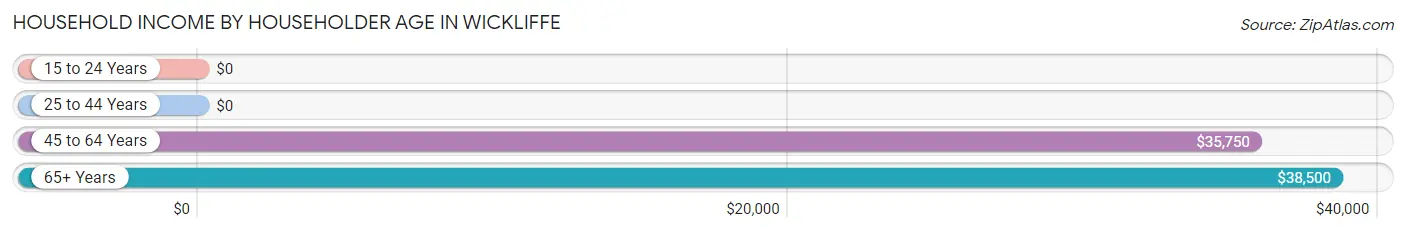
| Income Bracket | # Households | Median Income |
| 15 to 24 Years | 7 (2.6%) | $0 |
| 25 to 44 Years | 73 (26.7%) | $0 |
| 45 to 64 Years | 77 (28.2%) | $35,750 |
| 65+ Years | 116 (42.5%) | $38,500 |
| Total | 273 (100.0%) | $34,250 |
Poverty in Wickliffe
Income Below Poverty by Sex and Age in Wickliffe
With 32.9% poverty level for males and 29.1% for females among the residents of Wickliffe, 5 year old males and 18 to 24 year old females are the most vulnerable to poverty, with 4 males (100.0%) and 11 females (57.9%) in their respective age groups living below the poverty level.
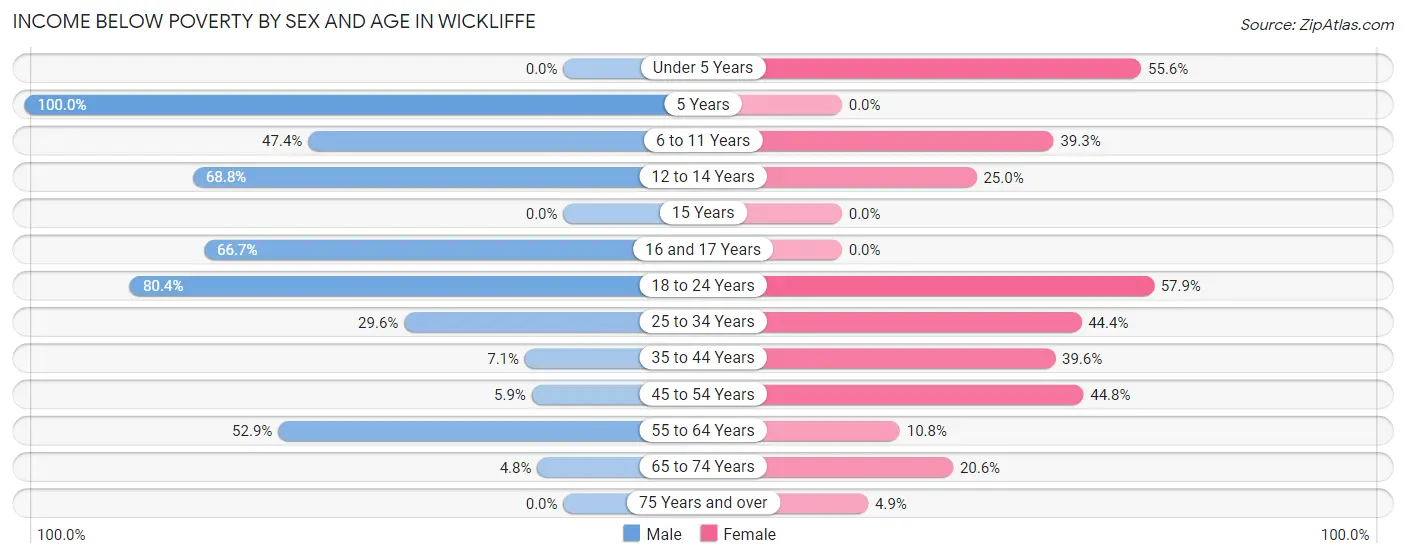
| Age Bracket | Male | Female |
| Under 5 Years | 0 (0.0%) | 15 (55.6%) |
| 5 Years | 4 (100.0%) | 0 (0.0%) |
| 6 to 11 Years | 9 (47.4%) | 11 (39.3%) |
| 12 to 14 Years | 11 (68.8%) | 3 (25.0%) |
| 15 Years | 0 (0.0%) | 0 (0.0%) |
| 16 and 17 Years | 14 (66.7%) | 0 (0.0%) |
| 18 to 24 Years | 37 (80.4%) | 11 (57.9%) |
| 25 to 34 Years | 13 (29.5%) | 8 (44.4%) |
| 35 to 44 Years | 2 (7.1%) | 19 (39.6%) |
| 45 to 54 Years | 2 (5.9%) | 13 (44.8%) |
| 55 to 64 Years | 9 (52.9%) | 7 (10.8%) |
| 65 to 74 Years | 3 (4.8%) | 13 (20.6%) |
| 75 Years and over | 0 (0.0%) | 2 (4.9%) |
| Total | 104 (32.9%) | 102 (29.1%) |
Income Above Poverty by Sex and Age in Wickliffe
According to the poverty statistics in Wickliffe, males aged under 5 years and females aged 75 years and over are the age groups that are most secure financially, with 100.0% of males and 95.1% of females in these age groups living above the poverty line.
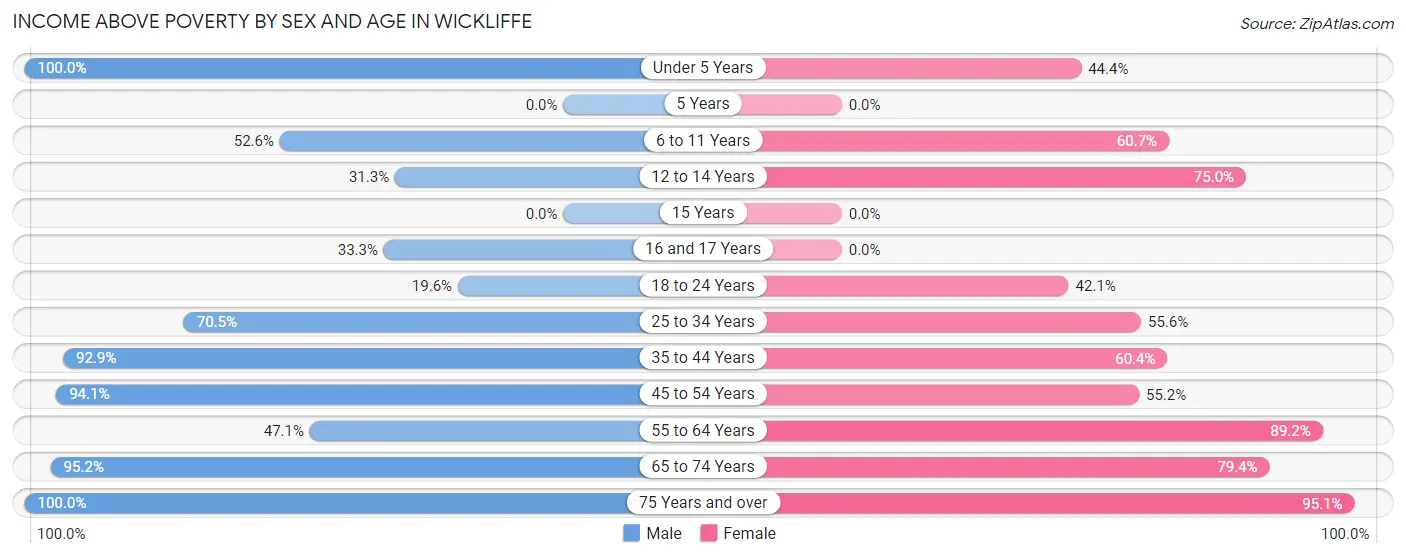
| Age Bracket | Male | Female |
| Under 5 Years | 7 (100.0%) | 12 (44.4%) |
| 5 Years | 0 (0.0%) | 0 (0.0%) |
| 6 to 11 Years | 10 (52.6%) | 17 (60.7%) |
| 12 to 14 Years | 5 (31.2%) | 9 (75.0%) |
| 15 Years | 0 (0.0%) | 0 (0.0%) |
| 16 and 17 Years | 7 (33.3%) | 0 (0.0%) |
| 18 to 24 Years | 9 (19.6%) | 8 (42.1%) |
| 25 to 34 Years | 31 (70.5%) | 10 (55.6%) |
| 35 to 44 Years | 26 (92.9%) | 29 (60.4%) |
| 45 to 54 Years | 32 (94.1%) | 16 (55.2%) |
| 55 to 64 Years | 8 (47.1%) | 58 (89.2%) |
| 65 to 74 Years | 59 (95.2%) | 50 (79.4%) |
| 75 Years and over | 18 (100.0%) | 39 (95.1%) |
| Total | 212 (67.1%) | 248 (70.9%) |
Income Below Poverty Among Married-Couple Families in Wickliffe
The poverty statistics for married-couple families in Wickliffe show that 10.7% or 9 of the total 84 families live below the poverty line. Families with 5 or more children have the highest poverty rate of 100.0%, comprising of 2 families. On the other hand, families with 1 or 2 children have the lowest poverty rate of 0.0%, which includes 0 families.
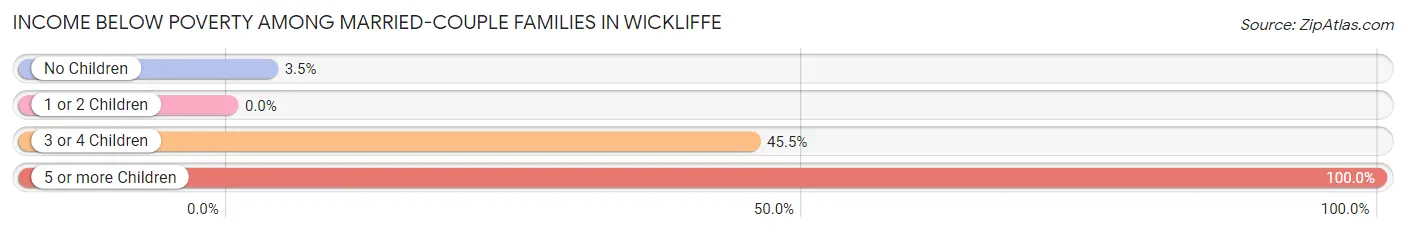
| Children | Above Poverty | Below Poverty |
| No Children | 56 (96.6%) | 2 (3.5%) |
| 1 or 2 Children | 13 (100.0%) | 0 (0.0%) |
| 3 or 4 Children | 6 (54.5%) | 5 (45.5%) |
| 5 or more Children | 0 (0.0%) | 2 (100.0%) |
| Total | 75 (89.3%) | 9 (10.7%) |
Income Below Poverty Among Single-Parent Households in Wickliffe
According to the poverty data in Wickliffe, 15.0% or 3 single-father households and 32.6% or 15 single-mother households are living below the poverty line. Among single-father households, those with 1 or 2 children have the highest poverty rate, with 3 households (100.0%) experiencing poverty. Likewise, among single-mother households, those with 1 or 2 children have the highest poverty rate, with 15 households (50.0%) falling below the poverty line.
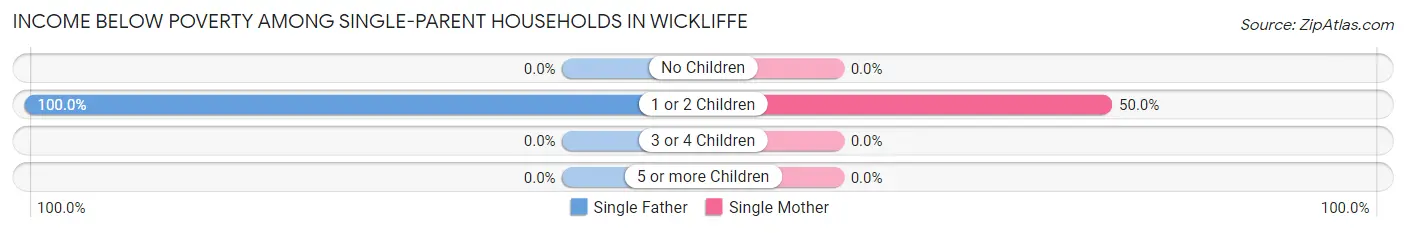
| Children | Single Father | Single Mother |
| No Children | 0 (0.0%) | 0 (0.0%) |
| 1 or 2 Children | 3 (100.0%) | 15 (50.0%) |
| 3 or 4 Children | 0 (0.0%) | 0 (0.0%) |
| 5 or more Children | 0 (0.0%) | 0 (0.0%) |
| Total | 3 (15.0%) | 15 (32.6%) |
Income Below Poverty Among Married-Couple vs Single-Parent Households in Wickliffe
The poverty data for Wickliffe shows that 9 of the married-couple family households (10.7%) and 18 of the single-parent households (27.3%) are living below the poverty level. Within the married-couple family households, those with 5 or more children have the highest poverty rate, with 2 households (100.0%) falling below the poverty line. Among the single-parent households, those with 1 or 2 children have the highest poverty rate, with 18 household (54.5%) living below poverty.
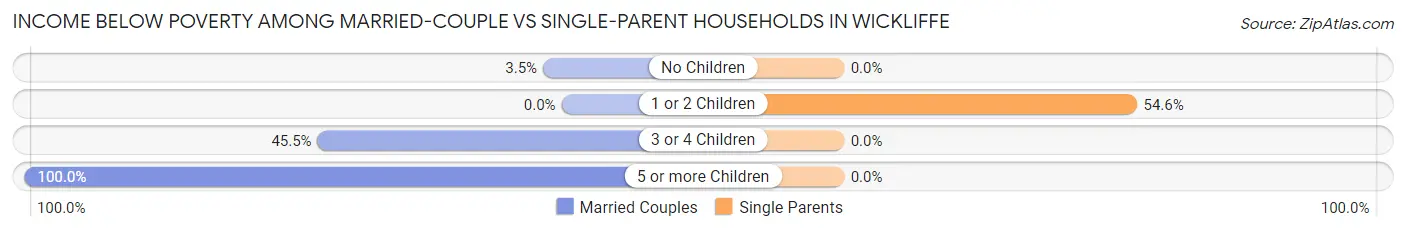
| Children | Married-Couple Families | Single-Parent Households |
| No Children | 2 (3.5%) | 0 (0.0%) |
| 1 or 2 Children | 0 (0.0%) | 18 (54.5%) |
| 3 or 4 Children | 5 (45.5%) | 0 (0.0%) |
| 5 or more Children | 2 (100.0%) | 0 (0.0%) |
| Total | 9 (10.7%) | 18 (27.3%) |
Race in Wickliffe
The most populous races in Wickliffe are White / Caucasian (587 | 80.7%), Black / African American (90 | 12.4%), and Two or more Races (48 | 6.6%).
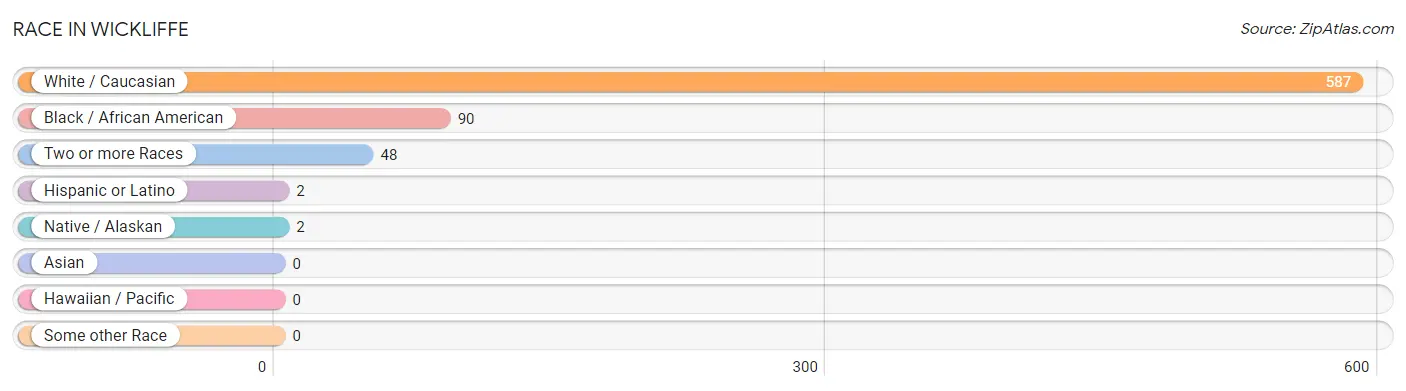
| Race | # Population | % Population |
| Asian | 0 | 0.0% |
| Black / African American | 90 | 12.4% |
| Hawaiian / Pacific | 0 | 0.0% |
| Hispanic or Latino | 2 | 0.3% |
| Native / Alaskan | 2 | 0.3% |
| White / Caucasian | 587 | 80.7% |
| Two or more Races | 48 | 6.6% |
| Some other Race | 0 | 0.0% |
| Total | 727 | 100.0% |
Ancestry in Wickliffe
The most populous ancestries reported in Wickliffe are English (204 | 28.1%), African (80 | 11.0%), Subsaharan African (80 | 11.0%), German (71 | 9.8%), and Irish (62 | 8.5%), together accounting for 68.4% of all Wickliffe residents.
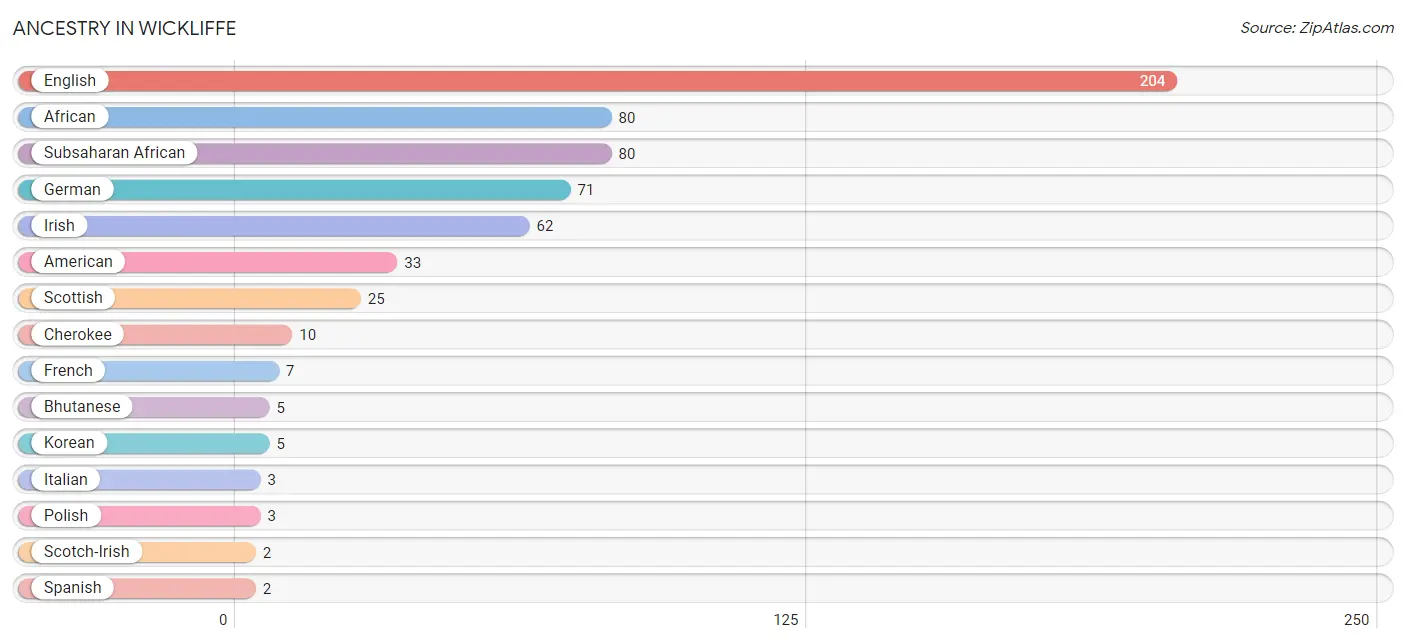
| Ancestry | # Population | % Population |
| African | 80 | 11.0% |
| American | 33 | 4.5% |
| Bhutanese | 5 | 0.7% |
| Cherokee | 10 | 1.4% |
| English | 204 | 28.1% |
| French | 7 | 1.0% |
| German | 71 | 9.8% |
| Irish | 62 | 8.5% |
| Italian | 3 | 0.4% |
| Korean | 5 | 0.7% |
| Polish | 3 | 0.4% |
| Scotch-Irish | 2 | 0.3% |
| Scottish | 25 | 3.4% |
| Spanish | 2 | 0.3% |
| Subsaharan African | 80 | 11.0% | View All 15 Rows |
Immigrants in Wickliffe

| Immigration Origin | # Population | % Population | View All 0 Rows |
Sex and Age in Wickliffe
Sex and Age in Wickliffe
The most populous age groups in Wickliffe are 20 to 24 Years (46 | 12.2%) for men and 60 to 64 Years (63 | 18.0%) for women.
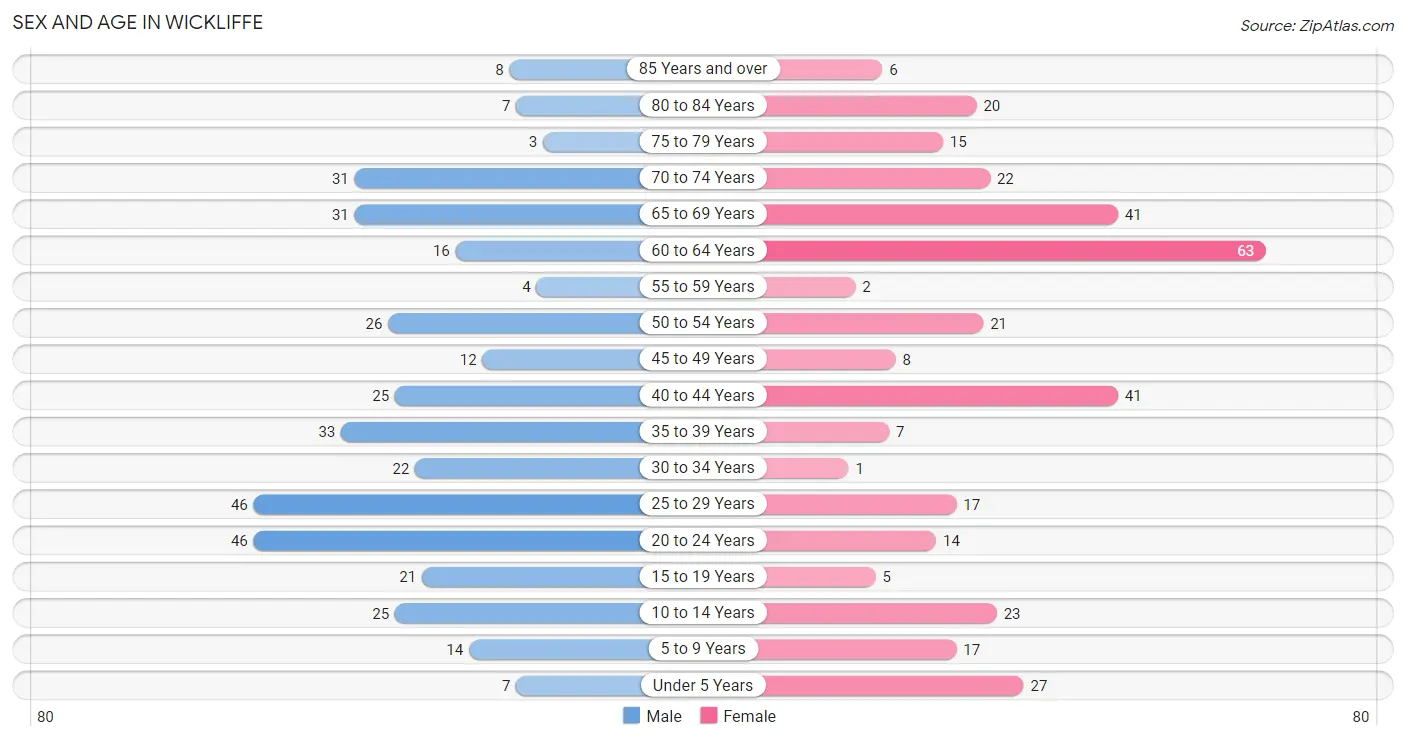
| Age Bracket | Male | Female |
| Under 5 Years | 7 (1.9%) | 27 (7.7%) |
| 5 to 9 Years | 14 (3.7%) | 17 (4.9%) |
| 10 to 14 Years | 25 (6.6%) | 23 (6.6%) |
| 15 to 19 Years | 21 (5.6%) | 5 (1.4%) |
| 20 to 24 Years | 46 (12.2%) | 14 (4.0%) |
| 25 to 29 Years | 46 (12.2%) | 17 (4.9%) |
| 30 to 34 Years | 22 (5.8%) | 1 (0.3%) |
| 35 to 39 Years | 33 (8.7%) | 7 (2.0%) |
| 40 to 44 Years | 25 (6.6%) | 41 (11.7%) |
| 45 to 49 Years | 12 (3.2%) | 8 (2.3%) |
| 50 to 54 Years | 26 (6.9%) | 21 (6.0%) |
| 55 to 59 Years | 4 (1.1%) | 2 (0.6%) |
| 60 to 64 Years | 16 (4.2%) | 63 (18.0%) |
| 65 to 69 Years | 31 (8.2%) | 41 (11.7%) |
| 70 to 74 Years | 31 (8.2%) | 22 (6.3%) |
| 75 to 79 Years | 3 (0.8%) | 15 (4.3%) |
| 80 to 84 Years | 7 (1.9%) | 20 (5.7%) |
| 85 Years and over | 8 (2.1%) | 6 (1.7%) |
| Total | 377 (100.0%) | 350 (100.0%) |
Families and Households in Wickliffe
Median Family Size in Wickliffe
The median family size in Wickliffe is 3.41 persons per family, with married-couple families (84 | 56.0%) accounting for the largest median family size of 3.56 persons per family. On the other hand, single male/father families (20 | 13.3%) represent the smallest median family size with 3.20 persons per family.
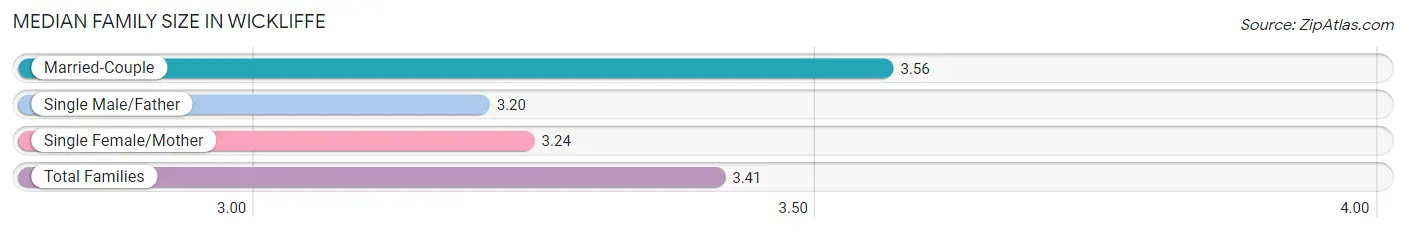
| Family Type | # Families | Family Size |
| Married-Couple | 84 (56.0%) | 3.56 |
| Single Male/Father | 20 (13.3%) | 3.20 |
| Single Female/Mother | 46 (30.7%) | 3.24 |
| Total Families | 150 (100.0%) | 3.41 |
Median Household Size in Wickliffe
The median household size in Wickliffe is 2.44 persons per household, with married-couple households (84 | 30.8%) accounting for the largest median household size of 3.69 persons per household. non-family households (123 | 45.1%) represent the smallest median household size with 1.15 persons per household.
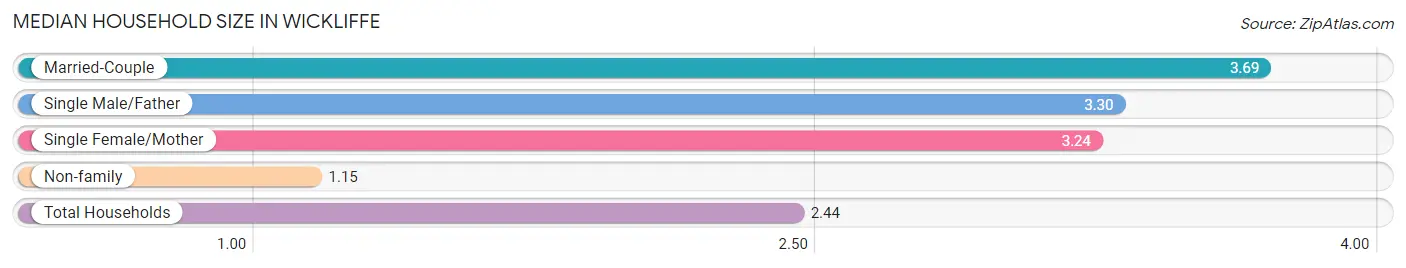
| Household Type | # Households | Household Size |
| Married-Couple | 84 (30.8%) | 3.69 |
| Single Male/Father | 20 (7.3%) | 3.30 |
| Single Female/Mother | 46 (16.9%) | 3.24 |
| Non-family | 123 (45.1%) | 1.15 |
| Total Households | 273 (100.0%) | 2.44 |
Household Size by Marriage Status in Wickliffe
Out of a total of 273 households in Wickliffe, 150 (54.9%) are family households, while 123 (45.1%) are nonfamily households. The most numerous type of family households are 2-person households, comprising 98, and the most common type of nonfamily households are 1-person households, comprising 97.
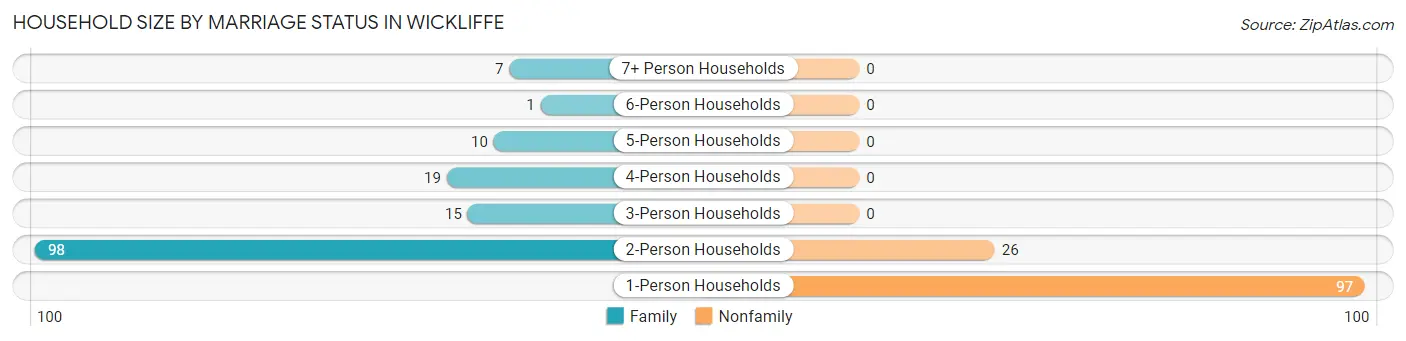
| Household Size | Family Households | Nonfamily Households |
| 1-Person Households | - | 97 (35.5%) |
| 2-Person Households | 98 (35.9%) | 26 (9.5%) |
| 3-Person Households | 15 (5.5%) | 0 (0.0%) |
| 4-Person Households | 19 (7.0%) | 0 (0.0%) |
| 5-Person Households | 10 (3.7%) | 0 (0.0%) |
| 6-Person Households | 1 (0.4%) | 0 (0.0%) |
| 7+ Person Households | 7 (2.6%) | 0 (0.0%) |
| Total | 150 (54.9%) | 123 (45.1%) |
Female Fertility in Wickliffe
Fertility by Age in Wickliffe
| Age Bracket | Women with Births | Births / 1,000 Women |
| 15 to 19 years | 0 (0.0%) | 0.0 |
| 20 to 34 years | 0 (0.0%) | 0.0 |
| 35 to 50 years | 0 (0.0%) | 0.0 |
| Total | 0 (0.0%) | 0.0 |
Fertility by Age by Marriage Status in Wickliffe
| Age Bracket | Married | Unmarried |
| 15 to 19 years | 0 (0.0%) | 0 (0.0%) |
| 20 to 34 years | 0 (0.0%) | 0 (0.0%) |
| 35 to 50 years | 0 (0.0%) | 0 (0.0%) |
| Total | 0 (0.0%) | 0 (0.0%) |
Fertility by Education in Wickliffe
| Educational Attainment | Women with Births | Births / 1,000 Women |
| Less than High School | 0 (0.0%) | 0.0 |
| High School Diploma | 0 (0.0%) | 0.0 |
| College or Associate's Degree | 0 (0.0%) | 0.0 |
| Bachelor's Degree | 0 (0.0%) | 0.0 |
| Graduate Degree | 0 (0.0%) | 0.0 |
| Total | 0 (0.0%) | 0.0 |
Fertility by Education by Marriage Status in Wickliffe
| Educational Attainment | Married | Unmarried |
| Less than High School | 0 (0.0%) | 0 (0.0%) |
| High School Diploma | 0 (0.0%) | 0 (0.0%) |
| College or Associate's Degree | 0 (0.0%) | 0 (0.0%) |
| Bachelor's Degree | 0 (0.0%) | 0 (0.0%) |
| Graduate Degree | 0 (0.0%) | 0 (0.0%) |
| Total | 0 (0.0%) | 0 (0.0%) |
Employment Characteristics in Wickliffe
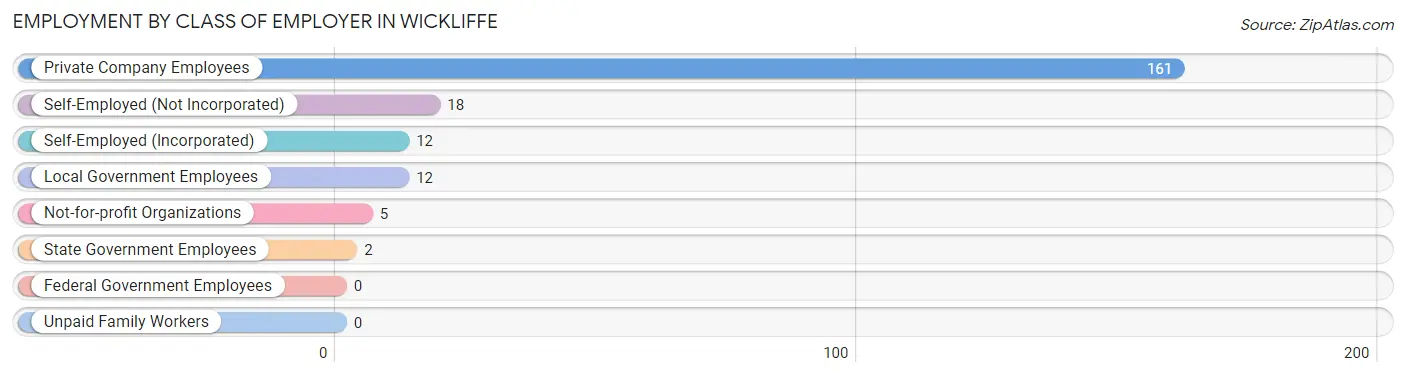
Employment by Class of Employer in Wickliffe
Among the 210 employed individuals in Wickliffe, private company employees (161 | 76.7%), self-employed (not incorporated) (18 | 8.6%), and self-employed (incorporated) (12 | 5.7%) make up the most common classes of employment.
| Employer Class | # Employees | % Employees |
| Private Company Employees | 161 | 76.7% |
| Self-Employed (Incorporated) | 12 | 5.7% |
| Self-Employed (Not Incorporated) | 18 | 8.6% |
| Not-for-profit Organizations | 5 | 2.4% |
| Local Government Employees | 12 | 5.7% |
| State Government Employees | 2 | 0.9% |
| Federal Government Employees | 0 | 0.0% |
| Unpaid Family Workers | 0 | 0.0% |
| Total | 210 | 100.0% |
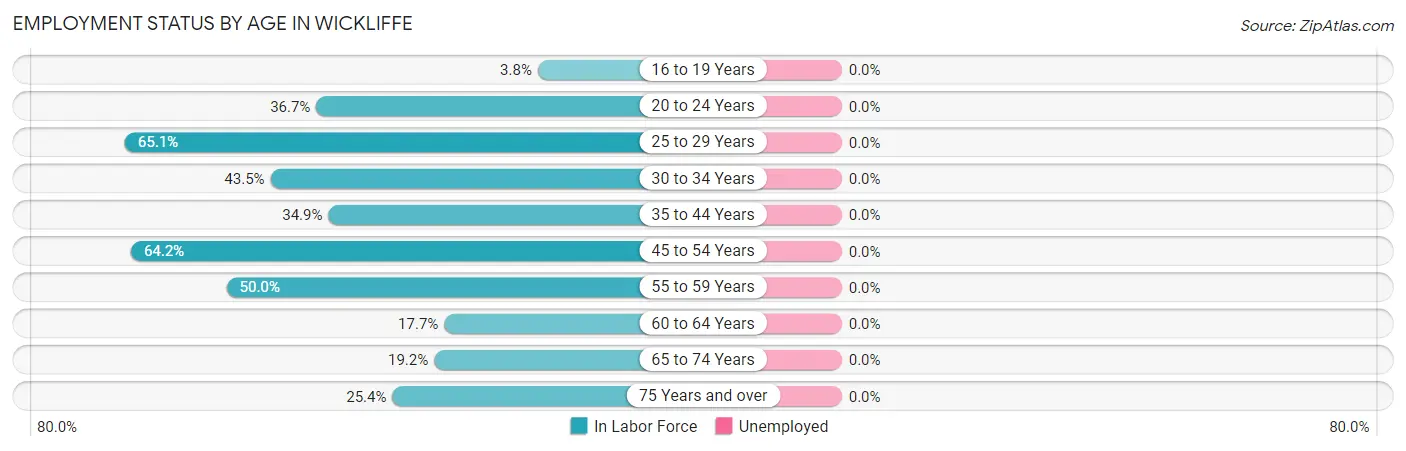
Employment Status by Age in Wickliffe
| Age Bracket | In Labor Force | Unemployed |
| 16 to 19 Years | 1 (3.8%) | 0 (0.0%) |
| 20 to 24 Years | 22 (36.7%) | 0 (0.0%) |
| 25 to 29 Years | 41 (65.1%) | 0 (0.0%) |
| 30 to 34 Years | 10 (43.5%) | 0 (0.0%) |
| 35 to 44 Years | 37 (34.9%) | 0 (0.0%) |
| 45 to 54 Years | 43 (64.2%) | 0 (0.0%) |
| 55 to 59 Years | 3 (50.0%) | 0 (0.0%) |
| 60 to 64 Years | 14 (17.7%) | 0 (0.0%) |
| 65 to 74 Years | 24 (19.2%) | 0 (0.0%) |
| 75 Years and over | 15 (25.4%) | 0 (0.0%) |
| Total | 210 (34.2%) | 0 (0.0%) |
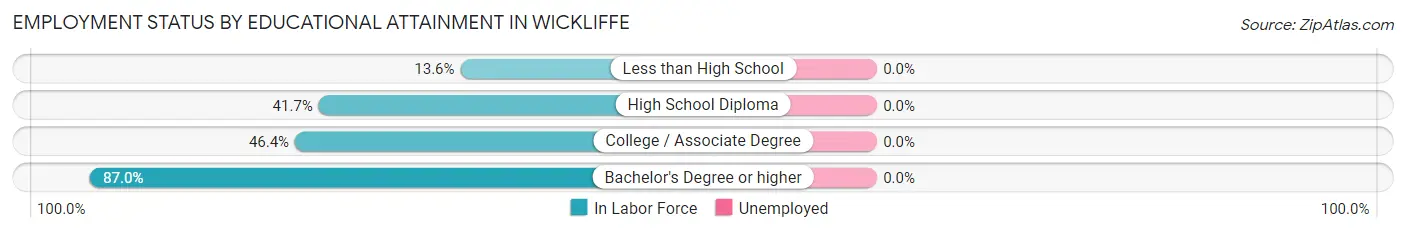
Employment Status by Educational Attainment in Wickliffe
| Educational Attainment | In Labor Force | Unemployed |
| Less than High School | 6 (13.6%) | 0 (0.0%) |
| High School Diploma | 58 (41.7%) | 0 (0.0%) |
| College / Associate Degree | 64 (46.4%) | 0 (0.0%) |
| Bachelor's Degree or higher | 20 (87.0%) | 0 (0.0%) |
| Total | 148 (43.0%) | 0 (0.0%) |
Employment Occupations by Sex in Wickliffe
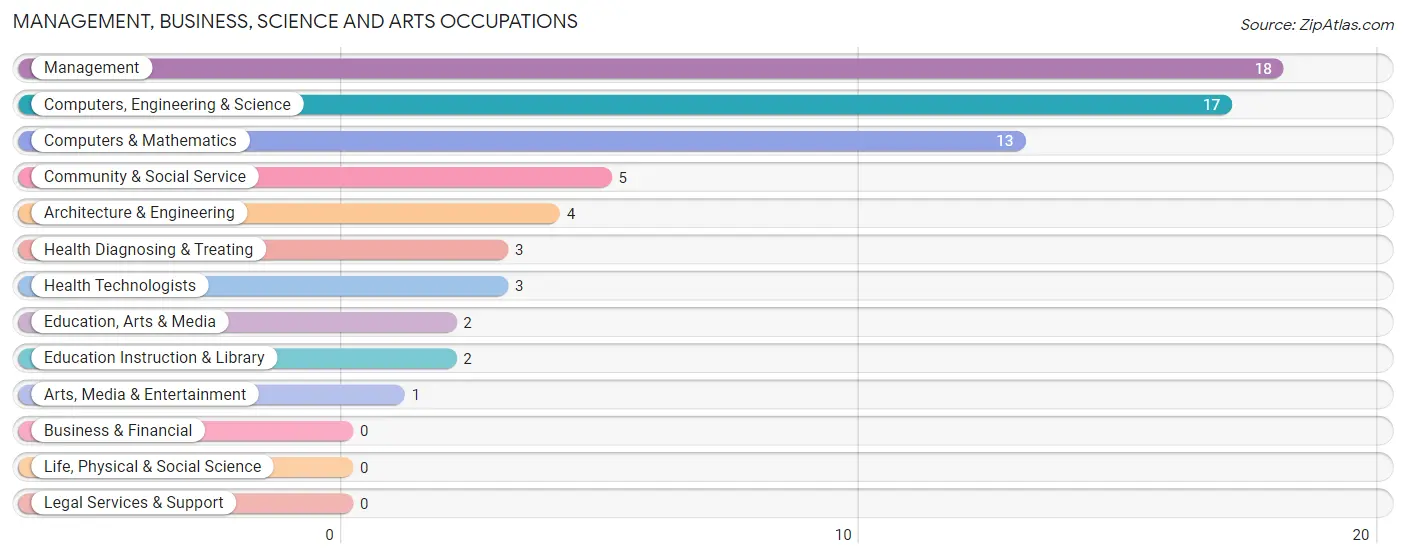
Management, Business, Science and Arts Occupations
The most common Management, Business, Science and Arts occupations in Wickliffe are Management (18 | 8.6%), Computers, Engineering & Science (17 | 8.1%), Computers & Mathematics (13 | 6.2%), Community & Social Service (5 | 2.4%), and Architecture & Engineering (4 | 1.9%).
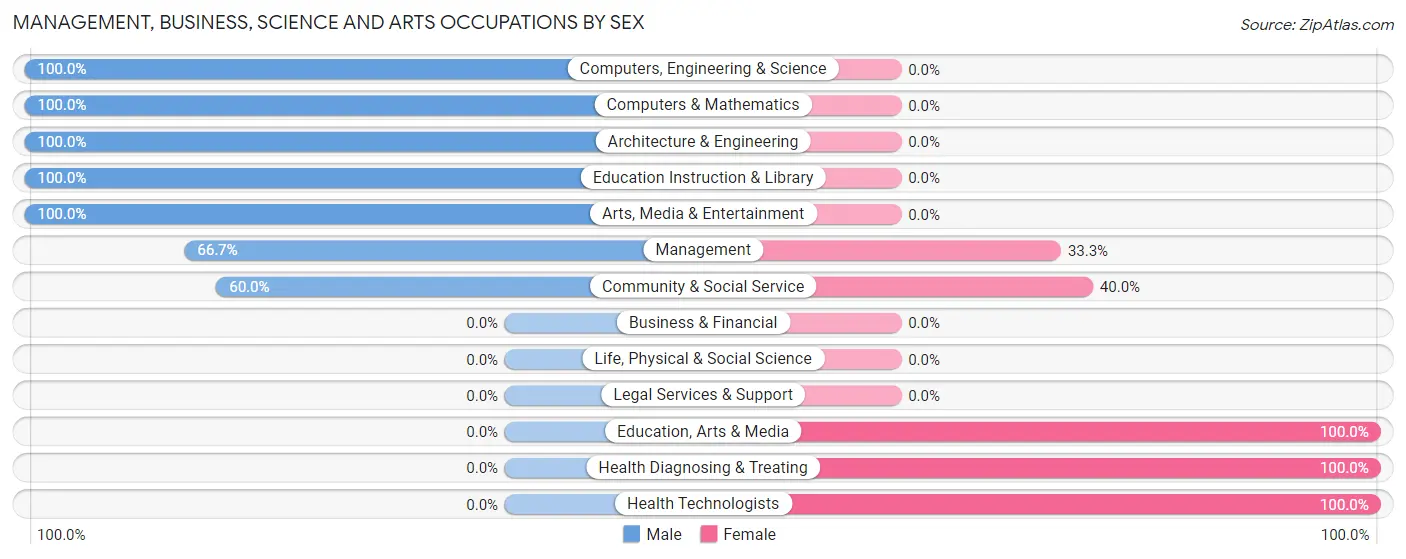
Management, Business, Science and Arts Occupations by Sex
Within the Management, Business, Science and Arts occupations in Wickliffe, the most male-oriented occupations are Computers, Engineering & Science (100.0%), Computers & Mathematics (100.0%), and Architecture & Engineering (100.0%), while the most female-oriented occupations are Education, Arts & Media (100.0%), Health Diagnosing & Treating (100.0%), and Health Technologists (100.0%).
| Occupation | Male | Female |
| Management | 12 (66.7%) | 6 (33.3%) |
| Business & Financial | 0 (0.0%) | 0 (0.0%) |
| Computers, Engineering & Science | 17 (100.0%) | 0 (0.0%) |
| Computers & Mathematics | 13 (100.0%) | 0 (0.0%) |
| Architecture & Engineering | 4 (100.0%) | 0 (0.0%) |
| Life, Physical & Social Science | 0 (0.0%) | 0 (0.0%) |
| Community & Social Service | 3 (60.0%) | 2 (40.0%) |
| Education, Arts & Media | 0 (0.0%) | 2 (100.0%) |
| Legal Services & Support | 0 (0.0%) | 0 (0.0%) |
| Education Instruction & Library | 2 (100.0%) | 0 (0.0%) |
| Arts, Media & Entertainment | 1 (100.0%) | 0 (0.0%) |
| Health Diagnosing & Treating | 0 (0.0%) | 3 (100.0%) |
| Health Technologists | 0 (0.0%) | 3 (100.0%) |
| Total (Category) | 32 (74.4%) | 11 (25.6%) |
| Total (Overall) | 139 (66.2%) | 71 (33.8%) |
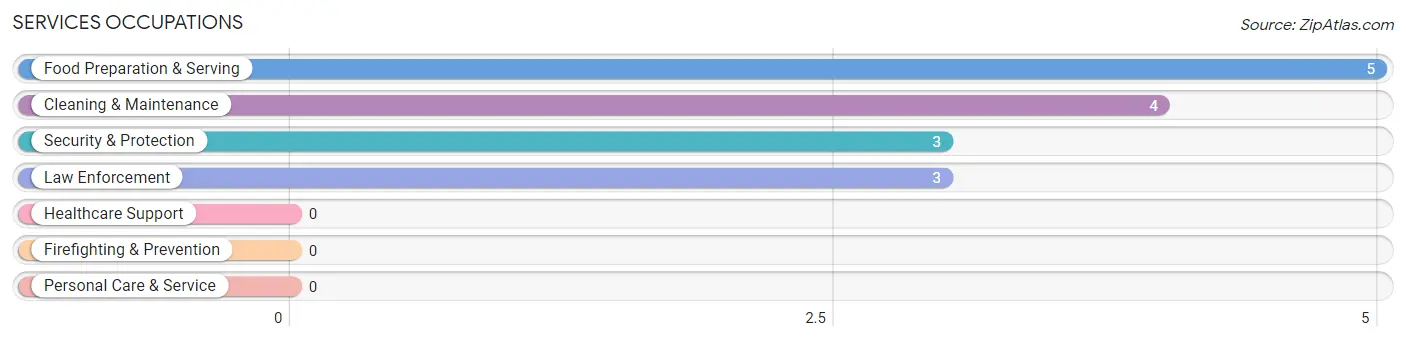
Services Occupations
The most common Services occupations in Wickliffe are Food Preparation & Serving (5 | 2.4%), Cleaning & Maintenance (4 | 1.9%), Security & Protection (3 | 1.4%), and Law Enforcement (3 | 1.4%).
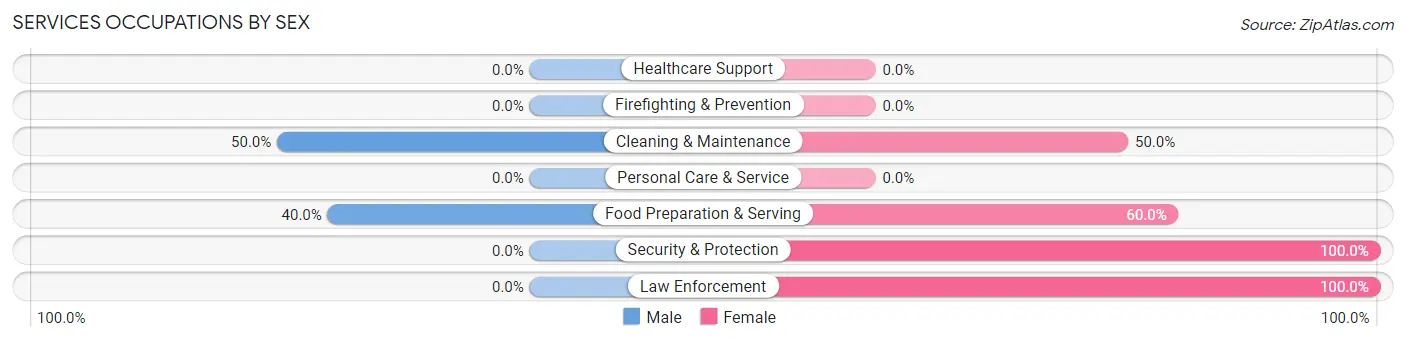
Services Occupations by Sex
Within the Services occupations in Wickliffe, the most male-oriented occupations are Cleaning & Maintenance (50.0%), and Food Preparation & Serving (40.0%), while the most female-oriented occupations are Security & Protection (100.0%), Law Enforcement (100.0%), and Food Preparation & Serving (60.0%).
| Occupation | Male | Female |
| Healthcare Support | 0 (0.0%) | 0 (0.0%) |
| Security & Protection | 0 (0.0%) | 3 (100.0%) |
| Firefighting & Prevention | 0 (0.0%) | 0 (0.0%) |
| Law Enforcement | 0 (0.0%) | 3 (100.0%) |
| Food Preparation & Serving | 2 (40.0%) | 3 (60.0%) |
| Cleaning & Maintenance | 2 (50.0%) | 2 (50.0%) |
| Personal Care & Service | 0 (0.0%) | 0 (0.0%) |
| Total (Category) | 4 (33.3%) | 8 (66.7%) |
| Total (Overall) | 139 (66.2%) | 71 (33.8%) |
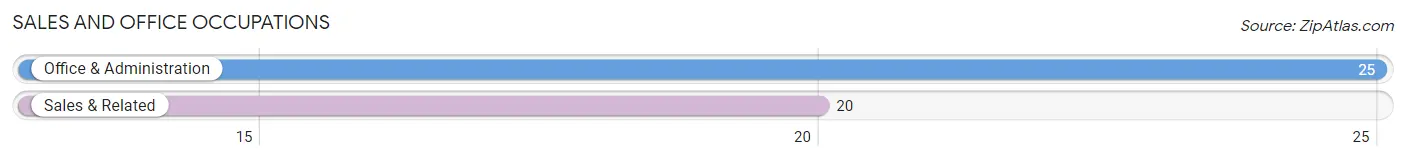
Sales and Office Occupations
The most common Sales and Office occupations in Wickliffe are Office & Administration (25 | 11.9%), and Sales & Related (20 | 9.5%).
Sales and Office Occupations by Sex
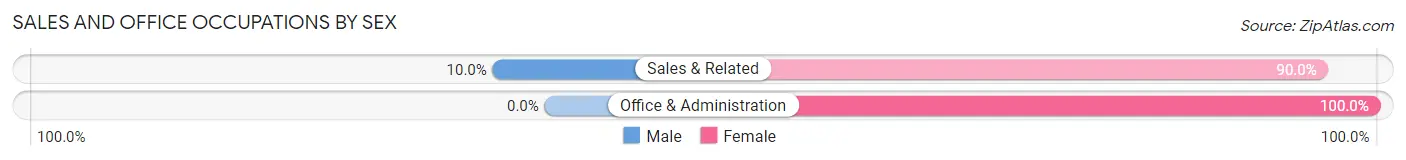
| Occupation | Male | Female |
| Sales & Related | 2 (10.0%) | 18 (90.0%) |
| Office & Administration | 0 (0.0%) | 25 (100.0%) |
| Total (Category) | 2 (4.4%) | 43 (95.6%) |
| Total (Overall) | 139 (66.2%) | 71 (33.8%) |
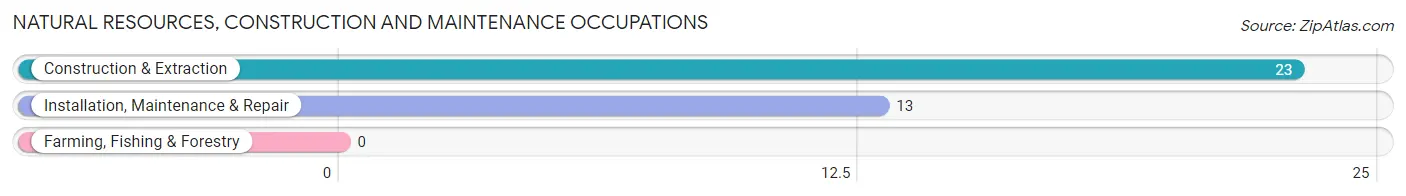
Natural Resources, Construction and Maintenance Occupations
The most common Natural Resources, Construction and Maintenance occupations in Wickliffe are Construction & Extraction (23 | 11.0%), and Installation, Maintenance & Repair (13 | 6.2%).
Natural Resources, Construction and Maintenance Occupations by Sex
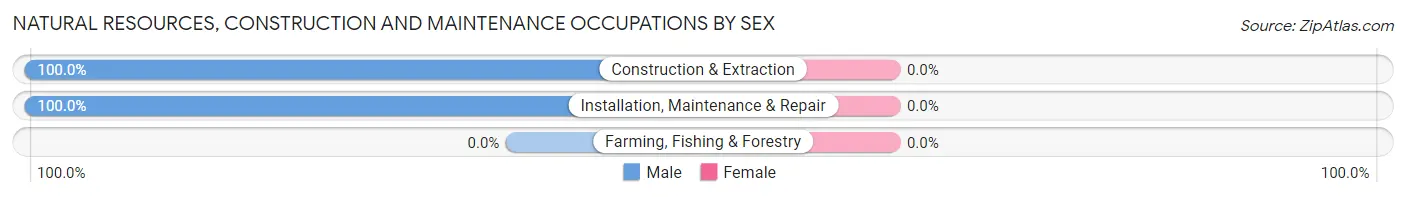
| Occupation | Male | Female |
| Farming, Fishing & Forestry | 0 (0.0%) | 0 (0.0%) |
| Construction & Extraction | 23 (100.0%) | 0 (0.0%) |
| Installation, Maintenance & Repair | 13 (100.0%) | 0 (0.0%) |
| Total (Category) | 36 (100.0%) | 0 (0.0%) |
| Total (Overall) | 139 (66.2%) | 71 (33.8%) |
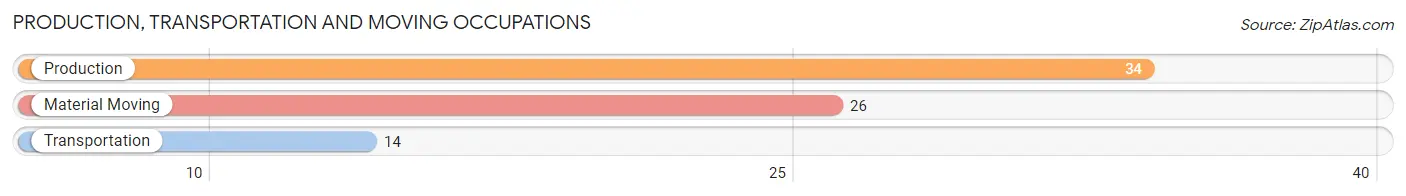
Production, Transportation and Moving Occupations
The most common Production, Transportation and Moving occupations in Wickliffe are Production (34 | 16.2%), Material Moving (26 | 12.4%), and Transportation (14 | 6.7%).
Production, Transportation and Moving Occupations by Sex
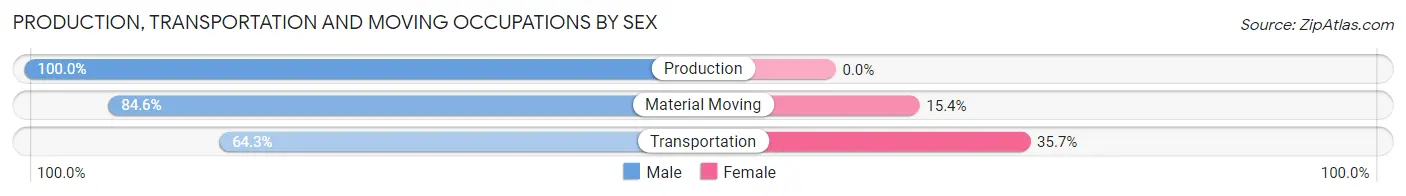
| Occupation | Male | Female |
| Production | 34 (100.0%) | 0 (0.0%) |
| Transportation | 9 (64.3%) | 5 (35.7%) |
| Material Moving | 22 (84.6%) | 4 (15.4%) |
| Total (Category) | 65 (87.8%) | 9 (12.2%) |
| Total (Overall) | 139 (66.2%) | 71 (33.8%) |
Employment Industries by Sex in Wickliffe
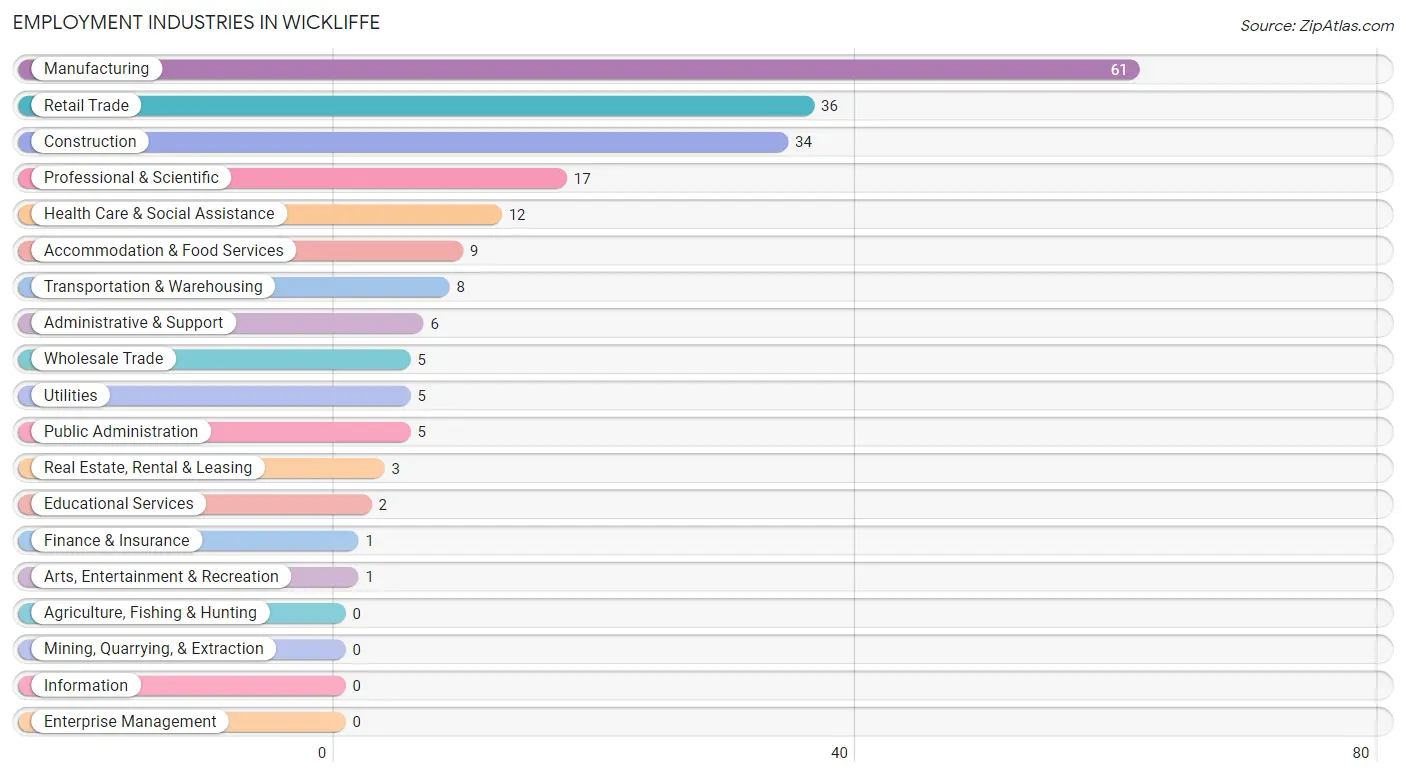
Employment Industries in Wickliffe
The major employment industries in Wickliffe include Manufacturing (61 | 29.0%), Retail Trade (36 | 17.1%), Construction (34 | 16.2%), Professional & Scientific (17 | 8.1%), and Health Care & Social Assistance (12 | 5.7%).
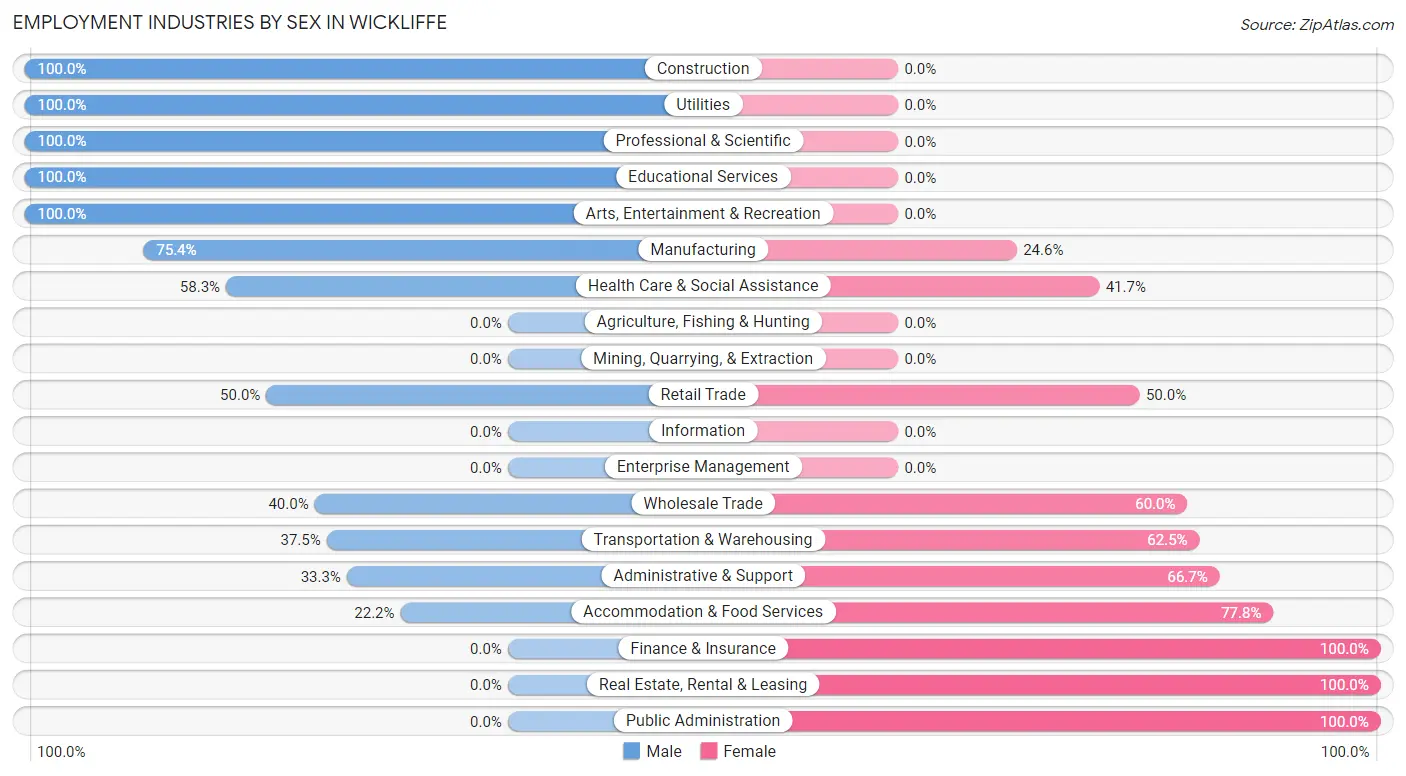
Employment Industries by Sex in Wickliffe
The Wickliffe industries that see more men than women are Construction (100.0%), Utilities (100.0%), and Professional & Scientific (100.0%), whereas the industries that tend to have a higher number of women are Finance & Insurance (100.0%), Real Estate, Rental & Leasing (100.0%), and Public Administration (100.0%).
| Industry | Male | Female |
| Agriculture, Fishing & Hunting | 0 (0.0%) | 0 (0.0%) |
| Mining, Quarrying, & Extraction | 0 (0.0%) | 0 (0.0%) |
| Construction | 34 (100.0%) | 0 (0.0%) |
| Manufacturing | 46 (75.4%) | 15 (24.6%) |
| Wholesale Trade | 2 (40.0%) | 3 (60.0%) |
| Retail Trade | 18 (50.0%) | 18 (50.0%) |
| Transportation & Warehousing | 3 (37.5%) | 5 (62.5%) |
| Utilities | 5 (100.0%) | 0 (0.0%) |
| Information | 0 (0.0%) | 0 (0.0%) |
| Finance & Insurance | 0 (0.0%) | 1 (100.0%) |
| Real Estate, Rental & Leasing | 0 (0.0%) | 3 (100.0%) |
| Professional & Scientific | 17 (100.0%) | 0 (0.0%) |
| Enterprise Management | 0 (0.0%) | 0 (0.0%) |
| Administrative & Support | 2 (33.3%) | 4 (66.7%) |
| Educational Services | 2 (100.0%) | 0 (0.0%) |
| Health Care & Social Assistance | 7 (58.3%) | 5 (41.7%) |
| Arts, Entertainment & Recreation | 1 (100.0%) | 0 (0.0%) |
| Accommodation & Food Services | 2 (22.2%) | 7 (77.8%) |
| Public Administration | 0 (0.0%) | 5 (100.0%) |
| Total | 139 (66.2%) | 71 (33.8%) |
Education in Wickliffe
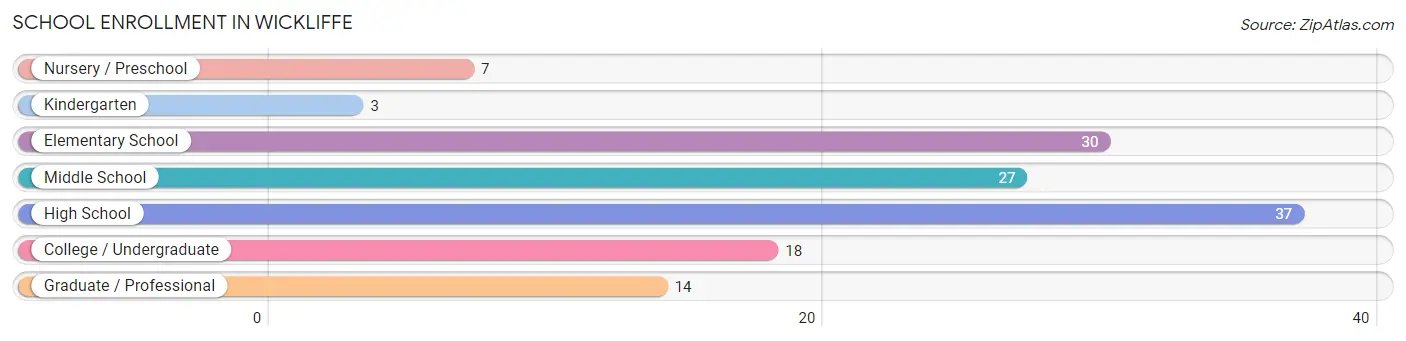
School Enrollment in Wickliffe
The most common levels of schooling among the 136 students in Wickliffe are high school (37 | 27.2%), elementary school (30 | 22.1%), and middle school (27 | 19.9%).
| School Level | # Students | % Students |
| Nursery / Preschool | 7 | 5.1% |
| Kindergarten | 3 | 2.2% |
| Elementary School | 30 | 22.1% |
| Middle School | 27 | 19.9% |
| High School | 37 | 27.2% |
| College / Undergraduate | 18 | 13.2% |
| Graduate / Professional | 14 | 10.3% |
| Total | 136 | 100.0% |
School Enrollment by Age by Funding Source in Wickliffe
Out of a total of 136 students who are enrolled in schools in Wickliffe, 28 (20.6%) attend a private institution, while the remaining 108 (79.4%) are enrolled in public schools. The age group of 20 to 24 year olds has the highest likelihood of being enrolled in private schools, with 7 (100.0% in the age bracket) enrolled. Conversely, the age group of 3 to 4 year olds has the lowest likelihood of being enrolled in a private school, with 7 (100.0% in the age bracket) attending a public institution.
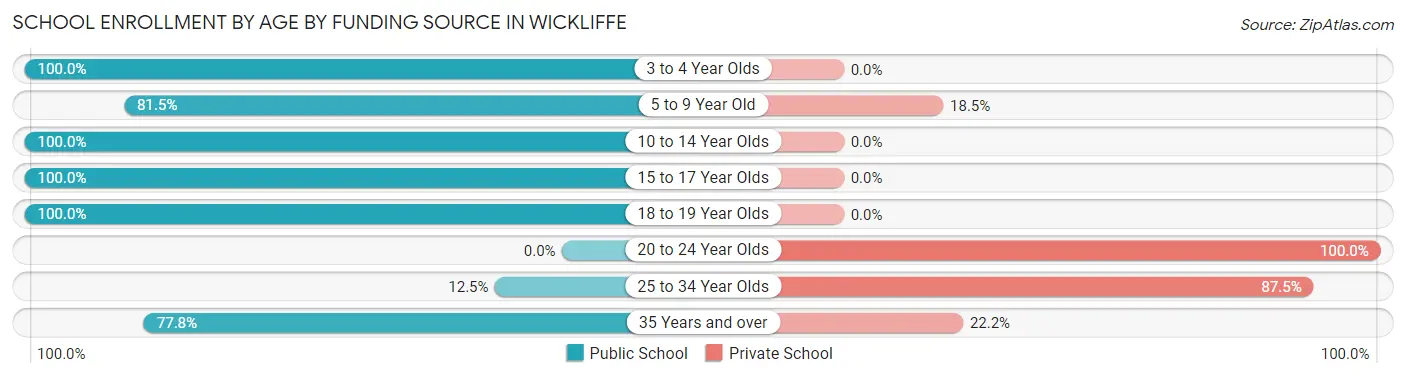
| Age Bracket | Public School | Private School |
| 3 to 4 Year Olds | 7 (100.0%) | 0 (0.0%) |
| 5 to 9 Year Old | 22 (81.5%) | 5 (18.5%) |
| 10 to 14 Year Olds | 48 (100.0%) | 0 (0.0%) |
| 15 to 17 Year Olds | 21 (100.0%) | 0 (0.0%) |
| 18 to 19 Year Olds | 1 (100.0%) | 0 (0.0%) |
| 20 to 24 Year Olds | 0 (0.0%) | 7 (100.0%) |
| 25 to 34 Year Olds | 2 (12.5%) | 14 (87.5%) |
| 35 Years and over | 7 (77.8%) | 2 (22.2%) |
| Total | 108 (79.4%) | 28 (20.6%) |
Educational Attainment by Field of Study in Wickliffe
Education (15 | 29.4%), arts & humanities (14 | 27.5%), science & technology (6 | 11.8%), bio, nature & agricultural (5 | 9.8%), and literature & languages (5 | 9.8%) are the most common fields of study among 51 individuals in Wickliffe who have obtained a bachelor's degree or higher.
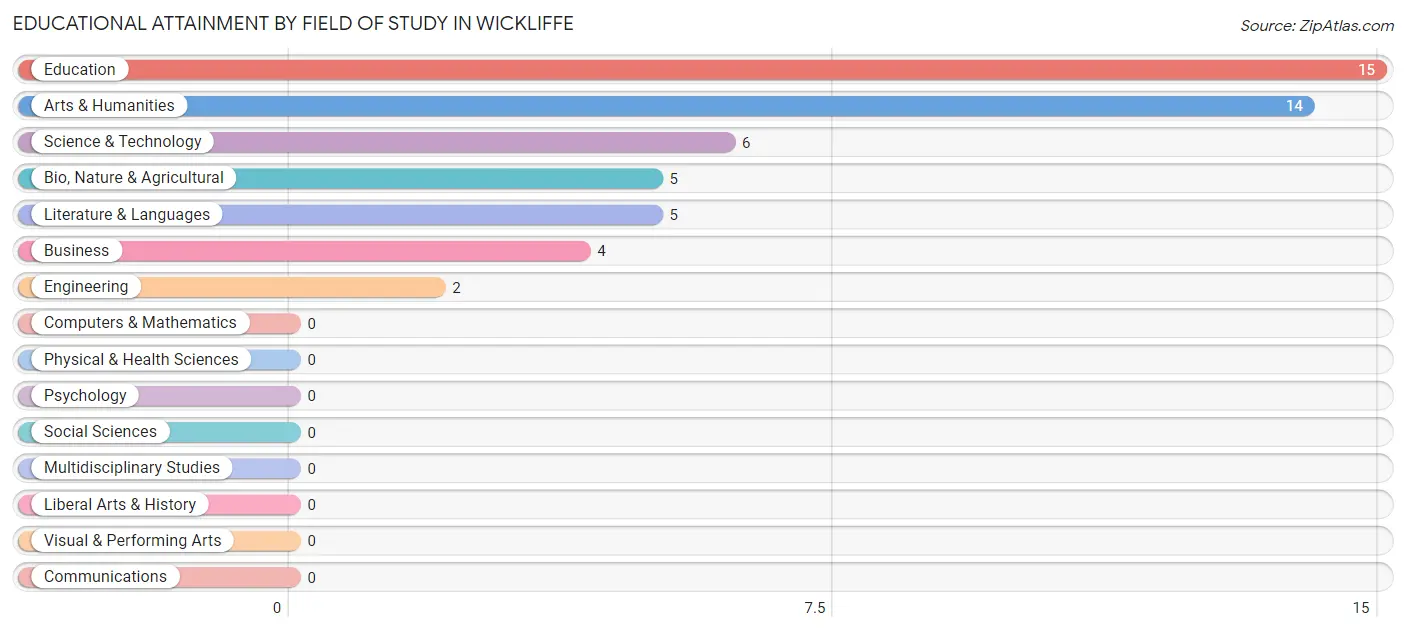
| Field of Study | # Graduates | % Graduates |
| Computers & Mathematics | 0 | 0.0% |
| Bio, Nature & Agricultural | 5 | 9.8% |
| Physical & Health Sciences | 0 | 0.0% |
| Psychology | 0 | 0.0% |
| Social Sciences | 0 | 0.0% |
| Engineering | 2 | 3.9% |
| Multidisciplinary Studies | 0 | 0.0% |
| Science & Technology | 6 | 11.8% |
| Business | 4 | 7.8% |
| Education | 15 | 29.4% |
| Literature & Languages | 5 | 9.8% |
| Liberal Arts & History | 0 | 0.0% |
| Visual & Performing Arts | 0 | 0.0% |
| Communications | 0 | 0.0% |
| Arts & Humanities | 14 | 27.5% |
| Total | 51 | 100.0% |
Transportation & Commute in Wickliffe
Vehicle Availability by Sex in Wickliffe
The most prevalent vehicle ownership categories in Wickliffe are males with 3 vehicles (46, accounting for 33.1%) and females with 3 vehicles (13, making up 64.8%).
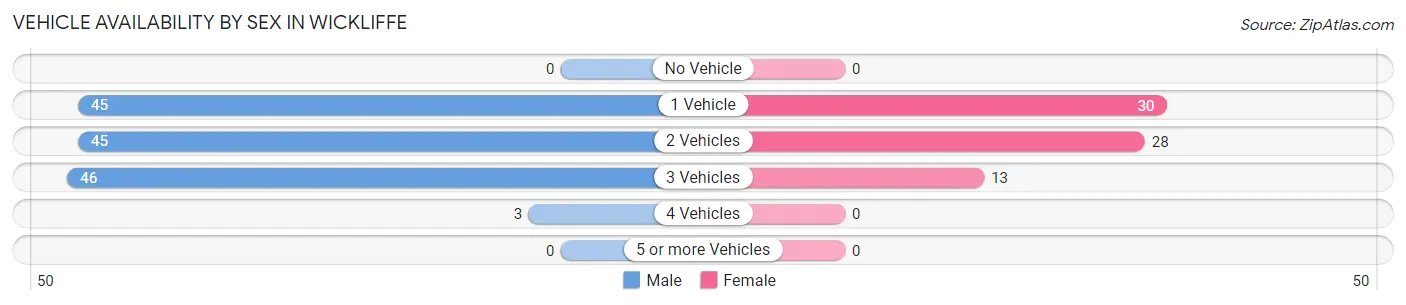
| Vehicles Available | Male | Female |
| No Vehicle | 0 (0.0%) | 0 (0.0%) |
| 1 Vehicle | 45 (32.4%) | 30 (42.2%) |
| 2 Vehicles | 45 (32.4%) | 28 (39.4%) |
| 3 Vehicles | 46 (33.1%) | 13 (18.3%) |
| 4 Vehicles | 3 (2.2%) | 0 (0.0%) |
| 5 or more Vehicles | 0 (0.0%) | 0 (0.0%) |
| Total | 139 (100.0%) | 71 (100.0%) |
Commute Time in Wickliffe
The most frequently occuring commute durations in Wickliffe are 5 to 9 minutes (44 commuters, 21.1%), 15 to 19 minutes (36 commuters, 17.3%), and 45 to 59 minutes (27 commuters, 13.0%).
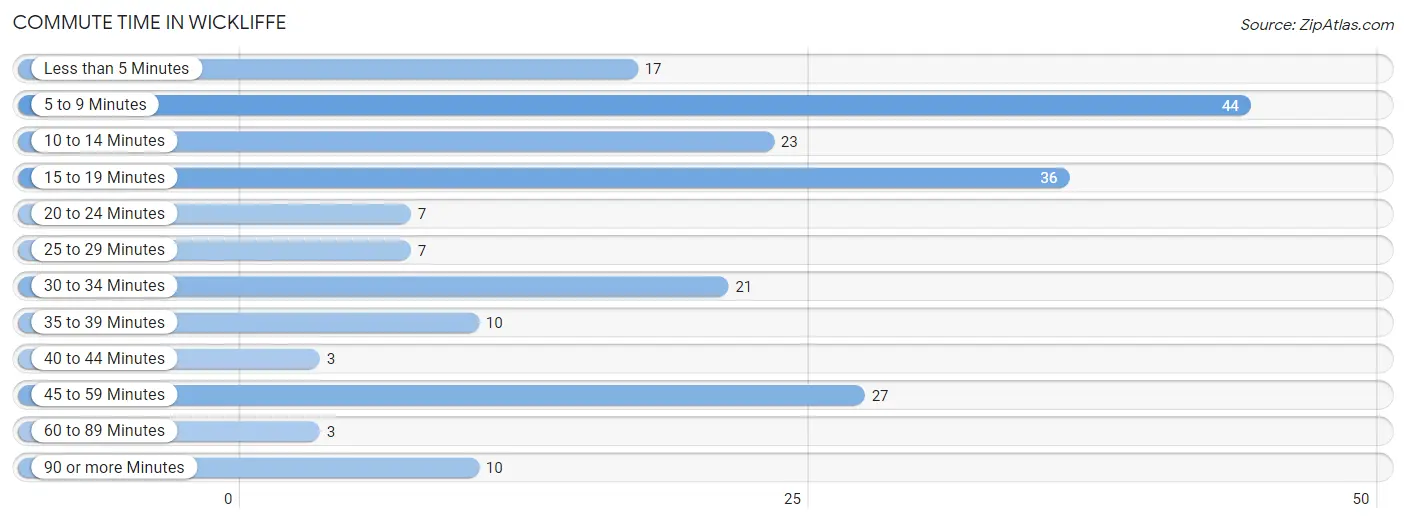
| Commute Time | # Commuters | % Commuters |
| Less than 5 Minutes | 17 | 8.2% |
| 5 to 9 Minutes | 44 | 21.1% |
| 10 to 14 Minutes | 23 | 11.1% |
| 15 to 19 Minutes | 36 | 17.3% |
| 20 to 24 Minutes | 7 | 3.4% |
| 25 to 29 Minutes | 7 | 3.4% |
| 30 to 34 Minutes | 21 | 10.1% |
| 35 to 39 Minutes | 10 | 4.8% |
| 40 to 44 Minutes | 3 | 1.4% |
| 45 to 59 Minutes | 27 | 13.0% |
| 60 to 89 Minutes | 3 | 1.4% |
| 90 or more Minutes | 10 | 4.8% |
Commute Time by Sex in Wickliffe
The most common commute times in Wickliffe are 15 to 19 minutes (30 commuters, 21.9%) for males and 5 to 9 minutes (20 commuters, 28.2%) for females.
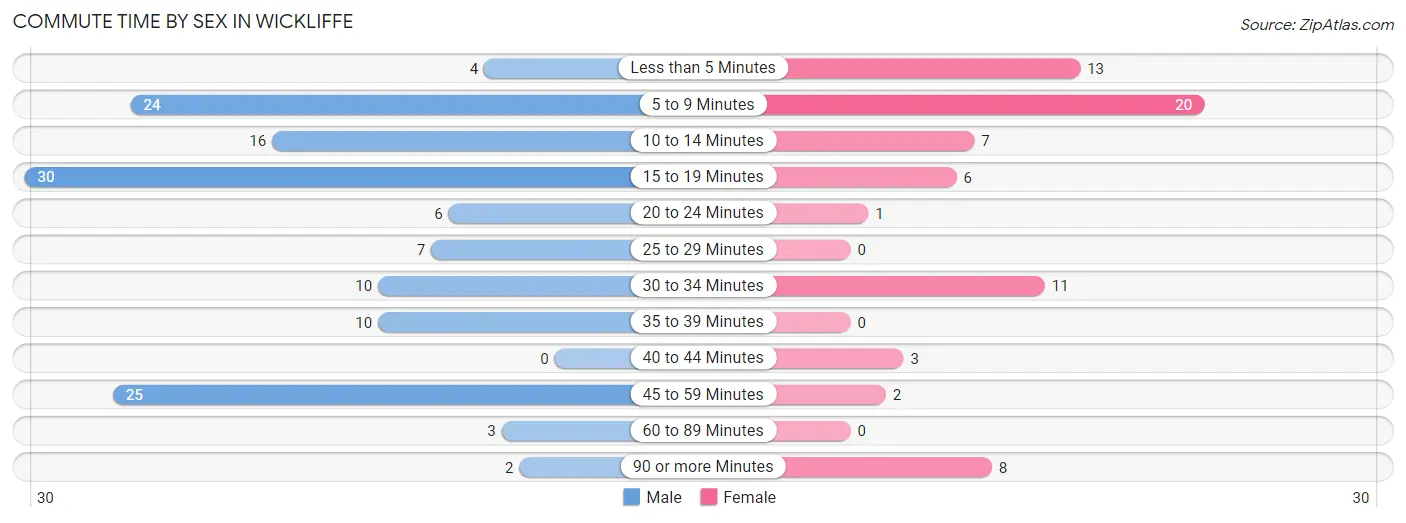
| Commute Time | Male | Female |
| Less than 5 Minutes | 4 (2.9%) | 13 (18.3%) |
| 5 to 9 Minutes | 24 (17.5%) | 20 (28.2%) |
| 10 to 14 Minutes | 16 (11.7%) | 7 (9.9%) |
| 15 to 19 Minutes | 30 (21.9%) | 6 (8.5%) |
| 20 to 24 Minutes | 6 (4.4%) | 1 (1.4%) |
| 25 to 29 Minutes | 7 (5.1%) | 0 (0.0%) |
| 30 to 34 Minutes | 10 (7.3%) | 11 (15.5%) |
| 35 to 39 Minutes | 10 (7.3%) | 0 (0.0%) |
| 40 to 44 Minutes | 0 (0.0%) | 3 (4.2%) |
| 45 to 59 Minutes | 25 (18.2%) | 2 (2.8%) |
| 60 to 89 Minutes | 3 (2.2%) | 0 (0.0%) |
| 90 or more Minutes | 2 (1.5%) | 8 (11.3%) |
Time of Departure to Work by Sex in Wickliffe
The most frequent times of departure to work in Wickliffe are 8:00 AM to 8:29 AM (39, 28.5%) for males and 7:00 AM to 7:29 AM (18, 25.4%) for females.
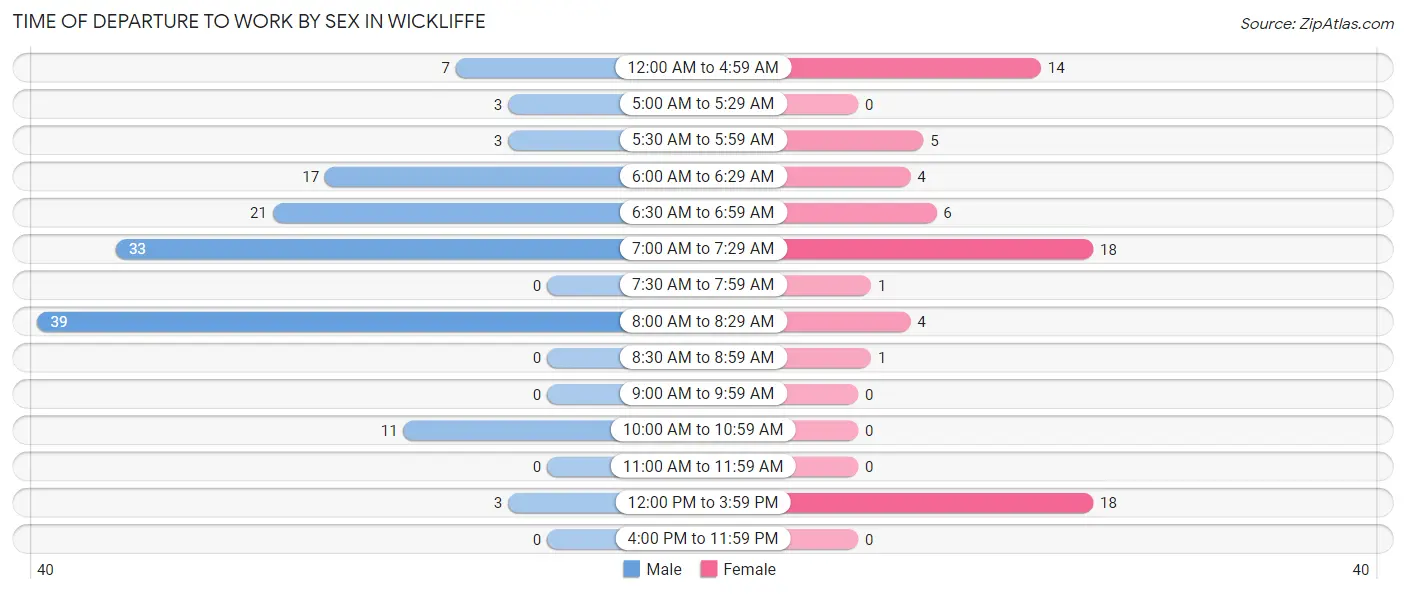
| Time of Departure | Male | Female |
| 12:00 AM to 4:59 AM | 7 (5.1%) | 14 (19.7%) |
| 5:00 AM to 5:29 AM | 3 (2.2%) | 0 (0.0%) |
| 5:30 AM to 5:59 AM | 3 (2.2%) | 5 (7.0%) |
| 6:00 AM to 6:29 AM | 17 (12.4%) | 4 (5.6%) |
| 6:30 AM to 6:59 AM | 21 (15.3%) | 6 (8.5%) |
| 7:00 AM to 7:29 AM | 33 (24.1%) | 18 (25.4%) |
| 7:30 AM to 7:59 AM | 0 (0.0%) | 1 (1.4%) |
| 8:00 AM to 8:29 AM | 39 (28.5%) | 4 (5.6%) |
| 8:30 AM to 8:59 AM | 0 (0.0%) | 1 (1.4%) |
| 9:00 AM to 9:59 AM | 0 (0.0%) | 0 (0.0%) |
| 10:00 AM to 10:59 AM | 11 (8.0%) | 0 (0.0%) |
| 11:00 AM to 11:59 AM | 0 (0.0%) | 0 (0.0%) |
| 12:00 PM to 3:59 PM | 3 (2.2%) | 18 (25.4%) |
| 4:00 PM to 11:59 PM | 0 (0.0%) | 0 (0.0%) |
| Total | 137 (100.0%) | 71 (100.0%) |
Housing Occupancy in Wickliffe
Occupancy by Ownership in Wickliffe
Of the total 273 dwellings in Wickliffe, owner-occupied units account for 208 (76.2%), while renter-occupied units make up 65 (23.8%).
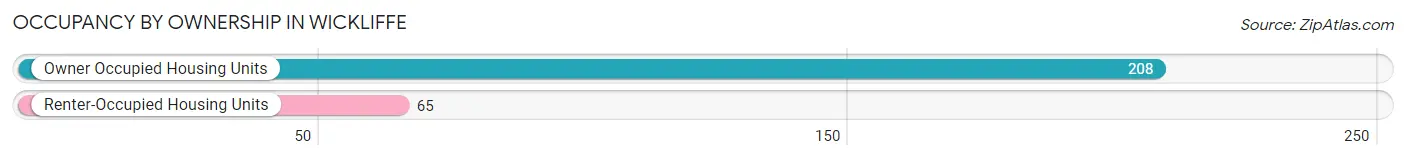
| Occupancy | # Housing Units | % Housing Units |
| Owner Occupied Housing Units | 208 | 76.2% |
| Renter-Occupied Housing Units | 65 | 23.8% |
| Total Occupied Housing Units | 273 | 100.0% |
Occupancy by Household Size in Wickliffe
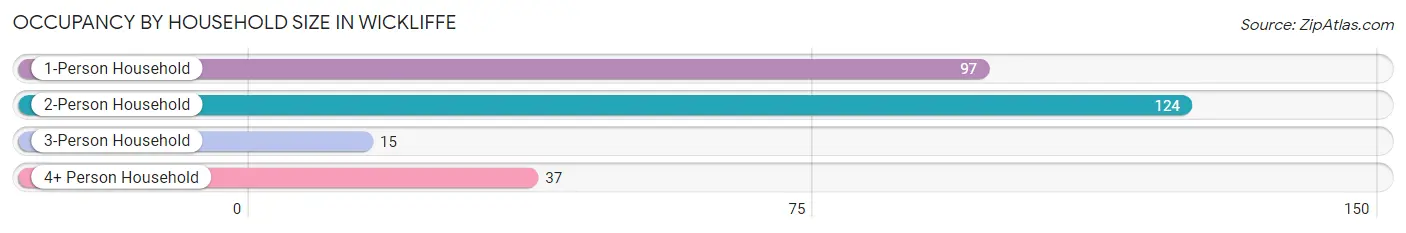
| Household Size | # Housing Units | % Housing Units |
| 1-Person Household | 97 | 35.5% |
| 2-Person Household | 124 | 45.4% |
| 3-Person Household | 15 | 5.5% |
| 4+ Person Household | 37 | 13.6% |
| Total Housing Units | 273 | 100.0% |
Occupancy by Ownership by Household Size in Wickliffe
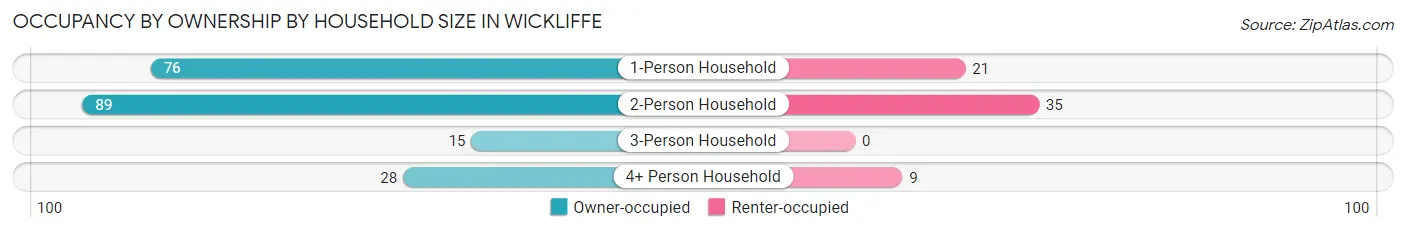
| Household Size | Owner-occupied | Renter-occupied |
| 1-Person Household | 76 (78.3%) | 21 (21.6%) |
| 2-Person Household | 89 (71.8%) | 35 (28.2%) |
| 3-Person Household | 15 (100.0%) | 0 (0.0%) |
| 4+ Person Household | 28 (75.7%) | 9 (24.3%) |
| Total Housing Units | 208 (76.2%) | 65 (23.8%) |
Occupancy by Educational Attainment in Wickliffe
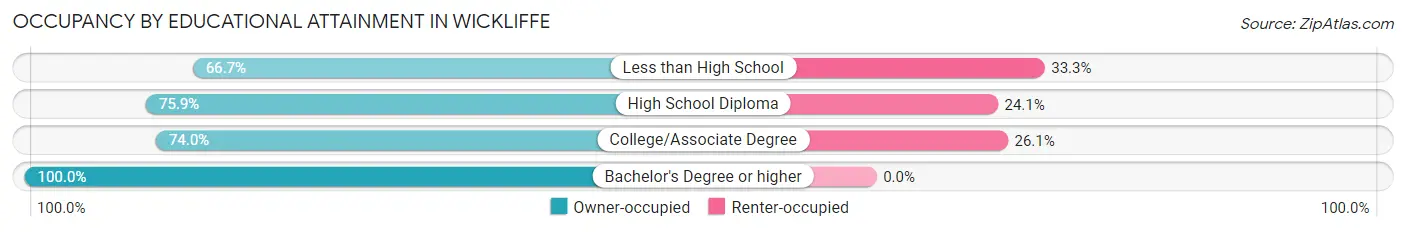
| Household Size | Owner-occupied | Renter-occupied |
| Less than High School | 16 (66.7%) | 8 (33.3%) |
| High School Diploma | 82 (75.9%) | 26 (24.1%) |
| College/Associate Degree | 88 (74.0%) | 31 (26.1%) |
| Bachelor's Degree or higher | 22 (100.0%) | 0 (0.0%) |
Occupancy by Age of Householder in Wickliffe
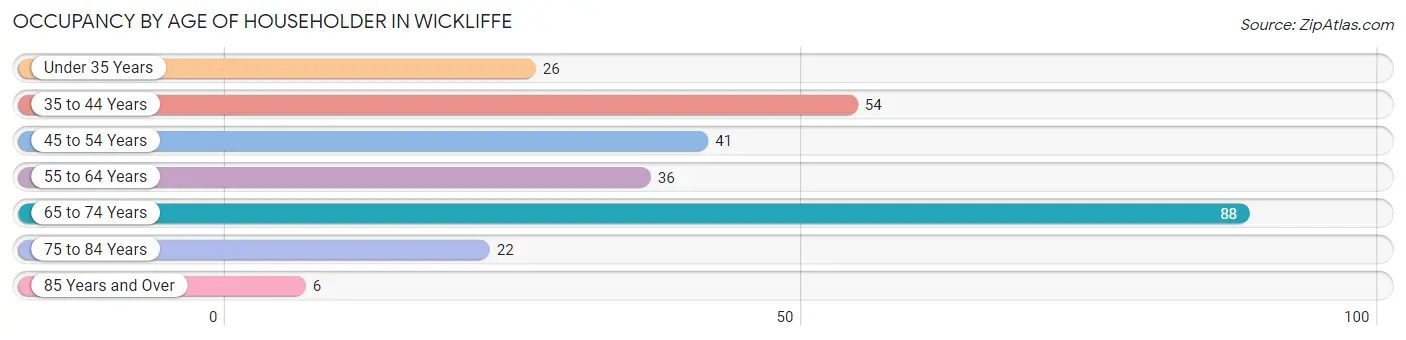
| Age Bracket | # Households | % Households |
| Under 35 Years | 26 | 9.5% |
| 35 to 44 Years | 54 | 19.8% |
| 45 to 54 Years | 41 | 15.0% |
| 55 to 64 Years | 36 | 13.2% |
| 65 to 74 Years | 88 | 32.2% |
| 75 to 84 Years | 22 | 8.1% |
| 85 Years and Over | 6 | 2.2% |
| Total | 273 | 100.0% |
Housing Finances in Wickliffe
Median Income by Occupancy in Wickliffe
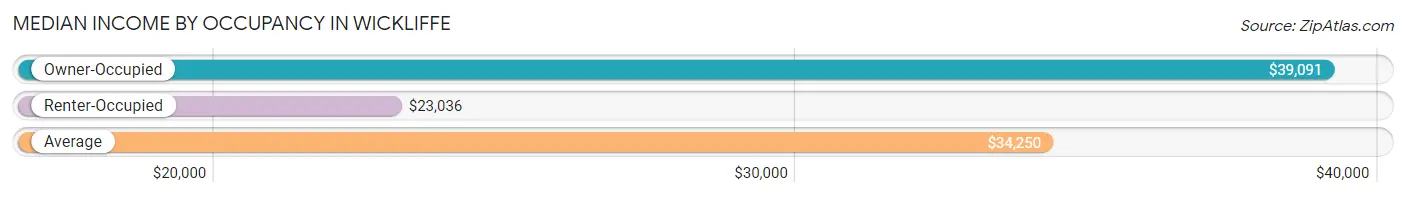
| Occupancy Type | # Households | Median Income |
| Owner-Occupied | 208 (76.2%) | $39,091 |
| Renter-Occupied | 65 (23.8%) | $23,036 |
| Average | 273 (100.0%) | $34,250 |
Occupancy by Householder Income Bracket in Wickliffe
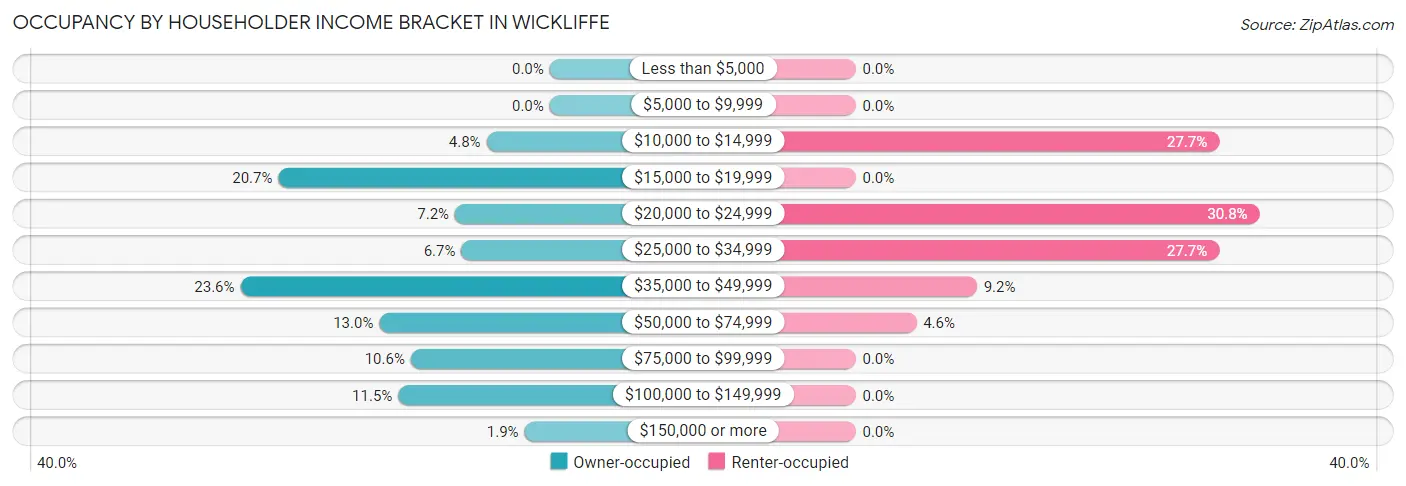
| Income Bracket | Owner-occupied | Renter-occupied |
| Less than $5,000 | 0 (0.0%) | 0 (0.0%) |
| $5,000 to $9,999 | 0 (0.0%) | 0 (0.0%) |
| $10,000 to $14,999 | 10 (4.8%) | 18 (27.7%) |
| $15,000 to $19,999 | 43 (20.7%) | 0 (0.0%) |
| $20,000 to $24,999 | 15 (7.2%) | 20 (30.8%) |
| $25,000 to $34,999 | 14 (6.7%) | 18 (27.7%) |
| $35,000 to $49,999 | 49 (23.6%) | 6 (9.2%) |
| $50,000 to $74,999 | 27 (13.0%) | 3 (4.6%) |
| $75,000 to $99,999 | 22 (10.6%) | 0 (0.0%) |
| $100,000 to $149,999 | 24 (11.5%) | 0 (0.0%) |
| $150,000 or more | 4 (1.9%) | 0 (0.0%) |
| Total | 208 (100.0%) | 65 (100.0%) |
Monthly Housing Cost Tiers in Wickliffe
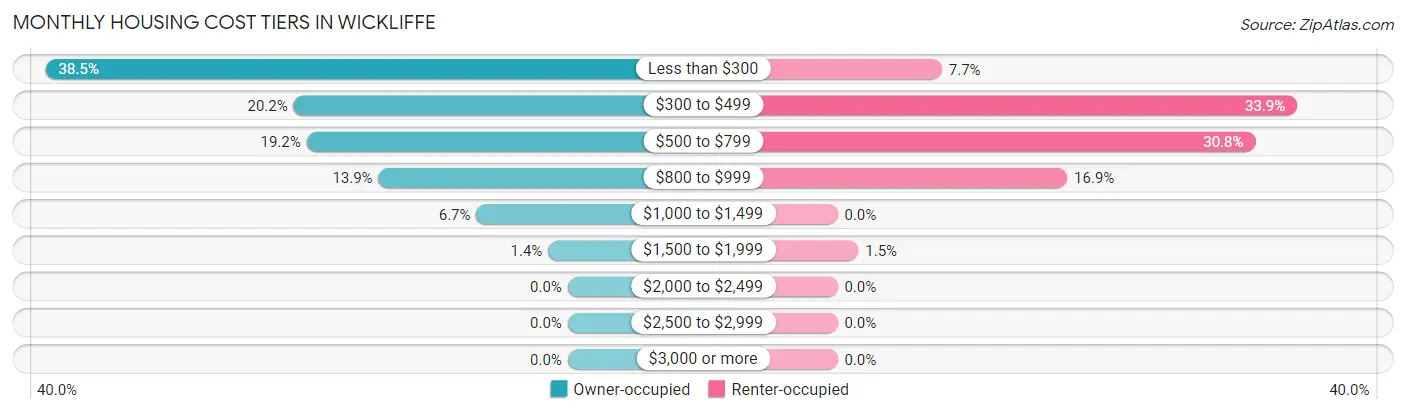
| Monthly Cost | Owner-occupied | Renter-occupied |
| Less than $300 | 80 (38.5%) | 5 (7.7%) |
| $300 to $499 | 42 (20.2%) | 22 (33.9%) |
| $500 to $799 | 40 (19.2%) | 20 (30.8%) |
| $800 to $999 | 29 (13.9%) | 11 (16.9%) |
| $1,000 to $1,499 | 14 (6.7%) | 0 (0.0%) |
| $1,500 to $1,999 | 3 (1.4%) | 1 (1.5%) |
| $2,000 to $2,499 | 0 (0.0%) | 0 (0.0%) |
| $2,500 to $2,999 | 0 (0.0%) | 0 (0.0%) |
| $3,000 or more | 0 (0.0%) | 0 (0.0%) |
| Total | 208 (100.0%) | 65 (100.0%) |
Physical Housing Characteristics in Wickliffe
Housing Structures in Wickliffe
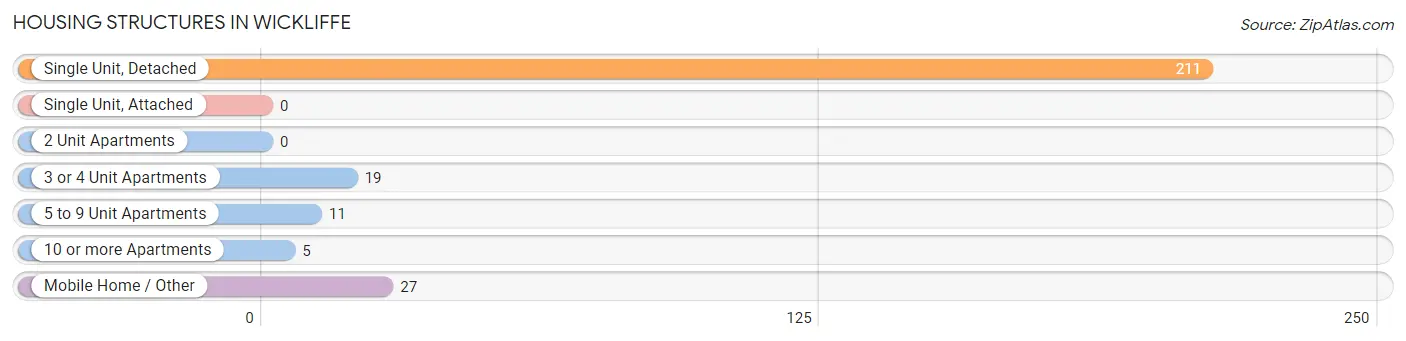
| Structure Type | # Housing Units | % Housing Units |
| Single Unit, Detached | 211 | 77.3% |
| Single Unit, Attached | 0 | 0.0% |
| 2 Unit Apartments | 0 | 0.0% |
| 3 or 4 Unit Apartments | 19 | 7.0% |
| 5 to 9 Unit Apartments | 11 | 4.0% |
| 10 or more Apartments | 5 | 1.8% |
| Mobile Home / Other | 27 | 9.9% |
| Total | 273 | 100.0% |
Housing Structures by Occupancy in Wickliffe
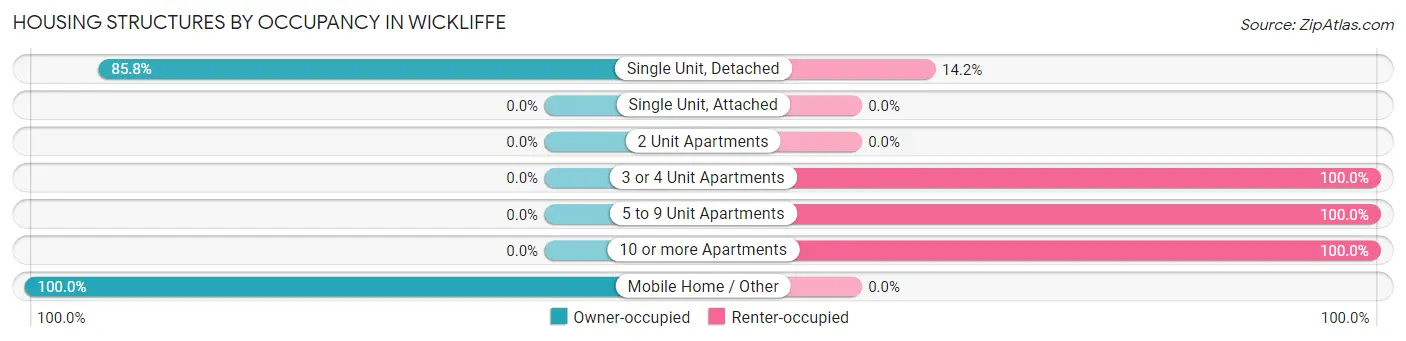
| Structure Type | Owner-occupied | Renter-occupied |
| Single Unit, Detached | 181 (85.8%) | 30 (14.2%) |
| Single Unit, Attached | 0 (0.0%) | 0 (0.0%) |
| 2 Unit Apartments | 0 (0.0%) | 0 (0.0%) |
| 3 or 4 Unit Apartments | 0 (0.0%) | 19 (100.0%) |
| 5 to 9 Unit Apartments | 0 (0.0%) | 11 (100.0%) |
| 10 or more Apartments | 0 (0.0%) | 5 (100.0%) |
| Mobile Home / Other | 27 (100.0%) | 0 (0.0%) |
| Total | 208 (76.2%) | 65 (23.8%) |
Housing Structures by Number of Rooms in Wickliffe
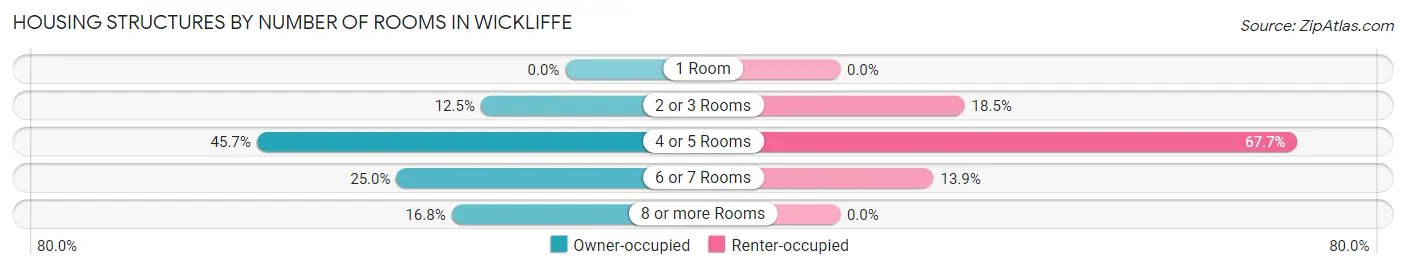
| Number of Rooms | Owner-occupied | Renter-occupied |
| 1 Room | 0 (0.0%) | 0 (0.0%) |
| 2 or 3 Rooms | 26 (12.5%) | 12 (18.5%) |
| 4 or 5 Rooms | 95 (45.7%) | 44 (67.7%) |
| 6 or 7 Rooms | 52 (25.0%) | 9 (13.9%) |
| 8 or more Rooms | 35 (16.8%) | 0 (0.0%) |
| Total | 208 (100.0%) | 65 (100.0%) |
Housing Structure by Heating Type in Wickliffe
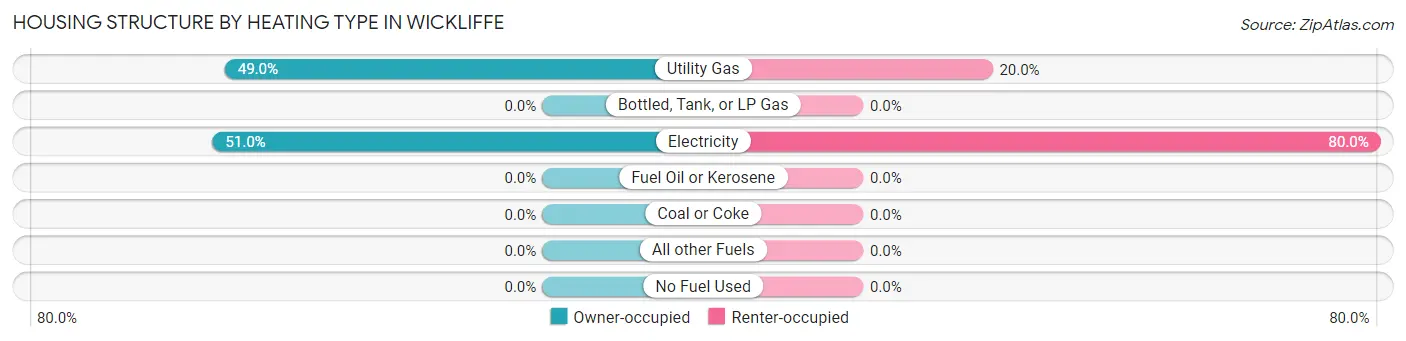
| Heating Type | Owner-occupied | Renter-occupied |
| Utility Gas | 102 (49.0%) | 13 (20.0%) |
| Bottled, Tank, or LP Gas | 0 (0.0%) | 0 (0.0%) |
| Electricity | 106 (51.0%) | 52 (80.0%) |
| Fuel Oil or Kerosene | 0 (0.0%) | 0 (0.0%) |
| Coal or Coke | 0 (0.0%) | 0 (0.0%) |
| All other Fuels | 0 (0.0%) | 0 (0.0%) |
| No Fuel Used | 0 (0.0%) | 0 (0.0%) |
| Total | 208 (100.0%) | 65 (100.0%) |
Household Vehicle Usage in Wickliffe
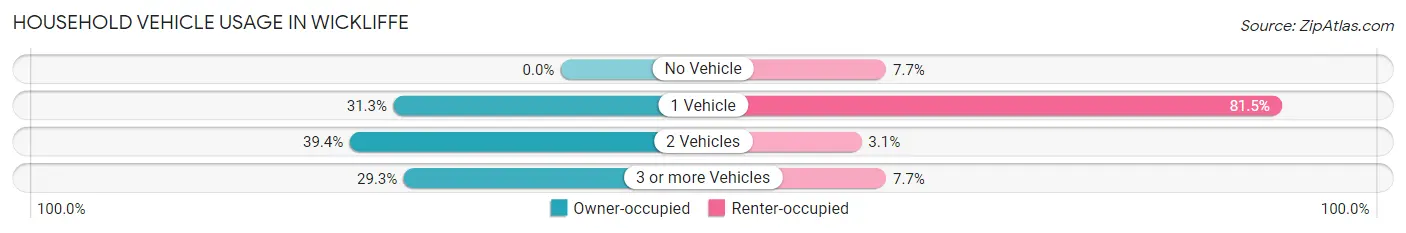
| Vehicles per Household | Owner-occupied | Renter-occupied |
| No Vehicle | 0 (0.0%) | 5 (7.7%) |
| 1 Vehicle | 65 (31.2%) | 53 (81.5%) |
| 2 Vehicles | 82 (39.4%) | 2 (3.1%) |
| 3 or more Vehicles | 61 (29.3%) | 5 (7.7%) |
| Total | 208 (100.0%) | 65 (100.0%) |
Real Estate & Mortgages in Wickliffe
Real Estate and Mortgage Overview in Wickliffe
| Characteristic | Without Mortgage | With Mortgage |
| Housing Units | 132 | 76 |
| Median Property Value | $53,100 | $86,200 |
| Median Household Income | $39,205 | $2 |
| Monthly Housing Costs | $284 | $0 |
| Real Estate Taxes | $199 | $2 |
Property Value by Mortgage Status in Wickliffe
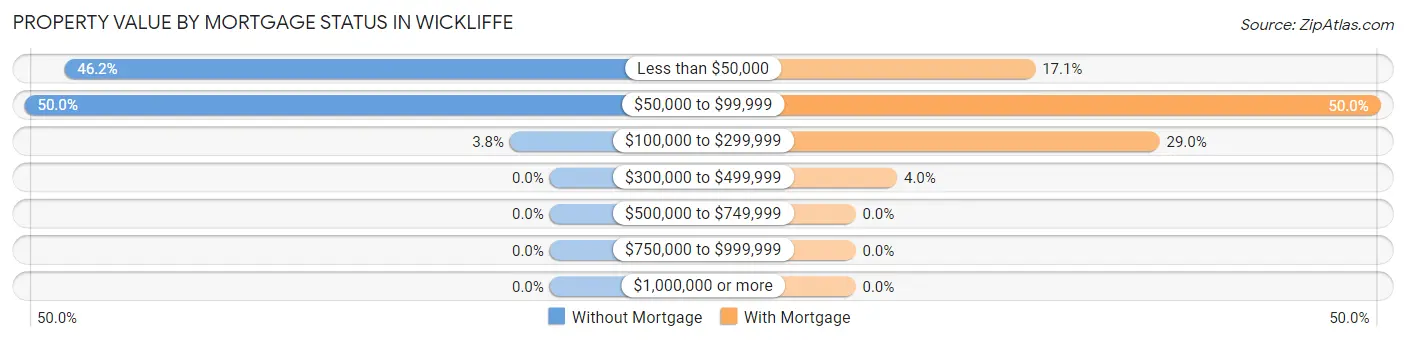
| Property Value | Without Mortgage | With Mortgage |
| Less than $50,000 | 61 (46.2%) | 13 (17.1%) |
| $50,000 to $99,999 | 66 (50.0%) | 38 (50.0%) |
| $100,000 to $299,999 | 5 (3.8%) | 22 (28.9%) |
| $300,000 to $499,999 | 0 (0.0%) | 3 (4.0%) |
| $500,000 to $749,999 | 0 (0.0%) | 0 (0.0%) |
| $750,000 to $999,999 | 0 (0.0%) | 0 (0.0%) |
| $1,000,000 or more | 0 (0.0%) | 0 (0.0%) |
| Total | 132 (100.0%) | 76 (100.0%) |
Household Income by Mortgage Status in Wickliffe
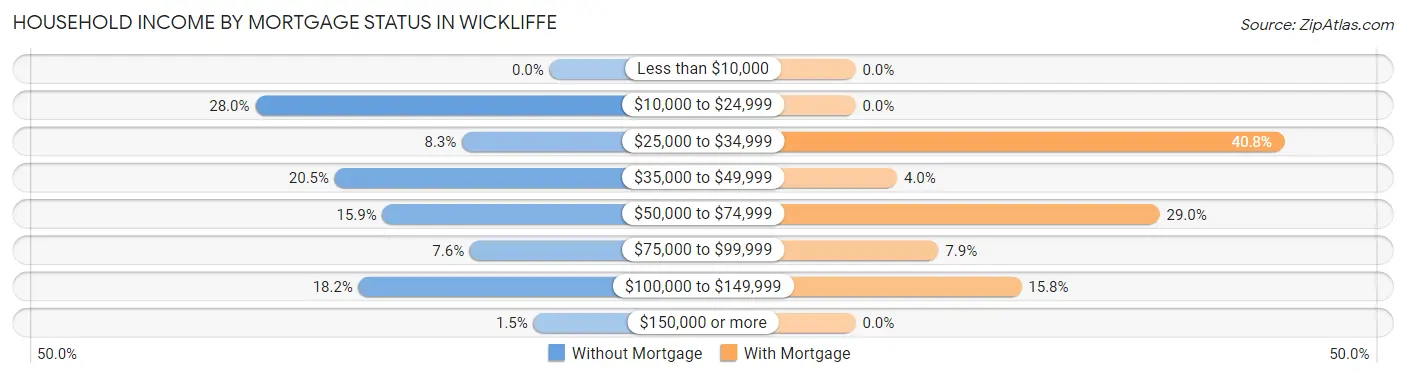
| Household Income | Without Mortgage | With Mortgage |
| Less than $10,000 | 0 (0.0%) | 0 (0.0%) |
| $10,000 to $24,999 | 37 (28.0%) | 0 (0.0%) |
| $25,000 to $34,999 | 11 (8.3%) | 31 (40.8%) |
| $35,000 to $49,999 | 27 (20.4%) | 3 (4.0%) |
| $50,000 to $74,999 | 21 (15.9%) | 22 (28.9%) |
| $75,000 to $99,999 | 10 (7.6%) | 6 (7.9%) |
| $100,000 to $149,999 | 24 (18.2%) | 12 (15.8%) |
| $150,000 or more | 2 (1.5%) | 0 (0.0%) |
| Total | 132 (100.0%) | 76 (100.0%) |
Property Value to Household Income Ratio in Wickliffe
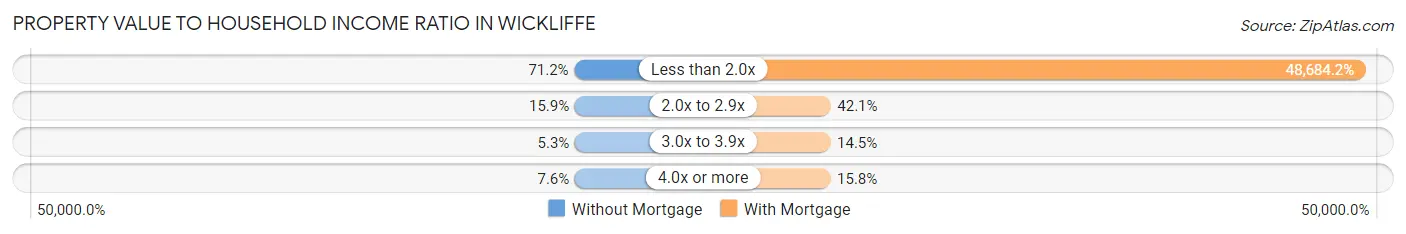
| Value-to-Income Ratio | Without Mortgage | With Mortgage |
| Less than 2.0x | 94 (71.2%) | 37,000 (48,684.2%) |
| 2.0x to 2.9x | 21 (15.9%) | 32 (42.1%) |
| 3.0x to 3.9x | 7 (5.3%) | 11 (14.5%) |
| 4.0x or more | 10 (7.6%) | 12 (15.8%) |
| Total | 132 (100.0%) | 76 (100.0%) |
Real Estate Taxes by Mortgage Status in Wickliffe
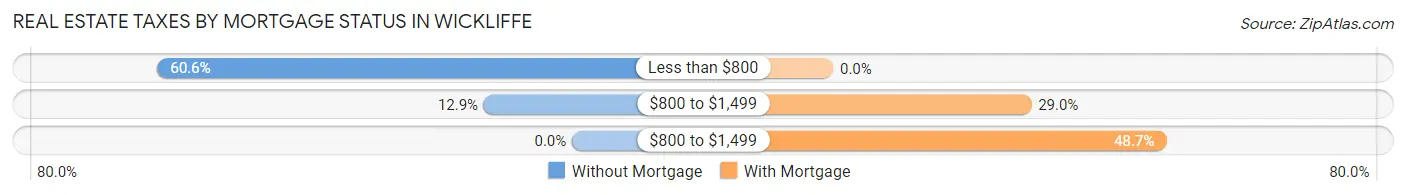
| Property Taxes | Without Mortgage | With Mortgage |
| Less than $800 | 80 (60.6%) | 0 (0.0%) |
| $800 to $1,499 | 17 (12.9%) | 22 (28.9%) |
| $800 to $1,499 | 0 (0.0%) | 37 (48.7%) |
| Total | 132 (100.0%) | 76 (100.0%) |
Health & Disability in Wickliffe
Health Insurance Coverage by Age in Wickliffe
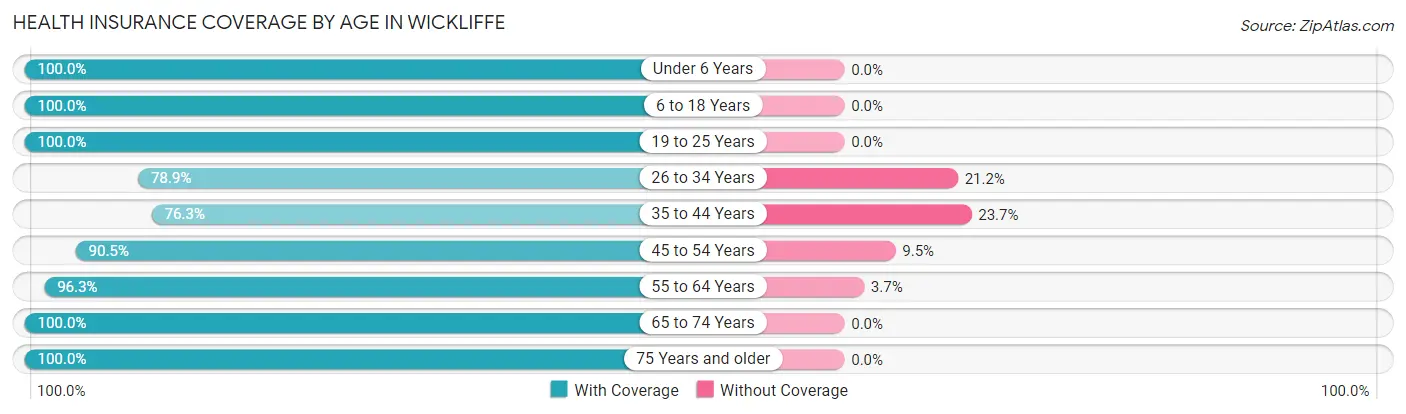
| Age Bracket | With Coverage | Without Coverage |
| Under 6 Years | 38 (100.0%) | 0 (0.0%) |
| 6 to 18 Years | 100 (100.0%) | 0 (0.0%) |
| 19 to 25 Years | 71 (100.0%) | 0 (0.0%) |
| 26 to 34 Years | 41 (78.8%) | 11 (21.1%) |
| 35 to 44 Years | 58 (76.3%) | 18 (23.7%) |
| 45 to 54 Years | 57 (90.5%) | 6 (9.5%) |
| 55 to 64 Years | 79 (96.3%) | 3 (3.7%) |
| 65 to 74 Years | 125 (100.0%) | 0 (0.0%) |
| 75 Years and older | 59 (100.0%) | 0 (0.0%) |
| Total | 628 (94.3%) | 38 (5.7%) |
Health Insurance Coverage by Citizenship Status in Wickliffe
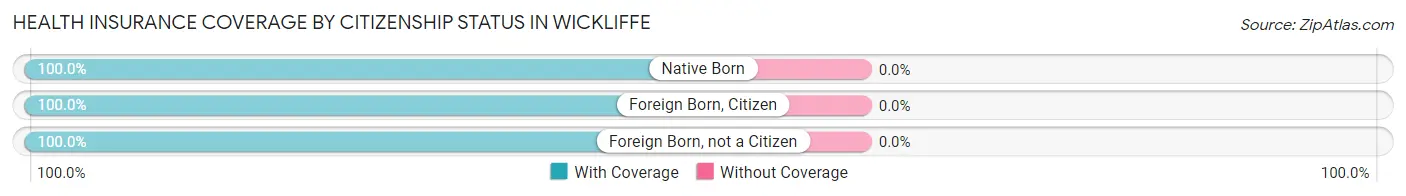
| Citizenship Status | With Coverage | Without Coverage |
| Native Born | 38 (100.0%) | 0 (0.0%) |
| Foreign Born, Citizen | 100 (100.0%) | 0 (0.0%) |
| Foreign Born, not a Citizen | 71 (100.0%) | 0 (0.0%) |
Health Insurance Coverage by Household Income in Wickliffe
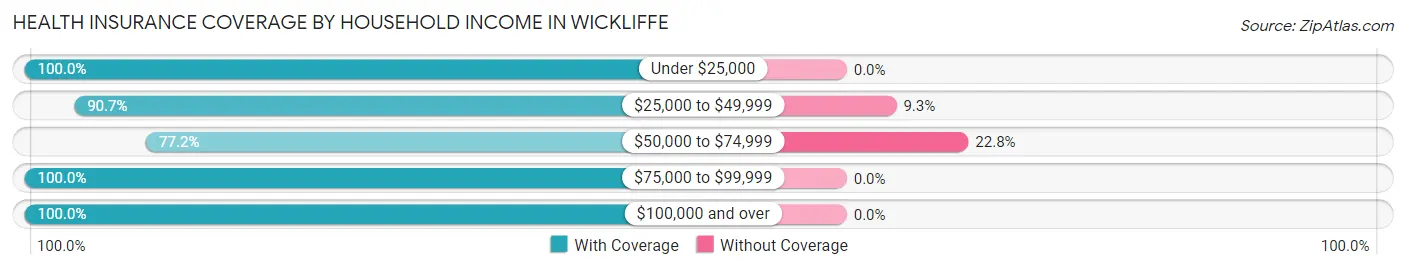
| Household Income | With Coverage | Without Coverage |
| Under $25,000 | 223 (100.0%) | 0 (0.0%) |
| $25,000 to $49,999 | 195 (90.7%) | 20 (9.3%) |
| $50,000 to $74,999 | 61 (77.2%) | 18 (22.8%) |
| $75,000 to $99,999 | 85 (100.0%) | 0 (0.0%) |
| $100,000 and over | 64 (100.0%) | 0 (0.0%) |
Public vs Private Health Insurance Coverage by Age in Wickliffe
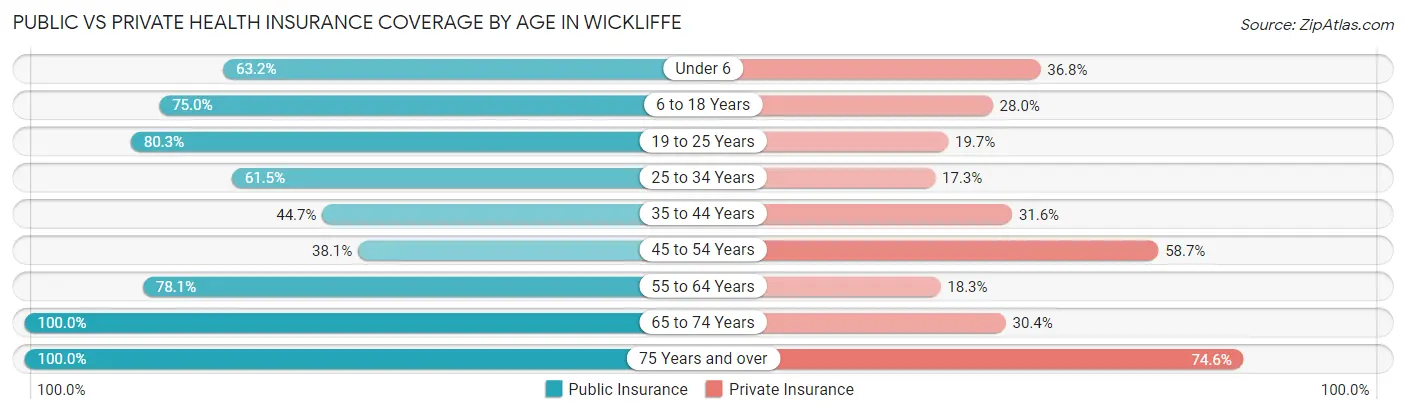
| Age Bracket | Public Insurance | Private Insurance |
| Under 6 | 24 (63.2%) | 14 (36.8%) |
| 6 to 18 Years | 75 (75.0%) | 28 (28.0%) |
| 19 to 25 Years | 57 (80.3%) | 14 (19.7%) |
| 25 to 34 Years | 32 (61.5%) | 9 (17.3%) |
| 35 to 44 Years | 34 (44.7%) | 24 (31.6%) |
| 45 to 54 Years | 24 (38.1%) | 37 (58.7%) |
| 55 to 64 Years | 64 (78.0%) | 15 (18.3%) |
| 65 to 74 Years | 125 (100.0%) | 38 (30.4%) |
| 75 Years and over | 59 (100.0%) | 44 (74.6%) |
| Total | 494 (74.2%) | 223 (33.5%) |
Disability Status by Sex by Age in Wickliffe
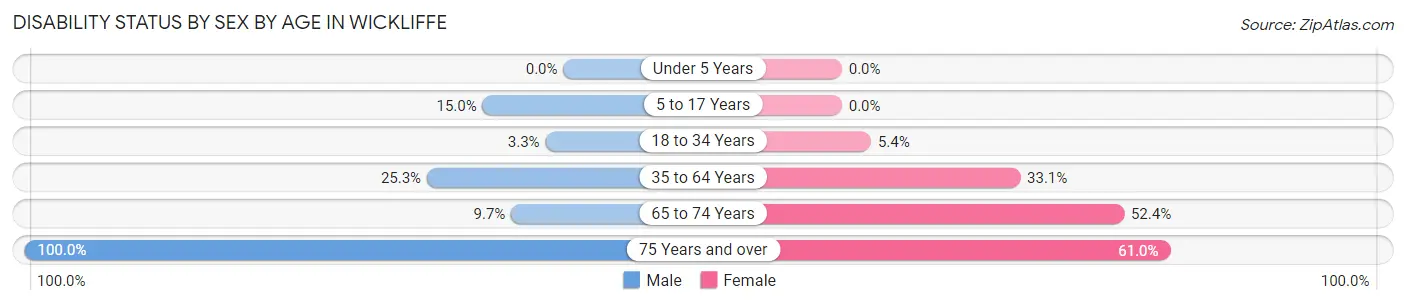
| Age Bracket | Male | Female |
| Under 5 Years | 0 (0.0%) | 0 (0.0%) |
| 5 to 17 Years | 9 (15.0%) | 0 (0.0%) |
| 18 to 34 Years | 3 (3.3%) | 2 (5.4%) |
| 35 to 64 Years | 20 (25.3%) | 47 (33.1%) |
| 65 to 74 Years | 6 (9.7%) | 33 (52.4%) |
| 75 Years and over | 18 (100.0%) | 25 (61.0%) |
Disability Class by Sex by Age in Wickliffe
Disability Class: Hearing Difficulty
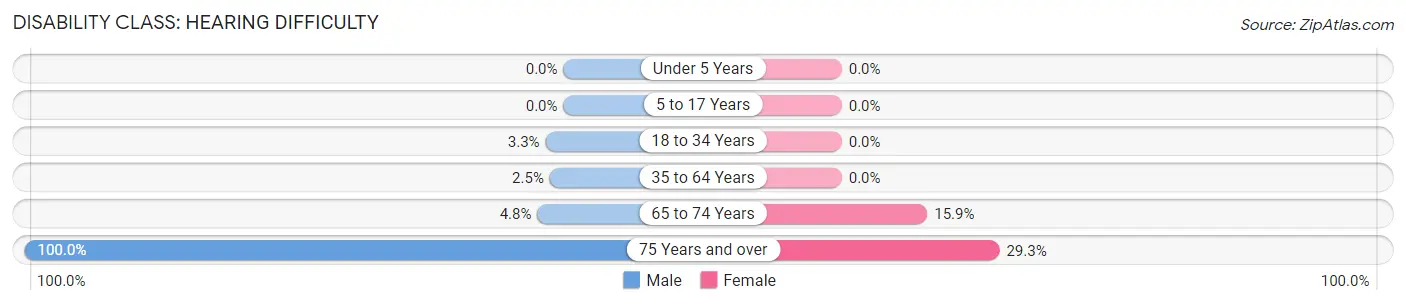
| Age Bracket | Male | Female |
| Under 5 Years | 0 (0.0%) | 0 (0.0%) |
| 5 to 17 Years | 0 (0.0%) | 0 (0.0%) |
| 18 to 34 Years | 3 (3.3%) | 0 (0.0%) |
| 35 to 64 Years | 2 (2.5%) | 0 (0.0%) |
| 65 to 74 Years | 3 (4.8%) | 10 (15.9%) |
| 75 Years and over | 18 (100.0%) | 12 (29.3%) |
Disability Class: Vision Difficulty
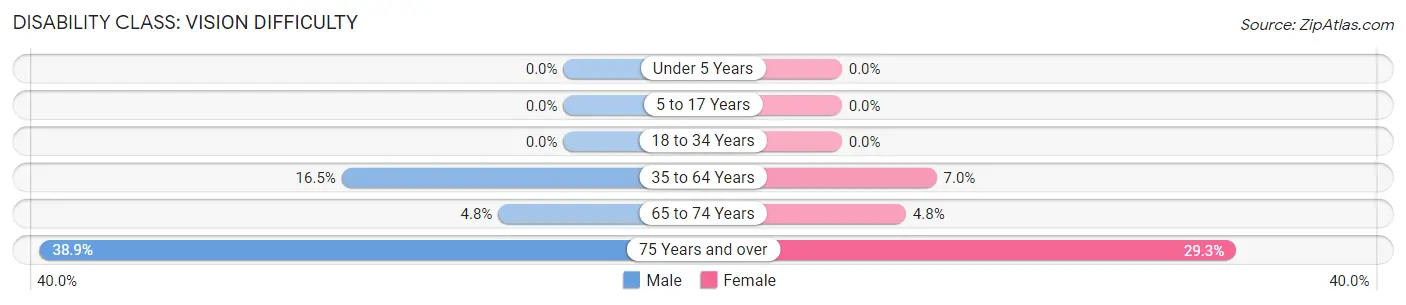
| Age Bracket | Male | Female |
| Under 5 Years | 0 (0.0%) | 0 (0.0%) |
| 5 to 17 Years | 0 (0.0%) | 0 (0.0%) |
| 18 to 34 Years | 0 (0.0%) | 0 (0.0%) |
| 35 to 64 Years | 13 (16.5%) | 10 (7.0%) |
| 65 to 74 Years | 3 (4.8%) | 3 (4.8%) |
| 75 Years and over | 7 (38.9%) | 12 (29.3%) |
Disability Class: Cognitive Difficulty
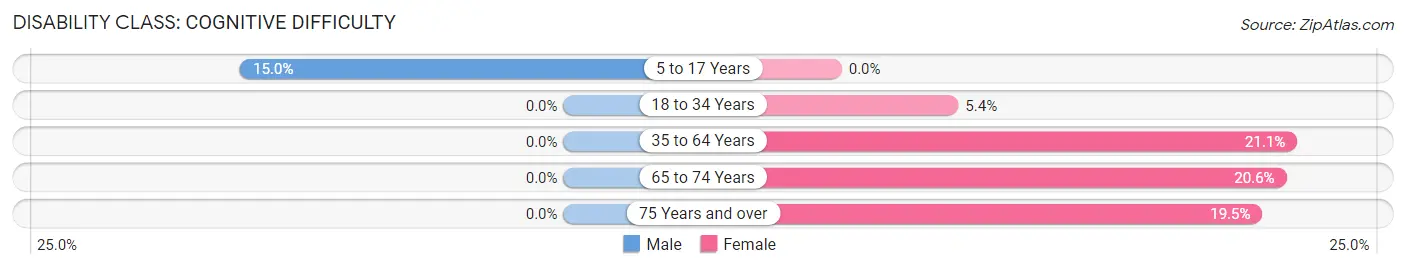
| Age Bracket | Male | Female |
| 5 to 17 Years | 9 (15.0%) | 0 (0.0%) |
| 18 to 34 Years | 0 (0.0%) | 2 (5.4%) |
| 35 to 64 Years | 0 (0.0%) | 30 (21.1%) |
| 65 to 74 Years | 0 (0.0%) | 13 (20.6%) |
| 75 Years and over | 0 (0.0%) | 8 (19.5%) |
Disability Class: Ambulatory Difficulty
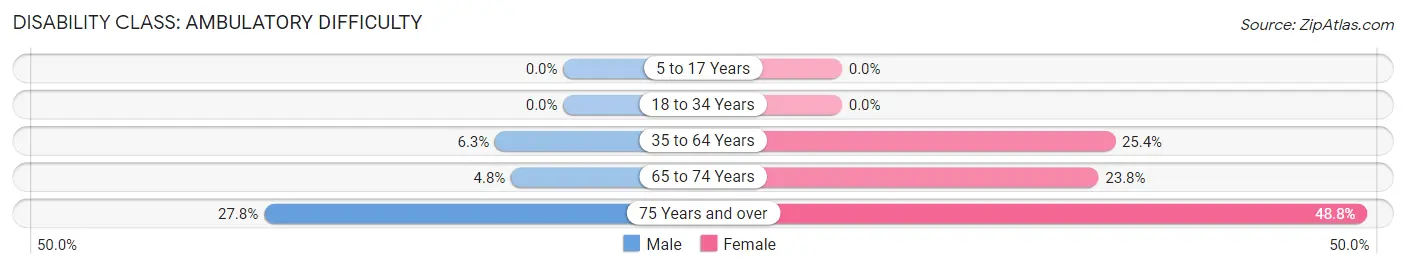
| Age Bracket | Male | Female |
| 5 to 17 Years | 0 (0.0%) | 0 (0.0%) |
| 18 to 34 Years | 0 (0.0%) | 0 (0.0%) |
| 35 to 64 Years | 5 (6.3%) | 36 (25.4%) |
| 65 to 74 Years | 3 (4.8%) | 15 (23.8%) |
| 75 Years and over | 5 (27.8%) | 20 (48.8%) |
Disability Class: Self-Care Difficulty
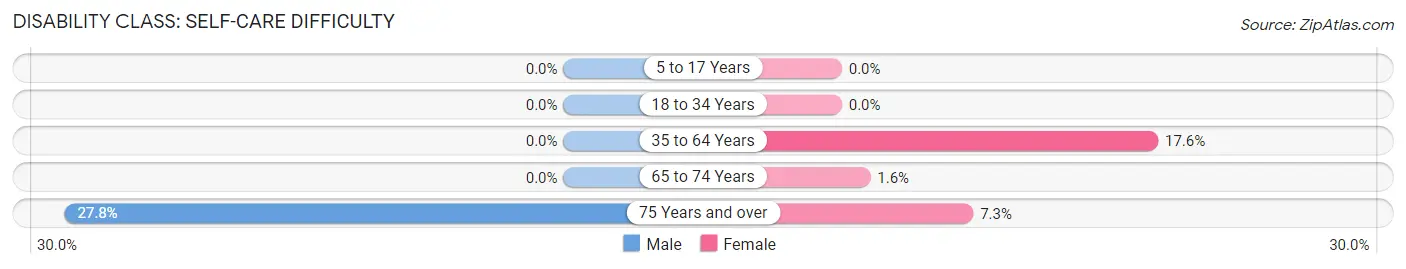
| Age Bracket | Male | Female |
| 5 to 17 Years | 0 (0.0%) | 0 (0.0%) |
| 18 to 34 Years | 0 (0.0%) | 0 (0.0%) |
| 35 to 64 Years | 0 (0.0%) | 25 (17.6%) |
| 65 to 74 Years | 0 (0.0%) | 1 (1.6%) |
| 75 Years and over | 5 (27.8%) | 3 (7.3%) |
Technology Access in Wickliffe
Computing Device Access in Wickliffe
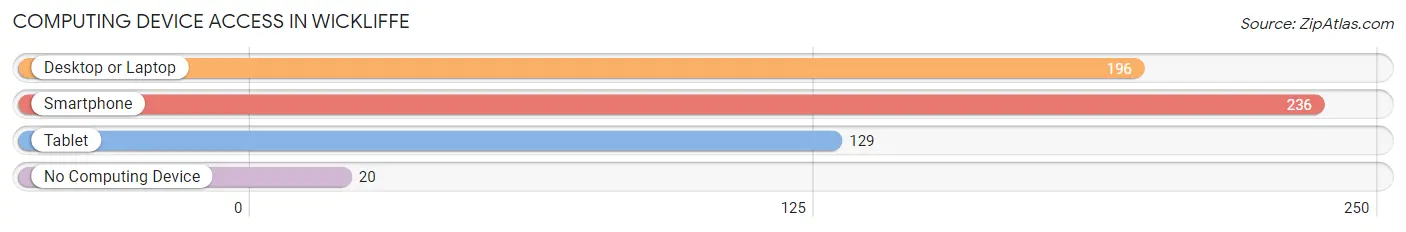
| Device Type | # Households | % Households |
| Desktop or Laptop | 196 | 71.8% |
| Smartphone | 236 | 86.5% |
| Tablet | 129 | 47.2% |
| No Computing Device | 20 | 7.3% |
| Total | 273 | 100.0% |
Internet Access in Wickliffe
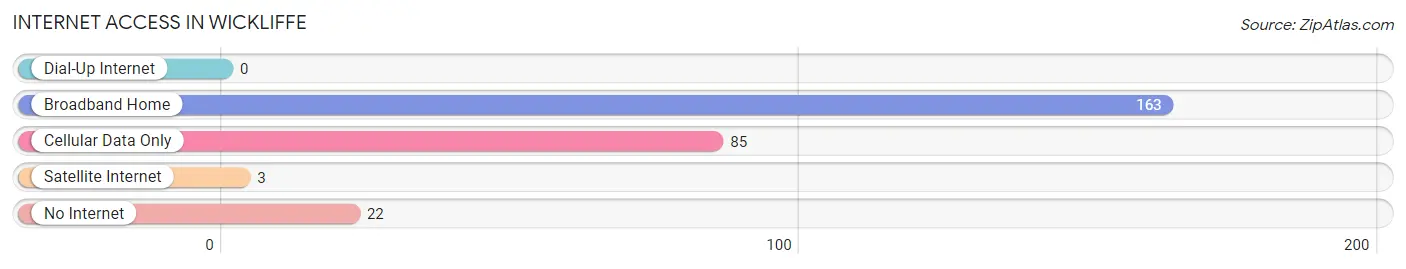
| Internet Type | # Households | % Households |
| Dial-Up Internet | 0 | 0.0% |
| Broadband Home | 163 | 59.7% |
| Cellular Data Only | 85 | 31.1% |
| Satellite Internet | 3 | 1.1% |
| No Internet | 22 | 8.1% |
| Total | 273 | 100.0% |
Wickliffe Summary
Wickliffe, Kentucky is a small city located in Ballard County, Kentucky. It is situated on the banks of the Mississippi River, just south of the Kentucky-Illinois border. The city has a population of approximately 2,000 people and is part of the Paducah, Kentucky metropolitan area.
History
Wickliffe was founded in 1854 by a group of settlers from the nearby town of Wickliffe, Illinois. The town was named after the original Wickliffe, which was named after the English statesman and philosopher, Edmund Burke. The town was incorporated in 1859 and was the county seat of Ballard County until 1876.
The town was a major port on the Mississippi River during the 19th century, and was a major hub for the steamboat trade. The town was also a major center for the cotton trade, and was home to several cotton mills.
Geography
Wickliffe is located in Ballard County, Kentucky, on the banks of the Mississippi River. The city is situated on the western edge of the state, just south of the Kentucky-Illinois border. The city is located approximately 30 miles north of Paducah, Kentucky, and approximately 60 miles south of Evansville, Indiana.
The city has a total area of 1.3 square miles, all of which is land. The city is located in a flat, low-lying area, and is surrounded by farmland and wooded areas.
Economy
The economy of Wickliffe is largely based on agriculture and tourism. The city is home to several farms, which produce a variety of crops, including corn, soybeans, and wheat. The city is also home to several tourist attractions, including the Wickliffe Mounds State Historic Site, which is a Native American archaeological site.
The city is also home to several small businesses, including restaurants, retail stores, and service providers. The city is also home to a small industrial park, which is home to several manufacturing and distribution companies.
Demographics
As of the 2010 census, Wickliffe had a population of 2,000 people. The racial makeup of the city was 97.2% White, 0.7% African American, 0.2% Native American, 0.2% Asian, 0.2% from other races, and 1.7% from two or more races. Hispanic or Latino of any race were 0.7% of the population.
The median income for a household in the city was $37,500, and the median income for a family was $45,000. The per capita income for the city was $18,000. About 11.2% of families and 14.2% of the population were below the poverty line, including 18.2% of those under age 18 and 8.2% of those age 65 or over.
Common Questions
What is Per Capita Income in Wickliffe?
Per Capita income in Wickliffe is $19,795.
What is the Median Family Income in Wickliffe?
Median Family Income in Wickliffe is $39,706.
What is the Median Household income in Wickliffe?
Median Household Income in Wickliffe is $34,250.
What is Income or Wage Gap in Wickliffe?
Income or Wage Gap in Wickliffe is 16.1%.
Women in Wickliffe earn 83.9 cents for every dollar earned by a man.
What is Inequality or Gini Index in Wickliffe?
Inequality or Gini Index in Wickliffe is 0.42.
What is the Total Population of Wickliffe?
Total Population of Wickliffe is 727.
What is the Total Male Population of Wickliffe?
Total Male Population of Wickliffe is 377.
What is the Total Female Population of Wickliffe?
Total Female Population of Wickliffe is 350.
What is the Ratio of Males per 100 Females in Wickliffe?
There are 107.71 Males per 100 Females in Wickliffe.
What is the Ratio of Females per 100 Males in Wickliffe?
There are 92.84 Females per 100 Males in Wickliffe.
What is the Median Population Age in Wickliffe?
Median Population Age in Wickliffe is 42.8 Years.
What is the Average Family Size in Wickliffe
Average Family Size in Wickliffe is 3.4 People.
What is the Average Household Size in Wickliffe
Average Household Size in Wickliffe is 2.4 People.
How Large is the Labor Force in Wickliffe?
There are 210 People in the Labor Forcein in Wickliffe.
What is the Percentage of People in the Labor Force in Wickliffe?
34.2% of People are in the Labor Force in Wickliffe.