Williamsburg, KY Map & Demographics
Williamsburg Map
Williamsburg Overview
$20,721
PER CAPITA INCOME
$50,216
AVG FAMILY INCOME
$33,875
AVG HOUSEHOLD INCOME
1.1%
WAGE / INCOME GAP [ % ]
98.9¢/ $1
WAGE / INCOME GAP [ $ ]
0.60
INEQUALITY / GINI INDEX
5,229
TOTAL POPULATION
2,503
MALE POPULATION
2,726
FEMALE POPULATION
91.82
MALES / 100 FEMALES
108.91
FEMALES / 100 MALES
27.3
MEDIAN AGE
2.8
AVG FAMILY SIZE
2.4
AVG HOUSEHOLD SIZE
2,141
LABOR FORCE [ PEOPLE ]
46.8%
PERCENT IN LABOR FORCE
12.1%
UNEMPLOYMENT RATE
Williamsburg Zip Codes
Williamsburg Area Codes
Income in Williamsburg
Income Overview in Williamsburg
Per Capita Income in Williamsburg is $20,721, while median incomes of families and households are $50,216 and $33,875 respectively.
| Characteristic | Number | Measure |
| Per Capita Income | 5,229 | $20,721 |
| Median Family Income | 1,018 | $50,216 |
| Mean Family Income | 1,018 | $56,634 |
| Median Household Income | 1,598 | $33,875 |
| Mean Household Income | 1,598 | $62,929 |
| Income Deficit | 1,018 | $0 |
| Wage / Income Gap (%) | 5,229 | 1.13% |
| Wage / Income Gap ($) | 5,229 | 98.87¢ per $1 |
| Gini / Inequality Index | 5,229 | 0.60 |
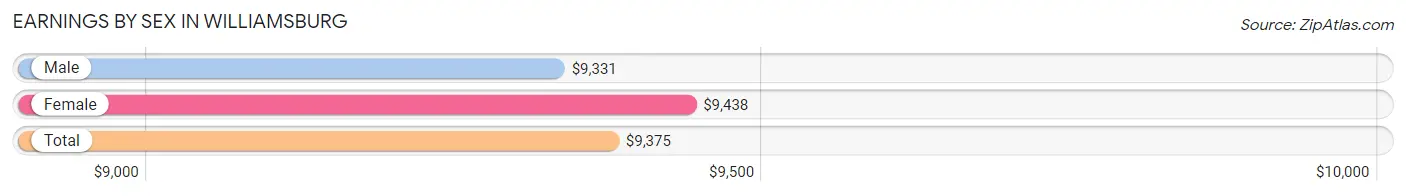
Earnings by Sex in Williamsburg
Average Earnings in Williamsburg are $9,375, $9,331 for men and $9,438 for women, a difference of 1.1%.
| Sex | Number | Average Earnings |
| Male | 1,293 (50.6%) | $9,331 |
| Female | 1,262 (49.4%) | $9,438 |
| Total | 2,555 (100.0%) | $9,375 |
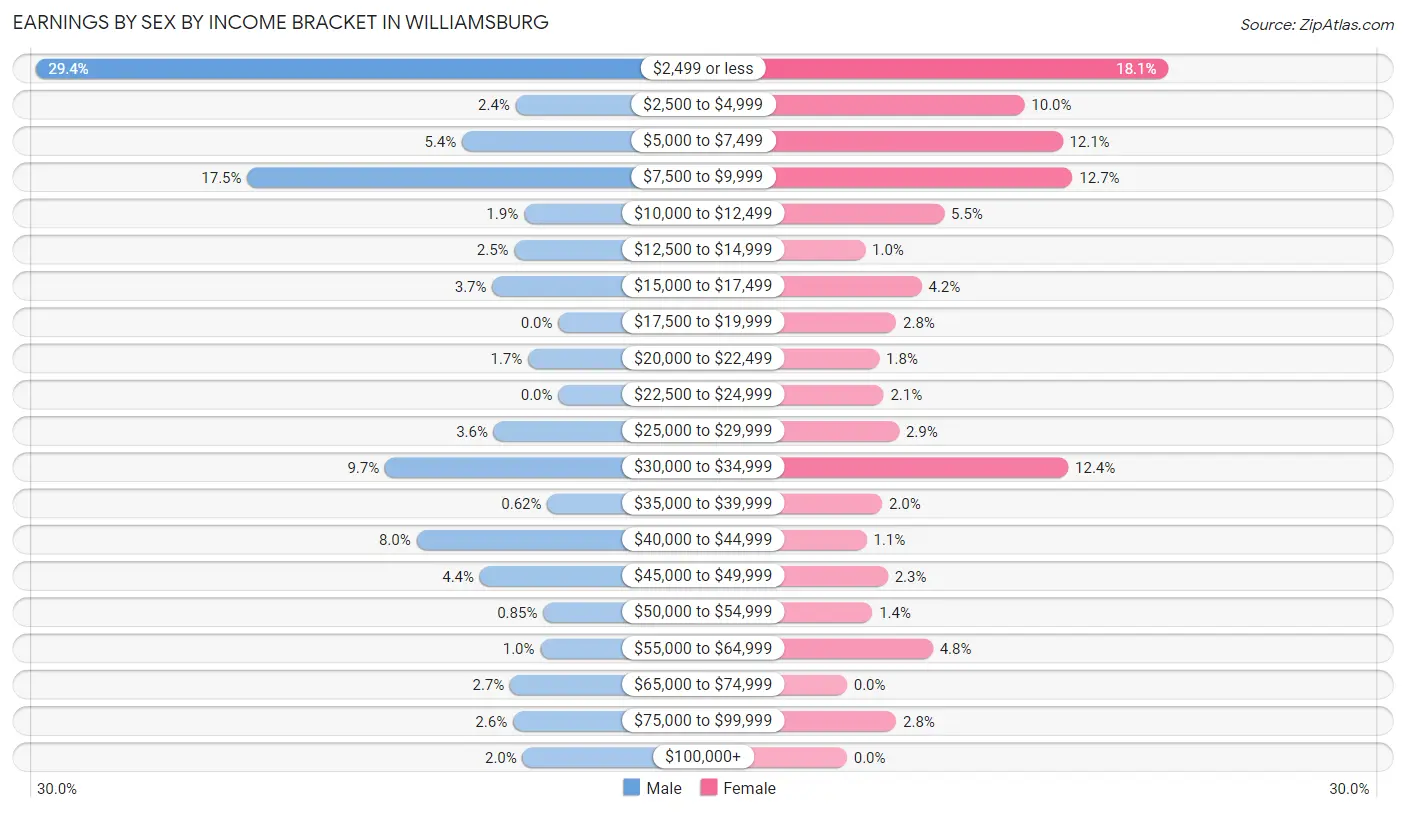
Earnings by Sex by Income Bracket in Williamsburg
The most common earnings brackets in Williamsburg are $2,499 or less for men (380 | 29.4%) and $2,499 or less for women (228 | 18.1%).
| Income | Male | Female |
| $2,499 or less | 380 (29.4%) | 228 (18.1%) |
| $2,500 to $4,999 | 31 (2.4%) | 126 (10.0%) |
| $5,000 to $7,499 | 70 (5.4%) | 153 (12.1%) |
| $7,500 to $9,999 | 226 (17.5%) | 160 (12.7%) |
| $10,000 to $12,499 | 25 (1.9%) | 69 (5.5%) |
| $12,500 to $14,999 | 32 (2.5%) | 13 (1.0%) |
| $15,000 to $17,499 | 48 (3.7%) | 53 (4.2%) |
| $17,500 to $19,999 | 0 (0.0%) | 35 (2.8%) |
| $20,000 to $22,499 | 22 (1.7%) | 23 (1.8%) |
| $22,500 to $24,999 | 0 (0.0%) | 26 (2.1%) |
| $25,000 to $29,999 | 47 (3.6%) | 37 (2.9%) |
| $30,000 to $34,999 | 126 (9.7%) | 157 (12.4%) |
| $35,000 to $39,999 | 8 (0.6%) | 25 (2.0%) |
| $40,000 to $44,999 | 103 (8.0%) | 14 (1.1%) |
| $45,000 to $49,999 | 57 (4.4%) | 29 (2.3%) |
| $50,000 to $54,999 | 11 (0.9%) | 18 (1.4%) |
| $55,000 to $64,999 | 13 (1.0%) | 61 (4.8%) |
| $65,000 to $74,999 | 35 (2.7%) | 0 (0.0%) |
| $75,000 to $99,999 | 33 (2.5%) | 35 (2.8%) |
| $100,000+ | 26 (2.0%) | 0 (0.0%) |
| Total | 1,293 (100.0%) | 1,262 (100.0%) |
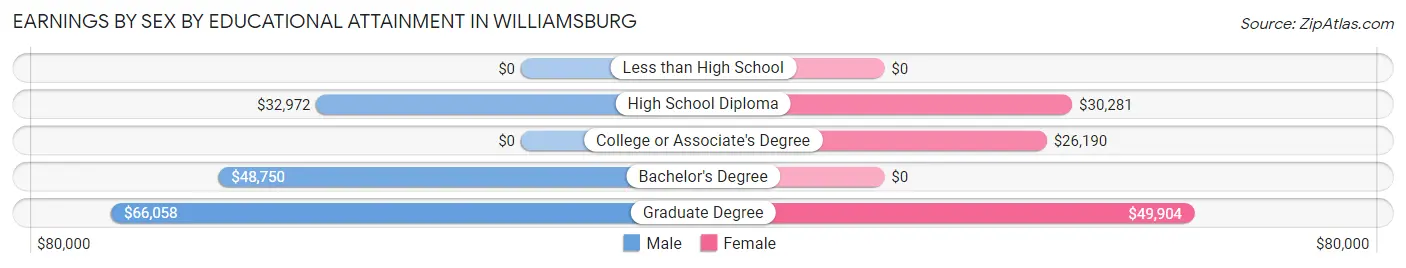
Earnings by Sex by Educational Attainment in Williamsburg
Average earnings in Williamsburg are $34,125 for men and $30,350 for women, a difference of 11.1%. Men with an educational attainment of graduate degree enjoy the highest average annual earnings of $66,058, while those with high school diploma education earn the least with $32,972. Women with an educational attainment of graduate degree earn the most with the average annual earnings of $49,904, while those with college or associate's degree education have the smallest earnings of $26,190.
| Educational Attainment | Male Income | Female Income |
| Less than High School | - | - |
| High School Diploma | $32,972 | $30,281 |
| College or Associate's Degree | - | - |
| Bachelor's Degree | $48,750 | $0 |
| Graduate Degree | $66,058 | $49,904 |
| Total | $34,125 | $30,350 |
Family Income in Williamsburg
Family Income Brackets in Williamsburg
According to the Williamsburg family income data, there are 274 families falling into the $50,000 to $74,999 income range, which is the most common income bracket and makes up 26.9% of all families. Conversely, the $200,000+ income bracket is the least frequent group with only 16 families (1.6%) belonging to this category.
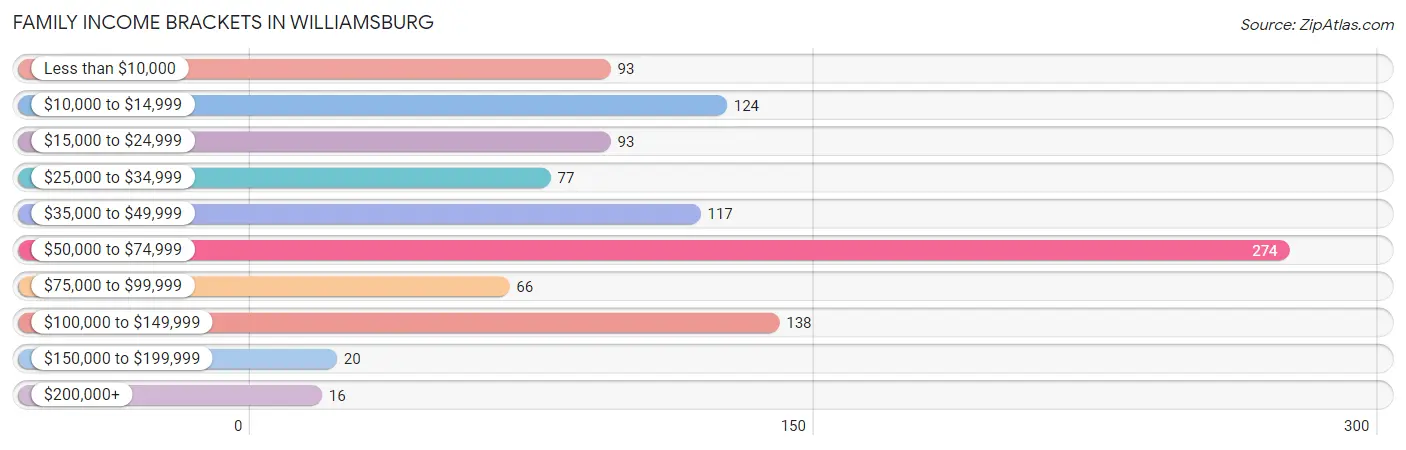
| Income Bracket | # Families | % Families |
| Less than $10,000 | 93 | 9.1% |
| $10,000 to $14,999 | 124 | 12.2% |
| $15,000 to $24,999 | 93 | 9.1% |
| $25,000 to $34,999 | 77 | 7.6% |
| $35,000 to $49,999 | 117 | 11.5% |
| $50,000 to $74,999 | 274 | 26.9% |
| $75,000 to $99,999 | 66 | 6.5% |
| $100,000 to $149,999 | 138 | 13.6% |
| $150,000 to $199,999 | 20 | 2.0% |
| $200,000+ | 16 | 1.6% |
Family Income by Famaliy Size in Williamsburg
5-person families (49 | 4.8%) account for the highest median family income in Williamsburg with $74,135 per family, while 2-person families (550 | 54.0%) have the highest median income of $22,981 per family member.
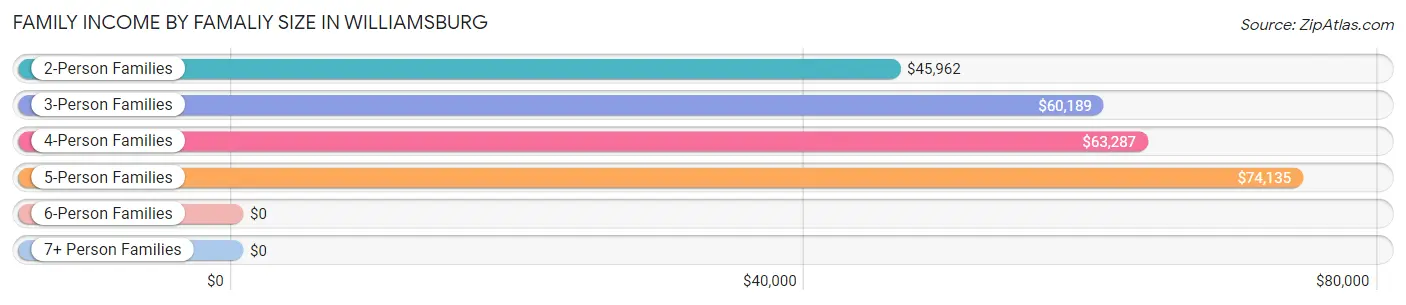
| Income Bracket | # Families | Median Income |
| 2-Person Families | 550 (54.0%) | $45,962 |
| 3-Person Families | 235 (23.1%) | $60,189 |
| 4-Person Families | 139 (13.7%) | $63,287 |
| 5-Person Families | 49 (4.8%) | $74,135 |
| 6-Person Families | 35 (3.4%) | $0 |
| 7+ Person Families | 10 (1.0%) | $0 |
| Total | 1,018 (100.0%) | $50,216 |
Family Income by Number of Earners in Williamsburg
The median family income in Williamsburg is $50,216, with families comprising 3+ earners (114) having the highest median family income of $125,643, while families with no earners (313) have the lowest median family income of $23,133, accounting for 11.2% and 30.7% of families, respectively.
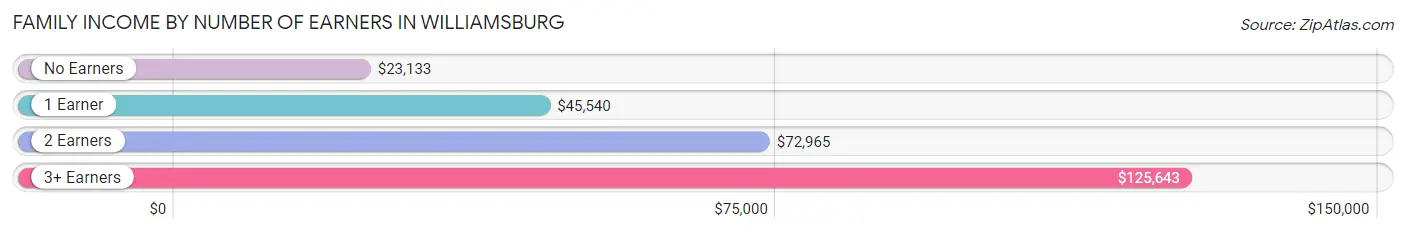
| Number of Earners | # Families | Median Income |
| No Earners | 313 (30.7%) | $23,133 |
| 1 Earner | 321 (31.5%) | $45,540 |
| 2 Earners | 270 (26.5%) | $72,965 |
| 3+ Earners | 114 (11.2%) | $125,643 |
| Total | 1,018 (100.0%) | $50,216 |
Household Income in Williamsburg
Household Income Brackets in Williamsburg
With 334 households falling in the category, the $50,000 to $74,999 income range is the most frequent in Williamsburg, accounting for 20.9% of all households. In contrast, only 21 households (1.3%) fall into the $150,000 to $199,999 income bracket, making it the least populous group.
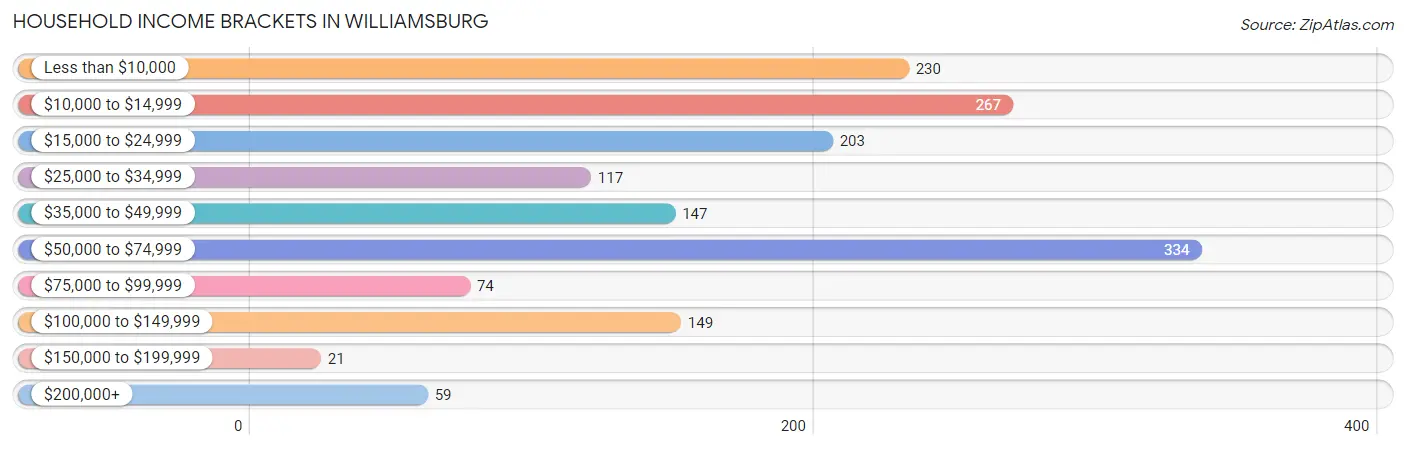
| Income Bracket | # Households | % Households |
| Less than $10,000 | 230 | 14.4% |
| $10,000 to $14,999 | 267 | 16.7% |
| $15,000 to $24,999 | 203 | 12.7% |
| $25,000 to $34,999 | 117 | 7.3% |
| $35,000 to $49,999 | 147 | 9.2% |
| $50,000 to $74,999 | 334 | 20.9% |
| $75,000 to $99,999 | 74 | 4.6% |
| $100,000 to $149,999 | 149 | 9.3% |
| $150,000 to $199,999 | 21 | 1.3% |
| $200,000+ | 59 | 3.7% |
Household Income by Householder Age in Williamsburg
The median household income in Williamsburg is $33,875, with the highest median household income of $50,745 found in the 45 to 64 years age bracket for the primary householder. A total of 646 households (40.4%) fall into this category. Meanwhile, the 65+ years age bracket for the primary householder has the lowest median household income of $0, with 382 households (23.9%) in this group.
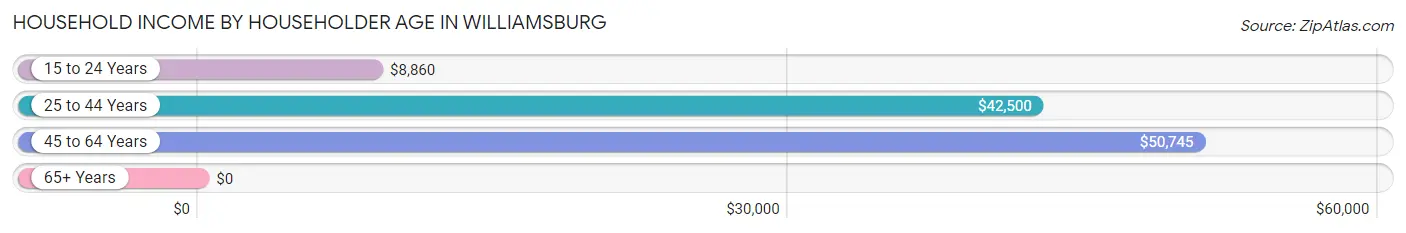
| Income Bracket | # Households | Median Income |
| 15 to 24 Years | 126 (7.9%) | $8,860 |
| 25 to 44 Years | 444 (27.8%) | $42,500 |
| 45 to 64 Years | 646 (40.4%) | $50,745 |
| 65+ Years | 382 (23.9%) | $0 |
| Total | 1,598 (100.0%) | $33,875 |
Poverty in Williamsburg
Income Below Poverty by Sex and Age in Williamsburg
With 32.3% poverty level for males and 33.6% for females among the residents of Williamsburg, 35 to 44 year old males and 18 to 24 year old females are the most vulnerable to poverty, with 153 males (86.4%) and 178 females (79.5%) in their respective age groups living below the poverty level.
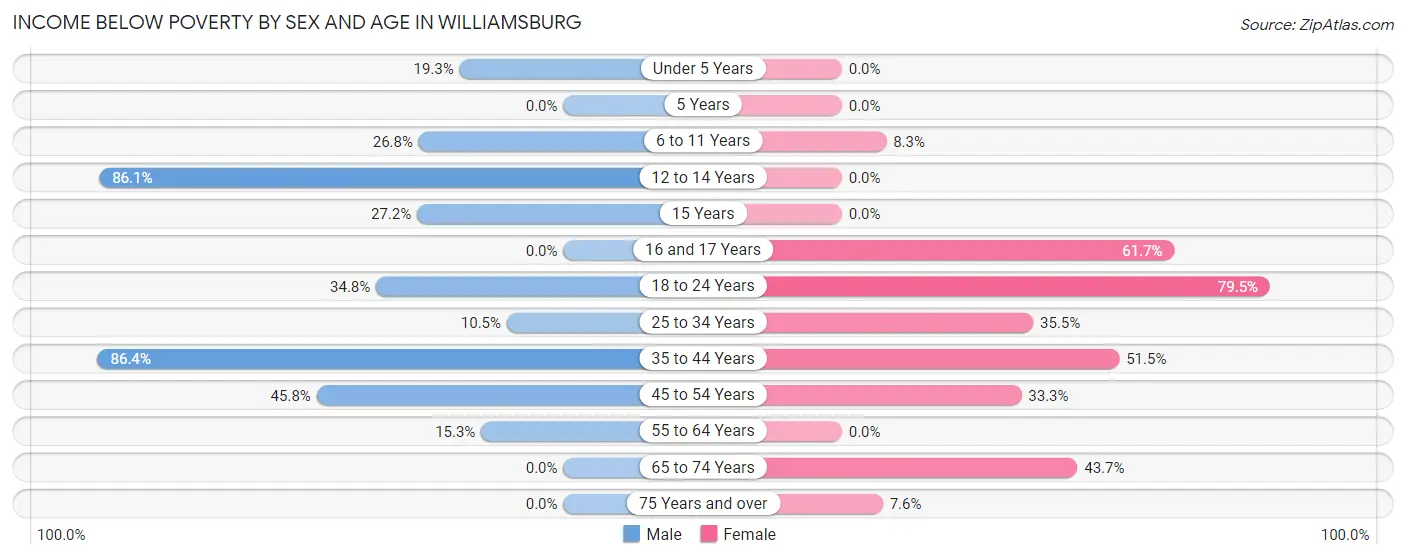
| Age Bracket | Male | Female |
| Under 5 Years | 21 (19.3%) | 0 (0.0%) |
| 5 Years | 0 (0.0%) | 0 (0.0%) |
| 6 to 11 Years | 11 (26.8%) | 8 (8.3%) |
| 12 to 14 Years | 87 (86.1%) | 0 (0.0%) |
| 15 Years | 22 (27.2%) | 0 (0.0%) |
| 16 and 17 Years | 0 (0.0%) | 50 (61.7%) |
| 18 to 24 Years | 123 (34.7%) | 178 (79.5%) |
| 25 to 34 Years | 32 (10.5%) | 87 (35.5%) |
| 35 to 44 Years | 153 (86.4%) | 137 (51.5%) |
| 45 to 54 Years | 125 (45.8%) | 108 (33.3%) |
| 55 to 64 Years | 43 (15.2%) | 0 (0.0%) |
| 65 to 74 Years | 0 (0.0%) | 73 (43.7%) |
| 75 Years and over | 0 (0.0%) | 18 (7.6%) |
| Total | 617 (32.3%) | 659 (33.6%) |
Income Above Poverty by Sex and Age in Williamsburg
According to the poverty statistics in Williamsburg, males aged 5 years and females aged under 5 years are the age groups that are most secure financially, with 100.0% of males and 100.0% of females in these age groups living above the poverty line.
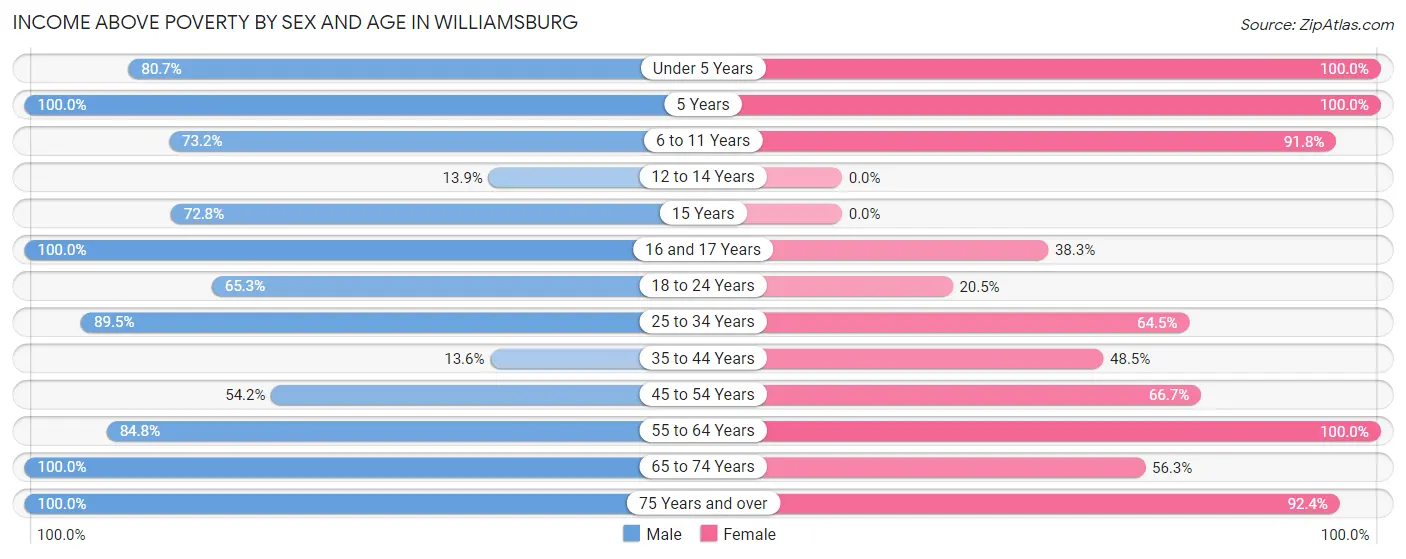
| Age Bracket | Male | Female |
| Under 5 Years | 88 (80.7%) | 121 (100.0%) |
| 5 Years | 28 (100.0%) | 11 (100.0%) |
| 6 to 11 Years | 30 (73.2%) | 89 (91.7%) |
| 12 to 14 Years | 14 (13.9%) | 0 (0.0%) |
| 15 Years | 59 (72.8%) | 0 (0.0%) |
| 16 and 17 Years | 40 (100.0%) | 31 (38.3%) |
| 18 to 24 Years | 231 (65.2%) | 46 (20.5%) |
| 25 to 34 Years | 273 (89.5%) | 158 (64.5%) |
| 35 to 44 Years | 24 (13.6%) | 129 (48.5%) |
| 45 to 54 Years | 148 (54.2%) | 216 (66.7%) |
| 55 to 64 Years | 239 (84.8%) | 186 (100.0%) |
| 65 to 74 Years | 9 (100.0%) | 94 (56.3%) |
| 75 Years and over | 111 (100.0%) | 219 (92.4%) |
| Total | 1,294 (67.7%) | 1,300 (66.4%) |
Income Below Poverty Among Married-Couple Families in Williamsburg
The poverty statistics for married-couple families in Williamsburg show that 16.2% or 121 of the total 749 families live below the poverty line. Families with 1 or 2 children have the highest poverty rate of 22.7%, comprising of 46 families. On the other hand, families with 3 or 4 children have the lowest poverty rate of 0.0%, which includes 0 families.
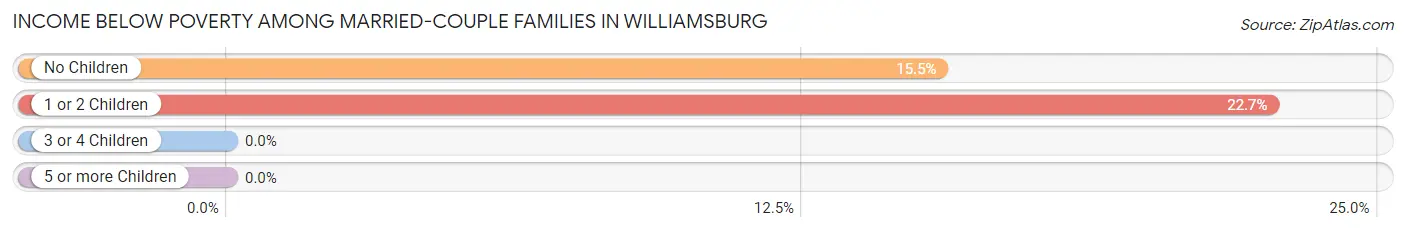
| Children | Above Poverty | Below Poverty |
| No Children | 410 (84.5%) | 75 (15.5%) |
| 1 or 2 Children | 157 (77.3%) | 46 (22.7%) |
| 3 or 4 Children | 61 (100.0%) | 0 (0.0%) |
| 5 or more Children | 0 (0.0%) | 0 (0.0%) |
| Total | 628 (83.9%) | 121 (16.2%) |
Income Below Poverty Among Single-Parent Households in Williamsburg
According to the poverty data in Williamsburg, 27.7% or 36 single-father households and 54.7% or 76 single-mother households are living below the poverty line. Among single-father households, those with 1 or 2 children have the highest poverty rate, with 36 households (35.6%) experiencing poverty. Likewise, among single-mother households, those with 1 or 2 children have the highest poverty rate, with 66 households (85.7%) falling below the poverty line.
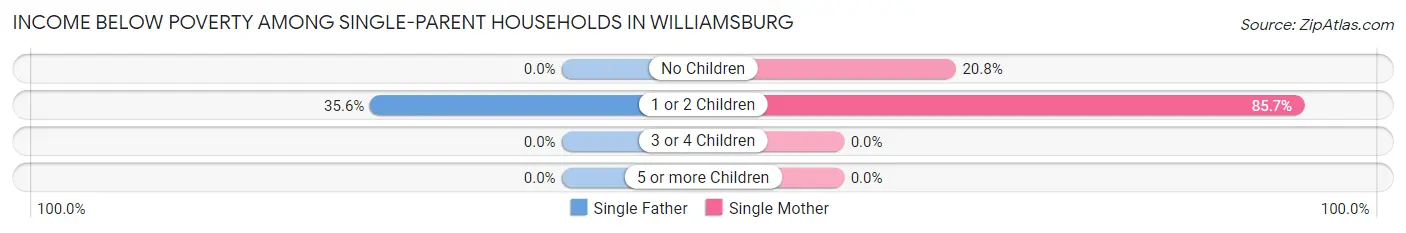
| Children | Single Father | Single Mother |
| No Children | 0 (0.0%) | 10 (20.8%) |
| 1 or 2 Children | 36 (35.6%) | 66 (85.7%) |
| 3 or 4 Children | 0 (0.0%) | 0 (0.0%) |
| 5 or more Children | 0 (0.0%) | 0 (0.0%) |
| Total | 36 (27.7%) | 76 (54.7%) |
Income Below Poverty Among Married-Couple vs Single-Parent Households in Williamsburg
The poverty data for Williamsburg shows that 121 of the married-couple family households (16.2%) and 112 of the single-parent households (41.6%) are living below the poverty level. Within the married-couple family households, those with 1 or 2 children have the highest poverty rate, with 46 households (22.7%) falling below the poverty line. Among the single-parent households, those with 1 or 2 children have the highest poverty rate, with 102 household (57.3%) living below poverty.
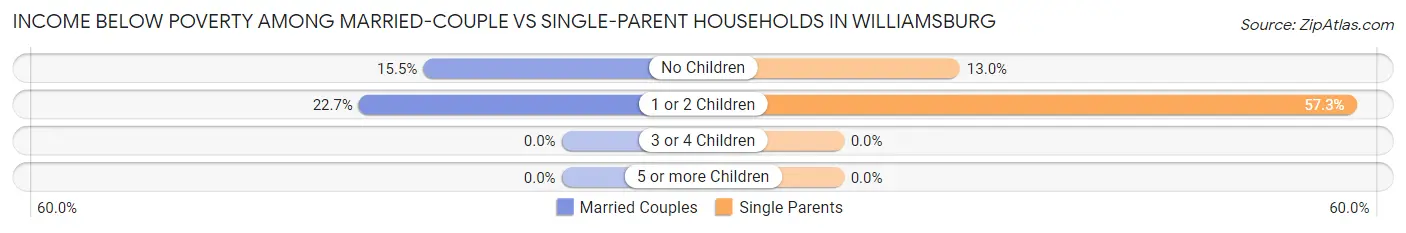
| Children | Married-Couple Families | Single-Parent Households |
| No Children | 75 (15.5%) | 10 (13.0%) |
| 1 or 2 Children | 46 (22.7%) | 102 (57.3%) |
| 3 or 4 Children | 0 (0.0%) | 0 (0.0%) |
| 5 or more Children | 0 (0.0%) | 0 (0.0%) |
| Total | 121 (16.2%) | 112 (41.6%) |
Race in Williamsburg
The most populous races in Williamsburg are White / Caucasian (4,756 | 90.9%), Black / African American (203 | 3.9%), and Hispanic or Latino (168 | 3.2%).
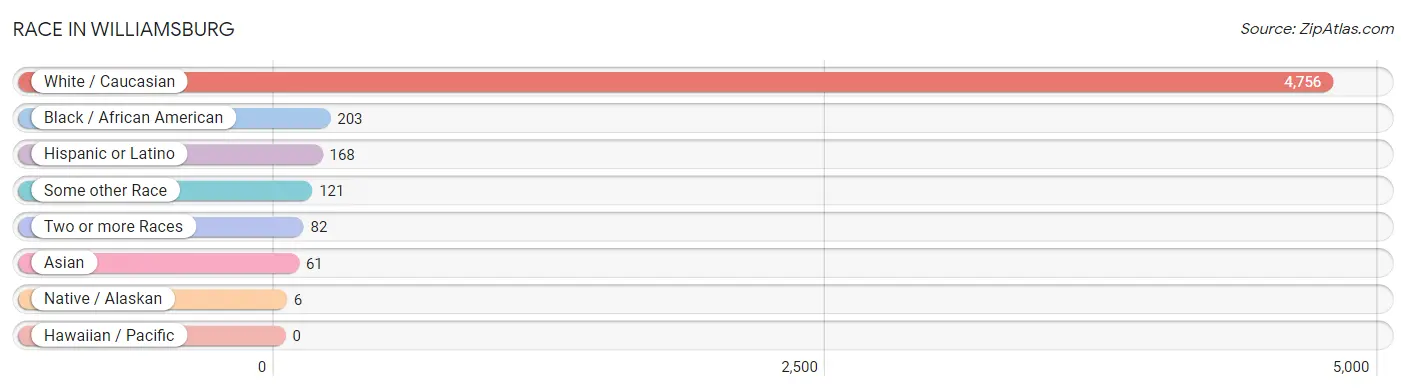
| Race | # Population | % Population |
| Asian | 61 | 1.2% |
| Black / African American | 203 | 3.9% |
| Hawaiian / Pacific | 0 | 0.0% |
| Hispanic or Latino | 168 | 3.2% |
| Native / Alaskan | 6 | 0.1% |
| White / Caucasian | 4,756 | 90.9% |
| Two or more Races | 82 | 1.6% |
| Some other Race | 121 | 2.3% |
| Total | 5,229 | 100.0% |
Ancestry in Williamsburg
The most populous ancestries reported in Williamsburg are American (567 | 10.8%), English (500 | 9.6%), German (471 | 9.0%), Irish (406 | 7.8%), and Welsh (180 | 3.4%), together accounting for 40.6% of all Williamsburg residents.
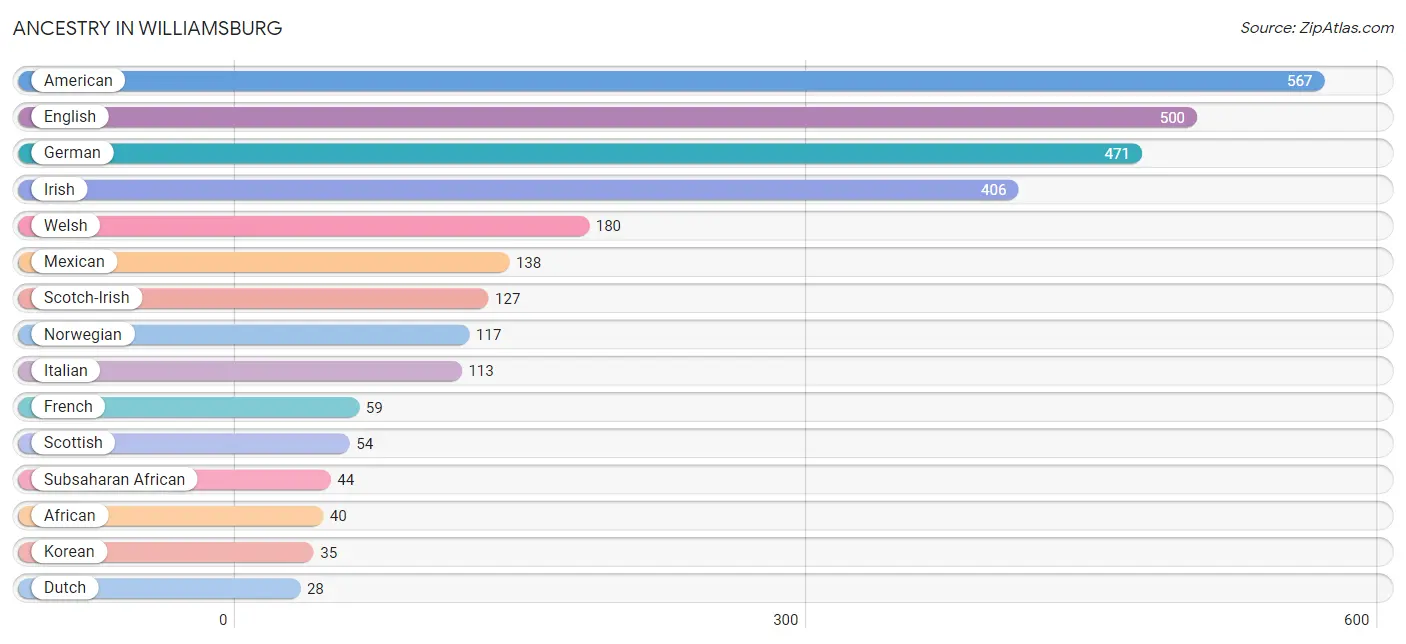
| Ancestry | # Population | % Population |
| African | 40 | 0.8% |
| American | 567 | 10.8% |
| Arab | 15 | 0.3% |
| Argentinean | 4 | 0.1% |
| British | 20 | 0.4% |
| Canadian | 7 | 0.1% |
| Central American | 6 | 0.1% |
| Central American Indian | 6 | 0.1% |
| Dutch | 28 | 0.5% |
| English | 500 | 9.6% |
| European | 16 | 0.3% |
| French | 59 | 1.1% |
| German | 471 | 9.0% |
| Guatemalan | 6 | 0.1% |
| Hungarian | 7 | 0.1% |
| Indian (Asian) | 19 | 0.4% |
| Irish | 406 | 7.8% |
| Italian | 113 | 2.2% |
| Korean | 35 | 0.7% |
| Mexican | 138 | 2.6% |
| Nigerian | 4 | 0.1% |
| Norwegian | 117 | 2.2% |
| Portuguese | 6 | 0.1% |
| Romanian | 4 | 0.1% |
| Scotch-Irish | 127 | 2.4% |
| Scottish | 54 | 1.0% |
| South American | 4 | 0.1% |
| Spaniard | 20 | 0.4% |
| Subsaharan African | 44 | 0.8% |
| Thai | 7 | 0.1% |
| Welsh | 180 | 3.4% |
| West Indian | 4 | 0.1% | View All 32 Rows |
Immigrants in Williamsburg
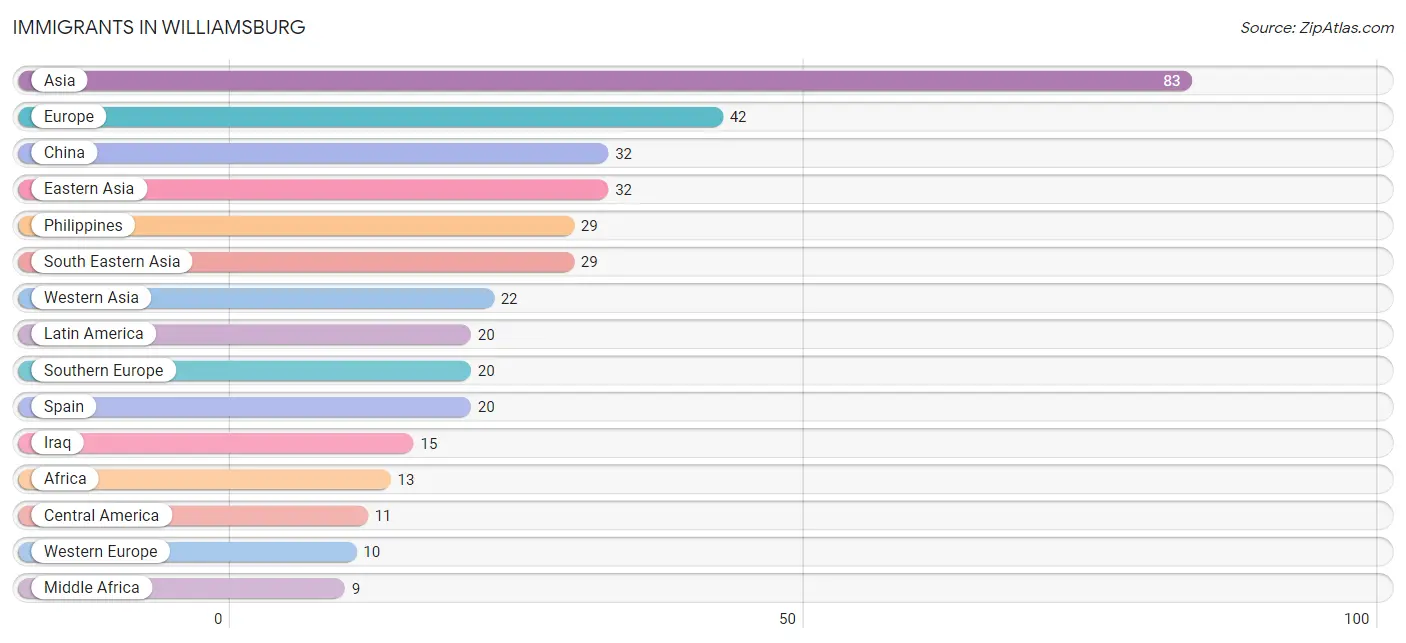
The most numerous immigrant groups reported in Williamsburg came from Asia (83 | 1.6%), Europe (42 | 0.8%), China (32 | 0.6%), Eastern Asia (32 | 0.6%), and Philippines (29 | 0.5%), together accounting for 4.2% of all Williamsburg residents.
| Immigration Origin | # Population | % Population |
| Africa | 13 | 0.3% |
| Asia | 83 | 1.6% |
| Brazil | 5 | 0.1% |
| Caribbean | 4 | 0.1% |
| Central America | 11 | 0.2% |
| China | 32 | 0.6% |
| Eastern Asia | 32 | 0.6% |
| Eastern Europe | 4 | 0.1% |
| Europe | 42 | 0.8% |
| France | 3 | 0.1% |
| Germany | 4 | 0.1% |
| Guatemala | 6 | 0.1% |
| Iraq | 15 | 0.3% |
| Latin America | 20 | 0.4% |
| Mexico | 5 | 0.1% |
| Middle Africa | 9 | 0.2% |
| Moldova | 4 | 0.1% |
| Netherlands | 3 | 0.1% |
| Nigeria | 4 | 0.1% |
| Northern Europe | 8 | 0.2% |
| Philippines | 29 | 0.5% |
| Saudi Arabia | 7 | 0.1% |
| South America | 5 | 0.1% |
| South Eastern Asia | 29 | 0.5% |
| Southern Europe | 20 | 0.4% |
| Spain | 20 | 0.4% |
| Sweden | 4 | 0.1% |
| Trinidad and Tobago | 4 | 0.1% |
| Western Africa | 4 | 0.1% |
| Western Asia | 22 | 0.4% |
| Western Europe | 10 | 0.2% |
| Zaire | 9 | 0.2% | View All 32 Rows |
Sex and Age in Williamsburg
Sex and Age in Williamsburg
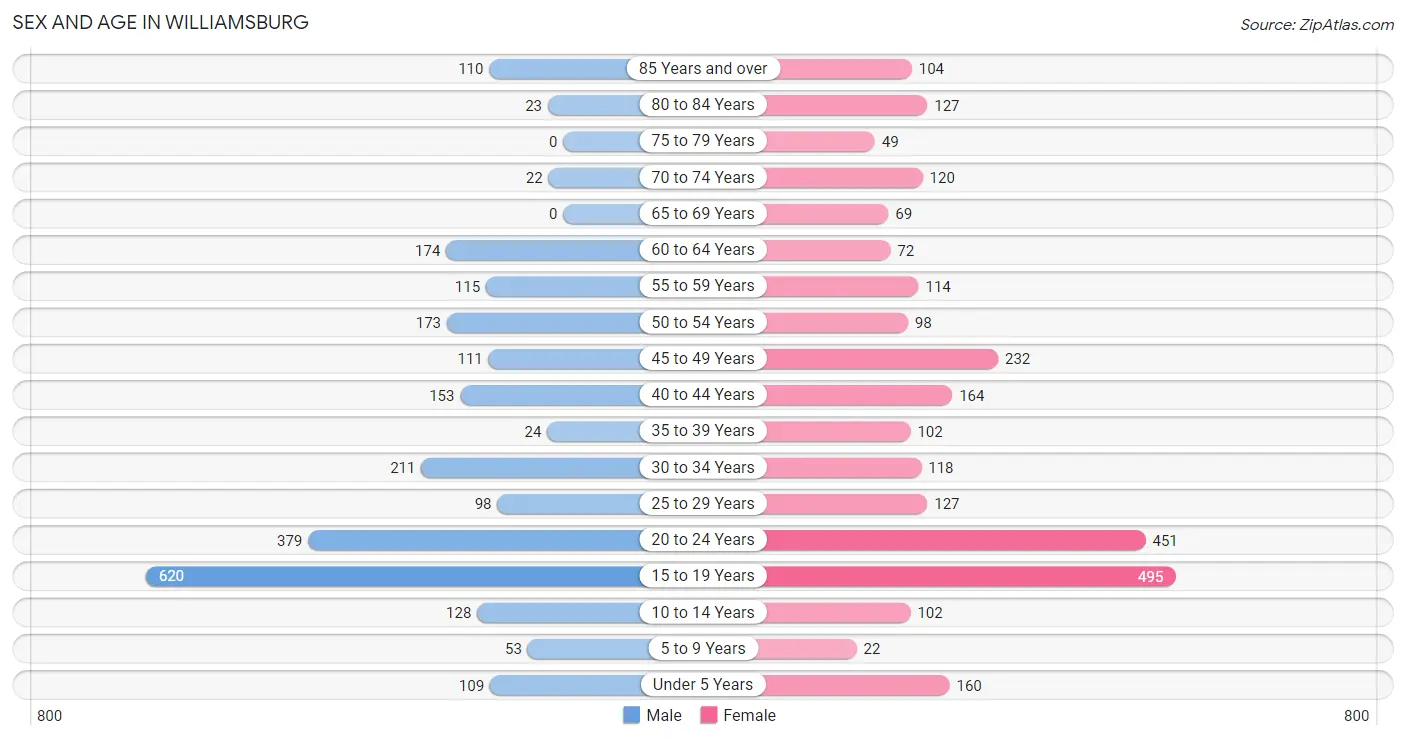
The most populous age groups in Williamsburg are 15 to 19 Years (620 | 24.8%) for men and 15 to 19 Years (495 | 18.2%) for women.
| Age Bracket | Male | Female |
| Under 5 Years | 109 (4.3%) | 160 (5.9%) |
| 5 to 9 Years | 53 (2.1%) | 22 (0.8%) |
| 10 to 14 Years | 128 (5.1%) | 102 (3.7%) |
| 15 to 19 Years | 620 (24.8%) | 495 (18.2%) |
| 20 to 24 Years | 379 (15.1%) | 451 (16.5%) |
| 25 to 29 Years | 98 (3.9%) | 127 (4.7%) |
| 30 to 34 Years | 211 (8.4%) | 118 (4.3%) |
| 35 to 39 Years | 24 (1.0%) | 102 (3.7%) |
| 40 to 44 Years | 153 (6.1%) | 164 (6.0%) |
| 45 to 49 Years | 111 (4.4%) | 232 (8.5%) |
| 50 to 54 Years | 173 (6.9%) | 98 (3.6%) |
| 55 to 59 Years | 115 (4.6%) | 114 (4.2%) |
| 60 to 64 Years | 174 (7.0%) | 72 (2.6%) |
| 65 to 69 Years | 0 (0.0%) | 69 (2.5%) |
| 70 to 74 Years | 22 (0.9%) | 120 (4.4%) |
| 75 to 79 Years | 0 (0.0%) | 49 (1.8%) |
| 80 to 84 Years | 23 (0.9%) | 127 (4.7%) |
| 85 Years and over | 110 (4.4%) | 104 (3.8%) |
| Total | 2,503 (100.0%) | 2,726 (100.0%) |
Families and Households in Williamsburg
Median Family Size in Williamsburg
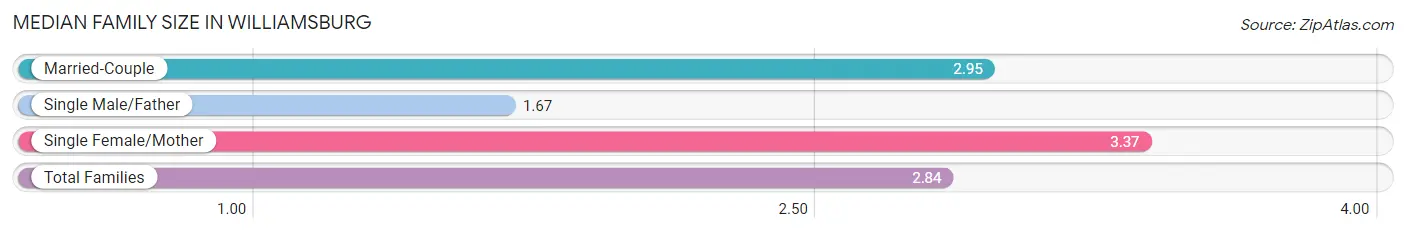
The median family size in Williamsburg is 2.84 persons per family, with single female/mother families (139 | 13.7%) accounting for the largest median family size of 3.37 persons per family. On the other hand, single male/father families (130 | 12.8%) represent the smallest median family size with 1.67 persons per family.
| Family Type | # Families | Family Size |
| Married-Couple | 749 (73.6%) | 2.95 |
| Single Male/Father | 130 (12.8%) | 1.67 |
| Single Female/Mother | 139 (13.7%) | 3.37 |
| Total Families | 1,018 (100.0%) | 2.84 |
Median Household Size in Williamsburg
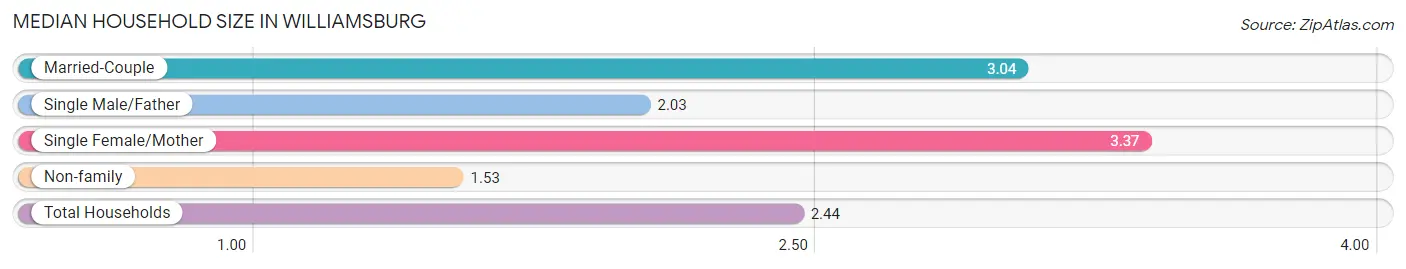
The median household size in Williamsburg is 2.44 persons per household, with single female/mother households (139 | 8.7%) accounting for the largest median household size of 3.37 persons per household. non-family households (580 | 36.3%) represent the smallest median household size with 1.53 persons per household.
| Household Type | # Households | Household Size |
| Married-Couple | 749 (46.9%) | 3.04 |
| Single Male/Father | 130 (8.1%) | 2.03 |
| Single Female/Mother | 139 (8.7%) | 3.37 |
| Non-family | 580 (36.3%) | 1.53 |
| Total Households | 1,598 (100.0%) | 2.44 |
Household Size by Marriage Status in Williamsburg
Out of a total of 1,598 households in Williamsburg, 1,018 (63.7%) are family households, while 580 (36.3%) are nonfamily households. The most numerous type of family households are 2-person households, comprising 481, and the most common type of nonfamily households are 1-person households, comprising 414.
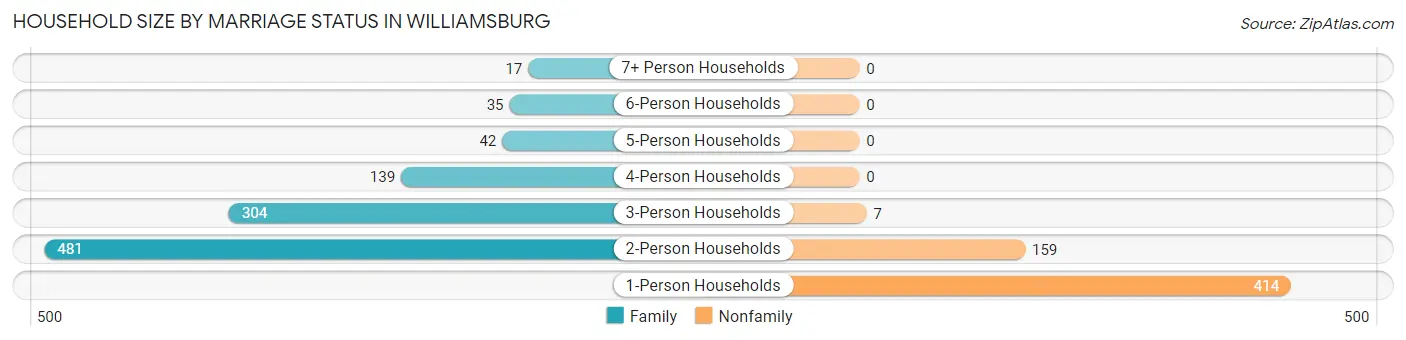
| Household Size | Family Households | Nonfamily Households |
| 1-Person Households | - | 414 (25.9%) |
| 2-Person Households | 481 (30.1%) | 159 (10.0%) |
| 3-Person Households | 304 (19.0%) | 7 (0.4%) |
| 4-Person Households | 139 (8.7%) | 0 (0.0%) |
| 5-Person Households | 42 (2.6%) | 0 (0.0%) |
| 6-Person Households | 35 (2.2%) | 0 (0.0%) |
| 7+ Person Households | 17 (1.1%) | 0 (0.0%) |
| Total | 1,018 (63.7%) | 580 (36.3%) |
Female Fertility in Williamsburg
Fertility by Age in Williamsburg
Average fertility rate in Williamsburg is 65.0 births per 1,000 women. Women in the age bracket of 20 to 34 years have the highest fertility rate with 165.0 births per 1,000 women. Women in the age bracket of 20 to 34 years acount for 100.0% of all women with births.
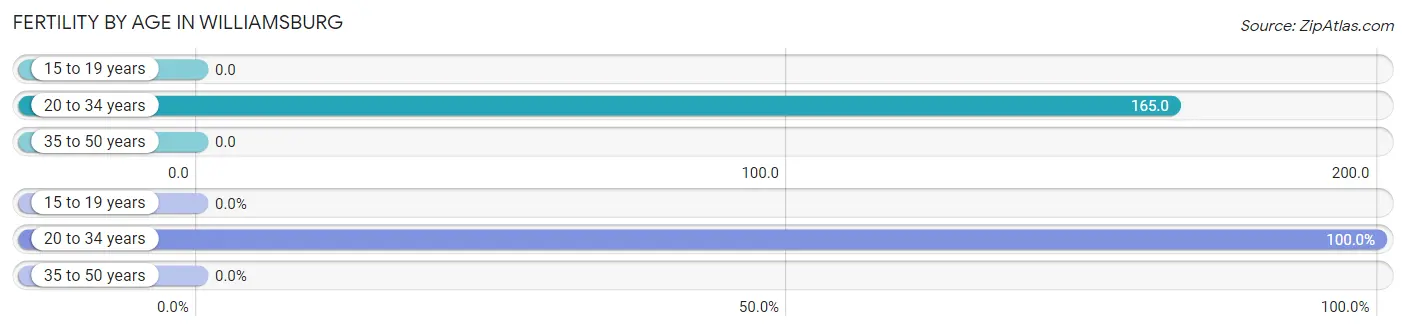
| Age Bracket | Women with Births | Births / 1,000 Women |
| 15 to 19 years | 0 (0.0%) | 0.0 |
| 20 to 34 years | 115 (100.0%) | 165.0 |
| 35 to 50 years | 0 (0.0%) | 0.0 |
| Total | 115 (100.0%) | 65.0 |
Fertility by Age by Marriage Status in Williamsburg
84.3% of women with births (115) in Williamsburg are married. The highest percentage of unmarried women with births falls into 20 to 34 years age bracket with 15.7% of them unmarried at the time of birth, while the lowest percentage of unmarried women with births belong to 20 to 34 years age bracket with 15.6% of them unmarried.
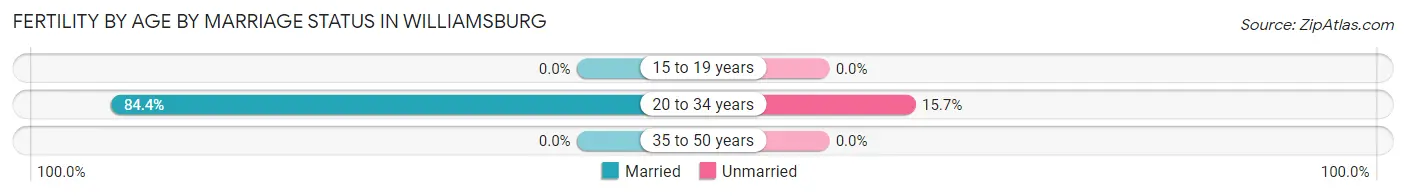
| Age Bracket | Married | Unmarried |
| 15 to 19 years | 0 (0.0%) | 0 (0.0%) |
| 20 to 34 years | 97 (84.4%) | 18 (15.7%) |
| 35 to 50 years | 0 (0.0%) | 0 (0.0%) |
| Total | 97 (84.4%) | 18 (15.7%) |
Fertility by Education in Williamsburg
Average fertility rate in Williamsburg is 65.0 births per 1,000 women. Women with the education attainment of graduate degree have the highest fertility rate of 164.0 births per 1,000 women, while women with the education attainment of high school diploma have the lowest fertility at 18.0 births per 1,000 women. Women with the education attainment of college or associate's degree represent 31.3% of all women with births.
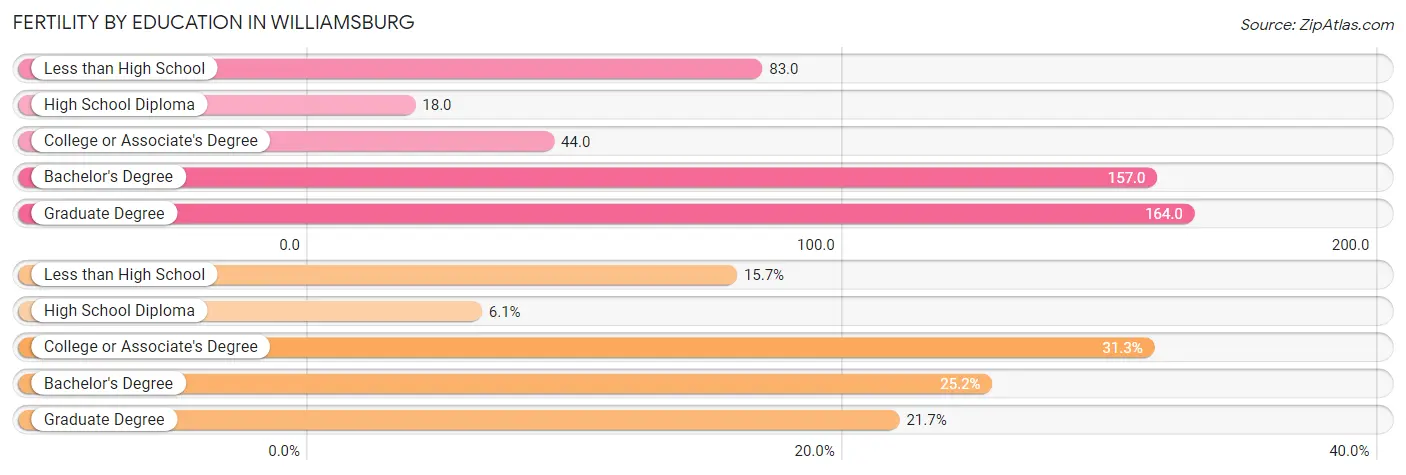
| Educational Attainment | Women with Births | Births / 1,000 Women |
| Less than High School | 18 (15.7%) | 83.0 |
| High School Diploma | 7 (6.1%) | 18.0 |
| College or Associate's Degree | 36 (31.3%) | 44.0 |
| Bachelor's Degree | 29 (25.2%) | 157.0 |
| Graduate Degree | 25 (21.7%) | 164.0 |
| Total | 115 (100.0%) | 65.0 |
Fertility by Education by Marriage Status in Williamsburg
15.7% of women with births in Williamsburg are unmarried. Women with the educational attainment of less than high school are most likely to be married with 100.0% of them married at childbirth, while women with the educational attainment of high school diploma are least likely to be married with 100.0% of them unmarried at childbirth.
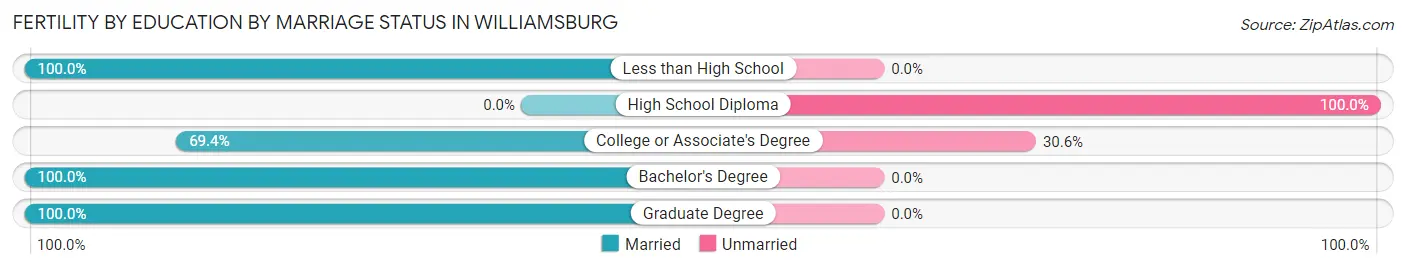
| Educational Attainment | Married | Unmarried |
| Less than High School | 18 (100.0%) | 0 (0.0%) |
| High School Diploma | 0 (0.0%) | 7 (100.0%) |
| College or Associate's Degree | 25 (69.4%) | 11 (30.6%) |
| Bachelor's Degree | 29 (100.0%) | 0 (0.0%) |
| Graduate Degree | 25 (100.0%) | 0 (0.0%) |
| Total | 97 (84.4%) | 18 (15.7%) |
Employment Characteristics in Williamsburg
Employment by Class of Employer in Williamsburg
Among the 1,795 employed individuals in Williamsburg, private company employees (1,026 | 57.2%), local government employees (241 | 13.4%), and not-for-profit organizations (237 | 13.2%) make up the most common classes of employment.
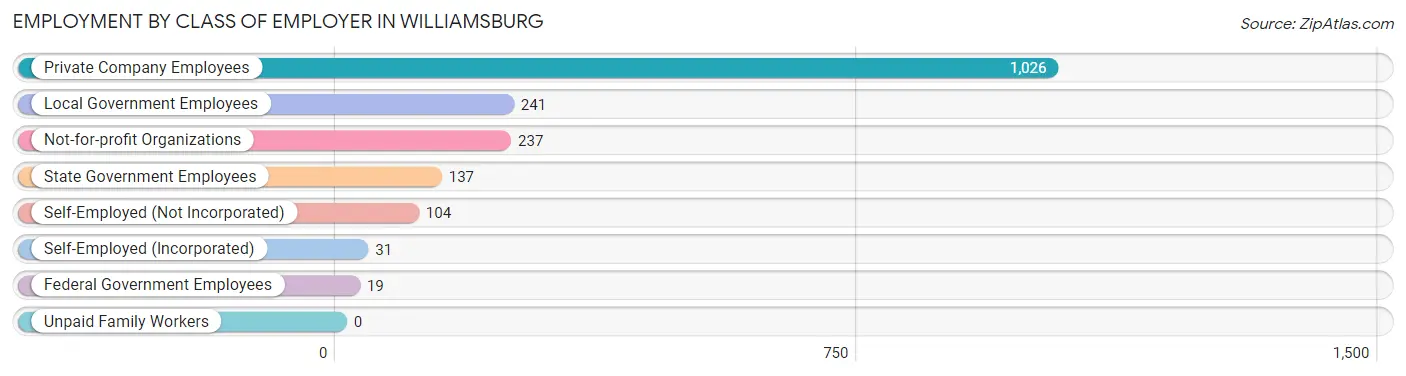
| Employer Class | # Employees | % Employees |
| Private Company Employees | 1,026 | 57.2% |
| Self-Employed (Incorporated) | 31 | 1.7% |
| Self-Employed (Not Incorporated) | 104 | 5.8% |
| Not-for-profit Organizations | 237 | 13.2% |
| Local Government Employees | 241 | 13.4% |
| State Government Employees | 137 | 7.6% |
| Federal Government Employees | 19 | 1.1% |
| Unpaid Family Workers | 0 | 0.0% |
| Total | 1,795 | 100.0% |
Employment Status by Age in Williamsburg
According to the labor force statistics for Williamsburg, out of the total population over 16 years of age (4,574), 46.8% or 2,141 individuals are in the labor force, with 12.1% or 259 of them unemployed. The age group with the highest labor force participation rate is 55 to 59 years, with 79.0% or 181 individuals in the labor force. Within the labor force, the 20 to 24 years age range has the highest percentage of unemployed individuals, with 32.8% or 144 of them being unemployed.
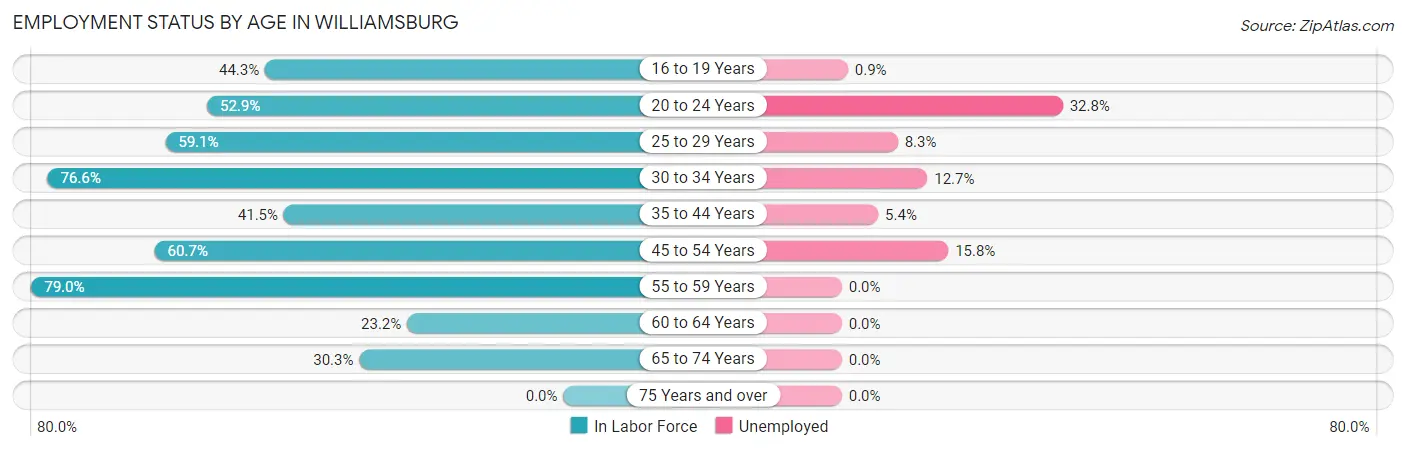
| Age Bracket | In Labor Force | Unemployed |
| 16 to 19 Years | 458 (44.3%) | 4 (0.9%) |
| 20 to 24 Years | 439 (52.9%) | 144 (32.8%) |
| 25 to 29 Years | 133 (59.1%) | 11 (8.3%) |
| 30 to 34 Years | 252 (76.6%) | 32 (12.7%) |
| 35 to 44 Years | 184 (41.5%) | 10 (5.4%) |
| 45 to 54 Years | 373 (60.7%) | 59 (15.8%) |
| 55 to 59 Years | 181 (79.0%) | 0 (0.0%) |
| 60 to 64 Years | 57 (23.2%) | 0 (0.0%) |
| 65 to 74 Years | 64 (30.3%) | 0 (0.0%) |
| 75 Years and over | 0 (0.0%) | 0 (0.0%) |
| Total | 2,141 (46.8%) | 259 (12.1%) |
Employment Status by Educational Attainment in Williamsburg
According to labor force statistics for Williamsburg, 56.6% of individuals (1,181) out of the total population between 25 and 64 years of age (2,086) are in the labor force, with 9.5% or 112 of them being unemployed. The group with the highest labor force participation rate are those with the educational attainment of bachelor's degree or higher, with 82.8% or 432 individuals in the labor force. Within the labor force, individuals with less than high school education have the highest percentage of unemployment, with 17.4% or 36 of them being unemployed.
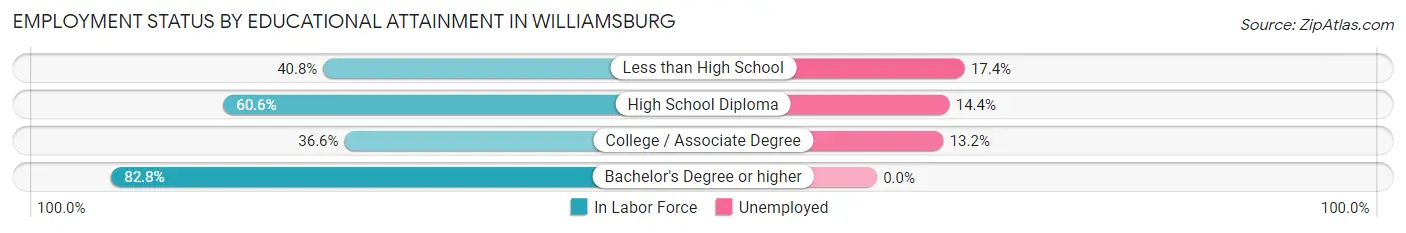
| Educational Attainment | In Labor Force | Unemployed |
| Less than High School | 207 (40.8%) | 88 (17.4%) |
| High School Diploma | 389 (60.6%) | 92 (14.4%) |
| College / Associate Degree | 152 (36.6%) | 55 (13.2%) |
| Bachelor's Degree or higher | 432 (82.8%) | 0 (0.0%) |
| Total | 1,181 (56.6%) | 198 (9.5%) |
Employment Occupations by Sex in Williamsburg
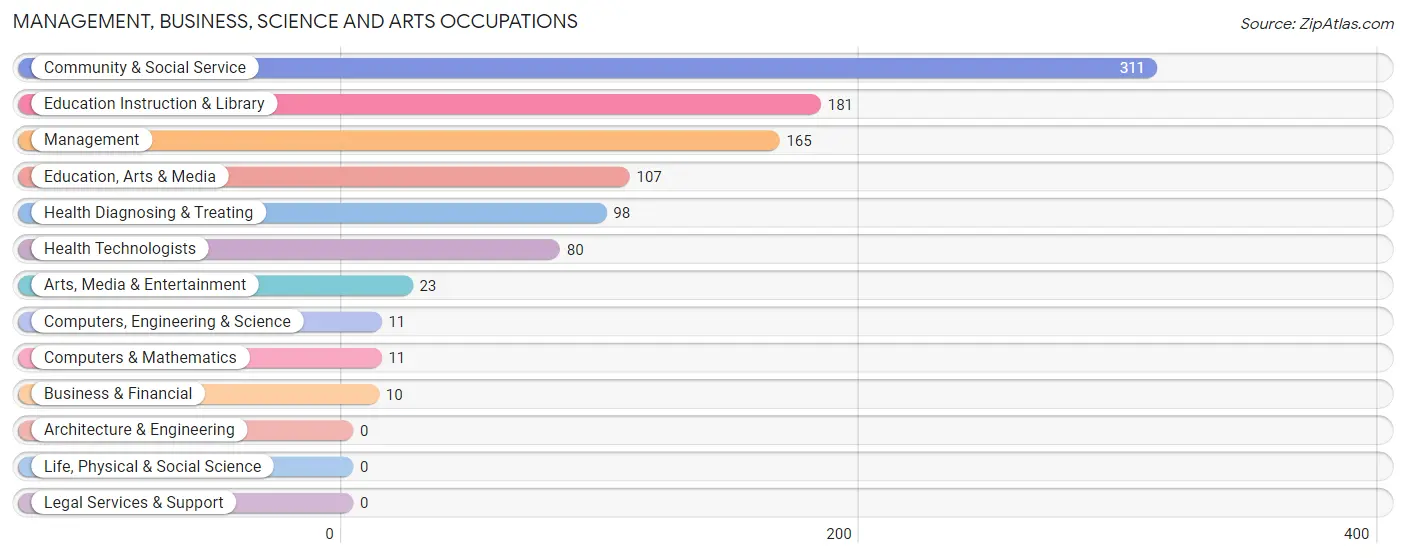
Management, Business, Science and Arts Occupations
The most common Management, Business, Science and Arts occupations in Williamsburg are Community & Social Service (311 | 16.5%), Education Instruction & Library (181 | 9.6%), Management (165 | 8.8%), Education, Arts & Media (107 | 5.7%), and Health Diagnosing & Treating (98 | 5.2%).
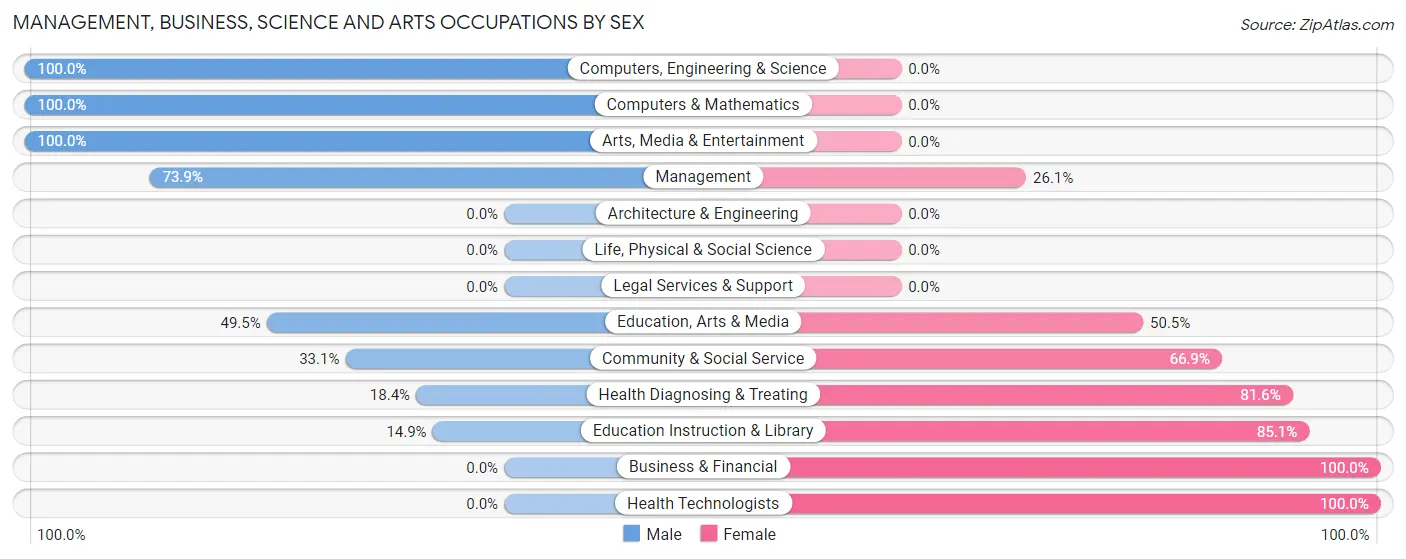
Management, Business, Science and Arts Occupations by Sex
Within the Management, Business, Science and Arts occupations in Williamsburg, the most male-oriented occupations are Computers, Engineering & Science (100.0%), Computers & Mathematics (100.0%), and Arts, Media & Entertainment (100.0%), while the most female-oriented occupations are Business & Financial (100.0%), Health Technologists (100.0%), and Education Instruction & Library (85.1%).
| Occupation | Male | Female |
| Management | 122 (73.9%) | 43 (26.1%) |
| Business & Financial | 0 (0.0%) | 10 (100.0%) |
| Computers, Engineering & Science | 11 (100.0%) | 0 (0.0%) |
| Computers & Mathematics | 11 (100.0%) | 0 (0.0%) |
| Architecture & Engineering | 0 (0.0%) | 0 (0.0%) |
| Life, Physical & Social Science | 0 (0.0%) | 0 (0.0%) |
| Community & Social Service | 103 (33.1%) | 208 (66.9%) |
| Education, Arts & Media | 53 (49.5%) | 54 (50.5%) |
| Legal Services & Support | 0 (0.0%) | 0 (0.0%) |
| Education Instruction & Library | 27 (14.9%) | 154 (85.1%) |
| Arts, Media & Entertainment | 23 (100.0%) | 0 (0.0%) |
| Health Diagnosing & Treating | 18 (18.4%) | 80 (81.6%) |
| Health Technologists | 0 (0.0%) | 80 (100.0%) |
| Total (Category) | 254 (42.7%) | 341 (57.3%) |
| Total (Overall) | 854 (45.4%) | 1,027 (54.6%) |
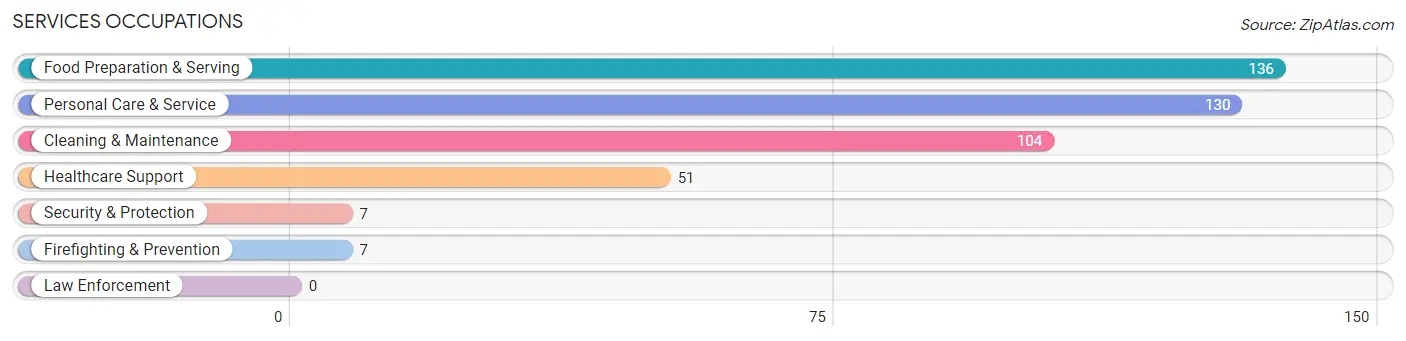
Services Occupations
The most common Services occupations in Williamsburg are Food Preparation & Serving (136 | 7.2%), Personal Care & Service (130 | 6.9%), Cleaning & Maintenance (104 | 5.5%), Healthcare Support (51 | 2.7%), and Security & Protection (7 | 0.4%).
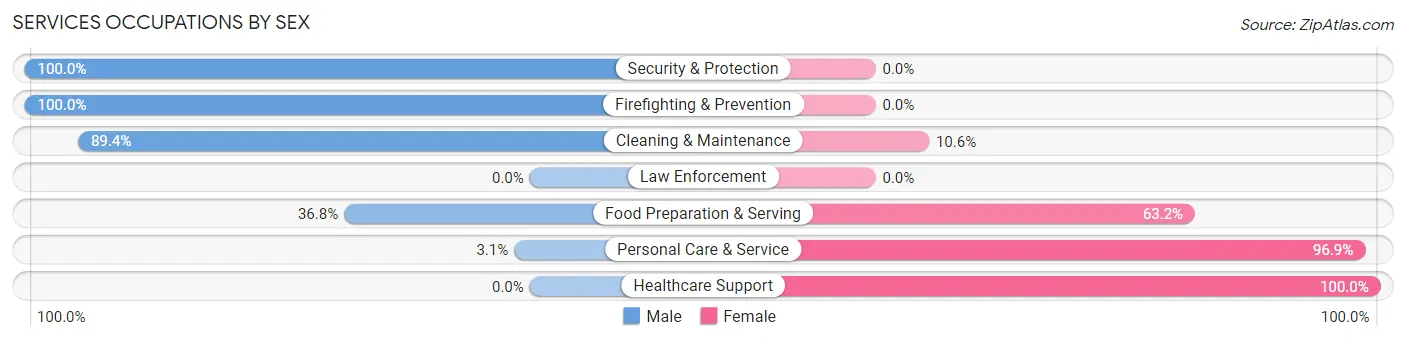
Services Occupations by Sex
Within the Services occupations in Williamsburg, the most male-oriented occupations are Security & Protection (100.0%), Firefighting & Prevention (100.0%), and Cleaning & Maintenance (89.4%), while the most female-oriented occupations are Healthcare Support (100.0%), Personal Care & Service (96.9%), and Food Preparation & Serving (63.2%).
| Occupation | Male | Female |
| Healthcare Support | 0 (0.0%) | 51 (100.0%) |
| Security & Protection | 7 (100.0%) | 0 (0.0%) |
| Firefighting & Prevention | 7 (100.0%) | 0 (0.0%) |
| Law Enforcement | 0 (0.0%) | 0 (0.0%) |
| Food Preparation & Serving | 50 (36.8%) | 86 (63.2%) |
| Cleaning & Maintenance | 93 (89.4%) | 11 (10.6%) |
| Personal Care & Service | 4 (3.1%) | 126 (96.9%) |
| Total (Category) | 154 (36.0%) | 274 (64.0%) |
| Total (Overall) | 854 (45.4%) | 1,027 (54.6%) |
Sales and Office Occupations
The most common Sales and Office occupations in Williamsburg are Office & Administration (311 | 16.5%), and Sales & Related (238 | 12.7%).

Sales and Office Occupations by Sex
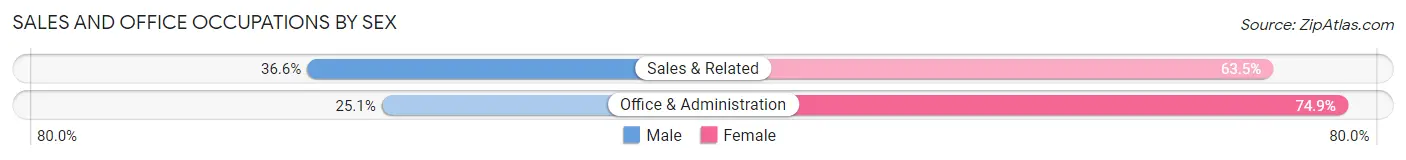
| Occupation | Male | Female |
| Sales & Related | 87 (36.5%) | 151 (63.4%) |
| Office & Administration | 78 (25.1%) | 233 (74.9%) |
| Total (Category) | 165 (30.0%) | 384 (70.0%) |
| Total (Overall) | 854 (45.4%) | 1,027 (54.6%) |
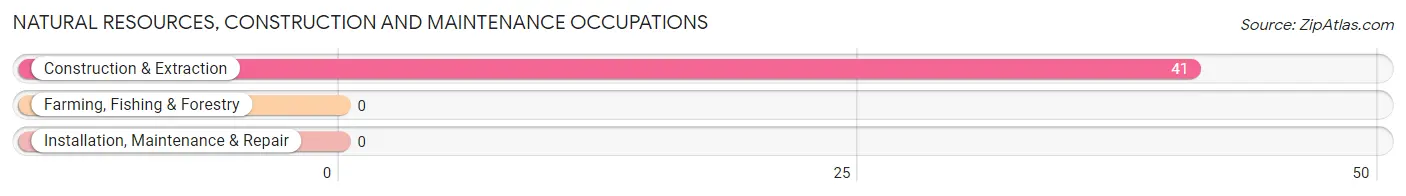
Natural Resources, Construction and Maintenance Occupations
The most common Natural Resources, Construction and Maintenance occupations in Williamsburg are , and Construction & Extraction (41 | 2.2%).
Natural Resources, Construction and Maintenance Occupations by Sex
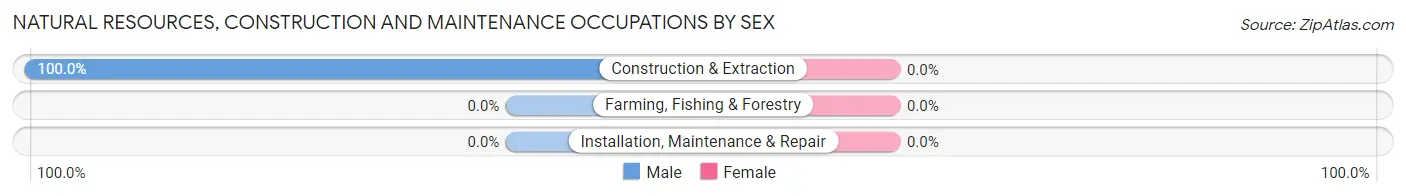
| Occupation | Male | Female |
| Farming, Fishing & Forestry | 0 (0.0%) | 0 (0.0%) |
| Construction & Extraction | 41 (100.0%) | 0 (0.0%) |
| Installation, Maintenance & Repair | 0 (0.0%) | 0 (0.0%) |
| Total (Category) | 41 (100.0%) | 0 (0.0%) |
| Total (Overall) | 854 (45.4%) | 1,027 (54.6%) |
Production, Transportation and Moving Occupations
The most common Production, Transportation and Moving occupations in Williamsburg are Material Moving (117 | 6.2%), Production (95 | 5.1%), and Transportation (56 | 3.0%).
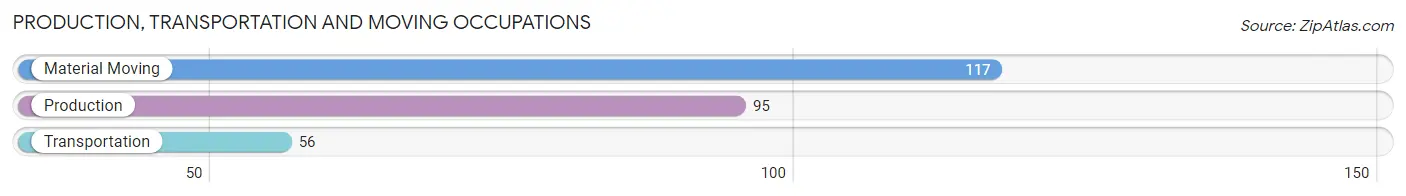
Production, Transportation and Moving Occupations by Sex
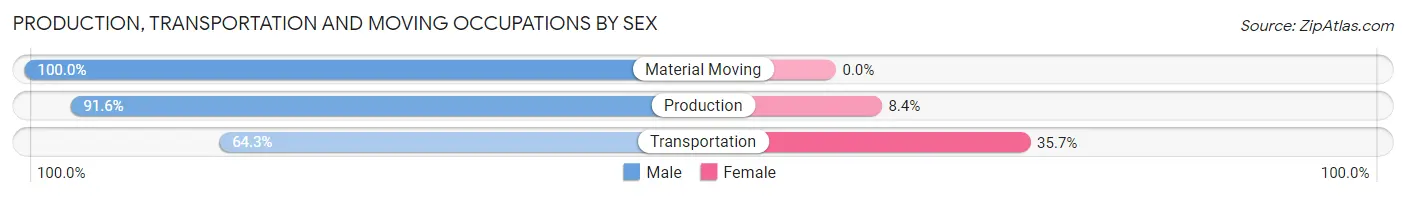
| Occupation | Male | Female |
| Production | 87 (91.6%) | 8 (8.4%) |
| Transportation | 36 (64.3%) | 20 (35.7%) |
| Material Moving | 117 (100.0%) | 0 (0.0%) |
| Total (Category) | 240 (89.5%) | 28 (10.4%) |
| Total (Overall) | 854 (45.4%) | 1,027 (54.6%) |
Employment Industries by Sex in Williamsburg
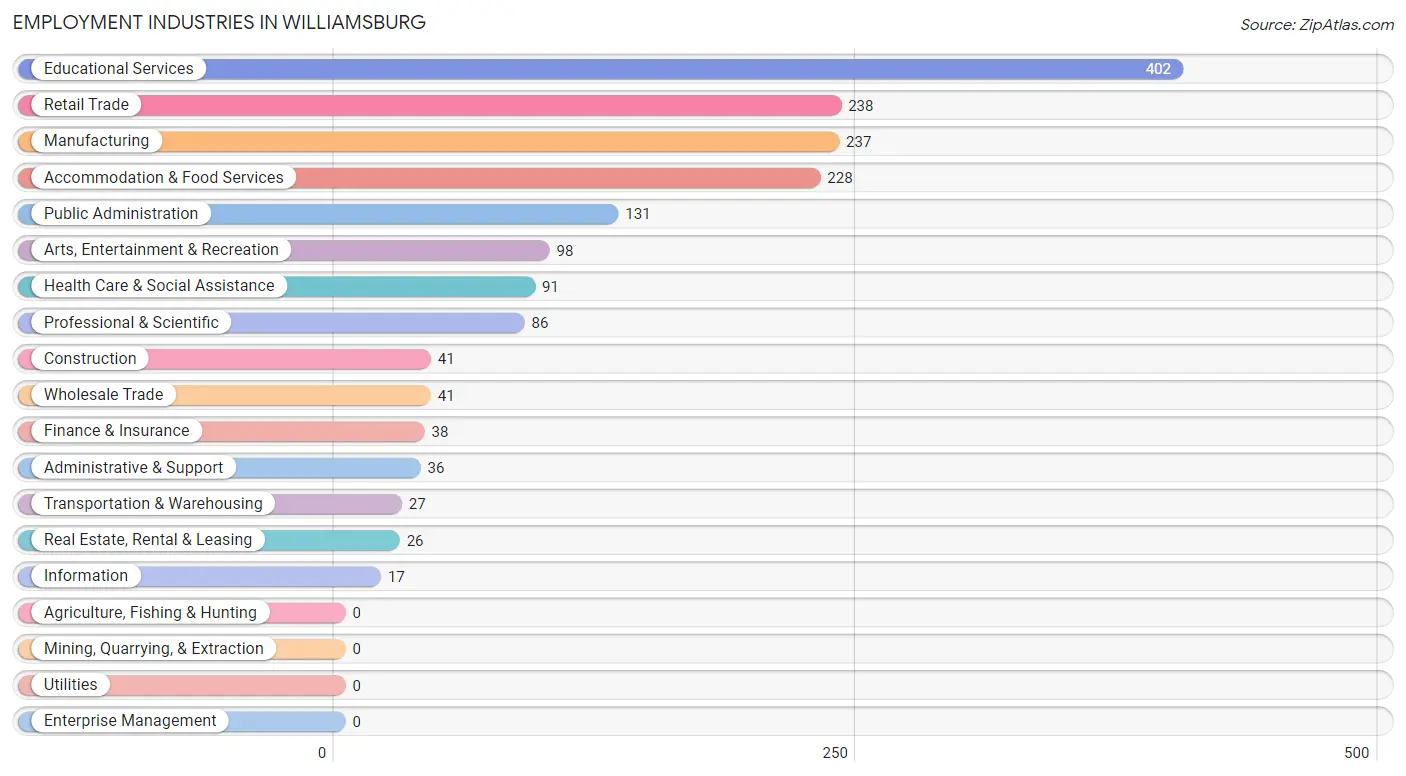
Employment Industries in Williamsburg
The major employment industries in Williamsburg include Educational Services (402 | 21.4%), Retail Trade (238 | 12.7%), Manufacturing (237 | 12.6%), Accommodation & Food Services (228 | 12.1%), and Public Administration (131 | 7.0%).
Employment Industries by Sex in Williamsburg
The Williamsburg industries that see more men than women are Construction (100.0%), Manufacturing (100.0%), and Wholesale Trade (100.0%), whereas the industries that tend to have a higher number of women are Information (100.0%), Finance & Insurance (100.0%), and Real Estate, Rental & Leasing (100.0%).
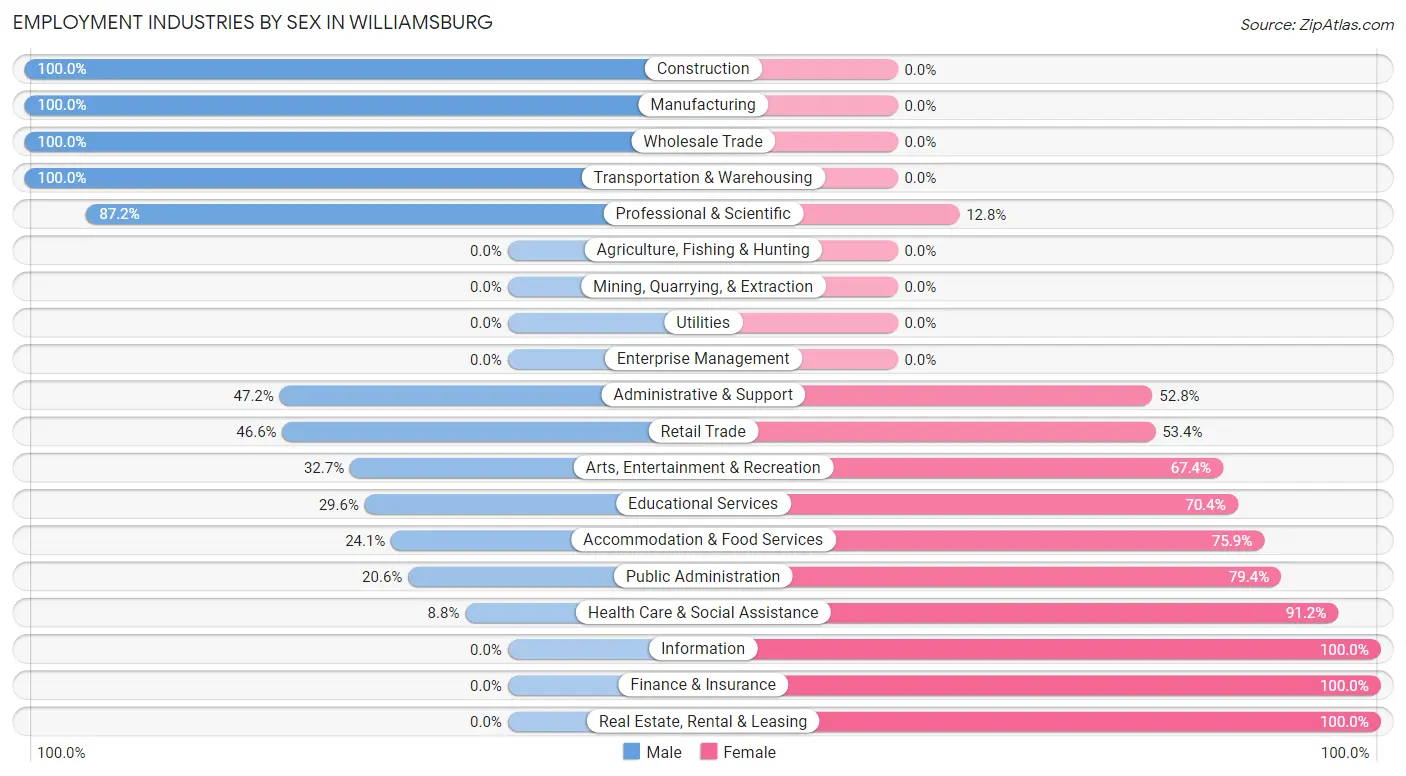
| Industry | Male | Female |
| Agriculture, Fishing & Hunting | 0 (0.0%) | 0 (0.0%) |
| Mining, Quarrying, & Extraction | 0 (0.0%) | 0 (0.0%) |
| Construction | 41 (100.0%) | 0 (0.0%) |
| Manufacturing | 237 (100.0%) | 0 (0.0%) |
| Wholesale Trade | 41 (100.0%) | 0 (0.0%) |
| Retail Trade | 111 (46.6%) | 127 (53.4%) |
| Transportation & Warehousing | 27 (100.0%) | 0 (0.0%) |
| Utilities | 0 (0.0%) | 0 (0.0%) |
| Information | 0 (0.0%) | 17 (100.0%) |
| Finance & Insurance | 0 (0.0%) | 38 (100.0%) |
| Real Estate, Rental & Leasing | 0 (0.0%) | 26 (100.0%) |
| Professional & Scientific | 75 (87.2%) | 11 (12.8%) |
| Enterprise Management | 0 (0.0%) | 0 (0.0%) |
| Administrative & Support | 17 (47.2%) | 19 (52.8%) |
| Educational Services | 119 (29.6%) | 283 (70.4%) |
| Health Care & Social Assistance | 8 (8.8%) | 83 (91.2%) |
| Arts, Entertainment & Recreation | 32 (32.7%) | 66 (67.3%) |
| Accommodation & Food Services | 55 (24.1%) | 173 (75.9%) |
| Public Administration | 27 (20.6%) | 104 (79.4%) |
| Total | 854 (45.4%) | 1,027 (54.6%) |
Education in Williamsburg
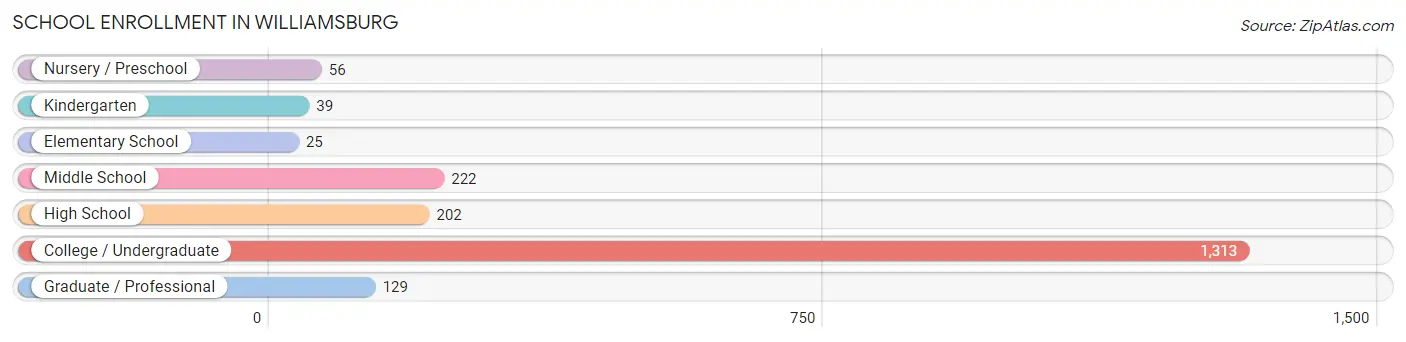
School Enrollment in Williamsburg
The most common levels of schooling among the 1,986 students in Williamsburg are college / undergraduate (1,313 | 66.1%), middle school (222 | 11.2%), and high school (202 | 10.2%).
| School Level | # Students | % Students |
| Nursery / Preschool | 56 | 2.8% |
| Kindergarten | 39 | 2.0% |
| Elementary School | 25 | 1.3% |
| Middle School | 222 | 11.2% |
| High School | 202 | 10.2% |
| College / Undergraduate | 1,313 | 66.1% |
| Graduate / Professional | 129 | 6.5% |
| Total | 1,986 | 100.0% |
School Enrollment by Age by Funding Source in Williamsburg
Out of a total of 1,986 students who are enrolled in schools in Williamsburg, 1,229 (61.9%) attend a private institution, while the remaining 757 (38.1%) are enrolled in public schools. The age group of 35 years and over has the highest likelihood of being enrolled in private schools, with 29 (100.0% in the age bracket) enrolled. Conversely, the age group of 5 to 9 year old has the lowest likelihood of being enrolled in a private school, with 54 (84.4% in the age bracket) attending a public institution.
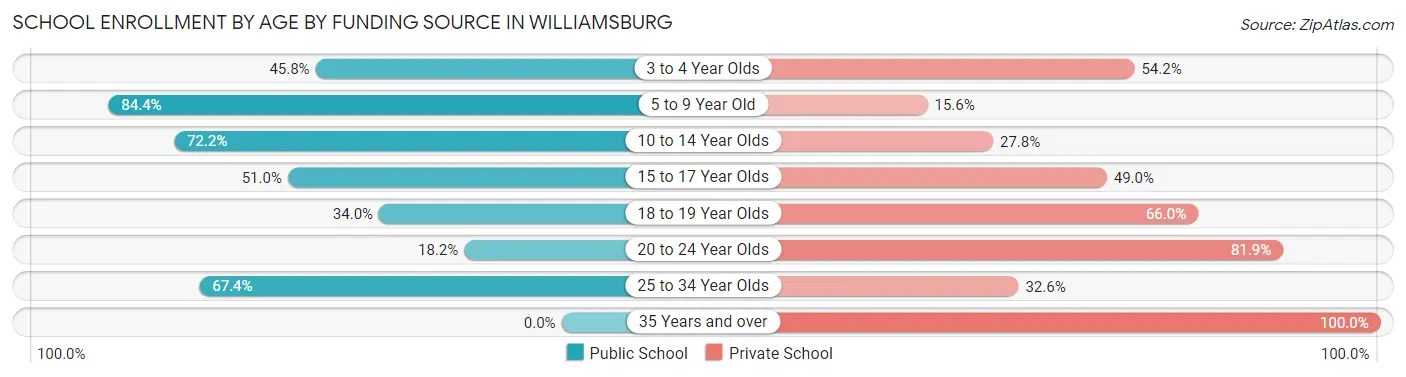
| Age Bracket | Public School | Private School |
| 3 to 4 Year Olds | 22 (45.8%) | 26 (54.2%) |
| 5 to 9 Year Old | 54 (84.4%) | 10 (15.6%) |
| 10 to 14 Year Olds | 166 (72.2%) | 64 (27.8%) |
| 15 to 17 Year Olds | 103 (51.0%) | 99 (49.0%) |
| 18 to 19 Year Olds | 286 (34.0%) | 555 (66.0%) |
| 20 to 24 Year Olds | 96 (18.1%) | 433 (81.9%) |
| 25 to 34 Year Olds | 29 (67.4%) | 14 (32.6%) |
| 35 Years and over | 0 (0.0%) | 29 (100.0%) |
| Total | 757 (38.1%) | 1,229 (61.9%) |
Educational Attainment by Field of Study in Williamsburg
Education (237 | 29.0%), liberal arts & history (129 | 15.8%), social sciences (86 | 10.5%), science & technology (83 | 10.2%), and business (71 | 8.7%) are the most common fields of study among 818 individuals in Williamsburg who have obtained a bachelor's degree or higher.
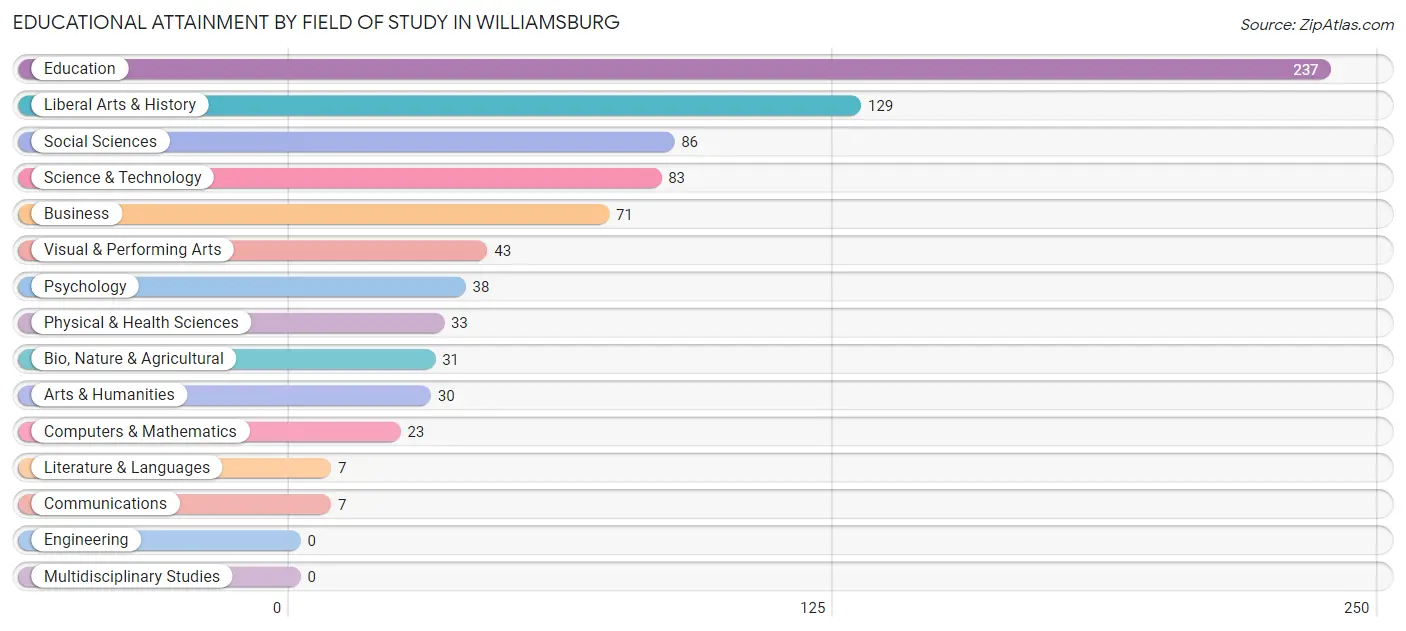
| Field of Study | # Graduates | % Graduates |
| Computers & Mathematics | 23 | 2.8% |
| Bio, Nature & Agricultural | 31 | 3.8% |
| Physical & Health Sciences | 33 | 4.0% |
| Psychology | 38 | 4.6% |
| Social Sciences | 86 | 10.5% |
| Engineering | 0 | 0.0% |
| Multidisciplinary Studies | 0 | 0.0% |
| Science & Technology | 83 | 10.2% |
| Business | 71 | 8.7% |
| Education | 237 | 29.0% |
| Literature & Languages | 7 | 0.9% |
| Liberal Arts & History | 129 | 15.8% |
| Visual & Performing Arts | 43 | 5.3% |
| Communications | 7 | 0.9% |
| Arts & Humanities | 30 | 3.7% |
| Total | 818 | 100.0% |
Transportation & Commute in Williamsburg
Vehicle Availability by Sex in Williamsburg
The most prevalent vehicle ownership categories in Williamsburg are males with 2 vehicles (350, accounting for 50.6%) and females with 2 vehicles (363, making up 50.1%).
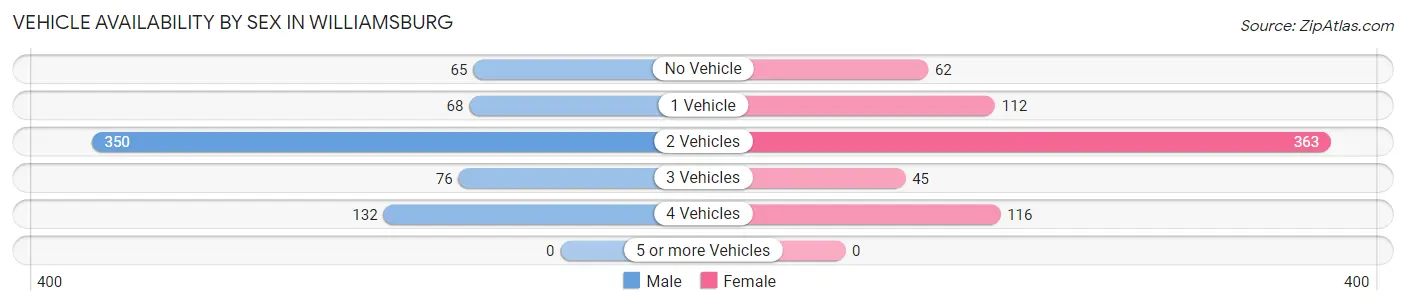
| Vehicles Available | Male | Female |
| No Vehicle | 65 (9.4%) | 62 (8.9%) |
| 1 Vehicle | 68 (9.8%) | 112 (16.1%) |
| 2 Vehicles | 350 (50.6%) | 363 (52.0%) |
| 3 Vehicles | 76 (11.0%) | 45 (6.5%) |
| 4 Vehicles | 132 (19.1%) | 116 (16.6%) |
| 5 or more Vehicles | 0 (0.0%) | 0 (0.0%) |
| Total | 691 (100.0%) | 698 (100.0%) |
Commute Time in Williamsburg
The most frequently occuring commute durations in Williamsburg are 5 to 9 minutes (706 commuters, 41.9%), 10 to 14 minutes (314 commuters, 18.6%), and less than 5 minutes (266 commuters, 15.8%).
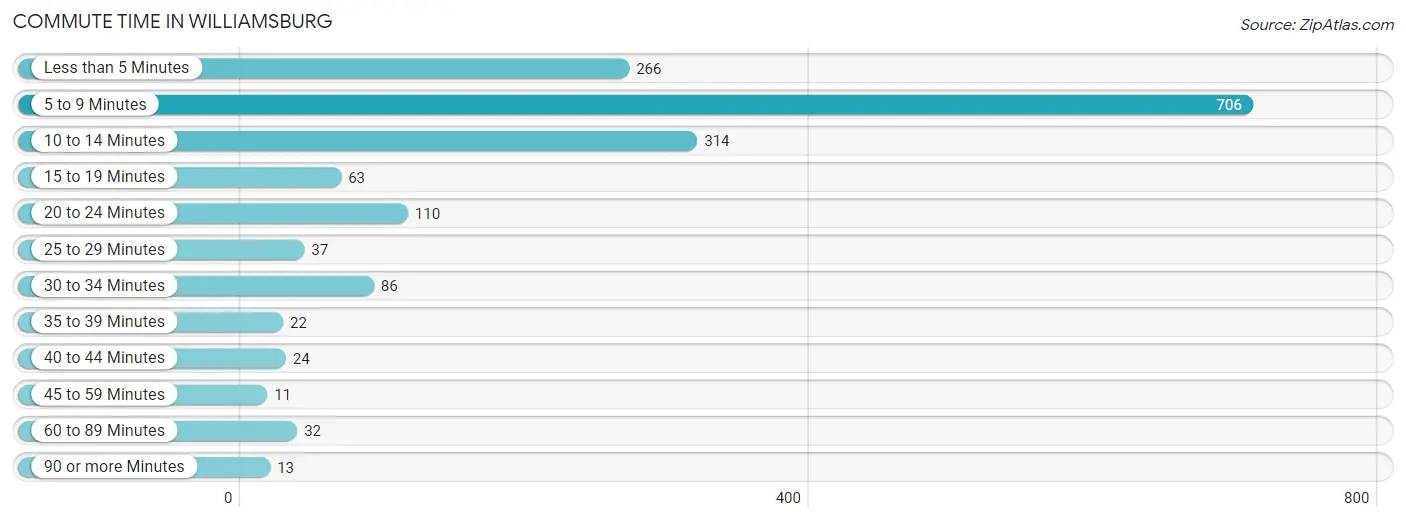
| Commute Time | # Commuters | % Commuters |
| Less than 5 Minutes | 266 | 15.8% |
| 5 to 9 Minutes | 706 | 41.9% |
| 10 to 14 Minutes | 314 | 18.6% |
| 15 to 19 Minutes | 63 | 3.7% |
| 20 to 24 Minutes | 110 | 6.5% |
| 25 to 29 Minutes | 37 | 2.2% |
| 30 to 34 Minutes | 86 | 5.1% |
| 35 to 39 Minutes | 22 | 1.3% |
| 40 to 44 Minutes | 24 | 1.4% |
| 45 to 59 Minutes | 11 | 0.6% |
| 60 to 89 Minutes | 32 | 1.9% |
| 90 or more Minutes | 13 | 0.8% |
Commute Time by Sex in Williamsburg
The most common commute times in Williamsburg are 5 to 9 minutes (297 commuters, 38.8%) for males and 5 to 9 minutes (409 commuters, 44.5%) for females.
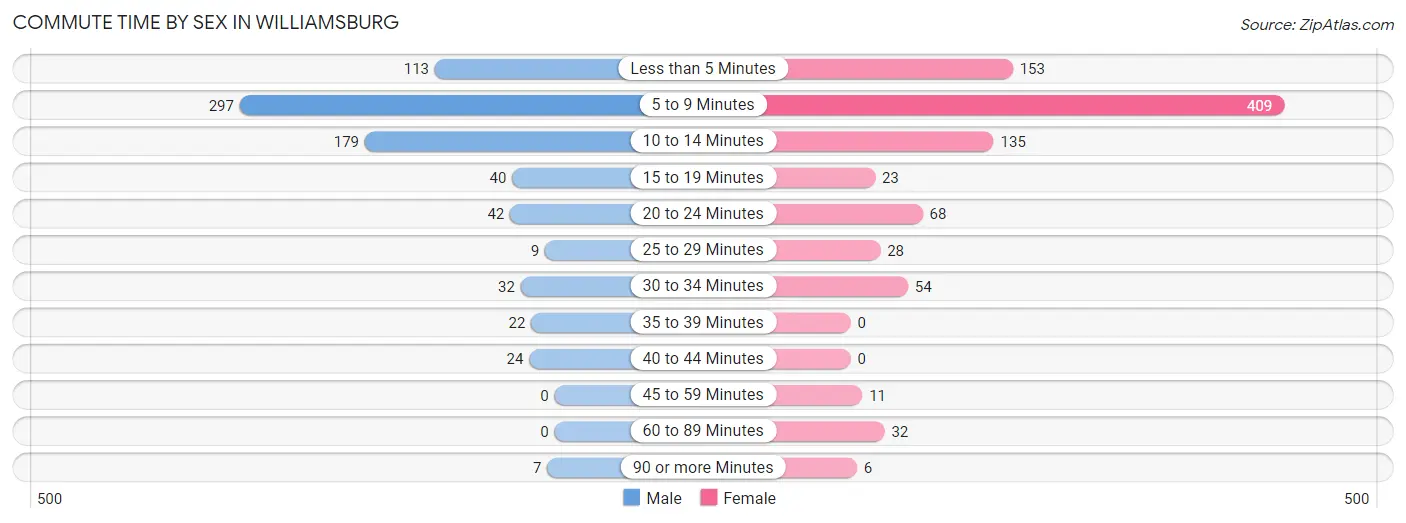
| Commute Time | Male | Female |
| Less than 5 Minutes | 113 (14.8%) | 153 (16.7%) |
| 5 to 9 Minutes | 297 (38.8%) | 409 (44.5%) |
| 10 to 14 Minutes | 179 (23.4%) | 135 (14.7%) |
| 15 to 19 Minutes | 40 (5.2%) | 23 (2.5%) |
| 20 to 24 Minutes | 42 (5.5%) | 68 (7.4%) |
| 25 to 29 Minutes | 9 (1.2%) | 28 (3.0%) |
| 30 to 34 Minutes | 32 (4.2%) | 54 (5.9%) |
| 35 to 39 Minutes | 22 (2.9%) | 0 (0.0%) |
| 40 to 44 Minutes | 24 (3.1%) | 0 (0.0%) |
| 45 to 59 Minutes | 0 (0.0%) | 11 (1.2%) |
| 60 to 89 Minutes | 0 (0.0%) | 32 (3.5%) |
| 90 or more Minutes | 7 (0.9%) | 6 (0.6%) |
Time of Departure to Work by Sex in Williamsburg
The most frequent times of departure to work in Williamsburg are 8:00 AM to 8:29 AM (159, 20.8%) for males and 12:00 PM to 3:59 PM (183, 19.9%) for females.
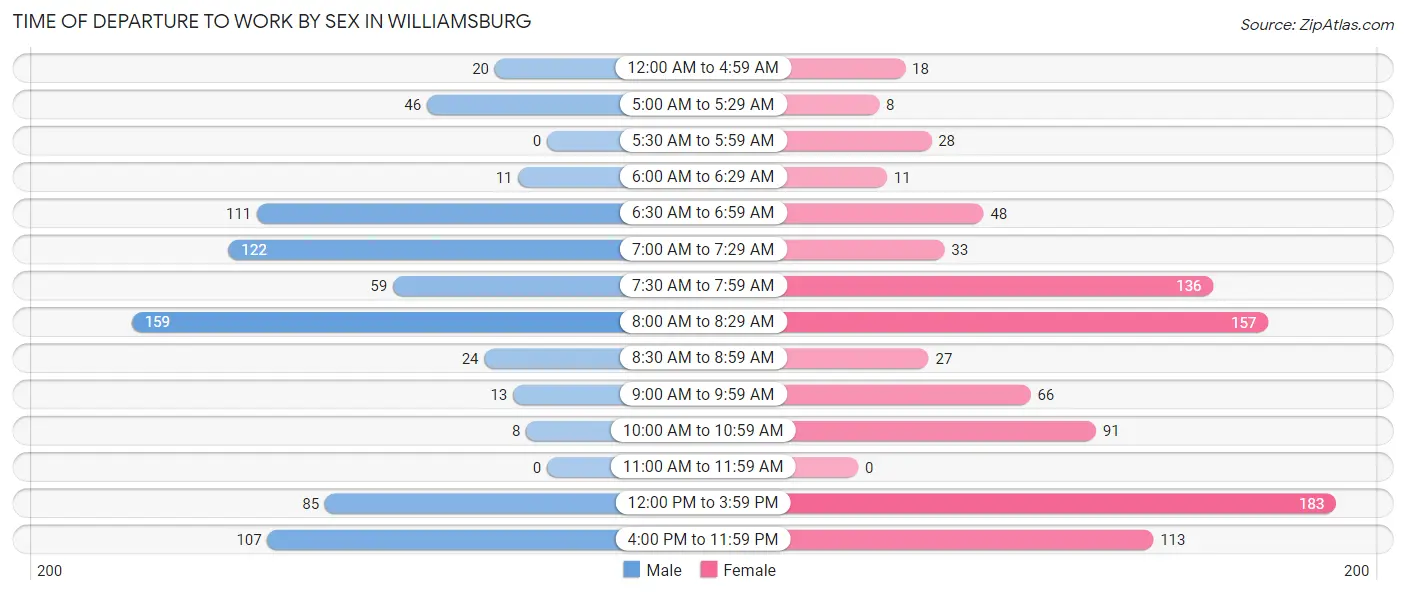
| Time of Departure | Male | Female |
| 12:00 AM to 4:59 AM | 20 (2.6%) | 18 (2.0%) |
| 5:00 AM to 5:29 AM | 46 (6.0%) | 8 (0.9%) |
| 5:30 AM to 5:59 AM | 0 (0.0%) | 28 (3.0%) |
| 6:00 AM to 6:29 AM | 11 (1.4%) | 11 (1.2%) |
| 6:30 AM to 6:59 AM | 111 (14.5%) | 48 (5.2%) |
| 7:00 AM to 7:29 AM | 122 (16.0%) | 33 (3.6%) |
| 7:30 AM to 7:59 AM | 59 (7.7%) | 136 (14.8%) |
| 8:00 AM to 8:29 AM | 159 (20.8%) | 157 (17.1%) |
| 8:30 AM to 8:59 AM | 24 (3.1%) | 27 (2.9%) |
| 9:00 AM to 9:59 AM | 13 (1.7%) | 66 (7.2%) |
| 10:00 AM to 10:59 AM | 8 (1.1%) | 91 (9.9%) |
| 11:00 AM to 11:59 AM | 0 (0.0%) | 0 (0.0%) |
| 12:00 PM to 3:59 PM | 85 (11.1%) | 183 (19.9%) |
| 4:00 PM to 11:59 PM | 107 (14.0%) | 113 (12.3%) |
| Total | 765 (100.0%) | 919 (100.0%) |
Housing Occupancy in Williamsburg
Occupancy by Ownership in Williamsburg
Of the total 1,598 dwellings in Williamsburg, owner-occupied units account for 677 (42.4%), while renter-occupied units make up 921 (57.6%).
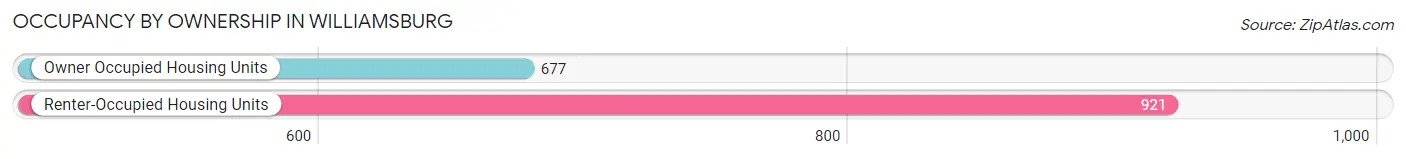
| Occupancy | # Housing Units | % Housing Units |
| Owner Occupied Housing Units | 677 | 42.4% |
| Renter-Occupied Housing Units | 921 | 57.6% |
| Total Occupied Housing Units | 1,598 | 100.0% |
Occupancy by Household Size in Williamsburg
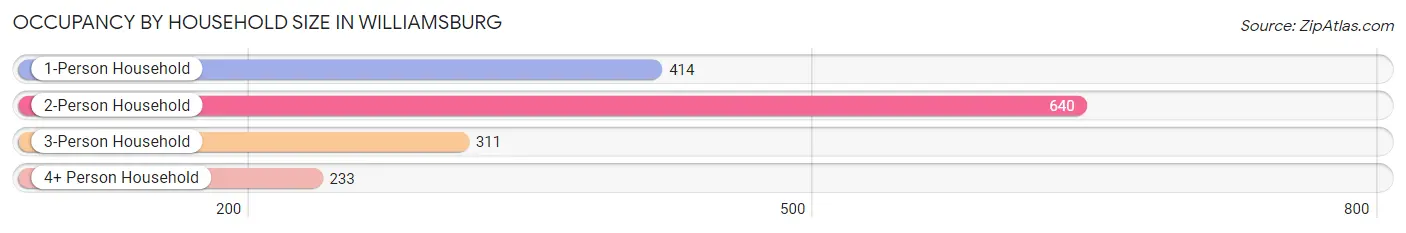
| Household Size | # Housing Units | % Housing Units |
| 1-Person Household | 414 | 25.9% |
| 2-Person Household | 640 | 40.1% |
| 3-Person Household | 311 | 19.5% |
| 4+ Person Household | 233 | 14.6% |
| Total Housing Units | 1,598 | 100.0% |
Occupancy by Ownership by Household Size in Williamsburg
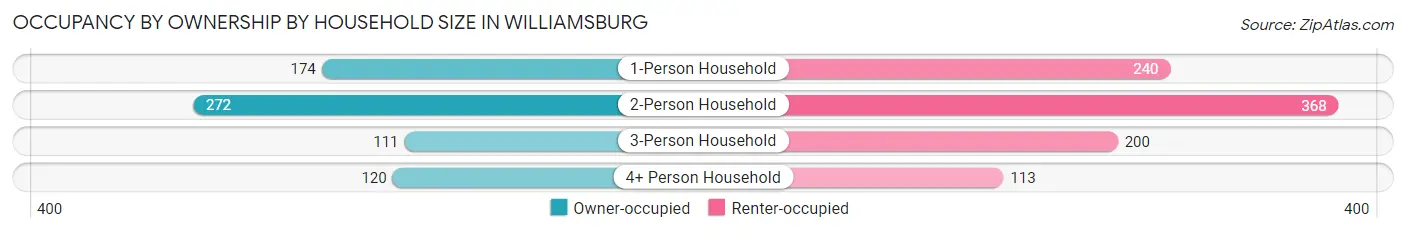
| Household Size | Owner-occupied | Renter-occupied |
| 1-Person Household | 174 (42.0%) | 240 (58.0%) |
| 2-Person Household | 272 (42.5%) | 368 (57.5%) |
| 3-Person Household | 111 (35.7%) | 200 (64.3%) |
| 4+ Person Household | 120 (51.5%) | 113 (48.5%) |
| Total Housing Units | 677 (42.4%) | 921 (57.6%) |
Occupancy by Educational Attainment in Williamsburg
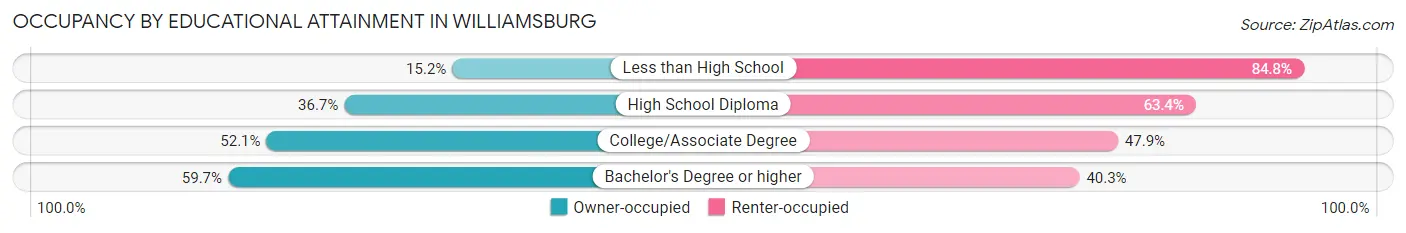
| Household Size | Owner-occupied | Renter-occupied |
| Less than High School | 46 (15.2%) | 256 (84.8%) |
| High School Diploma | 177 (36.6%) | 306 (63.3%) |
| College/Associate Degree | 214 (52.1%) | 197 (47.9%) |
| Bachelor's Degree or higher | 240 (59.7%) | 162 (40.3%) |
Occupancy by Age of Householder in Williamsburg
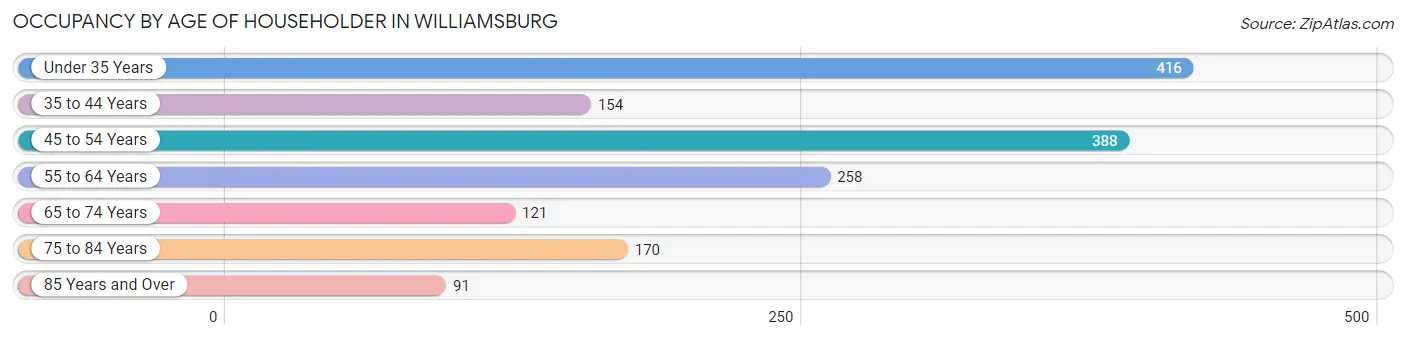
| Age Bracket | # Households | % Households |
| Under 35 Years | 416 | 26.0% |
| 35 to 44 Years | 154 | 9.6% |
| 45 to 54 Years | 388 | 24.3% |
| 55 to 64 Years | 258 | 16.2% |
| 65 to 74 Years | 121 | 7.6% |
| 75 to 84 Years | 170 | 10.6% |
| 85 Years and Over | 91 | 5.7% |
| Total | 1,598 | 100.0% |
Housing Finances in Williamsburg
Median Income by Occupancy in Williamsburg
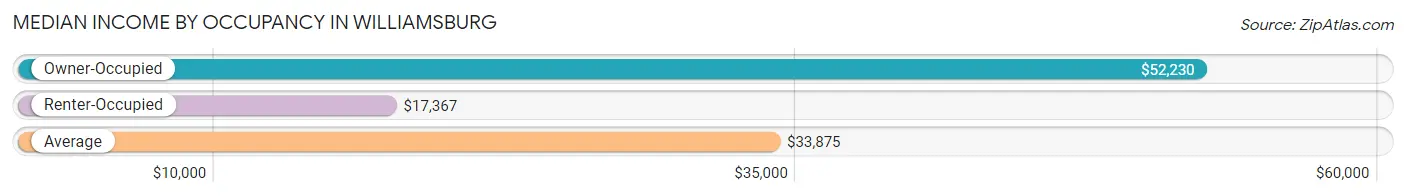
| Occupancy Type | # Households | Median Income |
| Owner-Occupied | 677 (42.4%) | $52,230 |
| Renter-Occupied | 921 (57.6%) | $17,367 |
| Average | 1,598 (100.0%) | $33,875 |
Occupancy by Householder Income Bracket in Williamsburg
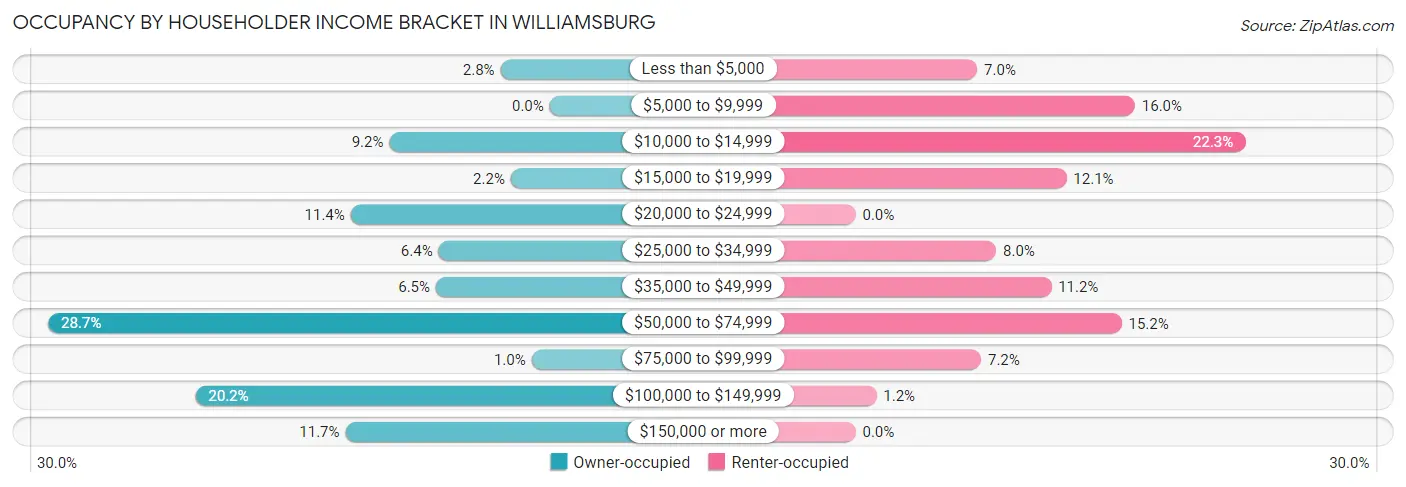
| Income Bracket | Owner-occupied | Renter-occupied |
| Less than $5,000 | 19 (2.8%) | 64 (7.0%) |
| $5,000 to $9,999 | 0 (0.0%) | 147 (16.0%) |
| $10,000 to $14,999 | 62 (9.2%) | 205 (22.3%) |
| $15,000 to $19,999 | 15 (2.2%) | 111 (12.0%) |
| $20,000 to $24,999 | 77 (11.4%) | 0 (0.0%) |
| $25,000 to $34,999 | 43 (6.4%) | 74 (8.0%) |
| $35,000 to $49,999 | 44 (6.5%) | 103 (11.2%) |
| $50,000 to $74,999 | 194 (28.7%) | 140 (15.2%) |
| $75,000 to $99,999 | 7 (1.0%) | 66 (7.2%) |
| $100,000 to $149,999 | 137 (20.2%) | 11 (1.2%) |
| $150,000 or more | 79 (11.7%) | 0 (0.0%) |
| Total | 677 (100.0%) | 921 (100.0%) |
Monthly Housing Cost Tiers in Williamsburg
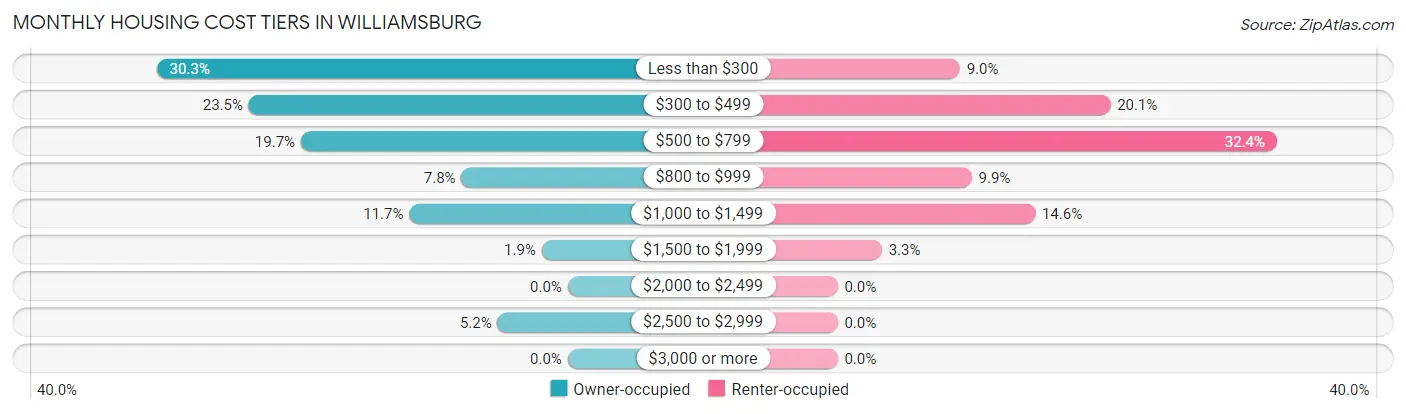
| Monthly Cost | Owner-occupied | Renter-occupied |
| Less than $300 | 205 (30.3%) | 83 (9.0%) |
| $300 to $499 | 159 (23.5%) | 185 (20.1%) |
| $500 to $799 | 133 (19.7%) | 298 (32.4%) |
| $800 to $999 | 53 (7.8%) | 91 (9.9%) |
| $1,000 to $1,499 | 79 (11.7%) | 134 (14.5%) |
| $1,500 to $1,999 | 13 (1.9%) | 30 (3.3%) |
| $2,000 to $2,499 | 0 (0.0%) | 0 (0.0%) |
| $2,500 to $2,999 | 35 (5.2%) | 0 (0.0%) |
| $3,000 or more | 0 (0.0%) | 0 (0.0%) |
| Total | 677 (100.0%) | 921 (100.0%) |
Physical Housing Characteristics in Williamsburg
Housing Structures in Williamsburg
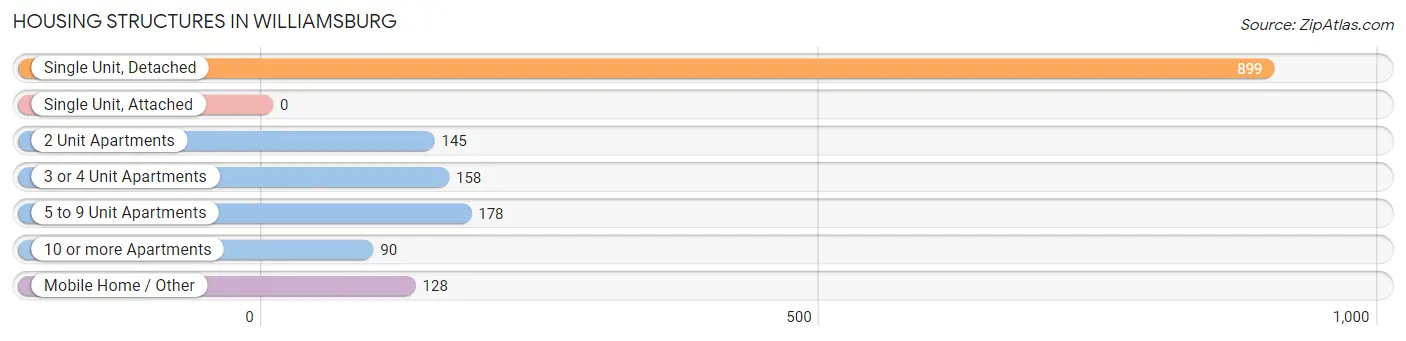
| Structure Type | # Housing Units | % Housing Units |
| Single Unit, Detached | 899 | 56.3% |
| Single Unit, Attached | 0 | 0.0% |
| 2 Unit Apartments | 145 | 9.1% |
| 3 or 4 Unit Apartments | 158 | 9.9% |
| 5 to 9 Unit Apartments | 178 | 11.1% |
| 10 or more Apartments | 90 | 5.6% |
| Mobile Home / Other | 128 | 8.0% |
| Total | 1,598 | 100.0% |
Housing Structures by Occupancy in Williamsburg
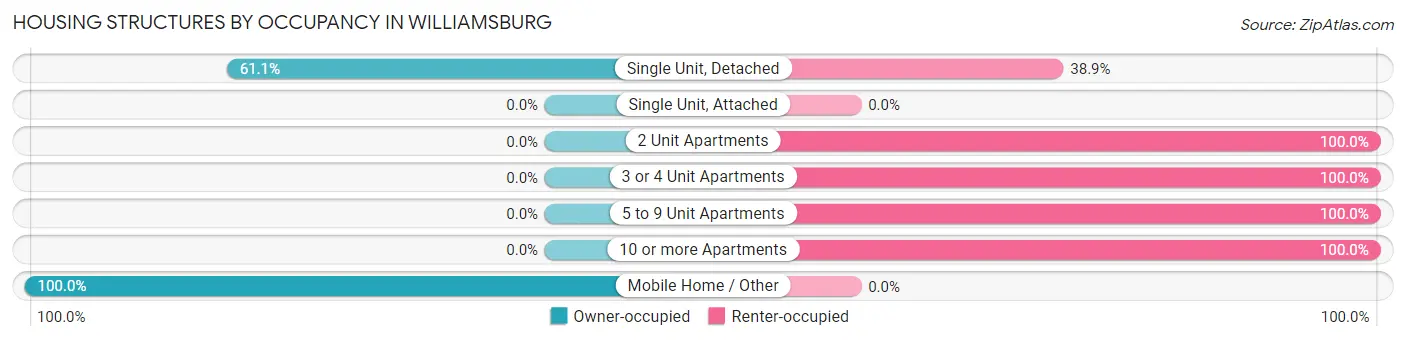
| Structure Type | Owner-occupied | Renter-occupied |
| Single Unit, Detached | 549 (61.1%) | 350 (38.9%) |
| Single Unit, Attached | 0 (0.0%) | 0 (0.0%) |
| 2 Unit Apartments | 0 (0.0%) | 145 (100.0%) |
| 3 or 4 Unit Apartments | 0 (0.0%) | 158 (100.0%) |
| 5 to 9 Unit Apartments | 0 (0.0%) | 178 (100.0%) |
| 10 or more Apartments | 0 (0.0%) | 90 (100.0%) |
| Mobile Home / Other | 128 (100.0%) | 0 (0.0%) |
| Total | 677 (42.4%) | 921 (57.6%) |
Housing Structures by Number of Rooms in Williamsburg
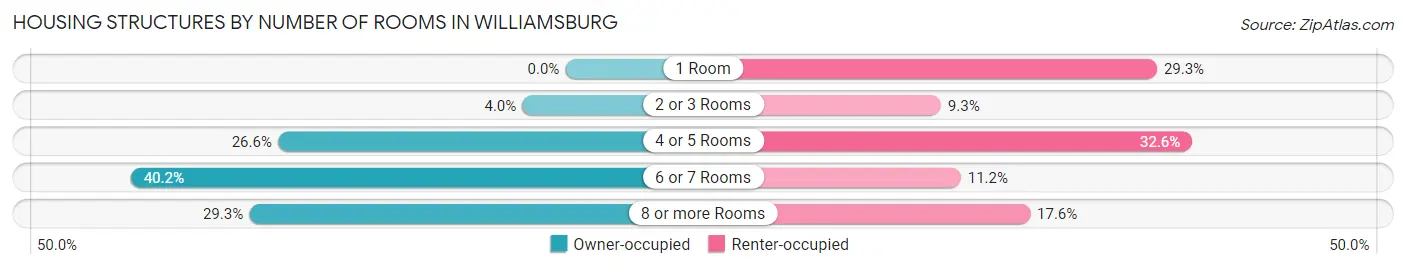
| Number of Rooms | Owner-occupied | Renter-occupied |
| 1 Room | 0 (0.0%) | 270 (29.3%) |
| 2 or 3 Rooms | 27 (4.0%) | 86 (9.3%) |
| 4 or 5 Rooms | 180 (26.6%) | 300 (32.6%) |
| 6 or 7 Rooms | 272 (40.2%) | 103 (11.2%) |
| 8 or more Rooms | 198 (29.2%) | 162 (17.6%) |
| Total | 677 (100.0%) | 921 (100.0%) |
Housing Structure by Heating Type in Williamsburg
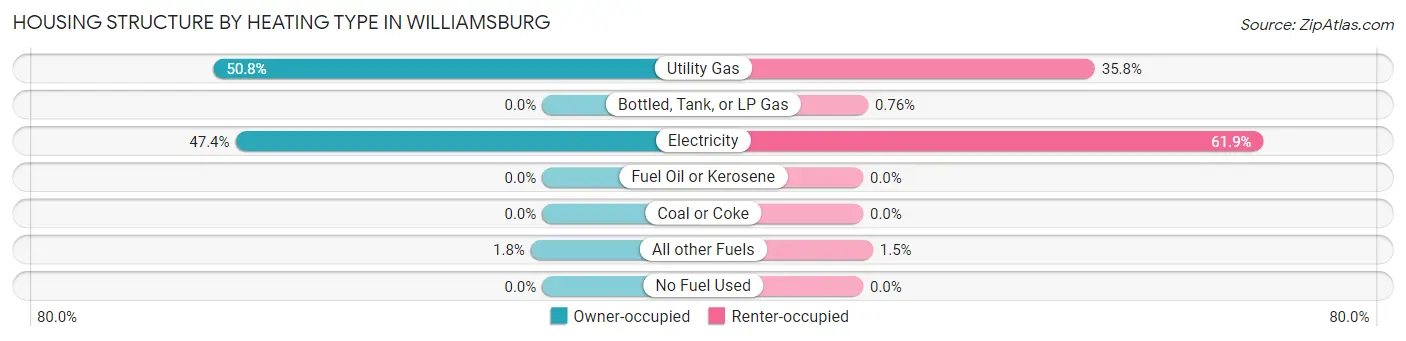
| Heating Type | Owner-occupied | Renter-occupied |
| Utility Gas | 344 (50.8%) | 330 (35.8%) |
| Bottled, Tank, or LP Gas | 0 (0.0%) | 7 (0.8%) |
| Electricity | 321 (47.4%) | 570 (61.9%) |
| Fuel Oil or Kerosene | 0 (0.0%) | 0 (0.0%) |
| Coal or Coke | 0 (0.0%) | 0 (0.0%) |
| All other Fuels | 12 (1.8%) | 14 (1.5%) |
| No Fuel Used | 0 (0.0%) | 0 (0.0%) |
| Total | 677 (100.0%) | 921 (100.0%) |
Household Vehicle Usage in Williamsburg
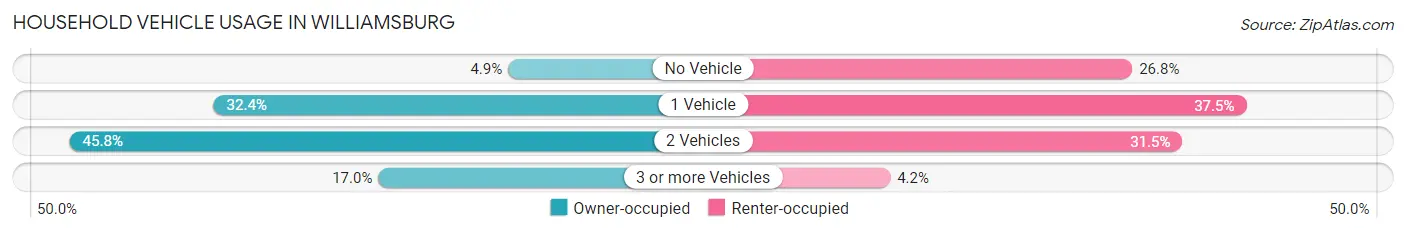
| Vehicles per Household | Owner-occupied | Renter-occupied |
| No Vehicle | 33 (4.9%) | 247 (26.8%) |
| 1 Vehicle | 219 (32.4%) | 345 (37.5%) |
| 2 Vehicles | 310 (45.8%) | 290 (31.5%) |
| 3 or more Vehicles | 115 (17.0%) | 39 (4.2%) |
| Total | 677 (100.0%) | 921 (100.0%) |
Real Estate & Mortgages in Williamsburg
Real Estate and Mortgage Overview in Williamsburg
| Characteristic | Without Mortgage | With Mortgage |
| Housing Units | 457 | 220 |
| Median Property Value | $74,200 | $178,400 |
| Median Household Income | $36,302 | $13 |
| Monthly Housing Costs | $324 | $0 |
| Real Estate Taxes | $713 | $0 |
Property Value by Mortgage Status in Williamsburg
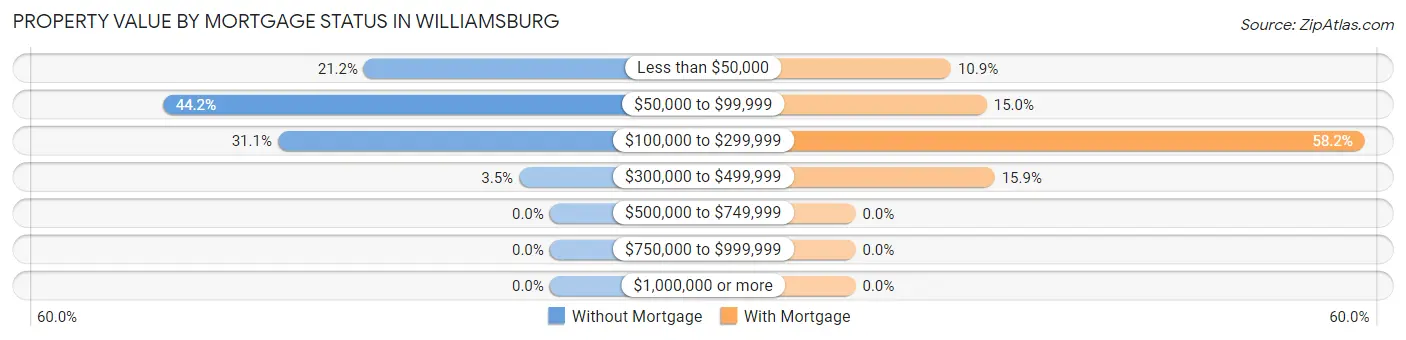
| Property Value | Without Mortgage | With Mortgage |
| Less than $50,000 | 97 (21.2%) | 24 (10.9%) |
| $50,000 to $99,999 | 202 (44.2%) | 33 (15.0%) |
| $100,000 to $299,999 | 142 (31.1%) | 128 (58.2%) |
| $300,000 to $499,999 | 16 (3.5%) | 35 (15.9%) |
| $500,000 to $749,999 | 0 (0.0%) | 0 (0.0%) |
| $750,000 to $999,999 | 0 (0.0%) | 0 (0.0%) |
| $1,000,000 or more | 0 (0.0%) | 0 (0.0%) |
| Total | 457 (100.0%) | 220 (100.0%) |
Household Income by Mortgage Status in Williamsburg
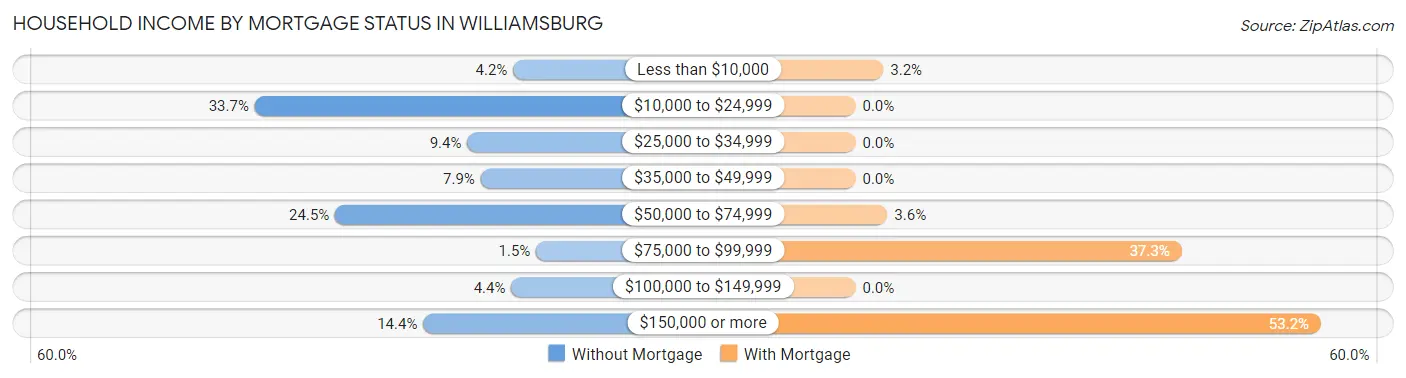
| Household Income | Without Mortgage | With Mortgage |
| Less than $10,000 | 19 (4.2%) | 7 (3.2%) |
| $10,000 to $24,999 | 154 (33.7%) | 0 (0.0%) |
| $25,000 to $34,999 | 43 (9.4%) | 0 (0.0%) |
| $35,000 to $49,999 | 36 (7.9%) | 0 (0.0%) |
| $50,000 to $74,999 | 112 (24.5%) | 8 (3.6%) |
| $75,000 to $99,999 | 7 (1.5%) | 82 (37.3%) |
| $100,000 to $149,999 | 20 (4.4%) | 0 (0.0%) |
| $150,000 or more | 66 (14.4%) | 117 (53.2%) |
| Total | 457 (100.0%) | 220 (100.0%) |
Property Value to Household Income Ratio in Williamsburg
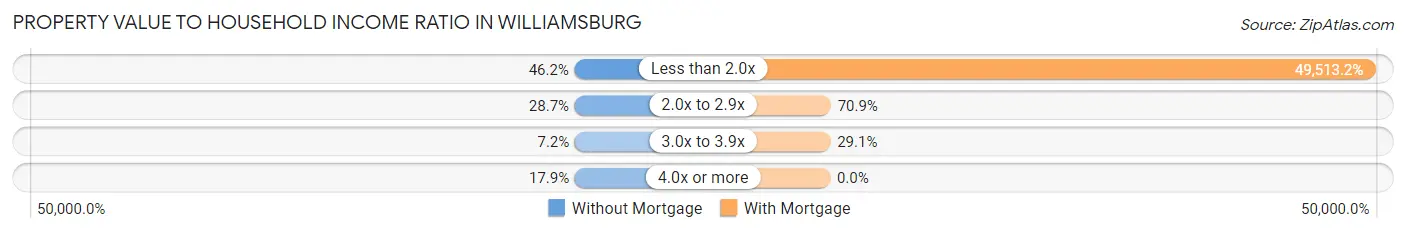
| Value-to-Income Ratio | Without Mortgage | With Mortgage |
| Less than 2.0x | 211 (46.2%) | 108,929 (49,513.2%) |
| 2.0x to 2.9x | 131 (28.7%) | 156 (70.9%) |
| 3.0x to 3.9x | 33 (7.2%) | 64 (29.1%) |
| 4.0x or more | 82 (17.9%) | 0 (0.0%) |
| Total | 457 (100.0%) | 220 (100.0%) |
Real Estate Taxes by Mortgage Status in Williamsburg
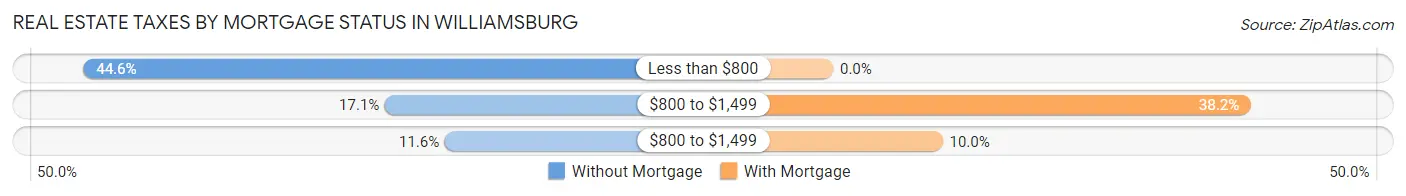
| Property Taxes | Without Mortgage | With Mortgage |
| Less than $800 | 204 (44.6%) | 0 (0.0%) |
| $800 to $1,499 | 78 (17.1%) | 84 (38.2%) |
| $800 to $1,499 | 53 (11.6%) | 22 (10.0%) |
| Total | 457 (100.0%) | 220 (100.0%) |
Health & Disability in Williamsburg
Health Insurance Coverage by Age in Williamsburg
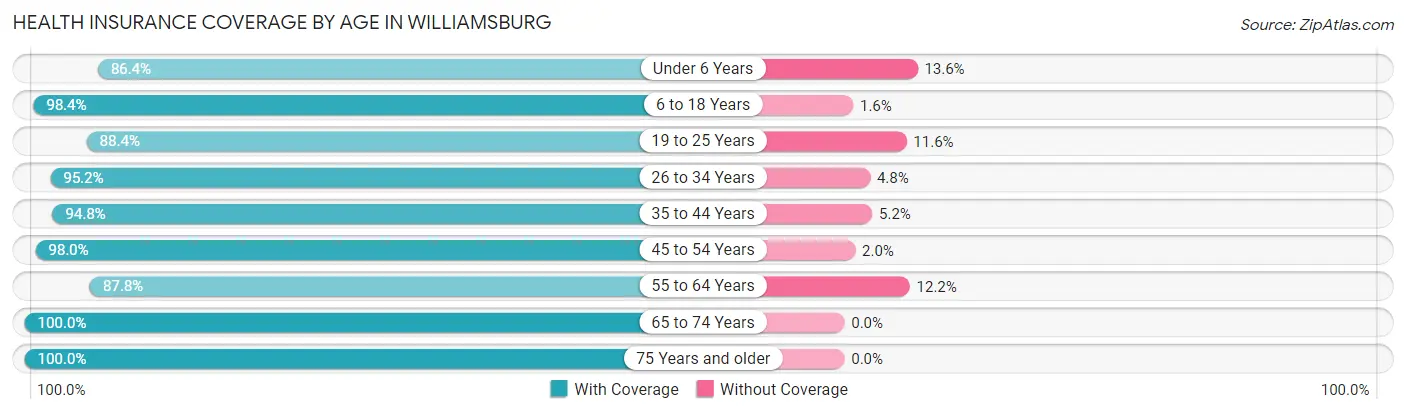
| Age Bracket | With Coverage | Without Coverage |
| Under 6 Years | 266 (86.4%) | 42 (13.6%) |
| 6 to 18 Years | 843 (98.4%) | 14 (1.6%) |
| 19 to 25 Years | 1,244 (88.4%) | 163 (11.6%) |
| 26 to 34 Years | 477 (95.2%) | 24 (4.8%) |
| 35 to 44 Years | 420 (94.8%) | 23 (5.2%) |
| 45 to 54 Years | 585 (98.0%) | 12 (2.0%) |
| 55 to 64 Years | 411 (87.8%) | 57 (12.2%) |
| 65 to 74 Years | 176 (100.0%) | 0 (0.0%) |
| 75 Years and older | 348 (100.0%) | 0 (0.0%) |
| Total | 4,770 (93.4%) | 335 (6.6%) |
Health Insurance Coverage by Citizenship Status in Williamsburg
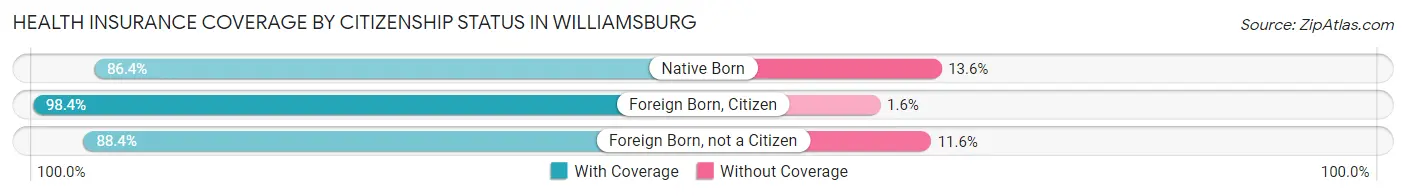
| Citizenship Status | With Coverage | Without Coverage |
| Native Born | 266 (86.4%) | 42 (13.6%) |
| Foreign Born, Citizen | 843 (98.4%) | 14 (1.6%) |
| Foreign Born, not a Citizen | 1,244 (88.4%) | 163 (11.6%) |
Health Insurance Coverage by Household Income in Williamsburg
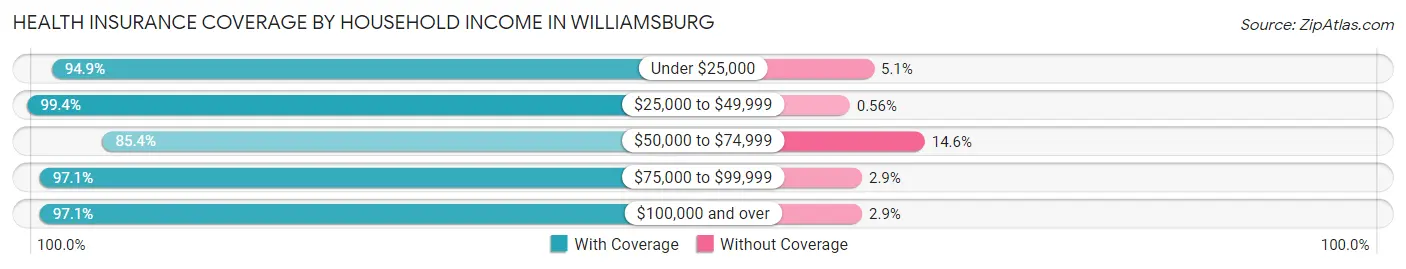
| Household Income | With Coverage | Without Coverage |
| Under $25,000 | 1,452 (94.9%) | 78 (5.1%) |
| $25,000 to $49,999 | 531 (99.4%) | 3 (0.6%) |
| $50,000 to $74,999 | 701 (85.4%) | 120 (14.6%) |
| $75,000 to $99,999 | 272 (97.1%) | 8 (2.9%) |
| $100,000 and over | 710 (97.1%) | 21 (2.9%) |
Public vs Private Health Insurance Coverage by Age in Williamsburg
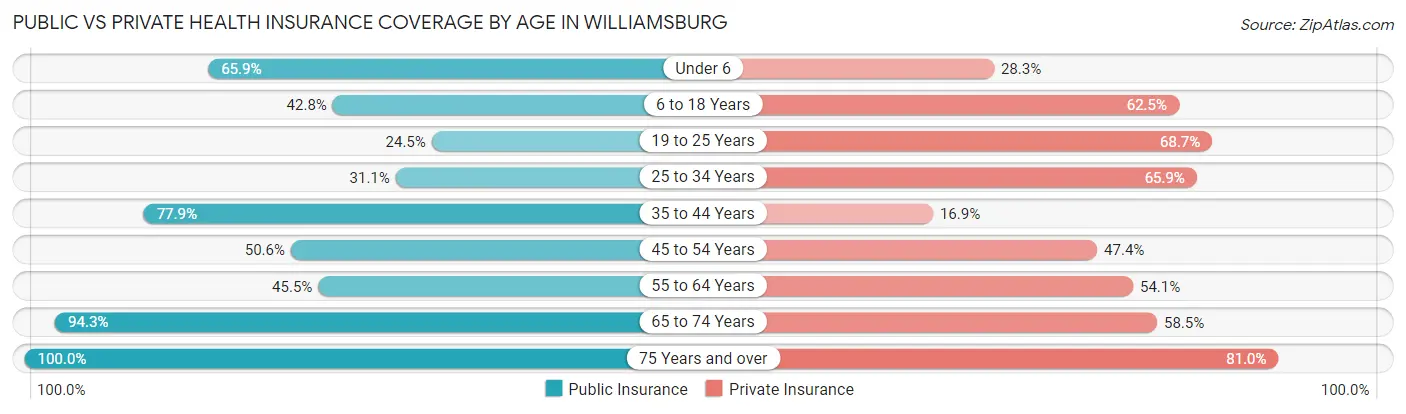
| Age Bracket | Public Insurance | Private Insurance |
| Under 6 | 203 (65.9%) | 87 (28.2%) |
| 6 to 18 Years | 367 (42.8%) | 536 (62.5%) |
| 19 to 25 Years | 344 (24.4%) | 967 (68.7%) |
| 25 to 34 Years | 156 (31.1%) | 330 (65.9%) |
| 35 to 44 Years | 345 (77.9%) | 75 (16.9%) |
| 45 to 54 Years | 302 (50.6%) | 283 (47.4%) |
| 55 to 64 Years | 213 (45.5%) | 253 (54.1%) |
| 65 to 74 Years | 166 (94.3%) | 103 (58.5%) |
| 75 Years and over | 348 (100.0%) | 282 (81.0%) |
| Total | 2,444 (47.9%) | 2,916 (57.1%) |
Disability Status by Sex by Age in Williamsburg
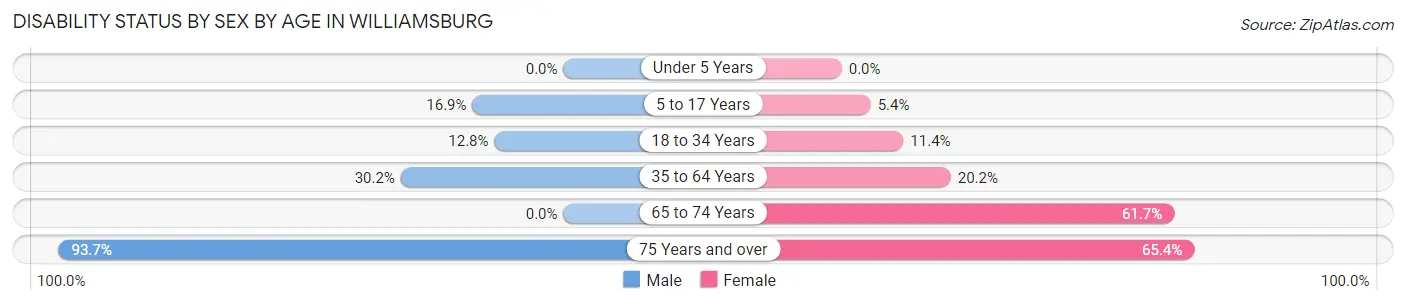
| Age Bracket | Male | Female |
| Under 5 Years | 0 (0.0%) | 0 (0.0%) |
| 5 to 17 Years | 51 (16.9%) | 11 (5.4%) |
| 18 to 34 Years | 152 (12.8%) | 127 (11.4%) |
| 35 to 64 Years | 221 (30.2%) | 157 (20.2%) |
| 65 to 74 Years | 0 (0.0%) | 103 (61.7%) |
| 75 Years and over | 104 (93.7%) | 155 (65.4%) |
Disability Class by Sex by Age in Williamsburg
Disability Class: Hearing Difficulty
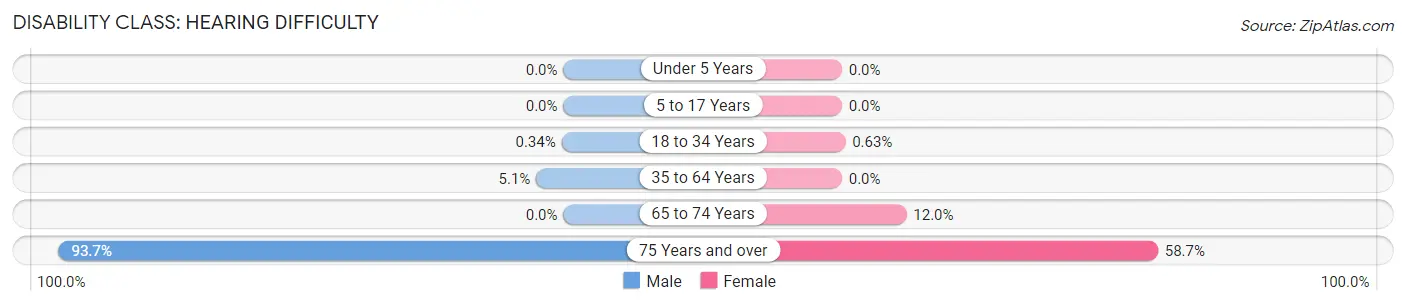
| Age Bracket | Male | Female |
| Under 5 Years | 0 (0.0%) | 0 (0.0%) |
| 5 to 17 Years | 0 (0.0%) | 0 (0.0%) |
| 18 to 34 Years | 4 (0.3%) | 7 (0.6%) |
| 35 to 64 Years | 37 (5.1%) | 0 (0.0%) |
| 65 to 74 Years | 0 (0.0%) | 20 (12.0%) |
| 75 Years and over | 104 (93.7%) | 139 (58.7%) |
Disability Class: Vision Difficulty
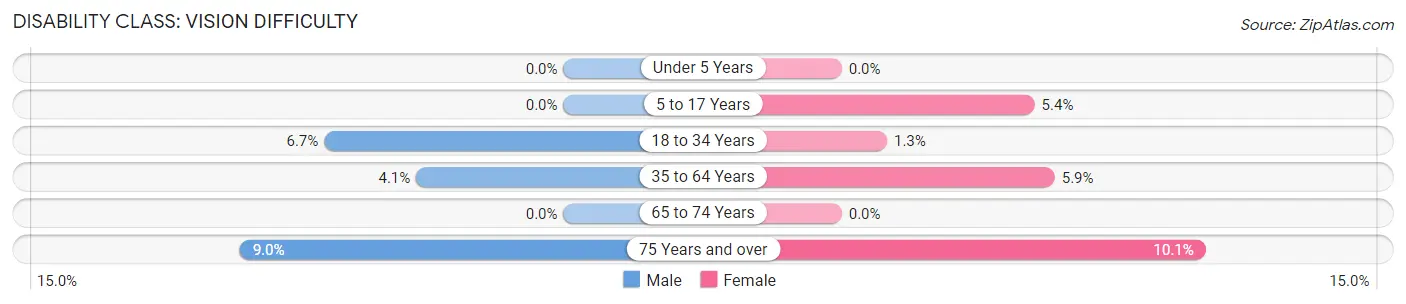
| Age Bracket | Male | Female |
| Under 5 Years | 0 (0.0%) | 0 (0.0%) |
| 5 to 17 Years | 0 (0.0%) | 11 (5.4%) |
| 18 to 34 Years | 79 (6.7%) | 14 (1.3%) |
| 35 to 64 Years | 30 (4.1%) | 46 (5.9%) |
| 65 to 74 Years | 0 (0.0%) | 0 (0.0%) |
| 75 Years and over | 10 (9.0%) | 24 (10.1%) |
Disability Class: Cognitive Difficulty
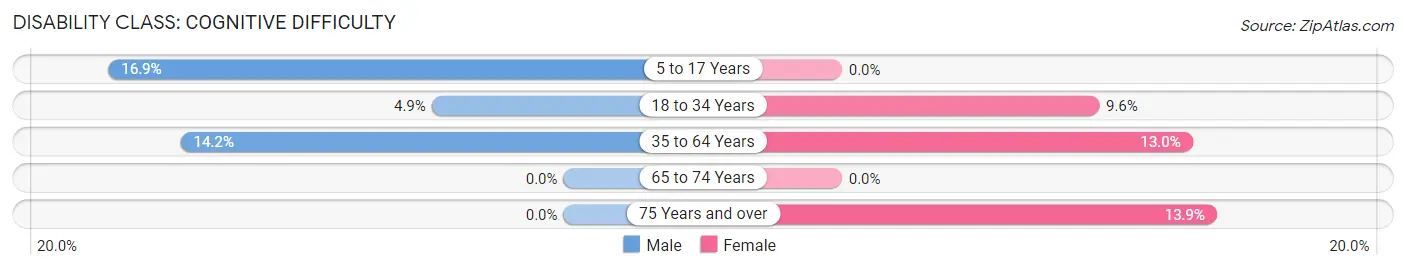
| Age Bracket | Male | Female |
| 5 to 17 Years | 51 (16.9%) | 0 (0.0%) |
| 18 to 34 Years | 58 (4.9%) | 106 (9.6%) |
| 35 to 64 Years | 104 (14.2%) | 101 (13.0%) |
| 65 to 74 Years | 0 (0.0%) | 0 (0.0%) |
| 75 Years and over | 0 (0.0%) | 33 (13.9%) |
Disability Class: Ambulatory Difficulty
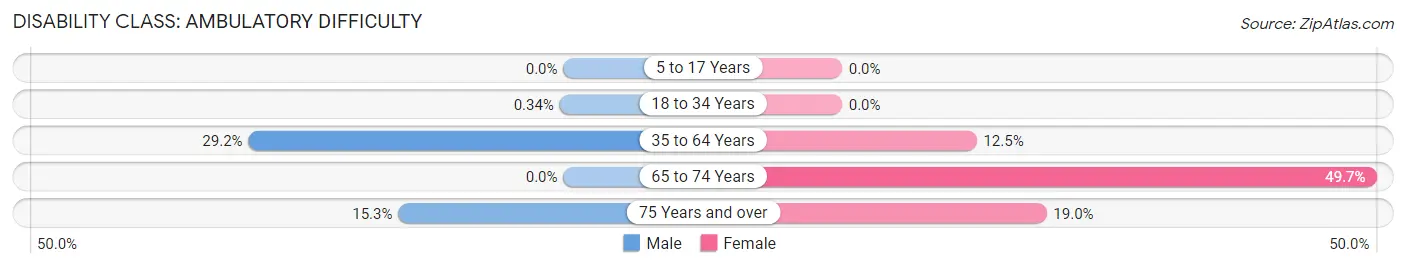
| Age Bracket | Male | Female |
| 5 to 17 Years | 0 (0.0%) | 0 (0.0%) |
| 18 to 34 Years | 4 (0.3%) | 0 (0.0%) |
| 35 to 64 Years | 214 (29.2%) | 97 (12.5%) |
| 65 to 74 Years | 0 (0.0%) | 83 (49.7%) |
| 75 Years and over | 17 (15.3%) | 45 (19.0%) |
Disability Class: Self-Care Difficulty
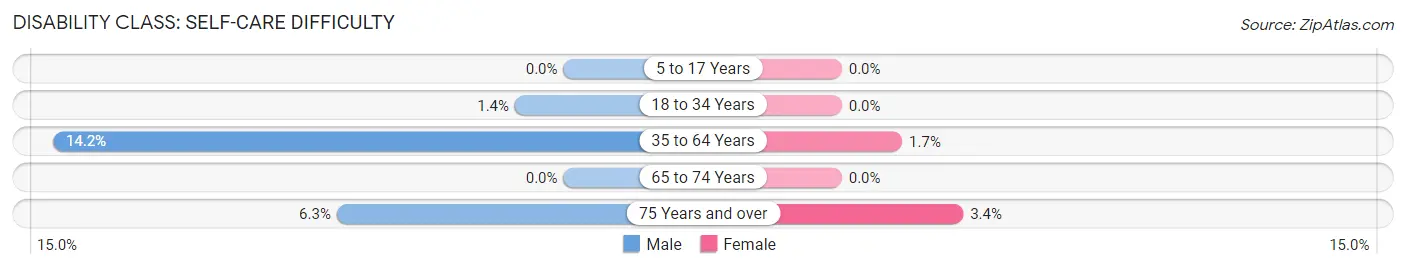
| Age Bracket | Male | Female |
| 5 to 17 Years | 0 (0.0%) | 0 (0.0%) |
| 18 to 34 Years | 16 (1.3%) | 0 (0.0%) |
| 35 to 64 Years | 104 (14.2%) | 13 (1.7%) |
| 65 to 74 Years | 0 (0.0%) | 0 (0.0%) |
| 75 Years and over | 7 (6.3%) | 8 (3.4%) |
Technology Access in Williamsburg
Computing Device Access in Williamsburg
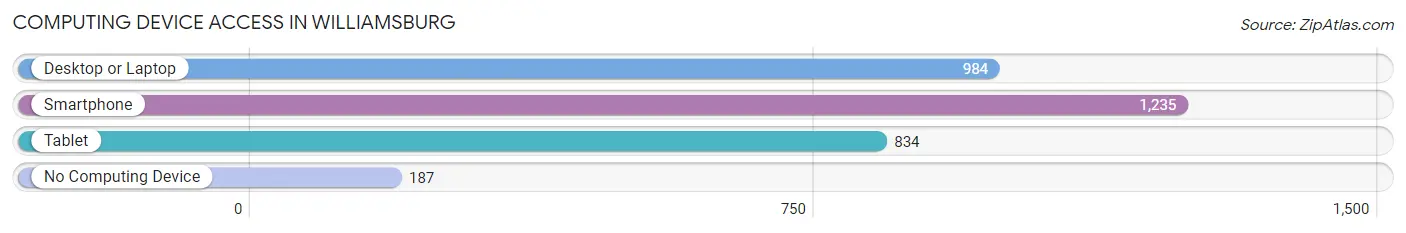
| Device Type | # Households | % Households |
| Desktop or Laptop | 984 | 61.6% |
| Smartphone | 1,235 | 77.3% |
| Tablet | 834 | 52.2% |
| No Computing Device | 187 | 11.7% |
| Total | 1,598 | 100.0% |
Internet Access in Williamsburg
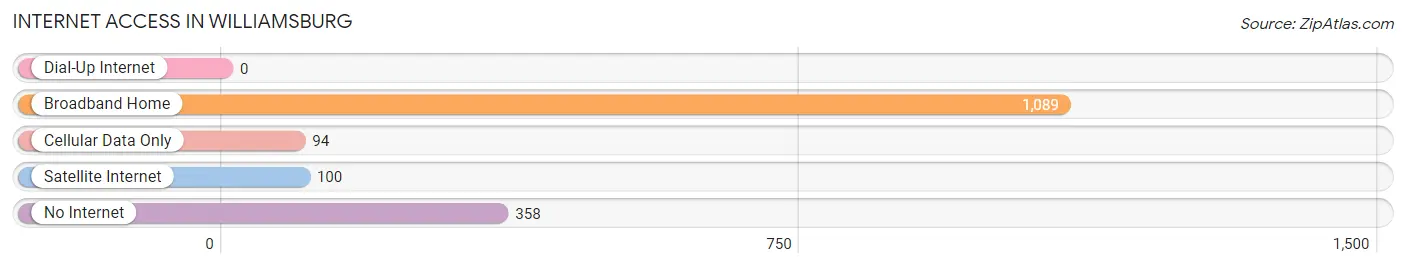
| Internet Type | # Households | % Households |
| Dial-Up Internet | 0 | 0.0% |
| Broadband Home | 1,089 | 68.1% |
| Cellular Data Only | 94 | 5.9% |
| Satellite Internet | 100 | 6.3% |
| No Internet | 358 | 22.4% |
| Total | 1,598 | 100.0% |
Williamsburg Summary
Williamsburg, Kentucky is a small city located in Whitley County in the southeastern part of the state. It is situated in the Cumberland Mountains, and is the county seat of Whitley County. The city has a population of 5,245 as of the 2010 census, and is the largest city in the county.
History
The area that is now Williamsburg was first settled in the late 1700s by a group of settlers from Virginia. The town was originally known as Spring Creek, and was later renamed Williamsburg in honor of the Virginia city of the same name. The town was officially incorporated in 1818, and was the first town in Whitley County.
In the early 1800s, Williamsburg was a thriving center of commerce and industry. It was home to several mills, a tannery, and a distillery. The town was also home to a number of stores and shops, and was a popular stop for travelers on the Wilderness Road.
In the late 1800s, Williamsburg began to decline as the railroad bypassed the town. The town was further hurt by the Great Depression, and many of the businesses in town closed. In the 1950s, the town began to experience a resurgence as the coal industry began to boom in the area. The town was also home to a number of manufacturing plants, and the population began to grow.
Geography
Williamsburg is located in southeastern Kentucky, in the Cumberland Mountains. The city is situated at the intersection of US 25 and KY 92. The city is located about 25 miles north of the Tennessee border, and about 50 miles south of Lexington.
The city is located in a hilly area, and is surrounded by forests and rolling hills. The city is located in the Cumberland Plateau, and is part of the Appalachian Mountains. The city is located in a humid subtropical climate zone, and experiences hot, humid summers and mild winters.
Economy
Williamsburg’s economy is largely based on the coal industry. The city is home to several coal mines, and the coal industry is the largest employer in the city. The city is also home to a number of manufacturing plants, and is a popular tourist destination.
The city is home to a number of retail stores and restaurants, and is a popular shopping destination for the surrounding area. The city is also home to a number of small businesses, and is a popular destination for outdoor recreation.
Demographics
As of the 2010 census, Williamsburg had a population of 5,245. The population is largely white, with a small African American population. The median household income is $30,945, and the median home value is $90,000. The city has a poverty rate of 22.3%, and the unemployment rate is 8.2%.
Conclusion
Williamsburg, Kentucky is a small city located in Whitley County in the southeastern part of the state. The city has a population of 5,245, and is the largest city in the county. The city’s economy is largely based on the coal industry, and the city is also home to a number of manufacturing plants and retail stores. The city has a largely white population, with a small African American population. The median household income is $30,945, and the median home value is $90,000. The city has a poverty rate of 22.3%, and the unemployment rate is 8.2%.
Common Questions
What is Per Capita Income in Williamsburg?
Per Capita income in Williamsburg is $20,721.
What is the Median Family Income in Williamsburg?
Median Family Income in Williamsburg is $50,216.
What is the Median Household income in Williamsburg?
Median Household Income in Williamsburg is $33,875.
What is Income or Wage Gap in Williamsburg?
Income or Wage Gap in Williamsburg is 1.1%.
Women in Williamsburg earn 98.9 cents for every dollar earned by a man.
What is Inequality or Gini Index in Williamsburg?
Inequality or Gini Index in Williamsburg is 0.60.
What is the Total Population of Williamsburg?
Total Population of Williamsburg is 5,229.
What is the Total Male Population of Williamsburg?
Total Male Population of Williamsburg is 2,503.
What is the Total Female Population of Williamsburg?
Total Female Population of Williamsburg is 2,726.
What is the Ratio of Males per 100 Females in Williamsburg?
There are 91.82 Males per 100 Females in Williamsburg.
What is the Ratio of Females per 100 Males in Williamsburg?
There are 108.91 Females per 100 Males in Williamsburg.
What is the Median Population Age in Williamsburg?
Median Population Age in Williamsburg is 27.3 Years.
What is the Average Family Size in Williamsburg
Average Family Size in Williamsburg is 2.8 People.
What is the Average Household Size in Williamsburg
Average Household Size in Williamsburg is 2.4 People.
How Large is the Labor Force in Williamsburg?
There are 2,141 People in the Labor Forcein in Williamsburg.
What is the Percentage of People in the Labor Force in Williamsburg?
46.8% of People are in the Labor Force in Williamsburg.
What is the Unemployment Rate in Williamsburg?
Unemployment Rate in Williamsburg is 12.1%.