Lancaster, KY Map & Demographics
Lancaster Map
Lancaster Overview
$25,076
PER CAPITA INCOME
$51,531
AVG FAMILY INCOME
$45,610
AVG HOUSEHOLD INCOME
46.3%
WAGE / INCOME GAP [ % ]
53.7¢/ $1
WAGE / INCOME GAP [ $ ]
$15,539
FAMILY INCOME DEFICIT
0.52
INEQUALITY / GINI INDEX
3,943
TOTAL POPULATION
1,700
MALE POPULATION
2,243
FEMALE POPULATION
75.79
MALES / 100 FEMALES
131.94
FEMALES / 100 MALES
33.4
MEDIAN AGE
3.2
AVG FAMILY SIZE
2.7
AVG HOUSEHOLD SIZE
1,660
LABOR FORCE [ PEOPLE ]
54.0%
PERCENT IN LABOR FORCE
10.9%
UNEMPLOYMENT RATE
Lancaster Zip Codes
Lancaster Area Codes
Income in Lancaster
Income Overview in Lancaster
Per Capita Income in Lancaster is $25,076, while median incomes of families and households are $51,531 and $45,610 respectively.
| Characteristic | Number | Measure |
| Per Capita Income | 3,943 | $25,076 |
| Median Family Income | 971 | $51,531 |
| Mean Family Income | 971 | $69,974 |
| Median Household Income | 1,438 | $45,610 |
| Mean Household Income | 1,438 | $69,429 |
| Income Deficit | 971 | $15,539 |
| Wage / Income Gap (%) | 3,943 | 46.34% |
| Wage / Income Gap ($) | 3,943 | 53.66¢ per $1 |
| Gini / Inequality Index | 3,943 | 0.52 |
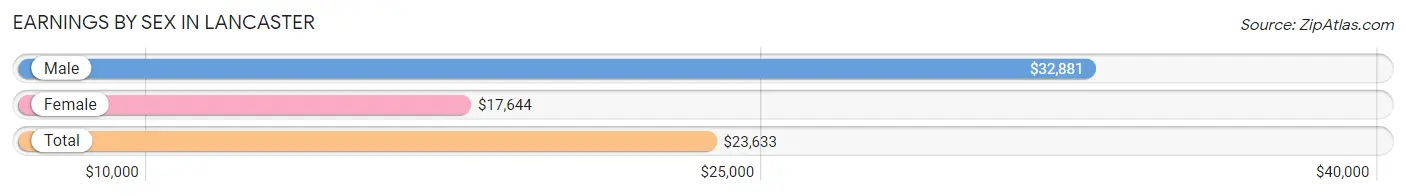
Earnings by Sex in Lancaster
Average Earnings in Lancaster are $23,633, $32,881 for men and $17,644 for women, a difference of 46.3%.
| Sex | Number | Average Earnings |
| Male | 830 (46.5%) | $32,881 |
| Female | 955 (53.5%) | $17,644 |
| Total | 1,785 (100.0%) | $23,633 |
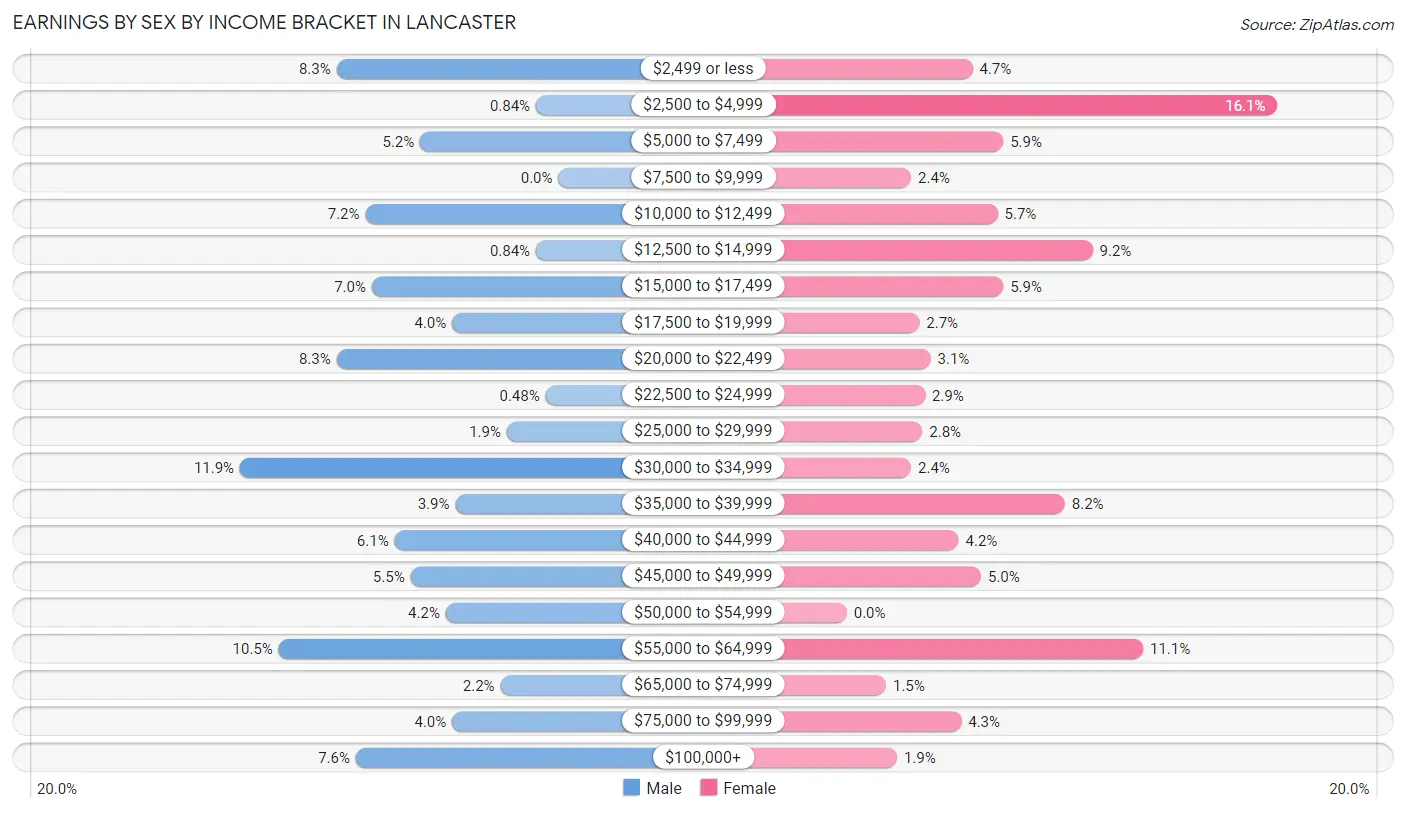
Earnings by Sex by Income Bracket in Lancaster
The most common earnings brackets in Lancaster are $30,000 to $34,999 for men (99 | 11.9%) and $2,500 to $4,999 for women (154 | 16.1%).
| Income | Male | Female |
| $2,499 or less | 69 (8.3%) | 45 (4.7%) |
| $2,500 to $4,999 | 7 (0.8%) | 154 (16.1%) |
| $5,000 to $7,499 | 43 (5.2%) | 56 (5.9%) |
| $7,500 to $9,999 | 0 (0.0%) | 23 (2.4%) |
| $10,000 to $12,499 | 60 (7.2%) | 54 (5.7%) |
| $12,500 to $14,999 | 7 (0.8%) | 88 (9.2%) |
| $15,000 to $17,499 | 58 (7.0%) | 56 (5.9%) |
| $17,500 to $19,999 | 33 (4.0%) | 26 (2.7%) |
| $20,000 to $22,499 | 69 (8.3%) | 30 (3.1%) |
| $22,500 to $24,999 | 4 (0.5%) | 28 (2.9%) |
| $25,000 to $29,999 | 16 (1.9%) | 27 (2.8%) |
| $30,000 to $34,999 | 99 (11.9%) | 23 (2.4%) |
| $35,000 to $39,999 | 32 (3.9%) | 78 (8.2%) |
| $40,000 to $44,999 | 51 (6.1%) | 40 (4.2%) |
| $45,000 to $49,999 | 46 (5.5%) | 48 (5.0%) |
| $50,000 to $54,999 | 35 (4.2%) | 0 (0.0%) |
| $55,000 to $64,999 | 87 (10.5%) | 106 (11.1%) |
| $65,000 to $74,999 | 18 (2.2%) | 14 (1.5%) |
| $75,000 to $99,999 | 33 (4.0%) | 41 (4.3%) |
| $100,000+ | 63 (7.6%) | 18 (1.9%) |
| Total | 830 (100.0%) | 955 (100.0%) |
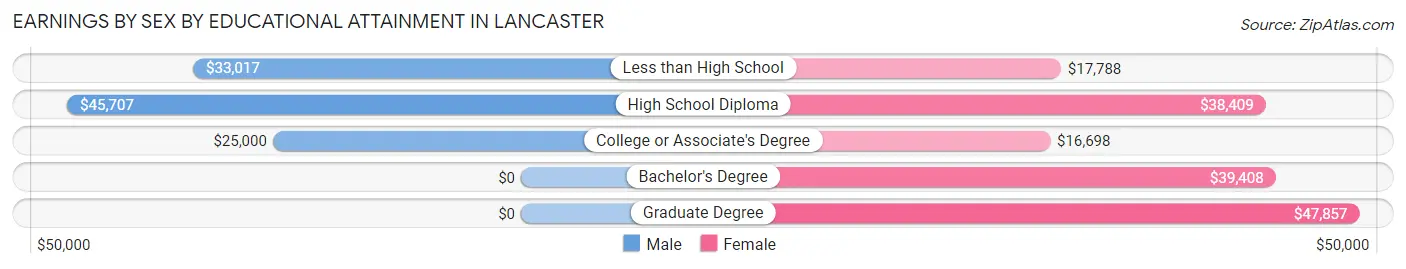
Earnings by Sex by Educational Attainment in Lancaster
Average earnings in Lancaster are $34,364 for men and $25,774 for women, a difference of 25.0%. Men with an educational attainment of high school diploma enjoy the highest average annual earnings of $45,707, while those with college or associate's degree education earn the least with $25,000. Women with an educational attainment of graduate degree earn the most with the average annual earnings of $47,857, while those with college or associate's degree education have the smallest earnings of $16,698.
| Educational Attainment | Male Income | Female Income |
| Less than High School | $33,017 | $17,788 |
| High School Diploma | $45,707 | $38,409 |
| College or Associate's Degree | $25,000 | $16,698 |
| Bachelor's Degree | - | - |
| Graduate Degree | - | - |
| Total | $34,364 | $25,774 |
Family Income in Lancaster
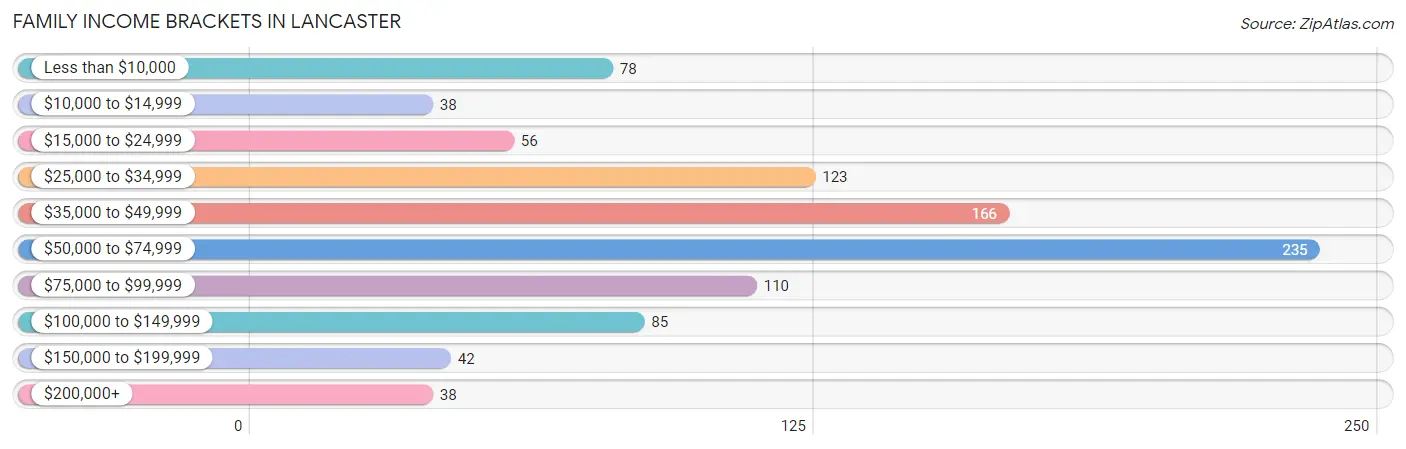
Family Income Brackets in Lancaster
According to the Lancaster family income data, there are 235 families falling into the $50,000 to $74,999 income range, which is the most common income bracket and makes up 24.2% of all families. Conversely, the $10,000 to $14,999 income bracket is the least frequent group with only 38 families (3.9%) belonging to this category.
| Income Bracket | # Families | % Families |
| Less than $10,000 | 78 | 8.0% |
| $10,000 to $14,999 | 38 | 3.9% |
| $15,000 to $24,999 | 56 | 5.8% |
| $25,000 to $34,999 | 123 | 12.7% |
| $35,000 to $49,999 | 166 | 17.1% |
| $50,000 to $74,999 | 235 | 24.2% |
| $75,000 to $99,999 | 110 | 11.3% |
| $100,000 to $149,999 | 85 | 8.8% |
| $150,000 to $199,999 | 42 | 4.3% |
| $200,000+ | 38 | 3.9% |
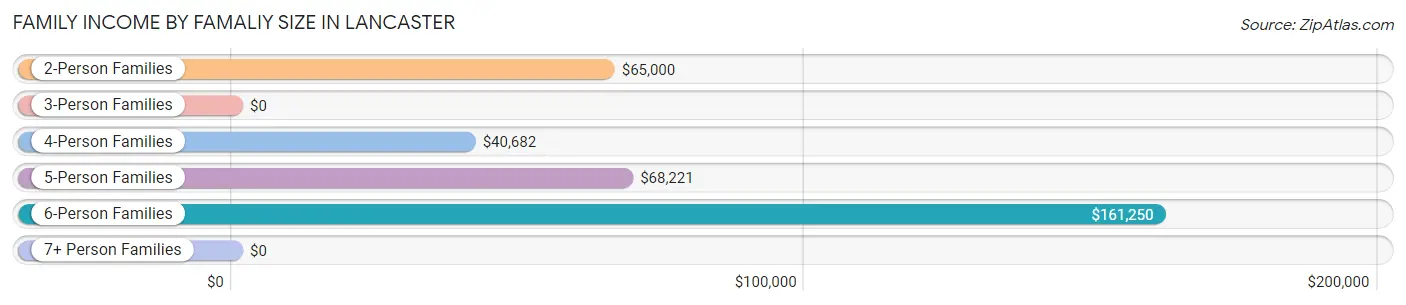
Family Income by Famaliy Size in Lancaster
6-person families (26 | 2.7%) account for the highest median family income in Lancaster with $161,250 per family, while 2-person families (456 | 47.0%) have the highest median income of $32,500 per family member.
| Income Bracket | # Families | Median Income |
| 2-Person Families | 456 (47.0%) | $65,000 |
| 3-Person Families | 189 (19.5%) | $0 |
| 4-Person Families | 198 (20.4%) | $40,682 |
| 5-Person Families | 77 (7.9%) | $68,221 |
| 6-Person Families | 26 (2.7%) | $161,250 |
| 7+ Person Families | 25 (2.6%) | $0 |
| Total | 971 (100.0%) | $51,531 |
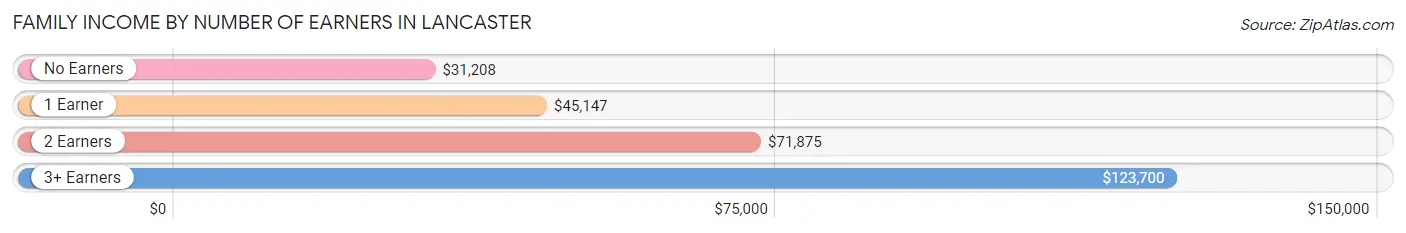
Family Income by Number of Earners in Lancaster
The median family income in Lancaster is $51,531, with families comprising 3+ earners (70) having the highest median family income of $123,700, while families with no earners (208) have the lowest median family income of $31,208, accounting for 7.2% and 21.4% of families, respectively.
| Number of Earners | # Families | Median Income |
| No Earners | 208 (21.4%) | $31,208 |
| 1 Earner | 338 (34.8%) | $45,147 |
| 2 Earners | 355 (36.6%) | $71,875 |
| 3+ Earners | 70 (7.2%) | $123,700 |
| Total | 971 (100.0%) | $51,531 |
Household Income in Lancaster
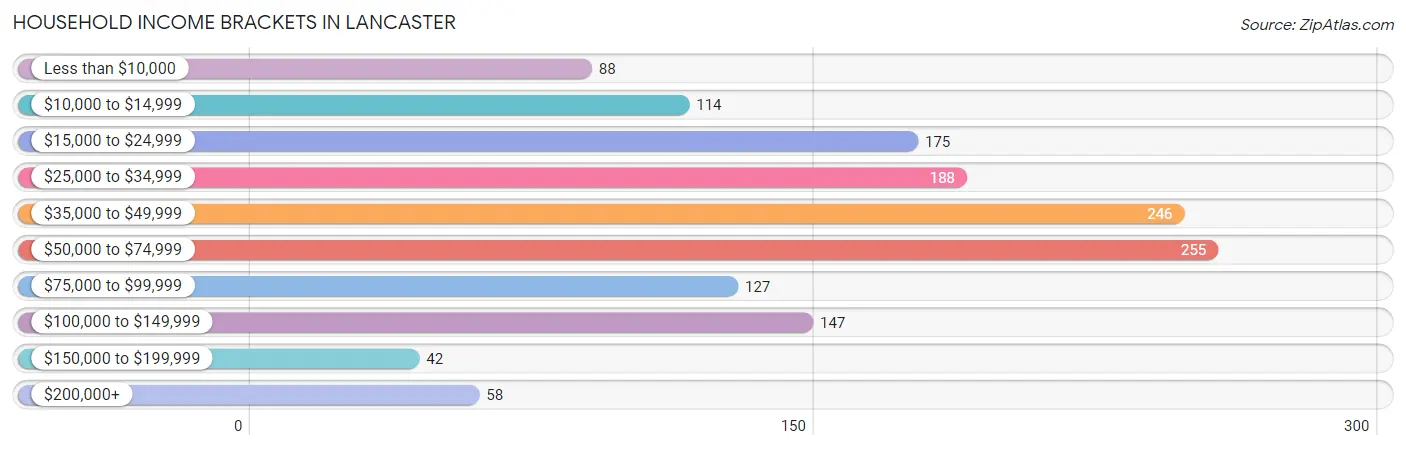
Household Income Brackets in Lancaster
With 255 households falling in the category, the $50,000 to $74,999 income range is the most frequent in Lancaster, accounting for 17.7% of all households. In contrast, only 42 households (2.9%) fall into the $150,000 to $199,999 income bracket, making it the least populous group.
| Income Bracket | # Households | % Households |
| Less than $10,000 | 88 | 6.1% |
| $10,000 to $14,999 | 114 | 7.9% |
| $15,000 to $24,999 | 175 | 12.2% |
| $25,000 to $34,999 | 188 | 13.1% |
| $35,000 to $49,999 | 246 | 17.1% |
| $50,000 to $74,999 | 255 | 17.7% |
| $75,000 to $99,999 | 127 | 8.8% |
| $100,000 to $149,999 | 147 | 10.2% |
| $150,000 to $199,999 | 42 | 2.9% |
| $200,000+ | 58 | 4.0% |
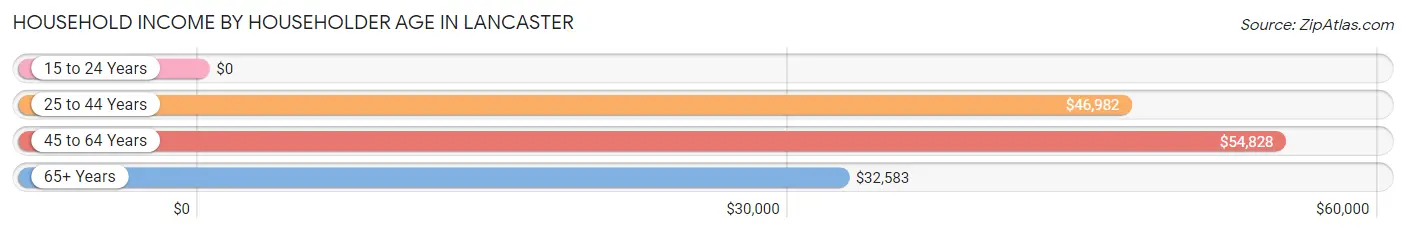
Household Income by Householder Age in Lancaster
The median household income in Lancaster is $45,610, with the highest median household income of $54,828 found in the 45 to 64 years age bracket for the primary householder. A total of 488 households (33.9%) fall into this category. Meanwhile, the 15 to 24 years age bracket for the primary householder has the lowest median household income of $0, with 29 households (2.0%) in this group.
| Income Bracket | # Households | Median Income |
| 15 to 24 Years | 29 (2.0%) | $0 |
| 25 to 44 Years | 539 (37.5%) | $46,982 |
| 45 to 64 Years | 488 (33.9%) | $54,828 |
| 65+ Years | 382 (26.6%) | $32,583 |
| Total | 1,438 (100.0%) | $45,610 |
Poverty in Lancaster
Income Below Poverty by Sex and Age in Lancaster
With 12.4% poverty level for males and 24.5% for females among the residents of Lancaster, under 5 year old males and under 5 year old females are the most vulnerable to poverty, with 46 males (40.4%) and 47 females (55.3%) in their respective age groups living below the poverty level.
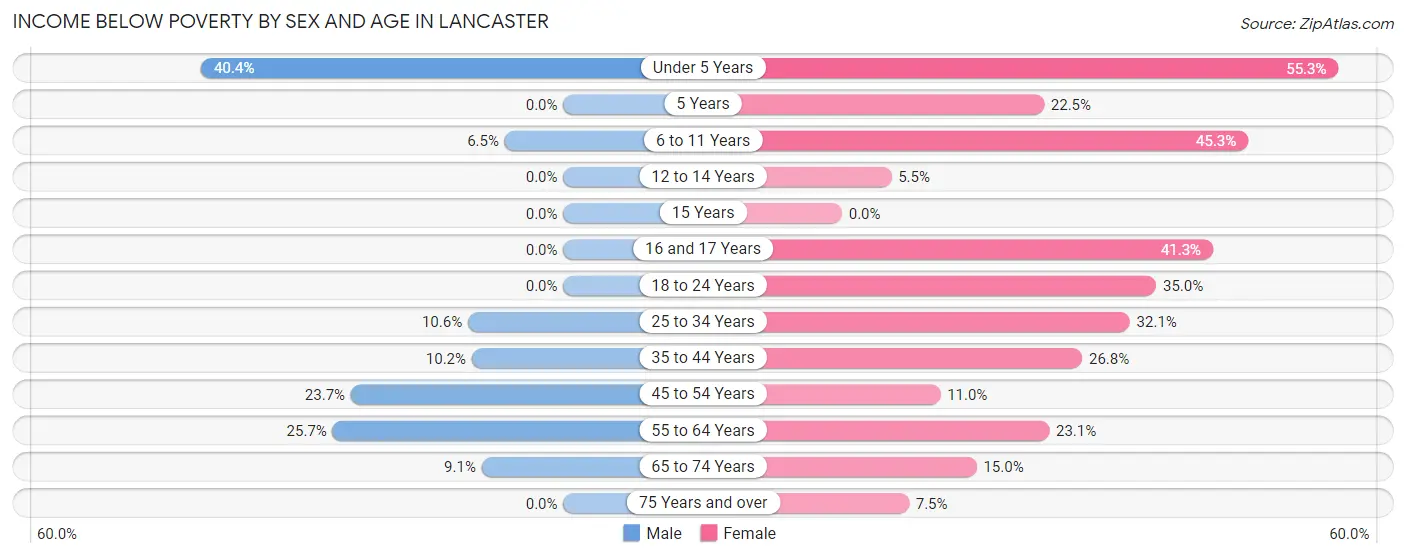
| Age Bracket | Male | Female |
| Under 5 Years | 46 (40.4%) | 47 (55.3%) |
| 5 Years | 0 (0.0%) | 9 (22.5%) |
| 6 to 11 Years | 9 (6.5%) | 81 (45.3%) |
| 12 to 14 Years | 0 (0.0%) | 6 (5.5%) |
| 15 Years | 0 (0.0%) | 0 (0.0%) |
| 16 and 17 Years | 0 (0.0%) | 31 (41.3%) |
| 18 to 24 Years | 0 (0.0%) | 84 (35.0%) |
| 25 to 34 Years | 34 (10.6%) | 109 (32.1%) |
| 35 to 44 Years | 21 (10.2%) | 57 (26.8%) |
| 45 to 54 Years | 31 (23.7%) | 40 (11.0%) |
| 55 to 64 Years | 56 (25.7%) | 27 (23.1%) |
| 65 to 74 Years | 6 (9.1%) | 15 (15.0%) |
| 75 Years and over | 0 (0.0%) | 20 (7.5%) |
| Total | 203 (12.4%) | 526 (24.5%) |
Income Above Poverty by Sex and Age in Lancaster
According to the poverty statistics in Lancaster, males aged 5 years and females aged 15 years are the age groups that are most secure financially, with 100.0% of males and 100.0% of females in these age groups living above the poverty line.
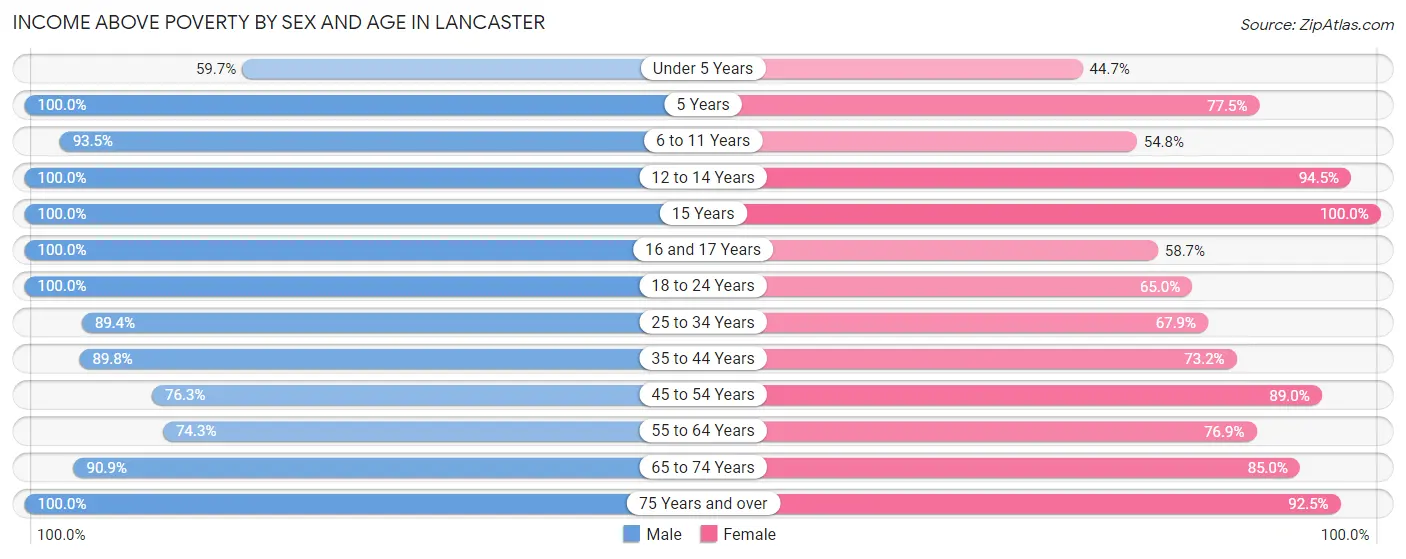
| Age Bracket | Male | Female |
| Under 5 Years | 68 (59.7%) | 38 (44.7%) |
| 5 Years | 29 (100.0%) | 31 (77.5%) |
| 6 to 11 Years | 129 (93.5%) | 98 (54.7%) |
| 12 to 14 Years | 48 (100.0%) | 103 (94.5%) |
| 15 Years | 55 (100.0%) | 16 (100.0%) |
| 16 and 17 Years | 27 (100.0%) | 44 (58.7%) |
| 18 to 24 Years | 177 (100.0%) | 156 (65.0%) |
| 25 to 34 Years | 286 (89.4%) | 231 (67.9%) |
| 35 to 44 Years | 185 (89.8%) | 156 (73.2%) |
| 45 to 54 Years | 100 (76.3%) | 325 (89.0%) |
| 55 to 64 Years | 162 (74.3%) | 90 (76.9%) |
| 65 to 74 Years | 60 (90.9%) | 85 (85.0%) |
| 75 Years and over | 112 (100.0%) | 248 (92.5%) |
| Total | 1,438 (87.6%) | 1,621 (75.5%) |
Income Below Poverty Among Married-Couple Families in Lancaster
The poverty statistics for married-couple families in Lancaster show that 5.6% or 31 of the total 551 families live below the poverty line. Families with 1 or 2 children have the highest poverty rate of 7.4%, comprising of 10 families. On the other hand, families with 3 or 4 children have the lowest poverty rate of 0.0%, which includes 0 families.
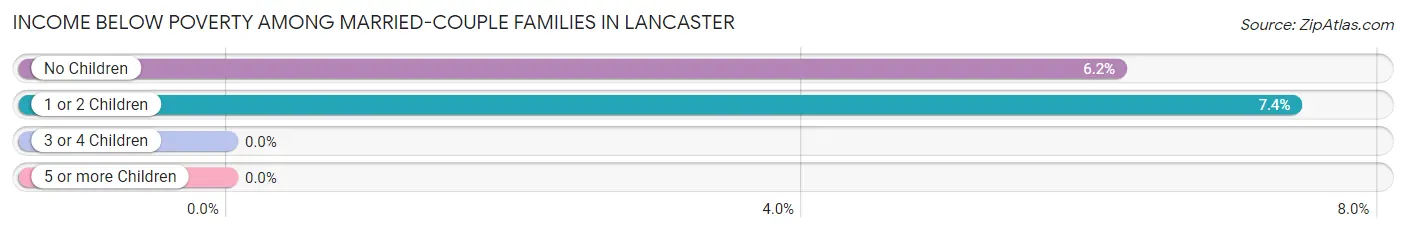
| Children | Above Poverty | Below Poverty |
| No Children | 318 (93.8%) | 21 (6.2%) |
| 1 or 2 Children | 125 (92.6%) | 10 (7.4%) |
| 3 or 4 Children | 77 (100.0%) | 0 (0.0%) |
| 5 or more Children | 0 (0.0%) | 0 (0.0%) |
| Total | 520 (94.4%) | 31 (5.6%) |
Income Below Poverty Among Single-Parent Households in Lancaster
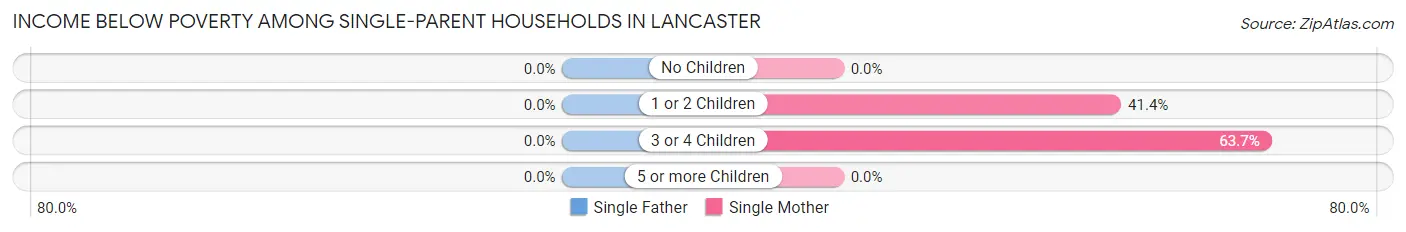
| Children | Single Father | Single Mother |
| No Children | 0 (0.0%) | 0 (0.0%) |
| 1 or 2 Children | 0 (0.0%) | 55 (41.3%) |
| 3 or 4 Children | 0 (0.0%) | 58 (63.7%) |
| 5 or more Children | 0 (0.0%) | 0 (0.0%) |
| Total | 0 (0.0%) | 113 (32.5%) |
Income Below Poverty Among Married-Couple vs Single-Parent Households in Lancaster
The poverty data for Lancaster shows that 31 of the married-couple family households (5.6%) and 113 of the single-parent households (26.9%) are living below the poverty level. Within the married-couple family households, those with 1 or 2 children have the highest poverty rate, with 10 households (7.4%) falling below the poverty line. Among the single-parent households, those with 3 or 4 children have the highest poverty rate, with 58 household (63.7%) living below poverty.
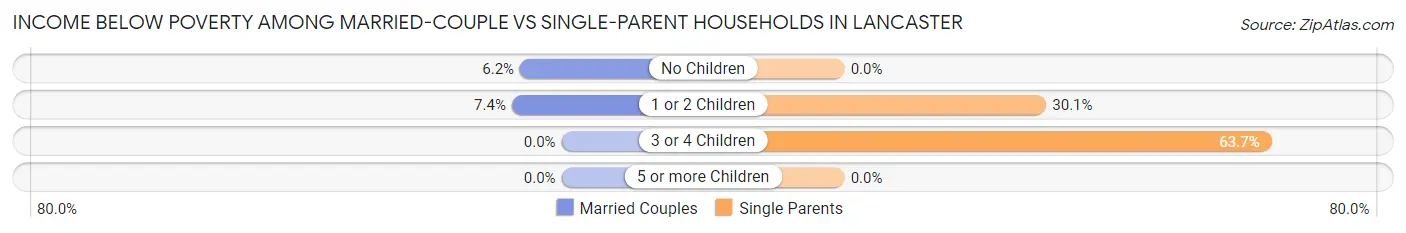
| Children | Married-Couple Families | Single-Parent Households |
| No Children | 21 (6.2%) | 0 (0.0%) |
| 1 or 2 Children | 10 (7.4%) | 55 (30.0%) |
| 3 or 4 Children | 0 (0.0%) | 58 (63.7%) |
| 5 or more Children | 0 (0.0%) | 0 (0.0%) |
| Total | 31 (5.6%) | 113 (26.9%) |
Race in Lancaster
The most populous races in Lancaster are White / Caucasian (3,370 | 85.5%), Black / African American (341 | 8.6%), and Two or more Races (227 | 5.8%).
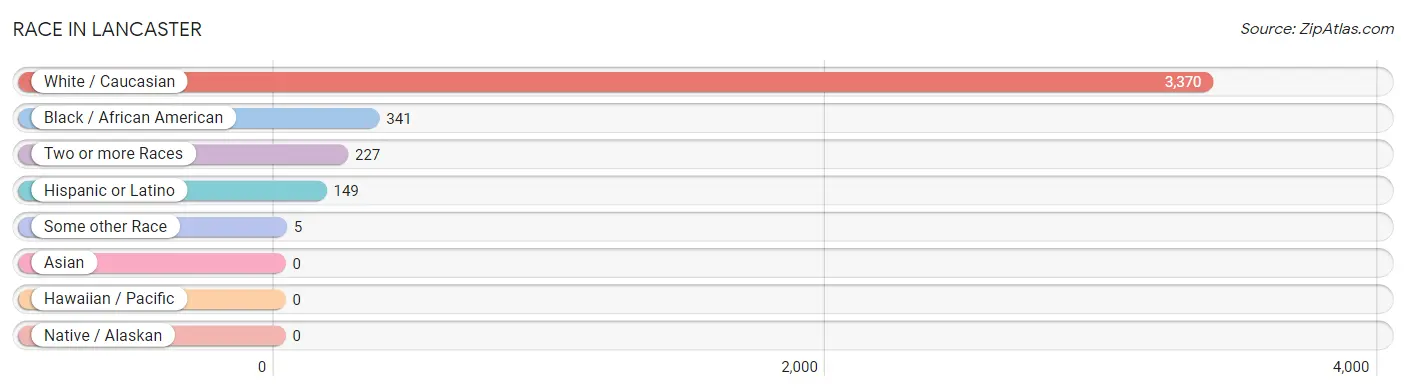
| Race | # Population | % Population |
| Asian | 0 | 0.0% |
| Black / African American | 341 | 8.6% |
| Hawaiian / Pacific | 0 | 0.0% |
| Hispanic or Latino | 149 | 3.8% |
| Native / Alaskan | 0 | 0.0% |
| White / Caucasian | 3,370 | 85.5% |
| Two or more Races | 227 | 5.8% |
| Some other Race | 5 | 0.1% |
| Total | 3,943 | 100.0% |
Ancestry in Lancaster
The most populous ancestries reported in Lancaster are American (1,606 | 40.7%), English (372 | 9.4%), German (216 | 5.5%), Mexican (140 | 3.5%), and Irish (136 | 3.5%), together accounting for 62.6% of all Lancaster residents.
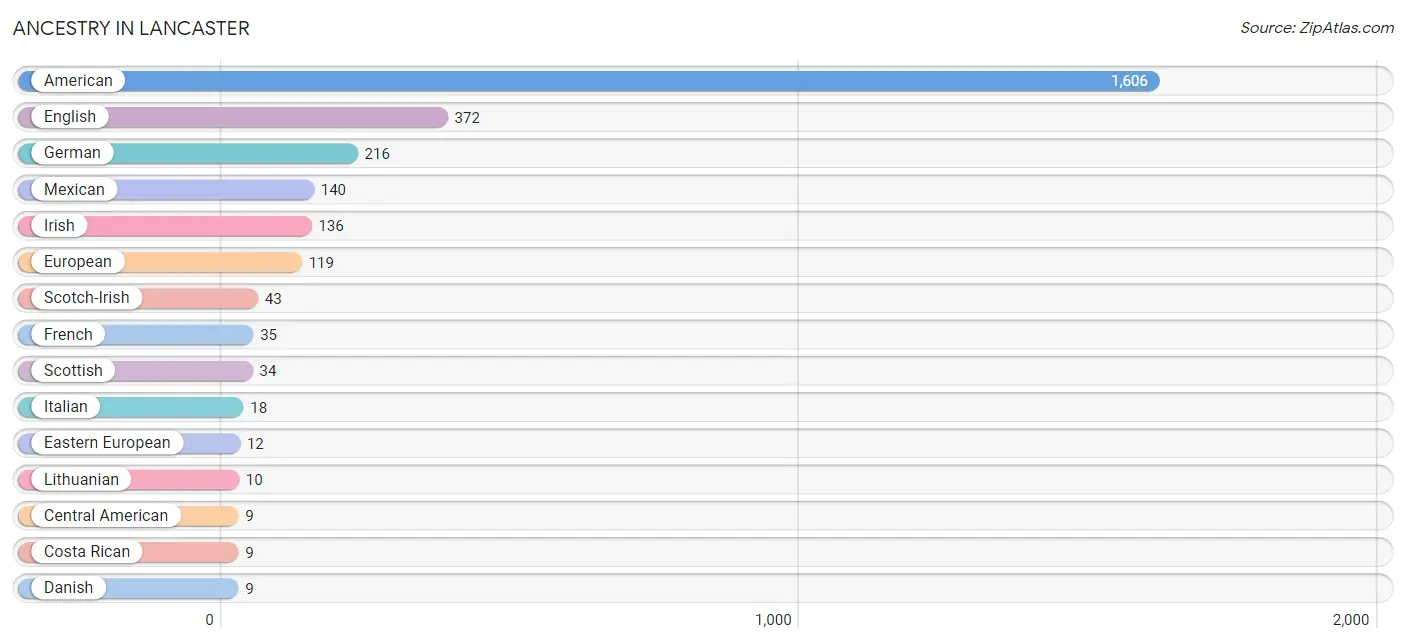
| Ancestry | # Population | % Population |
| American | 1,606 | 40.7% |
| British | 4 | 0.1% |
| Central American | 9 | 0.2% |
| Costa Rican | 9 | 0.2% |
| Danish | 9 | 0.2% |
| Eastern European | 12 | 0.3% |
| English | 372 | 9.4% |
| European | 119 | 3.0% |
| French | 35 | 0.9% |
| German | 216 | 5.5% |
| Irish | 136 | 3.5% |
| Italian | 18 | 0.5% |
| Lithuanian | 10 | 0.3% |
| Mexican | 140 | 3.5% |
| Northern European | 8 | 0.2% |
| Scotch-Irish | 43 | 1.1% |
| Scottish | 34 | 0.9% |
| Swedish | 6 | 0.2% |
| Ukrainian | 7 | 0.2% | View All 19 Rows |
Immigrants in Lancaster
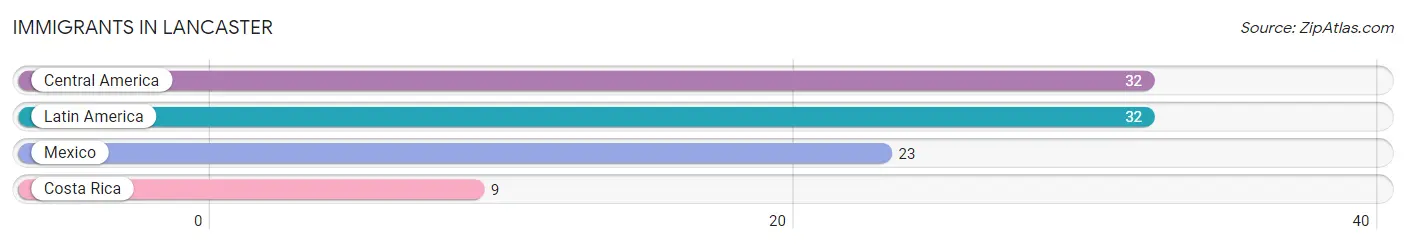
The most numerous immigrant groups reported in Lancaster came from Central America (32 | 0.8%), Latin America (32 | 0.8%), Mexico (23 | 0.6%), and Costa Rica (9 | 0.2%), together accounting for 2.4% of all Lancaster residents.
| Immigration Origin | # Population | % Population |
| Central America | 32 | 0.8% |
| Costa Rica | 9 | 0.2% |
| Latin America | 32 | 0.8% |
| Mexico | 23 | 0.6% | View All 4 Rows |
Sex and Age in Lancaster
Sex and Age in Lancaster
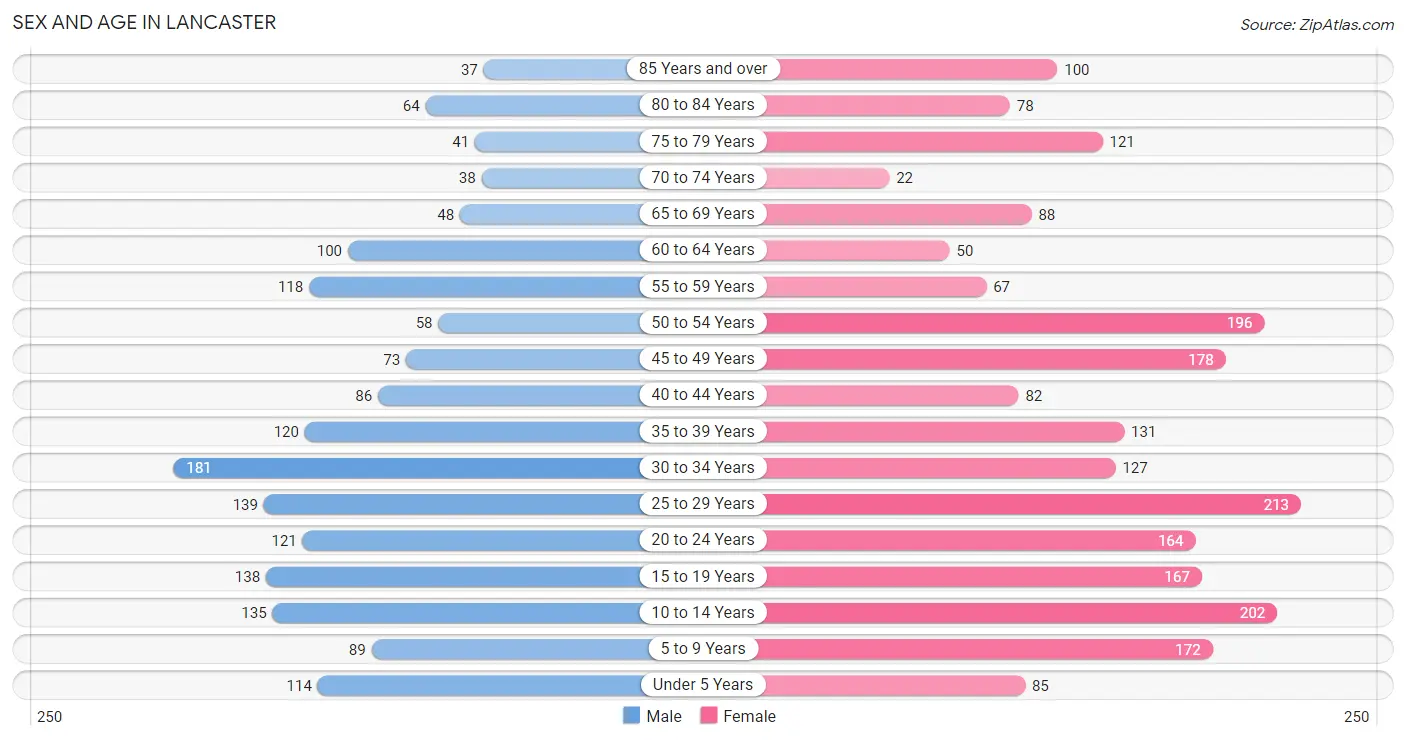
The most populous age groups in Lancaster are 30 to 34 Years (181 | 10.6%) for men and 25 to 29 Years (213 | 9.5%) for women.
| Age Bracket | Male | Female |
| Under 5 Years | 114 (6.7%) | 85 (3.8%) |
| 5 to 9 Years | 89 (5.2%) | 172 (7.7%) |
| 10 to 14 Years | 135 (7.9%) | 202 (9.0%) |
| 15 to 19 Years | 138 (8.1%) | 167 (7.4%) |
| 20 to 24 Years | 121 (7.1%) | 164 (7.3%) |
| 25 to 29 Years | 139 (8.2%) | 213 (9.5%) |
| 30 to 34 Years | 181 (10.6%) | 127 (5.7%) |
| 35 to 39 Years | 120 (7.1%) | 131 (5.8%) |
| 40 to 44 Years | 86 (5.1%) | 82 (3.7%) |
| 45 to 49 Years | 73 (4.3%) | 178 (7.9%) |
| 50 to 54 Years | 58 (3.4%) | 196 (8.7%) |
| 55 to 59 Years | 118 (6.9%) | 67 (3.0%) |
| 60 to 64 Years | 100 (5.9%) | 50 (2.2%) |
| 65 to 69 Years | 48 (2.8%) | 88 (3.9%) |
| 70 to 74 Years | 38 (2.2%) | 22 (1.0%) |
| 75 to 79 Years | 41 (2.4%) | 121 (5.4%) |
| 80 to 84 Years | 64 (3.8%) | 78 (3.5%) |
| 85 Years and over | 37 (2.2%) | 100 (4.5%) |
| Total | 1,700 (100.0%) | 2,243 (100.0%) |
Families and Households in Lancaster
Median Family Size in Lancaster
The median family size in Lancaster is 3.17 persons per family, with married-couple families (551 | 56.8%) accounting for the largest median family size of 3.3 persons per family. On the other hand, single female/mother families (348 | 35.8%) represent the smallest median family size with 2.99 persons per family.
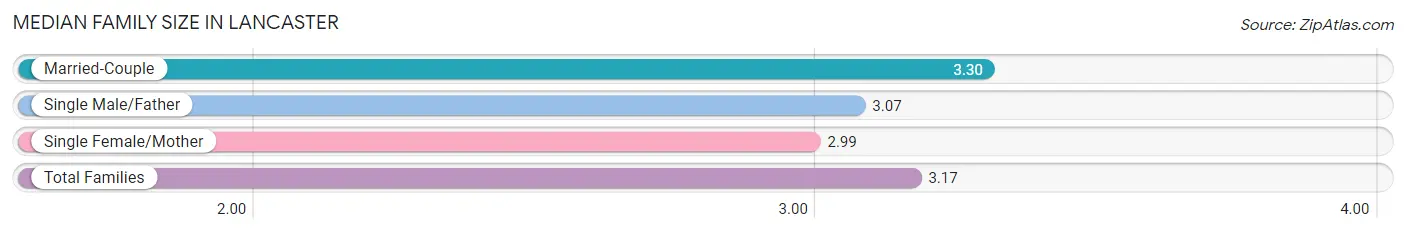
| Family Type | # Families | Family Size |
| Married-Couple | 551 (56.8%) | 3.30 |
| Single Male/Father | 72 (7.4%) | 3.07 |
| Single Female/Mother | 348 (35.8%) | 2.99 |
| Total Families | 971 (100.0%) | 3.17 |
Median Household Size in Lancaster
The median household size in Lancaster is 2.67 persons per household, with married-couple households (551 | 38.3%) accounting for the largest median household size of 3.3 persons per household. non-family households (467 | 32.5%) represent the smallest median household size with 1.45 persons per household.
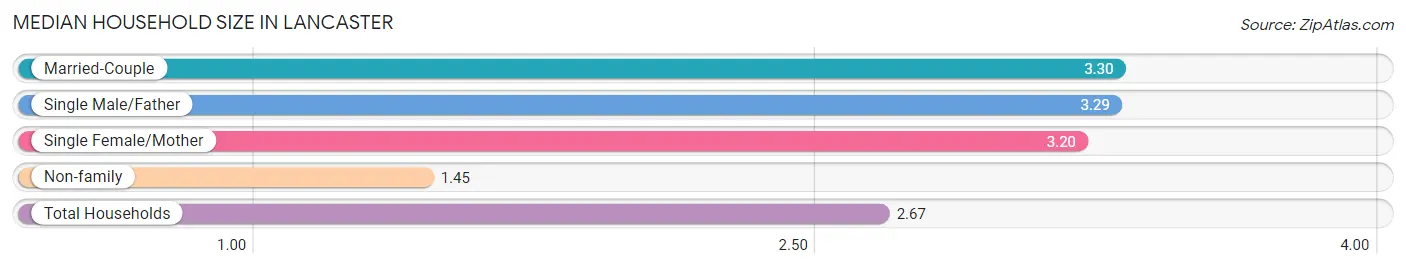
| Household Type | # Households | Household Size |
| Married-Couple | 551 (38.3%) | 3.30 |
| Single Male/Father | 72 (5.0%) | 3.29 |
| Single Female/Mother | 348 (24.2%) | 3.20 |
| Non-family | 467 (32.5%) | 1.45 |
| Total Households | 1,438 (100.0%) | 2.67 |
Household Size by Marriage Status in Lancaster
Out of a total of 1,438 households in Lancaster, 971 (67.5%) are family households, while 467 (32.5%) are nonfamily households. The most numerous type of family households are 2-person households, comprising 422, and the most common type of nonfamily households are 1-person households, comprising 392.
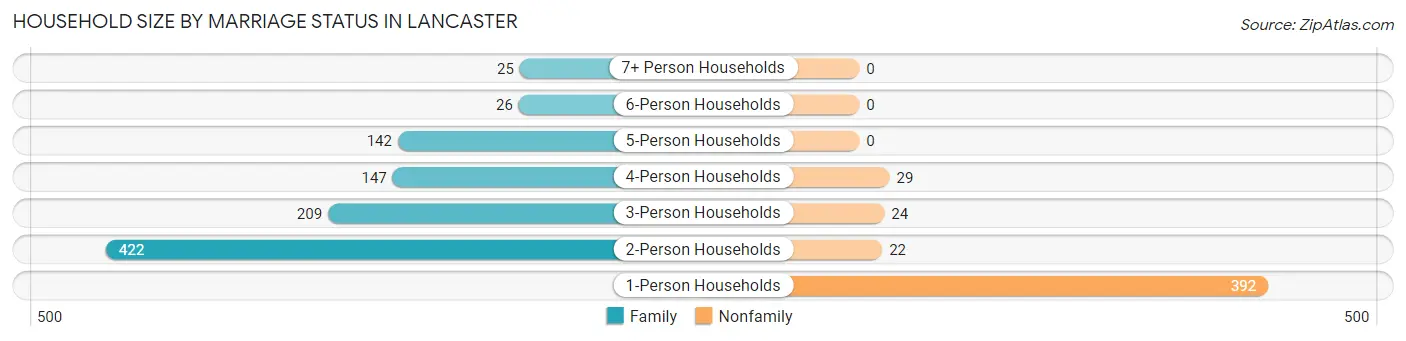
| Household Size | Family Households | Nonfamily Households |
| 1-Person Households | - | 392 (27.3%) |
| 2-Person Households | 422 (29.3%) | 22 (1.5%) |
| 3-Person Households | 209 (14.5%) | 24 (1.7%) |
| 4-Person Households | 147 (10.2%) | 29 (2.0%) |
| 5-Person Households | 142 (9.9%) | 0 (0.0%) |
| 6-Person Households | 26 (1.8%) | 0 (0.0%) |
| 7+ Person Households | 25 (1.7%) | 0 (0.0%) |
| Total | 971 (67.5%) | 467 (32.5%) |
Female Fertility in Lancaster
Fertility by Age in Lancaster
Average fertility rate in Lancaster is 44.0 births per 1,000 women. Women in the age bracket of 20 to 34 years have the highest fertility rate with 75.0 births per 1,000 women. Women in the age bracket of 20 to 34 years acount for 77.5% of all women with births.
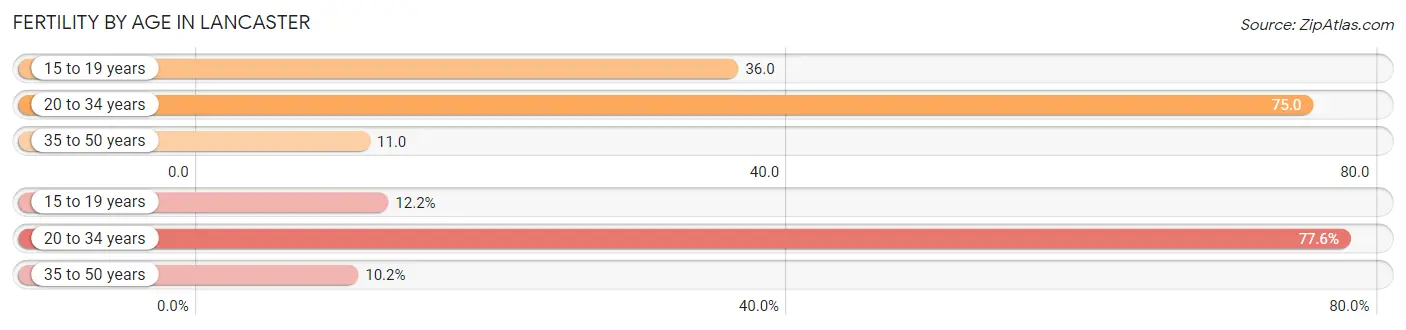
| Age Bracket | Women with Births | Births / 1,000 Women |
| 15 to 19 years | 6 (12.2%) | 36.0 |
| 20 to 34 years | 38 (77.5%) | 75.0 |
| 35 to 50 years | 5 (10.2%) | 11.0 |
| Total | 49 (100.0%) | 44.0 |
Fertility by Age by Marriage Status in Lancaster
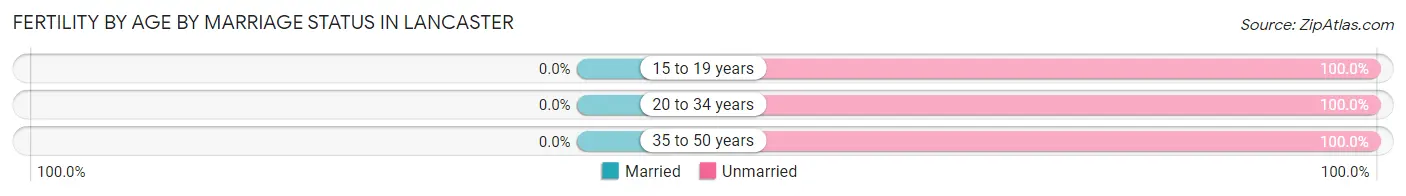
| Age Bracket | Married | Unmarried |
| 15 to 19 years | 0 (0.0%) | 6 (100.0%) |
| 20 to 34 years | 0 (0.0%) | 38 (100.0%) |
| 35 to 50 years | 0 (0.0%) | 5 (100.0%) |
| Total | 0 (0.0%) | 49 (100.0%) |
Fertility by Education in Lancaster
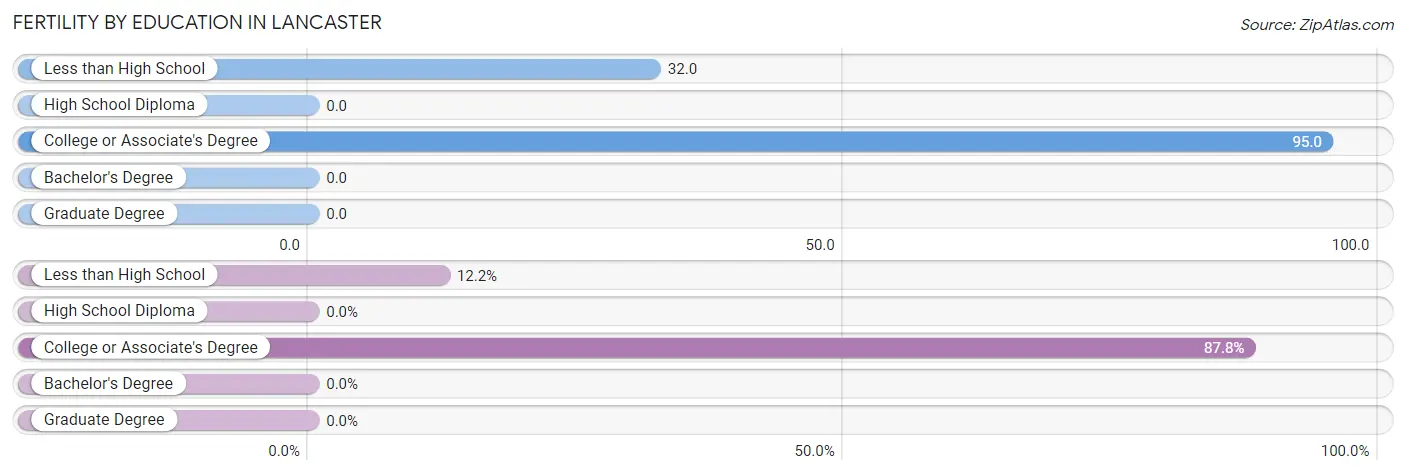
| Educational Attainment | Women with Births | Births / 1,000 Women |
| Less than High School | 6 (12.2%) | 32.0 |
| High School Diploma | 0 (0.0%) | 0.0 |
| College or Associate's Degree | 43 (87.8%) | 95.0 |
| Bachelor's Degree | 0 (0.0%) | 0.0 |
| Graduate Degree | 0 (0.0%) | 0.0 |
| Total | 49 (100.0%) | 44.0 |
Fertility by Education by Marriage Status in Lancaster
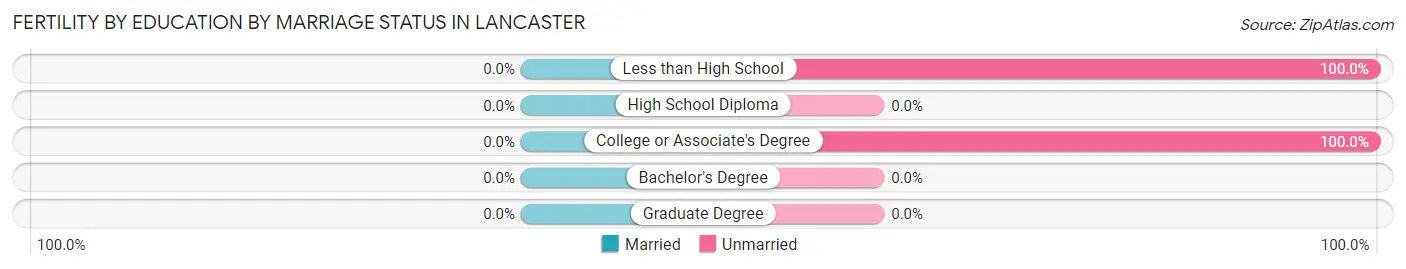
| Educational Attainment | Married | Unmarried |
| Less than High School | 0 (0.0%) | 6 (100.0%) |
| High School Diploma | 0 (0.0%) | 0 (0.0%) |
| College or Associate's Degree | 0 (0.0%) | 43 (100.0%) |
| Bachelor's Degree | 0 (0.0%) | 0 (0.0%) |
| Graduate Degree | 0 (0.0%) | 0 (0.0%) |
| Total | 0 (0.0%) | 49 (100.0%) |
Employment Characteristics in Lancaster
Employment by Class of Employer in Lancaster
Among the 1,475 employed individuals in Lancaster, private company employees (889 | 60.3%), self-employed (not incorporated) (160 | 10.8%), and local government employees (135 | 9.1%) make up the most common classes of employment.
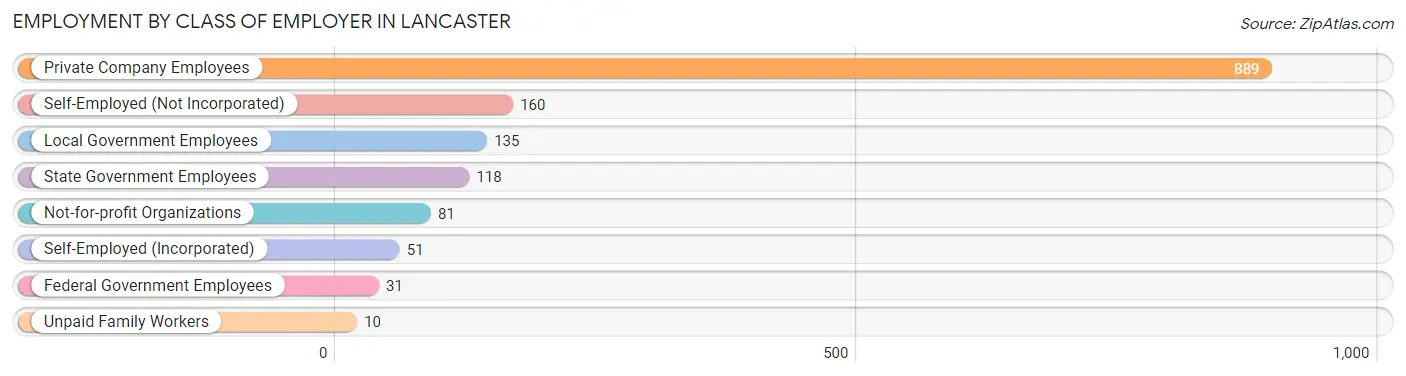
| Employer Class | # Employees | % Employees |
| Private Company Employees | 889 | 60.3% |
| Self-Employed (Incorporated) | 51 | 3.5% |
| Self-Employed (Not Incorporated) | 160 | 10.8% |
| Not-for-profit Organizations | 81 | 5.5% |
| Local Government Employees | 135 | 9.1% |
| State Government Employees | 118 | 8.0% |
| Federal Government Employees | 31 | 2.1% |
| Unpaid Family Workers | 10 | 0.7% |
| Total | 1,475 | 100.0% |
Employment Status by Age in Lancaster
According to the labor force statistics for Lancaster, out of the total population over 16 years of age (3,075), 54.0% or 1,660 individuals are in the labor force, with 10.9% or 181 of them unemployed. The age group with the highest labor force participation rate is 35 to 44 years, with 84.0% or 352 individuals in the labor force. Within the labor force, the 30 to 34 years age range has the highest percentage of unemployed individuals, with 31.2% or 68 of them being unemployed.
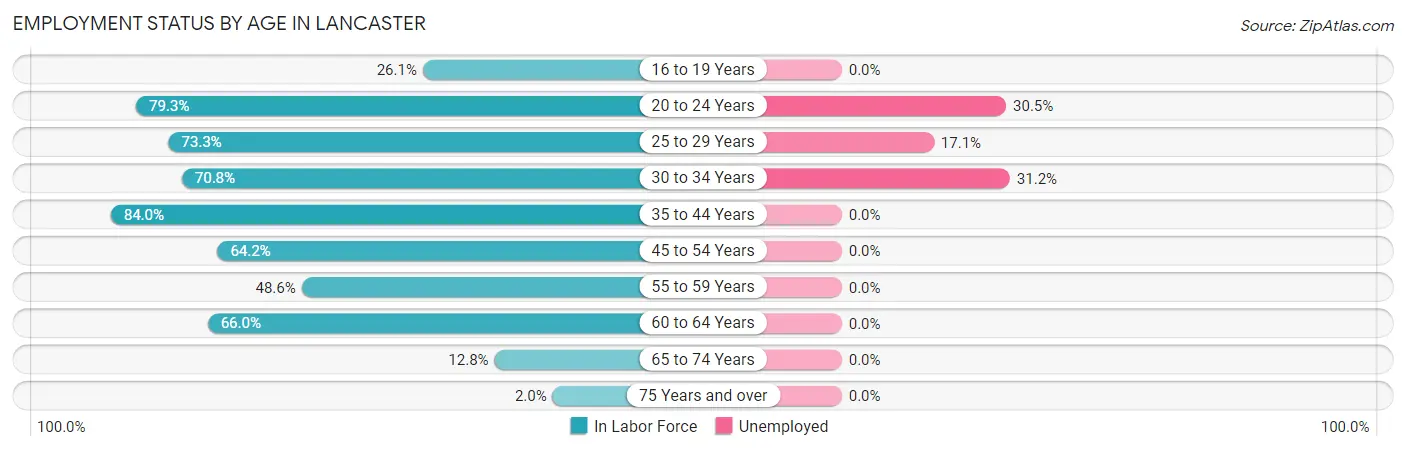
| Age Bracket | In Labor Force | Unemployed |
| 16 to 19 Years | 61 (26.1%) | 0 (0.0%) |
| 20 to 24 Years | 226 (79.3%) | 69 (30.5%) |
| 25 to 29 Years | 258 (73.3%) | 44 (17.1%) |
| 30 to 34 Years | 218 (70.8%) | 68 (31.2%) |
| 35 to 44 Years | 352 (84.0%) | 0 (0.0%) |
| 45 to 54 Years | 324 (64.2%) | 0 (0.0%) |
| 55 to 59 Years | 90 (48.6%) | 0 (0.0%) |
| 60 to 64 Years | 99 (66.0%) | 0 (0.0%) |
| 65 to 74 Years | 25 (12.8%) | 0 (0.0%) |
| 75 Years and over | 9 (2.0%) | 0 (0.0%) |
| Total | 1,660 (54.0%) | 181 (10.9%) |
Employment Status by Educational Attainment in Lancaster
According to labor force statistics for Lancaster, 69.9% of individuals (1,341) out of the total population between 25 and 64 years of age (1,919) are in the labor force, with 8.4% or 113 of them being unemployed. The group with the highest labor force participation rate are those with the educational attainment of bachelor's degree or higher, with 92.4% or 195 individuals in the labor force. Within the labor force, individuals with less than high school education have the highest percentage of unemployment, with 27.5% or 55 of them being unemployed.
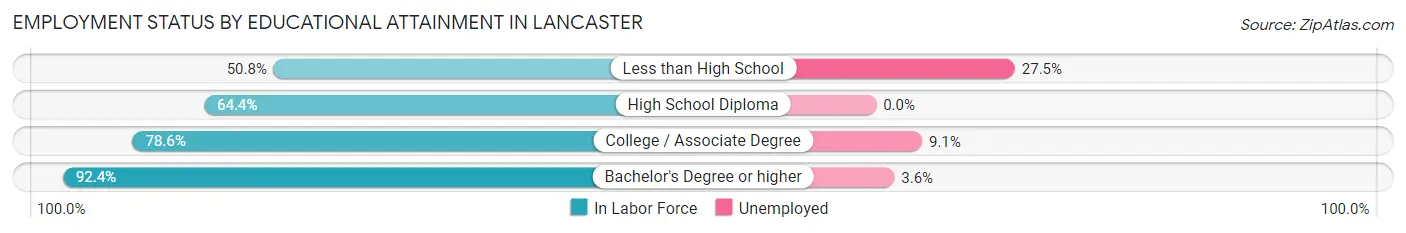
| Educational Attainment | In Labor Force | Unemployed |
| Less than High School | 200 (50.8%) | 108 (27.5%) |
| High School Diploma | 394 (64.4%) | 0 (0.0%) |
| College / Associate Degree | 552 (78.6%) | 64 (9.1%) |
| Bachelor's Degree or higher | 195 (92.4%) | 8 (3.6%) |
| Total | 1,341 (69.9%) | 161 (8.4%) |
Employment Occupations by Sex in Lancaster
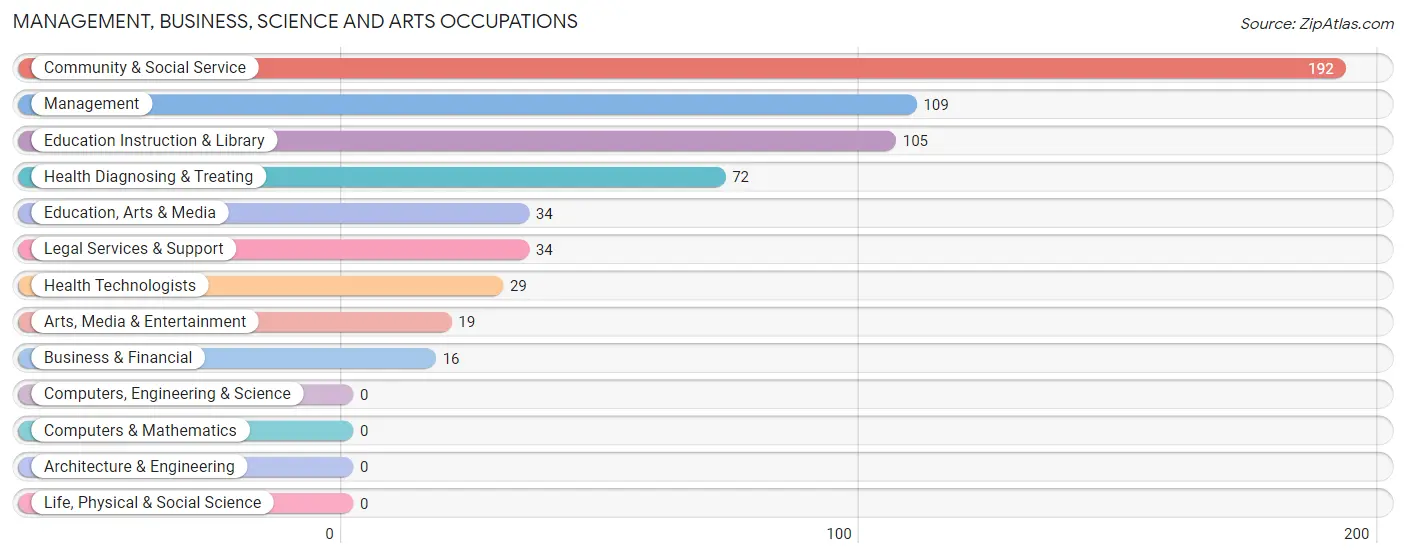
Management, Business, Science and Arts Occupations
The most common Management, Business, Science and Arts occupations in Lancaster are Community & Social Service (192 | 13.0%), Management (109 | 7.4%), Education Instruction & Library (105 | 7.1%), Health Diagnosing & Treating (72 | 4.9%), and Education, Arts & Media (34 | 2.3%).
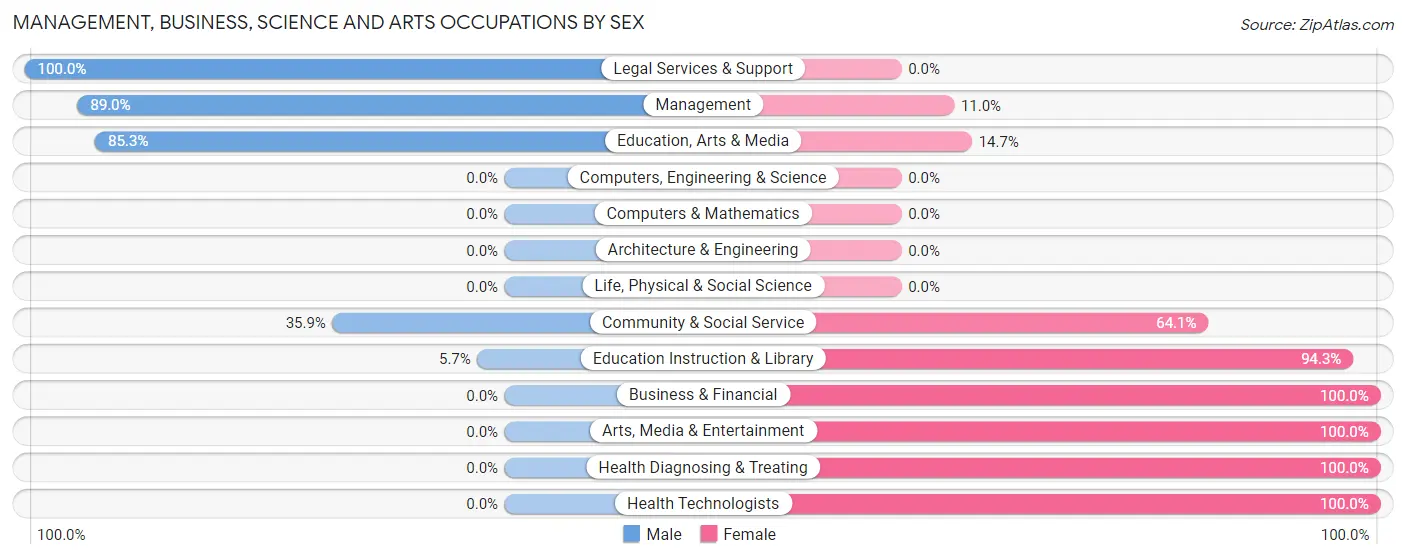
Management, Business, Science and Arts Occupations by Sex
Within the Management, Business, Science and Arts occupations in Lancaster, the most male-oriented occupations are Legal Services & Support (100.0%), Management (89.0%), and Education, Arts & Media (85.3%), while the most female-oriented occupations are Business & Financial (100.0%), Arts, Media & Entertainment (100.0%), and Health Diagnosing & Treating (100.0%).
| Occupation | Male | Female |
| Management | 97 (89.0%) | 12 (11.0%) |
| Business & Financial | 0 (0.0%) | 16 (100.0%) |
| Computers, Engineering & Science | 0 (0.0%) | 0 (0.0%) |
| Computers & Mathematics | 0 (0.0%) | 0 (0.0%) |
| Architecture & Engineering | 0 (0.0%) | 0 (0.0%) |
| Life, Physical & Social Science | 0 (0.0%) | 0 (0.0%) |
| Community & Social Service | 69 (35.9%) | 123 (64.1%) |
| Education, Arts & Media | 29 (85.3%) | 5 (14.7%) |
| Legal Services & Support | 34 (100.0%) | 0 (0.0%) |
| Education Instruction & Library | 6 (5.7%) | 99 (94.3%) |
| Arts, Media & Entertainment | 0 (0.0%) | 19 (100.0%) |
| Health Diagnosing & Treating | 0 (0.0%) | 72 (100.0%) |
| Health Technologists | 0 (0.0%) | 29 (100.0%) |
| Total (Category) | 166 (42.7%) | 223 (57.3%) |
| Total (Overall) | 680 (45.9%) | 801 (54.1%) |
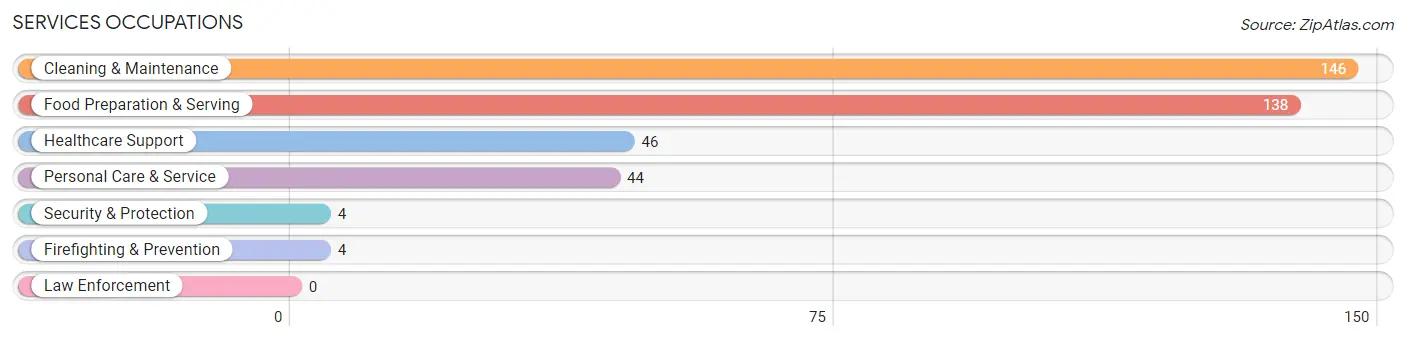
Services Occupations
The most common Services occupations in Lancaster are Cleaning & Maintenance (146 | 9.9%), Food Preparation & Serving (138 | 9.3%), Healthcare Support (46 | 3.1%), Personal Care & Service (44 | 3.0%), and Security & Protection (4 | 0.3%).
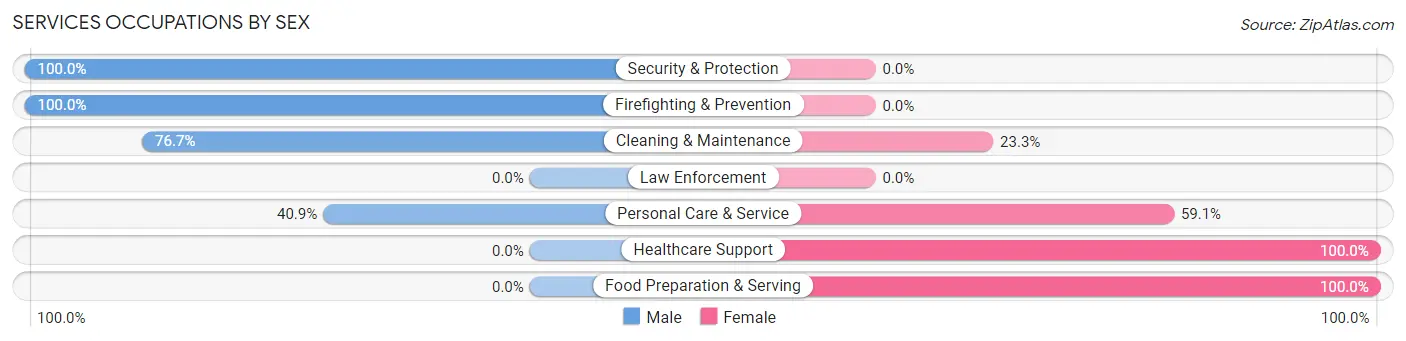
Services Occupations by Sex
Within the Services occupations in Lancaster, the most male-oriented occupations are Security & Protection (100.0%), Firefighting & Prevention (100.0%), and Cleaning & Maintenance (76.7%), while the most female-oriented occupations are Healthcare Support (100.0%), Food Preparation & Serving (100.0%), and Personal Care & Service (59.1%).
| Occupation | Male | Female |
| Healthcare Support | 0 (0.0%) | 46 (100.0%) |
| Security & Protection | 4 (100.0%) | 0 (0.0%) |
| Firefighting & Prevention | 4 (100.0%) | 0 (0.0%) |
| Law Enforcement | 0 (0.0%) | 0 (0.0%) |
| Food Preparation & Serving | 0 (0.0%) | 138 (100.0%) |
| Cleaning & Maintenance | 112 (76.7%) | 34 (23.3%) |
| Personal Care & Service | 18 (40.9%) | 26 (59.1%) |
| Total (Category) | 134 (35.4%) | 244 (64.5%) |
| Total (Overall) | 680 (45.9%) | 801 (54.1%) |
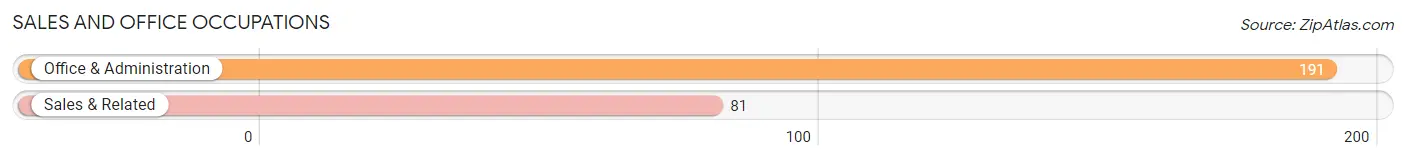
Sales and Office Occupations
The most common Sales and Office occupations in Lancaster are Office & Administration (191 | 12.9%), and Sales & Related (81 | 5.5%).
Sales and Office Occupations by Sex
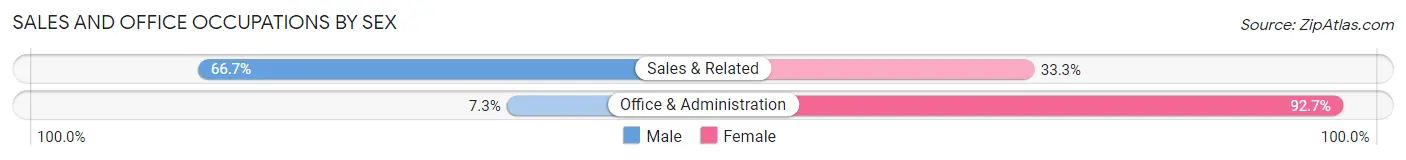
| Occupation | Male | Female |
| Sales & Related | 54 (66.7%) | 27 (33.3%) |
| Office & Administration | 14 (7.3%) | 177 (92.7%) |
| Total (Category) | 68 (25.0%) | 204 (75.0%) |
| Total (Overall) | 680 (45.9%) | 801 (54.1%) |
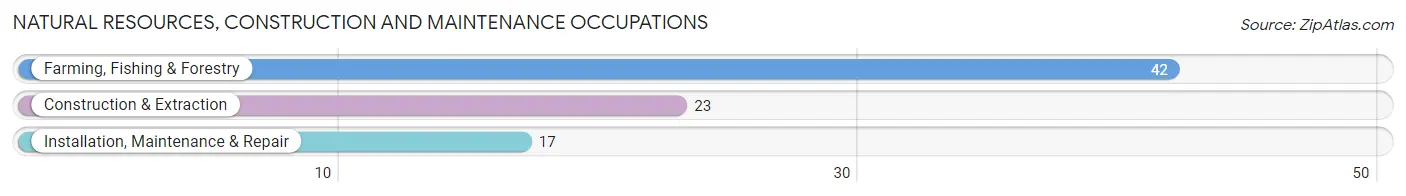
Natural Resources, Construction and Maintenance Occupations
The most common Natural Resources, Construction and Maintenance occupations in Lancaster are Farming, Fishing & Forestry (42 | 2.8%), Construction & Extraction (23 | 1.5%), and Installation, Maintenance & Repair (17 | 1.1%).
Natural Resources, Construction and Maintenance Occupations by Sex
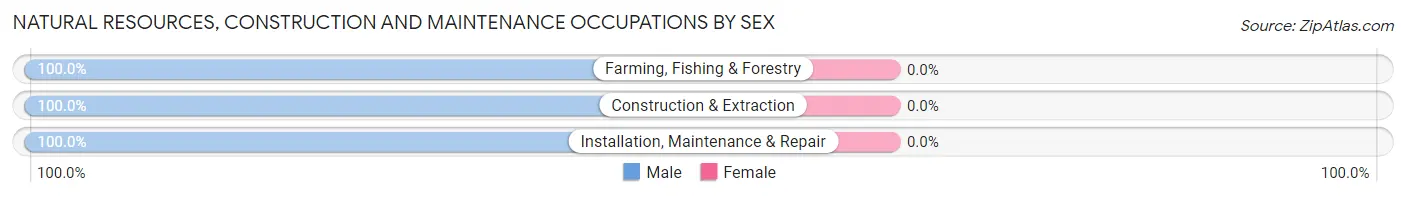
| Occupation | Male | Female |
| Farming, Fishing & Forestry | 42 (100.0%) | 0 (0.0%) |
| Construction & Extraction | 23 (100.0%) | 0 (0.0%) |
| Installation, Maintenance & Repair | 17 (100.0%) | 0 (0.0%) |
| Total (Category) | 82 (100.0%) | 0 (0.0%) |
| Total (Overall) | 680 (45.9%) | 801 (54.1%) |
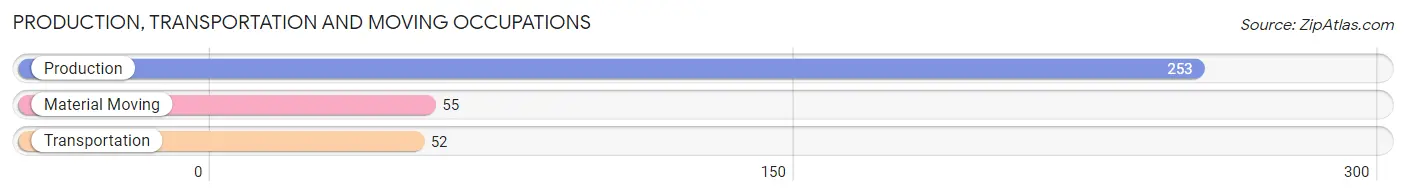
Production, Transportation and Moving Occupations
The most common Production, Transportation and Moving occupations in Lancaster are Production (253 | 17.1%), Material Moving (55 | 3.7%), and Transportation (52 | 3.5%).
Production, Transportation and Moving Occupations by Sex
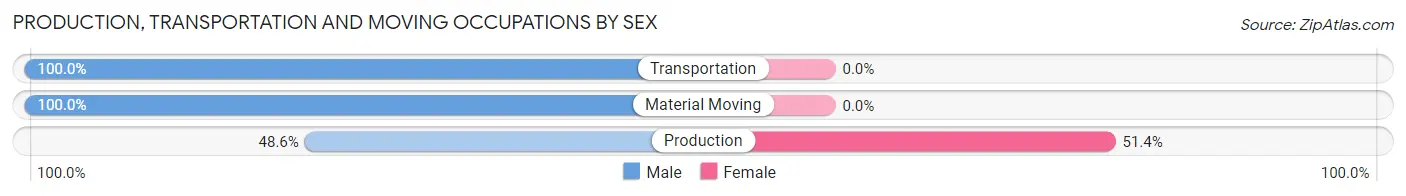
| Occupation | Male | Female |
| Production | 123 (48.6%) | 130 (51.4%) |
| Transportation | 52 (100.0%) | 0 (0.0%) |
| Material Moving | 55 (100.0%) | 0 (0.0%) |
| Total (Category) | 230 (63.9%) | 130 (36.1%) |
| Total (Overall) | 680 (45.9%) | 801 (54.1%) |
Employment Industries by Sex in Lancaster
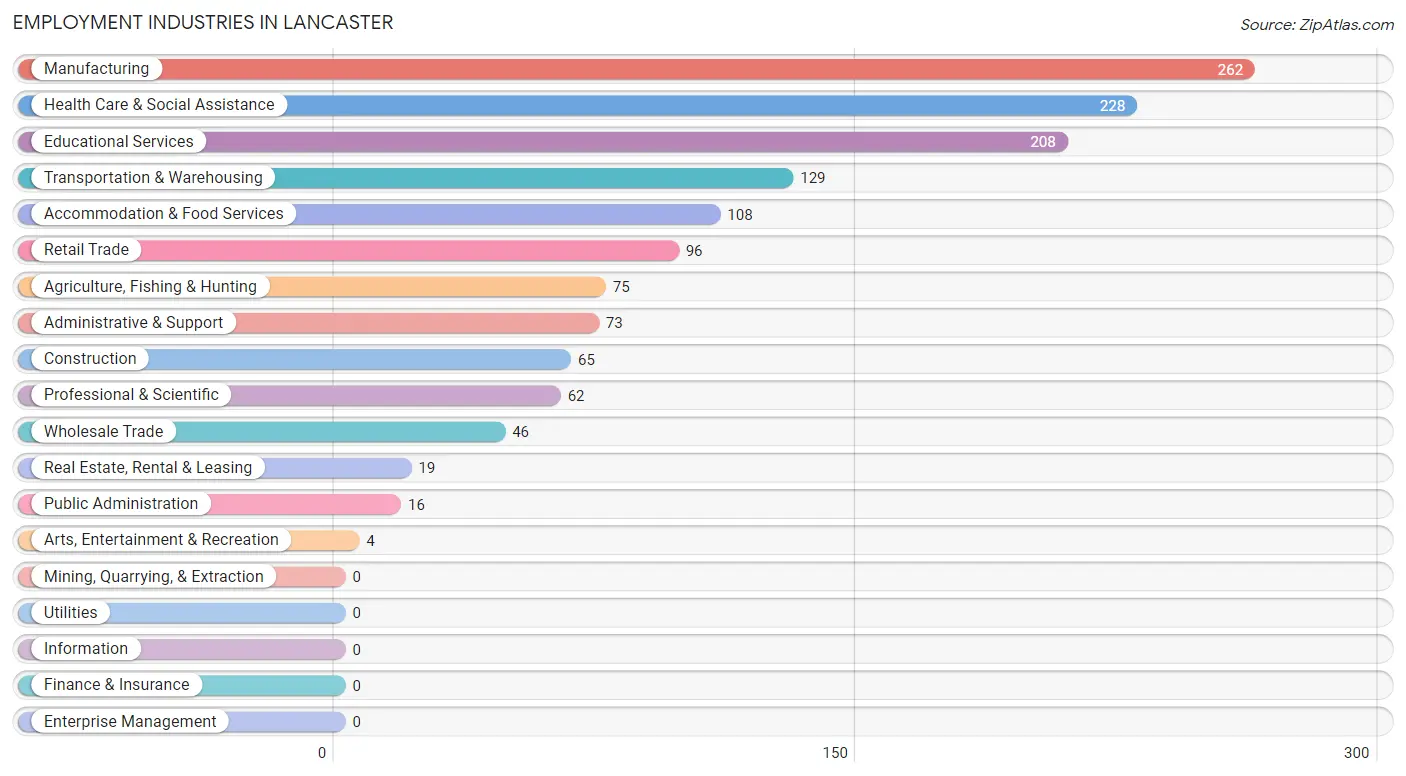
Employment Industries in Lancaster
The major employment industries in Lancaster include Manufacturing (262 | 17.7%), Health Care & Social Assistance (228 | 15.4%), Educational Services (208 | 14.0%), Transportation & Warehousing (129 | 8.7%), and Accommodation & Food Services (108 | 7.3%).
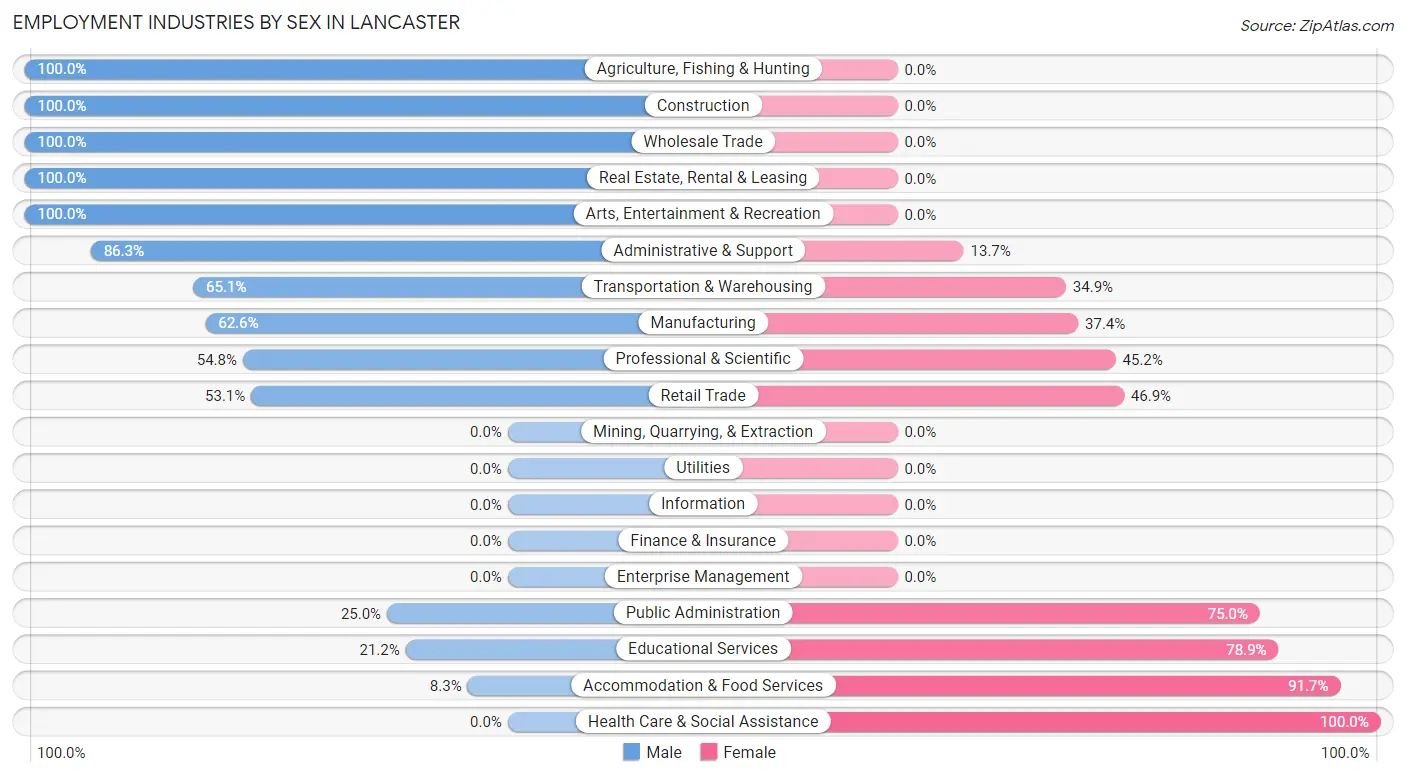
Employment Industries by Sex in Lancaster
The Lancaster industries that see more men than women are Agriculture, Fishing & Hunting (100.0%), Construction (100.0%), and Wholesale Trade (100.0%), whereas the industries that tend to have a higher number of women are Health Care & Social Assistance (100.0%), Accommodation & Food Services (91.7%), and Educational Services (78.8%).
| Industry | Male | Female |
| Agriculture, Fishing & Hunting | 75 (100.0%) | 0 (0.0%) |
| Mining, Quarrying, & Extraction | 0 (0.0%) | 0 (0.0%) |
| Construction | 65 (100.0%) | 0 (0.0%) |
| Manufacturing | 164 (62.6%) | 98 (37.4%) |
| Wholesale Trade | 46 (100.0%) | 0 (0.0%) |
| Retail Trade | 51 (53.1%) | 45 (46.9%) |
| Transportation & Warehousing | 84 (65.1%) | 45 (34.9%) |
| Utilities | 0 (0.0%) | 0 (0.0%) |
| Information | 0 (0.0%) | 0 (0.0%) |
| Finance & Insurance | 0 (0.0%) | 0 (0.0%) |
| Real Estate, Rental & Leasing | 19 (100.0%) | 0 (0.0%) |
| Professional & Scientific | 34 (54.8%) | 28 (45.2%) |
| Enterprise Management | 0 (0.0%) | 0 (0.0%) |
| Administrative & Support | 63 (86.3%) | 10 (13.7%) |
| Educational Services | 44 (21.1%) | 164 (78.8%) |
| Health Care & Social Assistance | 0 (0.0%) | 228 (100.0%) |
| Arts, Entertainment & Recreation | 4 (100.0%) | 0 (0.0%) |
| Accommodation & Food Services | 9 (8.3%) | 99 (91.7%) |
| Public Administration | 4 (25.0%) | 12 (75.0%) |
| Total | 680 (45.9%) | 801 (54.1%) |
Education in Lancaster
School Enrollment in Lancaster
The most common levels of schooling among the 921 students in Lancaster are high school (336 | 36.5%), middle school (203 | 22.0%), and elementary school (199 | 21.6%).
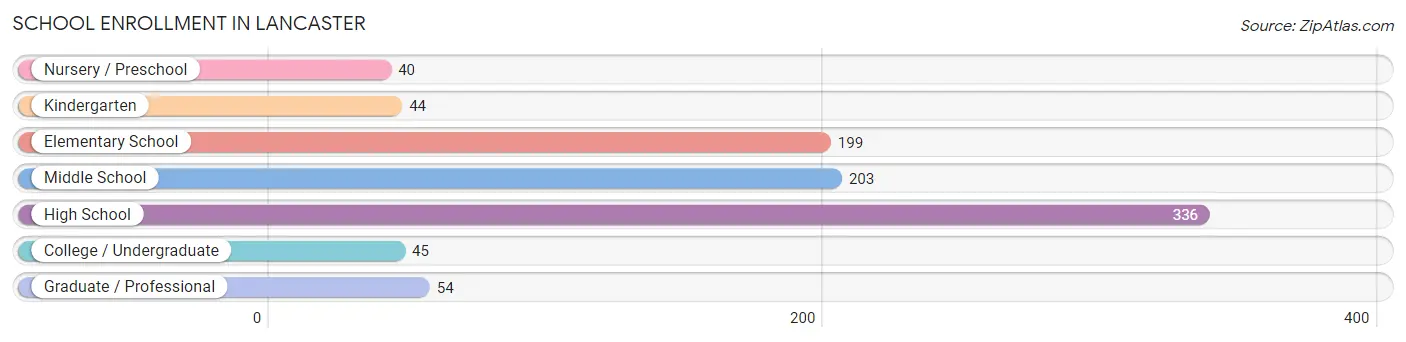
| School Level | # Students | % Students |
| Nursery / Preschool | 40 | 4.3% |
| Kindergarten | 44 | 4.8% |
| Elementary School | 199 | 21.6% |
| Middle School | 203 | 22.0% |
| High School | 336 | 36.5% |
| College / Undergraduate | 45 | 4.9% |
| Graduate / Professional | 54 | 5.9% |
| Total | 921 | 100.0% |
School Enrollment by Age by Funding Source in Lancaster
Out of a total of 921 students who are enrolled in schools in Lancaster, 77 (8.4%) attend a private institution, while the remaining 844 (91.6%) are enrolled in public schools. The age group of 3 to 4 year olds has the highest likelihood of being enrolled in private schools, with 12 (30.0% in the age bracket) enrolled. Conversely, the age group of 10 to 14 year olds has the lowest likelihood of being enrolled in a private school, with 303 (100.0% in the age bracket) attending a public institution.
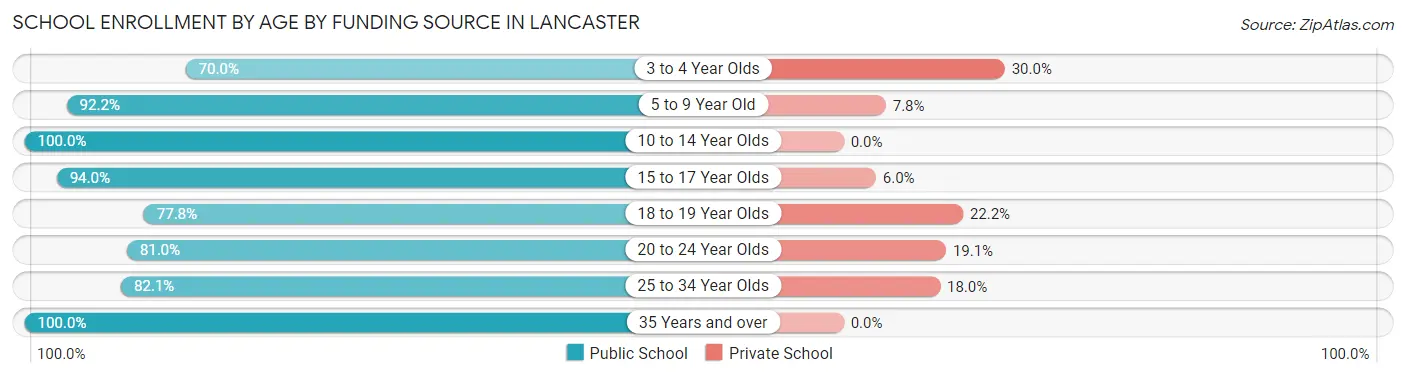
| Age Bracket | Public School | Private School |
| 3 to 4 Year Olds | 28 (70.0%) | 12 (30.0%) |
| 5 to 9 Year Old | 188 (92.2%) | 16 (7.8%) |
| 10 to 14 Year Olds | 303 (100.0%) | 0 (0.0%) |
| 15 to 17 Year Olds | 157 (94.0%) | 10 (6.0%) |
| 18 to 19 Year Olds | 84 (77.8%) | 24 (22.2%) |
| 20 to 24 Year Olds | 34 (80.9%) | 8 (19.1%) |
| 25 to 34 Year Olds | 32 (82.1%) | 7 (17.9%) |
| 35 Years and over | 18 (100.0%) | 0 (0.0%) |
| Total | 844 (91.6%) | 77 (8.4%) |
Educational Attainment by Field of Study in Lancaster
Education (86 | 27.4%), communications (59 | 18.8%), arts & humanities (34 | 10.8%), social sciences (29 | 9.2%), and business (27 | 8.6%) are the most common fields of study among 314 individuals in Lancaster who have obtained a bachelor's degree or higher.
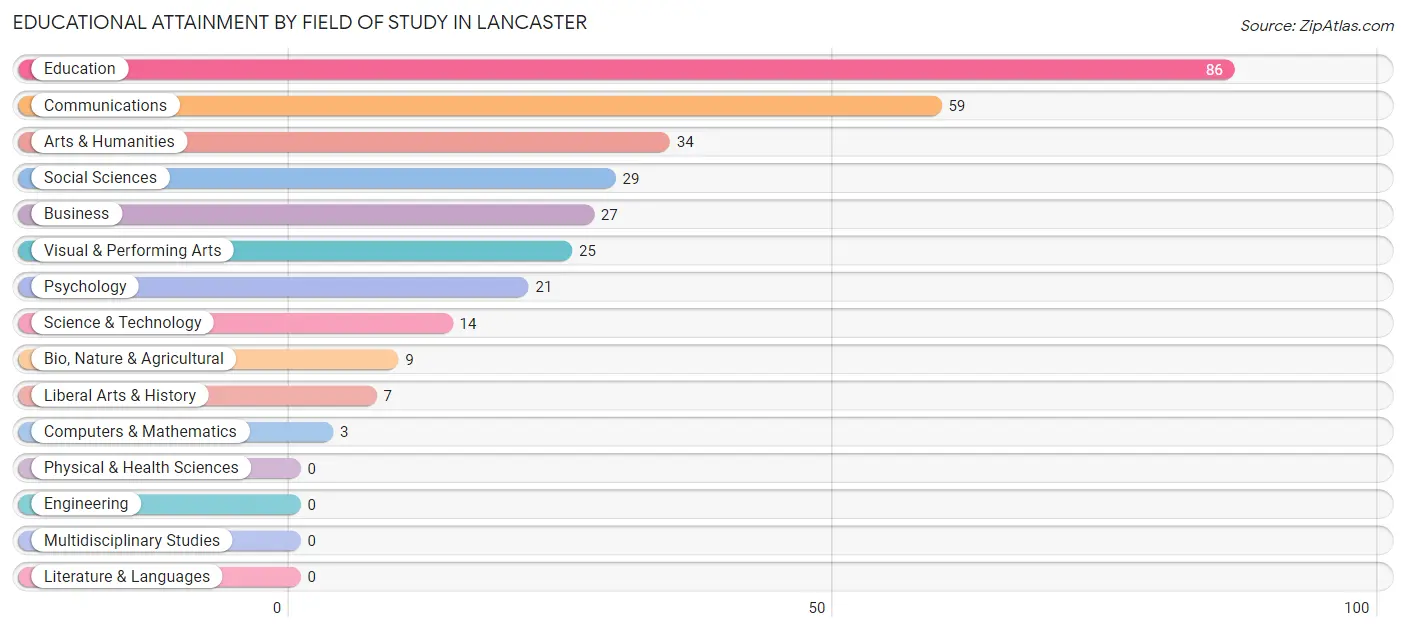
| Field of Study | # Graduates | % Graduates |
| Computers & Mathematics | 3 | 1.0% |
| Bio, Nature & Agricultural | 9 | 2.9% |
| Physical & Health Sciences | 0 | 0.0% |
| Psychology | 21 | 6.7% |
| Social Sciences | 29 | 9.2% |
| Engineering | 0 | 0.0% |
| Multidisciplinary Studies | 0 | 0.0% |
| Science & Technology | 14 | 4.5% |
| Business | 27 | 8.6% |
| Education | 86 | 27.4% |
| Literature & Languages | 0 | 0.0% |
| Liberal Arts & History | 7 | 2.2% |
| Visual & Performing Arts | 25 | 8.0% |
| Communications | 59 | 18.8% |
| Arts & Humanities | 34 | 10.8% |
| Total | 314 | 100.0% |
Transportation & Commute in Lancaster
Vehicle Availability by Sex in Lancaster
The most prevalent vehicle ownership categories in Lancaster are males with 2 vehicles (290, accounting for 42.6%) and females with 2 vehicles (292, making up 36.5%).
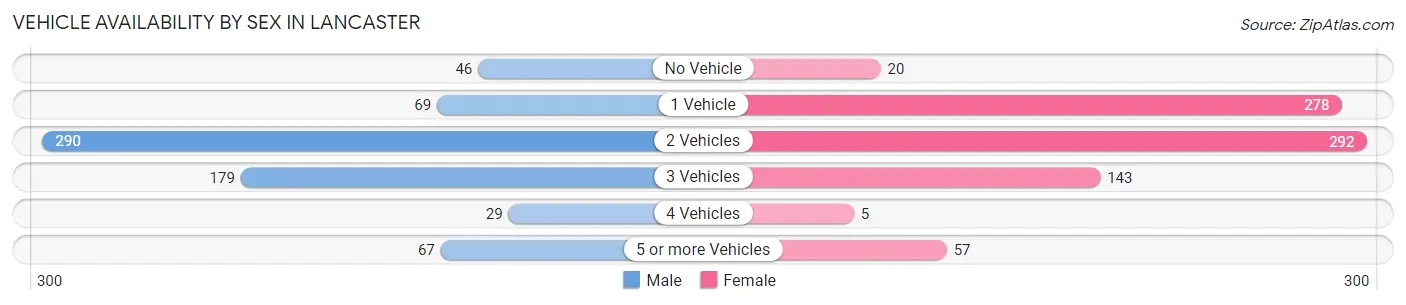
| Vehicles Available | Male | Female |
| No Vehicle | 46 (6.8%) | 20 (2.5%) |
| 1 Vehicle | 69 (10.2%) | 278 (35.0%) |
| 2 Vehicles | 290 (42.6%) | 292 (36.7%) |
| 3 Vehicles | 179 (26.3%) | 143 (18.0%) |
| 4 Vehicles | 29 (4.3%) | 5 (0.6%) |
| 5 or more Vehicles | 67 (9.9%) | 57 (7.2%) |
| Total | 680 (100.0%) | 795 (100.0%) |
Commute Time in Lancaster
The most frequently occuring commute durations in Lancaster are 5 to 9 minutes (193 commuters, 14.3%), 20 to 24 minutes (160 commuters, 11.9%), and 45 to 59 minutes (154 commuters, 11.5%).
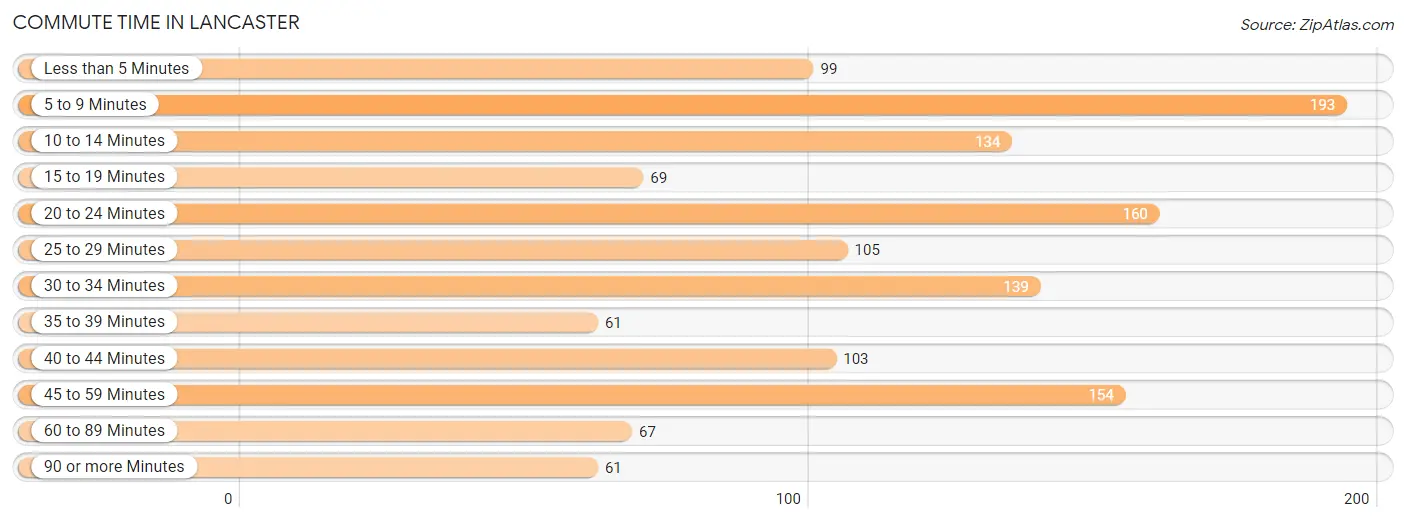
| Commute Time | # Commuters | % Commuters |
| Less than 5 Minutes | 99 | 7.4% |
| 5 to 9 Minutes | 193 | 14.3% |
| 10 to 14 Minutes | 134 | 10.0% |
| 15 to 19 Minutes | 69 | 5.1% |
| 20 to 24 Minutes | 160 | 11.9% |
| 25 to 29 Minutes | 105 | 7.8% |
| 30 to 34 Minutes | 139 | 10.3% |
| 35 to 39 Minutes | 61 | 4.5% |
| 40 to 44 Minutes | 103 | 7.7% |
| 45 to 59 Minutes | 154 | 11.5% |
| 60 to 89 Minutes | 67 | 5.0% |
| 90 or more Minutes | 61 | 4.5% |
Commute Time by Sex in Lancaster
The most common commute times in Lancaster are less than 5 minutes (74 commuters, 13.0%) for males and 5 to 9 minutes (149 commuters, 19.2%) for females.
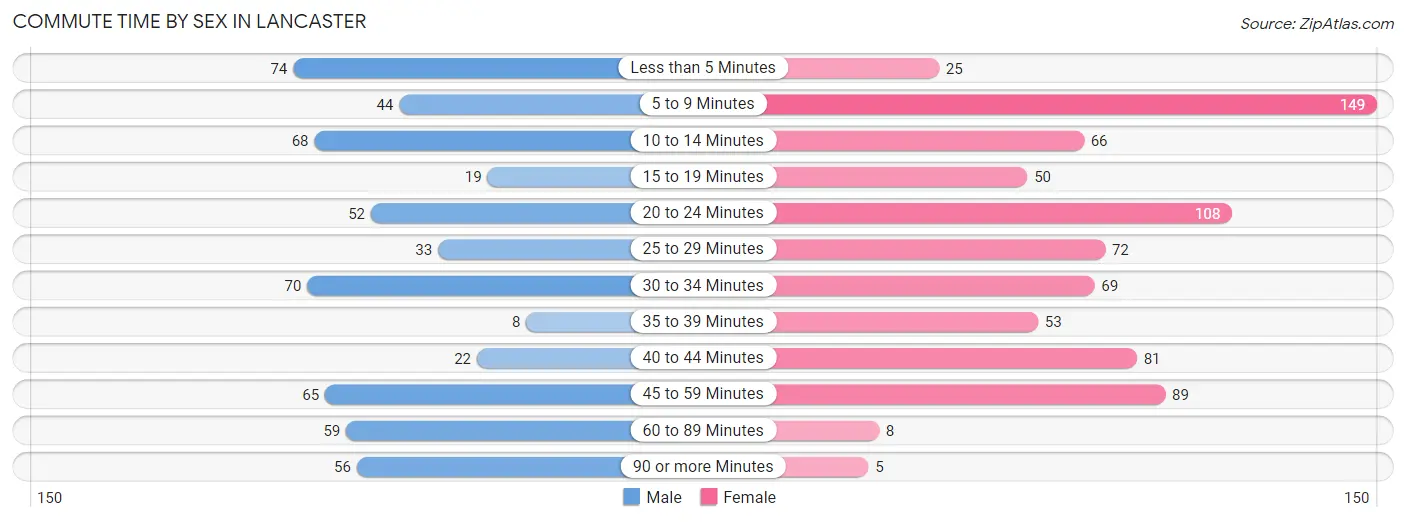
| Commute Time | Male | Female |
| Less than 5 Minutes | 74 (13.0%) | 25 (3.2%) |
| 5 to 9 Minutes | 44 (7.7%) | 149 (19.2%) |
| 10 to 14 Minutes | 68 (11.9%) | 66 (8.5%) |
| 15 to 19 Minutes | 19 (3.3%) | 50 (6.5%) |
| 20 to 24 Minutes | 52 (9.1%) | 108 (13.9%) |
| 25 to 29 Minutes | 33 (5.8%) | 72 (9.3%) |
| 30 to 34 Minutes | 70 (12.3%) | 69 (8.9%) |
| 35 to 39 Minutes | 8 (1.4%) | 53 (6.8%) |
| 40 to 44 Minutes | 22 (3.9%) | 81 (10.4%) |
| 45 to 59 Minutes | 65 (11.4%) | 89 (11.5%) |
| 60 to 89 Minutes | 59 (10.3%) | 8 (1.0%) |
| 90 or more Minutes | 56 (9.8%) | 5 (0.6%) |
Time of Departure to Work by Sex in Lancaster
The most frequent times of departure to work in Lancaster are 6:00 AM to 6:29 AM (90, 15.8%) for males and 7:00 AM to 7:29 AM (192, 24.8%) for females.
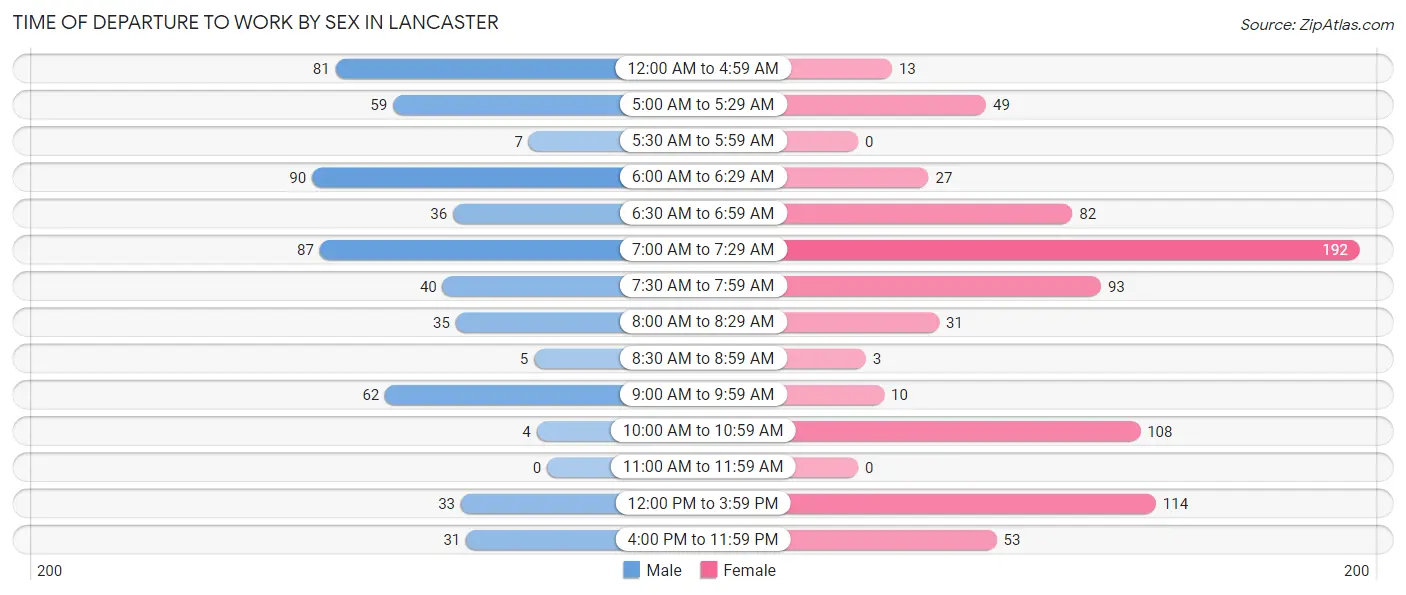
| Time of Departure | Male | Female |
| 12:00 AM to 4:59 AM | 81 (14.2%) | 13 (1.7%) |
| 5:00 AM to 5:29 AM | 59 (10.3%) | 49 (6.3%) |
| 5:30 AM to 5:59 AM | 7 (1.2%) | 0 (0.0%) |
| 6:00 AM to 6:29 AM | 90 (15.8%) | 27 (3.5%) |
| 6:30 AM to 6:59 AM | 36 (6.3%) | 82 (10.6%) |
| 7:00 AM to 7:29 AM | 87 (15.3%) | 192 (24.8%) |
| 7:30 AM to 7:59 AM | 40 (7.0%) | 93 (12.0%) |
| 8:00 AM to 8:29 AM | 35 (6.1%) | 31 (4.0%) |
| 8:30 AM to 8:59 AM | 5 (0.9%) | 3 (0.4%) |
| 9:00 AM to 9:59 AM | 62 (10.9%) | 10 (1.3%) |
| 10:00 AM to 10:59 AM | 4 (0.7%) | 108 (13.9%) |
| 11:00 AM to 11:59 AM | 0 (0.0%) | 0 (0.0%) |
| 12:00 PM to 3:59 PM | 33 (5.8%) | 114 (14.7%) |
| 4:00 PM to 11:59 PM | 31 (5.4%) | 53 (6.8%) |
| Total | 570 (100.0%) | 775 (100.0%) |
Housing Occupancy in Lancaster
Occupancy by Ownership in Lancaster
Of the total 1,438 dwellings in Lancaster, owner-occupied units account for 803 (55.8%), while renter-occupied units make up 635 (44.2%).
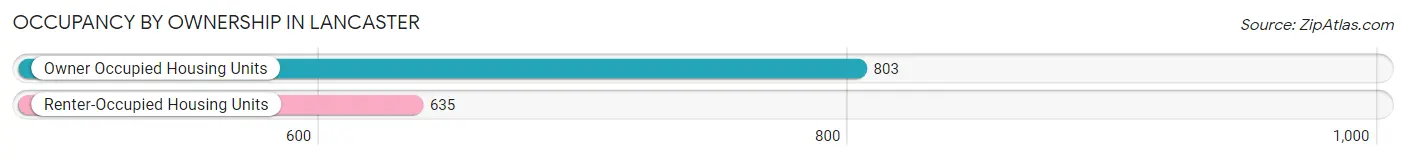
| Occupancy | # Housing Units | % Housing Units |
| Owner Occupied Housing Units | 803 | 55.8% |
| Renter-Occupied Housing Units | 635 | 44.2% |
| Total Occupied Housing Units | 1,438 | 100.0% |
Occupancy by Household Size in Lancaster
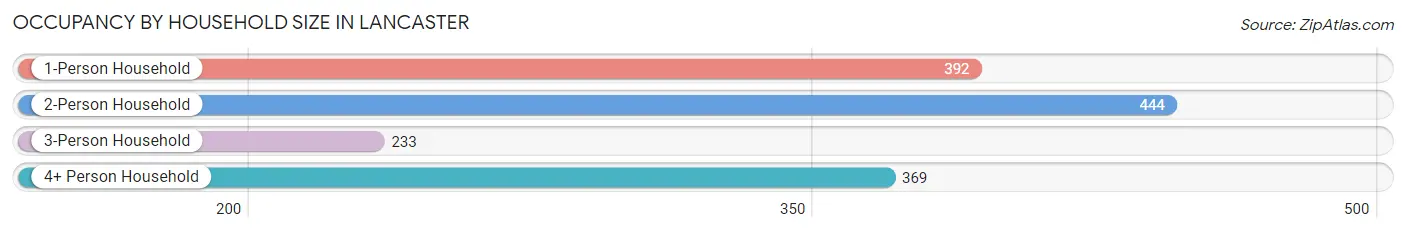
| Household Size | # Housing Units | % Housing Units |
| 1-Person Household | 392 | 27.3% |
| 2-Person Household | 444 | 30.9% |
| 3-Person Household | 233 | 16.2% |
| 4+ Person Household | 369 | 25.7% |
| Total Housing Units | 1,438 | 100.0% |
Occupancy by Ownership by Household Size in Lancaster
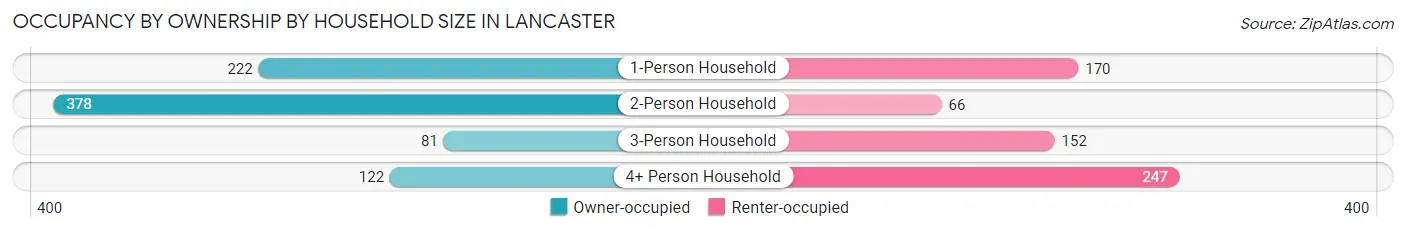
| Household Size | Owner-occupied | Renter-occupied |
| 1-Person Household | 222 (56.6%) | 170 (43.4%) |
| 2-Person Household | 378 (85.1%) | 66 (14.9%) |
| 3-Person Household | 81 (34.8%) | 152 (65.2%) |
| 4+ Person Household | 122 (33.1%) | 247 (66.9%) |
| Total Housing Units | 803 (55.8%) | 635 (44.2%) |
Occupancy by Educational Attainment in Lancaster
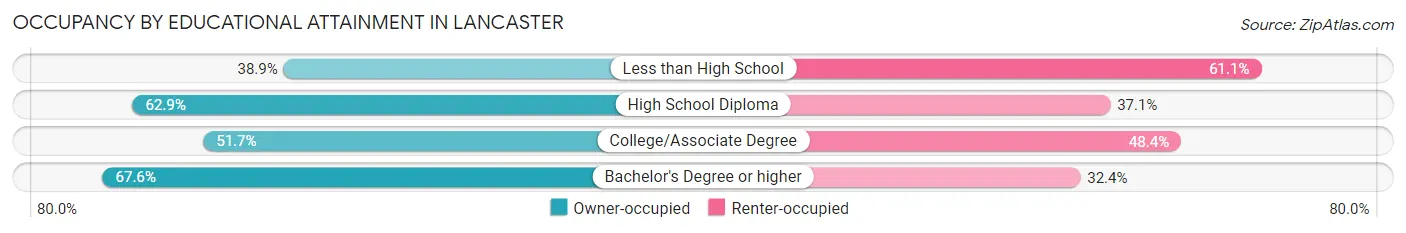
| Household Size | Owner-occupied | Renter-occupied |
| Less than High School | 109 (38.9%) | 171 (61.1%) |
| High School Diploma | 349 (62.9%) | 206 (37.1%) |
| College/Associate Degree | 203 (51.6%) | 190 (48.3%) |
| Bachelor's Degree or higher | 142 (67.6%) | 68 (32.4%) |
Occupancy by Age of Householder in Lancaster
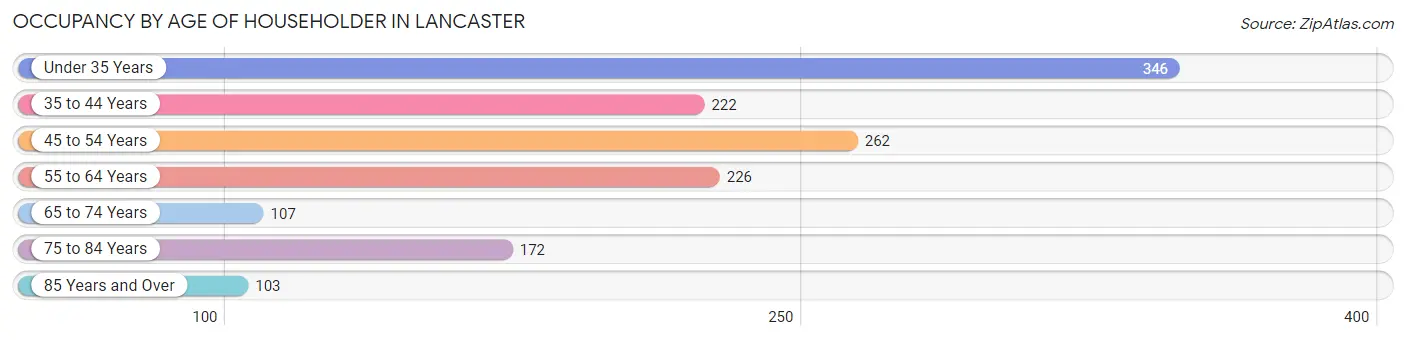
| Age Bracket | # Households | % Households |
| Under 35 Years | 346 | 24.1% |
| 35 to 44 Years | 222 | 15.4% |
| 45 to 54 Years | 262 | 18.2% |
| 55 to 64 Years | 226 | 15.7% |
| 65 to 74 Years | 107 | 7.4% |
| 75 to 84 Years | 172 | 12.0% |
| 85 Years and Over | 103 | 7.2% |
| Total | 1,438 | 100.0% |
Housing Finances in Lancaster
Median Income by Occupancy in Lancaster
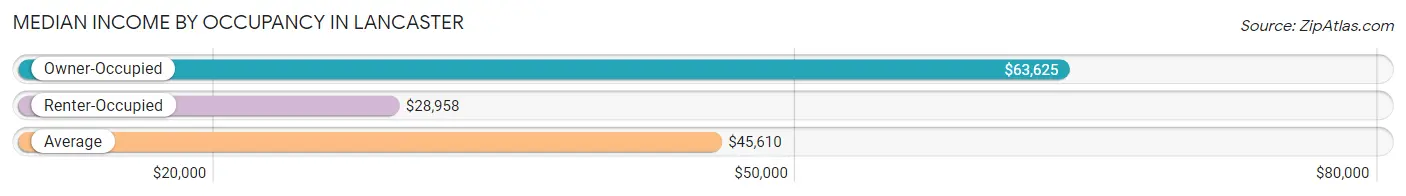
| Occupancy Type | # Households | Median Income |
| Owner-Occupied | 803 (55.8%) | $63,625 |
| Renter-Occupied | 635 (44.2%) | $28,958 |
| Average | 1,438 (100.0%) | $45,610 |
Occupancy by Householder Income Bracket in Lancaster
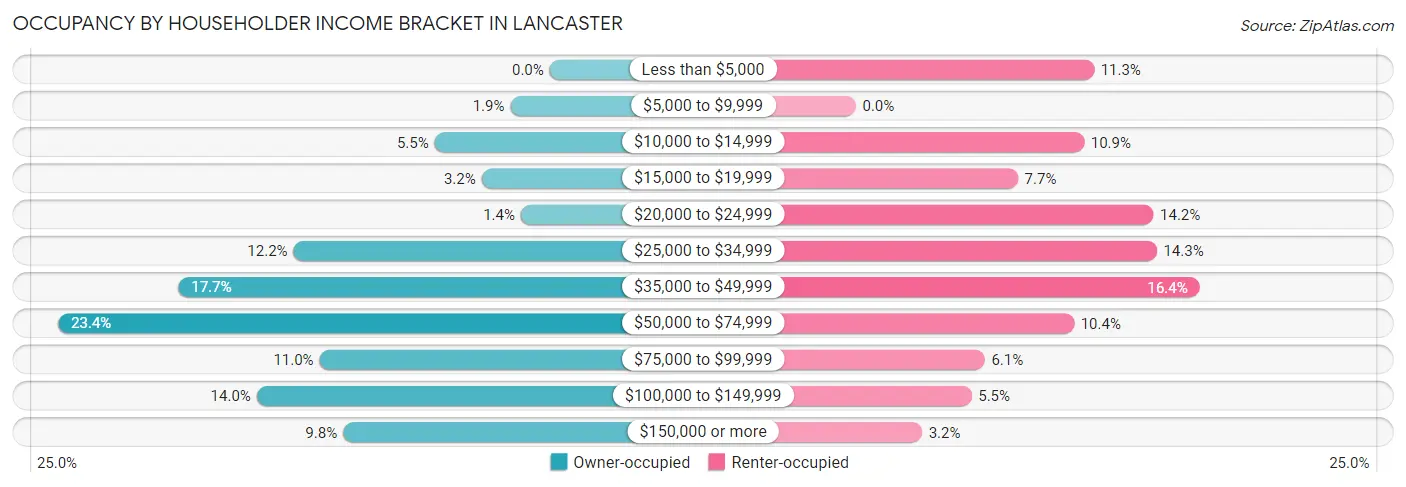
| Income Bracket | Owner-occupied | Renter-occupied |
| Less than $5,000 | 0 (0.0%) | 72 (11.3%) |
| $5,000 to $9,999 | 15 (1.9%) | 0 (0.0%) |
| $10,000 to $14,999 | 44 (5.5%) | 69 (10.9%) |
| $15,000 to $19,999 | 26 (3.2%) | 49 (7.7%) |
| $20,000 to $24,999 | 11 (1.4%) | 90 (14.2%) |
| $25,000 to $34,999 | 98 (12.2%) | 91 (14.3%) |
| $35,000 to $49,999 | 142 (17.7%) | 104 (16.4%) |
| $50,000 to $74,999 | 188 (23.4%) | 66 (10.4%) |
| $75,000 to $99,999 | 88 (11.0%) | 39 (6.1%) |
| $100,000 to $149,999 | 112 (14.0%) | 35 (5.5%) |
| $150,000 or more | 79 (9.8%) | 20 (3.2%) |
| Total | 803 (100.0%) | 635 (100.0%) |
Monthly Housing Cost Tiers in Lancaster
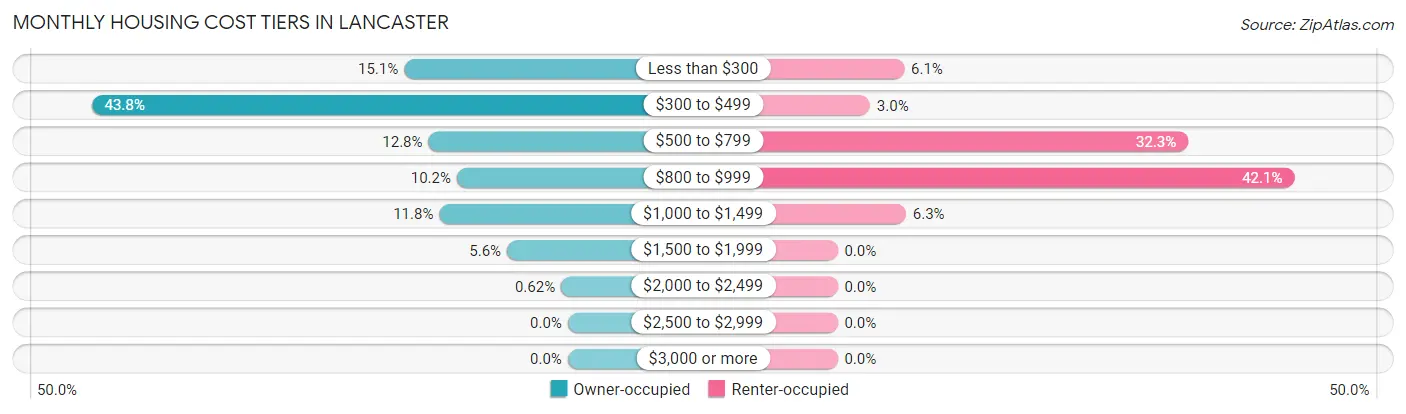
| Monthly Cost | Owner-occupied | Renter-occupied |
| Less than $300 | 121 (15.1%) | 39 (6.1%) |
| $300 to $499 | 352 (43.8%) | 19 (3.0%) |
| $500 to $799 | 103 (12.8%) | 205 (32.3%) |
| $800 to $999 | 82 (10.2%) | 267 (42.0%) |
| $1,000 to $1,499 | 95 (11.8%) | 40 (6.3%) |
| $1,500 to $1,999 | 45 (5.6%) | 0 (0.0%) |
| $2,000 to $2,499 | 5 (0.6%) | 0 (0.0%) |
| $2,500 to $2,999 | 0 (0.0%) | 0 (0.0%) |
| $3,000 or more | 0 (0.0%) | 0 (0.0%) |
| Total | 803 (100.0%) | 635 (100.0%) |
Physical Housing Characteristics in Lancaster
Housing Structures in Lancaster
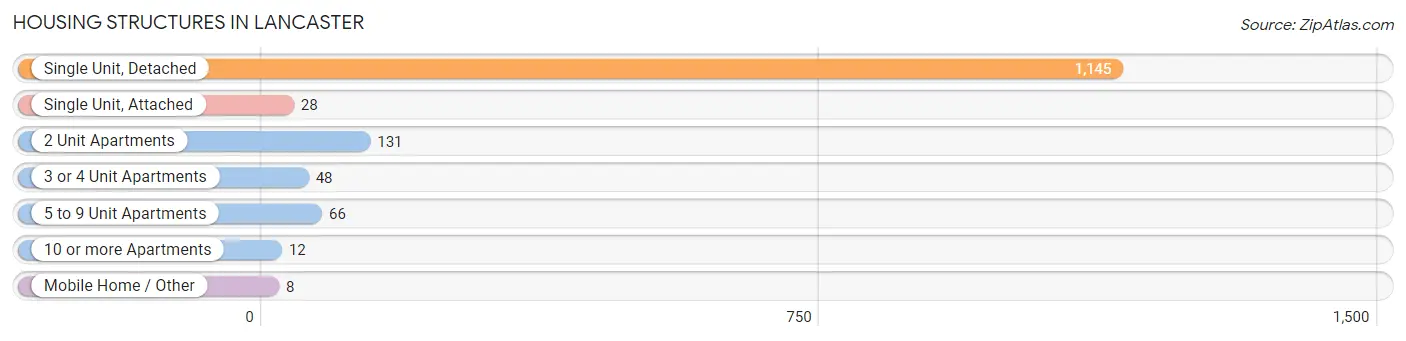
| Structure Type | # Housing Units | % Housing Units |
| Single Unit, Detached | 1,145 | 79.6% |
| Single Unit, Attached | 28 | 1.9% |
| 2 Unit Apartments | 131 | 9.1% |
| 3 or 4 Unit Apartments | 48 | 3.3% |
| 5 to 9 Unit Apartments | 66 | 4.6% |
| 10 or more Apartments | 12 | 0.8% |
| Mobile Home / Other | 8 | 0.6% |
| Total | 1,438 | 100.0% |
Housing Structures by Occupancy in Lancaster
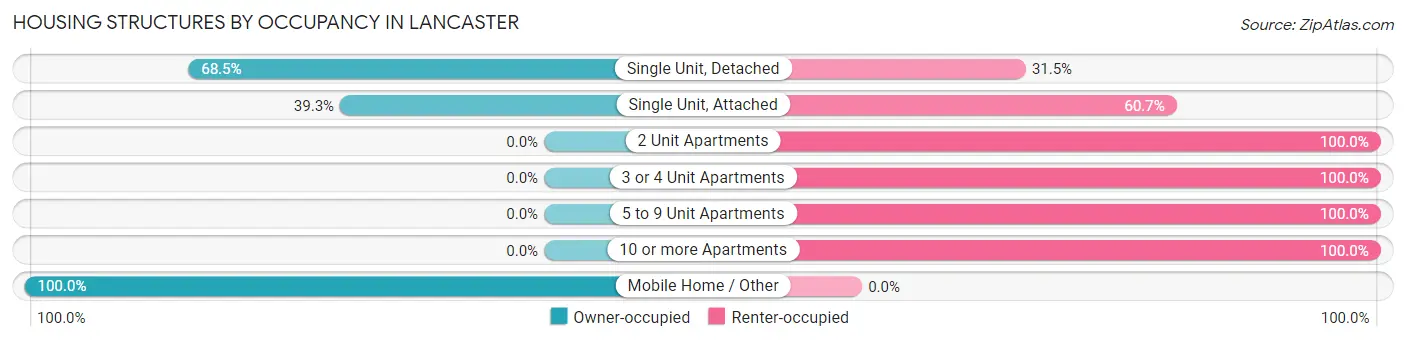
| Structure Type | Owner-occupied | Renter-occupied |
| Single Unit, Detached | 784 (68.5%) | 361 (31.5%) |
| Single Unit, Attached | 11 (39.3%) | 17 (60.7%) |
| 2 Unit Apartments | 0 (0.0%) | 131 (100.0%) |
| 3 or 4 Unit Apartments | 0 (0.0%) | 48 (100.0%) |
| 5 to 9 Unit Apartments | 0 (0.0%) | 66 (100.0%) |
| 10 or more Apartments | 0 (0.0%) | 12 (100.0%) |
| Mobile Home / Other | 8 (100.0%) | 0 (0.0%) |
| Total | 803 (55.8%) | 635 (44.2%) |
Housing Structures by Number of Rooms in Lancaster
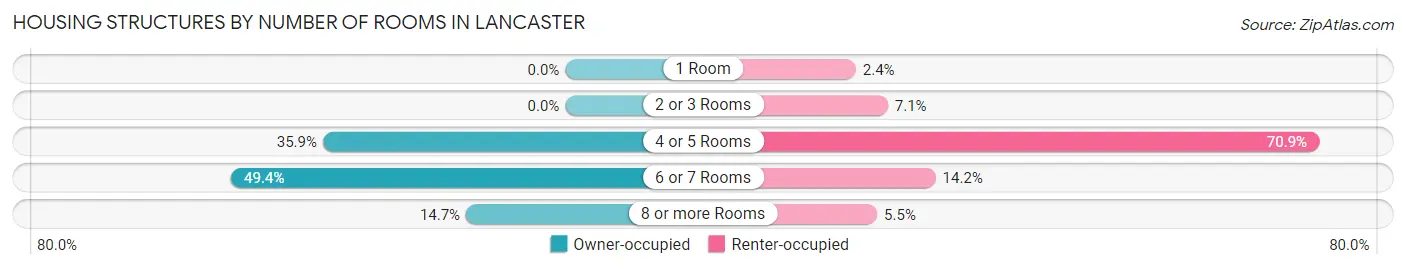
| Number of Rooms | Owner-occupied | Renter-occupied |
| 1 Room | 0 (0.0%) | 15 (2.4%) |
| 2 or 3 Rooms | 0 (0.0%) | 45 (7.1%) |
| 4 or 5 Rooms | 288 (35.9%) | 450 (70.9%) |
| 6 or 7 Rooms | 397 (49.4%) | 90 (14.2%) |
| 8 or more Rooms | 118 (14.7%) | 35 (5.5%) |
| Total | 803 (100.0%) | 635 (100.0%) |
Housing Structure by Heating Type in Lancaster
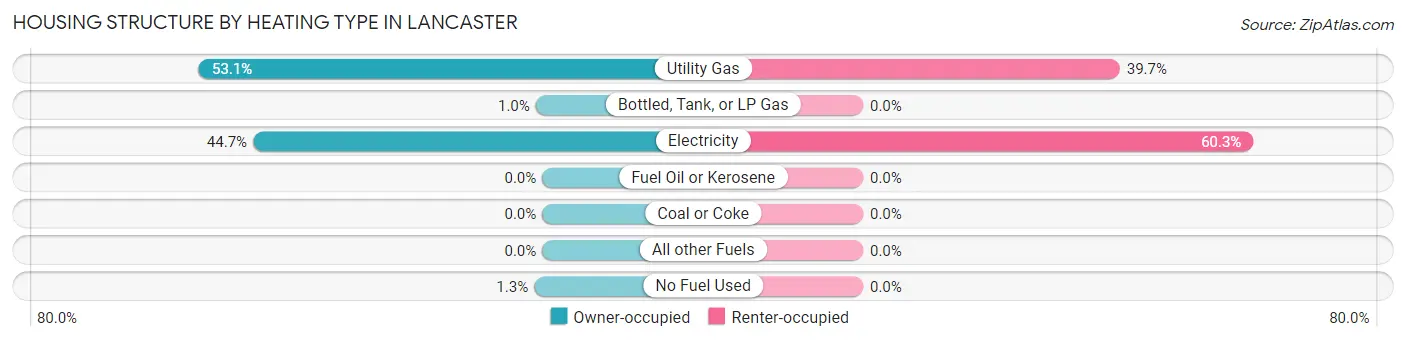
| Heating Type | Owner-occupied | Renter-occupied |
| Utility Gas | 426 (53.0%) | 252 (39.7%) |
| Bottled, Tank, or LP Gas | 8 (1.0%) | 0 (0.0%) |
| Electricity | 359 (44.7%) | 383 (60.3%) |
| Fuel Oil or Kerosene | 0 (0.0%) | 0 (0.0%) |
| Coal or Coke | 0 (0.0%) | 0 (0.0%) |
| All other Fuels | 0 (0.0%) | 0 (0.0%) |
| No Fuel Used | 10 (1.3%) | 0 (0.0%) |
| Total | 803 (100.0%) | 635 (100.0%) |
Household Vehicle Usage in Lancaster
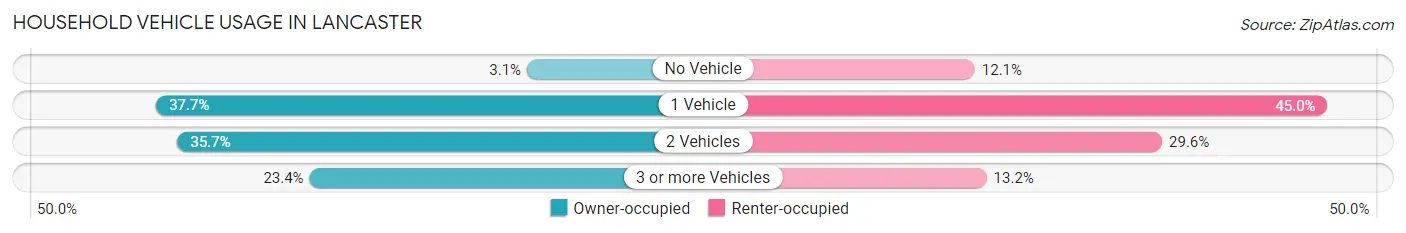
| Vehicles per Household | Owner-occupied | Renter-occupied |
| No Vehicle | 25 (3.1%) | 77 (12.1%) |
| 1 Vehicle | 303 (37.7%) | 286 (45.0%) |
| 2 Vehicles | 287 (35.7%) | 188 (29.6%) |
| 3 or more Vehicles | 188 (23.4%) | 84 (13.2%) |
| Total | 803 (100.0%) | 635 (100.0%) |
Real Estate & Mortgages in Lancaster
Real Estate and Mortgage Overview in Lancaster
| Characteristic | Without Mortgage | With Mortgage |
| Housing Units | 512 | 291 |
| Median Property Value | $98,900 | $127,200 |
| Median Household Income | $53,182 | $34 |
| Monthly Housing Costs | $414 | $0 |
| Real Estate Taxes | $1,201 | $0 |
Property Value by Mortgage Status in Lancaster
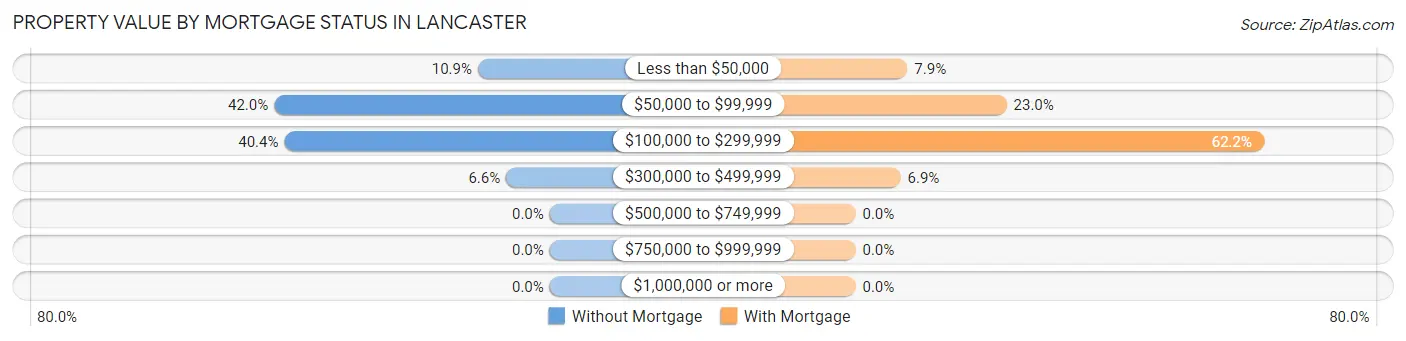
| Property Value | Without Mortgage | With Mortgage |
| Less than $50,000 | 56 (10.9%) | 23 (7.9%) |
| $50,000 to $99,999 | 215 (42.0%) | 67 (23.0%) |
| $100,000 to $299,999 | 207 (40.4%) | 181 (62.2%) |
| $300,000 to $499,999 | 34 (6.6%) | 20 (6.9%) |
| $500,000 to $749,999 | 0 (0.0%) | 0 (0.0%) |
| $750,000 to $999,999 | 0 (0.0%) | 0 (0.0%) |
| $1,000,000 or more | 0 (0.0%) | 0 (0.0%) |
| Total | 512 (100.0%) | 291 (100.0%) |
Household Income by Mortgage Status in Lancaster
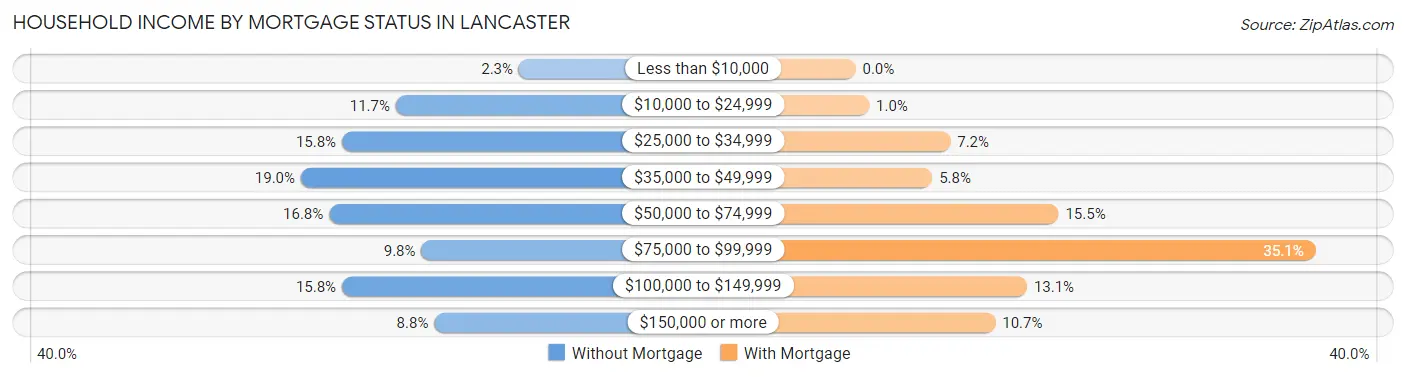
| Household Income | Without Mortgage | With Mortgage |
| Less than $10,000 | 12 (2.3%) | 0 (0.0%) |
| $10,000 to $24,999 | 60 (11.7%) | 3 (1.0%) |
| $25,000 to $34,999 | 81 (15.8%) | 21 (7.2%) |
| $35,000 to $49,999 | 97 (19.0%) | 17 (5.8%) |
| $50,000 to $74,999 | 86 (16.8%) | 45 (15.5%) |
| $75,000 to $99,999 | 50 (9.8%) | 102 (35.0%) |
| $100,000 to $149,999 | 81 (15.8%) | 38 (13.1%) |
| $150,000 or more | 45 (8.8%) | 31 (10.6%) |
| Total | 512 (100.0%) | 291 (100.0%) |
Property Value to Household Income Ratio in Lancaster
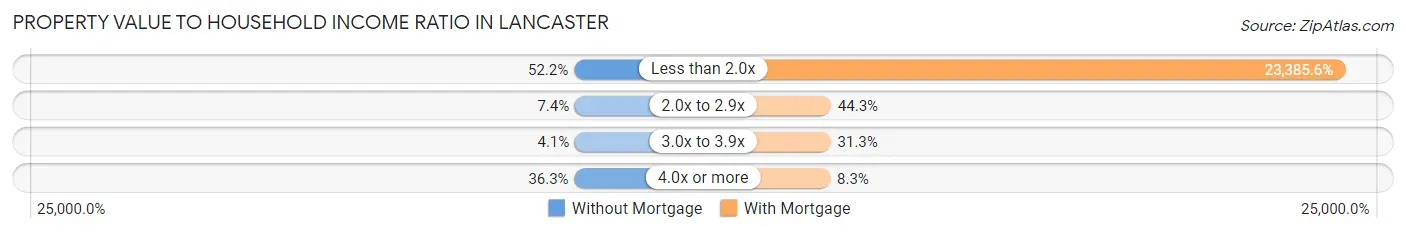
| Value-to-Income Ratio | Without Mortgage | With Mortgage |
| Less than 2.0x | 267 (52.1%) | 68,052 (23,385.6%) |
| 2.0x to 2.9x | 38 (7.4%) | 129 (44.3%) |
| 3.0x to 3.9x | 21 (4.1%) | 91 (31.3%) |
| 4.0x or more | 186 (36.3%) | 24 (8.3%) |
| Total | 512 (100.0%) | 291 (100.0%) |
Real Estate Taxes by Mortgage Status in Lancaster
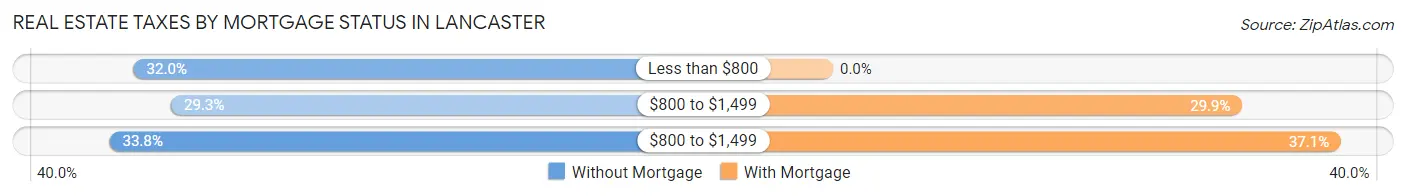
| Property Taxes | Without Mortgage | With Mortgage |
| Less than $800 | 164 (32.0%) | 0 (0.0%) |
| $800 to $1,499 | 150 (29.3%) | 87 (29.9%) |
| $800 to $1,499 | 173 (33.8%) | 108 (37.1%) |
| Total | 512 (100.0%) | 291 (100.0%) |
Health & Disability in Lancaster
Health Insurance Coverage by Age in Lancaster
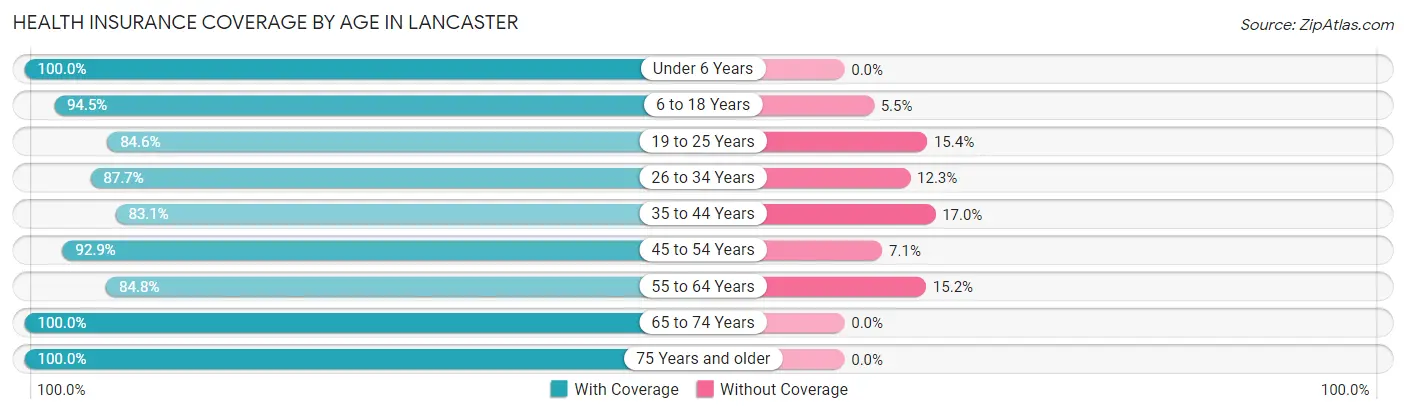
| Age Bracket | With Coverage | Without Coverage |
| Under 6 Years | 268 (100.0%) | 0 (0.0%) |
| 6 to 18 Years | 759 (94.5%) | 44 (5.5%) |
| 19 to 25 Years | 329 (84.6%) | 60 (15.4%) |
| 26 to 34 Years | 515 (87.7%) | 72 (12.3%) |
| 35 to 44 Years | 348 (83.1%) | 71 (17.0%) |
| 45 to 54 Years | 461 (92.9%) | 35 (7.1%) |
| 55 to 64 Years | 284 (84.8%) | 51 (15.2%) |
| 65 to 74 Years | 166 (100.0%) | 0 (0.0%) |
| 75 Years and older | 380 (100.0%) | 0 (0.0%) |
| Total | 3,510 (91.3%) | 333 (8.7%) |
Health Insurance Coverage by Citizenship Status in Lancaster
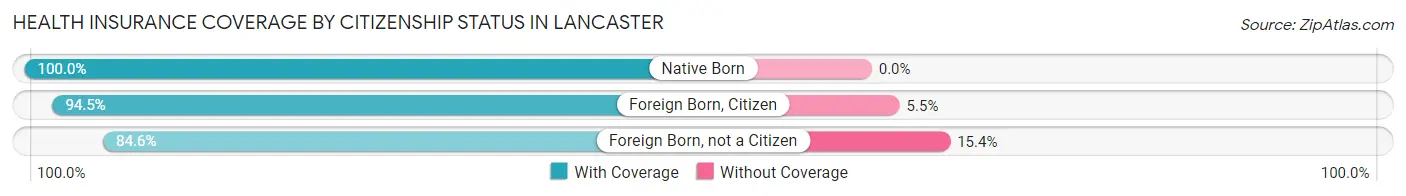
| Citizenship Status | With Coverage | Without Coverage |
| Native Born | 268 (100.0%) | 0 (0.0%) |
| Foreign Born, Citizen | 759 (94.5%) | 44 (5.5%) |
| Foreign Born, not a Citizen | 329 (84.6%) | 60 (15.4%) |
Health Insurance Coverage by Household Income in Lancaster
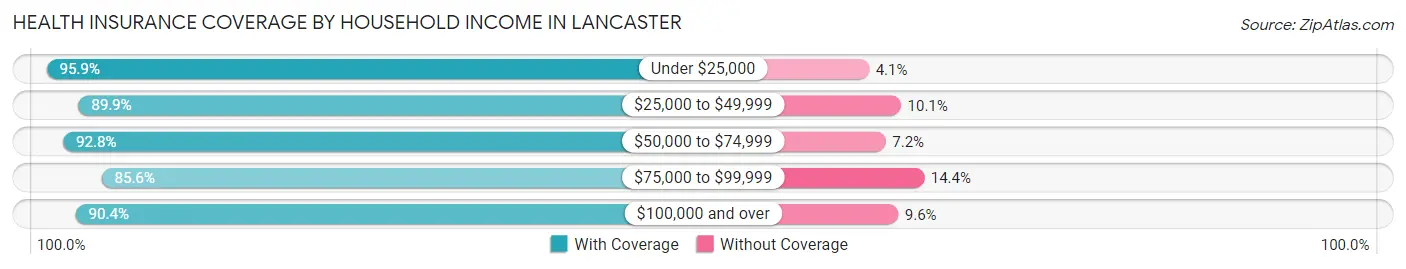
| Household Income | With Coverage | Without Coverage |
| Under $25,000 | 747 (95.9%) | 32 (4.1%) |
| $25,000 to $49,999 | 1,070 (89.9%) | 120 (10.1%) |
| $50,000 to $74,999 | 719 (92.8%) | 56 (7.2%) |
| $75,000 to $99,999 | 350 (85.6%) | 59 (14.4%) |
| $100,000 and over | 624 (90.4%) | 66 (9.6%) |
Public vs Private Health Insurance Coverage by Age in Lancaster
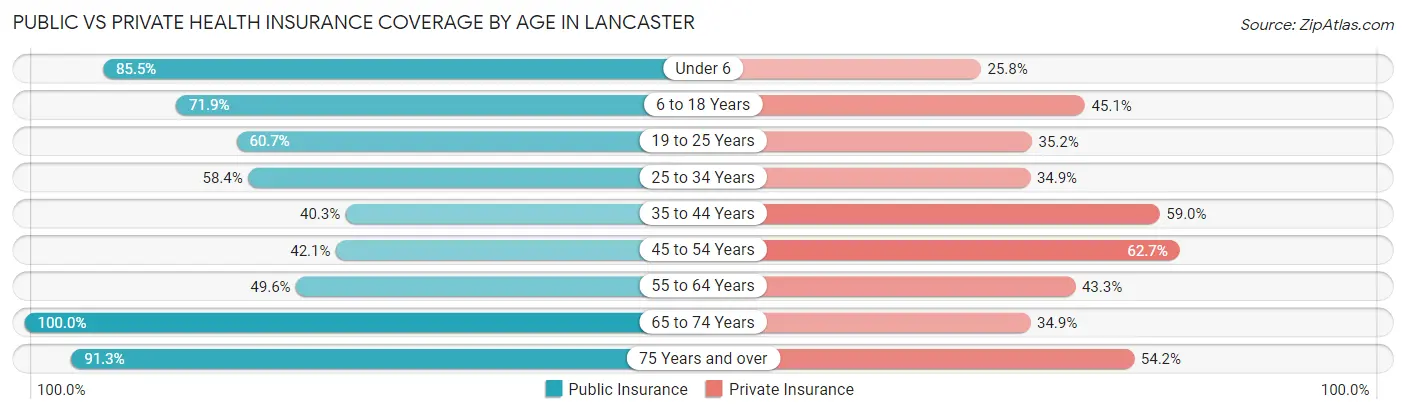
| Age Bracket | Public Insurance | Private Insurance |
| Under 6 | 229 (85.5%) | 69 (25.8%) |
| 6 to 18 Years | 577 (71.9%) | 362 (45.1%) |
| 19 to 25 Years | 236 (60.7%) | 137 (35.2%) |
| 25 to 34 Years | 343 (58.4%) | 205 (34.9%) |
| 35 to 44 Years | 169 (40.3%) | 247 (59.0%) |
| 45 to 54 Years | 209 (42.1%) | 311 (62.7%) |
| 55 to 64 Years | 166 (49.5%) | 145 (43.3%) |
| 65 to 74 Years | 166 (100.0%) | 58 (34.9%) |
| 75 Years and over | 347 (91.3%) | 206 (54.2%) |
| Total | 2,442 (63.5%) | 1,740 (45.3%) |
Disability Status by Sex by Age in Lancaster
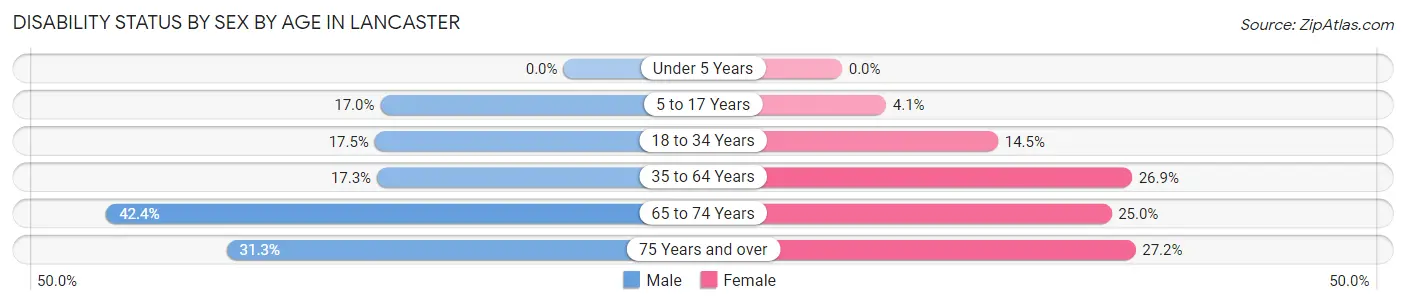
| Age Bracket | Male | Female |
| Under 5 Years | 0 (0.0%) | 0 (0.0%) |
| 5 to 17 Years | 52 (17.0%) | 19 (4.1%) |
| 18 to 34 Years | 87 (17.5%) | 84 (14.5%) |
| 35 to 64 Years | 96 (17.3%) | 187 (26.9%) |
| 65 to 74 Years | 28 (42.4%) | 25 (25.0%) |
| 75 Years and over | 35 (31.2%) | 73 (27.2%) |
Disability Class by Sex by Age in Lancaster
Disability Class: Hearing Difficulty
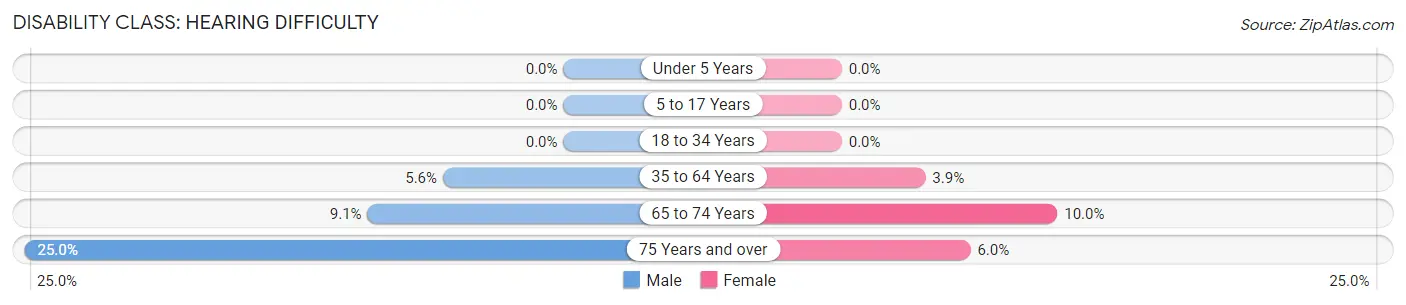
| Age Bracket | Male | Female |
| Under 5 Years | 0 (0.0%) | 0 (0.0%) |
| 5 to 17 Years | 0 (0.0%) | 0 (0.0%) |
| 18 to 34 Years | 0 (0.0%) | 0 (0.0%) |
| 35 to 64 Years | 31 (5.6%) | 27 (3.9%) |
| 65 to 74 Years | 6 (9.1%) | 10 (10.0%) |
| 75 Years and over | 28 (25.0%) | 16 (6.0%) |
Disability Class: Vision Difficulty
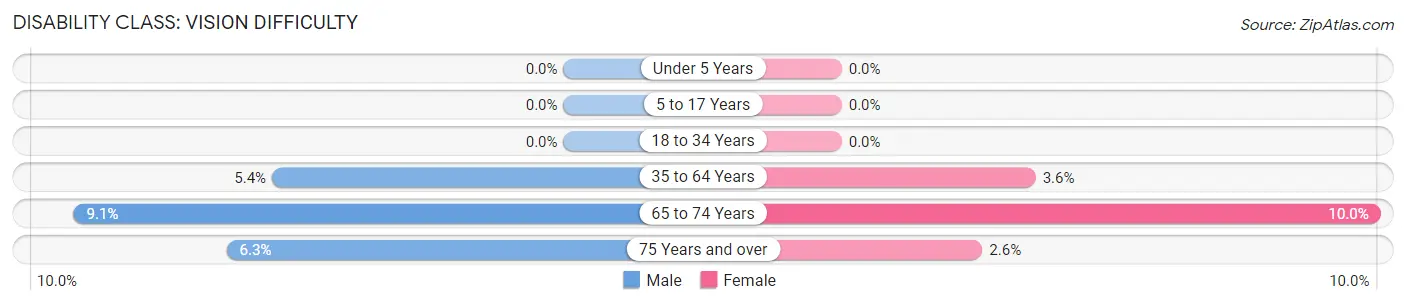
| Age Bracket | Male | Female |
| Under 5 Years | 0 (0.0%) | 0 (0.0%) |
| 5 to 17 Years | 0 (0.0%) | 0 (0.0%) |
| 18 to 34 Years | 0 (0.0%) | 0 (0.0%) |
| 35 to 64 Years | 30 (5.4%) | 25 (3.6%) |
| 65 to 74 Years | 6 (9.1%) | 10 (10.0%) |
| 75 Years and over | 7 (6.2%) | 7 (2.6%) |
Disability Class: Cognitive Difficulty
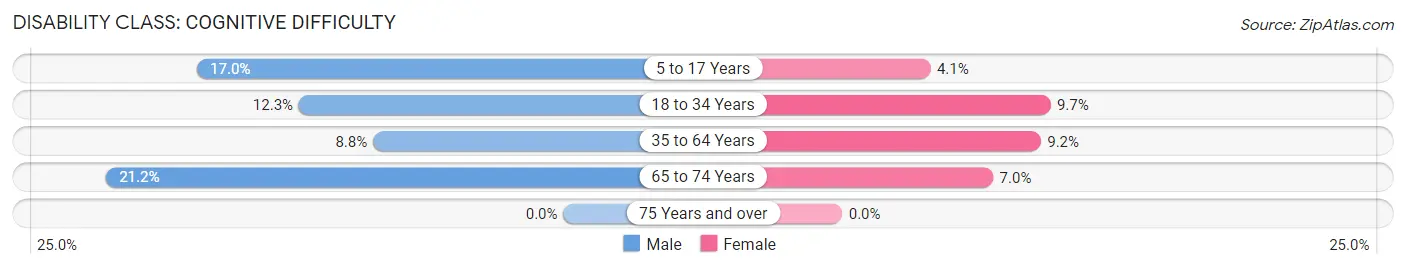
| Age Bracket | Male | Female |
| 5 to 17 Years | 52 (17.0%) | 19 (4.1%) |
| 18 to 34 Years | 61 (12.3%) | 56 (9.7%) |
| 35 to 64 Years | 49 (8.8%) | 64 (9.2%) |
| 65 to 74 Years | 14 (21.2%) | 7 (7.0%) |
| 75 Years and over | 0 (0.0%) | 0 (0.0%) |
Disability Class: Ambulatory Difficulty
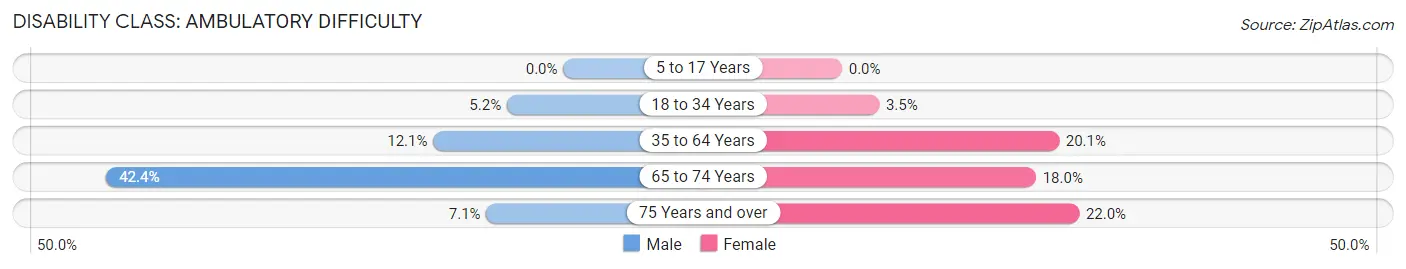
| Age Bracket | Male | Female |
| 5 to 17 Years | 0 (0.0%) | 0 (0.0%) |
| 18 to 34 Years | 26 (5.2%) | 20 (3.5%) |
| 35 to 64 Years | 67 (12.1%) | 140 (20.1%) |
| 65 to 74 Years | 28 (42.4%) | 18 (18.0%) |
| 75 Years and over | 8 (7.1%) | 59 (22.0%) |
Disability Class: Self-Care Difficulty
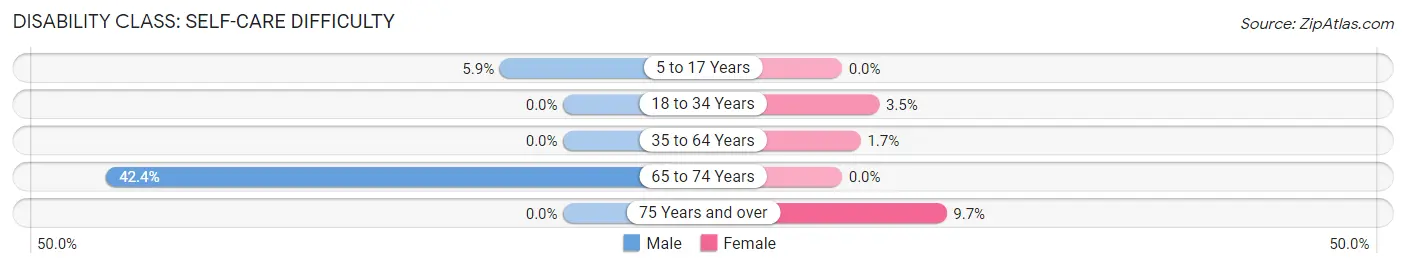
| Age Bracket | Male | Female |
| 5 to 17 Years | 18 (5.9%) | 0 (0.0%) |
| 18 to 34 Years | 0 (0.0%) | 20 (3.5%) |
| 35 to 64 Years | 0 (0.0%) | 12 (1.7%) |
| 65 to 74 Years | 28 (42.4%) | 0 (0.0%) |
| 75 Years and over | 0 (0.0%) | 26 (9.7%) |
Technology Access in Lancaster
Computing Device Access in Lancaster
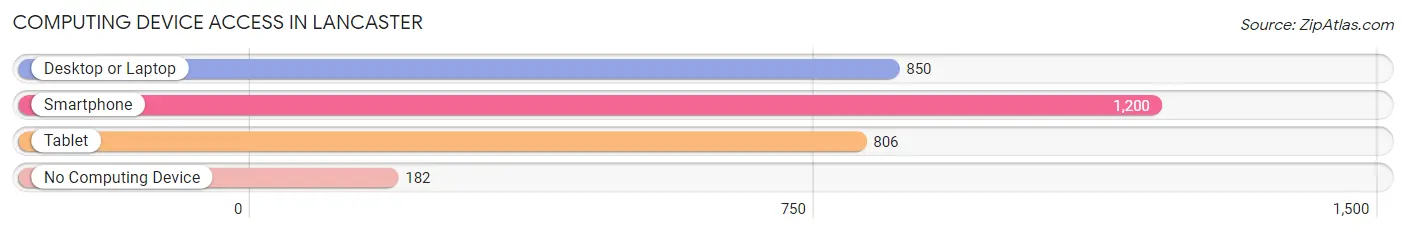
| Device Type | # Households | % Households |
| Desktop or Laptop | 850 | 59.1% |
| Smartphone | 1,200 | 83.5% |
| Tablet | 806 | 56.0% |
| No Computing Device | 182 | 12.7% |
| Total | 1,438 | 100.0% |
Internet Access in Lancaster
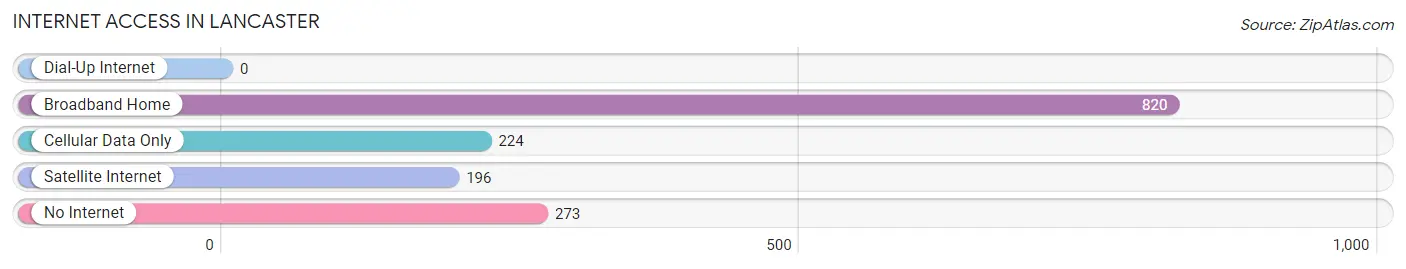
| Internet Type | # Households | % Households |
| Dial-Up Internet | 0 | 0.0% |
| Broadband Home | 820 | 57.0% |
| Cellular Data Only | 224 | 15.6% |
| Satellite Internet | 196 | 13.6% |
| No Internet | 273 | 19.0% |
| Total | 1,438 | 100.0% |
Lancaster Summary
Lancaster, Kentucky is a small city located in Garrard County, Kentucky. It is situated in the heart of the Bluegrass Region, and is the county seat of Garrard County. The city is located approximately 25 miles south of Lexington, and is part of the Lexington-Fayette Metropolitan Statistical Area. The population of Lancaster was 4,093 as of the 2010 census.
History
Lancaster was founded in 1797 by William and John Lancaster, two brothers from Virginia. The city was named after their father, John Lancaster, who had served in the Revolutionary War. The city was incorporated in 1817, and was the first city in Garrard County.
In the early 19th century, Lancaster was a thriving agricultural center, and was known for its tobacco production. The city was also home to several distilleries, and was a major producer of whiskey. In the late 19th century, the city began to experience a decline in its economy, as the tobacco industry began to decline.
In the early 20th century, Lancaster began to experience a resurgence in its economy, as the city began to attract new businesses and industries. The city was home to several manufacturing plants, including a furniture factory, a shoe factory, and a canning factory. The city also became a major center for the production of tobacco products.
Geography
Lancaster is located in central Garrard County, in the heart of the Bluegrass Region. The city is situated at the intersection of US Highway 27 and Kentucky Route 39. The city is located approximately 25 miles south of Lexington, and is part of the Lexington-Fayette Metropolitan Statistical Area.
The city is situated on a rolling terrain, with an elevation of 845 feet above sea level. The city is located in the Eastern Coal Field region of Kentucky, and is surrounded by rolling hills and farmland. The city is located near the Kentucky River, and is home to several small lakes and ponds.
Economy
Lancaster is a small city, and its economy is largely based on agriculture and manufacturing. The city is home to several manufacturing plants, including a furniture factory, a shoe factory, and a canning factory. The city is also home to several small businesses, including restaurants, retail stores, and service providers.
The city is also home to several agricultural operations, including dairy farms, beef farms, and tobacco farms. The city is also home to several wineries, and is a major producer of wine.
Demographics
As of the 2010 census, the population of Lancaster was 4,093. The racial makeup of the city was 95.3% White, 2.2% African American, 0.3% Native American, 0.4% Asian, 0.1% Pacific Islander, 0.7% from other races, and 0.9% from two or more races. Hispanic or Latino of any race were 1.7% of the population.
The median income for a household in the city was $35,938, and the median income for a family was $41,944. The per capita income for the city was $17,945. About 15.2% of families and 17.7% of the population were below the poverty line, including 25.2% of those under age 18 and 11.2% of those age 65 or over.
Common Questions
What is Per Capita Income in Lancaster?
Per Capita income in Lancaster is $25,076.
What is the Median Family Income in Lancaster?
Median Family Income in Lancaster is $51,531.
What is the Median Household income in Lancaster?
Median Household Income in Lancaster is $45,610.
What is Income or Wage Gap in Lancaster?
Income or Wage Gap in Lancaster is 46.3%.
Women in Lancaster earn 53.7 cents for every dollar earned by a man.
What is Family Income Deficit in Lancaster?
Family Income Deficit in Lancaster is $15,539.
Families that are below poverty line in Lancaster earn $15,539 less on average than the poverty threshold level.
What is Inequality or Gini Index in Lancaster?
Inequality or Gini Index in Lancaster is 0.52.
What is the Total Population of Lancaster?
Total Population of Lancaster is 3,943.
What is the Total Male Population of Lancaster?
Total Male Population of Lancaster is 1,700.
What is the Total Female Population of Lancaster?
Total Female Population of Lancaster is 2,243.
What is the Ratio of Males per 100 Females in Lancaster?
There are 75.79 Males per 100 Females in Lancaster.
What is the Ratio of Females per 100 Males in Lancaster?
There are 131.94 Females per 100 Males in Lancaster.
What is the Median Population Age in Lancaster?
Median Population Age in Lancaster is 33.4 Years.
What is the Average Family Size in Lancaster
Average Family Size in Lancaster is 3.2 People.
What is the Average Household Size in Lancaster
Average Household Size in Lancaster is 2.7 People.
How Large is the Labor Force in Lancaster?
There are 1,660 People in the Labor Forcein in Lancaster.
What is the Percentage of People in the Labor Force in Lancaster?
54.0% of People are in the Labor Force in Lancaster.
What is the Unemployment Rate in Lancaster?
Unemployment Rate in Lancaster is 10.9%.