Prospect, KY Map & Demographics
Prospect Map
Prospect Overview
$97,617
PER CAPITA INCOME
$199,811
AVG FAMILY INCOME
$173,528
AVG HOUSEHOLD INCOME
54.8%
WAGE / INCOME GAP [ % ]
45.2¢/ $1
WAGE / INCOME GAP [ $ ]
0.46
INEQUALITY / GINI INDEX
4,624
TOTAL POPULATION
2,215
MALE POPULATION
2,409
FEMALE POPULATION
91.95
MALES / 100 FEMALES
108.76
FEMALES / 100 MALES
56.2
MEDIAN AGE
2.7
AVG FAMILY SIZE
2.3
AVG HOUSEHOLD SIZE
2,267
LABOR FORCE [ PEOPLE ]
57.1%
PERCENT IN LABOR FORCE
4.7%
UNEMPLOYMENT RATE
Prospect Zip Codes
Income in Prospect
Income Overview in Prospect
Per Capita Income in Prospect is $97,617, while median incomes of families and households are $199,811 and $173,528 respectively.
| Characteristic | Number | Measure |
| Per Capita Income | 4,624 | $97,617 |
| Median Family Income | 1,497 | $199,811 |
| Mean Family Income | 1,497 | $275,974 |
| Median Household Income | 1,975 | $173,528 |
| Mean Household Income | 1,975 | $228,801 |
| Income Deficit | 1,497 | $0 |
| Wage / Income Gap (%) | 4,624 | 54.81% |
| Wage / Income Gap ($) | 4,624 | 45.19¢ per $1 |
| Gini / Inequality Index | 4,624 | 0.46 |
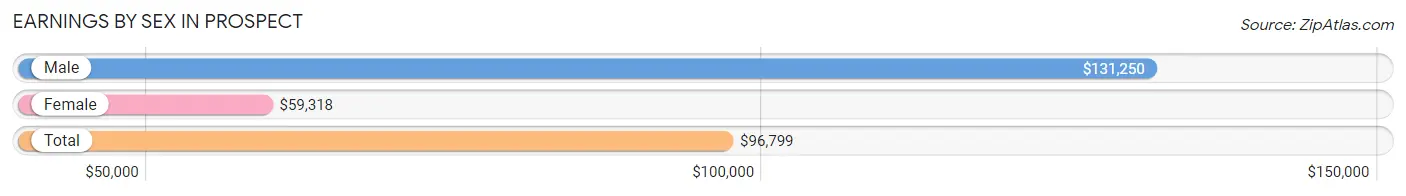
Earnings by Sex in Prospect
Average Earnings in Prospect are $96,799, $131,250 for men and $59,318 for women, a difference of 54.8%.
| Sex | Number | Average Earnings |
| Male | 1,355 (57.0%) | $131,250 |
| Female | 1,022 (43.0%) | $59,318 |
| Total | 2,377 (100.0%) | $96,799 |
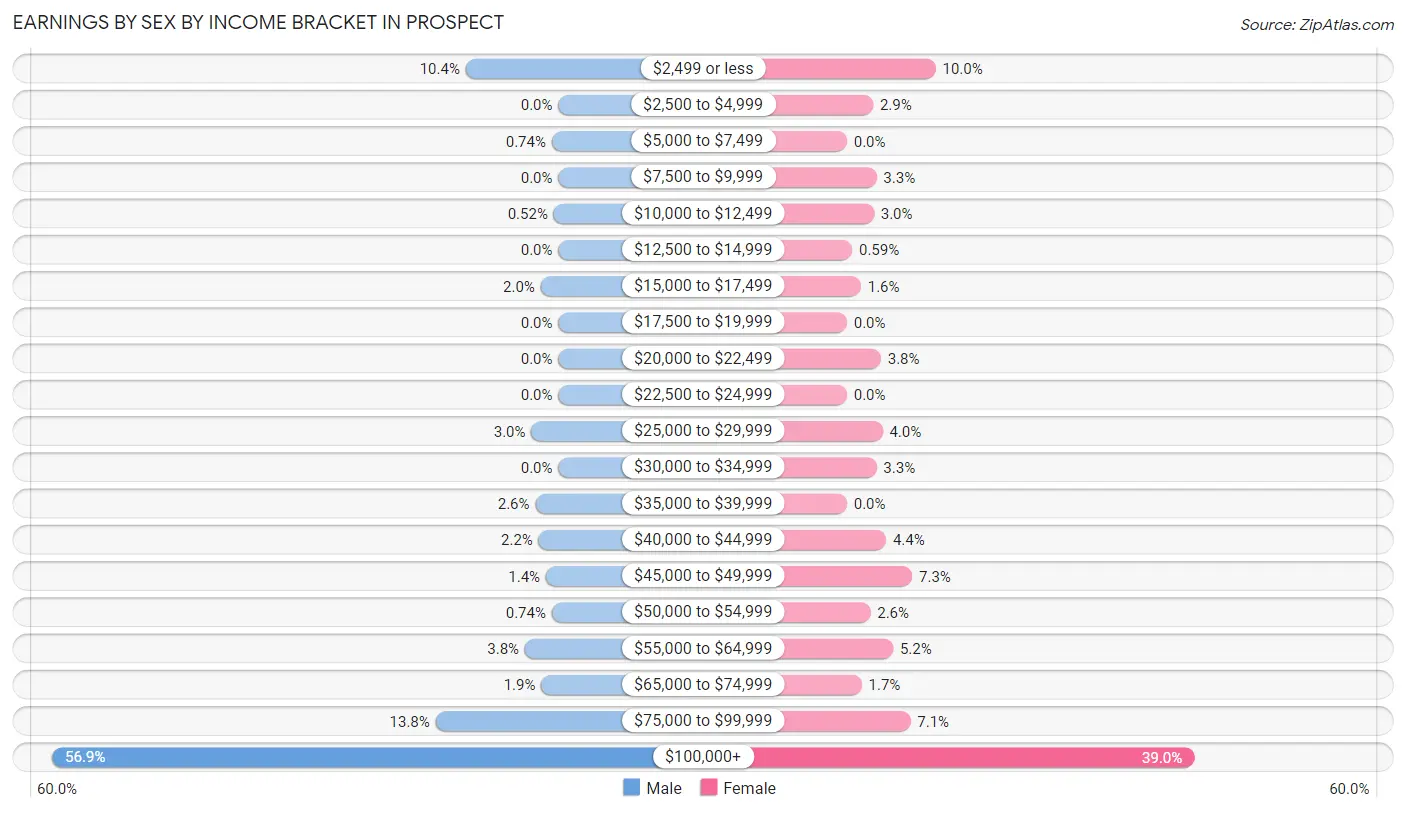
Earnings by Sex by Income Bracket in Prospect
The most common earnings brackets in Prospect are $100,000+ for men (771 | 56.9%) and $100,000+ for women (399 | 39.0%).
| Income | Male | Female |
| $2,499 or less | 141 (10.4%) | 102 (10.0%) |
| $2,500 to $4,999 | 0 (0.0%) | 30 (2.9%) |
| $5,000 to $7,499 | 10 (0.7%) | 0 (0.0%) |
| $7,500 to $9,999 | 0 (0.0%) | 34 (3.3%) |
| $10,000 to $12,499 | 7 (0.5%) | 31 (3.0%) |
| $12,500 to $14,999 | 0 (0.0%) | 6 (0.6%) |
| $15,000 to $17,499 | 27 (2.0%) | 16 (1.6%) |
| $17,500 to $19,999 | 0 (0.0%) | 0 (0.0%) |
| $20,000 to $22,499 | 0 (0.0%) | 39 (3.8%) |
| $22,500 to $24,999 | 0 (0.0%) | 0 (0.0%) |
| $25,000 to $29,999 | 41 (3.0%) | 41 (4.0%) |
| $30,000 to $34,999 | 0 (0.0%) | 34 (3.3%) |
| $35,000 to $39,999 | 35 (2.6%) | 0 (0.0%) |
| $40,000 to $44,999 | 30 (2.2%) | 45 (4.4%) |
| $45,000 to $49,999 | 19 (1.4%) | 75 (7.3%) |
| $50,000 to $54,999 | 10 (0.7%) | 27 (2.6%) |
| $55,000 to $64,999 | 51 (3.8%) | 53 (5.2%) |
| $65,000 to $74,999 | 26 (1.9%) | 17 (1.7%) |
| $75,000 to $99,999 | 187 (13.8%) | 73 (7.1%) |
| $100,000+ | 771 (56.9%) | 399 (39.0%) |
| Total | 1,355 (100.0%) | 1,022 (100.0%) |
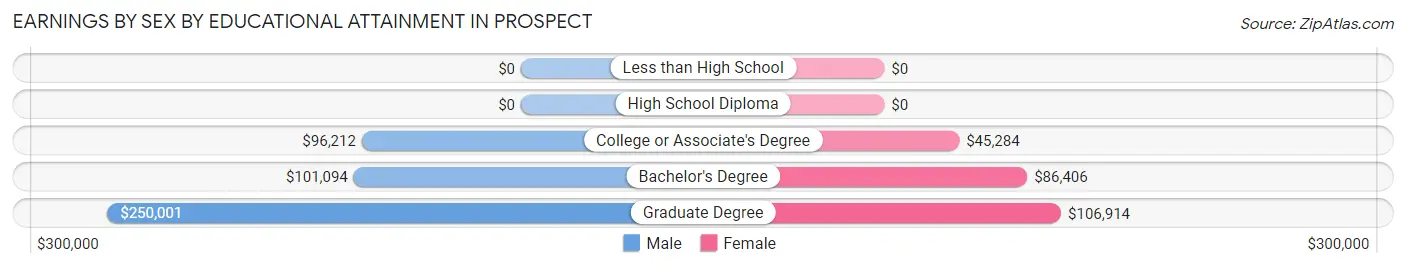
Earnings by Sex by Educational Attainment in Prospect
Average earnings in Prospect are $142,800 for men and $70,147 for women, a difference of 50.9%. Men with an educational attainment of graduate degree enjoy the highest average annual earnings of $250,001, while those with college or associate's degree education earn the least with $96,212. Women with an educational attainment of graduate degree earn the most with the average annual earnings of $106,914, while those with college or associate's degree education have the smallest earnings of $45,284.
| Educational Attainment | Male Income | Female Income |
| Less than High School | - | - |
| High School Diploma | - | - |
| College or Associate's Degree | $96,212 | $45,284 |
| Bachelor's Degree | $101,094 | $86,406 |
| Graduate Degree | $250,001 | $106,914 |
| Total | $142,800 | $70,147 |
Family Income in Prospect
Family Income Brackets in Prospect
According to the Prospect family income data, there are 746 families falling into the $200,000+ income range, which is the most common income bracket and makes up 49.8% of all families.
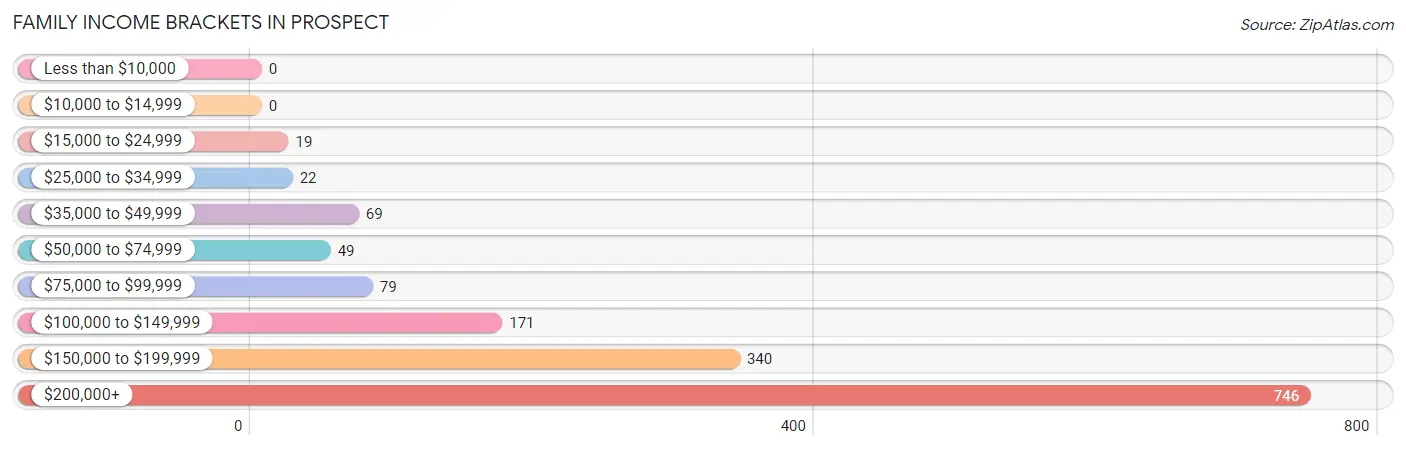
| Income Bracket | # Families | % Families |
| Less than $10,000 | 0 | 0.0% |
| $10,000 to $14,999 | 0 | 0.0% |
| $15,000 to $24,999 | 19 | 1.3% |
| $25,000 to $34,999 | 22 | 1.5% |
| $35,000 to $49,999 | 69 | 4.6% |
| $50,000 to $74,999 | 49 | 3.3% |
| $75,000 to $99,999 | 79 | 5.3% |
| $100,000 to $149,999 | 171 | 11.4% |
| $150,000 to $199,999 | 340 | 22.7% |
| $200,000+ | 746 | 49.8% |
Family Income by Famaliy Size in Prospect
3-person families (268 | 17.9%) account for the highest median family income in Prospect with $250,001 per family, while 2-person families (905 | 60.5%) have the highest median income of $87,344 per family member.
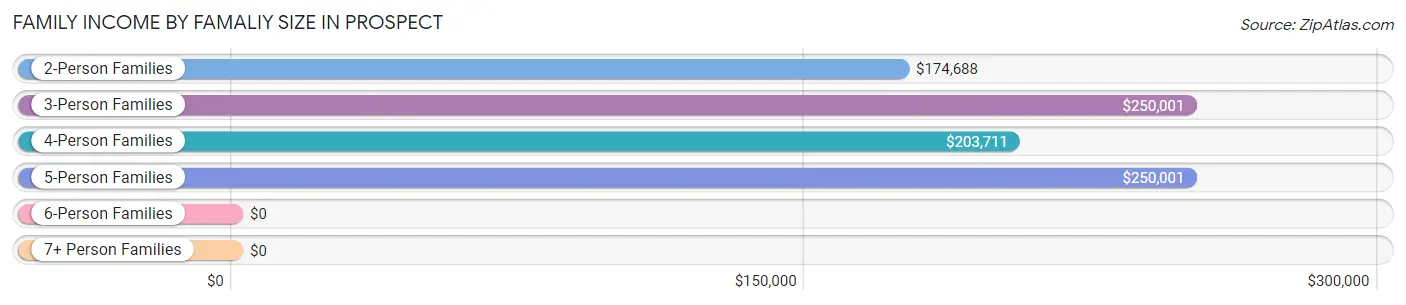
| Income Bracket | # Families | Median Income |
| 2-Person Families | 905 (60.5%) | $174,688 |
| 3-Person Families | 268 (17.9%) | $250,001 |
| 4-Person Families | 199 (13.3%) | $203,711 |
| 5-Person Families | 125 (8.4%) | $250,001 |
| 6-Person Families | 0 (0.0%) | $0 |
| 7+ Person Families | 0 (0.0%) | $0 |
| Total | 1,497 (100.0%) | $199,811 |
Family Income by Number of Earners in Prospect
The median family income in Prospect is $199,811, with families comprising 3+ earners (148) having the highest median family income of $250,001, while families with no earners (334) have the lowest median family income of $112,000, accounting for 9.9% and 22.3% of families, respectively.
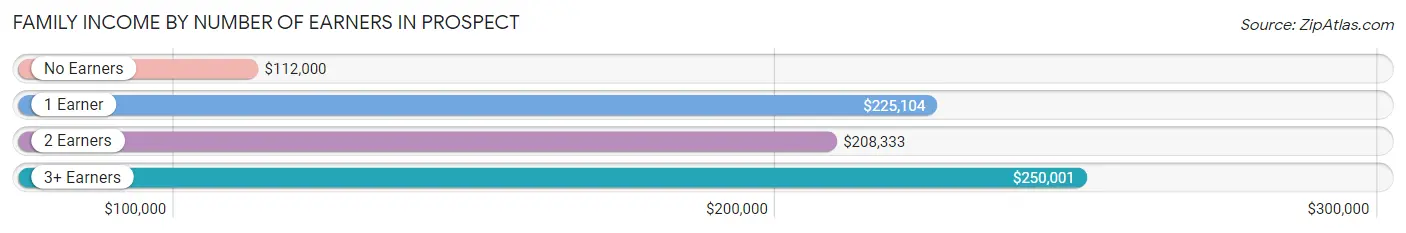
| Number of Earners | # Families | Median Income |
| No Earners | 334 (22.3%) | $112,000 |
| 1 Earner | 465 (31.1%) | $225,104 |
| 2 Earners | 550 (36.7%) | $208,333 |
| 3+ Earners | 148 (9.9%) | $250,001 |
| Total | 1,497 (100.0%) | $199,811 |
Household Income in Prospect
Household Income Brackets in Prospect
With 782 households falling in the category, the $200,000+ income range is the most frequent in Prospect, accounting for 39.6% of all households.
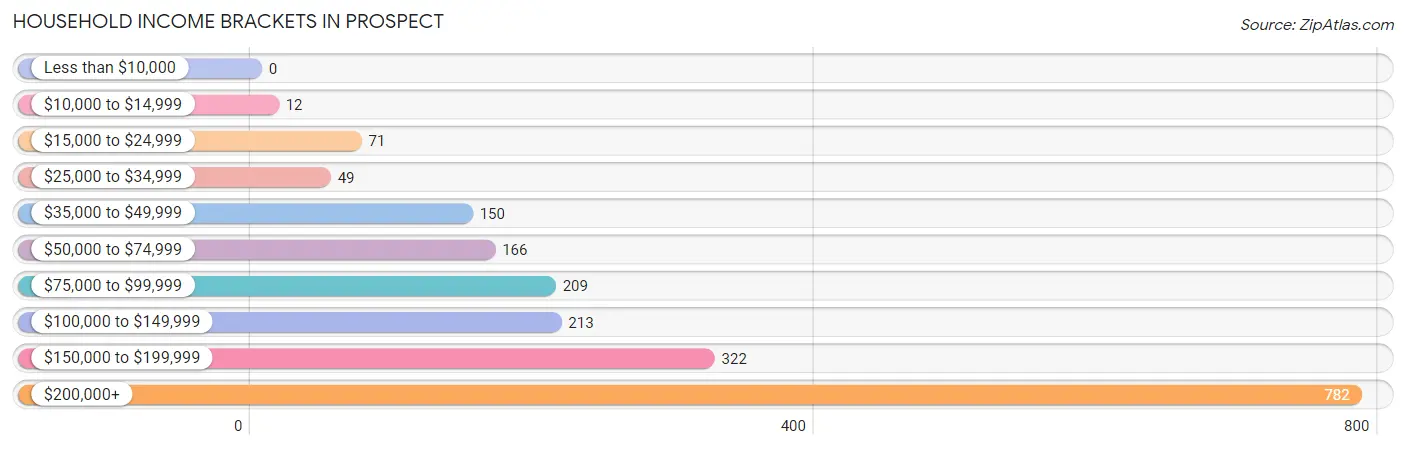
| Income Bracket | # Households | % Households |
| Less than $10,000 | 0 | 0.0% |
| $10,000 to $14,999 | 12 | 0.6% |
| $15,000 to $24,999 | 71 | 3.6% |
| $25,000 to $34,999 | 49 | 2.5% |
| $35,000 to $49,999 | 150 | 7.6% |
| $50,000 to $74,999 | 166 | 8.4% |
| $75,000 to $99,999 | 209 | 10.6% |
| $100,000 to $149,999 | 213 | 10.8% |
| $150,000 to $199,999 | 322 | 16.3% |
| $200,000+ | 782 | 39.6% |
Household Income by Householder Age in Prospect
The median household income in Prospect is $173,528, with the highest median household income of $250,001 found in the 45 to 64 years age bracket for the primary householder. A total of 822 households (41.6%) fall into this category. Meanwhile, the 15 to 24 years age bracket for the primary householder has the lowest median household income of $0, with 8 households (0.4%) in this group.
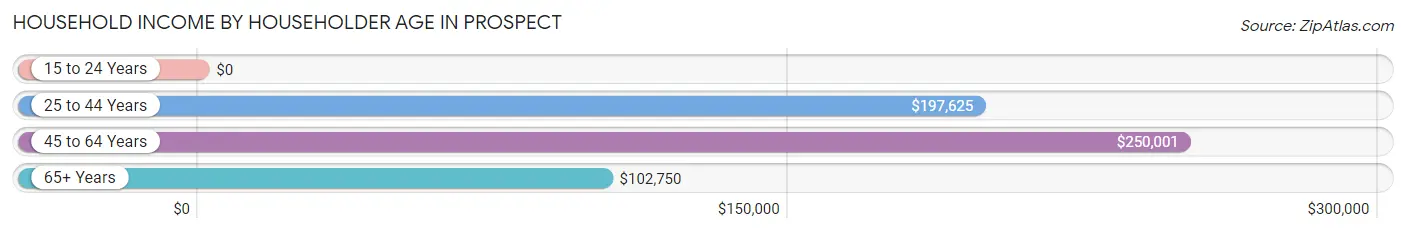
| Income Bracket | # Households | Median Income |
| 15 to 24 Years | 8 (0.4%) | $0 |
| 25 to 44 Years | 195 (9.9%) | $197,625 |
| 45 to 64 Years | 822 (41.6%) | $250,001 |
| 65+ Years | 950 (48.1%) | $102,750 |
| Total | 1,975 (100.0%) | $173,528 |
Poverty in Prospect
Income Below Poverty by Sex and Age in Prospect
With 0.9% poverty level for males and 2.0% for females among the residents of Prospect, 18 to 24 year old males and 45 to 54 year old females are the most vulnerable to poverty, with 5 males (3.6%) and 18 females (5.5%) in their respective age groups living below the poverty level.
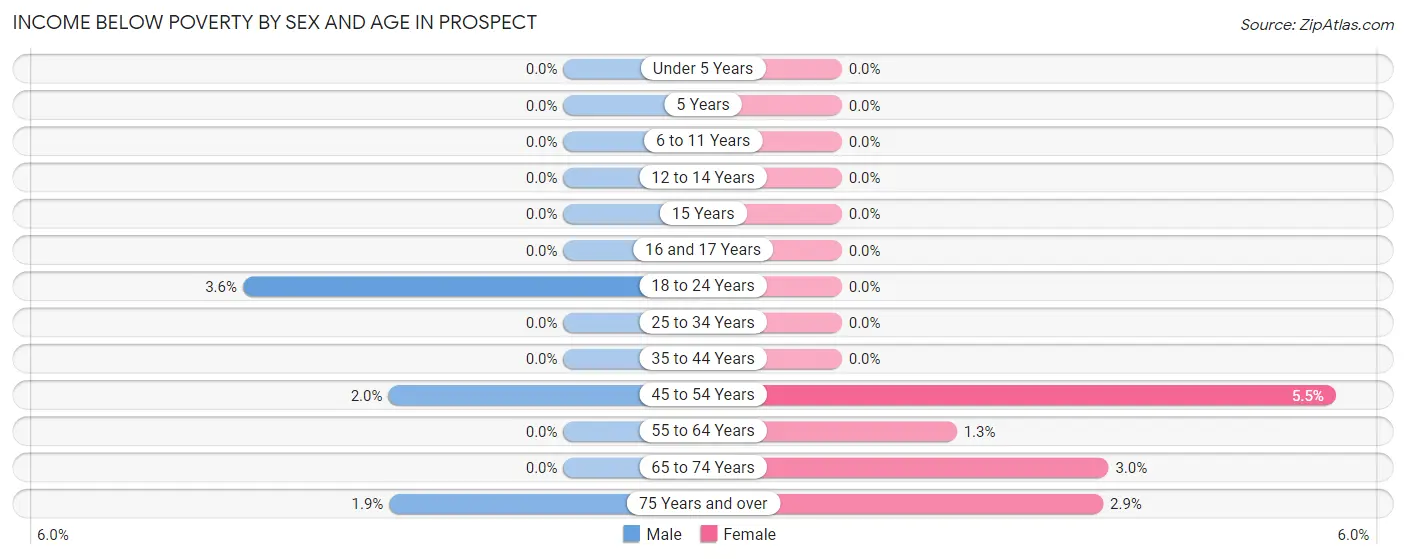
| Age Bracket | Male | Female |
| Under 5 Years | 0 (0.0%) | 0 (0.0%) |
| 5 Years | 0 (0.0%) | 0 (0.0%) |
| 6 to 11 Years | 0 (0.0%) | 0 (0.0%) |
| 12 to 14 Years | 0 (0.0%) | 0 (0.0%) |
| 15 Years | 0 (0.0%) | 0 (0.0%) |
| 16 and 17 Years | 0 (0.0%) | 0 (0.0%) |
| 18 to 24 Years | 5 (3.6%) | 0 (0.0%) |
| 25 to 34 Years | 0 (0.0%) | 0 (0.0%) |
| 35 to 44 Years | 0 (0.0%) | 0 (0.0%) |
| 45 to 54 Years | 6 (1.9%) | 18 (5.5%) |
| 55 to 64 Years | 0 (0.0%) | 5 (1.3%) |
| 65 to 74 Years | 0 (0.0%) | 17 (3.0%) |
| 75 Years and over | 8 (1.9%) | 9 (2.9%) |
| Total | 19 (0.9%) | 49 (2.0%) |
Income Above Poverty by Sex and Age in Prospect
According to the poverty statistics in Prospect, males aged under 5 years and females aged under 5 years are the age groups that are most secure financially, with 100.0% of males and 100.0% of females in these age groups living above the poverty line.
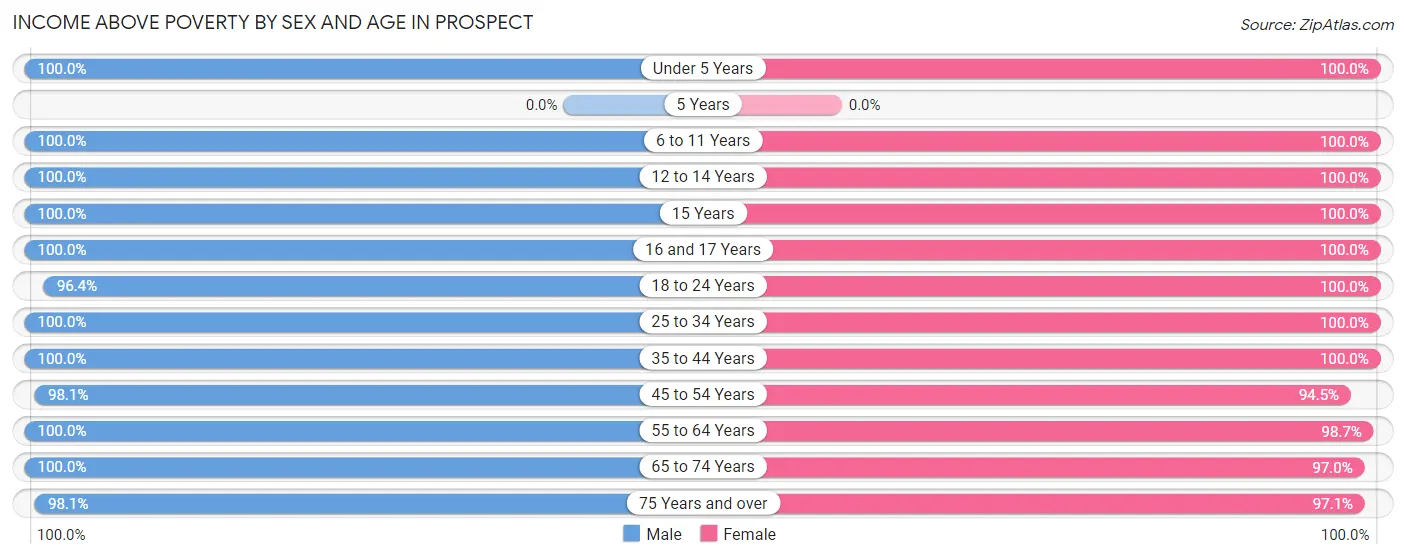
| Age Bracket | Male | Female |
| Under 5 Years | 70 (100.0%) | 88 (100.0%) |
| 5 Years | 0 (0.0%) | 0 (0.0%) |
| 6 to 11 Years | 113 (100.0%) | 128 (100.0%) |
| 12 to 14 Years | 75 (100.0%) | 96 (100.0%) |
| 15 Years | 65 (100.0%) | 19 (100.0%) |
| 16 and 17 Years | 55 (100.0%) | 34 (100.0%) |
| 18 to 24 Years | 135 (96.4%) | 97 (100.0%) |
| 25 to 34 Years | 50 (100.0%) | 77 (100.0%) |
| 35 to 44 Years | 150 (100.0%) | 271 (100.0%) |
| 45 to 54 Years | 301 (98.1%) | 309 (94.5%) |
| 55 to 64 Years | 440 (100.0%) | 386 (98.7%) |
| 65 to 74 Years | 338 (100.0%) | 555 (97.0%) |
| 75 Years and over | 404 (98.1%) | 300 (97.1%) |
| Total | 2,196 (99.1%) | 2,360 (98.0%) |
Income Below Poverty Among Married-Couple Families in Prospect
The poverty statistics for married-couple families in Prospect show that 1.0% or 14 of the total 1,422 families live below the poverty line. Families with no children have the highest poverty rate of 1.3%, comprising of 14 families. On the other hand, families with 1 or 2 children have the lowest poverty rate of 0.0%, which includes 0 families.
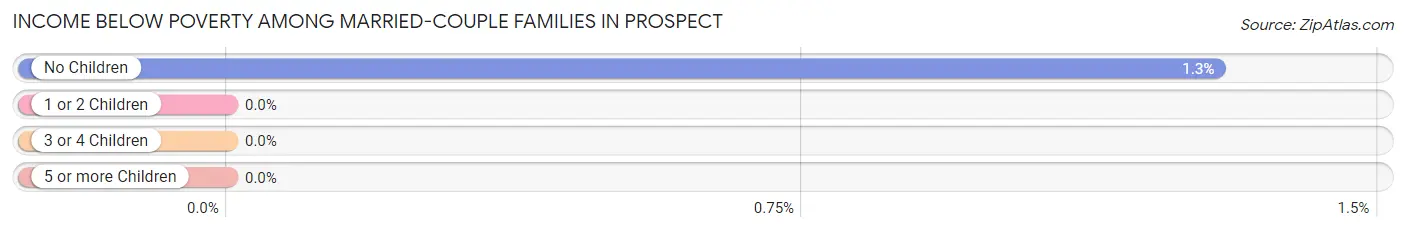
| Children | Above Poverty | Below Poverty |
| No Children | 1,068 (98.7%) | 14 (1.3%) |
| 1 or 2 Children | 231 (100.0%) | 0 (0.0%) |
| 3 or 4 Children | 109 (100.0%) | 0 (0.0%) |
| 5 or more Children | 0 (0.0%) | 0 (0.0%) |
| Total | 1,408 (99.0%) | 14 (1.0%) |
Income Below Poverty Among Single-Parent Households in Prospect
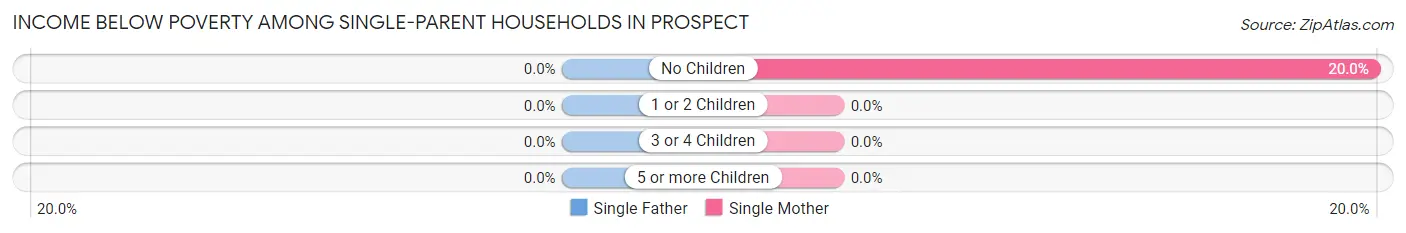
| Children | Single Father | Single Mother |
| No Children | 0 (0.0%) | 5 (20.0%) |
| 1 or 2 Children | 0 (0.0%) | 0 (0.0%) |
| 3 or 4 Children | 0 (0.0%) | 0 (0.0%) |
| 5 or more Children | 0 (0.0%) | 0 (0.0%) |
| Total | 0 (0.0%) | 5 (10.2%) |
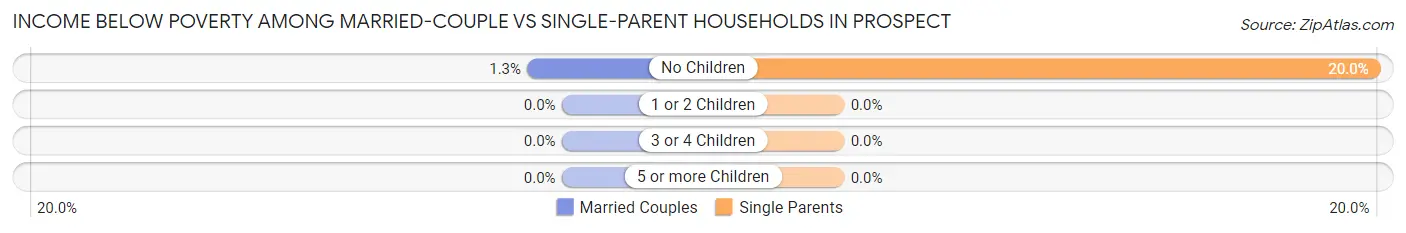
Income Below Poverty Among Married-Couple vs Single-Parent Households in Prospect
The poverty data for Prospect shows that 14 of the married-couple family households (1.0%) and 5 of the single-parent households (6.7%) are living below the poverty level. Within the married-couple family households, those with no children have the highest poverty rate, with 14 households (1.3%) falling below the poverty line. Among the single-parent households, those with no children have the highest poverty rate, with 5 household (20.0%) living below poverty.
| Children | Married-Couple Families | Single-Parent Households |
| No Children | 14 (1.3%) | 5 (20.0%) |
| 1 or 2 Children | 0 (0.0%) | 0 (0.0%) |
| 3 or 4 Children | 0 (0.0%) | 0 (0.0%) |
| 5 or more Children | 0 (0.0%) | 0 (0.0%) |
| Total | 14 (1.0%) | 5 (6.7%) |
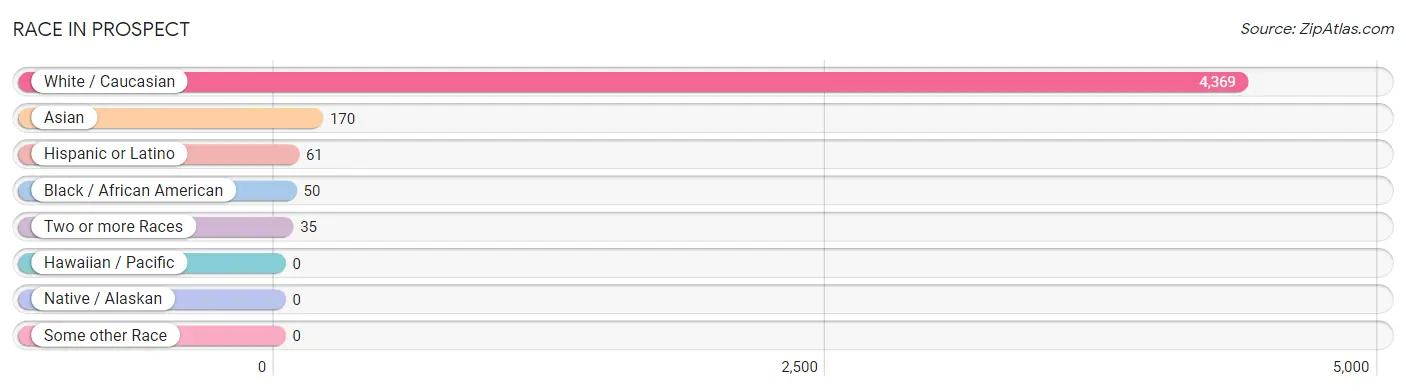
Race in Prospect
The most populous races in Prospect are White / Caucasian (4,369 | 94.5%), Asian (170 | 3.7%), and Hispanic or Latino (61 | 1.3%).
| Race | # Population | % Population |
| Asian | 170 | 3.7% |
| Black / African American | 50 | 1.1% |
| Hawaiian / Pacific | 0 | 0.0% |
| Hispanic or Latino | 61 | 1.3% |
| Native / Alaskan | 0 | 0.0% |
| White / Caucasian | 4,369 | 94.5% |
| Two or more Races | 35 | 0.8% |
| Some other Race | 0 | 0.0% |
| Total | 4,624 | 100.0% |
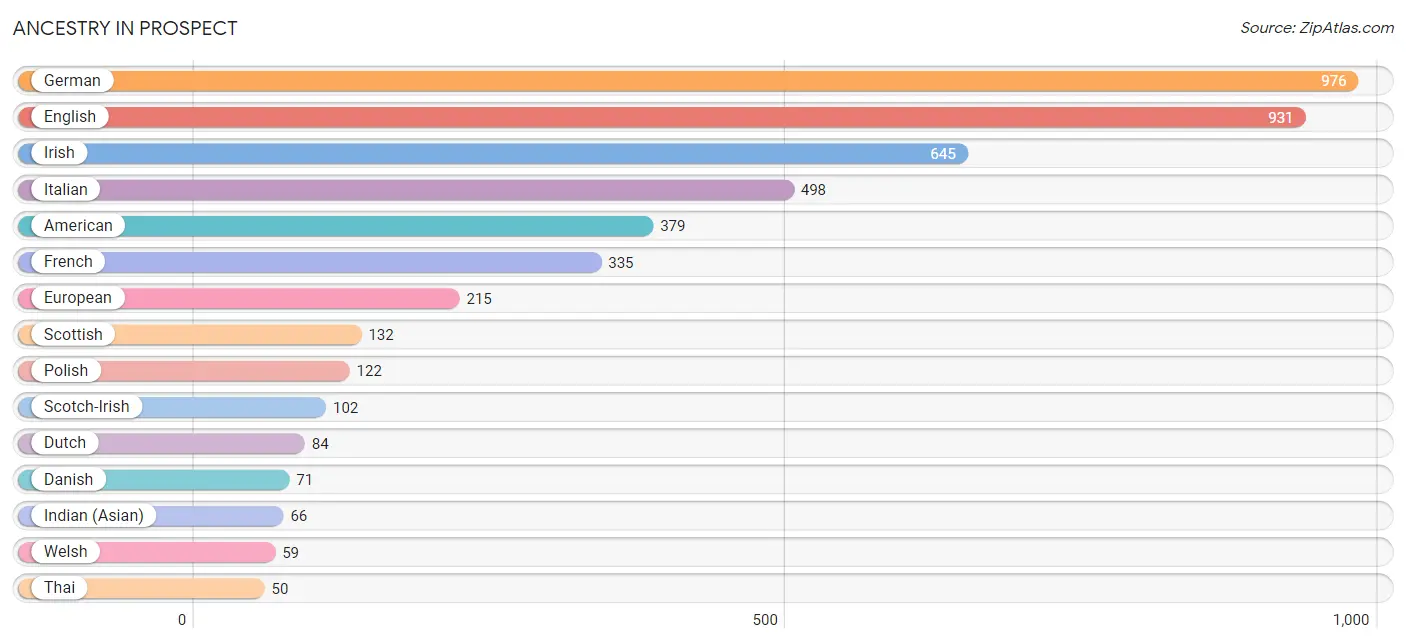
Ancestry in Prospect
The most populous ancestries reported in Prospect are German (976 | 21.1%), English (931 | 20.1%), Irish (645 | 14.0%), Italian (498 | 10.8%), and American (379 | 8.2%), together accounting for 74.2% of all Prospect residents.
| Ancestry | # Population | % Population |
| American | 379 | 8.2% |
| Arab | 34 | 0.7% |
| Austrian | 47 | 1.0% |
| Bhutanese | 16 | 0.4% |
| Brazilian | 13 | 0.3% |
| British | 39 | 0.8% |
| Burmese | 8 | 0.2% |
| Canadian | 23 | 0.5% |
| Cuban | 18 | 0.4% |
| Czech | 20 | 0.4% |
| Danish | 71 | 1.5% |
| Dutch | 84 | 1.8% |
| Eastern European | 26 | 0.6% |
| English | 931 | 20.1% |
| European | 215 | 4.6% |
| French | 335 | 7.2% |
| French Canadian | 9 | 0.2% |
| German | 976 | 21.1% |
| Indian (Asian) | 66 | 1.4% |
| Iranian | 9 | 0.2% |
| Irish | 645 | 14.0% |
| Italian | 498 | 10.8% |
| Kenyan | 10 | 0.2% |
| Lebanese | 21 | 0.4% |
| Northern European | 17 | 0.4% |
| Palestinian | 13 | 0.3% |
| Polish | 122 | 2.6% |
| Romanian | 40 | 0.9% |
| Russian | 31 | 0.7% |
| Scotch-Irish | 102 | 2.2% |
| Scottish | 132 | 2.9% |
| Serbian | 10 | 0.2% |
| South American | 28 | 0.6% |
| Spanish | 15 | 0.3% |
| Subsaharan African | 10 | 0.2% |
| Swedish | 16 | 0.4% |
| Swiss | 23 | 0.5% |
| Thai | 50 | 1.1% |
| Ukrainian | 9 | 0.2% |
| Venezuelan | 28 | 0.6% |
| Welsh | 59 | 1.3% | View All 41 Rows |
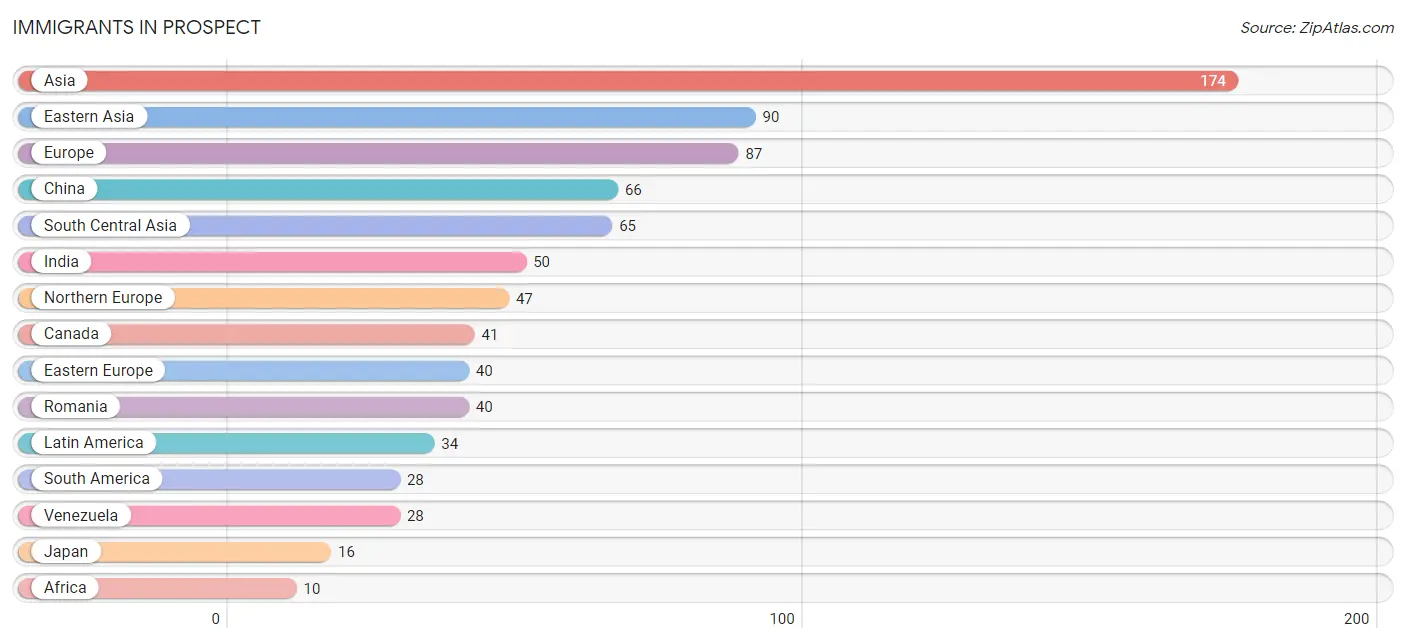
Immigrants in Prospect
The most numerous immigrant groups reported in Prospect came from Asia (174 | 3.8%), Eastern Asia (90 | 1.9%), Europe (87 | 1.9%), China (66 | 1.4%), and South Central Asia (65 | 1.4%), together accounting for 10.4% of all Prospect residents.
| Immigration Origin | # Population | % Population |
| Africa | 10 | 0.2% |
| Asia | 174 | 3.8% |
| Canada | 41 | 0.9% |
| Caribbean | 6 | 0.1% |
| China | 66 | 1.4% |
| Cuba | 6 | 0.1% |
| Eastern Africa | 10 | 0.2% |
| Eastern Asia | 90 | 1.9% |
| Eastern Europe | 40 | 0.9% |
| England | 10 | 0.2% |
| Europe | 87 | 1.9% |
| India | 50 | 1.1% |
| Iran | 9 | 0.2% |
| Ireland | 7 | 0.2% |
| Israel | 6 | 0.1% |
| Japan | 16 | 0.4% |
| Kenya | 10 | 0.2% |
| Korea | 8 | 0.2% |
| Latin America | 34 | 0.7% |
| Northern Europe | 47 | 1.0% |
| Pakistan | 6 | 0.1% |
| Romania | 40 | 0.9% |
| South America | 28 | 0.6% |
| South Central Asia | 65 | 1.4% |
| Venezuela | 28 | 0.6% |
| Western Asia | 6 | 0.1% | View All 26 Rows |
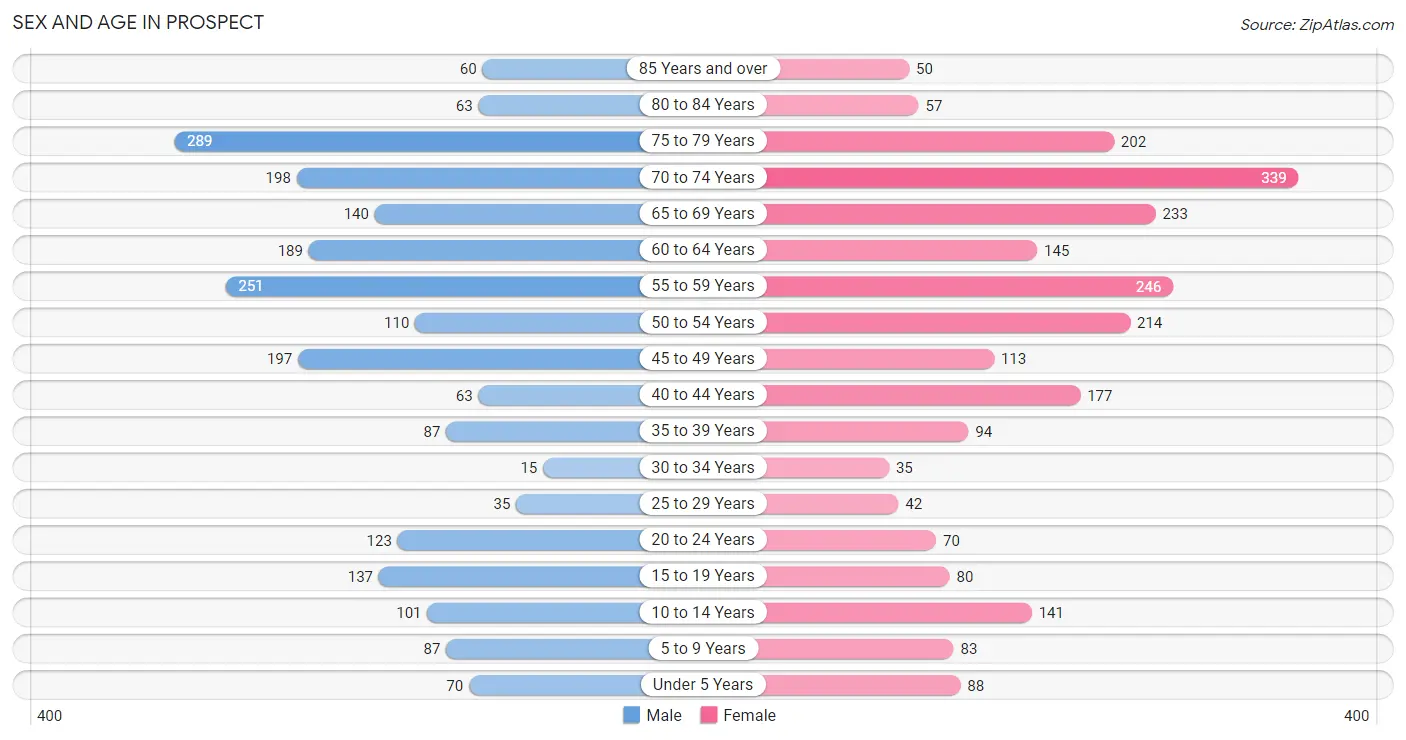
Sex and Age in Prospect
Sex and Age in Prospect
The most populous age groups in Prospect are 75 to 79 Years (289 | 13.1%) for men and 70 to 74 Years (339 | 14.1%) for women.
| Age Bracket | Male | Female |
| Under 5 Years | 70 (3.2%) | 88 (3.6%) |
| 5 to 9 Years | 87 (3.9%) | 83 (3.5%) |
| 10 to 14 Years | 101 (4.6%) | 141 (5.9%) |
| 15 to 19 Years | 137 (6.2%) | 80 (3.3%) |
| 20 to 24 Years | 123 (5.6%) | 70 (2.9%) |
| 25 to 29 Years | 35 (1.6%) | 42 (1.7%) |
| 30 to 34 Years | 15 (0.7%) | 35 (1.5%) |
| 35 to 39 Years | 87 (3.9%) | 94 (3.9%) |
| 40 to 44 Years | 63 (2.8%) | 177 (7.3%) |
| 45 to 49 Years | 197 (8.9%) | 113 (4.7%) |
| 50 to 54 Years | 110 (5.0%) | 214 (8.9%) |
| 55 to 59 Years | 251 (11.3%) | 246 (10.2%) |
| 60 to 64 Years | 189 (8.5%) | 145 (6.0%) |
| 65 to 69 Years | 140 (6.3%) | 233 (9.7%) |
| 70 to 74 Years | 198 (8.9%) | 339 (14.1%) |
| 75 to 79 Years | 289 (13.1%) | 202 (8.4%) |
| 80 to 84 Years | 63 (2.8%) | 57 (2.4%) |
| 85 Years and over | 60 (2.7%) | 50 (2.1%) |
| Total | 2,215 (100.0%) | 2,409 (100.0%) |
Families and Households in Prospect
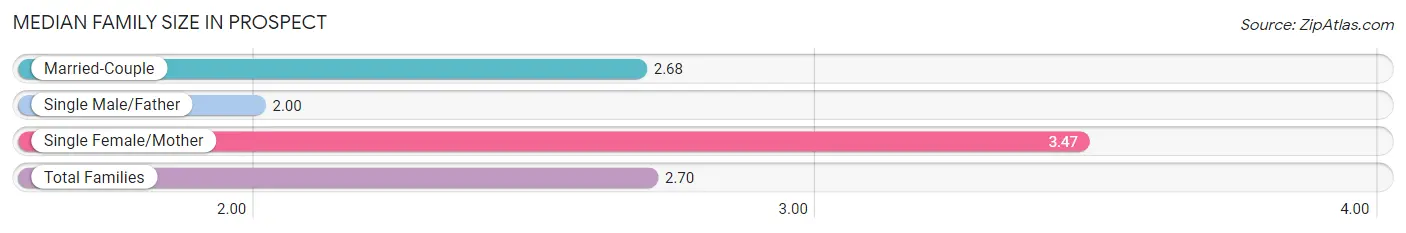
Median Family Size in Prospect
The median family size in Prospect is 2.70 persons per family, with single female/mother families (49 | 3.3%) accounting for the largest median family size of 3.47 persons per family. On the other hand, single male/father families (26 | 1.7%) represent the smallest median family size with 2.00 persons per family.
| Family Type | # Families | Family Size |
| Married-Couple | 1,422 (95.0%) | 2.68 |
| Single Male/Father | 26 (1.7%) | 2.00 |
| Single Female/Mother | 49 (3.3%) | 3.47 |
| Total Families | 1,497 (100.0%) | 2.70 |
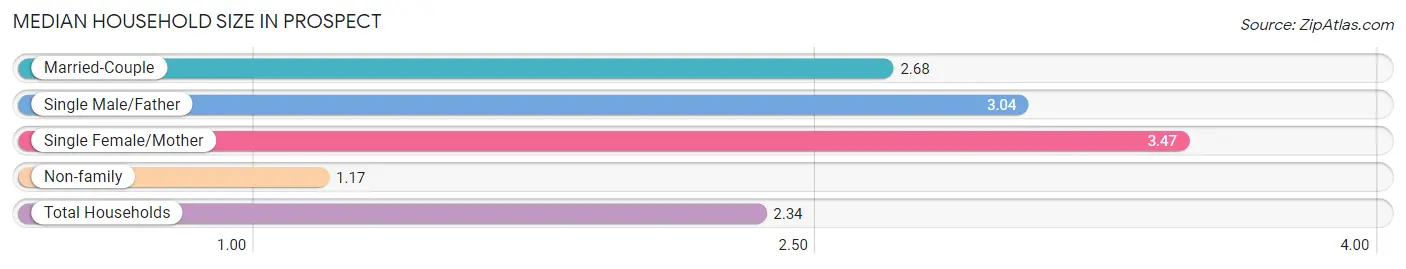
Median Household Size in Prospect
The median household size in Prospect is 2.34 persons per household, with single female/mother households (49 | 2.5%) accounting for the largest median household size of 3.47 persons per household. non-family households (478 | 24.2%) represent the smallest median household size with 1.17 persons per household.
| Household Type | # Households | Household Size |
| Married-Couple | 1,422 (72.0%) | 2.68 |
| Single Male/Father | 26 (1.3%) | 3.04 |
| Single Female/Mother | 49 (2.5%) | 3.47 |
| Non-family | 478 (24.2%) | 1.17 |
| Total Households | 1,975 (100.0%) | 2.34 |
Household Size by Marriage Status in Prospect
Out of a total of 1,975 households in Prospect, 1,497 (75.8%) are family households, while 478 (24.2%) are nonfamily households. The most numerous type of family households are 2-person households, comprising 879, and the most common type of nonfamily households are 1-person households, comprising 381.
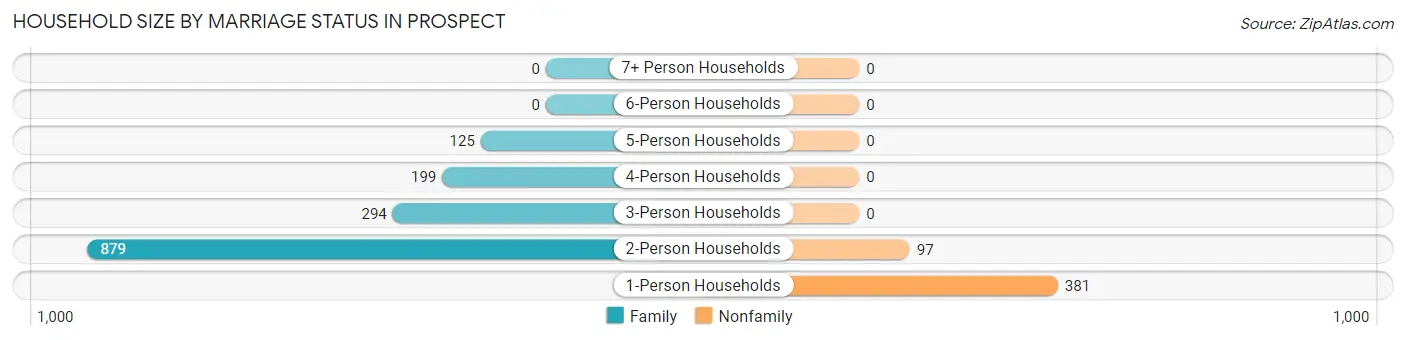
| Household Size | Family Households | Nonfamily Households |
| 1-Person Households | - | 381 (19.3%) |
| 2-Person Households | 879 (44.5%) | 97 (4.9%) |
| 3-Person Households | 294 (14.9%) | 0 (0.0%) |
| 4-Person Households | 199 (10.1%) | 0 (0.0%) |
| 5-Person Households | 125 (6.3%) | 0 (0.0%) |
| 6-Person Households | 0 (0.0%) | 0 (0.0%) |
| 7+ Person Households | 0 (0.0%) | 0 (0.0%) |
| Total | 1,497 (75.8%) | 478 (24.2%) |
Female Fertility in Prospect
Fertility by Age in Prospect
Average fertility rate in Prospect is 45.0 births per 1,000 women. Women in the age bracket of 20 to 34 years have the highest fertility rate with 68.0 births per 1,000 women. Women in the age bracket of 35 to 50 years acount for 65.5% of all women with births.
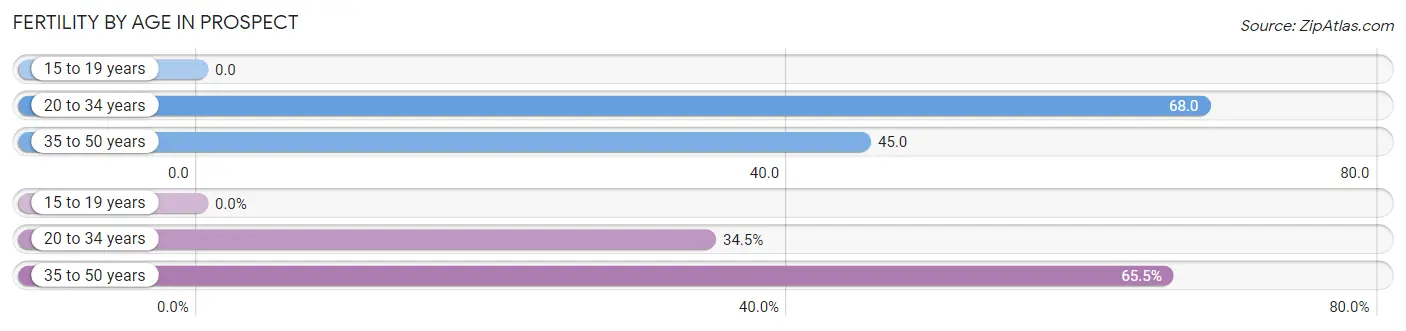
| Age Bracket | Women with Births | Births / 1,000 Women |
| 15 to 19 years | 0 (0.0%) | 0.0 |
| 20 to 34 years | 10 (34.5%) | 68.0 |
| 35 to 50 years | 19 (65.5%) | 45.0 |
| Total | 29 (100.0%) | 45.0 |
Fertility by Age by Marriage Status in Prospect
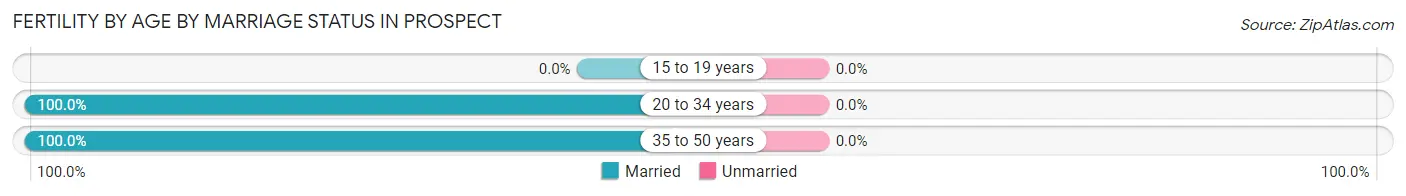
| Age Bracket | Married | Unmarried |
| 15 to 19 years | 0 (0.0%) | 0 (0.0%) |
| 20 to 34 years | 10 (100.0%) | 0 (0.0%) |
| 35 to 50 years | 19 (100.0%) | 0 (0.0%) |
| Total | 29 (100.0%) | 0 (0.0%) |
Fertility by Education in Prospect
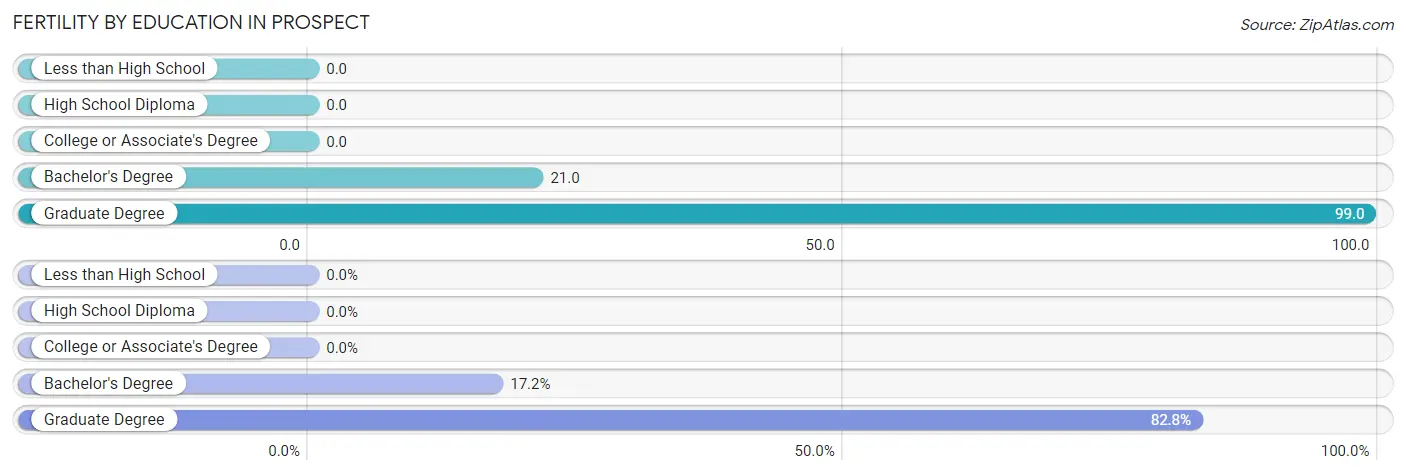
| Educational Attainment | Women with Births | Births / 1,000 Women |
| Less than High School | 0 (0.0%) | 0.0 |
| High School Diploma | 0 (0.0%) | 0.0 |
| College or Associate's Degree | 0 (0.0%) | 0.0 |
| Bachelor's Degree | 5 (17.2%) | 21.0 |
| Graduate Degree | 24 (82.8%) | 99.0 |
| Total | 29 (100.0%) | 45.0 |
Fertility by Education by Marriage Status in Prospect
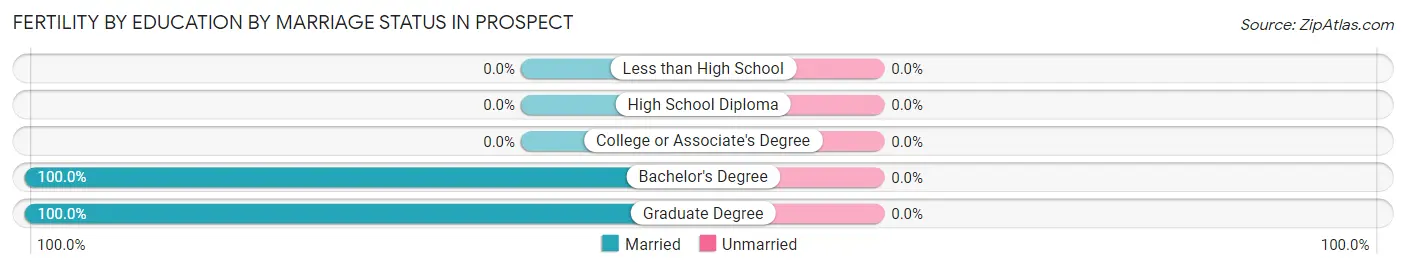
| Educational Attainment | Married | Unmarried |
| Less than High School | 0 (0.0%) | 0 (0.0%) |
| High School Diploma | 0 (0.0%) | 0 (0.0%) |
| College or Associate's Degree | 0 (0.0%) | 0 (0.0%) |
| Bachelor's Degree | 5 (100.0%) | 0 (0.0%) |
| Graduate Degree | 24 (100.0%) | 0 (0.0%) |
| Total | 29 (100.0%) | 0 (0.0%) |
Employment Characteristics in Prospect
Employment by Class of Employer in Prospect
Among the 2,080 employed individuals in Prospect, private company employees (1,246 | 59.9%), self-employed (not incorporated) (260 | 12.5%), and not-for-profit organizations (221 | 10.6%) make up the most common classes of employment.
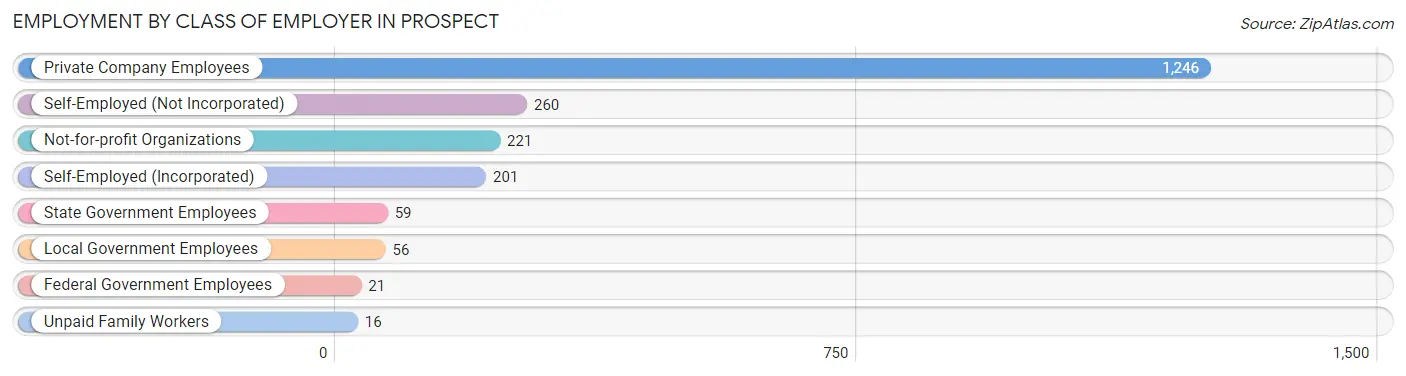
| Employer Class | # Employees | % Employees |
| Private Company Employees | 1,246 | 59.9% |
| Self-Employed (Incorporated) | 201 | 9.7% |
| Self-Employed (Not Incorporated) | 260 | 12.5% |
| Not-for-profit Organizations | 221 | 10.6% |
| Local Government Employees | 56 | 2.7% |
| State Government Employees | 59 | 2.8% |
| Federal Government Employees | 21 | 1.0% |
| Unpaid Family Workers | 16 | 0.8% |
| Total | 2,080 | 100.0% |
Employment Status by Age in Prospect
According to the labor force statistics for Prospect, out of the total population over 16 years of age (3,970), 57.1% or 2,267 individuals are in the labor force, with 4.7% or 107 of them unemployed. The age group with the highest labor force participation rate is 25 to 29 years, with 100.0% or 77 individuals in the labor force. Within the labor force, the 20 to 24 years age range has the highest percentage of unemployed individuals, with 56.6% or 69 of them being unemployed.
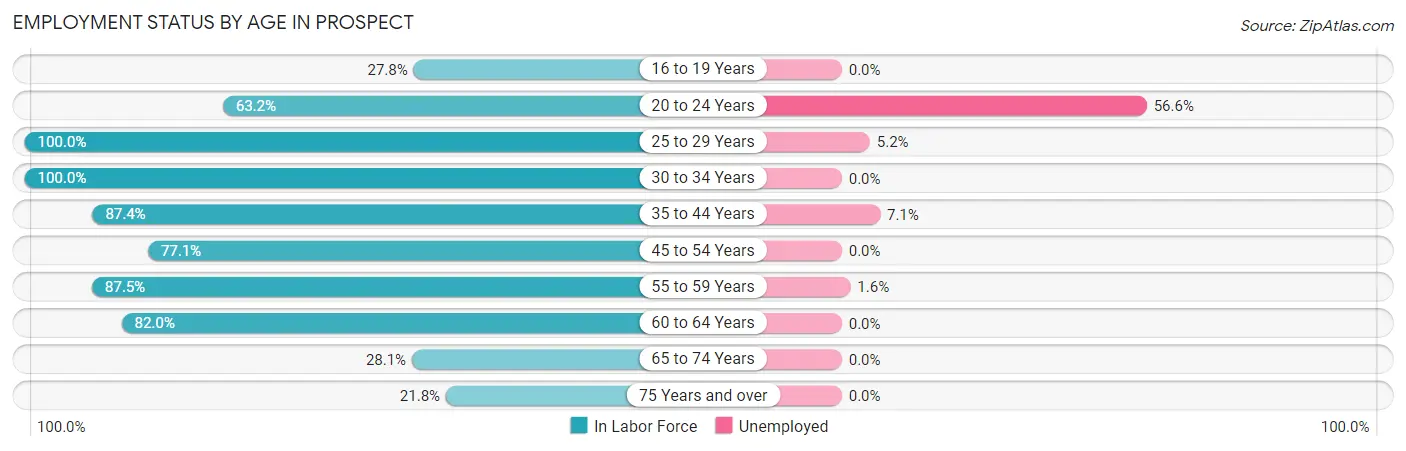
| Age Bracket | In Labor Force | Unemployed |
| 16 to 19 Years | 37 (27.8%) | 0 (0.0%) |
| 20 to 24 Years | 122 (63.2%) | 69 (56.6%) |
| 25 to 29 Years | 77 (100.0%) | 4 (5.2%) |
| 30 to 34 Years | 50 (100.0%) | 0 (0.0%) |
| 35 to 44 Years | 368 (87.4%) | 26 (7.1%) |
| 45 to 54 Years | 489 (77.1%) | 0 (0.0%) |
| 55 to 59 Years | 435 (87.5%) | 7 (1.6%) |
| 60 to 64 Years | 274 (82.0%) | 0 (0.0%) |
| 65 to 74 Years | 256 (28.1%) | 0 (0.0%) |
| 75 Years and over | 157 (21.8%) | 0 (0.0%) |
| Total | 2,267 (57.1%) | 107 (4.7%) |
Employment Status by Educational Attainment in Prospect
According to labor force statistics for Prospect, 84.1% of individuals (1,693) out of the total population between 25 and 64 years of age (2,013) are in the labor force, with 2.2% or 37 of them being unemployed. The group with the highest labor force participation rate are those with the educational attainment of bachelor's degree or higher, with 87.2% or 1,360 individuals in the labor force. Within the labor force, individuals with college / associate degree education have the highest percentage of unemployment, with 2.2% or 7 of them being unemployed.
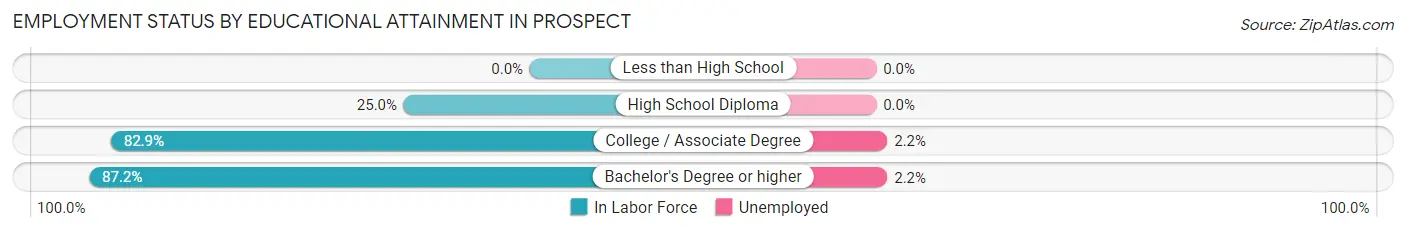
| Educational Attainment | In Labor Force | Unemployed |
| Less than High School | 0 (0.0%) | 0 (0.0%) |
| High School Diploma | 16 (25.0%) | 0 (0.0%) |
| College / Associate Degree | 316 (82.9%) | 8 (2.2%) |
| Bachelor's Degree or higher | 1,360 (87.2%) | 34 (2.2%) |
| Total | 1,693 (84.1%) | 44 (2.2%) |
Employment Occupations by Sex in Prospect
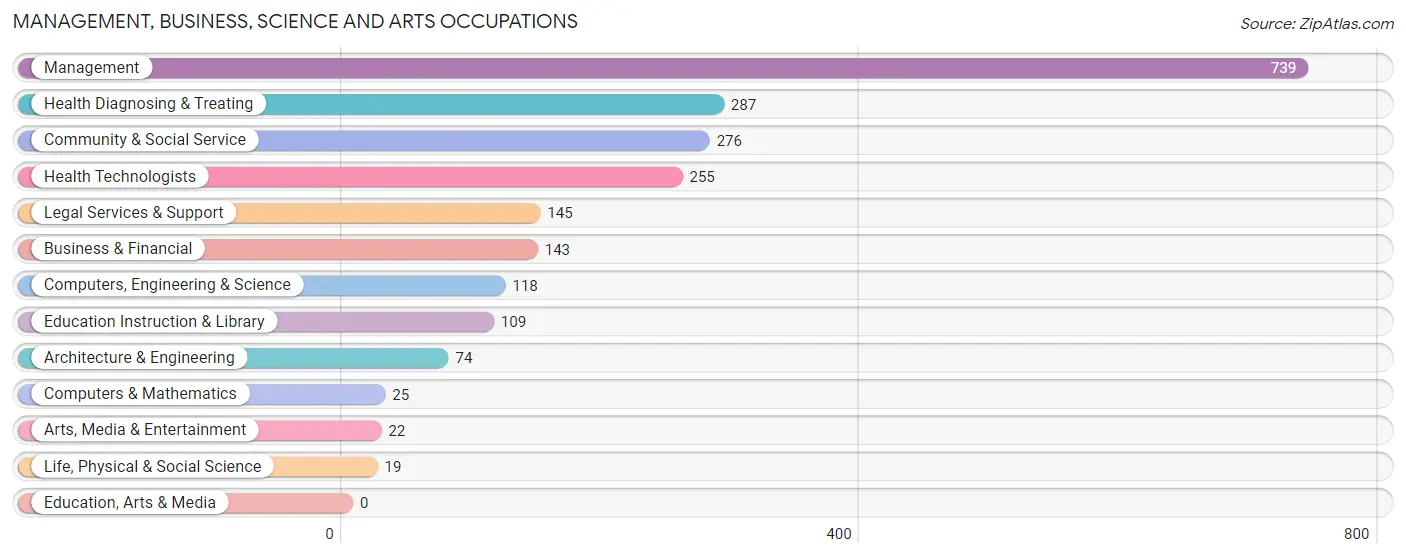
Management, Business, Science and Arts Occupations
The most common Management, Business, Science and Arts occupations in Prospect are Management (739 | 34.2%), Health Diagnosing & Treating (287 | 13.3%), Community & Social Service (276 | 12.8%), Health Technologists (255 | 11.8%), and Legal Services & Support (145 | 6.7%).
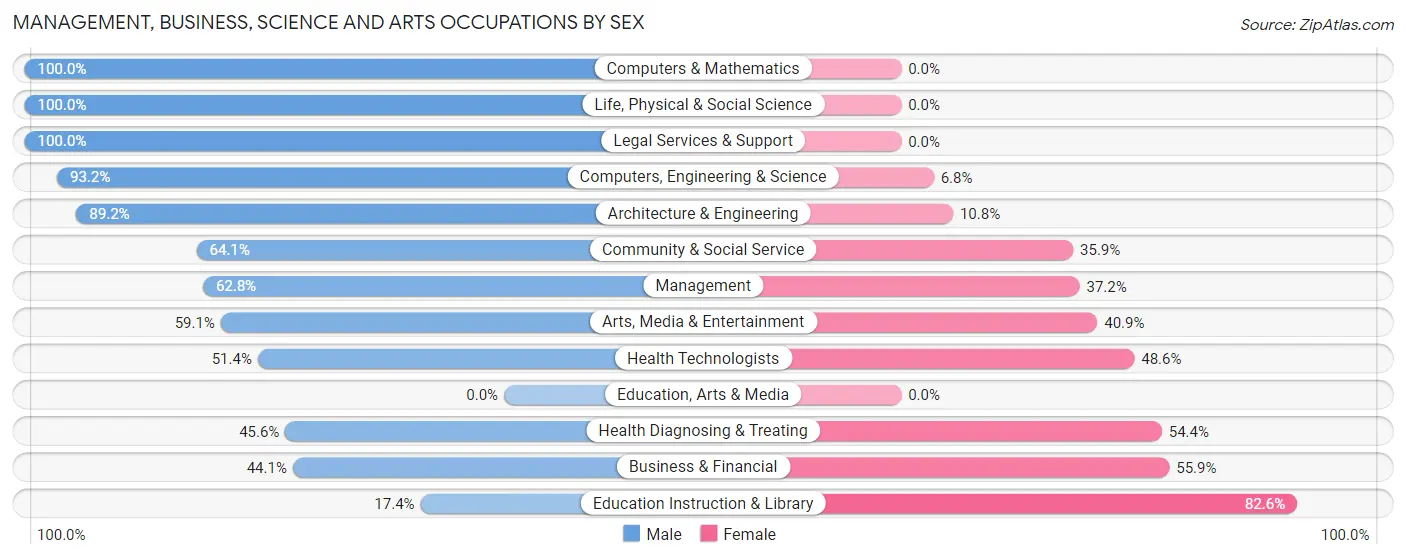
Management, Business, Science and Arts Occupations by Sex
Within the Management, Business, Science and Arts occupations in Prospect, the most male-oriented occupations are Computers & Mathematics (100.0%), Life, Physical & Social Science (100.0%), and Legal Services & Support (100.0%), while the most female-oriented occupations are Education Instruction & Library (82.6%), Business & Financial (55.9%), and Health Diagnosing & Treating (54.4%).
| Occupation | Male | Female |
| Management | 464 (62.8%) | 275 (37.2%) |
| Business & Financial | 63 (44.1%) | 80 (55.9%) |
| Computers, Engineering & Science | 110 (93.2%) | 8 (6.8%) |
| Computers & Mathematics | 25 (100.0%) | 0 (0.0%) |
| Architecture & Engineering | 66 (89.2%) | 8 (10.8%) |
| Life, Physical & Social Science | 19 (100.0%) | 0 (0.0%) |
| Community & Social Service | 177 (64.1%) | 99 (35.9%) |
| Education, Arts & Media | 0 (0.0%) | 0 (0.0%) |
| Legal Services & Support | 145 (100.0%) | 0 (0.0%) |
| Education Instruction & Library | 19 (17.4%) | 90 (82.6%) |
| Arts, Media & Entertainment | 13 (59.1%) | 9 (40.9%) |
| Health Diagnosing & Treating | 131 (45.6%) | 156 (54.4%) |
| Health Technologists | 131 (51.4%) | 124 (48.6%) |
| Total (Category) | 945 (60.5%) | 618 (39.5%) |
| Total (Overall) | 1,231 (57.0%) | 928 (43.0%) |
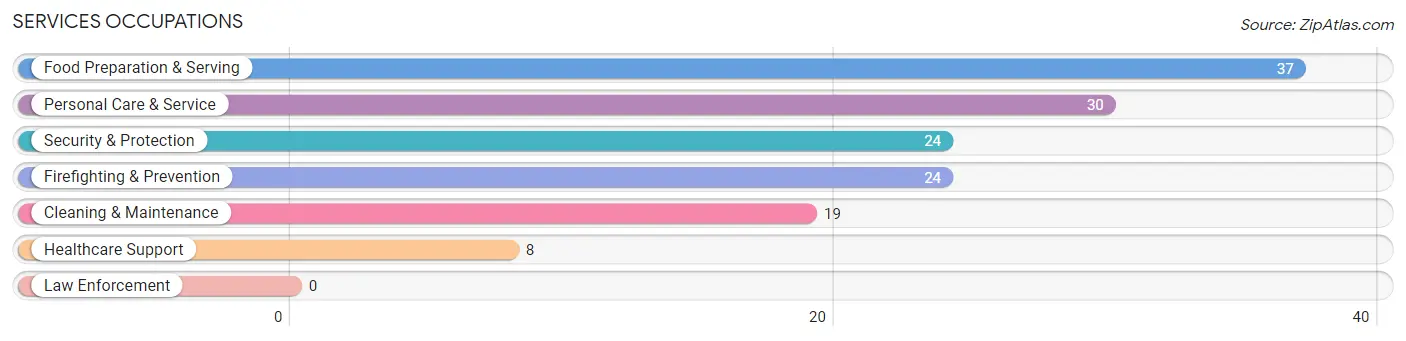
Services Occupations
The most common Services occupations in Prospect are Food Preparation & Serving (37 | 1.7%), Personal Care & Service (30 | 1.4%), Security & Protection (24 | 1.1%), Firefighting & Prevention (24 | 1.1%), and Cleaning & Maintenance (19 | 0.9%).
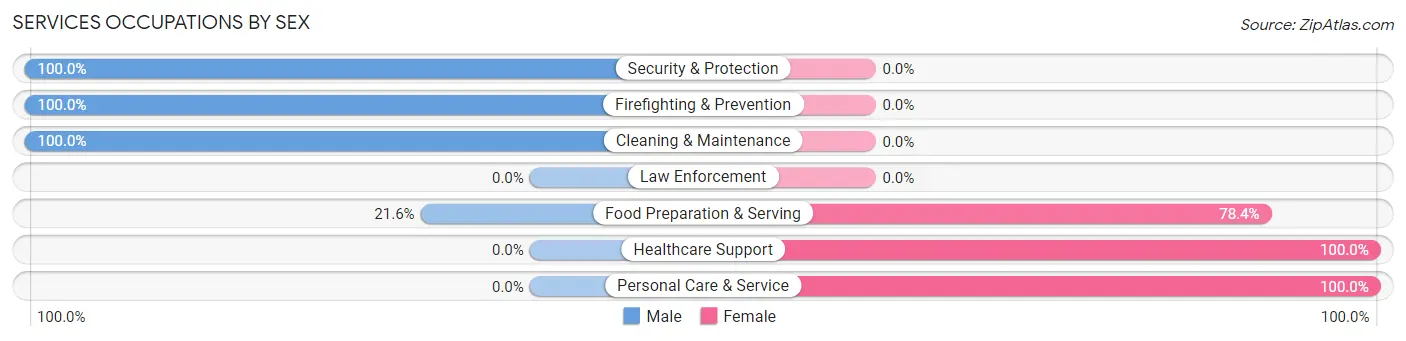
Services Occupations by Sex
Within the Services occupations in Prospect, the most male-oriented occupations are Security & Protection (100.0%), Firefighting & Prevention (100.0%), and Cleaning & Maintenance (100.0%), while the most female-oriented occupations are Healthcare Support (100.0%), Personal Care & Service (100.0%), and Food Preparation & Serving (78.4%).
| Occupation | Male | Female |
| Healthcare Support | 0 (0.0%) | 8 (100.0%) |
| Security & Protection | 24 (100.0%) | 0 (0.0%) |
| Firefighting & Prevention | 24 (100.0%) | 0 (0.0%) |
| Law Enforcement | 0 (0.0%) | 0 (0.0%) |
| Food Preparation & Serving | 8 (21.6%) | 29 (78.4%) |
| Cleaning & Maintenance | 19 (100.0%) | 0 (0.0%) |
| Personal Care & Service | 0 (0.0%) | 30 (100.0%) |
| Total (Category) | 51 (43.2%) | 67 (56.8%) |
| Total (Overall) | 1,231 (57.0%) | 928 (43.0%) |
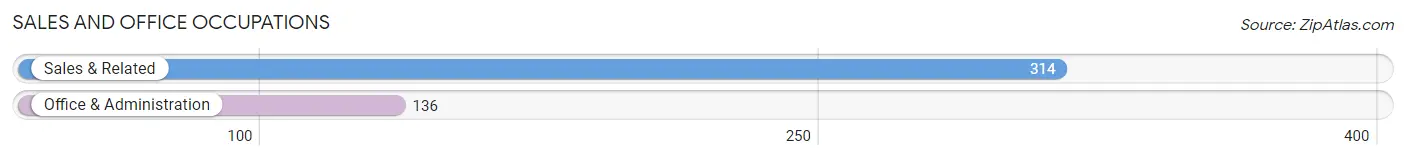
Sales and Office Occupations
The most common Sales and Office occupations in Prospect are Sales & Related (314 | 14.5%), and Office & Administration (136 | 6.3%).
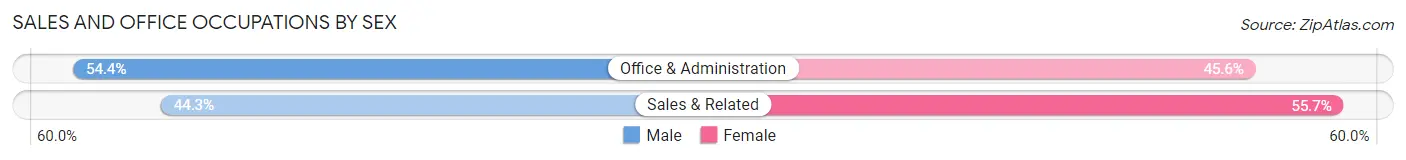
Sales and Office Occupations by Sex
| Occupation | Male | Female |
| Sales & Related | 139 (44.3%) | 175 (55.7%) |
| Office & Administration | 74 (54.4%) | 62 (45.6%) |
| Total (Category) | 213 (47.3%) | 237 (52.7%) |
| Total (Overall) | 1,231 (57.0%) | 928 (43.0%) |
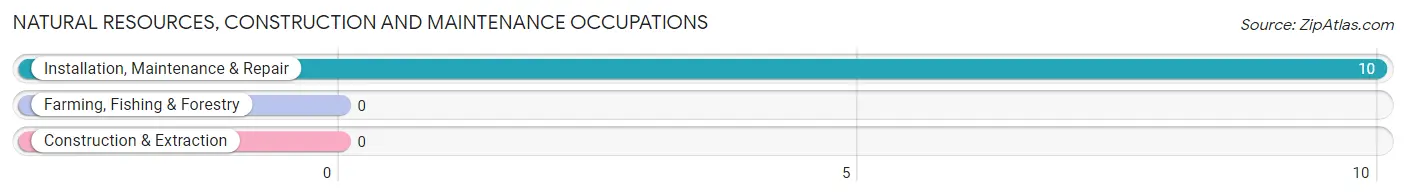
Natural Resources, Construction and Maintenance Occupations
The most common Natural Resources, Construction and Maintenance occupations in Prospect are , and Installation, Maintenance & Repair (10 | 0.5%).
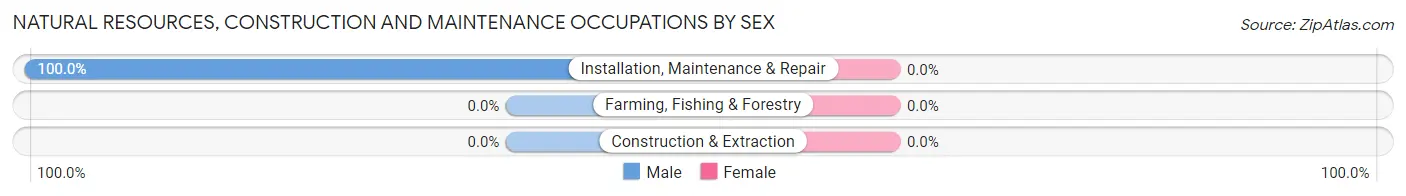
Natural Resources, Construction and Maintenance Occupations by Sex
| Occupation | Male | Female |
| Farming, Fishing & Forestry | 0 (0.0%) | 0 (0.0%) |
| Construction & Extraction | 0 (0.0%) | 0 (0.0%) |
| Installation, Maintenance & Repair | 10 (100.0%) | 0 (0.0%) |
| Total (Category) | 10 (100.0%) | 0 (0.0%) |
| Total (Overall) | 1,231 (57.0%) | 928 (43.0%) |
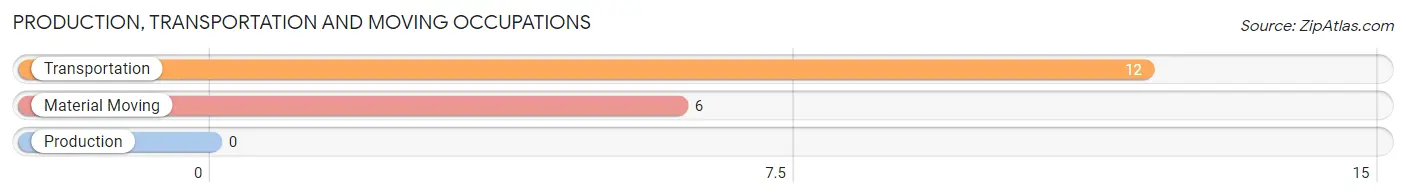
Production, Transportation and Moving Occupations
The most common Production, Transportation and Moving occupations in Prospect are Transportation (12 | 0.6%), and Material Moving (6 | 0.3%).
Production, Transportation and Moving Occupations by Sex
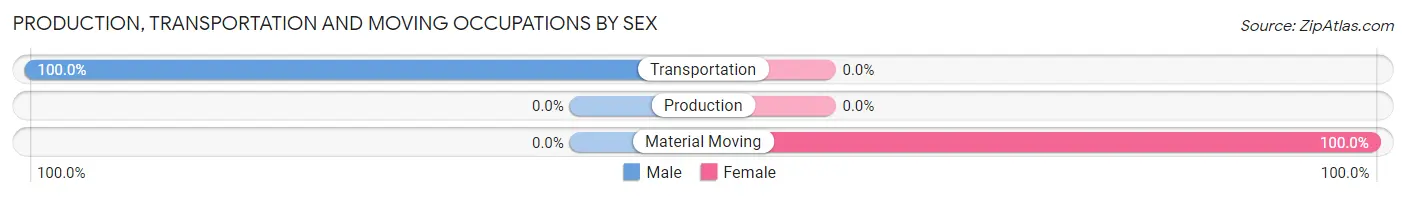
| Occupation | Male | Female |
| Production | 0 (0.0%) | 0 (0.0%) |
| Transportation | 12 (100.0%) | 0 (0.0%) |
| Material Moving | 0 (0.0%) | 6 (100.0%) |
| Total (Category) | 12 (66.7%) | 6 (33.3%) |
| Total (Overall) | 1,231 (57.0%) | 928 (43.0%) |
Employment Industries by Sex in Prospect
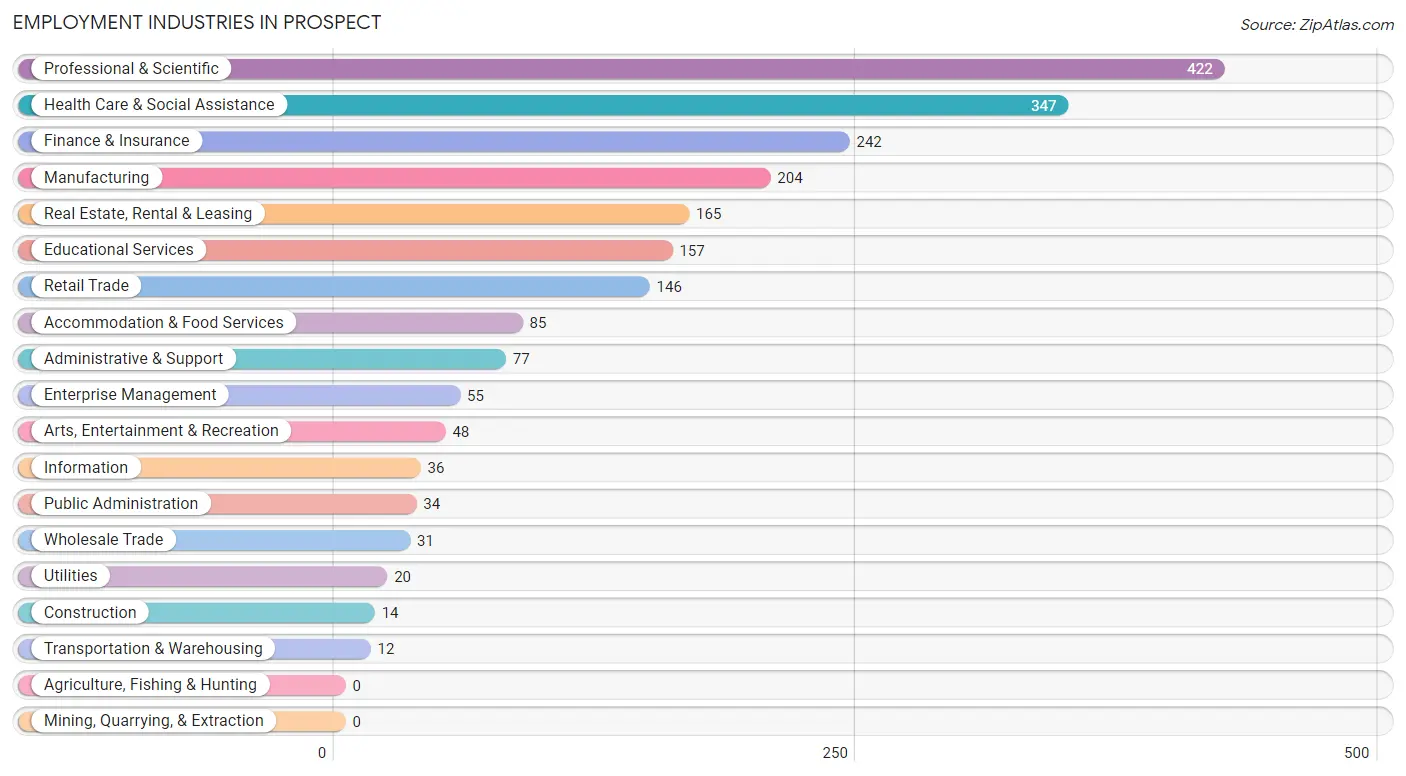
Employment Industries in Prospect
The major employment industries in Prospect include Professional & Scientific (422 | 19.6%), Health Care & Social Assistance (347 | 16.1%), Finance & Insurance (242 | 11.2%), Manufacturing (204 | 9.5%), and Real Estate, Rental & Leasing (165 | 7.6%).
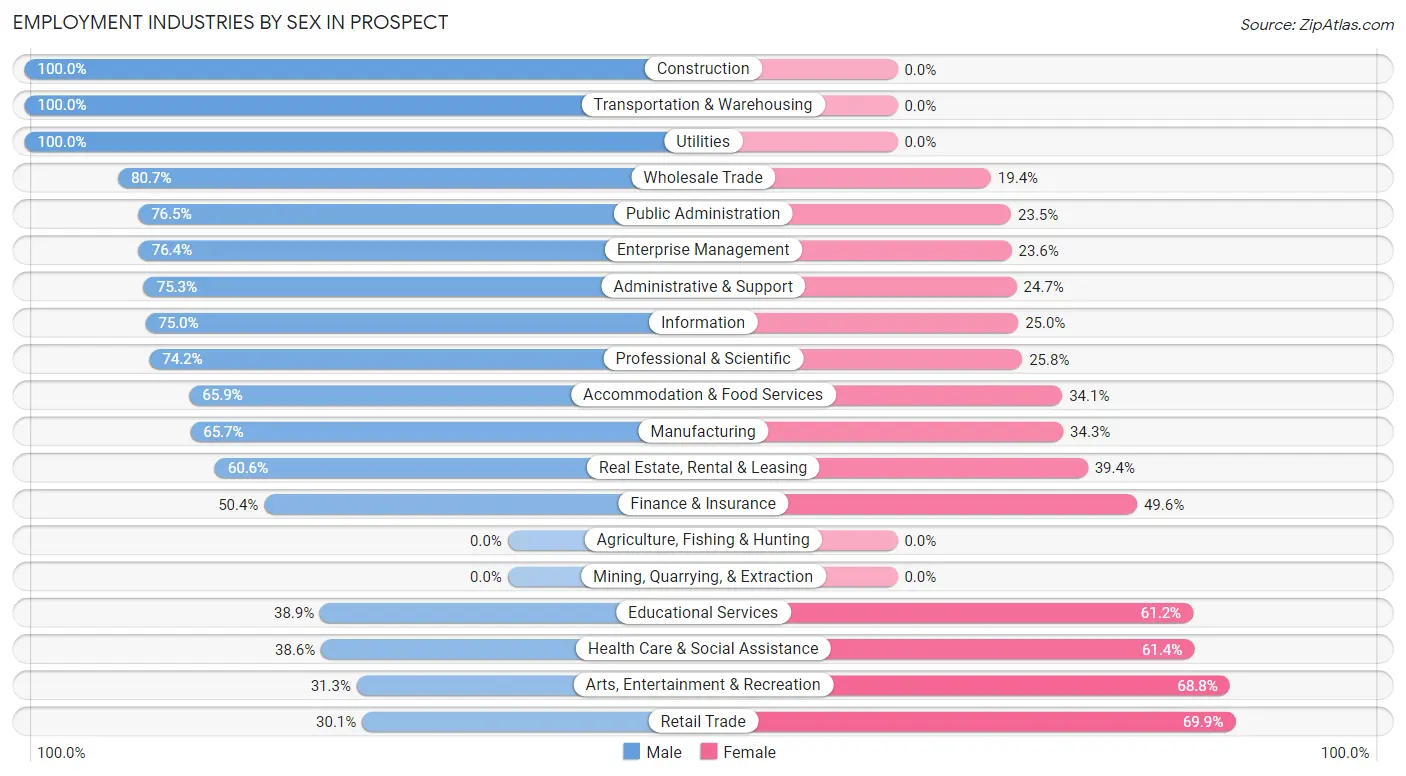
Employment Industries by Sex in Prospect
The Prospect industries that see more men than women are Construction (100.0%), Transportation & Warehousing (100.0%), and Utilities (100.0%), whereas the industries that tend to have a higher number of women are Retail Trade (69.9%), Arts, Entertainment & Recreation (68.8%), and Health Care & Social Assistance (61.4%).
| Industry | Male | Female |
| Agriculture, Fishing & Hunting | 0 (0.0%) | 0 (0.0%) |
| Mining, Quarrying, & Extraction | 0 (0.0%) | 0 (0.0%) |
| Construction | 14 (100.0%) | 0 (0.0%) |
| Manufacturing | 134 (65.7%) | 70 (34.3%) |
| Wholesale Trade | 25 (80.6%) | 6 (19.4%) |
| Retail Trade | 44 (30.1%) | 102 (69.9%) |
| Transportation & Warehousing | 12 (100.0%) | 0 (0.0%) |
| Utilities | 20 (100.0%) | 0 (0.0%) |
| Information | 27 (75.0%) | 9 (25.0%) |
| Finance & Insurance | 122 (50.4%) | 120 (49.6%) |
| Real Estate, Rental & Leasing | 100 (60.6%) | 65 (39.4%) |
| Professional & Scientific | 313 (74.2%) | 109 (25.8%) |
| Enterprise Management | 42 (76.4%) | 13 (23.6%) |
| Administrative & Support | 58 (75.3%) | 19 (24.7%) |
| Educational Services | 61 (38.9%) | 96 (61.2%) |
| Health Care & Social Assistance | 134 (38.6%) | 213 (61.4%) |
| Arts, Entertainment & Recreation | 15 (31.2%) | 33 (68.8%) |
| Accommodation & Food Services | 56 (65.9%) | 29 (34.1%) |
| Public Administration | 26 (76.5%) | 8 (23.5%) |
| Total | 1,231 (57.0%) | 928 (43.0%) |
Education in Prospect
School Enrollment in Prospect
The most common levels of schooling among the 887 students in Prospect are high school (271 | 30.5%), middle school (178 | 20.1%), and elementary school (155 | 17.5%).
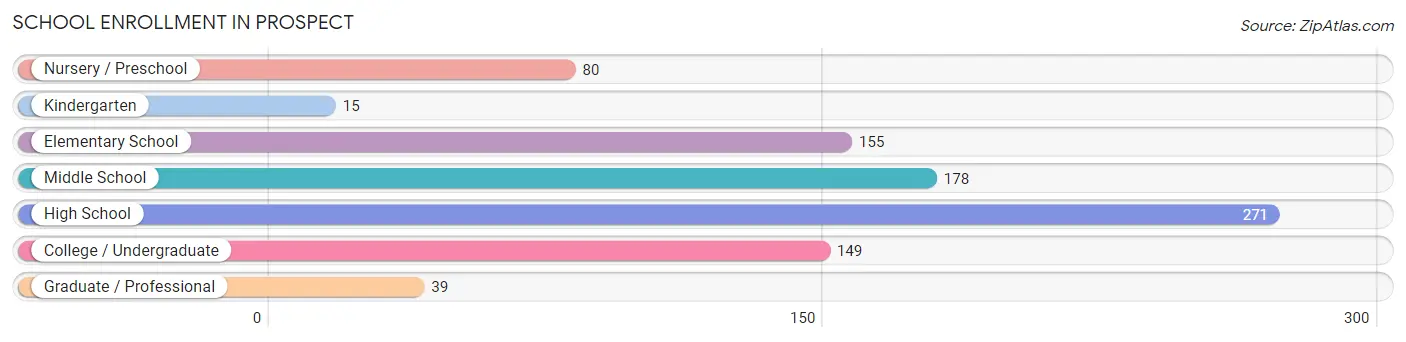
| School Level | # Students | % Students |
| Nursery / Preschool | 80 | 9.0% |
| Kindergarten | 15 | 1.7% |
| Elementary School | 155 | 17.5% |
| Middle School | 178 | 20.1% |
| High School | 271 | 30.5% |
| College / Undergraduate | 149 | 16.8% |
| Graduate / Professional | 39 | 4.4% |
| Total | 887 | 100.0% |
School Enrollment by Age by Funding Source in Prospect
Out of a total of 887 students who are enrolled in schools in Prospect, 279 (31.5%) attend a private institution, while the remaining 608 (68.5%) are enrolled in public schools. The age group of 3 to 4 year olds has the highest likelihood of being enrolled in private schools, with 80 (100.0% in the age bracket) enrolled. Conversely, the age group of 5 to 9 year old has the lowest likelihood of being enrolled in a private school, with 170 (100.0% in the age bracket) attending a public institution.
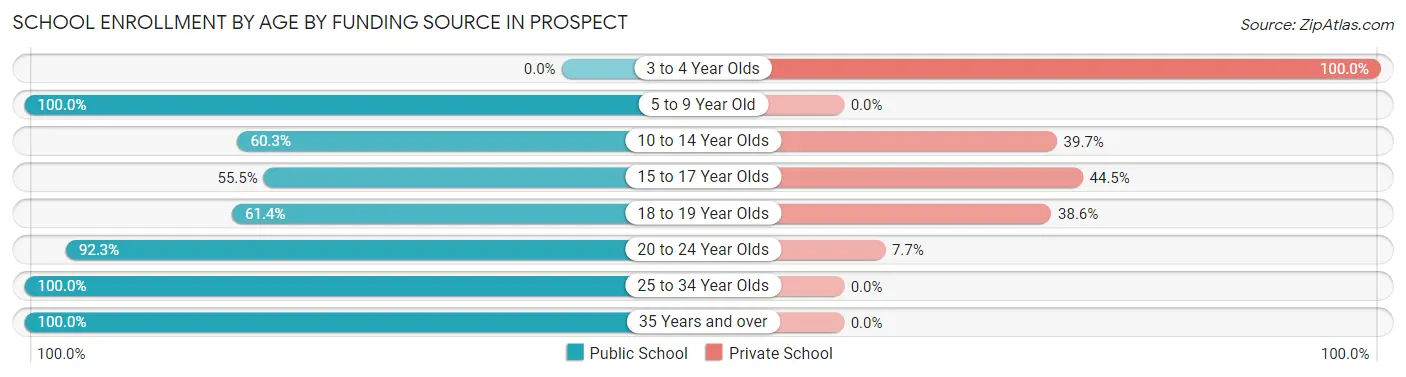
| Age Bracket | Public School | Private School |
| 3 to 4 Year Olds | 0 (0.0%) | 80 (100.0%) |
| 5 to 9 Year Old | 170 (100.0%) | 0 (0.0%) |
| 10 to 14 Year Olds | 146 (60.3%) | 96 (39.7%) |
| 15 to 17 Year Olds | 96 (55.5%) | 77 (44.5%) |
| 18 to 19 Year Olds | 27 (61.4%) | 17 (38.6%) |
| 20 to 24 Year Olds | 108 (92.3%) | 9 (7.7%) |
| 25 to 34 Year Olds | 40 (100.0%) | 0 (0.0%) |
| 35 Years and over | 21 (100.0%) | 0 (0.0%) |
| Total | 608 (68.5%) | 279 (31.5%) |
Educational Attainment by Field of Study in Prospect
Business (779 | 27.2%), science & technology (340 | 11.9%), bio, nature & agricultural (259 | 9.0%), education (244 | 8.5%), and social sciences (233 | 8.1%) are the most common fields of study among 2,862 individuals in Prospect who have obtained a bachelor's degree or higher.
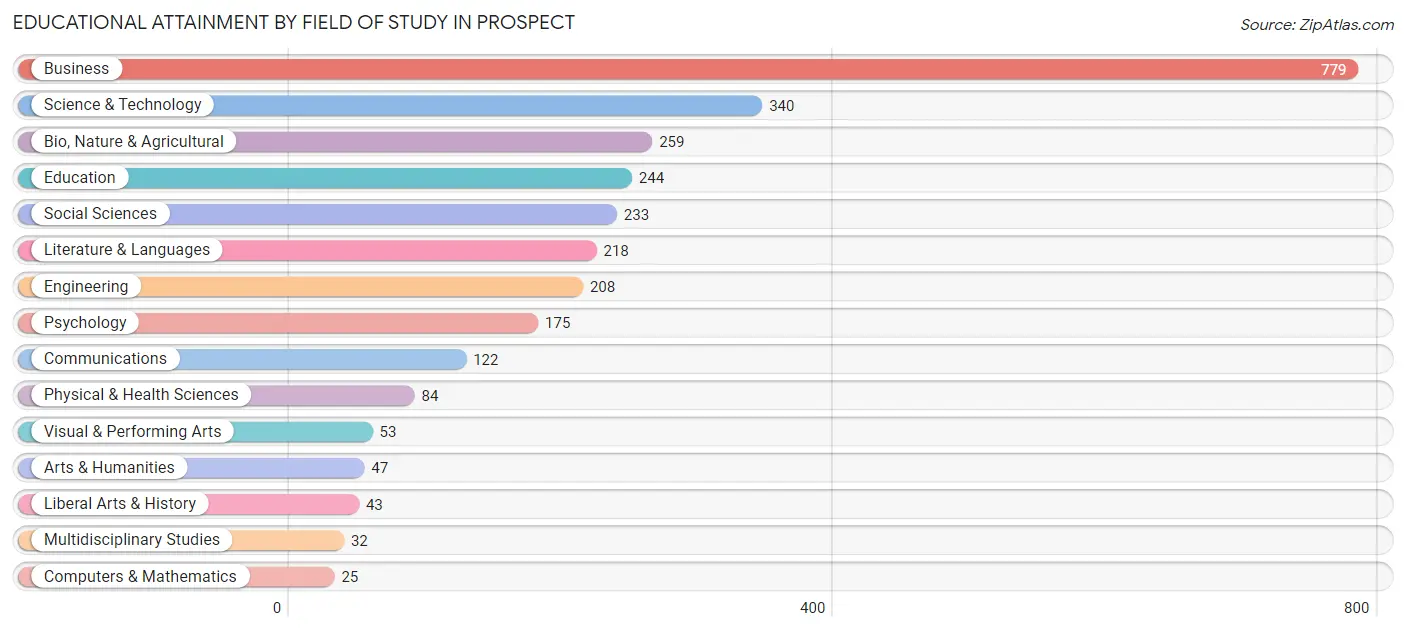
| Field of Study | # Graduates | % Graduates |
| Computers & Mathematics | 25 | 0.9% |
| Bio, Nature & Agricultural | 259 | 9.0% |
| Physical & Health Sciences | 84 | 2.9% |
| Psychology | 175 | 6.1% |
| Social Sciences | 233 | 8.1% |
| Engineering | 208 | 7.3% |
| Multidisciplinary Studies | 32 | 1.1% |
| Science & Technology | 340 | 11.9% |
| Business | 779 | 27.2% |
| Education | 244 | 8.5% |
| Literature & Languages | 218 | 7.6% |
| Liberal Arts & History | 43 | 1.5% |
| Visual & Performing Arts | 53 | 1.8% |
| Communications | 122 | 4.3% |
| Arts & Humanities | 47 | 1.6% |
| Total | 2,862 | 100.0% |
Transportation & Commute in Prospect
Vehicle Availability by Sex in Prospect
The most prevalent vehicle ownership categories in Prospect are males with 2 vehicles (718, accounting for 60.1%) and females with 2 vehicles (387, making up 81.1%).
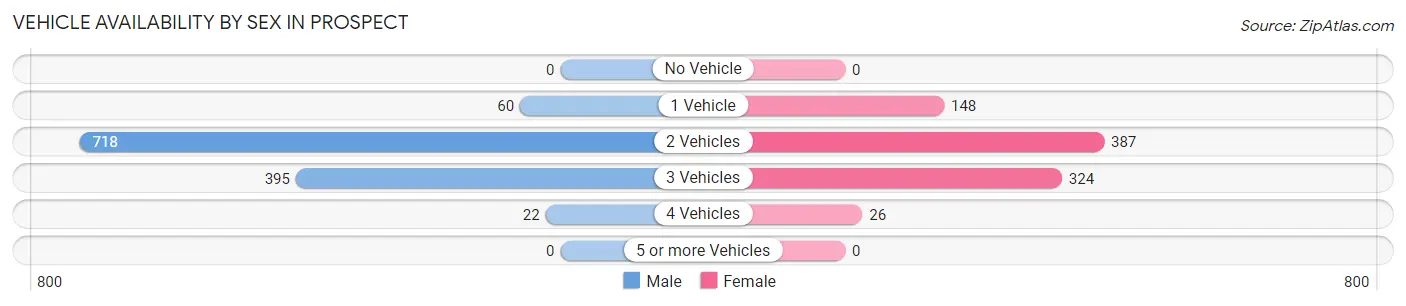
| Vehicles Available | Male | Female |
| No Vehicle | 0 (0.0%) | 0 (0.0%) |
| 1 Vehicle | 60 (5.0%) | 148 (16.7%) |
| 2 Vehicles | 718 (60.1%) | 387 (43.7%) |
| 3 Vehicles | 395 (33.1%) | 324 (36.6%) |
| 4 Vehicles | 22 (1.8%) | 26 (2.9%) |
| 5 or more Vehicles | 0 (0.0%) | 0 (0.0%) |
| Total | 1,195 (100.0%) | 885 (100.0%) |
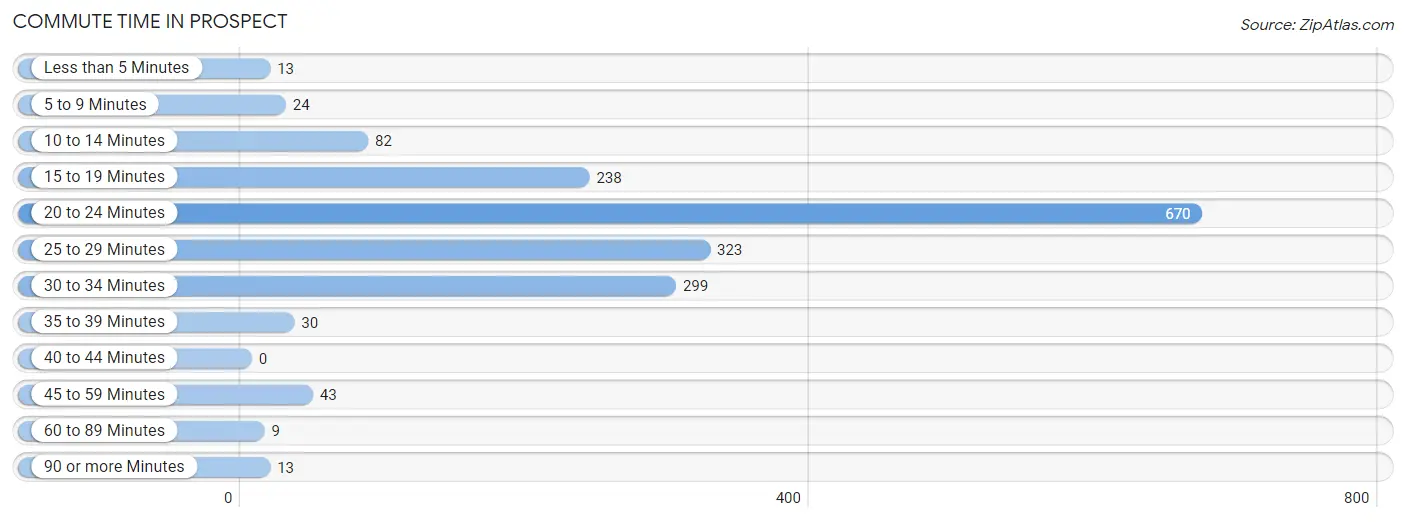
Commute Time in Prospect
The most frequently occuring commute durations in Prospect are 20 to 24 minutes (670 commuters, 38.4%), 25 to 29 minutes (323 commuters, 18.5%), and 30 to 34 minutes (299 commuters, 17.1%).
| Commute Time | # Commuters | % Commuters |
| Less than 5 Minutes | 13 | 0.7% |
| 5 to 9 Minutes | 24 | 1.4% |
| 10 to 14 Minutes | 82 | 4.7% |
| 15 to 19 Minutes | 238 | 13.7% |
| 20 to 24 Minutes | 670 | 38.4% |
| 25 to 29 Minutes | 323 | 18.5% |
| 30 to 34 Minutes | 299 | 17.1% |
| 35 to 39 Minutes | 30 | 1.7% |
| 40 to 44 Minutes | 0 | 0.0% |
| 45 to 59 Minutes | 43 | 2.5% |
| 60 to 89 Minutes | 9 | 0.5% |
| 90 or more Minutes | 13 | 0.7% |
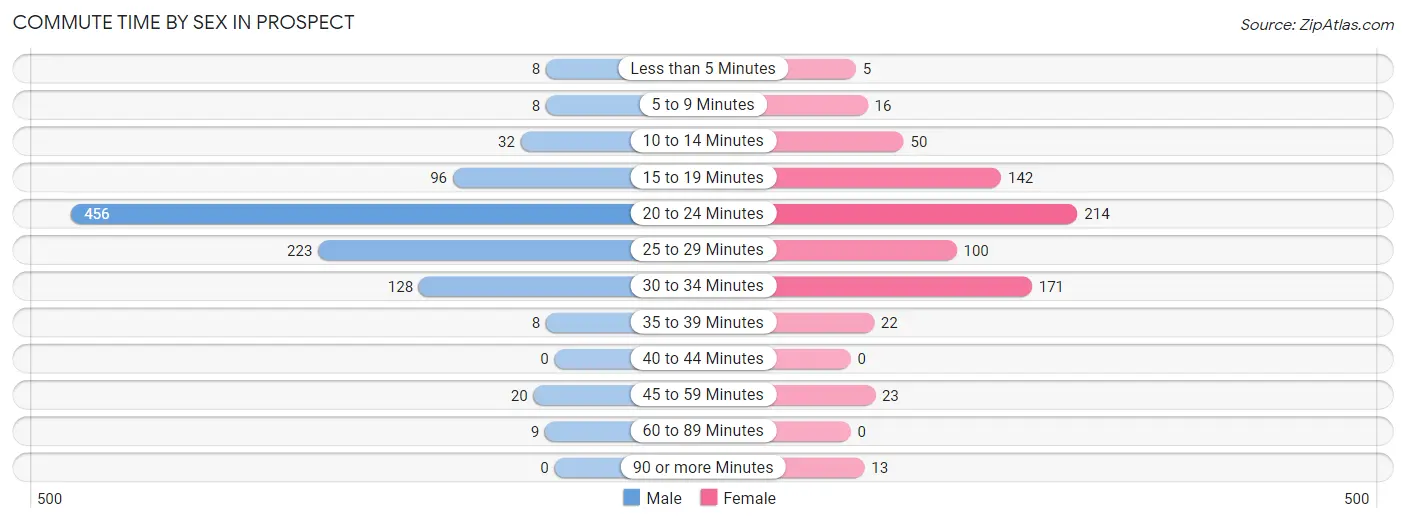
Commute Time by Sex in Prospect
The most common commute times in Prospect are 20 to 24 minutes (456 commuters, 46.2%) for males and 20 to 24 minutes (214 commuters, 28.3%) for females.
| Commute Time | Male | Female |
| Less than 5 Minutes | 8 (0.8%) | 5 (0.7%) |
| 5 to 9 Minutes | 8 (0.8%) | 16 (2.1%) |
| 10 to 14 Minutes | 32 (3.2%) | 50 (6.6%) |
| 15 to 19 Minutes | 96 (9.7%) | 142 (18.8%) |
| 20 to 24 Minutes | 456 (46.2%) | 214 (28.3%) |
| 25 to 29 Minutes | 223 (22.6%) | 100 (13.2%) |
| 30 to 34 Minutes | 128 (13.0%) | 171 (22.6%) |
| 35 to 39 Minutes | 8 (0.8%) | 22 (2.9%) |
| 40 to 44 Minutes | 0 (0.0%) | 0 (0.0%) |
| 45 to 59 Minutes | 20 (2.0%) | 23 (3.0%) |
| 60 to 89 Minutes | 9 (0.9%) | 0 (0.0%) |
| 90 or more Minutes | 0 (0.0%) | 13 (1.7%) |
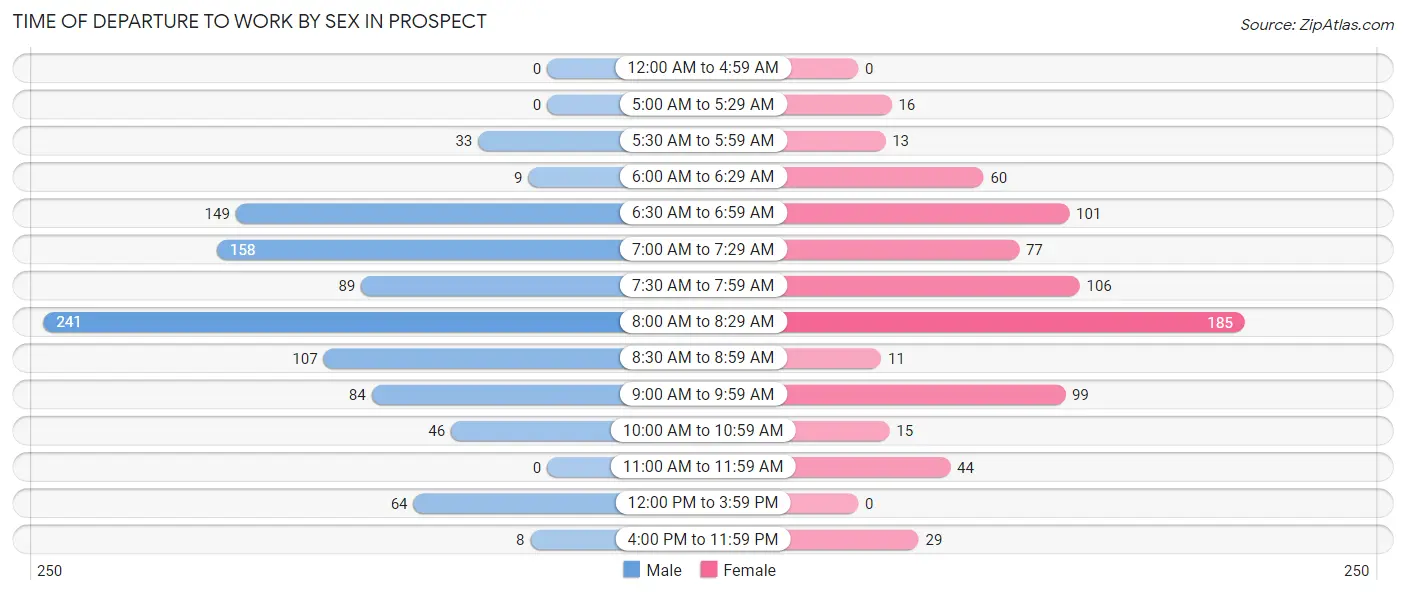
Time of Departure to Work by Sex in Prospect
The most frequent times of departure to work in Prospect are 8:00 AM to 8:29 AM (241, 24.4%) for males and 8:00 AM to 8:29 AM (185, 24.5%) for females.
| Time of Departure | Male | Female |
| 12:00 AM to 4:59 AM | 0 (0.0%) | 0 (0.0%) |
| 5:00 AM to 5:29 AM | 0 (0.0%) | 16 (2.1%) |
| 5:30 AM to 5:59 AM | 33 (3.3%) | 13 (1.7%) |
| 6:00 AM to 6:29 AM | 9 (0.9%) | 60 (7.9%) |
| 6:30 AM to 6:59 AM | 149 (15.1%) | 101 (13.4%) |
| 7:00 AM to 7:29 AM | 158 (16.0%) | 77 (10.2%) |
| 7:30 AM to 7:59 AM | 89 (9.0%) | 106 (14.0%) |
| 8:00 AM to 8:29 AM | 241 (24.4%) | 185 (24.5%) |
| 8:30 AM to 8:59 AM | 107 (10.8%) | 11 (1.5%) |
| 9:00 AM to 9:59 AM | 84 (8.5%) | 99 (13.1%) |
| 10:00 AM to 10:59 AM | 46 (4.7%) | 15 (2.0%) |
| 11:00 AM to 11:59 AM | 0 (0.0%) | 44 (5.8%) |
| 12:00 PM to 3:59 PM | 64 (6.5%) | 0 (0.0%) |
| 4:00 PM to 11:59 PM | 8 (0.8%) | 29 (3.8%) |
| Total | 988 (100.0%) | 756 (100.0%) |
Housing Occupancy in Prospect
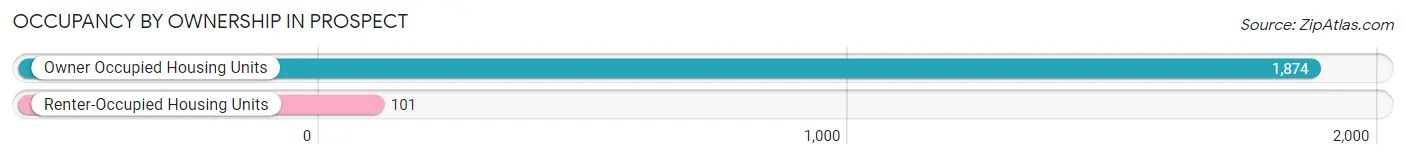
Occupancy by Ownership in Prospect
Of the total 1,975 dwellings in Prospect, owner-occupied units account for 1,874 (94.9%), while renter-occupied units make up 101 (5.1%).
| Occupancy | # Housing Units | % Housing Units |
| Owner Occupied Housing Units | 1,874 | 94.9% |
| Renter-Occupied Housing Units | 101 | 5.1% |
| Total Occupied Housing Units | 1,975 | 100.0% |
Occupancy by Household Size in Prospect
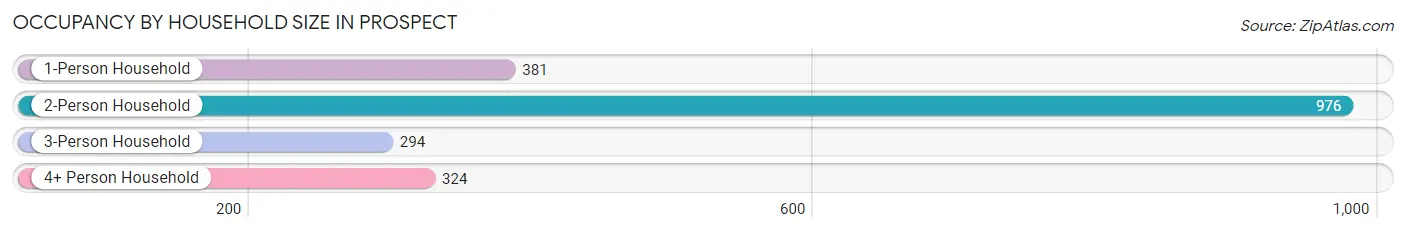
| Household Size | # Housing Units | % Housing Units |
| 1-Person Household | 381 | 19.3% |
| 2-Person Household | 976 | 49.4% |
| 3-Person Household | 294 | 14.9% |
| 4+ Person Household | 324 | 16.4% |
| Total Housing Units | 1,975 | 100.0% |
Occupancy by Ownership by Household Size in Prospect
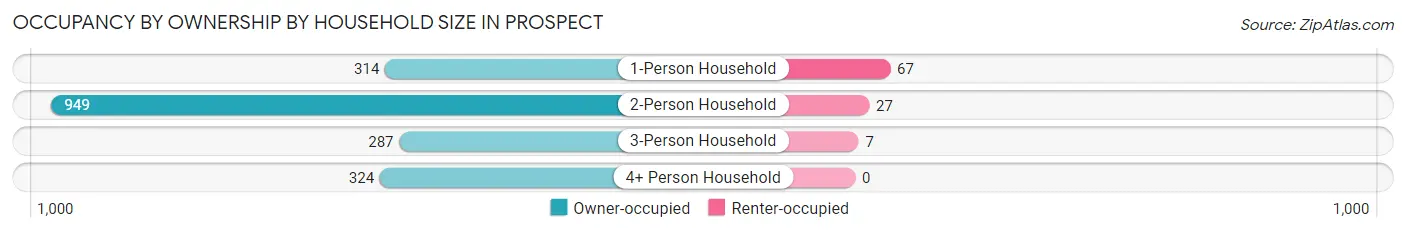
| Household Size | Owner-occupied | Renter-occupied |
| 1-Person Household | 314 (82.4%) | 67 (17.6%) |
| 2-Person Household | 949 (97.2%) | 27 (2.8%) |
| 3-Person Household | 287 (97.6%) | 7 (2.4%) |
| 4+ Person Household | 324 (100.0%) | 0 (0.0%) |
| Total Housing Units | 1,874 (94.9%) | 101 (5.1%) |
Occupancy by Educational Attainment in Prospect
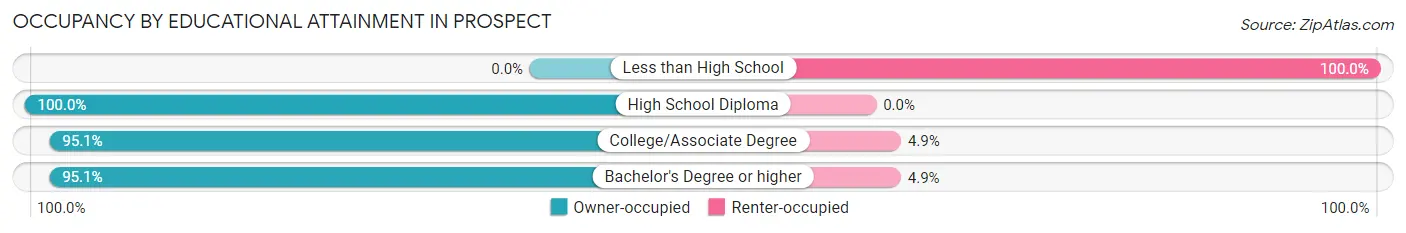
| Household Size | Owner-occupied | Renter-occupied |
| Less than High School | 0 (0.0%) | 8 (100.0%) |
| High School Diploma | 69 (100.0%) | 0 (0.0%) |
| College/Associate Degree | 425 (95.1%) | 22 (4.9%) |
| Bachelor's Degree or higher | 1,380 (95.1%) | 71 (4.9%) |
Occupancy by Age of Householder in Prospect
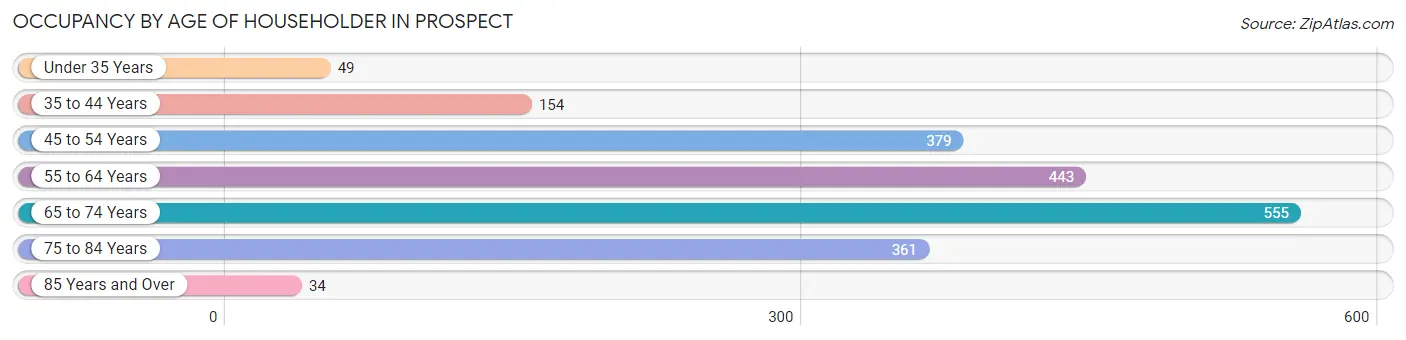
| Age Bracket | # Households | % Households |
| Under 35 Years | 49 | 2.5% |
| 35 to 44 Years | 154 | 7.8% |
| 45 to 54 Years | 379 | 19.2% |
| 55 to 64 Years | 443 | 22.4% |
| 65 to 74 Years | 555 | 28.1% |
| 75 to 84 Years | 361 | 18.3% |
| 85 Years and Over | 34 | 1.7% |
| Total | 1,975 | 100.0% |
Housing Finances in Prospect
Median Income by Occupancy in Prospect
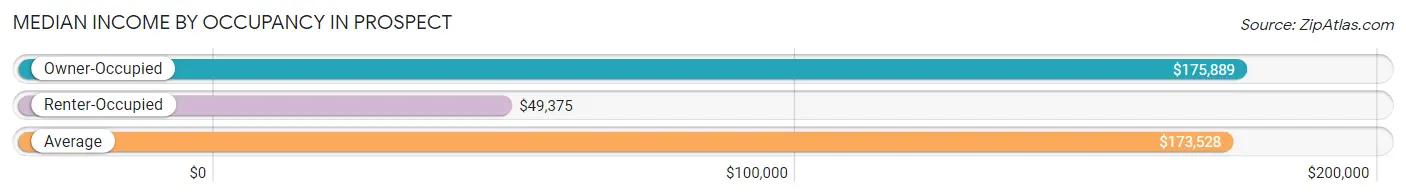
| Occupancy Type | # Households | Median Income |
| Owner-Occupied | 1,874 (94.9%) | $175,889 |
| Renter-Occupied | 101 (5.1%) | $49,375 |
| Average | 1,975 (100.0%) | $173,528 |
Occupancy by Householder Income Bracket in Prospect
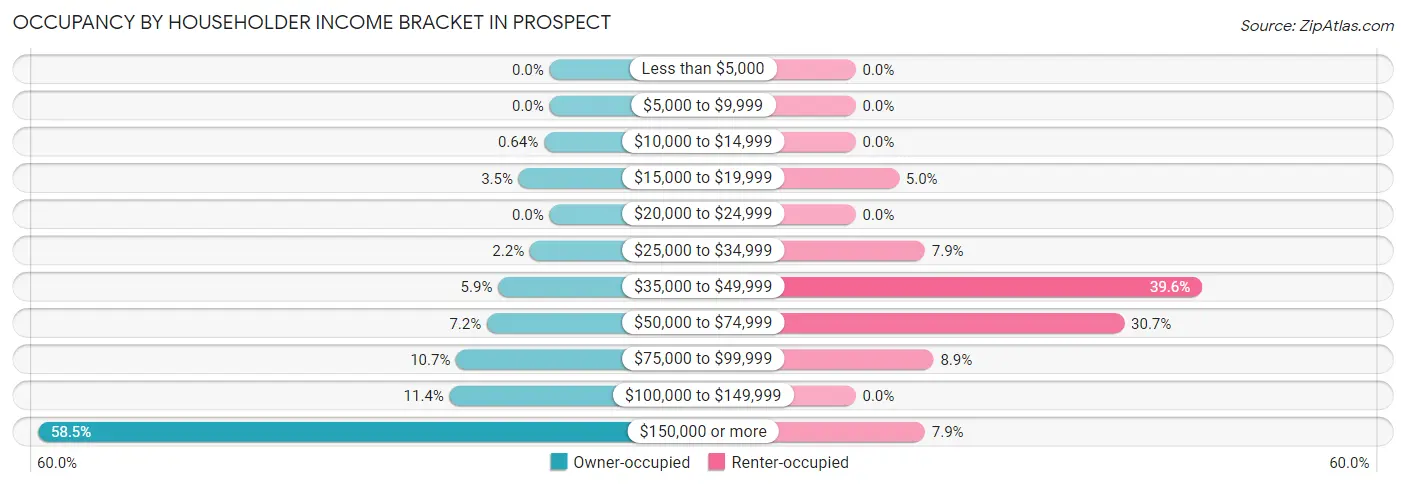
| Income Bracket | Owner-occupied | Renter-occupied |
| Less than $5,000 | 0 (0.0%) | 0 (0.0%) |
| $5,000 to $9,999 | 0 (0.0%) | 0 (0.0%) |
| $10,000 to $14,999 | 12 (0.6%) | 0 (0.0%) |
| $15,000 to $19,999 | 66 (3.5%) | 5 (5.0%) |
| $20,000 to $24,999 | 0 (0.0%) | 0 (0.0%) |
| $25,000 to $34,999 | 42 (2.2%) | 8 (7.9%) |
| $35,000 to $49,999 | 110 (5.9%) | 40 (39.6%) |
| $50,000 to $74,999 | 134 (7.1%) | 31 (30.7%) |
| $75,000 to $99,999 | 200 (10.7%) | 9 (8.9%) |
| $100,000 to $149,999 | 214 (11.4%) | 0 (0.0%) |
| $150,000 or more | 1,096 (58.5%) | 8 (7.9%) |
| Total | 1,874 (100.0%) | 101 (100.0%) |
Monthly Housing Cost Tiers in Prospect
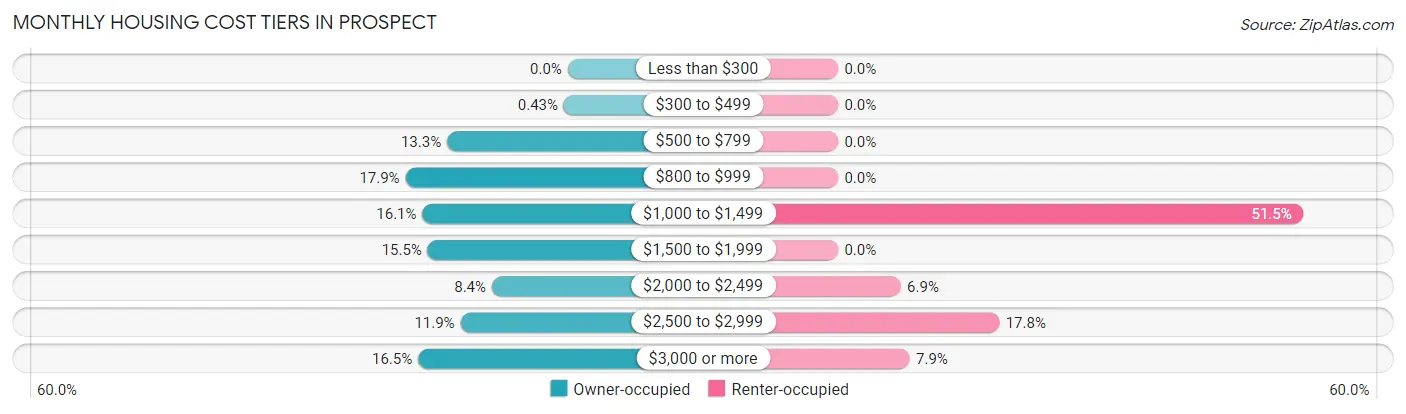
| Monthly Cost | Owner-occupied | Renter-occupied |
| Less than $300 | 0 (0.0%) | 0 (0.0%) |
| $300 to $499 | 8 (0.4%) | 0 (0.0%) |
| $500 to $799 | 250 (13.3%) | 0 (0.0%) |
| $800 to $999 | 336 (17.9%) | 0 (0.0%) |
| $1,000 to $1,499 | 301 (16.1%) | 52 (51.5%) |
| $1,500 to $1,999 | 290 (15.5%) | 0 (0.0%) |
| $2,000 to $2,499 | 157 (8.4%) | 7 (6.9%) |
| $2,500 to $2,999 | 222 (11.8%) | 18 (17.8%) |
| $3,000 or more | 310 (16.5%) | 8 (7.9%) |
| Total | 1,874 (100.0%) | 101 (100.0%) |
Physical Housing Characteristics in Prospect
Housing Structures in Prospect
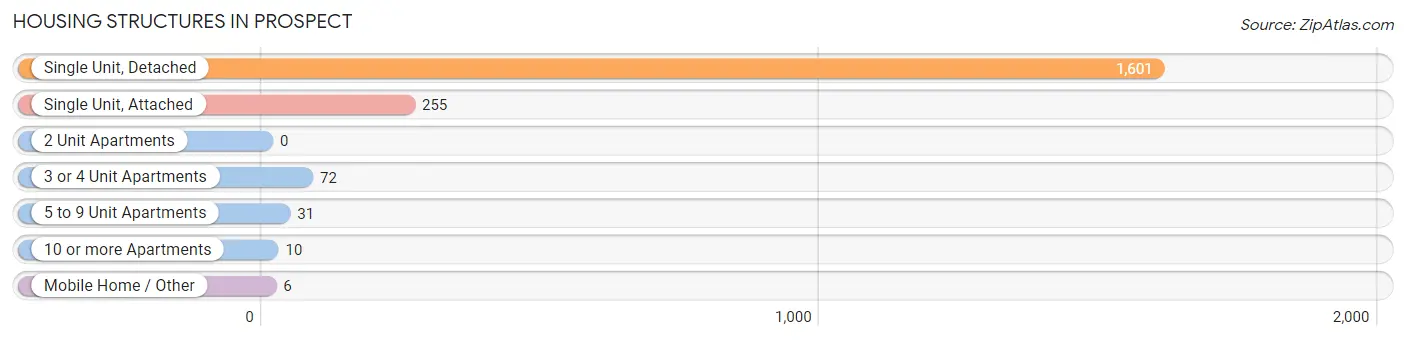
| Structure Type | # Housing Units | % Housing Units |
| Single Unit, Detached | 1,601 | 81.1% |
| Single Unit, Attached | 255 | 12.9% |
| 2 Unit Apartments | 0 | 0.0% |
| 3 or 4 Unit Apartments | 72 | 3.6% |
| 5 to 9 Unit Apartments | 31 | 1.6% |
| 10 or more Apartments | 10 | 0.5% |
| Mobile Home / Other | 6 | 0.3% |
| Total | 1,975 | 100.0% |
Housing Structures by Occupancy in Prospect
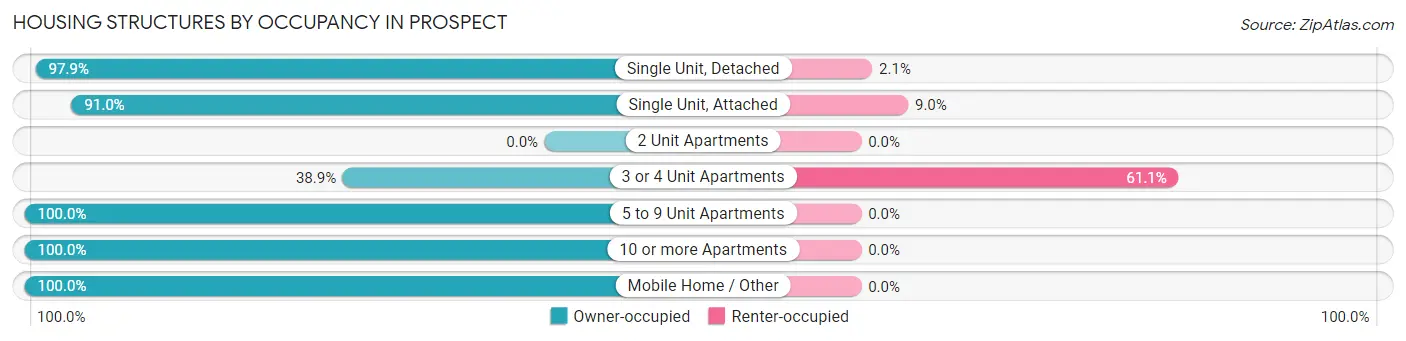
| Structure Type | Owner-occupied | Renter-occupied |
| Single Unit, Detached | 1,567 (97.9%) | 34 (2.1%) |
| Single Unit, Attached | 232 (91.0%) | 23 (9.0%) |
| 2 Unit Apartments | 0 (0.0%) | 0 (0.0%) |
| 3 or 4 Unit Apartments | 28 (38.9%) | 44 (61.1%) |
| 5 to 9 Unit Apartments | 31 (100.0%) | 0 (0.0%) |
| 10 or more Apartments | 10 (100.0%) | 0 (0.0%) |
| Mobile Home / Other | 6 (100.0%) | 0 (0.0%) |
| Total | 1,874 (94.9%) | 101 (5.1%) |
Housing Structures by Number of Rooms in Prospect
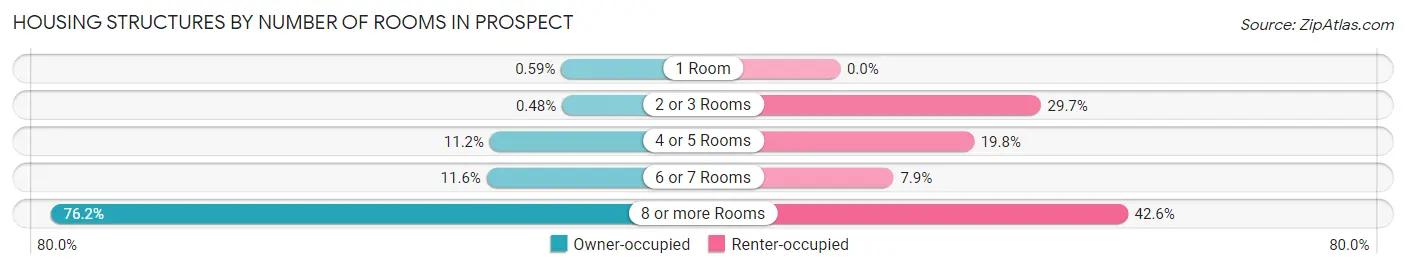
| Number of Rooms | Owner-occupied | Renter-occupied |
| 1 Room | 11 (0.6%) | 0 (0.0%) |
| 2 or 3 Rooms | 9 (0.5%) | 30 (29.7%) |
| 4 or 5 Rooms | 209 (11.2%) | 20 (19.8%) |
| 6 or 7 Rooms | 218 (11.6%) | 8 (7.9%) |
| 8 or more Rooms | 1,427 (76.1%) | 43 (42.6%) |
| Total | 1,874 (100.0%) | 101 (100.0%) |
Housing Structure by Heating Type in Prospect
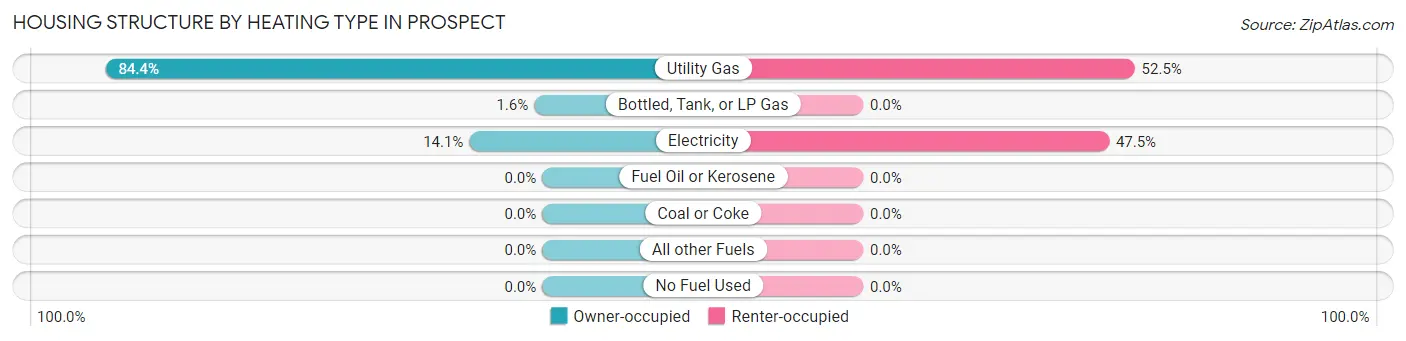
| Heating Type | Owner-occupied | Renter-occupied |
| Utility Gas | 1,581 (84.4%) | 53 (52.5%) |
| Bottled, Tank, or LP Gas | 29 (1.5%) | 0 (0.0%) |
| Electricity | 264 (14.1%) | 48 (47.5%) |
| Fuel Oil or Kerosene | 0 (0.0%) | 0 (0.0%) |
| Coal or Coke | 0 (0.0%) | 0 (0.0%) |
| All other Fuels | 0 (0.0%) | 0 (0.0%) |
| No Fuel Used | 0 (0.0%) | 0 (0.0%) |
| Total | 1,874 (100.0%) | 101 (100.0%) |
Household Vehicle Usage in Prospect
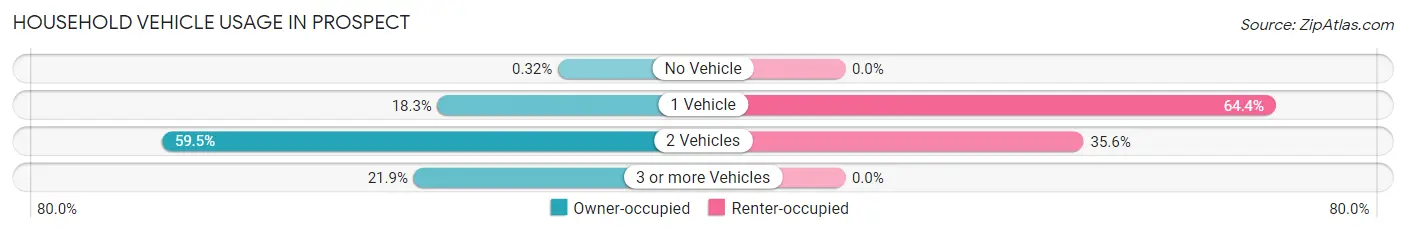
| Vehicles per Household | Owner-occupied | Renter-occupied |
| No Vehicle | 6 (0.3%) | 0 (0.0%) |
| 1 Vehicle | 343 (18.3%) | 65 (64.4%) |
| 2 Vehicles | 1,115 (59.5%) | 36 (35.6%) |
| 3 or more Vehicles | 410 (21.9%) | 0 (0.0%) |
| Total | 1,874 (100.0%) | 101 (100.0%) |
Real Estate & Mortgages in Prospect
Real Estate and Mortgage Overview in Prospect
| Characteristic | Without Mortgage | With Mortgage |
| Housing Units | 889 | 985 |
| Median Property Value | $478,200 | $465,100 |
| Median Household Income | $176,583 | $584 |
| Monthly Housing Costs | $953 | $310 |
| Real Estate Taxes | $4,416 | $0 |
Property Value by Mortgage Status in Prospect
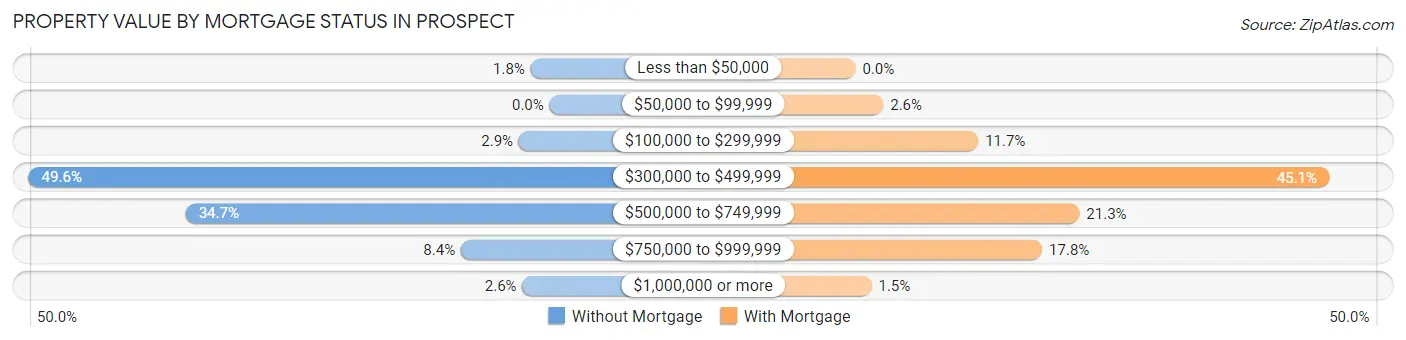
| Property Value | Without Mortgage | With Mortgage |
| Less than $50,000 | 16 (1.8%) | 0 (0.0%) |
| $50,000 to $99,999 | 0 (0.0%) | 26 (2.6%) |
| $100,000 to $299,999 | 26 (2.9%) | 115 (11.7%) |
| $300,000 to $499,999 | 441 (49.6%) | 444 (45.1%) |
| $500,000 to $749,999 | 308 (34.6%) | 210 (21.3%) |
| $750,000 to $999,999 | 75 (8.4%) | 175 (17.8%) |
| $1,000,000 or more | 23 (2.6%) | 15 (1.5%) |
| Total | 889 (100.0%) | 985 (100.0%) |
Household Income by Mortgage Status in Prospect
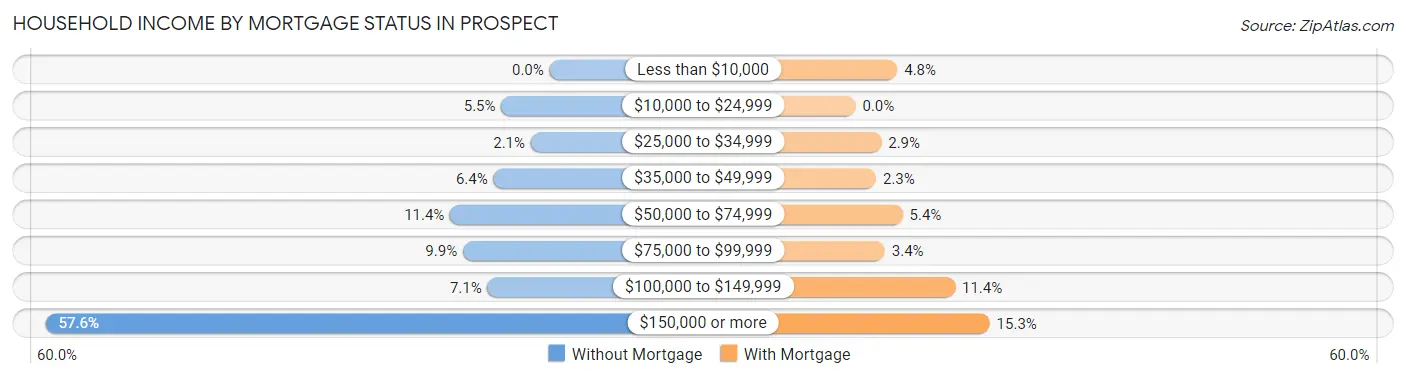
| Household Income | Without Mortgage | With Mortgage |
| Less than $10,000 | 0 (0.0%) | 47 (4.8%) |
| $10,000 to $24,999 | 49 (5.5%) | 0 (0.0%) |
| $25,000 to $34,999 | 19 (2.1%) | 29 (2.9%) |
| $35,000 to $49,999 | 57 (6.4%) | 23 (2.3%) |
| $50,000 to $74,999 | 101 (11.4%) | 53 (5.4%) |
| $75,000 to $99,999 | 88 (9.9%) | 33 (3.4%) |
| $100,000 to $149,999 | 63 (7.1%) | 112 (11.4%) |
| $150,000 or more | 512 (57.6%) | 151 (15.3%) |
| Total | 889 (100.0%) | 985 (100.0%) |
Property Value to Household Income Ratio in Prospect
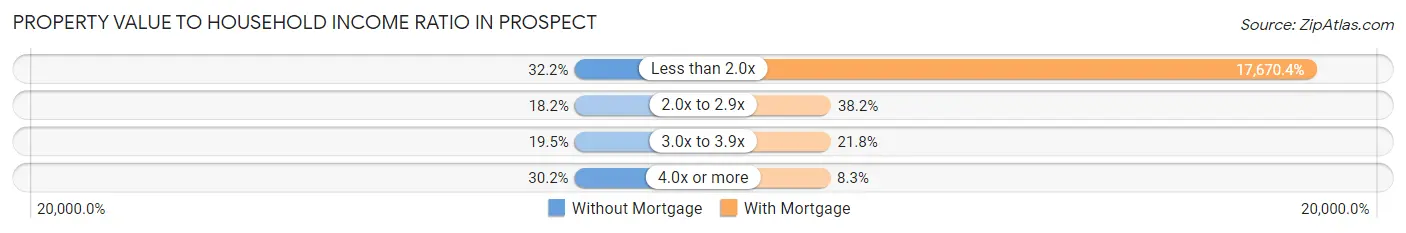
| Value-to-Income Ratio | Without Mortgage | With Mortgage |
| Less than 2.0x | 286 (32.2%) | 174,053 (17,670.4%) |
| 2.0x to 2.9x | 162 (18.2%) | 376 (38.2%) |
| 3.0x to 3.9x | 173 (19.5%) | 215 (21.8%) |
| 4.0x or more | 268 (30.1%) | 82 (8.3%) |
| Total | 889 (100.0%) | 985 (100.0%) |
Real Estate Taxes by Mortgage Status in Prospect
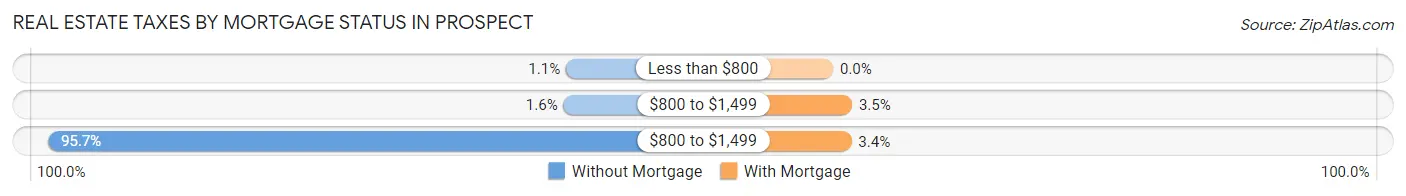
| Property Taxes | Without Mortgage | With Mortgage |
| Less than $800 | 10 (1.1%) | 0 (0.0%) |
| $800 to $1,499 | 14 (1.6%) | 34 (3.5%) |
| $800 to $1,499 | 851 (95.7%) | 33 (3.4%) |
| Total | 889 (100.0%) | 985 (100.0%) |
Health & Disability in Prospect
Health Insurance Coverage by Age in Prospect
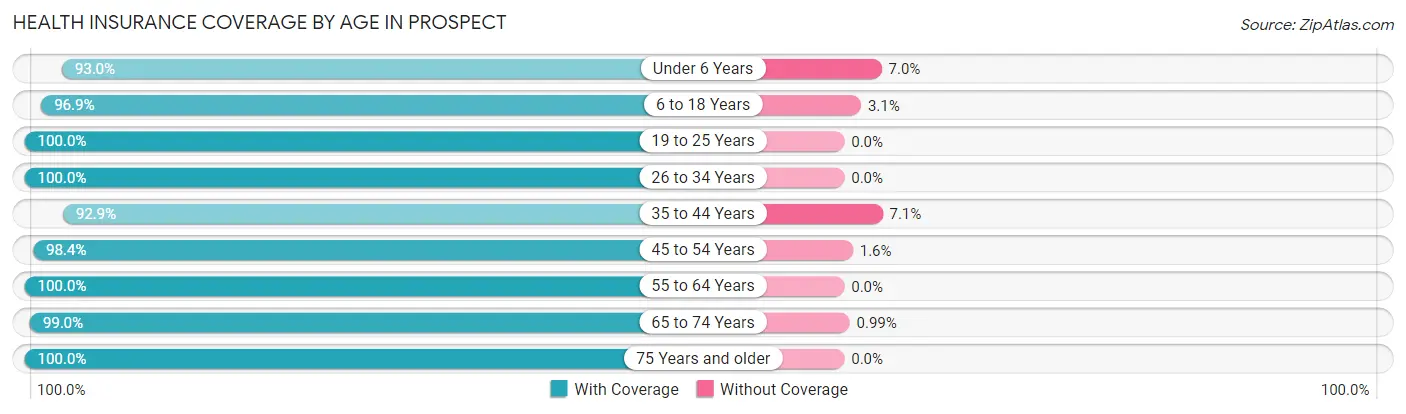
| Age Bracket | With Coverage | Without Coverage |
| Under 6 Years | 147 (93.0%) | 11 (7.0%) |
| 6 to 18 Years | 592 (96.9%) | 19 (3.1%) |
| 19 to 25 Years | 233 (100.0%) | 0 (0.0%) |
| 26 to 34 Years | 105 (100.0%) | 0 (0.0%) |
| 35 to 44 Years | 391 (92.9%) | 30 (7.1%) |
| 45 to 54 Years | 624 (98.4%) | 10 (1.6%) |
| 55 to 64 Years | 831 (100.0%) | 0 (0.0%) |
| 65 to 74 Years | 901 (99.0%) | 9 (1.0%) |
| 75 Years and older | 721 (100.0%) | 0 (0.0%) |
| Total | 4,545 (98.3%) | 79 (1.7%) |
Health Insurance Coverage by Citizenship Status in Prospect
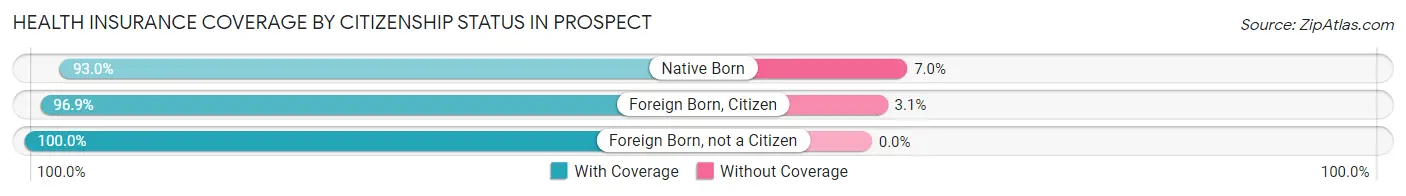
| Citizenship Status | With Coverage | Without Coverage |
| Native Born | 147 (93.0%) | 11 (7.0%) |
| Foreign Born, Citizen | 592 (96.9%) | 19 (3.1%) |
| Foreign Born, not a Citizen | 233 (100.0%) | 0 (0.0%) |
Health Insurance Coverage by Household Income in Prospect
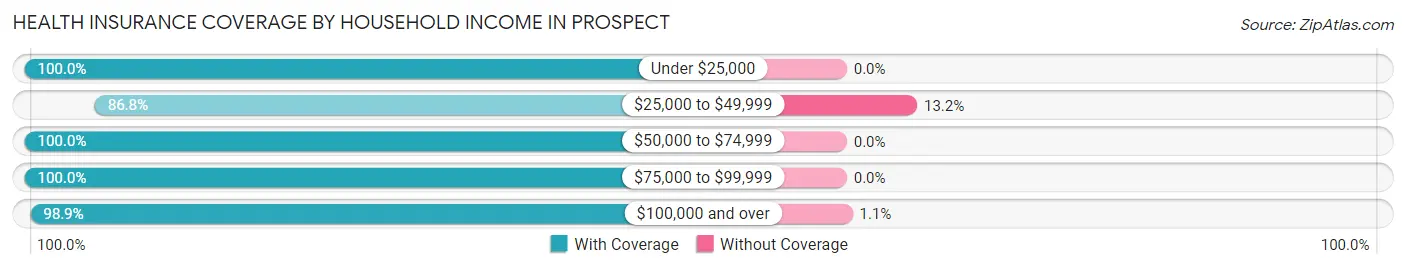
| Household Income | With Coverage | Without Coverage |
| Under $25,000 | 115 (100.0%) | 0 (0.0%) |
| $25,000 to $49,999 | 264 (86.8%) | 40 (13.2%) |
| $50,000 to $74,999 | 275 (100.0%) | 0 (0.0%) |
| $75,000 to $99,999 | 314 (100.0%) | 0 (0.0%) |
| $100,000 and over | 3,577 (98.9%) | 39 (1.1%) |
Public vs Private Health Insurance Coverage by Age in Prospect
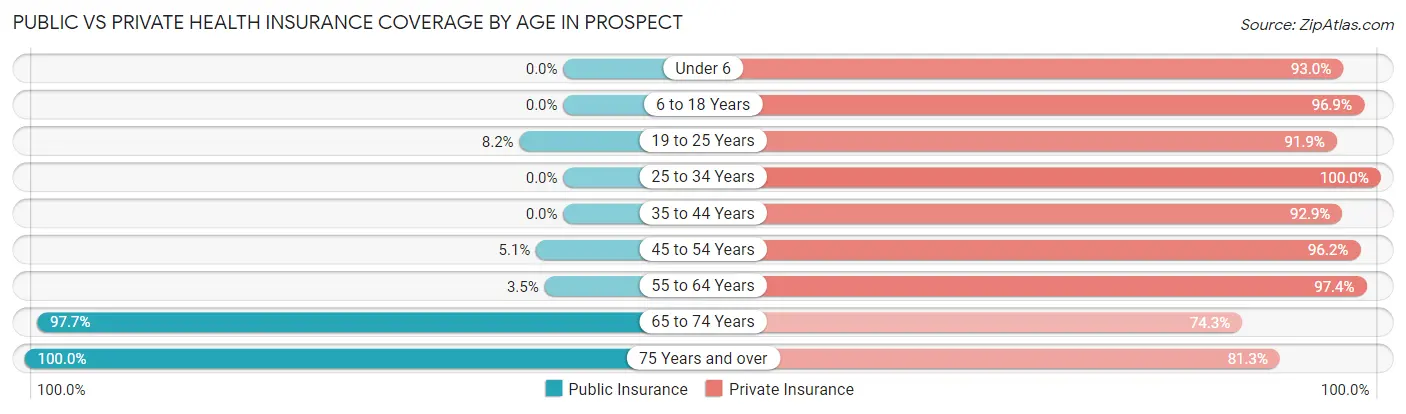
| Age Bracket | Public Insurance | Private Insurance |
| Under 6 | 0 (0.0%) | 147 (93.0%) |
| 6 to 18 Years | 0 (0.0%) | 592 (96.9%) |
| 19 to 25 Years | 19 (8.2%) | 214 (91.8%) |
| 25 to 34 Years | 0 (0.0%) | 105 (100.0%) |
| 35 to 44 Years | 0 (0.0%) | 391 (92.9%) |
| 45 to 54 Years | 32 (5.1%) | 610 (96.2%) |
| 55 to 64 Years | 29 (3.5%) | 809 (97.4%) |
| 65 to 74 Years | 889 (97.7%) | 676 (74.3%) |
| 75 Years and over | 721 (100.0%) | 586 (81.3%) |
| Total | 1,690 (36.5%) | 4,130 (89.3%) |
Disability Status by Sex by Age in Prospect
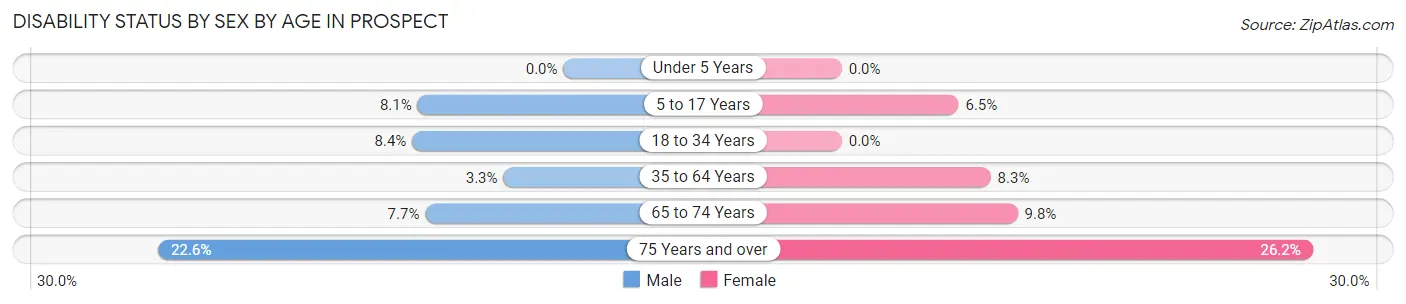
| Age Bracket | Male | Female |
| Under 5 Years | 0 (0.0%) | 0 (0.0%) |
| 5 to 17 Years | 25 (8.1%) | 18 (6.5%) |
| 18 to 34 Years | 16 (8.4%) | 0 (0.0%) |
| 35 to 64 Years | 30 (3.3%) | 82 (8.3%) |
| 65 to 74 Years | 26 (7.7%) | 56 (9.8%) |
| 75 Years and over | 93 (22.6%) | 81 (26.2%) |
Disability Class by Sex by Age in Prospect
Disability Class: Hearing Difficulty
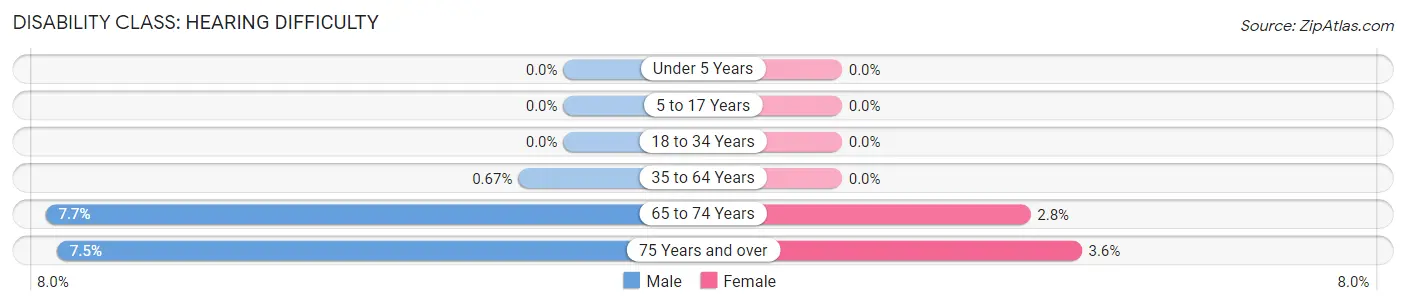
| Age Bracket | Male | Female |
| Under 5 Years | 0 (0.0%) | 0 (0.0%) |
| 5 to 17 Years | 0 (0.0%) | 0 (0.0%) |
| 18 to 34 Years | 0 (0.0%) | 0 (0.0%) |
| 35 to 64 Years | 6 (0.7%) | 0 (0.0%) |
| 65 to 74 Years | 26 (7.7%) | 16 (2.8%) |
| 75 Years and over | 31 (7.5%) | 11 (3.6%) |
Disability Class: Vision Difficulty
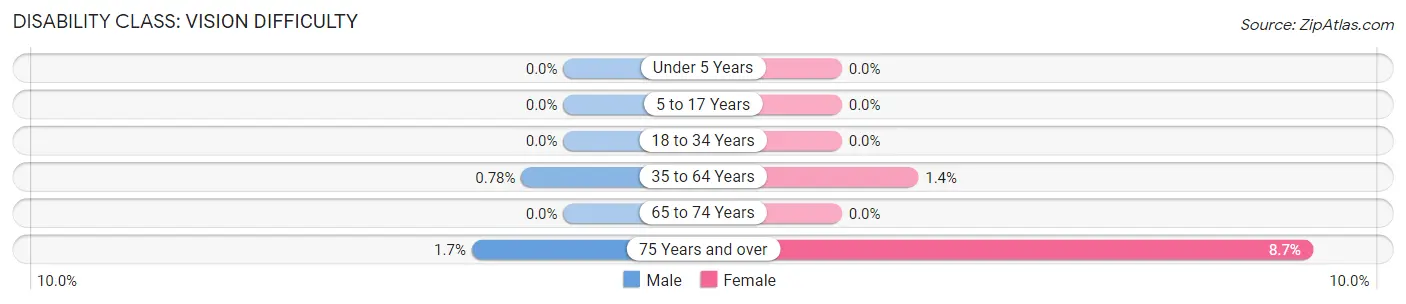
| Age Bracket | Male | Female |
| Under 5 Years | 0 (0.0%) | 0 (0.0%) |
| 5 to 17 Years | 0 (0.0%) | 0 (0.0%) |
| 18 to 34 Years | 0 (0.0%) | 0 (0.0%) |
| 35 to 64 Years | 7 (0.8%) | 14 (1.4%) |
| 65 to 74 Years | 0 (0.0%) | 0 (0.0%) |
| 75 Years and over | 7 (1.7%) | 27 (8.7%) |
Disability Class: Cognitive Difficulty
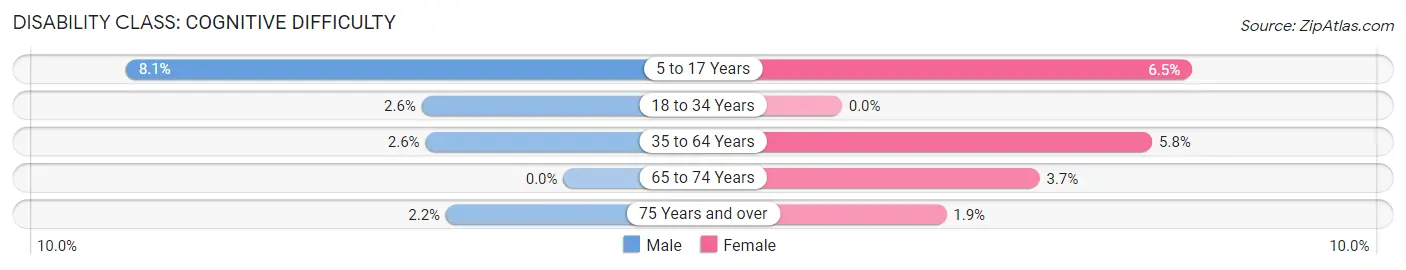
| Age Bracket | Male | Female |
| 5 to 17 Years | 25 (8.1%) | 18 (6.5%) |
| 18 to 34 Years | 5 (2.6%) | 0 (0.0%) |
| 35 to 64 Years | 23 (2.6%) | 57 (5.8%) |
| 65 to 74 Years | 0 (0.0%) | 21 (3.7%) |
| 75 Years and over | 9 (2.2%) | 6 (1.9%) |
Disability Class: Ambulatory Difficulty
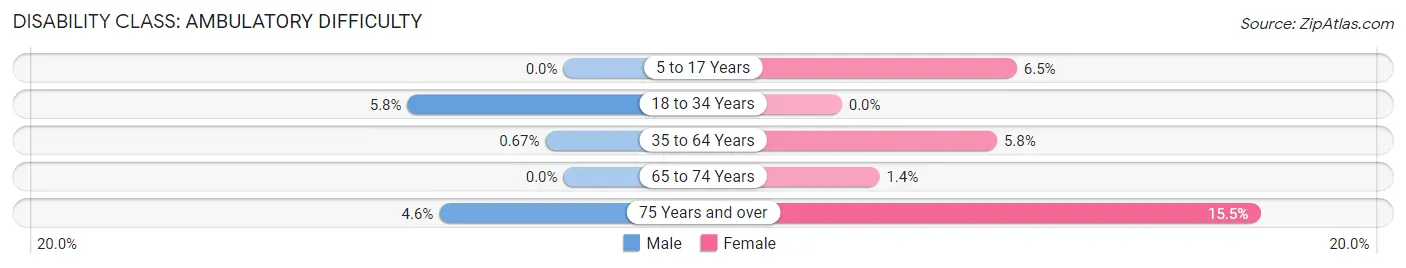
| Age Bracket | Male | Female |
| 5 to 17 Years | 0 (0.0%) | 18 (6.5%) |
| 18 to 34 Years | 11 (5.8%) | 0 (0.0%) |
| 35 to 64 Years | 6 (0.7%) | 57 (5.8%) |
| 65 to 74 Years | 0 (0.0%) | 8 (1.4%) |
| 75 Years and over | 19 (4.6%) | 48 (15.5%) |
Disability Class: Self-Care Difficulty
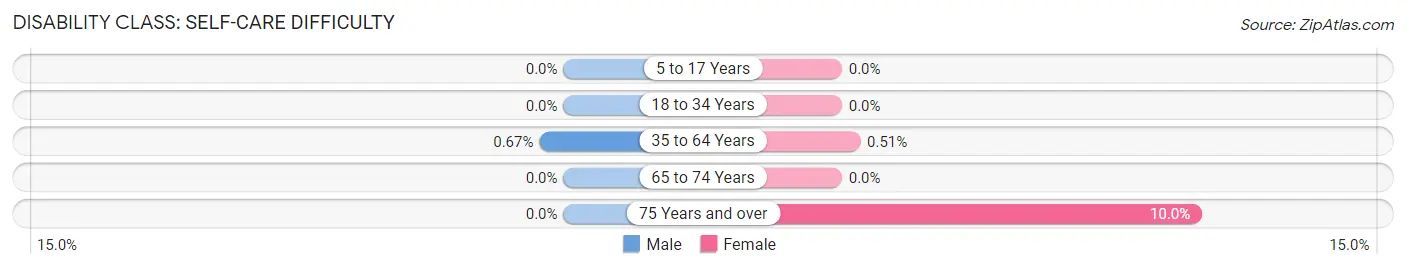
| Age Bracket | Male | Female |
| 5 to 17 Years | 0 (0.0%) | 0 (0.0%) |
| 18 to 34 Years | 0 (0.0%) | 0 (0.0%) |
| 35 to 64 Years | 6 (0.7%) | 5 (0.5%) |
| 65 to 74 Years | 0 (0.0%) | 0 (0.0%) |
| 75 Years and over | 0 (0.0%) | 31 (10.0%) |
Technology Access in Prospect
Computing Device Access in Prospect
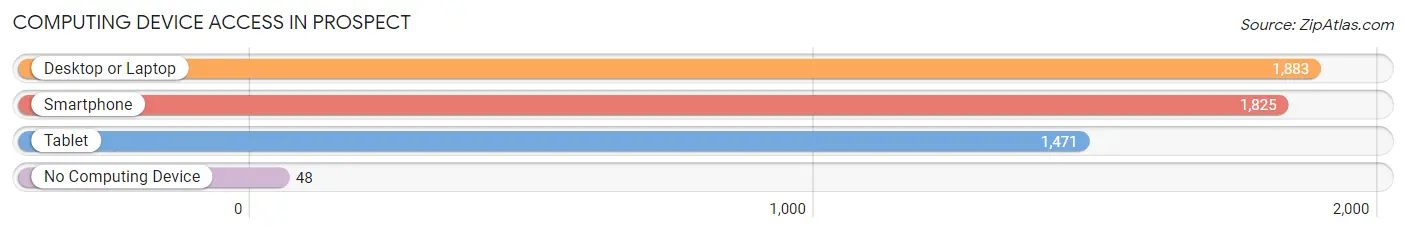
| Device Type | # Households | % Households |
| Desktop or Laptop | 1,883 | 95.3% |
| Smartphone | 1,825 | 92.4% |
| Tablet | 1,471 | 74.5% |
| No Computing Device | 48 | 2.4% |
| Total | 1,975 | 100.0% |
Internet Access in Prospect
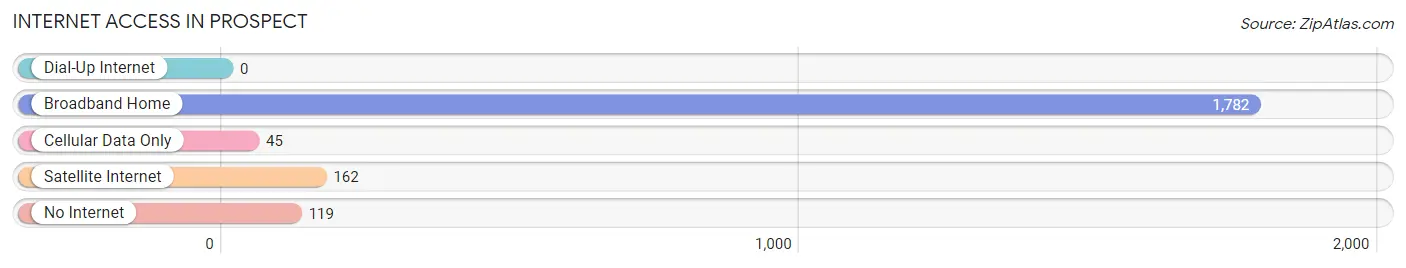
| Internet Type | # Households | % Households |
| Dial-Up Internet | 0 | 0.0% |
| Broadband Home | 1,782 | 90.2% |
| Cellular Data Only | 45 | 2.3% |
| Satellite Internet | 162 | 8.2% |
| No Internet | 119 | 6.0% |
| Total | 1,975 | 100.0% |
Prospect Summary
Prospect, Kentucky is a small city located in Jefferson County, Kentucky. It is situated on the Ohio River, just north of Louisville. The city has a population of approximately 8,000 people and is part of the Louisville metropolitan area.
History
Prospect was first settled in the early 1800s by a group of German immigrants. The town was originally known as “German Town” and was later renamed Prospect. The name was chosen to reflect the town’s location on the Ohio River, which offered a “prospect” of a better life for the settlers.
In the late 1800s, Prospect became a popular summer resort for wealthy Louisville residents. The town was known for its beautiful views of the Ohio River and its many recreational activities.
In the early 1900s, Prospect began to experience rapid growth. The city was incorporated in 1912 and the population grew to over 1,000 by the 1920s.
Geography
Prospect is located in Jefferson County, Kentucky. It is situated on the Ohio River, just north of Louisville. The city has a total area of 4.2 square miles, all of which is land.
The city is located in a hilly region of Kentucky and is surrounded by rolling hills and forests. The Ohio River forms the western border of the city.
Economy
The economy of Prospect is largely based on tourism and manufacturing. The city is home to several manufacturing plants, including a paper mill and a steel mill.
The city also has a thriving tourism industry. Prospect is home to several popular attractions, including the Prospect Historic District, the Prospect Riverwalk, and the Prospect Marina.
Demographics
As of the 2010 census, the population of Prospect was 8,000. The racial makeup of the city was 94.3% White, 2.2% African American, 0.3% Native American, 0.7% Asian, 0.1% Pacific Islander, and 2.4% from other races.
The median household income in Prospect was $50,000, and the median family income was $60,000. The per capita income was $25,000.
Conclusion
Prospect, Kentucky is a small city located in Jefferson County, Kentucky. It is situated on the Ohio River, just north of Louisville. The city has a population of approximately 8,000 people and is part of the Louisville metropolitan area. The economy of Prospect is largely based on tourism and manufacturing, and the city is home to several popular attractions. The population of Prospect is largely white, with a median household income of $50,000 and a median family income of $60,000.
Common Questions
What is Per Capita Income in Prospect?
Per Capita income in Prospect is $97,617.
What is the Median Family Income in Prospect?
Median Family Income in Prospect is $199,811.
What is the Median Household income in Prospect?
Median Household Income in Prospect is $173,528.
What is Income or Wage Gap in Prospect?
Income or Wage Gap in Prospect is 54.8%.
Women in Prospect earn 45.2 cents for every dollar earned by a man.
What is Inequality or Gini Index in Prospect?
Inequality or Gini Index in Prospect is 0.46.
What is the Total Population of Prospect?
Total Population of Prospect is 4,624.
What is the Total Male Population of Prospect?
Total Male Population of Prospect is 2,215.
What is the Total Female Population of Prospect?
Total Female Population of Prospect is 2,409.
What is the Ratio of Males per 100 Females in Prospect?
There are 91.95 Males per 100 Females in Prospect.
What is the Ratio of Females per 100 Males in Prospect?
There are 108.76 Females per 100 Males in Prospect.
What is the Median Population Age in Prospect?
Median Population Age in Prospect is 56.2 Years.
What is the Average Family Size in Prospect
Average Family Size in Prospect is 2.7 People.
What is the Average Household Size in Prospect
Average Household Size in Prospect is 2.3 People.
How Large is the Labor Force in Prospect?
There are 2,267 People in the Labor Forcein in Prospect.
What is the Percentage of People in the Labor Force in Prospect?
57.1% of People are in the Labor Force in Prospect.
What is the Unemployment Rate in Prospect?
Unemployment Rate in Prospect is 4.7%.