Perryville, KY Map & Demographics
Perryville Map
Perryville Overview
$30,663
PER CAPITA INCOME
$59,316
AVG FAMILY INCOME
$58,634
AVG HOUSEHOLD INCOME
1.2%
WAGE / INCOME GAP [ % ]
98.8¢/ $1
WAGE / INCOME GAP [ $ ]
$10,989
FAMILY INCOME DEFICIT
0.36
INEQUALITY / GINI INDEX
817
TOTAL POPULATION
355
MALE POPULATION
462
FEMALE POPULATION
76.84
MALES / 100 FEMALES
130.14
FEMALES / 100 MALES
42.5
MEDIAN AGE
2.5
AVG FAMILY SIZE
2.1
AVG HOUSEHOLD SIZE
394
LABOR FORCE [ PEOPLE ]
59.8%
PERCENT IN LABOR FORCE
0.8%
UNEMPLOYMENT RATE
Perryville Zip Codes
Perryville Area Codes
Income in Perryville
Income Overview in Perryville
Per Capita Income in Perryville is $30,663, while median incomes of families and households are $59,316 and $58,634 respectively.
| Characteristic | Number | Measure |
| Per Capita Income | 817 | $30,663 |
| Median Family Income | 266 | $59,316 |
| Mean Family Income | 266 | $77,094 |
| Median Household Income | 396 | $58,634 |
| Mean Household Income | 396 | $66,453 |
| Income Deficit | 266 | $10,989 |
| Wage / Income Gap (%) | 817 | 1.22% |
| Wage / Income Gap ($) | 817 | 98.78¢ per $1 |
| Gini / Inequality Index | 817 | 0.36 |
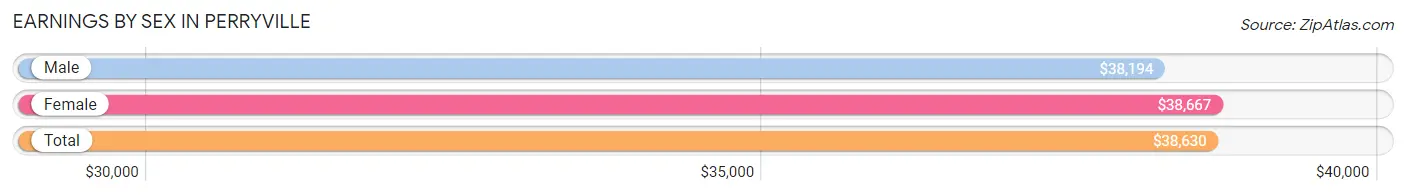
Earnings by Sex in Perryville
Average Earnings in Perryville are $38,630, $38,194 for men and $38,667 for women, a difference of 1.2%.
| Sex | Number | Average Earnings |
| Male | 195 (46.0%) | $38,194 |
| Female | 229 (54.0%) | $38,667 |
| Total | 424 (100.0%) | $38,630 |
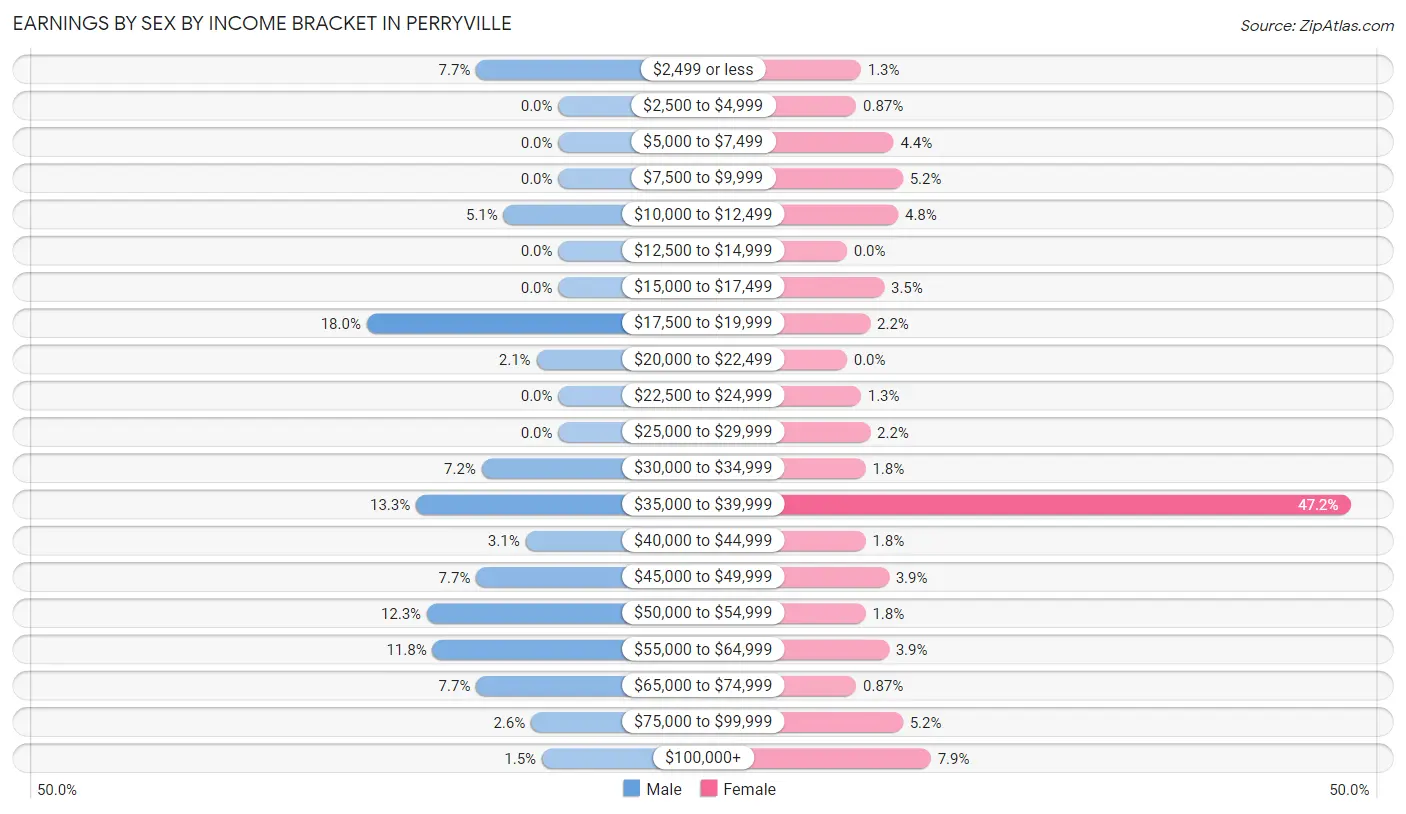
Earnings by Sex by Income Bracket in Perryville
The most common earnings brackets in Perryville are $17,500 to $19,999 for men (35 | 17.9%) and $35,000 to $39,999 for women (108 | 47.2%).
| Income | Male | Female |
| $2,499 or less | 15 (7.7%) | 3 (1.3%) |
| $2,500 to $4,999 | 0 (0.0%) | 2 (0.9%) |
| $5,000 to $7,499 | 0 (0.0%) | 10 (4.4%) |
| $7,500 to $9,999 | 0 (0.0%) | 12 (5.2%) |
| $10,000 to $12,499 | 10 (5.1%) | 11 (4.8%) |
| $12,500 to $14,999 | 0 (0.0%) | 0 (0.0%) |
| $15,000 to $17,499 | 0 (0.0%) | 8 (3.5%) |
| $17,500 to $19,999 | 35 (17.9%) | 5 (2.2%) |
| $20,000 to $22,499 | 4 (2.1%) | 0 (0.0%) |
| $22,500 to $24,999 | 0 (0.0%) | 3 (1.3%) |
| $25,000 to $29,999 | 0 (0.0%) | 5 (2.2%) |
| $30,000 to $34,999 | 14 (7.2%) | 4 (1.8%) |
| $35,000 to $39,999 | 26 (13.3%) | 108 (47.2%) |
| $40,000 to $44,999 | 6 (3.1%) | 4 (1.8%) |
| $45,000 to $49,999 | 15 (7.7%) | 9 (3.9%) |
| $50,000 to $54,999 | 24 (12.3%) | 4 (1.8%) |
| $55,000 to $64,999 | 23 (11.8%) | 9 (3.9%) |
| $65,000 to $74,999 | 15 (7.7%) | 2 (0.9%) |
| $75,000 to $99,999 | 5 (2.6%) | 12 (5.2%) |
| $100,000+ | 3 (1.5%) | 18 (7.9%) |
| Total | 195 (100.0%) | 229 (100.0%) |
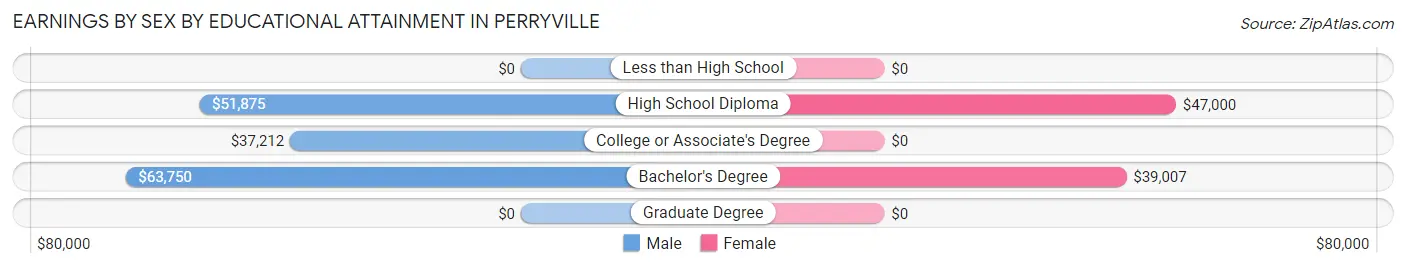
Earnings by Sex by Educational Attainment in Perryville
Average earnings in Perryville are $49,821 for men and $38,927 for women, a difference of 21.9%. Men with an educational attainment of bachelor's degree enjoy the highest average annual earnings of $63,750, while those with college or associate's degree education earn the least with $37,212. Women with an educational attainment of high school diploma earn the most with the average annual earnings of $47,000, while those with bachelor's degree education have the smallest earnings of $39,007.
| Educational Attainment | Male Income | Female Income |
| Less than High School | - | - |
| High School Diploma | $51,875 | $47,000 |
| College or Associate's Degree | $37,212 | $0 |
| Bachelor's Degree | $63,750 | $39,007 |
| Graduate Degree | - | - |
| Total | $49,821 | $38,927 |
Family Income in Perryville
Family Income Brackets in Perryville
According to the Perryville family income data, there are 125 families falling into the $50,000 to $74,999 income range, which is the most common income bracket and makes up 47.0% of all families. Conversely, the $15,000 to $24,999 income bracket is the least frequent group with only 2 families (0.7%) belonging to this category.
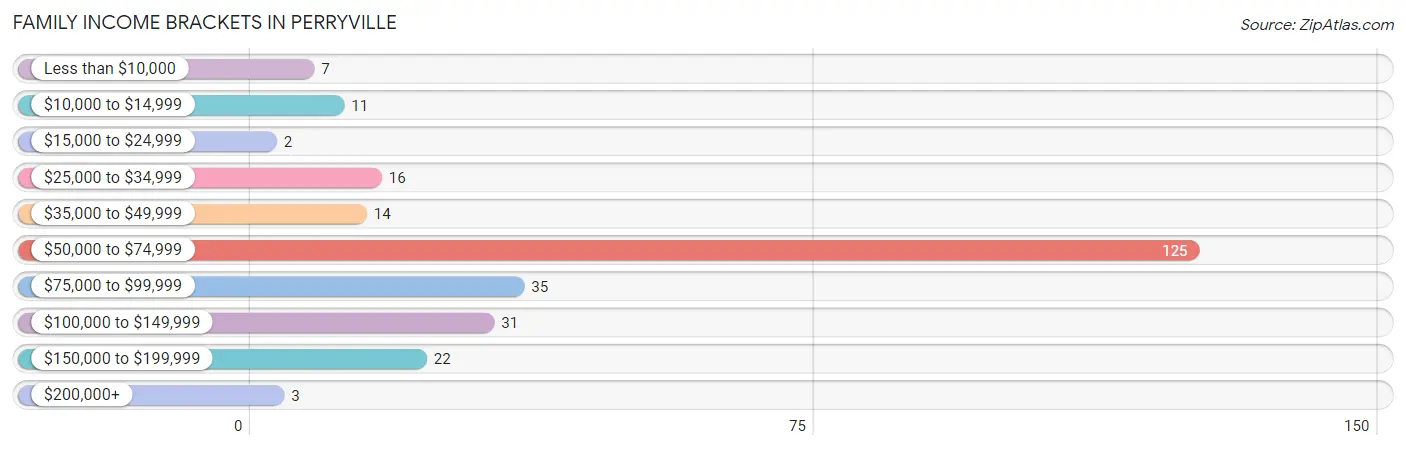
| Income Bracket | # Families | % Families |
| Less than $10,000 | 7 | 2.6% |
| $10,000 to $14,999 | 11 | 4.1% |
| $15,000 to $24,999 | 2 | 0.8% |
| $25,000 to $34,999 | 16 | 6.0% |
| $35,000 to $49,999 | 14 | 5.3% |
| $50,000 to $74,999 | 125 | 47.0% |
| $75,000 to $99,999 | 35 | 13.2% |
| $100,000 to $149,999 | 31 | 11.7% |
| $150,000 to $199,999 | 22 | 8.3% |
| $200,000+ | 3 | 1.1% |
Family Income by Famaliy Size in Perryville
4-person families (47 | 17.7%) account for the highest median family income in Perryville with $110,625 per family, while 4-person families (47 | 17.7%) have the highest median income of $27,656 per family member.
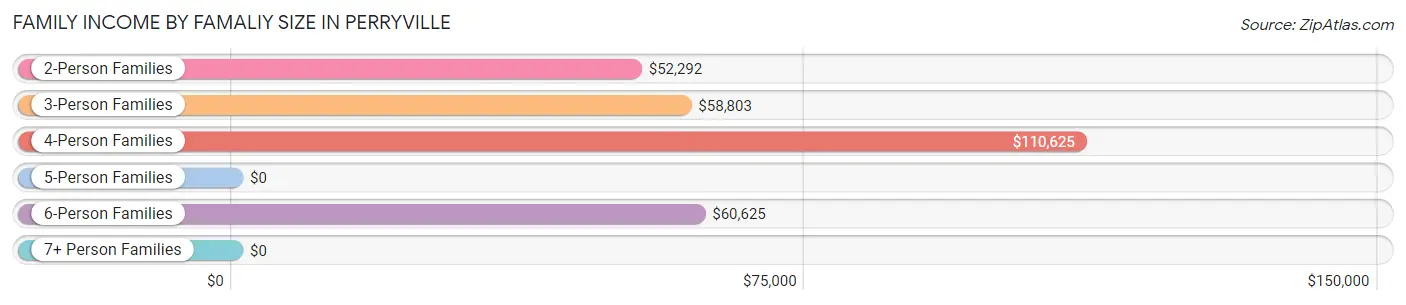
| Income Bracket | # Families | Median Income |
| 2-Person Families | 97 (36.5%) | $52,292 |
| 3-Person Families | 110 (41.3%) | $58,803 |
| 4-Person Families | 47 (17.7%) | $110,625 |
| 5-Person Families | 5 (1.9%) | $0 |
| 6-Person Families | 7 (2.6%) | $60,625 |
| 7+ Person Families | 0 (0.0%) | $0 |
| Total | 266 (100.0%) | $59,316 |
Family Income by Number of Earners in Perryville
The median family income in Perryville is $59,316, with families comprising 3+ earners (7) having the highest median family income of $84,375, while families with no earners (44) have the lowest median family income of $35,000, accounting for 2.6% and 16.5% of families, respectively.
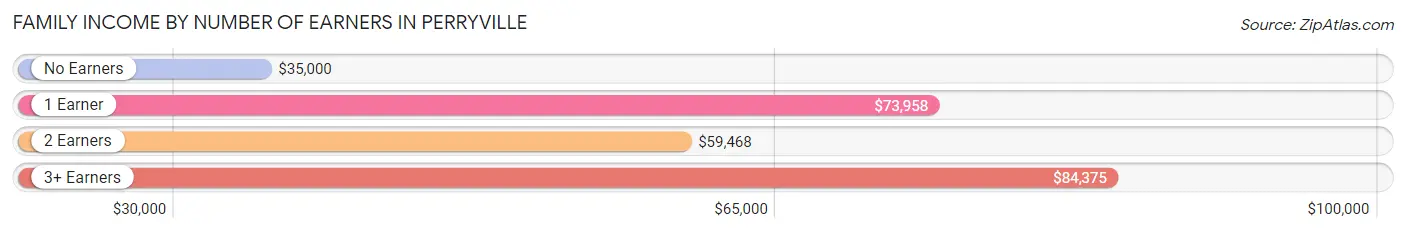
| Number of Earners | # Families | Median Income |
| No Earners | 44 (16.5%) | $35,000 |
| 1 Earner | 37 (13.9%) | $73,958 |
| 2 Earners | 178 (66.9%) | $59,468 |
| 3+ Earners | 7 (2.6%) | $84,375 |
| Total | 266 (100.0%) | $59,316 |
Household Income in Perryville
Household Income Brackets in Perryville
With 148 households falling in the category, the $50,000 to $74,999 income range is the most frequent in Perryville, accounting for 37.4% of all households. In contrast, only 3 households (0.8%) fall into the $200,000+ income bracket, making it the least populous group.
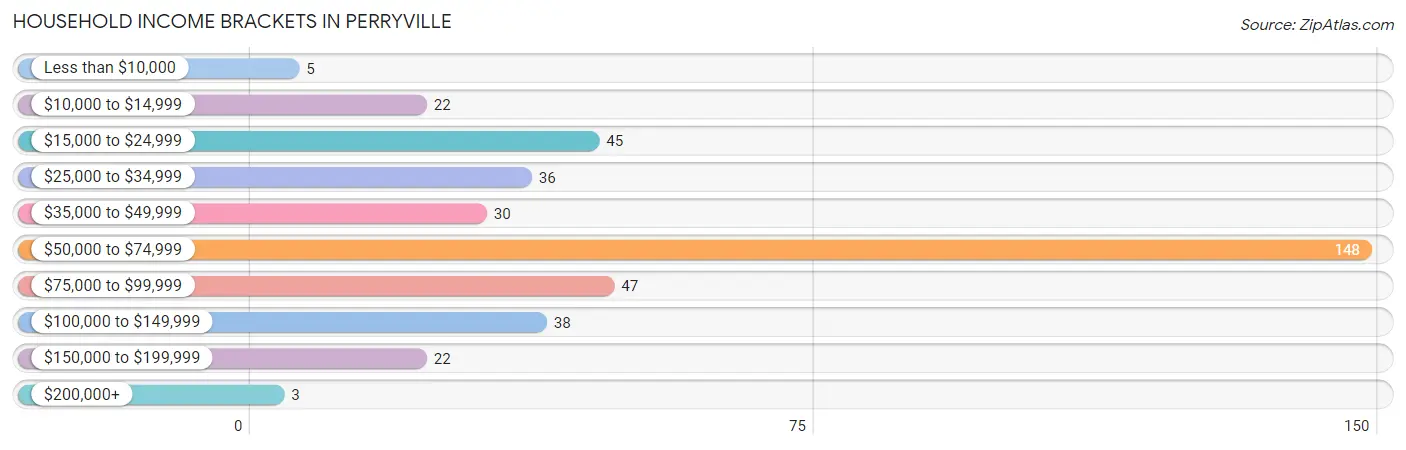
| Income Bracket | # Households | % Households |
| Less than $10,000 | 5 | 1.3% |
| $10,000 to $14,999 | 22 | 5.6% |
| $15,000 to $24,999 | 45 | 11.4% |
| $25,000 to $34,999 | 36 | 9.1% |
| $35,000 to $49,999 | 30 | 7.6% |
| $50,000 to $74,999 | 148 | 37.4% |
| $75,000 to $99,999 | 47 | 11.9% |
| $100,000 to $149,999 | 38 | 9.6% |
| $150,000 to $199,999 | 22 | 5.6% |
| $200,000+ | 3 | 0.8% |
Household Income by Householder Age in Perryville
The median household income in Perryville is $58,634, with the highest median household income of $71,250 found in the 45 to 64 years age bracket for the primary householder. A total of 110 households (27.8%) fall into this category. Meanwhile, the 15 to 24 years age bracket for the primary householder has the lowest median household income of $0, with 3 households (0.8%) in this group.
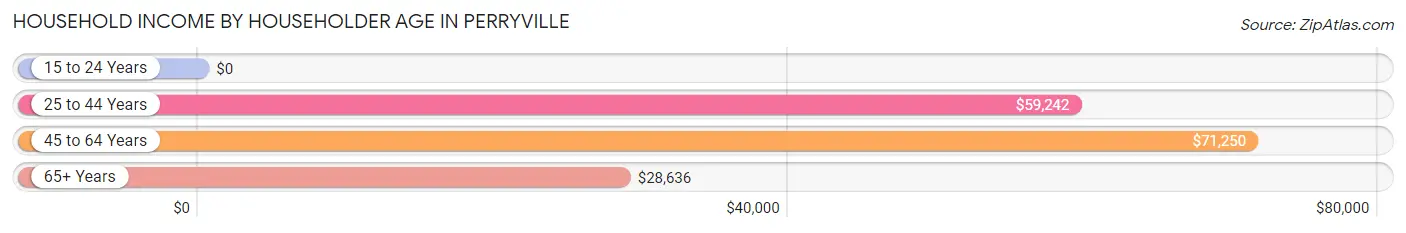
| Income Bracket | # Households | Median Income |
| 15 to 24 Years | 3 (0.8%) | $0 |
| 25 to 44 Years | 167 (42.2%) | $59,242 |
| 45 to 64 Years | 110 (27.8%) | $71,250 |
| 65+ Years | 116 (29.3%) | $28,636 |
| Total | 396 (100.0%) | $58,634 |
Poverty in Perryville
Income Below Poverty by Sex and Age in Perryville
With 4.9% poverty level for males and 8.7% for females among the residents of Perryville, 16 and 17 year old males and under 5 year old females are the most vulnerable to poverty, with 15 males (78.9%) and 7 females (38.9%) in their respective age groups living below the poverty level.
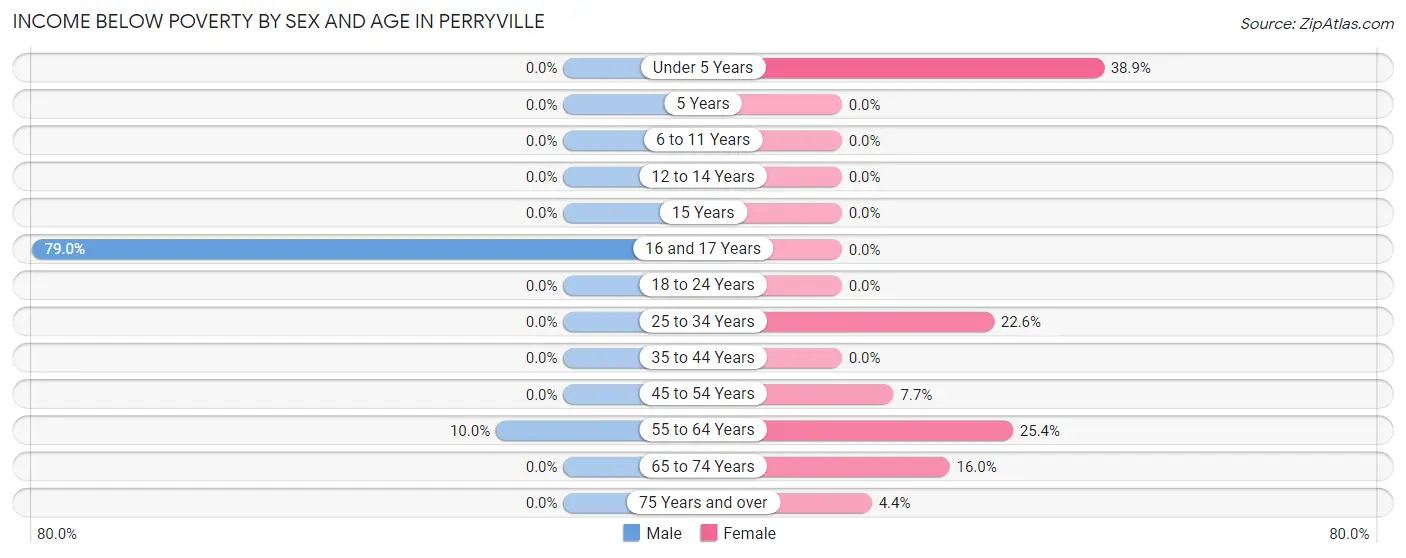
| Age Bracket | Male | Female |
| Under 5 Years | 0 (0.0%) | 7 (38.9%) |
| 5 Years | 0 (0.0%) | 0 (0.0%) |
| 6 to 11 Years | 0 (0.0%) | 0 (0.0%) |
| 12 to 14 Years | 0 (0.0%) | 0 (0.0%) |
| 15 Years | 0 (0.0%) | 0 (0.0%) |
| 16 and 17 Years | 15 (78.9%) | 0 (0.0%) |
| 18 to 24 Years | 0 (0.0%) | 0 (0.0%) |
| 25 to 34 Years | 0 (0.0%) | 7 (22.6%) |
| 35 to 44 Years | 0 (0.0%) | 0 (0.0%) |
| 45 to 54 Years | 0 (0.0%) | 4 (7.7%) |
| 55 to 64 Years | 2 (10.0%) | 16 (25.4%) |
| 65 to 74 Years | 0 (0.0%) | 4 (16.0%) |
| 75 Years and over | 0 (0.0%) | 2 (4.4%) |
| Total | 17 (4.9%) | 40 (8.7%) |
Income Above Poverty by Sex and Age in Perryville
According to the poverty statistics in Perryville, males aged under 5 years and females aged 6 to 11 years are the age groups that are most secure financially, with 100.0% of males and 100.0% of females in these age groups living above the poverty line.
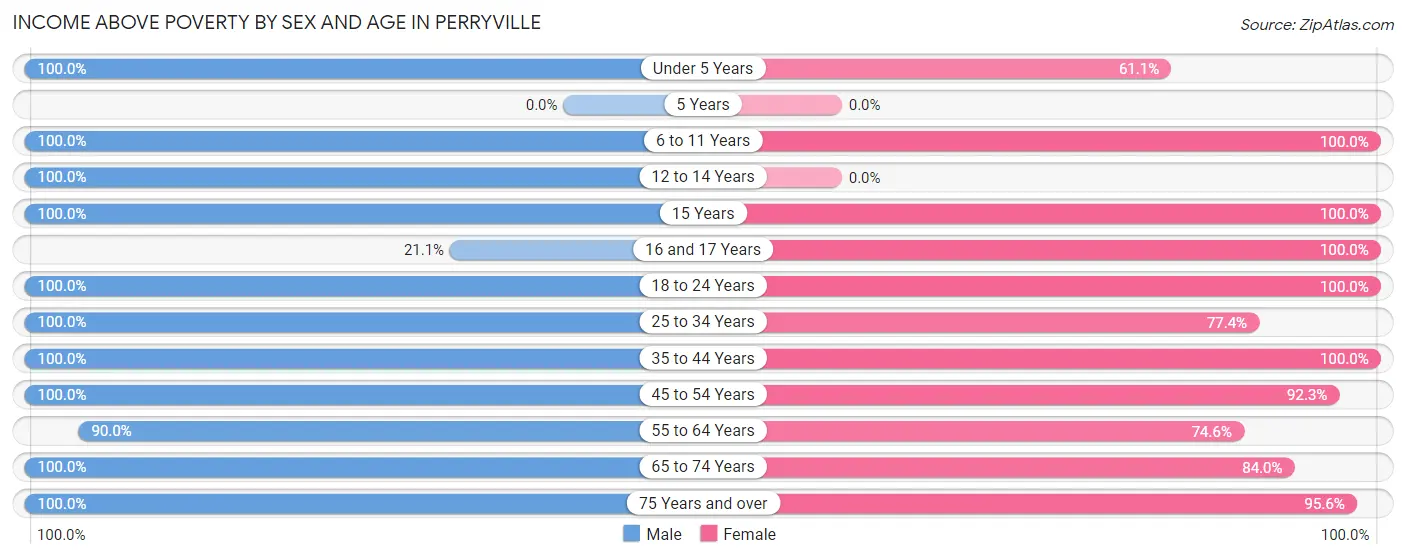
| Age Bracket | Male | Female |
| Under 5 Years | 5 (100.0%) | 11 (61.1%) |
| 5 Years | 0 (0.0%) | 0 (0.0%) |
| 6 to 11 Years | 18 (100.0%) | 15 (100.0%) |
| 12 to 14 Years | 17 (100.0%) | 0 (0.0%) |
| 15 Years | 5 (100.0%) | 74 (100.0%) |
| 16 and 17 Years | 4 (21.0%) | 9 (100.0%) |
| 18 to 24 Years | 45 (100.0%) | 17 (100.0%) |
| 25 to 34 Years | 61 (100.0%) | 24 (77.4%) |
| 35 to 44 Years | 12 (100.0%) | 113 (100.0%) |
| 45 to 54 Years | 62 (100.0%) | 48 (92.3%) |
| 55 to 64 Years | 18 (90.0%) | 47 (74.6%) |
| 65 to 74 Years | 30 (100.0%) | 21 (84.0%) |
| 75 Years and over | 55 (100.0%) | 43 (95.6%) |
| Total | 332 (95.1%) | 422 (91.3%) |
Income Below Poverty Among Married-Couple Families in Perryville
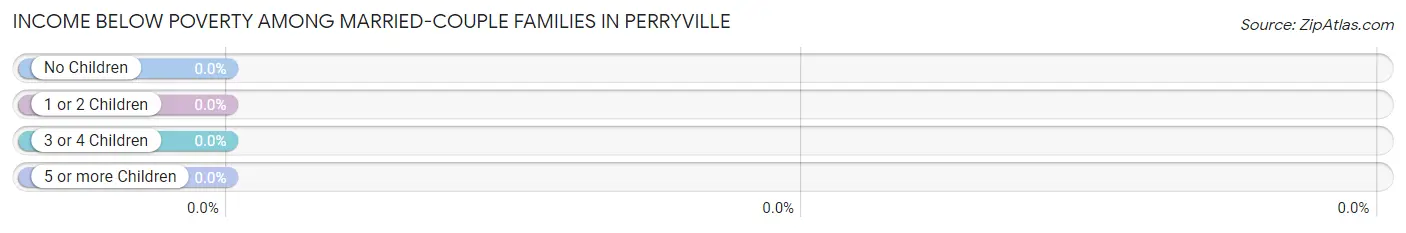
| Children | Above Poverty | Below Poverty |
| No Children | 76 (100.0%) | 0 (0.0%) |
| 1 or 2 Children | 44 (100.0%) | 0 (0.0%) |
| 3 or 4 Children | 12 (100.0%) | 0 (0.0%) |
| 5 or more Children | 0 (0.0%) | 0 (0.0%) |
| Total | 132 (100.0%) | 0 (0.0%) |
Income Below Poverty Among Single-Parent Households in Perryville
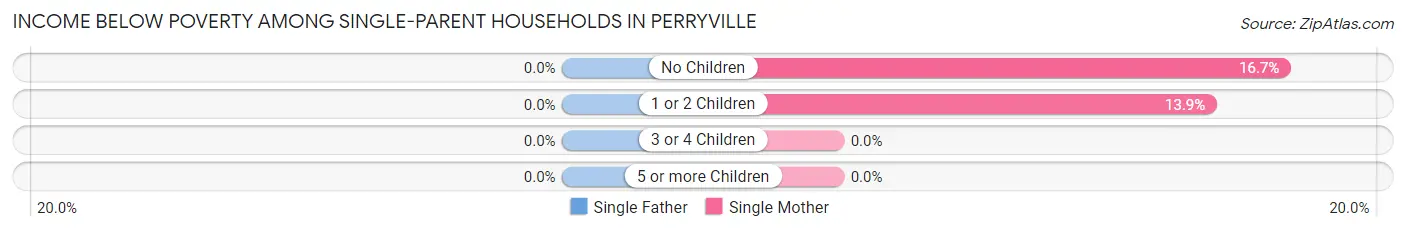
| Children | Single Father | Single Mother |
| No Children | 0 (0.0%) | 2 (16.7%) |
| 1 or 2 Children | 0 (0.0%) | 16 (13.9%) |
| 3 or 4 Children | 0 (0.0%) | 0 (0.0%) |
| 5 or more Children | 0 (0.0%) | 0 (0.0%) |
| Total | 0 (0.0%) | 18 (14.2%) |
Income Below Poverty Among Married-Couple vs Single-Parent Households in Perryville
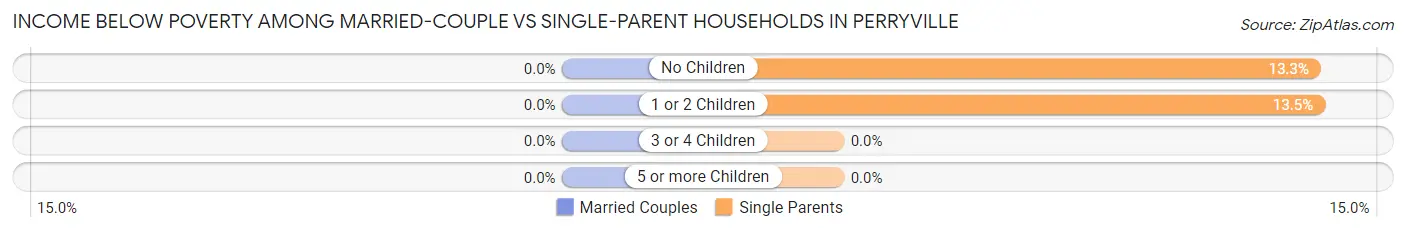
| Children | Married-Couple Families | Single-Parent Households |
| No Children | 0 (0.0%) | 2 (13.3%) |
| 1 or 2 Children | 0 (0.0%) | 16 (13.5%) |
| 3 or 4 Children | 0 (0.0%) | 0 (0.0%) |
| 5 or more Children | 0 (0.0%) | 0 (0.0%) |
| Total | 0 (0.0%) | 18 (13.4%) |
Race in Perryville
The most populous races in Perryville are White / Caucasian (756 | 92.5%), Black / African American (53 | 6.5%), and Hispanic or Latino (8 | 1.0%).
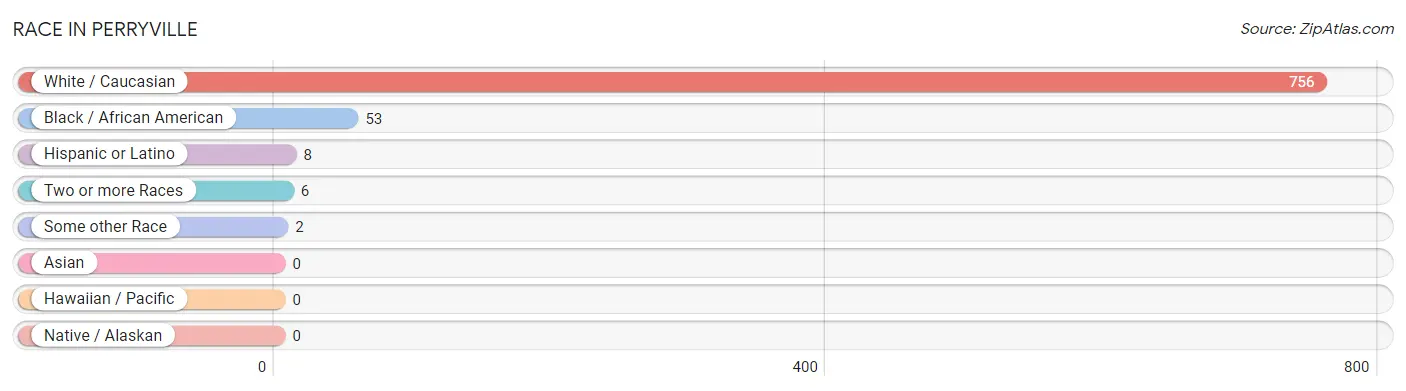
| Race | # Population | % Population |
| Asian | 0 | 0.0% |
| Black / African American | 53 | 6.5% |
| Hawaiian / Pacific | 0 | 0.0% |
| Hispanic or Latino | 8 | 1.0% |
| Native / Alaskan | 0 | 0.0% |
| White / Caucasian | 756 | 92.5% |
| Two or more Races | 6 | 0.7% |
| Some other Race | 2 | 0.2% |
| Total | 817 | 100.0% |
Ancestry in Perryville
The most populous ancestries reported in Perryville are American (152 | 18.6%), English (97 | 11.9%), Irish (79 | 9.7%), German (75 | 9.2%), and Scottish (37 | 4.5%), together accounting for 53.8% of all Perryville residents.
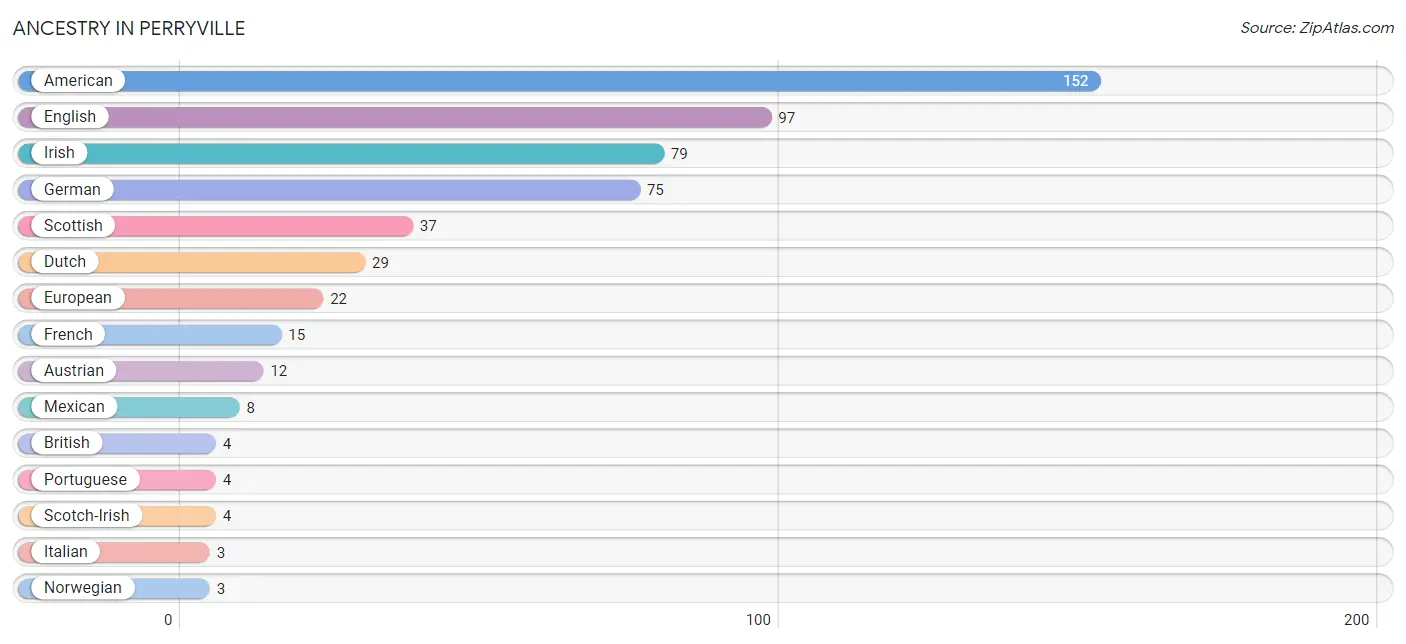
| Ancestry | # Population | % Population |
| American | 152 | 18.6% |
| Austrian | 12 | 1.5% |
| British | 4 | 0.5% |
| Dutch | 29 | 3.5% |
| English | 97 | 11.9% |
| European | 22 | 2.7% |
| French | 15 | 1.8% |
| German | 75 | 9.2% |
| Irish | 79 | 9.7% |
| Italian | 3 | 0.4% |
| Mexican | 8 | 1.0% |
| Norwegian | 3 | 0.4% |
| Portuguese | 4 | 0.5% |
| Scotch-Irish | 4 | 0.5% |
| Scottish | 37 | 4.5% | View All 15 Rows |
Immigrants in Perryville
The most numerous immigrant groups reported in Perryville came from Central America (2 | 0.2%), Latin America (2 | 0.2%), and Mexico (2 | 0.2%), together accounting for 0.7% of all Perryville residents.
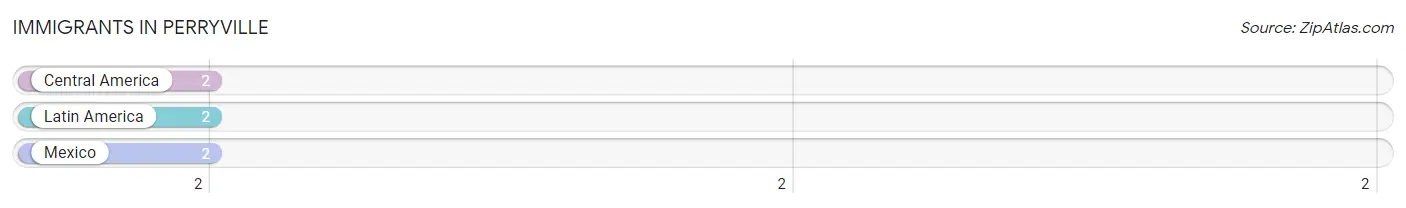
| Immigration Origin | # Population | % Population |
| Central America | 2 | 0.2% |
| Latin America | 2 | 0.2% |
| Mexico | 2 | 0.2% | View All 3 Rows |
Sex and Age in Perryville
Sex and Age in Perryville
The most populous age groups in Perryville are 15 to 19 Years (59 | 16.6%) for men and 40 to 44 Years (102 | 22.1%) for women.
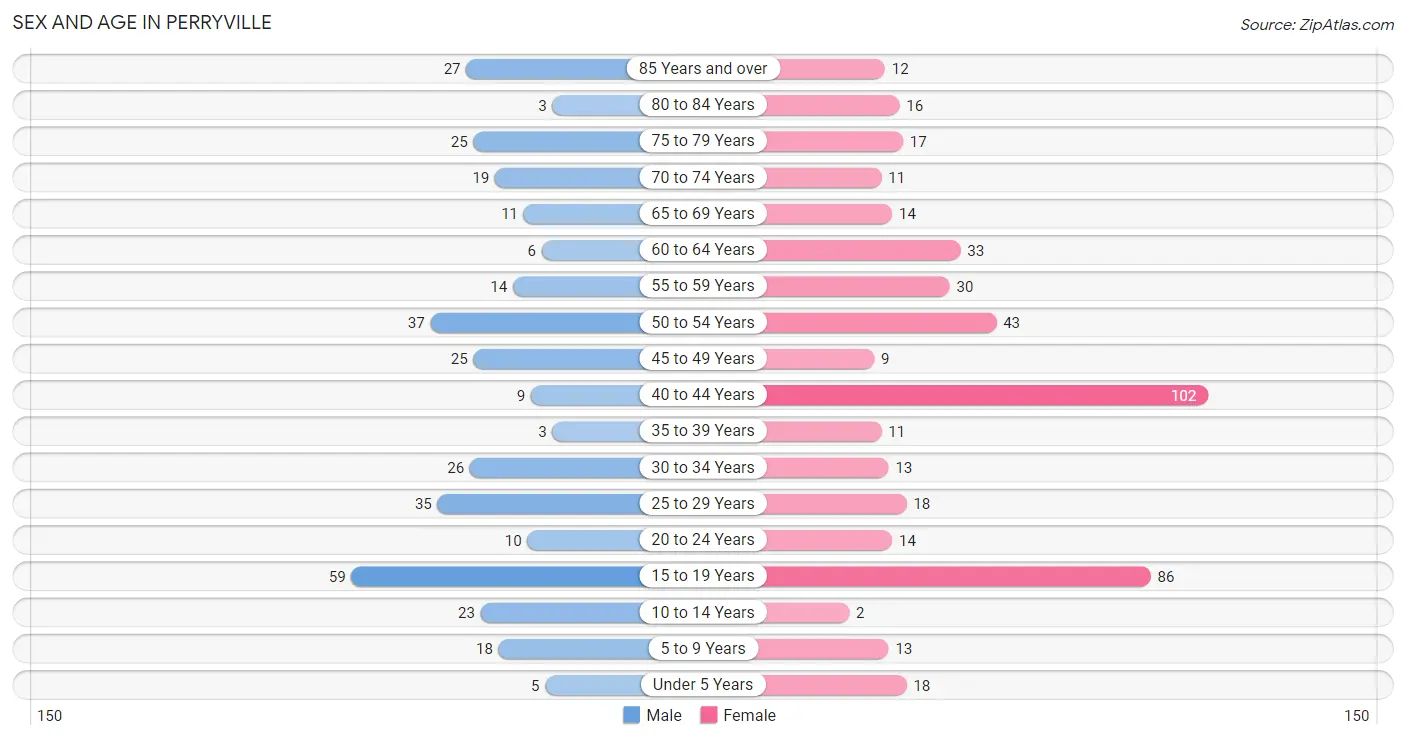
| Age Bracket | Male | Female |
| Under 5 Years | 5 (1.4%) | 18 (3.9%) |
| 5 to 9 Years | 18 (5.1%) | 13 (2.8%) |
| 10 to 14 Years | 23 (6.5%) | 2 (0.4%) |
| 15 to 19 Years | 59 (16.6%) | 86 (18.6%) |
| 20 to 24 Years | 10 (2.8%) | 14 (3.0%) |
| 25 to 29 Years | 35 (9.9%) | 18 (3.9%) |
| 30 to 34 Years | 26 (7.3%) | 13 (2.8%) |
| 35 to 39 Years | 3 (0.9%) | 11 (2.4%) |
| 40 to 44 Years | 9 (2.5%) | 102 (22.1%) |
| 45 to 49 Years | 25 (7.0%) | 9 (1.9%) |
| 50 to 54 Years | 37 (10.4%) | 43 (9.3%) |
| 55 to 59 Years | 14 (3.9%) | 30 (6.5%) |
| 60 to 64 Years | 6 (1.7%) | 33 (7.1%) |
| 65 to 69 Years | 11 (3.1%) | 14 (3.0%) |
| 70 to 74 Years | 19 (5.3%) | 11 (2.4%) |
| 75 to 79 Years | 25 (7.0%) | 17 (3.7%) |
| 80 to 84 Years | 3 (0.9%) | 16 (3.5%) |
| 85 Years and over | 27 (7.6%) | 12 (2.6%) |
| Total | 355 (100.0%) | 462 (100.0%) |
Families and Households in Perryville
Median Family Size in Perryville
The median family size in Perryville is 2.50 persons per family, with single male/father families (7 | 2.6%) accounting for the largest median family size of 3.57 persons per family. On the other hand, single female/mother families (127 | 47.7%) represent the smallest median family size with 2.15 persons per family.
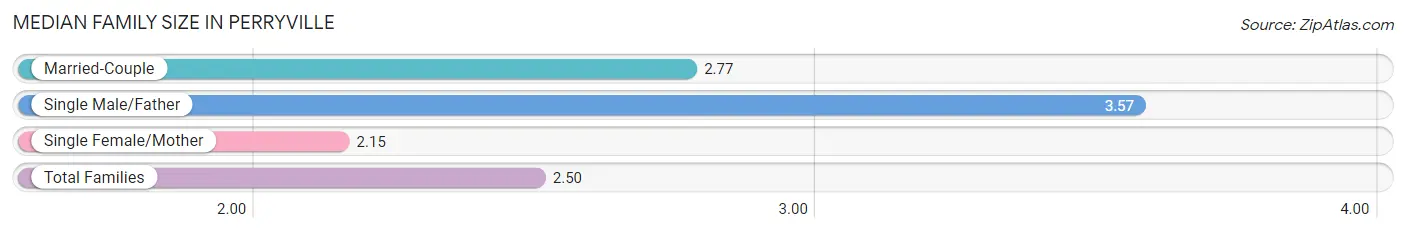
| Family Type | # Families | Family Size |
| Married-Couple | 132 (49.6%) | 2.77 |
| Single Male/Father | 7 (2.6%) | 3.57 |
| Single Female/Mother | 127 (47.7%) | 2.15 |
| Total Families | 266 (100.0%) | 2.50 |
Median Household Size in Perryville
The median household size in Perryville is 2.06 persons per household, with single male/father households (7 | 1.8%) accounting for the largest median household size of 3.57 persons per household. non-family households (130 | 32.8%) represent the smallest median household size with 1.03 persons per household.
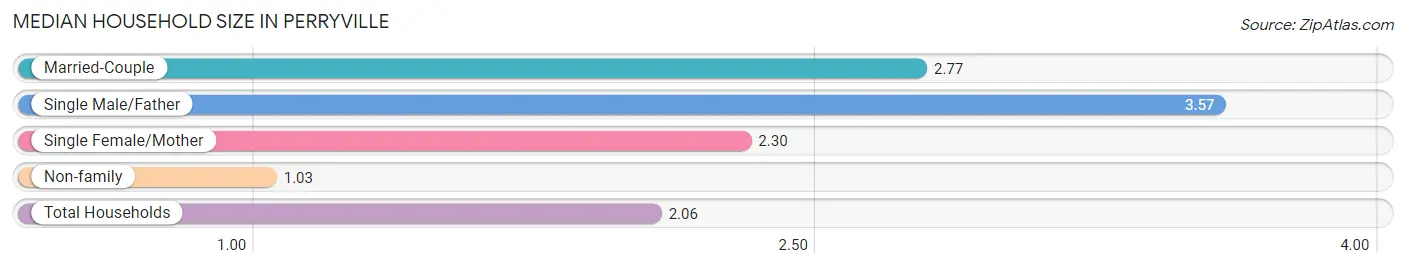
| Household Type | # Households | Household Size |
| Married-Couple | 132 (33.3%) | 2.77 |
| Single Male/Father | 7 (1.8%) | 3.57 |
| Single Female/Mother | 127 (32.1%) | 2.30 |
| Non-family | 130 (32.8%) | 1.03 |
| Total Households | 396 (100.0%) | 2.06 |
Household Size by Marriage Status in Perryville
Out of a total of 396 households in Perryville, 266 (67.2%) are family households, while 130 (32.8%) are nonfamily households. The most numerous type of family households are 3-person households, comprising 113, and the most common type of nonfamily households are 1-person households, comprising 124.
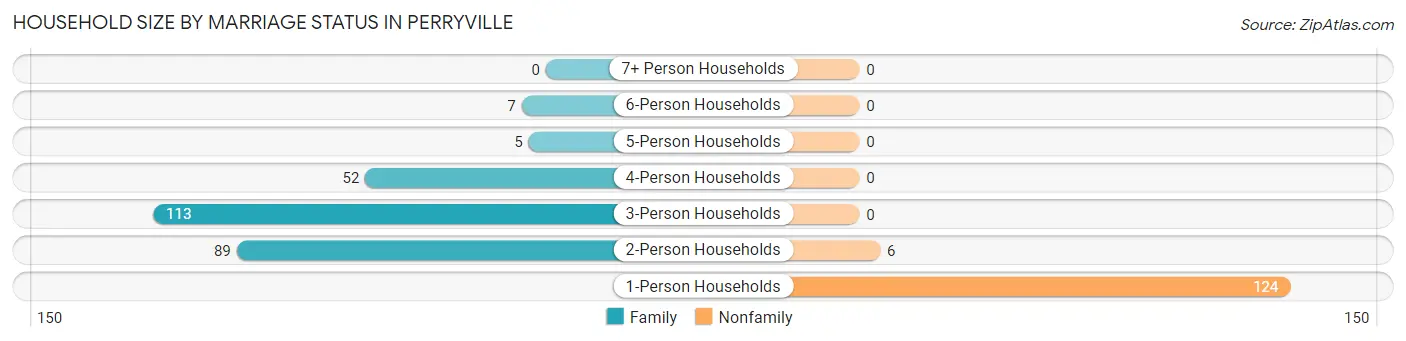
| Household Size | Family Households | Nonfamily Households |
| 1-Person Households | - | 124 (31.3%) |
| 2-Person Households | 89 (22.5%) | 6 (1.5%) |
| 3-Person Households | 113 (28.5%) | 0 (0.0%) |
| 4-Person Households | 52 (13.1%) | 0 (0.0%) |
| 5-Person Households | 5 (1.3%) | 0 (0.0%) |
| 6-Person Households | 7 (1.8%) | 0 (0.0%) |
| 7+ Person Households | 0 (0.0%) | 0 (0.0%) |
| Total | 266 (67.2%) | 130 (32.8%) |
Female Fertility in Perryville
Fertility by Age in Perryville
Average fertility rate in Perryville is 19.0 births per 1,000 women. Women in the age bracket of 20 to 34 years have the highest fertility rate with 111.0 births per 1,000 women. Women in the age bracket of 20 to 34 years acount for 100.0% of all women with births.
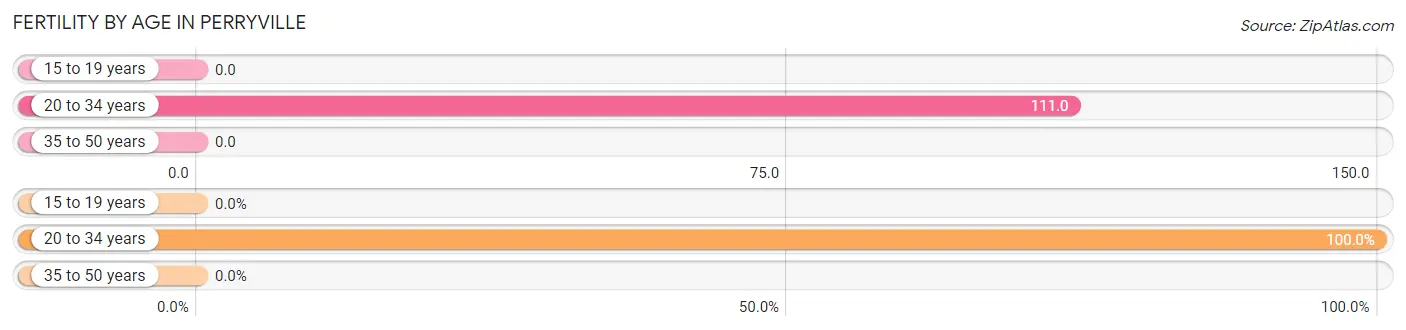
| Age Bracket | Women with Births | Births / 1,000 Women |
| 15 to 19 years | 0 (0.0%) | 0.0 |
| 20 to 34 years | 5 (100.0%) | 111.0 |
| 35 to 50 years | 0 (0.0%) | 0.0 |
| Total | 5 (100.0%) | 19.0 |
Fertility by Age by Marriage Status in Perryville
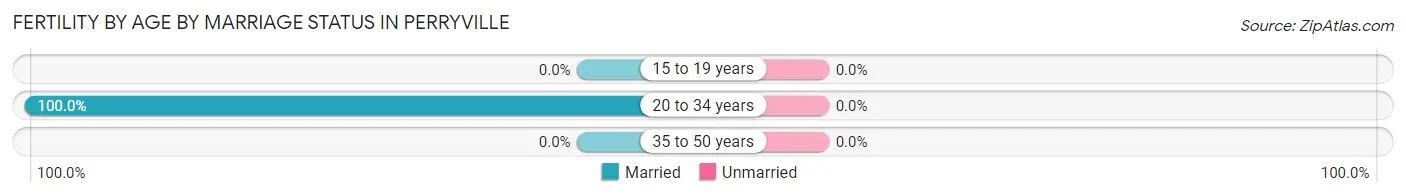
| Age Bracket | Married | Unmarried |
| 15 to 19 years | 0 (0.0%) | 0 (0.0%) |
| 20 to 34 years | 5 (100.0%) | 0 (0.0%) |
| 35 to 50 years | 0 (0.0%) | 0 (0.0%) |
| Total | 5 (100.0%) | 0 (0.0%) |
Fertility by Education in Perryville
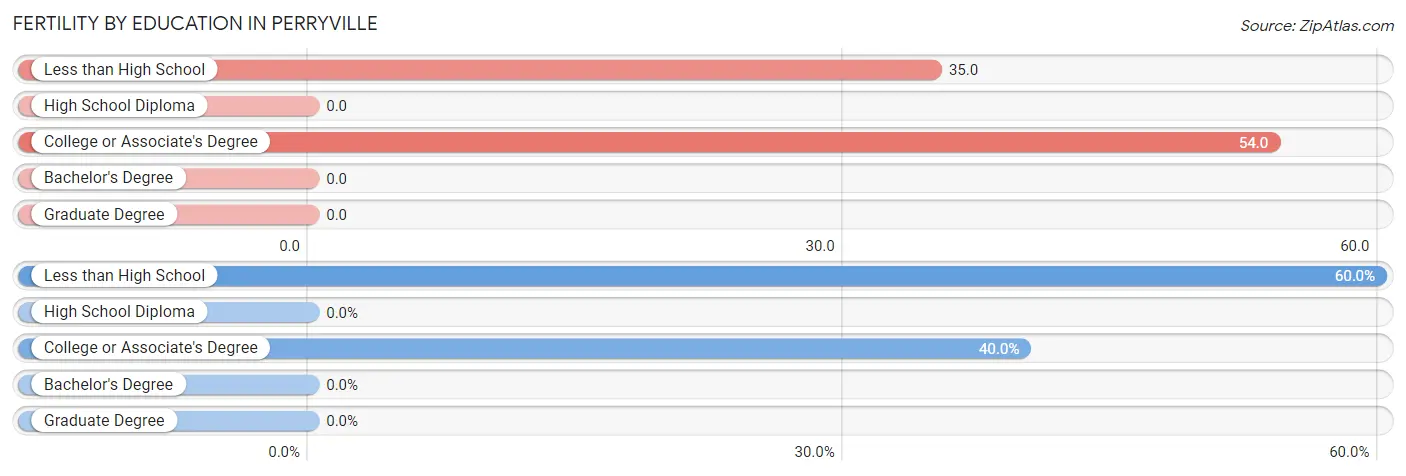
| Educational Attainment | Women with Births | Births / 1,000 Women |
| Less than High School | 3 (60.0%) | 35.0 |
| High School Diploma | 0 (0.0%) | 0.0 |
| College or Associate's Degree | 2 (40.0%) | 54.0 |
| Bachelor's Degree | 0 (0.0%) | 0.0 |
| Graduate Degree | 0 (0.0%) | 0.0 |
| Total | 5 (100.0%) | 19.0 |
Fertility by Education by Marriage Status in Perryville
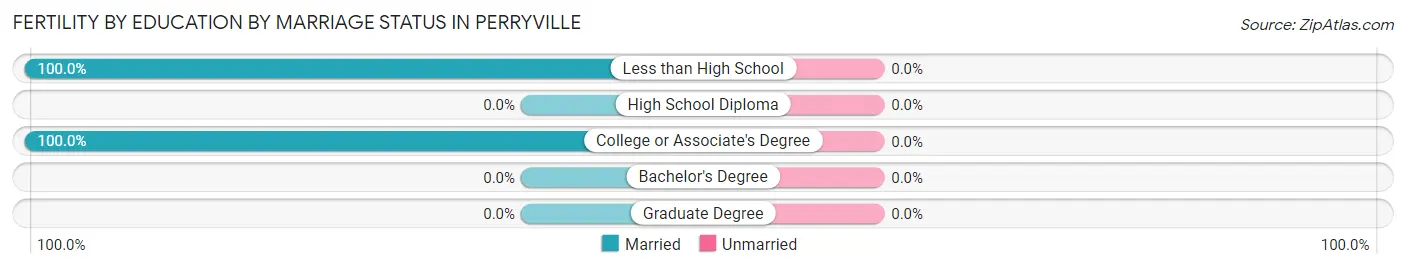
| Educational Attainment | Married | Unmarried |
| Less than High School | 3 (100.0%) | 0 (0.0%) |
| High School Diploma | 0 (0.0%) | 0 (0.0%) |
| College or Associate's Degree | 2 (100.0%) | 0 (0.0%) |
| Bachelor's Degree | 0 (0.0%) | 0 (0.0%) |
| Graduate Degree | 0 (0.0%) | 0 (0.0%) |
| Total | 5 (100.0%) | 0 (0.0%) |
Employment Characteristics in Perryville
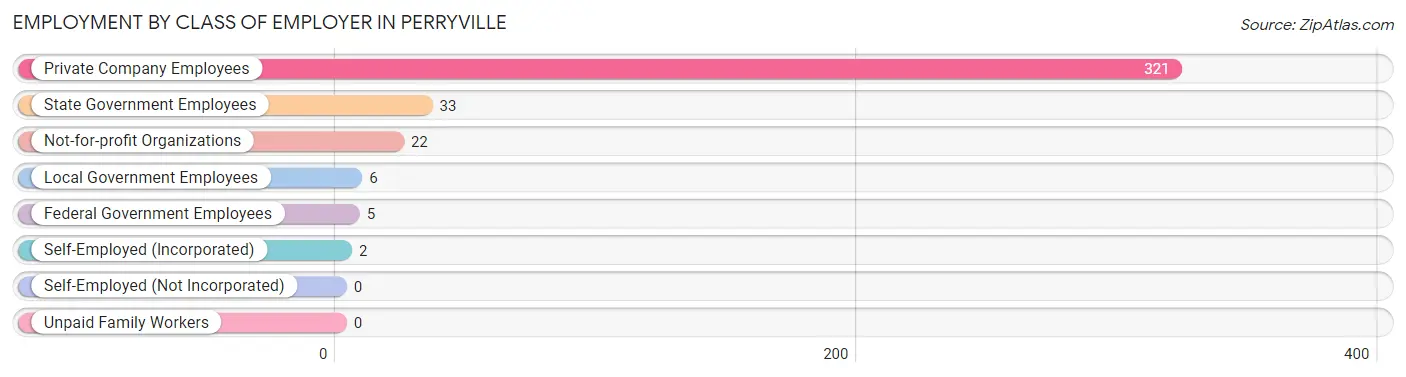
Employment by Class of Employer in Perryville
Among the 389 employed individuals in Perryville, private company employees (321 | 82.5%), state government employees (33 | 8.5%), and not-for-profit organizations (22 | 5.7%) make up the most common classes of employment.
| Employer Class | # Employees | % Employees |
| Private Company Employees | 321 | 82.5% |
| Self-Employed (Incorporated) | 2 | 0.5% |
| Self-Employed (Not Incorporated) | 0 | 0.0% |
| Not-for-profit Organizations | 22 | 5.7% |
| Local Government Employees | 6 | 1.5% |
| State Government Employees | 33 | 8.5% |
| Federal Government Employees | 5 | 1.3% |
| Unpaid Family Workers | 0 | 0.0% |
| Total | 389 | 100.0% |
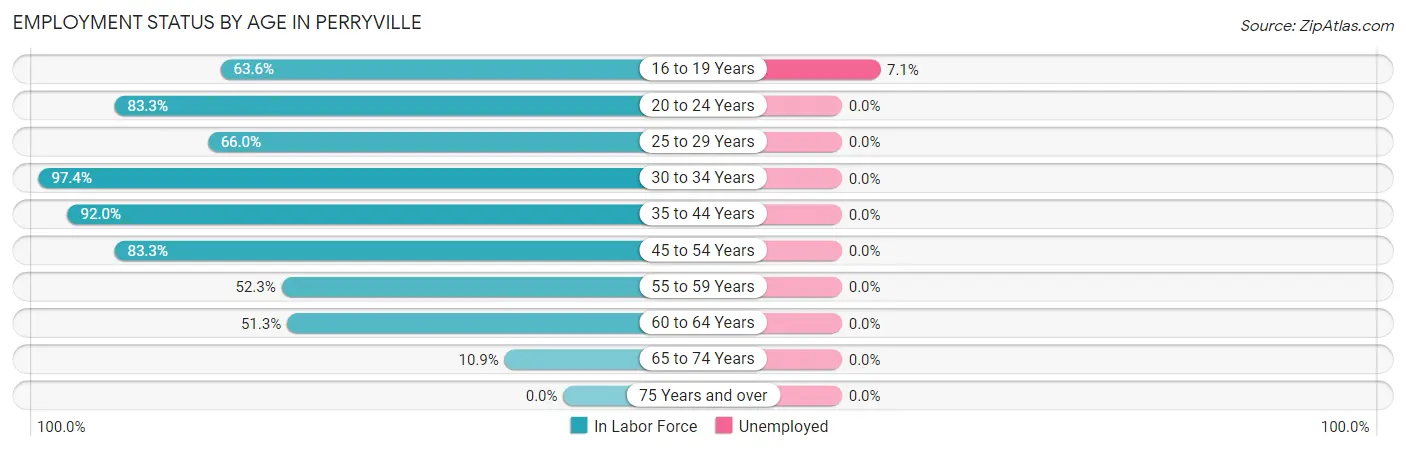
Employment Status by Age in Perryville
According to the labor force statistics for Perryville, out of the total population over 16 years of age (659), 59.8% or 394 individuals are in the labor force, with 0.8% or 3 of them unemployed. The age group with the highest labor force participation rate is 30 to 34 years, with 97.4% or 38 individuals in the labor force. Within the labor force, the 16 to 19 years age range has the highest percentage of unemployed individuals, with 7.1% or 3 of them being unemployed.
| Age Bracket | In Labor Force | Unemployed |
| 16 to 19 Years | 42 (63.6%) | 3 (7.1%) |
| 20 to 24 Years | 20 (83.3%) | 0 (0.0%) |
| 25 to 29 Years | 35 (66.0%) | 0 (0.0%) |
| 30 to 34 Years | 38 (97.4%) | 0 (0.0%) |
| 35 to 44 Years | 115 (92.0%) | 0 (0.0%) |
| 45 to 54 Years | 95 (83.3%) | 0 (0.0%) |
| 55 to 59 Years | 23 (52.3%) | 0 (0.0%) |
| 60 to 64 Years | 20 (51.3%) | 0 (0.0%) |
| 65 to 74 Years | 6 (10.9%) | 0 (0.0%) |
| 75 Years and over | 0 (0.0%) | 0 (0.0%) |
| Total | 394 (59.8%) | 3 (0.8%) |
Employment Status by Educational Attainment in Perryville
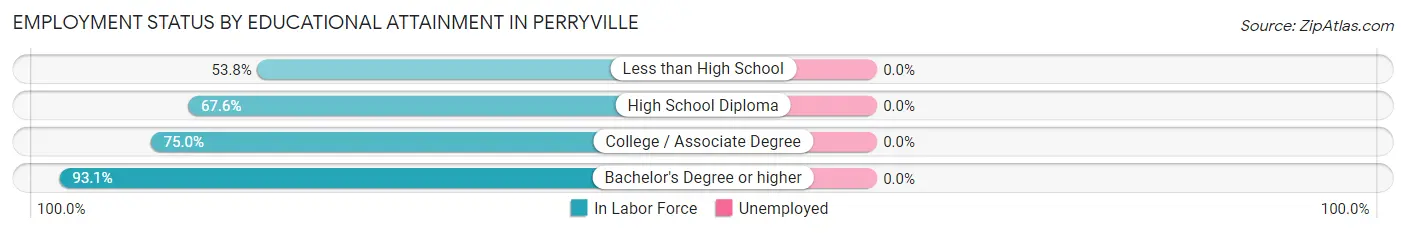
| Educational Attainment | In Labor Force | Unemployed |
| Less than High School | 7 (53.8%) | 0 (0.0%) |
| High School Diploma | 98 (67.6%) | 0 (0.0%) |
| College / Associate Degree | 72 (75.0%) | 0 (0.0%) |
| Bachelor's Degree or higher | 149 (93.1%) | 0 (0.0%) |
| Total | 326 (78.7%) | 0 (0.0%) |
Employment Occupations by Sex in Perryville
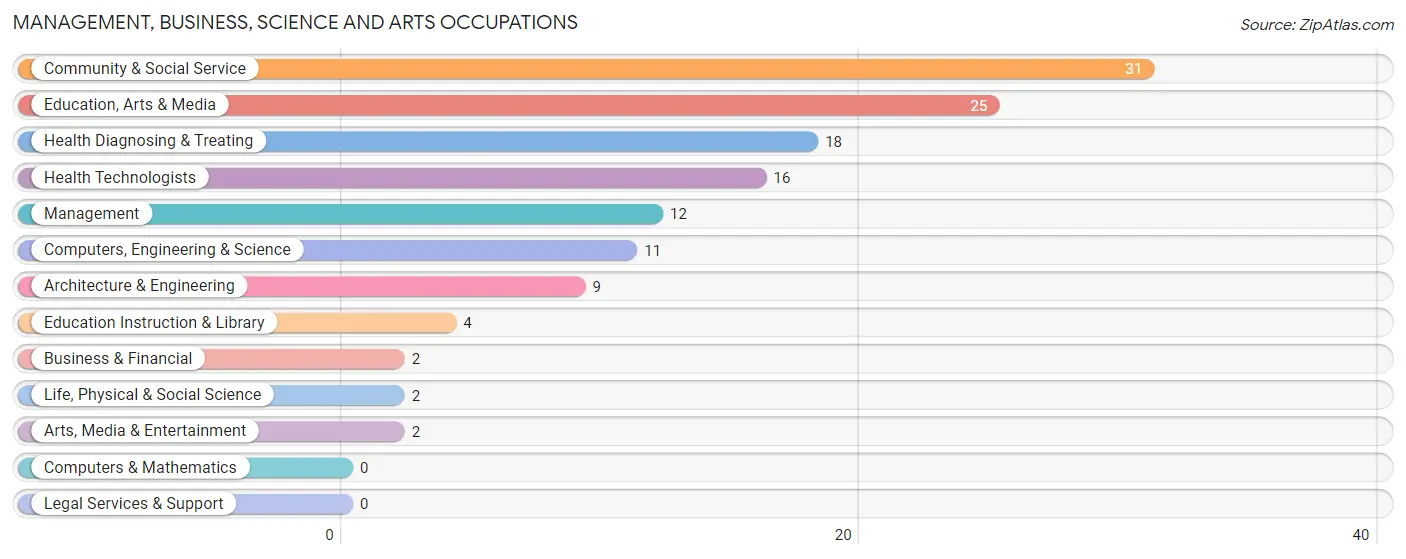
Management, Business, Science and Arts Occupations
The most common Management, Business, Science and Arts occupations in Perryville are Community & Social Service (31 | 7.9%), Education, Arts & Media (25 | 6.4%), Health Diagnosing & Treating (18 | 4.6%), Health Technologists (16 | 4.1%), and Management (12 | 3.1%).
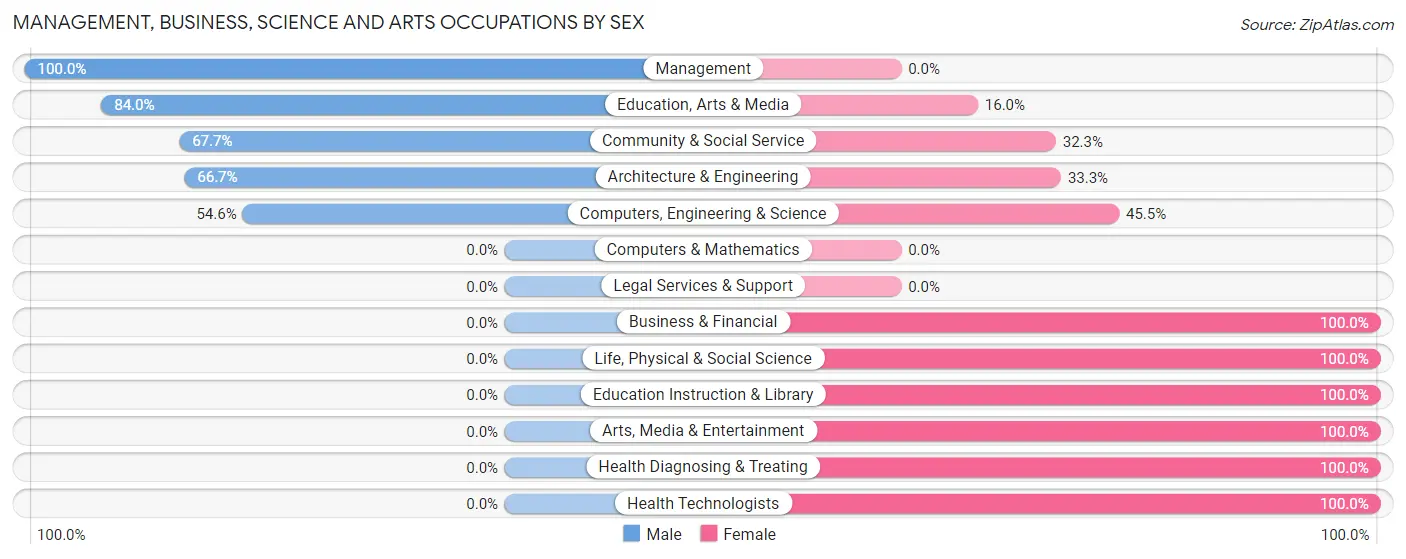
Management, Business, Science and Arts Occupations by Sex
Within the Management, Business, Science and Arts occupations in Perryville, the most male-oriented occupations are Management (100.0%), Education, Arts & Media (84.0%), and Community & Social Service (67.7%), while the most female-oriented occupations are Business & Financial (100.0%), Life, Physical & Social Science (100.0%), and Education Instruction & Library (100.0%).
| Occupation | Male | Female |
| Management | 12 (100.0%) | 0 (0.0%) |
| Business & Financial | 0 (0.0%) | 2 (100.0%) |
| Computers, Engineering & Science | 6 (54.5%) | 5 (45.5%) |
| Computers & Mathematics | 0 (0.0%) | 0 (0.0%) |
| Architecture & Engineering | 6 (66.7%) | 3 (33.3%) |
| Life, Physical & Social Science | 0 (0.0%) | 2 (100.0%) |
| Community & Social Service | 21 (67.7%) | 10 (32.3%) |
| Education, Arts & Media | 21 (84.0%) | 4 (16.0%) |
| Legal Services & Support | 0 (0.0%) | 0 (0.0%) |
| Education Instruction & Library | 0 (0.0%) | 4 (100.0%) |
| Arts, Media & Entertainment | 0 (0.0%) | 2 (100.0%) |
| Health Diagnosing & Treating | 0 (0.0%) | 18 (100.0%) |
| Health Technologists | 0 (0.0%) | 16 (100.0%) |
| Total (Category) | 39 (52.7%) | 35 (47.3%) |
| Total (Overall) | 176 (45.0%) | 215 (55.0%) |
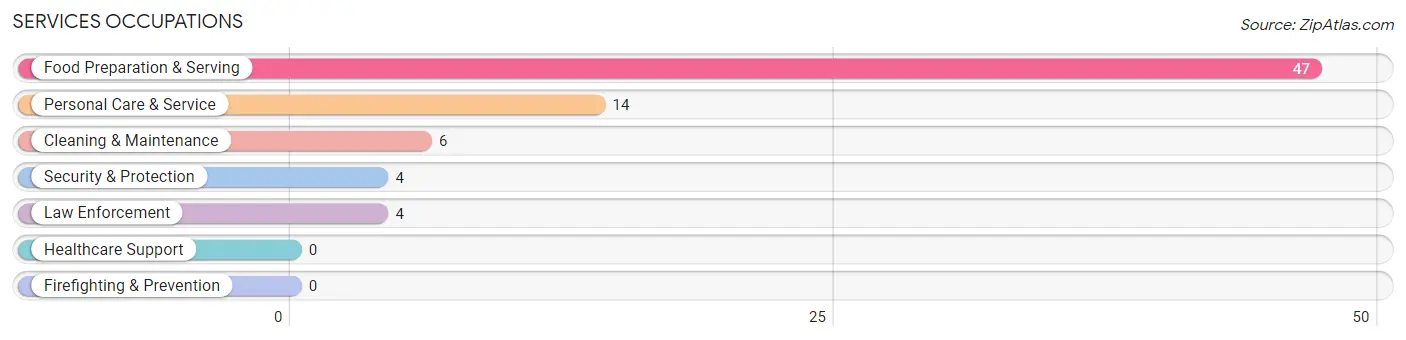
Services Occupations
The most common Services occupations in Perryville are Food Preparation & Serving (47 | 12.0%), Personal Care & Service (14 | 3.6%), Cleaning & Maintenance (6 | 1.5%), Security & Protection (4 | 1.0%), and Law Enforcement (4 | 1.0%).
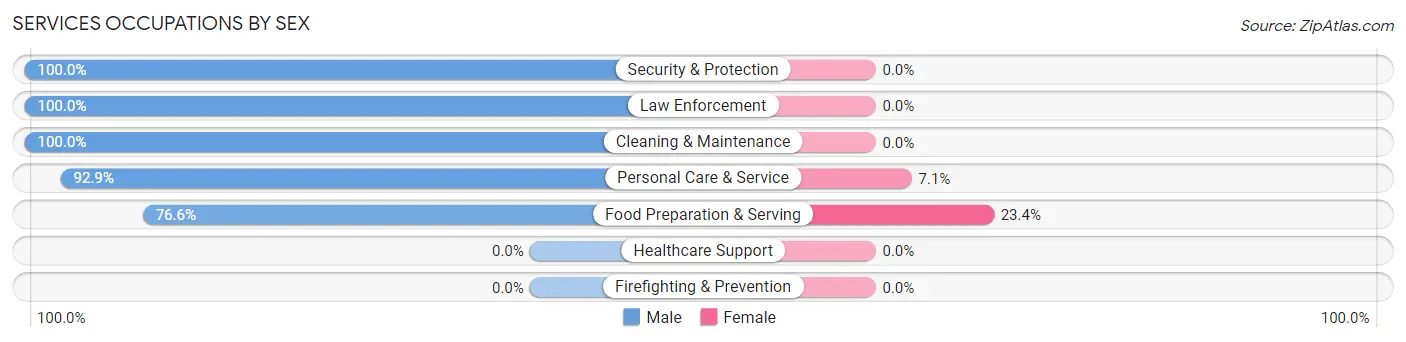
Services Occupations by Sex
Within the Services occupations in Perryville, the most male-oriented occupations are Security & Protection (100.0%), Law Enforcement (100.0%), and Cleaning & Maintenance (100.0%), while the most female-oriented occupations are Food Preparation & Serving (23.4%), and Personal Care & Service (7.1%).
| Occupation | Male | Female |
| Healthcare Support | 0 (0.0%) | 0 (0.0%) |
| Security & Protection | 4 (100.0%) | 0 (0.0%) |
| Firefighting & Prevention | 0 (0.0%) | 0 (0.0%) |
| Law Enforcement | 4 (100.0%) | 0 (0.0%) |
| Food Preparation & Serving | 36 (76.6%) | 11 (23.4%) |
| Cleaning & Maintenance | 6 (100.0%) | 0 (0.0%) |
| Personal Care & Service | 13 (92.9%) | 1 (7.1%) |
| Total (Category) | 59 (83.1%) | 12 (16.9%) |
| Total (Overall) | 176 (45.0%) | 215 (55.0%) |
Sales and Office Occupations
The most common Sales and Office occupations in Perryville are Office & Administration (137 | 35.0%), and Sales & Related (34 | 8.7%).
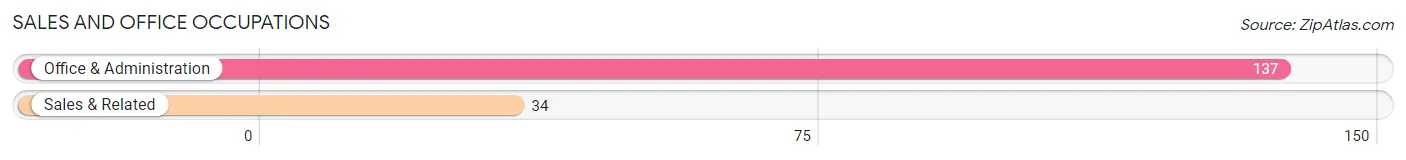
Sales and Office Occupations by Sex
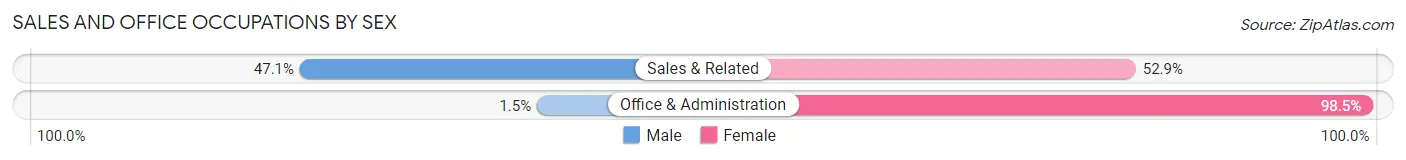
| Occupation | Male | Female |
| Sales & Related | 16 (47.1%) | 18 (52.9%) |
| Office & Administration | 2 (1.5%) | 135 (98.5%) |
| Total (Category) | 18 (10.5%) | 153 (89.5%) |
| Total (Overall) | 176 (45.0%) | 215 (55.0%) |
Natural Resources, Construction and Maintenance Occupations
The most common Natural Resources, Construction and Maintenance occupations in Perryville are Installation, Maintenance & Repair (3 | 0.8%), and Construction & Extraction (2 | 0.5%).
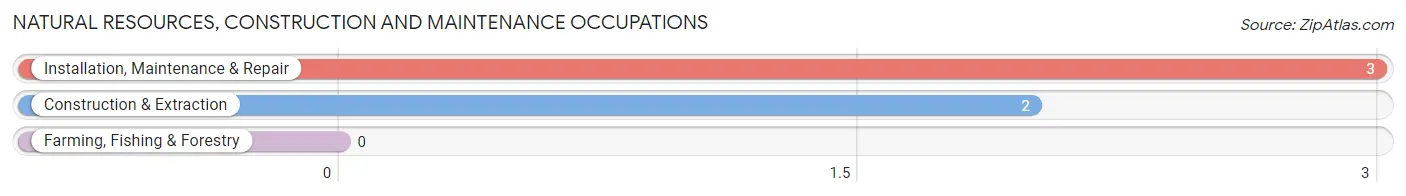
Natural Resources, Construction and Maintenance Occupations by Sex
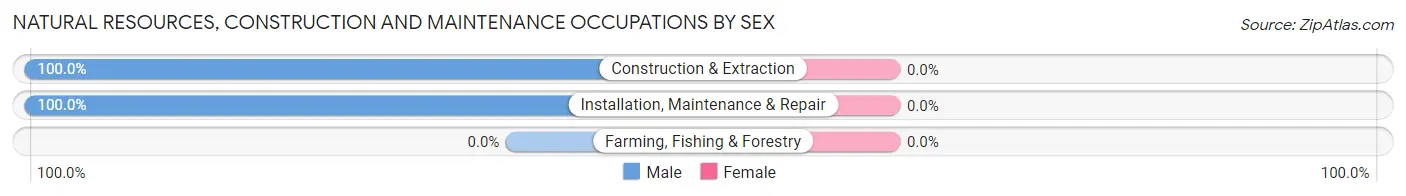
| Occupation | Male | Female |
| Farming, Fishing & Forestry | 0 (0.0%) | 0 (0.0%) |
| Construction & Extraction | 2 (100.0%) | 0 (0.0%) |
| Installation, Maintenance & Repair | 3 (100.0%) | 0 (0.0%) |
| Total (Category) | 5 (100.0%) | 0 (0.0%) |
| Total (Overall) | 176 (45.0%) | 215 (55.0%) |
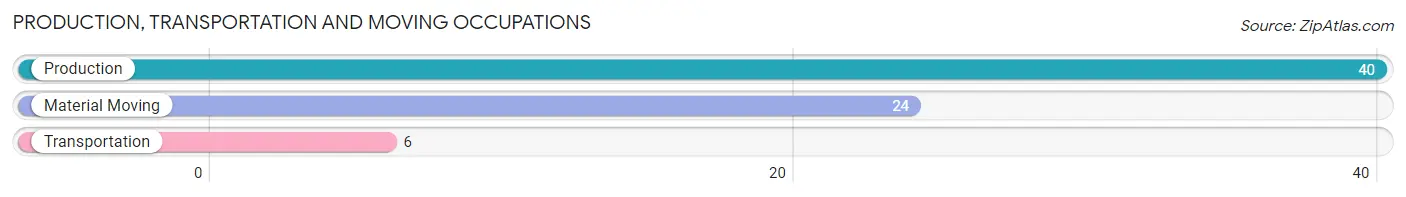
Production, Transportation and Moving Occupations
The most common Production, Transportation and Moving occupations in Perryville are Production (40 | 10.2%), Material Moving (24 | 6.1%), and Transportation (6 | 1.5%).
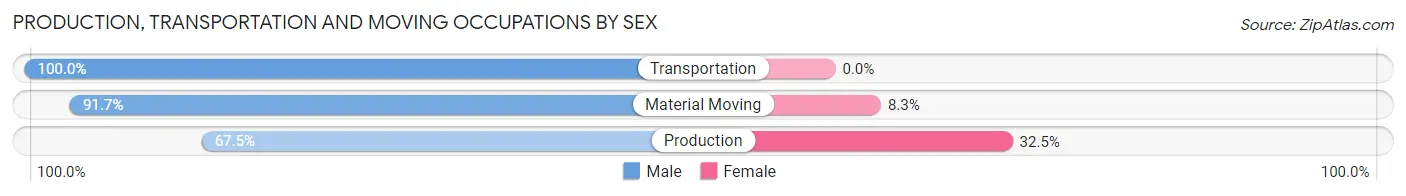
Production, Transportation and Moving Occupations by Sex
| Occupation | Male | Female |
| Production | 27 (67.5%) | 13 (32.5%) |
| Transportation | 6 (100.0%) | 0 (0.0%) |
| Material Moving | 22 (91.7%) | 2 (8.3%) |
| Total (Category) | 55 (78.6%) | 15 (21.4%) |
| Total (Overall) | 176 (45.0%) | 215 (55.0%) |
Employment Industries by Sex in Perryville
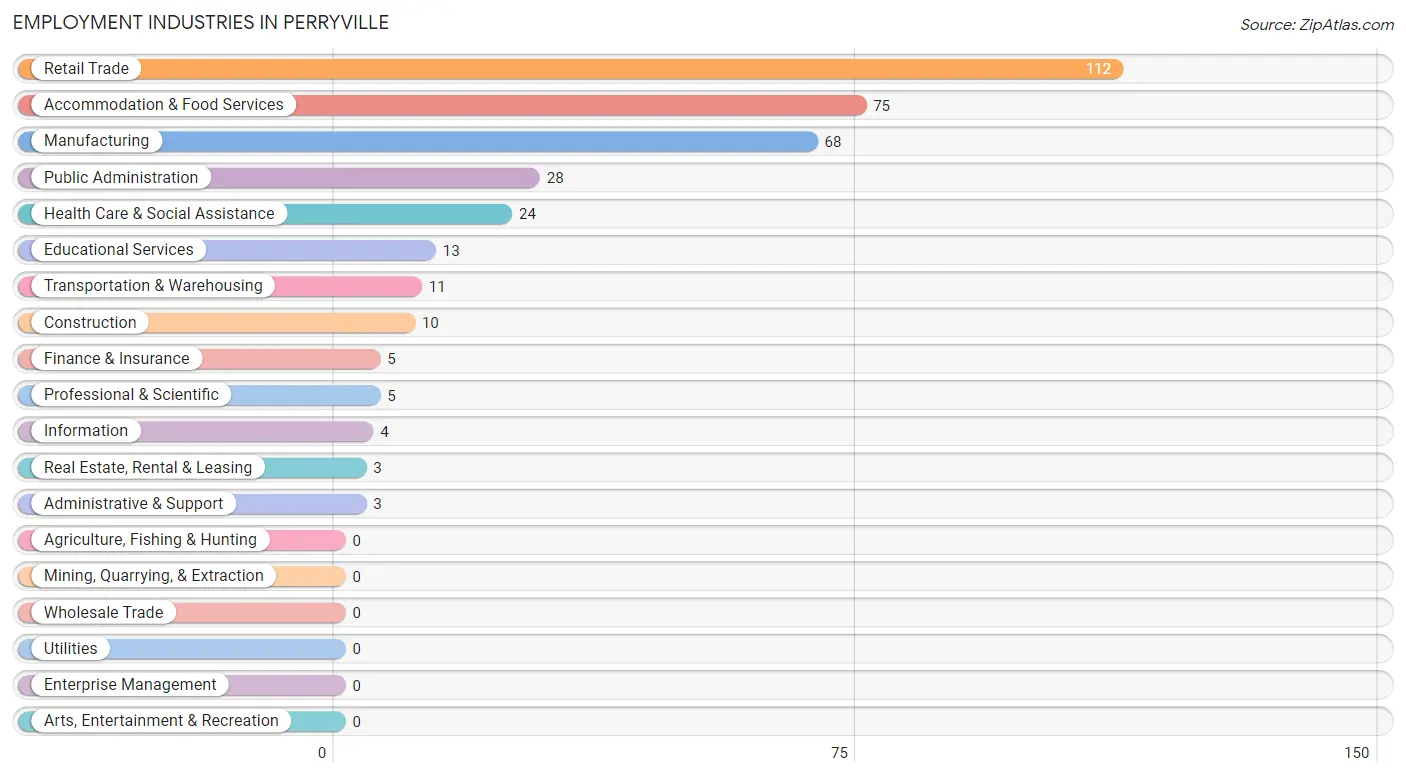
Employment Industries in Perryville
The major employment industries in Perryville include Retail Trade (112 | 28.6%), Accommodation & Food Services (75 | 19.2%), Manufacturing (68 | 17.4%), Public Administration (28 | 7.2%), and Health Care & Social Assistance (24 | 6.1%).
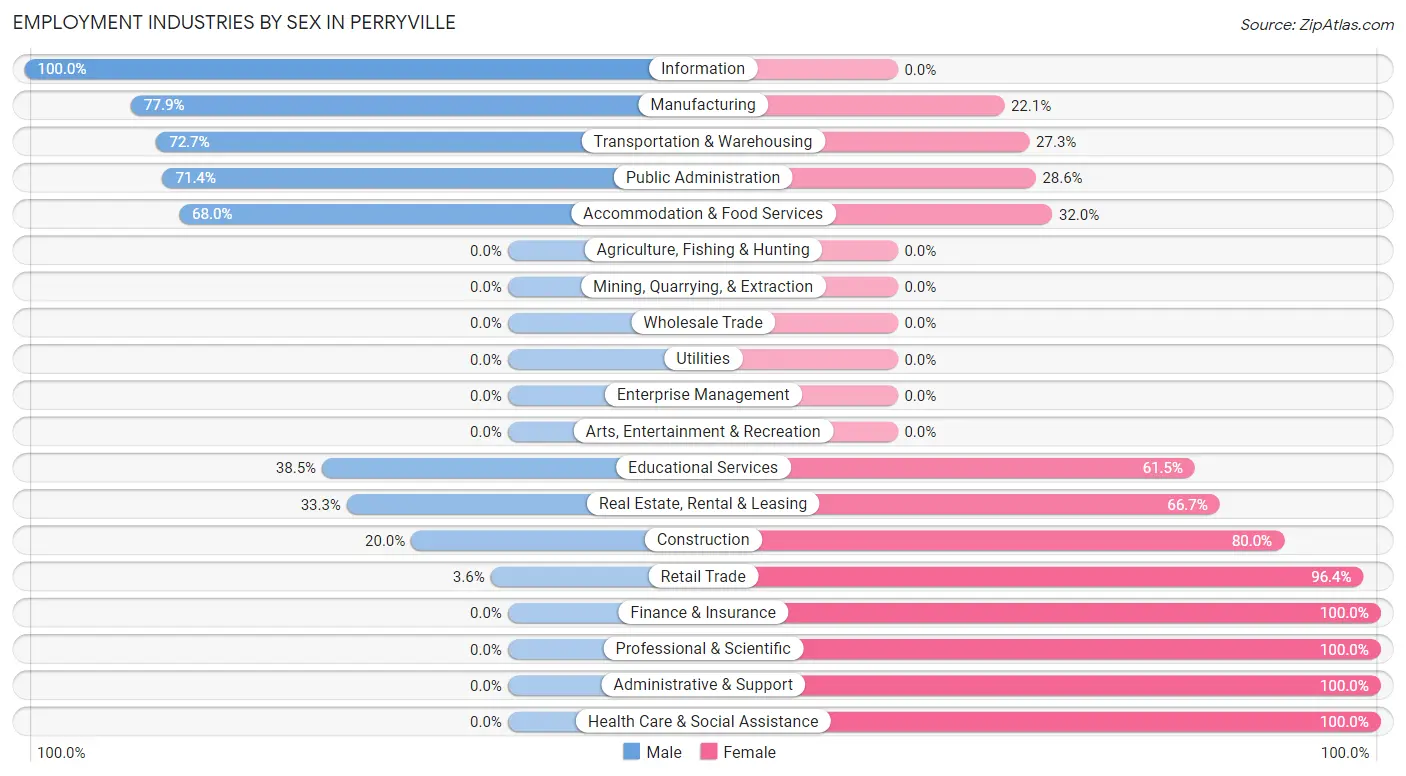
Employment Industries by Sex in Perryville
The Perryville industries that see more men than women are Information (100.0%), Manufacturing (77.9%), and Transportation & Warehousing (72.7%), whereas the industries that tend to have a higher number of women are Finance & Insurance (100.0%), Professional & Scientific (100.0%), and Administrative & Support (100.0%).
| Industry | Male | Female |
| Agriculture, Fishing & Hunting | 0 (0.0%) | 0 (0.0%) |
| Mining, Quarrying, & Extraction | 0 (0.0%) | 0 (0.0%) |
| Construction | 2 (20.0%) | 8 (80.0%) |
| Manufacturing | 53 (77.9%) | 15 (22.1%) |
| Wholesale Trade | 0 (0.0%) | 0 (0.0%) |
| Retail Trade | 4 (3.6%) | 108 (96.4%) |
| Transportation & Warehousing | 8 (72.7%) | 3 (27.3%) |
| Utilities | 0 (0.0%) | 0 (0.0%) |
| Information | 4 (100.0%) | 0 (0.0%) |
| Finance & Insurance | 0 (0.0%) | 5 (100.0%) |
| Real Estate, Rental & Leasing | 1 (33.3%) | 2 (66.7%) |
| Professional & Scientific | 0 (0.0%) | 5 (100.0%) |
| Enterprise Management | 0 (0.0%) | 0 (0.0%) |
| Administrative & Support | 0 (0.0%) | 3 (100.0%) |
| Educational Services | 5 (38.5%) | 8 (61.5%) |
| Health Care & Social Assistance | 0 (0.0%) | 24 (100.0%) |
| Arts, Entertainment & Recreation | 0 (0.0%) | 0 (0.0%) |
| Accommodation & Food Services | 51 (68.0%) | 24 (32.0%) |
| Public Administration | 20 (71.4%) | 8 (28.6%) |
| Total | 176 (45.0%) | 215 (55.0%) |
Education in Perryville
School Enrollment in Perryville
The most common levels of schooling among the 216 students in Perryville are high school (140 | 64.8%), elementary school (31 | 14.3%), and middle school (24 | 11.1%).
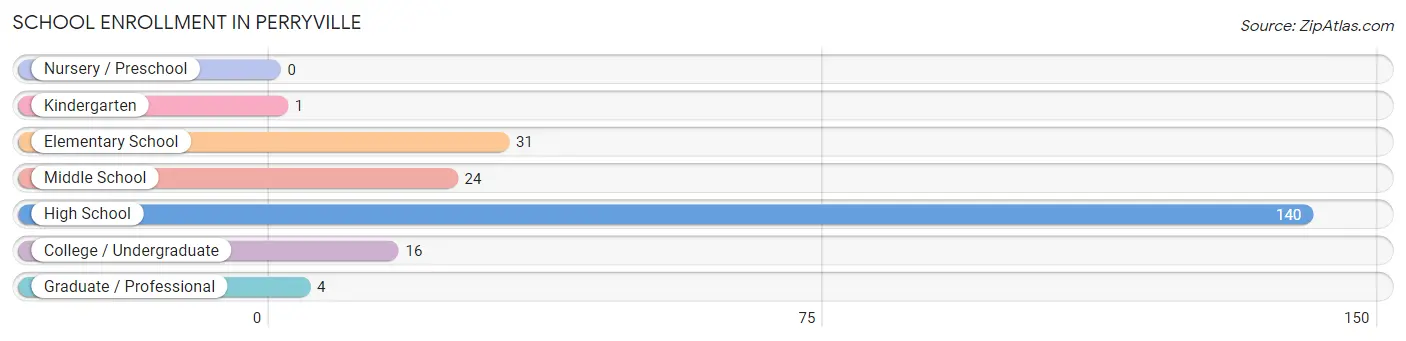
| School Level | # Students | % Students |
| Nursery / Preschool | 0 | 0.0% |
| Kindergarten | 1 | 0.5% |
| Elementary School | 31 | 14.3% |
| Middle School | 24 | 11.1% |
| High School | 140 | 64.8% |
| College / Undergraduate | 16 | 7.4% |
| Graduate / Professional | 4 | 1.8% |
| Total | 216 | 100.0% |
School Enrollment by Age by Funding Source in Perryville
Out of a total of 216 students who are enrolled in schools in Perryville, 12 (5.6%) attend a private institution, while the remaining 204 (94.4%) are enrolled in public schools. The age group of 35 years and over has the highest likelihood of being enrolled in private schools, with 2 (66.7% in the age bracket) enrolled. Conversely, the age group of 10 to 14 year olds has the lowest likelihood of being enrolled in a private school, with 23 (100.0% in the age bracket) attending a public institution.
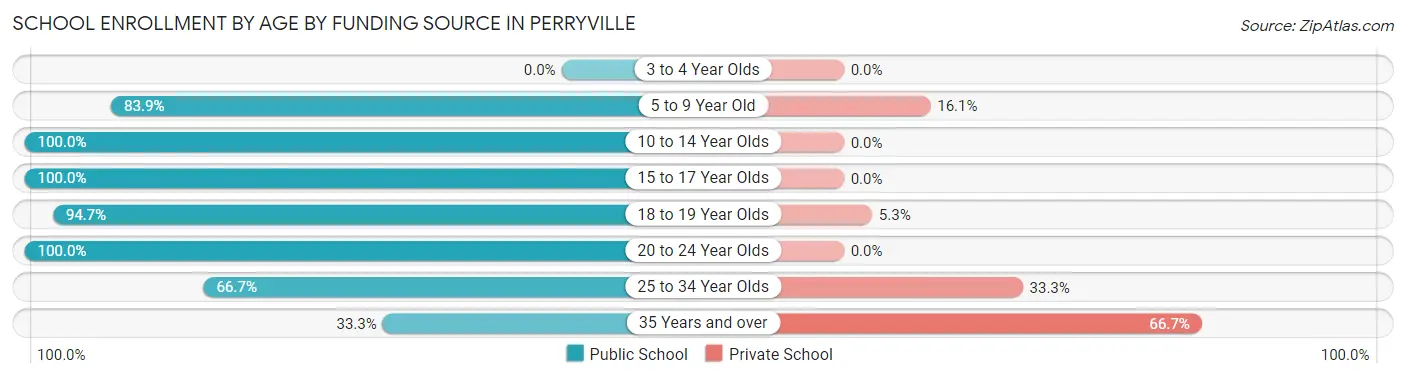
| Age Bracket | Public School | Private School |
| 3 to 4 Year Olds | 0 (0.0%) | 0 (0.0%) |
| 5 to 9 Year Old | 26 (83.9%) | 5 (16.1%) |
| 10 to 14 Year Olds | 23 (100.0%) | 0 (0.0%) |
| 15 to 17 Year Olds | 107 (100.0%) | 0 (0.0%) |
| 18 to 19 Year Olds | 36 (94.7%) | 2 (5.3%) |
| 20 to 24 Year Olds | 5 (100.0%) | 0 (0.0%) |
| 25 to 34 Year Olds | 6 (66.7%) | 3 (33.3%) |
| 35 Years and over | 1 (33.3%) | 2 (66.7%) |
| Total | 204 (94.4%) | 12 (5.6%) |
Educational Attainment by Field of Study in Perryville
Science & technology (114 | 53.3%), business (22 | 10.3%), arts & humanities (20 | 9.3%), education (15 | 7.0%), and literature & languages (15 | 7.0%) are the most common fields of study among 214 individuals in Perryville who have obtained a bachelor's degree or higher.
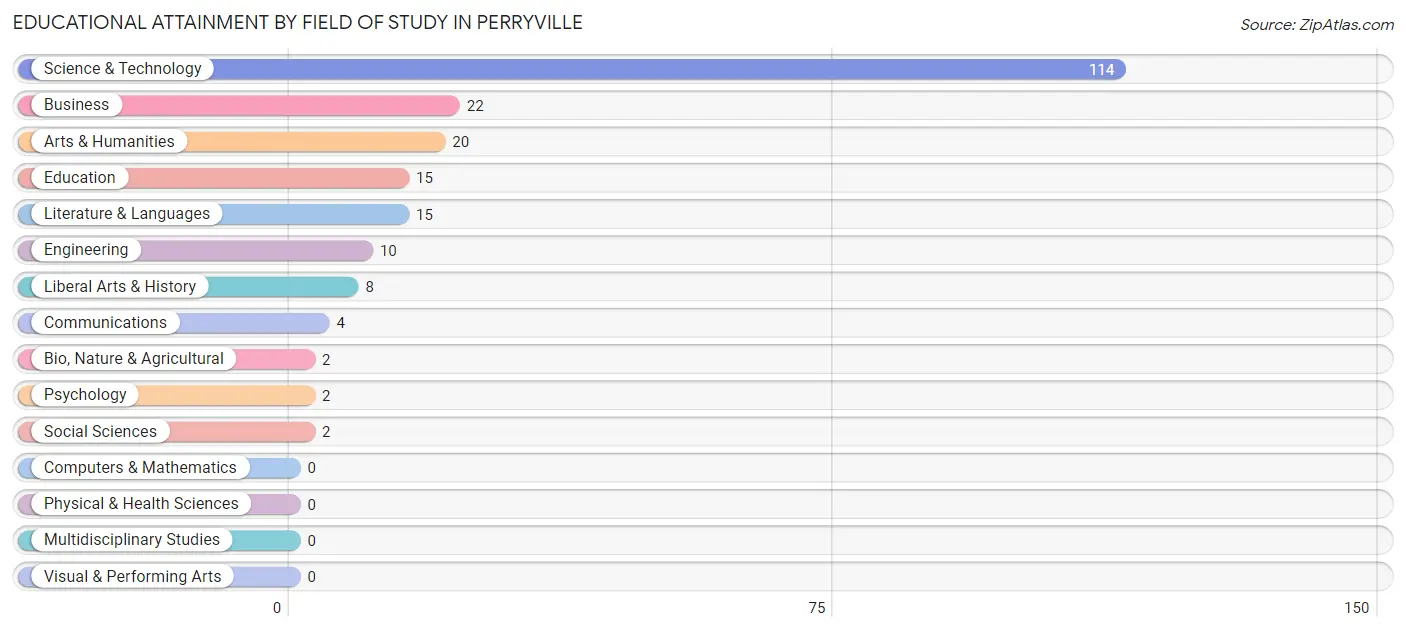
| Field of Study | # Graduates | % Graduates |
| Computers & Mathematics | 0 | 0.0% |
| Bio, Nature & Agricultural | 2 | 0.9% |
| Physical & Health Sciences | 0 | 0.0% |
| Psychology | 2 | 0.9% |
| Social Sciences | 2 | 0.9% |
| Engineering | 10 | 4.7% |
| Multidisciplinary Studies | 0 | 0.0% |
| Science & Technology | 114 | 53.3% |
| Business | 22 | 10.3% |
| Education | 15 | 7.0% |
| Literature & Languages | 15 | 7.0% |
| Liberal Arts & History | 8 | 3.7% |
| Visual & Performing Arts | 0 | 0.0% |
| Communications | 4 | 1.9% |
| Arts & Humanities | 20 | 9.3% |
| Total | 214 | 100.0% |
Transportation & Commute in Perryville
Vehicle Availability by Sex in Perryville
The most prevalent vehicle ownership categories in Perryville are males with 1 vehicle (53, accounting for 30.1%) and females with 1 vehicle (114, making up 24.9%).
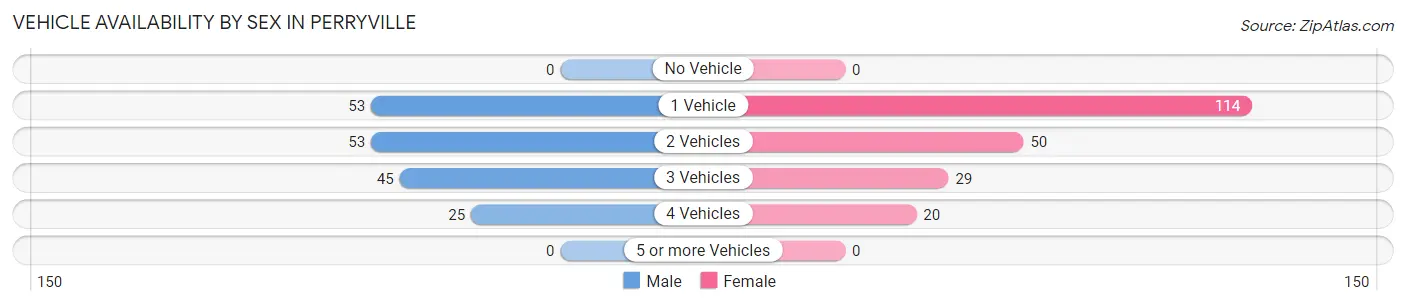
| Vehicles Available | Male | Female |
| No Vehicle | 0 (0.0%) | 0 (0.0%) |
| 1 Vehicle | 53 (30.1%) | 114 (53.5%) |
| 2 Vehicles | 53 (30.1%) | 50 (23.5%) |
| 3 Vehicles | 45 (25.6%) | 29 (13.6%) |
| 4 Vehicles | 25 (14.2%) | 20 (9.4%) |
| 5 or more Vehicles | 0 (0.0%) | 0 (0.0%) |
| Total | 176 (100.0%) | 213 (100.0%) |
Commute Time in Perryville
The most frequently occuring commute durations in Perryville are 15 to 19 minutes (126 commuters, 32.9%), 20 to 24 minutes (82 commuters, 21.4%), and 30 to 34 minutes (51 commuters, 13.3%).
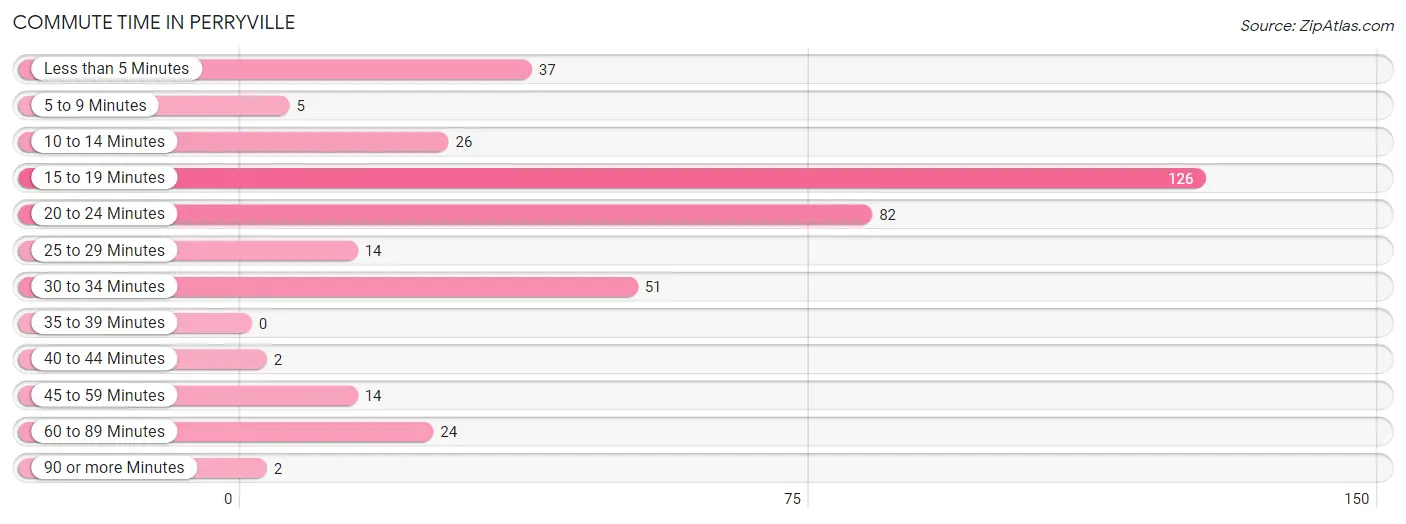
| Commute Time | # Commuters | % Commuters |
| Less than 5 Minutes | 37 | 9.7% |
| 5 to 9 Minutes | 5 | 1.3% |
| 10 to 14 Minutes | 26 | 6.8% |
| 15 to 19 Minutes | 126 | 32.9% |
| 20 to 24 Minutes | 82 | 21.4% |
| 25 to 29 Minutes | 14 | 3.7% |
| 30 to 34 Minutes | 51 | 13.3% |
| 35 to 39 Minutes | 0 | 0.0% |
| 40 to 44 Minutes | 2 | 0.5% |
| 45 to 59 Minutes | 14 | 3.7% |
| 60 to 89 Minutes | 24 | 6.3% |
| 90 or more Minutes | 2 | 0.5% |
Commute Time by Sex in Perryville
The most common commute times in Perryville are 20 to 24 minutes (63 commuters, 35.8%) for males and 15 to 19 minutes (115 commuters, 55.6%) for females.
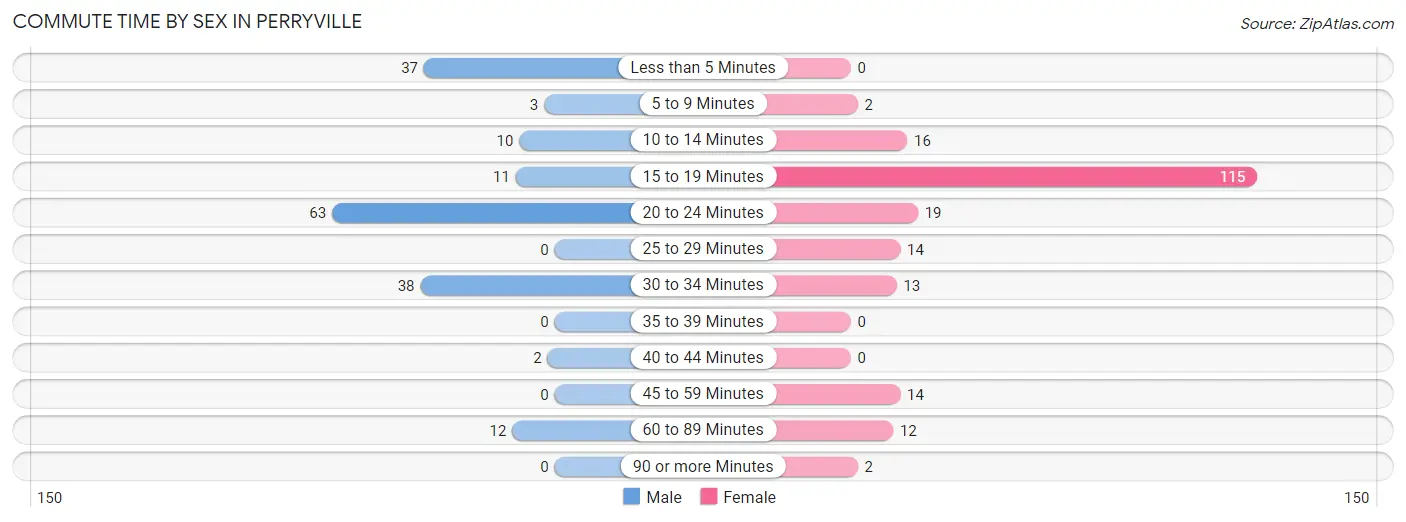
| Commute Time | Male | Female |
| Less than 5 Minutes | 37 (21.0%) | 0 (0.0%) |
| 5 to 9 Minutes | 3 (1.7%) | 2 (1.0%) |
| 10 to 14 Minutes | 10 (5.7%) | 16 (7.7%) |
| 15 to 19 Minutes | 11 (6.2%) | 115 (55.6%) |
| 20 to 24 Minutes | 63 (35.8%) | 19 (9.2%) |
| 25 to 29 Minutes | 0 (0.0%) | 14 (6.8%) |
| 30 to 34 Minutes | 38 (21.6%) | 13 (6.3%) |
| 35 to 39 Minutes | 0 (0.0%) | 0 (0.0%) |
| 40 to 44 Minutes | 2 (1.1%) | 0 (0.0%) |
| 45 to 59 Minutes | 0 (0.0%) | 14 (6.8%) |
| 60 to 89 Minutes | 12 (6.8%) | 12 (5.8%) |
| 90 or more Minutes | 0 (0.0%) | 2 (1.0%) |
Time of Departure to Work by Sex in Perryville
The most frequent times of departure to work in Perryville are 12:00 PM to 3:59 PM (57, 32.4%) for males and 7:30 AM to 7:59 AM (113, 54.6%) for females.
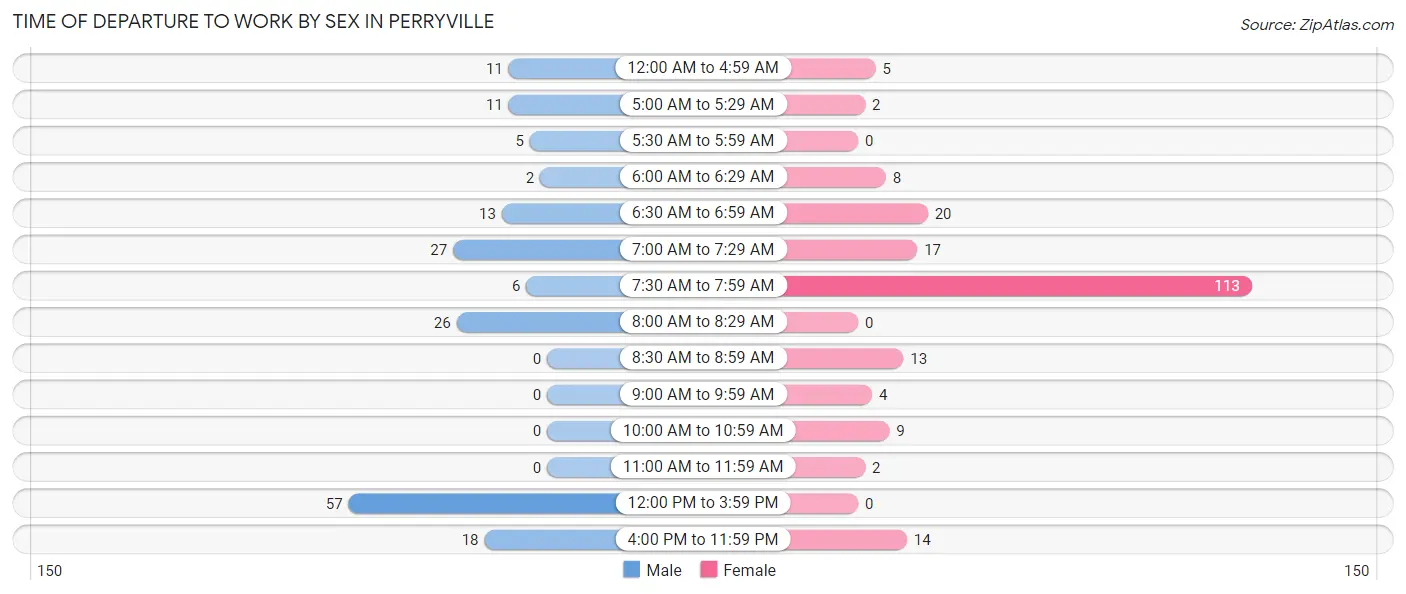
| Time of Departure | Male | Female |
| 12:00 AM to 4:59 AM | 11 (6.2%) | 5 (2.4%) |
| 5:00 AM to 5:29 AM | 11 (6.2%) | 2 (1.0%) |
| 5:30 AM to 5:59 AM | 5 (2.8%) | 0 (0.0%) |
| 6:00 AM to 6:29 AM | 2 (1.1%) | 8 (3.9%) |
| 6:30 AM to 6:59 AM | 13 (7.4%) | 20 (9.7%) |
| 7:00 AM to 7:29 AM | 27 (15.3%) | 17 (8.2%) |
| 7:30 AM to 7:59 AM | 6 (3.4%) | 113 (54.6%) |
| 8:00 AM to 8:29 AM | 26 (14.8%) | 0 (0.0%) |
| 8:30 AM to 8:59 AM | 0 (0.0%) | 13 (6.3%) |
| 9:00 AM to 9:59 AM | 0 (0.0%) | 4 (1.9%) |
| 10:00 AM to 10:59 AM | 0 (0.0%) | 9 (4.3%) |
| 11:00 AM to 11:59 AM | 0 (0.0%) | 2 (1.0%) |
| 12:00 PM to 3:59 PM | 57 (32.4%) | 0 (0.0%) |
| 4:00 PM to 11:59 PM | 18 (10.2%) | 14 (6.8%) |
| Total | 176 (100.0%) | 207 (100.0%) |
Housing Occupancy in Perryville
Occupancy by Ownership in Perryville
Of the total 396 dwellings in Perryville, owner-occupied units account for 312 (78.8%), while renter-occupied units make up 84 (21.2%).
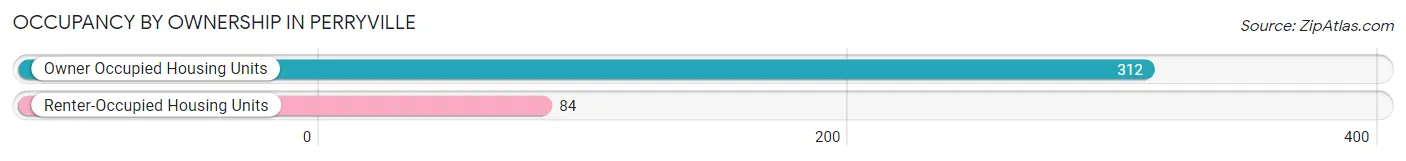
| Occupancy | # Housing Units | % Housing Units |
| Owner Occupied Housing Units | 312 | 78.8% |
| Renter-Occupied Housing Units | 84 | 21.2% |
| Total Occupied Housing Units | 396 | 100.0% |
Occupancy by Household Size in Perryville
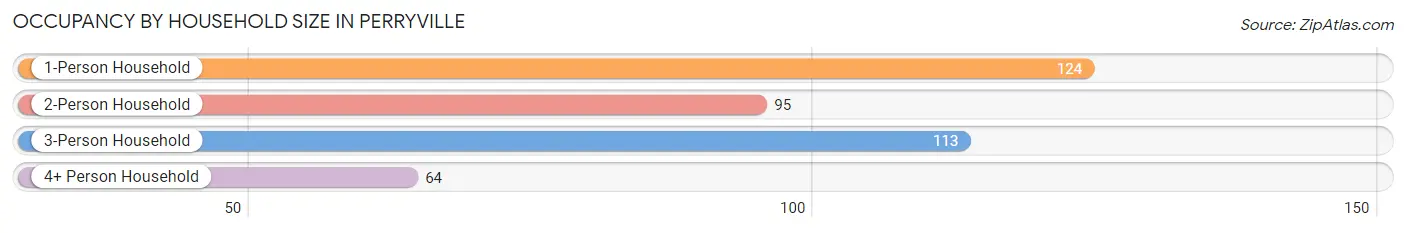
| Household Size | # Housing Units | % Housing Units |
| 1-Person Household | 124 | 31.3% |
| 2-Person Household | 95 | 24.0% |
| 3-Person Household | 113 | 28.5% |
| 4+ Person Household | 64 | 16.2% |
| Total Housing Units | 396 | 100.0% |
Occupancy by Ownership by Household Size in Perryville
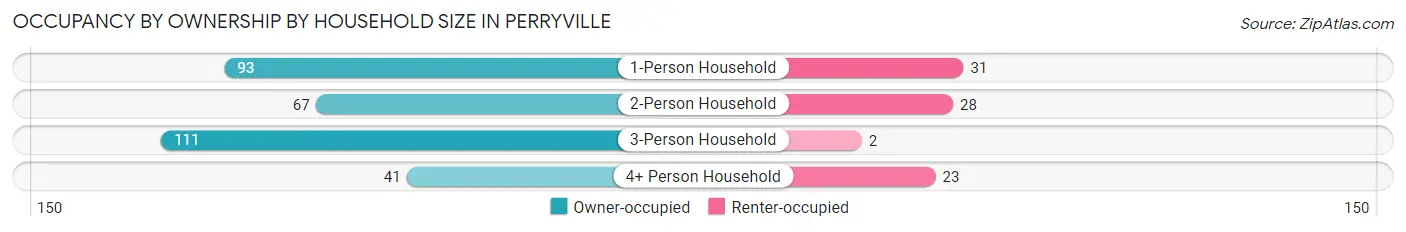
| Household Size | Owner-occupied | Renter-occupied |
| 1-Person Household | 93 (75.0%) | 31 (25.0%) |
| 2-Person Household | 67 (70.5%) | 28 (29.5%) |
| 3-Person Household | 111 (98.2%) | 2 (1.8%) |
| 4+ Person Household | 41 (64.1%) | 23 (35.9%) |
| Total Housing Units | 312 (78.8%) | 84 (21.2%) |
Occupancy by Educational Attainment in Perryville
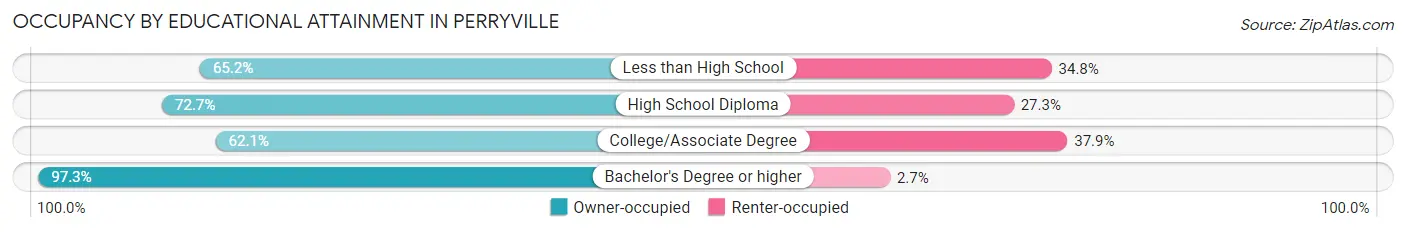
| Household Size | Owner-occupied | Renter-occupied |
| Less than High School | 15 (65.2%) | 8 (34.8%) |
| High School Diploma | 96 (72.7%) | 36 (27.3%) |
| College/Associate Degree | 59 (62.1%) | 36 (37.9%) |
| Bachelor's Degree or higher | 142 (97.3%) | 4 (2.7%) |
Occupancy by Age of Householder in Perryville
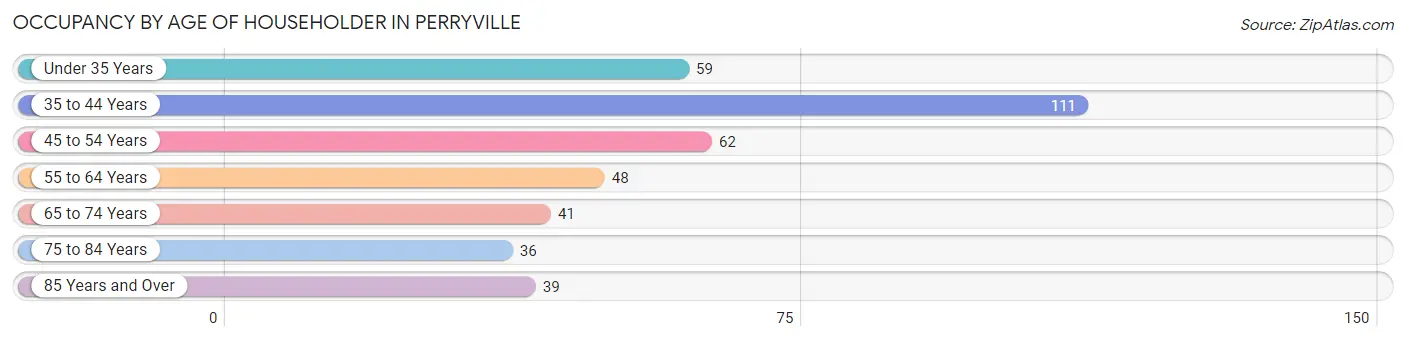
| Age Bracket | # Households | % Households |
| Under 35 Years | 59 | 14.9% |
| 35 to 44 Years | 111 | 28.0% |
| 45 to 54 Years | 62 | 15.7% |
| 55 to 64 Years | 48 | 12.1% |
| 65 to 74 Years | 41 | 10.3% |
| 75 to 84 Years | 36 | 9.1% |
| 85 Years and Over | 39 | 9.9% |
| Total | 396 | 100.0% |
Housing Finances in Perryville
Median Income by Occupancy in Perryville
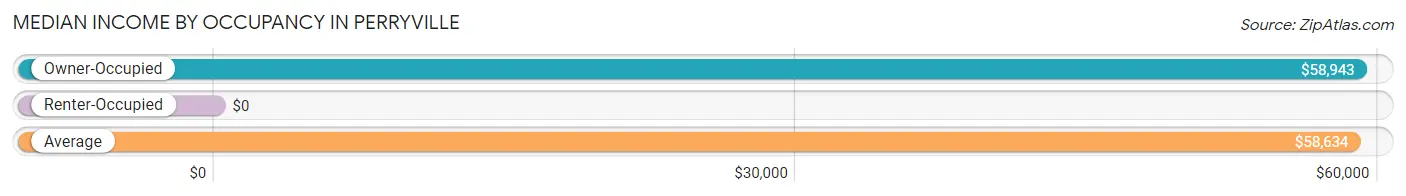
| Occupancy Type | # Households | Median Income |
| Owner-Occupied | 312 (78.8%) | $58,943 |
| Renter-Occupied | 84 (21.2%) | $0 |
| Average | 396 (100.0%) | $58,634 |
Occupancy by Householder Income Bracket in Perryville
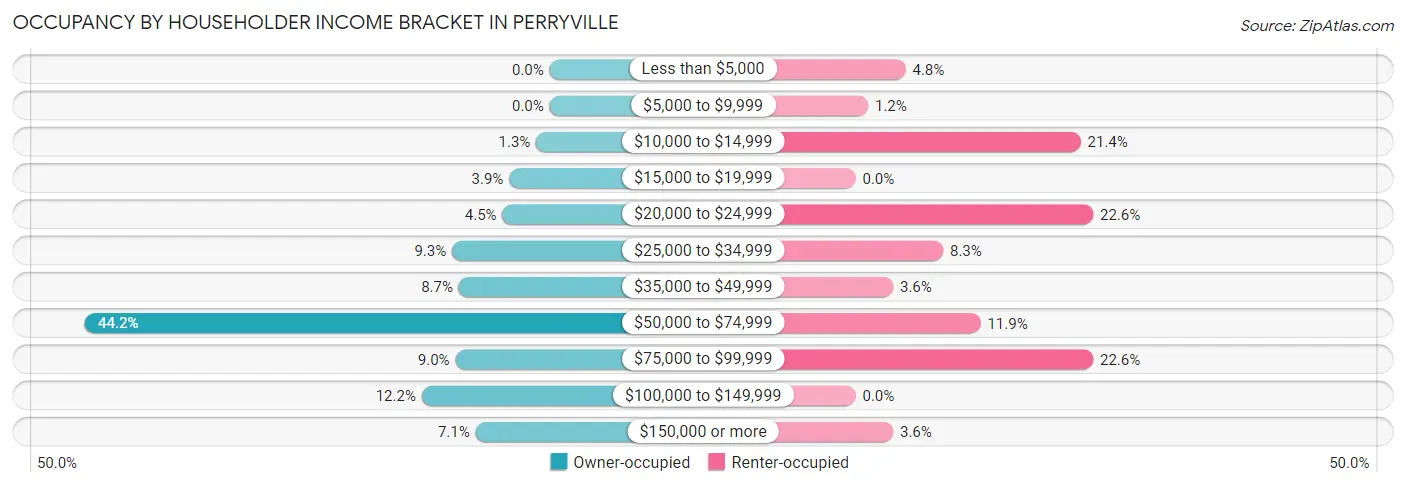
| Income Bracket | Owner-occupied | Renter-occupied |
| Less than $5,000 | 0 (0.0%) | 4 (4.8%) |
| $5,000 to $9,999 | 0 (0.0%) | 1 (1.2%) |
| $10,000 to $14,999 | 4 (1.3%) | 18 (21.4%) |
| $15,000 to $19,999 | 12 (3.8%) | 0 (0.0%) |
| $20,000 to $24,999 | 14 (4.5%) | 19 (22.6%) |
| $25,000 to $34,999 | 29 (9.3%) | 7 (8.3%) |
| $35,000 to $49,999 | 27 (8.6%) | 3 (3.6%) |
| $50,000 to $74,999 | 138 (44.2%) | 10 (11.9%) |
| $75,000 to $99,999 | 28 (9.0%) | 19 (22.6%) |
| $100,000 to $149,999 | 38 (12.2%) | 0 (0.0%) |
| $150,000 or more | 22 (7.0%) | 3 (3.6%) |
| Total | 312 (100.0%) | 84 (100.0%) |
Monthly Housing Cost Tiers in Perryville
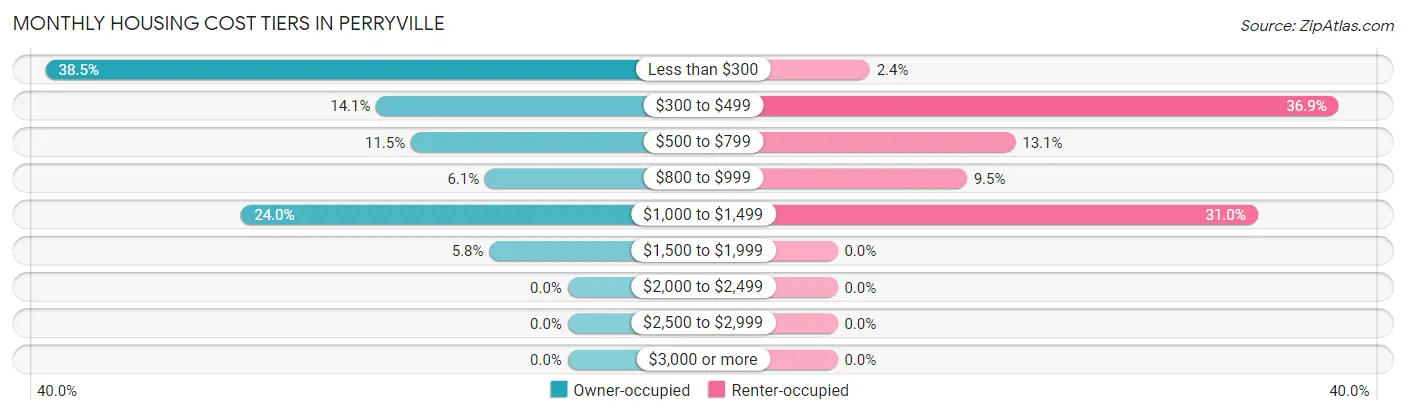
| Monthly Cost | Owner-occupied | Renter-occupied |
| Less than $300 | 120 (38.5%) | 2 (2.4%) |
| $300 to $499 | 44 (14.1%) | 31 (36.9%) |
| $500 to $799 | 36 (11.5%) | 11 (13.1%) |
| $800 to $999 | 19 (6.1%) | 8 (9.5%) |
| $1,000 to $1,499 | 75 (24.0%) | 26 (30.9%) |
| $1,500 to $1,999 | 18 (5.8%) | 0 (0.0%) |
| $2,000 to $2,499 | 0 (0.0%) | 0 (0.0%) |
| $2,500 to $2,999 | 0 (0.0%) | 0 (0.0%) |
| $3,000 or more | 0 (0.0%) | 0 (0.0%) |
| Total | 312 (100.0%) | 84 (100.0%) |
Physical Housing Characteristics in Perryville
Housing Structures in Perryville
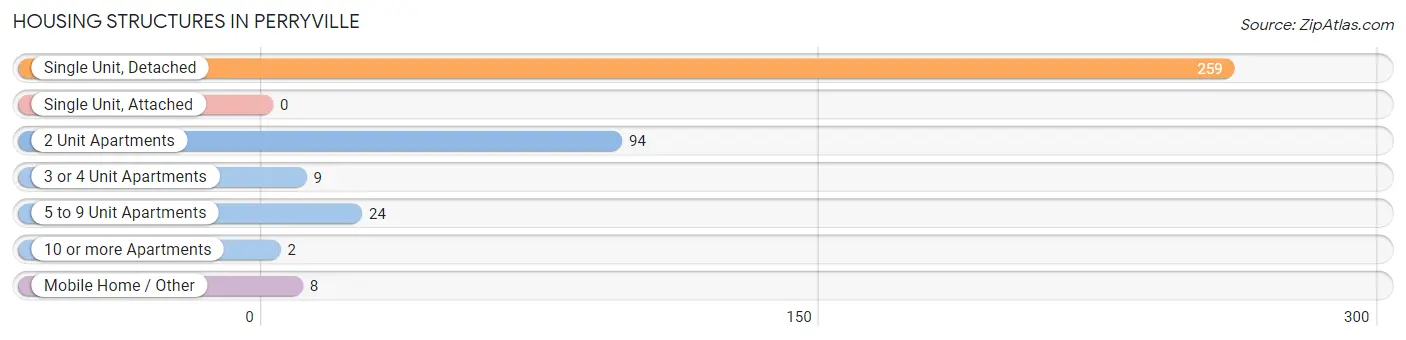
| Structure Type | # Housing Units | % Housing Units |
| Single Unit, Detached | 259 | 65.4% |
| Single Unit, Attached | 0 | 0.0% |
| 2 Unit Apartments | 94 | 23.7% |
| 3 or 4 Unit Apartments | 9 | 2.3% |
| 5 to 9 Unit Apartments | 24 | 6.1% |
| 10 or more Apartments | 2 | 0.5% |
| Mobile Home / Other | 8 | 2.0% |
| Total | 396 | 100.0% |
Housing Structures by Occupancy in Perryville
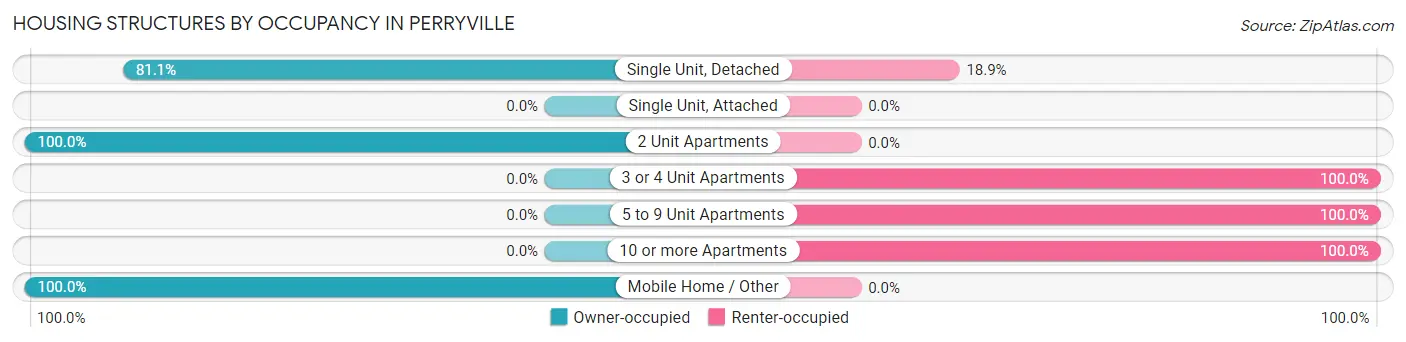
| Structure Type | Owner-occupied | Renter-occupied |
| Single Unit, Detached | 210 (81.1%) | 49 (18.9%) |
| Single Unit, Attached | 0 (0.0%) | 0 (0.0%) |
| 2 Unit Apartments | 94 (100.0%) | 0 (0.0%) |
| 3 or 4 Unit Apartments | 0 (0.0%) | 9 (100.0%) |
| 5 to 9 Unit Apartments | 0 (0.0%) | 24 (100.0%) |
| 10 or more Apartments | 0 (0.0%) | 2 (100.0%) |
| Mobile Home / Other | 8 (100.0%) | 0 (0.0%) |
| Total | 312 (78.8%) | 84 (21.2%) |
Housing Structures by Number of Rooms in Perryville
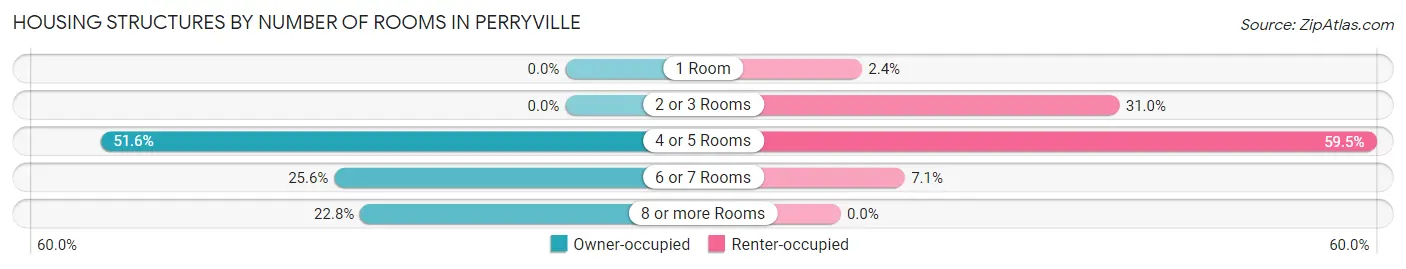
| Number of Rooms | Owner-occupied | Renter-occupied |
| 1 Room | 0 (0.0%) | 2 (2.4%) |
| 2 or 3 Rooms | 0 (0.0%) | 26 (30.9%) |
| 4 or 5 Rooms | 161 (51.6%) | 50 (59.5%) |
| 6 or 7 Rooms | 80 (25.6%) | 6 (7.1%) |
| 8 or more Rooms | 71 (22.8%) | 0 (0.0%) |
| Total | 312 (100.0%) | 84 (100.0%) |
Housing Structure by Heating Type in Perryville
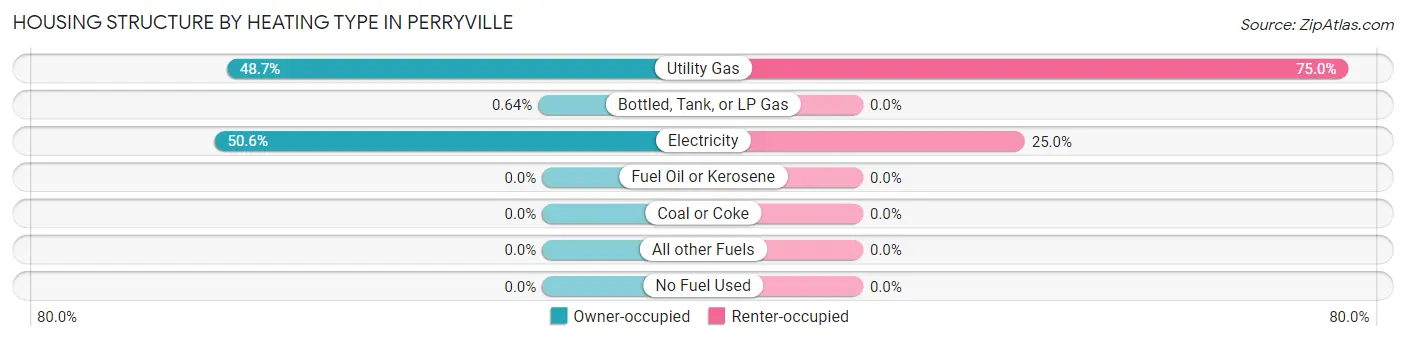
| Heating Type | Owner-occupied | Renter-occupied |
| Utility Gas | 152 (48.7%) | 63 (75.0%) |
| Bottled, Tank, or LP Gas | 2 (0.6%) | 0 (0.0%) |
| Electricity | 158 (50.6%) | 21 (25.0%) |
| Fuel Oil or Kerosene | 0 (0.0%) | 0 (0.0%) |
| Coal or Coke | 0 (0.0%) | 0 (0.0%) |
| All other Fuels | 0 (0.0%) | 0 (0.0%) |
| No Fuel Used | 0 (0.0%) | 0 (0.0%) |
| Total | 312 (100.0%) | 84 (100.0%) |
Household Vehicle Usage in Perryville
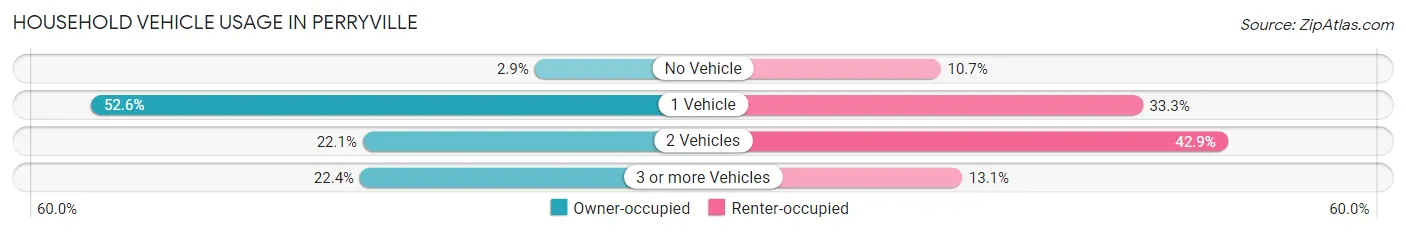
| Vehicles per Household | Owner-occupied | Renter-occupied |
| No Vehicle | 9 (2.9%) | 9 (10.7%) |
| 1 Vehicle | 164 (52.6%) | 28 (33.3%) |
| 2 Vehicles | 69 (22.1%) | 36 (42.9%) |
| 3 or more Vehicles | 70 (22.4%) | 11 (13.1%) |
| Total | 312 (100.0%) | 84 (100.0%) |
Real Estate & Mortgages in Perryville
Real Estate and Mortgage Overview in Perryville
| Characteristic | Without Mortgage | With Mortgage |
| Housing Units | 191 | 121 |
| Median Property Value | $87,300 | $131,000 |
| Median Household Income | $58,312 | $19 |
| Monthly Housing Costs | $199 | $0 |
| Real Estate Taxes | $288 | $3 |
Property Value by Mortgage Status in Perryville
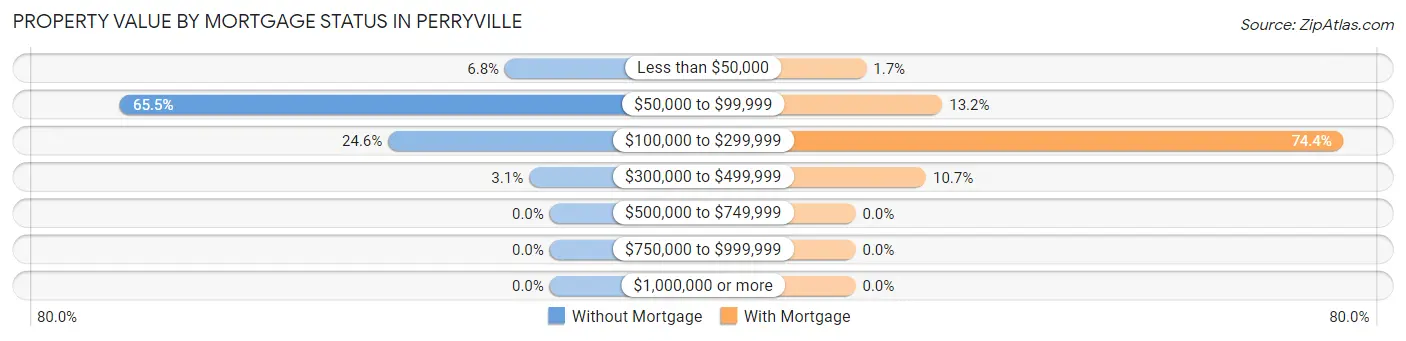
| Property Value | Without Mortgage | With Mortgage |
| Less than $50,000 | 13 (6.8%) | 2 (1.7%) |
| $50,000 to $99,999 | 125 (65.4%) | 16 (13.2%) |
| $100,000 to $299,999 | 47 (24.6%) | 90 (74.4%) |
| $300,000 to $499,999 | 6 (3.1%) | 13 (10.7%) |
| $500,000 to $749,999 | 0 (0.0%) | 0 (0.0%) |
| $750,000 to $999,999 | 0 (0.0%) | 0 (0.0%) |
| $1,000,000 or more | 0 (0.0%) | 0 (0.0%) |
| Total | 191 (100.0%) | 121 (100.0%) |
Household Income by Mortgage Status in Perryville
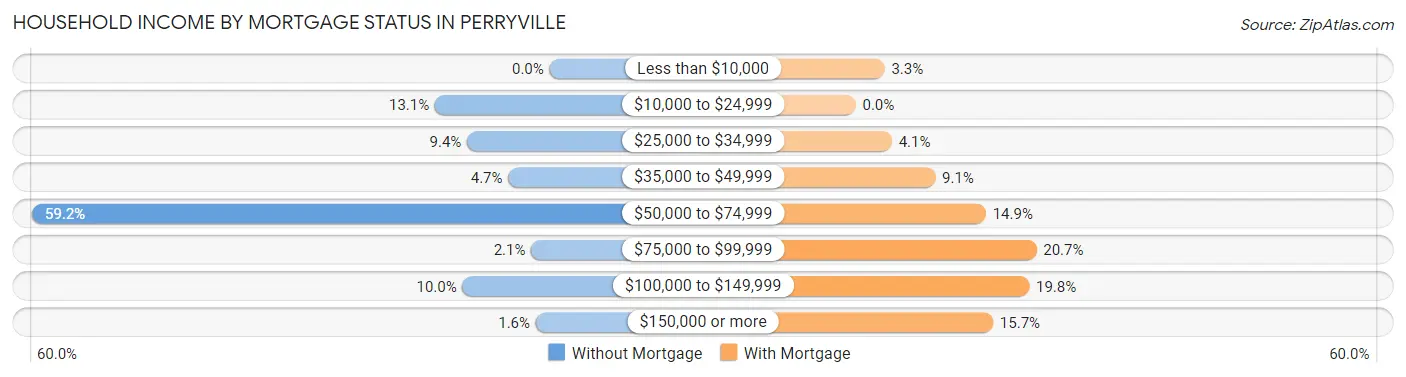
| Household Income | Without Mortgage | With Mortgage |
| Less than $10,000 | 0 (0.0%) | 4 (3.3%) |
| $10,000 to $24,999 | 25 (13.1%) | 0 (0.0%) |
| $25,000 to $34,999 | 18 (9.4%) | 5 (4.1%) |
| $35,000 to $49,999 | 9 (4.7%) | 11 (9.1%) |
| $50,000 to $74,999 | 113 (59.2%) | 18 (14.9%) |
| $75,000 to $99,999 | 4 (2.1%) | 25 (20.7%) |
| $100,000 to $149,999 | 19 (10.0%) | 24 (19.8%) |
| $150,000 or more | 3 (1.6%) | 19 (15.7%) |
| Total | 191 (100.0%) | 121 (100.0%) |
Property Value to Household Income Ratio in Perryville
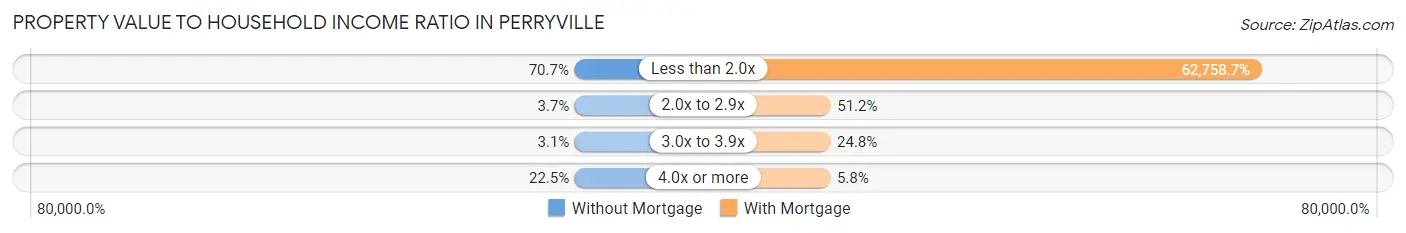
| Value-to-Income Ratio | Without Mortgage | With Mortgage |
| Less than 2.0x | 135 (70.7%) | 75,938 (62,758.7%) |
| 2.0x to 2.9x | 7 (3.7%) | 62 (51.2%) |
| 3.0x to 3.9x | 6 (3.1%) | 30 (24.8%) |
| 4.0x or more | 43 (22.5%) | 7 (5.8%) |
| Total | 191 (100.0%) | 121 (100.0%) |
Real Estate Taxes by Mortgage Status in Perryville
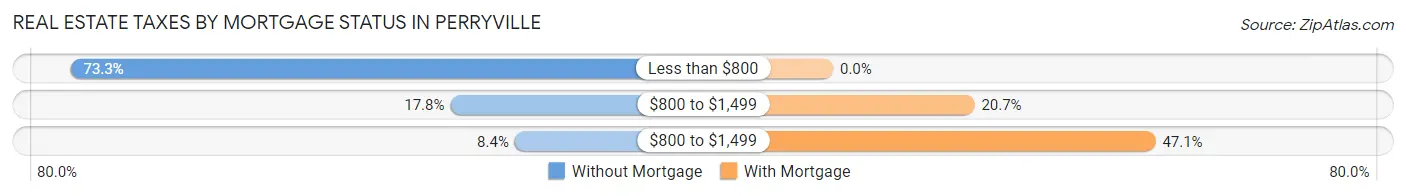
| Property Taxes | Without Mortgage | With Mortgage |
| Less than $800 | 140 (73.3%) | 0 (0.0%) |
| $800 to $1,499 | 34 (17.8%) | 25 (20.7%) |
| $800 to $1,499 | 16 (8.4%) | 57 (47.1%) |
| Total | 191 (100.0%) | 121 (100.0%) |
Health & Disability in Perryville
Health Insurance Coverage by Age in Perryville
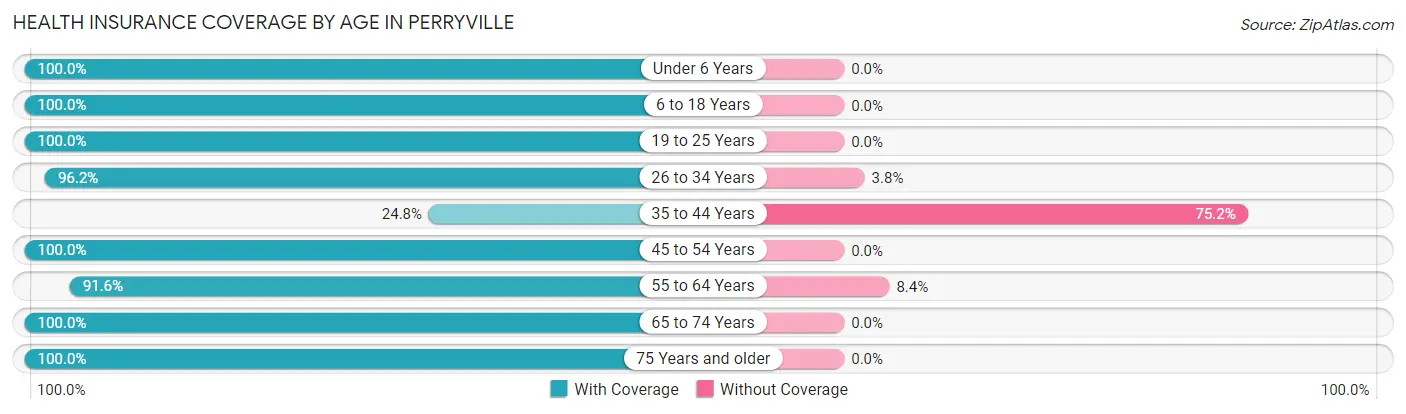
| Age Bracket | With Coverage | Without Coverage |
| Under 6 Years | 23 (100.0%) | 0 (0.0%) |
| 6 to 18 Years | 196 (100.0%) | 0 (0.0%) |
| 19 to 25 Years | 42 (100.0%) | 0 (0.0%) |
| 26 to 34 Years | 76 (96.2%) | 3 (3.8%) |
| 35 to 44 Years | 31 (24.8%) | 94 (75.2%) |
| 45 to 54 Years | 114 (100.0%) | 0 (0.0%) |
| 55 to 64 Years | 76 (91.6%) | 7 (8.4%) |
| 65 to 74 Years | 55 (100.0%) | 0 (0.0%) |
| 75 Years and older | 100 (100.0%) | 0 (0.0%) |
| Total | 713 (87.3%) | 104 (12.7%) |
Health Insurance Coverage by Citizenship Status in Perryville
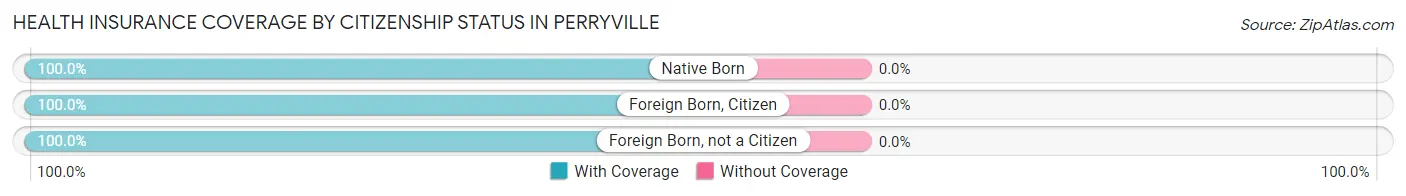
| Citizenship Status | With Coverage | Without Coverage |
| Native Born | 23 (100.0%) | 0 (0.0%) |
| Foreign Born, Citizen | 196 (100.0%) | 0 (0.0%) |
| Foreign Born, not a Citizen | 42 (100.0%) | 0 (0.0%) |
Health Insurance Coverage by Household Income in Perryville
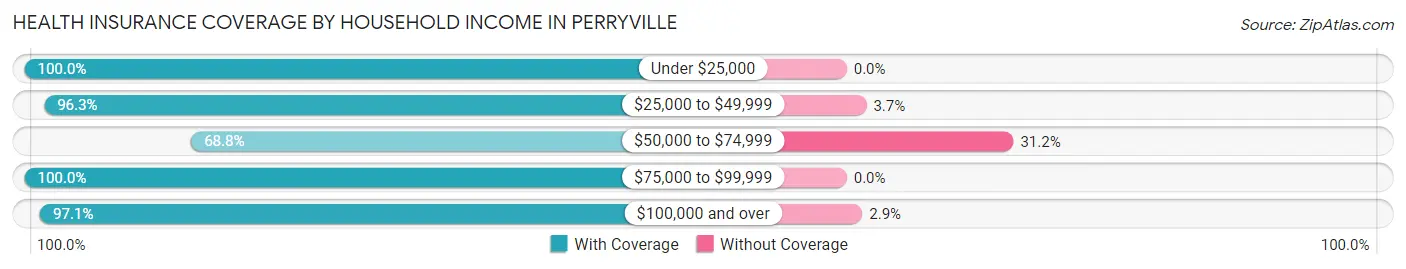
| Household Income | With Coverage | Without Coverage |
| Under $25,000 | 94 (100.0%) | 0 (0.0%) |
| $25,000 to $49,999 | 131 (96.3%) | 5 (3.7%) |
| $50,000 to $74,999 | 207 (68.8%) | 94 (31.2%) |
| $75,000 to $99,999 | 114 (100.0%) | 0 (0.0%) |
| $100,000 and over | 167 (97.1%) | 5 (2.9%) |
Public vs Private Health Insurance Coverage by Age in Perryville
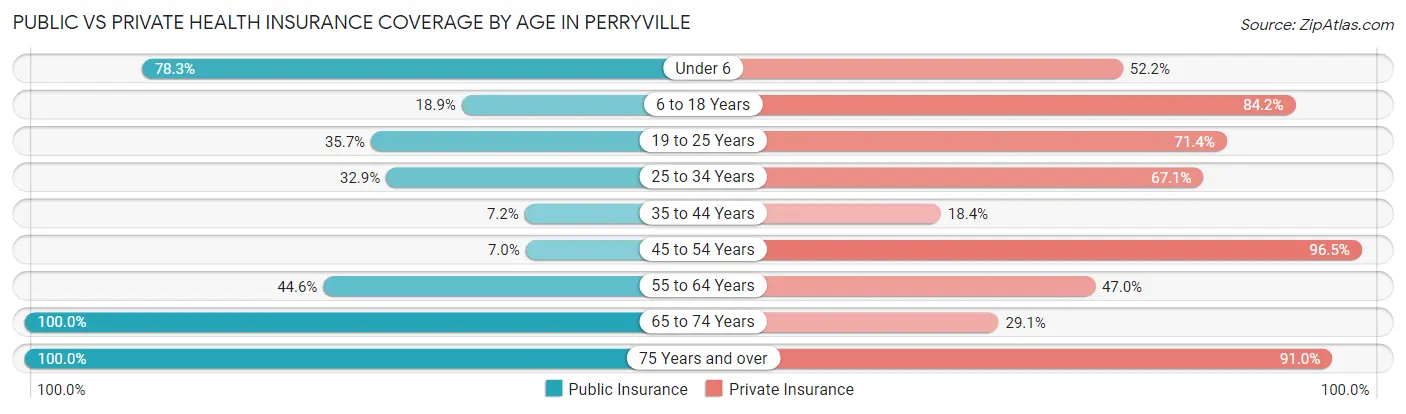
| Age Bracket | Public Insurance | Private Insurance |
| Under 6 | 18 (78.3%) | 12 (52.2%) |
| 6 to 18 Years | 37 (18.9%) | 165 (84.2%) |
| 19 to 25 Years | 15 (35.7%) | 30 (71.4%) |
| 25 to 34 Years | 26 (32.9%) | 53 (67.1%) |
| 35 to 44 Years | 9 (7.2%) | 23 (18.4%) |
| 45 to 54 Years | 8 (7.0%) | 110 (96.5%) |
| 55 to 64 Years | 37 (44.6%) | 39 (47.0%) |
| 65 to 74 Years | 55 (100.0%) | 16 (29.1%) |
| 75 Years and over | 100 (100.0%) | 91 (91.0%) |
| Total | 305 (37.3%) | 539 (66.0%) |
Disability Status by Sex by Age in Perryville
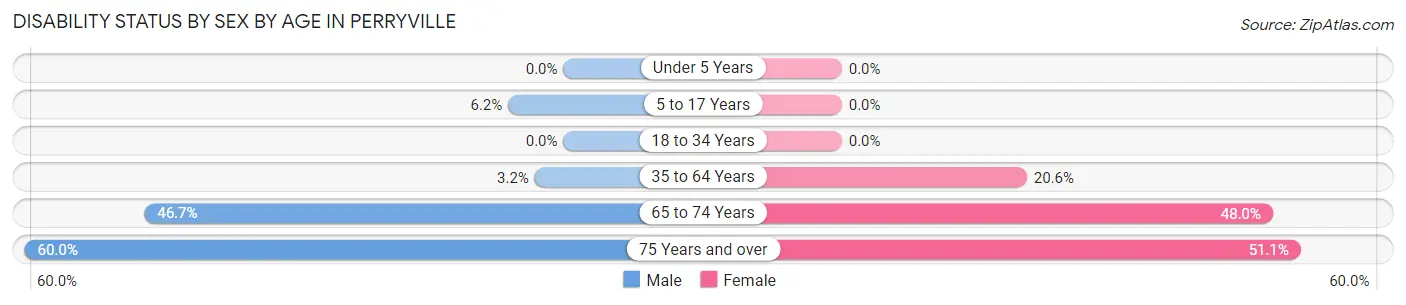
| Age Bracket | Male | Female |
| Under 5 Years | 0 (0.0%) | 0 (0.0%) |
| 5 to 17 Years | 4 (6.1%) | 0 (0.0%) |
| 18 to 34 Years | 0 (0.0%) | 0 (0.0%) |
| 35 to 64 Years | 3 (3.2%) | 47 (20.6%) |
| 65 to 74 Years | 14 (46.7%) | 12 (48.0%) |
| 75 Years and over | 33 (60.0%) | 23 (51.1%) |
Disability Class by Sex by Age in Perryville
Disability Class: Hearing Difficulty
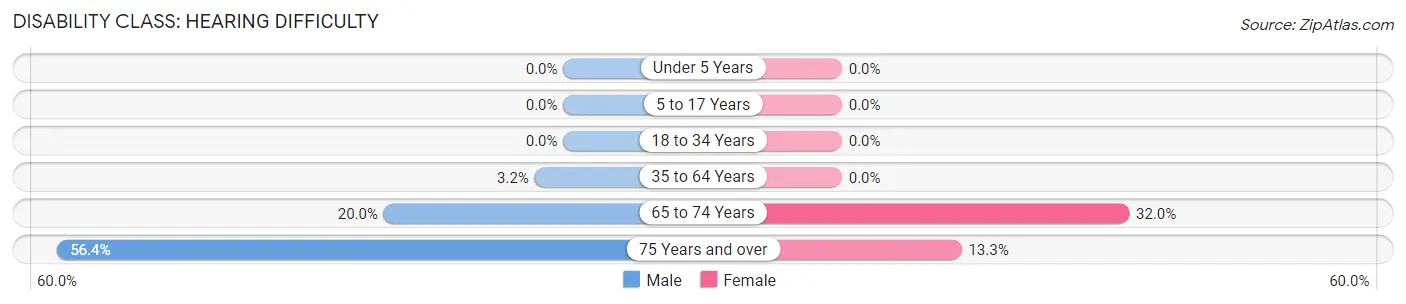
| Age Bracket | Male | Female |
| Under 5 Years | 0 (0.0%) | 0 (0.0%) |
| 5 to 17 Years | 0 (0.0%) | 0 (0.0%) |
| 18 to 34 Years | 0 (0.0%) | 0 (0.0%) |
| 35 to 64 Years | 3 (3.2%) | 0 (0.0%) |
| 65 to 74 Years | 6 (20.0%) | 8 (32.0%) |
| 75 Years and over | 31 (56.4%) | 6 (13.3%) |
Disability Class: Vision Difficulty
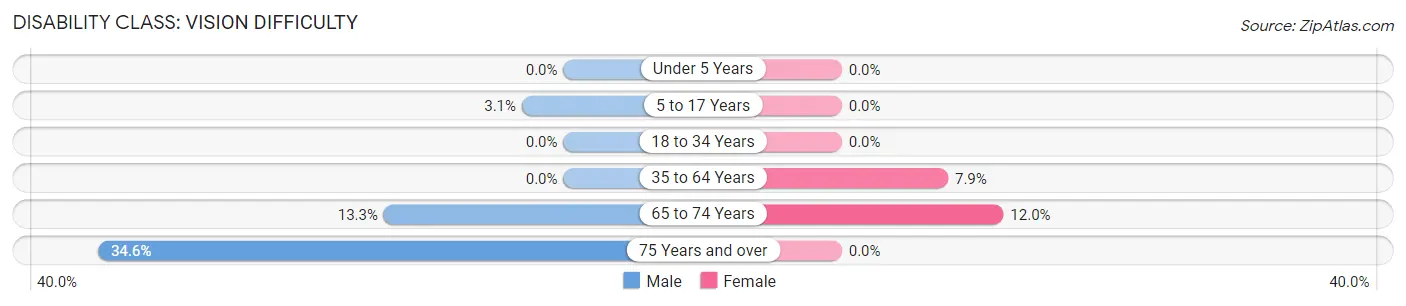
| Age Bracket | Male | Female |
| Under 5 Years | 0 (0.0%) | 0 (0.0%) |
| 5 to 17 Years | 2 (3.1%) | 0 (0.0%) |
| 18 to 34 Years | 0 (0.0%) | 0 (0.0%) |
| 35 to 64 Years | 0 (0.0%) | 18 (7.9%) |
| 65 to 74 Years | 4 (13.3%) | 3 (12.0%) |
| 75 Years and over | 19 (34.5%) | 0 (0.0%) |
Disability Class: Cognitive Difficulty
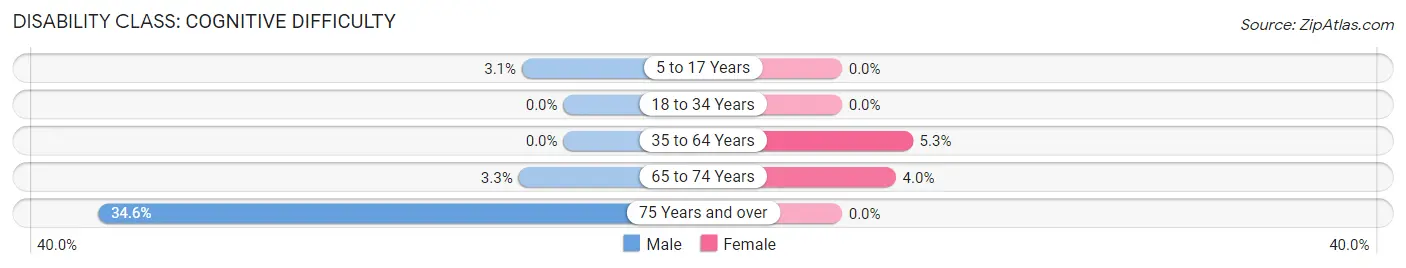
| Age Bracket | Male | Female |
| 5 to 17 Years | 2 (3.1%) | 0 (0.0%) |
| 18 to 34 Years | 0 (0.0%) | 0 (0.0%) |
| 35 to 64 Years | 0 (0.0%) | 12 (5.3%) |
| 65 to 74 Years | 1 (3.3%) | 1 (4.0%) |
| 75 Years and over | 19 (34.5%) | 0 (0.0%) |
Disability Class: Ambulatory Difficulty
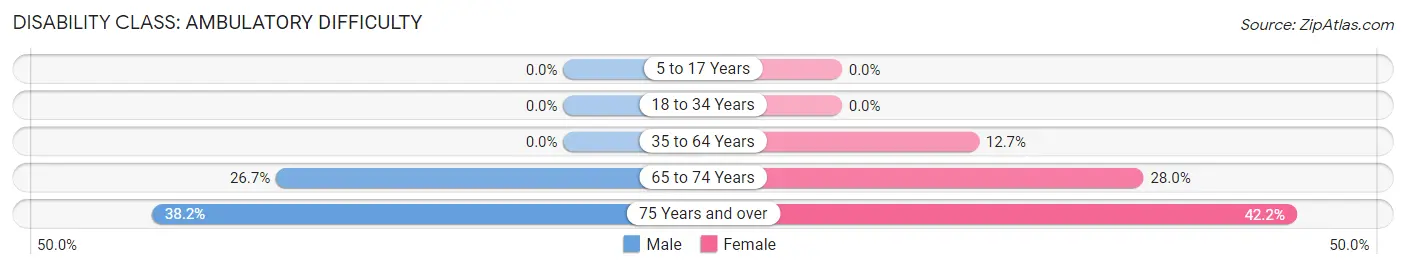
| Age Bracket | Male | Female |
| 5 to 17 Years | 0 (0.0%) | 0 (0.0%) |
| 18 to 34 Years | 0 (0.0%) | 0 (0.0%) |
| 35 to 64 Years | 0 (0.0%) | 29 (12.7%) |
| 65 to 74 Years | 8 (26.7%) | 7 (28.0%) |
| 75 Years and over | 21 (38.2%) | 19 (42.2%) |
Disability Class: Self-Care Difficulty
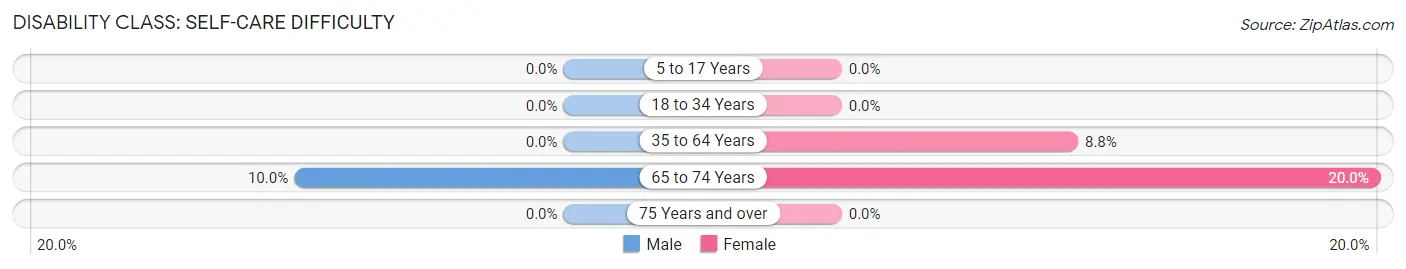
| Age Bracket | Male | Female |
| 5 to 17 Years | 0 (0.0%) | 0 (0.0%) |
| 18 to 34 Years | 0 (0.0%) | 0 (0.0%) |
| 35 to 64 Years | 0 (0.0%) | 20 (8.8%) |
| 65 to 74 Years | 3 (10.0%) | 5 (20.0%) |
| 75 Years and over | 0 (0.0%) | 0 (0.0%) |
Technology Access in Perryville
Computing Device Access in Perryville
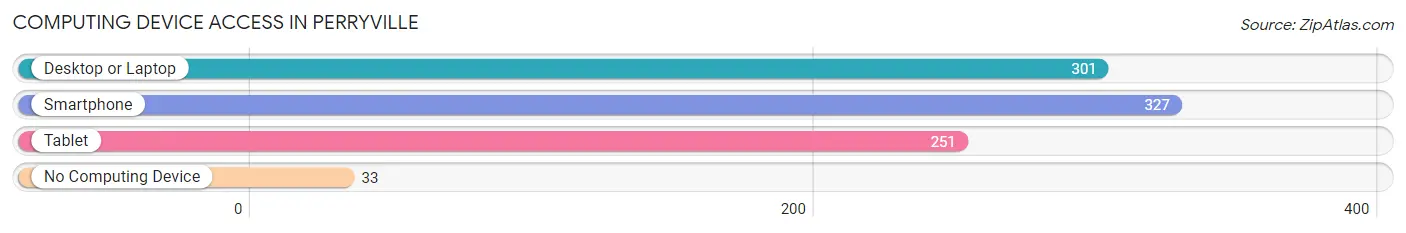
| Device Type | # Households | % Households |
| Desktop or Laptop | 301 | 76.0% |
| Smartphone | 327 | 82.6% |
| Tablet | 251 | 63.4% |
| No Computing Device | 33 | 8.3% |
| Total | 396 | 100.0% |
Internet Access in Perryville
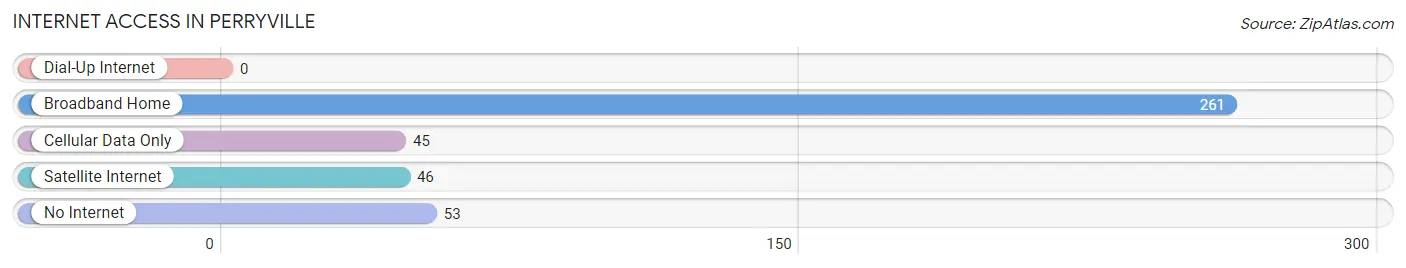
| Internet Type | # Households | % Households |
| Dial-Up Internet | 0 | 0.0% |
| Broadband Home | 261 | 65.9% |
| Cellular Data Only | 45 | 11.4% |
| Satellite Internet | 46 | 11.6% |
| No Internet | 53 | 13.4% |
| Total | 396 | 100.0% |
Perryville Summary
Perryville, Kentucky is a small town located in Boyle County, Kentucky. It is situated on the banks of the Chaplin River, and is the county seat of Boyle County. The town was founded in 1817 and named after Commodore Oliver Hazard Perry, a hero of the War of 1812. Perryville is known for its historic downtown area, which is listed on the National Register of Historic Places.
Geography
Perryville is located in the Bluegrass region of Kentucky, and is situated on the banks of the Chaplin River. The town is located in the central part of the state, approximately 40 miles south of Lexington and 60 miles north of Nashville, Tennessee. The town is surrounded by rolling hills and farmland, and is home to several parks and recreational areas.
The climate in Perryville is humid subtropical, with hot summers and mild winters. The average annual temperature is around 60 degrees Fahrenheit, and the average annual precipitation is around 45 inches.
Economy
The economy of Perryville is largely based on agriculture and manufacturing. The town is home to several large farms, and the surrounding area is known for its production of tobacco, corn, and soybeans. Perryville is also home to several manufacturing companies, including a paper mill, a furniture factory, and a plastics plant.
The town is also home to several small businesses, including restaurants, shops, and other services. The town is also home to a branch of the Boyle County Public Library, which serves the community with books, magazines, and other resources.
Demographics
As of the 2010 census, Perryville had a population of 8,125. The racial makeup of the town was 95.3% White, 1.7% African American, 0.3% Native American, 0.4% Asian, 0.1% Pacific Islander, 0.7% from other races, and 1.4% from two or more races. Hispanic or Latino of any race were 2.2% of the population.
The median household income in Perryville was $37,917, and the median family income was $45,938. The per capita income for the town was $19,945. About 11.2% of families and 14.2% of the population were below the poverty line, including 19.2% of those under age 18 and 8.2% of those age 65 or over.
History
Perryville was founded in 1817 and named after Commodore Oliver Hazard Perry, a hero of the War of 1812. The town was originally a trading post, and the first post office was established in 1820. The town was incorporated in 1837, and the first courthouse was built in 1838.
During the Civil War, Perryville was the site of a major battle between the Union and Confederate forces. The Battle of Perryville, which took place on October 8, 1862, was the largest battle fought in Kentucky during the war. The Union forces were victorious, and the town was spared from destruction.
In the late 19th century, Perryville was a thriving agricultural center, and the town was home to several large farms. The town was also home to several manufacturing companies, including a paper mill, a furniture factory, and a plastics plant.
Today, Perryville is a small town with a population of 8,125. The town is home to several historic sites, including the Perryville Battlefield State Historic Site, which commemorates the Battle of Perryville. The town is also home to several parks and recreational areas, and is a popular destination for outdoor activities.
Common Questions
What is Per Capita Income in Perryville?
Per Capita income in Perryville is $30,663.
What is the Median Family Income in Perryville?
Median Family Income in Perryville is $59,316.
What is the Median Household income in Perryville?
Median Household Income in Perryville is $58,634.
What is Income or Wage Gap in Perryville?
Income or Wage Gap in Perryville is 1.2%.
Women in Perryville earn 98.8 cents for every dollar earned by a man.
What is Family Income Deficit in Perryville?
Family Income Deficit in Perryville is $10,989.
Families that are below poverty line in Perryville earn $10,989 less on average than the poverty threshold level.
What is Inequality or Gini Index in Perryville?
Inequality or Gini Index in Perryville is 0.36.
What is the Total Population of Perryville?
Total Population of Perryville is 817.
What is the Total Male Population of Perryville?
Total Male Population of Perryville is 355.
What is the Total Female Population of Perryville?
Total Female Population of Perryville is 462.
What is the Ratio of Males per 100 Females in Perryville?
There are 76.84 Males per 100 Females in Perryville.
What is the Ratio of Females per 100 Males in Perryville?
There are 130.14 Females per 100 Males in Perryville.
What is the Median Population Age in Perryville?
Median Population Age in Perryville is 42.5 Years.
What is the Average Family Size in Perryville
Average Family Size in Perryville is 2.5 People.
What is the Average Household Size in Perryville
Average Household Size in Perryville is 2.1 People.
How Large is the Labor Force in Perryville?
There are 394 People in the Labor Forcein in Perryville.
What is the Percentage of People in the Labor Force in Perryville?
59.8% of People are in the Labor Force in Perryville.
What is the Unemployment Rate in Perryville?
Unemployment Rate in Perryville is 0.8%.