River Bluff, KY Map & Demographics
River Bluff Map
River Bluff Overview
$60,187
PER CAPITA INCOME
$167,500
AVG FAMILY INCOME
$155,208
AVG HOUSEHOLD INCOME
9.7%
WAGE / INCOME GAP [ % ]
90.3¢/ $1
WAGE / INCOME GAP [ $ ]
0.38
INEQUALITY / GINI INDEX
496
TOTAL POPULATION
222
MALE POPULATION
274
FEMALE POPULATION
81.02
MALES / 100 FEMALES
123.42
FEMALES / 100 MALES
40.4
MEDIAN AGE
3.3
AVG FAMILY SIZE
2.9
AVG HOUSEHOLD SIZE
275
LABOR FORCE [ PEOPLE ]
71.2%
PERCENT IN LABOR FORCE
Income in River Bluff
Income Overview in River Bluff
Per Capita Income in River Bluff is $60,187, while median incomes of families and households are $167,500 and $155,208 respectively.
| Characteristic | Number | Measure |
| Per Capita Income | 496 | $60,187 |
| Median Family Income | 140 | $167,500 |
| Mean Family Income | 140 | $191,877 |
| Median Household Income | 171 | $155,208 |
| Mean Household Income | 171 | $170,901 |
| Income Deficit | 140 | $0 |
| Wage / Income Gap (%) | 496 | 9.70% |
| Wage / Income Gap ($) | 496 | 90.30¢ per $1 |
| Gini / Inequality Index | 496 | 0.38 |
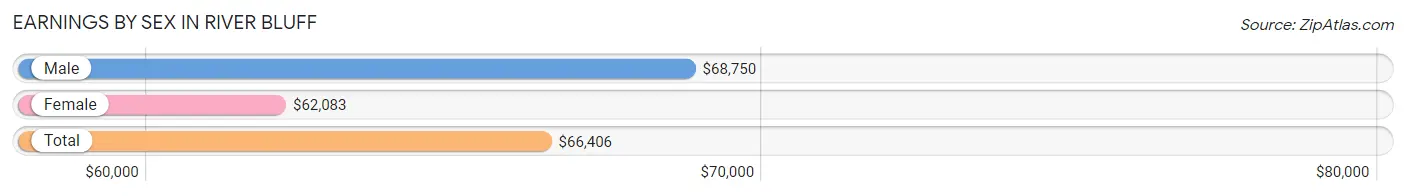
Earnings by Sex in River Bluff
Average Earnings in River Bluff are $66,406, $68,750 for men and $62,083 for women, a difference of 9.7%.
| Sex | Number | Average Earnings |
| Male | 156 (54.7%) | $68,750 |
| Female | 129 (45.3%) | $62,083 |
| Total | 285 (100.0%) | $66,406 |
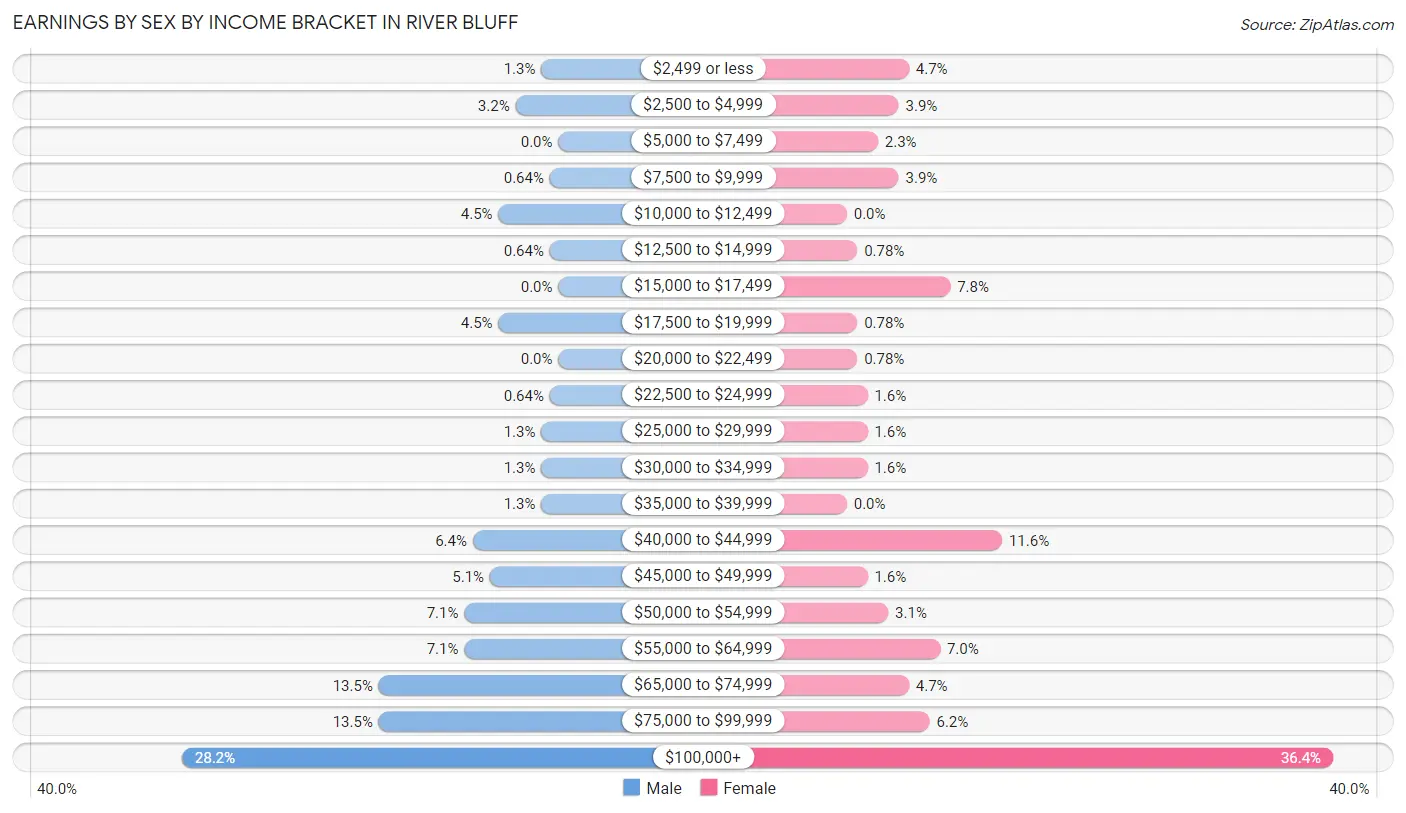
Earnings by Sex by Income Bracket in River Bluff
The most common earnings brackets in River Bluff are $100,000+ for men (44 | 28.2%) and $100,000+ for women (47 | 36.4%).
| Income | Male | Female |
| $2,499 or less | 2 (1.3%) | 6 (4.6%) |
| $2,500 to $4,999 | 5 (3.2%) | 5 (3.9%) |
| $5,000 to $7,499 | 0 (0.0%) | 3 (2.3%) |
| $7,500 to $9,999 | 1 (0.6%) | 5 (3.9%) |
| $10,000 to $12,499 | 7 (4.5%) | 0 (0.0%) |
| $12,500 to $14,999 | 1 (0.6%) | 1 (0.8%) |
| $15,000 to $17,499 | 0 (0.0%) | 10 (7.7%) |
| $17,500 to $19,999 | 7 (4.5%) | 1 (0.8%) |
| $20,000 to $22,499 | 0 (0.0%) | 1 (0.8%) |
| $22,500 to $24,999 | 1 (0.6%) | 2 (1.5%) |
| $25,000 to $29,999 | 2 (1.3%) | 2 (1.5%) |
| $30,000 to $34,999 | 2 (1.3%) | 2 (1.5%) |
| $35,000 to $39,999 | 2 (1.3%) | 0 (0.0%) |
| $40,000 to $44,999 | 10 (6.4%) | 15 (11.6%) |
| $45,000 to $49,999 | 8 (5.1%) | 2 (1.5%) |
| $50,000 to $54,999 | 11 (7.0%) | 4 (3.1%) |
| $55,000 to $64,999 | 11 (7.0%) | 9 (7.0%) |
| $65,000 to $74,999 | 21 (13.5%) | 6 (4.6%) |
| $75,000 to $99,999 | 21 (13.5%) | 8 (6.2%) |
| $100,000+ | 44 (28.2%) | 47 (36.4%) |
| Total | 156 (100.0%) | 129 (100.0%) |
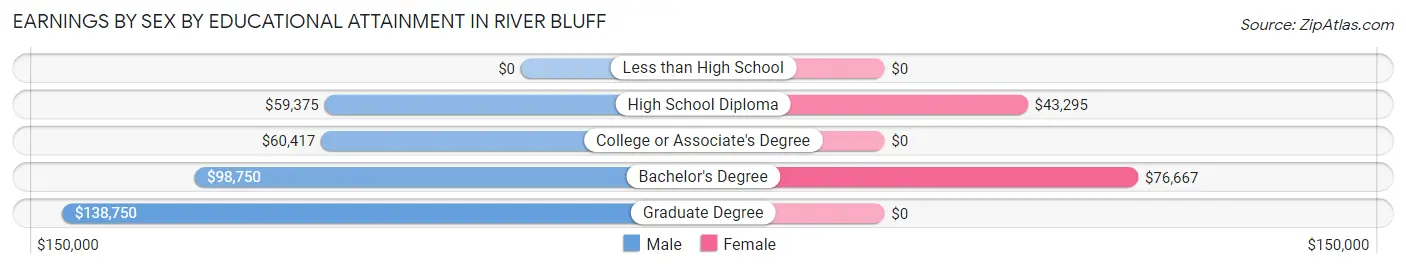
Earnings by Sex by Educational Attainment in River Bluff
Average earnings in River Bluff are $72,125 for men and $70,833 for women, a difference of 1.8%. Men with an educational attainment of graduate degree enjoy the highest average annual earnings of $138,750, while those with high school diploma education earn the least with $59,375. Women with an educational attainment of bachelor's degree earn the most with the average annual earnings of $76,667, while those with high school diploma education have the smallest earnings of $43,295.
| Educational Attainment | Male Income | Female Income |
| Less than High School | - | - |
| High School Diploma | $59,375 | $43,295 |
| College or Associate's Degree | $60,417 | $0 |
| Bachelor's Degree | $98,750 | $76,667 |
| Graduate Degree | $138,750 | $0 |
| Total | $72,125 | $70,833 |
Family Income in River Bluff
Family Income Brackets in River Bluff
According to the River Bluff family income data, there are 42 families falling into the $150,000 to $199,999 income range, which is the most common income bracket and makes up 30.0% of all families.
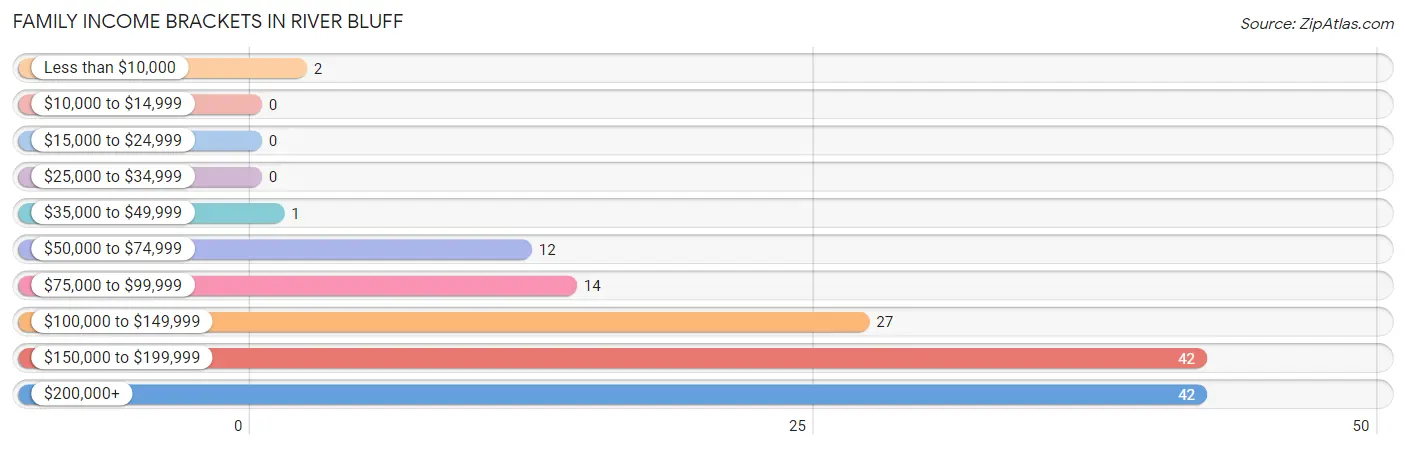
| Income Bracket | # Families | % Families |
| Less than $10,000 | 2 | 1.4% |
| $10,000 to $14,999 | 0 | 0.0% |
| $15,000 to $24,999 | 0 | 0.0% |
| $25,000 to $34,999 | 0 | 0.0% |
| $35,000 to $49,999 | 1 | 0.7% |
| $50,000 to $74,999 | 12 | 8.6% |
| $75,000 to $99,999 | 14 | 10.0% |
| $100,000 to $149,999 | 27 | 19.3% |
| $150,000 to $199,999 | 42 | 30.0% |
| $200,000+ | 42 | 30.0% |
Family Income by Famaliy Size in River Bluff
3-person families (24 | 17.1%) account for the highest median family income in River Bluff with $193,333 per family, while 2-person families (46 | 32.9%) have the highest median income of $75,625 per family member.
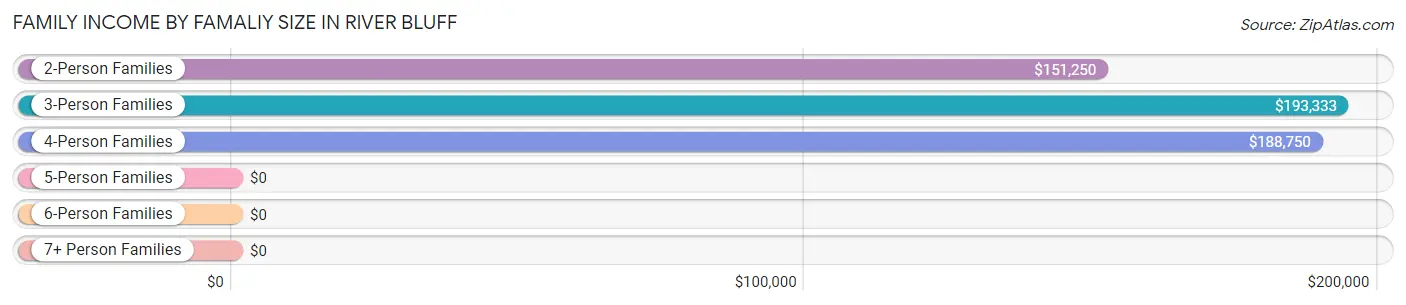
| Income Bracket | # Families | Median Income |
| 2-Person Families | 46 (32.9%) | $151,250 |
| 3-Person Families | 24 (17.1%) | $193,333 |
| 4-Person Families | 52 (37.1%) | $188,750 |
| 5-Person Families | 13 (9.3%) | $0 |
| 6-Person Families | 4 (2.9%) | $0 |
| 7+ Person Families | 1 (0.7%) | $0 |
| Total | 140 (100.0%) | $167,500 |
Family Income by Number of Earners in River Bluff
The median family income in River Bluff is $167,500, with families comprising 3+ earners (29) having the highest median family income of $194,028, while families with no earners (13) have the lowest median family income of $101,875, accounting for 20.7% and 9.3% of families, respectively.
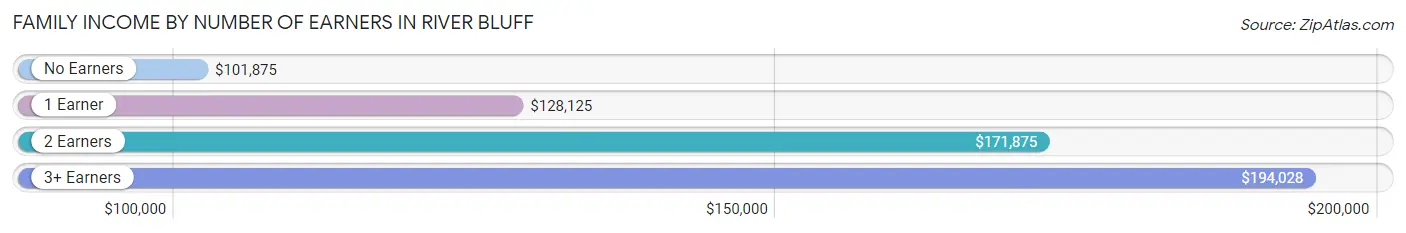
| Number of Earners | # Families | Median Income |
| No Earners | 13 (9.3%) | $101,875 |
| 1 Earner | 27 (19.3%) | $128,125 |
| 2 Earners | 71 (50.7%) | $171,875 |
| 3+ Earners | 29 (20.7%) | $194,028 |
| Total | 140 (100.0%) | $167,500 |
Household Income in River Bluff
Household Income Brackets in River Bluff
With 46 households falling in the category, the $200,000+ income range is the most frequent in River Bluff, accounting for 26.9% of all households.
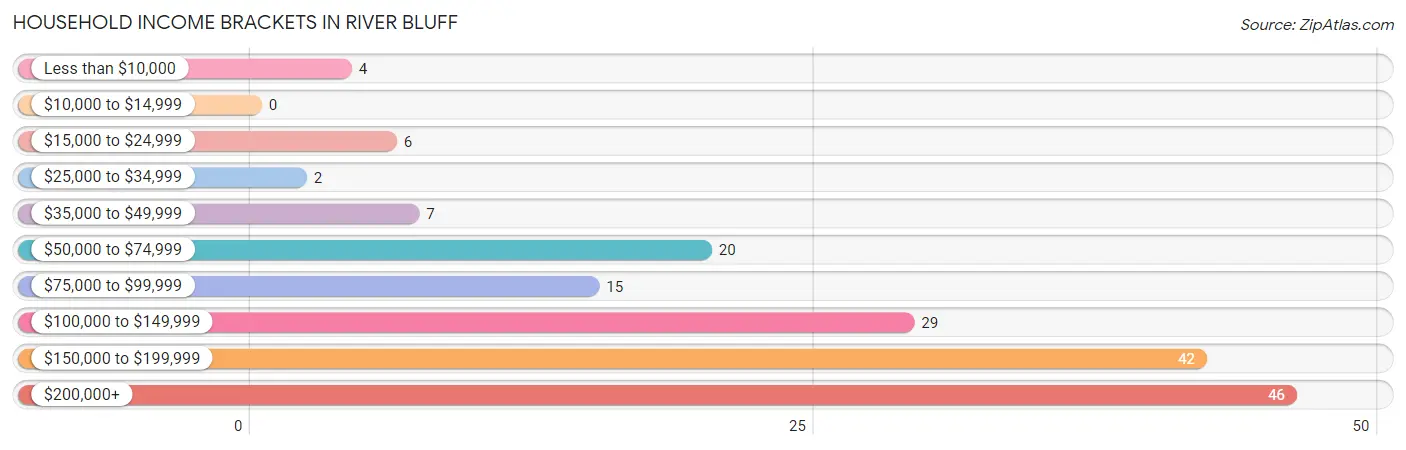
| Income Bracket | # Households | % Households |
| Less than $10,000 | 4 | 2.3% |
| $10,000 to $14,999 | 0 | 0.0% |
| $15,000 to $24,999 | 6 | 3.5% |
| $25,000 to $34,999 | 2 | 1.2% |
| $35,000 to $49,999 | 7 | 4.1% |
| $50,000 to $74,999 | 20 | 11.7% |
| $75,000 to $99,999 | 15 | 8.8% |
| $100,000 to $149,999 | 29 | 17.0% |
| $150,000 to $199,999 | 42 | 24.6% |
| $200,000+ | 46 | 26.9% |
Household Income by Householder Age in River Bluff
The median household income in River Bluff is $155,208, with the highest median household income of $188,750 found in the 25 to 44 years age bracket for the primary householder. A total of 50 households (29.2%) fall into this category. Meanwhile, the 15 to 24 years age bracket for the primary householder has the lowest median household income of $0, with 3 households (1.8%) in this group.
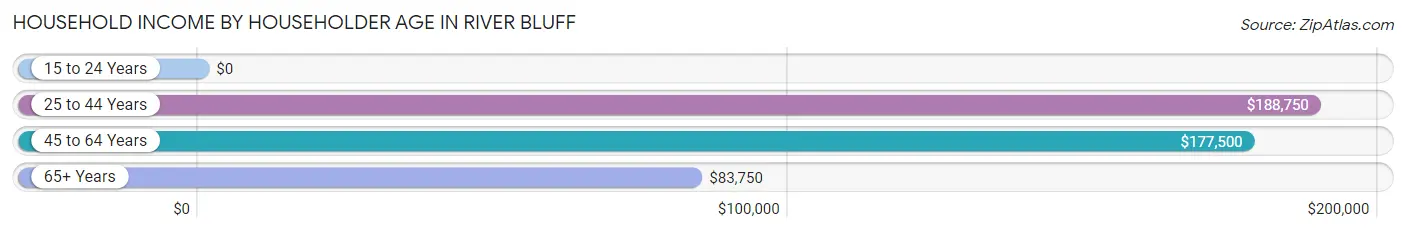
| Income Bracket | # Households | Median Income |
| 15 to 24 Years | 3 (1.8%) | $0 |
| 25 to 44 Years | 50 (29.2%) | $188,750 |
| 45 to 64 Years | 72 (42.1%) | $177,500 |
| 65+ Years | 46 (26.9%) | $83,750 |
| Total | 171 (100.0%) | $155,208 |
Poverty in River Bluff
Income Below Poverty by Sex and Age in River Bluff
With 0.9% poverty level for males and 2.9% for females among the residents of River Bluff, 65 to 74 year old males and 75 year old and over females are the most vulnerable to poverty, with 2 males (11.8%) and 2 females (11.1%) in their respective age groups living below the poverty level.
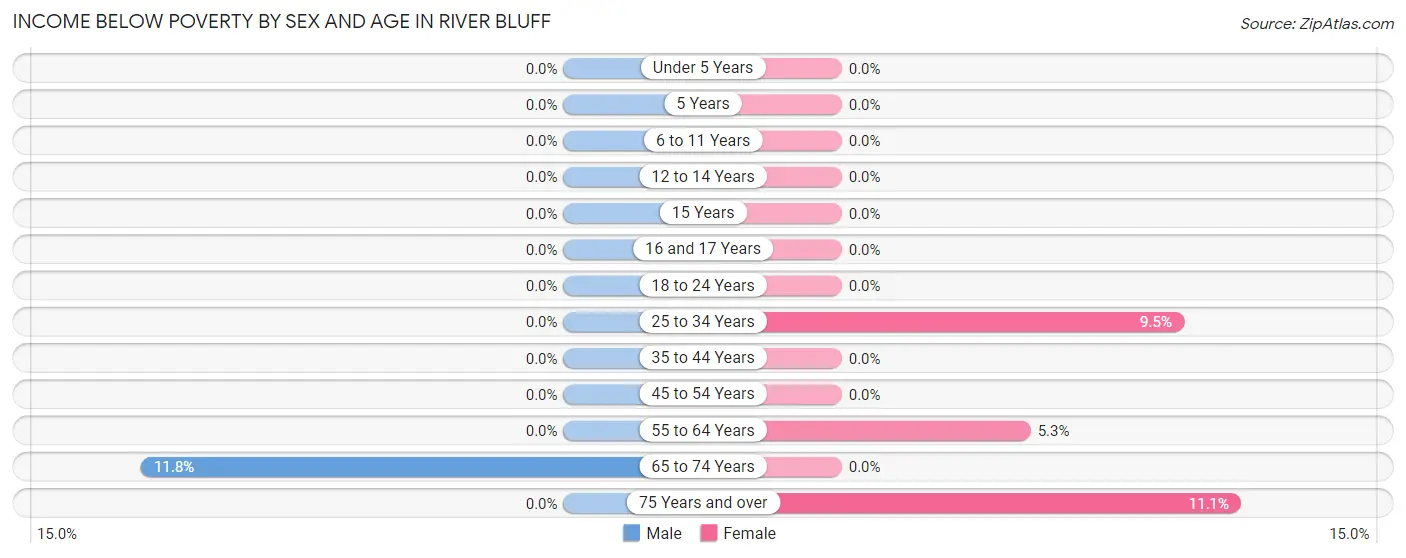
| Age Bracket | Male | Female |
| Under 5 Years | 0 (0.0%) | 0 (0.0%) |
| 5 Years | 0 (0.0%) | 0 (0.0%) |
| 6 to 11 Years | 0 (0.0%) | 0 (0.0%) |
| 12 to 14 Years | 0 (0.0%) | 0 (0.0%) |
| 15 Years | 0 (0.0%) | 0 (0.0%) |
| 16 and 17 Years | 0 (0.0%) | 0 (0.0%) |
| 18 to 24 Years | 0 (0.0%) | 0 (0.0%) |
| 25 to 34 Years | 0 (0.0%) | 4 (9.5%) |
| 35 to 44 Years | 0 (0.0%) | 0 (0.0%) |
| 45 to 54 Years | 0 (0.0%) | 0 (0.0%) |
| 55 to 64 Years | 0 (0.0%) | 2 (5.3%) |
| 65 to 74 Years | 2 (11.8%) | 0 (0.0%) |
| 75 Years and over | 0 (0.0%) | 2 (11.1%) |
| Total | 2 (0.9%) | 8 (2.9%) |
Income Above Poverty by Sex and Age in River Bluff
According to the poverty statistics in River Bluff, males aged under 5 years and females aged under 5 years are the age groups that are most secure financially, with 100.0% of males and 100.0% of females in these age groups living above the poverty line.
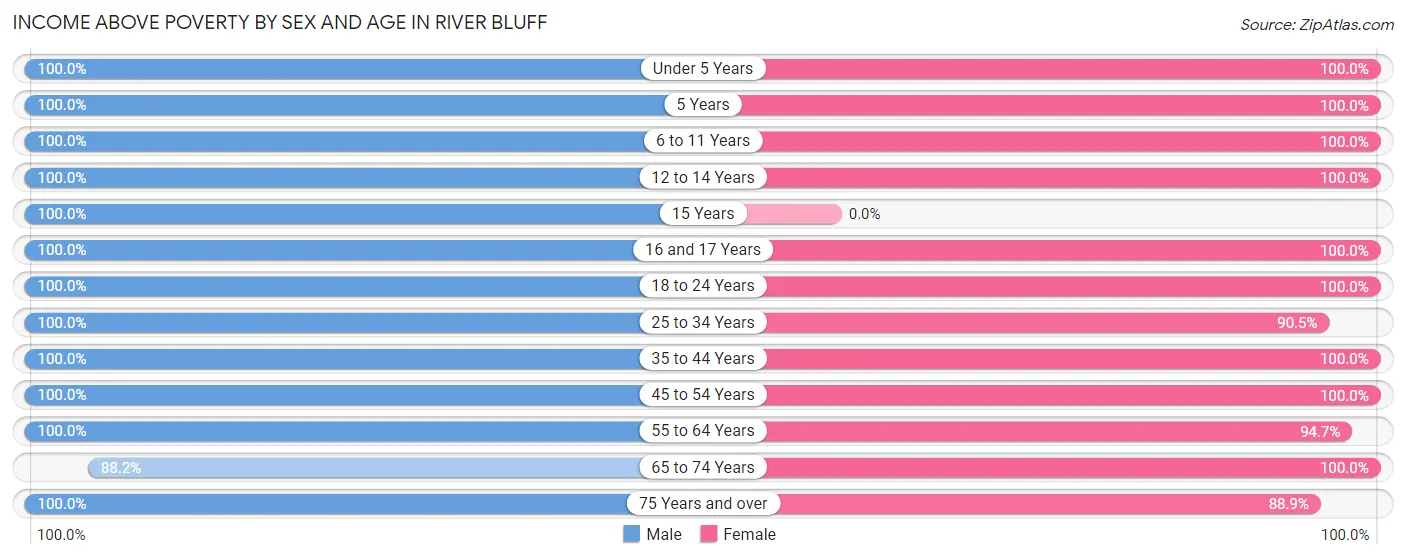
| Age Bracket | Male | Female |
| Under 5 Years | 12 (100.0%) | 27 (100.0%) |
| 5 Years | 2 (100.0%) | 4 (100.0%) |
| 6 to 11 Years | 11 (100.0%) | 37 (100.0%) |
| 12 to 14 Years | 10 (100.0%) | 5 (100.0%) |
| 15 Years | 2 (100.0%) | 0 (0.0%) |
| 16 and 17 Years | 2 (100.0%) | 9 (100.0%) |
| 18 to 24 Years | 15 (100.0%) | 12 (100.0%) |
| 25 to 34 Years | 26 (100.0%) | 38 (90.5%) |
| 35 to 44 Years | 39 (100.0%) | 32 (100.0%) |
| 45 to 54 Years | 44 (100.0%) | 33 (100.0%) |
| 55 to 64 Years | 25 (100.0%) | 36 (94.7%) |
| 65 to 74 Years | 15 (88.2%) | 17 (100.0%) |
| 75 Years and over | 17 (100.0%) | 16 (88.9%) |
| Total | 220 (99.1%) | 266 (97.1%) |
Income Below Poverty Among Married-Couple Families in River Bluff
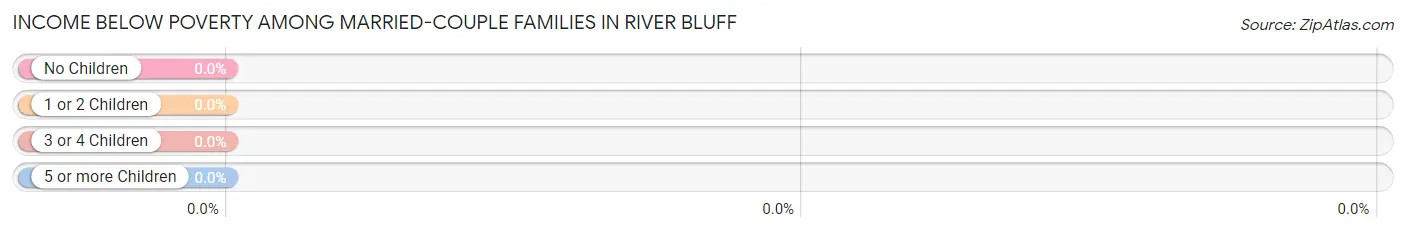
| Children | Above Poverty | Below Poverty |
| No Children | 67 (100.0%) | 0 (0.0%) |
| 1 or 2 Children | 53 (100.0%) | 0 (0.0%) |
| 3 or 4 Children | 12 (100.0%) | 0 (0.0%) |
| 5 or more Children | 1 (100.0%) | 0 (0.0%) |
| Total | 133 (100.0%) | 0 (0.0%) |
Income Below Poverty Among Single-Parent Households in River Bluff
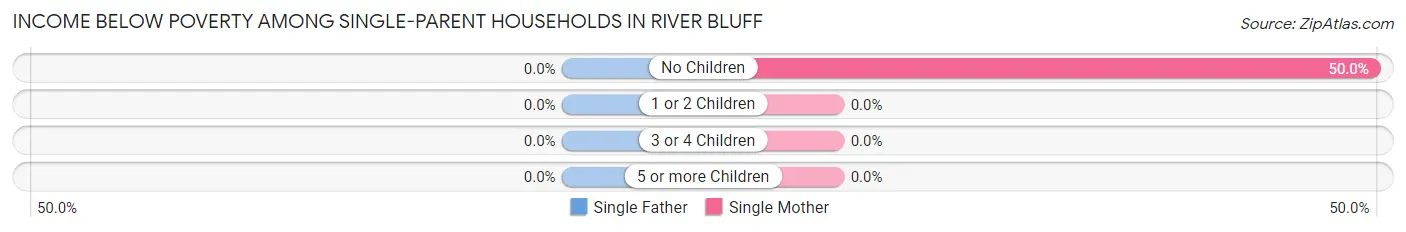
| Children | Single Father | Single Mother |
| No Children | 0 (0.0%) | 2 (50.0%) |
| 1 or 2 Children | 0 (0.0%) | 0 (0.0%) |
| 3 or 4 Children | 0 (0.0%) | 0 (0.0%) |
| 5 or more Children | 0 (0.0%) | 0 (0.0%) |
| Total | 0 (0.0%) | 2 (40.0%) |
Income Below Poverty Among Married-Couple vs Single-Parent Households in River Bluff
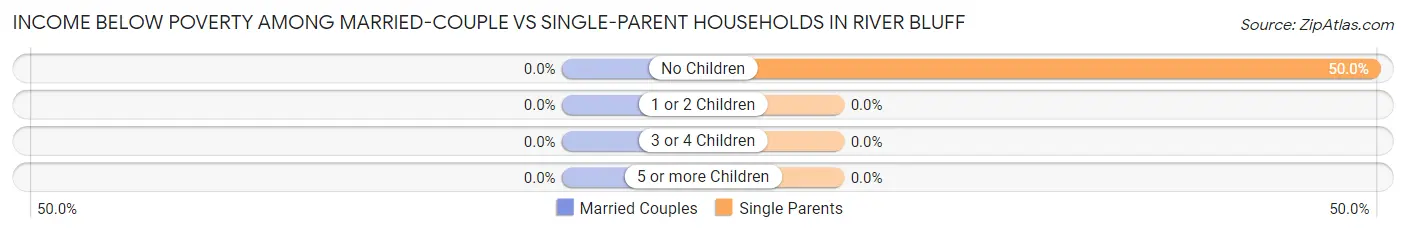
| Children | Married-Couple Families | Single-Parent Households |
| No Children | 0 (0.0%) | 2 (50.0%) |
| 1 or 2 Children | 0 (0.0%) | 0 (0.0%) |
| 3 or 4 Children | 0 (0.0%) | 0 (0.0%) |
| 5 or more Children | 0 (0.0%) | 0 (0.0%) |
| Total | 0 (0.0%) | 2 (28.6%) |
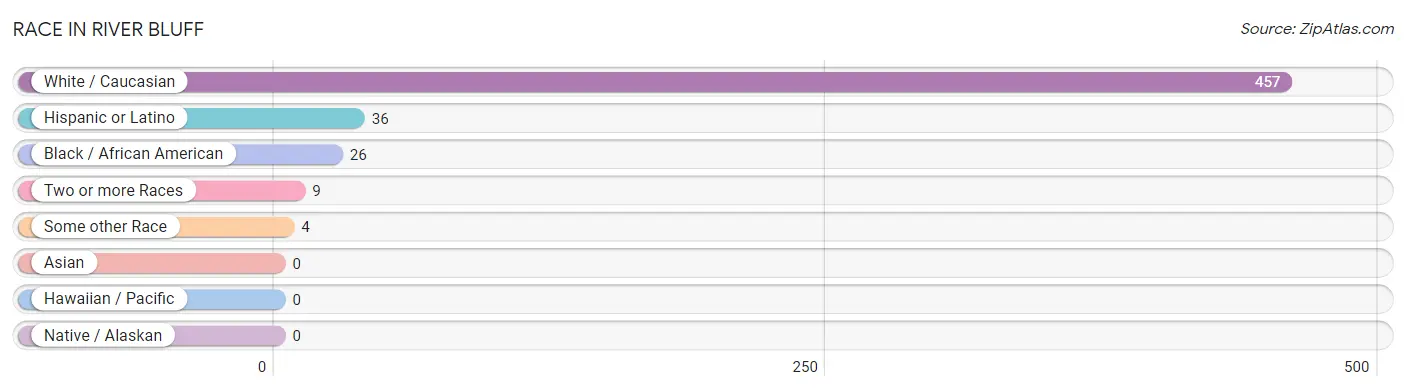
Race in River Bluff
The most populous races in River Bluff are White / Caucasian (457 | 92.1%), Hispanic or Latino (36 | 7.3%), and Black / African American (26 | 5.2%).
| Race | # Population | % Population |
| Asian | 0 | 0.0% |
| Black / African American | 26 | 5.2% |
| Hawaiian / Pacific | 0 | 0.0% |
| Hispanic or Latino | 36 | 7.3% |
| Native / Alaskan | 0 | 0.0% |
| White / Caucasian | 457 | 92.1% |
| Two or more Races | 9 | 1.8% |
| Some other Race | 4 | 0.8% |
| Total | 496 | 100.0% |
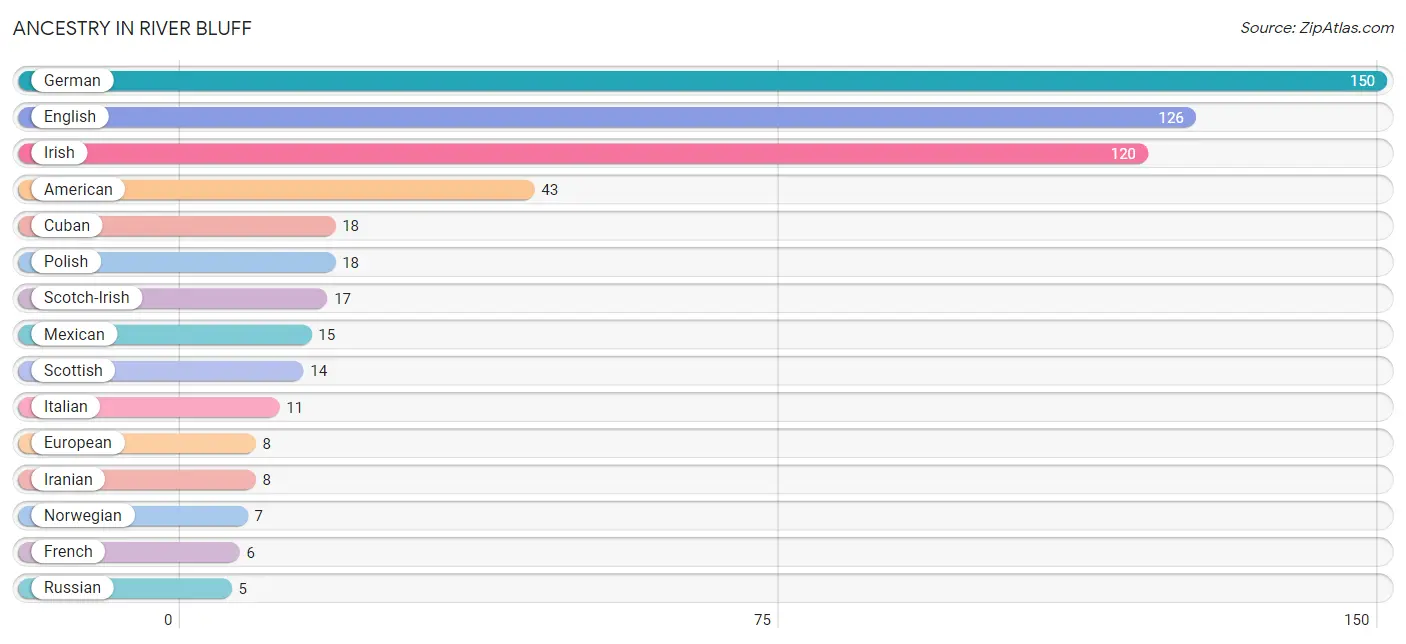
Ancestry in River Bluff
The most populous ancestries reported in River Bluff are German (150 | 30.2%), English (126 | 25.4%), Irish (120 | 24.2%), American (43 | 8.7%), and Cuban (18 | 3.6%), together accounting for 92.1% of all River Bluff residents.
| Ancestry | # Population | % Population |
| American | 43 | 8.7% |
| British | 2 | 0.4% |
| Canadian | 1 | 0.2% |
| Cuban | 18 | 3.6% |
| Danish | 2 | 0.4% |
| English | 126 | 25.4% |
| European | 8 | 1.6% |
| Finnish | 2 | 0.4% |
| French | 6 | 1.2% |
| German | 150 | 30.2% |
| Greek | 2 | 0.4% |
| Iranian | 8 | 1.6% |
| Irish | 120 | 24.2% |
| Italian | 11 | 2.2% |
| Mexican | 15 | 3.0% |
| Norwegian | 7 | 1.4% |
| Polish | 18 | 3.6% |
| Russian | 5 | 1.0% |
| Scandinavian | 2 | 0.4% |
| Scotch-Irish | 17 | 3.4% |
| Scottish | 14 | 2.8% |
| South African | 2 | 0.4% |
| Spanish | 3 | 0.6% |
| Subsaharan African | 2 | 0.4% |
| Swedish | 1 | 0.2% |
| Swiss | 2 | 0.4% |
| Ukrainian | 1 | 0.2% | View All 27 Rows |
Immigrants in River Bluff
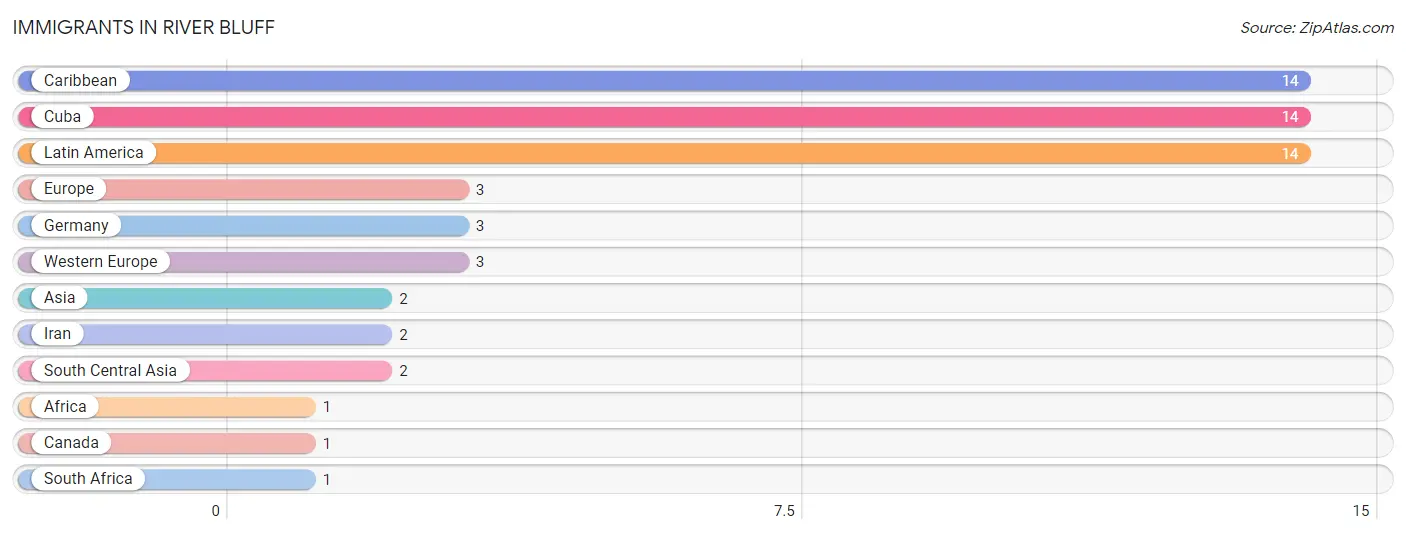
The most numerous immigrant groups reported in River Bluff came from Caribbean (14 | 2.8%), Cuba (14 | 2.8%), Latin America (14 | 2.8%), Europe (3 | 0.6%), and Germany (3 | 0.6%), together accounting for 9.7% of all River Bluff residents.
| Immigration Origin | # Population | % Population |
| Africa | 1 | 0.2% |
| Asia | 2 | 0.4% |
| Canada | 1 | 0.2% |
| Caribbean | 14 | 2.8% |
| Cuba | 14 | 2.8% |
| Europe | 3 | 0.6% |
| Germany | 3 | 0.6% |
| Iran | 2 | 0.4% |
| Latin America | 14 | 2.8% |
| South Africa | 1 | 0.2% |
| South Central Asia | 2 | 0.4% |
| Western Europe | 3 | 0.6% | View All 12 Rows |
Sex and Age in River Bluff
Sex and Age in River Bluff
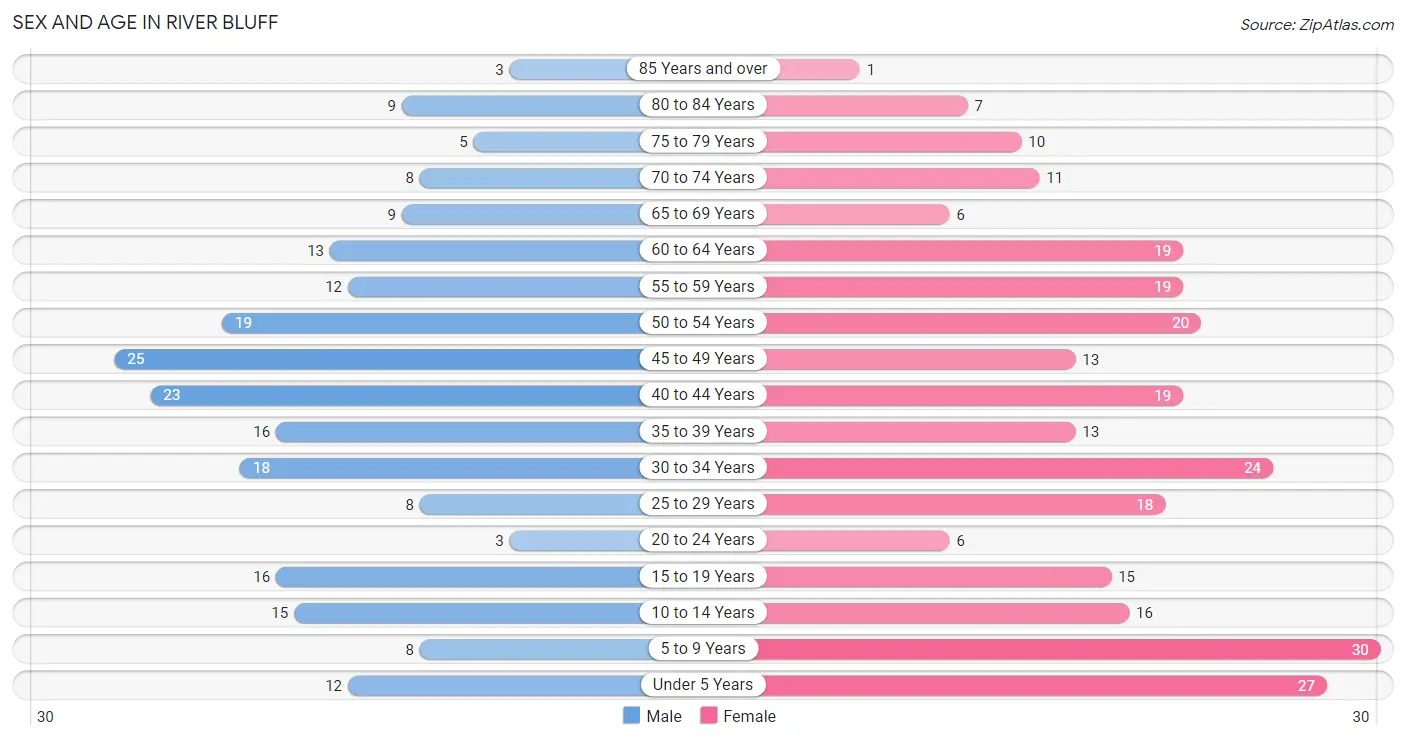
The most populous age groups in River Bluff are 45 to 49 Years (25 | 11.3%) for men and 5 to 9 Years (30 | 11.0%) for women.
| Age Bracket | Male | Female |
| Under 5 Years | 12 (5.4%) | 27 (9.9%) |
| 5 to 9 Years | 8 (3.6%) | 30 (11.0%) |
| 10 to 14 Years | 15 (6.8%) | 16 (5.8%) |
| 15 to 19 Years | 16 (7.2%) | 15 (5.5%) |
| 20 to 24 Years | 3 (1.3%) | 6 (2.2%) |
| 25 to 29 Years | 8 (3.6%) | 18 (6.6%) |
| 30 to 34 Years | 18 (8.1%) | 24 (8.8%) |
| 35 to 39 Years | 16 (7.2%) | 13 (4.7%) |
| 40 to 44 Years | 23 (10.4%) | 19 (6.9%) |
| 45 to 49 Years | 25 (11.3%) | 13 (4.7%) |
| 50 to 54 Years | 19 (8.6%) | 20 (7.3%) |
| 55 to 59 Years | 12 (5.4%) | 19 (6.9%) |
| 60 to 64 Years | 13 (5.9%) | 19 (6.9%) |
| 65 to 69 Years | 9 (4.1%) | 6 (2.2%) |
| 70 to 74 Years | 8 (3.6%) | 11 (4.0%) |
| 75 to 79 Years | 5 (2.2%) | 10 (3.6%) |
| 80 to 84 Years | 9 (4.1%) | 7 (2.5%) |
| 85 Years and over | 3 (1.3%) | 1 (0.4%) |
| Total | 222 (100.0%) | 274 (100.0%) |
Families and Households in River Bluff
Median Family Size in River Bluff
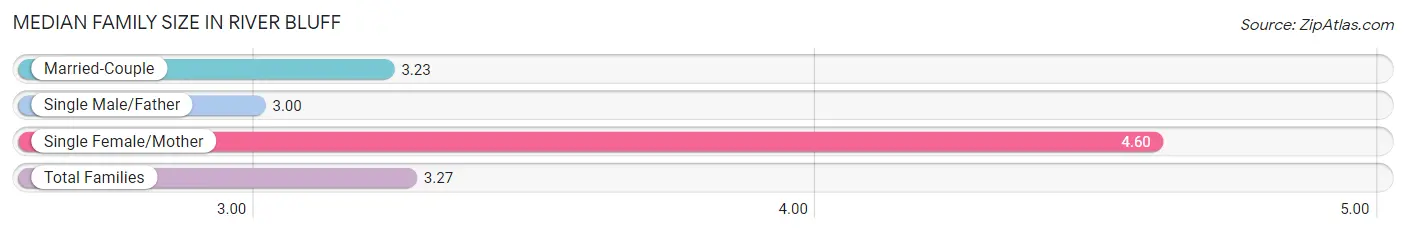
The median family size in River Bluff is 3.27 persons per family, with single female/mother families (5 | 3.6%) accounting for the largest median family size of 4.6 persons per family. On the other hand, single male/father families (2 | 1.4%) represent the smallest median family size with 3.00 persons per family.
| Family Type | # Families | Family Size |
| Married-Couple | 133 (95.0%) | 3.23 |
| Single Male/Father | 2 (1.4%) | 3.00 |
| Single Female/Mother | 5 (3.6%) | 4.60 |
| Total Families | 140 (100.0%) | 3.27 |
Median Household Size in River Bluff
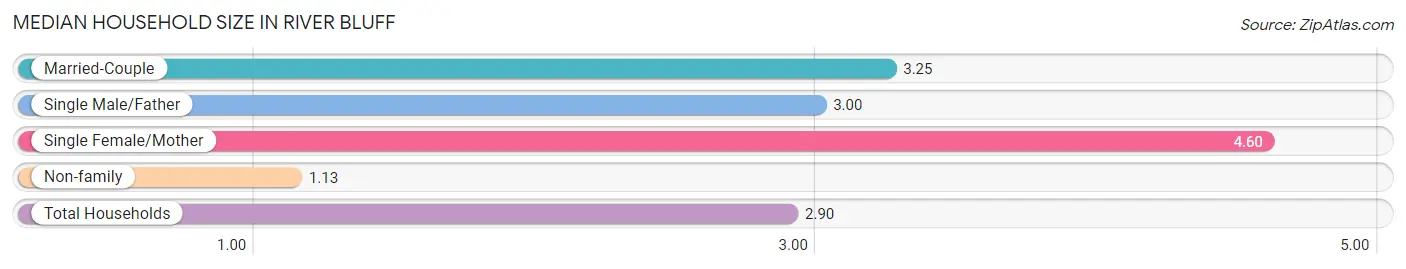
The median household size in River Bluff is 2.90 persons per household, with single female/mother households (5 | 2.9%) accounting for the largest median household size of 4.6 persons per household. non-family households (31 | 18.1%) represent the smallest median household size with 1.13 persons per household.
| Household Type | # Households | Household Size |
| Married-Couple | 133 (77.8%) | 3.25 |
| Single Male/Father | 2 (1.2%) | 3.00 |
| Single Female/Mother | 5 (2.9%) | 4.60 |
| Non-family | 31 (18.1%) | 1.13 |
| Total Households | 171 (100.0%) | 2.90 |
Household Size by Marriage Status in River Bluff
Out of a total of 171 households in River Bluff, 140 (81.9%) are family households, while 31 (18.1%) are nonfamily households. The most numerous type of family households are 4-person households, comprising 52, and the most common type of nonfamily households are 1-person households, comprising 28.
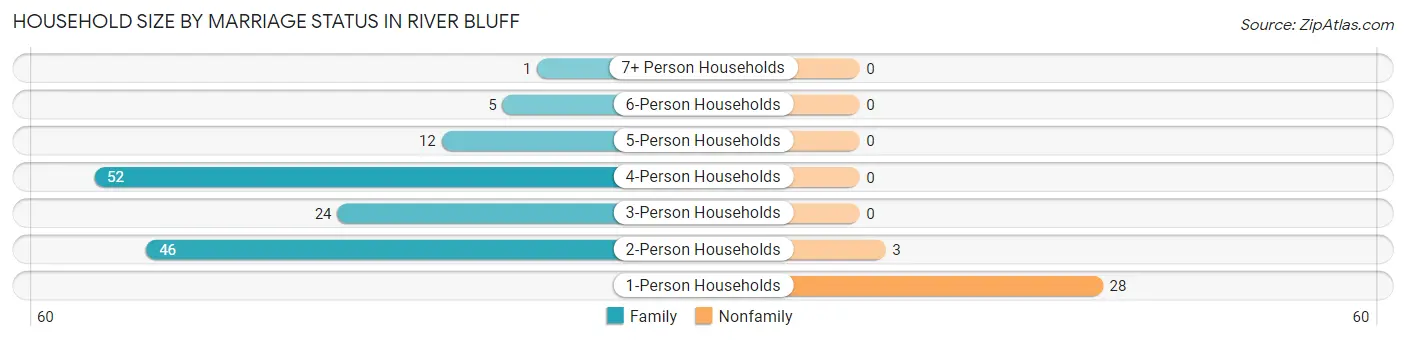
| Household Size | Family Households | Nonfamily Households |
| 1-Person Households | - | 28 (16.4%) |
| 2-Person Households | 46 (26.9%) | 3 (1.8%) |
| 3-Person Households | 24 (14.0%) | 0 (0.0%) |
| 4-Person Households | 52 (30.4%) | 0 (0.0%) |
| 5-Person Households | 12 (7.0%) | 0 (0.0%) |
| 6-Person Households | 5 (2.9%) | 0 (0.0%) |
| 7+ Person Households | 1 (0.6%) | 0 (0.0%) |
| Total | 140 (81.9%) | 31 (18.1%) |
Female Fertility in River Bluff
Fertility by Age in River Bluff
| Age Bracket | Women with Births | Births / 1,000 Women |
| 15 to 19 years | 0 (0.0%) | 0.0 |
| 20 to 34 years | 0 (0.0%) | 0.0 |
| 35 to 50 years | 0 (0.0%) | 0.0 |
| Total | 0 (0.0%) | 0.0 |
Fertility by Age by Marriage Status in River Bluff
| Age Bracket | Married | Unmarried |
| 15 to 19 years | 0 (0.0%) | 0 (0.0%) |
| 20 to 34 years | 0 (0.0%) | 0 (0.0%) |
| 35 to 50 years | 0 (0.0%) | 0 (0.0%) |
| Total | 0 (0.0%) | 0 (0.0%) |
Fertility by Education in River Bluff
| Educational Attainment | Women with Births | Births / 1,000 Women |
| Less than High School | 0 (0.0%) | 0.0 |
| High School Diploma | 0 (0.0%) | 0.0 |
| College or Associate's Degree | 0 (0.0%) | 0.0 |
| Bachelor's Degree | 0 (0.0%) | 0.0 |
| Graduate Degree | 0 (0.0%) | 0.0 |
| Total | 0 (0.0%) | 0.0 |
Fertility by Education by Marriage Status in River Bluff
| Educational Attainment | Married | Unmarried |
| Less than High School | 0 (0.0%) | 0 (0.0%) |
| High School Diploma | 0 (0.0%) | 0 (0.0%) |
| College or Associate's Degree | 0 (0.0%) | 0 (0.0%) |
| Bachelor's Degree | 0 (0.0%) | 0 (0.0%) |
| Graduate Degree | 0 (0.0%) | 0 (0.0%) |
| Total | 0 (0.0%) | 0 (0.0%) |
Employment Characteristics in River Bluff
Employment by Class of Employer in River Bluff
Among the 270 employed individuals in River Bluff, private company employees (215 | 79.6%), not-for-profit organizations (20 | 7.4%), and federal government employees (13 | 4.8%) make up the most common classes of employment.
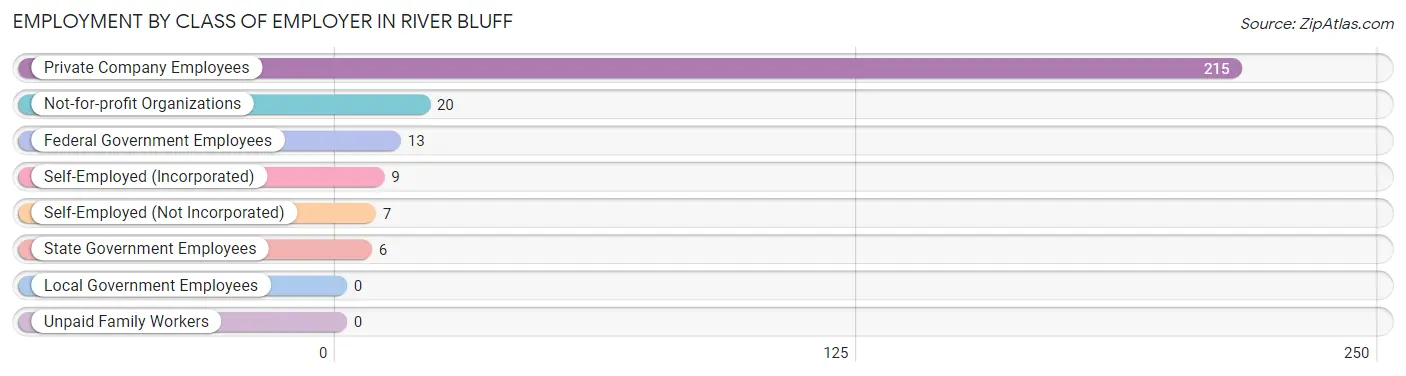
| Employer Class | # Employees | % Employees |
| Private Company Employees | 215 | 79.6% |
| Self-Employed (Incorporated) | 9 | 3.3% |
| Self-Employed (Not Incorporated) | 7 | 2.6% |
| Not-for-profit Organizations | 20 | 7.4% |
| Local Government Employees | 0 | 0.0% |
| State Government Employees | 6 | 2.2% |
| Federal Government Employees | 13 | 4.8% |
| Unpaid Family Workers | 0 | 0.0% |
| Total | 270 | 100.0% |
Employment Status by Age in River Bluff
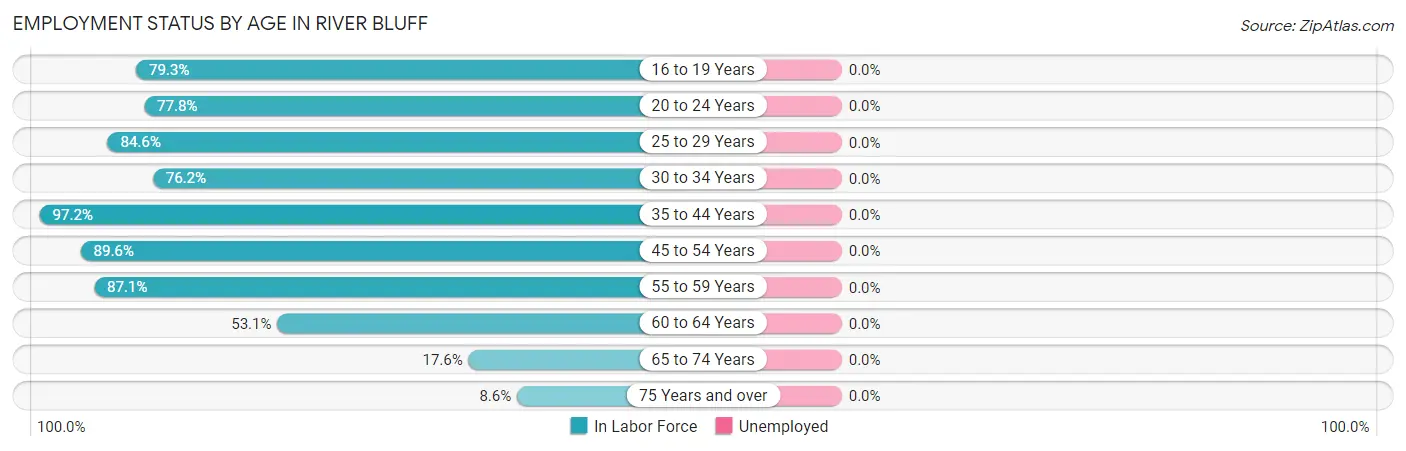
| Age Bracket | In Labor Force | Unemployed |
| 16 to 19 Years | 23 (79.3%) | 0 (0.0%) |
| 20 to 24 Years | 7 (77.8%) | 0 (0.0%) |
| 25 to 29 Years | 22 (84.6%) | 0 (0.0%) |
| 30 to 34 Years | 32 (76.2%) | 0 (0.0%) |
| 35 to 44 Years | 69 (97.2%) | 0 (0.0%) |
| 45 to 54 Years | 69 (89.6%) | 0 (0.0%) |
| 55 to 59 Years | 27 (87.1%) | 0 (0.0%) |
| 60 to 64 Years | 17 (53.1%) | 0 (0.0%) |
| 65 to 74 Years | 6 (17.6%) | 0 (0.0%) |
| 75 Years and over | 3 (8.6%) | 0 (0.0%) |
| Total | 275 (71.2%) | 0 (0.0%) |
Employment Status by Educational Attainment in River Bluff
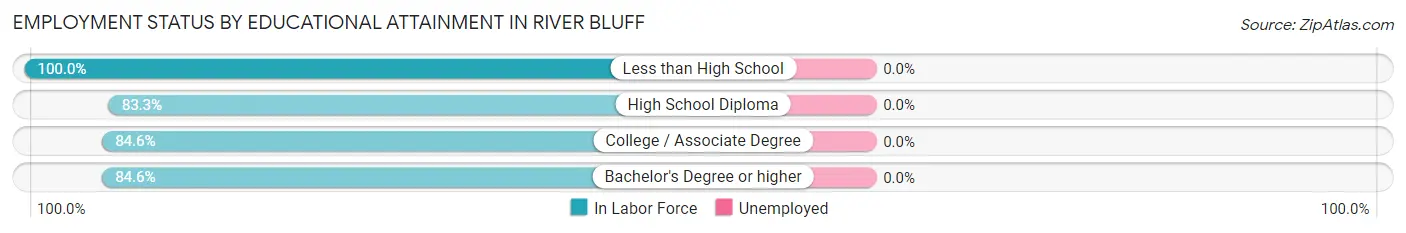
| Educational Attainment | In Labor Force | Unemployed |
| Less than High School | 3 (100.0%) | 0 (0.0%) |
| High School Diploma | 35 (83.3%) | 0 (0.0%) |
| College / Associate Degree | 55 (84.6%) | 0 (0.0%) |
| Bachelor's Degree or higher | 143 (84.6%) | 0 (0.0%) |
| Total | 236 (84.6%) | 0 (0.0%) |
Employment Occupations by Sex in River Bluff
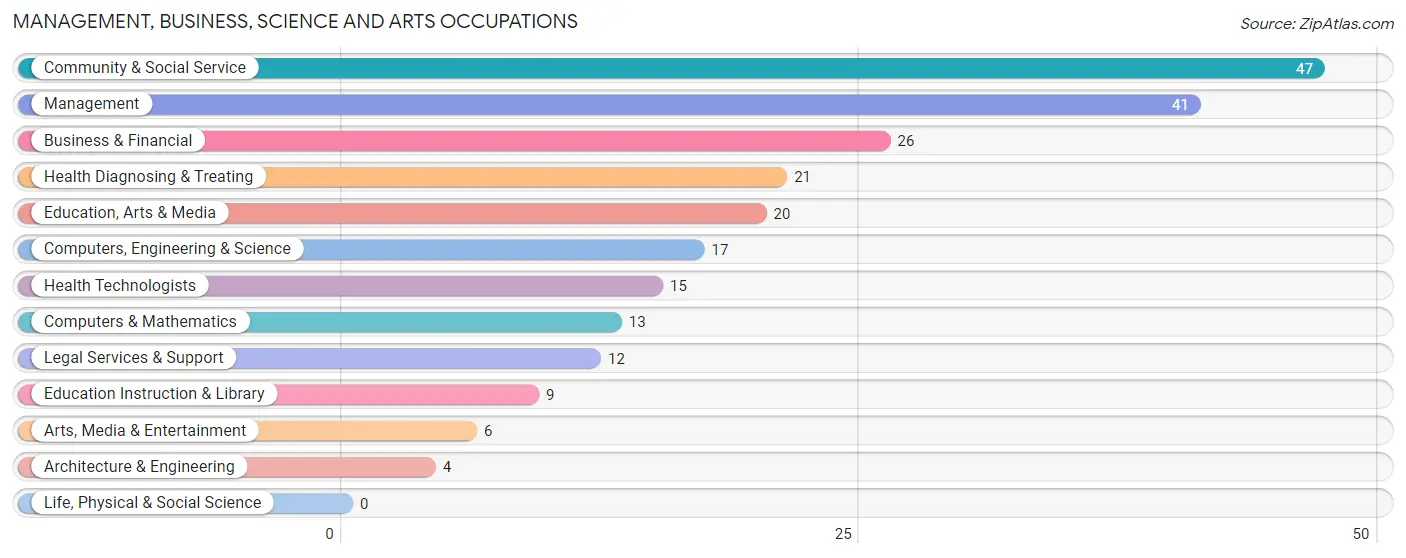
Management, Business, Science and Arts Occupations
The most common Management, Business, Science and Arts occupations in River Bluff are Community & Social Service (47 | 17.1%), Management (41 | 14.9%), Business & Financial (26 | 9.5%), Health Diagnosing & Treating (21 | 7.6%), and Education, Arts & Media (20 | 7.3%).
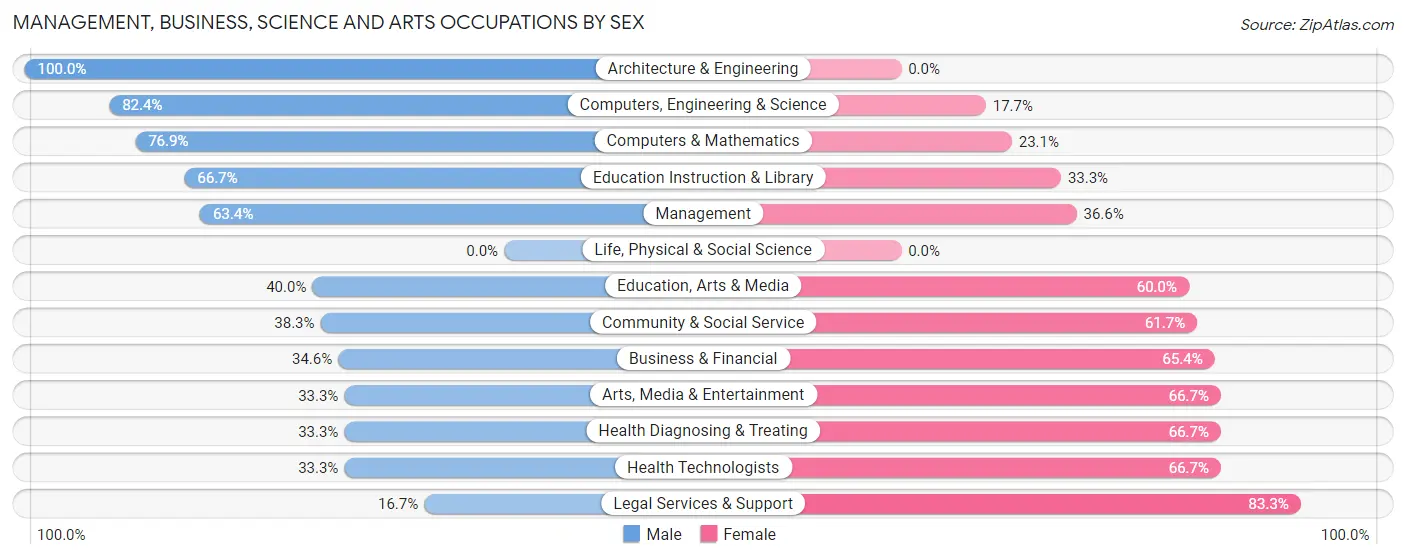
Management, Business, Science and Arts Occupations by Sex
Within the Management, Business, Science and Arts occupations in River Bluff, the most male-oriented occupations are Architecture & Engineering (100.0%), Computers, Engineering & Science (82.4%), and Computers & Mathematics (76.9%), while the most female-oriented occupations are Legal Services & Support (83.3%), Arts, Media & Entertainment (66.7%), and Health Diagnosing & Treating (66.7%).
| Occupation | Male | Female |
| Management | 26 (63.4%) | 15 (36.6%) |
| Business & Financial | 9 (34.6%) | 17 (65.4%) |
| Computers, Engineering & Science | 14 (82.4%) | 3 (17.6%) |
| Computers & Mathematics | 10 (76.9%) | 3 (23.1%) |
| Architecture & Engineering | 4 (100.0%) | 0 (0.0%) |
| Life, Physical & Social Science | 0 (0.0%) | 0 (0.0%) |
| Community & Social Service | 18 (38.3%) | 29 (61.7%) |
| Education, Arts & Media | 8 (40.0%) | 12 (60.0%) |
| Legal Services & Support | 2 (16.7%) | 10 (83.3%) |
| Education Instruction & Library | 6 (66.7%) | 3 (33.3%) |
| Arts, Media & Entertainment | 2 (33.3%) | 4 (66.7%) |
| Health Diagnosing & Treating | 7 (33.3%) | 14 (66.7%) |
| Health Technologists | 5 (33.3%) | 10 (66.7%) |
| Total (Category) | 74 (48.7%) | 78 (51.3%) |
| Total (Overall) | 148 (53.8%) | 127 (46.2%) |
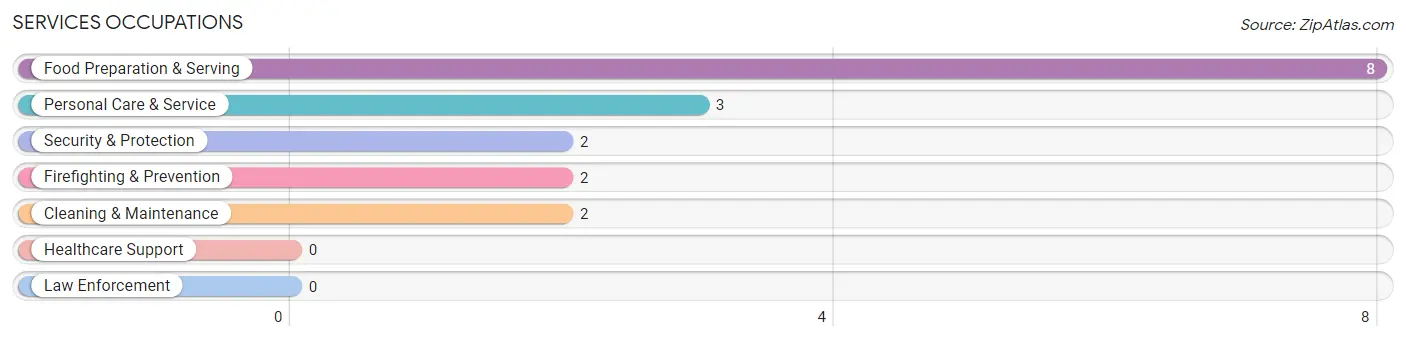
Services Occupations
The most common Services occupations in River Bluff are Food Preparation & Serving (8 | 2.9%), Personal Care & Service (3 | 1.1%), Security & Protection (2 | 0.7%), Firefighting & Prevention (2 | 0.7%), and Cleaning & Maintenance (2 | 0.7%).
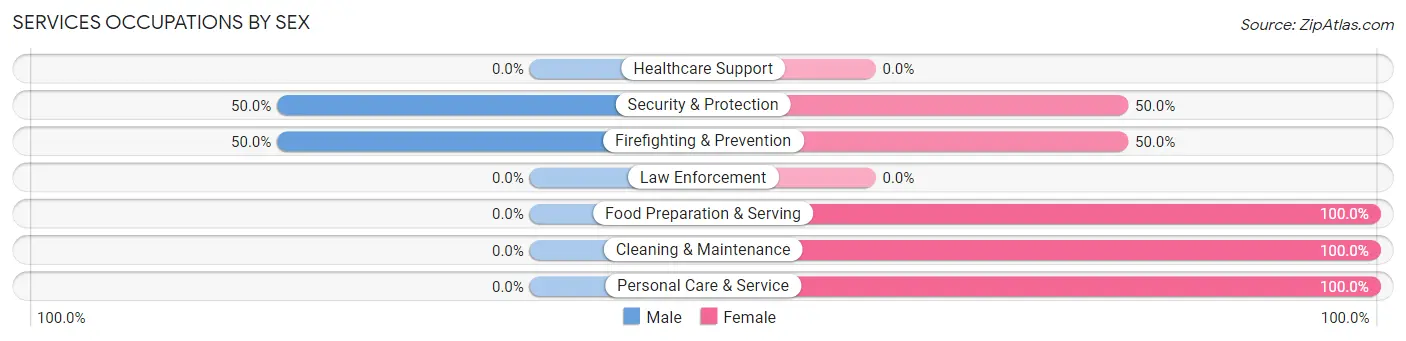
Services Occupations by Sex
Within the Services occupations in River Bluff, the most male-oriented occupations are Security & Protection (50.0%), and Firefighting & Prevention (50.0%), while the most female-oriented occupations are Food Preparation & Serving (100.0%), Cleaning & Maintenance (100.0%), and Personal Care & Service (100.0%).
| Occupation | Male | Female |
| Healthcare Support | 0 (0.0%) | 0 (0.0%) |
| Security & Protection | 1 (50.0%) | 1 (50.0%) |
| Firefighting & Prevention | 1 (50.0%) | 1 (50.0%) |
| Law Enforcement | 0 (0.0%) | 0 (0.0%) |
| Food Preparation & Serving | 0 (0.0%) | 8 (100.0%) |
| Cleaning & Maintenance | 0 (0.0%) | 2 (100.0%) |
| Personal Care & Service | 0 (0.0%) | 3 (100.0%) |
| Total (Category) | 1 (6.7%) | 14 (93.3%) |
| Total (Overall) | 148 (53.8%) | 127 (46.2%) |
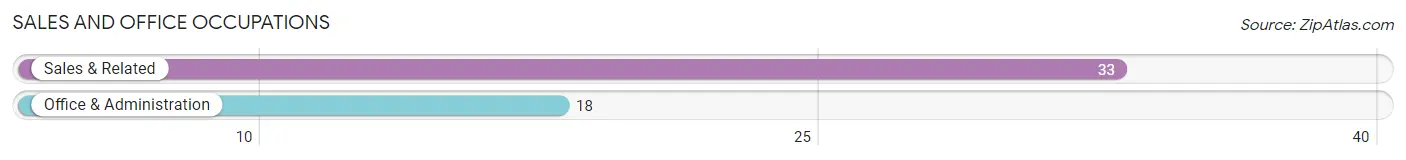
Sales and Office Occupations
The most common Sales and Office occupations in River Bluff are Sales & Related (33 | 12.0%), and Office & Administration (18 | 6.6%).
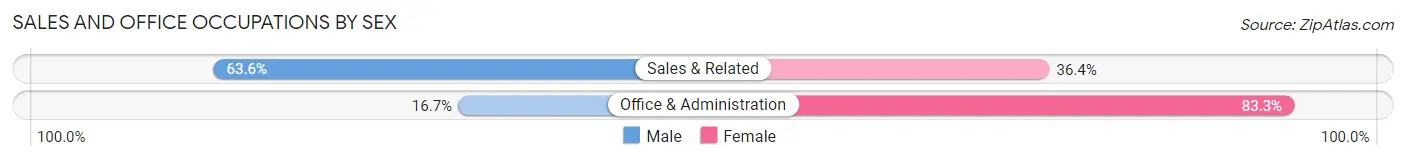
Sales and Office Occupations by Sex
| Occupation | Male | Female |
| Sales & Related | 21 (63.6%) | 12 (36.4%) |
| Office & Administration | 3 (16.7%) | 15 (83.3%) |
| Total (Category) | 24 (47.1%) | 27 (52.9%) |
| Total (Overall) | 148 (53.8%) | 127 (46.2%) |
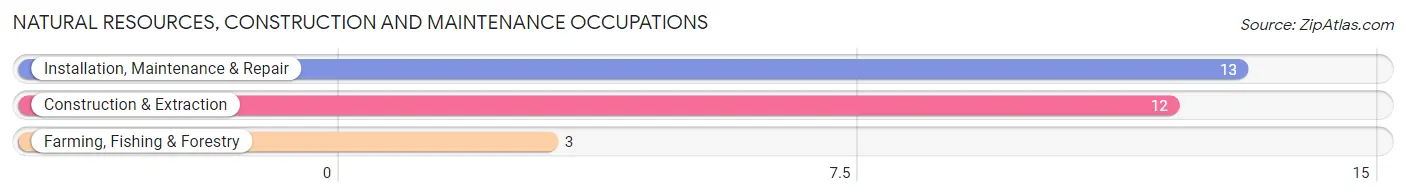
Natural Resources, Construction and Maintenance Occupations
The most common Natural Resources, Construction and Maintenance occupations in River Bluff are Installation, Maintenance & Repair (13 | 4.7%), Construction & Extraction (12 | 4.4%), and Farming, Fishing & Forestry (3 | 1.1%).
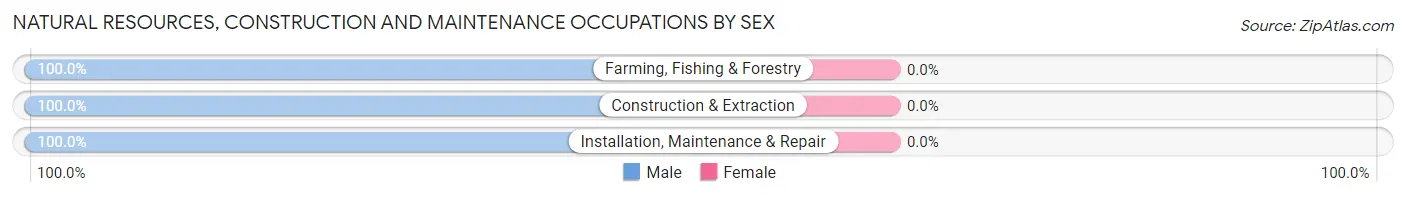
Natural Resources, Construction and Maintenance Occupations by Sex
| Occupation | Male | Female |
| Farming, Fishing & Forestry | 3 (100.0%) | 0 (0.0%) |
| Construction & Extraction | 12 (100.0%) | 0 (0.0%) |
| Installation, Maintenance & Repair | 13 (100.0%) | 0 (0.0%) |
| Total (Category) | 28 (100.0%) | 0 (0.0%) |
| Total (Overall) | 148 (53.8%) | 127 (46.2%) |
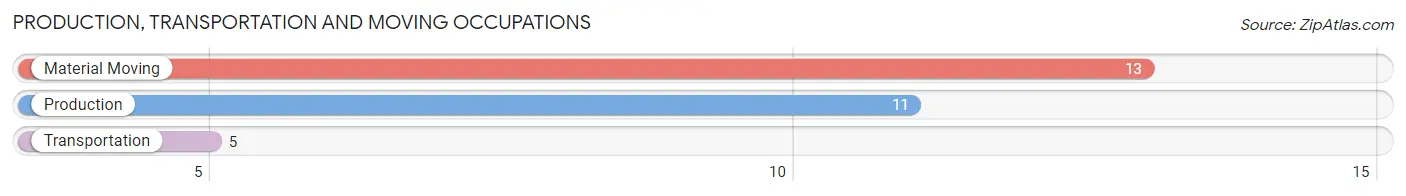
Production, Transportation and Moving Occupations
The most common Production, Transportation and Moving occupations in River Bluff are Material Moving (13 | 4.7%), Production (11 | 4.0%), and Transportation (5 | 1.8%).
Production, Transportation and Moving Occupations by Sex
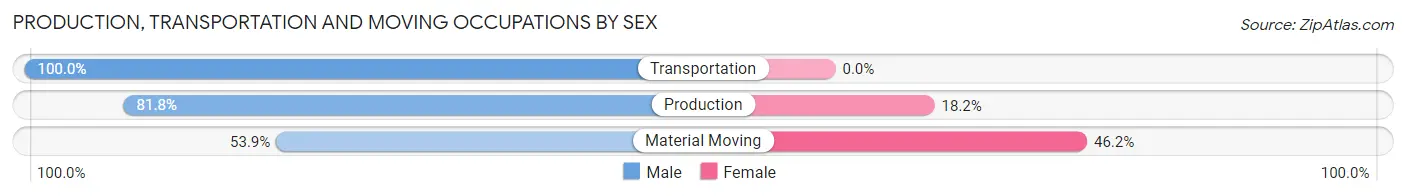
| Occupation | Male | Female |
| Production | 9 (81.8%) | 2 (18.2%) |
| Transportation | 5 (100.0%) | 0 (0.0%) |
| Material Moving | 7 (53.8%) | 6 (46.2%) |
| Total (Category) | 21 (72.4%) | 8 (27.6%) |
| Total (Overall) | 148 (53.8%) | 127 (46.2%) |
Employment Industries by Sex in River Bluff
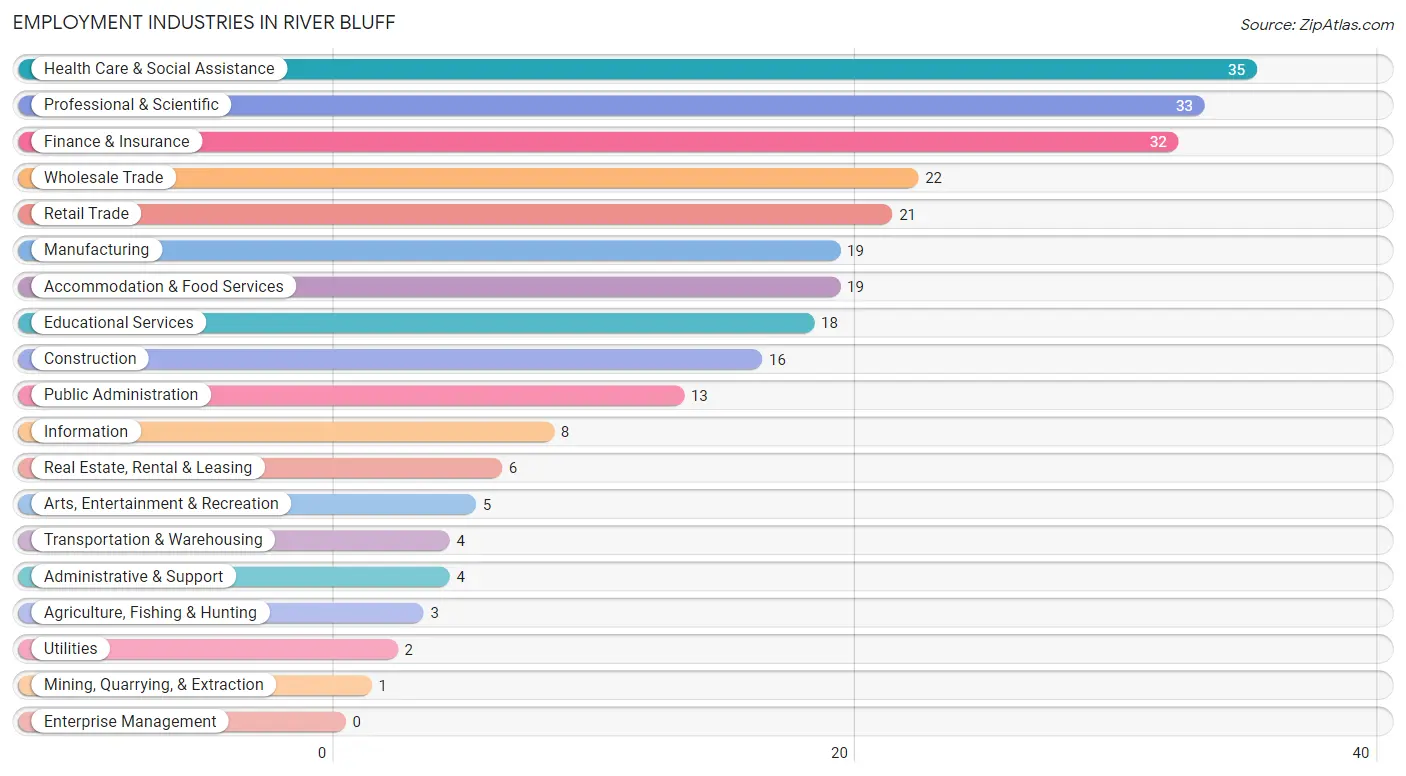
Employment Industries in River Bluff
The major employment industries in River Bluff include Health Care & Social Assistance (35 | 12.7%), Professional & Scientific (33 | 12.0%), Finance & Insurance (32 | 11.6%), Wholesale Trade (22 | 8.0%), and Retail Trade (21 | 7.6%).
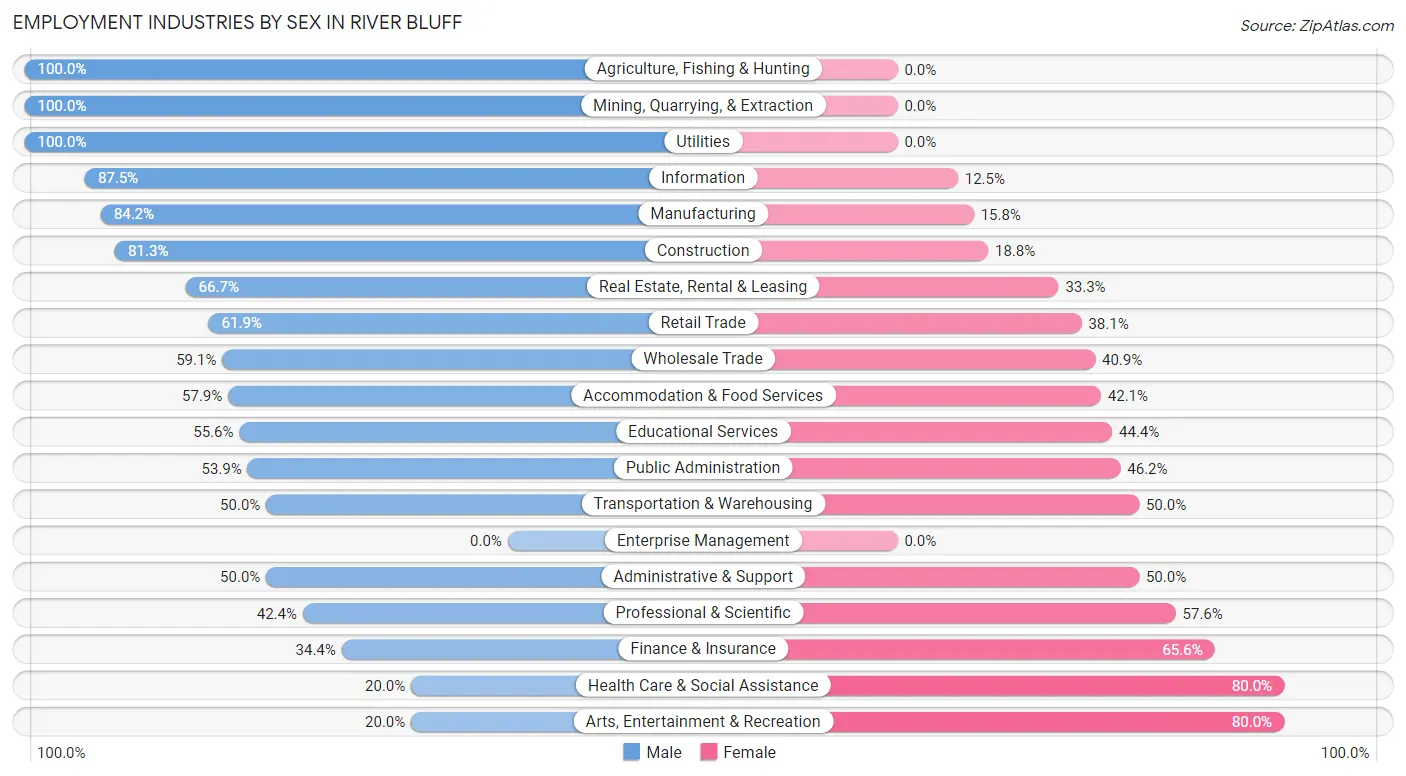
Employment Industries by Sex in River Bluff
The River Bluff industries that see more men than women are Agriculture, Fishing & Hunting (100.0%), Mining, Quarrying, & Extraction (100.0%), and Utilities (100.0%), whereas the industries that tend to have a higher number of women are Health Care & Social Assistance (80.0%), Arts, Entertainment & Recreation (80.0%), and Finance & Insurance (65.6%).
| Industry | Male | Female |
| Agriculture, Fishing & Hunting | 3 (100.0%) | 0 (0.0%) |
| Mining, Quarrying, & Extraction | 1 (100.0%) | 0 (0.0%) |
| Construction | 13 (81.2%) | 3 (18.8%) |
| Manufacturing | 16 (84.2%) | 3 (15.8%) |
| Wholesale Trade | 13 (59.1%) | 9 (40.9%) |
| Retail Trade | 13 (61.9%) | 8 (38.1%) |
| Transportation & Warehousing | 2 (50.0%) | 2 (50.0%) |
| Utilities | 2 (100.0%) | 0 (0.0%) |
| Information | 7 (87.5%) | 1 (12.5%) |
| Finance & Insurance | 11 (34.4%) | 21 (65.6%) |
| Real Estate, Rental & Leasing | 4 (66.7%) | 2 (33.3%) |
| Professional & Scientific | 14 (42.4%) | 19 (57.6%) |
| Enterprise Management | 0 (0.0%) | 0 (0.0%) |
| Administrative & Support | 2 (50.0%) | 2 (50.0%) |
| Educational Services | 10 (55.6%) | 8 (44.4%) |
| Health Care & Social Assistance | 7 (20.0%) | 28 (80.0%) |
| Arts, Entertainment & Recreation | 1 (20.0%) | 4 (80.0%) |
| Accommodation & Food Services | 11 (57.9%) | 8 (42.1%) |
| Public Administration | 7 (53.8%) | 6 (46.2%) |
| Total | 148 (53.8%) | 127 (46.2%) |
Education in River Bluff
School Enrollment in River Bluff
The most common levels of schooling among the 126 students in River Bluff are elementary school (33 | 26.2%), middle school (24 | 19.1%), and high school (23 | 18.2%).
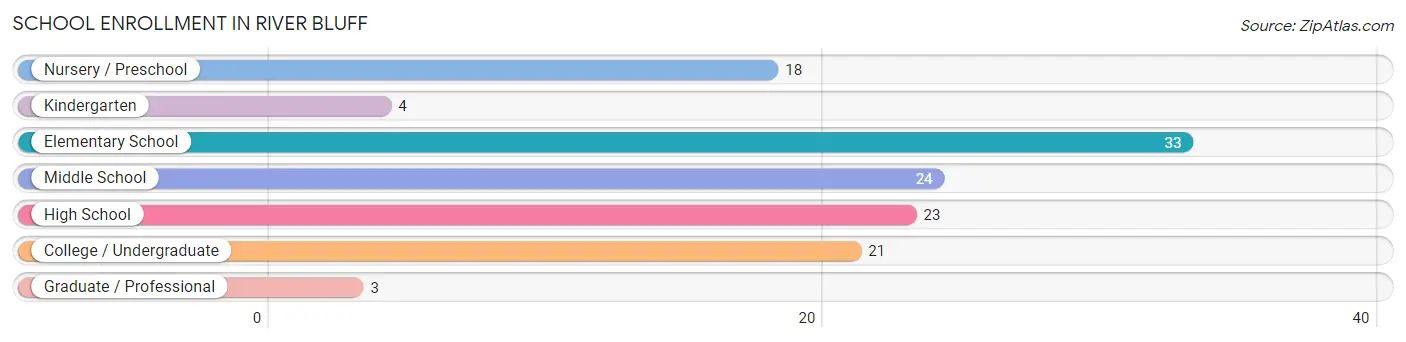
| School Level | # Students | % Students |
| Nursery / Preschool | 18 | 14.3% |
| Kindergarten | 4 | 3.2% |
| Elementary School | 33 | 26.2% |
| Middle School | 24 | 19.1% |
| High School | 23 | 18.2% |
| College / Undergraduate | 21 | 16.7% |
| Graduate / Professional | 3 | 2.4% |
| Total | 126 | 100.0% |
School Enrollment by Age by Funding Source in River Bluff
Out of a total of 126 students who are enrolled in schools in River Bluff, 30 (23.8%) attend a private institution, while the remaining 96 (76.2%) are enrolled in public schools. The age group of 3 to 4 year olds has the highest likelihood of being enrolled in private schools, with 14 (93.3% in the age bracket) enrolled. Conversely, the age group of 15 to 17 year olds has the lowest likelihood of being enrolled in a private school, with 13 (100.0% in the age bracket) attending a public institution.
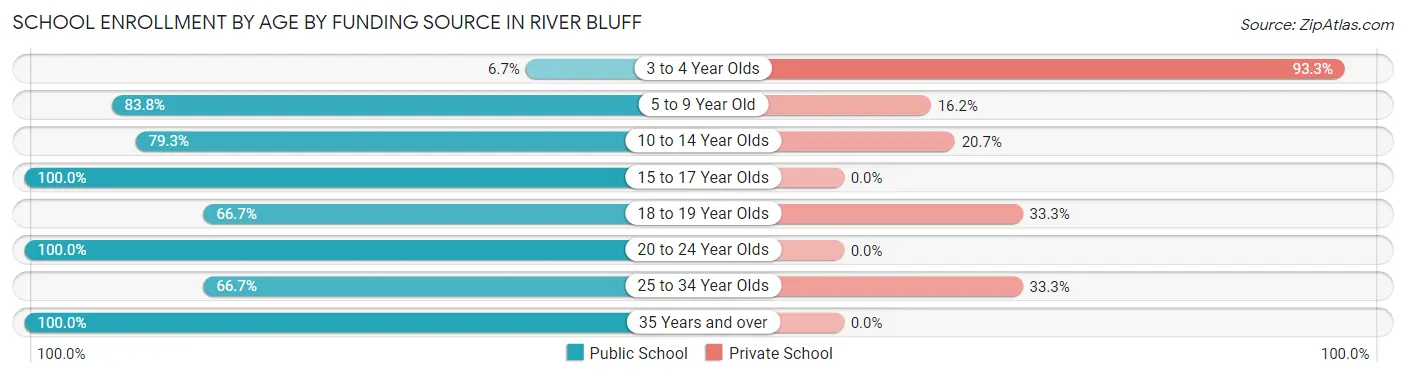
| Age Bracket | Public School | Private School |
| 3 to 4 Year Olds | 1 (6.7%) | 14 (93.3%) |
| 5 to 9 Year Old | 31 (83.8%) | 6 (16.2%) |
| 10 to 14 Year Olds | 23 (79.3%) | 6 (20.7%) |
| 15 to 17 Year Olds | 13 (100.0%) | 0 (0.0%) |
| 18 to 19 Year Olds | 6 (66.7%) | 3 (33.3%) |
| 20 to 24 Year Olds | 6 (100.0%) | 0 (0.0%) |
| 25 to 34 Year Olds | 2 (66.7%) | 1 (33.3%) |
| 35 Years and over | 14 (100.0%) | 0 (0.0%) |
| Total | 96 (76.2%) | 30 (23.8%) |
Educational Attainment by Field of Study in River Bluff
Business (69 | 32.6%), social sciences (41 | 19.3%), education (21 | 9.9%), science & technology (20 | 9.4%), and bio, nature & agricultural (17 | 8.0%) are the most common fields of study among 212 individuals in River Bluff who have obtained a bachelor's degree or higher.
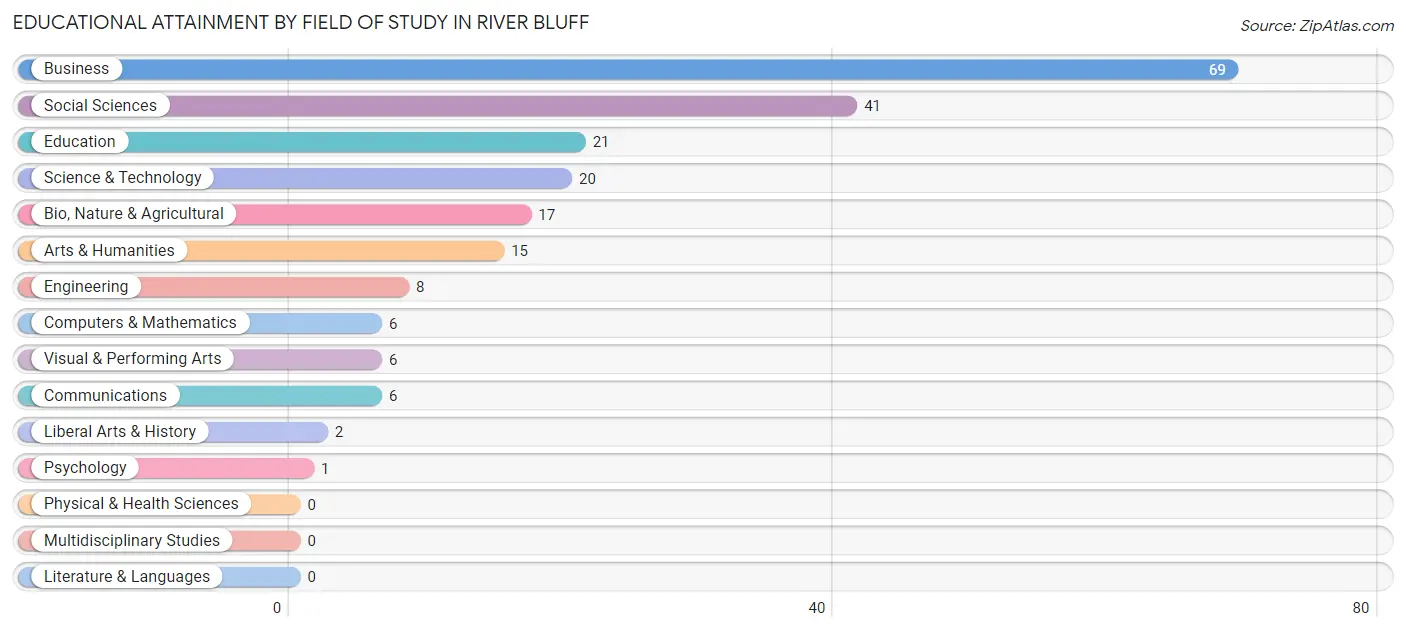
| Field of Study | # Graduates | % Graduates |
| Computers & Mathematics | 6 | 2.8% |
| Bio, Nature & Agricultural | 17 | 8.0% |
| Physical & Health Sciences | 0 | 0.0% |
| Psychology | 1 | 0.5% |
| Social Sciences | 41 | 19.3% |
| Engineering | 8 | 3.8% |
| Multidisciplinary Studies | 0 | 0.0% |
| Science & Technology | 20 | 9.4% |
| Business | 69 | 32.6% |
| Education | 21 | 9.9% |
| Literature & Languages | 0 | 0.0% |
| Liberal Arts & History | 2 | 0.9% |
| Visual & Performing Arts | 6 | 2.8% |
| Communications | 6 | 2.8% |
| Arts & Humanities | 15 | 7.1% |
| Total | 212 | 100.0% |
Transportation & Commute in River Bluff
Vehicle Availability by Sex in River Bluff
The most prevalent vehicle ownership categories in River Bluff are males with 2 vehicles (83, accounting for 56.1%) and females with 2 vehicles (61, making up 68.0%).
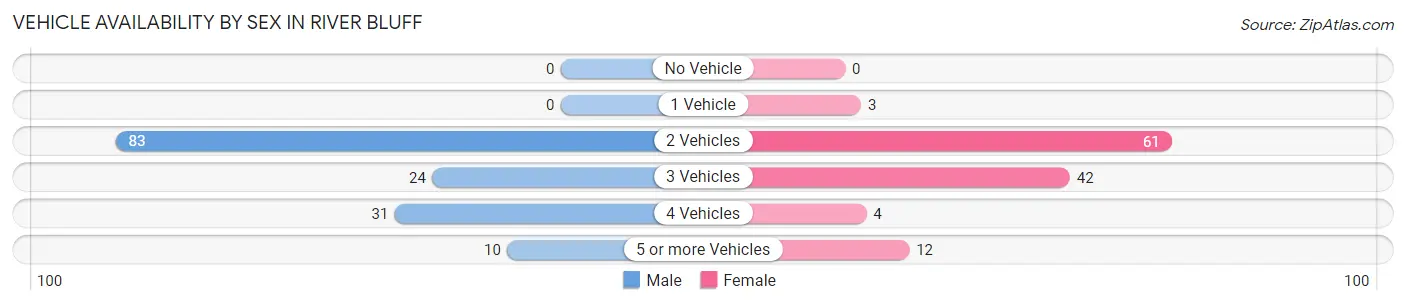
| Vehicles Available | Male | Female |
| No Vehicle | 0 (0.0%) | 0 (0.0%) |
| 1 Vehicle | 0 (0.0%) | 3 (2.5%) |
| 2 Vehicles | 83 (56.1%) | 61 (50.0%) |
| 3 Vehicles | 24 (16.2%) | 42 (34.4%) |
| 4 Vehicles | 31 (20.9%) | 4 (3.3%) |
| 5 or more Vehicles | 10 (6.8%) | 12 (9.8%) |
| Total | 148 (100.0%) | 122 (100.0%) |
Commute Time in River Bluff
The most frequently occuring commute durations in River Bluff are 30 to 34 minutes (74 commuters, 36.3%), 20 to 24 minutes (46 commuters, 22.6%), and 15 to 19 minutes (32 commuters, 15.7%).
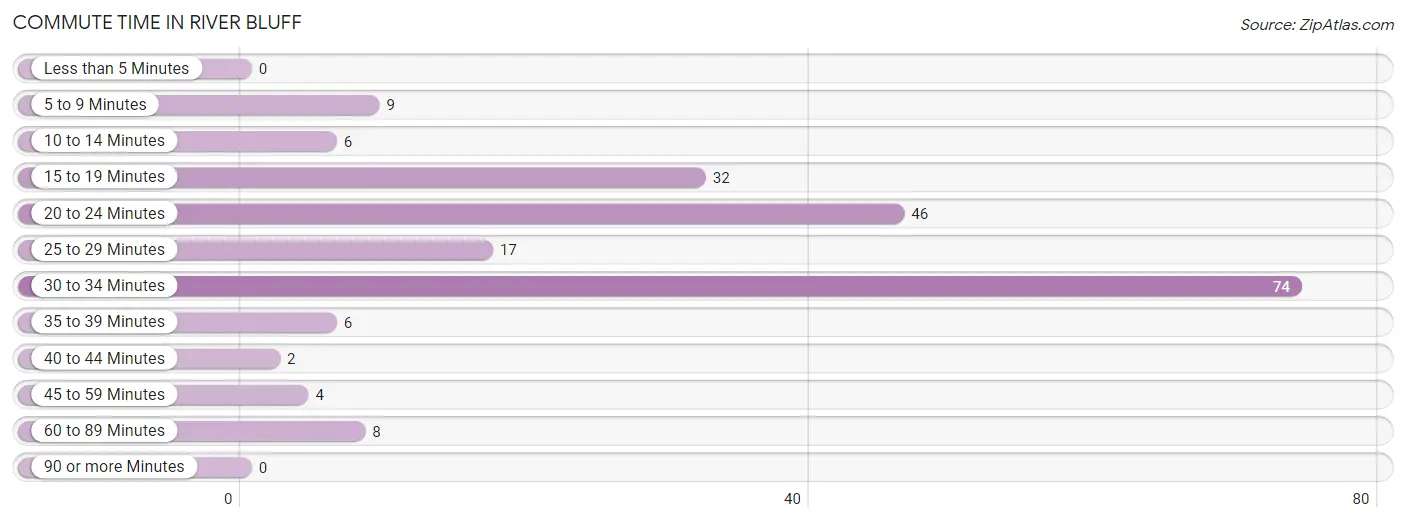
| Commute Time | # Commuters | % Commuters |
| Less than 5 Minutes | 0 | 0.0% |
| 5 to 9 Minutes | 9 | 4.4% |
| 10 to 14 Minutes | 6 | 2.9% |
| 15 to 19 Minutes | 32 | 15.7% |
| 20 to 24 Minutes | 46 | 22.6% |
| 25 to 29 Minutes | 17 | 8.3% |
| 30 to 34 Minutes | 74 | 36.3% |
| 35 to 39 Minutes | 6 | 2.9% |
| 40 to 44 Minutes | 2 | 1.0% |
| 45 to 59 Minutes | 4 | 2.0% |
| 60 to 89 Minutes | 8 | 3.9% |
| 90 or more Minutes | 0 | 0.0% |
Commute Time by Sex in River Bluff
The most common commute times in River Bluff are 30 to 34 minutes (57 commuters, 44.5%) for males and 15 to 19 minutes (21 commuters, 27.6%) for females.
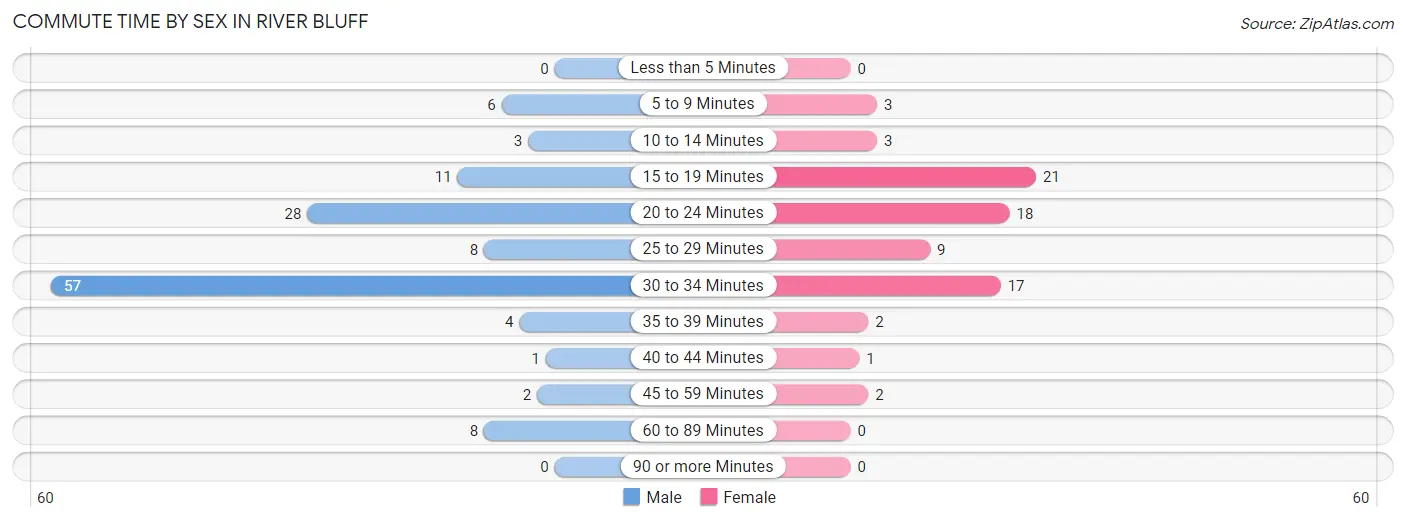
| Commute Time | Male | Female |
| Less than 5 Minutes | 0 (0.0%) | 0 (0.0%) |
| 5 to 9 Minutes | 6 (4.7%) | 3 (4.0%) |
| 10 to 14 Minutes | 3 (2.3%) | 3 (4.0%) |
| 15 to 19 Minutes | 11 (8.6%) | 21 (27.6%) |
| 20 to 24 Minutes | 28 (21.9%) | 18 (23.7%) |
| 25 to 29 Minutes | 8 (6.2%) | 9 (11.8%) |
| 30 to 34 Minutes | 57 (44.5%) | 17 (22.4%) |
| 35 to 39 Minutes | 4 (3.1%) | 2 (2.6%) |
| 40 to 44 Minutes | 1 (0.8%) | 1 (1.3%) |
| 45 to 59 Minutes | 2 (1.6%) | 2 (2.6%) |
| 60 to 89 Minutes | 8 (6.2%) | 0 (0.0%) |
| 90 or more Minutes | 0 (0.0%) | 0 (0.0%) |
Time of Departure to Work by Sex in River Bluff
The most frequent times of departure to work in River Bluff are 6:00 AM to 6:29 AM (20, 15.6%) for males and 10:00 AM to 10:59 AM (14, 18.4%) for females.
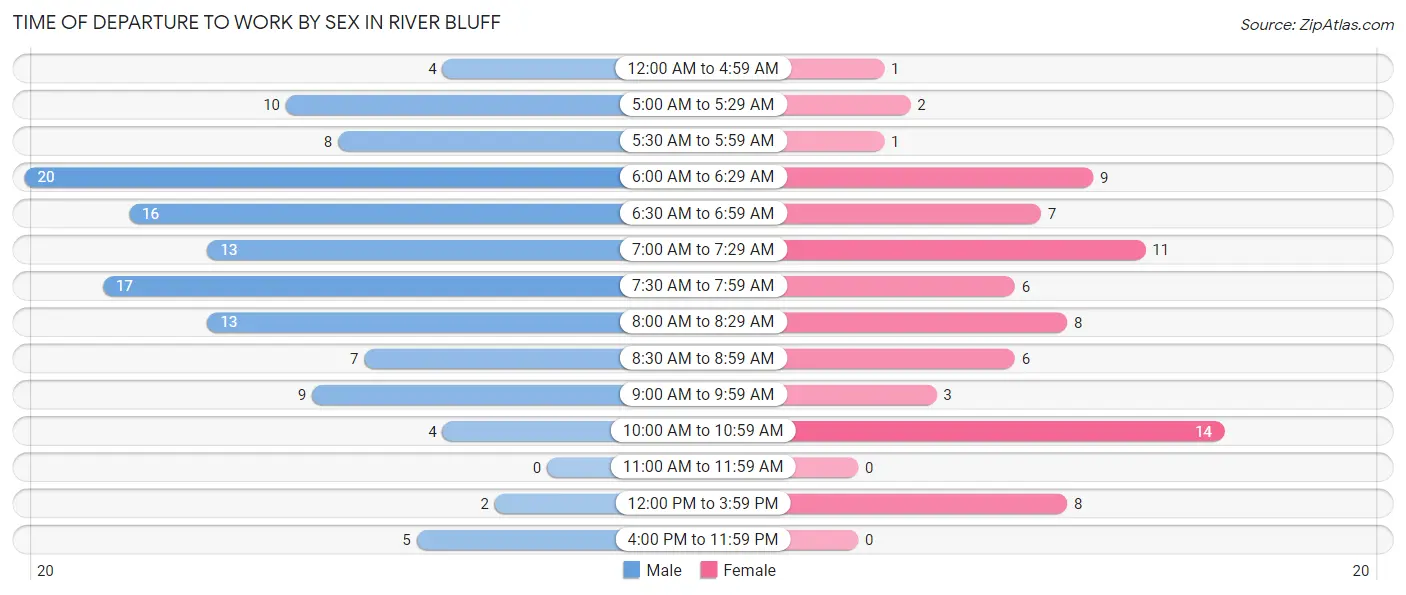
| Time of Departure | Male | Female |
| 12:00 AM to 4:59 AM | 4 (3.1%) | 1 (1.3%) |
| 5:00 AM to 5:29 AM | 10 (7.8%) | 2 (2.6%) |
| 5:30 AM to 5:59 AM | 8 (6.2%) | 1 (1.3%) |
| 6:00 AM to 6:29 AM | 20 (15.6%) | 9 (11.8%) |
| 6:30 AM to 6:59 AM | 16 (12.5%) | 7 (9.2%) |
| 7:00 AM to 7:29 AM | 13 (10.2%) | 11 (14.5%) |
| 7:30 AM to 7:59 AM | 17 (13.3%) | 6 (7.9%) |
| 8:00 AM to 8:29 AM | 13 (10.2%) | 8 (10.5%) |
| 8:30 AM to 8:59 AM | 7 (5.5%) | 6 (7.9%) |
| 9:00 AM to 9:59 AM | 9 (7.0%) | 3 (4.0%) |
| 10:00 AM to 10:59 AM | 4 (3.1%) | 14 (18.4%) |
| 11:00 AM to 11:59 AM | 0 (0.0%) | 0 (0.0%) |
| 12:00 PM to 3:59 PM | 2 (1.6%) | 8 (10.5%) |
| 4:00 PM to 11:59 PM | 5 (3.9%) | 0 (0.0%) |
| Total | 128 (100.0%) | 76 (100.0%) |
Housing Occupancy in River Bluff
Occupancy by Ownership in River Bluff
Of the total 171 dwellings in River Bluff, owner-occupied units account for 169 (98.8%), while renter-occupied units make up 2 (1.2%).
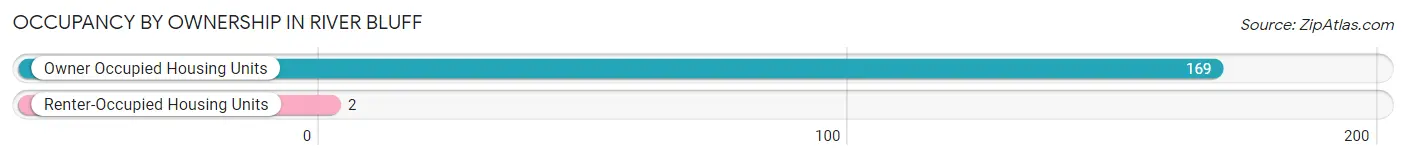
| Occupancy | # Housing Units | % Housing Units |
| Owner Occupied Housing Units | 169 | 98.8% |
| Renter-Occupied Housing Units | 2 | 1.2% |
| Total Occupied Housing Units | 171 | 100.0% |
Occupancy by Household Size in River Bluff
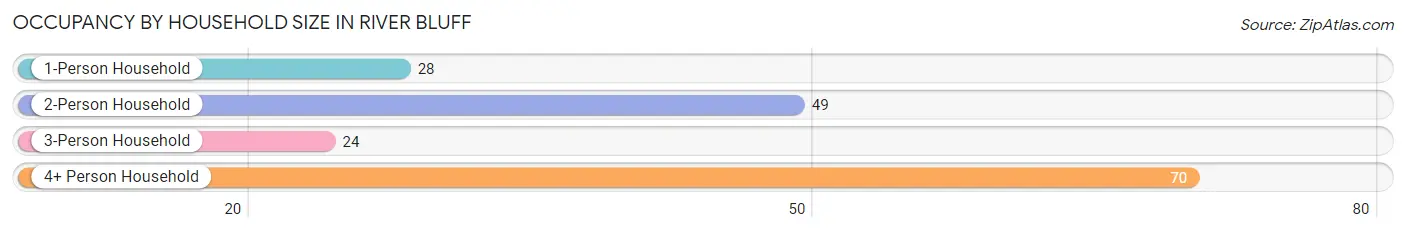
| Household Size | # Housing Units | % Housing Units |
| 1-Person Household | 28 | 16.4% |
| 2-Person Household | 49 | 28.6% |
| 3-Person Household | 24 | 14.0% |
| 4+ Person Household | 70 | 40.9% |
| Total Housing Units | 171 | 100.0% |
Occupancy by Ownership by Household Size in River Bluff
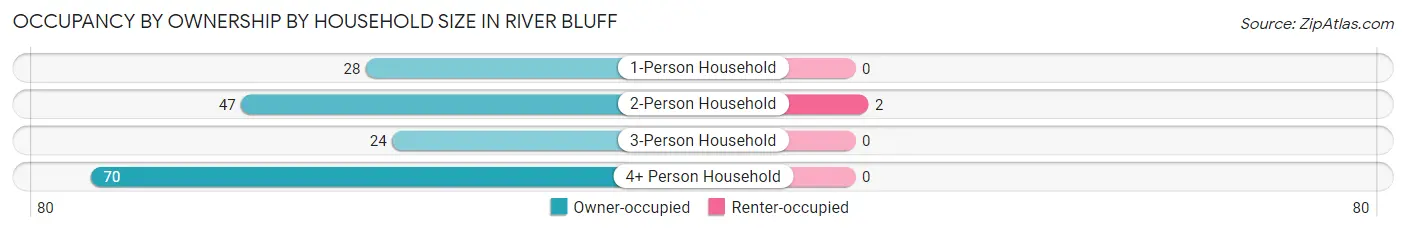
| Household Size | Owner-occupied | Renter-occupied |
| 1-Person Household | 28 (100.0%) | 0 (0.0%) |
| 2-Person Household | 47 (95.9%) | 2 (4.1%) |
| 3-Person Household | 24 (100.0%) | 0 (0.0%) |
| 4+ Person Household | 70 (100.0%) | 0 (0.0%) |
| Total Housing Units | 169 (98.8%) | 2 (1.2%) |
Occupancy by Educational Attainment in River Bluff
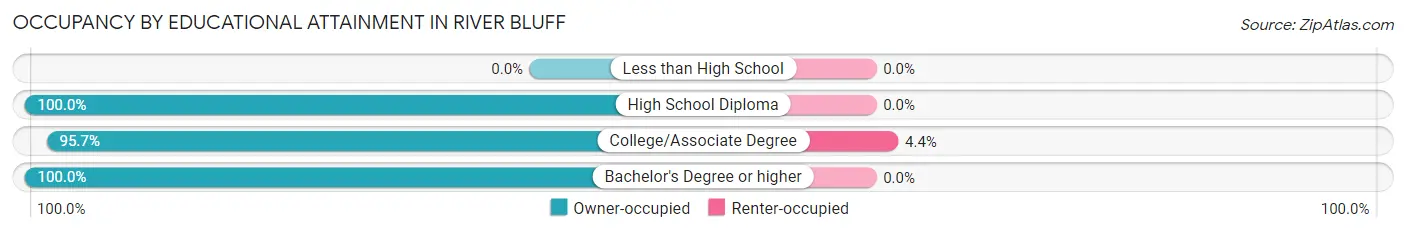
| Household Size | Owner-occupied | Renter-occupied |
| Less than High School | 0 (0.0%) | 0 (0.0%) |
| High School Diploma | 15 (100.0%) | 0 (0.0%) |
| College/Associate Degree | 44 (95.7%) | 2 (4.3%) |
| Bachelor's Degree or higher | 110 (100.0%) | 0 (0.0%) |
Occupancy by Age of Householder in River Bluff
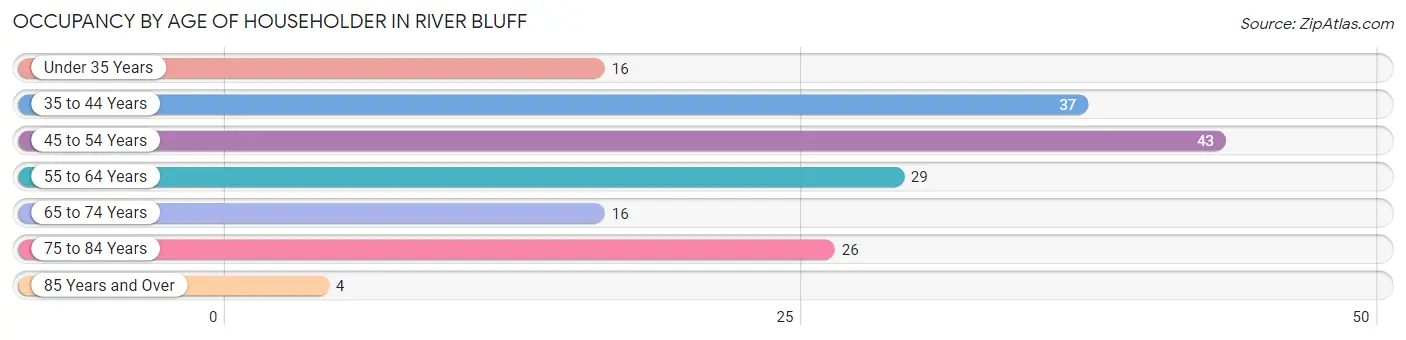
| Age Bracket | # Households | % Households |
| Under 35 Years | 16 | 9.4% |
| 35 to 44 Years | 37 | 21.6% |
| 45 to 54 Years | 43 | 25.2% |
| 55 to 64 Years | 29 | 17.0% |
| 65 to 74 Years | 16 | 9.4% |
| 75 to 84 Years | 26 | 15.2% |
| 85 Years and Over | 4 | 2.3% |
| Total | 171 | 100.0% |
Housing Finances in River Bluff
Median Income by Occupancy in River Bluff
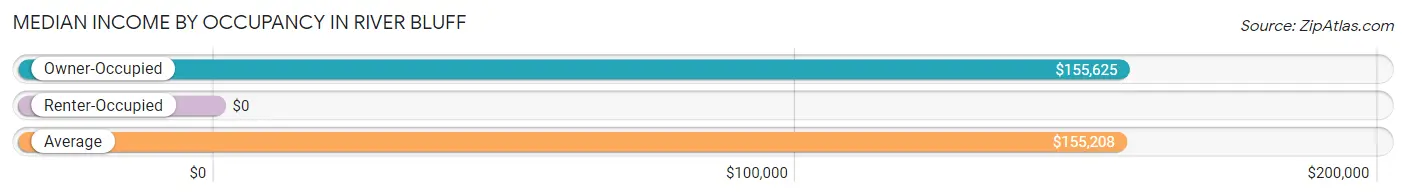
| Occupancy Type | # Households | Median Income |
| Owner-Occupied | 169 (98.8%) | $155,625 |
| Renter-Occupied | 2 (1.2%) | $0 |
| Average | 171 (100.0%) | $155,208 |
Occupancy by Householder Income Bracket in River Bluff
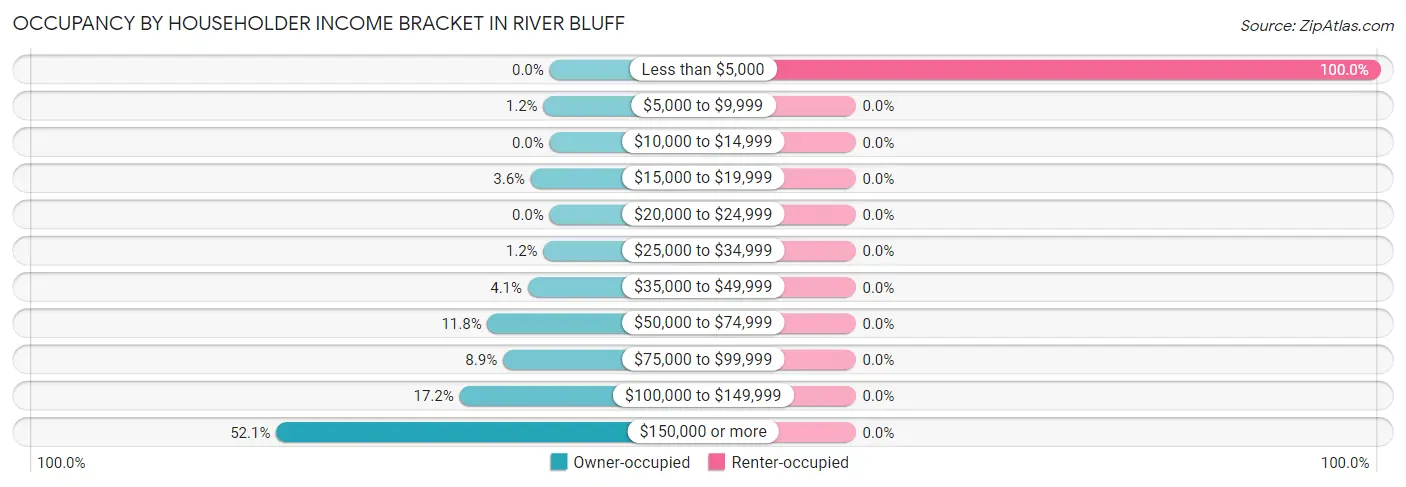
| Income Bracket | Owner-occupied | Renter-occupied |
| Less than $5,000 | 0 (0.0%) | 2 (100.0%) |
| $5,000 to $9,999 | 2 (1.2%) | 0 (0.0%) |
| $10,000 to $14,999 | 0 (0.0%) | 0 (0.0%) |
| $15,000 to $19,999 | 6 (3.5%) | 0 (0.0%) |
| $20,000 to $24,999 | 0 (0.0%) | 0 (0.0%) |
| $25,000 to $34,999 | 2 (1.2%) | 0 (0.0%) |
| $35,000 to $49,999 | 7 (4.1%) | 0 (0.0%) |
| $50,000 to $74,999 | 20 (11.8%) | 0 (0.0%) |
| $75,000 to $99,999 | 15 (8.9%) | 0 (0.0%) |
| $100,000 to $149,999 | 29 (17.2%) | 0 (0.0%) |
| $150,000 or more | 88 (52.1%) | 0 (0.0%) |
| Total | 169 (100.0%) | 2 (100.0%) |
Monthly Housing Cost Tiers in River Bluff
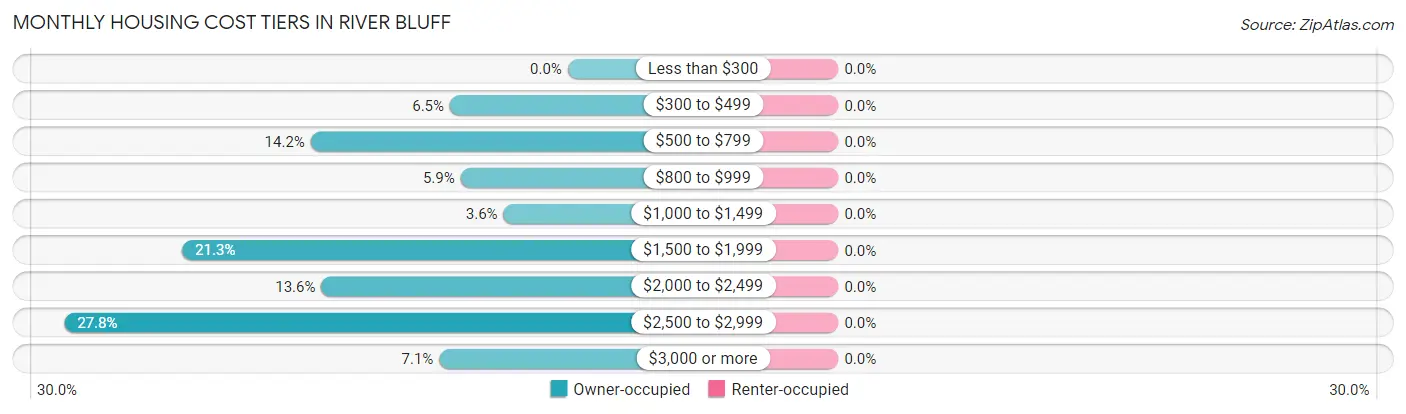
| Monthly Cost | Owner-occupied | Renter-occupied |
| Less than $300 | 0 (0.0%) | 0 (0.0%) |
| $300 to $499 | 11 (6.5%) | 0 (0.0%) |
| $500 to $799 | 24 (14.2%) | 0 (0.0%) |
| $800 to $999 | 10 (5.9%) | 0 (0.0%) |
| $1,000 to $1,499 | 6 (3.5%) | 0 (0.0%) |
| $1,500 to $1,999 | 36 (21.3%) | 0 (0.0%) |
| $2,000 to $2,499 | 23 (13.6%) | 0 (0.0%) |
| $2,500 to $2,999 | 47 (27.8%) | 0 (0.0%) |
| $3,000 or more | 12 (7.1%) | 0 (0.0%) |
| Total | 169 (100.0%) | 2 (100.0%) |
Physical Housing Characteristics in River Bluff
Housing Structures in River Bluff
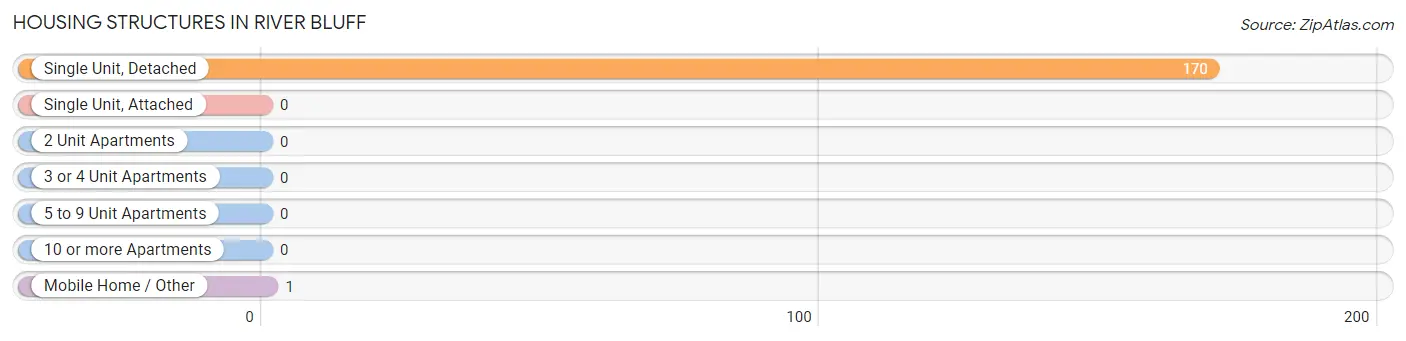
| Structure Type | # Housing Units | % Housing Units |
| Single Unit, Detached | 170 | 99.4% |
| Single Unit, Attached | 0 | 0.0% |
| 2 Unit Apartments | 0 | 0.0% |
| 3 or 4 Unit Apartments | 0 | 0.0% |
| 5 to 9 Unit Apartments | 0 | 0.0% |
| 10 or more Apartments | 0 | 0.0% |
| Mobile Home / Other | 1 | 0.6% |
| Total | 171 | 100.0% |
Housing Structures by Occupancy in River Bluff
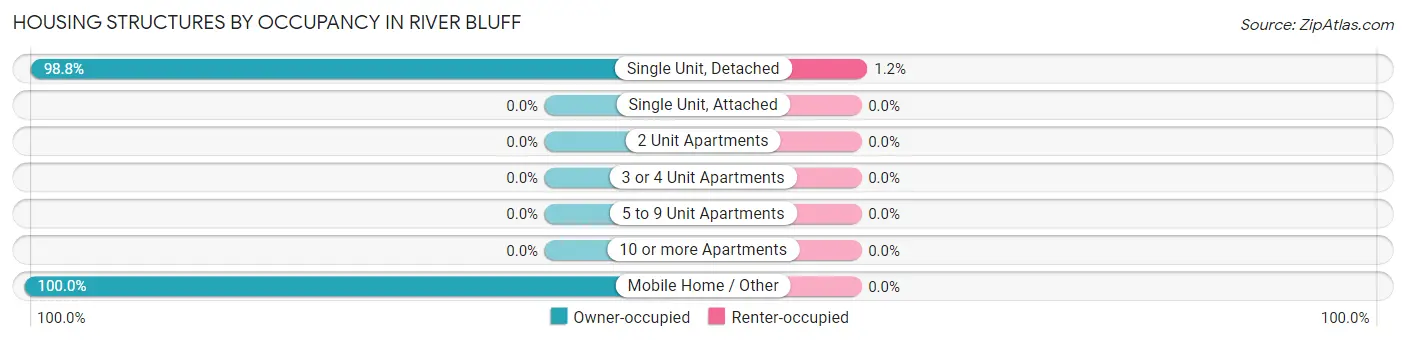
| Structure Type | Owner-occupied | Renter-occupied |
| Single Unit, Detached | 168 (98.8%) | 2 (1.2%) |
| Single Unit, Attached | 0 (0.0%) | 0 (0.0%) |
| 2 Unit Apartments | 0 (0.0%) | 0 (0.0%) |
| 3 or 4 Unit Apartments | 0 (0.0%) | 0 (0.0%) |
| 5 to 9 Unit Apartments | 0 (0.0%) | 0 (0.0%) |
| 10 or more Apartments | 0 (0.0%) | 0 (0.0%) |
| Mobile Home / Other | 1 (100.0%) | 0 (0.0%) |
| Total | 169 (98.8%) | 2 (1.2%) |
Housing Structures by Number of Rooms in River Bluff
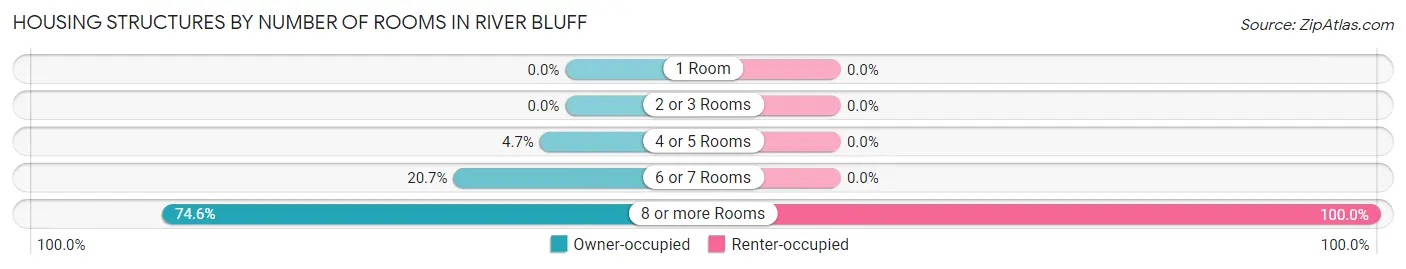
| Number of Rooms | Owner-occupied | Renter-occupied |
| 1 Room | 0 (0.0%) | 0 (0.0%) |
| 2 or 3 Rooms | 0 (0.0%) | 0 (0.0%) |
| 4 or 5 Rooms | 8 (4.7%) | 0 (0.0%) |
| 6 or 7 Rooms | 35 (20.7%) | 0 (0.0%) |
| 8 or more Rooms | 126 (74.6%) | 2 (100.0%) |
| Total | 169 (100.0%) | 2 (100.0%) |
Housing Structure by Heating Type in River Bluff
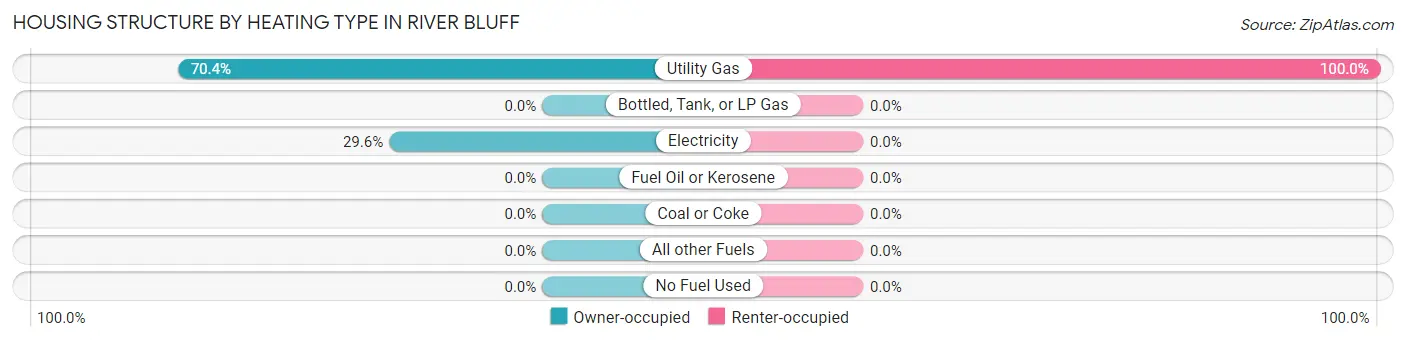
| Heating Type | Owner-occupied | Renter-occupied |
| Utility Gas | 119 (70.4%) | 2 (100.0%) |
| Bottled, Tank, or LP Gas | 0 (0.0%) | 0 (0.0%) |
| Electricity | 50 (29.6%) | 0 (0.0%) |
| Fuel Oil or Kerosene | 0 (0.0%) | 0 (0.0%) |
| Coal or Coke | 0 (0.0%) | 0 (0.0%) |
| All other Fuels | 0 (0.0%) | 0 (0.0%) |
| No Fuel Used | 0 (0.0%) | 0 (0.0%) |
| Total | 169 (100.0%) | 2 (100.0%) |
Household Vehicle Usage in River Bluff
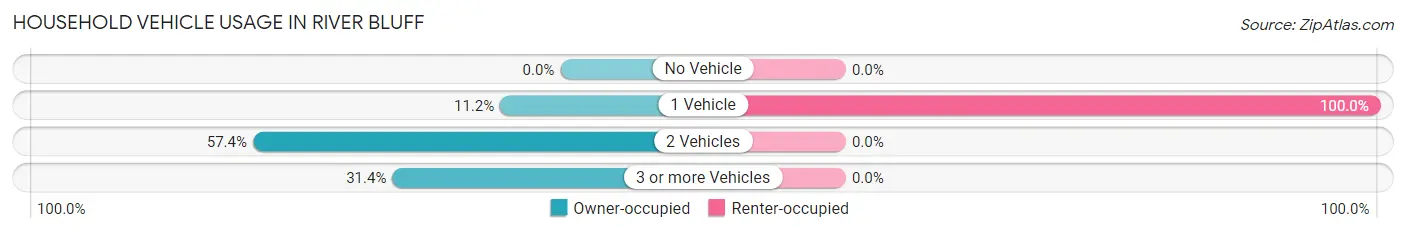
| Vehicles per Household | Owner-occupied | Renter-occupied |
| No Vehicle | 0 (0.0%) | 0 (0.0%) |
| 1 Vehicle | 19 (11.2%) | 2 (100.0%) |
| 2 Vehicles | 97 (57.4%) | 0 (0.0%) |
| 3 or more Vehicles | 53 (31.4%) | 0 (0.0%) |
| Total | 169 (100.0%) | 2 (100.0%) |
Real Estate & Mortgages in River Bluff
Real Estate and Mortgage Overview in River Bluff
| Characteristic | Without Mortgage | With Mortgage |
| Housing Units | 45 | 124 |
| Median Property Value | $298,200 | $407,400 |
| Median Household Income | $80,625 | $76 |
| Monthly Housing Costs | $712 | $12 |
| Real Estate Taxes | $3,026 | $0 |
Property Value by Mortgage Status in River Bluff
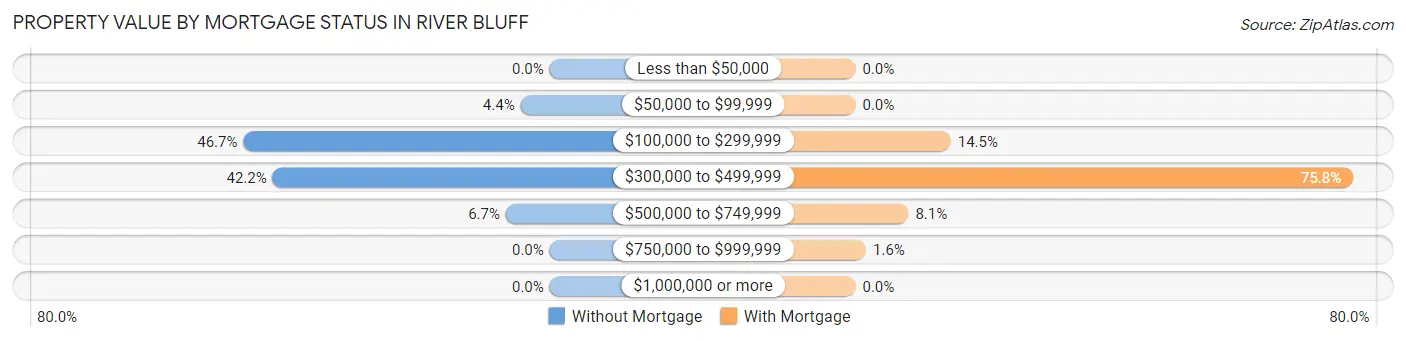
| Property Value | Without Mortgage | With Mortgage |
| Less than $50,000 | 0 (0.0%) | 0 (0.0%) |
| $50,000 to $99,999 | 2 (4.4%) | 0 (0.0%) |
| $100,000 to $299,999 | 21 (46.7%) | 18 (14.5%) |
| $300,000 to $499,999 | 19 (42.2%) | 94 (75.8%) |
| $500,000 to $749,999 | 3 (6.7%) | 10 (8.1%) |
| $750,000 to $999,999 | 0 (0.0%) | 2 (1.6%) |
| $1,000,000 or more | 0 (0.0%) | 0 (0.0%) |
| Total | 45 (100.0%) | 124 (100.0%) |
Household Income by Mortgage Status in River Bluff
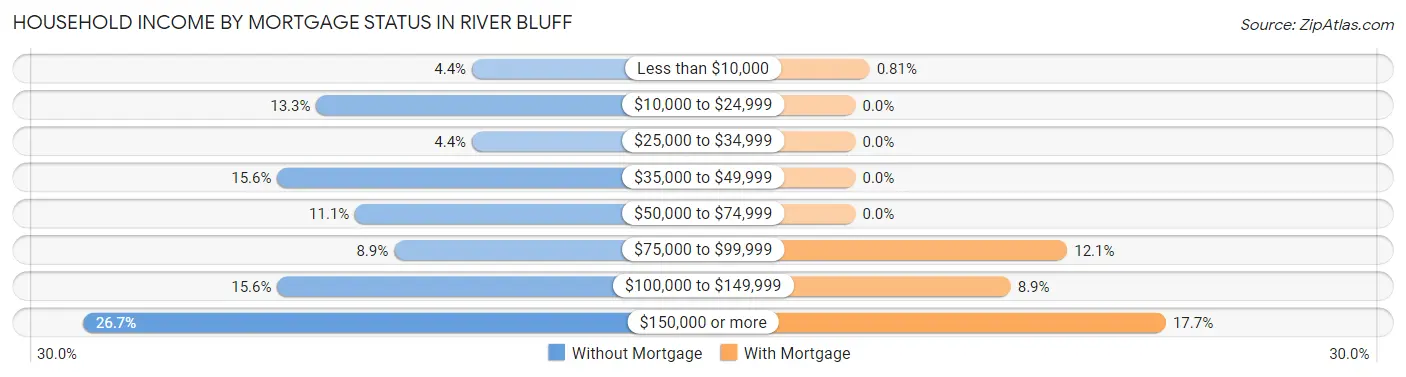
| Household Income | Without Mortgage | With Mortgage |
| Less than $10,000 | 2 (4.4%) | 1 (0.8%) |
| $10,000 to $24,999 | 6 (13.3%) | 0 (0.0%) |
| $25,000 to $34,999 | 2 (4.4%) | 0 (0.0%) |
| $35,000 to $49,999 | 7 (15.6%) | 0 (0.0%) |
| $50,000 to $74,999 | 5 (11.1%) | 0 (0.0%) |
| $75,000 to $99,999 | 4 (8.9%) | 15 (12.1%) |
| $100,000 to $149,999 | 7 (15.6%) | 11 (8.9%) |
| $150,000 or more | 12 (26.7%) | 22 (17.7%) |
| Total | 45 (100.0%) | 124 (100.0%) |
Property Value to Household Income Ratio in River Bluff
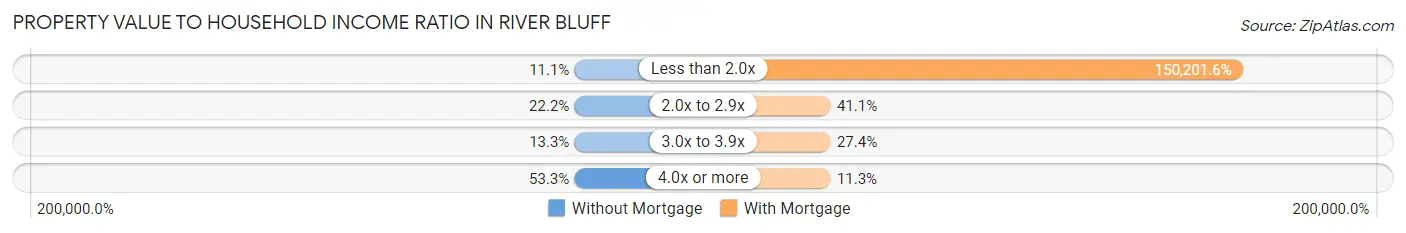
| Value-to-Income Ratio | Without Mortgage | With Mortgage |
| Less than 2.0x | 5 (11.1%) | 186,250 (150,201.6%) |
| 2.0x to 2.9x | 10 (22.2%) | 51 (41.1%) |
| 3.0x to 3.9x | 6 (13.3%) | 34 (27.4%) |
| 4.0x or more | 24 (53.3%) | 14 (11.3%) |
| Total | 45 (100.0%) | 124 (100.0%) |
Real Estate Taxes by Mortgage Status in River Bluff
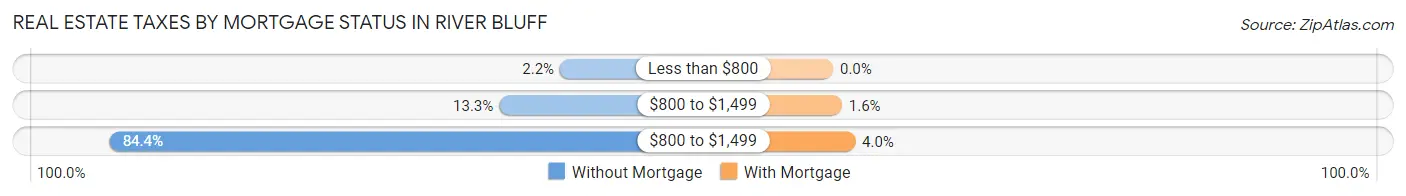
| Property Taxes | Without Mortgage | With Mortgage |
| Less than $800 | 1 (2.2%) | 0 (0.0%) |
| $800 to $1,499 | 6 (13.3%) | 2 (1.6%) |
| $800 to $1,499 | 38 (84.4%) | 5 (4.0%) |
| Total | 45 (100.0%) | 124 (100.0%) |
Health & Disability in River Bluff
Health Insurance Coverage by Age in River Bluff
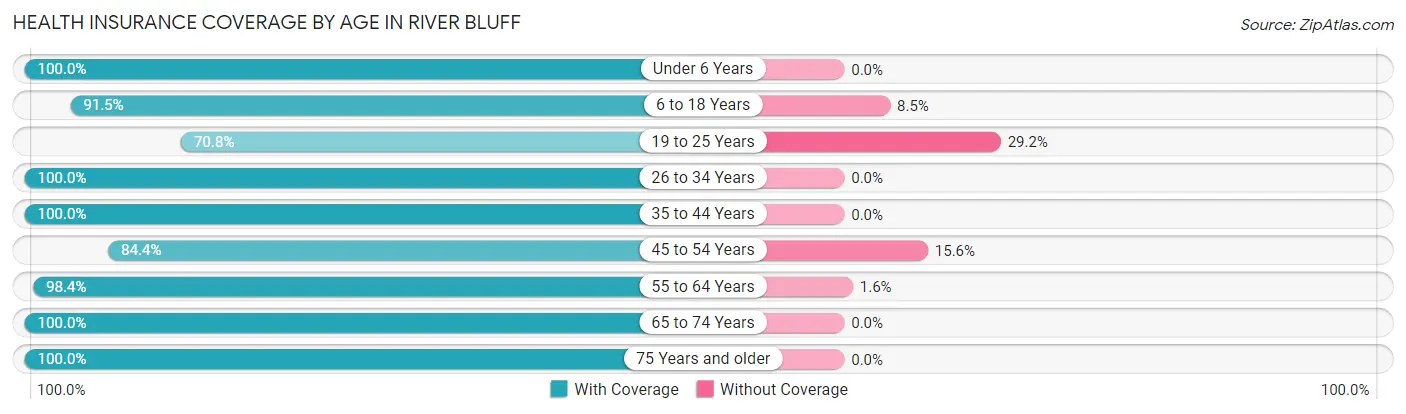
| Age Bracket | With Coverage | Without Coverage |
| Under 6 Years | 45 (100.0%) | 0 (0.0%) |
| 6 to 18 Years | 75 (91.5%) | 7 (8.5%) |
| 19 to 25 Years | 17 (70.8%) | 7 (29.2%) |
| 26 to 34 Years | 65 (100.0%) | 0 (0.0%) |
| 35 to 44 Years | 71 (100.0%) | 0 (0.0%) |
| 45 to 54 Years | 65 (84.4%) | 12 (15.6%) |
| 55 to 64 Years | 62 (98.4%) | 1 (1.6%) |
| 65 to 74 Years | 34 (100.0%) | 0 (0.0%) |
| 75 Years and older | 35 (100.0%) | 0 (0.0%) |
| Total | 469 (94.6%) | 27 (5.4%) |
Health Insurance Coverage by Citizenship Status in River Bluff
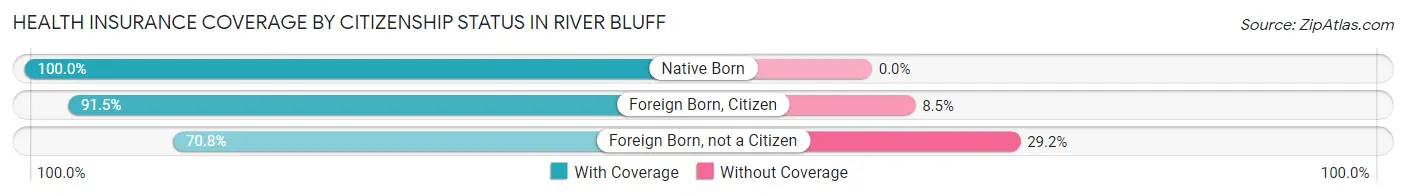
| Citizenship Status | With Coverage | Without Coverage |
| Native Born | 45 (100.0%) | 0 (0.0%) |
| Foreign Born, Citizen | 75 (91.5%) | 7 (8.5%) |
| Foreign Born, not a Citizen | 17 (70.8%) | 7 (29.2%) |
Health Insurance Coverage by Household Income in River Bluff
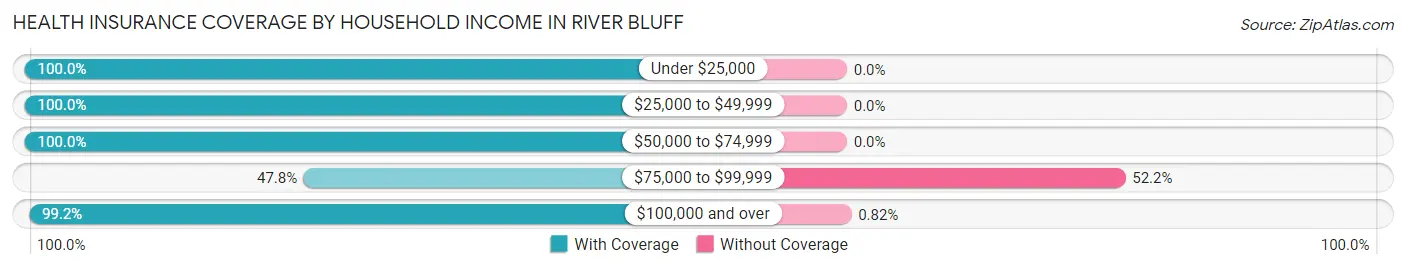
| Household Income | With Coverage | Without Coverage |
| Under $25,000 | 14 (100.0%) | 0 (0.0%) |
| $25,000 to $49,999 | 10 (100.0%) | 0 (0.0%) |
| $50,000 to $74,999 | 61 (100.0%) | 0 (0.0%) |
| $75,000 to $99,999 | 22 (47.8%) | 24 (52.2%) |
| $100,000 and over | 362 (99.2%) | 3 (0.8%) |
Public vs Private Health Insurance Coverage by Age in River Bluff
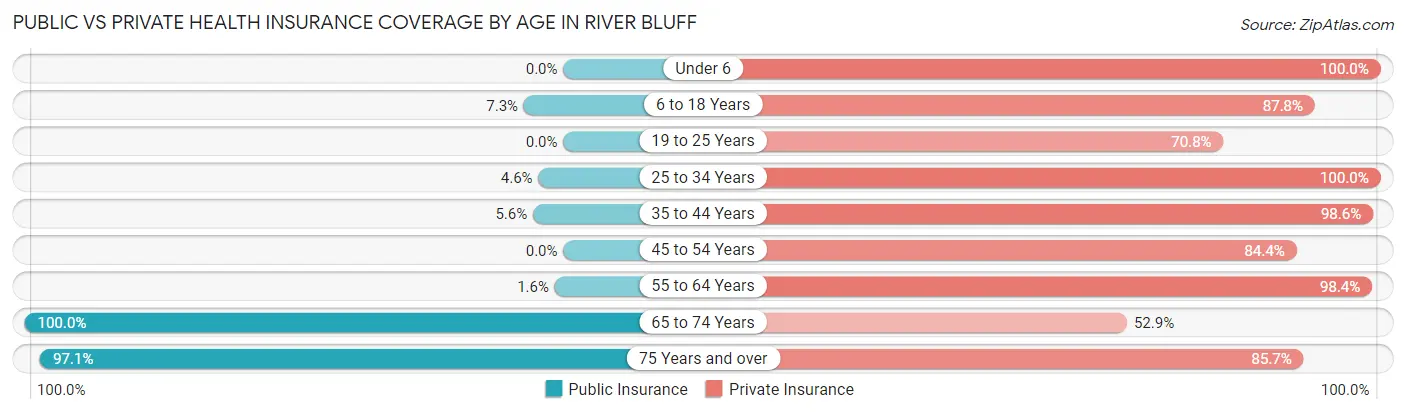
| Age Bracket | Public Insurance | Private Insurance |
| Under 6 | 0 (0.0%) | 45 (100.0%) |
| 6 to 18 Years | 6 (7.3%) | 72 (87.8%) |
| 19 to 25 Years | 0 (0.0%) | 17 (70.8%) |
| 25 to 34 Years | 3 (4.6%) | 65 (100.0%) |
| 35 to 44 Years | 4 (5.6%) | 70 (98.6%) |
| 45 to 54 Years | 0 (0.0%) | 65 (84.4%) |
| 55 to 64 Years | 1 (1.6%) | 62 (98.4%) |
| 65 to 74 Years | 34 (100.0%) | 18 (52.9%) |
| 75 Years and over | 34 (97.1%) | 30 (85.7%) |
| Total | 82 (16.5%) | 444 (89.5%) |
Disability Status by Sex by Age in River Bluff
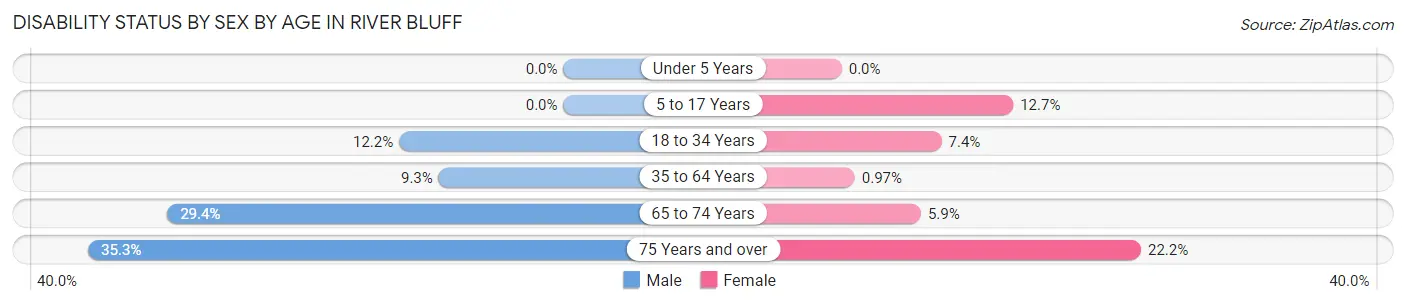
| Age Bracket | Male | Female |
| Under 5 Years | 0 (0.0%) | 0 (0.0%) |
| 5 to 17 Years | 0 (0.0%) | 7 (12.7%) |
| 18 to 34 Years | 5 (12.2%) | 4 (7.4%) |
| 35 to 64 Years | 10 (9.3%) | 1 (1.0%) |
| 65 to 74 Years | 5 (29.4%) | 1 (5.9%) |
| 75 Years and over | 6 (35.3%) | 4 (22.2%) |
Disability Class by Sex by Age in River Bluff
Disability Class: Hearing Difficulty
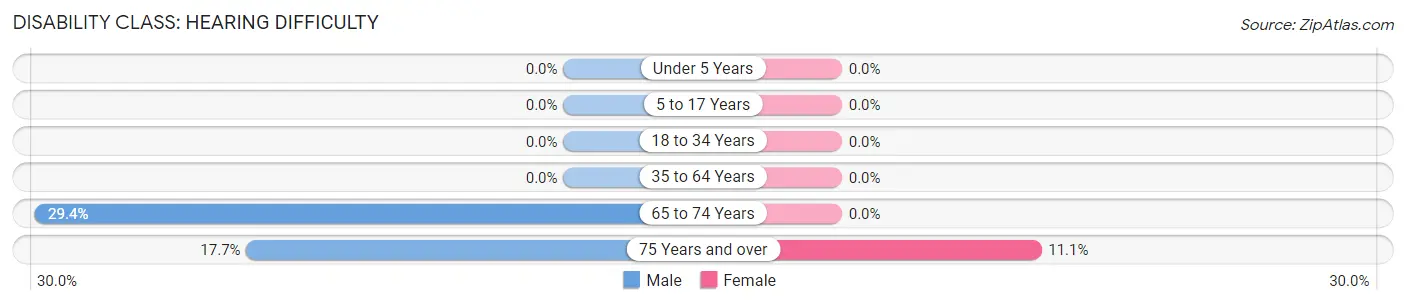
| Age Bracket | Male | Female |
| Under 5 Years | 0 (0.0%) | 0 (0.0%) |
| 5 to 17 Years | 0 (0.0%) | 0 (0.0%) |
| 18 to 34 Years | 0 (0.0%) | 0 (0.0%) |
| 35 to 64 Years | 0 (0.0%) | 0 (0.0%) |
| 65 to 74 Years | 5 (29.4%) | 0 (0.0%) |
| 75 Years and over | 3 (17.6%) | 2 (11.1%) |
Disability Class: Vision Difficulty
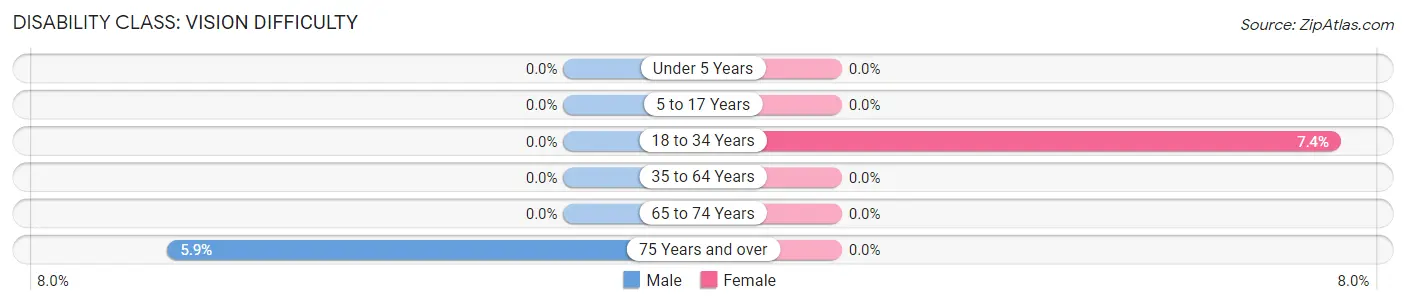
| Age Bracket | Male | Female |
| Under 5 Years | 0 (0.0%) | 0 (0.0%) |
| 5 to 17 Years | 0 (0.0%) | 0 (0.0%) |
| 18 to 34 Years | 0 (0.0%) | 4 (7.4%) |
| 35 to 64 Years | 0 (0.0%) | 0 (0.0%) |
| 65 to 74 Years | 0 (0.0%) | 0 (0.0%) |
| 75 Years and over | 1 (5.9%) | 0 (0.0%) |
Disability Class: Cognitive Difficulty
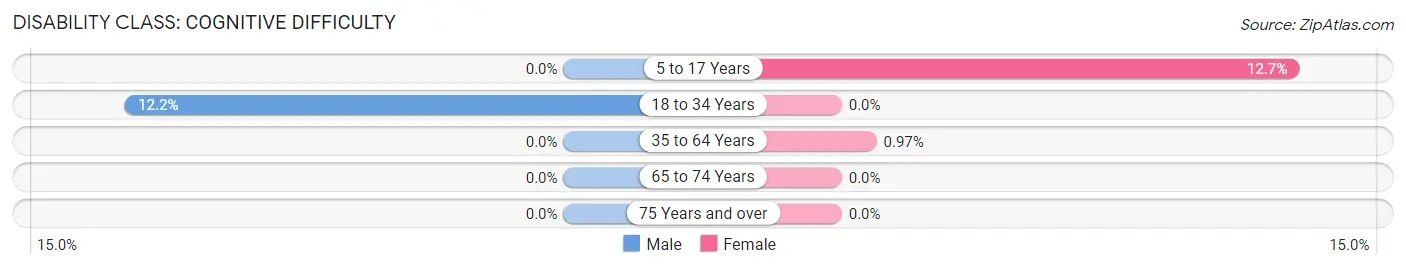
| Age Bracket | Male | Female |
| 5 to 17 Years | 0 (0.0%) | 7 (12.7%) |
| 18 to 34 Years | 5 (12.2%) | 0 (0.0%) |
| 35 to 64 Years | 0 (0.0%) | 1 (1.0%) |
| 65 to 74 Years | 0 (0.0%) | 0 (0.0%) |
| 75 Years and over | 0 (0.0%) | 0 (0.0%) |
Disability Class: Ambulatory Difficulty
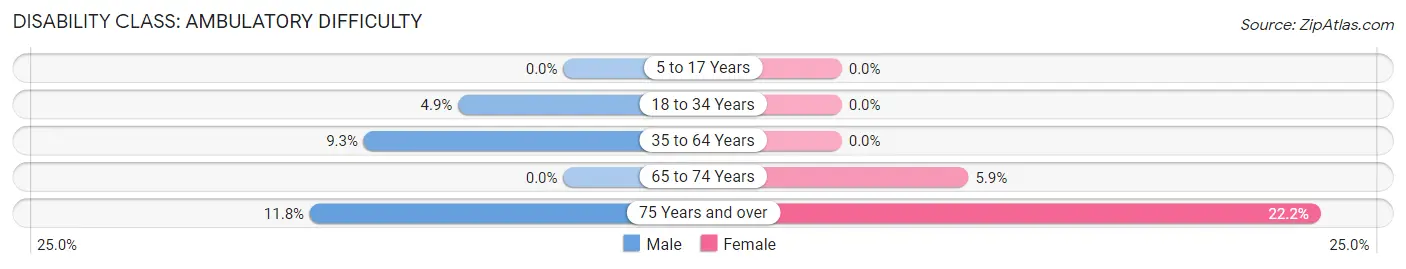
| Age Bracket | Male | Female |
| 5 to 17 Years | 0 (0.0%) | 0 (0.0%) |
| 18 to 34 Years | 2 (4.9%) | 0 (0.0%) |
| 35 to 64 Years | 10 (9.3%) | 0 (0.0%) |
| 65 to 74 Years | 0 (0.0%) | 1 (5.9%) |
| 75 Years and over | 2 (11.8%) | 4 (22.2%) |
Disability Class: Self-Care Difficulty
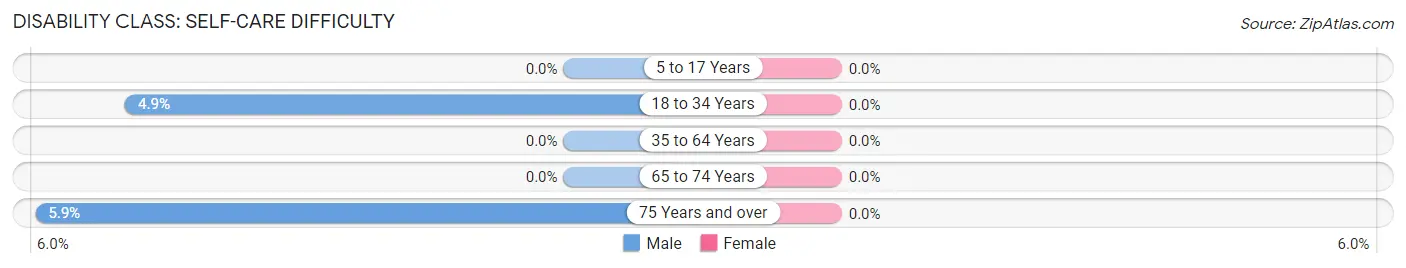
| Age Bracket | Male | Female |
| 5 to 17 Years | 0 (0.0%) | 0 (0.0%) |
| 18 to 34 Years | 2 (4.9%) | 0 (0.0%) |
| 35 to 64 Years | 0 (0.0%) | 0 (0.0%) |
| 65 to 74 Years | 0 (0.0%) | 0 (0.0%) |
| 75 Years and over | 1 (5.9%) | 0 (0.0%) |
Technology Access in River Bluff
Computing Device Access in River Bluff
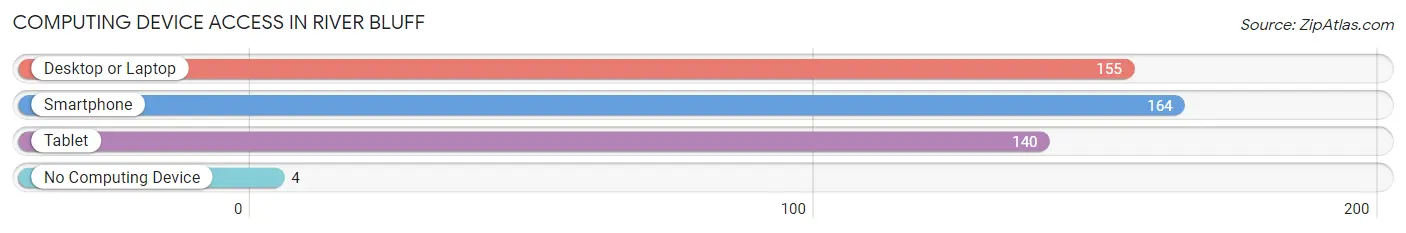
| Device Type | # Households | % Households |
| Desktop or Laptop | 155 | 90.6% |
| Smartphone | 164 | 95.9% |
| Tablet | 140 | 81.9% |
| No Computing Device | 4 | 2.3% |
| Total | 171 | 100.0% |
Internet Access in River Bluff
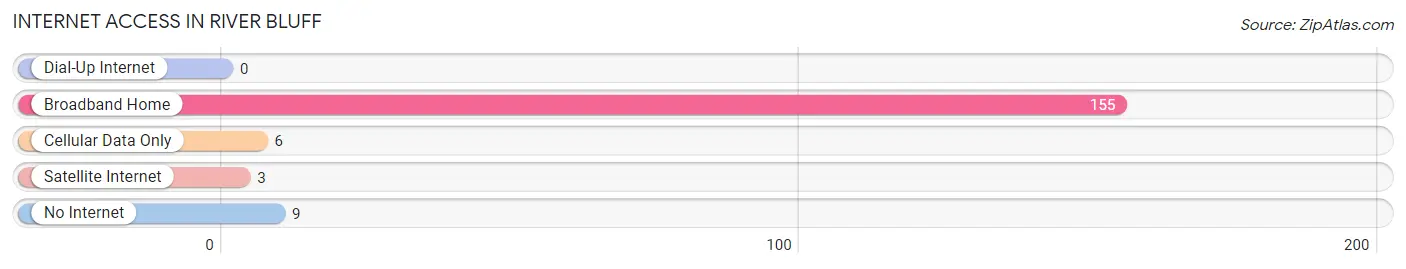
| Internet Type | # Households | % Households |
| Dial-Up Internet | 0 | 0.0% |
| Broadband Home | 155 | 90.6% |
| Cellular Data Only | 6 | 3.5% |
| Satellite Internet | 3 | 1.8% |
| No Internet | 9 | 5.3% |
| Total | 171 | 100.0% |
River Bluff Summary
River Bluff, Kentucky is a small town located in the southeastern part of the state, in the foothills of the Appalachian Mountains. It is situated on the banks of the Kentucky River, and is home to a population of just over 1,000 people. The town is known for its scenic beauty, and is a popular destination for outdoor recreation.
History
The area that is now River Bluff was first settled in the late 1700s by a group of settlers from Virginia. The town was originally known as “The Bluff”, and was a small farming community. In the early 1800s, the town was renamed “River Bluff”, and the population began to grow. The town was incorporated in 1820, and the first post office was established in 1821.
In the late 1800s, the town began to experience a period of growth and prosperity. The railroad arrived in 1887, and the town became a popular stop for travelers. The town also became a center for the timber industry, and several sawmills were built in the area.
In the early 1900s, the town experienced a period of decline. The timber industry began to decline, and the railroad stopped running through the town. The population began to decline, and the town was nearly abandoned by the mid-1900s.
In the late 1900s, the town began to experience a resurgence. The population began to grow, and the town began to attract new businesses. The town also began to attract tourists, and the town began to experience a period of growth and prosperity.
Geography
River Bluff is located in the southeastern part of Kentucky, in the foothills of the Appalachian Mountains. The town is situated on the banks of the Kentucky River, and is surrounded by rolling hills and forests. The town is located approximately 30 miles from Lexington, and is within easy driving distance of several major cities.
The climate in River Bluff is humid subtropical, with hot summers and mild winters. The average annual temperature is around 60 degrees Fahrenheit, and the average annual precipitation is around 45 inches.
Economy
The economy of River Bluff is largely based on tourism and outdoor recreation. The town is a popular destination for fishing, hunting, camping, and other outdoor activities. The town also has several small businesses, including restaurants, shops, and other services.
The town is also home to several manufacturing companies, including a furniture factory and a paper mill. The town is also home to a small airport, which serves as a hub for private and commercial flights.
Demographics
As of the 2010 census, the population of River Bluff was 1,072. The racial makeup of the town was 97.3% White, 0.9% African American, 0.2% Native American, 0.2% Asian, 0.1% Pacific Islander, and 1.3% from other races. The median household income was $37,500, and the median home value was $117,000.
Conclusion
River Bluff, Kentucky is a small town located in the southeastern part of the state, in the foothills of the Appalachian Mountains. It is situated on the banks of the Kentucky River, and is home to a population of just over 1,000 people. The town is known for its scenic beauty, and is a popular destination for outdoor recreation. The economy of River Bluff is largely based on tourism and outdoor recreation, and the town is also home to several manufacturing companies. The population of River Bluff is predominantly White, with a small percentage of African American, Native American, Asian, and Pacific Islander residents.
Common Questions
What is Per Capita Income in River Bluff?
Per Capita income in River Bluff is $60,187.
What is the Median Family Income in River Bluff?
Median Family Income in River Bluff is $167,500.
What is the Median Household income in River Bluff?
Median Household Income in River Bluff is $155,208.
What is Income or Wage Gap in River Bluff?
Income or Wage Gap in River Bluff is 9.7%.
Women in River Bluff earn 90.3 cents for every dollar earned by a man.
What is Inequality or Gini Index in River Bluff?
Inequality or Gini Index in River Bluff is 0.38.
What is the Total Population of River Bluff?
Total Population of River Bluff is 496.
What is the Total Male Population of River Bluff?
Total Male Population of River Bluff is 222.
What is the Total Female Population of River Bluff?
Total Female Population of River Bluff is 274.
What is the Ratio of Males per 100 Females in River Bluff?
There are 81.02 Males per 100 Females in River Bluff.
What is the Ratio of Females per 100 Males in River Bluff?
There are 123.42 Females per 100 Males in River Bluff.
What is the Median Population Age in River Bluff?
Median Population Age in River Bluff is 40.4 Years.
What is the Average Family Size in River Bluff
Average Family Size in River Bluff is 3.3 People.
What is the Average Household Size in River Bluff
Average Household Size in River Bluff is 2.9 People.
How Large is the Labor Force in River Bluff?
There are 275 People in the Labor Forcein in River Bluff.
What is the Percentage of People in the Labor Force in River Bluff?
71.2% of People are in the Labor Force in River Bluff.