La Grange, KY Map & Demographics
La Grange Map
La Grange Overview
$33,588
PER CAPITA INCOME
$92,800
AVG FAMILY INCOME
$72,265
AVG HOUSEHOLD INCOME
29.2%
WAGE / INCOME GAP [ % ]
70.8¢/ $1
WAGE / INCOME GAP [ $ ]
0.39
INEQUALITY / GINI INDEX
10,073
TOTAL POPULATION
5,097
MALE POPULATION
4,976
FEMALE POPULATION
102.43
MALES / 100 FEMALES
97.63
FEMALES / 100 MALES
34.8
MEDIAN AGE
3.1
AVG FAMILY SIZE
2.7
AVG HOUSEHOLD SIZE
5,381
LABOR FORCE [ PEOPLE ]
70.3%
PERCENT IN LABOR FORCE
4.7%
UNEMPLOYMENT RATE
La Grange Zip Codes
La Grange Area Codes
Income in La Grange
Income Overview in La Grange
Per Capita Income in La Grange is $33,588, while median incomes of families and households are $92,800 and $72,265 respectively.
| Characteristic | Number | Measure |
| Per Capita Income | 10,073 | $33,588 |
| Median Family Income | 2,566 | $92,800 |
| Mean Family Income | 2,566 | $103,536 |
| Median Household Income | 3,684 | $72,265 |
| Mean Household Income | 3,684 | $89,242 |
| Income Deficit | 2,566 | $0 |
| Wage / Income Gap (%) | 10,073 | 29.22% |
| Wage / Income Gap ($) | 10,073 | 70.78¢ per $1 |
| Gini / Inequality Index | 10,073 | 0.39 |
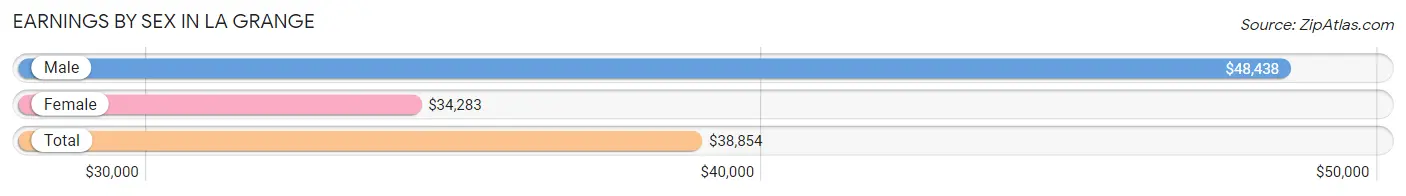
Earnings by Sex in La Grange
Average Earnings in La Grange are $38,854, $48,438 for men and $34,283 for women, a difference of 29.2%.
| Sex | Number | Average Earnings |
| Male | 2,728 (50.5%) | $48,438 |
| Female | 2,678 (49.5%) | $34,283 |
| Total | 5,406 (100.0%) | $38,854 |
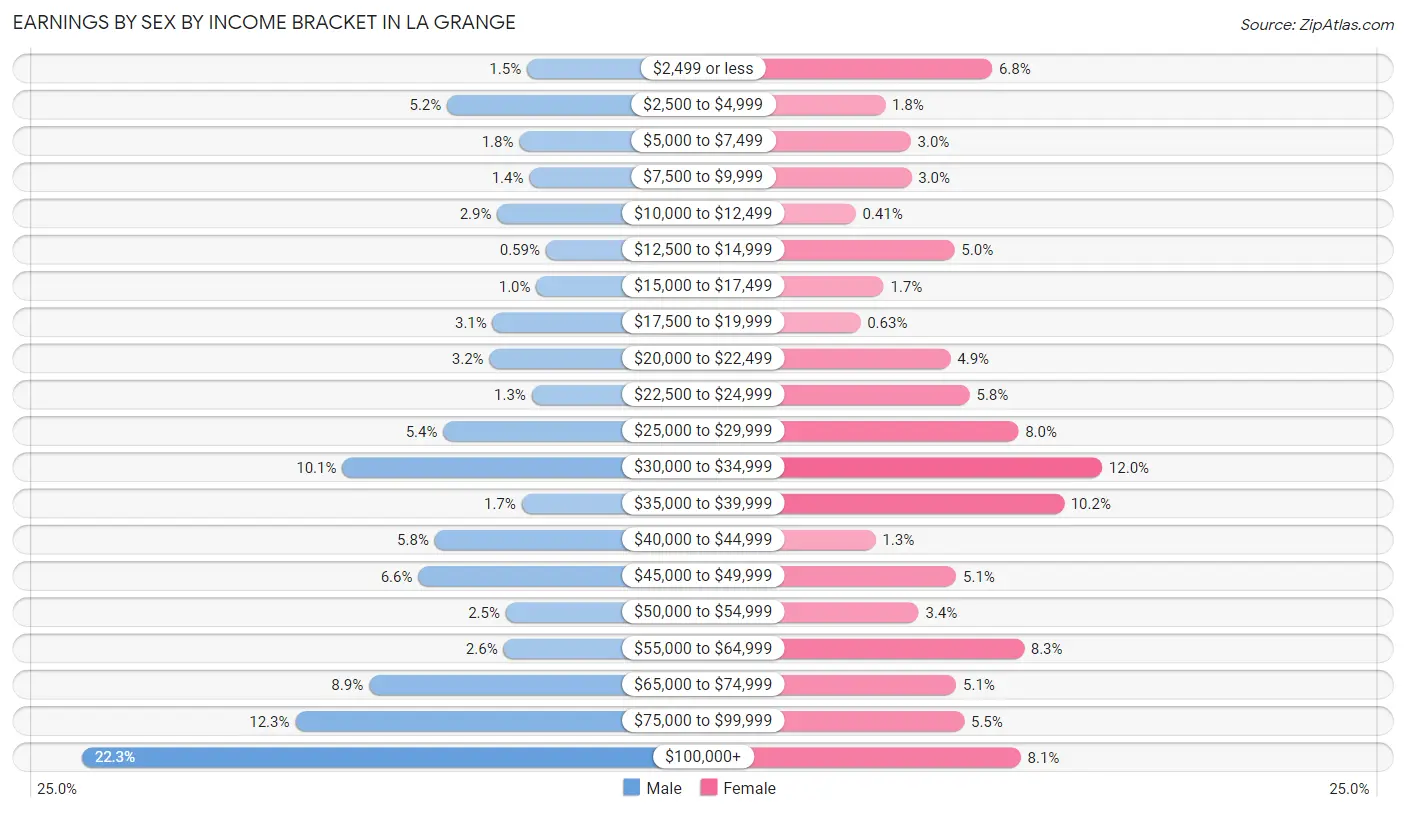
Earnings by Sex by Income Bracket in La Grange
The most common earnings brackets in La Grange are $100,000+ for men (609 | 22.3%) and $30,000 to $34,999 for women (320 | 11.9%).
| Income | Male | Female |
| $2,499 or less | 40 (1.5%) | 182 (6.8%) |
| $2,500 to $4,999 | 142 (5.2%) | 48 (1.8%) |
| $5,000 to $7,499 | 50 (1.8%) | 80 (3.0%) |
| $7,500 to $9,999 | 37 (1.4%) | 81 (3.0%) |
| $10,000 to $12,499 | 78 (2.9%) | 11 (0.4%) |
| $12,500 to $14,999 | 16 (0.6%) | 135 (5.0%) |
| $15,000 to $17,499 | 28 (1.0%) | 46 (1.7%) |
| $17,500 to $19,999 | 84 (3.1%) | 17 (0.6%) |
| $20,000 to $22,499 | 88 (3.2%) | 130 (4.9%) |
| $22,500 to $24,999 | 34 (1.3%) | 154 (5.8%) |
| $25,000 to $29,999 | 147 (5.4%) | 215 (8.0%) |
| $30,000 to $34,999 | 276 (10.1%) | 320 (11.9%) |
| $35,000 to $39,999 | 47 (1.7%) | 272 (10.2%) |
| $40,000 to $44,999 | 158 (5.8%) | 36 (1.3%) |
| $45,000 to $49,999 | 179 (6.6%) | 137 (5.1%) |
| $50,000 to $54,999 | 67 (2.5%) | 90 (3.4%) |
| $55,000 to $64,999 | 70 (2.6%) | 222 (8.3%) |
| $65,000 to $74,999 | 242 (8.9%) | 137 (5.1%) |
| $75,000 to $99,999 | 336 (12.3%) | 147 (5.5%) |
| $100,000+ | 609 (22.3%) | 218 (8.1%) |
| Total | 2,728 (100.0%) | 2,678 (100.0%) |
Earnings by Sex by Educational Attainment in La Grange
Average earnings in La Grange are $65,429 for men and $38,330 for women, a difference of 41.4%. Men with an educational attainment of graduate degree enjoy the highest average annual earnings of $91,406, while those with high school diploma education earn the least with $42,571. Women with an educational attainment of bachelor's degree earn the most with the average annual earnings of $61,250, while those with college or associate's degree education have the smallest earnings of $26,373.

| Educational Attainment | Male Income | Female Income |
| Less than High School | - | - |
| High School Diploma | $42,571 | $27,448 |
| College or Associate's Degree | $47,115 | $26,373 |
| Bachelor's Degree | $80,625 | $61,250 |
| Graduate Degree | $91,406 | $60,536 |
| Total | $65,429 | $38,330 |
Family Income in La Grange
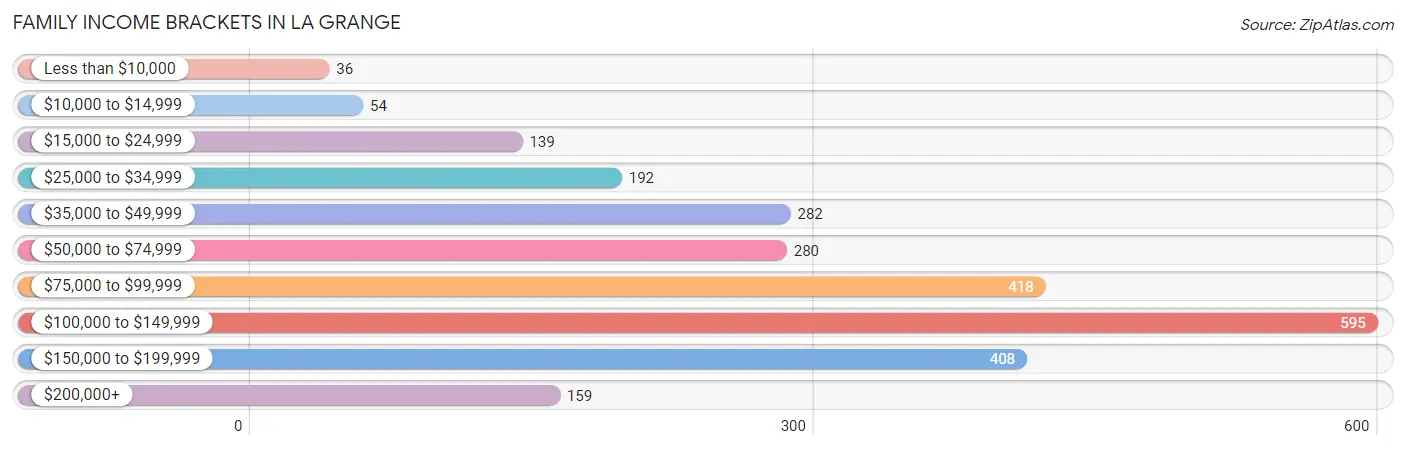
Family Income Brackets in La Grange
According to the La Grange family income data, there are 595 families falling into the $100,000 to $149,999 income range, which is the most common income bracket and makes up 23.2% of all families. Conversely, the less than $10,000 income bracket is the least frequent group with only 36 families (1.4%) belonging to this category.
| Income Bracket | # Families | % Families |
| Less than $10,000 | 36 | 1.4% |
| $10,000 to $14,999 | 54 | 2.1% |
| $15,000 to $24,999 | 139 | 5.4% |
| $25,000 to $34,999 | 192 | 7.5% |
| $35,000 to $49,999 | 282 | 11.0% |
| $50,000 to $74,999 | 280 | 10.9% |
| $75,000 to $99,999 | 418 | 16.3% |
| $100,000 to $149,999 | 595 | 23.2% |
| $150,000 to $199,999 | 408 | 15.9% |
| $200,000+ | 159 | 6.2% |
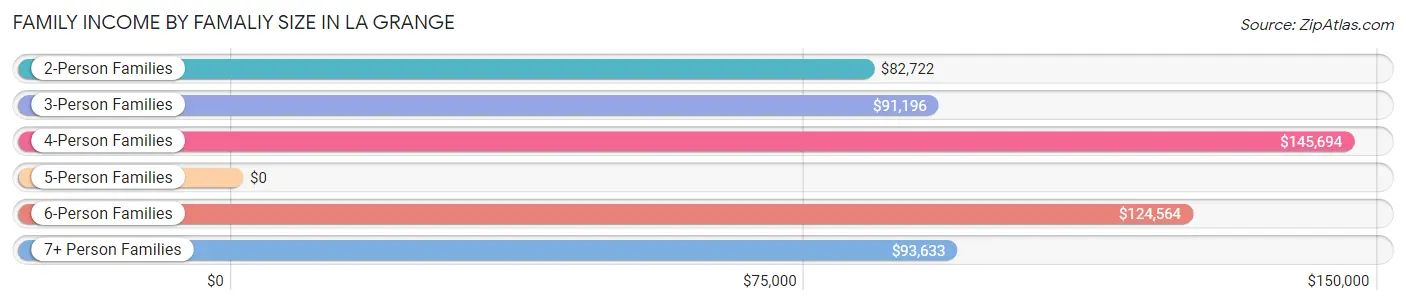
Family Income by Famaliy Size in La Grange
4-person families (590 | 23.0%) account for the highest median family income in La Grange with $145,694 per family, while 2-person families (1,126 | 43.9%) have the highest median income of $41,361 per family member.
| Income Bracket | # Families | Median Income |
| 2-Person Families | 1,126 (43.9%) | $82,722 |
| 3-Person Families | 440 (17.2%) | $91,196 |
| 4-Person Families | 590 (23.0%) | $145,694 |
| 5-Person Families | 234 (9.1%) | $0 |
| 6-Person Families | 121 (4.7%) | $124,564 |
| 7+ Person Families | 55 (2.1%) | $93,633 |
| Total | 2,566 (100.0%) | $92,800 |
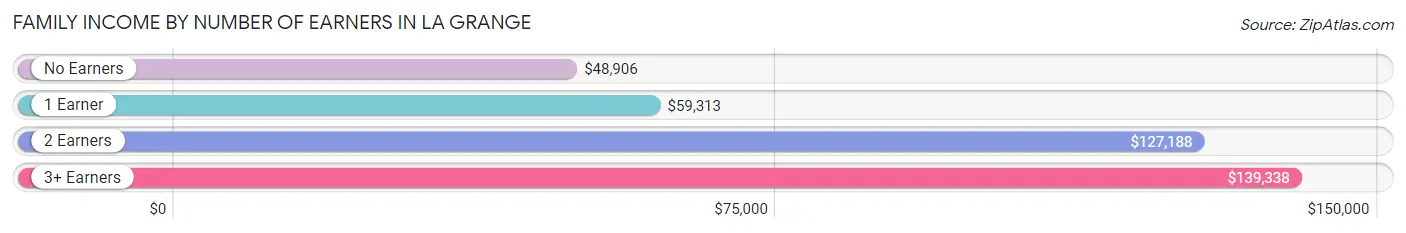
Family Income by Number of Earners in La Grange
The median family income in La Grange is $92,800, with families comprising 3+ earners (308) having the highest median family income of $139,338, while families with no earners (265) have the lowest median family income of $48,906, accounting for 12.0% and 10.3% of families, respectively.
| Number of Earners | # Families | Median Income |
| No Earners | 265 (10.3%) | $48,906 |
| 1 Earner | 963 (37.5%) | $59,313 |
| 2 Earners | 1,030 (40.1%) | $127,188 |
| 3+ Earners | 308 (12.0%) | $139,338 |
| Total | 2,566 (100.0%) | $92,800 |
Household Income in La Grange
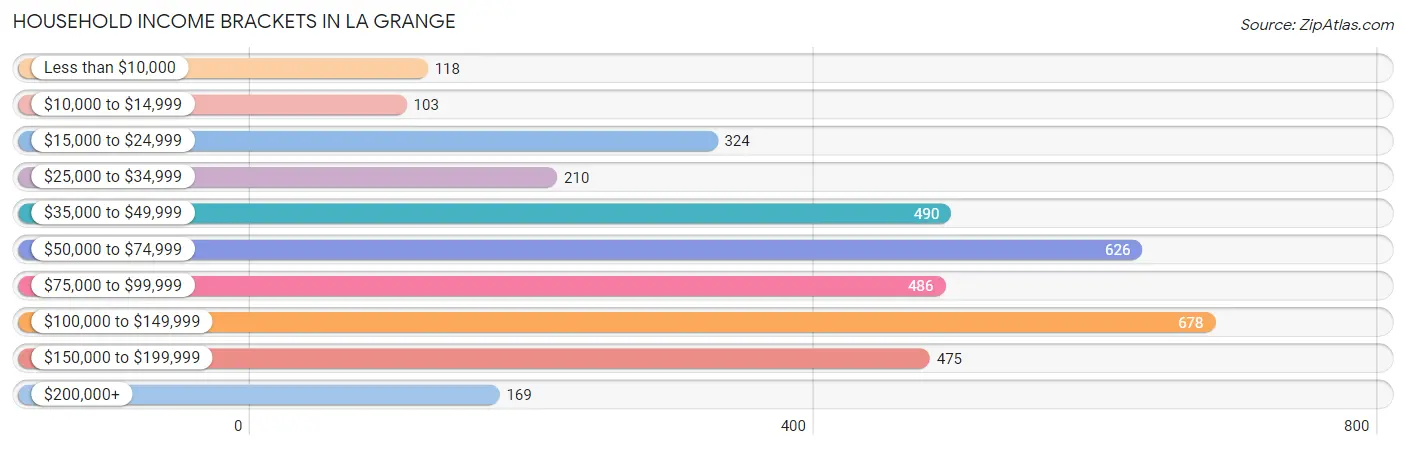
Household Income Brackets in La Grange
With 678 households falling in the category, the $100,000 to $149,999 income range is the most frequent in La Grange, accounting for 18.4% of all households. In contrast, only 103 households (2.8%) fall into the $10,000 to $14,999 income bracket, making it the least populous group.
| Income Bracket | # Households | % Households |
| Less than $10,000 | 118 | 3.2% |
| $10,000 to $14,999 | 103 | 2.8% |
| $15,000 to $24,999 | 324 | 8.8% |
| $25,000 to $34,999 | 210 | 5.7% |
| $35,000 to $49,999 | 490 | 13.3% |
| $50,000 to $74,999 | 626 | 17.0% |
| $75,000 to $99,999 | 486 | 13.2% |
| $100,000 to $149,999 | 678 | 18.4% |
| $150,000 to $199,999 | 475 | 12.9% |
| $200,000+ | 169 | 4.6% |
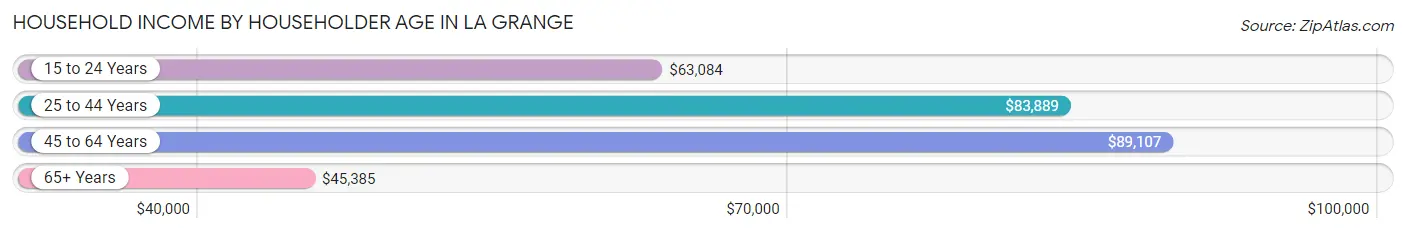
Household Income by Householder Age in La Grange
The median household income in La Grange is $72,265, with the highest median household income of $89,107 found in the 45 to 64 years age bracket for the primary householder. A total of 1,332 households (36.2%) fall into this category. Meanwhile, the 65+ years age bracket for the primary householder has the lowest median household income of $45,385, with 746 households (20.3%) in this group.
| Income Bracket | # Households | Median Income |
| 15 to 24 Years | 314 (8.5%) | $63,084 |
| 25 to 44 Years | 1,292 (35.1%) | $83,889 |
| 45 to 64 Years | 1,332 (36.2%) | $89,107 |
| 65+ Years | 746 (20.3%) | $45,385 |
| Total | 3,684 (100.0%) | $72,265 |
Poverty in La Grange
Income Below Poverty by Sex and Age in La Grange
With 9.6% poverty level for males and 11.7% for females among the residents of La Grange, 6 to 11 year old males and under 5 year old females are the most vulnerable to poverty, with 152 males (30.6%) and 77 females (27.7%) in their respective age groups living below the poverty level.
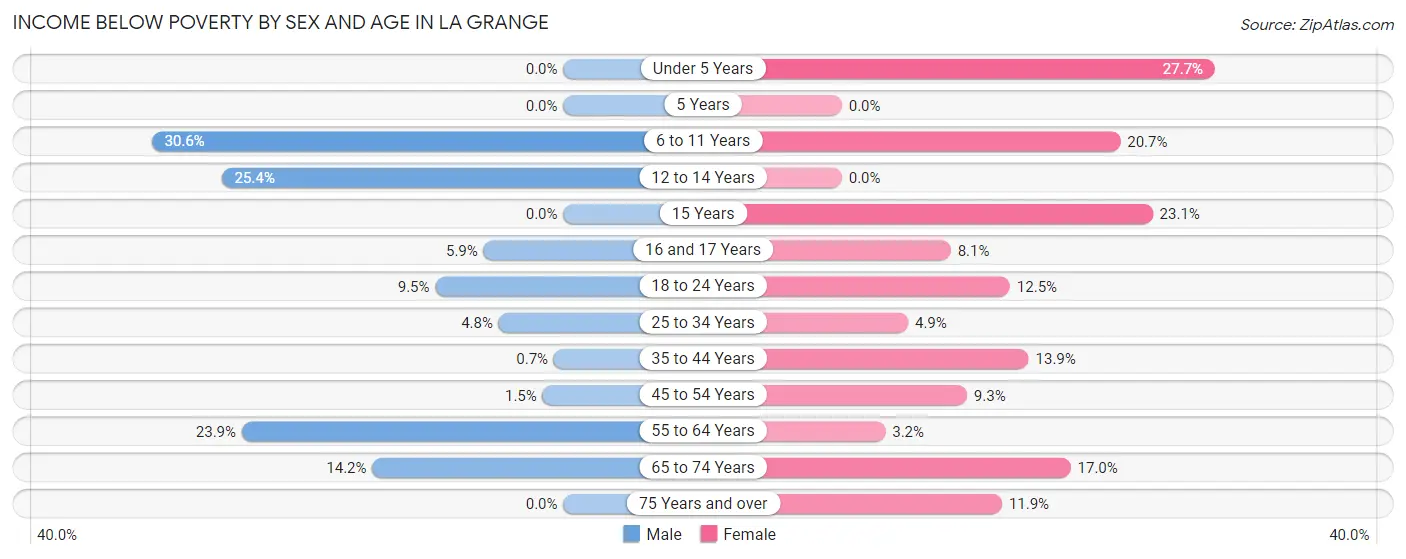
| Age Bracket | Male | Female |
| Under 5 Years | 0 (0.0%) | 77 (27.7%) |
| 5 Years | 0 (0.0%) | 0 (0.0%) |
| 6 to 11 Years | 152 (30.6%) | 97 (20.7%) |
| 12 to 14 Years | 67 (25.4%) | 0 (0.0%) |
| 15 Years | 0 (0.0%) | 12 (23.1%) |
| 16 and 17 Years | 9 (5.9%) | 11 (8.1%) |
| 18 to 24 Years | 64 (9.5%) | 65 (12.5%) |
| 25 to 34 Years | 24 (4.8%) | 30 (4.9%) |
| 35 to 44 Years | 4 (0.7%) | 90 (13.9%) |
| 45 to 54 Years | 12 (1.5%) | 60 (9.3%) |
| 55 to 64 Years | 100 (23.9%) | 18 (3.2%) |
| 65 to 74 Years | 38 (14.2%) | 70 (17.0%) |
| 75 Years and over | 0 (0.0%) | 39 (11.9%) |
| Total | 470 (9.6%) | 569 (11.7%) |
Income Above Poverty by Sex and Age in La Grange
According to the poverty statistics in La Grange, males aged under 5 years and females aged 5 years are the age groups that are most secure financially, with 100.0% of males and 100.0% of females in these age groups living above the poverty line.
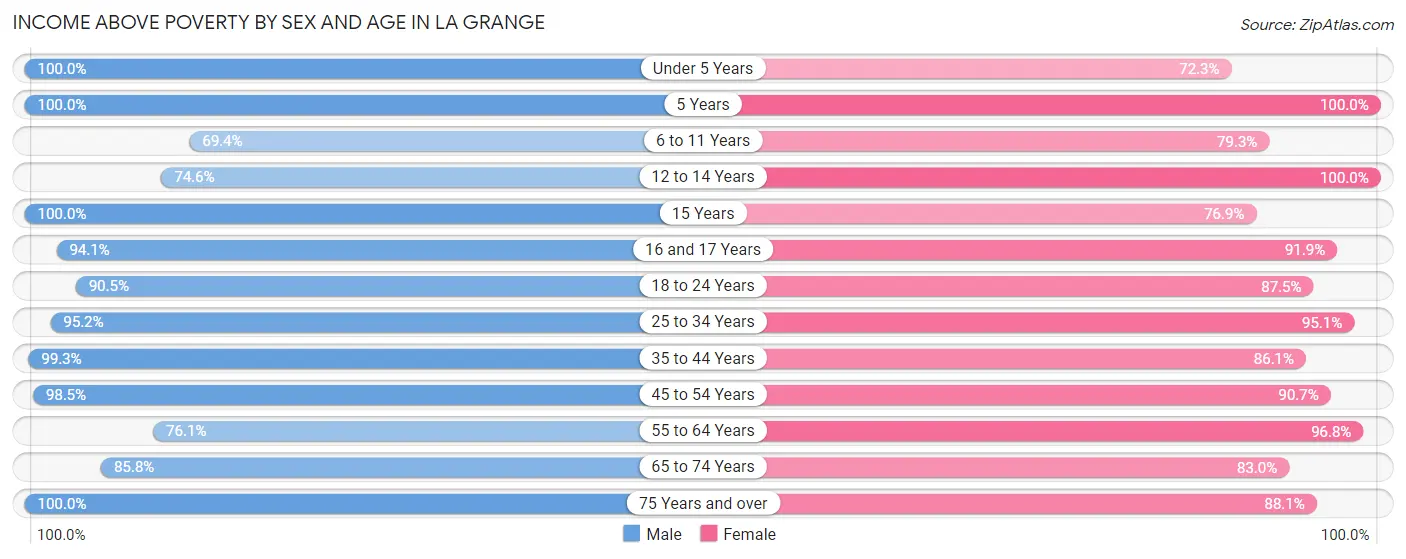
| Age Bracket | Male | Female |
| Under 5 Years | 373 (100.0%) | 201 (72.3%) |
| 5 Years | 219 (100.0%) | 29 (100.0%) |
| 6 to 11 Years | 345 (69.4%) | 372 (79.3%) |
| 12 to 14 Years | 197 (74.6%) | 192 (100.0%) |
| 15 Years | 29 (100.0%) | 40 (76.9%) |
| 16 and 17 Years | 143 (94.1%) | 125 (91.9%) |
| 18 to 24 Years | 610 (90.5%) | 456 (87.5%) |
| 25 to 34 Years | 477 (95.2%) | 580 (95.1%) |
| 35 to 44 Years | 569 (99.3%) | 559 (86.1%) |
| 45 to 54 Years | 767 (98.5%) | 586 (90.7%) |
| 55 to 64 Years | 319 (76.1%) | 540 (96.8%) |
| 65 to 74 Years | 230 (85.8%) | 342 (83.0%) |
| 75 Years and over | 171 (100.0%) | 289 (88.1%) |
| Total | 4,449 (90.4%) | 4,311 (88.3%) |
Income Below Poverty Among Married-Couple Families in La Grange
The poverty statistics for married-couple families in La Grange show that 3.3% or 60 of the total 1,799 families live below the poverty line. Families with 3 or 4 children have the highest poverty rate of 8.8%, comprising of 20 families. On the other hand, families with 1 or 2 children have the lowest poverty rate of 0.0%, which includes 0 families.
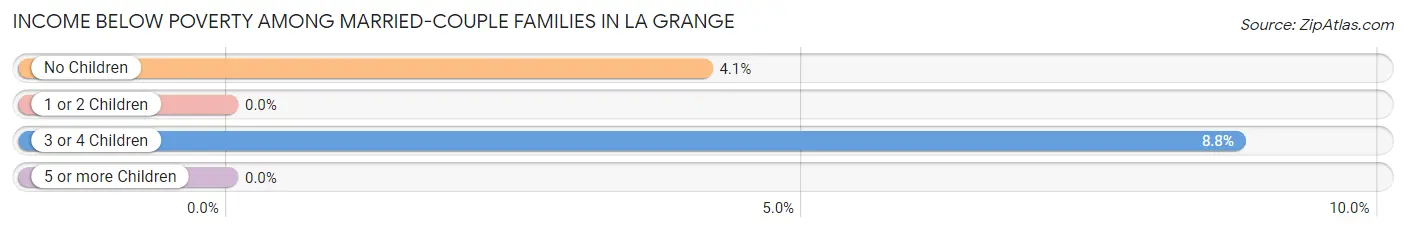
| Children | Above Poverty | Below Poverty |
| No Children | 928 (95.9%) | 40 (4.1%) |
| 1 or 2 Children | 585 (100.0%) | 0 (0.0%) |
| 3 or 4 Children | 208 (91.2%) | 20 (8.8%) |
| 5 or more Children | 18 (100.0%) | 0 (0.0%) |
| Total | 1,739 (96.7%) | 60 (3.3%) |
Income Below Poverty Among Single-Parent Households in La Grange
According to the poverty data in La Grange, 2.9% or 4 single-father households and 23.0% or 145 single-mother households are living below the poverty line. Among single-father households, those with 1 or 2 children have the highest poverty rate, with 4 households (3.7%) experiencing poverty. Likewise, among single-mother households, those with 3 or 4 children have the highest poverty rate, with 73 households (36.7%) falling below the poverty line.
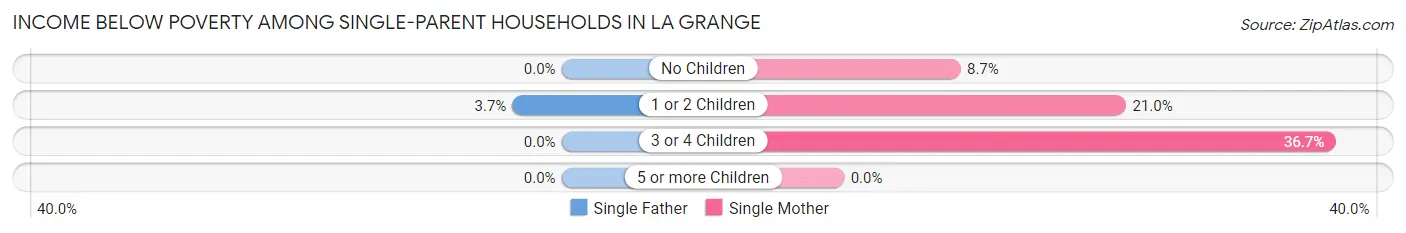
| Children | Single Father | Single Mother |
| No Children | 0 (0.0%) | 13 (8.7%) |
| 1 or 2 Children | 4 (3.7%) | 59 (21.0%) |
| 3 or 4 Children | 0 (0.0%) | 73 (36.7%) |
| 5 or more Children | 0 (0.0%) | 0 (0.0%) |
| Total | 4 (2.9%) | 145 (23.0%) |
Income Below Poverty Among Married-Couple vs Single-Parent Households in La Grange
The poverty data for La Grange shows that 60 of the married-couple family households (3.3%) and 149 of the single-parent households (19.4%) are living below the poverty level. Within the married-couple family households, those with 3 or 4 children have the highest poverty rate, with 20 households (8.8%) falling below the poverty line. Among the single-parent households, those with 3 or 4 children have the highest poverty rate, with 73 household (36.7%) living below poverty.
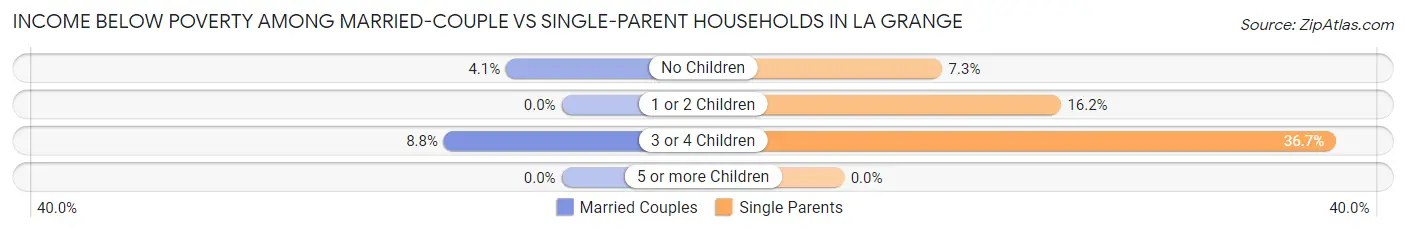
| Children | Married-Couple Families | Single-Parent Households |
| No Children | 40 (4.1%) | 13 (7.3%) |
| 1 or 2 Children | 0 (0.0%) | 63 (16.2%) |
| 3 or 4 Children | 20 (8.8%) | 73 (36.7%) |
| 5 or more Children | 0 (0.0%) | 0 (0.0%) |
| Total | 60 (3.3%) | 149 (19.4%) |
Race in La Grange
The most populous races in La Grange are White / Caucasian (9,056 | 89.9%), Black / African American (539 | 5.3%), and Hispanic or Latino (360 | 3.6%).
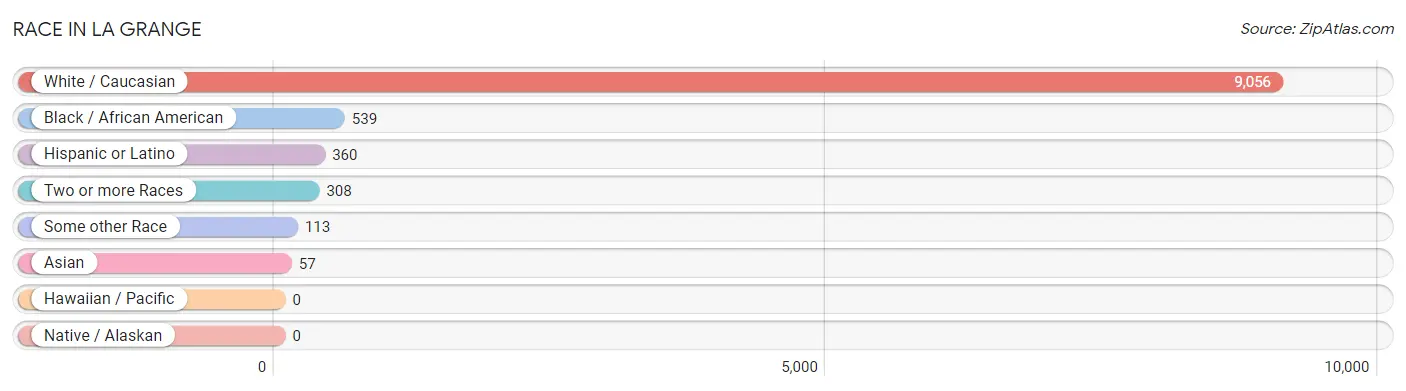
| Race | # Population | % Population |
| Asian | 57 | 0.6% |
| Black / African American | 539 | 5.3% |
| Hawaiian / Pacific | 0 | 0.0% |
| Hispanic or Latino | 360 | 3.6% |
| Native / Alaskan | 0 | 0.0% |
| White / Caucasian | 9,056 | 89.9% |
| Two or more Races | 308 | 3.1% |
| Some other Race | 113 | 1.1% |
| Total | 10,073 | 100.0% |
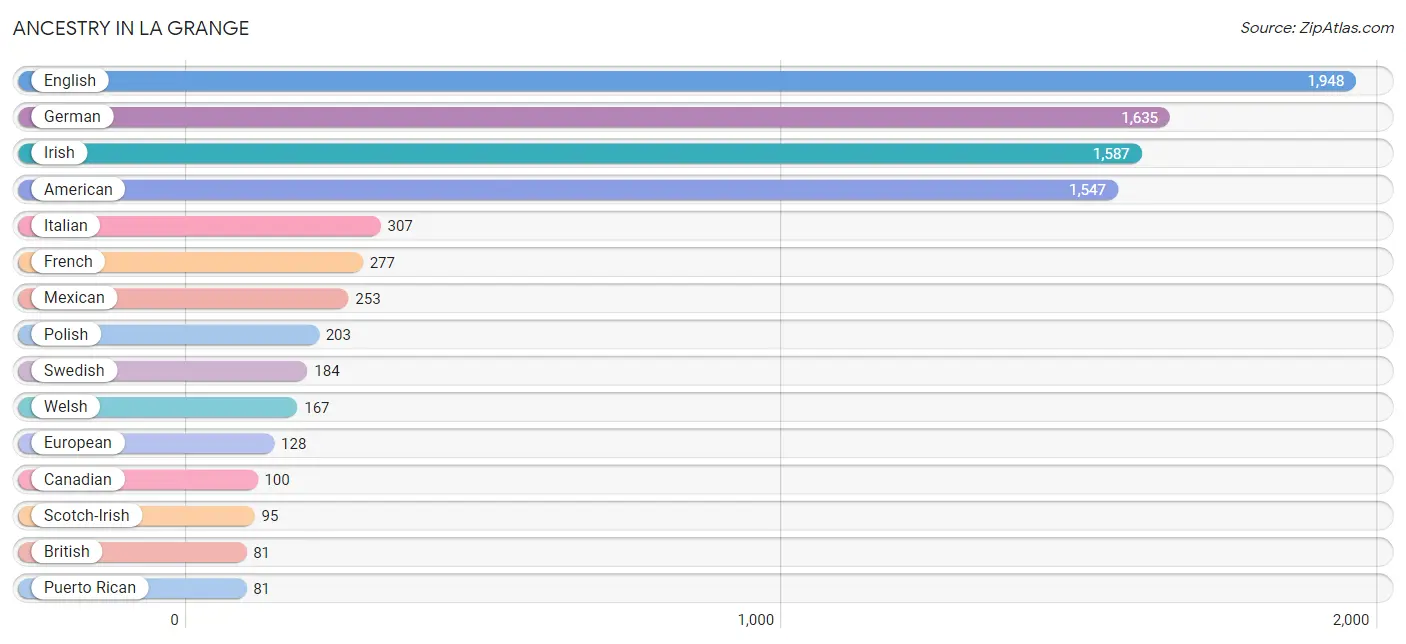
Ancestry in La Grange
The most populous ancestries reported in La Grange are English (1,948 | 19.3%), German (1,635 | 16.2%), Irish (1,587 | 15.8%), American (1,547 | 15.4%), and Italian (307 | 3.0%), together accounting for 69.7% of all La Grange residents.
| Ancestry | # Population | % Population |
| African | 47 | 0.5% |
| American | 1,547 | 15.4% |
| Arab | 56 | 0.6% |
| Austrian | 12 | 0.1% |
| Blackfeet | 9 | 0.1% |
| British | 81 | 0.8% |
| Canadian | 100 | 1.0% |
| Central American | 9 | 0.1% |
| Cherokee | 33 | 0.3% |
| Choctaw | 7 | 0.1% |
| Cuban | 17 | 0.2% |
| Czechoslovakian | 24 | 0.2% |
| Danish | 45 | 0.4% |
| Dutch | 29 | 0.3% |
| Eastern European | 9 | 0.1% |
| English | 1,948 | 19.3% |
| European | 128 | 1.3% |
| French | 277 | 2.8% |
| German | 1,635 | 16.2% |
| Guatemalan | 9 | 0.1% |
| Hungarian | 10 | 0.1% |
| Indian (Asian) | 22 | 0.2% |
| Iranian | 7 | 0.1% |
| Irish | 1,587 | 15.8% |
| Italian | 307 | 3.0% |
| Jordanian | 43 | 0.4% |
| Kenyan | 25 | 0.3% |
| Korean | 15 | 0.2% |
| Lithuanian | 14 | 0.1% |
| Mexican | 253 | 2.5% |
| Norwegian | 38 | 0.4% |
| Palestinian | 7 | 0.1% |
| Polish | 203 | 2.0% |
| Portuguese | 15 | 0.2% |
| Puerto Rican | 81 | 0.8% |
| Romanian | 5 | 0.1% |
| Russian | 30 | 0.3% |
| Scandinavian | 33 | 0.3% |
| Scotch-Irish | 95 | 0.9% |
| Scottish | 67 | 0.7% |
| Slovak | 8 | 0.1% |
| Slovene | 22 | 0.2% |
| Subsaharan African | 72 | 0.7% |
| Swedish | 184 | 1.8% |
| Swiss | 6 | 0.1% |
| Thai | 41 | 0.4% |
| Welsh | 167 | 1.7% |
| Yugoslavian | 24 | 0.2% | View All 48 Rows |
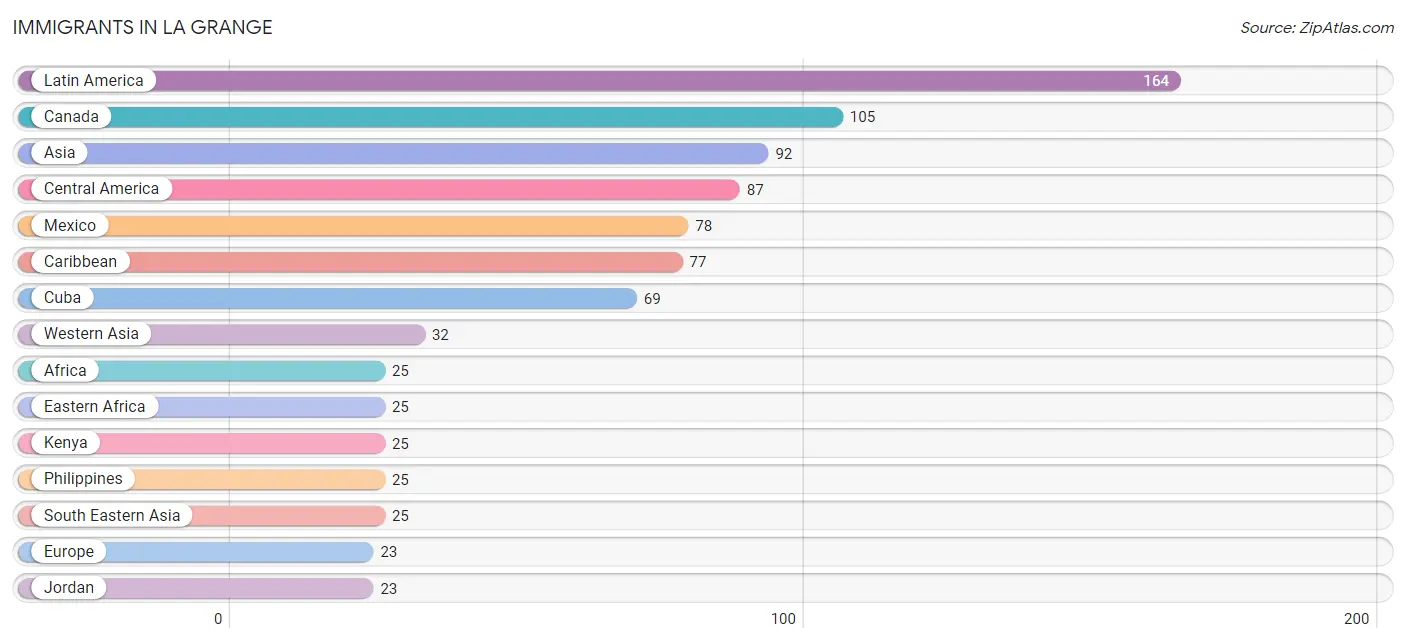
Immigrants in La Grange
The most numerous immigrant groups reported in La Grange came from Latin America (164 | 1.6%), Canada (105 | 1.0%), Asia (92 | 0.9%), Central America (87 | 0.9%), and Mexico (78 | 0.8%), together accounting for 5.2% of all La Grange residents.
| Immigration Origin | # Population | % Population |
| Africa | 25 | 0.3% |
| Asia | 92 | 0.9% |
| Canada | 105 | 1.0% |
| Caribbean | 77 | 0.8% |
| Central America | 87 | 0.9% |
| China | 22 | 0.2% |
| Cuba | 69 | 0.7% |
| Eastern Africa | 25 | 0.3% |
| Eastern Asia | 22 | 0.2% |
| Europe | 23 | 0.2% |
| Guatemala | 9 | 0.1% |
| Iran | 7 | 0.1% |
| Jamaica | 8 | 0.1% |
| Jordan | 23 | 0.2% |
| Kenya | 25 | 0.3% |
| Kuwait | 9 | 0.1% |
| Latin America | 164 | 1.6% |
| Mexico | 78 | 0.8% |
| Northern Europe | 23 | 0.2% |
| Oceania | 19 | 0.2% |
| Philippines | 25 | 0.3% |
| Scotland | 23 | 0.2% |
| South Central Asia | 7 | 0.1% |
| South Eastern Asia | 25 | 0.3% |
| Western Asia | 32 | 0.3% | View All 25 Rows |
Sex and Age in La Grange
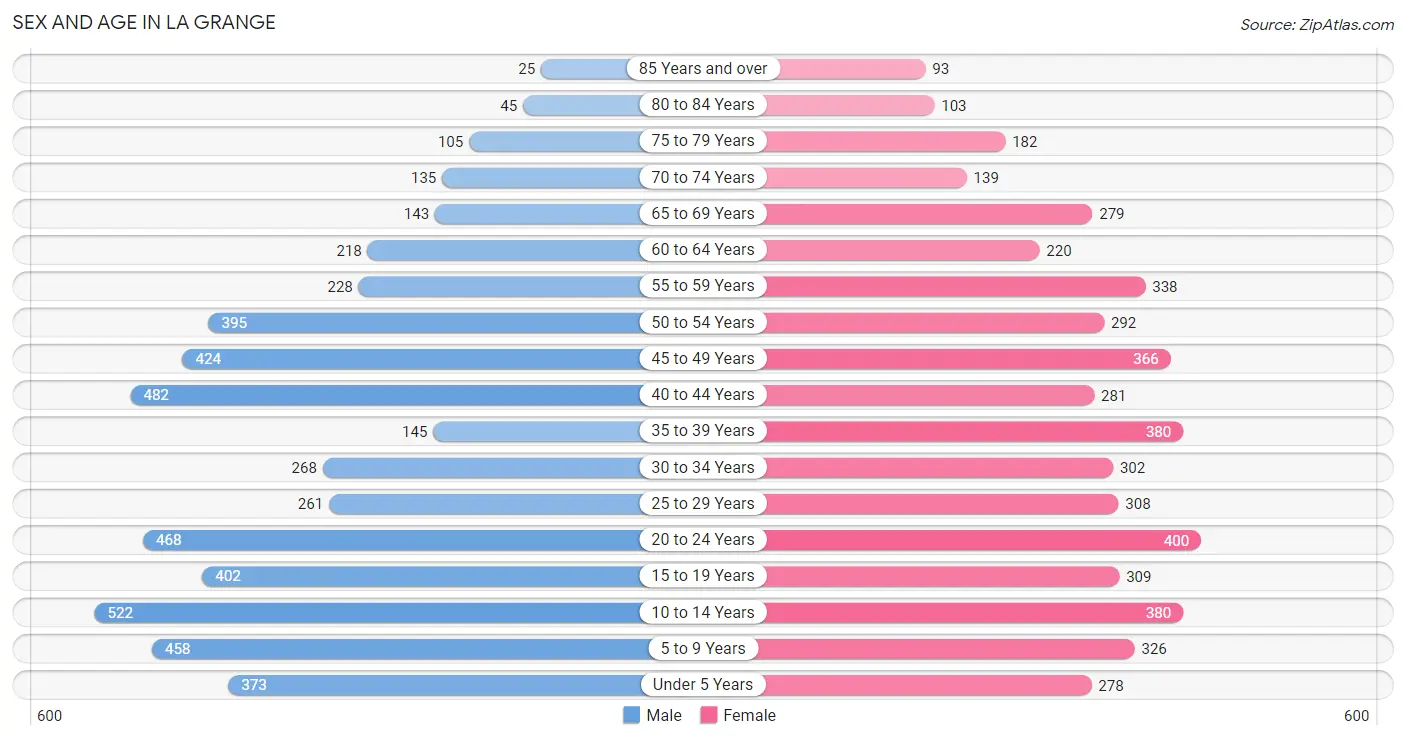
Sex and Age in La Grange
The most populous age groups in La Grange are 10 to 14 Years (522 | 10.2%) for men and 20 to 24 Years (400 | 8.0%) for women.
| Age Bracket | Male | Female |
| Under 5 Years | 373 (7.3%) | 278 (5.6%) |
| 5 to 9 Years | 458 (9.0%) | 326 (6.6%) |
| 10 to 14 Years | 522 (10.2%) | 380 (7.6%) |
| 15 to 19 Years | 402 (7.9%) | 309 (6.2%) |
| 20 to 24 Years | 468 (9.2%) | 400 (8.0%) |
| 25 to 29 Years | 261 (5.1%) | 308 (6.2%) |
| 30 to 34 Years | 268 (5.3%) | 302 (6.1%) |
| 35 to 39 Years | 145 (2.8%) | 380 (7.6%) |
| 40 to 44 Years | 482 (9.5%) | 281 (5.7%) |
| 45 to 49 Years | 424 (8.3%) | 366 (7.4%) |
| 50 to 54 Years | 395 (7.7%) | 292 (5.9%) |
| 55 to 59 Years | 228 (4.5%) | 338 (6.8%) |
| 60 to 64 Years | 218 (4.3%) | 220 (4.4%) |
| 65 to 69 Years | 143 (2.8%) | 279 (5.6%) |
| 70 to 74 Years | 135 (2.6%) | 139 (2.8%) |
| 75 to 79 Years | 105 (2.1%) | 182 (3.7%) |
| 80 to 84 Years | 45 (0.9%) | 103 (2.1%) |
| 85 Years and over | 25 (0.5%) | 93 (1.9%) |
| Total | 5,097 (100.0%) | 4,976 (100.0%) |
Families and Households in La Grange
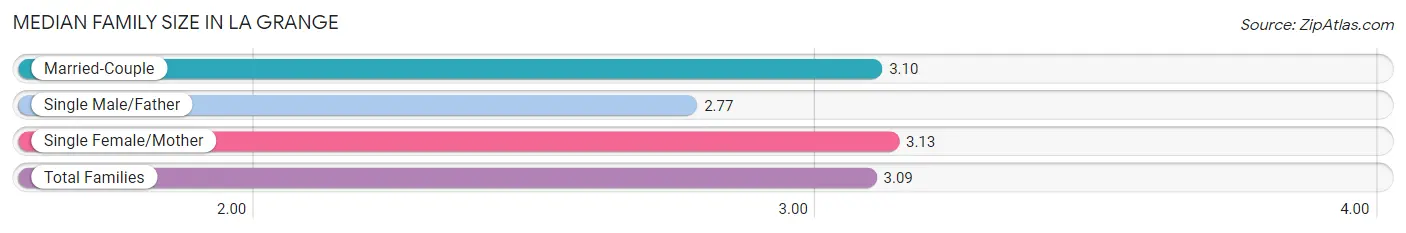
Median Family Size in La Grange
The median family size in La Grange is 3.09 persons per family, with single female/mother families (630 | 24.5%) accounting for the largest median family size of 3.13 persons per family. On the other hand, single male/father families (137 | 5.3%) represent the smallest median family size with 2.77 persons per family.
| Family Type | # Families | Family Size |
| Married-Couple | 1,799 (70.1%) | 3.10 |
| Single Male/Father | 137 (5.3%) | 2.77 |
| Single Female/Mother | 630 (24.5%) | 3.13 |
| Total Families | 2,566 (100.0%) | 3.09 |
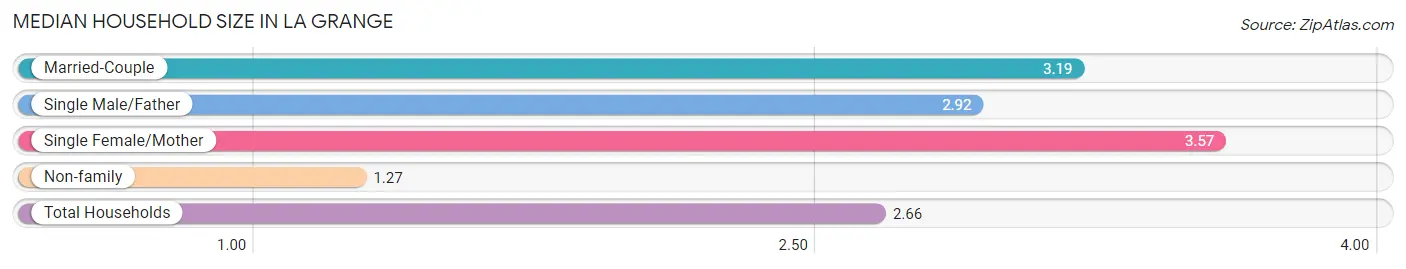
Median Household Size in La Grange
The median household size in La Grange is 2.66 persons per household, with single female/mother households (630 | 17.1%) accounting for the largest median household size of 3.57 persons per household. non-family households (1,118 | 30.3%) represent the smallest median household size with 1.27 persons per household.
| Household Type | # Households | Household Size |
| Married-Couple | 1,799 (48.8%) | 3.19 |
| Single Male/Father | 137 (3.7%) | 2.92 |
| Single Female/Mother | 630 (17.1%) | 3.57 |
| Non-family | 1,118 (30.3%) | 1.27 |
| Total Households | 3,684 (100.0%) | 2.66 |
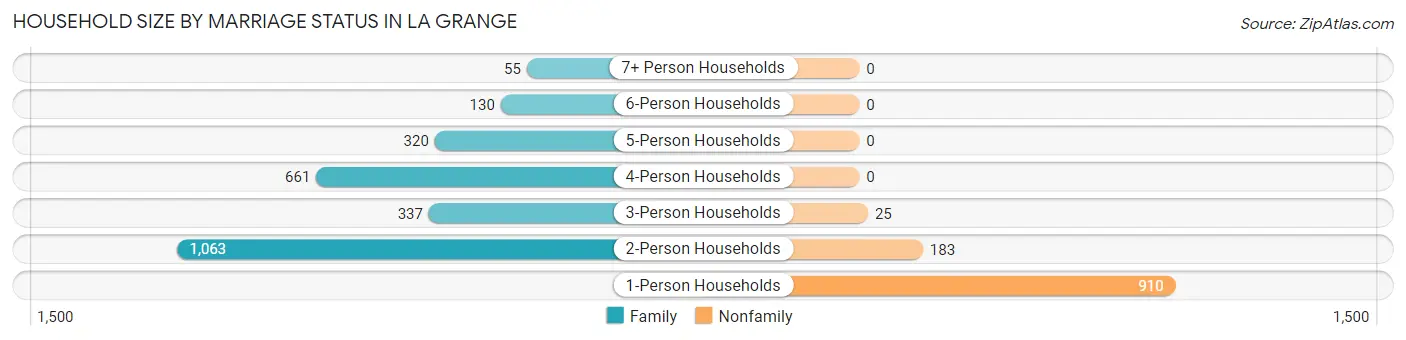
Household Size by Marriage Status in La Grange
Out of a total of 3,684 households in La Grange, 2,566 (69.7%) are family households, while 1,118 (30.3%) are nonfamily households. The most numerous type of family households are 2-person households, comprising 1,063, and the most common type of nonfamily households are 1-person households, comprising 910.
| Household Size | Family Households | Nonfamily Households |
| 1-Person Households | - | 910 (24.7%) |
| 2-Person Households | 1,063 (28.8%) | 183 (5.0%) |
| 3-Person Households | 337 (9.1%) | 25 (0.7%) |
| 4-Person Households | 661 (17.9%) | 0 (0.0%) |
| 5-Person Households | 320 (8.7%) | 0 (0.0%) |
| 6-Person Households | 130 (3.5%) | 0 (0.0%) |
| 7+ Person Households | 55 (1.5%) | 0 (0.0%) |
| Total | 2,566 (69.7%) | 1,118 (30.3%) |
Female Fertility in La Grange
Fertility by Age in La Grange
Average fertility rate in La Grange is 98.0 births per 1,000 women. Women in the age bracket of 20 to 34 years have the highest fertility rate with 199.0 births per 1,000 women. Women in the age bracket of 20 to 34 years acount for 87.0% of all women with births.
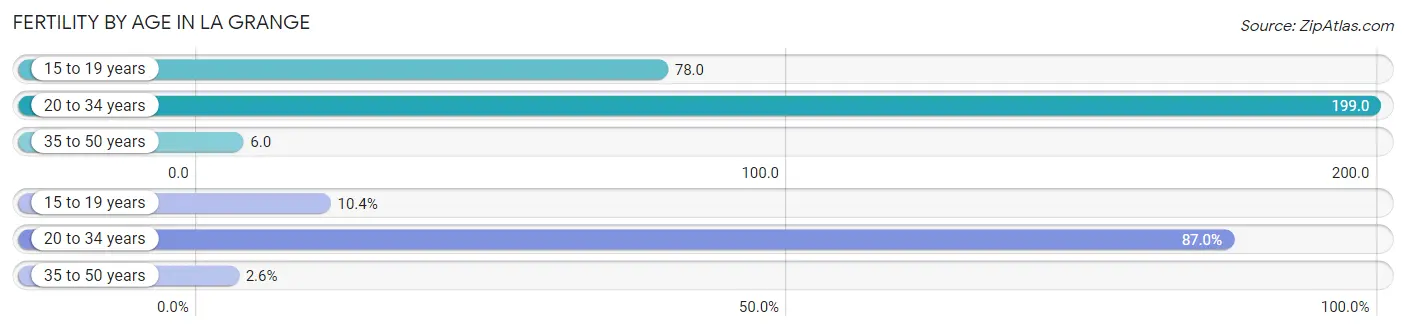
| Age Bracket | Women with Births | Births / 1,000 Women |
| 15 to 19 years | 24 (10.4%) | 78.0 |
| 20 to 34 years | 201 (87.0%) | 199.0 |
| 35 to 50 years | 6 (2.6%) | 6.0 |
| Total | 231 (100.0%) | 98.0 |
Fertility by Age by Marriage Status in La Grange
49.8% of women with births (231) in La Grange are married. The highest percentage of unmarried women with births falls into 15 to 19 years age bracket with 100.0% of them unmarried at the time of birth, while the lowest percentage of unmarried women with births belong to 20 to 34 years age bracket with 42.8% of them unmarried.
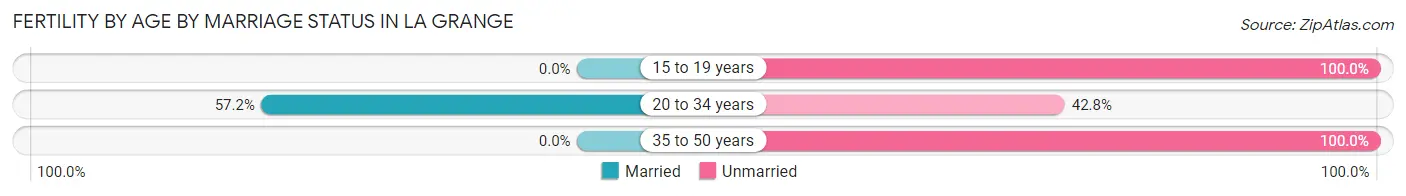
| Age Bracket | Married | Unmarried |
| 15 to 19 years | 0 (0.0%) | 24 (100.0%) |
| 20 to 34 years | 115 (57.2%) | 86 (42.8%) |
| 35 to 50 years | 0 (0.0%) | 6 (100.0%) |
| Total | 115 (49.8%) | 116 (50.2%) |
Fertility by Education in La Grange
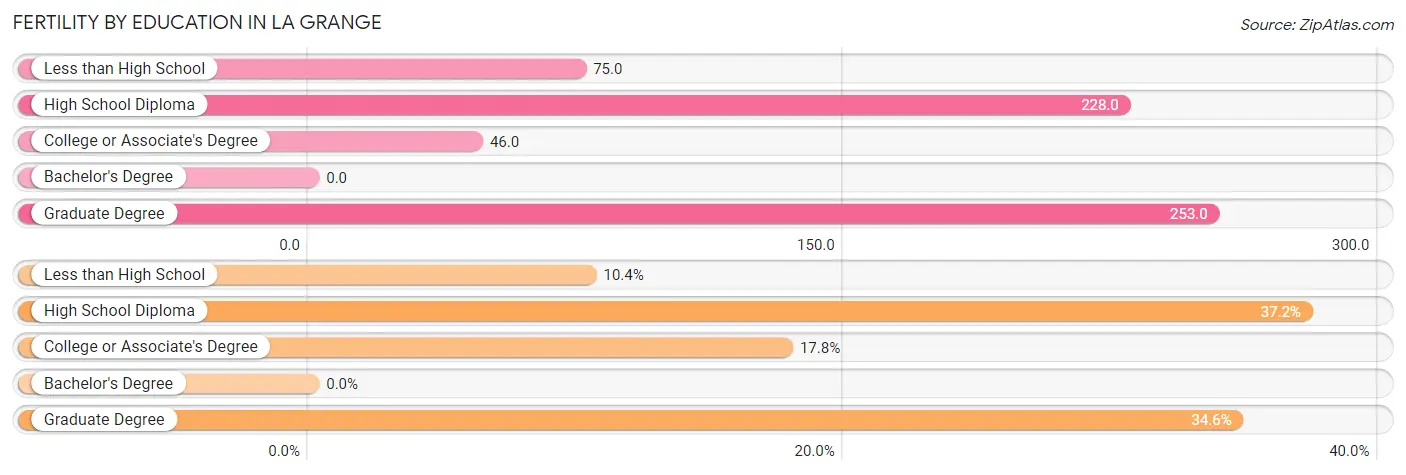
| Educational Attainment | Women with Births | Births / 1,000 Women |
| Less than High School | 24 (10.4%) | 75.0 |
| High School Diploma | 86 (37.2%) | 228.0 |
| College or Associate's Degree | 41 (17.7%) | 46.0 |
| Bachelor's Degree | 0 (0.0%) | 0.0 |
| Graduate Degree | 80 (34.6%) | 253.0 |
| Total | 231 (100.0%) | 98.0 |
Fertility by Education by Marriage Status in La Grange
50.2% of women with births in La Grange are unmarried. Women with the educational attainment of college or associate's degree are most likely to be married with 100.0% of them married at childbirth, while women with the educational attainment of less than high school are least likely to be married with 100.0% of them unmarried at childbirth.
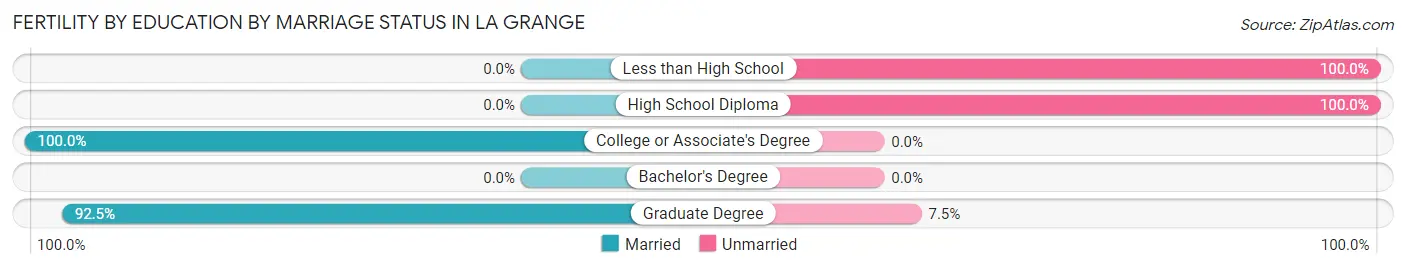
| Educational Attainment | Married | Unmarried |
| Less than High School | 0 (0.0%) | 24 (100.0%) |
| High School Diploma | 0 (0.0%) | 86 (100.0%) |
| College or Associate's Degree | 41 (100.0%) | 0 (0.0%) |
| Bachelor's Degree | 0 (0.0%) | 0 (0.0%) |
| Graduate Degree | 74 (92.5%) | 6 (7.5%) |
| Total | 115 (49.8%) | 116 (50.2%) |
Employment Characteristics in La Grange
Employment by Class of Employer in La Grange
Among the 5,009 employed individuals in La Grange, private company employees (3,459 | 69.1%), local government employees (466 | 9.3%), and not-for-profit organizations (464 | 9.3%) make up the most common classes of employment.
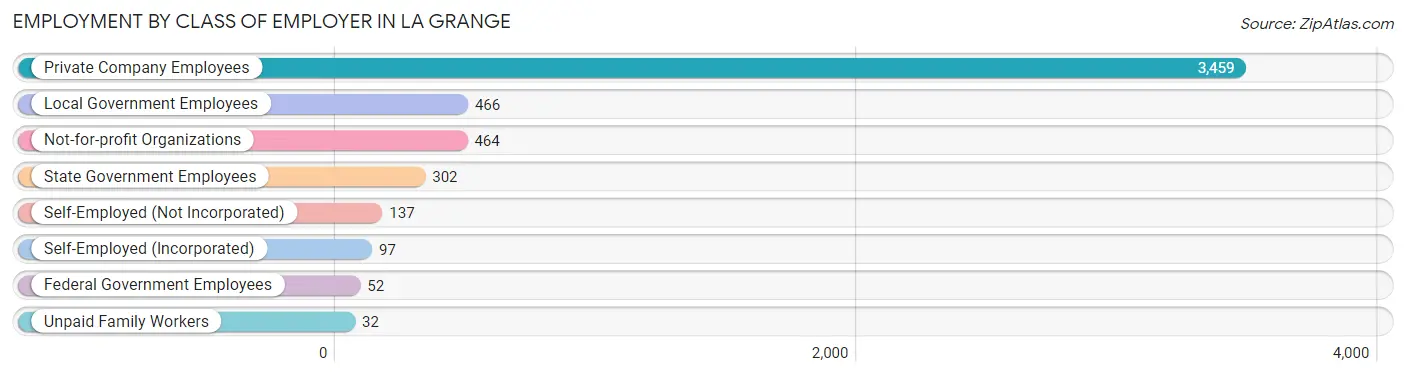
| Employer Class | # Employees | % Employees |
| Private Company Employees | 3,459 | 69.1% |
| Self-Employed (Incorporated) | 97 | 1.9% |
| Self-Employed (Not Incorporated) | 137 | 2.7% |
| Not-for-profit Organizations | 464 | 9.3% |
| Local Government Employees | 466 | 9.3% |
| State Government Employees | 302 | 6.0% |
| Federal Government Employees | 52 | 1.0% |
| Unpaid Family Workers | 32 | 0.6% |
| Total | 5,009 | 100.0% |
Employment Status by Age in La Grange
According to the labor force statistics for La Grange, out of the total population over 16 years of age (7,655), 70.3% or 5,381 individuals are in the labor force, with 4.7% or 253 of them unemployed. The age group with the highest labor force participation rate is 20 to 24 years, with 95.3% or 827 individuals in the labor force. Within the labor force, the 20 to 24 years age range has the highest percentage of unemployed individuals, with 9.7% or 80 of them being unemployed.
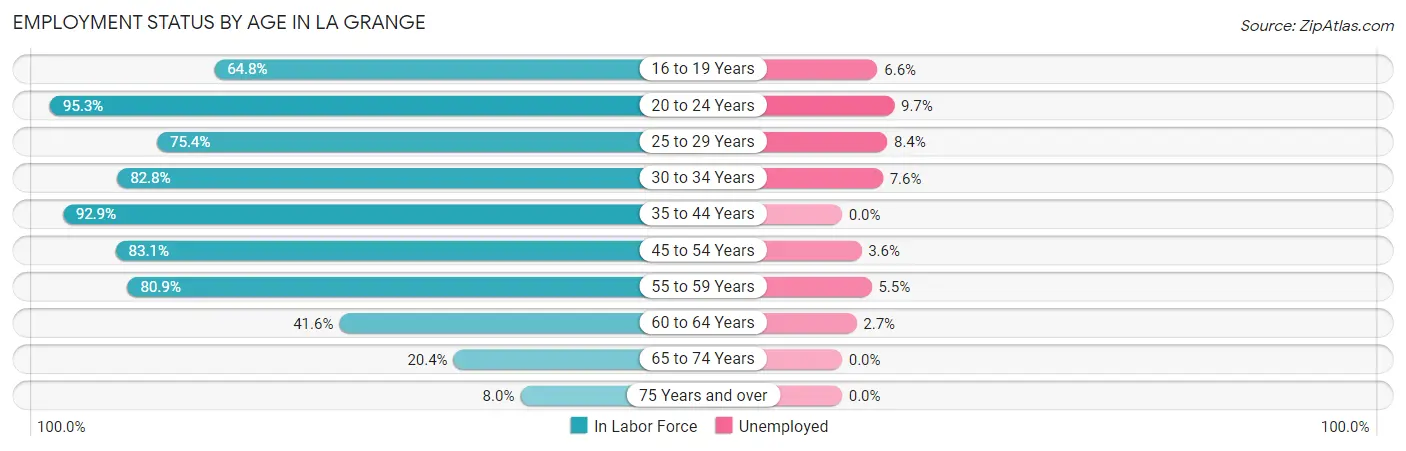
| Age Bracket | In Labor Force | Unemployed |
| 16 to 19 Years | 408 (64.8%) | 27 (6.6%) |
| 20 to 24 Years | 827 (95.3%) | 80 (9.7%) |
| 25 to 29 Years | 429 (75.4%) | 36 (8.4%) |
| 30 to 34 Years | 472 (82.8%) | 36 (7.6%) |
| 35 to 44 Years | 1,197 (92.9%) | 0 (0.0%) |
| 45 to 54 Years | 1,227 (83.1%) | 44 (3.6%) |
| 55 to 59 Years | 458 (80.9%) | 25 (5.5%) |
| 60 to 64 Years | 182 (41.6%) | 5 (2.7%) |
| 65 to 74 Years | 142 (20.4%) | 0 (0.0%) |
| 75 Years and over | 44 (8.0%) | 0 (0.0%) |
| Total | 5,381 (70.3%) | 253 (4.7%) |
Employment Status by Educational Attainment in La Grange
According to labor force statistics for La Grange, 80.8% of individuals (3,966) out of the total population between 25 and 64 years of age (4,908) are in the labor force, with 3.7% or 147 of them being unemployed. The group with the highest labor force participation rate are those with the educational attainment of bachelor's degree or higher, with 95.7% or 1,836 individuals in the labor force. Within the labor force, individuals with high school diploma education have the highest percentage of unemployment, with 5.7% or 42 of them being unemployed.
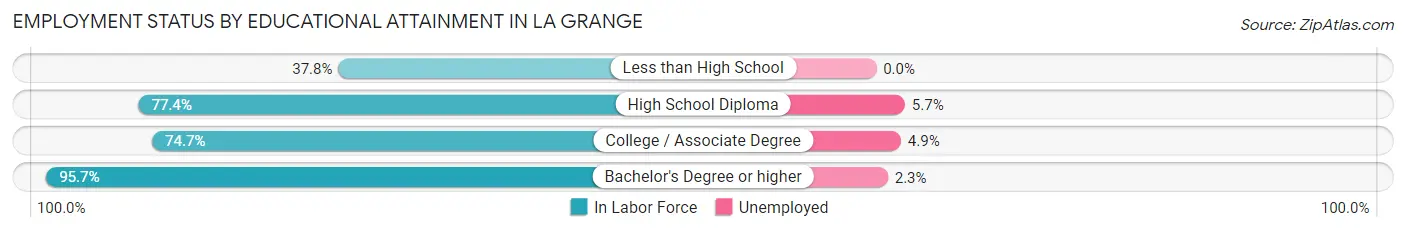
| Educational Attainment | In Labor Force | Unemployed |
| Less than High School | 135 (37.8%) | 0 (0.0%) |
| High School Diploma | 738 (77.4%) | 54 (5.7%) |
| College / Associate Degree | 1,255 (74.7%) | 82 (4.9%) |
| Bachelor's Degree or higher | 1,836 (95.7%) | 44 (2.3%) |
| Total | 3,966 (80.8%) | 182 (3.7%) |
Employment Occupations by Sex in La Grange
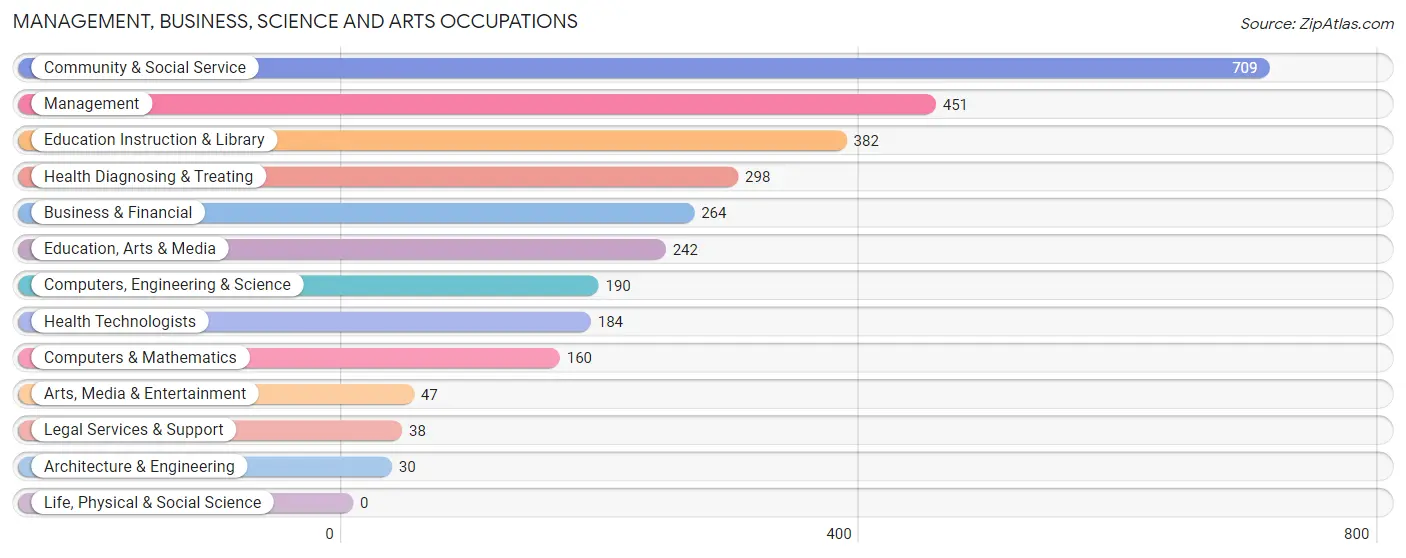
Management, Business, Science and Arts Occupations
The most common Management, Business, Science and Arts occupations in La Grange are Community & Social Service (709 | 13.8%), Management (451 | 8.8%), Education Instruction & Library (382 | 7.4%), Health Diagnosing & Treating (298 | 5.8%), and Business & Financial (264 | 5.1%).
Management, Business, Science and Arts Occupations by Sex
Within the Management, Business, Science and Arts occupations in La Grange, the most male-oriented occupations are Architecture & Engineering (100.0%), Arts, Media & Entertainment (93.6%), and Management (77.8%), while the most female-oriented occupations are Education Instruction & Library (87.4%), Education, Arts & Media (87.2%), and Health Technologists (87.0%).
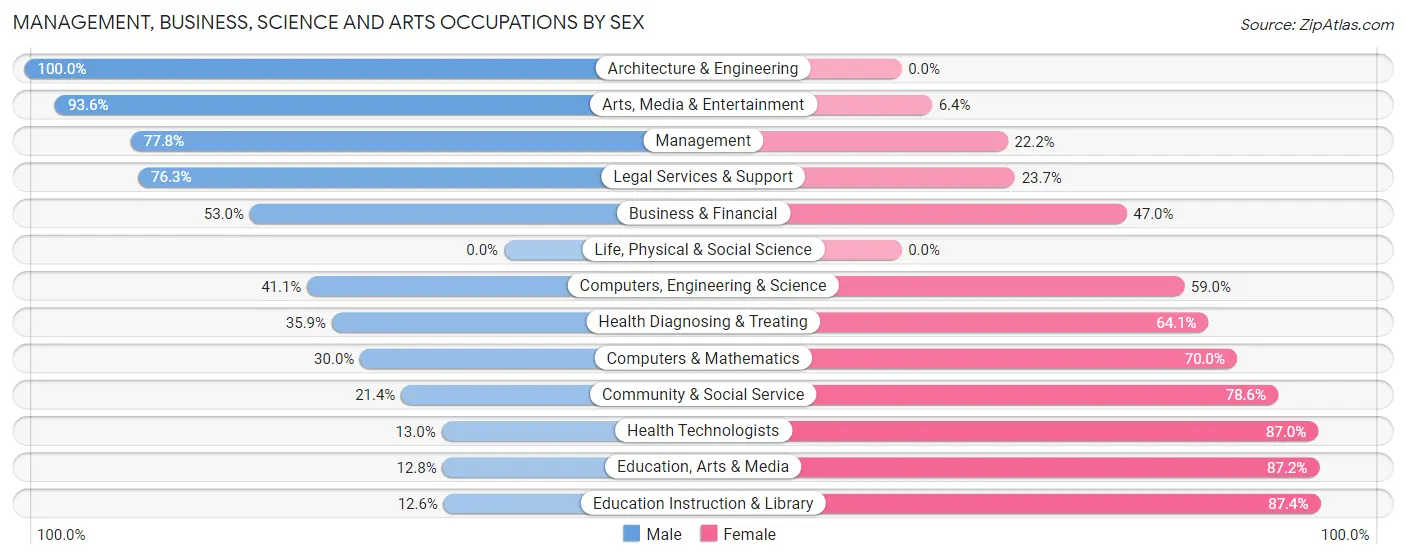
| Occupation | Male | Female |
| Management | 351 (77.8%) | 100 (22.2%) |
| Business & Financial | 140 (53.0%) | 124 (47.0%) |
| Computers, Engineering & Science | 78 (41.0%) | 112 (59.0%) |
| Computers & Mathematics | 48 (30.0%) | 112 (70.0%) |
| Architecture & Engineering | 30 (100.0%) | 0 (0.0%) |
| Life, Physical & Social Science | 0 (0.0%) | 0 (0.0%) |
| Community & Social Service | 152 (21.4%) | 557 (78.6%) |
| Education, Arts & Media | 31 (12.8%) | 211 (87.2%) |
| Legal Services & Support | 29 (76.3%) | 9 (23.7%) |
| Education Instruction & Library | 48 (12.6%) | 334 (87.4%) |
| Arts, Media & Entertainment | 44 (93.6%) | 3 (6.4%) |
| Health Diagnosing & Treating | 107 (35.9%) | 191 (64.1%) |
| Health Technologists | 24 (13.0%) | 160 (87.0%) |
| Total (Category) | 828 (43.3%) | 1,084 (56.7%) |
| Total (Overall) | 2,634 (51.3%) | 2,498 (48.7%) |
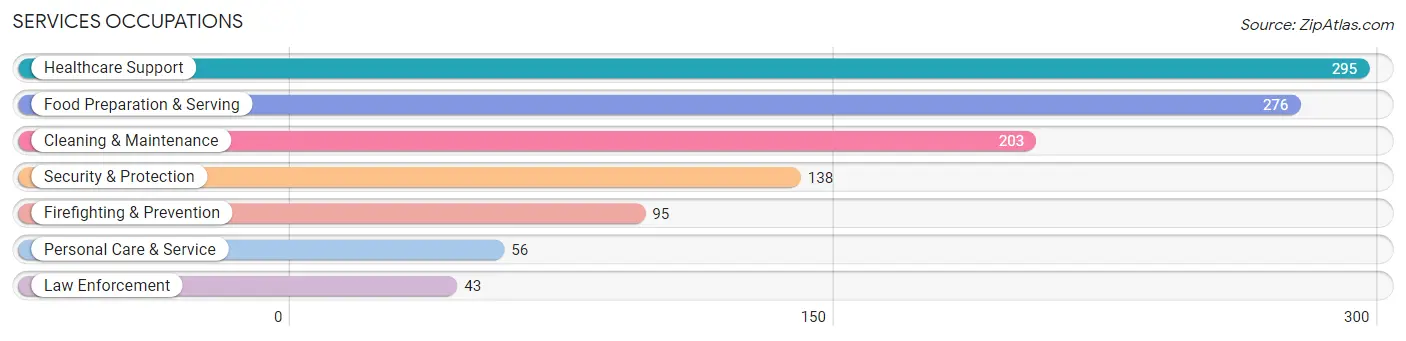
Services Occupations
The most common Services occupations in La Grange are Healthcare Support (295 | 5.8%), Food Preparation & Serving (276 | 5.4%), Cleaning & Maintenance (203 | 4.0%), Security & Protection (138 | 2.7%), and Firefighting & Prevention (95 | 1.8%).
Services Occupations by Sex
Within the Services occupations in La Grange, the most male-oriented occupations are Law Enforcement (100.0%), Security & Protection (68.8%), and Firefighting & Prevention (54.7%), while the most female-oriented occupations are Personal Care & Service (100.0%), Healthcare Support (98.0%), and Food Preparation & Serving (61.6%).
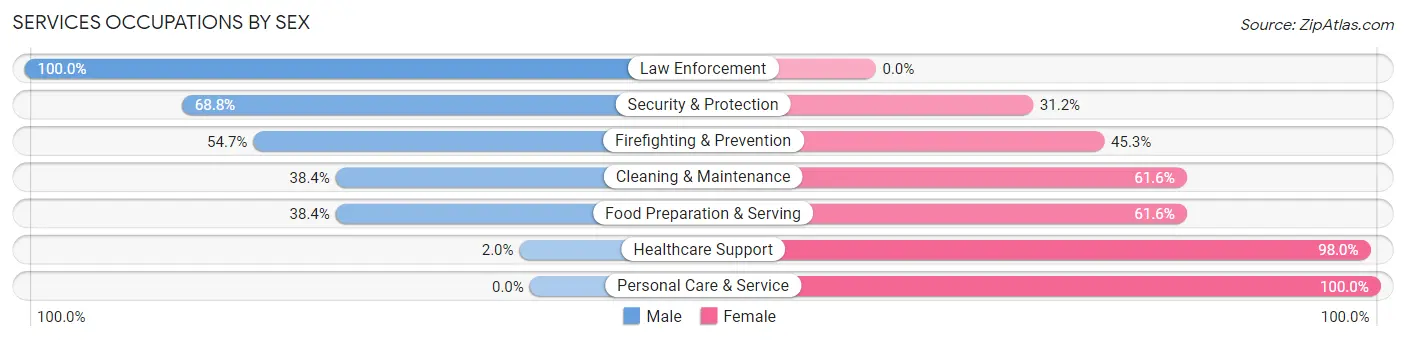
| Occupation | Male | Female |
| Healthcare Support | 6 (2.0%) | 289 (98.0%) |
| Security & Protection | 95 (68.8%) | 43 (31.2%) |
| Firefighting & Prevention | 52 (54.7%) | 43 (45.3%) |
| Law Enforcement | 43 (100.0%) | 0 (0.0%) |
| Food Preparation & Serving | 106 (38.4%) | 170 (61.6%) |
| Cleaning & Maintenance | 78 (38.4%) | 125 (61.6%) |
| Personal Care & Service | 0 (0.0%) | 56 (100.0%) |
| Total (Category) | 285 (29.4%) | 683 (70.6%) |
| Total (Overall) | 2,634 (51.3%) | 2,498 (48.7%) |
Sales and Office Occupations
The most common Sales and Office occupations in La Grange are Office & Administration (564 | 11.0%), and Sales & Related (557 | 10.8%).

Sales and Office Occupations by Sex

| Occupation | Male | Female |
| Sales & Related | 337 (60.5%) | 220 (39.5%) |
| Office & Administration | 214 (37.9%) | 350 (62.1%) |
| Total (Category) | 551 (49.1%) | 570 (50.8%) |
| Total (Overall) | 2,634 (51.3%) | 2,498 (48.7%) |
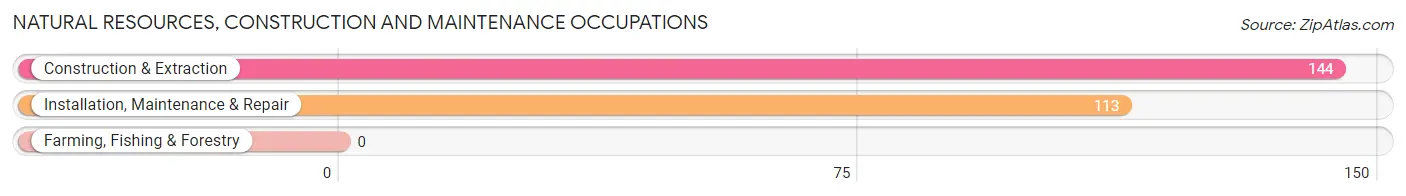
Natural Resources, Construction and Maintenance Occupations
The most common Natural Resources, Construction and Maintenance occupations in La Grange are Construction & Extraction (144 | 2.8%), and Installation, Maintenance & Repair (113 | 2.2%).
Natural Resources, Construction and Maintenance Occupations by Sex
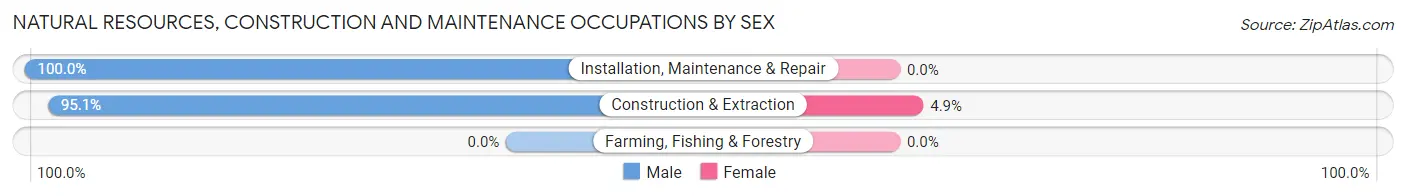
| Occupation | Male | Female |
| Farming, Fishing & Forestry | 0 (0.0%) | 0 (0.0%) |
| Construction & Extraction | 137 (95.1%) | 7 (4.9%) |
| Installation, Maintenance & Repair | 113 (100.0%) | 0 (0.0%) |
| Total (Category) | 250 (97.3%) | 7 (2.7%) |
| Total (Overall) | 2,634 (51.3%) | 2,498 (48.7%) |
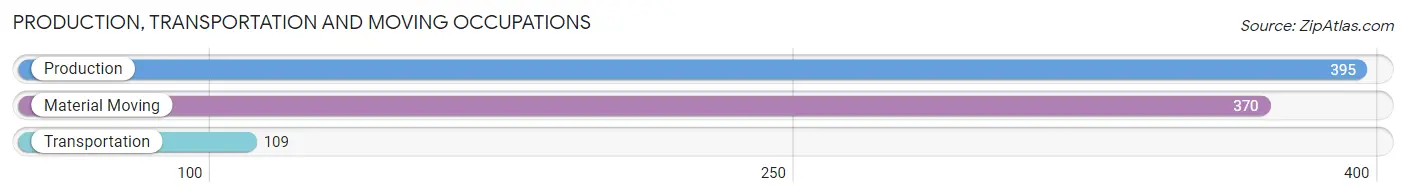
Production, Transportation and Moving Occupations
The most common Production, Transportation and Moving occupations in La Grange are Production (395 | 7.7%), Material Moving (370 | 7.2%), and Transportation (109 | 2.1%).
Production, Transportation and Moving Occupations by Sex
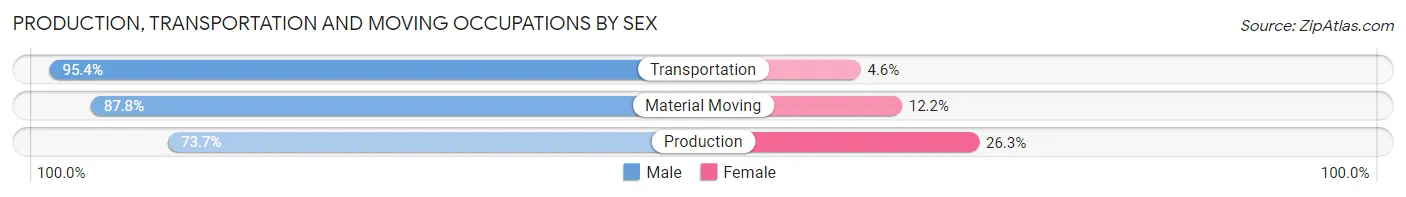
| Occupation | Male | Female |
| Production | 291 (73.7%) | 104 (26.3%) |
| Transportation | 104 (95.4%) | 5 (4.6%) |
| Material Moving | 325 (87.8%) | 45 (12.2%) |
| Total (Category) | 720 (82.4%) | 154 (17.6%) |
| Total (Overall) | 2,634 (51.3%) | 2,498 (48.7%) |
Employment Industries by Sex in La Grange
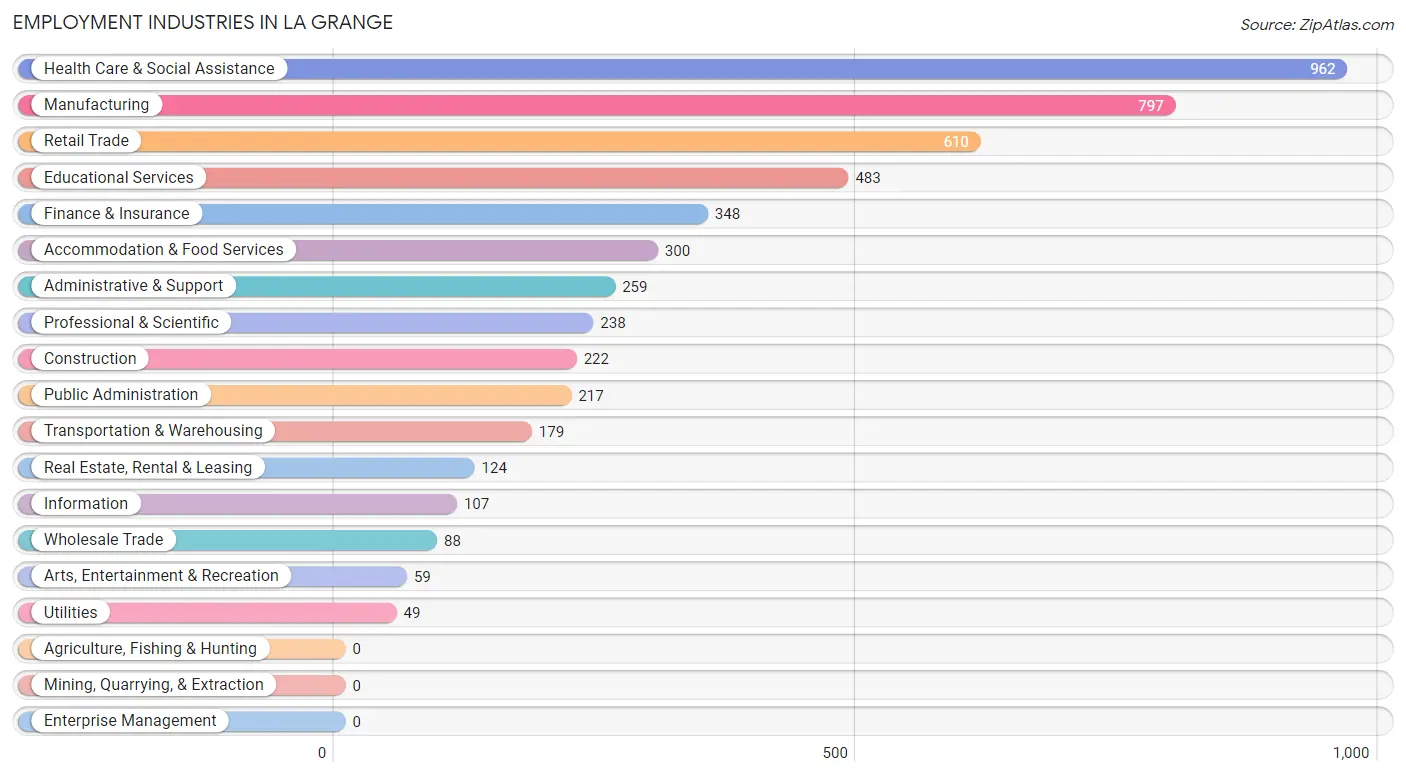
Employment Industries in La Grange
The major employment industries in La Grange include Health Care & Social Assistance (962 | 18.8%), Manufacturing (797 | 15.5%), Retail Trade (610 | 11.9%), Educational Services (483 | 9.4%), and Finance & Insurance (348 | 6.8%).
Employment Industries by Sex in La Grange
The La Grange industries that see more men than women are Construction (92.8%), Utilities (85.7%), and Manufacturing (82.6%), whereas the industries that tend to have a higher number of women are Health Care & Social Assistance (84.7%), Educational Services (79.3%), and Wholesale Trade (76.1%).
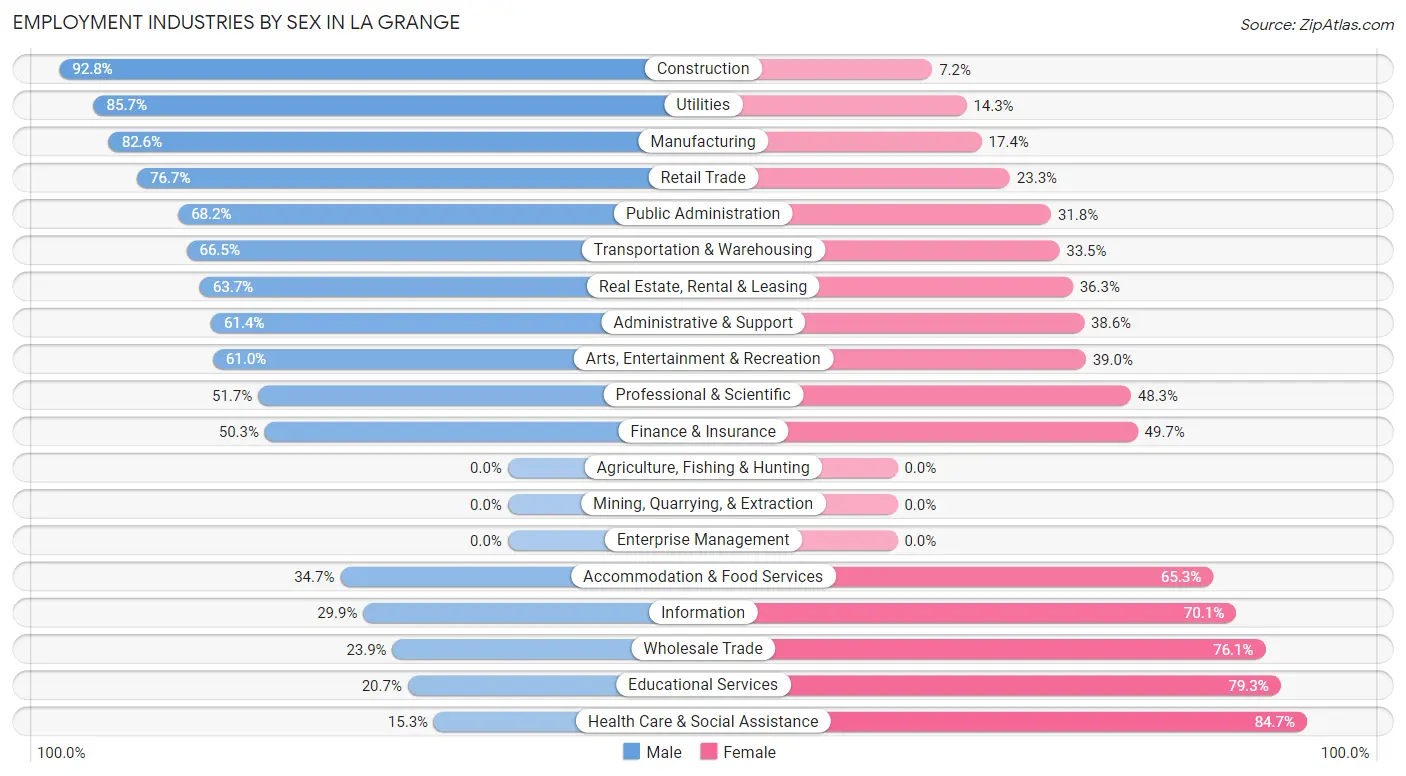
| Industry | Male | Female |
| Agriculture, Fishing & Hunting | 0 (0.0%) | 0 (0.0%) |
| Mining, Quarrying, & Extraction | 0 (0.0%) | 0 (0.0%) |
| Construction | 206 (92.8%) | 16 (7.2%) |
| Manufacturing | 658 (82.6%) | 139 (17.4%) |
| Wholesale Trade | 21 (23.9%) | 67 (76.1%) |
| Retail Trade | 468 (76.7%) | 142 (23.3%) |
| Transportation & Warehousing | 119 (66.5%) | 60 (33.5%) |
| Utilities | 42 (85.7%) | 7 (14.3%) |
| Information | 32 (29.9%) | 75 (70.1%) |
| Finance & Insurance | 175 (50.3%) | 173 (49.7%) |
| Real Estate, Rental & Leasing | 79 (63.7%) | 45 (36.3%) |
| Professional & Scientific | 123 (51.7%) | 115 (48.3%) |
| Enterprise Management | 0 (0.0%) | 0 (0.0%) |
| Administrative & Support | 159 (61.4%) | 100 (38.6%) |
| Educational Services | 100 (20.7%) | 383 (79.3%) |
| Health Care & Social Assistance | 147 (15.3%) | 815 (84.7%) |
| Arts, Entertainment & Recreation | 36 (61.0%) | 23 (39.0%) |
| Accommodation & Food Services | 104 (34.7%) | 196 (65.3%) |
| Public Administration | 148 (68.2%) | 69 (31.8%) |
| Total | 2,634 (51.3%) | 2,498 (48.7%) |
Education in La Grange
School Enrollment in La Grange
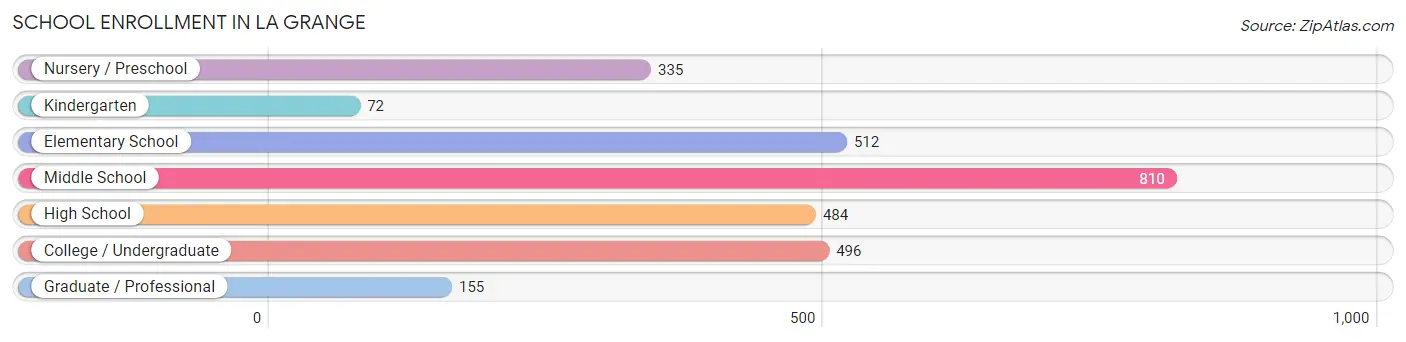
The most common levels of schooling among the 2,864 students in La Grange are middle school (810 | 28.3%), elementary school (512 | 17.9%), and college / undergraduate (496 | 17.3%).
| School Level | # Students | % Students |
| Nursery / Preschool | 335 | 11.7% |
| Kindergarten | 72 | 2.5% |
| Elementary School | 512 | 17.9% |
| Middle School | 810 | 28.3% |
| High School | 484 | 16.9% |
| College / Undergraduate | 496 | 17.3% |
| Graduate / Professional | 155 | 5.4% |
| Total | 2,864 | 100.0% |
School Enrollment by Age by Funding Source in La Grange
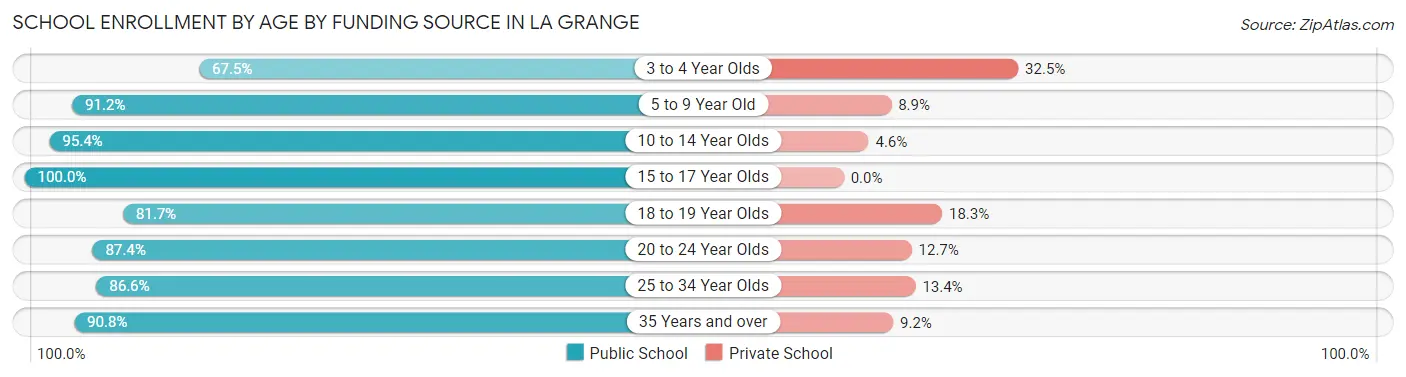
Out of a total of 2,864 students who are enrolled in schools in La Grange, 255 (8.9%) attend a private institution, while the remaining 2,609 (91.1%) are enrolled in public schools. The age group of 3 to 4 year olds has the highest likelihood of being enrolled in private schools, with 52 (32.5% in the age bracket) enrolled. Conversely, the age group of 15 to 17 year olds has the lowest likelihood of being enrolled in a private school, with 369 (100.0% in the age bracket) attending a public institution.
| Age Bracket | Public School | Private School |
| 3 to 4 Year Olds | 108 (67.5%) | 52 (32.5%) |
| 5 to 9 Year Old | 690 (91.1%) | 67 (8.8%) |
| 10 to 14 Year Olds | 845 (95.4%) | 41 (4.6%) |
| 15 to 17 Year Olds | 369 (100.0%) | 0 (0.0%) |
| 18 to 19 Year Olds | 165 (81.7%) | 37 (18.3%) |
| 20 to 24 Year Olds | 145 (87.4%) | 21 (12.7%) |
| 25 to 34 Year Olds | 149 (86.6%) | 23 (13.4%) |
| 35 Years and over | 138 (90.8%) | 14 (9.2%) |
| Total | 2,609 (91.1%) | 255 (8.9%) |
Educational Attainment by Field of Study in La Grange
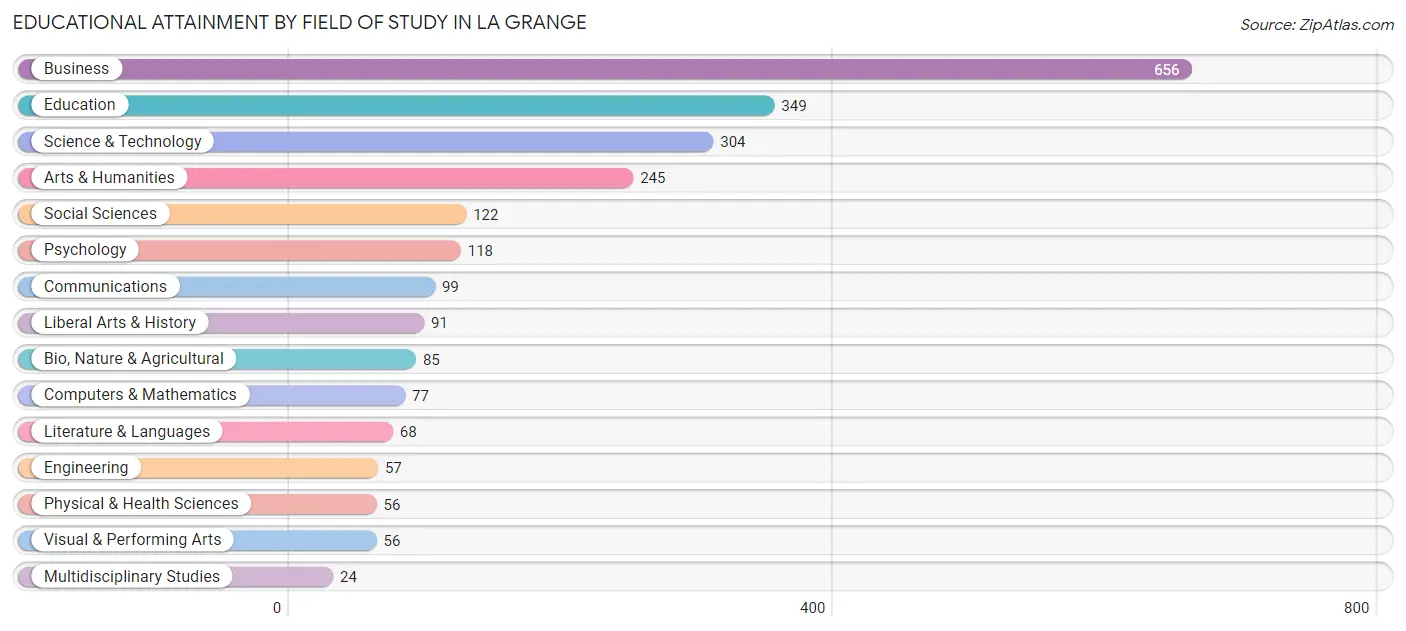
Business (656 | 27.3%), education (349 | 14.5%), science & technology (304 | 12.6%), arts & humanities (245 | 10.2%), and social sciences (122 | 5.1%) are the most common fields of study among 2,407 individuals in La Grange who have obtained a bachelor's degree or higher.
| Field of Study | # Graduates | % Graduates |
| Computers & Mathematics | 77 | 3.2% |
| Bio, Nature & Agricultural | 85 | 3.5% |
| Physical & Health Sciences | 56 | 2.3% |
| Psychology | 118 | 4.9% |
| Social Sciences | 122 | 5.1% |
| Engineering | 57 | 2.4% |
| Multidisciplinary Studies | 24 | 1.0% |
| Science & Technology | 304 | 12.6% |
| Business | 656 | 27.3% |
| Education | 349 | 14.5% |
| Literature & Languages | 68 | 2.8% |
| Liberal Arts & History | 91 | 3.8% |
| Visual & Performing Arts | 56 | 2.3% |
| Communications | 99 | 4.1% |
| Arts & Humanities | 245 | 10.2% |
| Total | 2,407 | 100.0% |
Transportation & Commute in La Grange
Vehicle Availability by Sex in La Grange
The most prevalent vehicle ownership categories in La Grange are males with 2 vehicles (1,100, accounting for 42.2%) and females with 2 vehicles (836, making up 45.8%).
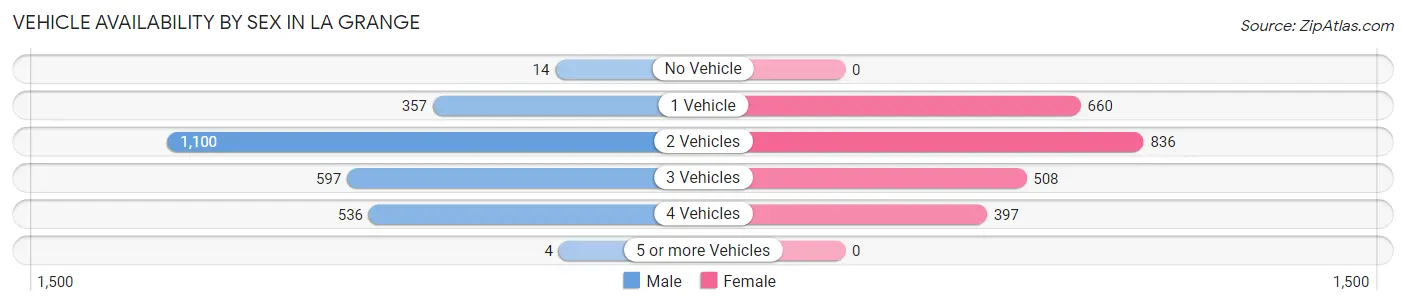
| Vehicles Available | Male | Female |
| No Vehicle | 14 (0.5%) | 0 (0.0%) |
| 1 Vehicle | 357 (13.7%) | 660 (27.5%) |
| 2 Vehicles | 1,100 (42.2%) | 836 (34.8%) |
| 3 Vehicles | 597 (22.9%) | 508 (21.2%) |
| 4 Vehicles | 536 (20.5%) | 397 (16.5%) |
| 5 or more Vehicles | 4 (0.2%) | 0 (0.0%) |
| Total | 2,608 (100.0%) | 2,401 (100.0%) |
Commute Time in La Grange
The most frequently occuring commute durations in La Grange are 30 to 34 minutes (988 commuters, 21.5%), 5 to 9 minutes (625 commuters, 13.6%), and 10 to 14 minutes (607 commuters, 13.2%).
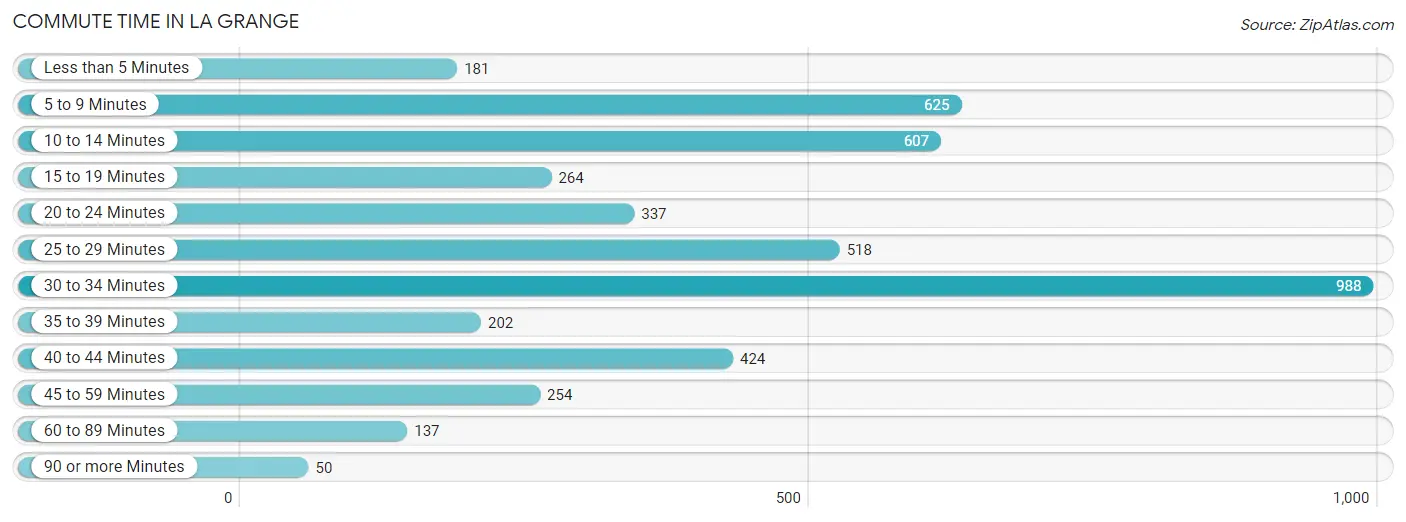
| Commute Time | # Commuters | % Commuters |
| Less than 5 Minutes | 181 | 4.0% |
| 5 to 9 Minutes | 625 | 13.6% |
| 10 to 14 Minutes | 607 | 13.2% |
| 15 to 19 Minutes | 264 | 5.8% |
| 20 to 24 Minutes | 337 | 7.3% |
| 25 to 29 Minutes | 518 | 11.3% |
| 30 to 34 Minutes | 988 | 21.5% |
| 35 to 39 Minutes | 202 | 4.4% |
| 40 to 44 Minutes | 424 | 9.2% |
| 45 to 59 Minutes | 254 | 5.5% |
| 60 to 89 Minutes | 137 | 3.0% |
| 90 or more Minutes | 50 | 1.1% |
Commute Time by Sex in La Grange
The most common commute times in La Grange are 30 to 34 minutes (602 commuters, 25.2%) for males and 5 to 9 minutes (410 commuters, 18.6%) for females.
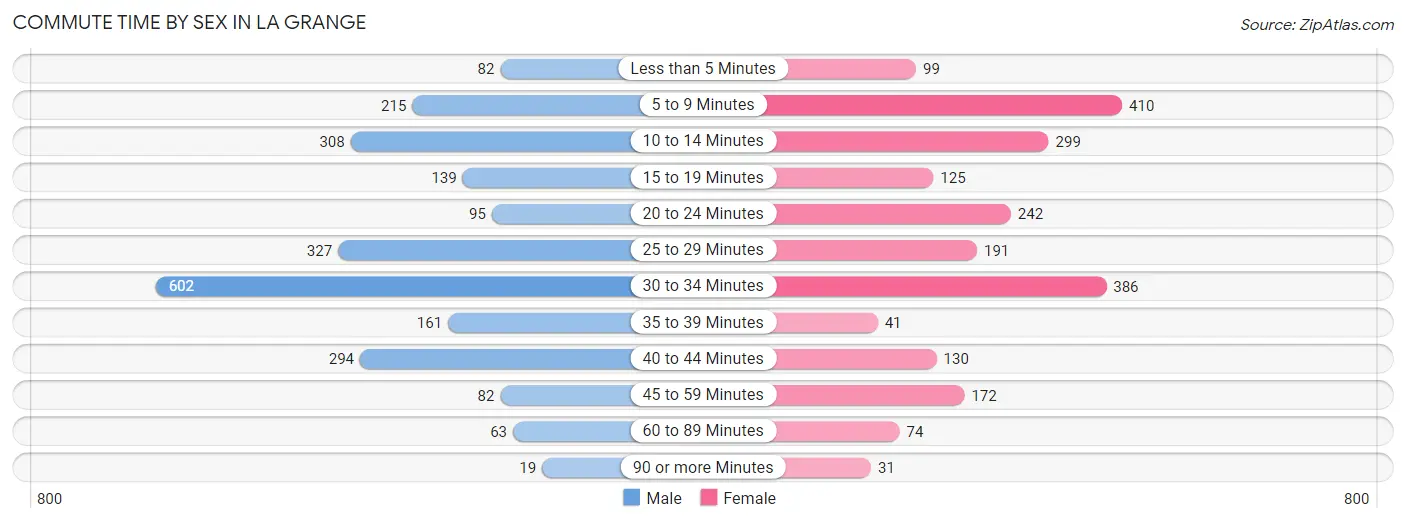
| Commute Time | Male | Female |
| Less than 5 Minutes | 82 (3.4%) | 99 (4.5%) |
| 5 to 9 Minutes | 215 (9.0%) | 410 (18.6%) |
| 10 to 14 Minutes | 308 (12.9%) | 299 (13.6%) |
| 15 to 19 Minutes | 139 (5.8%) | 125 (5.7%) |
| 20 to 24 Minutes | 95 (4.0%) | 242 (11.0%) |
| 25 to 29 Minutes | 327 (13.7%) | 191 (8.7%) |
| 30 to 34 Minutes | 602 (25.2%) | 386 (17.5%) |
| 35 to 39 Minutes | 161 (6.7%) | 41 (1.9%) |
| 40 to 44 Minutes | 294 (12.3%) | 130 (5.9%) |
| 45 to 59 Minutes | 82 (3.4%) | 172 (7.8%) |
| 60 to 89 Minutes | 63 (2.6%) | 74 (3.4%) |
| 90 or more Minutes | 19 (0.8%) | 31 (1.4%) |
Time of Departure to Work by Sex in La Grange
The most frequent times of departure to work in La Grange are 7:00 AM to 7:29 AM (499, 20.9%) for males and 7:30 AM to 7:59 AM (360, 16.4%) for females.
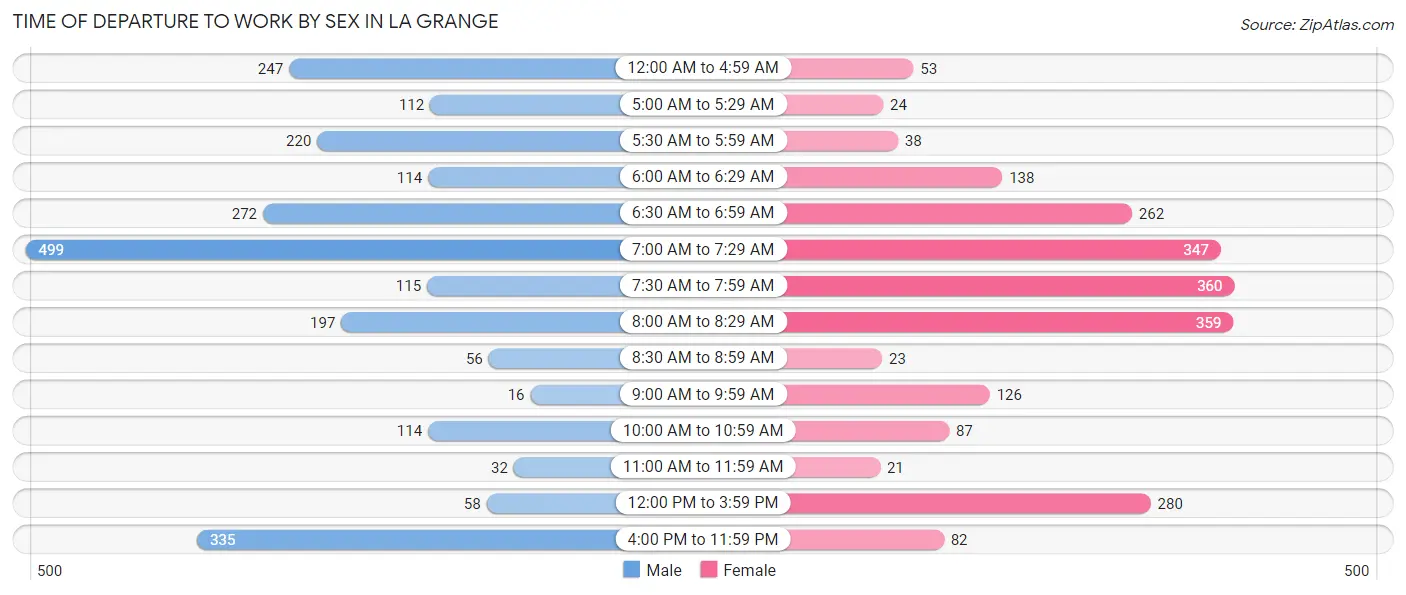
| Time of Departure | Male | Female |
| 12:00 AM to 4:59 AM | 247 (10.3%) | 53 (2.4%) |
| 5:00 AM to 5:29 AM | 112 (4.7%) | 24 (1.1%) |
| 5:30 AM to 5:59 AM | 220 (9.2%) | 38 (1.7%) |
| 6:00 AM to 6:29 AM | 114 (4.8%) | 138 (6.3%) |
| 6:30 AM to 6:59 AM | 272 (11.4%) | 262 (11.9%) |
| 7:00 AM to 7:29 AM | 499 (20.9%) | 347 (15.8%) |
| 7:30 AM to 7:59 AM | 115 (4.8%) | 360 (16.4%) |
| 8:00 AM to 8:29 AM | 197 (8.3%) | 359 (16.3%) |
| 8:30 AM to 8:59 AM | 56 (2.4%) | 23 (1.1%) |
| 9:00 AM to 9:59 AM | 16 (0.7%) | 126 (5.7%) |
| 10:00 AM to 10:59 AM | 114 (4.8%) | 87 (4.0%) |
| 11:00 AM to 11:59 AM | 32 (1.3%) | 21 (0.9%) |
| 12:00 PM to 3:59 PM | 58 (2.4%) | 280 (12.7%) |
| 4:00 PM to 11:59 PM | 335 (14.0%) | 82 (3.7%) |
| Total | 2,387 (100.0%) | 2,200 (100.0%) |
Housing Occupancy in La Grange
Occupancy by Ownership in La Grange
Of the total 3,684 dwellings in La Grange, owner-occupied units account for 2,530 (68.7%), while renter-occupied units make up 1,154 (31.3%).
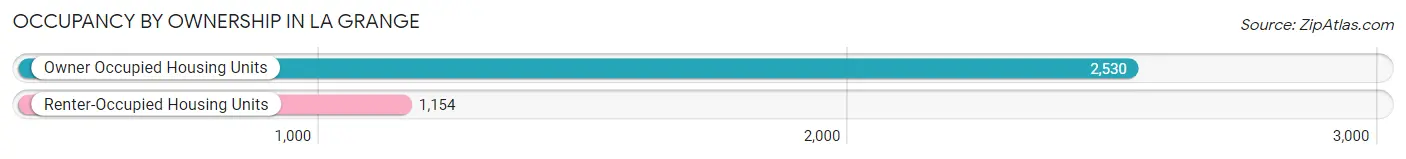
| Occupancy | # Housing Units | % Housing Units |
| Owner Occupied Housing Units | 2,530 | 68.7% |
| Renter-Occupied Housing Units | 1,154 | 31.3% |
| Total Occupied Housing Units | 3,684 | 100.0% |
Occupancy by Household Size in La Grange
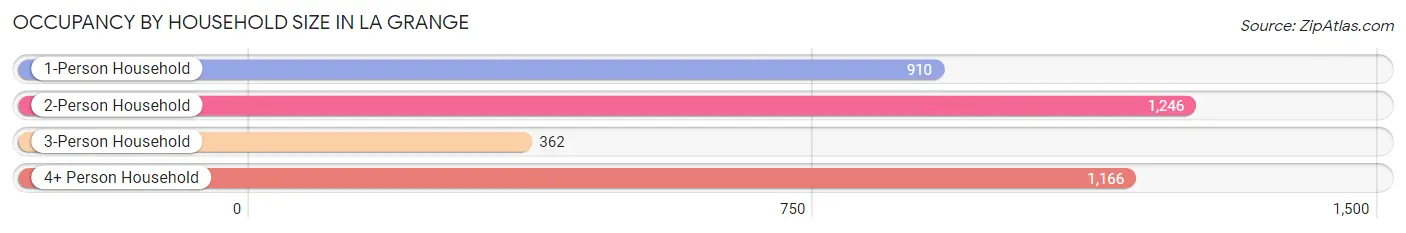
| Household Size | # Housing Units | % Housing Units |
| 1-Person Household | 910 | 24.7% |
| 2-Person Household | 1,246 | 33.8% |
| 3-Person Household | 362 | 9.8% |
| 4+ Person Household | 1,166 | 31.7% |
| Total Housing Units | 3,684 | 100.0% |
Occupancy by Ownership by Household Size in La Grange
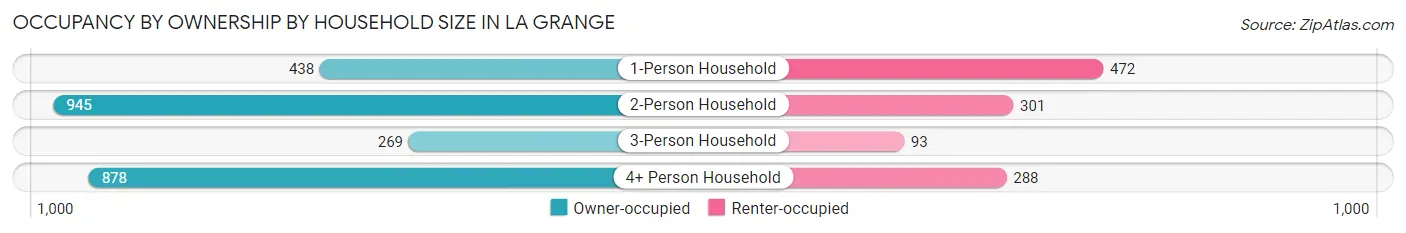
| Household Size | Owner-occupied | Renter-occupied |
| 1-Person Household | 438 (48.1%) | 472 (51.9%) |
| 2-Person Household | 945 (75.8%) | 301 (24.2%) |
| 3-Person Household | 269 (74.3%) | 93 (25.7%) |
| 4+ Person Household | 878 (75.3%) | 288 (24.7%) |
| Total Housing Units | 2,530 (68.7%) | 1,154 (31.3%) |
Occupancy by Educational Attainment in La Grange
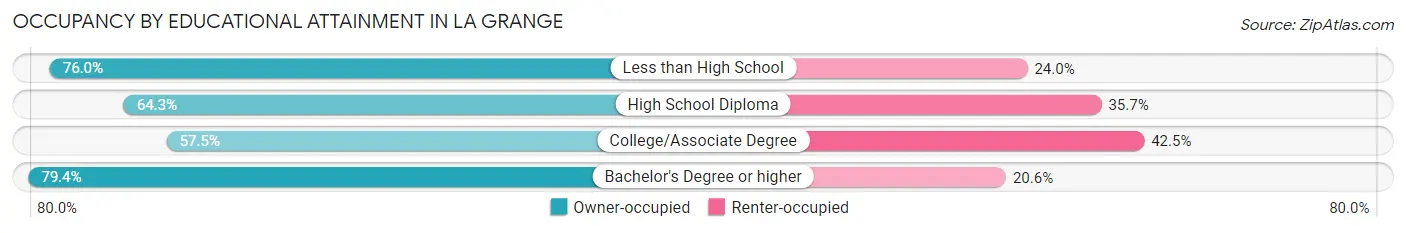
| Household Size | Owner-occupied | Renter-occupied |
| Less than High School | 133 (76.0%) | 42 (24.0%) |
| High School Diploma | 552 (64.3%) | 307 (35.7%) |
| College/Associate Degree | 680 (57.5%) | 503 (42.5%) |
| Bachelor's Degree or higher | 1,165 (79.4%) | 302 (20.6%) |
Occupancy by Age of Householder in La Grange
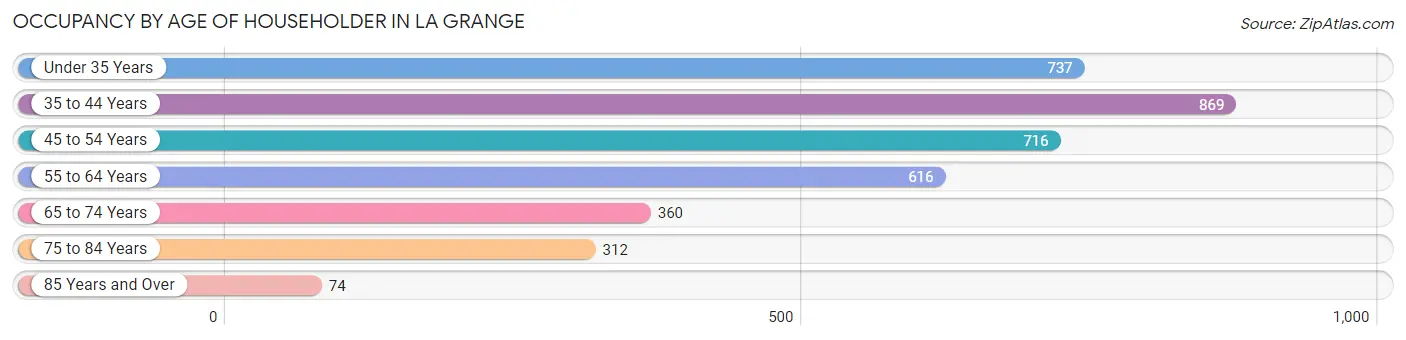
| Age Bracket | # Households | % Households |
| Under 35 Years | 737 | 20.0% |
| 35 to 44 Years | 869 | 23.6% |
| 45 to 54 Years | 716 | 19.4% |
| 55 to 64 Years | 616 | 16.7% |
| 65 to 74 Years | 360 | 9.8% |
| 75 to 84 Years | 312 | 8.5% |
| 85 Years and Over | 74 | 2.0% |
| Total | 3,684 | 100.0% |
Housing Finances in La Grange
Median Income by Occupancy in La Grange
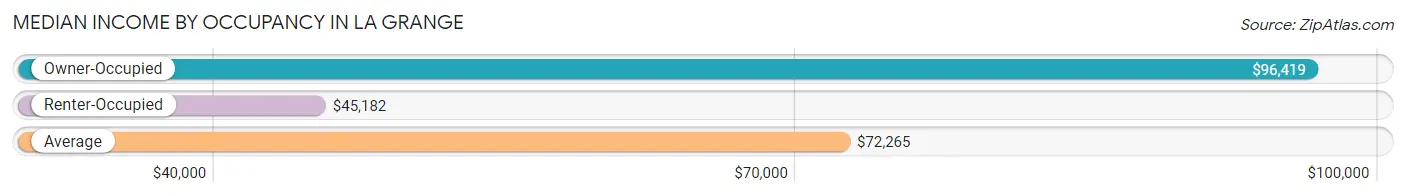
| Occupancy Type | # Households | Median Income |
| Owner-Occupied | 2,530 (68.7%) | $96,419 |
| Renter-Occupied | 1,154 (31.3%) | $45,182 |
| Average | 3,684 (100.0%) | $72,265 |
Occupancy by Householder Income Bracket in La Grange
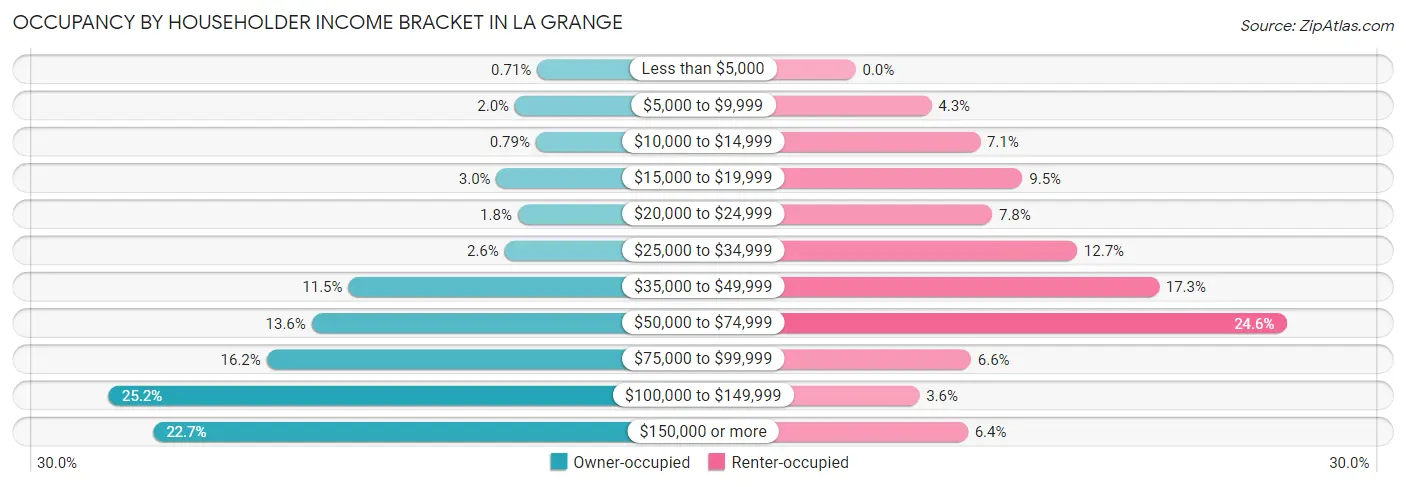
| Income Bracket | Owner-occupied | Renter-occupied |
| Less than $5,000 | 18 (0.7%) | 0 (0.0%) |
| $5,000 to $9,999 | 50 (2.0%) | 50 (4.3%) |
| $10,000 to $14,999 | 20 (0.8%) | 82 (7.1%) |
| $15,000 to $19,999 | 77 (3.0%) | 110 (9.5%) |
| $20,000 to $24,999 | 46 (1.8%) | 90 (7.8%) |
| $25,000 to $34,999 | 65 (2.6%) | 146 (12.7%) |
| $35,000 to $49,999 | 291 (11.5%) | 200 (17.3%) |
| $50,000 to $74,999 | 344 (13.6%) | 284 (24.6%) |
| $75,000 to $99,999 | 409 (16.2%) | 76 (6.6%) |
| $100,000 to $149,999 | 637 (25.2%) | 42 (3.6%) |
| $150,000 or more | 573 (22.7%) | 74 (6.4%) |
| Total | 2,530 (100.0%) | 1,154 (100.0%) |
Monthly Housing Cost Tiers in La Grange
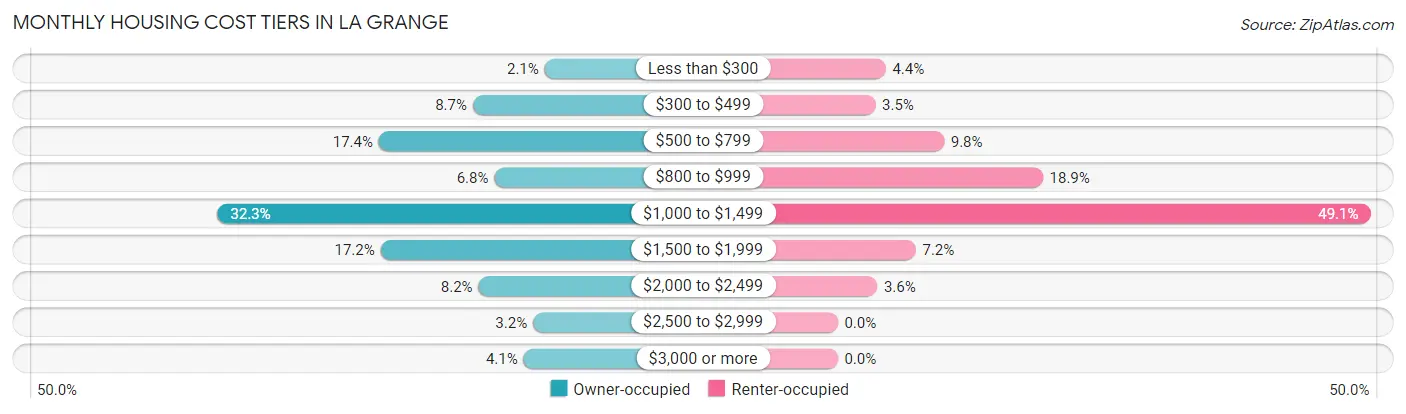
| Monthly Cost | Owner-occupied | Renter-occupied |
| Less than $300 | 54 (2.1%) | 51 (4.4%) |
| $300 to $499 | 221 (8.7%) | 40 (3.5%) |
| $500 to $799 | 440 (17.4%) | 113 (9.8%) |
| $800 to $999 | 171 (6.8%) | 218 (18.9%) |
| $1,000 to $1,499 | 816 (32.3%) | 566 (49.0%) |
| $1,500 to $1,999 | 436 (17.2%) | 83 (7.2%) |
| $2,000 to $2,499 | 208 (8.2%) | 42 (3.6%) |
| $2,500 to $2,999 | 81 (3.2%) | 0 (0.0%) |
| $3,000 or more | 103 (4.1%) | 0 (0.0%) |
| Total | 2,530 (100.0%) | 1,154 (100.0%) |
Physical Housing Characteristics in La Grange
Housing Structures in La Grange
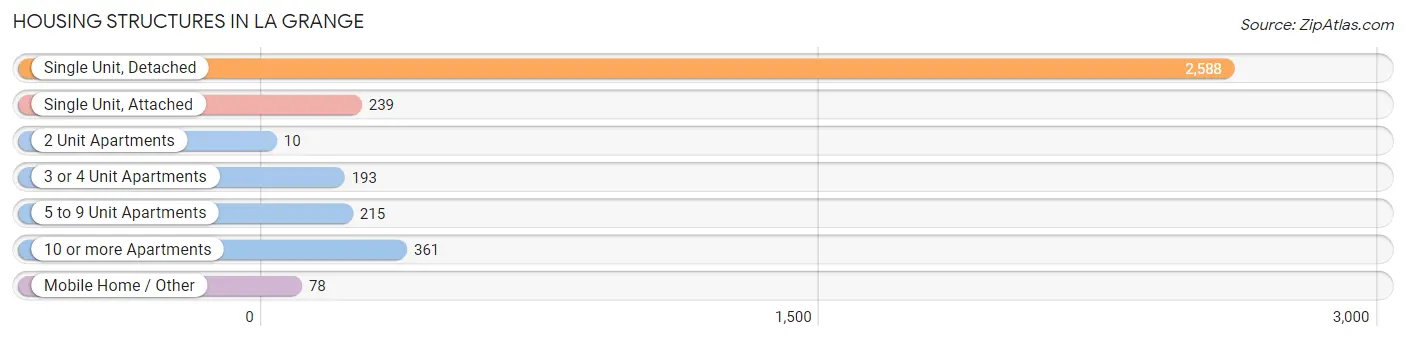
| Structure Type | # Housing Units | % Housing Units |
| Single Unit, Detached | 2,588 | 70.3% |
| Single Unit, Attached | 239 | 6.5% |
| 2 Unit Apartments | 10 | 0.3% |
| 3 or 4 Unit Apartments | 193 | 5.2% |
| 5 to 9 Unit Apartments | 215 | 5.8% |
| 10 or more Apartments | 361 | 9.8% |
| Mobile Home / Other | 78 | 2.1% |
| Total | 3,684 | 100.0% |
Housing Structures by Occupancy in La Grange
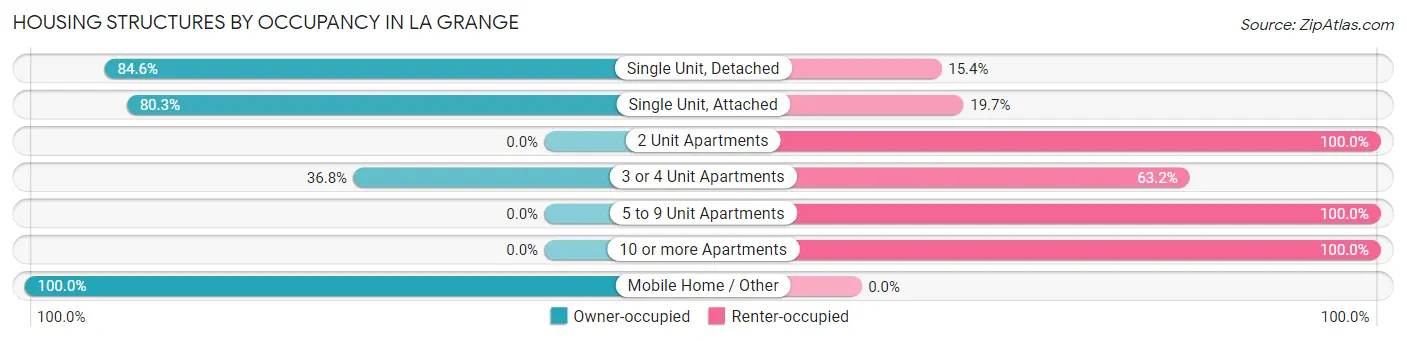
| Structure Type | Owner-occupied | Renter-occupied |
| Single Unit, Detached | 2,189 (84.6%) | 399 (15.4%) |
| Single Unit, Attached | 192 (80.3%) | 47 (19.7%) |
| 2 Unit Apartments | 0 (0.0%) | 10 (100.0%) |
| 3 or 4 Unit Apartments | 71 (36.8%) | 122 (63.2%) |
| 5 to 9 Unit Apartments | 0 (0.0%) | 215 (100.0%) |
| 10 or more Apartments | 0 (0.0%) | 361 (100.0%) |
| Mobile Home / Other | 78 (100.0%) | 0 (0.0%) |
| Total | 2,530 (68.7%) | 1,154 (31.3%) |
Housing Structures by Number of Rooms in La Grange
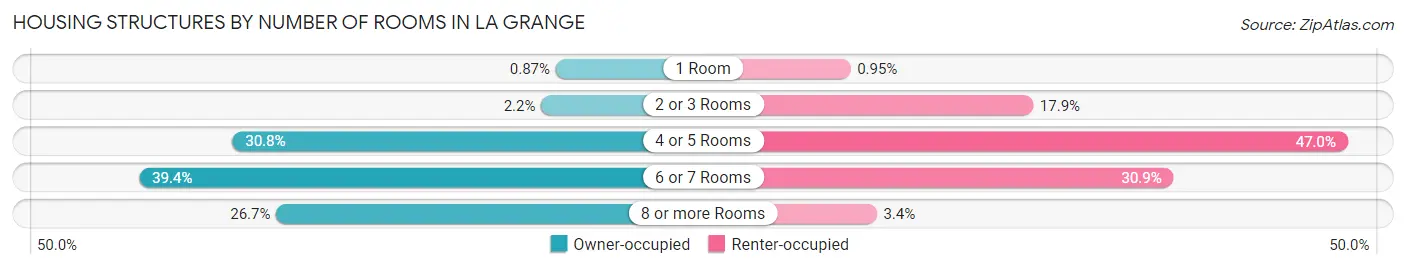
| Number of Rooms | Owner-occupied | Renter-occupied |
| 1 Room | 22 (0.9%) | 11 (0.9%) |
| 2 or 3 Rooms | 56 (2.2%) | 206 (17.8%) |
| 4 or 5 Rooms | 779 (30.8%) | 542 (47.0%) |
| 6 or 7 Rooms | 997 (39.4%) | 356 (30.8%) |
| 8 or more Rooms | 676 (26.7%) | 39 (3.4%) |
| Total | 2,530 (100.0%) | 1,154 (100.0%) |
Housing Structure by Heating Type in La Grange
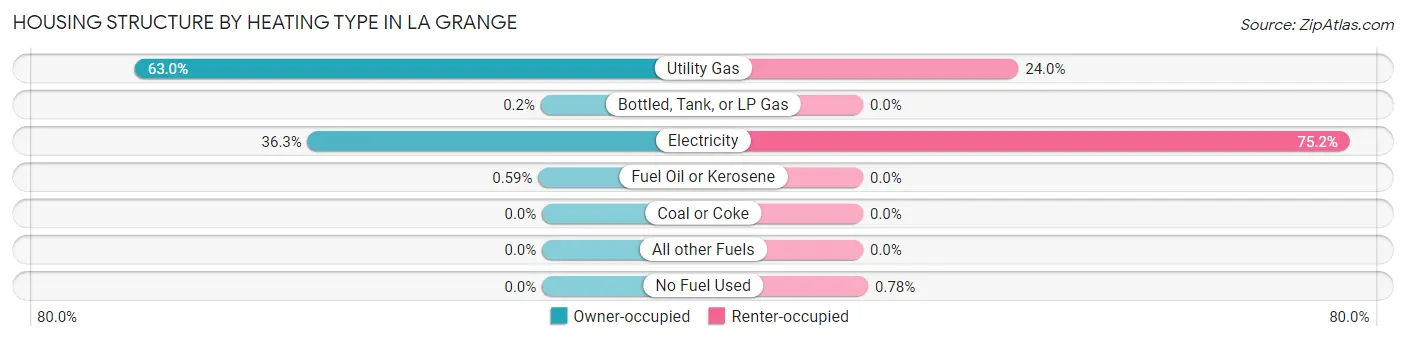
| Heating Type | Owner-occupied | Renter-occupied |
| Utility Gas | 1,593 (63.0%) | 277 (24.0%) |
| Bottled, Tank, or LP Gas | 5 (0.2%) | 0 (0.0%) |
| Electricity | 917 (36.2%) | 868 (75.2%) |
| Fuel Oil or Kerosene | 15 (0.6%) | 0 (0.0%) |
| Coal or Coke | 0 (0.0%) | 0 (0.0%) |
| All other Fuels | 0 (0.0%) | 0 (0.0%) |
| No Fuel Used | 0 (0.0%) | 9 (0.8%) |
| Total | 2,530 (100.0%) | 1,154 (100.0%) |
Household Vehicle Usage in La Grange
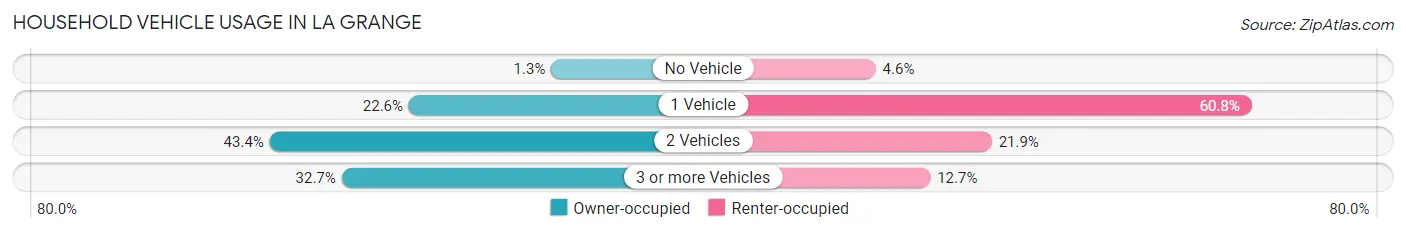
| Vehicles per Household | Owner-occupied | Renter-occupied |
| No Vehicle | 34 (1.3%) | 53 (4.6%) |
| 1 Vehicle | 572 (22.6%) | 701 (60.8%) |
| 2 Vehicles | 1,098 (43.4%) | 253 (21.9%) |
| 3 or more Vehicles | 826 (32.7%) | 147 (12.7%) |
| Total | 2,530 (100.0%) | 1,154 (100.0%) |
Real Estate & Mortgages in La Grange
Real Estate and Mortgage Overview in La Grange
| Characteristic | Without Mortgage | With Mortgage |
| Housing Units | 675 | 1,855 |
| Median Property Value | $227,800 | $257,300 |
| Median Household Income | $71,875 | $521 |
| Monthly Housing Costs | $576 | $103 |
| Real Estate Taxes | $1,861 | $0 |
Property Value by Mortgage Status in La Grange
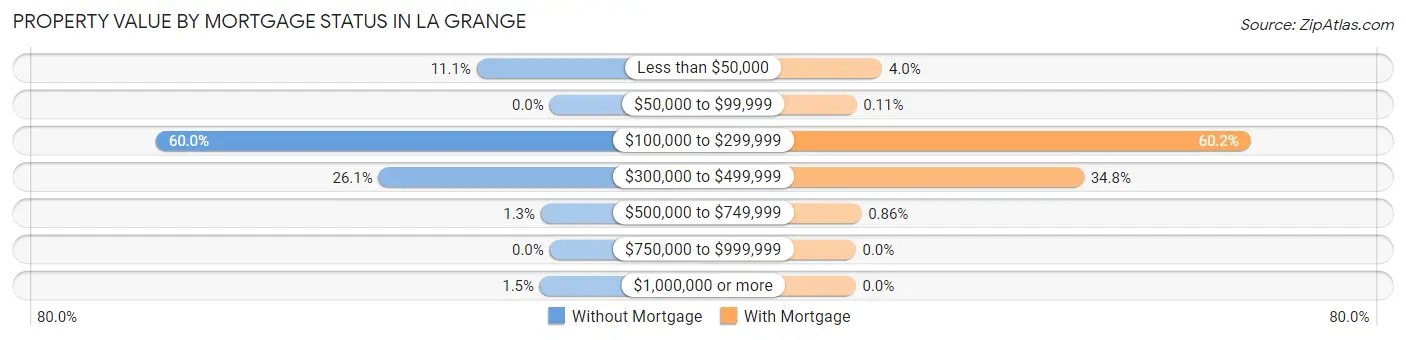
| Property Value | Without Mortgage | With Mortgage |
| Less than $50,000 | 75 (11.1%) | 75 (4.0%) |
| $50,000 to $99,999 | 0 (0.0%) | 2 (0.1%) |
| $100,000 to $299,999 | 405 (60.0%) | 1,117 (60.2%) |
| $300,000 to $499,999 | 176 (26.1%) | 645 (34.8%) |
| $500,000 to $749,999 | 9 (1.3%) | 16 (0.9%) |
| $750,000 to $999,999 | 0 (0.0%) | 0 (0.0%) |
| $1,000,000 or more | 10 (1.5%) | 0 (0.0%) |
| Total | 675 (100.0%) | 1,855 (100.0%) |
Household Income by Mortgage Status in La Grange
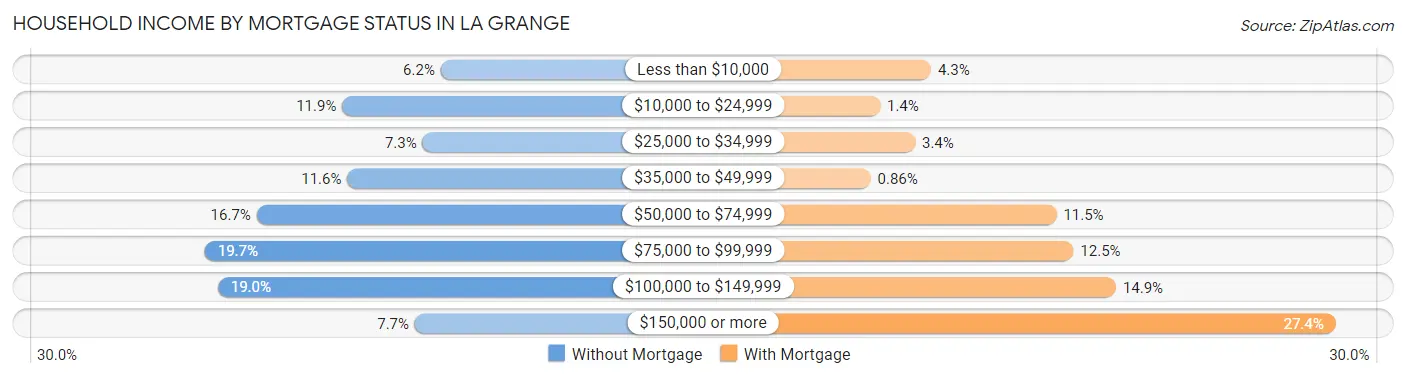
| Household Income | Without Mortgage | With Mortgage |
| Less than $10,000 | 42 (6.2%) | 80 (4.3%) |
| $10,000 to $24,999 | 80 (11.8%) | 26 (1.4%) |
| $25,000 to $34,999 | 49 (7.3%) | 63 (3.4%) |
| $35,000 to $49,999 | 78 (11.6%) | 16 (0.9%) |
| $50,000 to $74,999 | 113 (16.7%) | 213 (11.5%) |
| $75,000 to $99,999 | 133 (19.7%) | 231 (12.4%) |
| $100,000 to $149,999 | 128 (19.0%) | 276 (14.9%) |
| $150,000 or more | 52 (7.7%) | 509 (27.4%) |
| Total | 675 (100.0%) | 1,855 (100.0%) |
Property Value to Household Income Ratio in La Grange
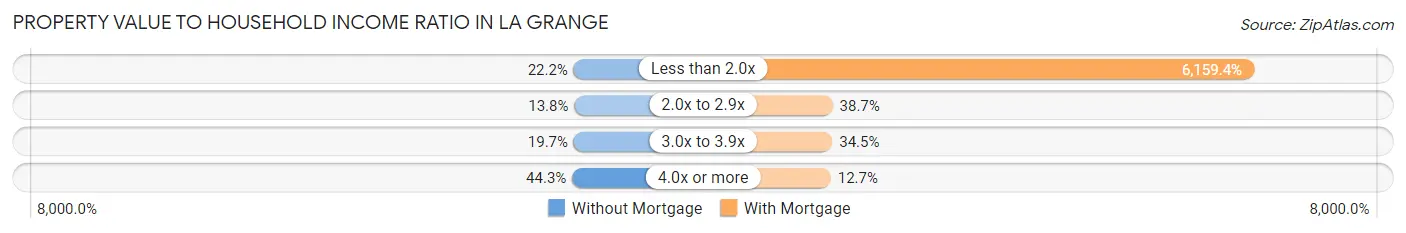
| Value-to-Income Ratio | Without Mortgage | With Mortgage |
| Less than 2.0x | 150 (22.2%) | 114,256 (6,159.3%) |
| 2.0x to 2.9x | 93 (13.8%) | 718 (38.7%) |
| 3.0x to 3.9x | 133 (19.7%) | 639 (34.4%) |
| 4.0x or more | 299 (44.3%) | 235 (12.7%) |
| Total | 675 (100.0%) | 1,855 (100.0%) |
Real Estate Taxes by Mortgage Status in La Grange
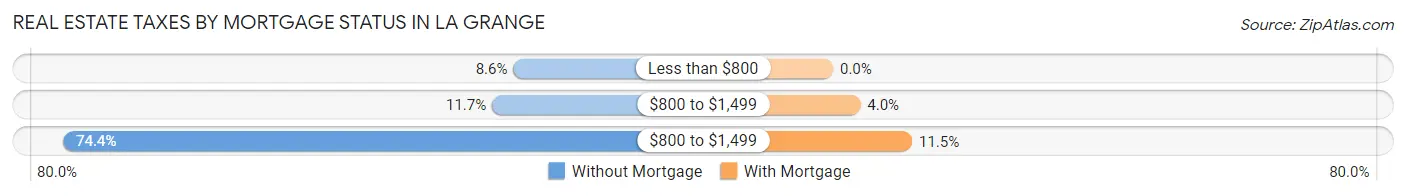
| Property Taxes | Without Mortgage | With Mortgage |
| Less than $800 | 58 (8.6%) | 0 (0.0%) |
| $800 to $1,499 | 79 (11.7%) | 74 (4.0%) |
| $800 to $1,499 | 502 (74.4%) | 214 (11.5%) |
| Total | 675 (100.0%) | 1,855 (100.0%) |
Health & Disability in La Grange
Health Insurance Coverage by Age in La Grange
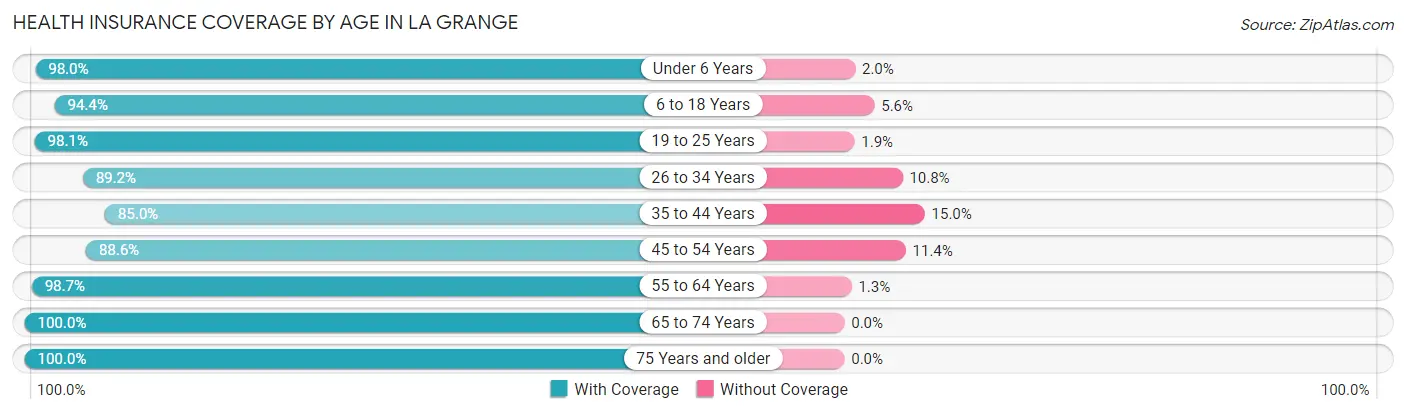
| Age Bracket | With Coverage | Without Coverage |
| Under 6 Years | 881 (98.0%) | 18 (2.0%) |
| 6 to 18 Years | 1,807 (94.4%) | 107 (5.6%) |
| 19 to 25 Years | 1,207 (98.1%) | 23 (1.9%) |
| 26 to 34 Years | 864 (89.2%) | 105 (10.8%) |
| 35 to 44 Years | 1,039 (85.0%) | 183 (15.0%) |
| 45 to 54 Years | 1,262 (88.6%) | 163 (11.4%) |
| 55 to 64 Years | 964 (98.7%) | 13 (1.3%) |
| 65 to 74 Years | 680 (100.0%) | 0 (0.0%) |
| 75 Years and older | 499 (100.0%) | 0 (0.0%) |
| Total | 9,203 (93.8%) | 612 (6.2%) |
Health Insurance Coverage by Citizenship Status in La Grange

| Citizenship Status | With Coverage | Without Coverage |
| Native Born | 881 (98.0%) | 18 (2.0%) |
| Foreign Born, Citizen | 1,807 (94.4%) | 107 (5.6%) |
| Foreign Born, not a Citizen | 1,207 (98.1%) | 23 (1.9%) |
Health Insurance Coverage by Household Income in La Grange
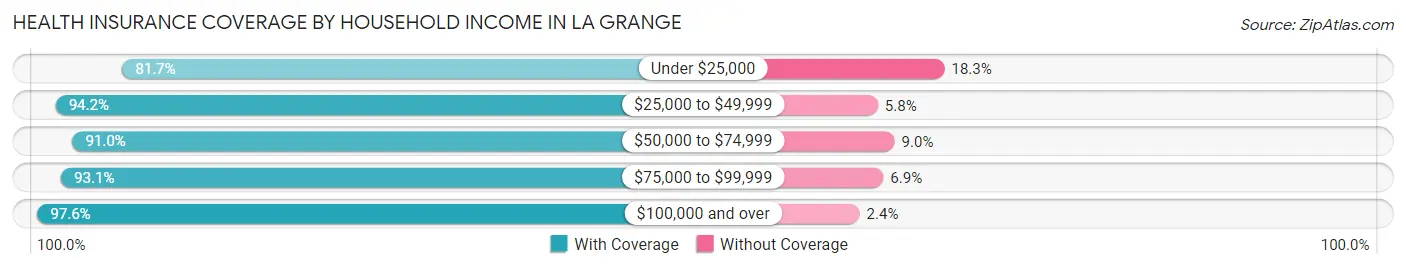
| Household Income | With Coverage | Without Coverage |
| Under $25,000 | 905 (81.7%) | 203 (18.3%) |
| $25,000 to $49,999 | 1,277 (94.2%) | 79 (5.8%) |
| $50,000 to $74,999 | 1,278 (91.0%) | 126 (9.0%) |
| $75,000 to $99,999 | 1,249 (93.1%) | 92 (6.9%) |
| $100,000 and over | 4,487 (97.6%) | 111 (2.4%) |
Public vs Private Health Insurance Coverage by Age in La Grange
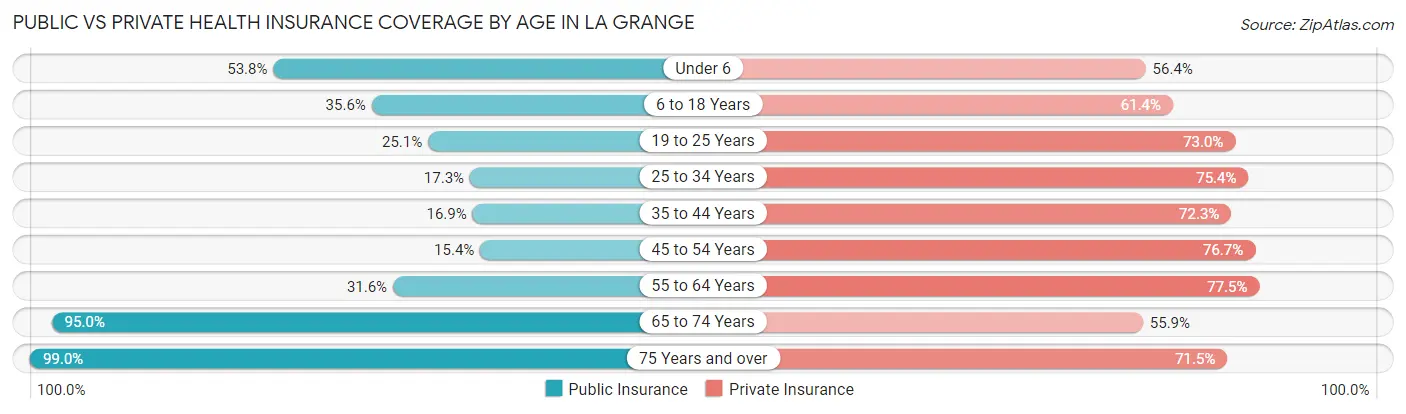
| Age Bracket | Public Insurance | Private Insurance |
| Under 6 | 484 (53.8%) | 507 (56.4%) |
| 6 to 18 Years | 681 (35.6%) | 1,176 (61.4%) |
| 19 to 25 Years | 309 (25.1%) | 898 (73.0%) |
| 25 to 34 Years | 168 (17.3%) | 731 (75.4%) |
| 35 to 44 Years | 206 (16.9%) | 883 (72.3%) |
| 45 to 54 Years | 220 (15.4%) | 1,093 (76.7%) |
| 55 to 64 Years | 309 (31.6%) | 757 (77.5%) |
| 65 to 74 Years | 646 (95.0%) | 380 (55.9%) |
| 75 Years and over | 494 (99.0%) | 357 (71.5%) |
| Total | 3,517 (35.8%) | 6,782 (69.1%) |
Disability Status by Sex by Age in La Grange
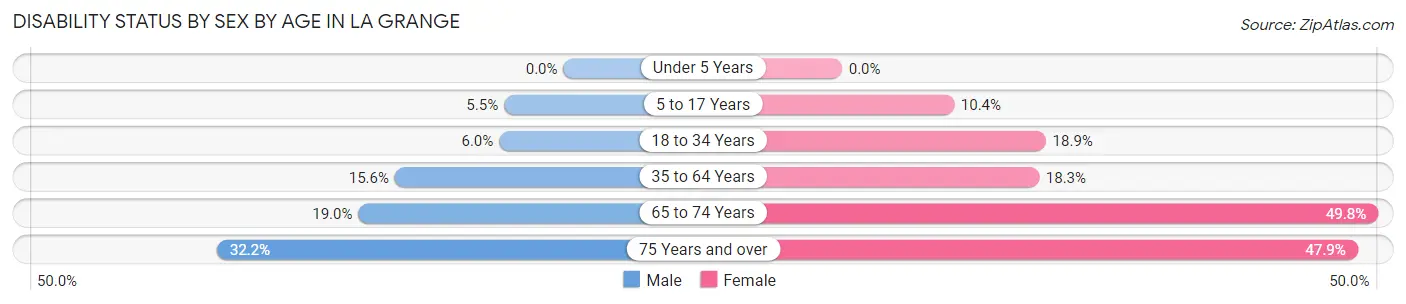
| Age Bracket | Male | Female |
| Under 5 Years | 0 (0.0%) | 0 (0.0%) |
| 5 to 17 Years | 64 (5.5%) | 93 (10.4%) |
| 18 to 34 Years | 70 (6.0%) | 214 (18.9%) |
| 35 to 64 Years | 277 (15.6%) | 339 (18.3%) |
| 65 to 74 Years | 51 (19.0%) | 205 (49.8%) |
| 75 Years and over | 55 (32.2%) | 157 (47.9%) |
Disability Class by Sex by Age in La Grange
Disability Class: Hearing Difficulty
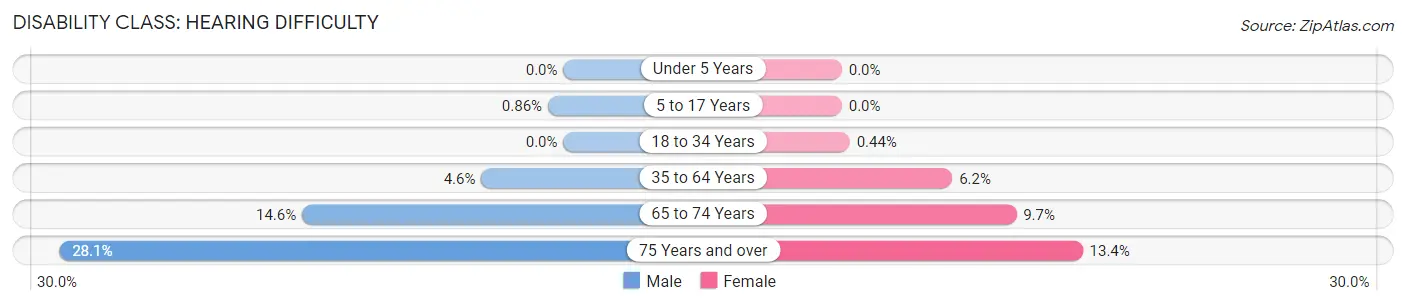
| Age Bracket | Male | Female |
| Under 5 Years | 0 (0.0%) | 0 (0.0%) |
| 5 to 17 Years | 10 (0.9%) | 0 (0.0%) |
| 18 to 34 Years | 0 (0.0%) | 5 (0.4%) |
| 35 to 64 Years | 81 (4.6%) | 114 (6.1%) |
| 65 to 74 Years | 39 (14.5%) | 40 (9.7%) |
| 75 Years and over | 48 (28.1%) | 44 (13.4%) |
Disability Class: Vision Difficulty
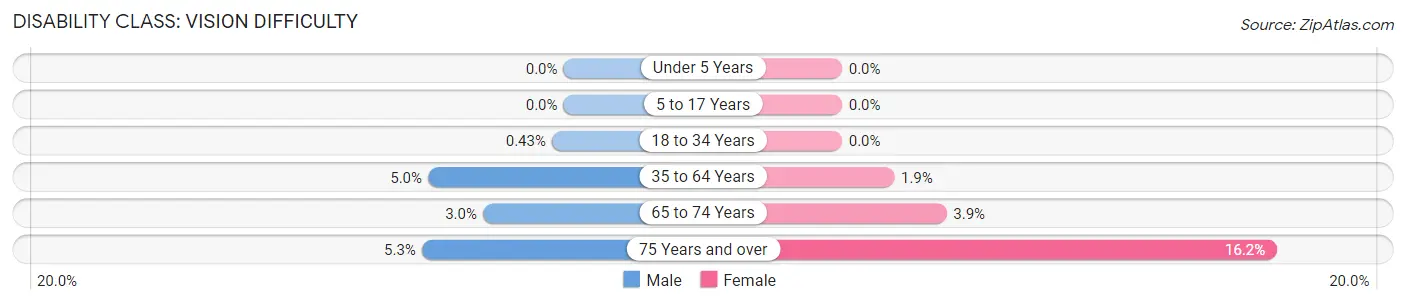
| Age Bracket | Male | Female |
| Under 5 Years | 0 (0.0%) | 0 (0.0%) |
| 5 to 17 Years | 0 (0.0%) | 0 (0.0%) |
| 18 to 34 Years | 5 (0.4%) | 0 (0.0%) |
| 35 to 64 Years | 89 (5.0%) | 36 (1.9%) |
| 65 to 74 Years | 8 (3.0%) | 16 (3.9%) |
| 75 Years and over | 9 (5.3%) | 53 (16.2%) |
Disability Class: Cognitive Difficulty
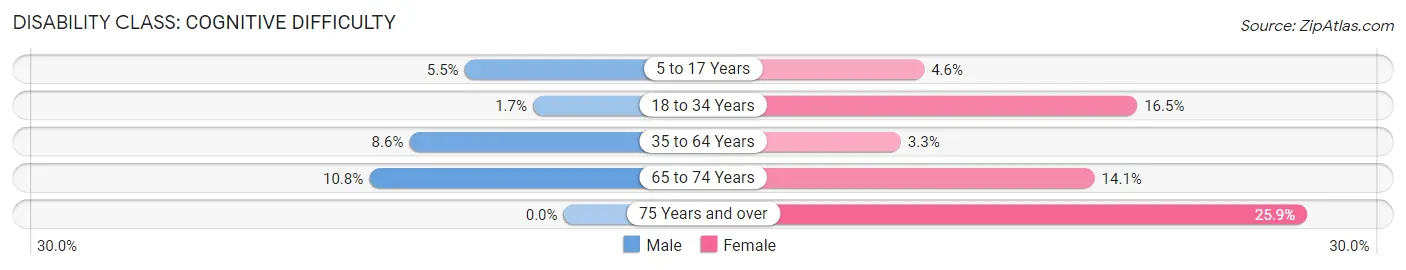
| Age Bracket | Male | Female |
| 5 to 17 Years | 64 (5.5%) | 41 (4.6%) |
| 18 to 34 Years | 20 (1.7%) | 186 (16.5%) |
| 35 to 64 Years | 152 (8.6%) | 61 (3.3%) |
| 65 to 74 Years | 29 (10.8%) | 58 (14.1%) |
| 75 Years and over | 0 (0.0%) | 85 (25.9%) |
Disability Class: Ambulatory Difficulty
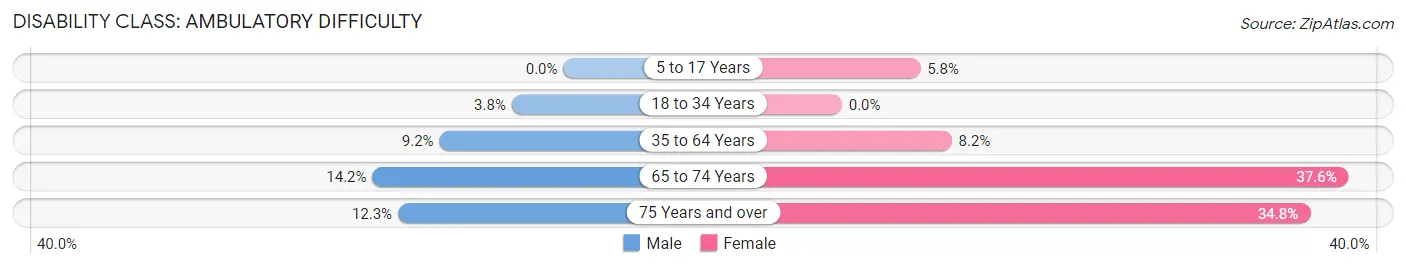
| Age Bracket | Male | Female |
| 5 to 17 Years | 0 (0.0%) | 52 (5.8%) |
| 18 to 34 Years | 45 (3.8%) | 0 (0.0%) |
| 35 to 64 Years | 163 (9.2%) | 151 (8.2%) |
| 65 to 74 Years | 38 (14.2%) | 155 (37.6%) |
| 75 Years and over | 21 (12.3%) | 114 (34.8%) |
Disability Class: Self-Care Difficulty
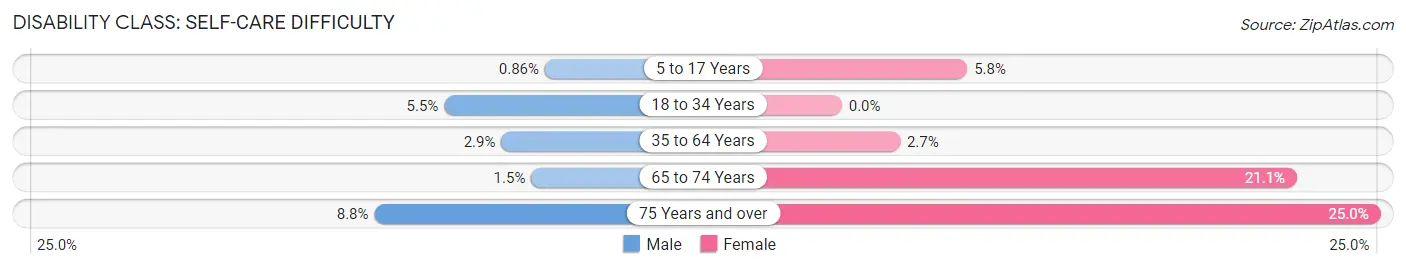
| Age Bracket | Male | Female |
| 5 to 17 Years | 10 (0.9%) | 52 (5.8%) |
| 18 to 34 Years | 65 (5.5%) | 0 (0.0%) |
| 35 to 64 Years | 51 (2.9%) | 50 (2.7%) |
| 65 to 74 Years | 4 (1.5%) | 87 (21.1%) |
| 75 Years and over | 15 (8.8%) | 82 (25.0%) |
Technology Access in La Grange
Computing Device Access in La Grange
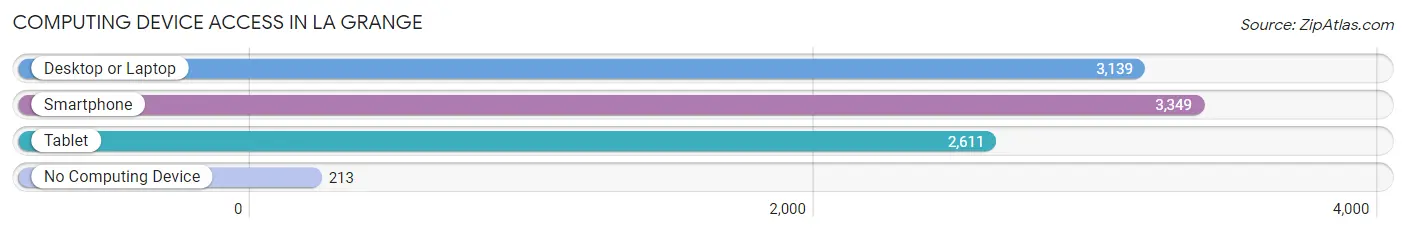
| Device Type | # Households | % Households |
| Desktop or Laptop | 3,139 | 85.2% |
| Smartphone | 3,349 | 90.9% |
| Tablet | 2,611 | 70.9% |
| No Computing Device | 213 | 5.8% |
| Total | 3,684 | 100.0% |
Internet Access in La Grange
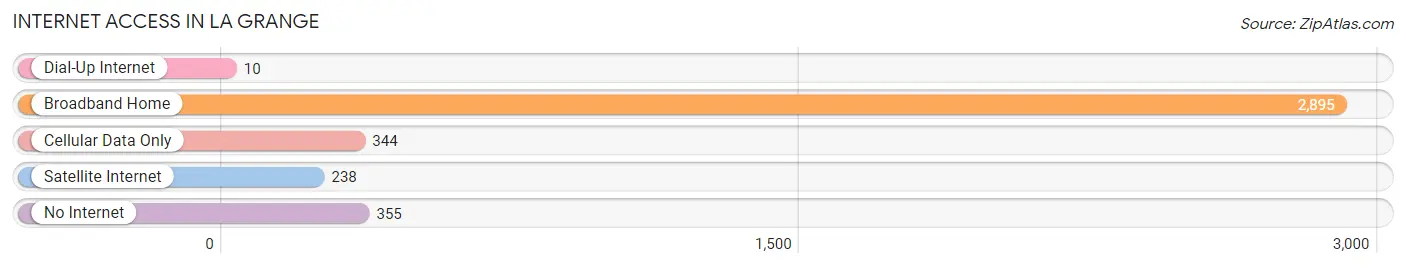
| Internet Type | # Households | % Households |
| Dial-Up Internet | 10 | 0.3% |
| Broadband Home | 2,895 | 78.6% |
| Cellular Data Only | 344 | 9.3% |
| Satellite Internet | 238 | 6.5% |
| No Internet | 355 | 9.6% |
| Total | 3,684 | 100.0% |
La Grange Summary
La Grange, Kentucky is a small city located in Oldham County, Kentucky, United States. It is situated on the banks of the Ohio River, approximately 25 miles northeast of Louisville. The city has a population of 8,082 as of the 2010 census, making it the largest city in Oldham County.
History
La Grange was founded in 1827 by Colonel William A. Bullitt, a prominent Kentucky lawyer and politician. Bullitt named the city after the French estate of the same name, which was owned by his friend, the Marquis de Lafayette. The city was incorporated in 1837 and quickly became a popular destination for travelers and settlers.
The city was a major stop on the Louisville and Nashville Railroad, which connected Louisville to Nashville, Tennessee. This allowed La Grange to become a major trading center for the region. The city was also home to several large manufacturing plants, including a cotton mill, a paper mill, and a tobacco factory.
In the late 19th century, La Grange was a popular destination for wealthy Louisville residents, who built large summer homes in the city. This led to the development of several upscale neighborhoods, such as the historic Prospect Hill neighborhood.
Geography
La Grange is located in Oldham County, Kentucky, approximately 25 miles northeast of Louisville. The city is situated on the banks of the Ohio River, and is surrounded by rolling hills and farmland. The city has a total area of 4.2 square miles, all of which is land.
The climate in La Grange is humid subtropical, with hot, humid summers and mild winters. The average annual temperature is 61 degrees Fahrenheit, and the average annual precipitation is 44 inches.
Economy
The economy of La Grange is largely based on manufacturing and agriculture. The city is home to several large manufacturing plants, including a cotton mill, a paper mill, and a tobacco factory. The city is also home to several large agricultural operations, including dairy farms, cattle farms, and vegetable farms.
The city is also home to several retail stores, restaurants, and other businesses. The city is served by the Louisville International Airport, which is located approximately 25 miles away.
Demographics
As of the 2010 census, La Grange had a population of 8,082. The racial makeup of the city was 87.3% White, 8.2% African American, 0.4% Native American, 0.7% Asian, 0.1% Pacific Islander, 1.2% from other races, and 2.1% from two or more races. Hispanic or Latino of any race were 3.2% of the population.
The median income for a household in La Grange was $50,945, and the median income for a family was $60,945. The per capita income for the city was $25,945. About 8.2% of families and 10.2% of the population were below the poverty line, including 14.2% of those under age 18 and 8.2% of those age 65 or over.
Common Questions
What is Per Capita Income in La Grange?
Per Capita income in La Grange is $33,588.
What is the Median Family Income in La Grange?
Median Family Income in La Grange is $92,800.
What is the Median Household income in La Grange?
Median Household Income in La Grange is $72,265.
What is Income or Wage Gap in La Grange?
Income or Wage Gap in La Grange is 29.2%.
Women in La Grange earn 70.8 cents for every dollar earned by a man.
What is Inequality or Gini Index in La Grange?
Inequality or Gini Index in La Grange is 0.39.
What is the Total Population of La Grange?
Total Population of La Grange is 10,073.
What is the Total Male Population of La Grange?
Total Male Population of La Grange is 5,097.
What is the Total Female Population of La Grange?
Total Female Population of La Grange is 4,976.
What is the Ratio of Males per 100 Females in La Grange?
There are 102.43 Males per 100 Females in La Grange.
What is the Ratio of Females per 100 Males in La Grange?
There are 97.63 Females per 100 Males in La Grange.
What is the Median Population Age in La Grange?
Median Population Age in La Grange is 34.8 Years.
What is the Average Family Size in La Grange
Average Family Size in La Grange is 3.1 People.
What is the Average Household Size in La Grange
Average Household Size in La Grange is 2.7 People.
How Large is the Labor Force in La Grange?
There are 5,381 People in the Labor Forcein in La Grange.
What is the Percentage of People in the Labor Force in La Grange?
70.3% of People are in the Labor Force in La Grange.
What is the Unemployment Rate in La Grange?
Unemployment Rate in La Grange is 4.7%.