Claryville, KY Map & Demographics
Claryville Map
Claryville Overview
$34,441
PER CAPITA INCOME
$97,112
AVG FAMILY INCOME
$95,127
AVG HOUSEHOLD INCOME
37.7%
WAGE / INCOME GAP [ % ]
62.3¢/ $1
WAGE / INCOME GAP [ $ ]
0.36
INEQUALITY / GINI INDEX
3,364
TOTAL POPULATION
1,618
MALE POPULATION
1,746
FEMALE POPULATION
92.67
MALES / 100 FEMALES
107.91
FEMALES / 100 MALES
37.4
MEDIAN AGE
3.0
AVG FAMILY SIZE
2.6
AVG HOUSEHOLD SIZE
1,537
LABOR FORCE [ PEOPLE ]
63.5%
PERCENT IN LABOR FORCE
2.9%
UNEMPLOYMENT RATE
Income in Claryville
Income Overview in Claryville
Per Capita Income in Claryville is $34,441, while median incomes of families and households are $97,112 and $95,127 respectively.
| Characteristic | Number | Measure |
| Per Capita Income | 3,364 | $34,441 |
| Median Family Income | 917 | $97,112 |
| Mean Family Income | 917 | $106,021 |
| Median Household Income | 1,312 | $95,127 |
| Mean Household Income | 1,312 | $93,565 |
| Income Deficit | 917 | $0 |
| Wage / Income Gap (%) | 3,364 | 37.69% |
| Wage / Income Gap ($) | 3,364 | 62.31¢ per $1 |
| Gini / Inequality Index | 3,364 | 0.36 |
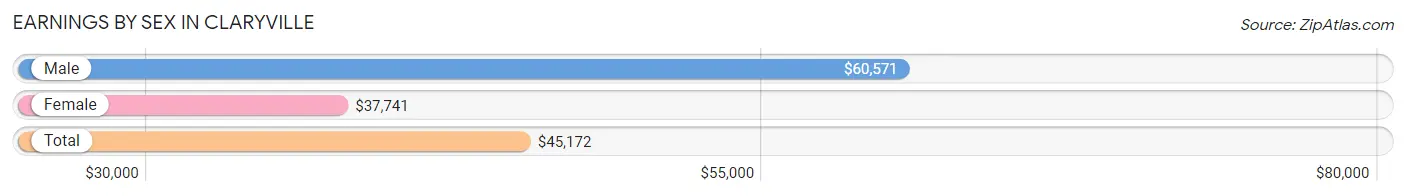
Earnings by Sex in Claryville
Average Earnings in Claryville are $45,172, $60,571 for men and $37,741 for women, a difference of 37.7%.
| Sex | Number | Average Earnings |
| Male | 871 (51.8%) | $60,571 |
| Female | 811 (48.2%) | $37,741 |
| Total | 1,682 (100.0%) | $45,172 |
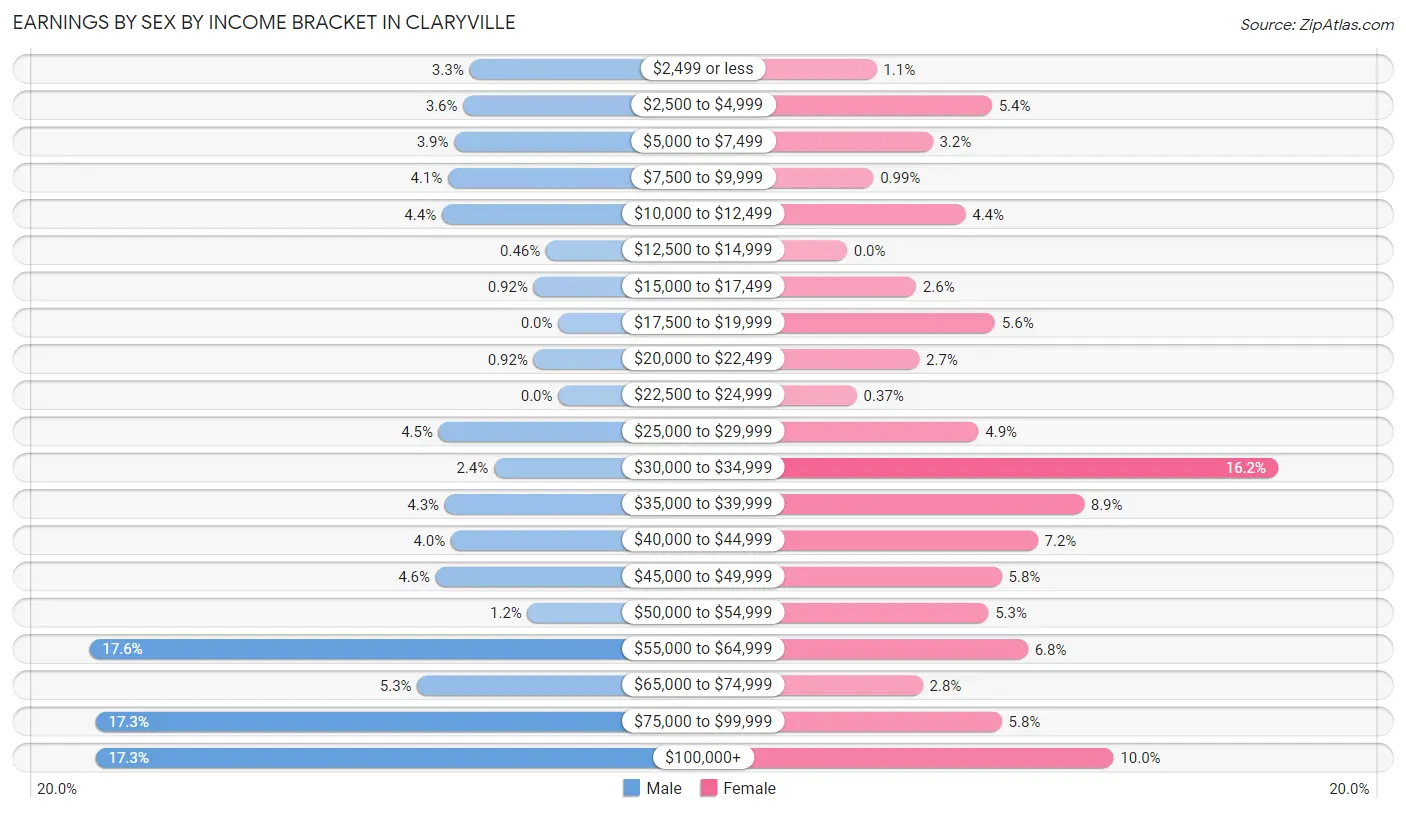
Earnings by Sex by Income Bracket in Claryville
The most common earnings brackets in Claryville are $55,000 to $64,999 for men (153 | 17.6%) and $30,000 to $34,999 for women (131 | 16.2%).
| Income | Male | Female |
| $2,499 or less | 29 (3.3%) | 9 (1.1%) |
| $2,500 to $4,999 | 31 (3.6%) | 44 (5.4%) |
| $5,000 to $7,499 | 34 (3.9%) | 26 (3.2%) |
| $7,500 to $9,999 | 36 (4.1%) | 8 (1.0%) |
| $10,000 to $12,499 | 38 (4.4%) | 36 (4.4%) |
| $12,500 to $14,999 | 4 (0.5%) | 0 (0.0%) |
| $15,000 to $17,499 | 8 (0.9%) | 21 (2.6%) |
| $17,500 to $19,999 | 0 (0.0%) | 45 (5.6%) |
| $20,000 to $22,499 | 8 (0.9%) | 22 (2.7%) |
| $22,500 to $24,999 | 0 (0.0%) | 3 (0.4%) |
| $25,000 to $29,999 | 39 (4.5%) | 40 (4.9%) |
| $30,000 to $34,999 | 21 (2.4%) | 131 (16.2%) |
| $35,000 to $39,999 | 37 (4.3%) | 72 (8.9%) |
| $40,000 to $44,999 | 35 (4.0%) | 58 (7.1%) |
| $45,000 to $49,999 | 40 (4.6%) | 47 (5.8%) |
| $50,000 to $54,999 | 10 (1.1%) | 43 (5.3%) |
| $55,000 to $64,999 | 153 (17.6%) | 55 (6.8%) |
| $65,000 to $74,999 | 46 (5.3%) | 23 (2.8%) |
| $75,000 to $99,999 | 151 (17.3%) | 47 (5.8%) |
| $100,000+ | 151 (17.3%) | 81 (10.0%) |
| Total | 871 (100.0%) | 811 (100.0%) |
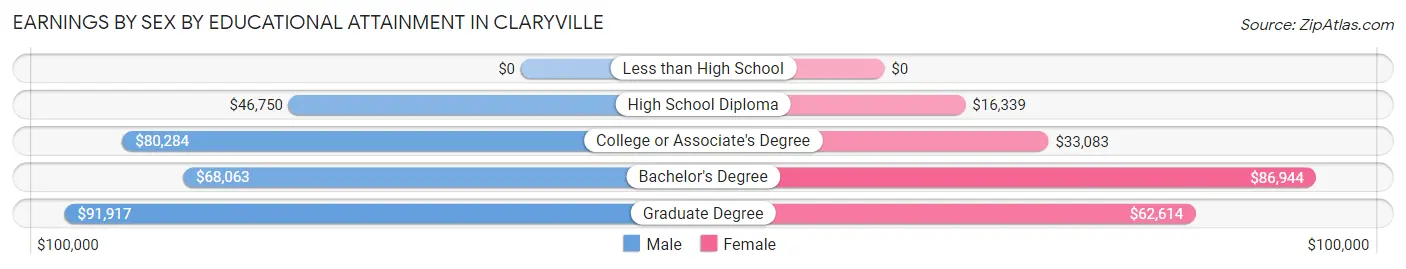
Earnings by Sex by Educational Attainment in Claryville
Average earnings in Claryville are $62,500 for men and $39,737 for women, a difference of 36.4%. Men with an educational attainment of graduate degree enjoy the highest average annual earnings of $91,917, while those with high school diploma education earn the least with $46,750. Women with an educational attainment of bachelor's degree earn the most with the average annual earnings of $86,944, while those with high school diploma education have the smallest earnings of $16,339.
| Educational Attainment | Male Income | Female Income |
| Less than High School | - | - |
| High School Diploma | $46,750 | $16,339 |
| College or Associate's Degree | $80,284 | $33,083 |
| Bachelor's Degree | $68,063 | $86,944 |
| Graduate Degree | $91,917 | $62,614 |
| Total | $62,500 | $39,737 |
Family Income in Claryville
Family Income Brackets in Claryville
According to the Claryville family income data, there are 220 families falling into the $100,000 to $149,999 income range, which is the most common income bracket and makes up 24.0% of all families. Conversely, the less than $10,000 income bracket is the least frequent group with only 7 families (0.8%) belonging to this category.
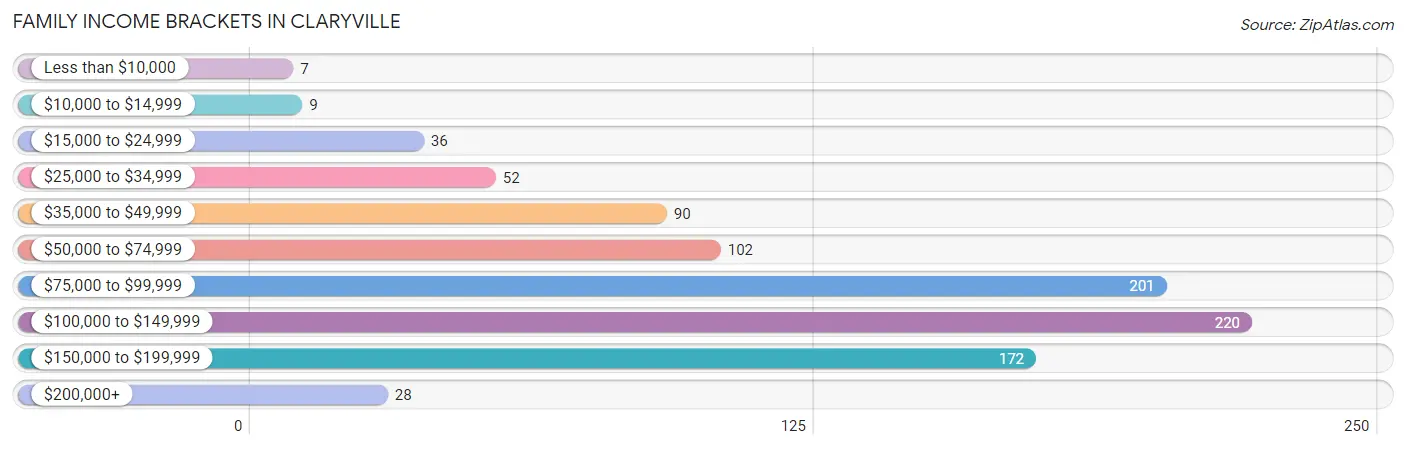
| Income Bracket | # Families | % Families |
| Less than $10,000 | 7 | 0.8% |
| $10,000 to $14,999 | 9 | 1.0% |
| $15,000 to $24,999 | 36 | 3.9% |
| $25,000 to $34,999 | 52 | 5.7% |
| $35,000 to $49,999 | 90 | 9.8% |
| $50,000 to $74,999 | 102 | 11.1% |
| $75,000 to $99,999 | 201 | 21.9% |
| $100,000 to $149,999 | 220 | 24.0% |
| $150,000 to $199,999 | 172 | 18.8% |
| $200,000+ | 28 | 3.1% |
Family Income by Famaliy Size in Claryville
5-person families (128 | 14.0%) account for the highest median family income in Claryville with $175,385 per family, while 5-person families (128 | 14.0%) have the highest median income of $35,077 per family member.
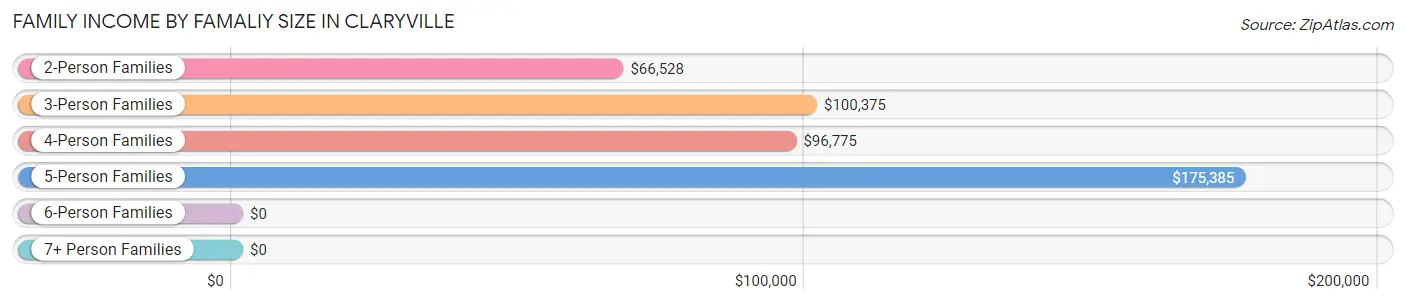
| Income Bracket | # Families | Median Income |
| 2-Person Families | 289 (31.5%) | $66,528 |
| 3-Person Families | 243 (26.5%) | $100,375 |
| 4-Person Families | 257 (28.0%) | $96,775 |
| 5-Person Families | 128 (14.0%) | $175,385 |
| 6-Person Families | 0 (0.0%) | $0 |
| 7+ Person Families | 0 (0.0%) | $0 |
| Total | 917 (100.0%) | $97,112 |
Family Income by Number of Earners in Claryville
The median family income in Claryville is $97,112, with families comprising 3+ earners (86) having the highest median family income of $161,429, while families with no earners (123) have the lowest median family income of $37,904, accounting for 9.4% and 13.4% of families, respectively.
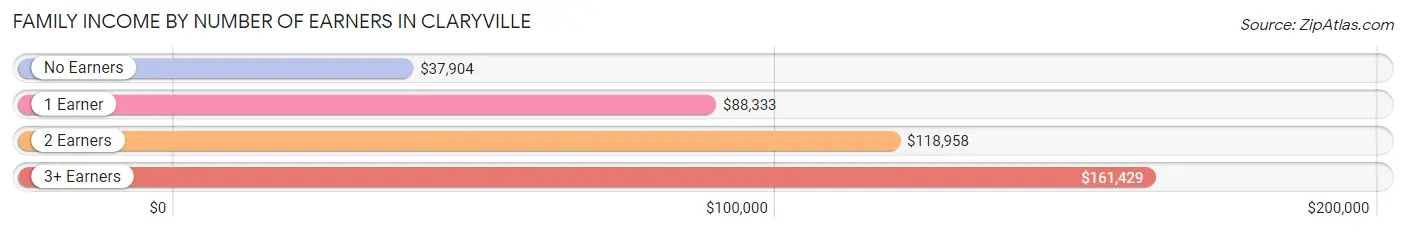
| Number of Earners | # Families | Median Income |
| No Earners | 123 (13.4%) | $37,904 |
| 1 Earner | 304 (33.2%) | $88,333 |
| 2 Earners | 404 (44.1%) | $118,958 |
| 3+ Earners | 86 (9.4%) | $161,429 |
| Total | 917 (100.0%) | $97,112 |
Household Income in Claryville
Household Income Brackets in Claryville
With 266 households falling in the category, the $100,000 to $149,999 income range is the most frequent in Claryville, accounting for 20.3% of all households.
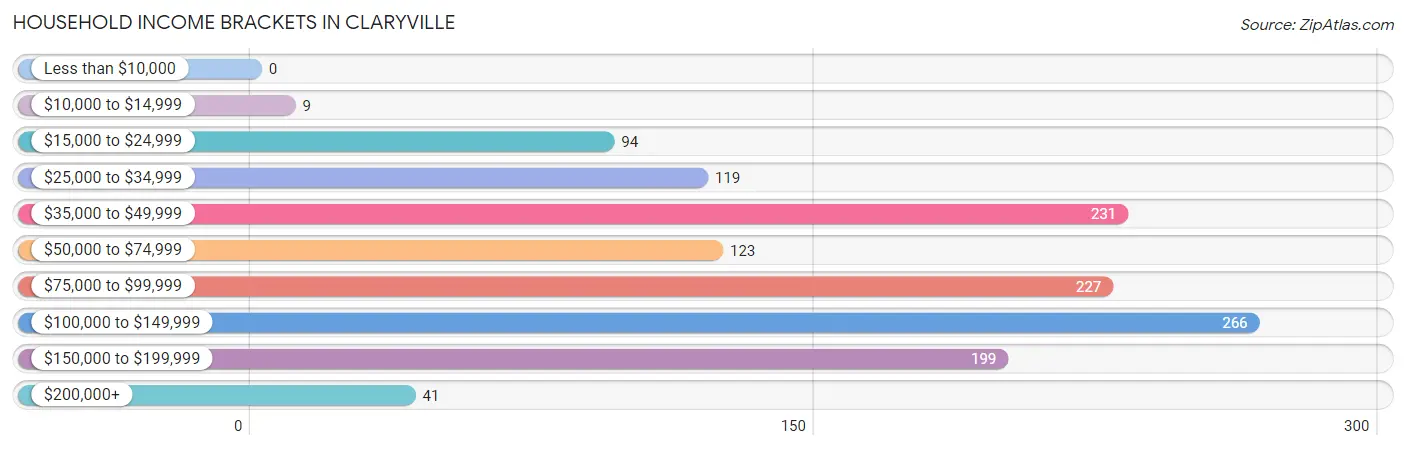
| Income Bracket | # Households | % Households |
| Less than $10,000 | 0 | 0.0% |
| $10,000 to $14,999 | 9 | 0.7% |
| $15,000 to $24,999 | 94 | 7.2% |
| $25,000 to $34,999 | 119 | 9.1% |
| $35,000 to $49,999 | 231 | 17.6% |
| $50,000 to $74,999 | 123 | 9.4% |
| $75,000 to $99,999 | 227 | 17.3% |
| $100,000 to $149,999 | 266 | 20.3% |
| $150,000 to $199,999 | 199 | 15.2% |
| $200,000+ | 41 | 3.1% |
Household Income by Householder Age in Claryville
The median household income in Claryville is $95,127, with the highest median household income of $104,917 found in the 25 to 44 years age bracket for the primary householder. A total of 363 households (27.7%) fall into this category. Meanwhile, the 15 to 24 years age bracket for the primary householder has the lowest median household income of $0, with 36 households (2.7%) in this group.
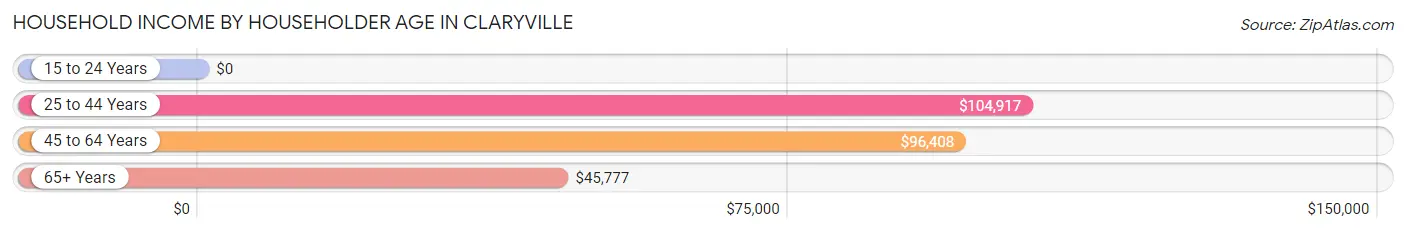
| Income Bracket | # Households | Median Income |
| 15 to 24 Years | 36 (2.7%) | $0 |
| 25 to 44 Years | 363 (27.7%) | $104,917 |
| 45 to 64 Years | 578 (44.1%) | $96,408 |
| 65+ Years | 335 (25.5%) | $45,777 |
| Total | 1,312 (100.0%) | $95,127 |
Poverty in Claryville
Income Below Poverty by Sex and Age in Claryville
With 4.0% poverty level for males and 2.5% for females among the residents of Claryville, 25 to 34 year old males and 16 and 17 year old females are the most vulnerable to poverty, with 30 males (18.5%) and 9 females (23.1%) in their respective age groups living below the poverty level.
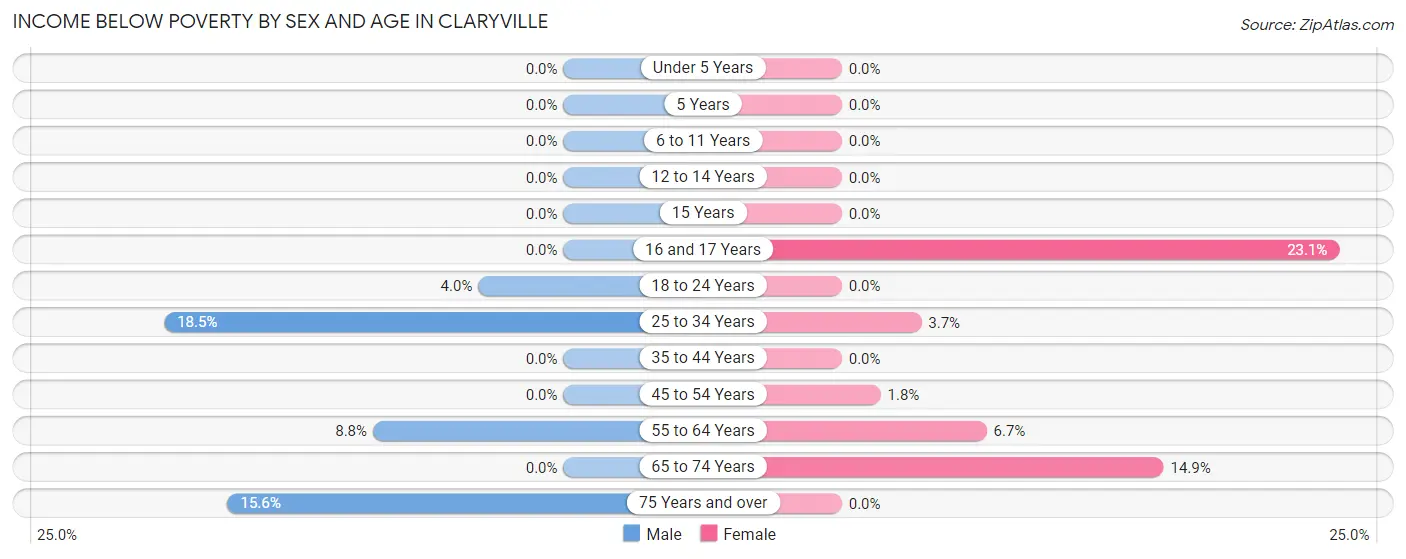
| Age Bracket | Male | Female |
| Under 5 Years | 0 (0.0%) | 0 (0.0%) |
| 5 Years | 0 (0.0%) | 0 (0.0%) |
| 6 to 11 Years | 0 (0.0%) | 0 (0.0%) |
| 12 to 14 Years | 0 (0.0%) | 0 (0.0%) |
| 15 Years | 0 (0.0%) | 0 (0.0%) |
| 16 and 17 Years | 0 (0.0%) | 9 (23.1%) |
| 18 to 24 Years | 3 (4.0%) | 0 (0.0%) |
| 25 to 34 Years | 30 (18.5%) | 8 (3.7%) |
| 35 to 44 Years | 0 (0.0%) | 0 (0.0%) |
| 45 to 54 Years | 0 (0.0%) | 7 (1.8%) |
| 55 to 64 Years | 19 (8.8%) | 9 (6.7%) |
| 65 to 74 Years | 0 (0.0%) | 10 (14.9%) |
| 75 Years and over | 12 (15.6%) | 0 (0.0%) |
| Total | 64 (4.0%) | 43 (2.5%) |
Income Above Poverty by Sex and Age in Claryville
According to the poverty statistics in Claryville, males aged under 5 years and females aged under 5 years are the age groups that are most secure financially, with 100.0% of males and 100.0% of females in these age groups living above the poverty line.
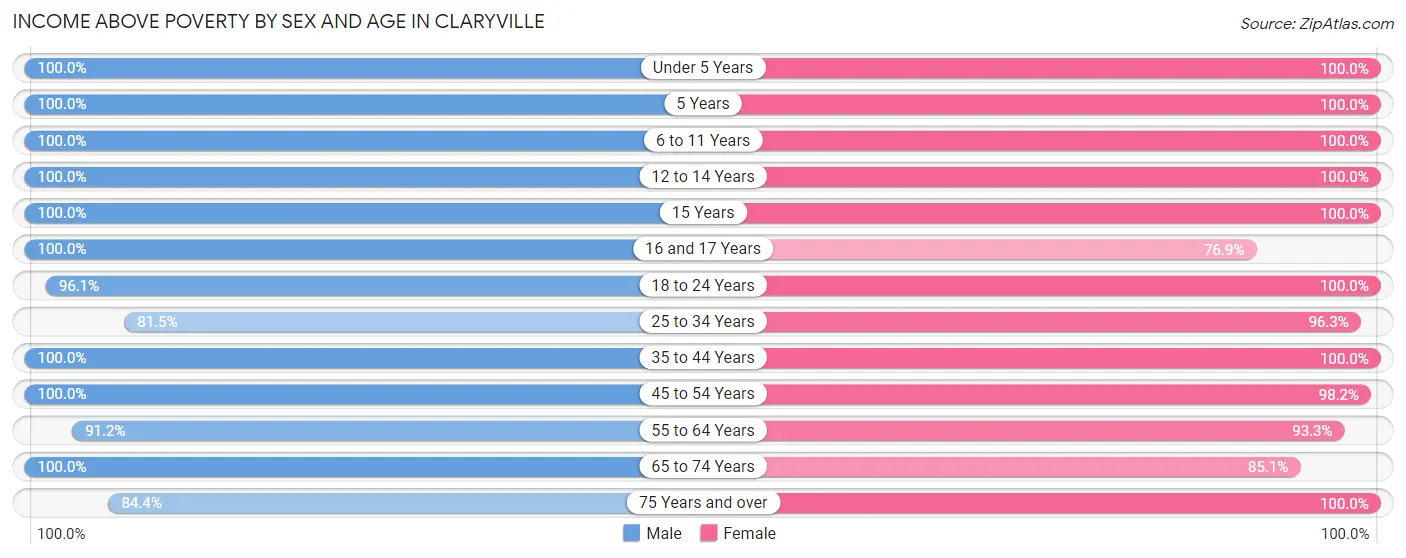
| Age Bracket | Male | Female |
| Under 5 Years | 82 (100.0%) | 286 (100.0%) |
| 5 Years | 31 (100.0%) | 31 (100.0%) |
| 6 to 11 Years | 159 (100.0%) | 142 (100.0%) |
| 12 to 14 Years | 107 (100.0%) | 34 (100.0%) |
| 15 Years | 32 (100.0%) | 29 (100.0%) |
| 16 and 17 Years | 23 (100.0%) | 30 (76.9%) |
| 18 to 24 Years | 73 (96.1%) | 66 (100.0%) |
| 25 to 34 Years | 132 (81.5%) | 209 (96.3%) |
| 35 to 44 Years | 199 (100.0%) | 197 (100.0%) |
| 45 to 54 Years | 234 (100.0%) | 381 (98.2%) |
| 55 to 64 Years | 196 (91.2%) | 125 (93.3%) |
| 65 to 74 Years | 211 (100.0%) | 57 (85.1%) |
| 75 Years and over | 65 (84.4%) | 116 (100.0%) |
| Total | 1,544 (96.0%) | 1,703 (97.5%) |
Income Below Poverty Among Married-Couple Families in Claryville
The poverty statistics for married-couple families in Claryville show that 1.6% or 10 of the total 643 families live below the poverty line. Families with no children have the highest poverty rate of 4.4%, comprising of 10 families. On the other hand, families with 1 or 2 children have the lowest poverty rate of 0.0%, which includes 0 families.
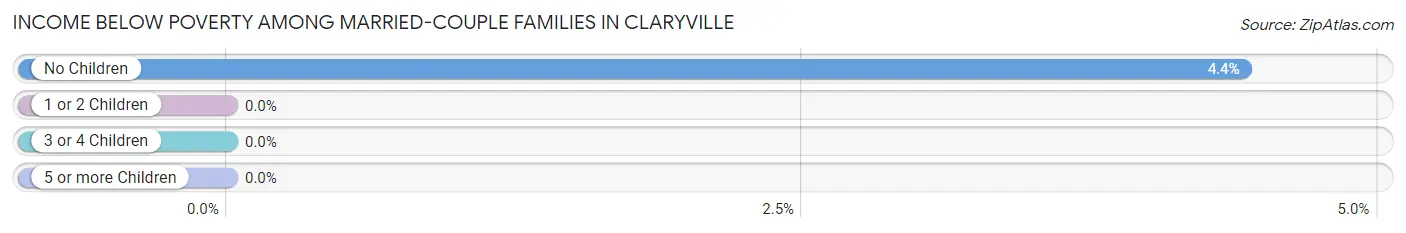
| Children | Above Poverty | Below Poverty |
| No Children | 217 (95.6%) | 10 (4.4%) |
| 1 or 2 Children | 311 (100.0%) | 0 (0.0%) |
| 3 or 4 Children | 105 (100.0%) | 0 (0.0%) |
| 5 or more Children | 0 (0.0%) | 0 (0.0%) |
| Total | 633 (98.4%) | 10 (1.6%) |
Income Below Poverty Among Single-Parent Households in Claryville
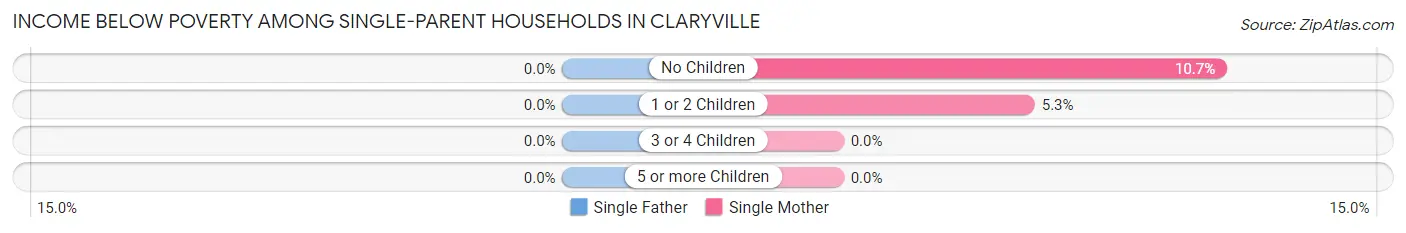
| Children | Single Father | Single Mother |
| No Children | 0 (0.0%) | 9 (10.7%) |
| 1 or 2 Children | 0 (0.0%) | 7 (5.3%) |
| 3 or 4 Children | 0 (0.0%) | 0 (0.0%) |
| 5 or more Children | 0 (0.0%) | 0 (0.0%) |
| Total | 0 (0.0%) | 16 (7.4%) |
Income Below Poverty Among Married-Couple vs Single-Parent Households in Claryville
The poverty data for Claryville shows that 10 of the married-couple family households (1.6%) and 16 of the single-parent households (5.8%) are living below the poverty level. Within the married-couple family households, those with no children have the highest poverty rate, with 10 households (4.4%) falling below the poverty line. Among the single-parent households, those with no children have the highest poverty rate, with 9 household (9.7%) living below poverty.
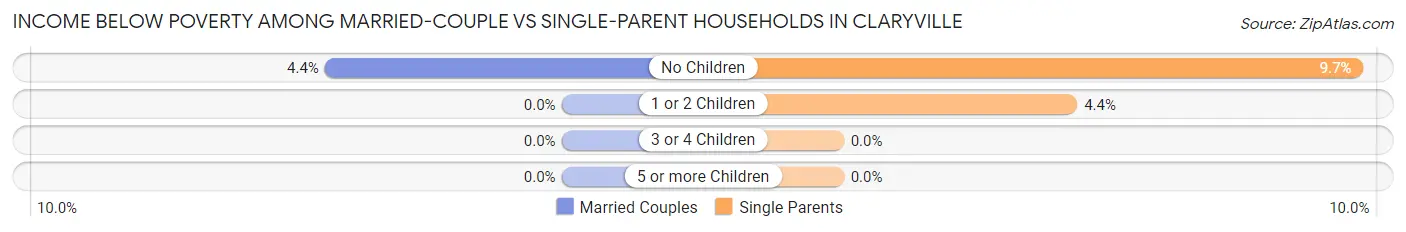
| Children | Married-Couple Families | Single-Parent Households |
| No Children | 10 (4.4%) | 9 (9.7%) |
| 1 or 2 Children | 0 (0.0%) | 7 (4.3%) |
| 3 or 4 Children | 0 (0.0%) | 0 (0.0%) |
| 5 or more Children | 0 (0.0%) | 0 (0.0%) |
| Total | 10 (1.6%) | 16 (5.8%) |
Race in Claryville
The most populous races in Claryville are White / Caucasian (3,297 | 98.0%), Hispanic or Latino (119 | 3.5%), and Two or more Races (46 | 1.4%).
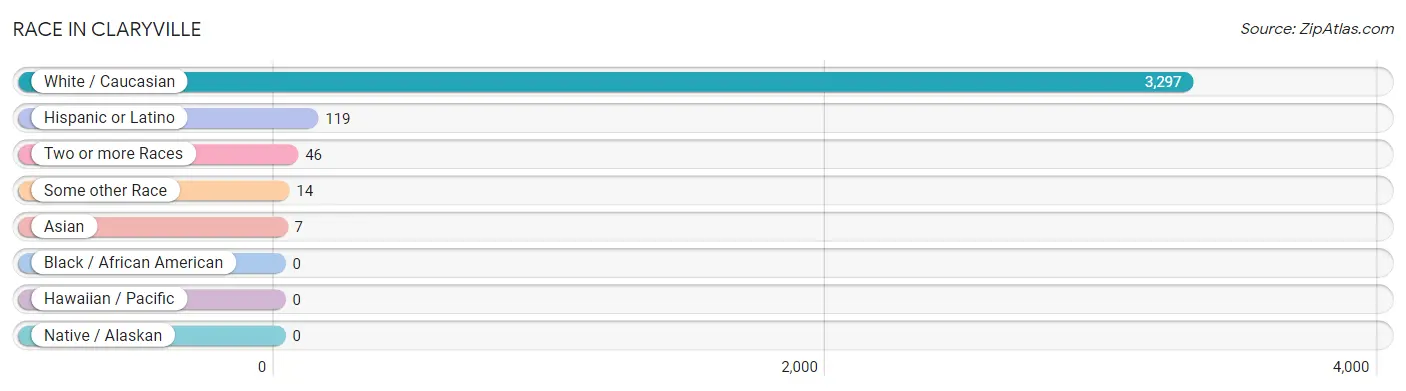
| Race | # Population | % Population |
| Asian | 7 | 0.2% |
| Black / African American | 0 | 0.0% |
| Hawaiian / Pacific | 0 | 0.0% |
| Hispanic or Latino | 119 | 3.5% |
| Native / Alaskan | 0 | 0.0% |
| White / Caucasian | 3,297 | 98.0% |
| Two or more Races | 46 | 1.4% |
| Some other Race | 14 | 0.4% |
| Total | 3,364 | 100.0% |
Ancestry in Claryville
The most populous ancestries reported in Claryville are German (1,599 | 47.5%), Italian (599 | 17.8%), English (566 | 16.8%), Irish (458 | 13.6%), and American (284 | 8.4%), together accounting for 104.2% of all Claryville residents.
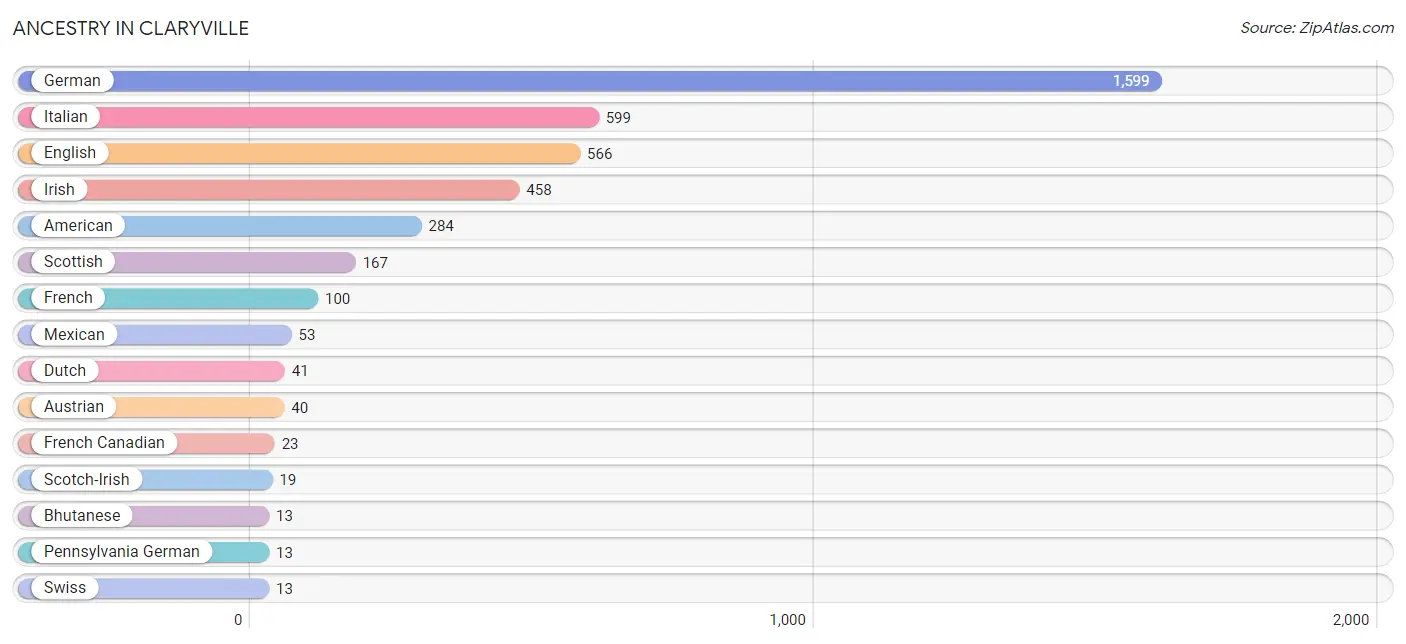
| Ancestry | # Population | % Population |
| American | 284 | 8.4% |
| Austrian | 40 | 1.2% |
| Bhutanese | 13 | 0.4% |
| Blackfeet | 6 | 0.2% |
| Cherokee | 3 | 0.1% |
| Creek | 4 | 0.1% |
| Dutch | 41 | 1.2% |
| Eastern European | 11 | 0.3% |
| English | 566 | 16.8% |
| European | 11 | 0.3% |
| French | 100 | 3.0% |
| French Canadian | 23 | 0.7% |
| German | 1,599 | 47.5% |
| Irish | 458 | 13.6% |
| Italian | 599 | 17.8% |
| Mexican | 53 | 1.6% |
| Norwegian | 6 | 0.2% |
| Pennsylvania German | 13 | 0.4% |
| Polish | 8 | 0.2% |
| Scandinavian | 7 | 0.2% |
| Scotch-Irish | 19 | 0.6% |
| Scottish | 167 | 5.0% |
| Sri Lankan | 8 | 0.2% |
| Swiss | 13 | 0.4% | View All 24 Rows |
Immigrants in Claryville

| Immigration Origin | # Population | % Population | View All 0 Rows |
Sex and Age in Claryville
Sex and Age in Claryville
The most populous age groups in Claryville are 10 to 14 Years (179 | 11.1%) for men and Under 5 Years (286 | 16.4%) for women.
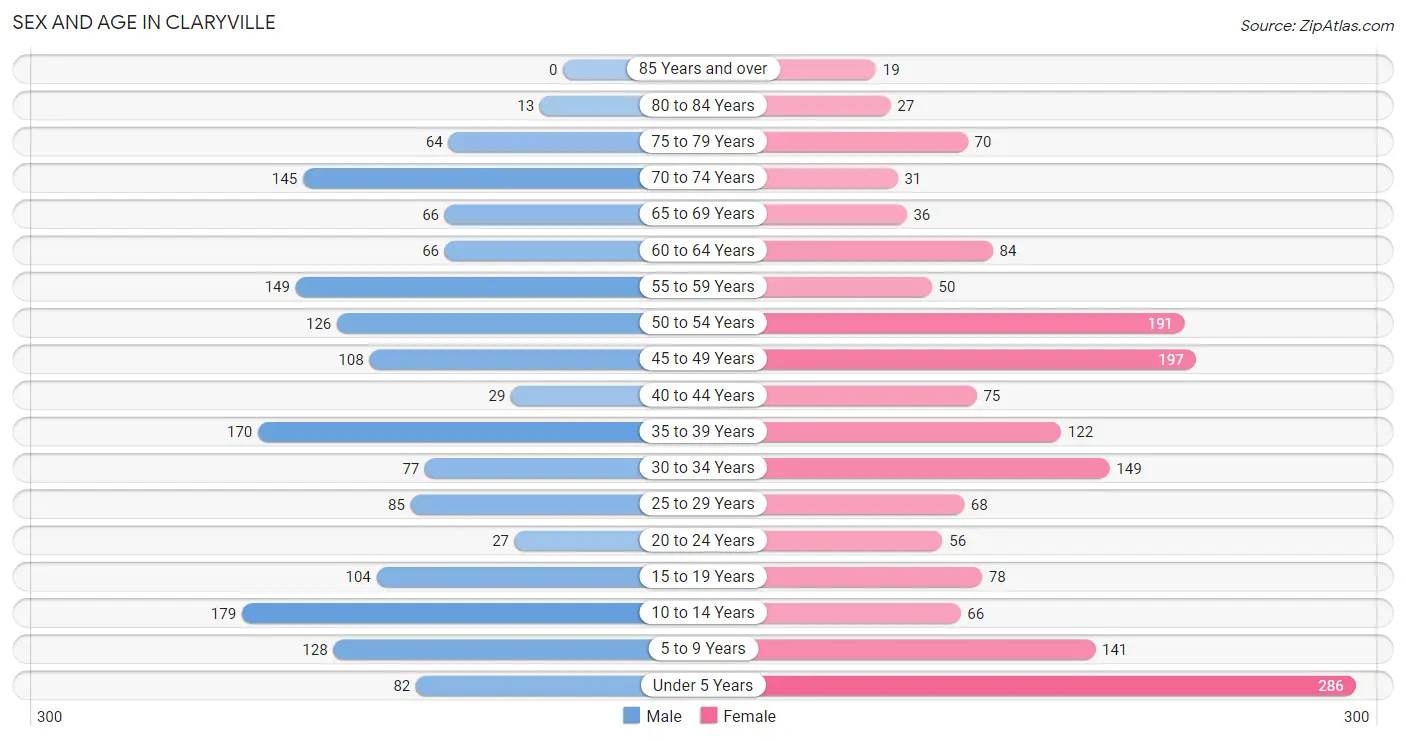
| Age Bracket | Male | Female |
| Under 5 Years | 82 (5.1%) | 286 (16.4%) |
| 5 to 9 Years | 128 (7.9%) | 141 (8.1%) |
| 10 to 14 Years | 179 (11.1%) | 66 (3.8%) |
| 15 to 19 Years | 104 (6.4%) | 78 (4.5%) |
| 20 to 24 Years | 27 (1.7%) | 56 (3.2%) |
| 25 to 29 Years | 85 (5.2%) | 68 (3.9%) |
| 30 to 34 Years | 77 (4.8%) | 149 (8.5%) |
| 35 to 39 Years | 170 (10.5%) | 122 (7.0%) |
| 40 to 44 Years | 29 (1.8%) | 75 (4.3%) |
| 45 to 49 Years | 108 (6.7%) | 197 (11.3%) |
| 50 to 54 Years | 126 (7.8%) | 191 (10.9%) |
| 55 to 59 Years | 149 (9.2%) | 50 (2.9%) |
| 60 to 64 Years | 66 (4.1%) | 84 (4.8%) |
| 65 to 69 Years | 66 (4.1%) | 36 (2.1%) |
| 70 to 74 Years | 145 (9.0%) | 31 (1.8%) |
| 75 to 79 Years | 64 (4.0%) | 70 (4.0%) |
| 80 to 84 Years | 13 (0.8%) | 27 (1.5%) |
| 85 Years and over | 0 (0.0%) | 19 (1.1%) |
| Total | 1,618 (100.0%) | 1,746 (100.0%) |
Families and Households in Claryville
Median Family Size in Claryville
The median family size in Claryville is 3.01 persons per family, with married-couple families (643 | 70.1%) accounting for the largest median family size of 3.21 persons per family. On the other hand, single male/father families (59 | 6.4%) represent the smallest median family size with 2.31 persons per family.
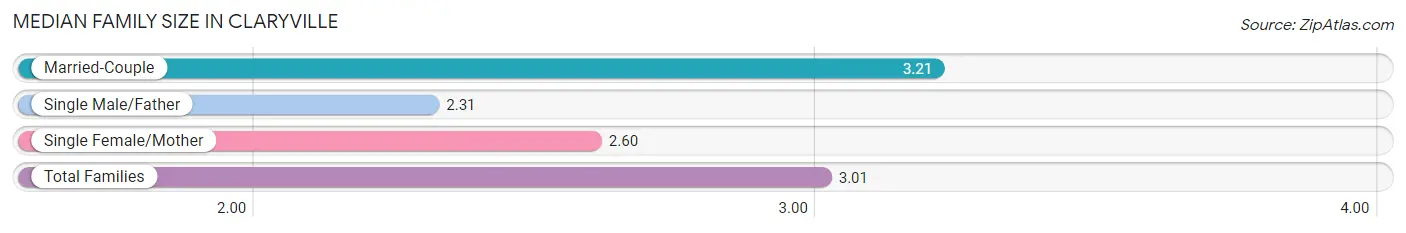
| Family Type | # Families | Family Size |
| Married-Couple | 643 (70.1%) | 3.21 |
| Single Male/Father | 59 (6.4%) | 2.31 |
| Single Female/Mother | 215 (23.4%) | 2.60 |
| Total Families | 917 (100.0%) | 3.01 |
Median Household Size in Claryville
The median household size in Claryville is 2.56 persons per household, with married-couple households (643 | 49.0%) accounting for the largest median household size of 3.22 persons per household. non-family households (395 | 30.1%) represent the smallest median household size with 1.29 persons per household.
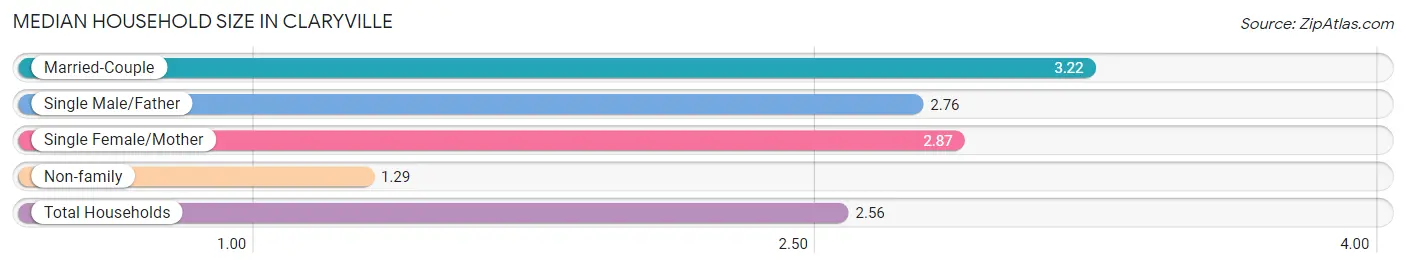
| Household Type | # Households | Household Size |
| Married-Couple | 643 (49.0%) | 3.22 |
| Single Male/Father | 59 (4.5%) | 2.76 |
| Single Female/Mother | 215 (16.4%) | 2.87 |
| Non-family | 395 (30.1%) | 1.29 |
| Total Households | 1,312 (100.0%) | 2.56 |
Household Size by Marriage Status in Claryville
Out of a total of 1,312 households in Claryville, 917 (69.9%) are family households, while 395 (30.1%) are nonfamily households. The most numerous type of family households are 3-person households, comprising 298, and the most common type of nonfamily households are 1-person households, comprising 291.
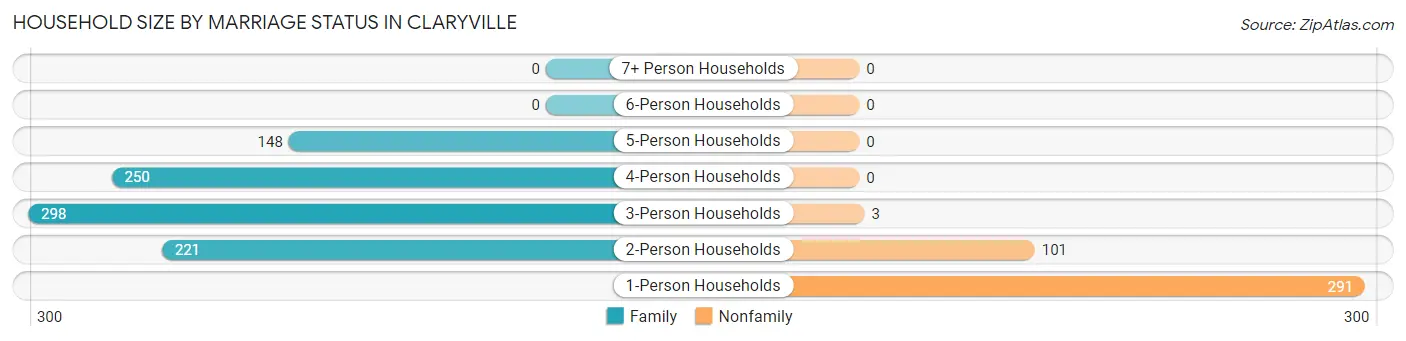
| Household Size | Family Households | Nonfamily Households |
| 1-Person Households | - | 291 (22.2%) |
| 2-Person Households | 221 (16.8%) | 101 (7.7%) |
| 3-Person Households | 298 (22.7%) | 3 (0.2%) |
| 4-Person Households | 250 (19.1%) | 0 (0.0%) |
| 5-Person Households | 148 (11.3%) | 0 (0.0%) |
| 6-Person Households | 0 (0.0%) | 0 (0.0%) |
| 7+ Person Households | 0 (0.0%) | 0 (0.0%) |
| Total | 917 (69.9%) | 395 (30.1%) |
Female Fertility in Claryville
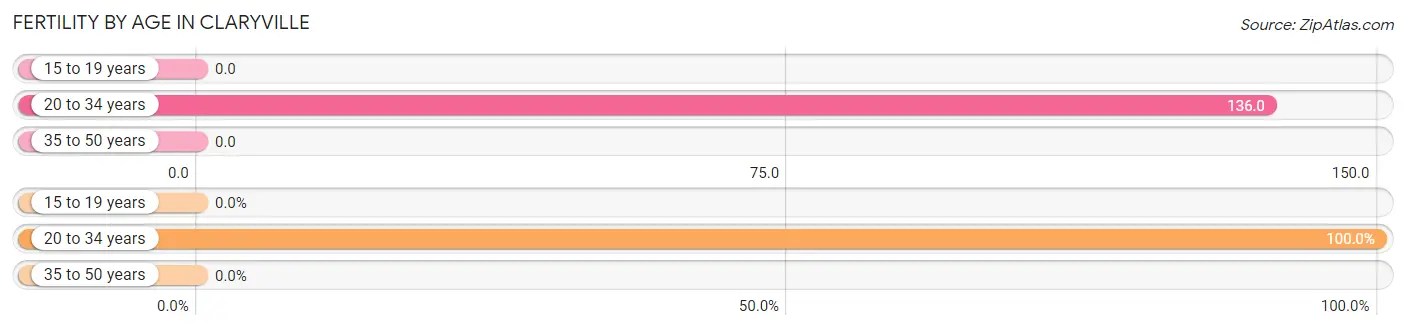
Fertility by Age in Claryville
Average fertility rate in Claryville is 46.0 births per 1,000 women. Women in the age bracket of 20 to 34 years have the highest fertility rate with 136.0 births per 1,000 women. Women in the age bracket of 20 to 34 years acount for 100.0% of all women with births.
| Age Bracket | Women with Births | Births / 1,000 Women |
| 15 to 19 years | 0 (0.0%) | 0.0 |
| 20 to 34 years | 37 (100.0%) | 136.0 |
| 35 to 50 years | 0 (0.0%) | 0.0 |
| Total | 37 (100.0%) | 46.0 |
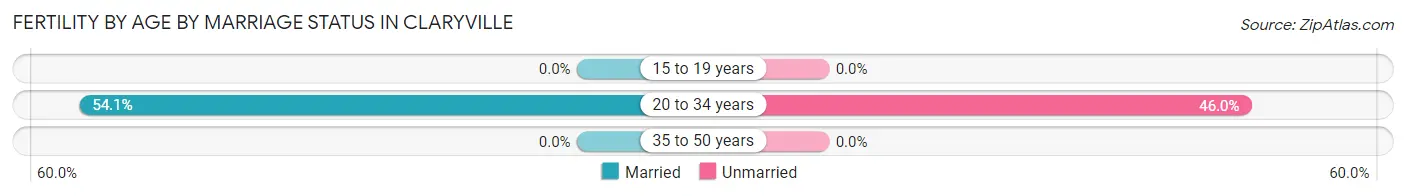
Fertility by Age by Marriage Status in Claryville
54.1% of women with births (37) in Claryville are married. The highest percentage of unmarried women with births falls into 20 to 34 years age bracket with 46.0% of them unmarried at the time of birth, while the lowest percentage of unmarried women with births belong to 20 to 34 years age bracket with 46.0% of them unmarried.
| Age Bracket | Married | Unmarried |
| 15 to 19 years | 0 (0.0%) | 0 (0.0%) |
| 20 to 34 years | 20 (54.0%) | 17 (46.0%) |
| 35 to 50 years | 0 (0.0%) | 0 (0.0%) |
| Total | 20 (54.0%) | 17 (46.0%) |
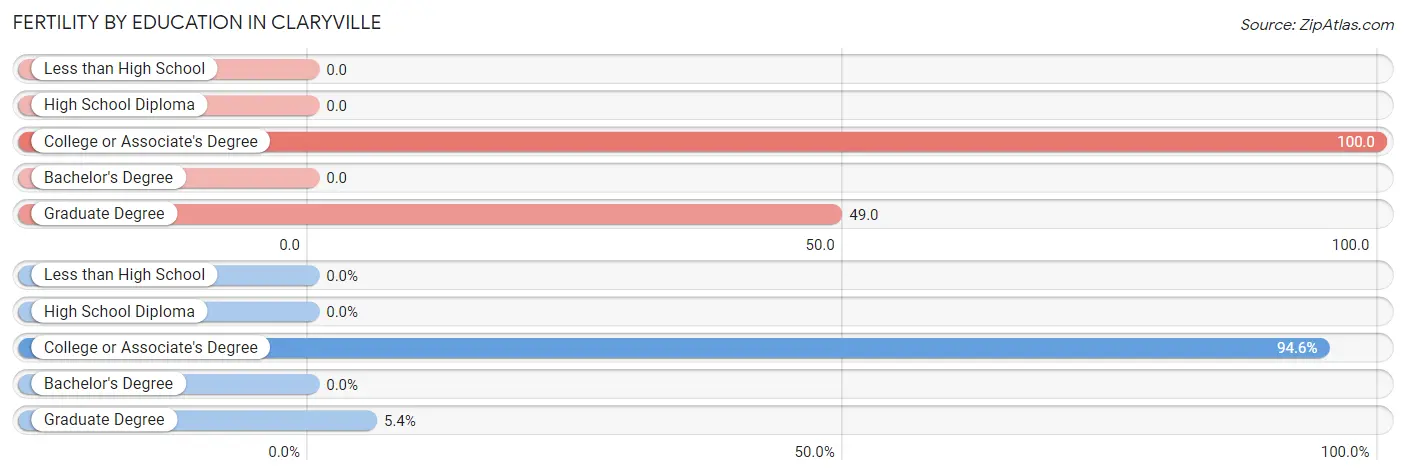
Fertility by Education in Claryville
| Educational Attainment | Women with Births | Births / 1,000 Women |
| Less than High School | 0 (0.0%) | 0.0 |
| High School Diploma | 0 (0.0%) | 0.0 |
| College or Associate's Degree | 35 (94.6%) | 100.0 |
| Bachelor's Degree | 0 (0.0%) | 0.0 |
| Graduate Degree | 2 (5.4%) | 49.0 |
| Total | 37 (100.0%) | 46.0 |
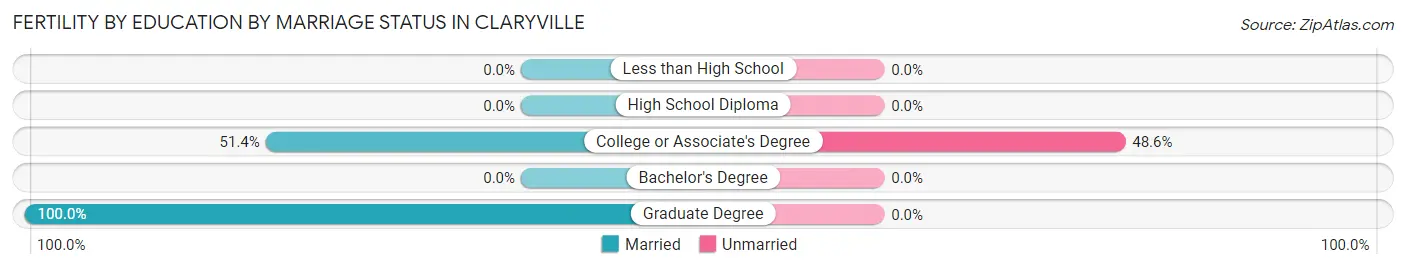
Fertility by Education by Marriage Status in Claryville
46.0% of women with births in Claryville are unmarried. Women with the educational attainment of graduate degree are most likely to be married with 100.0% of them married at childbirth, while women with the educational attainment of college or associate's degree are least likely to be married with 48.6% of them unmarried at childbirth.
| Educational Attainment | Married | Unmarried |
| Less than High School | 0 (0.0%) | 0 (0.0%) |
| High School Diploma | 0 (0.0%) | 0 (0.0%) |
| College or Associate's Degree | 18 (51.4%) | 17 (48.6%) |
| Bachelor's Degree | 0 (0.0%) | 0 (0.0%) |
| Graduate Degree | 2 (100.0%) | 0 (0.0%) |
| Total | 20 (54.0%) | 17 (46.0%) |
Employment Characteristics in Claryville
Employment by Class of Employer in Claryville
Among the 1,458 employed individuals in Claryville, private company employees (1,008 | 69.1%), local government employees (127 | 8.7%), and not-for-profit organizations (98 | 6.7%) make up the most common classes of employment.
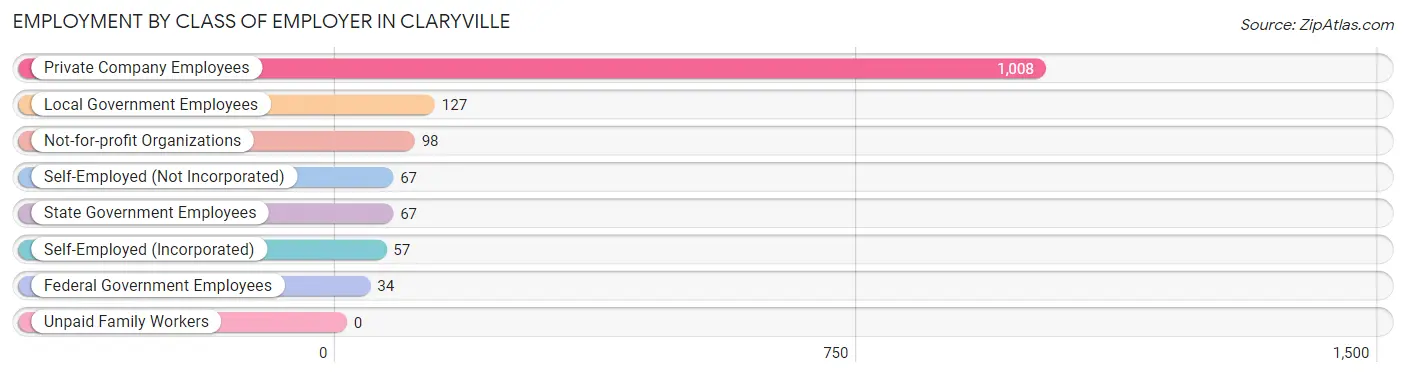
| Employer Class | # Employees | % Employees |
| Private Company Employees | 1,008 | 69.1% |
| Self-Employed (Incorporated) | 57 | 3.9% |
| Self-Employed (Not Incorporated) | 67 | 4.6% |
| Not-for-profit Organizations | 98 | 6.7% |
| Local Government Employees | 127 | 8.7% |
| State Government Employees | 67 | 4.6% |
| Federal Government Employees | 34 | 2.3% |
| Unpaid Family Workers | 0 | 0.0% |
| Total | 1,458 | 100.0% |
Employment Status by Age in Claryville
According to the labor force statistics for Claryville, out of the total population over 16 years of age (2,421), 63.5% or 1,537 individuals are in the labor force, with 2.9% or 45 of them unemployed. The age group with the highest labor force participation rate is 35 to 44 years, with 96.2% or 381 individuals in the labor force. Within the labor force, the 16 to 19 years age range has the highest percentage of unemployed individuals, with 16.7% or 9 of them being unemployed.
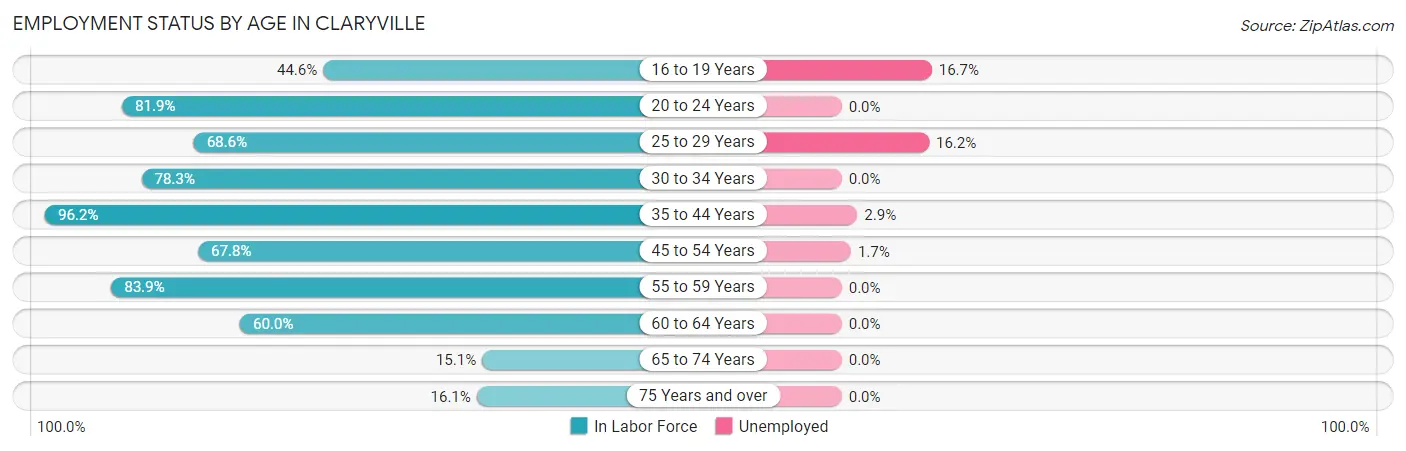
| Age Bracket | In Labor Force | Unemployed |
| 16 to 19 Years | 54 (44.6%) | 9 (16.7%) |
| 20 to 24 Years | 68 (81.9%) | 0 (0.0%) |
| 25 to 29 Years | 105 (68.6%) | 17 (16.2%) |
| 30 to 34 Years | 177 (78.3%) | 0 (0.0%) |
| 35 to 44 Years | 381 (96.2%) | 11 (2.9%) |
| 45 to 54 Years | 422 (67.8%) | 7 (1.7%) |
| 55 to 59 Years | 167 (83.9%) | 0 (0.0%) |
| 60 to 64 Years | 90 (60.0%) | 0 (0.0%) |
| 65 to 74 Years | 42 (15.1%) | 0 (0.0%) |
| 75 Years and over | 31 (16.1%) | 0 (0.0%) |
| Total | 1,537 (63.5%) | 45 (2.9%) |
Employment Status by Educational Attainment in Claryville
According to labor force statistics for Claryville, 76.9% of individuals (1,343) out of the total population between 25 and 64 years of age (1,746) are in the labor force, with 2.6% or 35 of them being unemployed. The group with the highest labor force participation rate are those with the educational attainment of college / associate degree, with 83.5% or 535 individuals in the labor force. Within the labor force, individuals with less than high school education have the highest percentage of unemployment, with 12.7% or 7 of them being unemployed.
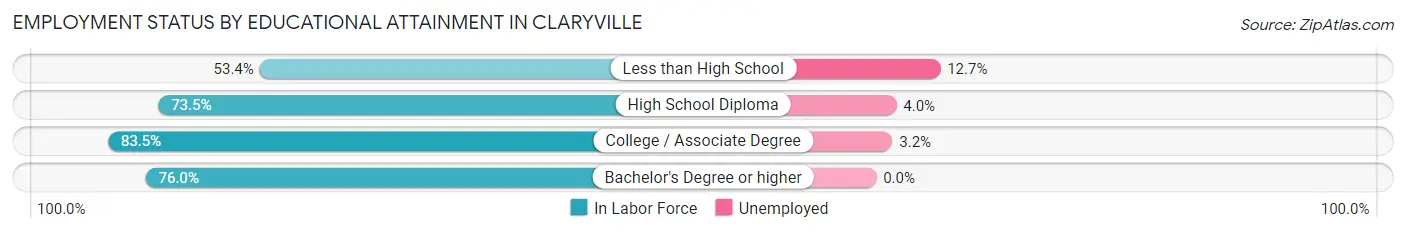
| Educational Attainment | In Labor Force | Unemployed |
| Less than High School | 55 (53.4%) | 13 (12.7%) |
| High School Diploma | 278 (73.5%) | 15 (4.0%) |
| College / Associate Degree | 535 (83.5%) | 21 (3.2%) |
| Bachelor's Degree or higher | 474 (76.0%) | 0 (0.0%) |
| Total | 1,343 (76.9%) | 45 (2.6%) |
Employment Occupations by Sex in Claryville
Management, Business, Science and Arts Occupations
The most common Management, Business, Science and Arts occupations in Claryville are Management (215 | 14.4%), Health Diagnosing & Treating (163 | 10.9%), Business & Financial (118 | 7.9%), Community & Social Service (102 | 6.8%), and Health Technologists (96 | 6.4%).
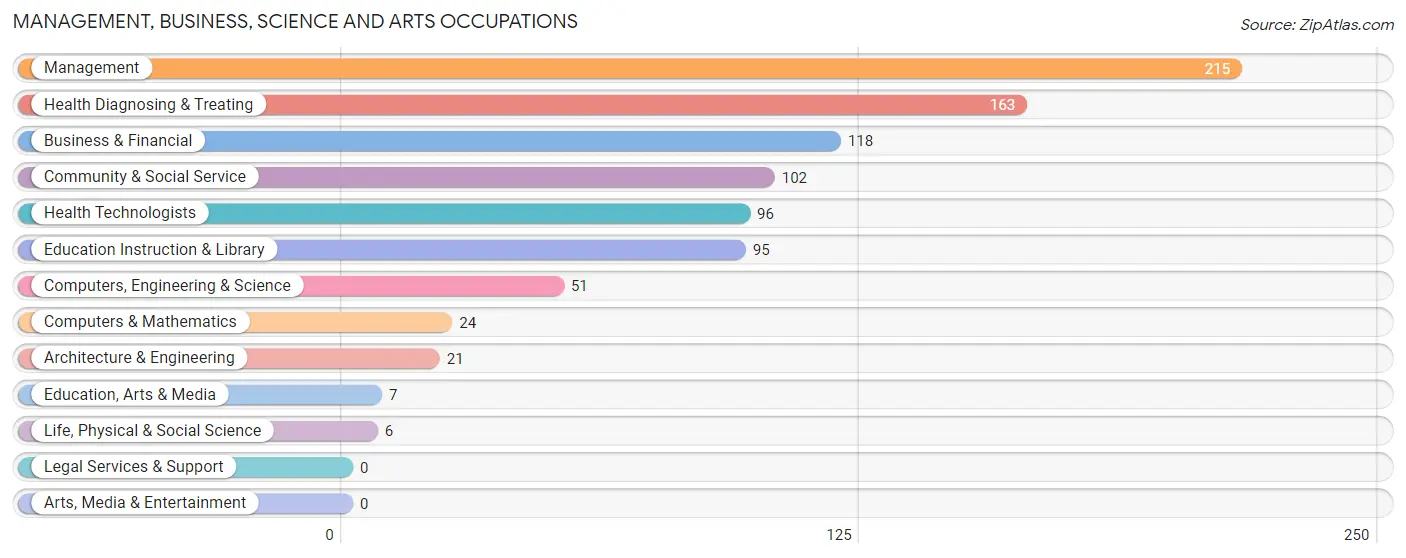
Management, Business, Science and Arts Occupations by Sex
Within the Management, Business, Science and Arts occupations in Claryville, the most male-oriented occupations are Computers & Mathematics (100.0%), Architecture & Engineering (100.0%), and Computers, Engineering & Science (88.2%), while the most female-oriented occupations are Life, Physical & Social Science (100.0%), Education, Arts & Media (100.0%), and Health Diagnosing & Treating (100.0%).
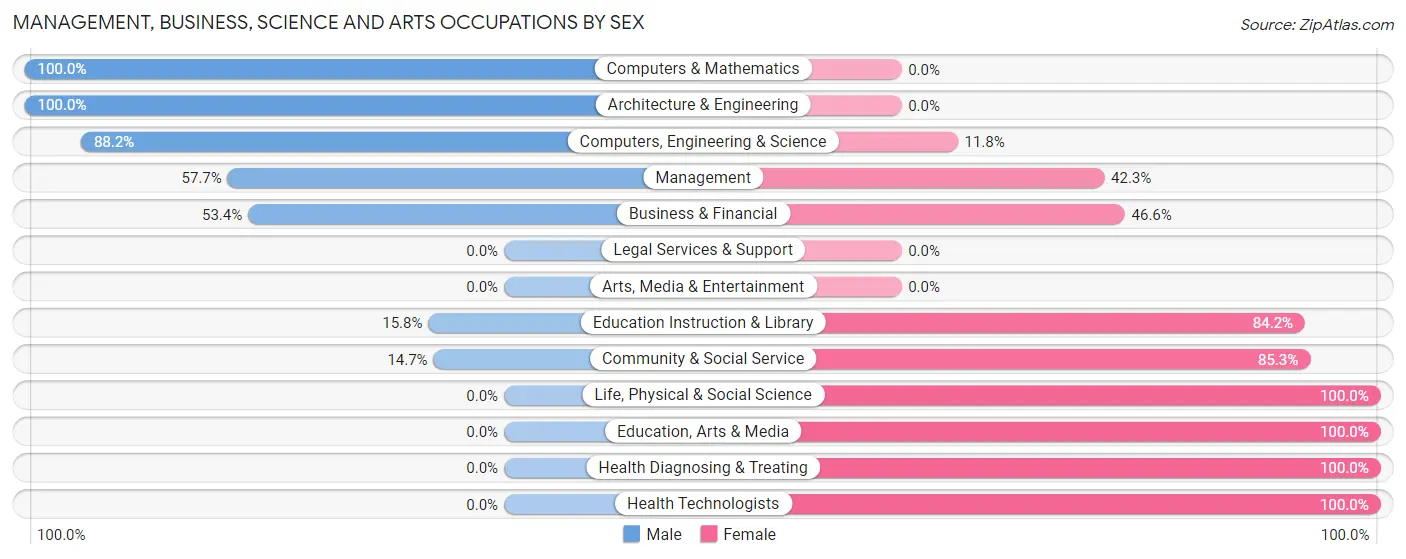
| Occupation | Male | Female |
| Management | 124 (57.7%) | 91 (42.3%) |
| Business & Financial | 63 (53.4%) | 55 (46.6%) |
| Computers, Engineering & Science | 45 (88.2%) | 6 (11.8%) |
| Computers & Mathematics | 24 (100.0%) | 0 (0.0%) |
| Architecture & Engineering | 21 (100.0%) | 0 (0.0%) |
| Life, Physical & Social Science | 0 (0.0%) | 6 (100.0%) |
| Community & Social Service | 15 (14.7%) | 87 (85.3%) |
| Education, Arts & Media | 0 (0.0%) | 7 (100.0%) |
| Legal Services & Support | 0 (0.0%) | 0 (0.0%) |
| Education Instruction & Library | 15 (15.8%) | 80 (84.2%) |
| Arts, Media & Entertainment | 0 (0.0%) | 0 (0.0%) |
| Health Diagnosing & Treating | 0 (0.0%) | 163 (100.0%) |
| Health Technologists | 0 (0.0%) | 96 (100.0%) |
| Total (Category) | 247 (38.1%) | 402 (61.9%) |
| Total (Overall) | 803 (53.8%) | 690 (46.2%) |
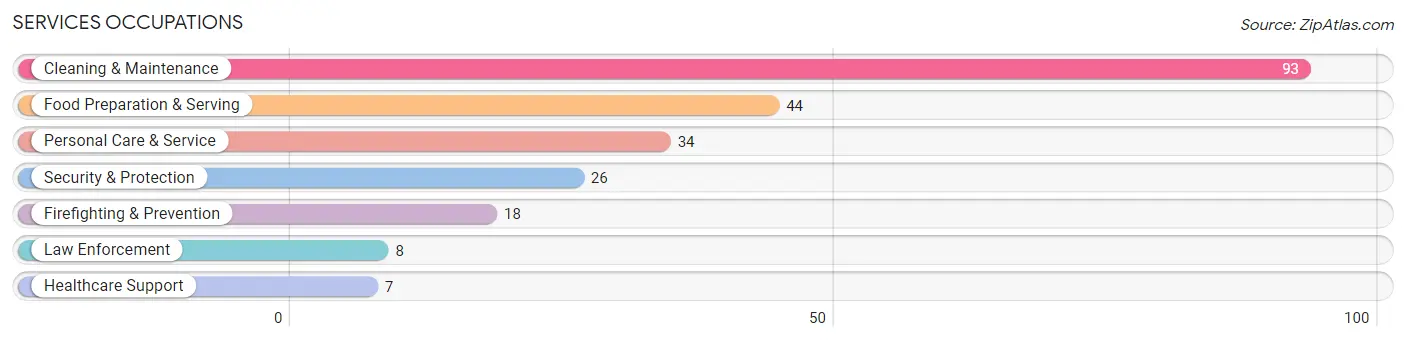
Services Occupations
The most common Services occupations in Claryville are Cleaning & Maintenance (93 | 6.2%), Food Preparation & Serving (44 | 2.9%), Personal Care & Service (34 | 2.3%), Security & Protection (26 | 1.7%), and Firefighting & Prevention (18 | 1.2%).
Services Occupations by Sex
Within the Services occupations in Claryville, the most male-oriented occupations are Law Enforcement (100.0%), Cleaning & Maintenance (81.7%), and Personal Care & Service (55.9%), while the most female-oriented occupations are Healthcare Support (100.0%), Firefighting & Prevention (100.0%), and Security & Protection (69.2%).
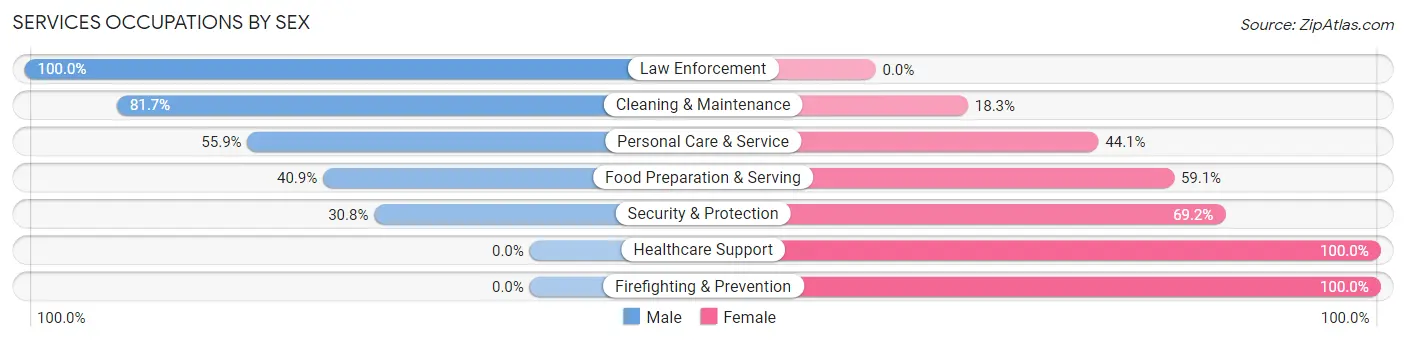
| Occupation | Male | Female |
| Healthcare Support | 0 (0.0%) | 7 (100.0%) |
| Security & Protection | 8 (30.8%) | 18 (69.2%) |
| Firefighting & Prevention | 0 (0.0%) | 18 (100.0%) |
| Law Enforcement | 8 (100.0%) | 0 (0.0%) |
| Food Preparation & Serving | 18 (40.9%) | 26 (59.1%) |
| Cleaning & Maintenance | 76 (81.7%) | 17 (18.3%) |
| Personal Care & Service | 19 (55.9%) | 15 (44.1%) |
| Total (Category) | 121 (59.3%) | 83 (40.7%) |
| Total (Overall) | 803 (53.8%) | 690 (46.2%) |
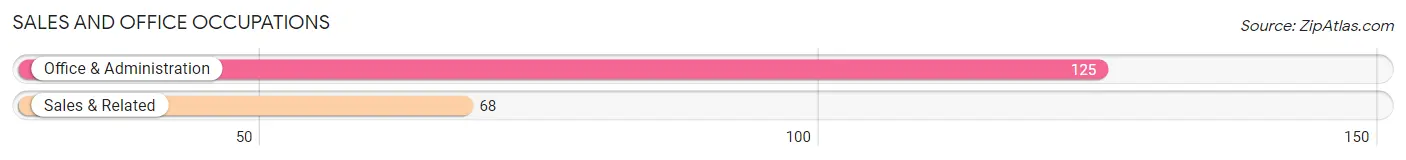
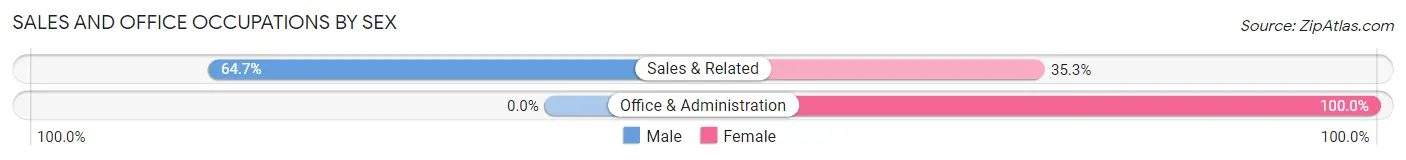
Sales and Office Occupations
The most common Sales and Office occupations in Claryville are Office & Administration (125 | 8.4%), and Sales & Related (68 | 4.5%).
Sales and Office Occupations by Sex
| Occupation | Male | Female |
| Sales & Related | 44 (64.7%) | 24 (35.3%) |
| Office & Administration | 0 (0.0%) | 125 (100.0%) |
| Total (Category) | 44 (22.8%) | 149 (77.2%) |
| Total (Overall) | 803 (53.8%) | 690 (46.2%) |
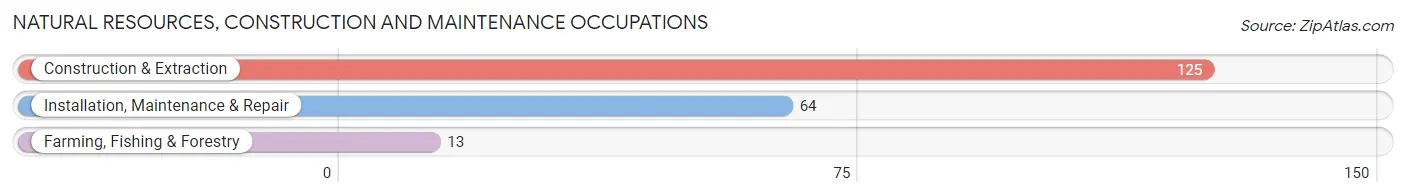
Natural Resources, Construction and Maintenance Occupations
The most common Natural Resources, Construction and Maintenance occupations in Claryville are Construction & Extraction (125 | 8.4%), Installation, Maintenance & Repair (64 | 4.3%), and Farming, Fishing & Forestry (13 | 0.9%).
Natural Resources, Construction and Maintenance Occupations by Sex
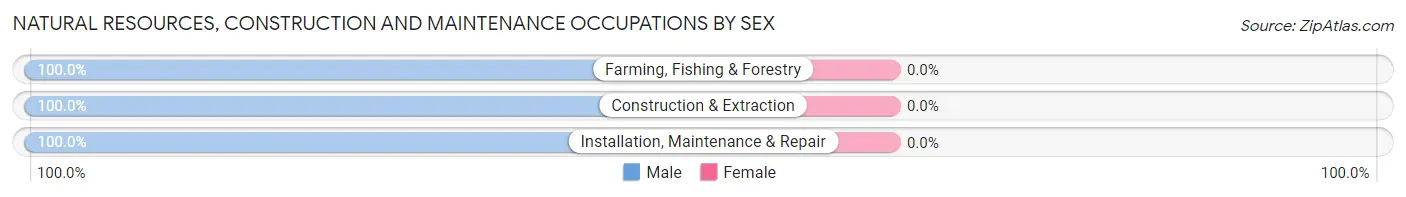
| Occupation | Male | Female |
| Farming, Fishing & Forestry | 13 (100.0%) | 0 (0.0%) |
| Construction & Extraction | 125 (100.0%) | 0 (0.0%) |
| Installation, Maintenance & Repair | 64 (100.0%) | 0 (0.0%) |
| Total (Category) | 202 (100.0%) | 0 (0.0%) |
| Total (Overall) | 803 (53.8%) | 690 (46.2%) |
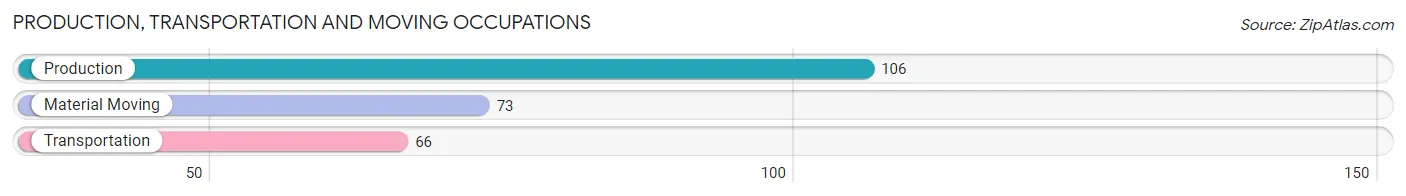
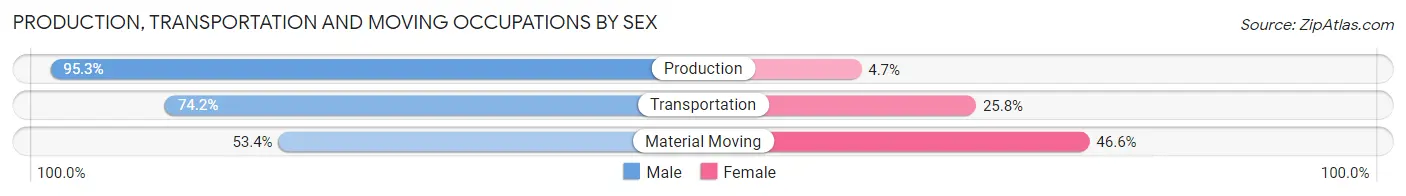
Production, Transportation and Moving Occupations
The most common Production, Transportation and Moving occupations in Claryville are Production (106 | 7.1%), Material Moving (73 | 4.9%), and Transportation (66 | 4.4%).
Production, Transportation and Moving Occupations by Sex
| Occupation | Male | Female |
| Production | 101 (95.3%) | 5 (4.7%) |
| Transportation | 49 (74.2%) | 17 (25.8%) |
| Material Moving | 39 (53.4%) | 34 (46.6%) |
| Total (Category) | 189 (77.1%) | 56 (22.9%) |
| Total (Overall) | 803 (53.8%) | 690 (46.2%) |
Employment Industries by Sex in Claryville
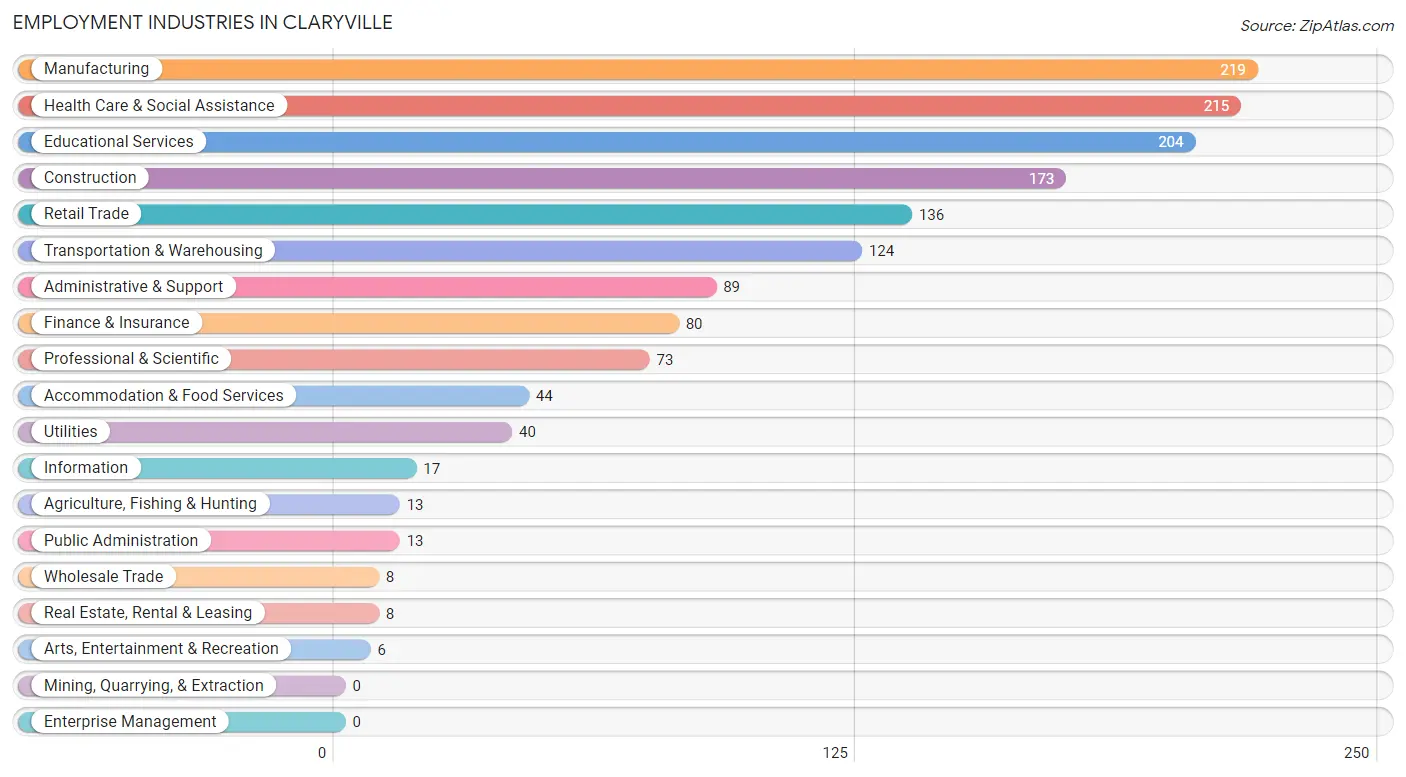
Employment Industries in Claryville
The major employment industries in Claryville include Manufacturing (219 | 14.7%), Health Care & Social Assistance (215 | 14.4%), Educational Services (204 | 13.7%), Construction (173 | 11.6%), and Retail Trade (136 | 9.1%).
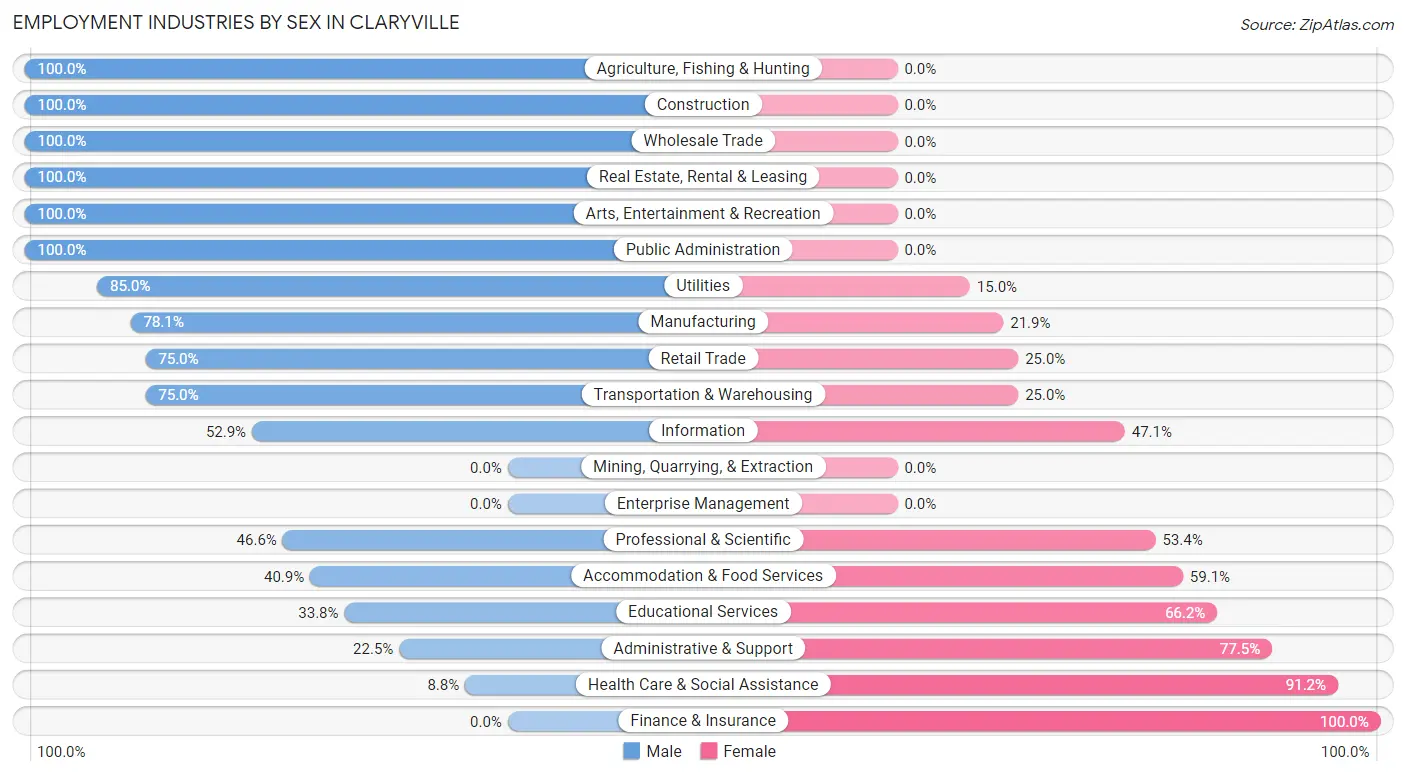
Employment Industries by Sex in Claryville
The Claryville industries that see more men than women are Agriculture, Fishing & Hunting (100.0%), Construction (100.0%), and Wholesale Trade (100.0%), whereas the industries that tend to have a higher number of women are Finance & Insurance (100.0%), Health Care & Social Assistance (91.2%), and Administrative & Support (77.5%).
| Industry | Male | Female |
| Agriculture, Fishing & Hunting | 13 (100.0%) | 0 (0.0%) |
| Mining, Quarrying, & Extraction | 0 (0.0%) | 0 (0.0%) |
| Construction | 173 (100.0%) | 0 (0.0%) |
| Manufacturing | 171 (78.1%) | 48 (21.9%) |
| Wholesale Trade | 8 (100.0%) | 0 (0.0%) |
| Retail Trade | 102 (75.0%) | 34 (25.0%) |
| Transportation & Warehousing | 93 (75.0%) | 31 (25.0%) |
| Utilities | 34 (85.0%) | 6 (15.0%) |
| Information | 9 (52.9%) | 8 (47.1%) |
| Finance & Insurance | 0 (0.0%) | 80 (100.0%) |
| Real Estate, Rental & Leasing | 8 (100.0%) | 0 (0.0%) |
| Professional & Scientific | 34 (46.6%) | 39 (53.4%) |
| Enterprise Management | 0 (0.0%) | 0 (0.0%) |
| Administrative & Support | 20 (22.5%) | 69 (77.5%) |
| Educational Services | 69 (33.8%) | 135 (66.2%) |
| Health Care & Social Assistance | 19 (8.8%) | 196 (91.2%) |
| Arts, Entertainment & Recreation | 6 (100.0%) | 0 (0.0%) |
| Accommodation & Food Services | 18 (40.9%) | 26 (59.1%) |
| Public Administration | 13 (100.0%) | 0 (0.0%) |
| Total | 803 (53.8%) | 690 (46.2%) |
Education in Claryville
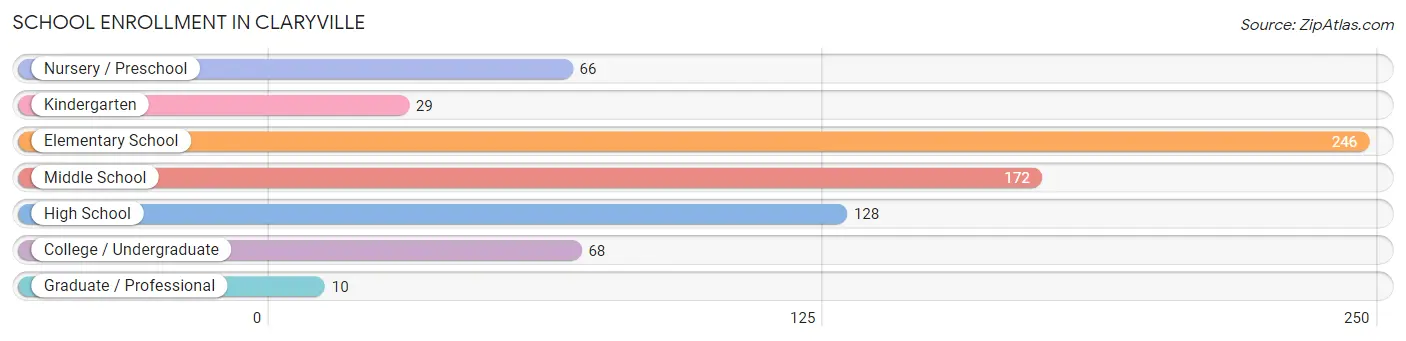
School Enrollment in Claryville
The most common levels of schooling among the 719 students in Claryville are elementary school (246 | 34.2%), middle school (172 | 23.9%), and high school (128 | 17.8%).
| School Level | # Students | % Students |
| Nursery / Preschool | 66 | 9.2% |
| Kindergarten | 29 | 4.0% |
| Elementary School | 246 | 34.2% |
| Middle School | 172 | 23.9% |
| High School | 128 | 17.8% |
| College / Undergraduate | 68 | 9.5% |
| Graduate / Professional | 10 | 1.4% |
| Total | 719 | 100.0% |
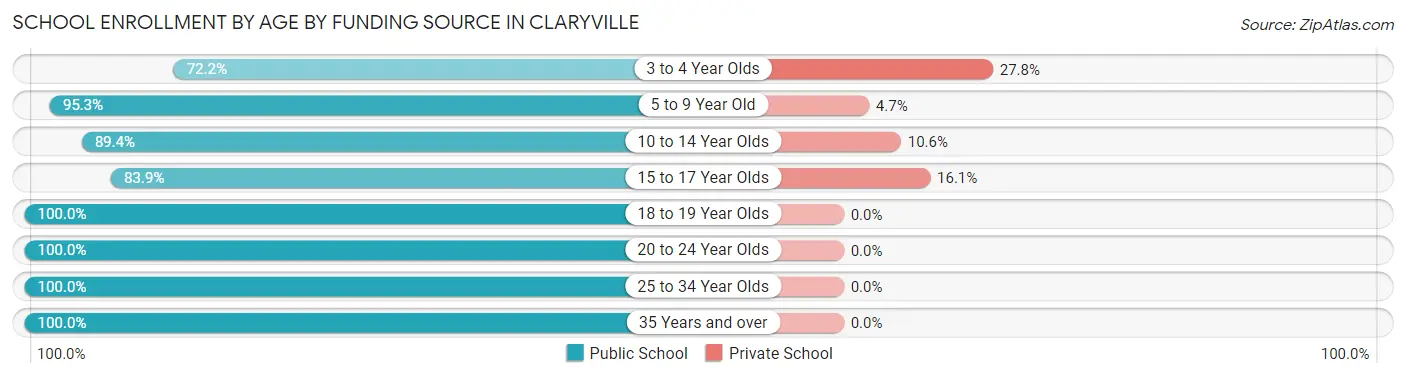
School Enrollment by Age by Funding Source in Claryville
Out of a total of 719 students who are enrolled in schools in Claryville, 70 (9.7%) attend a private institution, while the remaining 649 (90.3%) are enrolled in public schools. The age group of 3 to 4 year olds has the highest likelihood of being enrolled in private schools, with 15 (27.8% in the age bracket) enrolled. Conversely, the age group of 18 to 19 year olds has the lowest likelihood of being enrolled in a private school, with 26 (100.0% in the age bracket) attending a public institution.
| Age Bracket | Public School | Private School |
| 3 to 4 Year Olds | 39 (72.2%) | 15 (27.8%) |
| 5 to 9 Year Old | 223 (95.3%) | 11 (4.7%) |
| 10 to 14 Year Olds | 210 (89.4%) | 25 (10.6%) |
| 15 to 17 Year Olds | 99 (83.9%) | 19 (16.1%) |
| 18 to 19 Year Olds | 26 (100.0%) | 0 (0.0%) |
| 20 to 24 Year Olds | 35 (100.0%) | 0 (0.0%) |
| 25 to 34 Year Olds | 7 (100.0%) | 0 (0.0%) |
| 35 Years and over | 10 (100.0%) | 0 (0.0%) |
| Total | 649 (90.3%) | 70 (9.7%) |
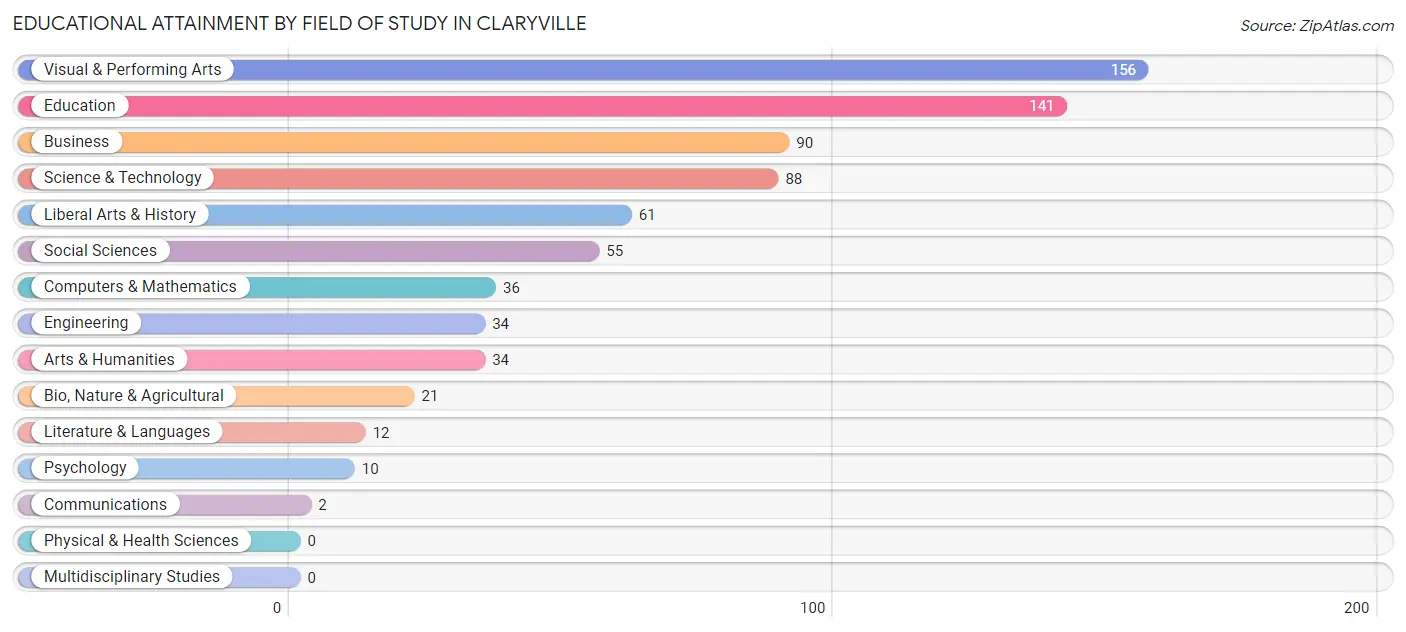
Educational Attainment by Field of Study in Claryville
Visual & performing arts (156 | 21.1%), education (141 | 19.1%), business (90 | 12.2%), science & technology (88 | 11.9%), and liberal arts & history (61 | 8.2%) are the most common fields of study among 740 individuals in Claryville who have obtained a bachelor's degree or higher.
| Field of Study | # Graduates | % Graduates |
| Computers & Mathematics | 36 | 4.9% |
| Bio, Nature & Agricultural | 21 | 2.8% |
| Physical & Health Sciences | 0 | 0.0% |
| Psychology | 10 | 1.3% |
| Social Sciences | 55 | 7.4% |
| Engineering | 34 | 4.6% |
| Multidisciplinary Studies | 0 | 0.0% |
| Science & Technology | 88 | 11.9% |
| Business | 90 | 12.2% |
| Education | 141 | 19.1% |
| Literature & Languages | 12 | 1.6% |
| Liberal Arts & History | 61 | 8.2% |
| Visual & Performing Arts | 156 | 21.1% |
| Communications | 2 | 0.3% |
| Arts & Humanities | 34 | 4.6% |
| Total | 740 | 100.0% |
Transportation & Commute in Claryville
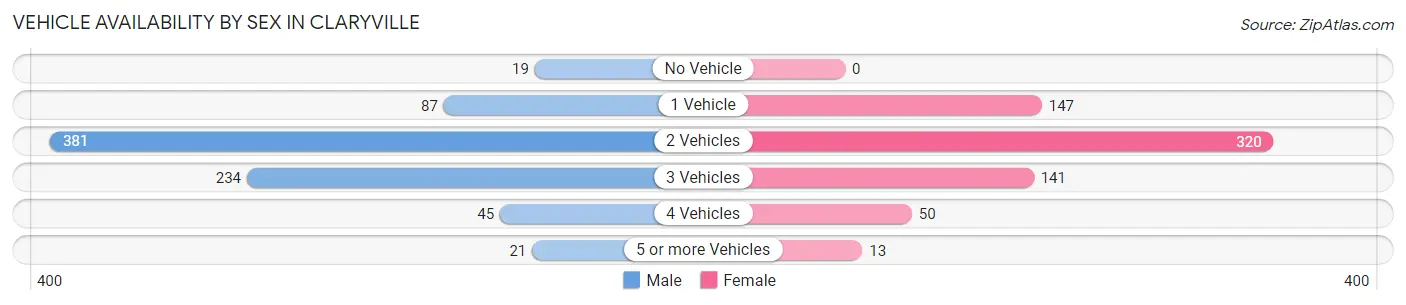
Vehicle Availability by Sex in Claryville
The most prevalent vehicle ownership categories in Claryville are males with 2 vehicles (381, accounting for 48.4%) and females with 2 vehicles (320, making up 56.8%).
| Vehicles Available | Male | Female |
| No Vehicle | 19 (2.4%) | 0 (0.0%) |
| 1 Vehicle | 87 (11.1%) | 147 (21.9%) |
| 2 Vehicles | 381 (48.4%) | 320 (47.7%) |
| 3 Vehicles | 234 (29.7%) | 141 (21.0%) |
| 4 Vehicles | 45 (5.7%) | 50 (7.4%) |
| 5 or more Vehicles | 21 (2.7%) | 13 (1.9%) |
| Total | 787 (100.0%) | 671 (100.0%) |
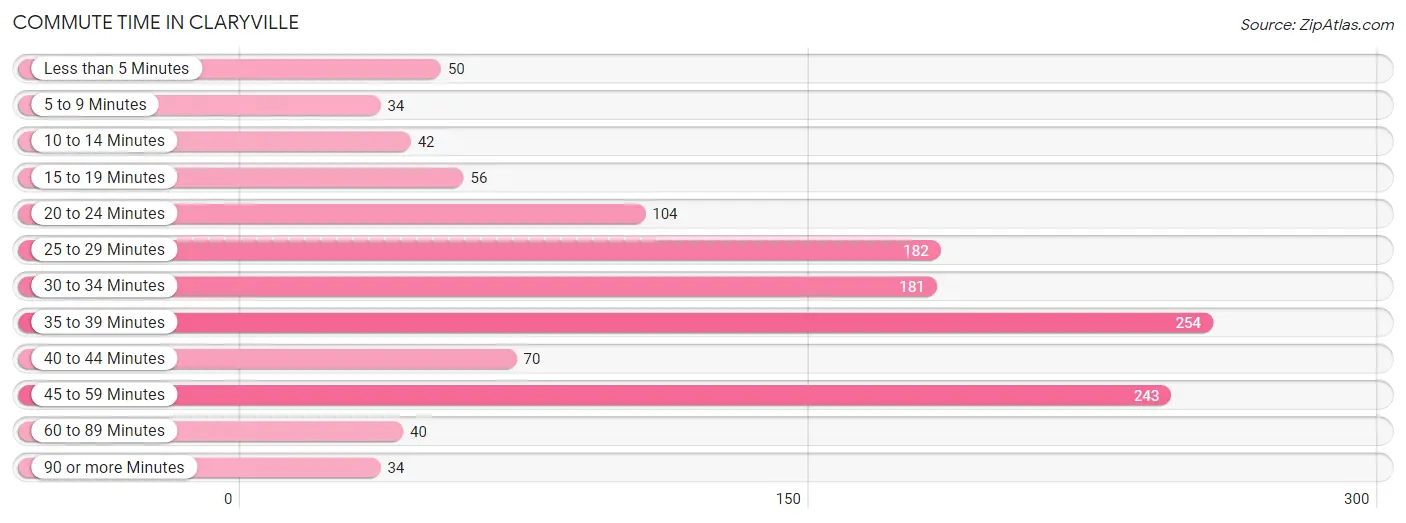
Commute Time in Claryville
The most frequently occuring commute durations in Claryville are 35 to 39 minutes (254 commuters, 19.7%), 45 to 59 minutes (243 commuters, 18.8%), and 25 to 29 minutes (182 commuters, 14.1%).
| Commute Time | # Commuters | % Commuters |
| Less than 5 Minutes | 50 | 3.9% |
| 5 to 9 Minutes | 34 | 2.6% |
| 10 to 14 Minutes | 42 | 3.3% |
| 15 to 19 Minutes | 56 | 4.3% |
| 20 to 24 Minutes | 104 | 8.1% |
| 25 to 29 Minutes | 182 | 14.1% |
| 30 to 34 Minutes | 181 | 14.0% |
| 35 to 39 Minutes | 254 | 19.7% |
| 40 to 44 Minutes | 70 | 5.4% |
| 45 to 59 Minutes | 243 | 18.8% |
| 60 to 89 Minutes | 40 | 3.1% |
| 90 or more Minutes | 34 | 2.6% |
Commute Time by Sex in Claryville
The most common commute times in Claryville are 45 to 59 minutes (161 commuters, 23.3%) for males and 25 to 29 minutes (147 commuters, 24.5%) for females.
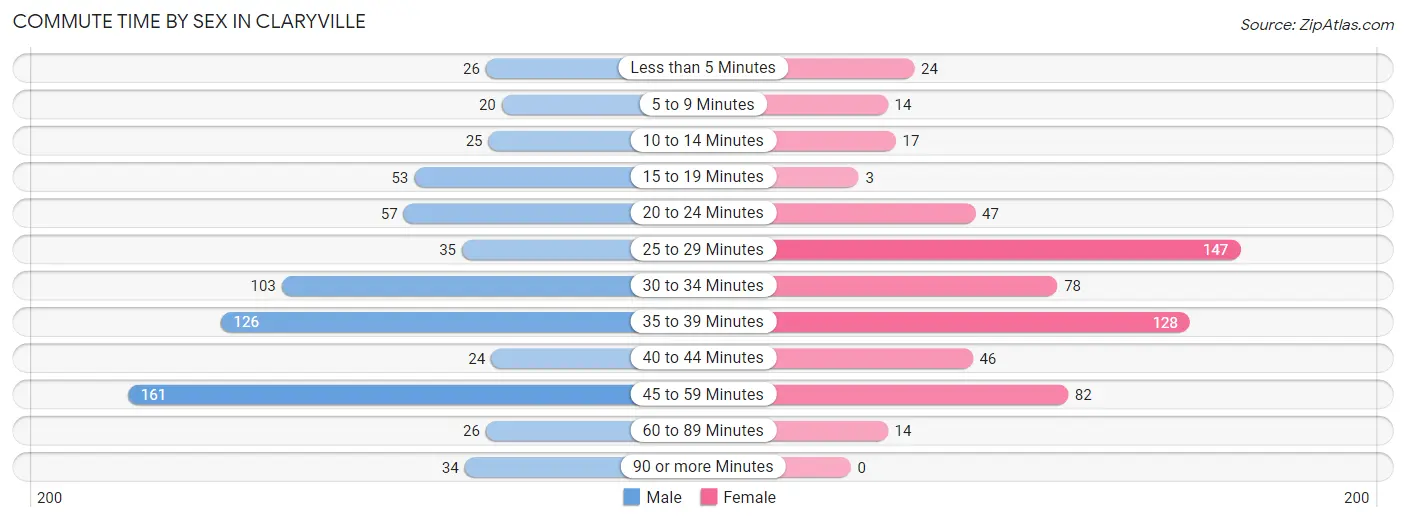
| Commute Time | Male | Female |
| Less than 5 Minutes | 26 (3.8%) | 24 (4.0%) |
| 5 to 9 Minutes | 20 (2.9%) | 14 (2.3%) |
| 10 to 14 Minutes | 25 (3.6%) | 17 (2.8%) |
| 15 to 19 Minutes | 53 (7.7%) | 3 (0.5%) |
| 20 to 24 Minutes | 57 (8.3%) | 47 (7.8%) |
| 25 to 29 Minutes | 35 (5.1%) | 147 (24.5%) |
| 30 to 34 Minutes | 103 (14.9%) | 78 (13.0%) |
| 35 to 39 Minutes | 126 (18.3%) | 128 (21.3%) |
| 40 to 44 Minutes | 24 (3.5%) | 46 (7.7%) |
| 45 to 59 Minutes | 161 (23.3%) | 82 (13.7%) |
| 60 to 89 Minutes | 26 (3.8%) | 14 (2.3%) |
| 90 or more Minutes | 34 (4.9%) | 0 (0.0%) |
Time of Departure to Work by Sex in Claryville
The most frequent times of departure to work in Claryville are 6:30 AM to 6:59 AM (168, 24.3%) for males and 6:30 AM to 6:59 AM (147, 24.5%) for females.
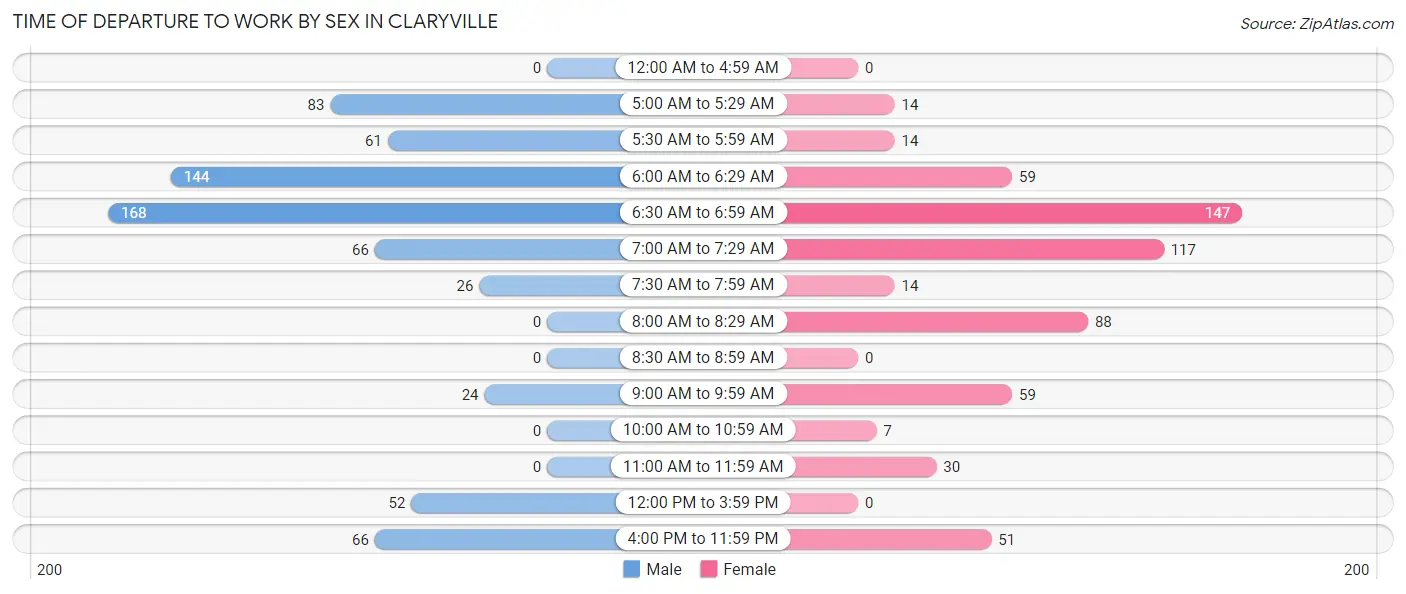
| Time of Departure | Male | Female |
| 12:00 AM to 4:59 AM | 0 (0.0%) | 0 (0.0%) |
| 5:00 AM to 5:29 AM | 83 (12.0%) | 14 (2.3%) |
| 5:30 AM to 5:59 AM | 61 (8.8%) | 14 (2.3%) |
| 6:00 AM to 6:29 AM | 144 (20.9%) | 59 (9.8%) |
| 6:30 AM to 6:59 AM | 168 (24.3%) | 147 (24.5%) |
| 7:00 AM to 7:29 AM | 66 (9.6%) | 117 (19.5%) |
| 7:30 AM to 7:59 AM | 26 (3.8%) | 14 (2.3%) |
| 8:00 AM to 8:29 AM | 0 (0.0%) | 88 (14.7%) |
| 8:30 AM to 8:59 AM | 0 (0.0%) | 0 (0.0%) |
| 9:00 AM to 9:59 AM | 24 (3.5%) | 59 (9.8%) |
| 10:00 AM to 10:59 AM | 0 (0.0%) | 7 (1.2%) |
| 11:00 AM to 11:59 AM | 0 (0.0%) | 30 (5.0%) |
| 12:00 PM to 3:59 PM | 52 (7.5%) | 0 (0.0%) |
| 4:00 PM to 11:59 PM | 66 (9.6%) | 51 (8.5%) |
| Total | 690 (100.0%) | 600 (100.0%) |
Housing Occupancy in Claryville
Occupancy by Ownership in Claryville
Of the total 1,312 dwellings in Claryville, owner-occupied units account for 1,082 (82.5%), while renter-occupied units make up 230 (17.5%).
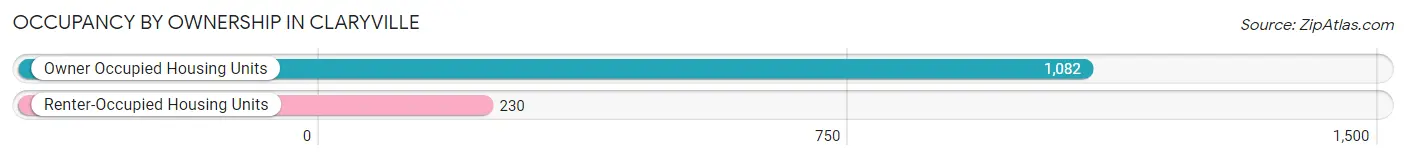
| Occupancy | # Housing Units | % Housing Units |
| Owner Occupied Housing Units | 1,082 | 82.5% |
| Renter-Occupied Housing Units | 230 | 17.5% |
| Total Occupied Housing Units | 1,312 | 100.0% |
Occupancy by Household Size in Claryville
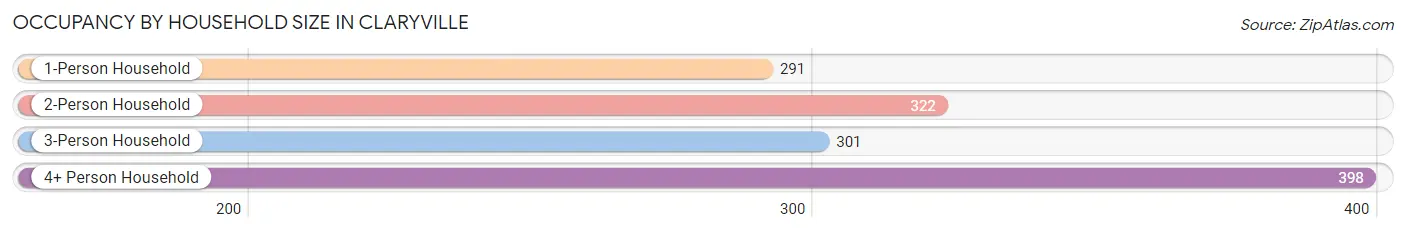
| Household Size | # Housing Units | % Housing Units |
| 1-Person Household | 291 | 22.2% |
| 2-Person Household | 322 | 24.5% |
| 3-Person Household | 301 | 22.9% |
| 4+ Person Household | 398 | 30.3% |
| Total Housing Units | 1,312 | 100.0% |
Occupancy by Ownership by Household Size in Claryville
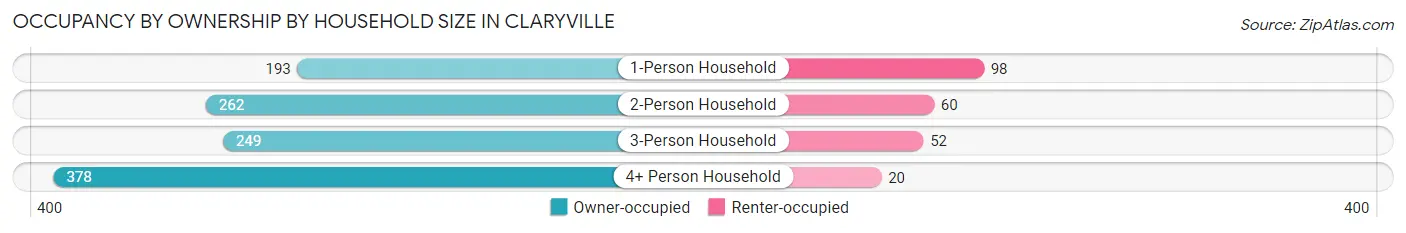
| Household Size | Owner-occupied | Renter-occupied |
| 1-Person Household | 193 (66.3%) | 98 (33.7%) |
| 2-Person Household | 262 (81.4%) | 60 (18.6%) |
| 3-Person Household | 249 (82.7%) | 52 (17.3%) |
| 4+ Person Household | 378 (95.0%) | 20 (5.0%) |
| Total Housing Units | 1,082 (82.5%) | 230 (17.5%) |
Occupancy by Educational Attainment in Claryville
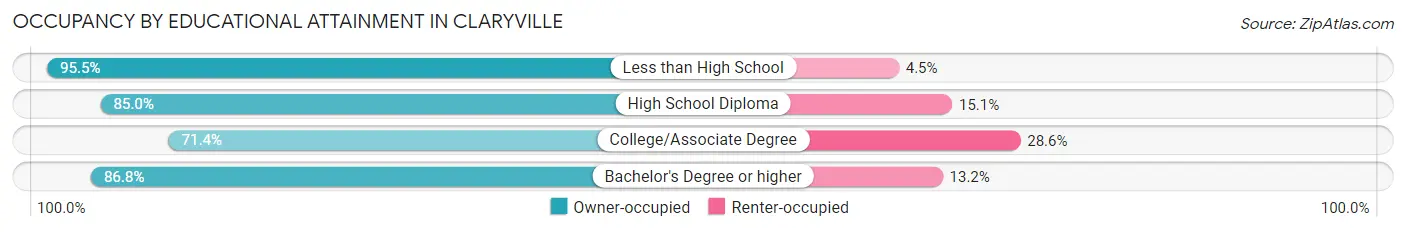
| Household Size | Owner-occupied | Renter-occupied |
| Less than High School | 128 (95.5%) | 6 (4.5%) |
| High School Diploma | 237 (85.0%) | 42 (15.0%) |
| College/Associate Degree | 295 (71.4%) | 118 (28.6%) |
| Bachelor's Degree or higher | 422 (86.8%) | 64 (13.2%) |
Occupancy by Age of Householder in Claryville
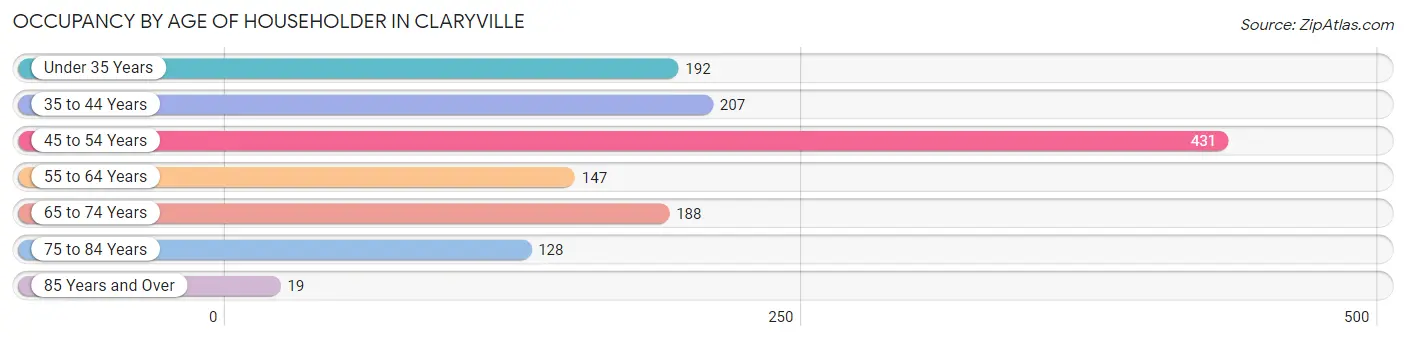
| Age Bracket | # Households | % Households |
| Under 35 Years | 192 | 14.6% |
| 35 to 44 Years | 207 | 15.8% |
| 45 to 54 Years | 431 | 32.9% |
| 55 to 64 Years | 147 | 11.2% |
| 65 to 74 Years | 188 | 14.3% |
| 75 to 84 Years | 128 | 9.8% |
| 85 Years and Over | 19 | 1.5% |
| Total | 1,312 | 100.0% |
Housing Finances in Claryville
Median Income by Occupancy in Claryville
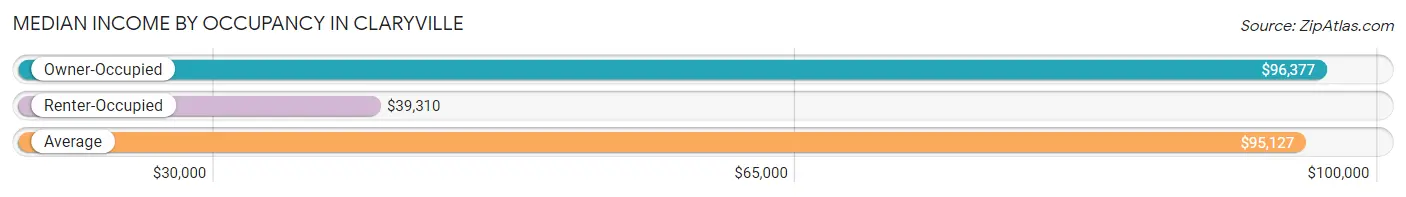
| Occupancy Type | # Households | Median Income |
| Owner-Occupied | 1,082 (82.5%) | $96,377 |
| Renter-Occupied | 230 (17.5%) | $39,310 |
| Average | 1,312 (100.0%) | $95,127 |
Occupancy by Householder Income Bracket in Claryville
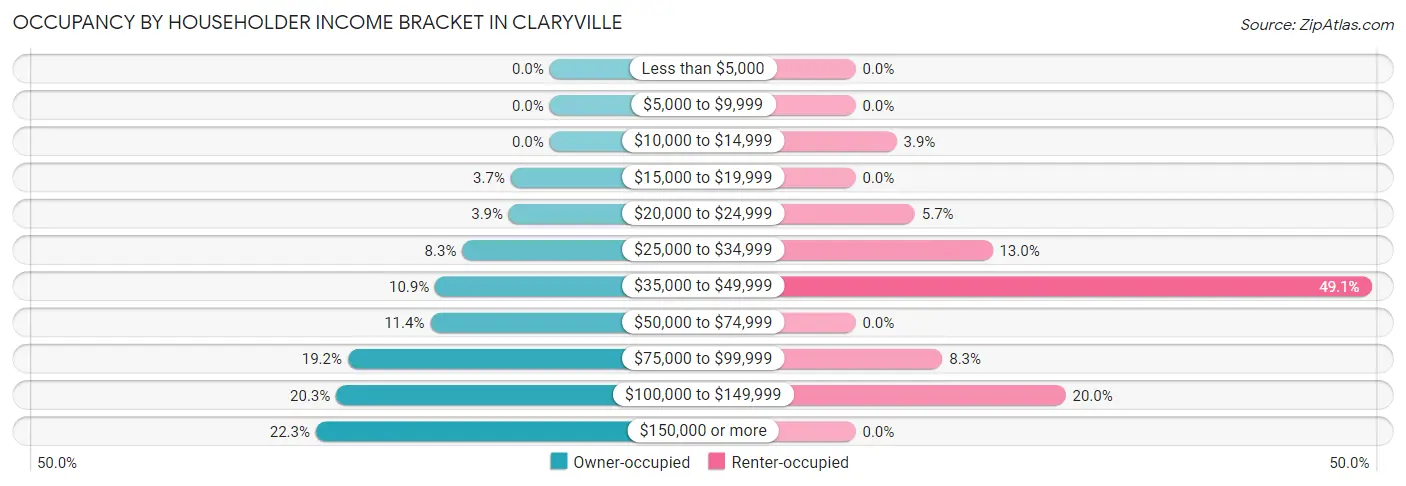
| Income Bracket | Owner-occupied | Renter-occupied |
| Less than $5,000 | 0 (0.0%) | 0 (0.0%) |
| $5,000 to $9,999 | 0 (0.0%) | 0 (0.0%) |
| $10,000 to $14,999 | 0 (0.0%) | 9 (3.9%) |
| $15,000 to $19,999 | 40 (3.7%) | 0 (0.0%) |
| $20,000 to $24,999 | 42 (3.9%) | 13 (5.7%) |
| $25,000 to $34,999 | 90 (8.3%) | 30 (13.0%) |
| $35,000 to $49,999 | 118 (10.9%) | 113 (49.1%) |
| $50,000 to $74,999 | 123 (11.4%) | 0 (0.0%) |
| $75,000 to $99,999 | 208 (19.2%) | 19 (8.3%) |
| $100,000 to $149,999 | 220 (20.3%) | 46 (20.0%) |
| $150,000 or more | 241 (22.3%) | 0 (0.0%) |
| Total | 1,082 (100.0%) | 230 (100.0%) |
Monthly Housing Cost Tiers in Claryville
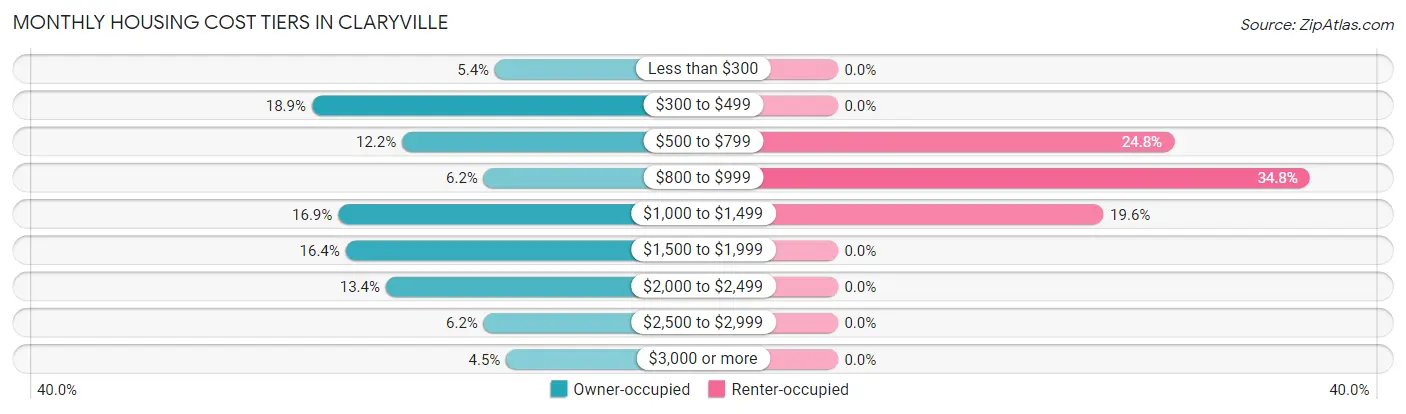
| Monthly Cost | Owner-occupied | Renter-occupied |
| Less than $300 | 58 (5.4%) | 0 (0.0%) |
| $300 to $499 | 204 (18.9%) | 0 (0.0%) |
| $500 to $799 | 132 (12.2%) | 57 (24.8%) |
| $800 to $999 | 67 (6.2%) | 80 (34.8%) |
| $1,000 to $1,499 | 183 (16.9%) | 45 (19.6%) |
| $1,500 to $1,999 | 177 (16.4%) | 0 (0.0%) |
| $2,000 to $2,499 | 145 (13.4%) | 0 (0.0%) |
| $2,500 to $2,999 | 67 (6.2%) | 0 (0.0%) |
| $3,000 or more | 49 (4.5%) | 0 (0.0%) |
| Total | 1,082 (100.0%) | 230 (100.0%) |
Physical Housing Characteristics in Claryville
Housing Structures in Claryville
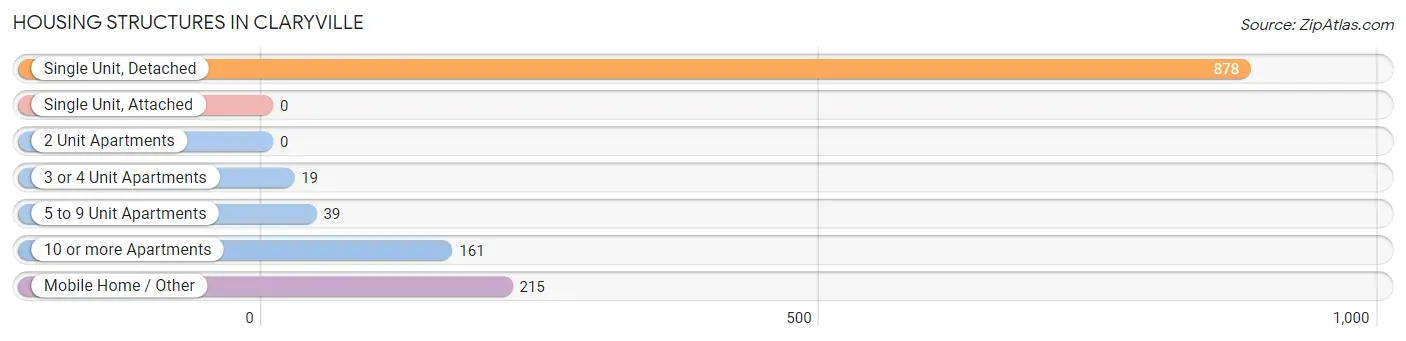
| Structure Type | # Housing Units | % Housing Units |
| Single Unit, Detached | 878 | 66.9% |
| Single Unit, Attached | 0 | 0.0% |
| 2 Unit Apartments | 0 | 0.0% |
| 3 or 4 Unit Apartments | 19 | 1.5% |
| 5 to 9 Unit Apartments | 39 | 3.0% |
| 10 or more Apartments | 161 | 12.3% |
| Mobile Home / Other | 215 | 16.4% |
| Total | 1,312 | 100.0% |
Housing Structures by Occupancy in Claryville
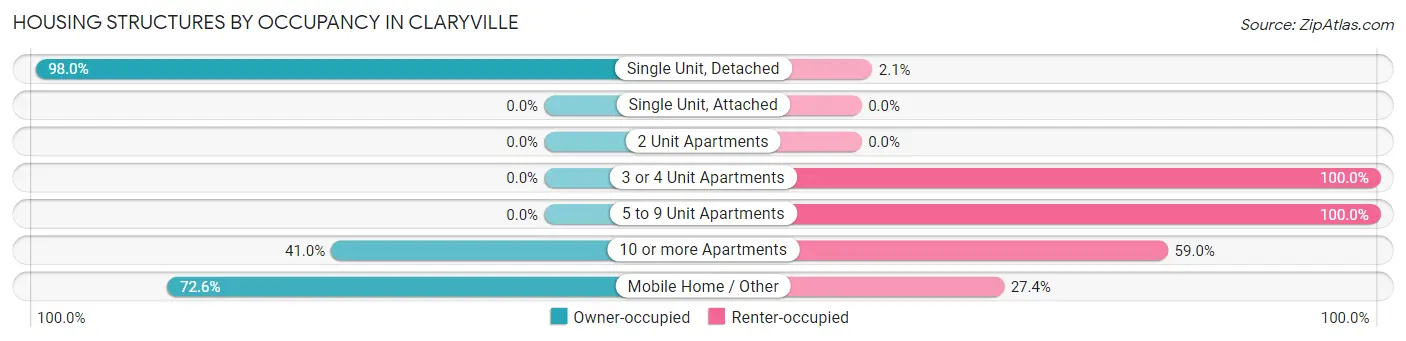
| Structure Type | Owner-occupied | Renter-occupied |
| Single Unit, Detached | 860 (98.0%) | 18 (2.1%) |
| Single Unit, Attached | 0 (0.0%) | 0 (0.0%) |
| 2 Unit Apartments | 0 (0.0%) | 0 (0.0%) |
| 3 or 4 Unit Apartments | 0 (0.0%) | 19 (100.0%) |
| 5 to 9 Unit Apartments | 0 (0.0%) | 39 (100.0%) |
| 10 or more Apartments | 66 (41.0%) | 95 (59.0%) |
| Mobile Home / Other | 156 (72.6%) | 59 (27.4%) |
| Total | 1,082 (82.5%) | 230 (17.5%) |
Housing Structures by Number of Rooms in Claryville
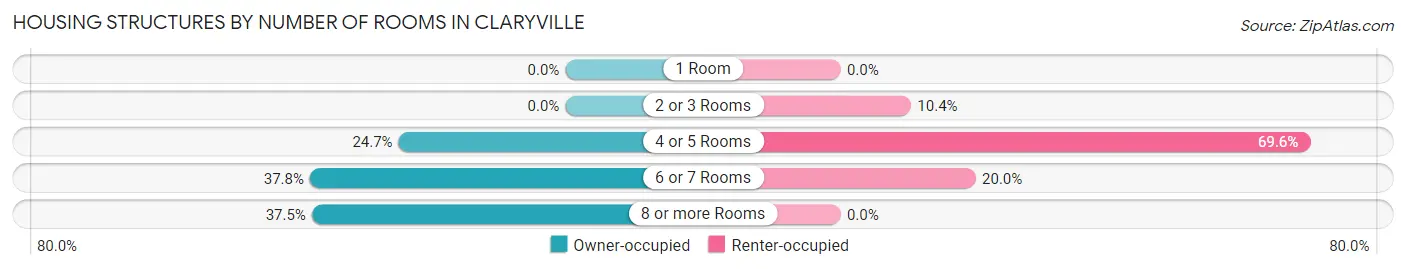
| Number of Rooms | Owner-occupied | Renter-occupied |
| 1 Room | 0 (0.0%) | 0 (0.0%) |
| 2 or 3 Rooms | 0 (0.0%) | 24 (10.4%) |
| 4 or 5 Rooms | 267 (24.7%) | 160 (69.6%) |
| 6 or 7 Rooms | 409 (37.8%) | 46 (20.0%) |
| 8 or more Rooms | 406 (37.5%) | 0 (0.0%) |
| Total | 1,082 (100.0%) | 230 (100.0%) |
Housing Structure by Heating Type in Claryville
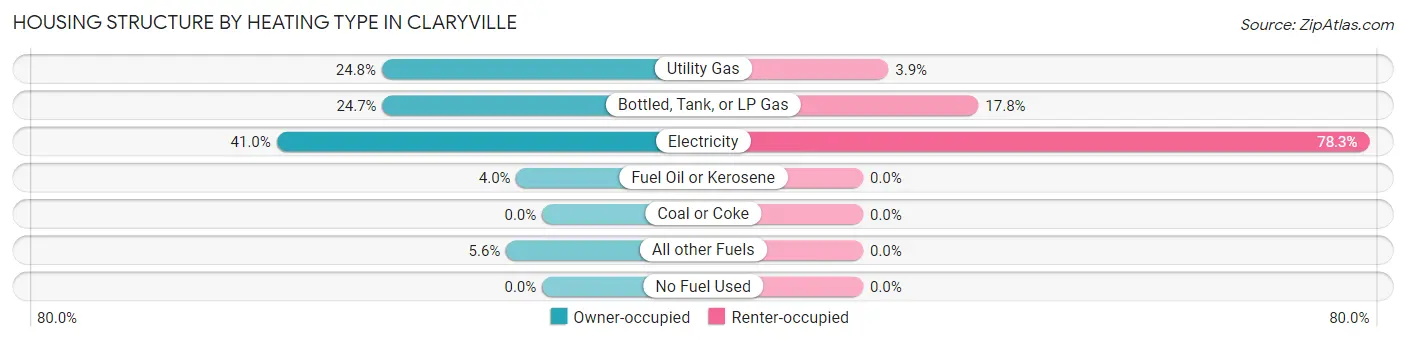
| Heating Type | Owner-occupied | Renter-occupied |
| Utility Gas | 268 (24.8%) | 9 (3.9%) |
| Bottled, Tank, or LP Gas | 267 (24.7%) | 41 (17.8%) |
| Electricity | 444 (41.0%) | 180 (78.3%) |
| Fuel Oil or Kerosene | 43 (4.0%) | 0 (0.0%) |
| Coal or Coke | 0 (0.0%) | 0 (0.0%) |
| All other Fuels | 60 (5.6%) | 0 (0.0%) |
| No Fuel Used | 0 (0.0%) | 0 (0.0%) |
| Total | 1,082 (100.0%) | 230 (100.0%) |
Household Vehicle Usage in Claryville
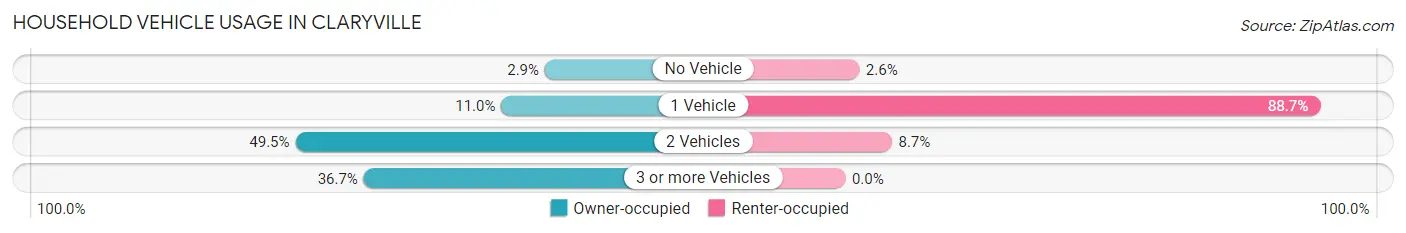
| Vehicles per Household | Owner-occupied | Renter-occupied |
| No Vehicle | 31 (2.9%) | 6 (2.6%) |
| 1 Vehicle | 119 (11.0%) | 204 (88.7%) |
| 2 Vehicles | 535 (49.4%) | 20 (8.7%) |
| 3 or more Vehicles | 397 (36.7%) | 0 (0.0%) |
| Total | 1,082 (100.0%) | 230 (100.0%) |
Real Estate & Mortgages in Claryville
Real Estate and Mortgage Overview in Claryville
| Characteristic | Without Mortgage | With Mortgage |
| Housing Units | 403 | 679 |
| Median Property Value | $114,400 | $279,100 |
| Median Household Income | $46,157 | $215 |
| Monthly Housing Costs | $460 | $49 |
| Real Estate Taxes | $1,088 | $0 |
Property Value by Mortgage Status in Claryville
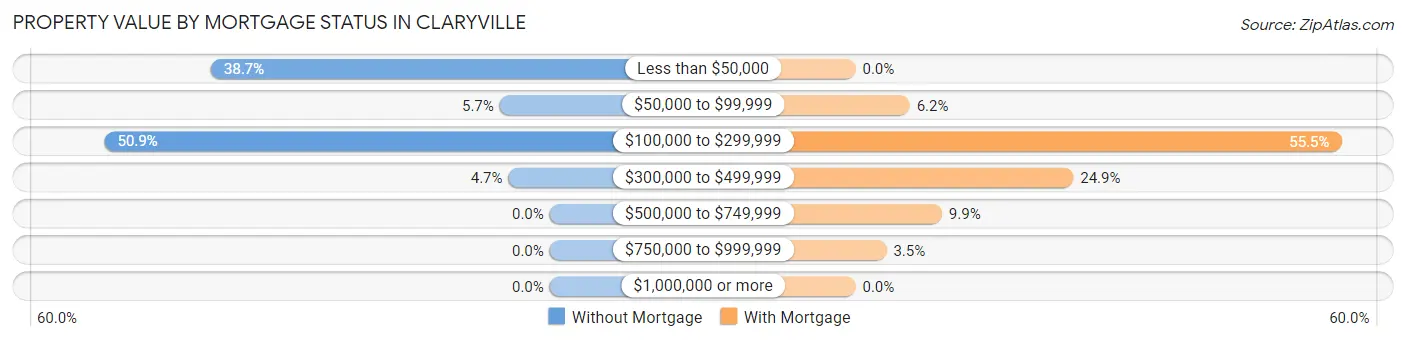
| Property Value | Without Mortgage | With Mortgage |
| Less than $50,000 | 156 (38.7%) | 0 (0.0%) |
| $50,000 to $99,999 | 23 (5.7%) | 42 (6.2%) |
| $100,000 to $299,999 | 205 (50.9%) | 377 (55.5%) |
| $300,000 to $499,999 | 19 (4.7%) | 169 (24.9%) |
| $500,000 to $749,999 | 0 (0.0%) | 67 (9.9%) |
| $750,000 to $999,999 | 0 (0.0%) | 24 (3.5%) |
| $1,000,000 or more | 0 (0.0%) | 0 (0.0%) |
| Total | 403 (100.0%) | 679 (100.0%) |
Household Income by Mortgage Status in Claryville
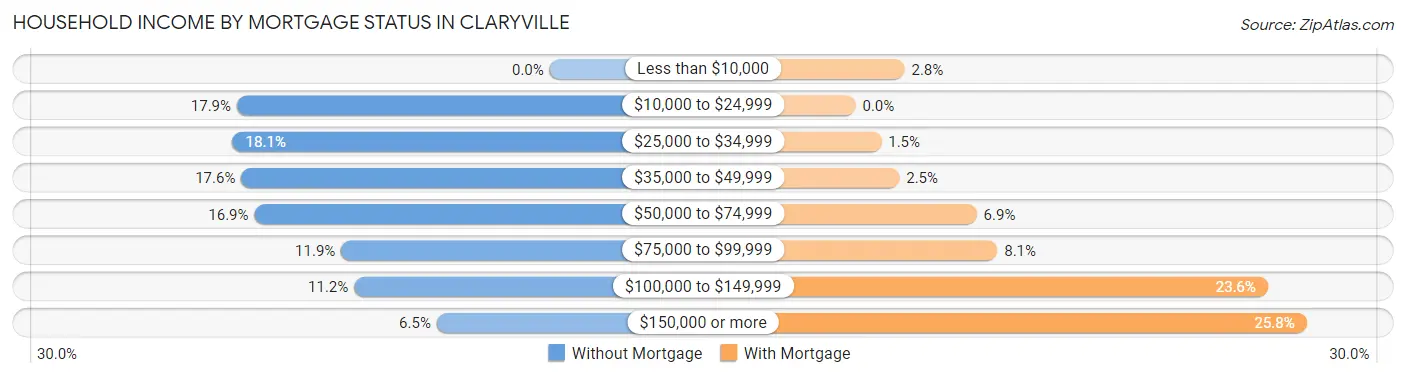
| Household Income | Without Mortgage | With Mortgage |
| Less than $10,000 | 0 (0.0%) | 19 (2.8%) |
| $10,000 to $24,999 | 72 (17.9%) | 0 (0.0%) |
| $25,000 to $34,999 | 73 (18.1%) | 10 (1.5%) |
| $35,000 to $49,999 | 71 (17.6%) | 17 (2.5%) |
| $50,000 to $74,999 | 68 (16.9%) | 47 (6.9%) |
| $75,000 to $99,999 | 48 (11.9%) | 55 (8.1%) |
| $100,000 to $149,999 | 45 (11.2%) | 160 (23.6%) |
| $150,000 or more | 26 (6.5%) | 175 (25.8%) |
| Total | 403 (100.0%) | 679 (100.0%) |
Property Value to Household Income Ratio in Claryville
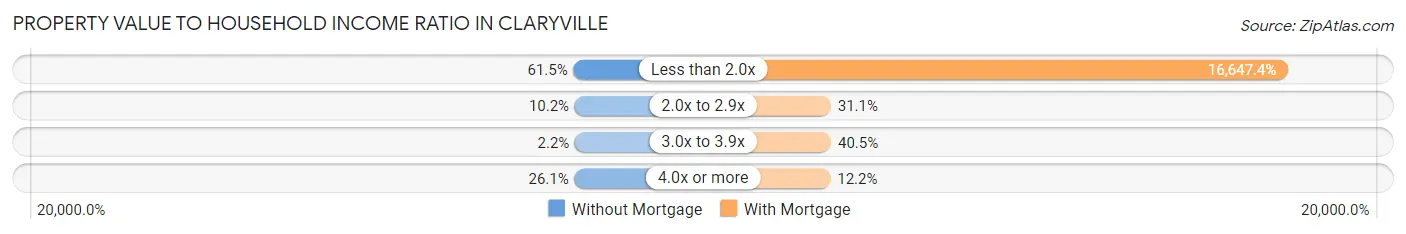
| Value-to-Income Ratio | Without Mortgage | With Mortgage |
| Less than 2.0x | 248 (61.5%) | 113,036 (16,647.4%) |
| 2.0x to 2.9x | 41 (10.2%) | 211 (31.1%) |
| 3.0x to 3.9x | 9 (2.2%) | 275 (40.5%) |
| 4.0x or more | 105 (26.1%) | 83 (12.2%) |
| Total | 403 (100.0%) | 679 (100.0%) |
Real Estate Taxes by Mortgage Status in Claryville
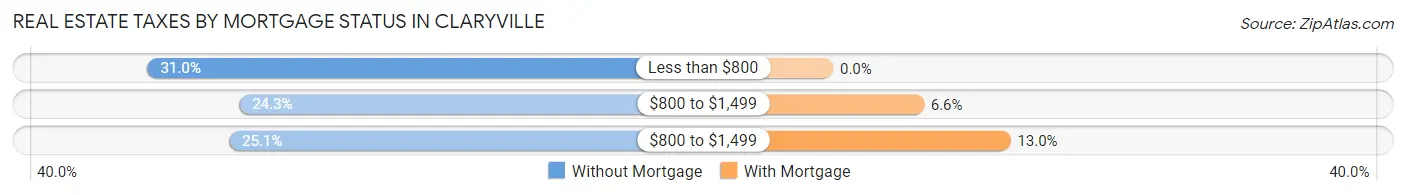
| Property Taxes | Without Mortgage | With Mortgage |
| Less than $800 | 125 (31.0%) | 0 (0.0%) |
| $800 to $1,499 | 98 (24.3%) | 45 (6.6%) |
| $800 to $1,499 | 101 (25.1%) | 88 (13.0%) |
| Total | 403 (100.0%) | 679 (100.0%) |
Health & Disability in Claryville
Health Insurance Coverage by Age in Claryville
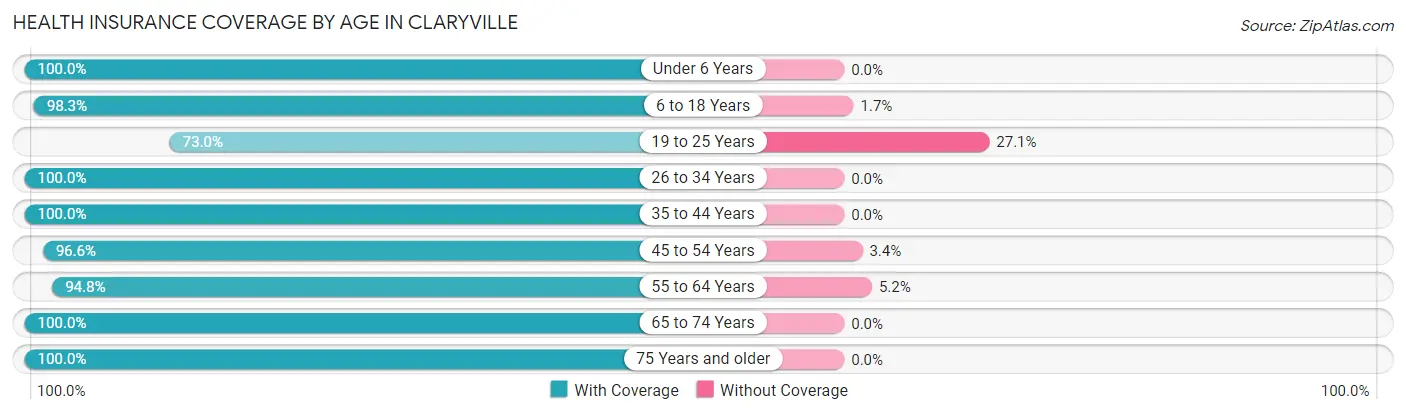
| Age Bracket | With Coverage | Without Coverage |
| Under 6 Years | 430 (100.0%) | 0 (0.0%) |
| 6 to 18 Years | 569 (98.3%) | 10 (1.7%) |
| 19 to 25 Years | 151 (73.0%) | 56 (27.1%) |
| 26 to 34 Years | 310 (100.0%) | 0 (0.0%) |
| 35 to 44 Years | 396 (100.0%) | 0 (0.0%) |
| 45 to 54 Years | 601 (96.6%) | 21 (3.4%) |
| 55 to 64 Years | 331 (94.8%) | 18 (5.2%) |
| 65 to 74 Years | 278 (100.0%) | 0 (0.0%) |
| 75 Years and older | 193 (100.0%) | 0 (0.0%) |
| Total | 3,259 (96.9%) | 105 (3.1%) |
Health Insurance Coverage by Citizenship Status in Claryville
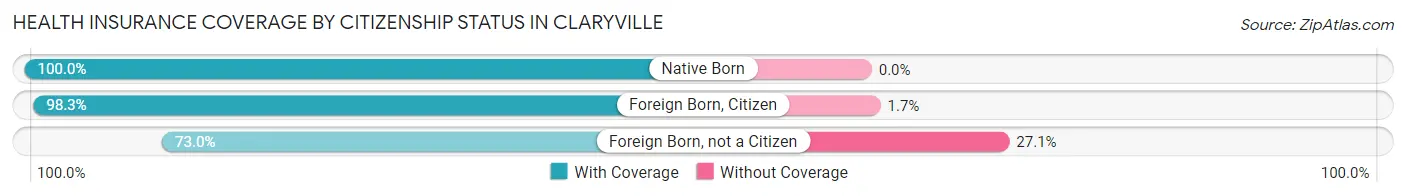
| Citizenship Status | With Coverage | Without Coverage |
| Native Born | 430 (100.0%) | 0 (0.0%) |
| Foreign Born, Citizen | 569 (98.3%) | 10 (1.7%) |
| Foreign Born, not a Citizen | 151 (73.0%) | 56 (27.1%) |
Health Insurance Coverage by Household Income in Claryville
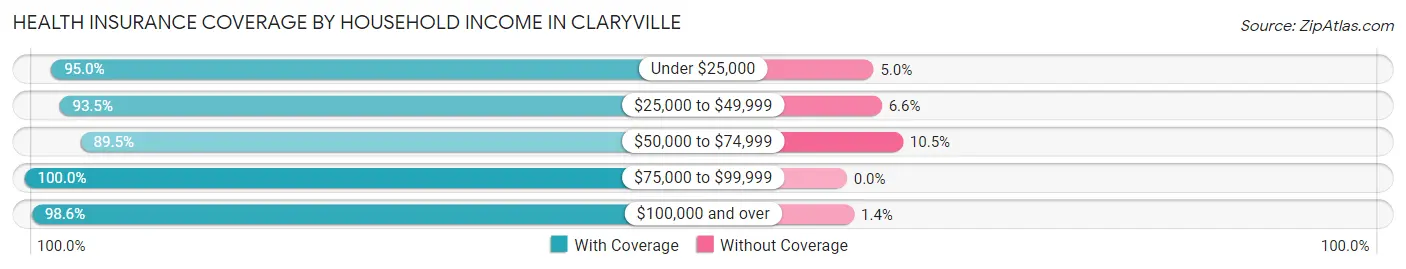
| Household Income | With Coverage | Without Coverage |
| Under $25,000 | 152 (95.0%) | 8 (5.0%) |
| $25,000 to $49,999 | 556 (93.4%) | 39 (6.6%) |
| $50,000 to $74,999 | 298 (89.5%) | 35 (10.5%) |
| $75,000 to $99,999 | 599 (100.0%) | 0 (0.0%) |
| $100,000 and over | 1,654 (98.6%) | 23 (1.4%) |
Public vs Private Health Insurance Coverage by Age in Claryville
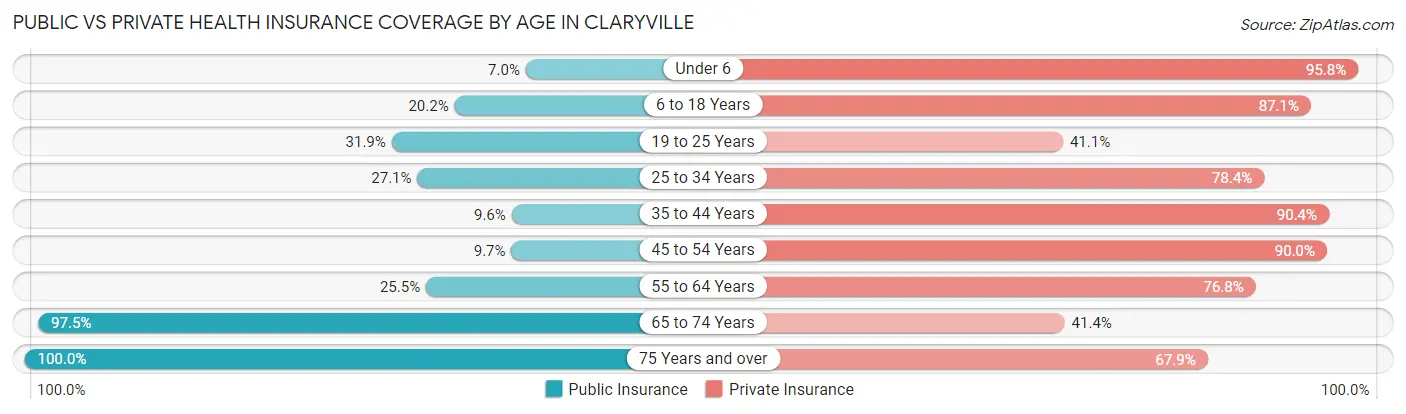
| Age Bracket | Public Insurance | Private Insurance |
| Under 6 | 30 (7.0%) | 412 (95.8%) |
| 6 to 18 Years | 117 (20.2%) | 504 (87.1%) |
| 19 to 25 Years | 66 (31.9%) | 85 (41.1%) |
| 25 to 34 Years | 84 (27.1%) | 243 (78.4%) |
| 35 to 44 Years | 38 (9.6%) | 358 (90.4%) |
| 45 to 54 Years | 60 (9.7%) | 560 (90.0%) |
| 55 to 64 Years | 89 (25.5%) | 268 (76.8%) |
| 65 to 74 Years | 271 (97.5%) | 115 (41.4%) |
| 75 Years and over | 193 (100.0%) | 131 (67.9%) |
| Total | 948 (28.2%) | 2,676 (79.5%) |
Disability Status by Sex by Age in Claryville
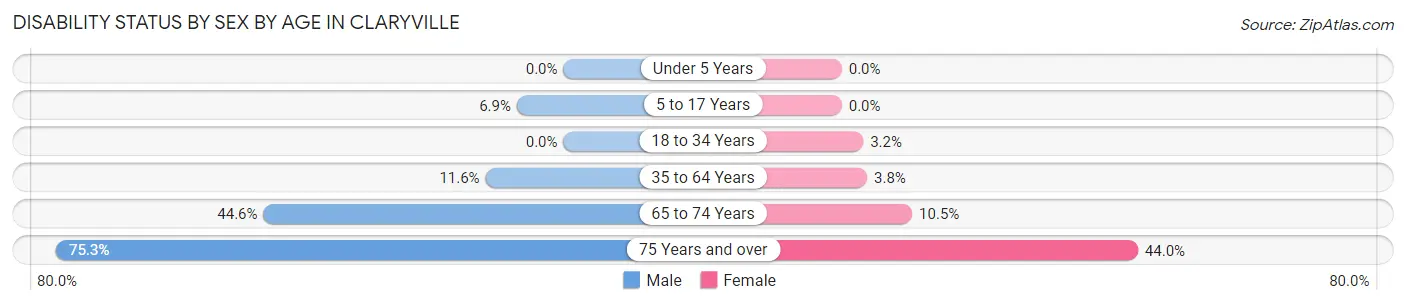
| Age Bracket | Male | Female |
| Under 5 Years | 0 (0.0%) | 0 (0.0%) |
| 5 to 17 Years | 25 (6.9%) | 0 (0.0%) |
| 18 to 34 Years | 0 (0.0%) | 9 (3.2%) |
| 35 to 64 Years | 75 (11.6%) | 27 (3.8%) |
| 65 to 74 Years | 94 (44.6%) | 7 (10.4%) |
| 75 Years and over | 58 (75.3%) | 51 (44.0%) |
Disability Class by Sex by Age in Claryville
Disability Class: Hearing Difficulty
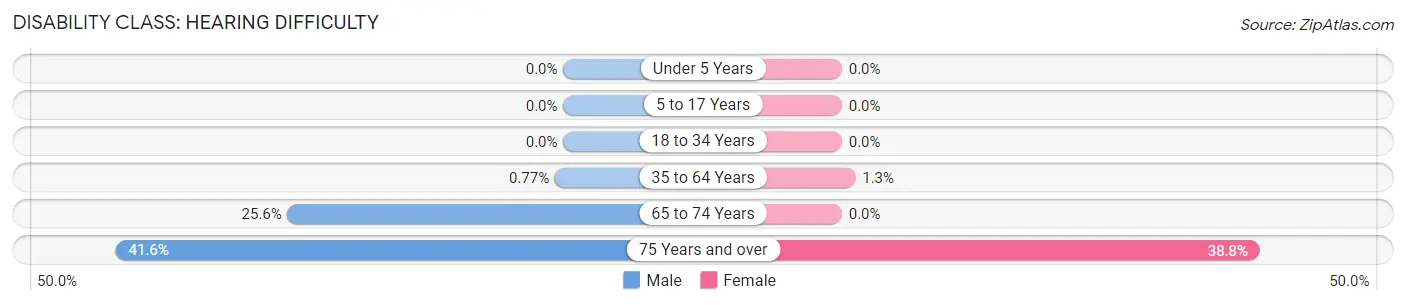
| Age Bracket | Male | Female |
| Under 5 Years | 0 (0.0%) | 0 (0.0%) |
| 5 to 17 Years | 0 (0.0%) | 0 (0.0%) |
| 18 to 34 Years | 0 (0.0%) | 0 (0.0%) |
| 35 to 64 Years | 5 (0.8%) | 9 (1.3%) |
| 65 to 74 Years | 54 (25.6%) | 0 (0.0%) |
| 75 Years and over | 32 (41.6%) | 45 (38.8%) |
Disability Class: Vision Difficulty
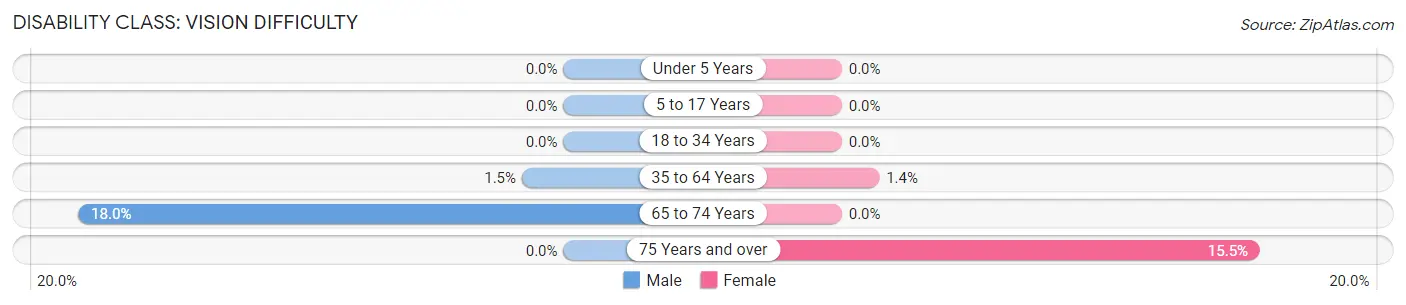
| Age Bracket | Male | Female |
| Under 5 Years | 0 (0.0%) | 0 (0.0%) |
| 5 to 17 Years | 0 (0.0%) | 0 (0.0%) |
| 18 to 34 Years | 0 (0.0%) | 0 (0.0%) |
| 35 to 64 Years | 10 (1.5%) | 10 (1.4%) |
| 65 to 74 Years | 38 (18.0%) | 0 (0.0%) |
| 75 Years and over | 0 (0.0%) | 18 (15.5%) |
Disability Class: Cognitive Difficulty
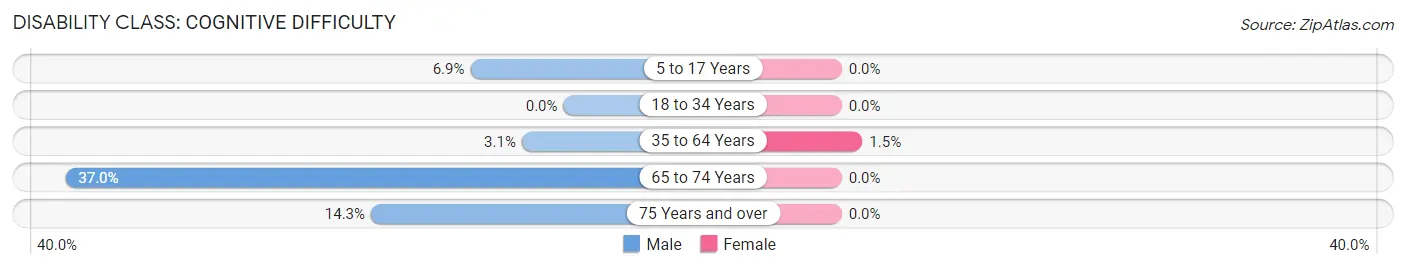
| Age Bracket | Male | Female |
| 5 to 17 Years | 25 (6.9%) | 0 (0.0%) |
| 18 to 34 Years | 0 (0.0%) | 0 (0.0%) |
| 35 to 64 Years | 20 (3.1%) | 11 (1.5%) |
| 65 to 74 Years | 78 (37.0%) | 0 (0.0%) |
| 75 Years and over | 11 (14.3%) | 0 (0.0%) |
Disability Class: Ambulatory Difficulty
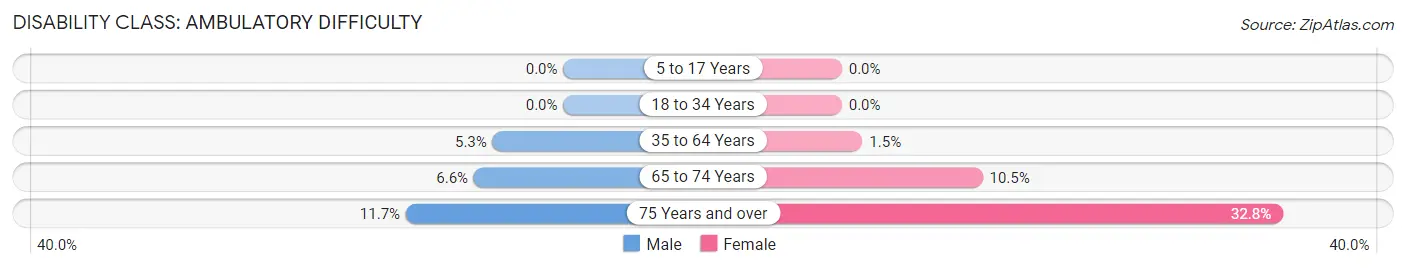
| Age Bracket | Male | Female |
| 5 to 17 Years | 0 (0.0%) | 0 (0.0%) |
| 18 to 34 Years | 0 (0.0%) | 0 (0.0%) |
| 35 to 64 Years | 34 (5.2%) | 11 (1.5%) |
| 65 to 74 Years | 14 (6.6%) | 7 (10.4%) |
| 75 Years and over | 9 (11.7%) | 38 (32.8%) |
Disability Class: Self-Care Difficulty
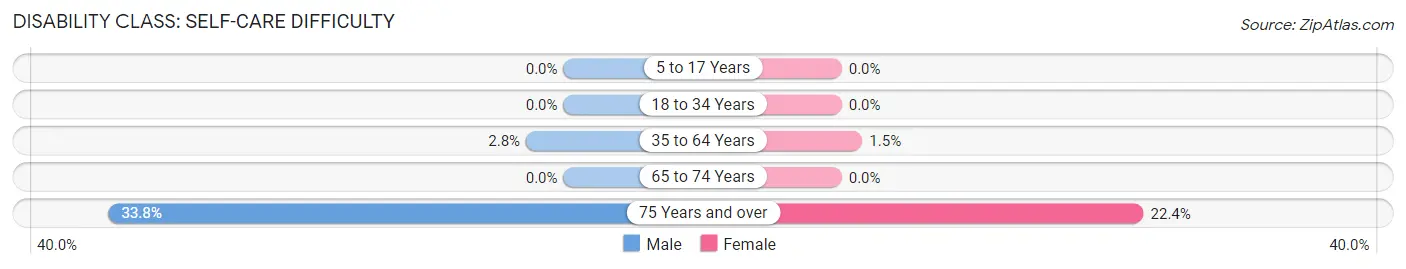
| Age Bracket | Male | Female |
| 5 to 17 Years | 0 (0.0%) | 0 (0.0%) |
| 18 to 34 Years | 0 (0.0%) | 0 (0.0%) |
| 35 to 64 Years | 18 (2.8%) | 11 (1.5%) |
| 65 to 74 Years | 0 (0.0%) | 0 (0.0%) |
| 75 Years and over | 26 (33.8%) | 26 (22.4%) |
Technology Access in Claryville
Computing Device Access in Claryville
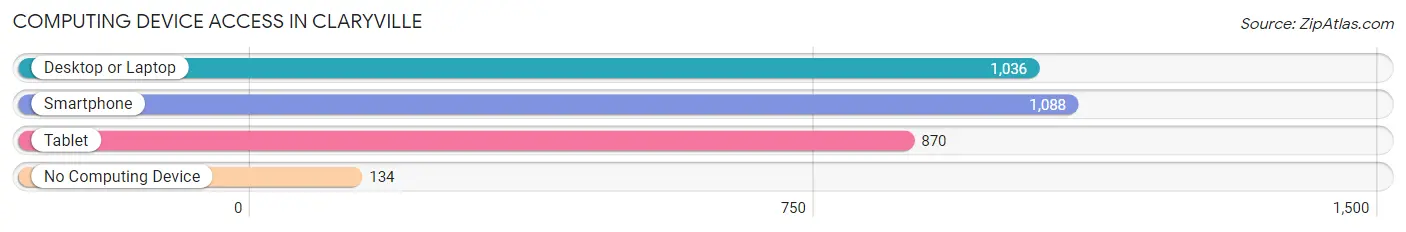
| Device Type | # Households | % Households |
| Desktop or Laptop | 1,036 | 79.0% |
| Smartphone | 1,088 | 82.9% |
| Tablet | 870 | 66.3% |
| No Computing Device | 134 | 10.2% |
| Total | 1,312 | 100.0% |
Internet Access in Claryville
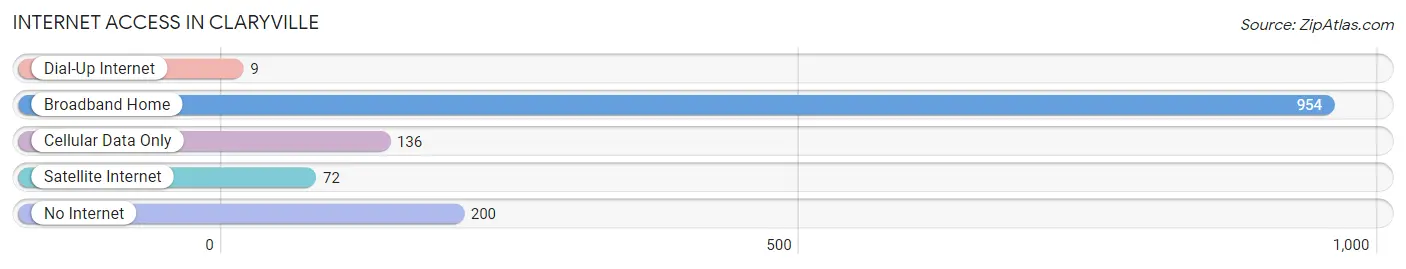
| Internet Type | # Households | % Households |
| Dial-Up Internet | 9 | 0.7% |
| Broadband Home | 954 | 72.7% |
| Cellular Data Only | 136 | 10.4% |
| Satellite Internet | 72 | 5.5% |
| No Internet | 200 | 15.2% |
| Total | 1,312 | 100.0% |
Claryville Summary
Claryville is a small unincorporated community located in the western part of Knox County, Kentucky. It is situated on the banks of the Cumberland River, approximately 10 miles east of Barbourville. The population of Claryville was estimated to be around 200 people in 2000.
History
Claryville was first settled in the early 1800s by the Clary family, who were among the first settlers in the area. The town was named after the family and was officially incorporated in 1845. The town was a thriving community in the late 1800s, with a post office, a general store, a blacksmith shop, a school, and several churches.
In the early 1900s, the town began to decline as the railroad bypassed it and the population began to move away. By the 1950s, the town had become a virtual ghost town, with only a few residents remaining.
Geography
Claryville is located in the western part of Knox County, Kentucky, on the banks of the Cumberland River. The town is situated at an elevation of 845 feet above sea level. The climate in Claryville is humid subtropical, with hot summers and mild winters.
The town is surrounded by rolling hills and farmland, with the Cumberland River providing a scenic backdrop. The nearest major city is Barbourville, which is located approximately 10 miles to the west.
Economy
The economy of Claryville is largely based on agriculture. The town is home to several small farms, which produce a variety of crops, including corn, soybeans, and hay. The town also has a few small businesses, including a general store and a gas station.
Demographics
As of the 2000 census, the population of Claryville was estimated to be around 200 people. The racial makeup of the town was 97.5% White, 0.5% African American, 0.5% Native American, and 1.5% from other races. The median household income was $25,000, and the median family income was $30,000.
Conclusion
Claryville is a small unincorporated community located in the western part of Knox County, Kentucky. It is situated on the banks of the Cumberland River, approximately 10 miles east of Barbourville. The population of Claryville was estimated to be around 200 people in 2000. The town is largely agricultural, with a few small businesses, and the median household income was $25,000. Claryville is a quiet, rural community with a rich history and a beautiful natural setting.
Common Questions
What is Per Capita Income in Claryville?
Per Capita income in Claryville is $34,441.
What is the Median Family Income in Claryville?
Median Family Income in Claryville is $97,112.
What is the Median Household income in Claryville?
Median Household Income in Claryville is $95,127.
What is Income or Wage Gap in Claryville?
Income or Wage Gap in Claryville is 37.7%.
Women in Claryville earn 62.3 cents for every dollar earned by a man.
What is Inequality or Gini Index in Claryville?
Inequality or Gini Index in Claryville is 0.36.
What is the Total Population of Claryville?
Total Population of Claryville is 3,364.
What is the Total Male Population of Claryville?
Total Male Population of Claryville is 1,618.
What is the Total Female Population of Claryville?
Total Female Population of Claryville is 1,746.
What is the Ratio of Males per 100 Females in Claryville?
There are 92.67 Males per 100 Females in Claryville.
What is the Ratio of Females per 100 Males in Claryville?
There are 107.91 Females per 100 Males in Claryville.
What is the Median Population Age in Claryville?
Median Population Age in Claryville is 37.4 Years.
What is the Average Family Size in Claryville
Average Family Size in Claryville is 3.0 People.
What is the Average Household Size in Claryville
Average Household Size in Claryville is 2.6 People.
How Large is the Labor Force in Claryville?
There are 1,537 People in the Labor Forcein in Claryville.
What is the Percentage of People in the Labor Force in Claryville?
63.5% of People are in the Labor Force in Claryville.
What is the Unemployment Rate in Claryville?
Unemployment Rate in Claryville is 2.9%.