Erlanger, KY Map & Demographics
Erlanger Map
Erlanger Overview
$39,877
PER CAPITA INCOME
$85,894
AVG FAMILY INCOME
$74,147
AVG HOUSEHOLD INCOME
21.5%
WAGE / INCOME GAP [ % ]
78.5¢/ $1
WAGE / INCOME GAP [ $ ]
$15,096
FAMILY INCOME DEFICIT
0.42
INEQUALITY / GINI INDEX
19,577
TOTAL POPULATION
9,783
MALE POPULATION
9,794
FEMALE POPULATION
99.89
MALES / 100 FEMALES
100.11
FEMALES / 100 MALES
39.0
MEDIAN AGE
3.0
AVG FAMILY SIZE
2.5
AVG HOUSEHOLD SIZE
11,129
LABOR FORCE [ PEOPLE ]
71.4%
PERCENT IN LABOR FORCE
4.5%
UNEMPLOYMENT RATE
Erlanger Zip Codes
Erlanger Area Codes
Income in Erlanger
Income Overview in Erlanger
Per Capita Income in Erlanger is $39,877, while median incomes of families and households are $85,894 and $74,147 respectively.
| Characteristic | Number | Measure |
| Per Capita Income | 19,577 | $39,877 |
| Median Family Income | 4,982 | $85,894 |
| Mean Family Income | 4,982 | $111,731 |
| Median Household Income | 7,875 | $74,147 |
| Mean Household Income | 7,875 | $97,581 |
| Income Deficit | 4,982 | $15,096 |
| Wage / Income Gap (%) | 19,577 | 21.46% |
| Wage / Income Gap ($) | 19,577 | 78.54¢ per $1 |
| Gini / Inequality Index | 19,577 | 0.42 |
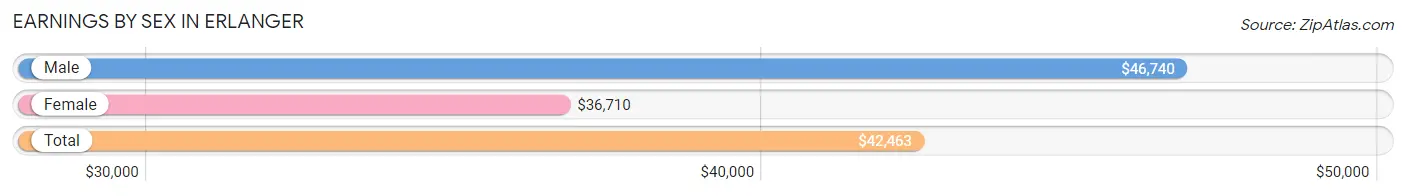
Earnings by Sex in Erlanger
Average Earnings in Erlanger are $42,463, $46,740 for men and $36,710 for women, a difference of 21.5%.
| Sex | Number | Average Earnings |
| Male | 5,949 (51.2%) | $46,740 |
| Female | 5,666 (48.8%) | $36,710 |
| Total | 11,615 (100.0%) | $42,463 |
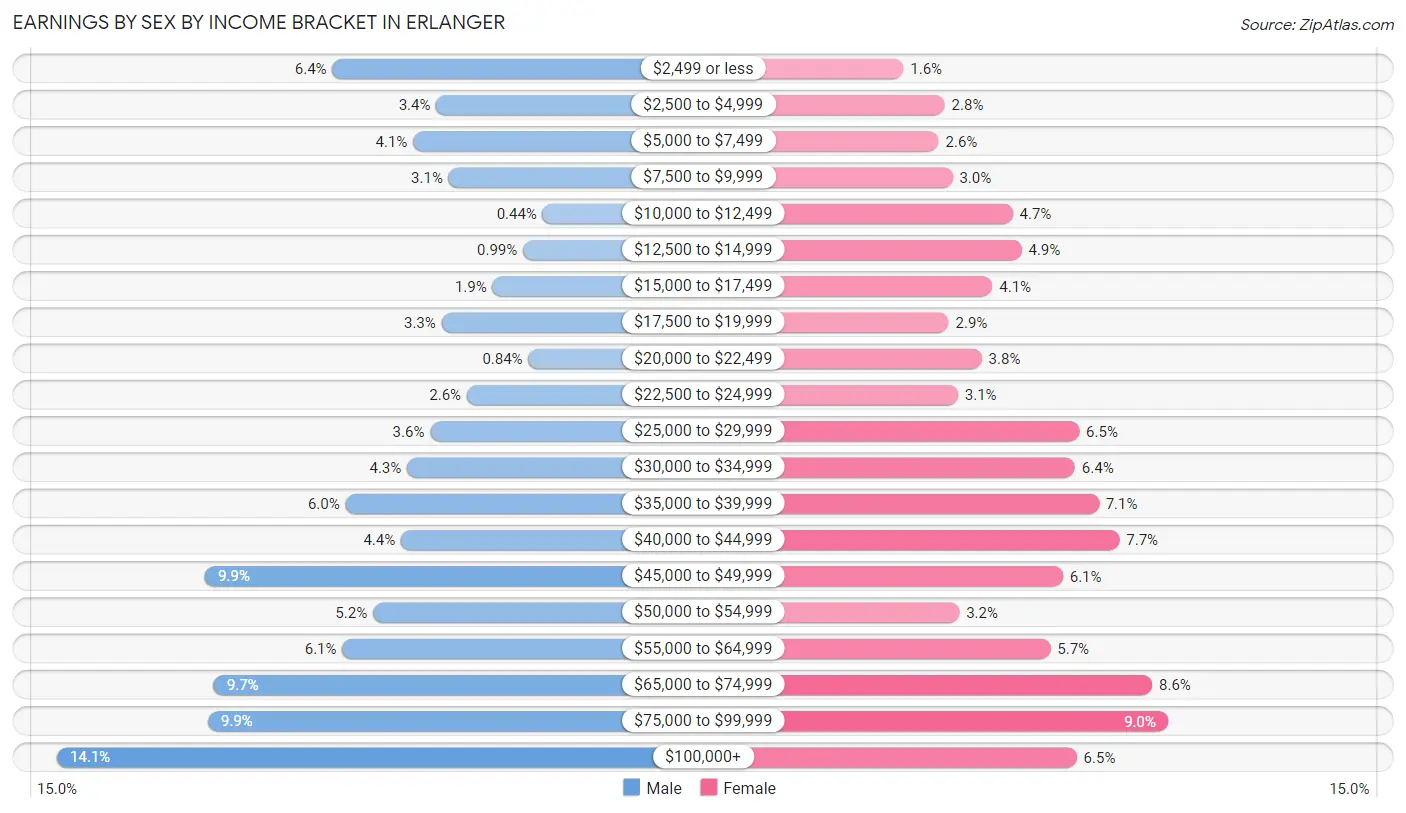
Earnings by Sex by Income Bracket in Erlanger
The most common earnings brackets in Erlanger are $100,000+ for men (838 | 14.1%) and $75,000 to $99,999 for women (511 | 9.0%).
| Income | Male | Female |
| $2,499 or less | 378 (6.4%) | 90 (1.6%) |
| $2,500 to $4,999 | 204 (3.4%) | 156 (2.8%) |
| $5,000 to $7,499 | 243 (4.1%) | 146 (2.6%) |
| $7,500 to $9,999 | 183 (3.1%) | 168 (3.0%) |
| $10,000 to $12,499 | 26 (0.4%) | 264 (4.7%) |
| $12,500 to $14,999 | 59 (1.0%) | 278 (4.9%) |
| $15,000 to $17,499 | 110 (1.8%) | 232 (4.1%) |
| $17,500 to $19,999 | 195 (3.3%) | 162 (2.9%) |
| $20,000 to $22,499 | 50 (0.8%) | 215 (3.8%) |
| $22,500 to $24,999 | 153 (2.6%) | 177 (3.1%) |
| $25,000 to $29,999 | 214 (3.6%) | 370 (6.5%) |
| $30,000 to $34,999 | 253 (4.3%) | 363 (6.4%) |
| $35,000 to $39,999 | 356 (6.0%) | 401 (7.1%) |
| $40,000 to $44,999 | 263 (4.4%) | 434 (7.7%) |
| $45,000 to $49,999 | 591 (9.9%) | 344 (6.1%) |
| $50,000 to $54,999 | 310 (5.2%) | 179 (3.2%) |
| $55,000 to $64,999 | 361 (6.1%) | 324 (5.7%) |
| $65,000 to $74,999 | 576 (9.7%) | 486 (8.6%) |
| $75,000 to $99,999 | 586 (9.9%) | 511 (9.0%) |
| $100,000+ | 838 (14.1%) | 366 (6.5%) |
| Total | 5,949 (100.0%) | 5,666 (100.0%) |
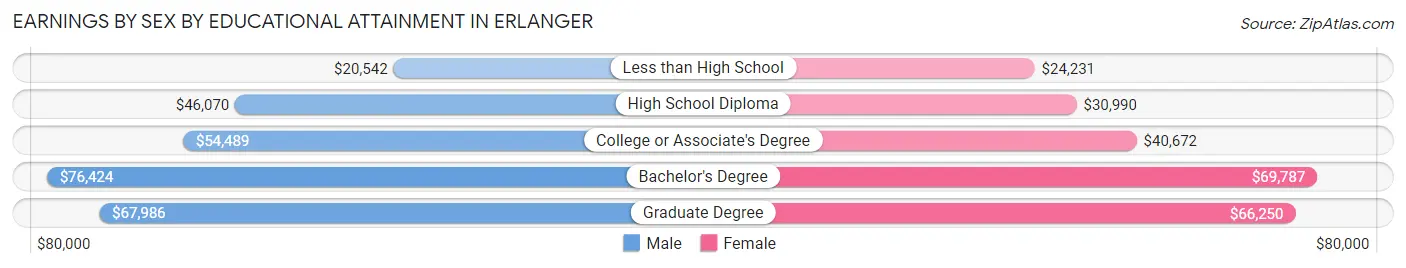
Earnings by Sex by Educational Attainment in Erlanger
Average earnings in Erlanger are $53,361 for men and $43,760 for women, a difference of 18.0%. Men with an educational attainment of bachelor's degree enjoy the highest average annual earnings of $76,424, while those with less than high school education earn the least with $20,542. Women with an educational attainment of bachelor's degree earn the most with the average annual earnings of $69,787, while those with less than high school education have the smallest earnings of $24,231.
| Educational Attainment | Male Income | Female Income |
| Less than High School | $20,542 | $24,231 |
| High School Diploma | $46,070 | $30,990 |
| College or Associate's Degree | $54,489 | $40,672 |
| Bachelor's Degree | $76,424 | $69,787 |
| Graduate Degree | $67,986 | $66,250 |
| Total | $53,361 | $43,760 |
Family Income in Erlanger
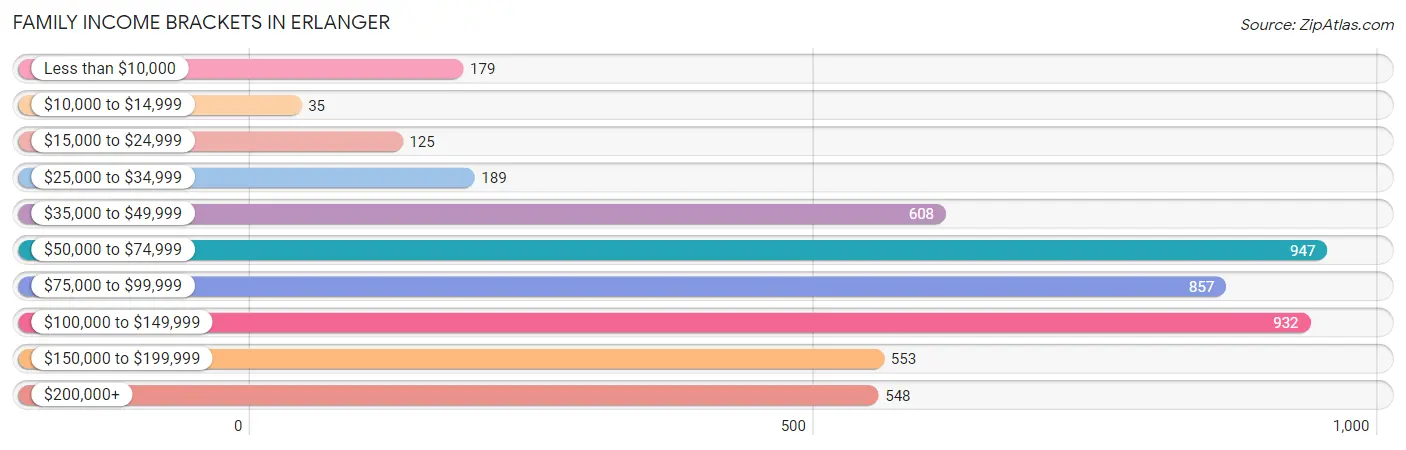
Family Income Brackets in Erlanger
According to the Erlanger family income data, there are 947 families falling into the $50,000 to $74,999 income range, which is the most common income bracket and makes up 19.0% of all families. Conversely, the $10,000 to $14,999 income bracket is the least frequent group with only 35 families (0.7%) belonging to this category.
| Income Bracket | # Families | % Families |
| Less than $10,000 | 179 | 3.6% |
| $10,000 to $14,999 | 35 | 0.7% |
| $15,000 to $24,999 | 125 | 2.5% |
| $25,000 to $34,999 | 189 | 3.8% |
| $35,000 to $49,999 | 608 | 12.2% |
| $50,000 to $74,999 | 947 | 19.0% |
| $75,000 to $99,999 | 857 | 17.2% |
| $100,000 to $149,999 | 932 | 18.7% |
| $150,000 to $199,999 | 553 | 11.1% |
| $200,000+ | 548 | 11.0% |
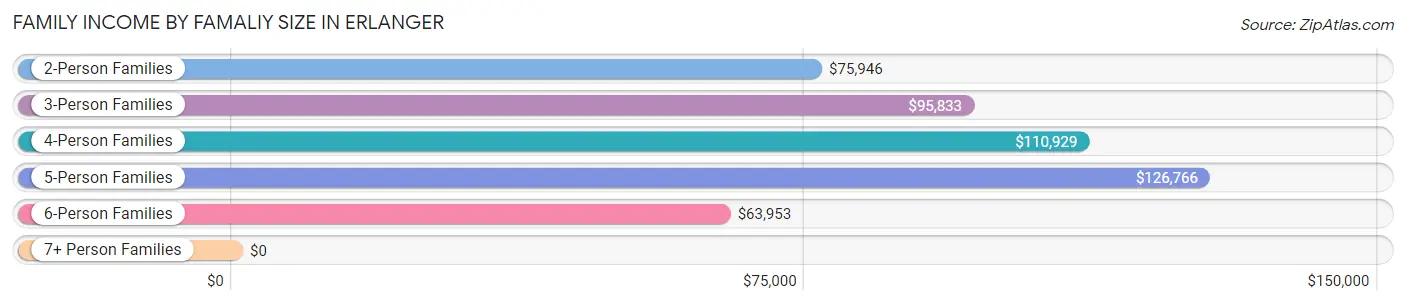
Family Income by Famaliy Size in Erlanger
5-person families (359 | 7.2%) account for the highest median family income in Erlanger with $126,766 per family, while 2-person families (2,653 | 53.2%) have the highest median income of $37,973 per family member.
| Income Bracket | # Families | Median Income |
| 2-Person Families | 2,653 (53.2%) | $75,946 |
| 3-Person Families | 1,032 (20.7%) | $95,833 |
| 4-Person Families | 740 (14.8%) | $110,929 |
| 5-Person Families | 359 (7.2%) | $126,766 |
| 6-Person Families | 151 (3.0%) | $63,953 |
| 7+ Person Families | 47 (0.9%) | $0 |
| Total | 4,982 (100.0%) | $85,894 |
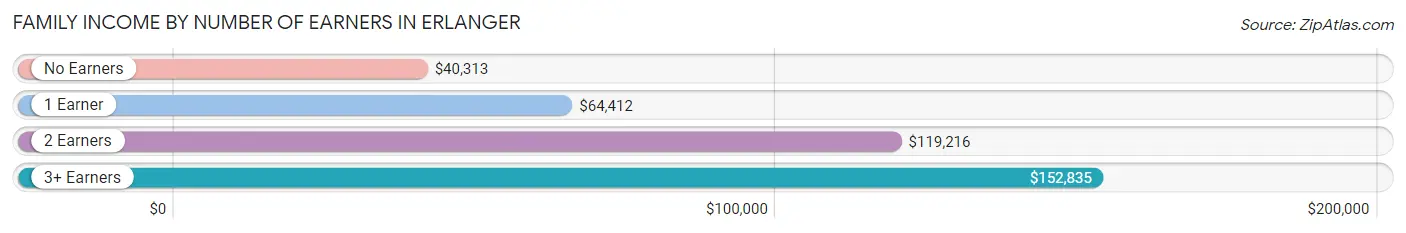
Family Income by Number of Earners in Erlanger
The median family income in Erlanger is $85,894, with families comprising 3+ earners (624) having the highest median family income of $152,835, while families with no earners (690) have the lowest median family income of $40,313, accounting for 12.5% and 13.9% of families, respectively.
| Number of Earners | # Families | Median Income |
| No Earners | 690 (13.9%) | $40,313 |
| 1 Earner | 1,468 (29.5%) | $64,412 |
| 2 Earners | 2,200 (44.2%) | $119,216 |
| 3+ Earners | 624 (12.5%) | $152,835 |
| Total | 4,982 (100.0%) | $85,894 |
Household Income in Erlanger
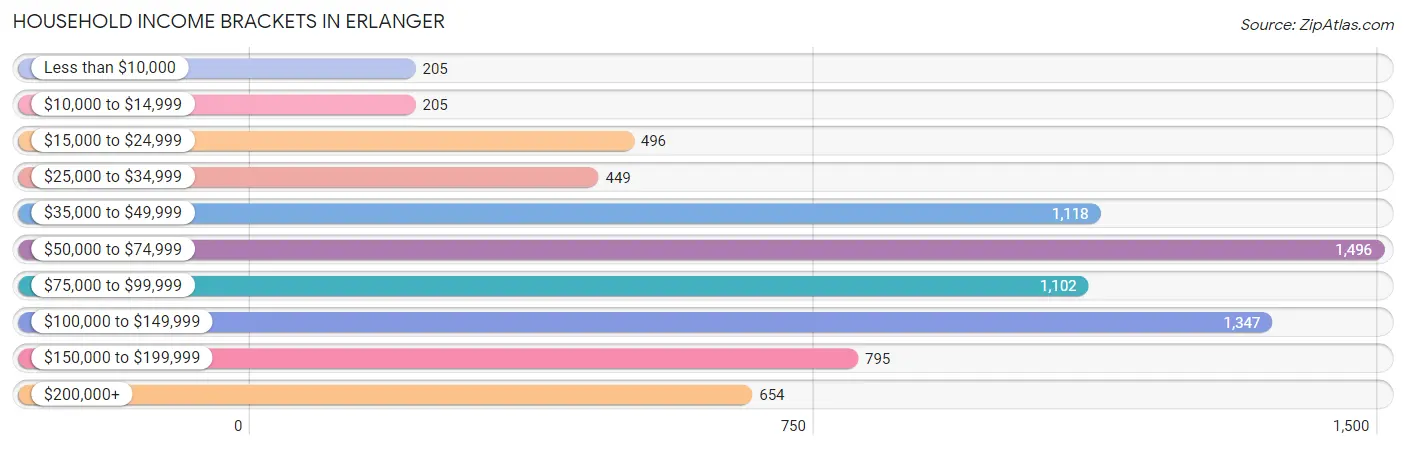
Household Income Brackets in Erlanger
With 1,496 households falling in the category, the $50,000 to $74,999 income range is the most frequent in Erlanger, accounting for 19.0% of all households. In contrast, only 205 households (2.6%) fall into the less than $10,000 income bracket, making it the least populous group.
| Income Bracket | # Households | % Households |
| Less than $10,000 | 205 | 2.6% |
| $10,000 to $14,999 | 205 | 2.6% |
| $15,000 to $24,999 | 496 | 6.3% |
| $25,000 to $34,999 | 449 | 5.7% |
| $35,000 to $49,999 | 1,118 | 14.2% |
| $50,000 to $74,999 | 1,496 | 19.0% |
| $75,000 to $99,999 | 1,102 | 14.0% |
| $100,000 to $149,999 | 1,347 | 17.1% |
| $150,000 to $199,999 | 795 | 10.1% |
| $200,000+ | 654 | 8.3% |
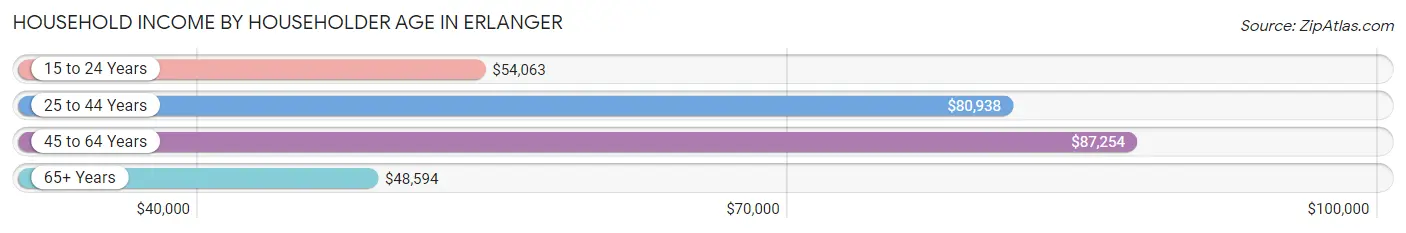
Household Income by Householder Age in Erlanger
The median household income in Erlanger is $74,147, with the highest median household income of $87,254 found in the 45 to 64 years age bracket for the primary householder. A total of 3,060 households (38.9%) fall into this category. Meanwhile, the 65+ years age bracket for the primary householder has the lowest median household income of $48,594, with 1,725 households (21.9%) in this group.
| Income Bracket | # Households | Median Income |
| 15 to 24 Years | 392 (5.0%) | $54,063 |
| 25 to 44 Years | 2,698 (34.3%) | $80,938 |
| 45 to 64 Years | 3,060 (38.9%) | $87,254 |
| 65+ Years | 1,725 (21.9%) | $48,594 |
| Total | 7,875 (100.0%) | $74,147 |
Poverty in Erlanger
Income Below Poverty by Sex and Age in Erlanger
With 8.8% poverty level for males and 11.9% for females among the residents of Erlanger, 16 and 17 year old males and 6 to 11 year old females are the most vulnerable to poverty, with 139 males (38.7%) and 293 females (43.8%) in their respective age groups living below the poverty level.
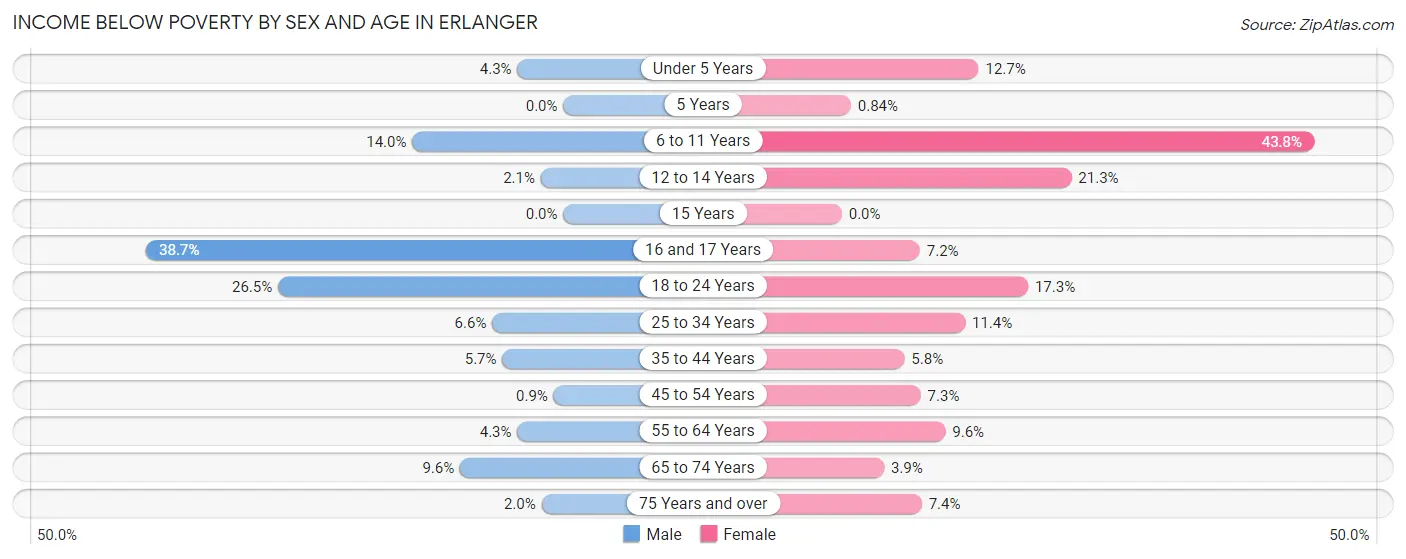
| Age Bracket | Male | Female |
| Under 5 Years | 28 (4.3%) | 66 (12.7%) |
| 5 Years | 0 (0.0%) | 1 (0.8%) |
| 6 to 11 Years | 112 (14.0%) | 293 (43.8%) |
| 12 to 14 Years | 5 (2.1%) | 101 (21.3%) |
| 15 Years | 0 (0.0%) | 0 (0.0%) |
| 16 and 17 Years | 139 (38.7%) | 21 (7.2%) |
| 18 to 24 Years | 272 (26.5%) | 154 (17.3%) |
| 25 to 34 Years | 80 (6.6%) | 148 (11.4%) |
| 35 to 44 Years | 61 (5.7%) | 75 (5.8%) |
| 45 to 54 Years | 12 (0.9%) | 90 (7.3%) |
| 55 to 64 Years | 58 (4.3%) | 128 (9.6%) |
| 65 to 74 Years | 81 (9.6%) | 36 (3.9%) |
| 75 Years and over | 10 (2.0%) | 35 (7.4%) |
| Total | 858 (8.8%) | 1,148 (11.9%) |
Income Above Poverty by Sex and Age in Erlanger
According to the poverty statistics in Erlanger, males aged 5 years and females aged 15 years are the age groups that are most secure financially, with 100.0% of males and 100.0% of females in these age groups living above the poverty line.
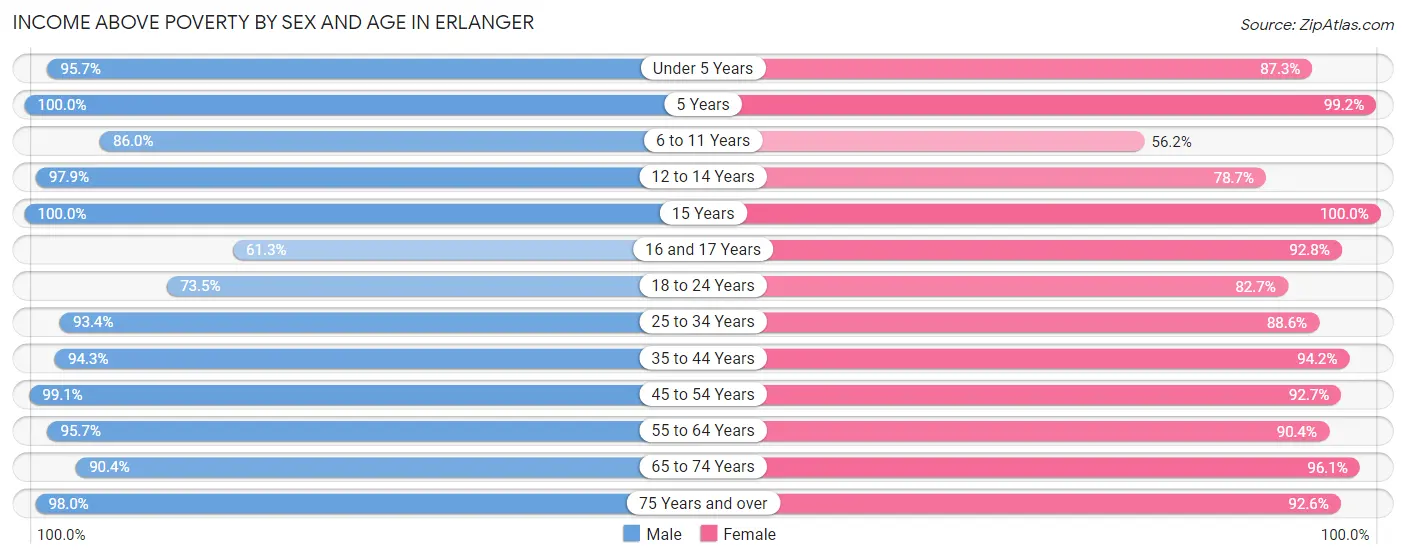
| Age Bracket | Male | Female |
| Under 5 Years | 630 (95.7%) | 454 (87.3%) |
| 5 Years | 135 (100.0%) | 118 (99.2%) |
| 6 to 11 Years | 687 (86.0%) | 376 (56.2%) |
| 12 to 14 Years | 234 (97.9%) | 373 (78.7%) |
| 15 Years | 196 (100.0%) | 102 (100.0%) |
| 16 and 17 Years | 220 (61.3%) | 269 (92.8%) |
| 18 to 24 Years | 755 (73.5%) | 737 (82.7%) |
| 25 to 34 Years | 1,132 (93.4%) | 1,146 (88.6%) |
| 35 to 44 Years | 1,017 (94.3%) | 1,216 (94.2%) |
| 45 to 54 Years | 1,316 (99.1%) | 1,139 (92.7%) |
| 55 to 64 Years | 1,301 (95.7%) | 1,204 (90.4%) |
| 65 to 74 Years | 764 (90.4%) | 885 (96.1%) |
| 75 Years and over | 486 (98.0%) | 437 (92.6%) |
| Total | 8,873 (91.2%) | 8,456 (88.0%) |
Income Below Poverty Among Married-Couple Families in Erlanger
The poverty statistics for married-couple families in Erlanger show that 1.8% or 62 of the total 3,472 families live below the poverty line. Families with 3 or 4 children have the highest poverty rate of 2.3%, comprising of 8 families. On the other hand, families with 5 or more children have the lowest poverty rate of 0.0%, which includes 0 families.
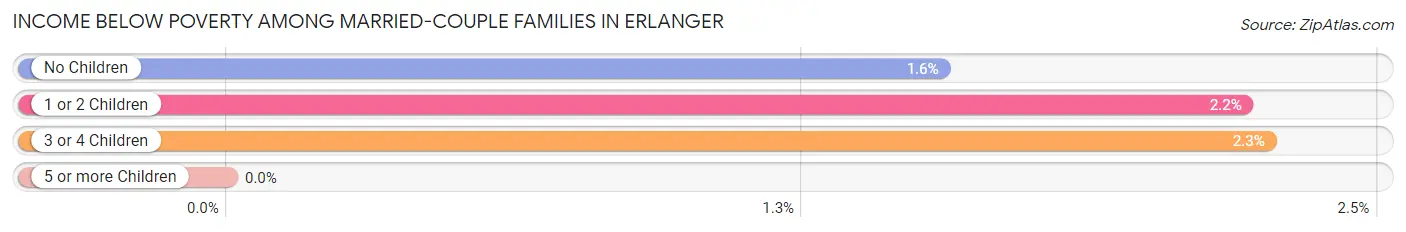
| Children | Above Poverty | Below Poverty |
| No Children | 2,164 (98.5%) | 34 (1.5%) |
| 1 or 2 Children | 884 (97.8%) | 20 (2.2%) |
| 3 or 4 Children | 346 (97.7%) | 8 (2.3%) |
| 5 or more Children | 16 (100.0%) | 0 (0.0%) |
| Total | 3,410 (98.2%) | 62 (1.8%) |
Income Below Poverty Among Single-Parent Households in Erlanger
According to the poverty data in Erlanger, 14.2% or 59 single-father households and 17.1% or 187 single-mother households are living below the poverty line. Among single-father households, those with 1 or 2 children have the highest poverty rate, with 59 households (35.5%) experiencing poverty. Likewise, among single-mother households, those with 5 or more children have the highest poverty rate, with 46 households (55.4%) falling below the poverty line.
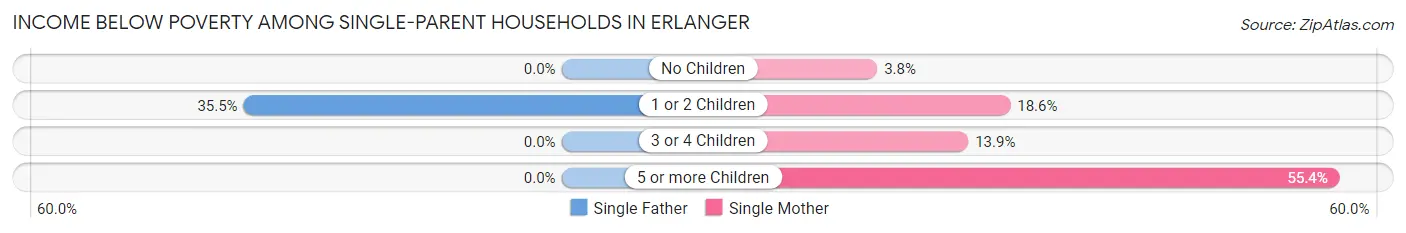
| Children | Single Father | Single Mother |
| No Children | 0 (0.0%) | 11 (3.7%) |
| 1 or 2 Children | 59 (35.5%) | 119 (18.6%) |
| 3 or 4 Children | 0 (0.0%) | 11 (13.9%) |
| 5 or more Children | 0 (0.0%) | 46 (55.4%) |
| Total | 59 (14.2%) | 187 (17.1%) |
Income Below Poverty Among Married-Couple vs Single-Parent Households in Erlanger
The poverty data for Erlanger shows that 62 of the married-couple family households (1.8%) and 246 of the single-parent households (16.3%) are living below the poverty level. Within the married-couple family households, those with 3 or 4 children have the highest poverty rate, with 8 households (2.3%) falling below the poverty line. Among the single-parent households, those with 5 or more children have the highest poverty rate, with 46 household (55.4%) living below poverty.
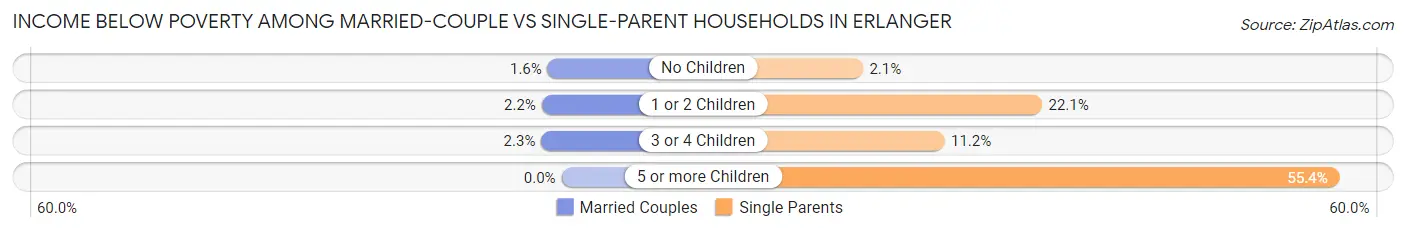
| Children | Married-Couple Families | Single-Parent Households |
| No Children | 34 (1.5%) | 11 (2.1%) |
| 1 or 2 Children | 20 (2.2%) | 178 (22.1%) |
| 3 or 4 Children | 8 (2.3%) | 11 (11.2%) |
| 5 or more Children | 0 (0.0%) | 46 (55.4%) |
| Total | 62 (1.8%) | 246 (16.3%) |
Race in Erlanger
The most populous races in Erlanger are White / Caucasian (17,033 | 87.0%), Two or more Races (1,225 | 6.3%), and Black / African American (870 | 4.4%).
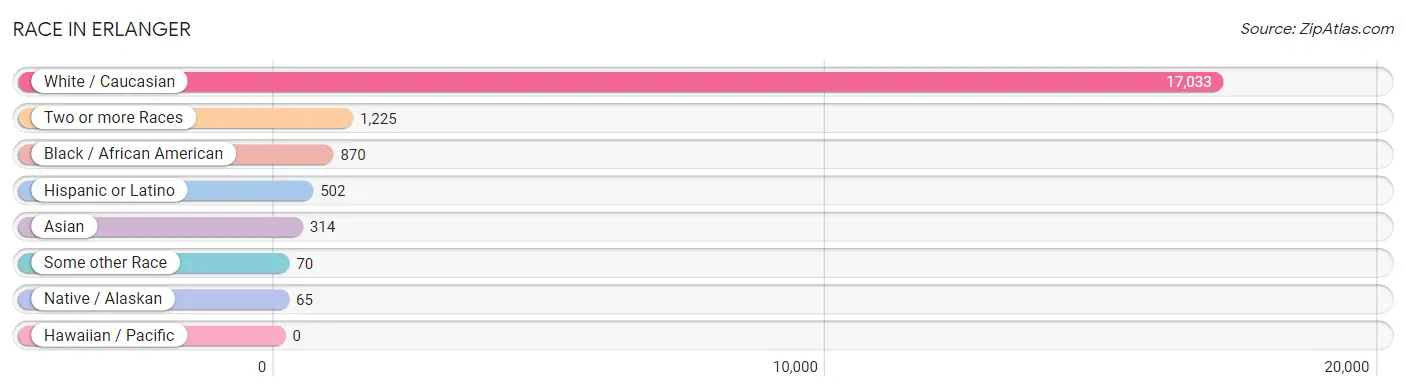
| Race | # Population | % Population |
| Asian | 314 | 1.6% |
| Black / African American | 870 | 4.4% |
| Hawaiian / Pacific | 0 | 0.0% |
| Hispanic or Latino | 502 | 2.6% |
| Native / Alaskan | 65 | 0.3% |
| White / Caucasian | 17,033 | 87.0% |
| Two or more Races | 1,225 | 6.3% |
| Some other Race | 70 | 0.4% |
| Total | 19,577 | 100.0% |
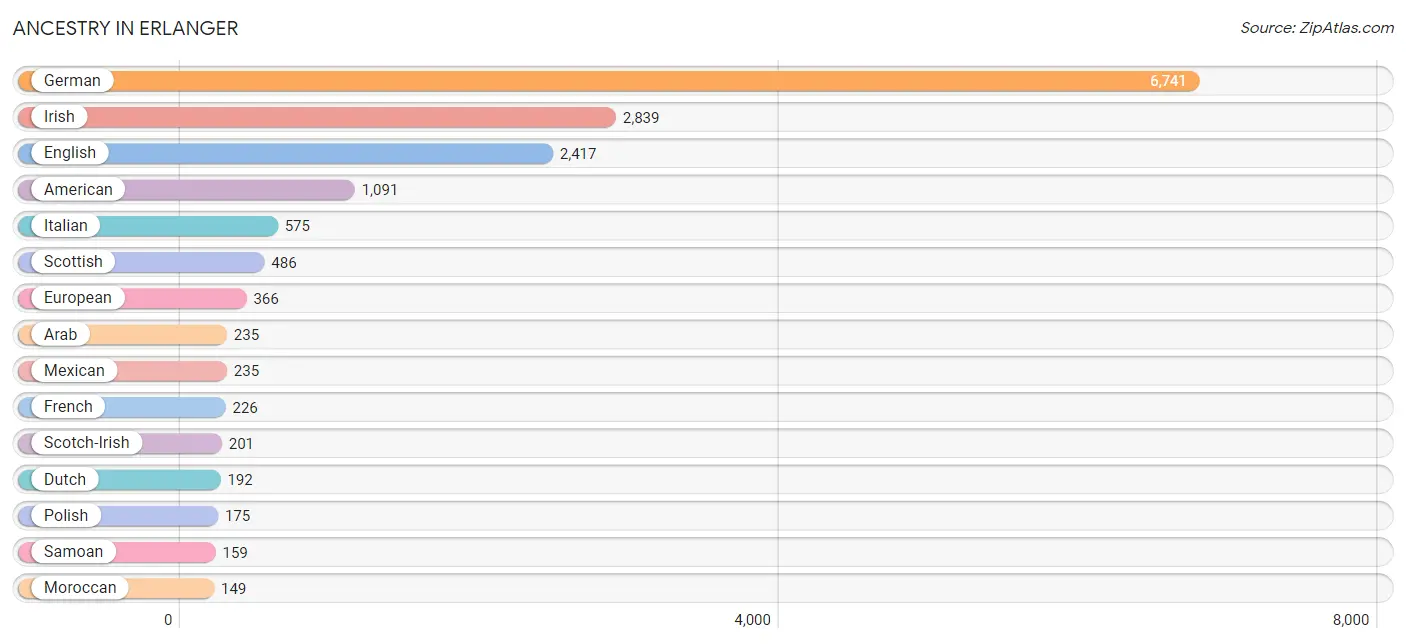
Ancestry in Erlanger
The most populous ancestries reported in Erlanger are German (6,741 | 34.4%), Irish (2,839 | 14.5%), English (2,417 | 12.3%), American (1,091 | 5.6%), and Italian (575 | 2.9%), together accounting for 69.8% of all Erlanger residents.
| Ancestry | # Population | % Population |
| African | 14 | 0.1% |
| American | 1,091 | 5.6% |
| Arab | 235 | 1.2% |
| Austrian | 13 | 0.1% |
| Bhutanese | 56 | 0.3% |
| Blackfeet | 6 | 0.0% |
| British | 146 | 0.7% |
| Burmese | 97 | 0.5% |
| Central American | 112 | 0.6% |
| Cherokee | 119 | 0.6% |
| Colombian | 33 | 0.2% |
| Cree | 1 | 0.0% |
| Croatian | 19 | 0.1% |
| Czechoslovakian | 15 | 0.1% |
| Dutch | 192 | 1.0% |
| English | 2,417 | 12.3% |
| European | 366 | 1.9% |
| French | 226 | 1.1% |
| French Canadian | 135 | 0.7% |
| German | 6,741 | 34.4% |
| Greek | 46 | 0.2% |
| Guatemalan | 67 | 0.3% |
| Honduran | 45 | 0.2% |
| Indian (Asian) | 80 | 0.4% |
| Irish | 2,839 | 14.5% |
| Iroquois | 4 | 0.0% |
| Italian | 575 | 2.9% |
| Korean | 89 | 0.4% |
| Mexican | 235 | 1.2% |
| Mexican American Indian | 111 | 0.6% |
| Moroccan | 149 | 0.8% |
| Norwegian | 74 | 0.4% |
| Pakistani | 5 | 0.0% |
| Pennsylvania German | 28 | 0.1% |
| Peruvian | 21 | 0.1% |
| Polish | 175 | 0.9% |
| Puerto Rican | 39 | 0.2% |
| Russian | 46 | 0.2% |
| Samoan | 159 | 0.8% |
| Scotch-Irish | 201 | 1.0% |
| Scottish | 486 | 2.5% |
| Slovak | 26 | 0.1% |
| South American | 74 | 0.4% |
| Spaniard | 12 | 0.1% |
| Subsaharan African | 28 | 0.1% |
| Swedish | 45 | 0.2% |
| Swiss | 61 | 0.3% |
| Thai | 75 | 0.4% |
| Ukrainian | 15 | 0.1% |
| Venezuelan | 20 | 0.1% |
| Welsh | 101 | 0.5% | View All 51 Rows |
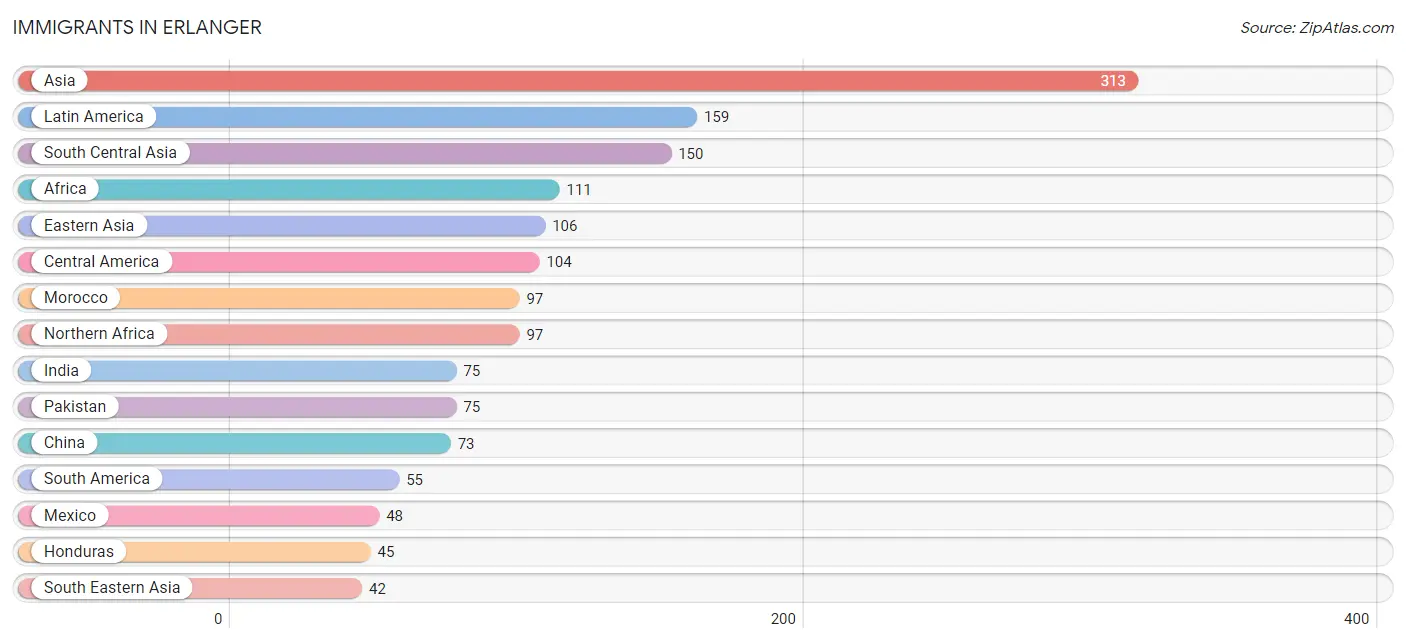
Immigrants in Erlanger
The most numerous immigrant groups reported in Erlanger came from Asia (313 | 1.6%), Latin America (159 | 0.8%), South Central Asia (150 | 0.8%), Africa (111 | 0.6%), and Eastern Asia (106 | 0.5%), together accounting for 4.3% of all Erlanger residents.
| Immigration Origin | # Population | % Population |
| Africa | 111 | 0.6% |
| Asia | 313 | 1.6% |
| Canada | 11 | 0.1% |
| Central America | 104 | 0.5% |
| China | 73 | 0.4% |
| Colombia | 14 | 0.1% |
| Eastern Asia | 106 | 0.5% |
| England | 18 | 0.1% |
| Europe | 32 | 0.2% |
| Germany | 14 | 0.1% |
| Guatemala | 11 | 0.1% |
| Honduras | 45 | 0.2% |
| India | 75 | 0.4% |
| Korea | 33 | 0.2% |
| Latin America | 159 | 0.8% |
| Mexico | 48 | 0.3% |
| Morocco | 97 | 0.5% |
| Northern Africa | 97 | 0.5% |
| Northern Europe | 18 | 0.1% |
| Pakistan | 75 | 0.4% |
| Peru | 21 | 0.1% |
| Philippines | 26 | 0.1% |
| South America | 55 | 0.3% |
| South Central Asia | 150 | 0.8% |
| South Eastern Asia | 42 | 0.2% |
| Thailand | 16 | 0.1% |
| Venezuela | 20 | 0.1% |
| Western Africa | 14 | 0.1% |
| Western Europe | 14 | 0.1% | View All 29 Rows |
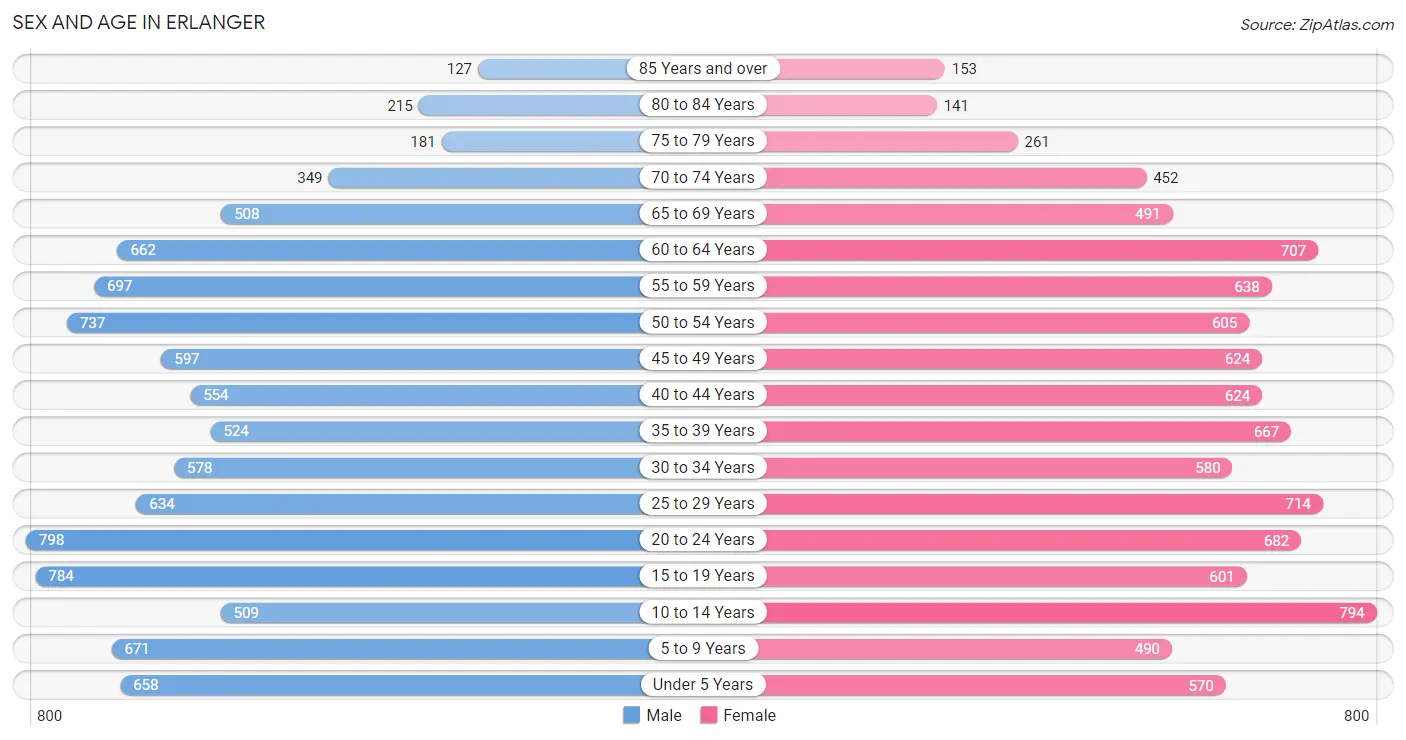
Sex and Age in Erlanger
Sex and Age in Erlanger
The most populous age groups in Erlanger are 20 to 24 Years (798 | 8.2%) for men and 10 to 14 Years (794 | 8.1%) for women.
| Age Bracket | Male | Female |
| Under 5 Years | 658 (6.7%) | 570 (5.8%) |
| 5 to 9 Years | 671 (6.9%) | 490 (5.0%) |
| 10 to 14 Years | 509 (5.2%) | 794 (8.1%) |
| 15 to 19 Years | 784 (8.0%) | 601 (6.1%) |
| 20 to 24 Years | 798 (8.2%) | 682 (7.0%) |
| 25 to 29 Years | 634 (6.5%) | 714 (7.3%) |
| 30 to 34 Years | 578 (5.9%) | 580 (5.9%) |
| 35 to 39 Years | 524 (5.4%) | 667 (6.8%) |
| 40 to 44 Years | 554 (5.7%) | 624 (6.4%) |
| 45 to 49 Years | 597 (6.1%) | 624 (6.4%) |
| 50 to 54 Years | 737 (7.5%) | 605 (6.2%) |
| 55 to 59 Years | 697 (7.1%) | 638 (6.5%) |
| 60 to 64 Years | 662 (6.8%) | 707 (7.2%) |
| 65 to 69 Years | 508 (5.2%) | 491 (5.0%) |
| 70 to 74 Years | 349 (3.6%) | 452 (4.6%) |
| 75 to 79 Years | 181 (1.8%) | 261 (2.7%) |
| 80 to 84 Years | 215 (2.2%) | 141 (1.4%) |
| 85 Years and over | 127 (1.3%) | 153 (1.6%) |
| Total | 9,783 (100.0%) | 9,794 (100.0%) |
Families and Households in Erlanger
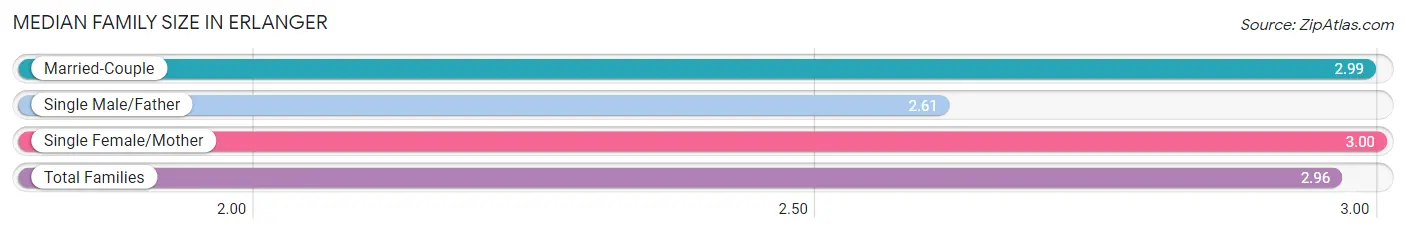
Median Family Size in Erlanger
The median family size in Erlanger is 2.96 persons per family, with single female/mother families (1,094 | 22.0%) accounting for the largest median family size of 3 persons per family. On the other hand, single male/father families (416 | 8.4%) represent the smallest median family size with 2.61 persons per family.
| Family Type | # Families | Family Size |
| Married-Couple | 3,472 (69.7%) | 2.99 |
| Single Male/Father | 416 (8.4%) | 2.61 |
| Single Female/Mother | 1,094 (22.0%) | 3.00 |
| Total Families | 4,982 (100.0%) | 2.96 |
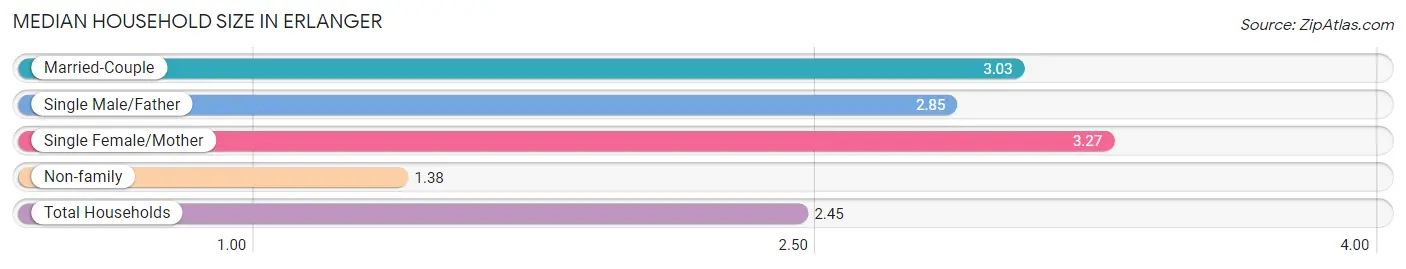
Median Household Size in Erlanger
The median household size in Erlanger is 2.45 persons per household, with single female/mother households (1,094 | 13.9%) accounting for the largest median household size of 3.27 persons per household. non-family households (2,893 | 36.7%) represent the smallest median household size with 1.38 persons per household.
| Household Type | # Households | Household Size |
| Married-Couple | 3,472 (44.1%) | 3.03 |
| Single Male/Father | 416 (5.3%) | 2.85 |
| Single Female/Mother | 1,094 (13.9%) | 3.27 |
| Non-family | 2,893 (36.7%) | 1.38 |
| Total Households | 7,875 (100.0%) | 2.45 |
Household Size by Marriage Status in Erlanger
Out of a total of 7,875 households in Erlanger, 4,982 (63.3%) are family households, while 2,893 (36.7%) are nonfamily households. The most numerous type of family households are 2-person households, comprising 2,420, and the most common type of nonfamily households are 1-person households, comprising 1,944.
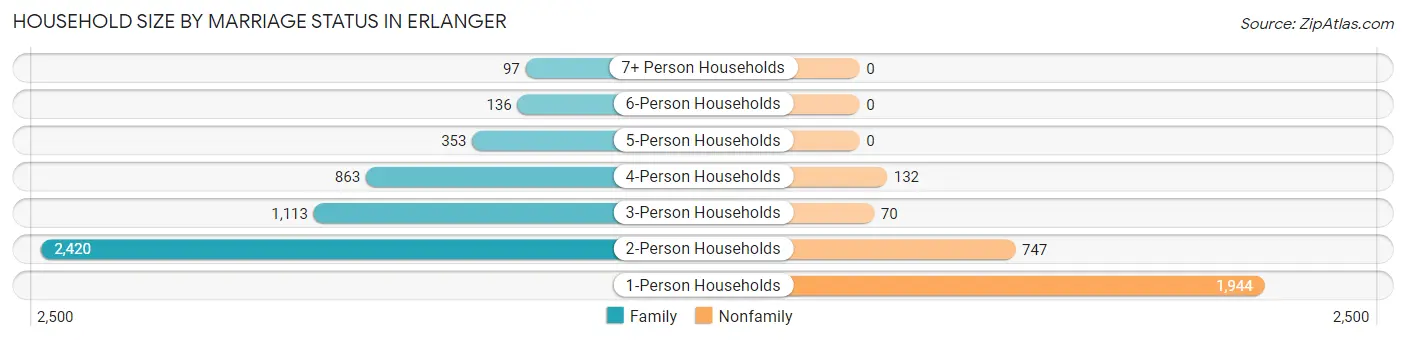
| Household Size | Family Households | Nonfamily Households |
| 1-Person Households | - | 1,944 (24.7%) |
| 2-Person Households | 2,420 (30.7%) | 747 (9.5%) |
| 3-Person Households | 1,113 (14.1%) | 70 (0.9%) |
| 4-Person Households | 863 (11.0%) | 132 (1.7%) |
| 5-Person Households | 353 (4.5%) | 0 (0.0%) |
| 6-Person Households | 136 (1.7%) | 0 (0.0%) |
| 7+ Person Households | 97 (1.2%) | 0 (0.0%) |
| Total | 4,982 (63.3%) | 2,893 (36.7%) |
Female Fertility in Erlanger
Fertility by Age in Erlanger
Average fertility rate in Erlanger is 53.0 births per 1,000 women. Women in the age bracket of 20 to 34 years have the highest fertility rate with 124.0 births per 1,000 women. Women in the age bracket of 20 to 34 years acount for 100.0% of all women with births.
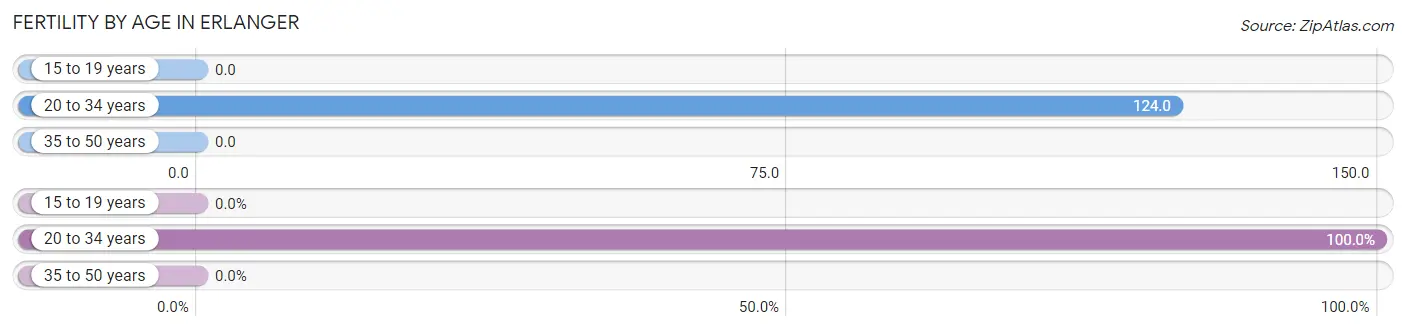
| Age Bracket | Women with Births | Births / 1,000 Women |
| 15 to 19 years | 0 (0.0%) | 0.0 |
| 20 to 34 years | 245 (100.0%) | 124.0 |
| 35 to 50 years | 0 (0.0%) | 0.0 |
| Total | 245 (100.0%) | 53.0 |
Fertility by Age by Marriage Status in Erlanger
62.4% of women with births (245) in Erlanger are married. The highest percentage of unmarried women with births falls into 20 to 34 years age bracket with 37.6% of them unmarried at the time of birth, while the lowest percentage of unmarried women with births belong to 20 to 34 years age bracket with 37.5% of them unmarried.
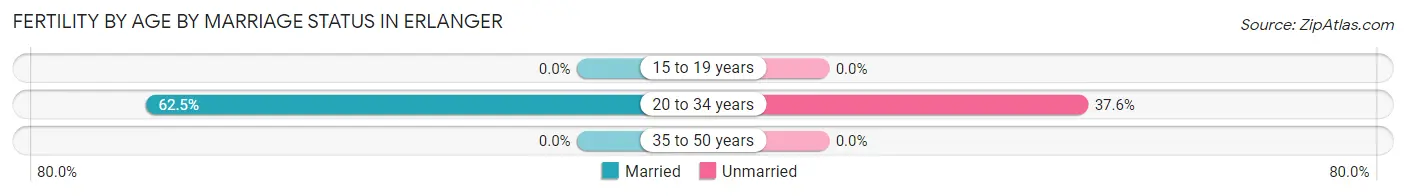
| Age Bracket | Married | Unmarried |
| 15 to 19 years | 0 (0.0%) | 0 (0.0%) |
| 20 to 34 years | 153 (62.5%) | 92 (37.6%) |
| 35 to 50 years | 0 (0.0%) | 0 (0.0%) |
| Total | 153 (62.5%) | 92 (37.6%) |
Fertility by Education in Erlanger
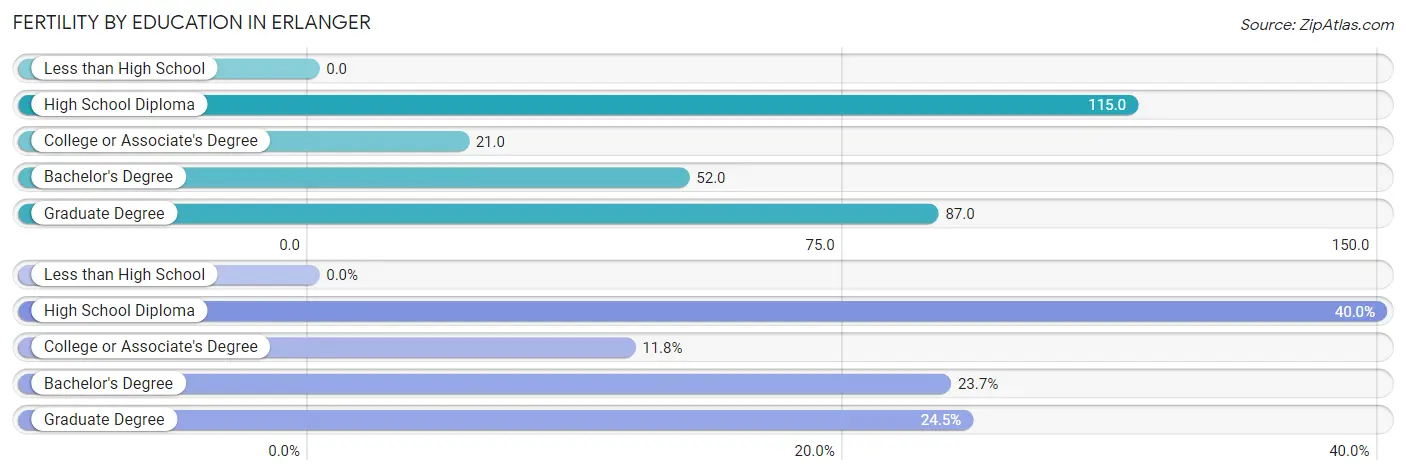
| Educational Attainment | Women with Births | Births / 1,000 Women |
| Less than High School | 0 (0.0%) | 0.0 |
| High School Diploma | 98 (40.0%) | 115.0 |
| College or Associate's Degree | 29 (11.8%) | 21.0 |
| Bachelor's Degree | 58 (23.7%) | 52.0 |
| Graduate Degree | 60 (24.5%) | 87.0 |
| Total | 245 (100.0%) | 53.0 |
Fertility by Education by Marriage Status in Erlanger
37.6% of women with births in Erlanger are unmarried. Women with the educational attainment of bachelor's degree are most likely to be married with 100.0% of them married at childbirth, while women with the educational attainment of high school diploma are least likely to be married with 84.7% of them unmarried at childbirth.
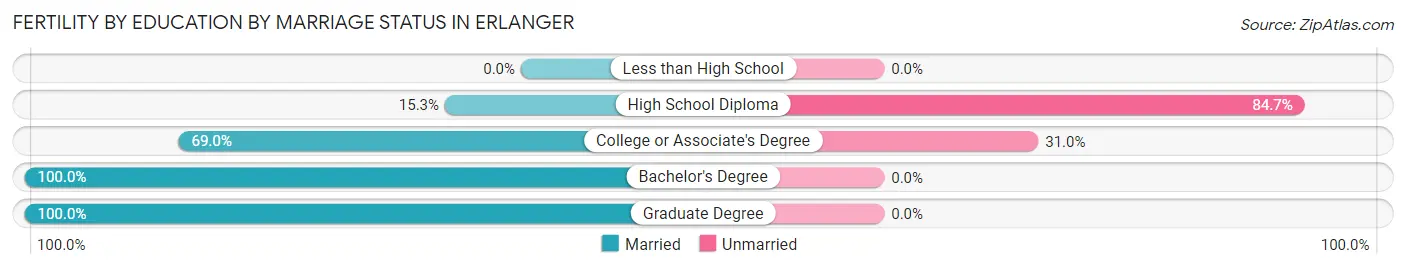
| Educational Attainment | Married | Unmarried |
| Less than High School | 0 (0.0%) | 0 (0.0%) |
| High School Diploma | 15 (15.3%) | 83 (84.7%) |
| College or Associate's Degree | 20 (69.0%) | 9 (31.0%) |
| Bachelor's Degree | 58 (100.0%) | 0 (0.0%) |
| Graduate Degree | 60 (100.0%) | 0 (0.0%) |
| Total | 153 (62.5%) | 92 (37.6%) |
Employment Characteristics in Erlanger
Employment by Class of Employer in Erlanger
Among the 10,528 employed individuals in Erlanger, private company employees (7,677 | 72.9%), not-for-profit organizations (1,138 | 10.8%), and local government employees (598 | 5.7%) make up the most common classes of employment.
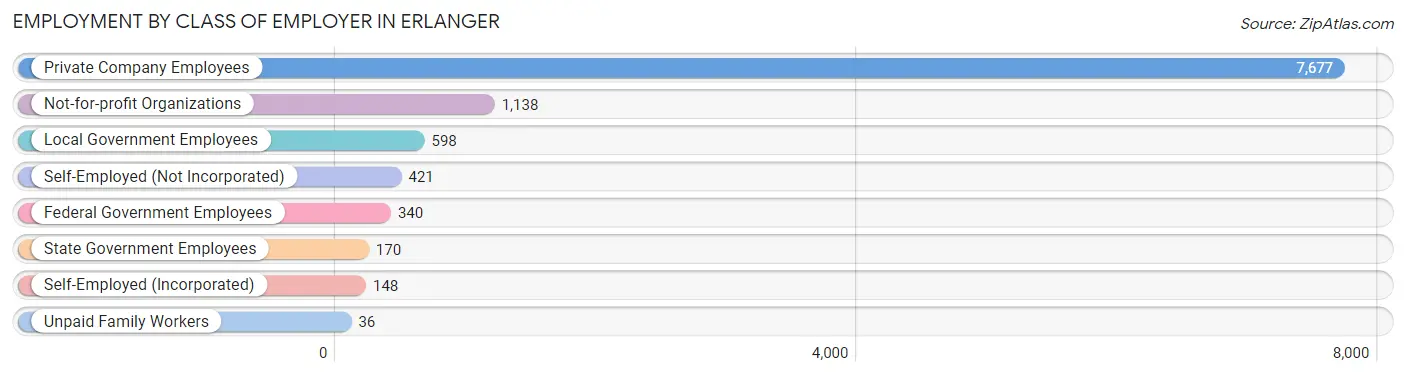
| Employer Class | # Employees | % Employees |
| Private Company Employees | 7,677 | 72.9% |
| Self-Employed (Incorporated) | 148 | 1.4% |
| Self-Employed (Not Incorporated) | 421 | 4.0% |
| Not-for-profit Organizations | 1,138 | 10.8% |
| Local Government Employees | 598 | 5.7% |
| State Government Employees | 170 | 1.6% |
| Federal Government Employees | 340 | 3.2% |
| Unpaid Family Workers | 36 | 0.3% |
| Total | 10,528 | 100.0% |
Employment Status by Age in Erlanger
According to the labor force statistics for Erlanger, out of the total population over 16 years of age (15,587), 71.4% or 11,129 individuals are in the labor force, with 4.5% or 501 of them unemployed. The age group with the highest labor force participation rate is 35 to 44 years, with 91.3% or 2,163 individuals in the labor force. Within the labor force, the 16 to 19 years age range has the highest percentage of unemployed individuals, with 14.8% or 113 of them being unemployed.
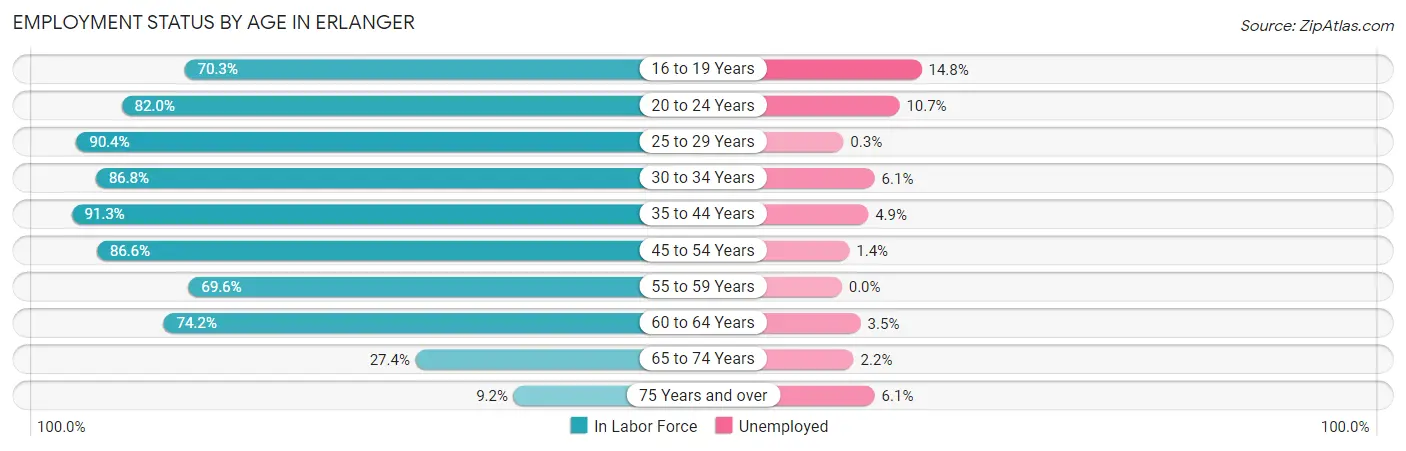
| Age Bracket | In Labor Force | Unemployed |
| 16 to 19 Years | 764 (70.3%) | 113 (14.8%) |
| 20 to 24 Years | 1,214 (82.0%) | 130 (10.7%) |
| 25 to 29 Years | 1,219 (90.4%) | 4 (0.3%) |
| 30 to 34 Years | 1,005 (86.8%) | 61 (6.1%) |
| 35 to 44 Years | 2,163 (91.3%) | 106 (4.9%) |
| 45 to 54 Years | 2,220 (86.6%) | 31 (1.4%) |
| 55 to 59 Years | 929 (69.6%) | 0 (0.0%) |
| 60 to 64 Years | 1,016 (74.2%) | 36 (3.5%) |
| 65 to 74 Years | 493 (27.4%) | 11 (2.2%) |
| 75 Years and over | 99 (9.2%) | 6 (6.1%) |
| Total | 11,129 (71.4%) | 501 (4.5%) |
Employment Status by Educational Attainment in Erlanger
According to labor force statistics for Erlanger, 84.3% of individuals (8,550) out of the total population between 25 and 64 years of age (10,142) are in the labor force, with 2.8% or 239 of them being unemployed. The group with the highest labor force participation rate are those with the educational attainment of college / associate degree, with 91.2% or 2,800 individuals in the labor force. Within the labor force, individuals with less than high school education have the highest percentage of unemployment, with 7.6% or 27 of them being unemployed.
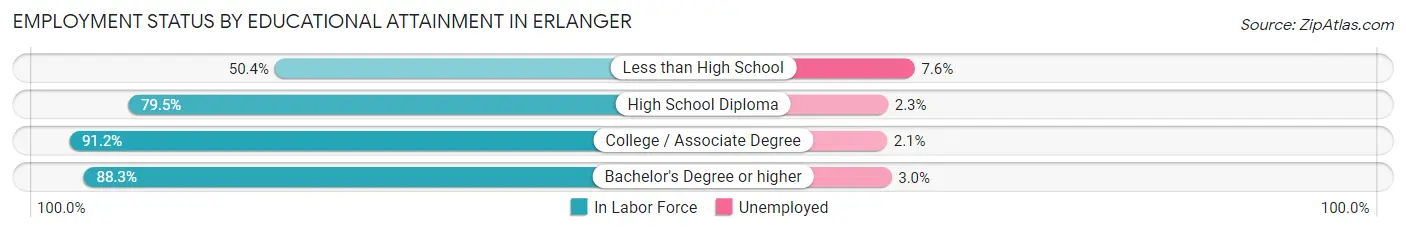
| Educational Attainment | In Labor Force | Unemployed |
| Less than High School | 357 (50.4%) | 54 (7.6%) |
| High School Diploma | 2,025 (79.5%) | 59 (2.3%) |
| College / Associate Degree | 2,800 (91.2%) | 64 (2.1%) |
| Bachelor's Degree or higher | 3,370 (88.3%) | 115 (3.0%) |
| Total | 8,550 (84.3%) | 284 (2.8%) |
Employment Occupations by Sex in Erlanger
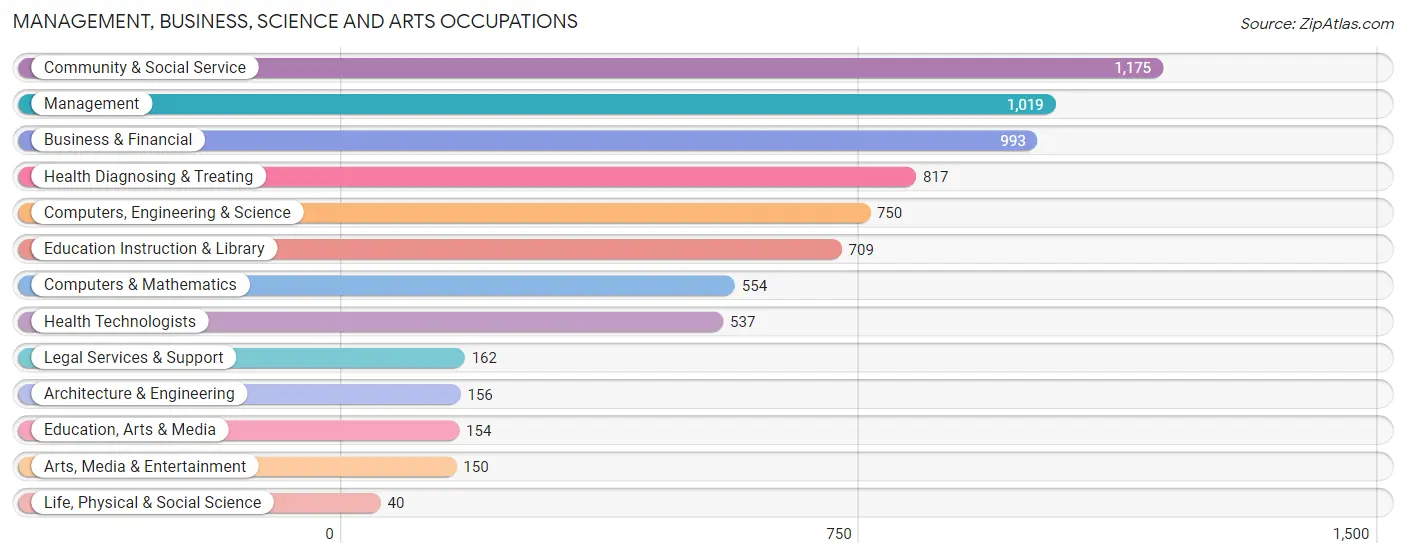
Management, Business, Science and Arts Occupations
The most common Management, Business, Science and Arts occupations in Erlanger are Community & Social Service (1,175 | 11.1%), Management (1,019 | 9.6%), Business & Financial (993 | 9.4%), Health Diagnosing & Treating (817 | 7.7%), and Computers, Engineering & Science (750 | 7.1%).
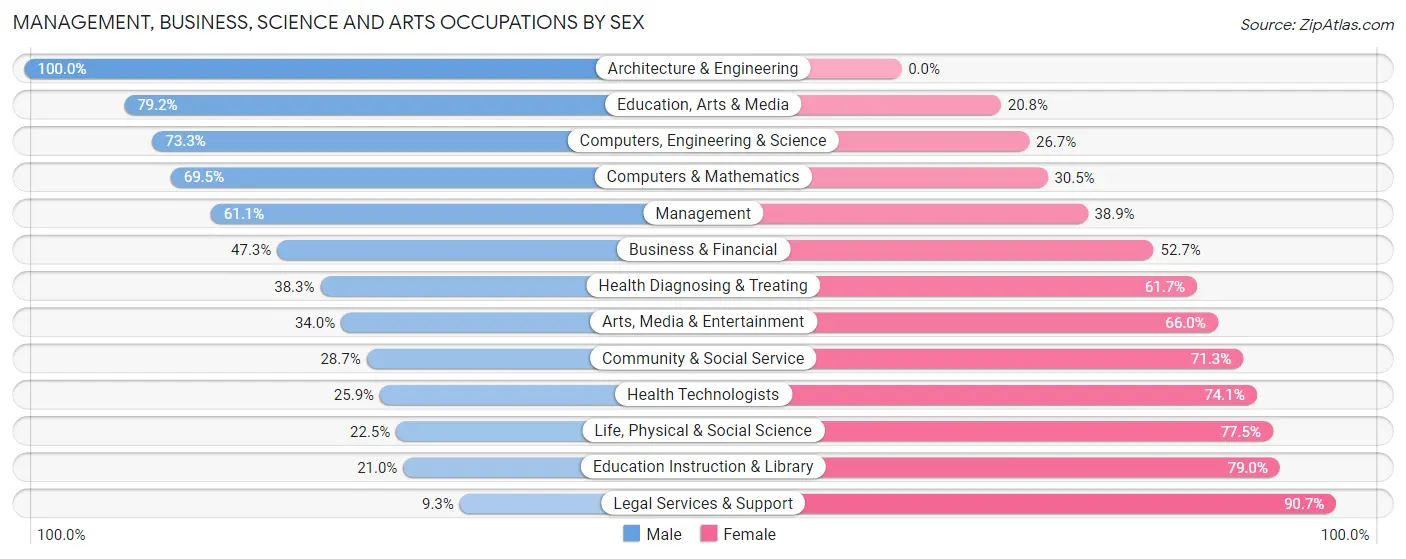
Management, Business, Science and Arts Occupations by Sex
Within the Management, Business, Science and Arts occupations in Erlanger, the most male-oriented occupations are Architecture & Engineering (100.0%), Education, Arts & Media (79.2%), and Computers, Engineering & Science (73.3%), while the most female-oriented occupations are Legal Services & Support (90.7%), Education Instruction & Library (79.0%), and Life, Physical & Social Science (77.5%).
| Occupation | Male | Female |
| Management | 623 (61.1%) | 396 (38.9%) |
| Business & Financial | 470 (47.3%) | 523 (52.7%) |
| Computers, Engineering & Science | 550 (73.3%) | 200 (26.7%) |
| Computers & Mathematics | 385 (69.5%) | 169 (30.5%) |
| Architecture & Engineering | 156 (100.0%) | 0 (0.0%) |
| Life, Physical & Social Science | 9 (22.5%) | 31 (77.5%) |
| Community & Social Service | 337 (28.7%) | 838 (71.3%) |
| Education, Arts & Media | 122 (79.2%) | 32 (20.8%) |
| Legal Services & Support | 15 (9.3%) | 147 (90.7%) |
| Education Instruction & Library | 149 (21.0%) | 560 (79.0%) |
| Arts, Media & Entertainment | 51 (34.0%) | 99 (66.0%) |
| Health Diagnosing & Treating | 313 (38.3%) | 504 (61.7%) |
| Health Technologists | 139 (25.9%) | 398 (74.1%) |
| Total (Category) | 2,293 (48.2%) | 2,461 (51.8%) |
| Total (Overall) | 5,226 (49.4%) | 5,344 (50.6%) |
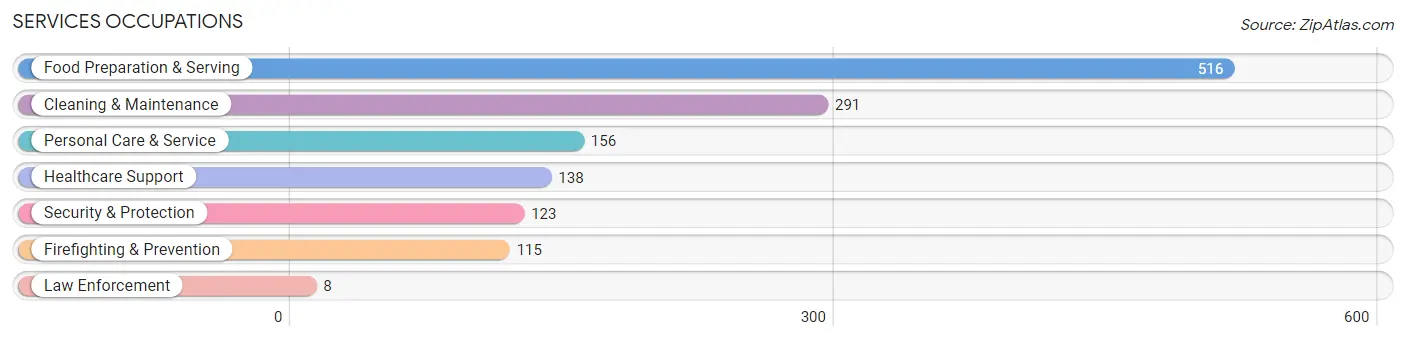
Services Occupations
The most common Services occupations in Erlanger are Food Preparation & Serving (516 | 4.9%), Cleaning & Maintenance (291 | 2.8%), Personal Care & Service (156 | 1.5%), Healthcare Support (138 | 1.3%), and Security & Protection (123 | 1.2%).
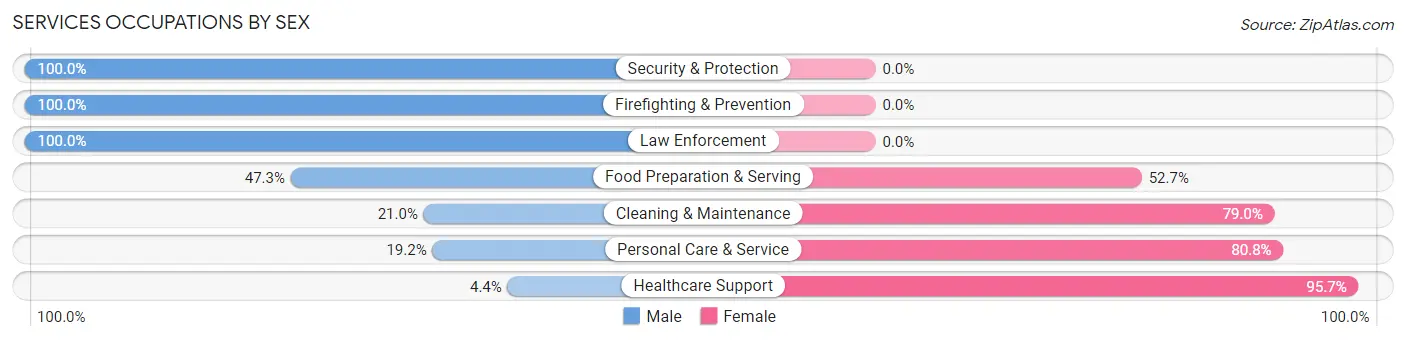
Services Occupations by Sex
Within the Services occupations in Erlanger, the most male-oriented occupations are Security & Protection (100.0%), Firefighting & Prevention (100.0%), and Law Enforcement (100.0%), while the most female-oriented occupations are Healthcare Support (95.7%), Personal Care & Service (80.8%), and Cleaning & Maintenance (79.0%).
| Occupation | Male | Female |
| Healthcare Support | 6 (4.3%) | 132 (95.7%) |
| Security & Protection | 123 (100.0%) | 0 (0.0%) |
| Firefighting & Prevention | 115 (100.0%) | 0 (0.0%) |
| Law Enforcement | 8 (100.0%) | 0 (0.0%) |
| Food Preparation & Serving | 244 (47.3%) | 272 (52.7%) |
| Cleaning & Maintenance | 61 (21.0%) | 230 (79.0%) |
| Personal Care & Service | 30 (19.2%) | 126 (80.8%) |
| Total (Category) | 464 (37.9%) | 760 (62.1%) |
| Total (Overall) | 5,226 (49.4%) | 5,344 (50.6%) |
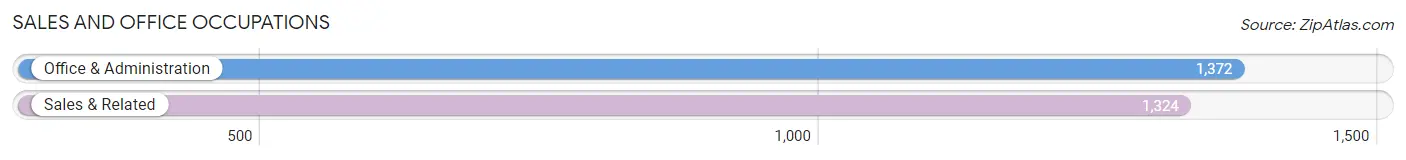
Sales and Office Occupations
The most common Sales and Office occupations in Erlanger are Office & Administration (1,372 | 13.0%), and Sales & Related (1,324 | 12.5%).
Sales and Office Occupations by Sex
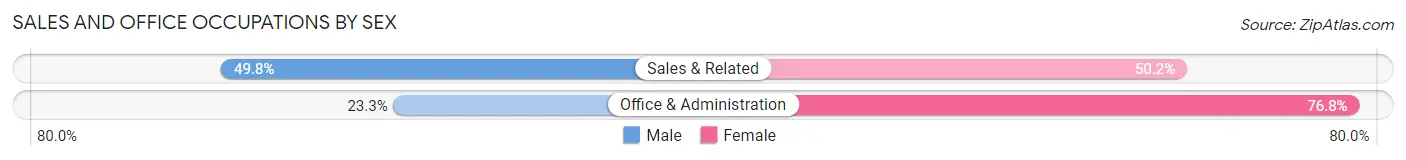
| Occupation | Male | Female |
| Sales & Related | 659 (49.8%) | 665 (50.2%) |
| Office & Administration | 319 (23.3%) | 1,053 (76.7%) |
| Total (Category) | 978 (36.3%) | 1,718 (63.7%) |
| Total (Overall) | 5,226 (49.4%) | 5,344 (50.6%) |
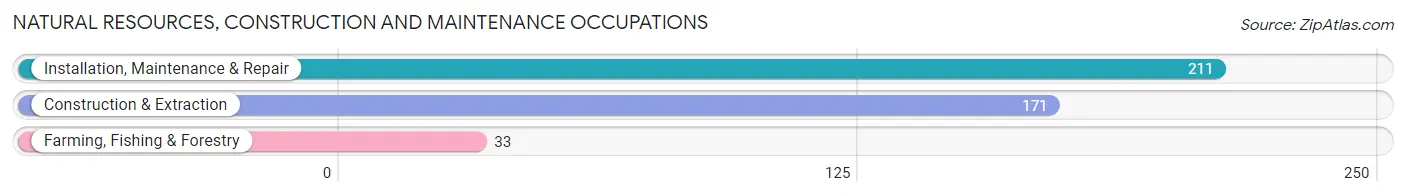
Natural Resources, Construction and Maintenance Occupations
The most common Natural Resources, Construction and Maintenance occupations in Erlanger are Installation, Maintenance & Repair (211 | 2.0%), Construction & Extraction (171 | 1.6%), and Farming, Fishing & Forestry (33 | 0.3%).
Natural Resources, Construction and Maintenance Occupations by Sex
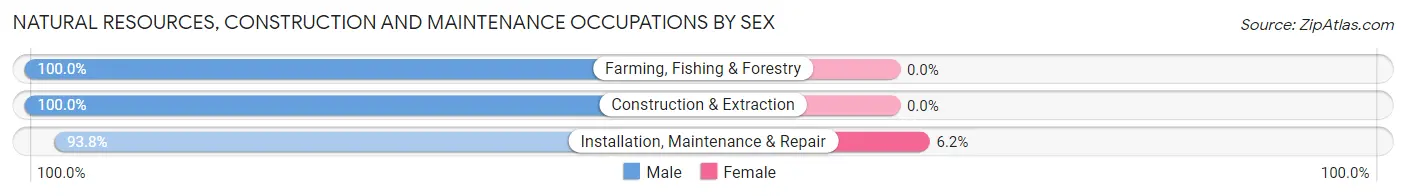
| Occupation | Male | Female |
| Farming, Fishing & Forestry | 33 (100.0%) | 0 (0.0%) |
| Construction & Extraction | 171 (100.0%) | 0 (0.0%) |
| Installation, Maintenance & Repair | 198 (93.8%) | 13 (6.2%) |
| Total (Category) | 402 (96.9%) | 13 (3.1%) |
| Total (Overall) | 5,226 (49.4%) | 5,344 (50.6%) |
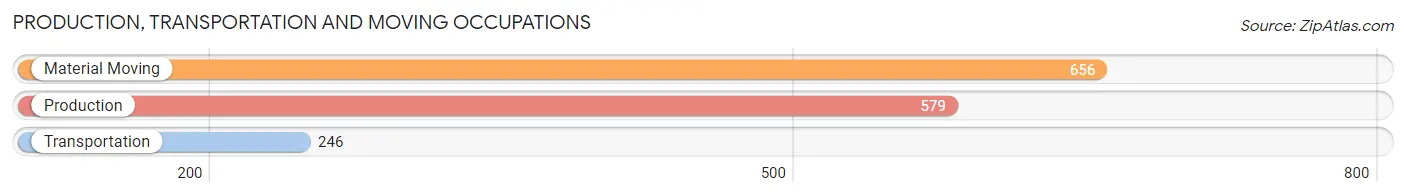
Production, Transportation and Moving Occupations
The most common Production, Transportation and Moving occupations in Erlanger are Material Moving (656 | 6.2%), Production (579 | 5.5%), and Transportation (246 | 2.3%).
Production, Transportation and Moving Occupations by Sex
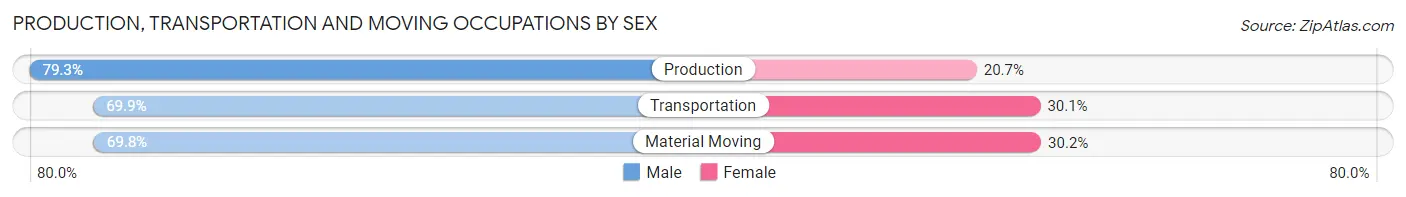
| Occupation | Male | Female |
| Production | 459 (79.3%) | 120 (20.7%) |
| Transportation | 172 (69.9%) | 74 (30.1%) |
| Material Moving | 458 (69.8%) | 198 (30.2%) |
| Total (Category) | 1,089 (73.5%) | 392 (26.5%) |
| Total (Overall) | 5,226 (49.4%) | 5,344 (50.6%) |
Employment Industries by Sex in Erlanger
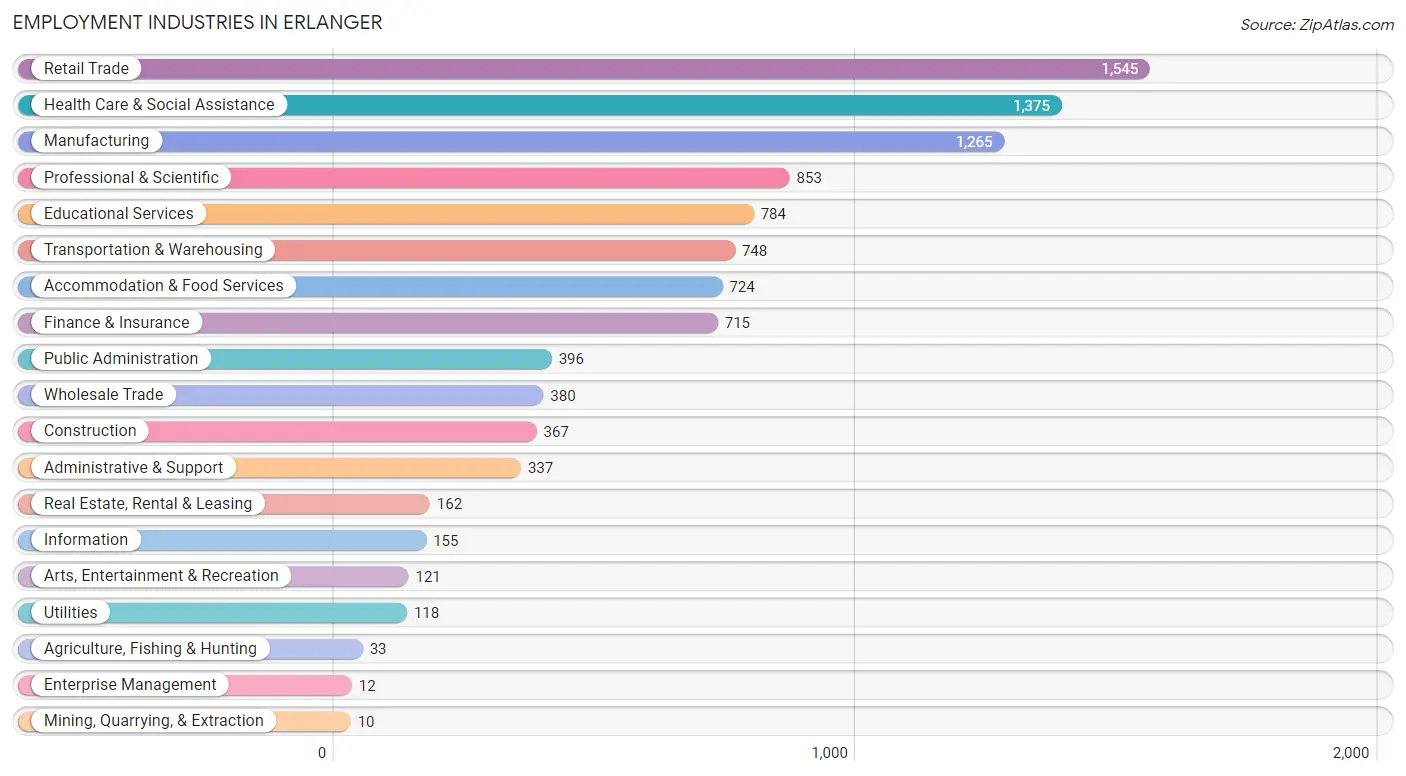
Employment Industries in Erlanger
The major employment industries in Erlanger include Retail Trade (1,545 | 14.6%), Health Care & Social Assistance (1,375 | 13.0%), Manufacturing (1,265 | 12.0%), Professional & Scientific (853 | 8.1%), and Educational Services (784 | 7.4%).
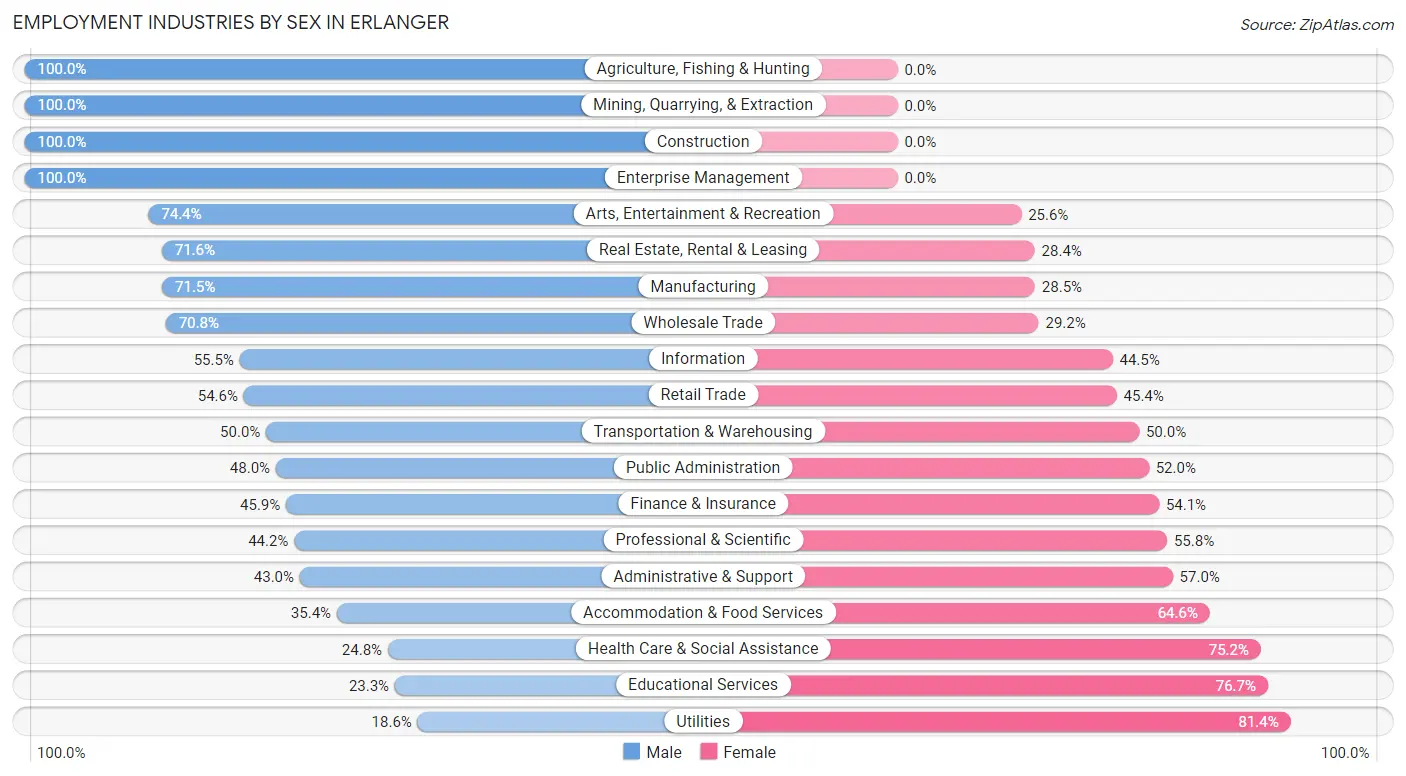
Employment Industries by Sex in Erlanger
The Erlanger industries that see more men than women are Agriculture, Fishing & Hunting (100.0%), Mining, Quarrying, & Extraction (100.0%), and Construction (100.0%), whereas the industries that tend to have a higher number of women are Utilities (81.4%), Educational Services (76.7%), and Health Care & Social Assistance (75.2%).
| Industry | Male | Female |
| Agriculture, Fishing & Hunting | 33 (100.0%) | 0 (0.0%) |
| Mining, Quarrying, & Extraction | 10 (100.0%) | 0 (0.0%) |
| Construction | 367 (100.0%) | 0 (0.0%) |
| Manufacturing | 905 (71.5%) | 360 (28.5%) |
| Wholesale Trade | 269 (70.8%) | 111 (29.2%) |
| Retail Trade | 844 (54.6%) | 701 (45.4%) |
| Transportation & Warehousing | 374 (50.0%) | 374 (50.0%) |
| Utilities | 22 (18.6%) | 96 (81.4%) |
| Information | 86 (55.5%) | 69 (44.5%) |
| Finance & Insurance | 328 (45.9%) | 387 (54.1%) |
| Real Estate, Rental & Leasing | 116 (71.6%) | 46 (28.4%) |
| Professional & Scientific | 377 (44.2%) | 476 (55.8%) |
| Enterprise Management | 12 (100.0%) | 0 (0.0%) |
| Administrative & Support | 145 (43.0%) | 192 (57.0%) |
| Educational Services | 183 (23.3%) | 601 (76.7%) |
| Health Care & Social Assistance | 341 (24.8%) | 1,034 (75.2%) |
| Arts, Entertainment & Recreation | 90 (74.4%) | 31 (25.6%) |
| Accommodation & Food Services | 256 (35.4%) | 468 (64.6%) |
| Public Administration | 190 (48.0%) | 206 (52.0%) |
| Total | 5,226 (49.4%) | 5,344 (50.6%) |
Education in Erlanger
School Enrollment in Erlanger
The most common levels of schooling among the 4,573 students in Erlanger are middle school (1,073 | 23.5%), high school (1,055 | 23.1%), and elementary school (904 | 19.8%).
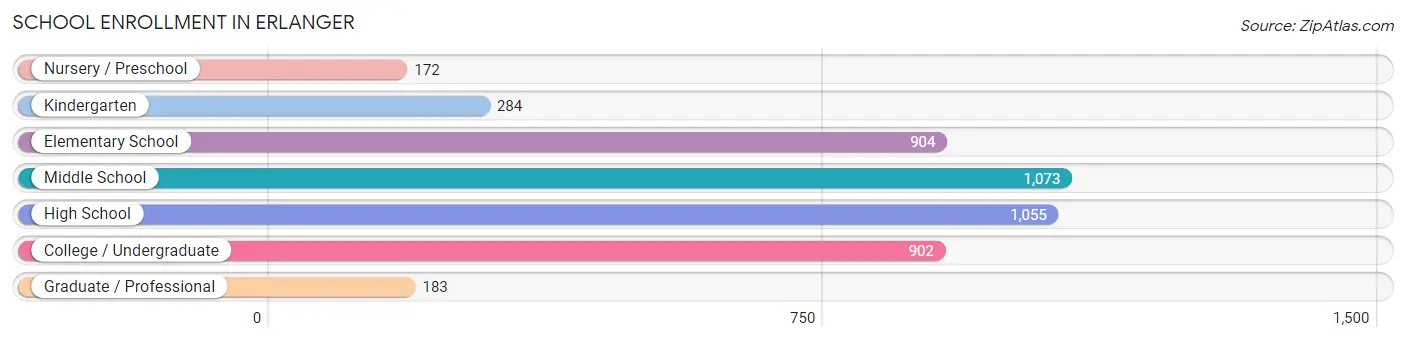
| School Level | # Students | % Students |
| Nursery / Preschool | 172 | 3.8% |
| Kindergarten | 284 | 6.2% |
| Elementary School | 904 | 19.8% |
| Middle School | 1,073 | 23.5% |
| High School | 1,055 | 23.1% |
| College / Undergraduate | 902 | 19.7% |
| Graduate / Professional | 183 | 4.0% |
| Total | 4,573 | 100.0% |
School Enrollment by Age by Funding Source in Erlanger
Out of a total of 4,573 students who are enrolled in schools in Erlanger, 1,244 (27.2%) attend a private institution, while the remaining 3,329 (72.8%) are enrolled in public schools. The age group of 3 to 4 year olds has the highest likelihood of being enrolled in private schools, with 66 (46.2% in the age bracket) enrolled. Conversely, the age group of 5 to 9 year old has the lowest likelihood of being enrolled in a private school, with 856 (79.0% in the age bracket) attending a public institution.
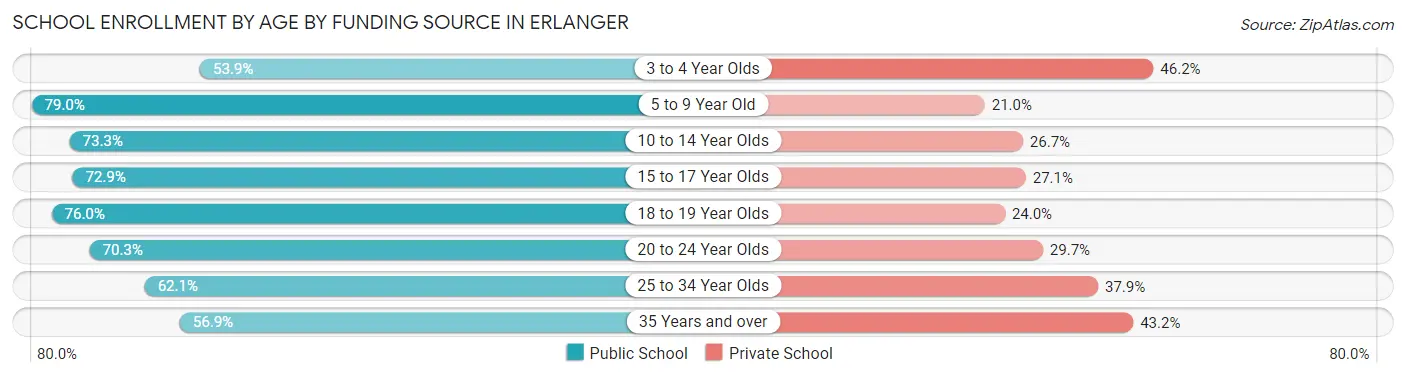
| Age Bracket | Public School | Private School |
| 3 to 4 Year Olds | 77 (53.8%) | 66 (46.2%) |
| 5 to 9 Year Old | 856 (79.0%) | 228 (21.0%) |
| 10 to 14 Year Olds | 955 (73.3%) | 348 (26.7%) |
| 15 to 17 Year Olds | 690 (72.9%) | 257 (27.1%) |
| 18 to 19 Year Olds | 215 (76.0%) | 68 (24.0%) |
| 20 to 24 Year Olds | 315 (70.3%) | 133 (29.7%) |
| 25 to 34 Year Olds | 136 (62.1%) | 83 (37.9%) |
| 35 Years and over | 83 (56.9%) | 63 (43.1%) |
| Total | 3,329 (72.8%) | 1,244 (27.2%) |
Educational Attainment by Field of Study in Erlanger
Business (1,249 | 26.6%), education (719 | 15.3%), science & technology (573 | 12.2%), arts & humanities (329 | 7.0%), and computers & mathematics (294 | 6.3%) are the most common fields of study among 4,693 individuals in Erlanger who have obtained a bachelor's degree or higher.
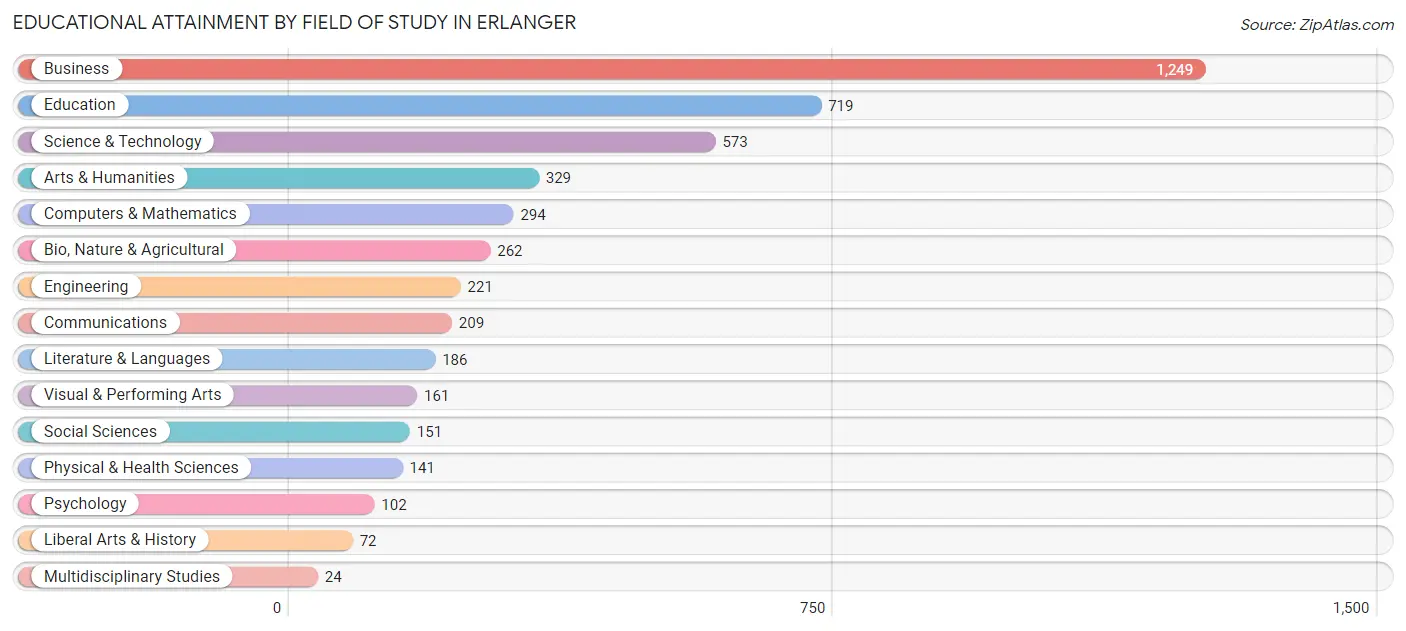
| Field of Study | # Graduates | % Graduates |
| Computers & Mathematics | 294 | 6.3% |
| Bio, Nature & Agricultural | 262 | 5.6% |
| Physical & Health Sciences | 141 | 3.0% |
| Psychology | 102 | 2.2% |
| Social Sciences | 151 | 3.2% |
| Engineering | 221 | 4.7% |
| Multidisciplinary Studies | 24 | 0.5% |
| Science & Technology | 573 | 12.2% |
| Business | 1,249 | 26.6% |
| Education | 719 | 15.3% |
| Literature & Languages | 186 | 4.0% |
| Liberal Arts & History | 72 | 1.5% |
| Visual & Performing Arts | 161 | 3.4% |
| Communications | 209 | 4.4% |
| Arts & Humanities | 329 | 7.0% |
| Total | 4,693 | 100.0% |
Transportation & Commute in Erlanger
Vehicle Availability by Sex in Erlanger
The most prevalent vehicle ownership categories in Erlanger are males with 2 vehicles (2,496, accounting for 47.4%) and females with 2 vehicles (2,475, making up 47.5%).
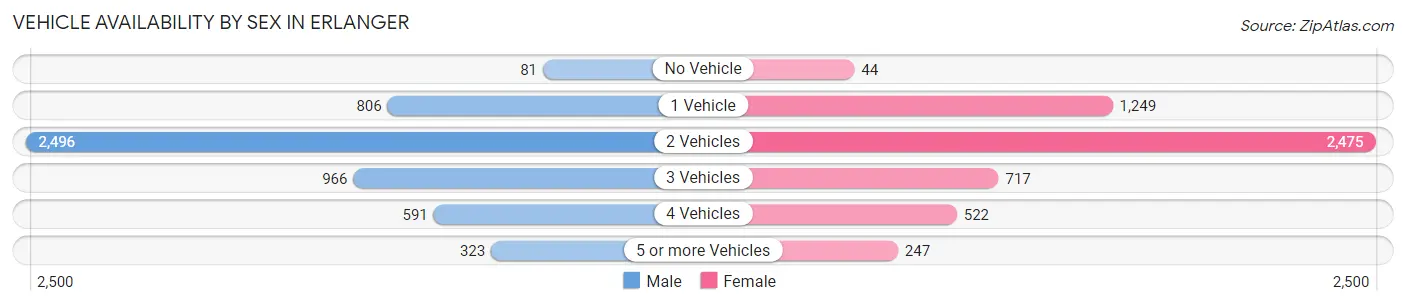
| Vehicles Available | Male | Female |
| No Vehicle | 81 (1.5%) | 44 (0.8%) |
| 1 Vehicle | 806 (15.3%) | 1,249 (23.8%) |
| 2 Vehicles | 2,496 (47.4%) | 2,475 (47.1%) |
| 3 Vehicles | 966 (18.3%) | 717 (13.7%) |
| 4 Vehicles | 591 (11.2%) | 522 (9.9%) |
| 5 or more Vehicles | 323 (6.1%) | 247 (4.7%) |
| Total | 5,263 (100.0%) | 5,254 (100.0%) |
Commute Time in Erlanger
The most frequently occuring commute durations in Erlanger are 15 to 19 minutes (2,247 commuters, 24.5%), 10 to 14 minutes (1,598 commuters, 17.4%), and 20 to 24 minutes (1,544 commuters, 16.8%).
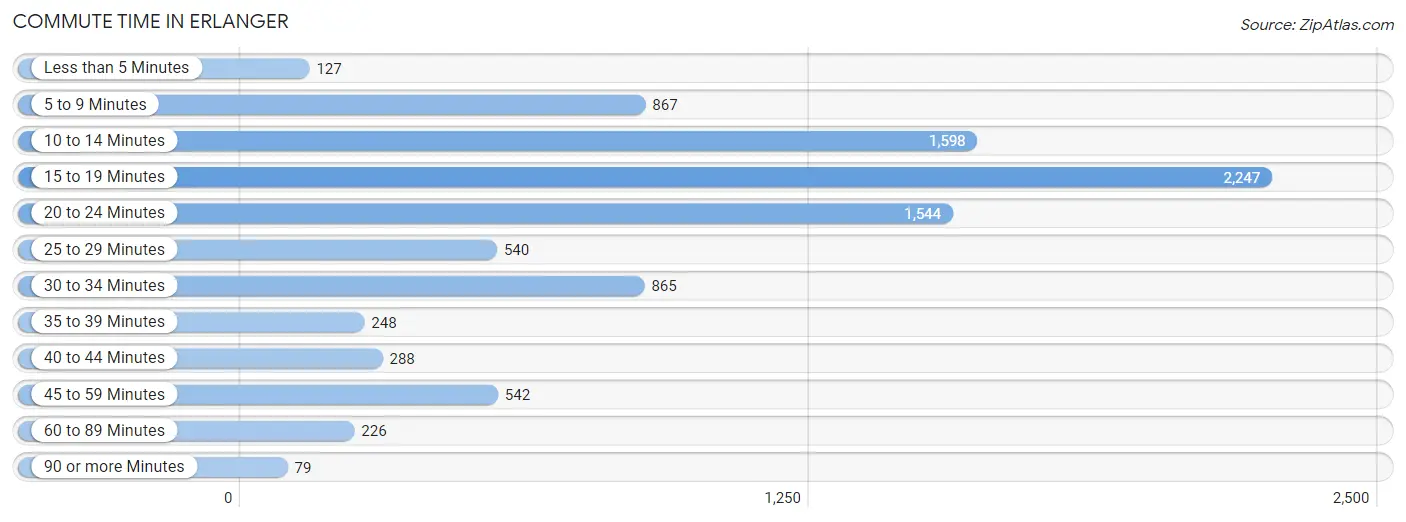
| Commute Time | # Commuters | % Commuters |
| Less than 5 Minutes | 127 | 1.4% |
| 5 to 9 Minutes | 867 | 9.5% |
| 10 to 14 Minutes | 1,598 | 17.4% |
| 15 to 19 Minutes | 2,247 | 24.5% |
| 20 to 24 Minutes | 1,544 | 16.8% |
| 25 to 29 Minutes | 540 | 5.9% |
| 30 to 34 Minutes | 865 | 9.4% |
| 35 to 39 Minutes | 248 | 2.7% |
| 40 to 44 Minutes | 288 | 3.1% |
| 45 to 59 Minutes | 542 | 5.9% |
| 60 to 89 Minutes | 226 | 2.5% |
| 90 or more Minutes | 79 | 0.9% |
Commute Time by Sex in Erlanger
The most common commute times in Erlanger are 15 to 19 minutes (1,093 commuters, 24.1%) for males and 15 to 19 minutes (1,154 commuters, 24.9%) for females.
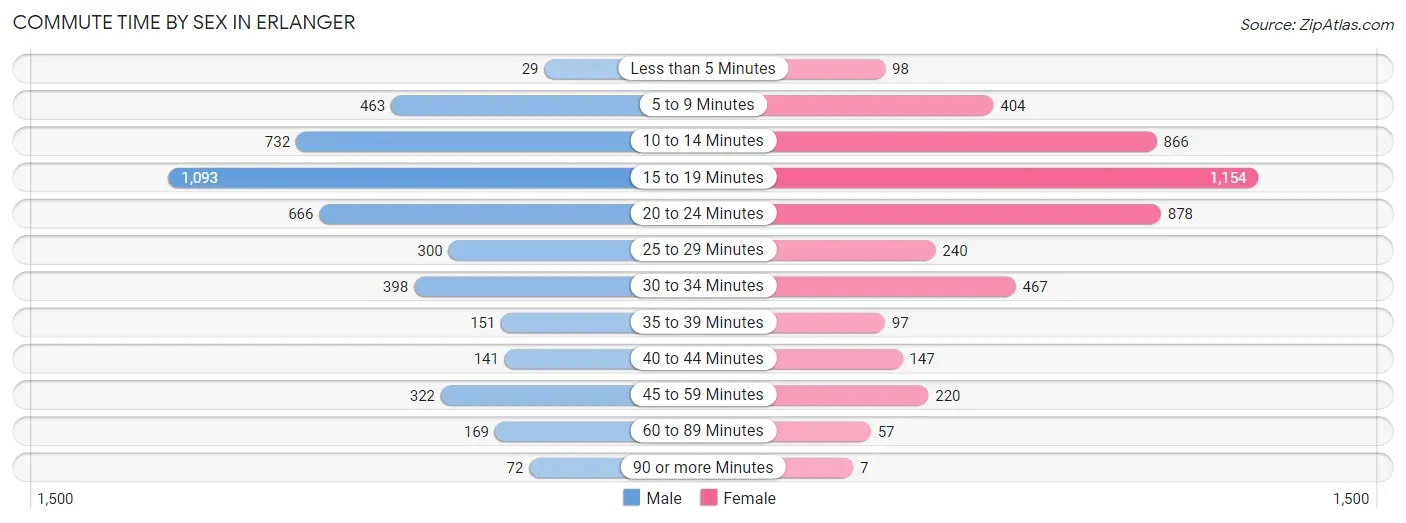
| Commute Time | Male | Female |
| Less than 5 Minutes | 29 (0.6%) | 98 (2.1%) |
| 5 to 9 Minutes | 463 (10.2%) | 404 (8.7%) |
| 10 to 14 Minutes | 732 (16.1%) | 866 (18.7%) |
| 15 to 19 Minutes | 1,093 (24.1%) | 1,154 (24.9%) |
| 20 to 24 Minutes | 666 (14.7%) | 878 (18.9%) |
| 25 to 29 Minutes | 300 (6.6%) | 240 (5.2%) |
| 30 to 34 Minutes | 398 (8.8%) | 467 (10.1%) |
| 35 to 39 Minutes | 151 (3.3%) | 97 (2.1%) |
| 40 to 44 Minutes | 141 (3.1%) | 147 (3.2%) |
| 45 to 59 Minutes | 322 (7.1%) | 220 (4.8%) |
| 60 to 89 Minutes | 169 (3.7%) | 57 (1.2%) |
| 90 or more Minutes | 72 (1.6%) | 7 (0.2%) |
Time of Departure to Work by Sex in Erlanger
The most frequent times of departure to work in Erlanger are 7:30 AM to 7:59 AM (552, 12.2%) for males and 6:30 AM to 6:59 AM (897, 19.4%) for females.
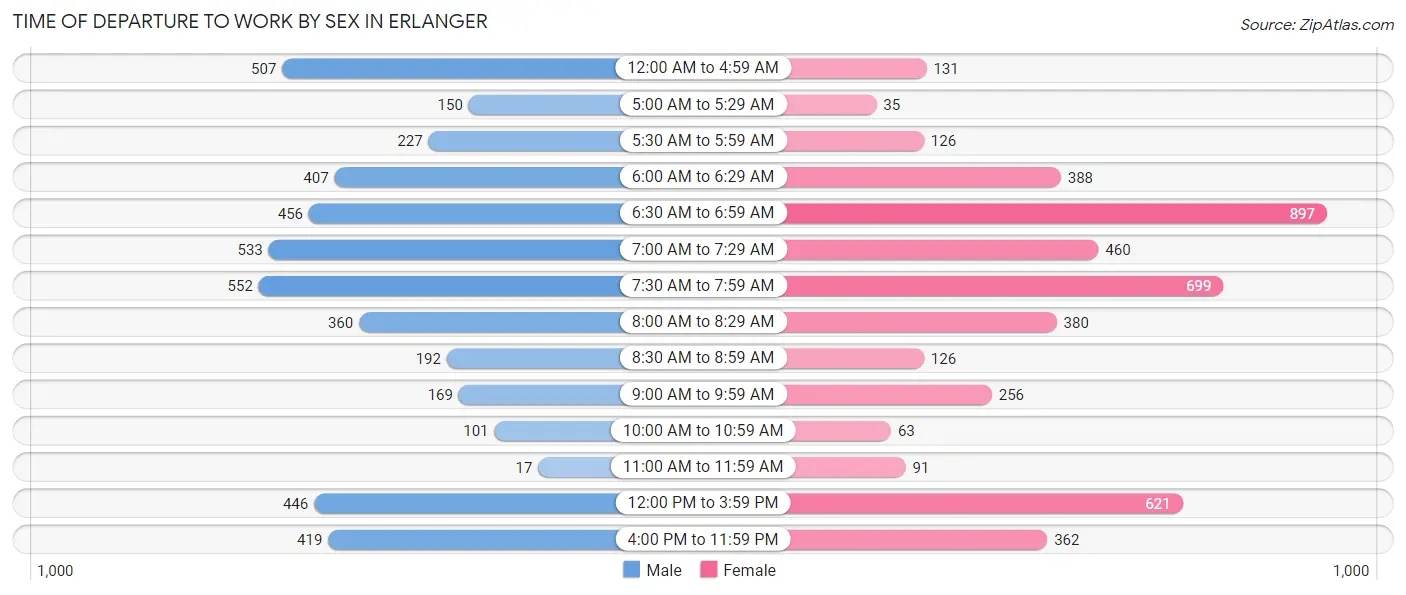
| Time of Departure | Male | Female |
| 12:00 AM to 4:59 AM | 507 (11.2%) | 131 (2.8%) |
| 5:00 AM to 5:29 AM | 150 (3.3%) | 35 (0.8%) |
| 5:30 AM to 5:59 AM | 227 (5.0%) | 126 (2.7%) |
| 6:00 AM to 6:29 AM | 407 (9.0%) | 388 (8.4%) |
| 6:30 AM to 6:59 AM | 456 (10.1%) | 897 (19.4%) |
| 7:00 AM to 7:29 AM | 533 (11.7%) | 460 (9.9%) |
| 7:30 AM to 7:59 AM | 552 (12.2%) | 699 (15.1%) |
| 8:00 AM to 8:29 AM | 360 (7.9%) | 380 (8.2%) |
| 8:30 AM to 8:59 AM | 192 (4.2%) | 126 (2.7%) |
| 9:00 AM to 9:59 AM | 169 (3.7%) | 256 (5.5%) |
| 10:00 AM to 10:59 AM | 101 (2.2%) | 63 (1.4%) |
| 11:00 AM to 11:59 AM | 17 (0.4%) | 91 (2.0%) |
| 12:00 PM to 3:59 PM | 446 (9.8%) | 621 (13.4%) |
| 4:00 PM to 11:59 PM | 419 (9.2%) | 362 (7.8%) |
| Total | 4,536 (100.0%) | 4,635 (100.0%) |
Housing Occupancy in Erlanger
Occupancy by Ownership in Erlanger
Of the total 7,875 dwellings in Erlanger, owner-occupied units account for 5,420 (68.8%), while renter-occupied units make up 2,455 (31.2%).
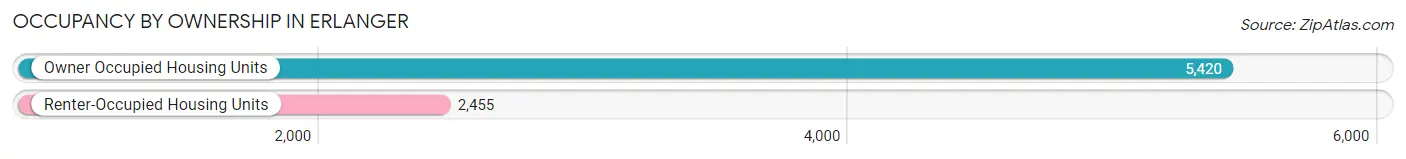
| Occupancy | # Housing Units | % Housing Units |
| Owner Occupied Housing Units | 5,420 | 68.8% |
| Renter-Occupied Housing Units | 2,455 | 31.2% |
| Total Occupied Housing Units | 7,875 | 100.0% |
Occupancy by Household Size in Erlanger
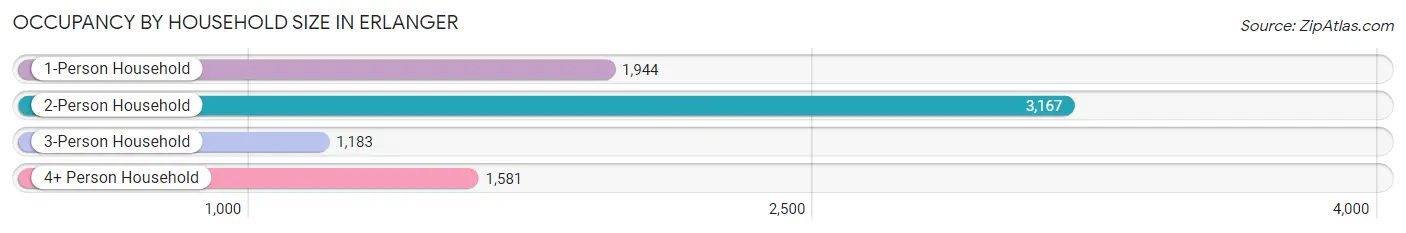
| Household Size | # Housing Units | % Housing Units |
| 1-Person Household | 1,944 | 24.7% |
| 2-Person Household | 3,167 | 40.2% |
| 3-Person Household | 1,183 | 15.0% |
| 4+ Person Household | 1,581 | 20.1% |
| Total Housing Units | 7,875 | 100.0% |
Occupancy by Ownership by Household Size in Erlanger
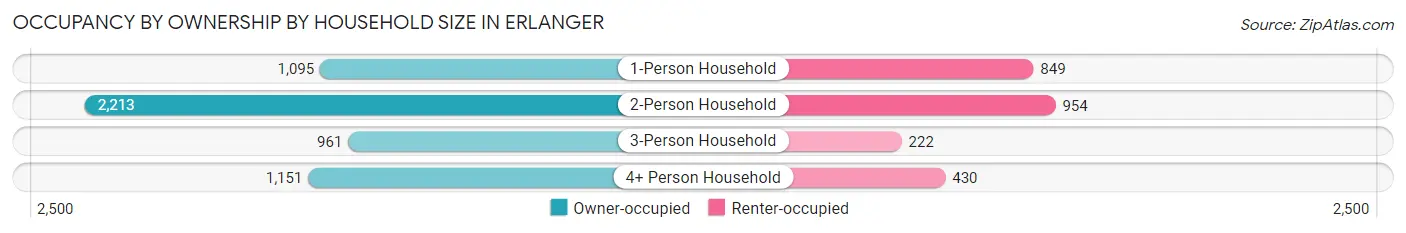
| Household Size | Owner-occupied | Renter-occupied |
| 1-Person Household | 1,095 (56.3%) | 849 (43.7%) |
| 2-Person Household | 2,213 (69.9%) | 954 (30.1%) |
| 3-Person Household | 961 (81.2%) | 222 (18.8%) |
| 4+ Person Household | 1,151 (72.8%) | 430 (27.2%) |
| Total Housing Units | 5,420 (68.8%) | 2,455 (31.2%) |
Occupancy by Educational Attainment in Erlanger
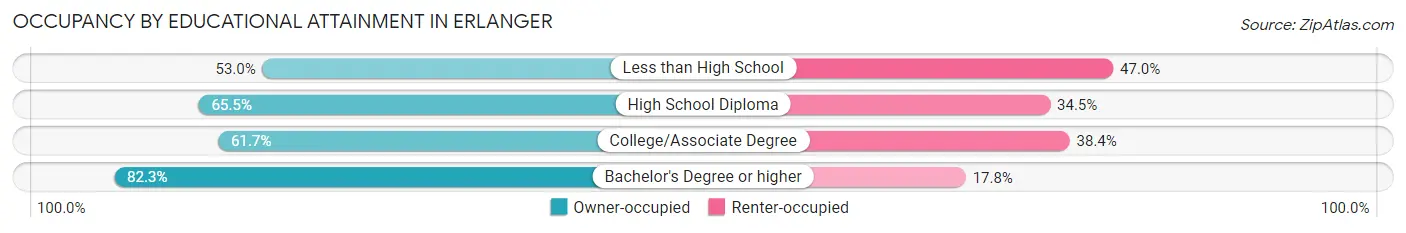
| Household Size | Owner-occupied | Renter-occupied |
| Less than High School | 290 (53.0%) | 257 (47.0%) |
| High School Diploma | 1,503 (65.5%) | 791 (34.5%) |
| College/Associate Degree | 1,537 (61.7%) | 956 (38.4%) |
| Bachelor's Degree or higher | 2,090 (82.3%) | 451 (17.7%) |
Occupancy by Age of Householder in Erlanger
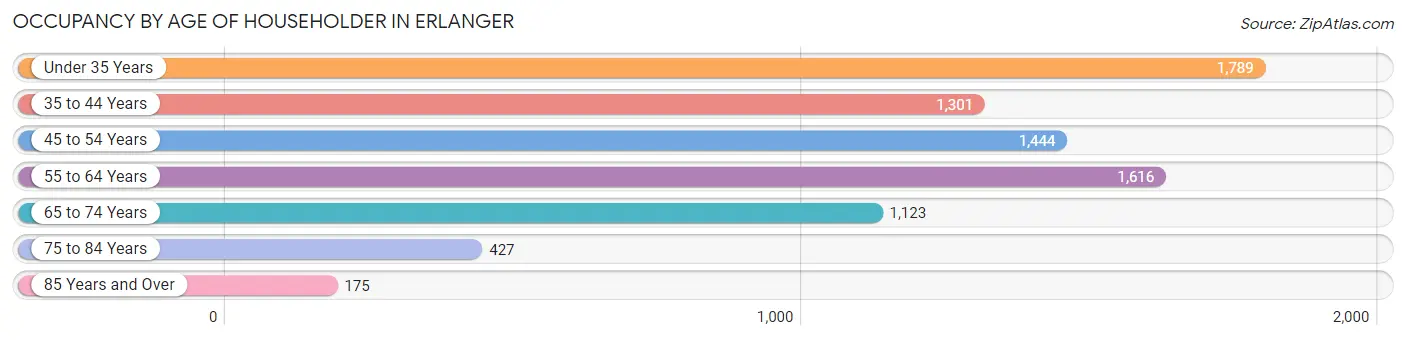
| Age Bracket | # Households | % Households |
| Under 35 Years | 1,789 | 22.7% |
| 35 to 44 Years | 1,301 | 16.5% |
| 45 to 54 Years | 1,444 | 18.3% |
| 55 to 64 Years | 1,616 | 20.5% |
| 65 to 74 Years | 1,123 | 14.3% |
| 75 to 84 Years | 427 | 5.4% |
| 85 Years and Over | 175 | 2.2% |
| Total | 7,875 | 100.0% |
Housing Finances in Erlanger
Median Income by Occupancy in Erlanger
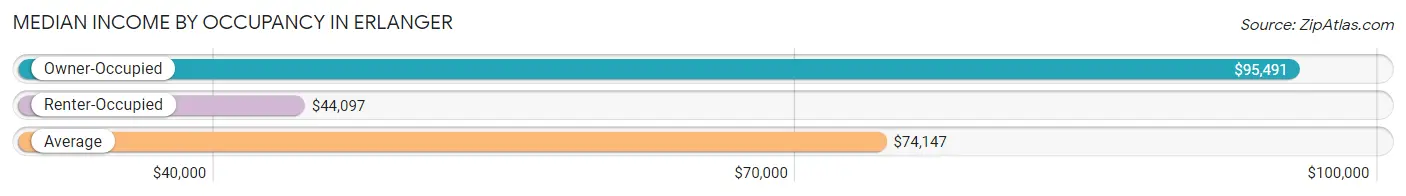
| Occupancy Type | # Households | Median Income |
| Owner-Occupied | 5,420 (68.8%) | $95,491 |
| Renter-Occupied | 2,455 (31.2%) | $44,097 |
| Average | 7,875 (100.0%) | $74,147 |
Occupancy by Householder Income Bracket in Erlanger
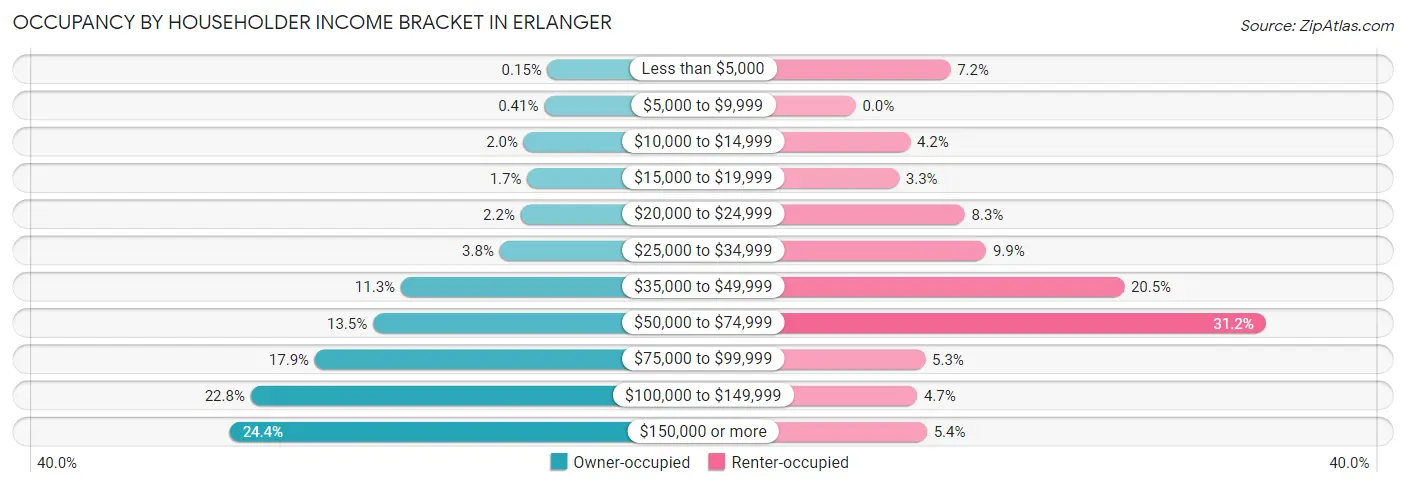
| Income Bracket | Owner-occupied | Renter-occupied |
| Less than $5,000 | 8 (0.2%) | 177 (7.2%) |
| $5,000 to $9,999 | 22 (0.4%) | 0 (0.0%) |
| $10,000 to $14,999 | 106 (2.0%) | 102 (4.2%) |
| $15,000 to $19,999 | 92 (1.7%) | 81 (3.3%) |
| $20,000 to $24,999 | 119 (2.2%) | 204 (8.3%) |
| $25,000 to $34,999 | 206 (3.8%) | 244 (9.9%) |
| $35,000 to $49,999 | 614 (11.3%) | 502 (20.4%) |
| $50,000 to $74,999 | 729 (13.5%) | 767 (31.2%) |
| $75,000 to $99,999 | 969 (17.9%) | 130 (5.3%) |
| $100,000 to $149,999 | 1,234 (22.8%) | 115 (4.7%) |
| $150,000 or more | 1,321 (24.4%) | 133 (5.4%) |
| Total | 5,420 (100.0%) | 2,455 (100.0%) |
Monthly Housing Cost Tiers in Erlanger
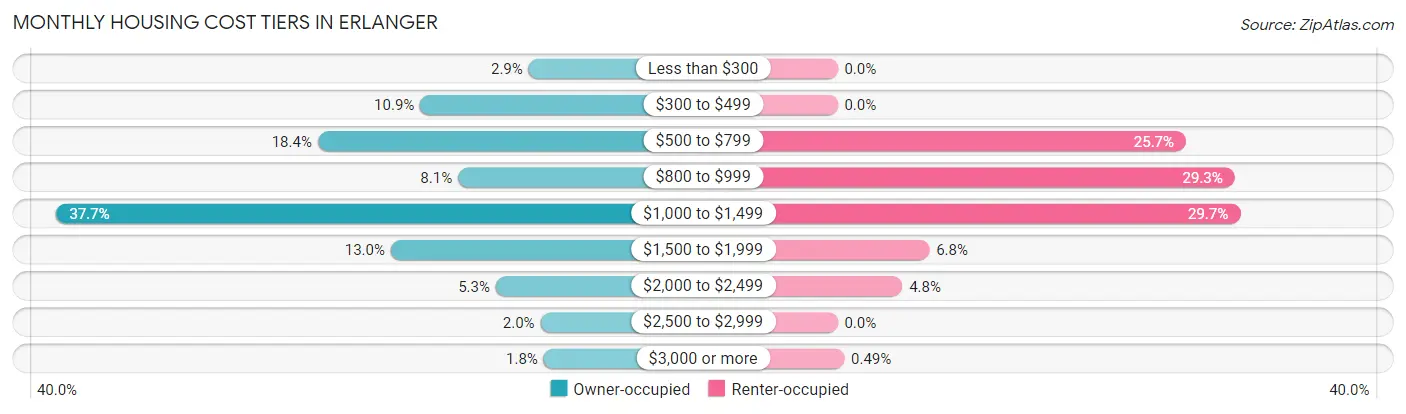
| Monthly Cost | Owner-occupied | Renter-occupied |
| Less than $300 | 156 (2.9%) | 0 (0.0%) |
| $300 to $499 | 589 (10.9%) | 0 (0.0%) |
| $500 to $799 | 998 (18.4%) | 630 (25.7%) |
| $800 to $999 | 438 (8.1%) | 718 (29.2%) |
| $1,000 to $1,499 | 2,041 (37.7%) | 728 (29.6%) |
| $1,500 to $1,999 | 706 (13.0%) | 166 (6.8%) |
| $2,000 to $2,499 | 287 (5.3%) | 117 (4.8%) |
| $2,500 to $2,999 | 109 (2.0%) | 0 (0.0%) |
| $3,000 or more | 96 (1.8%) | 12 (0.5%) |
| Total | 5,420 (100.0%) | 2,455 (100.0%) |
Physical Housing Characteristics in Erlanger
Housing Structures in Erlanger
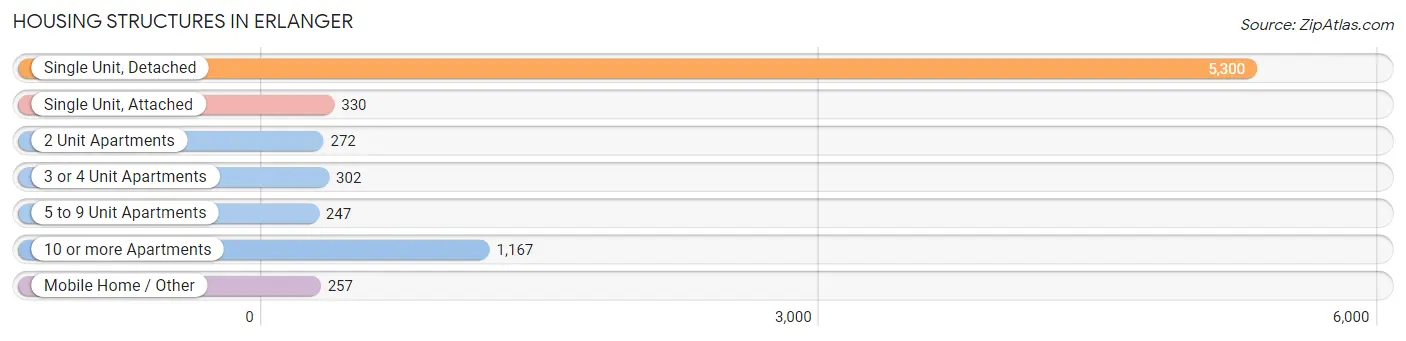
| Structure Type | # Housing Units | % Housing Units |
| Single Unit, Detached | 5,300 | 67.3% |
| Single Unit, Attached | 330 | 4.2% |
| 2 Unit Apartments | 272 | 3.5% |
| 3 or 4 Unit Apartments | 302 | 3.8% |
| 5 to 9 Unit Apartments | 247 | 3.1% |
| 10 or more Apartments | 1,167 | 14.8% |
| Mobile Home / Other | 257 | 3.3% |
| Total | 7,875 | 100.0% |
Housing Structures by Occupancy in Erlanger
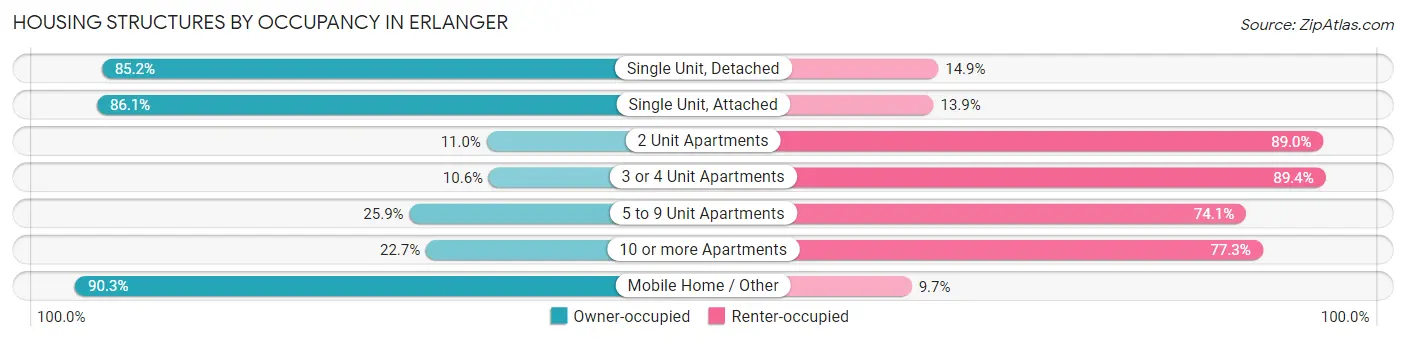
| Structure Type | Owner-occupied | Renter-occupied |
| Single Unit, Detached | 4,513 (85.2%) | 787 (14.8%) |
| Single Unit, Attached | 284 (86.1%) | 46 (13.9%) |
| 2 Unit Apartments | 30 (11.0%) | 242 (89.0%) |
| 3 or 4 Unit Apartments | 32 (10.6%) | 270 (89.4%) |
| 5 to 9 Unit Apartments | 64 (25.9%) | 183 (74.1%) |
| 10 or more Apartments | 265 (22.7%) | 902 (77.3%) |
| Mobile Home / Other | 232 (90.3%) | 25 (9.7%) |
| Total | 5,420 (68.8%) | 2,455 (31.2%) |
Housing Structures by Number of Rooms in Erlanger
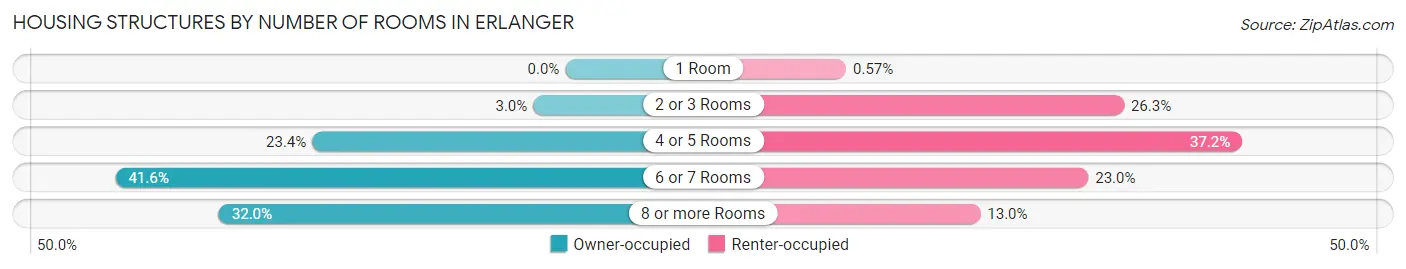
| Number of Rooms | Owner-occupied | Renter-occupied |
| 1 Room | 0 (0.0%) | 14 (0.6%) |
| 2 or 3 Rooms | 161 (3.0%) | 645 (26.3%) |
| 4 or 5 Rooms | 1,269 (23.4%) | 913 (37.2%) |
| 6 or 7 Rooms | 2,254 (41.6%) | 564 (23.0%) |
| 8 or more Rooms | 1,736 (32.0%) | 319 (13.0%) |
| Total | 5,420 (100.0%) | 2,455 (100.0%) |
Housing Structure by Heating Type in Erlanger
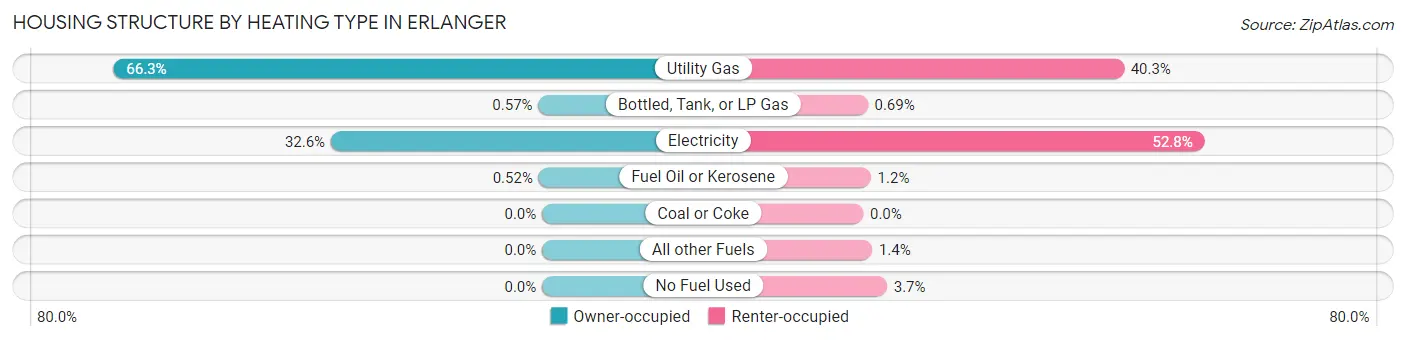
| Heating Type | Owner-occupied | Renter-occupied |
| Utility Gas | 3,592 (66.3%) | 989 (40.3%) |
| Bottled, Tank, or LP Gas | 31 (0.6%) | 17 (0.7%) |
| Electricity | 1,769 (32.6%) | 1,296 (52.8%) |
| Fuel Oil or Kerosene | 28 (0.5%) | 29 (1.2%) |
| Coal or Coke | 0 (0.0%) | 0 (0.0%) |
| All other Fuels | 0 (0.0%) | 34 (1.4%) |
| No Fuel Used | 0 (0.0%) | 90 (3.7%) |
| Total | 5,420 (100.0%) | 2,455 (100.0%) |
Household Vehicle Usage in Erlanger
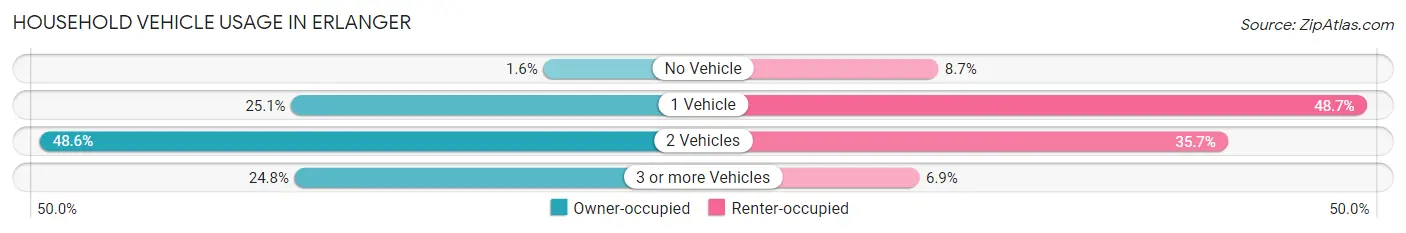
| Vehicles per Household | Owner-occupied | Renter-occupied |
| No Vehicle | 84 (1.5%) | 213 (8.7%) |
| 1 Vehicle | 1,360 (25.1%) | 1,195 (48.7%) |
| 2 Vehicles | 2,633 (48.6%) | 877 (35.7%) |
| 3 or more Vehicles | 1,343 (24.8%) | 170 (6.9%) |
| Total | 5,420 (100.0%) | 2,455 (100.0%) |
Real Estate & Mortgages in Erlanger
Real Estate and Mortgage Overview in Erlanger
| Characteristic | Without Mortgage | With Mortgage |
| Housing Units | 1,484 | 3,936 |
| Median Property Value | $153,200 | $180,000 |
| Median Household Income | $75,529 | $1,039 |
| Monthly Housing Costs | $509 | $96 |
| Real Estate Taxes | $1,741 | $38 |
Property Value by Mortgage Status in Erlanger
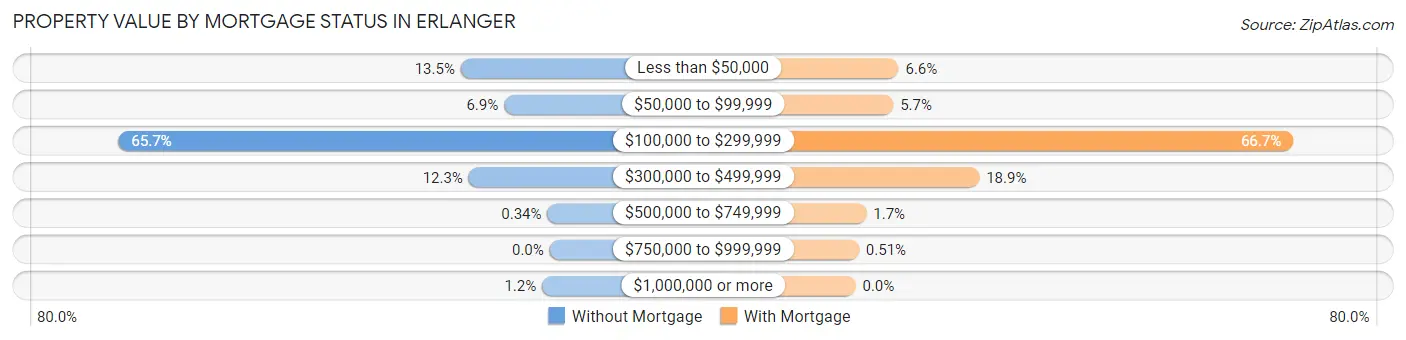
| Property Value | Without Mortgage | With Mortgage |
| Less than $50,000 | 201 (13.5%) | 258 (6.6%) |
| $50,000 to $99,999 | 103 (6.9%) | 226 (5.7%) |
| $100,000 to $299,999 | 975 (65.7%) | 2,625 (66.7%) |
| $300,000 to $499,999 | 183 (12.3%) | 742 (18.9%) |
| $500,000 to $749,999 | 5 (0.3%) | 65 (1.7%) |
| $750,000 to $999,999 | 0 (0.0%) | 20 (0.5%) |
| $1,000,000 or more | 17 (1.1%) | 0 (0.0%) |
| Total | 1,484 (100.0%) | 3,936 (100.0%) |
Household Income by Mortgage Status in Erlanger
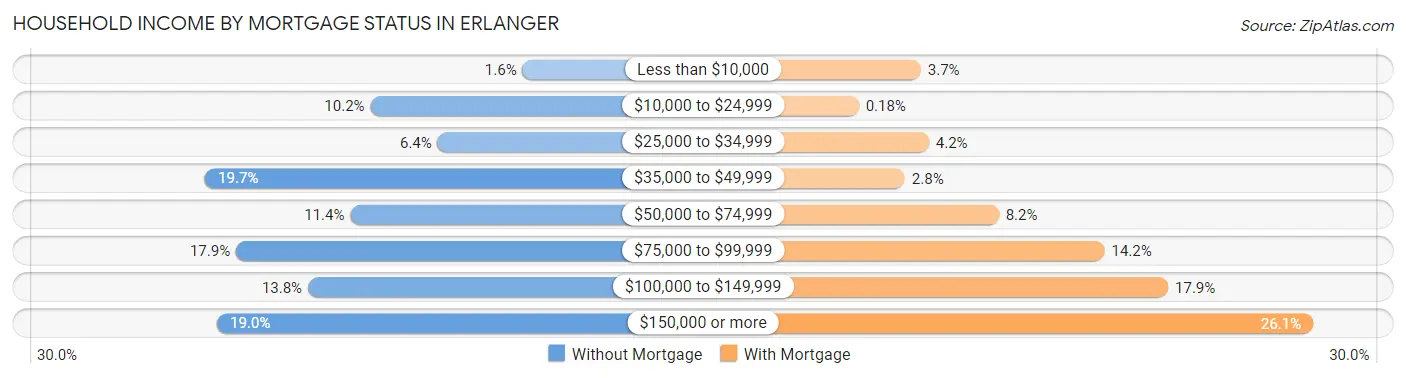
| Household Income | Without Mortgage | With Mortgage |
| Less than $10,000 | 23 (1.5%) | 147 (3.7%) |
| $10,000 to $24,999 | 152 (10.2%) | 7 (0.2%) |
| $25,000 to $34,999 | 95 (6.4%) | 165 (4.2%) |
| $35,000 to $49,999 | 292 (19.7%) | 111 (2.8%) |
| $50,000 to $74,999 | 169 (11.4%) | 322 (8.2%) |
| $75,000 to $99,999 | 266 (17.9%) | 560 (14.2%) |
| $100,000 to $149,999 | 205 (13.8%) | 703 (17.9%) |
| $150,000 or more | 282 (19.0%) | 1,029 (26.1%) |
| Total | 1,484 (100.0%) | 3,936 (100.0%) |
Property Value to Household Income Ratio in Erlanger
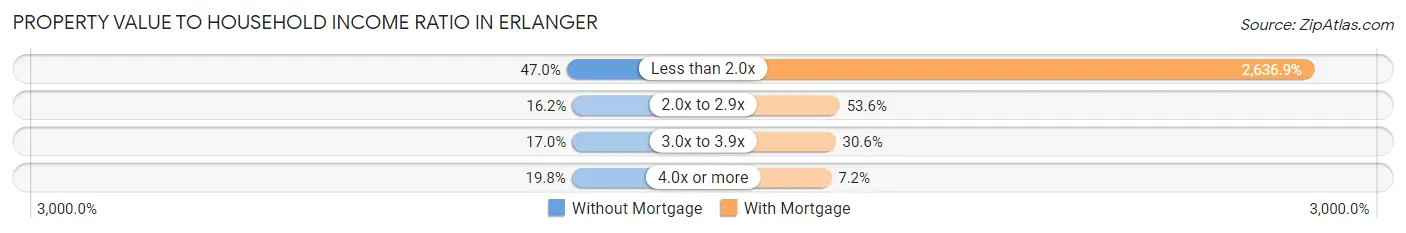
| Value-to-Income Ratio | Without Mortgage | With Mortgage |
| Less than 2.0x | 698 (47.0%) | 103,790 (2,636.9%) |
| 2.0x to 2.9x | 240 (16.2%) | 2,108 (53.6%) |
| 3.0x to 3.9x | 252 (17.0%) | 1,203 (30.6%) |
| 4.0x or more | 294 (19.8%) | 285 (7.2%) |
| Total | 1,484 (100.0%) | 3,936 (100.0%) |
Real Estate Taxes by Mortgage Status in Erlanger
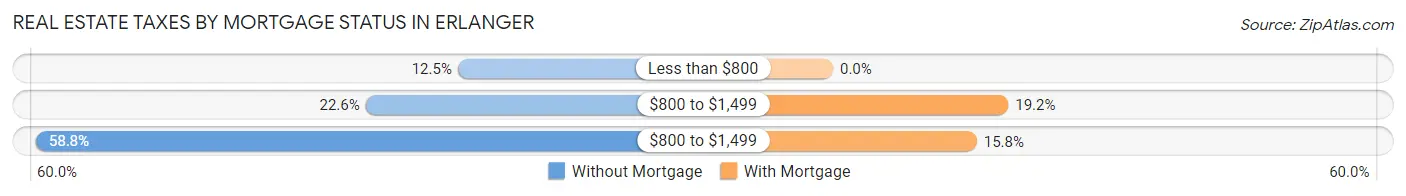
| Property Taxes | Without Mortgage | With Mortgage |
| Less than $800 | 186 (12.5%) | 0 (0.0%) |
| $800 to $1,499 | 336 (22.6%) | 756 (19.2%) |
| $800 to $1,499 | 872 (58.8%) | 620 (15.8%) |
| Total | 1,484 (100.0%) | 3,936 (100.0%) |
Health & Disability in Erlanger
Health Insurance Coverage by Age in Erlanger
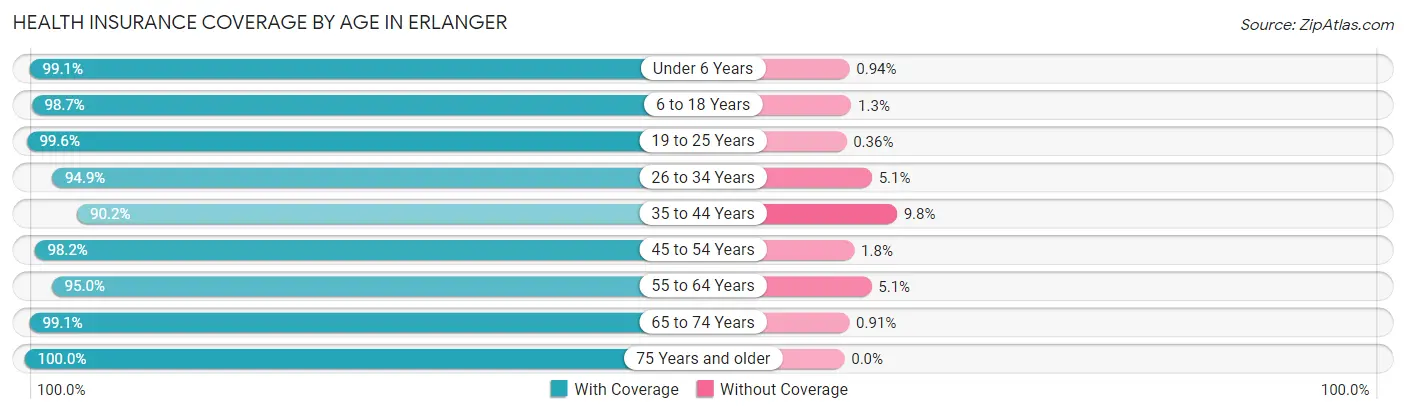
| Age Bracket | With Coverage | Without Coverage |
| Under 6 Years | 1,468 (99.1%) | 14 (0.9%) |
| 6 to 18 Years | 3,304 (98.7%) | 43 (1.3%) |
| 19 to 25 Years | 1,958 (99.6%) | 7 (0.4%) |
| 26 to 34 Years | 2,153 (94.9%) | 116 (5.1%) |
| 35 to 44 Years | 2,086 (90.2%) | 226 (9.8%) |
| 45 to 54 Years | 2,510 (98.2%) | 47 (1.8%) |
| 55 to 64 Years | 2,555 (95.0%) | 136 (5.1%) |
| 65 to 74 Years | 1,750 (99.1%) | 16 (0.9%) |
| 75 Years and older | 968 (100.0%) | 0 (0.0%) |
| Total | 18,752 (96.9%) | 605 (3.1%) |
Health Insurance Coverage by Citizenship Status in Erlanger
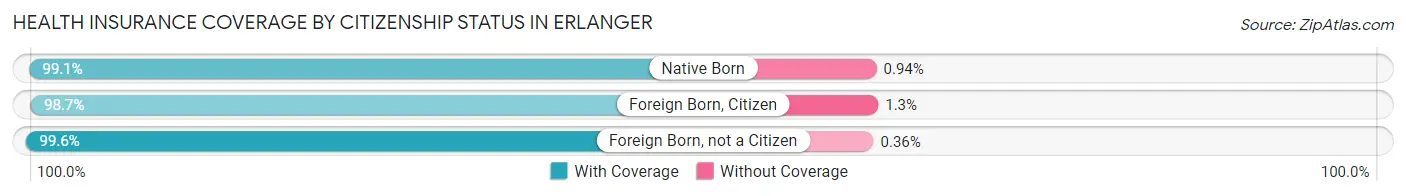
| Citizenship Status | With Coverage | Without Coverage |
| Native Born | 1,468 (99.1%) | 14 (0.9%) |
| Foreign Born, Citizen | 3,304 (98.7%) | 43 (1.3%) |
| Foreign Born, not a Citizen | 1,958 (99.6%) | 7 (0.4%) |
Health Insurance Coverage by Household Income in Erlanger
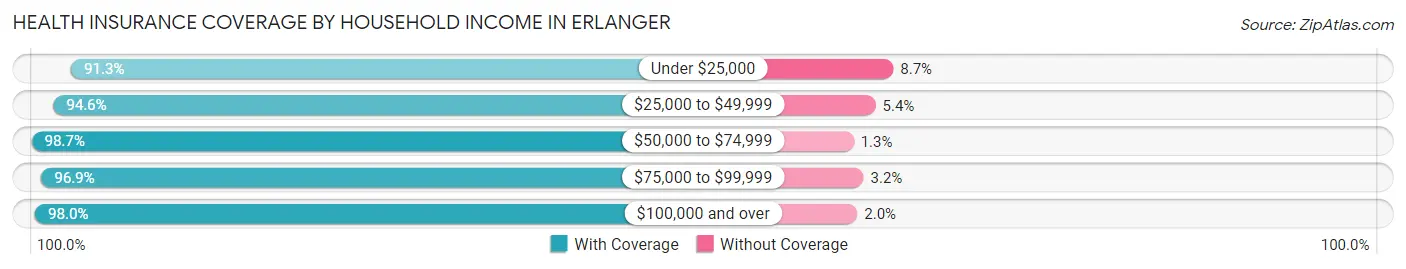
| Household Income | With Coverage | Without Coverage |
| Under $25,000 | 1,288 (91.3%) | 123 (8.7%) |
| $25,000 to $49,999 | 2,944 (94.6%) | 168 (5.4%) |
| $50,000 to $74,999 | 3,579 (98.7%) | 47 (1.3%) |
| $75,000 to $99,999 | 2,520 (96.9%) | 82 (3.2%) |
| $100,000 and over | 8,297 (98.0%) | 168 (2.0%) |
Public vs Private Health Insurance Coverage by Age in Erlanger
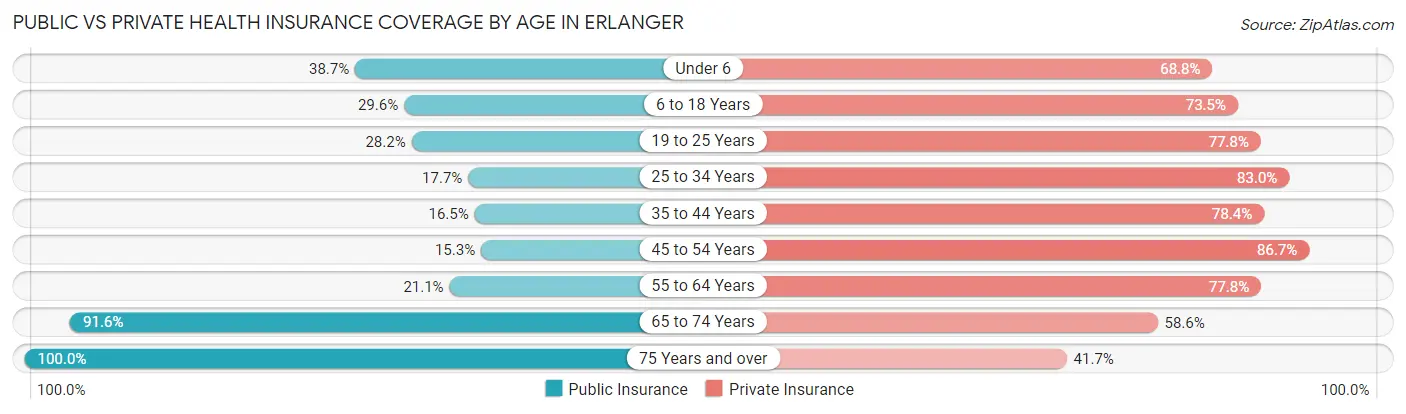
| Age Bracket | Public Insurance | Private Insurance |
| Under 6 | 573 (38.7%) | 1,019 (68.8%) |
| 6 to 18 Years | 990 (29.6%) | 2,460 (73.5%) |
| 19 to 25 Years | 554 (28.2%) | 1,528 (77.8%) |
| 25 to 34 Years | 401 (17.7%) | 1,884 (83.0%) |
| 35 to 44 Years | 381 (16.5%) | 1,812 (78.4%) |
| 45 to 54 Years | 391 (15.3%) | 2,218 (86.7%) |
| 55 to 64 Years | 569 (21.1%) | 2,094 (77.8%) |
| 65 to 74 Years | 1,617 (91.6%) | 1,035 (58.6%) |
| 75 Years and over | 968 (100.0%) | 404 (41.7%) |
| Total | 6,444 (33.3%) | 14,454 (74.7%) |
Disability Status by Sex by Age in Erlanger
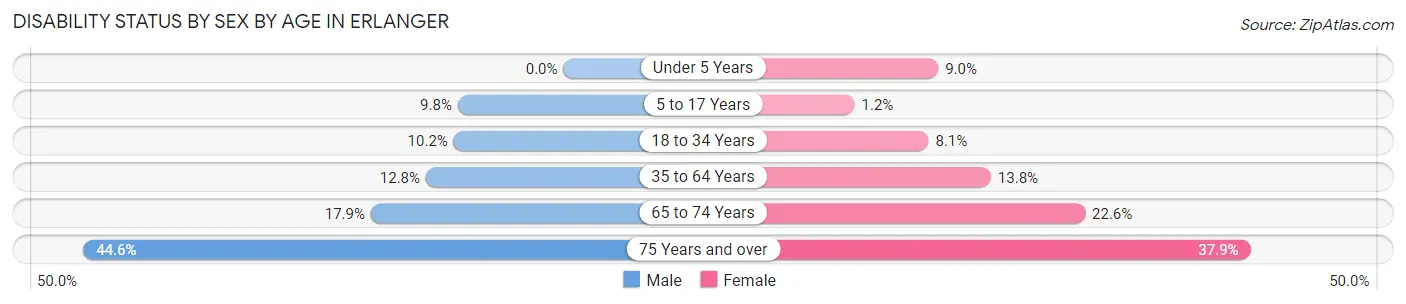
| Age Bracket | Male | Female |
| Under 5 Years | 0 (0.0%) | 51 (8.9%) |
| 5 to 17 Years | 170 (9.8%) | 20 (1.2%) |
| 18 to 34 Years | 228 (10.2%) | 176 (8.1%) |
| 35 to 64 Years | 473 (12.8%) | 533 (13.8%) |
| 65 to 74 Years | 151 (17.9%) | 208 (22.6%) |
| 75 Years and over | 221 (44.6%) | 179 (37.9%) |
Disability Class by Sex by Age in Erlanger
Disability Class: Hearing Difficulty
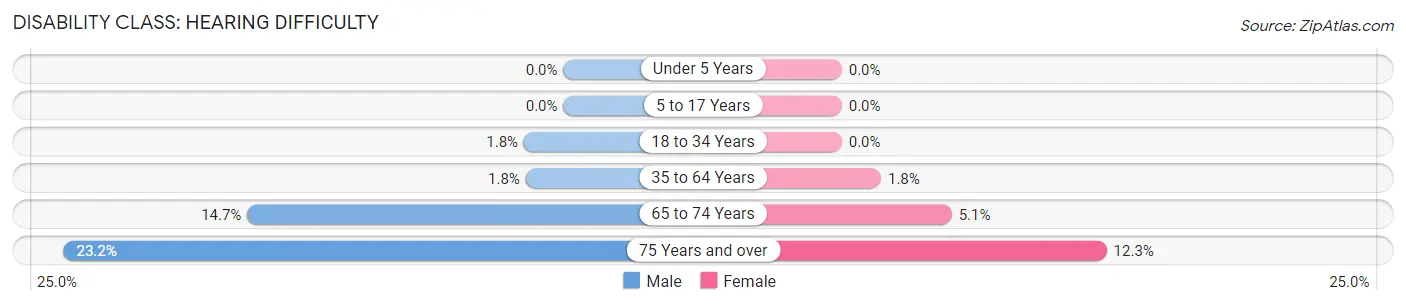
| Age Bracket | Male | Female |
| Under 5 Years | 0 (0.0%) | 0 (0.0%) |
| 5 to 17 Years | 0 (0.0%) | 0 (0.0%) |
| 18 to 34 Years | 41 (1.8%) | 0 (0.0%) |
| 35 to 64 Years | 65 (1.8%) | 70 (1.8%) |
| 65 to 74 Years | 124 (14.7%) | 47 (5.1%) |
| 75 Years and over | 115 (23.2%) | 58 (12.3%) |
Disability Class: Vision Difficulty
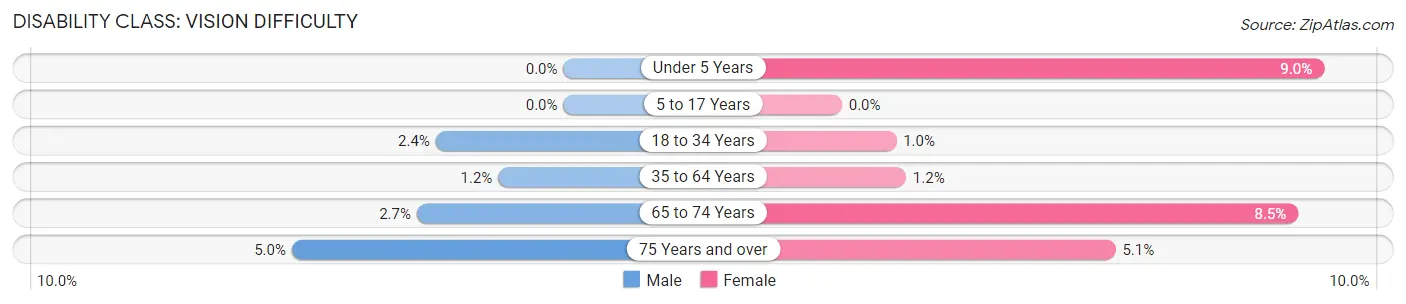
| Age Bracket | Male | Female |
| Under 5 Years | 0 (0.0%) | 51 (8.9%) |
| 5 to 17 Years | 0 (0.0%) | 0 (0.0%) |
| 18 to 34 Years | 53 (2.4%) | 22 (1.0%) |
| 35 to 64 Years | 45 (1.2%) | 46 (1.2%) |
| 65 to 74 Years | 23 (2.7%) | 78 (8.5%) |
| 75 Years and over | 25 (5.0%) | 24 (5.1%) |
Disability Class: Cognitive Difficulty
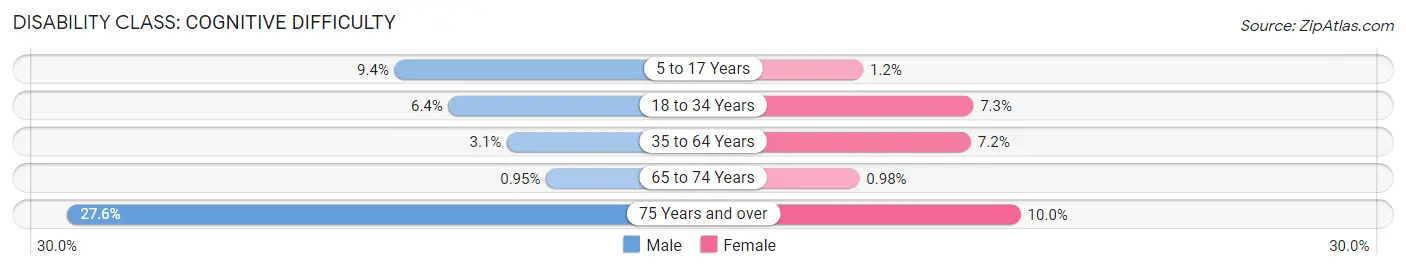
| Age Bracket | Male | Female |
| 5 to 17 Years | 163 (9.4%) | 20 (1.2%) |
| 18 to 34 Years | 143 (6.4%) | 160 (7.3%) |
| 35 to 64 Years | 116 (3.1%) | 277 (7.2%) |
| 65 to 74 Years | 8 (0.9%) | 9 (1.0%) |
| 75 Years and over | 137 (27.6%) | 47 (10.0%) |
Disability Class: Ambulatory Difficulty
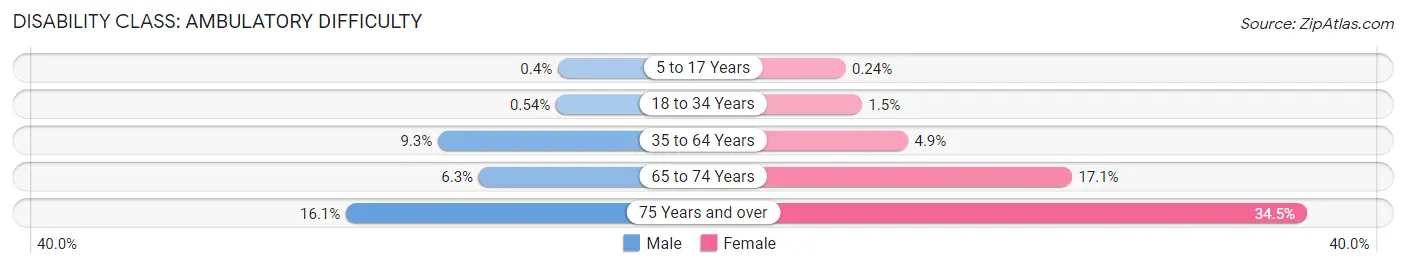
| Age Bracket | Male | Female |
| 5 to 17 Years | 7 (0.4%) | 4 (0.2%) |
| 18 to 34 Years | 12 (0.5%) | 32 (1.5%) |
| 35 to 64 Years | 345 (9.3%) | 188 (4.9%) |
| 65 to 74 Years | 53 (6.3%) | 157 (17.1%) |
| 75 Years and over | 80 (16.1%) | 163 (34.5%) |
Disability Class: Self-Care Difficulty
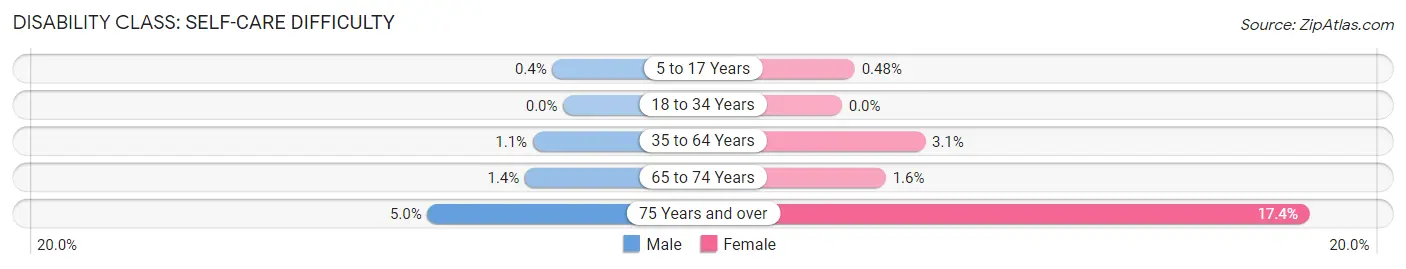
| Age Bracket | Male | Female |
| 5 to 17 Years | 7 (0.4%) | 8 (0.5%) |
| 18 to 34 Years | 0 (0.0%) | 0 (0.0%) |
| 35 to 64 Years | 42 (1.1%) | 119 (3.1%) |
| 65 to 74 Years | 12 (1.4%) | 15 (1.6%) |
| 75 Years and over | 25 (5.0%) | 82 (17.4%) |
Technology Access in Erlanger
Computing Device Access in Erlanger
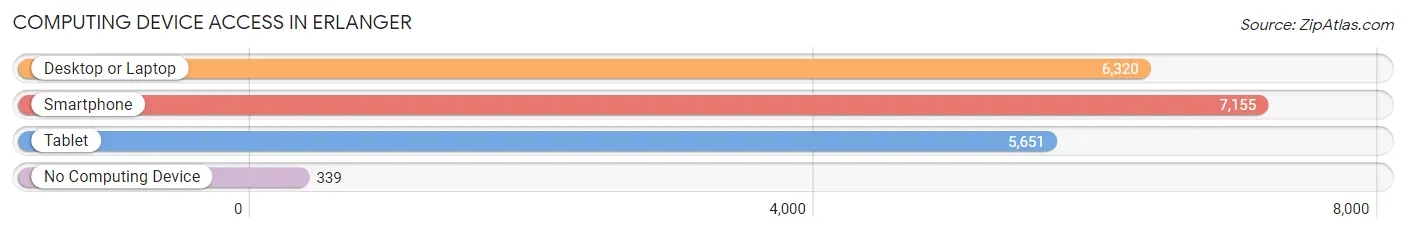
| Device Type | # Households | % Households |
| Desktop or Laptop | 6,320 | 80.2% |
| Smartphone | 7,155 | 90.9% |
| Tablet | 5,651 | 71.8% |
| No Computing Device | 339 | 4.3% |
| Total | 7,875 | 100.0% |
Internet Access in Erlanger
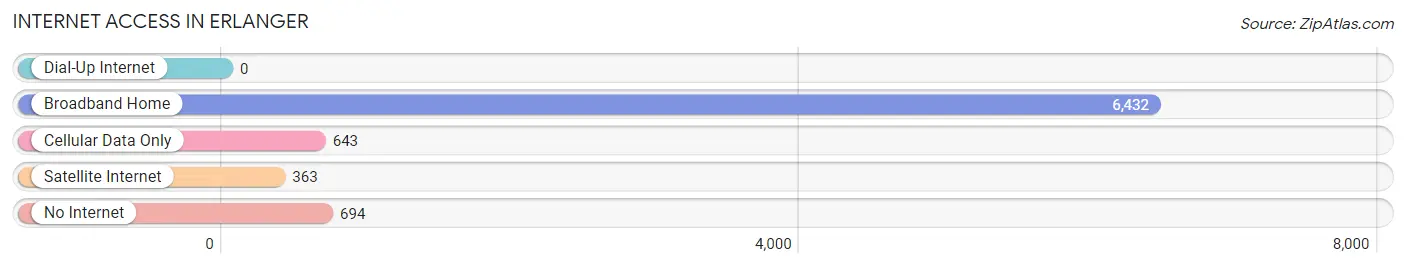
| Internet Type | # Households | % Households |
| Dial-Up Internet | 0 | 0.0% |
| Broadband Home | 6,432 | 81.7% |
| Cellular Data Only | 643 | 8.2% |
| Satellite Internet | 363 | 4.6% |
| No Internet | 694 | 8.8% |
| Total | 7,875 | 100.0% |
Erlanger Summary
Erlanger, Kentucky is a small city located in the northern part of the state, just south of Cincinnati, Ohio. It is part of the Cincinnati metropolitan area and is the county seat of Kenton County. The city has a population of just over 18,000 people and is known for its small-town charm and friendly atmosphere.
History
Erlanger was founded in 1881 by a group of German immigrants who named the city after their hometown of Erlangen, Germany. The city was incorporated in 1886 and quickly grew to become a thriving industrial center. The city was home to several factories, including the Erlanger Woolen Mills, which produced woolen goods for the Union Army during the Civil War. The city also had a large number of breweries, which produced beer for the local population.
In the early 20th century, Erlanger experienced a period of growth and prosperity. The city was home to several large businesses, including the Erlanger Brewing Company, the Erlanger Carriage Company, and the Erlanger Woolen Mills. The city also had a thriving downtown area, with several stores, restaurants, and other businesses.
Geography
Erlanger is located in the northern part of Kentucky, just south of Cincinnati, Ohio. The city is situated on the banks of the Ohio River and is surrounded by rolling hills and farmland. The city is located in the Cincinnati metropolitan area and is part of the Cincinnati-Northern Kentucky metropolitan statistical area.
The city has a total area of 4.3 square miles, all of which is land. The city has a humid subtropical climate, with hot, humid summers and cold, wet winters.
Economy
Erlanger’s economy is largely based on manufacturing and retail. The city is home to several large factories, including the Erlanger Brewing Company, the Erlanger Carriage Company, and the Erlanger Woolen Mills. The city also has a thriving retail sector, with several stores, restaurants, and other businesses.
The city is also home to several large employers, including the Erlanger-Elsmere School District, the Erlanger-Elsmere Public Library, and the Erlanger-Elsmere Fire Department. The city is also home to several hospitals, including St. Elizabeth Healthcare and the University of Cincinnati Medical Center.
Demographics
As of the 2010 census, Erlanger had a population of 18,082 people. The racial makeup of the city was 87.3% White, 8.2% African American, 0.3% Native American, 1.2% Asian, 0.1% Pacific Islander, 1.2% from other races, and 1.9% from two or more races. Hispanic or Latino of any race were 3.2% of the population.
The median income for a household in the city was $45,945, and the median income for a family was $54,945. The per capita income for the city was $22,945. About 8.2% of families and 10.2% of the population were below the poverty line, including 14.2% of those under age 18 and 6.2% of those age 65 or over.
Erlanger is a small city with a rich history and a friendly atmosphere. The city has a thriving economy and is home to several large employers. The city also has a diverse population, with a mix of races and ethnicities. Erlanger is a great place to live and work, and is a great place to visit.
Common Questions
What is Per Capita Income in Erlanger?
Per Capita income in Erlanger is $39,877.
What is the Median Family Income in Erlanger?
Median Family Income in Erlanger is $85,894.
What is the Median Household income in Erlanger?
Median Household Income in Erlanger is $74,147.
What is Income or Wage Gap in Erlanger?
Income or Wage Gap in Erlanger is 21.5%.
Women in Erlanger earn 78.5 cents for every dollar earned by a man.
What is Family Income Deficit in Erlanger?
Family Income Deficit in Erlanger is $15,096.
Families that are below poverty line in Erlanger earn $15,096 less on average than the poverty threshold level.
What is Inequality or Gini Index in Erlanger?
Inequality or Gini Index in Erlanger is 0.42.
What is the Total Population of Erlanger?
Total Population of Erlanger is 19,577.
What is the Total Male Population of Erlanger?
Total Male Population of Erlanger is 9,783.
What is the Total Female Population of Erlanger?
Total Female Population of Erlanger is 9,794.
What is the Ratio of Males per 100 Females in Erlanger?
There are 99.89 Males per 100 Females in Erlanger.
What is the Ratio of Females per 100 Males in Erlanger?
There are 100.11 Females per 100 Males in Erlanger.
What is the Median Population Age in Erlanger?
Median Population Age in Erlanger is 39.0 Years.
What is the Average Family Size in Erlanger
Average Family Size in Erlanger is 3.0 People.
What is the Average Household Size in Erlanger
Average Household Size in Erlanger is 2.5 People.
How Large is the Labor Force in Erlanger?
There are 11,129 People in the Labor Forcein in Erlanger.
What is the Percentage of People in the Labor Force in Erlanger?
71.4% of People are in the Labor Force in Erlanger.
What is the Unemployment Rate in Erlanger?
Unemployment Rate in Erlanger is 4.5%.