Glenview Hills, KY Map & Demographics
Glenview Hills Map
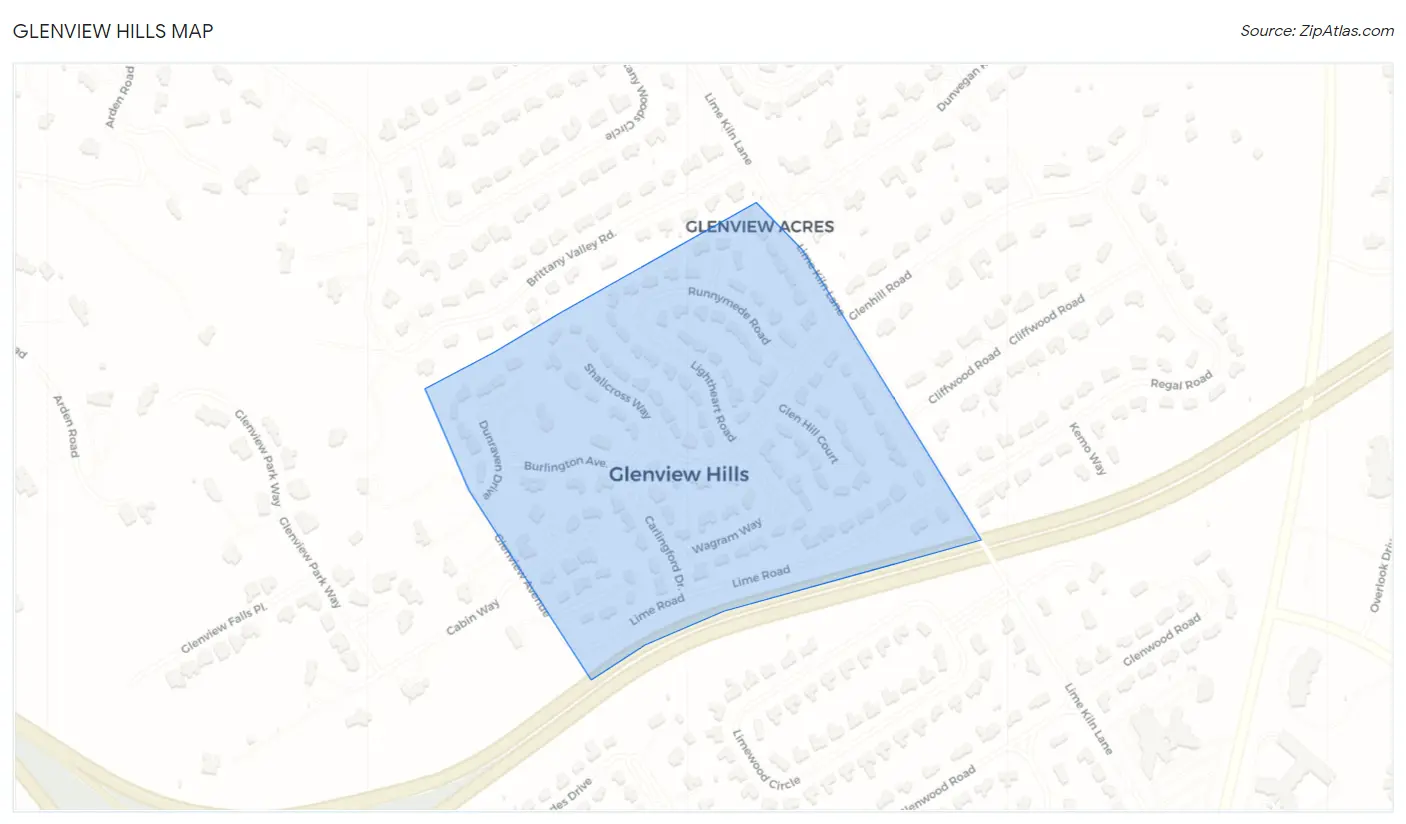
Glenview Hills Overview
$68,207
PER CAPITA INCOME
$147,500
AVG FAMILY INCOME
$141,667
AVG HOUSEHOLD INCOME
49.3%
WAGE / INCOME GAP [ % ]
50.7¢/ $1
WAGE / INCOME GAP [ $ ]
0.38
INEQUALITY / GINI INDEX
345
TOTAL POPULATION
168
MALE POPULATION
177
FEMALE POPULATION
94.92
MALES / 100 FEMALES
105.36
FEMALES / 100 MALES
48.5
MEDIAN AGE
3.0
AVG FAMILY SIZE
2.6
AVG HOUSEHOLD SIZE
182
LABOR FORCE [ PEOPLE ]
64.8%
PERCENT IN LABOR FORCE
Glenview Hills Area Codes
Income in Glenview Hills
Income Overview in Glenview Hills
Per Capita Income in Glenview Hills is $68,207, while median incomes of families and households are $147,500 and $141,667 respectively.
| Characteristic | Number | Measure |
| Per Capita Income | 345 | $68,207 |
| Median Family Income | 102 | $147,500 |
| Mean Family Income | 102 | $182,182 |
| Median Household Income | 132 | $141,667 |
| Mean Household Income | 132 | $176,843 |
| Income Deficit | 102 | $0 |
| Wage / Income Gap (%) | 345 | 49.28% |
| Wage / Income Gap ($) | 345 | 50.72¢ per $1 |
| Gini / Inequality Index | 345 | 0.38 |
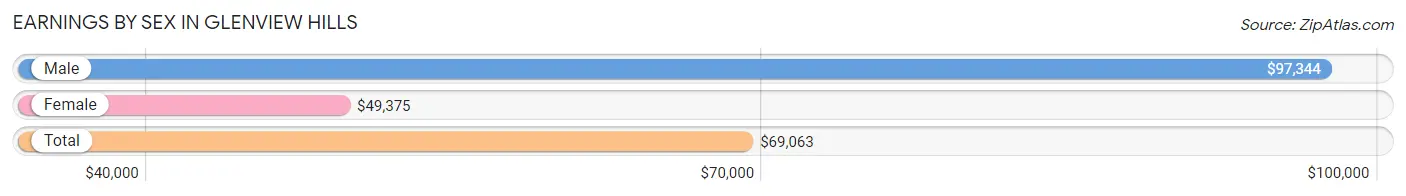
Earnings by Sex in Glenview Hills
Average Earnings in Glenview Hills are $69,063, $97,344 for men and $49,375 for women, a difference of 49.3%.
| Sex | Number | Average Earnings |
| Male | 103 (53.9%) | $97,344 |
| Female | 88 (46.1%) | $49,375 |
| Total | 191 (100.0%) | $69,063 |
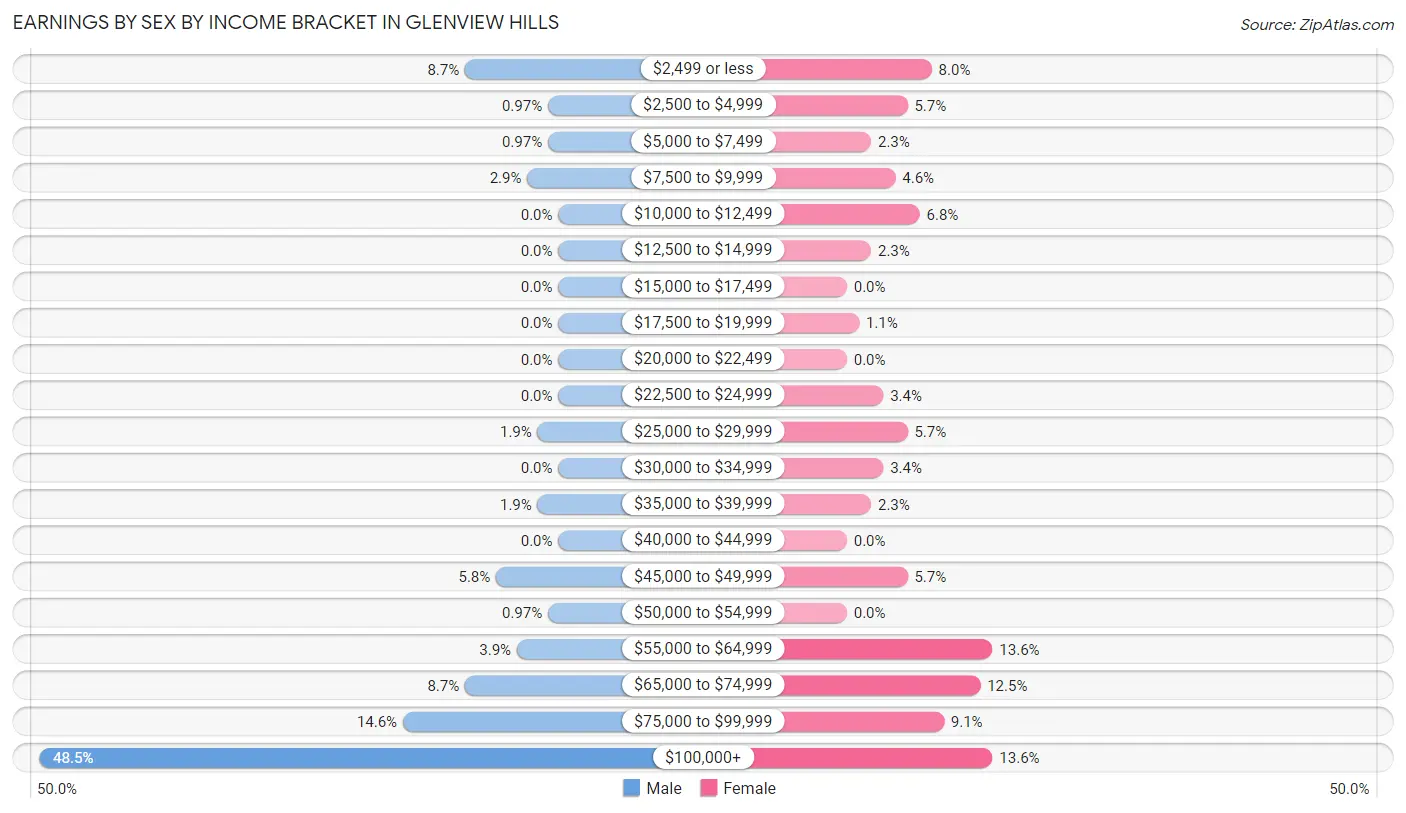
Earnings by Sex by Income Bracket in Glenview Hills
The most common earnings brackets in Glenview Hills are $100,000+ for men (50 | 48.5%) and $55,000 to $64,999 for women (12 | 13.6%).
| Income | Male | Female |
| $2,499 or less | 9 (8.7%) | 7 (8.0%) |
| $2,500 to $4,999 | 1 (1.0%) | 5 (5.7%) |
| $5,000 to $7,499 | 1 (1.0%) | 2 (2.3%) |
| $7,500 to $9,999 | 3 (2.9%) | 4 (4.5%) |
| $10,000 to $12,499 | 0 (0.0%) | 6 (6.8%) |
| $12,500 to $14,999 | 0 (0.0%) | 2 (2.3%) |
| $15,000 to $17,499 | 0 (0.0%) | 0 (0.0%) |
| $17,500 to $19,999 | 0 (0.0%) | 1 (1.1%) |
| $20,000 to $22,499 | 0 (0.0%) | 0 (0.0%) |
| $22,500 to $24,999 | 0 (0.0%) | 3 (3.4%) |
| $25,000 to $29,999 | 2 (1.9%) | 5 (5.7%) |
| $30,000 to $34,999 | 0 (0.0%) | 3 (3.4%) |
| $35,000 to $39,999 | 2 (1.9%) | 2 (2.3%) |
| $40,000 to $44,999 | 0 (0.0%) | 0 (0.0%) |
| $45,000 to $49,999 | 6 (5.8%) | 5 (5.7%) |
| $50,000 to $54,999 | 1 (1.0%) | 0 (0.0%) |
| $55,000 to $64,999 | 4 (3.9%) | 12 (13.6%) |
| $65,000 to $74,999 | 9 (8.7%) | 11 (12.5%) |
| $75,000 to $99,999 | 15 (14.6%) | 8 (9.1%) |
| $100,000+ | 50 (48.5%) | 12 (13.6%) |
| Total | 103 (100.0%) | 88 (100.0%) |
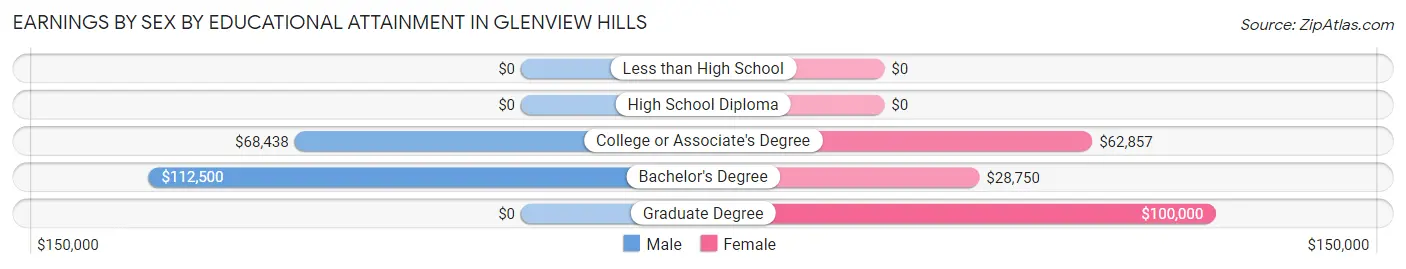
Earnings by Sex by Educational Attainment in Glenview Hills
Average earnings in Glenview Hills are $103,125 for men and $57,188 for women, a difference of 44.5%. Men with an educational attainment of bachelor's degree enjoy the highest average annual earnings of $112,500, while those with college or associate's degree education earn the least with $68,438. Women with an educational attainment of graduate degree earn the most with the average annual earnings of $100,000, while those with bachelor's degree education have the smallest earnings of $28,750.
| Educational Attainment | Male Income | Female Income |
| Less than High School | - | - |
| High School Diploma | - | - |
| College or Associate's Degree | $68,438 | $62,857 |
| Bachelor's Degree | $112,500 | $28,750 |
| Graduate Degree | - | - |
| Total | $103,125 | $57,188 |
Family Income in Glenview Hills
Family Income Brackets in Glenview Hills
According to the Glenview Hills family income data, there are 39 families falling into the $200,000+ income range, which is the most common income bracket and makes up 38.2% of all families.
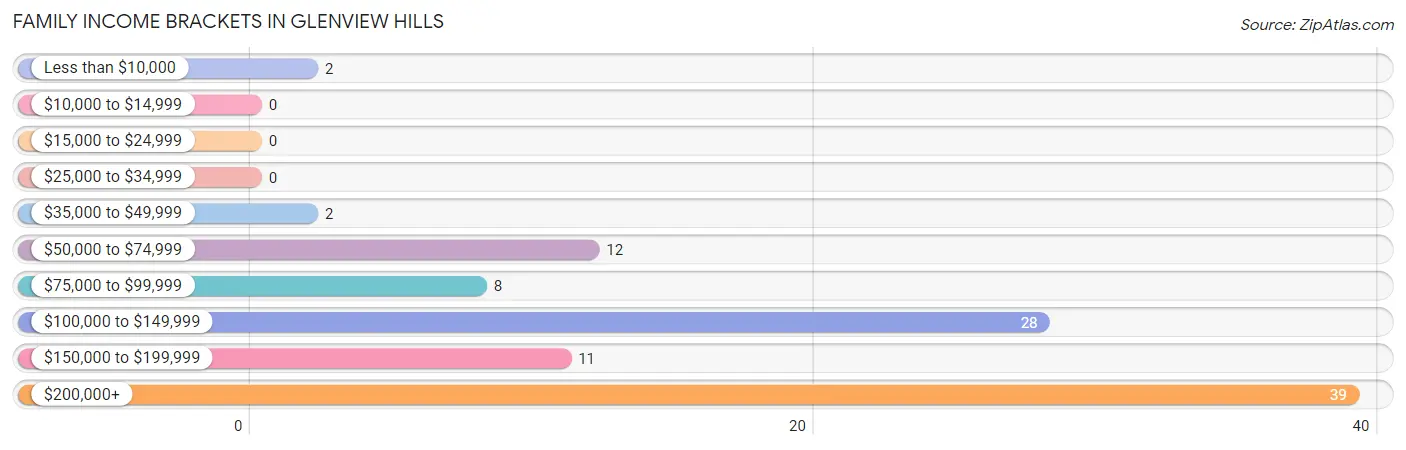
| Income Bracket | # Families | % Families |
| Less than $10,000 | 2 | 2.0% |
| $10,000 to $14,999 | 0 | 0.0% |
| $15,000 to $24,999 | 0 | 0.0% |
| $25,000 to $34,999 | 0 | 0.0% |
| $35,000 to $49,999 | 2 | 2.0% |
| $50,000 to $74,999 | 12 | 11.8% |
| $75,000 to $99,999 | 8 | 7.8% |
| $100,000 to $149,999 | 28 | 27.5% |
| $150,000 to $199,999 | 11 | 10.8% |
| $200,000+ | 39 | 38.2% |
Family Income by Famaliy Size in Glenview Hills
4-person families (20 | 19.6%) account for the highest median family income in Glenview Hills with $241,250 per family, while 4-person families (20 | 19.6%) have the highest median income of $60,312 per family member.
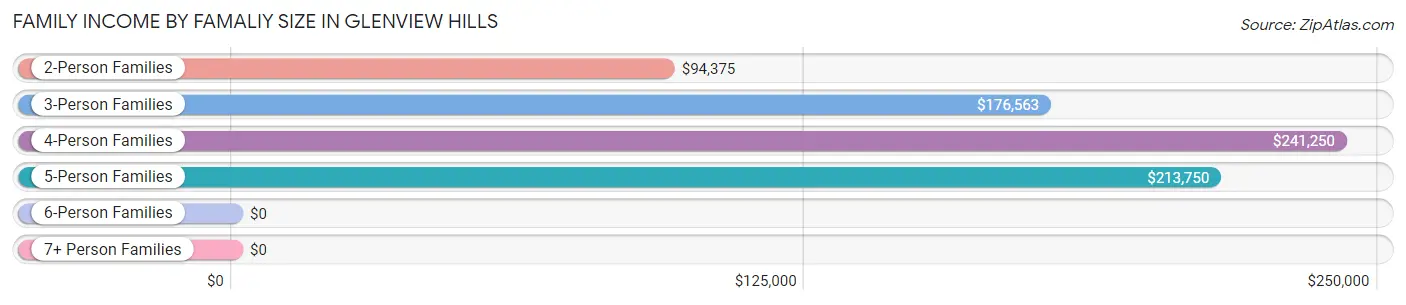
| Income Bracket | # Families | Median Income |
| 2-Person Families | 44 (43.1%) | $94,375 |
| 3-Person Families | 31 (30.4%) | $176,563 |
| 4-Person Families | 20 (19.6%) | $241,250 |
| 5-Person Families | 6 (5.9%) | $213,750 |
| 6-Person Families | 1 (1.0%) | $0 |
| 7+ Person Families | 0 (0.0%) | $0 |
| Total | 102 (100.0%) | $147,500 |
Family Income by Number of Earners in Glenview Hills
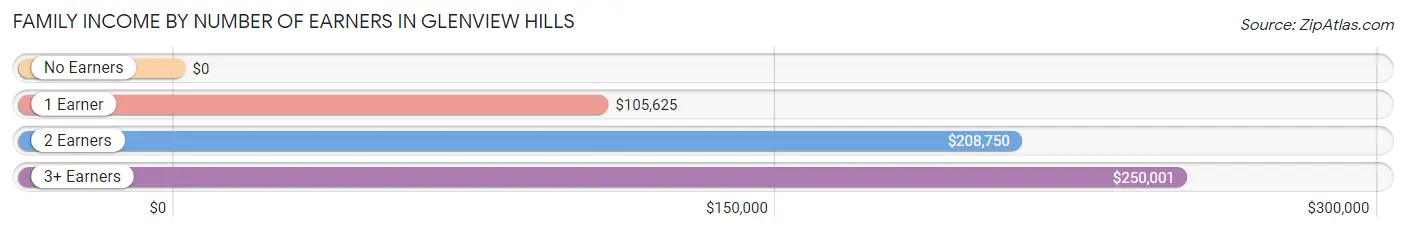
| Number of Earners | # Families | Median Income |
| No Earners | 23 (22.6%) | $0 |
| 1 Earner | 20 (19.6%) | $105,625 |
| 2 Earners | 40 (39.2%) | $208,750 |
| 3+ Earners | 19 (18.6%) | $250,001 |
| Total | 102 (100.0%) | $147,500 |
Household Income in Glenview Hills
Household Income Brackets in Glenview Hills
With 49 households falling in the category, the $200,000+ income range is the most frequent in Glenview Hills, accounting for 37.1% of all households.
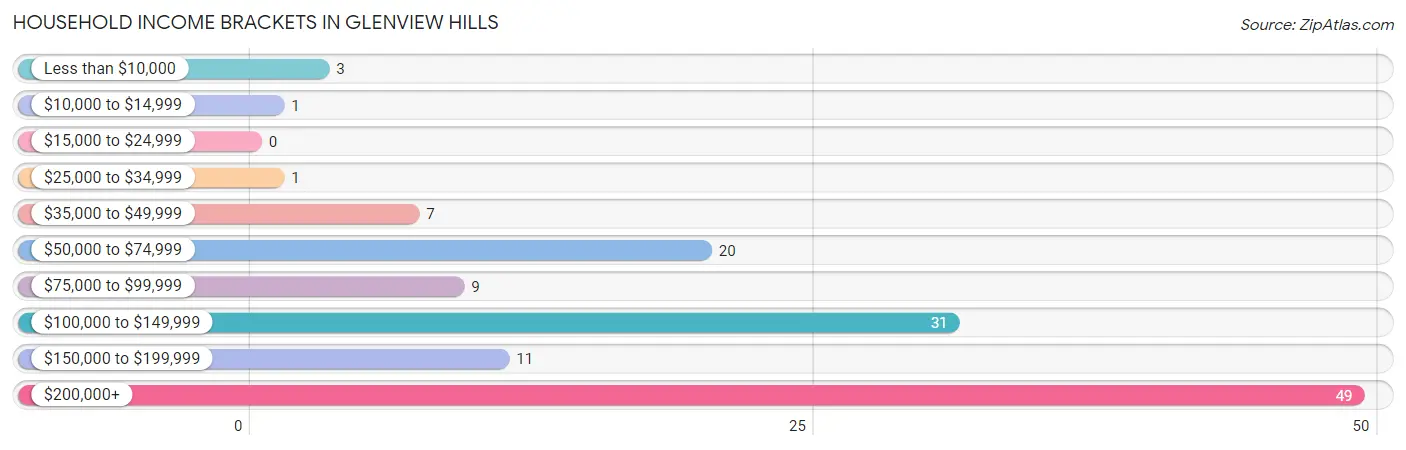
| Income Bracket | # Households | % Households |
| Less than $10,000 | 3 | 2.3% |
| $10,000 to $14,999 | 1 | 0.8% |
| $15,000 to $24,999 | 0 | 0.0% |
| $25,000 to $34,999 | 1 | 0.8% |
| $35,000 to $49,999 | 7 | 5.3% |
| $50,000 to $74,999 | 20 | 15.2% |
| $75,000 to $99,999 | 9 | 6.8% |
| $100,000 to $149,999 | 31 | 23.5% |
| $150,000 to $199,999 | 11 | 8.3% |
| $200,000+ | 49 | 37.1% |
Household Income by Householder Age in Glenview Hills
The median household income in Glenview Hills is $141,667, with the highest median household income of $205,000 found in the 25 to 44 years age bracket for the primary householder. A total of 24 households (18.2%) fall into this category.
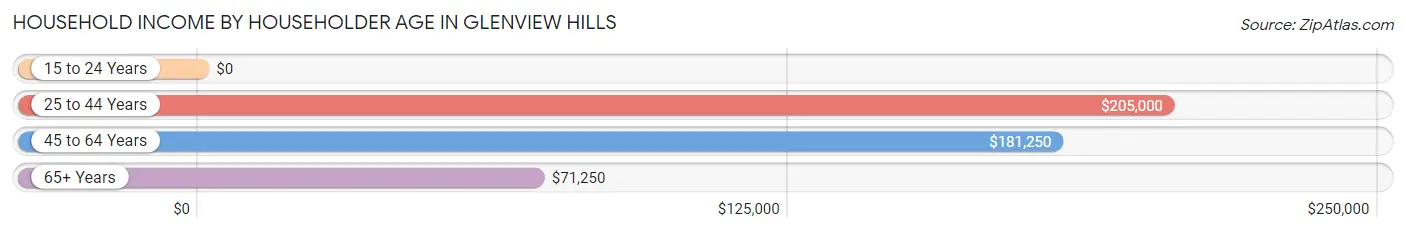
| Income Bracket | # Households | Median Income |
| 15 to 24 Years | 0 (0.0%) | $0 |
| 25 to 44 Years | 24 (18.2%) | $205,000 |
| 45 to 64 Years | 58 (43.9%) | $181,250 |
| 65+ Years | 50 (37.9%) | $71,250 |
| Total | 132 (100.0%) | $141,667 |
Poverty in Glenview Hills
Income Below Poverty by Sex and Age in Glenview Hills
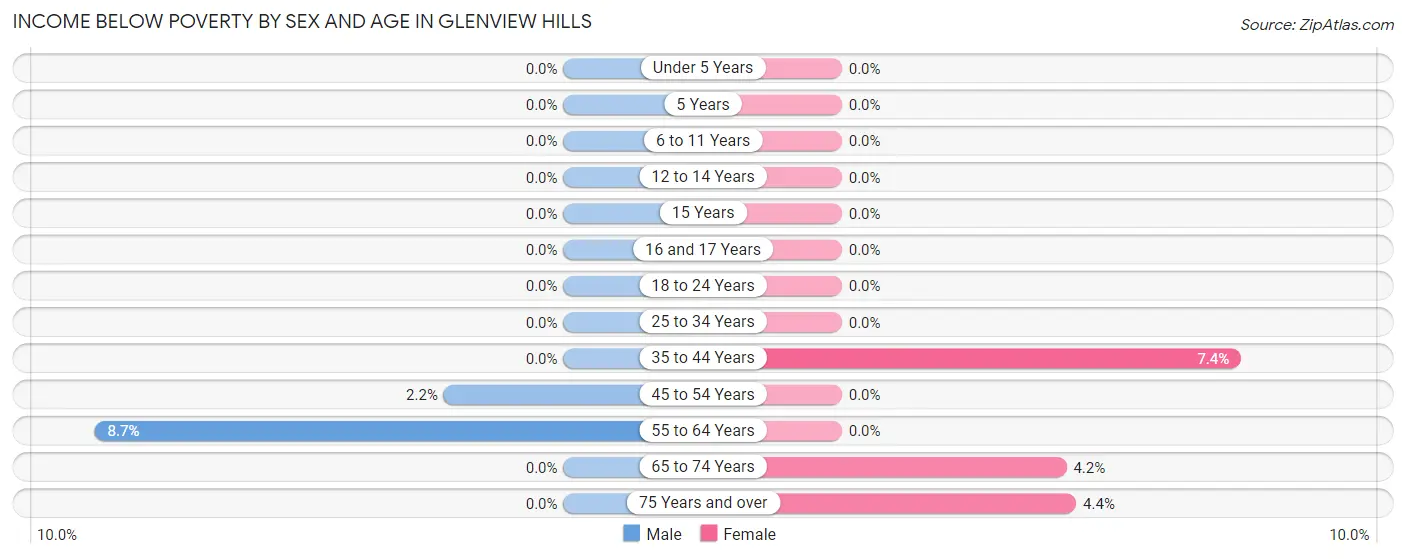
With 1.8% poverty level for males and 2.3% for females among the residents of Glenview Hills, 55 to 64 year old males and 35 to 44 year old females are the most vulnerable to poverty, with 2 males (8.7%) and 2 females (7.4%) in their respective age groups living below the poverty level.
| Age Bracket | Male | Female |
| Under 5 Years | 0 (0.0%) | 0 (0.0%) |
| 5 Years | 0 (0.0%) | 0 (0.0%) |
| 6 to 11 Years | 0 (0.0%) | 0 (0.0%) |
| 12 to 14 Years | 0 (0.0%) | 0 (0.0%) |
| 15 Years | 0 (0.0%) | 0 (0.0%) |
| 16 and 17 Years | 0 (0.0%) | 0 (0.0%) |
| 18 to 24 Years | 0 (0.0%) | 0 (0.0%) |
| 25 to 34 Years | 0 (0.0%) | 0 (0.0%) |
| 35 to 44 Years | 0 (0.0%) | 2 (7.4%) |
| 45 to 54 Years | 1 (2.2%) | 0 (0.0%) |
| 55 to 64 Years | 2 (8.7%) | 0 (0.0%) |
| 65 to 74 Years | 0 (0.0%) | 1 (4.2%) |
| 75 Years and over | 0 (0.0%) | 1 (4.3%) |
| Total | 3 (1.8%) | 4 (2.3%) |
Income Above Poverty by Sex and Age in Glenview Hills
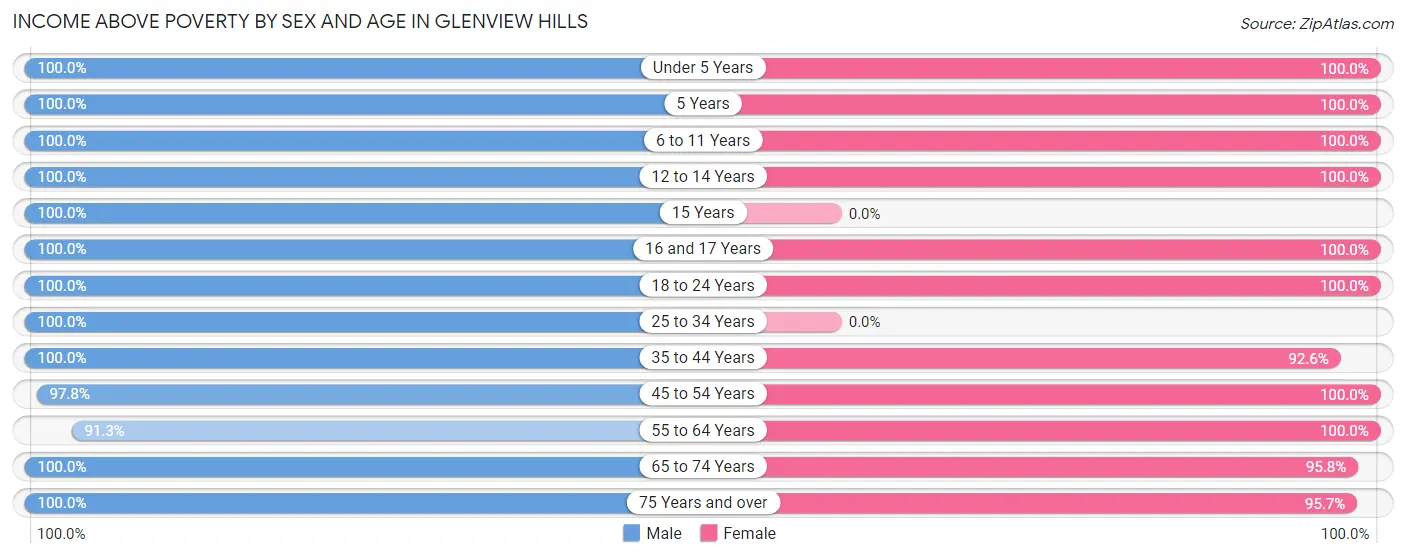
According to the poverty statistics in Glenview Hills, males aged under 5 years and females aged under 5 years are the age groups that are most secure financially, with 100.0% of males and 100.0% of females in these age groups living above the poverty line.
| Age Bracket | Male | Female |
| Under 5 Years | 4 (100.0%) | 13 (100.0%) |
| 5 Years | 3 (100.0%) | 3 (100.0%) |
| 6 to 11 Years | 7 (100.0%) | 7 (100.0%) |
| 12 to 14 Years | 17 (100.0%) | 8 (100.0%) |
| 15 Years | 2 (100.0%) | 0 (0.0%) |
| 16 and 17 Years | 6 (100.0%) | 16 (100.0%) |
| 18 to 24 Years | 8 (100.0%) | 2 (100.0%) |
| 25 to 34 Years | 3 (100.0%) | 0 (0.0%) |
| 35 to 44 Years | 19 (100.0%) | 25 (92.6%) |
| 45 to 54 Years | 44 (97.8%) | 43 (100.0%) |
| 55 to 64 Years | 21 (91.3%) | 11 (100.0%) |
| 65 to 74 Years | 13 (100.0%) | 23 (95.8%) |
| 75 Years and over | 18 (100.0%) | 22 (95.7%) |
| Total | 165 (98.2%) | 173 (97.7%) |
Income Below Poverty Among Married-Couple Families in Glenview Hills
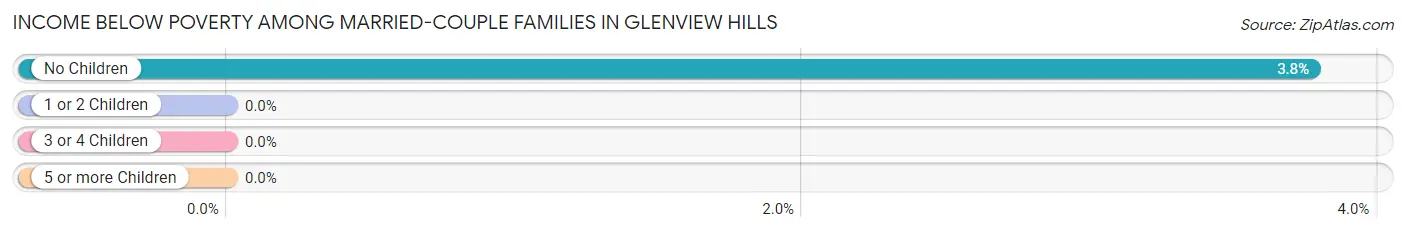
The poverty statistics for married-couple families in Glenview Hills show that 2.1% or 2 of the total 95 families live below the poverty line. Families with no children have the highest poverty rate of 3.8%, comprising of 2 families. On the other hand, families with 1 or 2 children have the lowest poverty rate of 0.0%, which includes 0 families.
| Children | Above Poverty | Below Poverty |
| No Children | 51 (96.2%) | 2 (3.8%) |
| 1 or 2 Children | 38 (100.0%) | 0 (0.0%) |
| 3 or 4 Children | 4 (100.0%) | 0 (0.0%) |
| 5 or more Children | 0 (0.0%) | 0 (0.0%) |
| Total | 93 (97.9%) | 2 (2.1%) |
Income Below Poverty Among Single-Parent Households in Glenview Hills
| Children | Single Father | Single Mother |
| No Children | 0 (0.0%) | 0 (0.0%) |
| 1 or 2 Children | 0 (0.0%) | 0 (0.0%) |
| 3 or 4 Children | 0 (0.0%) | 0 (0.0%) |
| 5 or more Children | 0 (0.0%) | 0 (0.0%) |
| Total | 0 (0.0%) | 0 (0.0%) |
Income Below Poverty Among Married-Couple vs Single-Parent Households in Glenview Hills
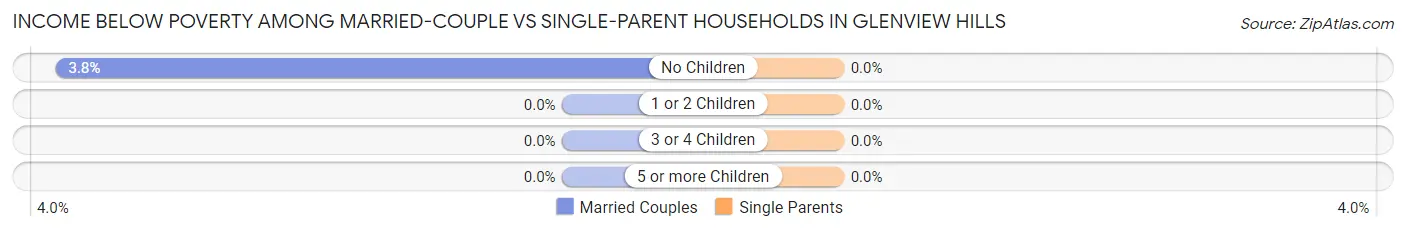
| Children | Married-Couple Families | Single-Parent Households |
| No Children | 2 (3.8%) | 0 (0.0%) |
| 1 or 2 Children | 0 (0.0%) | 0 (0.0%) |
| 3 or 4 Children | 0 (0.0%) | 0 (0.0%) |
| 5 or more Children | 0 (0.0%) | 0 (0.0%) |
| Total | 2 (2.1%) | 0 (0.0%) |
Race in Glenview Hills
The most populous races in Glenview Hills are White / Caucasian (327 | 94.8%), Hispanic or Latino (14 | 4.1%), and Two or more Races (13 | 3.8%).
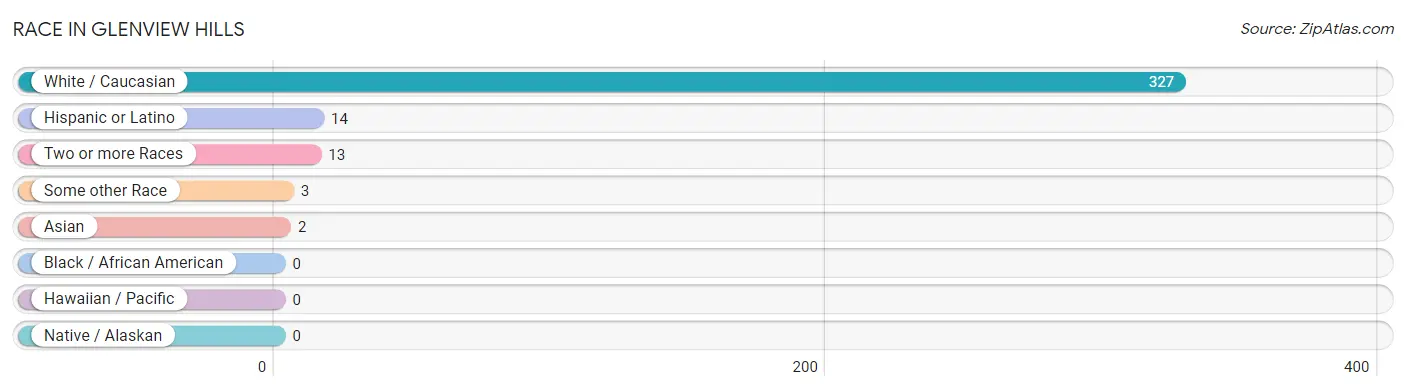
| Race | # Population | % Population |
| Asian | 2 | 0.6% |
| Black / African American | 0 | 0.0% |
| Hawaiian / Pacific | 0 | 0.0% |
| Hispanic or Latino | 14 | 4.1% |
| Native / Alaskan | 0 | 0.0% |
| White / Caucasian | 327 | 94.8% |
| Two or more Races | 13 | 3.8% |
| Some other Race | 3 | 0.9% |
| Total | 345 | 100.0% |
Ancestry in Glenview Hills
The most populous ancestries reported in Glenview Hills are English (77 | 22.3%), German (72 | 20.9%), Irish (47 | 13.6%), American (36 | 10.4%), and European (23 | 6.7%), together accounting for 73.9% of all Glenview Hills residents.
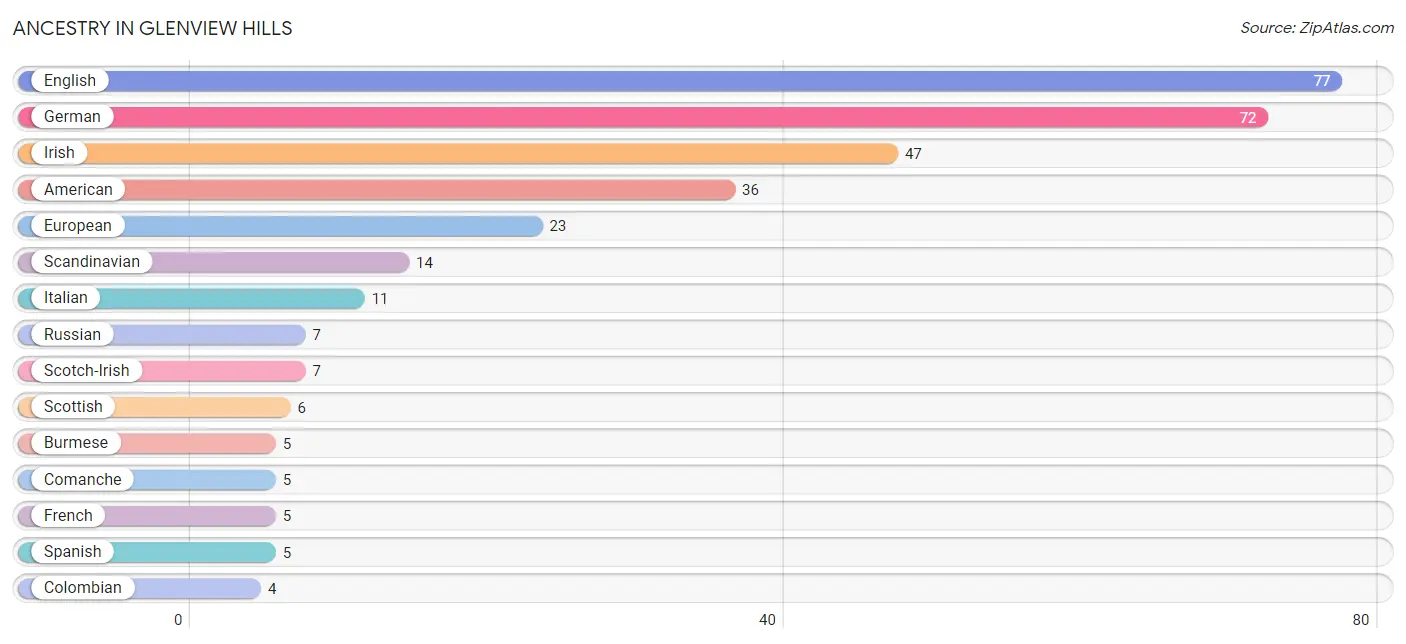
| Ancestry | # Population | % Population |
| African | 1 | 0.3% |
| American | 36 | 10.4% |
| Austrian | 1 | 0.3% |
| British | 1 | 0.3% |
| Burmese | 5 | 1.5% |
| Central American | 3 | 0.9% |
| Colombian | 4 | 1.2% |
| Comanche | 5 | 1.5% |
| Creek | 4 | 1.2% |
| Czechoslovakian | 3 | 0.9% |
| Dutch | 4 | 1.2% |
| English | 77 | 22.3% |
| European | 23 | 6.7% |
| French | 5 | 1.5% |
| French Canadian | 2 | 0.6% |
| German | 72 | 20.9% |
| Guatemalan | 3 | 0.9% |
| Hungarian | 2 | 0.6% |
| Irish | 47 | 13.6% |
| Italian | 11 | 3.2% |
| Lithuanian | 2 | 0.6% |
| Mexican | 2 | 0.6% |
| Norwegian | 1 | 0.3% |
| Polish | 4 | 1.2% |
| Romanian | 1 | 0.3% |
| Russian | 7 | 2.0% |
| Scandinavian | 14 | 4.1% |
| Scotch-Irish | 7 | 2.0% |
| Scottish | 6 | 1.7% |
| South American | 4 | 1.2% |
| Spanish | 5 | 1.5% |
| Subsaharan African | 1 | 0.3% |
| Swedish | 1 | 0.3% |
| Ukrainian | 2 | 0.6% |
| Welsh | 2 | 0.6% | View All 35 Rows |
Immigrants in Glenview Hills
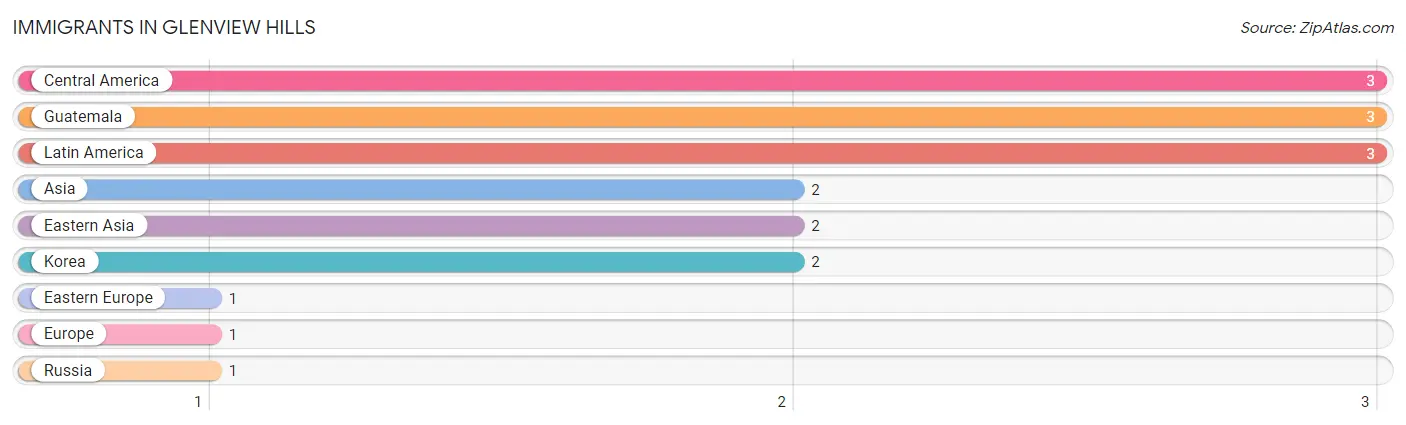
The most numerous immigrant groups reported in Glenview Hills came from Central America (3 | 0.9%), Guatemala (3 | 0.9%), Latin America (3 | 0.9%), Asia (2 | 0.6%), and Eastern Asia (2 | 0.6%), together accounting for 3.8% of all Glenview Hills residents.
| Immigration Origin | # Population | % Population |
| Asia | 2 | 0.6% |
| Central America | 3 | 0.9% |
| Eastern Asia | 2 | 0.6% |
| Eastern Europe | 1 | 0.3% |
| Europe | 1 | 0.3% |
| Guatemala | 3 | 0.9% |
| Korea | 2 | 0.6% |
| Latin America | 3 | 0.9% |
| Russia | 1 | 0.3% | View All 9 Rows |
Sex and Age in Glenview Hills
Sex and Age in Glenview Hills
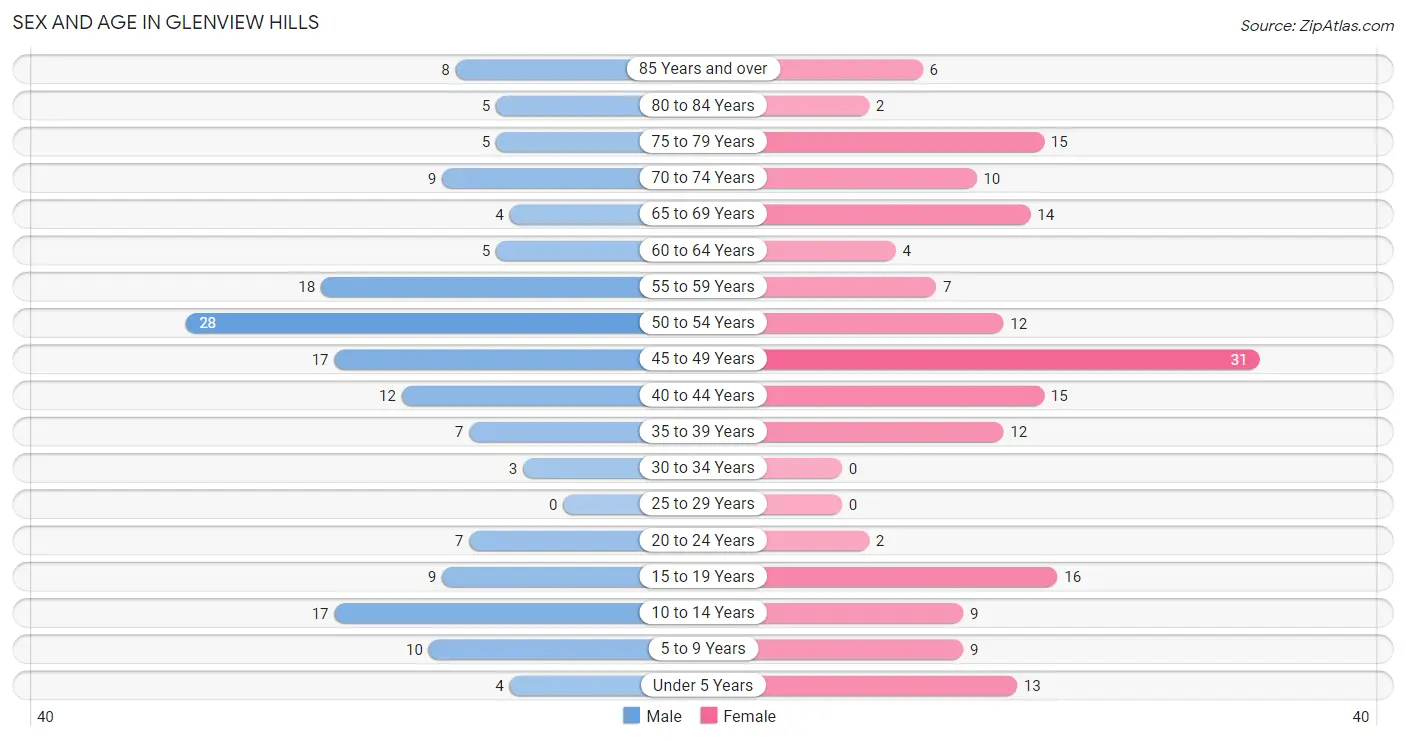
The most populous age groups in Glenview Hills are 50 to 54 Years (28 | 16.7%) for men and 45 to 49 Years (31 | 17.5%) for women.
| Age Bracket | Male | Female |
| Under 5 Years | 4 (2.4%) | 13 (7.3%) |
| 5 to 9 Years | 10 (5.9%) | 9 (5.1%) |
| 10 to 14 Years | 17 (10.1%) | 9 (5.1%) |
| 15 to 19 Years | 9 (5.4%) | 16 (9.0%) |
| 20 to 24 Years | 7 (4.2%) | 2 (1.1%) |
| 25 to 29 Years | 0 (0.0%) | 0 (0.0%) |
| 30 to 34 Years | 3 (1.8%) | 0 (0.0%) |
| 35 to 39 Years | 7 (4.2%) | 12 (6.8%) |
| 40 to 44 Years | 12 (7.1%) | 15 (8.5%) |
| 45 to 49 Years | 17 (10.1%) | 31 (17.5%) |
| 50 to 54 Years | 28 (16.7%) | 12 (6.8%) |
| 55 to 59 Years | 18 (10.7%) | 7 (4.0%) |
| 60 to 64 Years | 5 (3.0%) | 4 (2.3%) |
| 65 to 69 Years | 4 (2.4%) | 14 (7.9%) |
| 70 to 74 Years | 9 (5.4%) | 10 (5.7%) |
| 75 to 79 Years | 5 (3.0%) | 15 (8.5%) |
| 80 to 84 Years | 5 (3.0%) | 2 (1.1%) |
| 85 Years and over | 8 (4.8%) | 6 (3.4%) |
| Total | 168 (100.0%) | 177 (100.0%) |
Families and Households in Glenview Hills
Median Family Size in Glenview Hills
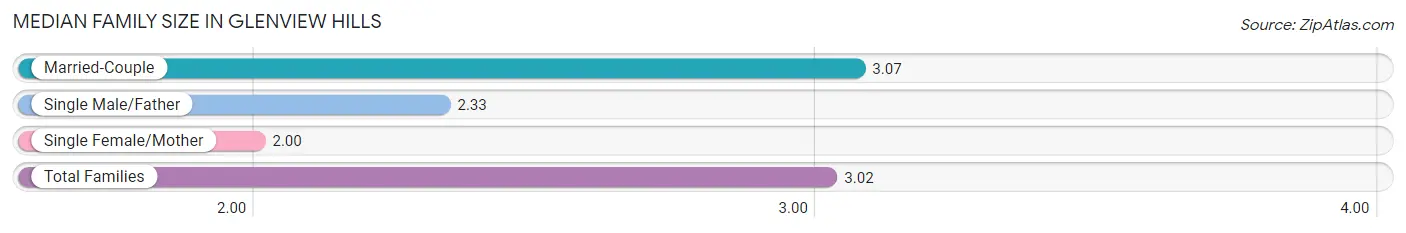
The median family size in Glenview Hills is 3.02 persons per family, with married-couple families (95 | 93.1%) accounting for the largest median family size of 3.07 persons per family. On the other hand, single female/mother families (1 | 1.0%) represent the smallest median family size with 2.00 persons per family.
| Family Type | # Families | Family Size |
| Married-Couple | 95 (93.1%) | 3.07 |
| Single Male/Father | 6 (5.9%) | 2.33 |
| Single Female/Mother | 1 (1.0%) | 2.00 |
| Total Families | 102 (100.0%) | 3.02 |
Median Household Size in Glenview Hills
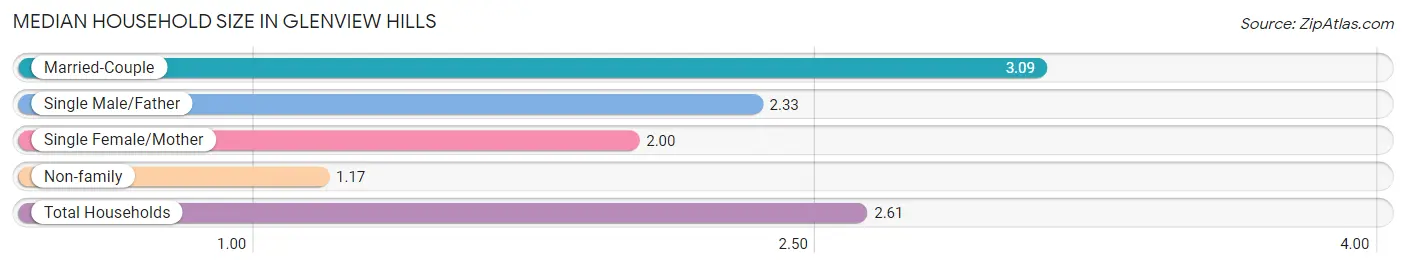
The median household size in Glenview Hills is 2.61 persons per household, with married-couple households (95 | 72.0%) accounting for the largest median household size of 3.09 persons per household. non-family households (30 | 22.7%) represent the smallest median household size with 1.17 persons per household.
| Household Type | # Households | Household Size |
| Married-Couple | 95 (72.0%) | 3.09 |
| Single Male/Father | 6 (4.5%) | 2.33 |
| Single Female/Mother | 1 (0.8%) | 2.00 |
| Non-family | 30 (22.7%) | 1.17 |
| Total Households | 132 (100.0%) | 2.61 |
Household Size by Marriage Status in Glenview Hills
Out of a total of 132 households in Glenview Hills, 102 (77.3%) are family households, while 30 (22.7%) are nonfamily households. The most numerous type of family households are 2-person households, comprising 44, and the most common type of nonfamily households are 1-person households, comprising 25.
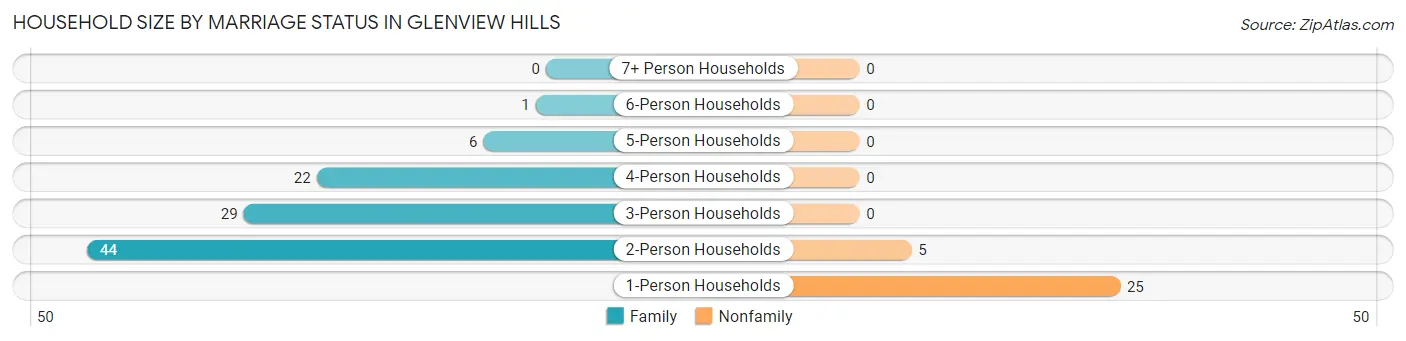
| Household Size | Family Households | Nonfamily Households |
| 1-Person Households | - | 25 (18.9%) |
| 2-Person Households | 44 (33.3%) | 5 (3.8%) |
| 3-Person Households | 29 (22.0%) | 0 (0.0%) |
| 4-Person Households | 22 (16.7%) | 0 (0.0%) |
| 5-Person Households | 6 (4.5%) | 0 (0.0%) |
| 6-Person Households | 1 (0.8%) | 0 (0.0%) |
| 7+ Person Households | 0 (0.0%) | 0 (0.0%) |
| Total | 102 (77.3%) | 30 (22.7%) |
Female Fertility in Glenview Hills
Fertility by Age in Glenview Hills
Average fertility rate in Glenview Hills is 25.0 births per 1,000 women. Women in the age bracket of 35 to 50 years have the highest fertility rate with 33.0 births per 1,000 women. Women in the age bracket of 35 to 50 years acount for 100.0% of all women with births.
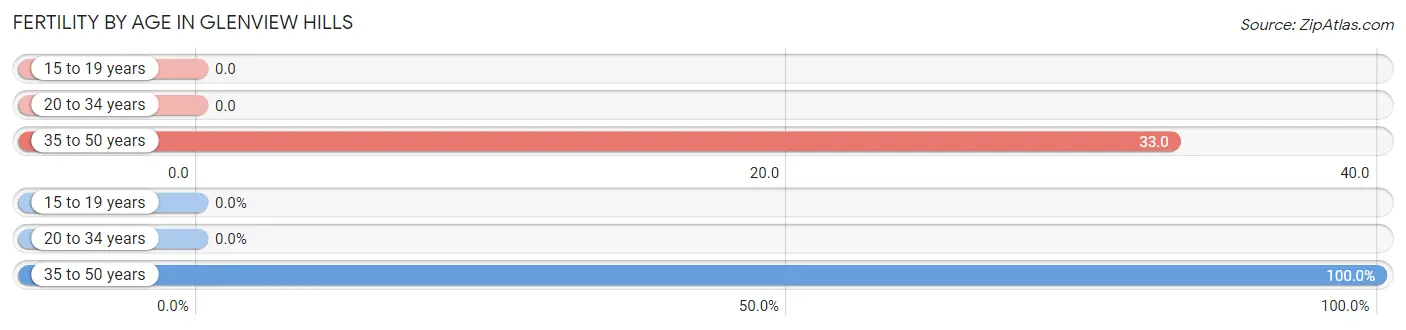
| Age Bracket | Women with Births | Births / 1,000 Women |
| 15 to 19 years | 0 (0.0%) | 0.0 |
| 20 to 34 years | 0 (0.0%) | 0.0 |
| 35 to 50 years | 2 (100.0%) | 33.0 |
| Total | 2 (100.0%) | 25.0 |
Fertility by Age by Marriage Status in Glenview Hills
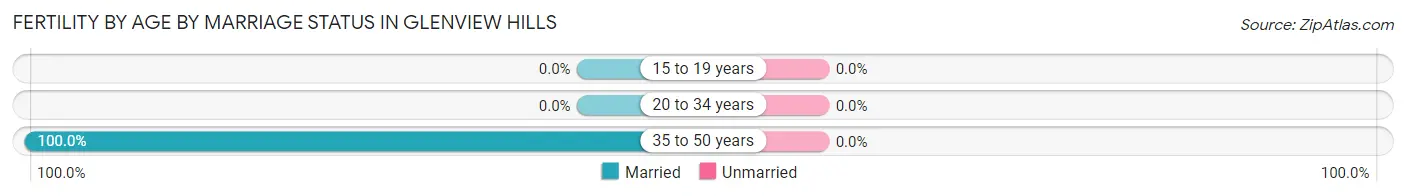
| Age Bracket | Married | Unmarried |
| 15 to 19 years | 0 (0.0%) | 0 (0.0%) |
| 20 to 34 years | 0 (0.0%) | 0 (0.0%) |
| 35 to 50 years | 2 (100.0%) | 0 (0.0%) |
| Total | 2 (100.0%) | 0 (0.0%) |
Fertility by Education in Glenview Hills
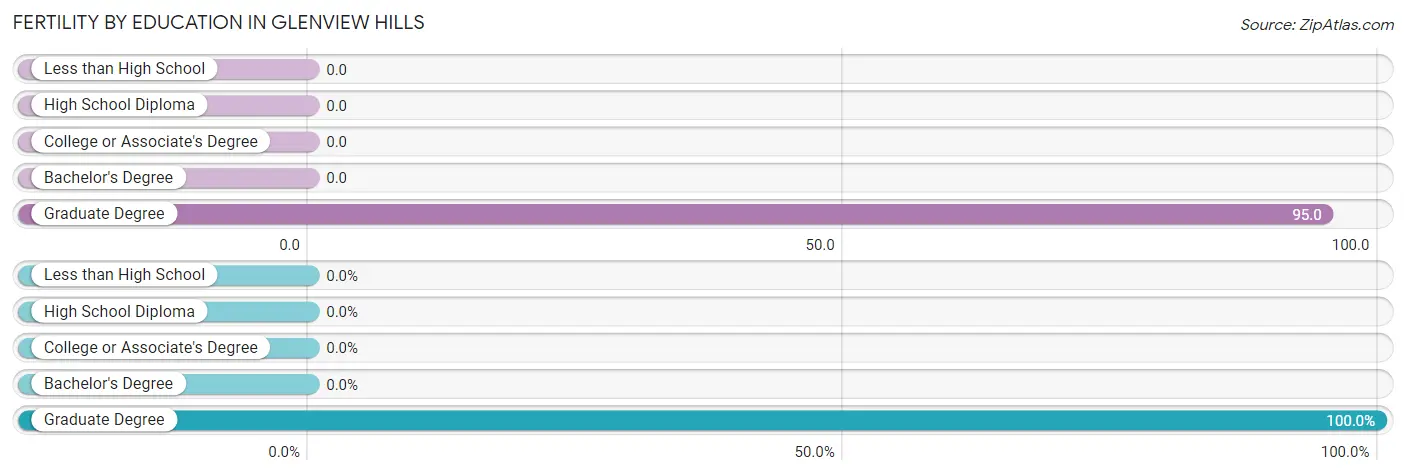
| Educational Attainment | Women with Births | Births / 1,000 Women |
| Less than High School | 0 (0.0%) | 0.0 |
| High School Diploma | 0 (0.0%) | 0.0 |
| College or Associate's Degree | 0 (0.0%) | 0.0 |
| Bachelor's Degree | 0 (0.0%) | 0.0 |
| Graduate Degree | 2 (100.0%) | 95.0 |
| Total | 2 (100.0%) | 25.0 |
Fertility by Education by Marriage Status in Glenview Hills
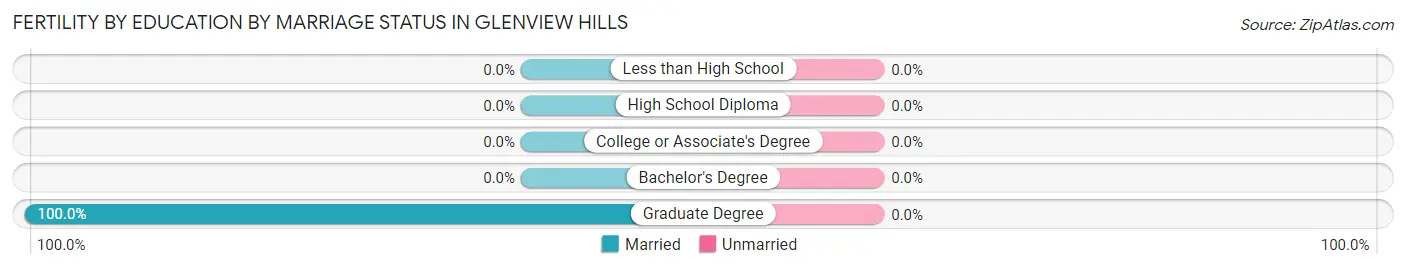
| Educational Attainment | Married | Unmarried |
| Less than High School | 0 (0.0%) | 0 (0.0%) |
| High School Diploma | 0 (0.0%) | 0 (0.0%) |
| College or Associate's Degree | 0 (0.0%) | 0 (0.0%) |
| Bachelor's Degree | 0 (0.0%) | 0 (0.0%) |
| Graduate Degree | 2 (100.0%) | 0 (0.0%) |
| Total | 2 (100.0%) | 0 (0.0%) |
Employment Characteristics in Glenview Hills
Employment by Class of Employer in Glenview Hills
Among the 182 employed individuals in Glenview Hills, private company employees (108 | 59.3%), not-for-profit organizations (34 | 18.7%), and self-employed (incorporated) (17 | 9.3%) make up the most common classes of employment.
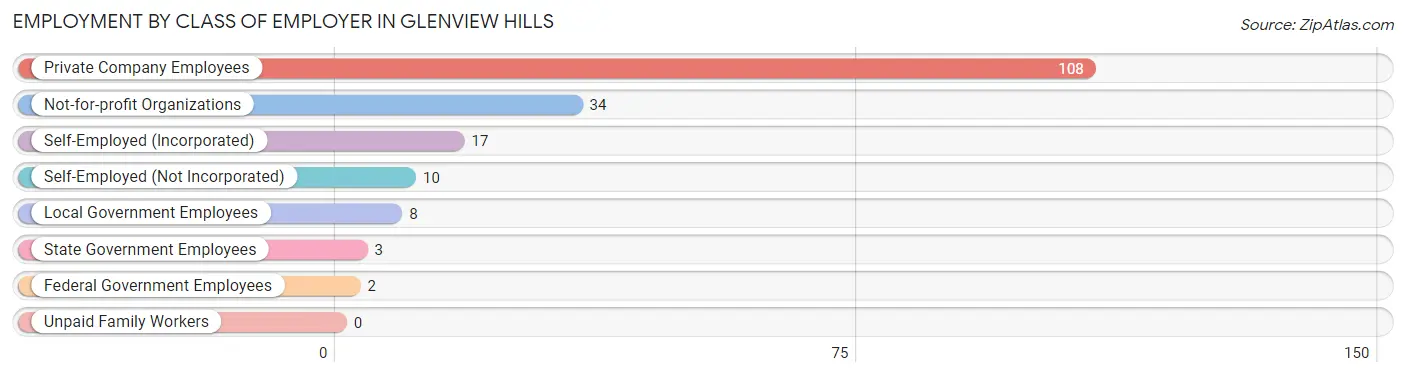
| Employer Class | # Employees | % Employees |
| Private Company Employees | 108 | 59.3% |
| Self-Employed (Incorporated) | 17 | 9.3% |
| Self-Employed (Not Incorporated) | 10 | 5.5% |
| Not-for-profit Organizations | 34 | 18.7% |
| Local Government Employees | 8 | 4.4% |
| State Government Employees | 3 | 1.7% |
| Federal Government Employees | 2 | 1.1% |
| Unpaid Family Workers | 0 | 0.0% |
| Total | 182 | 100.0% |
Employment Status by Age in Glenview Hills
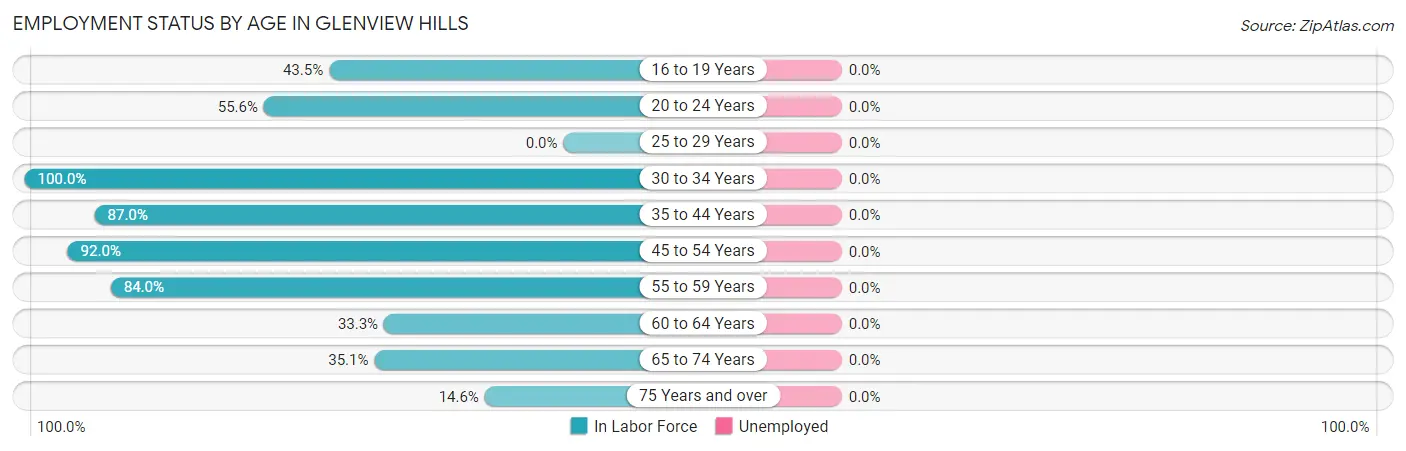
| Age Bracket | In Labor Force | Unemployed |
| 16 to 19 Years | 10 (43.5%) | 0 (0.0%) |
| 20 to 24 Years | 5 (55.6%) | 0 (0.0%) |
| 25 to 29 Years | 0 (0.0%) | 0 (0.0%) |
| 30 to 34 Years | 3 (100.0%) | 0 (0.0%) |
| 35 to 44 Years | 40 (87.0%) | 0 (0.0%) |
| 45 to 54 Years | 81 (92.0%) | 0 (0.0%) |
| 55 to 59 Years | 21 (84.0%) | 0 (0.0%) |
| 60 to 64 Years | 3 (33.3%) | 0 (0.0%) |
| 65 to 74 Years | 13 (35.1%) | 0 (0.0%) |
| 75 Years and over | 6 (14.6%) | 0 (0.0%) |
| Total | 182 (64.8%) | 0 (0.0%) |
Employment Status by Educational Attainment in Glenview Hills
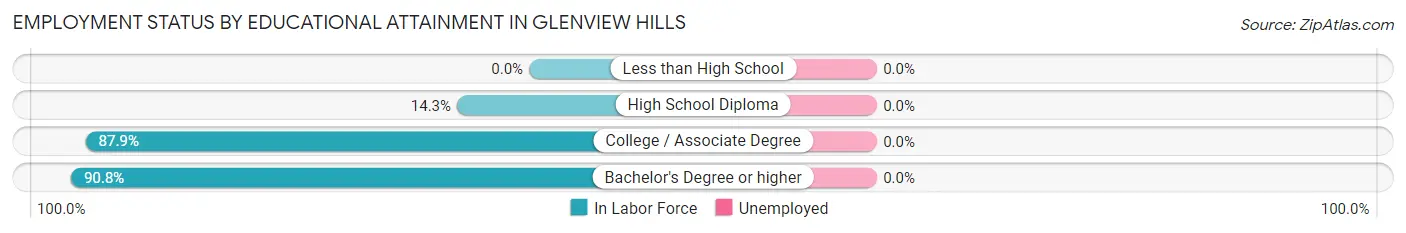
| Educational Attainment | In Labor Force | Unemployed |
| Less than High School | 0 (0.0%) | 0 (0.0%) |
| High School Diploma | 1 (14.3%) | 0 (0.0%) |
| College / Associate Degree | 29 (87.9%) | 0 (0.0%) |
| Bachelor's Degree or higher | 118 (90.8%) | 0 (0.0%) |
| Total | 148 (86.5%) | 0 (0.0%) |
Employment Occupations by Sex in Glenview Hills
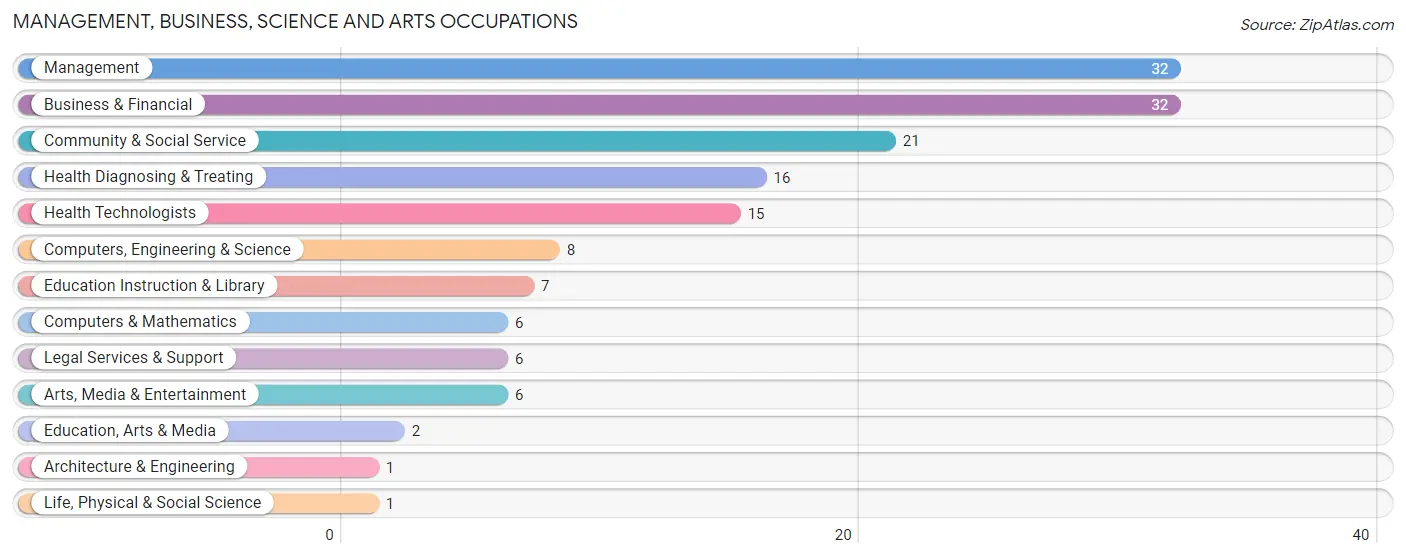
Management, Business, Science and Arts Occupations
The most common Management, Business, Science and Arts occupations in Glenview Hills are Management (32 | 17.6%), Business & Financial (32 | 17.6%), Community & Social Service (21 | 11.5%), Health Diagnosing & Treating (16 | 8.8%), and Health Technologists (15 | 8.2%).
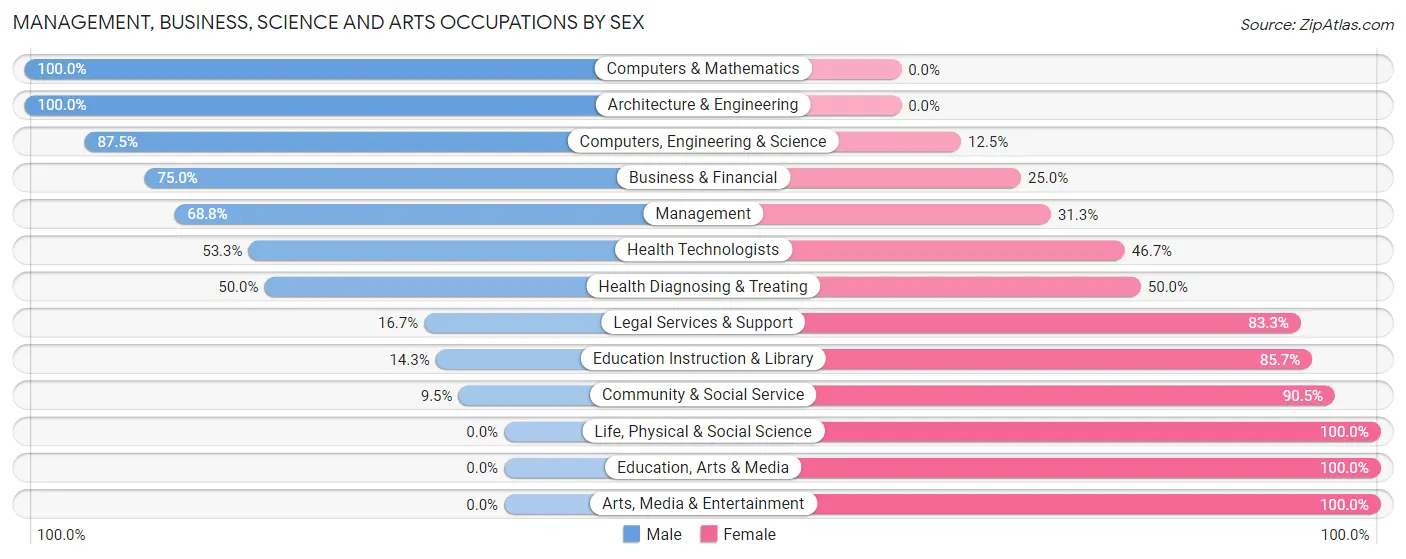
Management, Business, Science and Arts Occupations by Sex
Within the Management, Business, Science and Arts occupations in Glenview Hills, the most male-oriented occupations are Computers & Mathematics (100.0%), Architecture & Engineering (100.0%), and Computers, Engineering & Science (87.5%), while the most female-oriented occupations are Life, Physical & Social Science (100.0%), Education, Arts & Media (100.0%), and Arts, Media & Entertainment (100.0%).
| Occupation | Male | Female |
| Management | 22 (68.8%) | 10 (31.2%) |
| Business & Financial | 24 (75.0%) | 8 (25.0%) |
| Computers, Engineering & Science | 7 (87.5%) | 1 (12.5%) |
| Computers & Mathematics | 6 (100.0%) | 0 (0.0%) |
| Architecture & Engineering | 1 (100.0%) | 0 (0.0%) |
| Life, Physical & Social Science | 0 (0.0%) | 1 (100.0%) |
| Community & Social Service | 2 (9.5%) | 19 (90.5%) |
| Education, Arts & Media | 0 (0.0%) | 2 (100.0%) |
| Legal Services & Support | 1 (16.7%) | 5 (83.3%) |
| Education Instruction & Library | 1 (14.3%) | 6 (85.7%) |
| Arts, Media & Entertainment | 0 (0.0%) | 6 (100.0%) |
| Health Diagnosing & Treating | 8 (50.0%) | 8 (50.0%) |
| Health Technologists | 8 (53.3%) | 7 (46.7%) |
| Total (Category) | 63 (57.8%) | 46 (42.2%) |
| Total (Overall) | 103 (56.6%) | 79 (43.4%) |
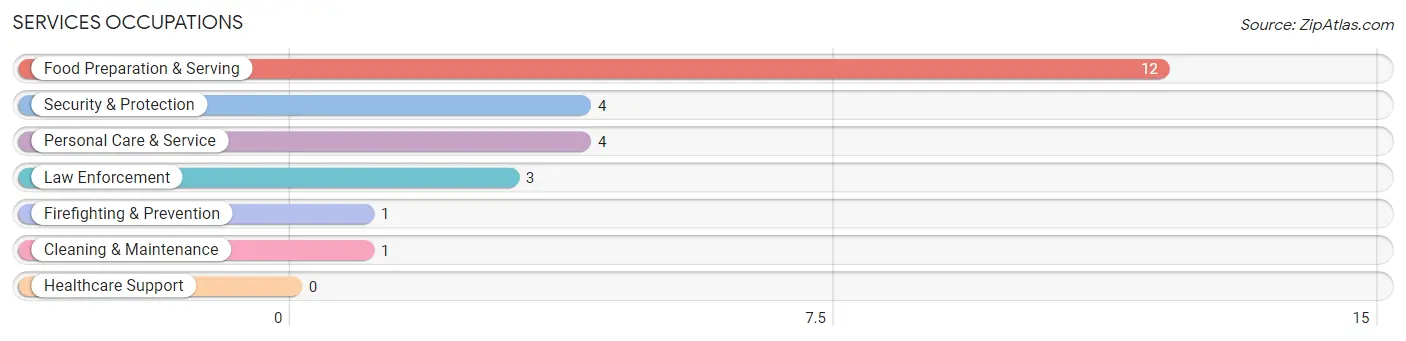
Services Occupations
The most common Services occupations in Glenview Hills are Food Preparation & Serving (12 | 6.6%), Security & Protection (4 | 2.2%), Personal Care & Service (4 | 2.2%), Law Enforcement (3 | 1.7%), and Firefighting & Prevention (1 | 0.5%).
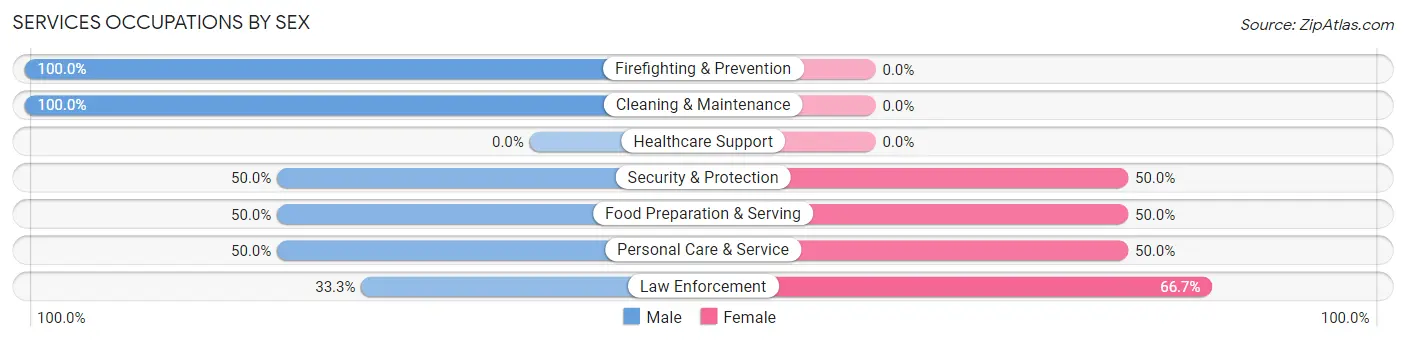
Services Occupations by Sex
Within the Services occupations in Glenview Hills, the most male-oriented occupations are Firefighting & Prevention (100.0%), Cleaning & Maintenance (100.0%), and Security & Protection (50.0%), while the most female-oriented occupations are Law Enforcement (66.7%), Security & Protection (50.0%), and Food Preparation & Serving (50.0%).
| Occupation | Male | Female |
| Healthcare Support | 0 (0.0%) | 0 (0.0%) |
| Security & Protection | 2 (50.0%) | 2 (50.0%) |
| Firefighting & Prevention | 1 (100.0%) | 0 (0.0%) |
| Law Enforcement | 1 (33.3%) | 2 (66.7%) |
| Food Preparation & Serving | 6 (50.0%) | 6 (50.0%) |
| Cleaning & Maintenance | 1 (100.0%) | 0 (0.0%) |
| Personal Care & Service | 2 (50.0%) | 2 (50.0%) |
| Total (Category) | 11 (52.4%) | 10 (47.6%) |
| Total (Overall) | 103 (56.6%) | 79 (43.4%) |
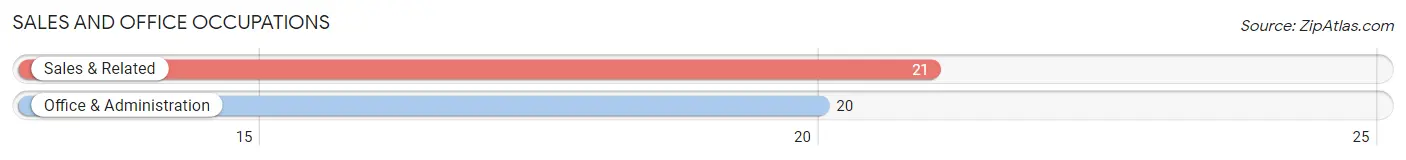
Sales and Office Occupations
The most common Sales and Office occupations in Glenview Hills are Sales & Related (21 | 11.5%), and Office & Administration (20 | 11.0%).
Sales and Office Occupations by Sex
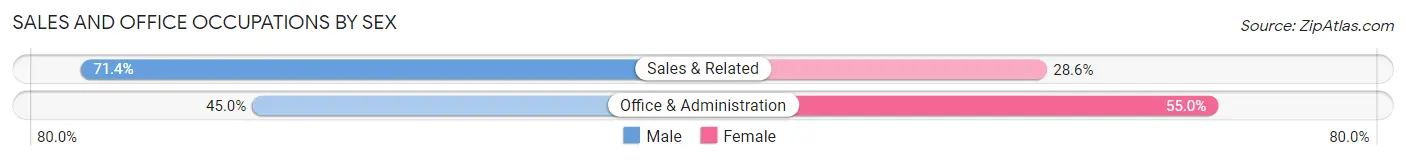
| Occupation | Male | Female |
| Sales & Related | 15 (71.4%) | 6 (28.6%) |
| Office & Administration | 9 (45.0%) | 11 (55.0%) |
| Total (Category) | 24 (58.5%) | 17 (41.5%) |
| Total (Overall) | 103 (56.6%) | 79 (43.4%) |
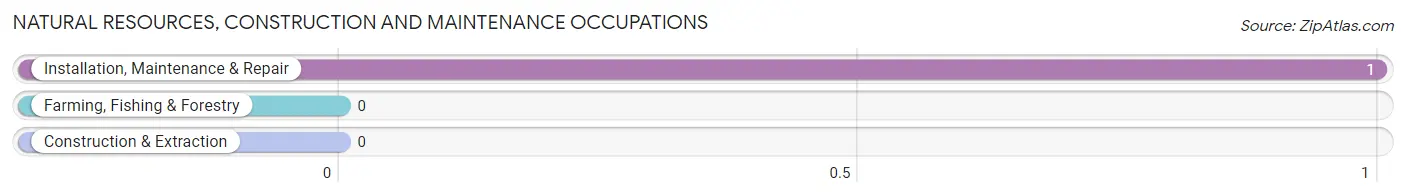
Natural Resources, Construction and Maintenance Occupations
The most common Natural Resources, Construction and Maintenance occupations in Glenview Hills are , and Installation, Maintenance & Repair (1 | 0.5%).
Natural Resources, Construction and Maintenance Occupations by Sex
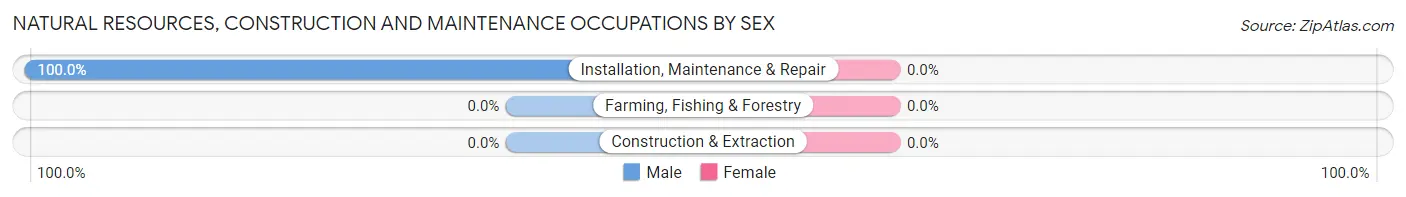
| Occupation | Male | Female |
| Farming, Fishing & Forestry | 0 (0.0%) | 0 (0.0%) |
| Construction & Extraction | 0 (0.0%) | 0 (0.0%) |
| Installation, Maintenance & Repair | 1 (100.0%) | 0 (0.0%) |
| Total (Category) | 1 (100.0%) | 0 (0.0%) |
| Total (Overall) | 103 (56.6%) | 79 (43.4%) |
Production, Transportation and Moving Occupations
The most common Production, Transportation and Moving occupations in Glenview Hills are Material Moving (6 | 3.3%), and Production (4 | 2.2%).
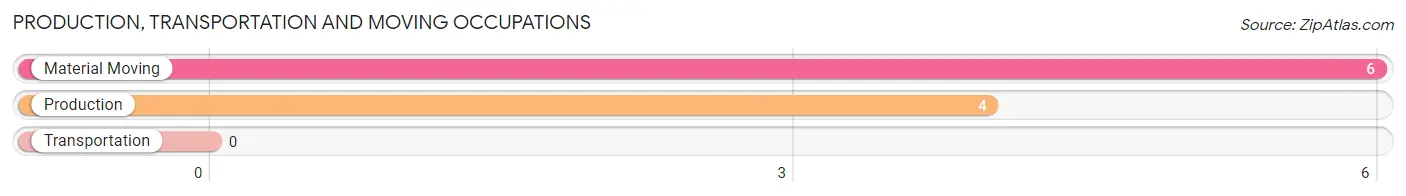
Production, Transportation and Moving Occupations by Sex
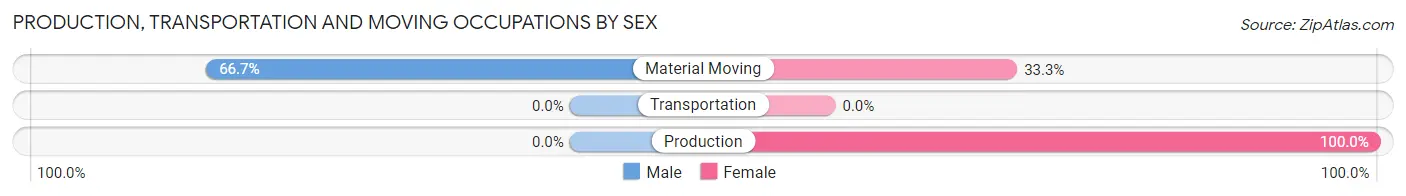
| Occupation | Male | Female |
| Production | 0 (0.0%) | 4 (100.0%) |
| Transportation | 0 (0.0%) | 0 (0.0%) |
| Material Moving | 4 (66.7%) | 2 (33.3%) |
| Total (Category) | 4 (40.0%) | 6 (60.0%) |
| Total (Overall) | 103 (56.6%) | 79 (43.4%) |
Employment Industries by Sex in Glenview Hills
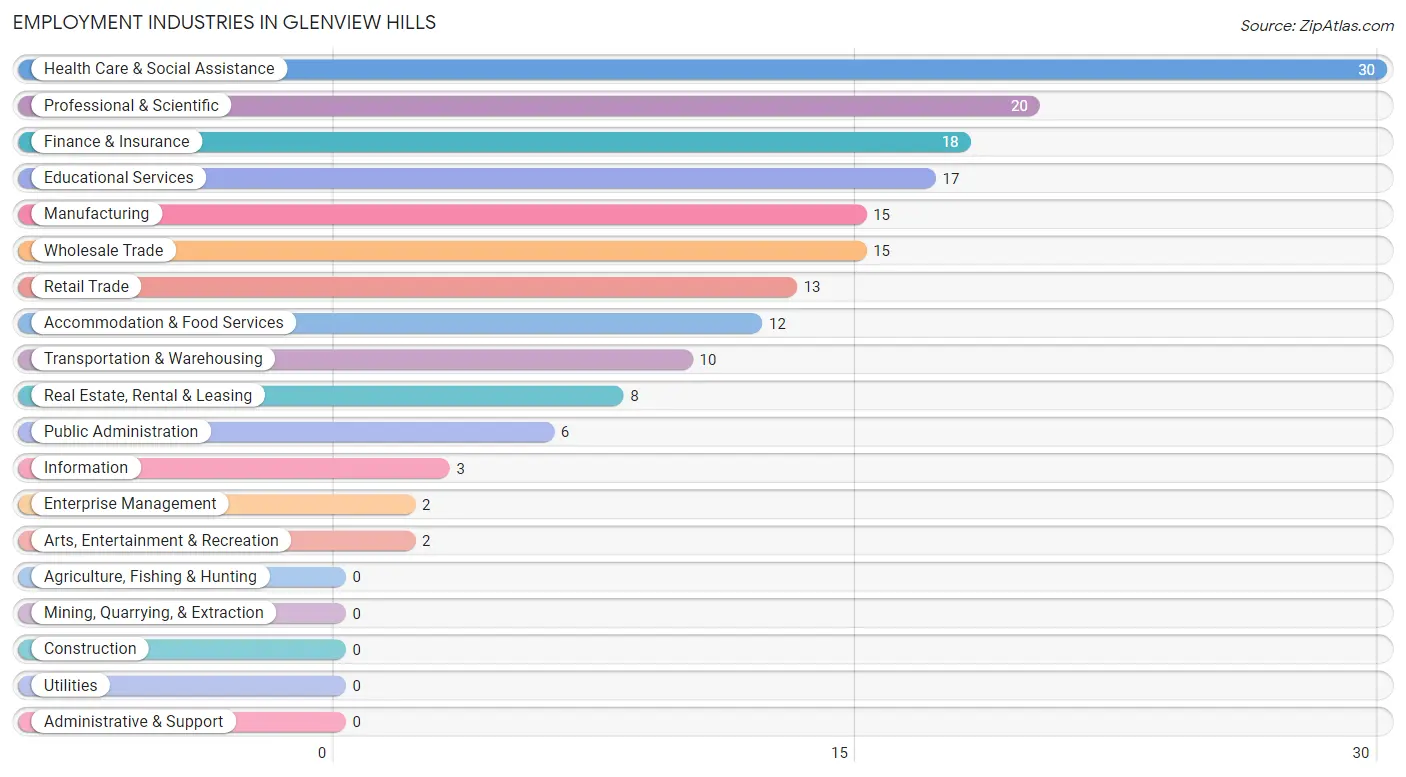
Employment Industries in Glenview Hills
The major employment industries in Glenview Hills include Health Care & Social Assistance (30 | 16.5%), Professional & Scientific (20 | 11.0%), Finance & Insurance (18 | 9.9%), Educational Services (17 | 9.3%), and Manufacturing (15 | 8.2%).
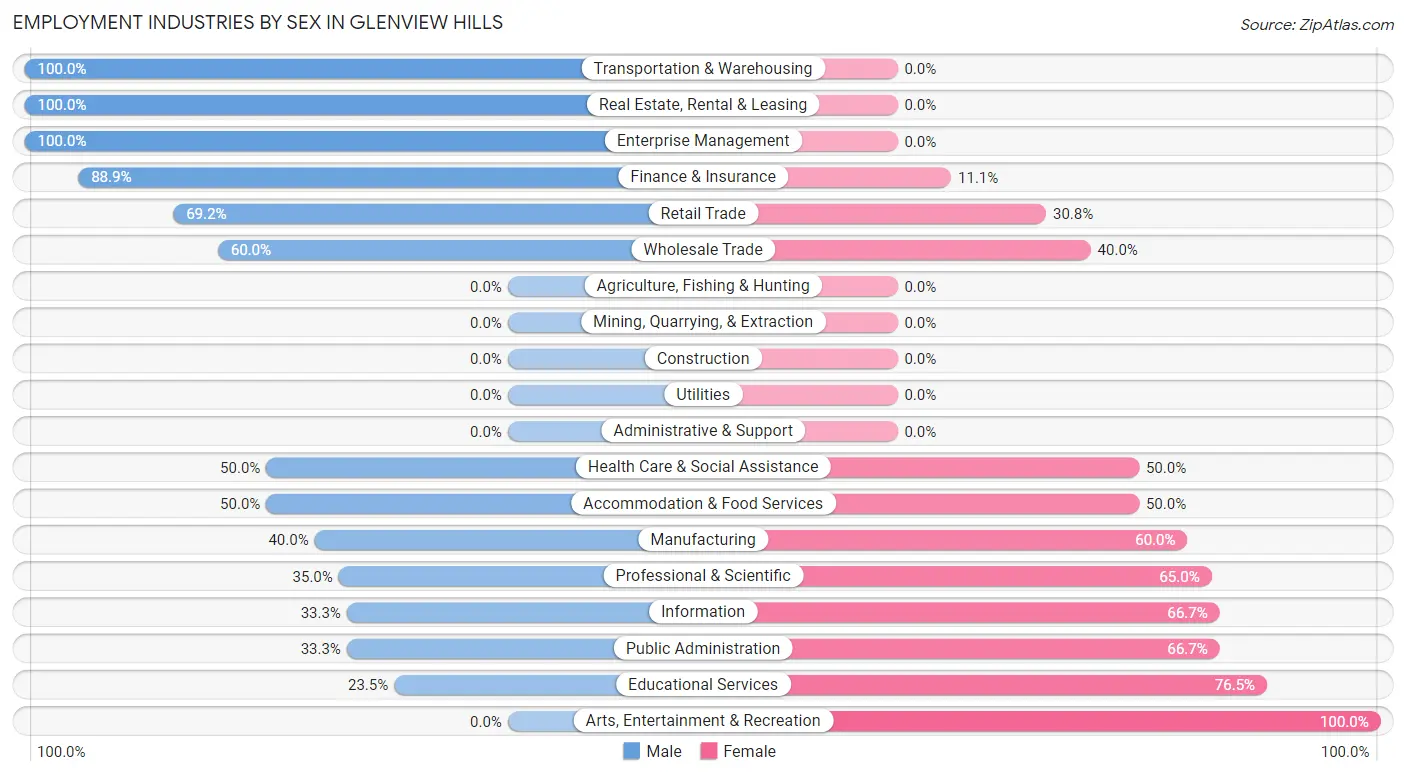
Employment Industries by Sex in Glenview Hills
The Glenview Hills industries that see more men than women are Transportation & Warehousing (100.0%), Real Estate, Rental & Leasing (100.0%), and Enterprise Management (100.0%), whereas the industries that tend to have a higher number of women are Arts, Entertainment & Recreation (100.0%), Educational Services (76.5%), and Information (66.7%).
| Industry | Male | Female |
| Agriculture, Fishing & Hunting | 0 (0.0%) | 0 (0.0%) |
| Mining, Quarrying, & Extraction | 0 (0.0%) | 0 (0.0%) |
| Construction | 0 (0.0%) | 0 (0.0%) |
| Manufacturing | 6 (40.0%) | 9 (60.0%) |
| Wholesale Trade | 9 (60.0%) | 6 (40.0%) |
| Retail Trade | 9 (69.2%) | 4 (30.8%) |
| Transportation & Warehousing | 10 (100.0%) | 0 (0.0%) |
| Utilities | 0 (0.0%) | 0 (0.0%) |
| Information | 1 (33.3%) | 2 (66.7%) |
| Finance & Insurance | 16 (88.9%) | 2 (11.1%) |
| Real Estate, Rental & Leasing | 8 (100.0%) | 0 (0.0%) |
| Professional & Scientific | 7 (35.0%) | 13 (65.0%) |
| Enterprise Management | 2 (100.0%) | 0 (0.0%) |
| Administrative & Support | 0 (0.0%) | 0 (0.0%) |
| Educational Services | 4 (23.5%) | 13 (76.5%) |
| Health Care & Social Assistance | 15 (50.0%) | 15 (50.0%) |
| Arts, Entertainment & Recreation | 0 (0.0%) | 2 (100.0%) |
| Accommodation & Food Services | 6 (50.0%) | 6 (50.0%) |
| Public Administration | 2 (33.3%) | 4 (66.7%) |
| Total | 103 (56.6%) | 79 (43.4%) |
Education in Glenview Hills
School Enrollment in Glenview Hills
The most common levels of schooling among the 83 students in Glenview Hills are high school (31 | 37.3%), middle school (20 | 24.1%), and elementary school (13 | 15.7%).
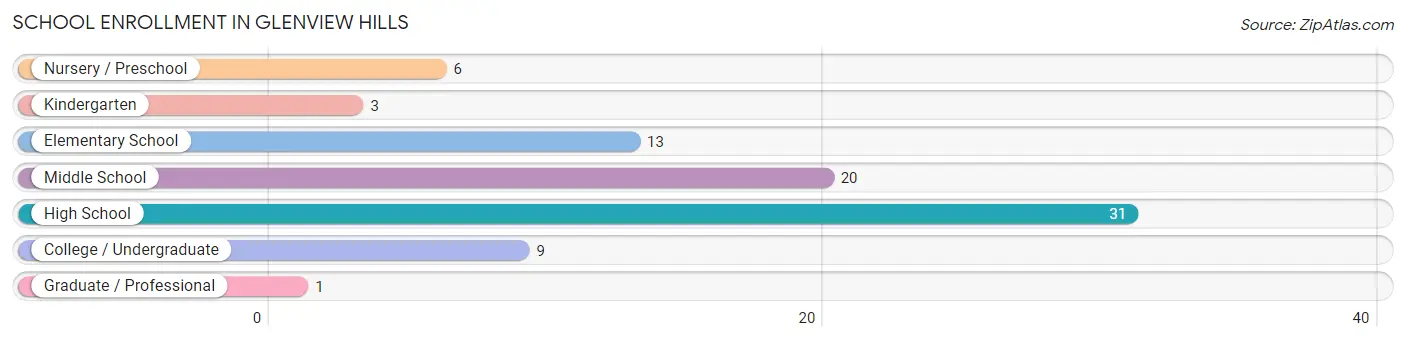
| School Level | # Students | % Students |
| Nursery / Preschool | 6 | 7.2% |
| Kindergarten | 3 | 3.6% |
| Elementary School | 13 | 15.7% |
| Middle School | 20 | 24.1% |
| High School | 31 | 37.3% |
| College / Undergraduate | 9 | 10.8% |
| Graduate / Professional | 1 | 1.2% |
| Total | 83 | 100.0% |
School Enrollment by Age by Funding Source in Glenview Hills
Out of a total of 83 students who are enrolled in schools in Glenview Hills, 46 (55.4%) attend a private institution, while the remaining 37 (44.6%) are enrolled in public schools. The age group of 3 to 4 year olds has the highest likelihood of being enrolled in private schools, with 5 (100.0% in the age bracket) enrolled. Conversely, the age group of 20 to 24 year olds has the lowest likelihood of being enrolled in a private school, with 7 (100.0% in the age bracket) attending a public institution.
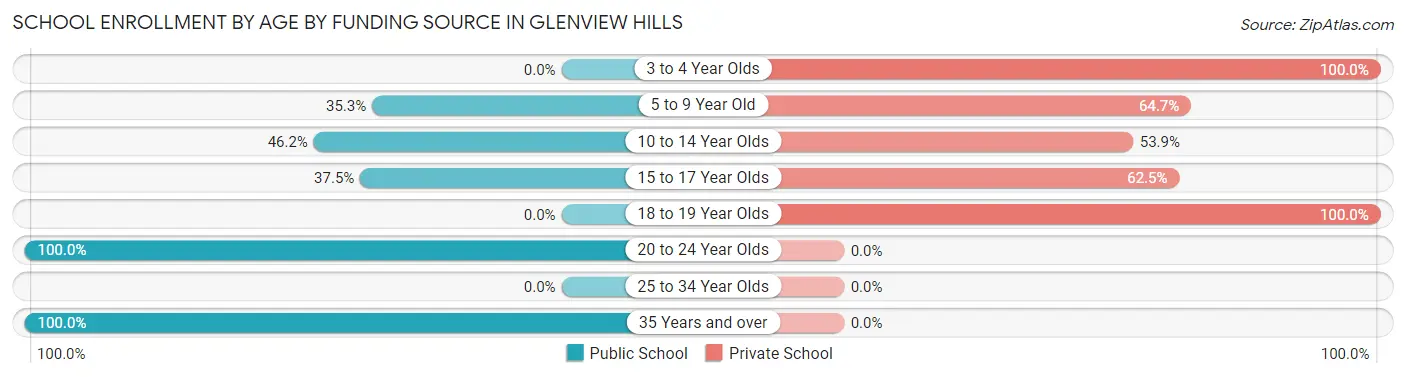
| Age Bracket | Public School | Private School |
| 3 to 4 Year Olds | 0 (0.0%) | 5 (100.0%) |
| 5 to 9 Year Old | 6 (35.3%) | 11 (64.7%) |
| 10 to 14 Year Olds | 12 (46.2%) | 14 (53.8%) |
| 15 to 17 Year Olds | 9 (37.5%) | 15 (62.5%) |
| 18 to 19 Year Olds | 0 (0.0%) | 1 (100.0%) |
| 20 to 24 Year Olds | 7 (100.0%) | 0 (0.0%) |
| 25 to 34 Year Olds | 0 (0.0%) | 0 (0.0%) |
| 35 Years and over | 3 (100.0%) | 0 (0.0%) |
| Total | 37 (44.6%) | 46 (55.4%) |
Educational Attainment by Field of Study in Glenview Hills
Business (58 | 27.5%), education (29 | 13.7%), social sciences (22 | 10.4%), psychology (18 | 8.5%), and visual & performing arts (16 | 7.6%) are the most common fields of study among 211 individuals in Glenview Hills who have obtained a bachelor's degree or higher.
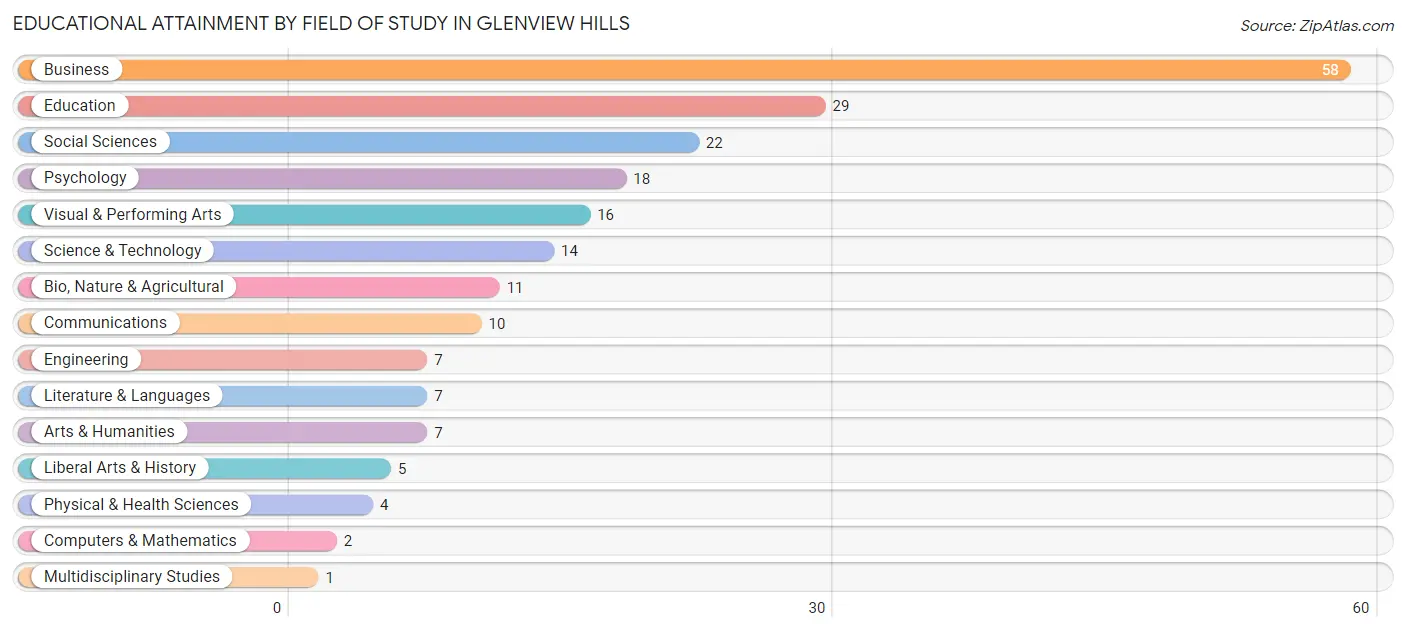
| Field of Study | # Graduates | % Graduates |
| Computers & Mathematics | 2 | 0.9% |
| Bio, Nature & Agricultural | 11 | 5.2% |
| Physical & Health Sciences | 4 | 1.9% |
| Psychology | 18 | 8.5% |
| Social Sciences | 22 | 10.4% |
| Engineering | 7 | 3.3% |
| Multidisciplinary Studies | 1 | 0.5% |
| Science & Technology | 14 | 6.6% |
| Business | 58 | 27.5% |
| Education | 29 | 13.7% |
| Literature & Languages | 7 | 3.3% |
| Liberal Arts & History | 5 | 2.4% |
| Visual & Performing Arts | 16 | 7.6% |
| Communications | 10 | 4.7% |
| Arts & Humanities | 7 | 3.3% |
| Total | 211 | 100.0% |
Transportation & Commute in Glenview Hills
Vehicle Availability by Sex in Glenview Hills
The most prevalent vehicle ownership categories in Glenview Hills are males with 2 vehicles (46, accounting for 44.7%) and females with 2 vehicles (28, making up 58.2%).
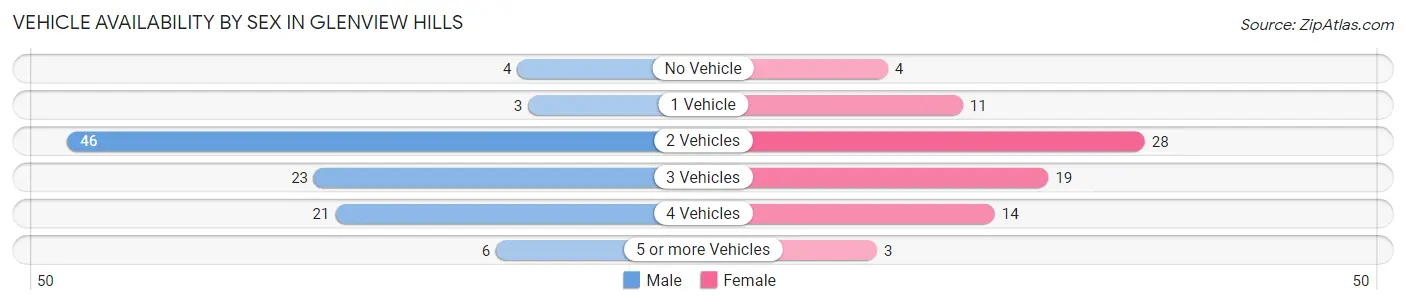
| Vehicles Available | Male | Female |
| No Vehicle | 4 (3.9%) | 4 (5.1%) |
| 1 Vehicle | 3 (2.9%) | 11 (13.9%) |
| 2 Vehicles | 46 (44.7%) | 28 (35.4%) |
| 3 Vehicles | 23 (22.3%) | 19 (24.0%) |
| 4 Vehicles | 21 (20.4%) | 14 (17.7%) |
| 5 or more Vehicles | 6 (5.8%) | 3 (3.8%) |
| Total | 103 (100.0%) | 79 (100.0%) |
Commute Time in Glenview Hills
The most frequently occuring commute durations in Glenview Hills are 15 to 19 minutes (53 commuters, 33.8%), 30 to 34 minutes (27 commuters, 17.2%), and 20 to 24 minutes (23 commuters, 14.6%).
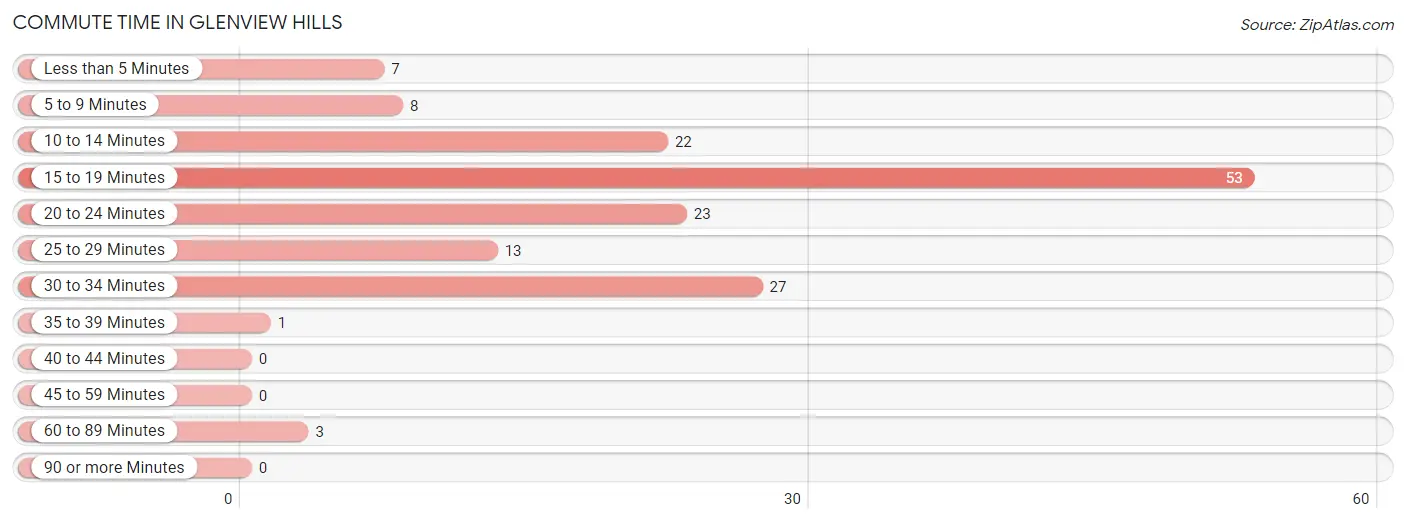
| Commute Time | # Commuters | % Commuters |
| Less than 5 Minutes | 7 | 4.5% |
| 5 to 9 Minutes | 8 | 5.1% |
| 10 to 14 Minutes | 22 | 14.0% |
| 15 to 19 Minutes | 53 | 33.8% |
| 20 to 24 Minutes | 23 | 14.6% |
| 25 to 29 Minutes | 13 | 8.3% |
| 30 to 34 Minutes | 27 | 17.2% |
| 35 to 39 Minutes | 1 | 0.6% |
| 40 to 44 Minutes | 0 | 0.0% |
| 45 to 59 Minutes | 0 | 0.0% |
| 60 to 89 Minutes | 3 | 1.9% |
| 90 or more Minutes | 0 | 0.0% |
Commute Time by Sex in Glenview Hills
The most common commute times in Glenview Hills are 15 to 19 minutes (24 commuters, 29.3%) for males and 15 to 19 minutes (29 commuters, 38.7%) for females.
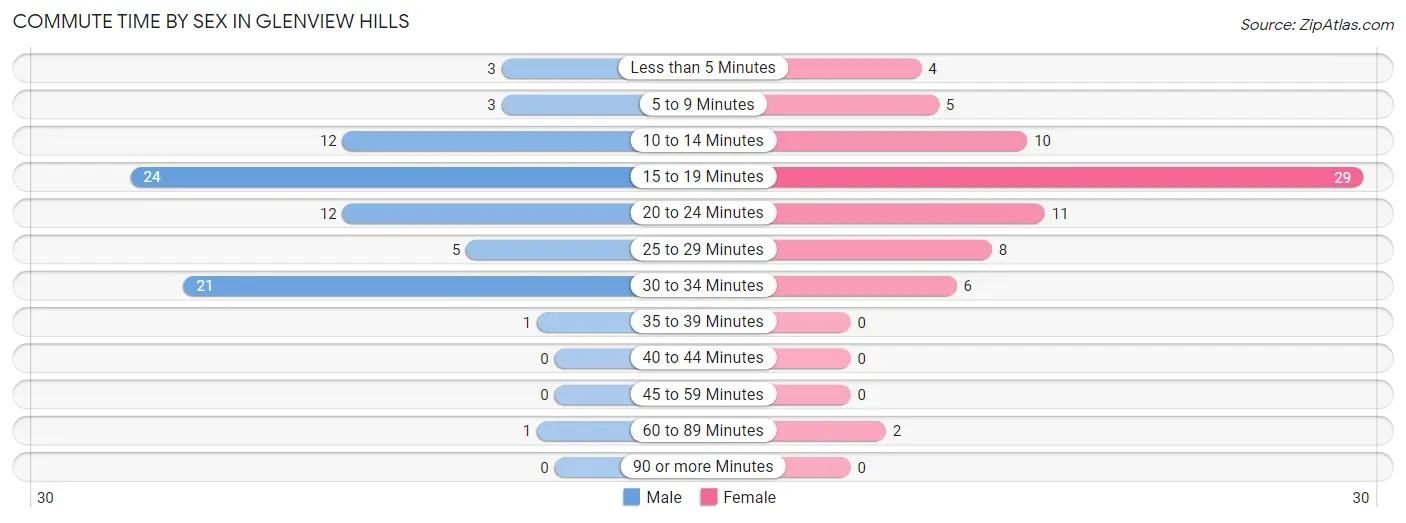
| Commute Time | Male | Female |
| Less than 5 Minutes | 3 (3.7%) | 4 (5.3%) |
| 5 to 9 Minutes | 3 (3.7%) | 5 (6.7%) |
| 10 to 14 Minutes | 12 (14.6%) | 10 (13.3%) |
| 15 to 19 Minutes | 24 (29.3%) | 29 (38.7%) |
| 20 to 24 Minutes | 12 (14.6%) | 11 (14.7%) |
| 25 to 29 Minutes | 5 (6.1%) | 8 (10.7%) |
| 30 to 34 Minutes | 21 (25.6%) | 6 (8.0%) |
| 35 to 39 Minutes | 1 (1.2%) | 0 (0.0%) |
| 40 to 44 Minutes | 0 (0.0%) | 0 (0.0%) |
| 45 to 59 Minutes | 0 (0.0%) | 0 (0.0%) |
| 60 to 89 Minutes | 1 (1.2%) | 2 (2.7%) |
| 90 or more Minutes | 0 (0.0%) | 0 (0.0%) |
Time of Departure to Work by Sex in Glenview Hills
The most frequent times of departure to work in Glenview Hills are 7:30 AM to 7:59 AM (18, 22.0%) for males and 8:00 AM to 8:29 AM (18, 24.0%) for females.
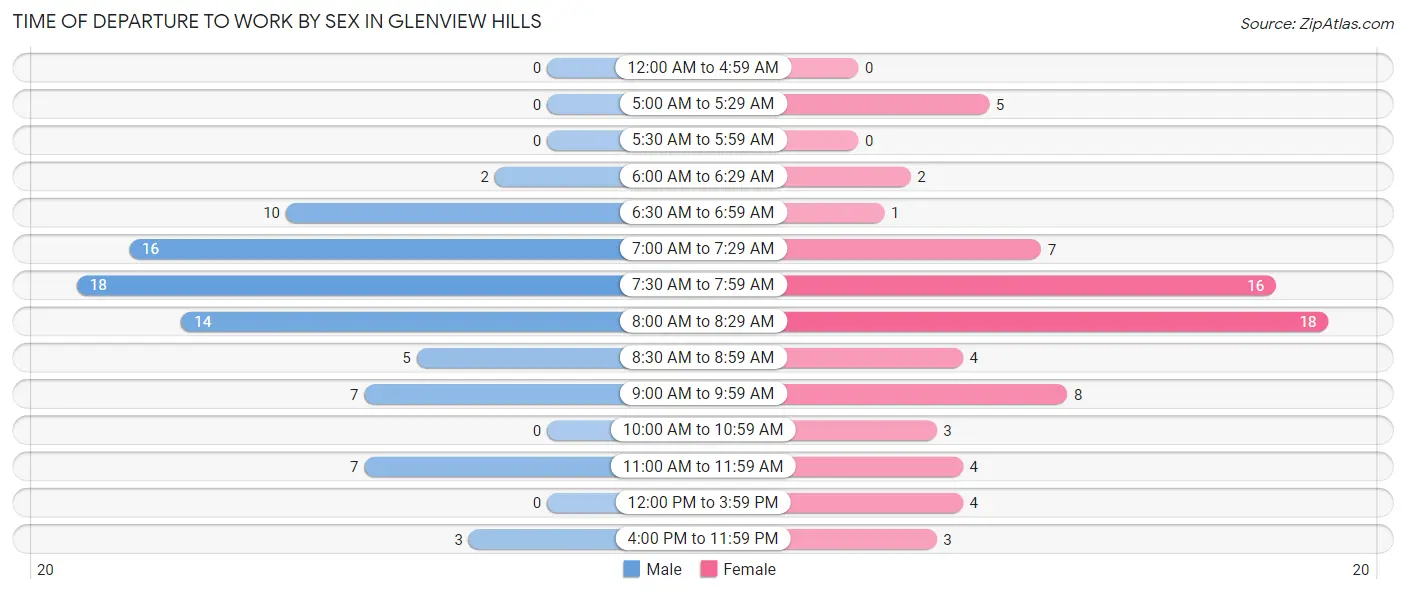
| Time of Departure | Male | Female |
| 12:00 AM to 4:59 AM | 0 (0.0%) | 0 (0.0%) |
| 5:00 AM to 5:29 AM | 0 (0.0%) | 5 (6.7%) |
| 5:30 AM to 5:59 AM | 0 (0.0%) | 0 (0.0%) |
| 6:00 AM to 6:29 AM | 2 (2.4%) | 2 (2.7%) |
| 6:30 AM to 6:59 AM | 10 (12.2%) | 1 (1.3%) |
| 7:00 AM to 7:29 AM | 16 (19.5%) | 7 (9.3%) |
| 7:30 AM to 7:59 AM | 18 (22.0%) | 16 (21.3%) |
| 8:00 AM to 8:29 AM | 14 (17.1%) | 18 (24.0%) |
| 8:30 AM to 8:59 AM | 5 (6.1%) | 4 (5.3%) |
| 9:00 AM to 9:59 AM | 7 (8.5%) | 8 (10.7%) |
| 10:00 AM to 10:59 AM | 0 (0.0%) | 3 (4.0%) |
| 11:00 AM to 11:59 AM | 7 (8.5%) | 4 (5.3%) |
| 12:00 PM to 3:59 PM | 0 (0.0%) | 4 (5.3%) |
| 4:00 PM to 11:59 PM | 3 (3.7%) | 3 (4.0%) |
| Total | 82 (100.0%) | 75 (100.0%) |
Housing Occupancy in Glenview Hills
Occupancy by Ownership in Glenview Hills
Of the total 132 dwellings in Glenview Hills, owner-occupied units account for 124 (93.9%), while renter-occupied units make up 8 (6.1%).
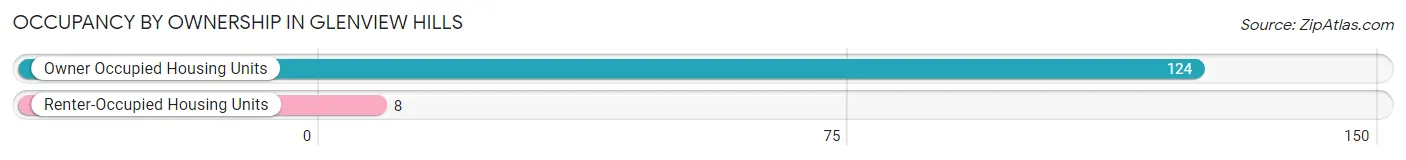
| Occupancy | # Housing Units | % Housing Units |
| Owner Occupied Housing Units | 124 | 93.9% |
| Renter-Occupied Housing Units | 8 | 6.1% |
| Total Occupied Housing Units | 132 | 100.0% |
Occupancy by Household Size in Glenview Hills
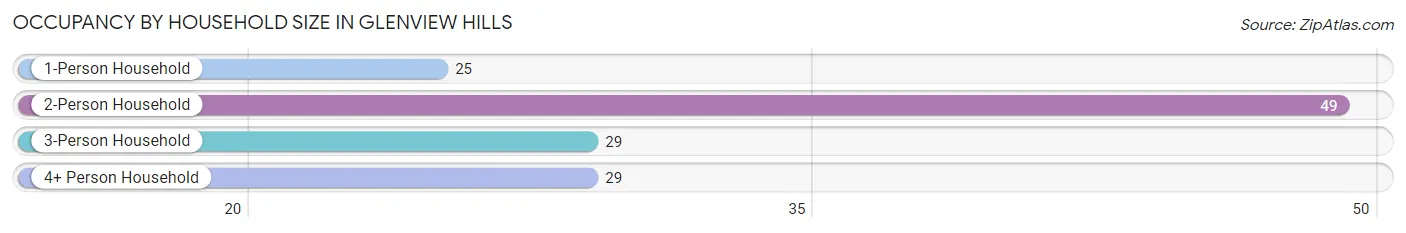
| Household Size | # Housing Units | % Housing Units |
| 1-Person Household | 25 | 18.9% |
| 2-Person Household | 49 | 37.1% |
| 3-Person Household | 29 | 22.0% |
| 4+ Person Household | 29 | 22.0% |
| Total Housing Units | 132 | 100.0% |
Occupancy by Ownership by Household Size in Glenview Hills
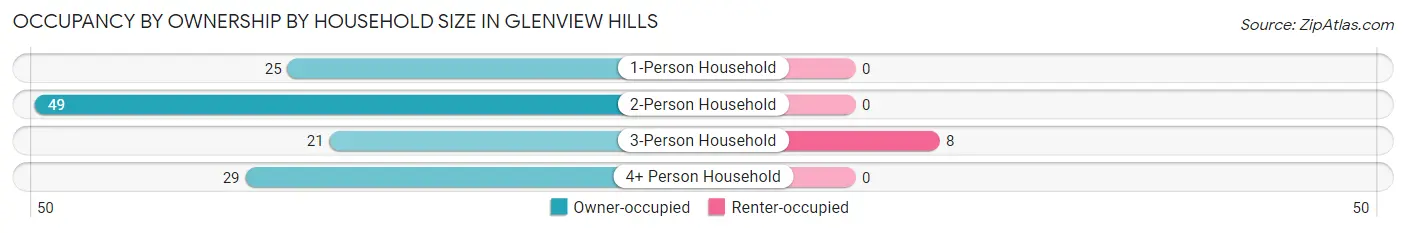
| Household Size | Owner-occupied | Renter-occupied |
| 1-Person Household | 25 (100.0%) | 0 (0.0%) |
| 2-Person Household | 49 (100.0%) | 0 (0.0%) |
| 3-Person Household | 21 (72.4%) | 8 (27.6%) |
| 4+ Person Household | 29 (100.0%) | 0 (0.0%) |
| Total Housing Units | 124 (93.9%) | 8 (6.1%) |
Occupancy by Educational Attainment in Glenview Hills
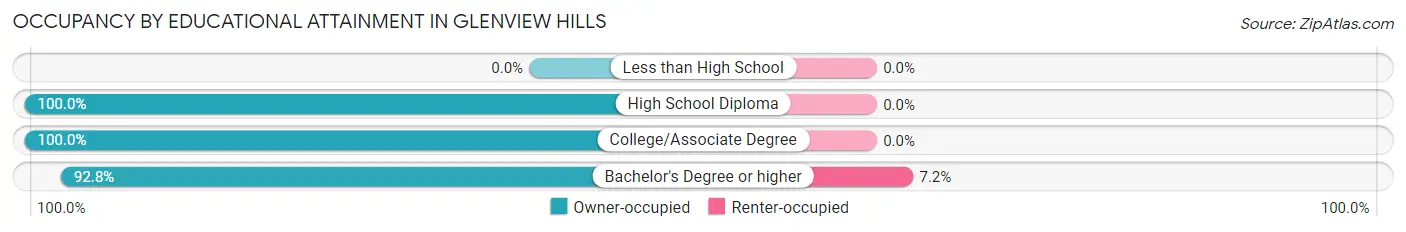
| Household Size | Owner-occupied | Renter-occupied |
| Less than High School | 0 (0.0%) | 0 (0.0%) |
| High School Diploma | 2 (100.0%) | 0 (0.0%) |
| College/Associate Degree | 19 (100.0%) | 0 (0.0%) |
| Bachelor's Degree or higher | 103 (92.8%) | 8 (7.2%) |
Occupancy by Age of Householder in Glenview Hills
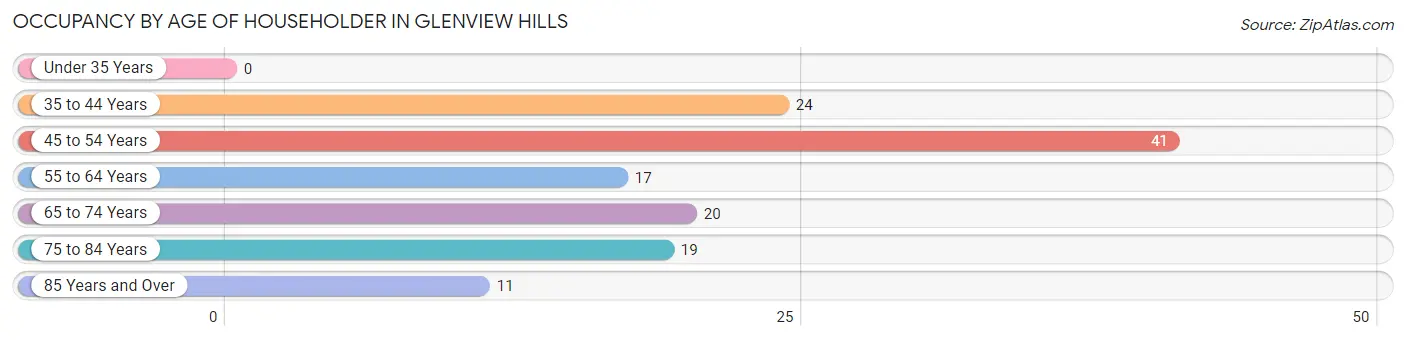
| Age Bracket | # Households | % Households |
| Under 35 Years | 0 | 0.0% |
| 35 to 44 Years | 24 | 18.2% |
| 45 to 54 Years | 41 | 31.1% |
| 55 to 64 Years | 17 | 12.9% |
| 65 to 74 Years | 20 | 15.1% |
| 75 to 84 Years | 19 | 14.4% |
| 85 Years and Over | 11 | 8.3% |
| Total | 132 | 100.0% |
Housing Finances in Glenview Hills
Median Income by Occupancy in Glenview Hills
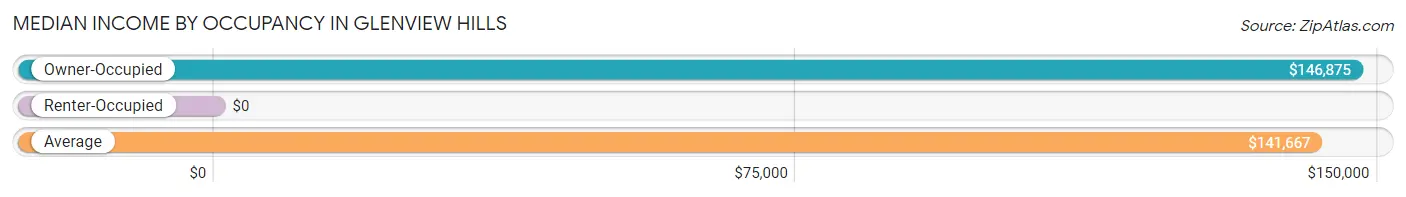
| Occupancy Type | # Households | Median Income |
| Owner-Occupied | 124 (93.9%) | $146,875 |
| Renter-Occupied | 8 (6.1%) | $0 |
| Average | 132 (100.0%) | $141,667 |
Occupancy by Householder Income Bracket in Glenview Hills
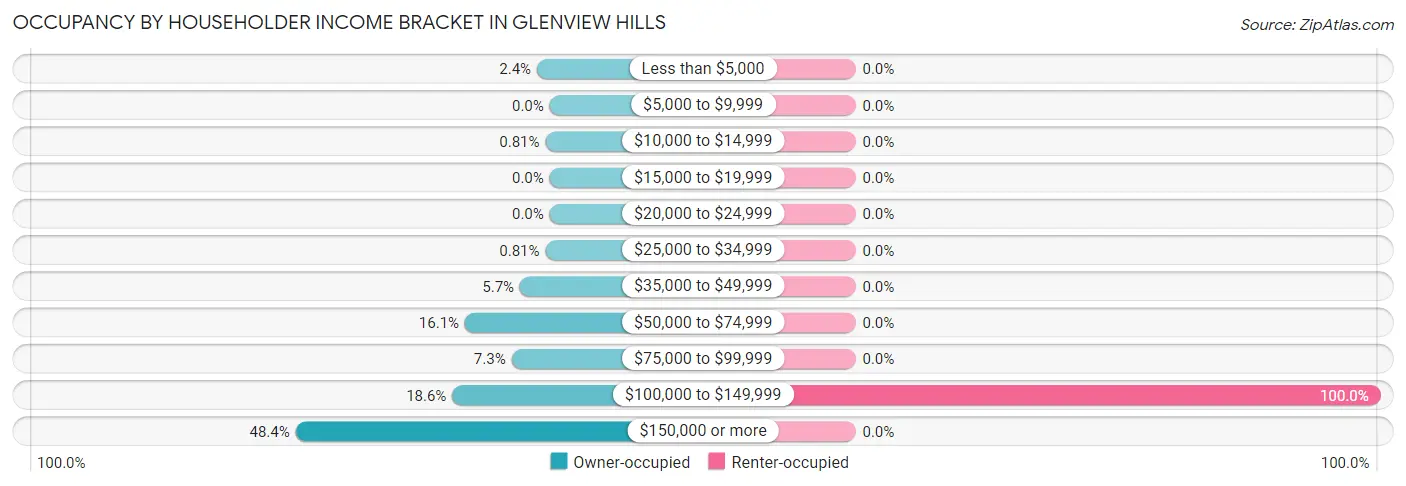
| Income Bracket | Owner-occupied | Renter-occupied |
| Less than $5,000 | 3 (2.4%) | 0 (0.0%) |
| $5,000 to $9,999 | 0 (0.0%) | 0 (0.0%) |
| $10,000 to $14,999 | 1 (0.8%) | 0 (0.0%) |
| $15,000 to $19,999 | 0 (0.0%) | 0 (0.0%) |
| $20,000 to $24,999 | 0 (0.0%) | 0 (0.0%) |
| $25,000 to $34,999 | 1 (0.8%) | 0 (0.0%) |
| $35,000 to $49,999 | 7 (5.7%) | 0 (0.0%) |
| $50,000 to $74,999 | 20 (16.1%) | 0 (0.0%) |
| $75,000 to $99,999 | 9 (7.3%) | 0 (0.0%) |
| $100,000 to $149,999 | 23 (18.5%) | 8 (100.0%) |
| $150,000 or more | 60 (48.4%) | 0 (0.0%) |
| Total | 124 (100.0%) | 8 (100.0%) |
Monthly Housing Cost Tiers in Glenview Hills
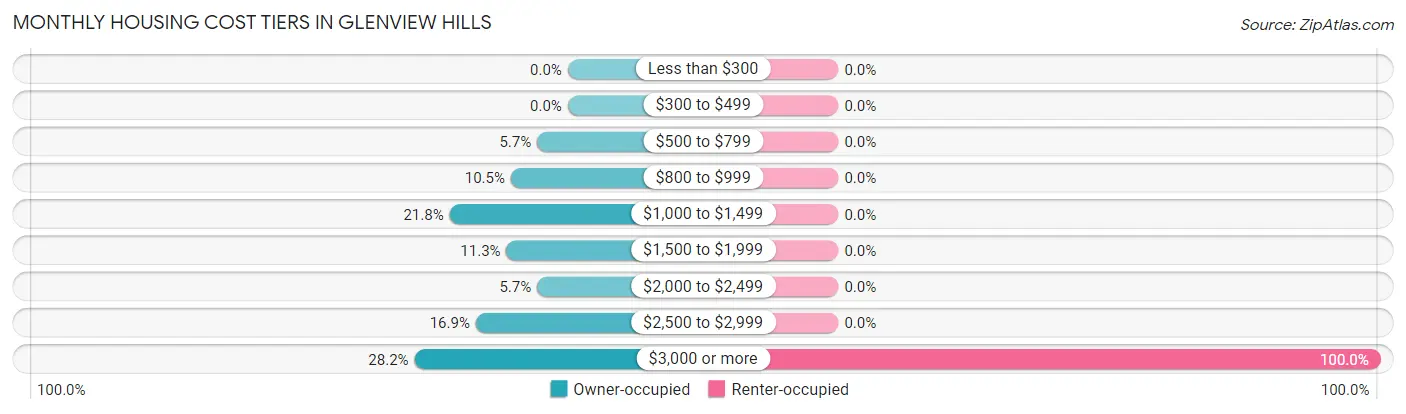
| Monthly Cost | Owner-occupied | Renter-occupied |
| Less than $300 | 0 (0.0%) | 0 (0.0%) |
| $300 to $499 | 0 (0.0%) | 0 (0.0%) |
| $500 to $799 | 7 (5.7%) | 0 (0.0%) |
| $800 to $999 | 13 (10.5%) | 0 (0.0%) |
| $1,000 to $1,499 | 27 (21.8%) | 0 (0.0%) |
| $1,500 to $1,999 | 14 (11.3%) | 0 (0.0%) |
| $2,000 to $2,499 | 7 (5.7%) | 0 (0.0%) |
| $2,500 to $2,999 | 21 (16.9%) | 0 (0.0%) |
| $3,000 or more | 35 (28.2%) | 8 (100.0%) |
| Total | 124 (100.0%) | 8 (100.0%) |
Physical Housing Characteristics in Glenview Hills
Housing Structures in Glenview Hills
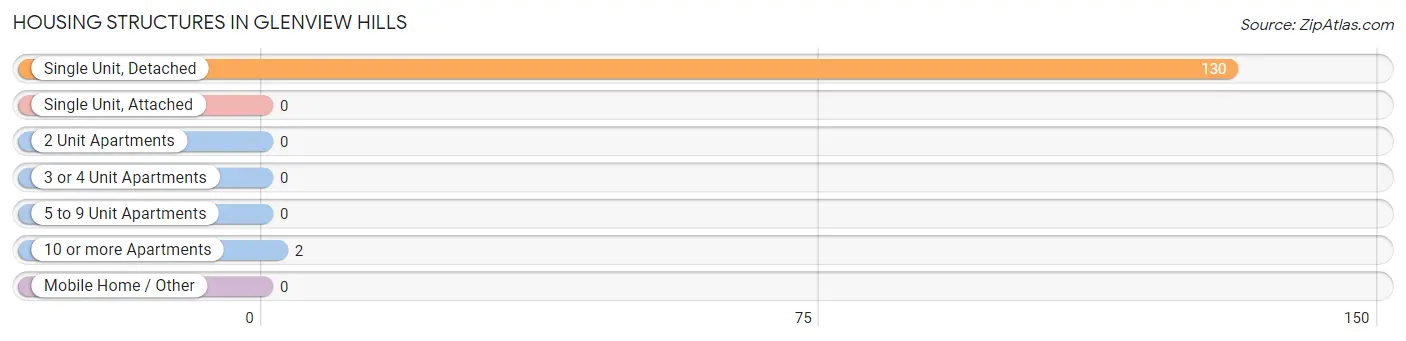
| Structure Type | # Housing Units | % Housing Units |
| Single Unit, Detached | 130 | 98.5% |
| Single Unit, Attached | 0 | 0.0% |
| 2 Unit Apartments | 0 | 0.0% |
| 3 or 4 Unit Apartments | 0 | 0.0% |
| 5 to 9 Unit Apartments | 0 | 0.0% |
| 10 or more Apartments | 2 | 1.5% |
| Mobile Home / Other | 0 | 0.0% |
| Total | 132 | 100.0% |
Housing Structures by Occupancy in Glenview Hills
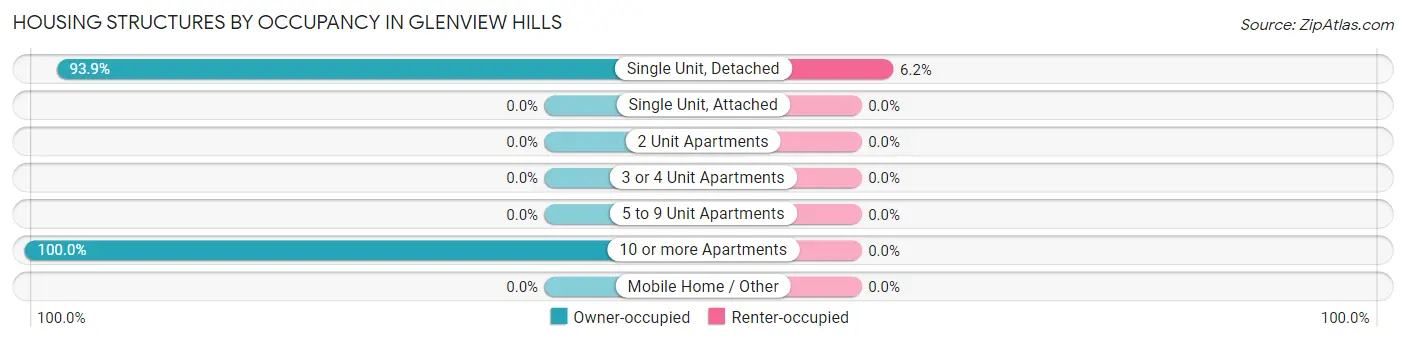
| Structure Type | Owner-occupied | Renter-occupied |
| Single Unit, Detached | 122 (93.9%) | 8 (6.1%) |
| Single Unit, Attached | 0 (0.0%) | 0 (0.0%) |
| 2 Unit Apartments | 0 (0.0%) | 0 (0.0%) |
| 3 or 4 Unit Apartments | 0 (0.0%) | 0 (0.0%) |
| 5 to 9 Unit Apartments | 0 (0.0%) | 0 (0.0%) |
| 10 or more Apartments | 2 (100.0%) | 0 (0.0%) |
| Mobile Home / Other | 0 (0.0%) | 0 (0.0%) |
| Total | 124 (93.9%) | 8 (6.1%) |
Housing Structures by Number of Rooms in Glenview Hills
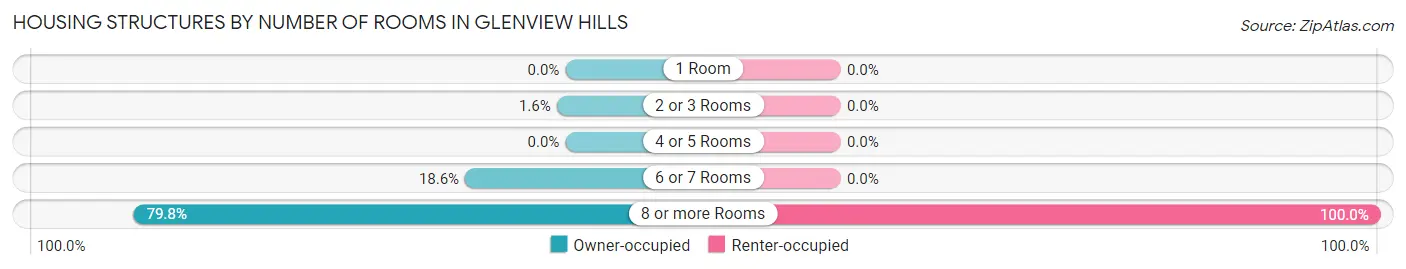
| Number of Rooms | Owner-occupied | Renter-occupied |
| 1 Room | 0 (0.0%) | 0 (0.0%) |
| 2 or 3 Rooms | 2 (1.6%) | 0 (0.0%) |
| 4 or 5 Rooms | 0 (0.0%) | 0 (0.0%) |
| 6 or 7 Rooms | 23 (18.5%) | 0 (0.0%) |
| 8 or more Rooms | 99 (79.8%) | 8 (100.0%) |
| Total | 124 (100.0%) | 8 (100.0%) |
Housing Structure by Heating Type in Glenview Hills
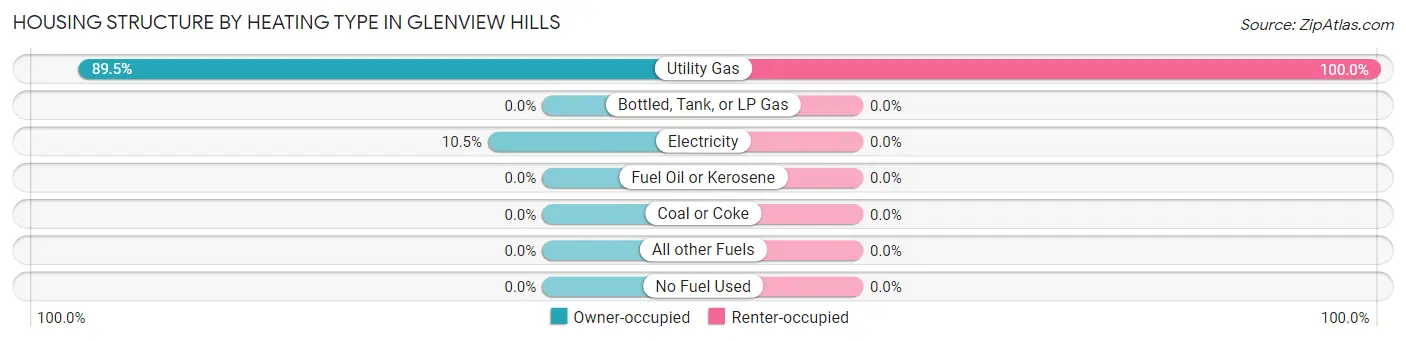
| Heating Type | Owner-occupied | Renter-occupied |
| Utility Gas | 111 (89.5%) | 8 (100.0%) |
| Bottled, Tank, or LP Gas | 0 (0.0%) | 0 (0.0%) |
| Electricity | 13 (10.5%) | 0 (0.0%) |
| Fuel Oil or Kerosene | 0 (0.0%) | 0 (0.0%) |
| Coal or Coke | 0 (0.0%) | 0 (0.0%) |
| All other Fuels | 0 (0.0%) | 0 (0.0%) |
| No Fuel Used | 0 (0.0%) | 0 (0.0%) |
| Total | 124 (100.0%) | 8 (100.0%) |
Household Vehicle Usage in Glenview Hills
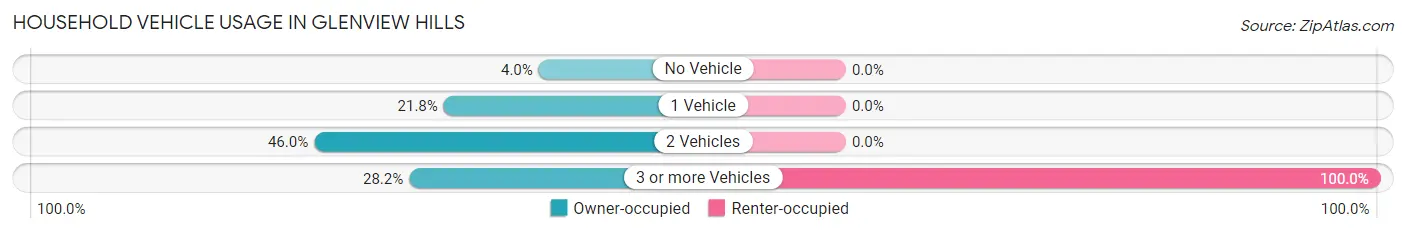
| Vehicles per Household | Owner-occupied | Renter-occupied |
| No Vehicle | 5 (4.0%) | 0 (0.0%) |
| 1 Vehicle | 27 (21.8%) | 0 (0.0%) |
| 2 Vehicles | 57 (46.0%) | 0 (0.0%) |
| 3 or more Vehicles | 35 (28.2%) | 8 (100.0%) |
| Total | 124 (100.0%) | 8 (100.0%) |
Real Estate & Mortgages in Glenview Hills
Real Estate and Mortgage Overview in Glenview Hills
| Characteristic | Without Mortgage | With Mortgage |
| Housing Units | 48 | 76 |
| Median Property Value | $557,700 | $594,800 |
| Median Household Income | $75,000 | $48 |
| Monthly Housing Costs | $1,050 | $35 |
| Real Estate Taxes | $4,500 | $0 |
Property Value by Mortgage Status in Glenview Hills
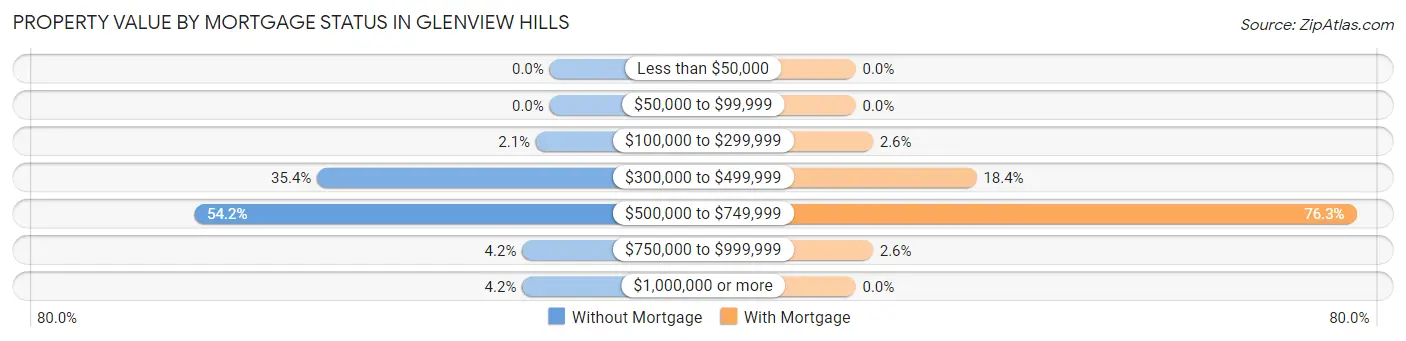
| Property Value | Without Mortgage | With Mortgage |
| Less than $50,000 | 0 (0.0%) | 0 (0.0%) |
| $50,000 to $99,999 | 0 (0.0%) | 0 (0.0%) |
| $100,000 to $299,999 | 1 (2.1%) | 2 (2.6%) |
| $300,000 to $499,999 | 17 (35.4%) | 14 (18.4%) |
| $500,000 to $749,999 | 26 (54.2%) | 58 (76.3%) |
| $750,000 to $999,999 | 2 (4.2%) | 2 (2.6%) |
| $1,000,000 or more | 2 (4.2%) | 0 (0.0%) |
| Total | 48 (100.0%) | 76 (100.0%) |
Household Income by Mortgage Status in Glenview Hills
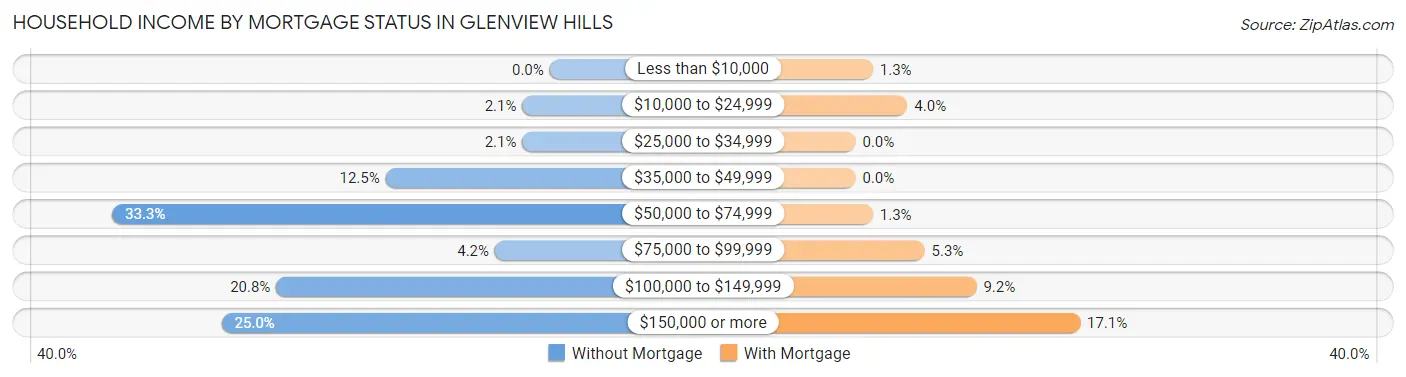
| Household Income | Without Mortgage | With Mortgage |
| Less than $10,000 | 0 (0.0%) | 1 (1.3%) |
| $10,000 to $24,999 | 1 (2.1%) | 3 (4.0%) |
| $25,000 to $34,999 | 1 (2.1%) | 0 (0.0%) |
| $35,000 to $49,999 | 6 (12.5%) | 0 (0.0%) |
| $50,000 to $74,999 | 16 (33.3%) | 1 (1.3%) |
| $75,000 to $99,999 | 2 (4.2%) | 4 (5.3%) |
| $100,000 to $149,999 | 10 (20.8%) | 7 (9.2%) |
| $150,000 or more | 12 (25.0%) | 13 (17.1%) |
| Total | 48 (100.0%) | 76 (100.0%) |
Property Value to Household Income Ratio in Glenview Hills
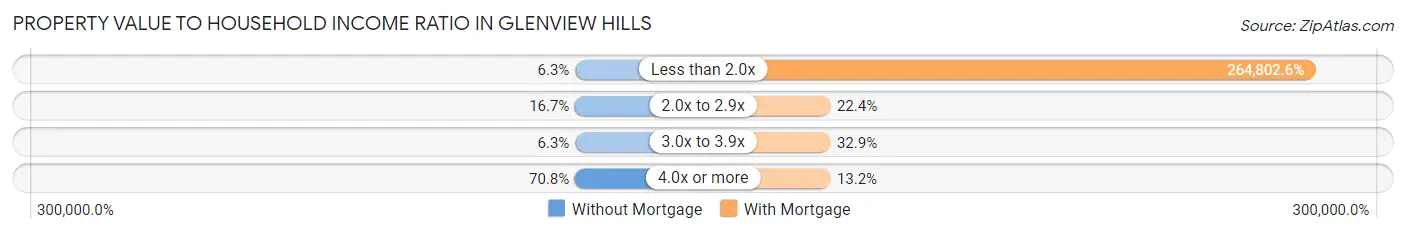
| Value-to-Income Ratio | Without Mortgage | With Mortgage |
| Less than 2.0x | 3 (6.2%) | 201,250 (264,802.6%) |
| 2.0x to 2.9x | 8 (16.7%) | 17 (22.4%) |
| 3.0x to 3.9x | 3 (6.2%) | 25 (32.9%) |
| 4.0x or more | 34 (70.8%) | 10 (13.2%) |
| Total | 48 (100.0%) | 76 (100.0%) |
Real Estate Taxes by Mortgage Status in Glenview Hills
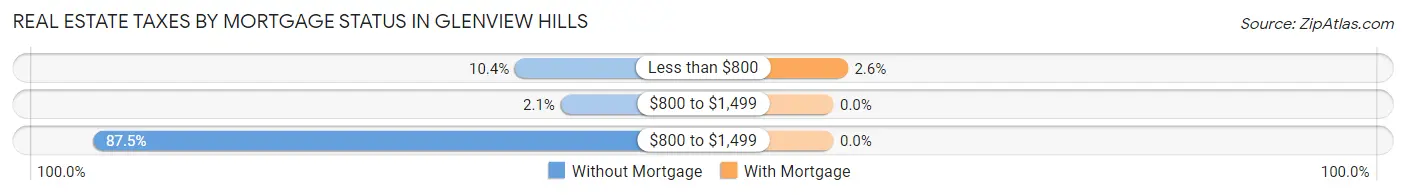
| Property Taxes | Without Mortgage | With Mortgage |
| Less than $800 | 5 (10.4%) | 2 (2.6%) |
| $800 to $1,499 | 1 (2.1%) | 0 (0.0%) |
| $800 to $1,499 | 42 (87.5%) | 0 (0.0%) |
| Total | 48 (100.0%) | 76 (100.0%) |
Health & Disability in Glenview Hills
Health Insurance Coverage by Age in Glenview Hills
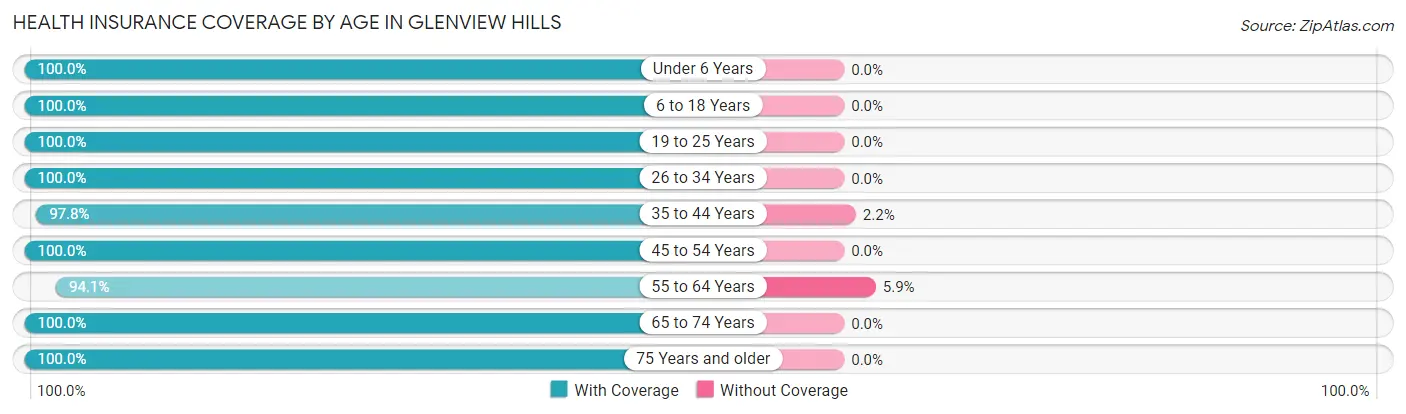
| Age Bracket | With Coverage | Without Coverage |
| Under 6 Years | 23 (100.0%) | 0 (0.0%) |
| 6 to 18 Years | 64 (100.0%) | 0 (0.0%) |
| 19 to 25 Years | 9 (100.0%) | 0 (0.0%) |
| 26 to 34 Years | 3 (100.0%) | 0 (0.0%) |
| 35 to 44 Years | 45 (97.8%) | 1 (2.2%) |
| 45 to 54 Years | 88 (100.0%) | 0 (0.0%) |
| 55 to 64 Years | 32 (94.1%) | 2 (5.9%) |
| 65 to 74 Years | 37 (100.0%) | 0 (0.0%) |
| 75 Years and older | 41 (100.0%) | 0 (0.0%) |
| Total | 342 (99.1%) | 3 (0.9%) |
Health Insurance Coverage by Citizenship Status in Glenview Hills
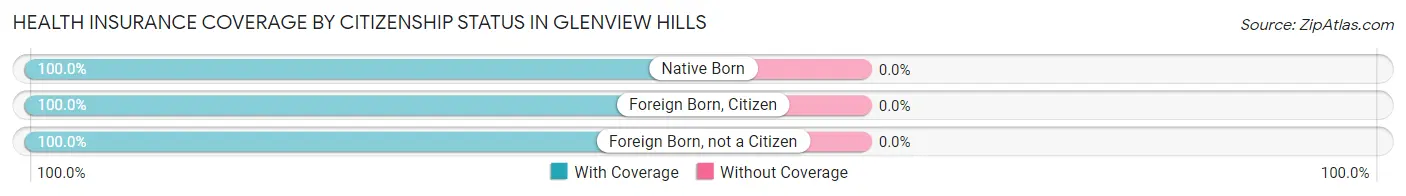
| Citizenship Status | With Coverage | Without Coverage |
| Native Born | 23 (100.0%) | 0 (0.0%) |
| Foreign Born, Citizen | 64 (100.0%) | 0 (0.0%) |
| Foreign Born, not a Citizen | 9 (100.0%) | 0 (0.0%) |
Health Insurance Coverage by Household Income in Glenview Hills
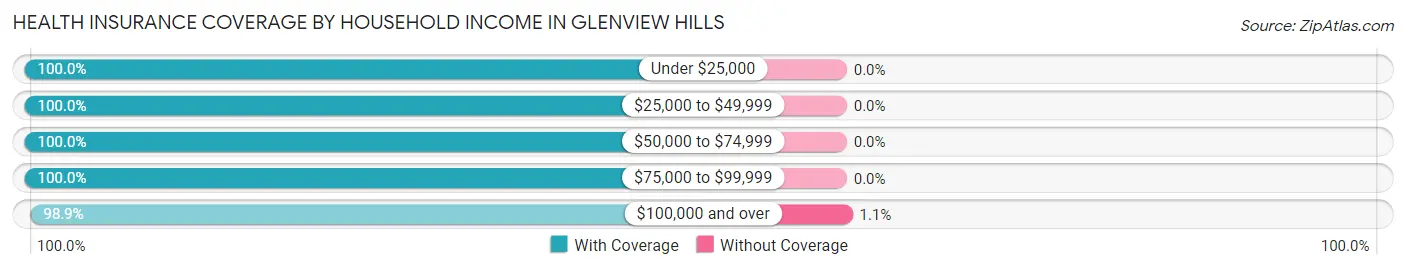
| Household Income | With Coverage | Without Coverage |
| Under $25,000 | 6 (100.0%) | 0 (0.0%) |
| $25,000 to $49,999 | 10 (100.0%) | 0 (0.0%) |
| $50,000 to $74,999 | 34 (100.0%) | 0 (0.0%) |
| $75,000 to $99,999 | 18 (100.0%) | 0 (0.0%) |
| $100,000 and over | 274 (98.9%) | 3 (1.1%) |
Public vs Private Health Insurance Coverage by Age in Glenview Hills
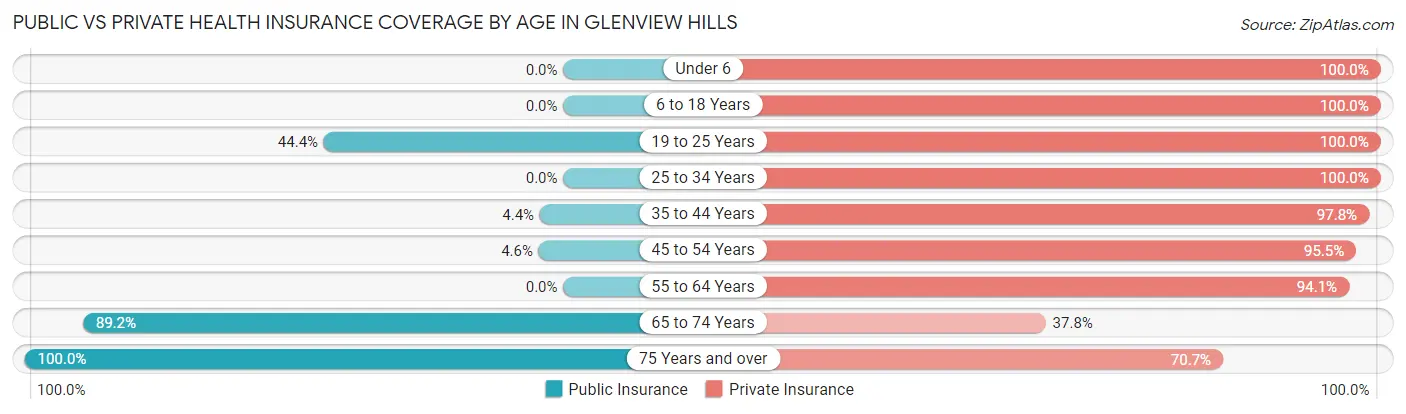
| Age Bracket | Public Insurance | Private Insurance |
| Under 6 | 0 (0.0%) | 23 (100.0%) |
| 6 to 18 Years | 0 (0.0%) | 64 (100.0%) |
| 19 to 25 Years | 4 (44.4%) | 9 (100.0%) |
| 25 to 34 Years | 0 (0.0%) | 3 (100.0%) |
| 35 to 44 Years | 2 (4.3%) | 45 (97.8%) |
| 45 to 54 Years | 4 (4.5%) | 84 (95.5%) |
| 55 to 64 Years | 0 (0.0%) | 32 (94.1%) |
| 65 to 74 Years | 33 (89.2%) | 14 (37.8%) |
| 75 Years and over | 41 (100.0%) | 29 (70.7%) |
| Total | 84 (24.3%) | 303 (87.8%) |
Disability Status by Sex by Age in Glenview Hills
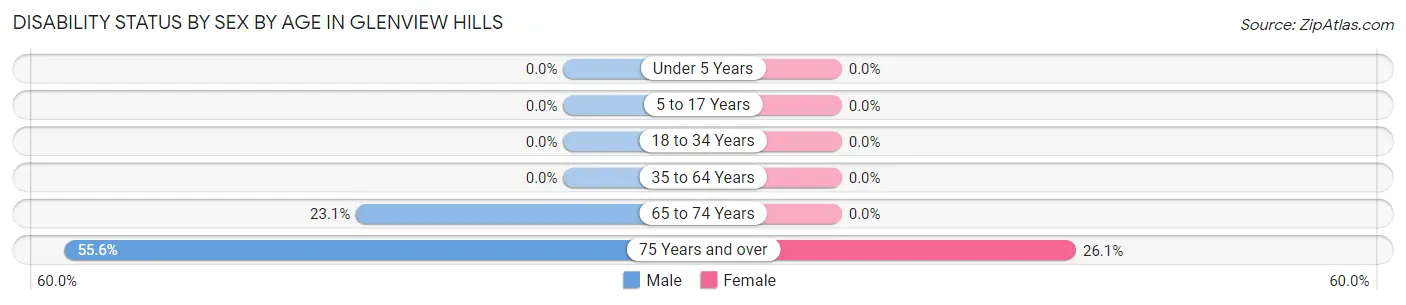
| Age Bracket | Male | Female |
| Under 5 Years | 0 (0.0%) | 0 (0.0%) |
| 5 to 17 Years | 0 (0.0%) | 0 (0.0%) |
| 18 to 34 Years | 0 (0.0%) | 0 (0.0%) |
| 35 to 64 Years | 0 (0.0%) | 0 (0.0%) |
| 65 to 74 Years | 3 (23.1%) | 0 (0.0%) |
| 75 Years and over | 10 (55.6%) | 6 (26.1%) |
Disability Class by Sex by Age in Glenview Hills
Disability Class: Hearing Difficulty
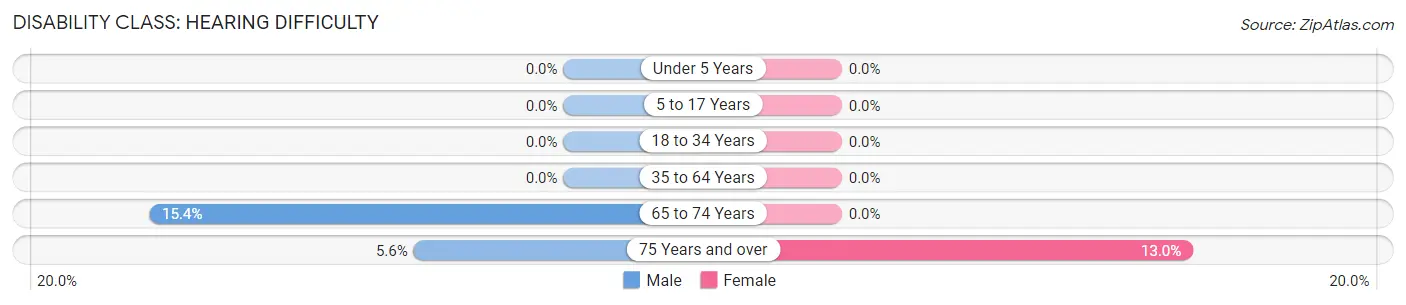
| Age Bracket | Male | Female |
| Under 5 Years | 0 (0.0%) | 0 (0.0%) |
| 5 to 17 Years | 0 (0.0%) | 0 (0.0%) |
| 18 to 34 Years | 0 (0.0%) | 0 (0.0%) |
| 35 to 64 Years | 0 (0.0%) | 0 (0.0%) |
| 65 to 74 Years | 2 (15.4%) | 0 (0.0%) |
| 75 Years and over | 1 (5.6%) | 3 (13.0%) |
Disability Class: Vision Difficulty
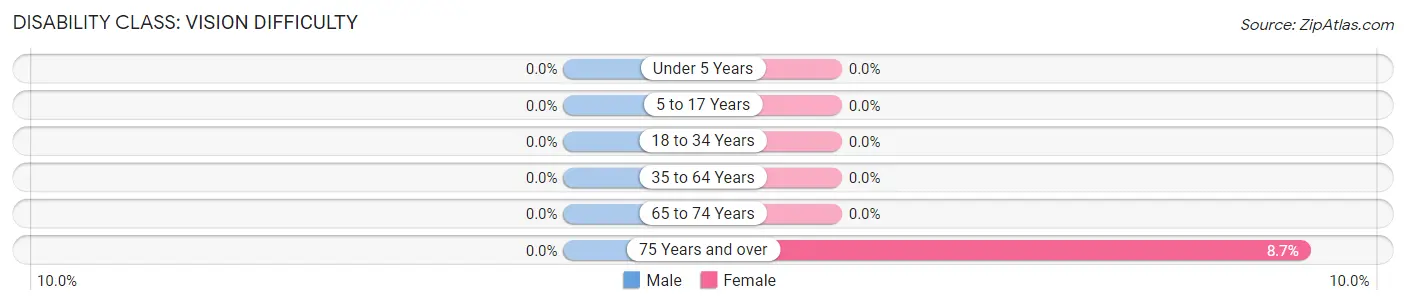
| Age Bracket | Male | Female |
| Under 5 Years | 0 (0.0%) | 0 (0.0%) |
| 5 to 17 Years | 0 (0.0%) | 0 (0.0%) |
| 18 to 34 Years | 0 (0.0%) | 0 (0.0%) |
| 35 to 64 Years | 0 (0.0%) | 0 (0.0%) |
| 65 to 74 Years | 0 (0.0%) | 0 (0.0%) |
| 75 Years and over | 0 (0.0%) | 2 (8.7%) |
Disability Class: Cognitive Difficulty
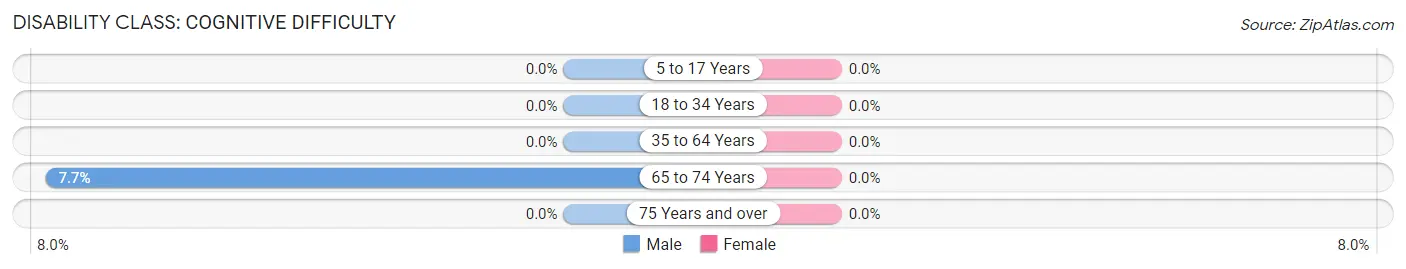
| Age Bracket | Male | Female |
| 5 to 17 Years | 0 (0.0%) | 0 (0.0%) |
| 18 to 34 Years | 0 (0.0%) | 0 (0.0%) |
| 35 to 64 Years | 0 (0.0%) | 0 (0.0%) |
| 65 to 74 Years | 1 (7.7%) | 0 (0.0%) |
| 75 Years and over | 0 (0.0%) | 0 (0.0%) |
Disability Class: Ambulatory Difficulty
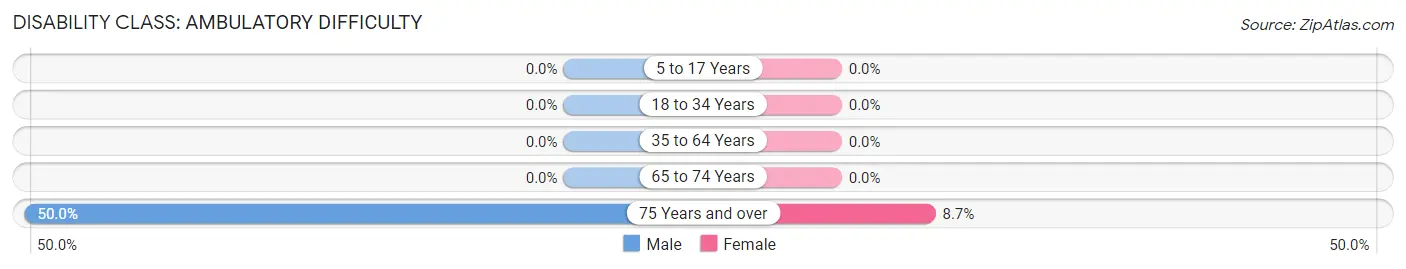
| Age Bracket | Male | Female |
| 5 to 17 Years | 0 (0.0%) | 0 (0.0%) |
| 18 to 34 Years | 0 (0.0%) | 0 (0.0%) |
| 35 to 64 Years | 0 (0.0%) | 0 (0.0%) |
| 65 to 74 Years | 0 (0.0%) | 0 (0.0%) |
| 75 Years and over | 9 (50.0%) | 2 (8.7%) |
Disability Class: Self-Care Difficulty
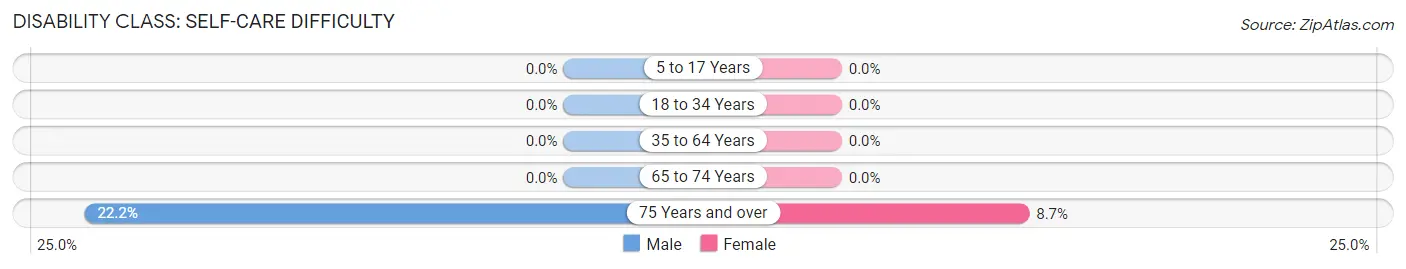
| Age Bracket | Male | Female |
| 5 to 17 Years | 0 (0.0%) | 0 (0.0%) |
| 18 to 34 Years | 0 (0.0%) | 0 (0.0%) |
| 35 to 64 Years | 0 (0.0%) | 0 (0.0%) |
| 65 to 74 Years | 0 (0.0%) | 0 (0.0%) |
| 75 Years and over | 4 (22.2%) | 2 (8.7%) |
Technology Access in Glenview Hills
Computing Device Access in Glenview Hills
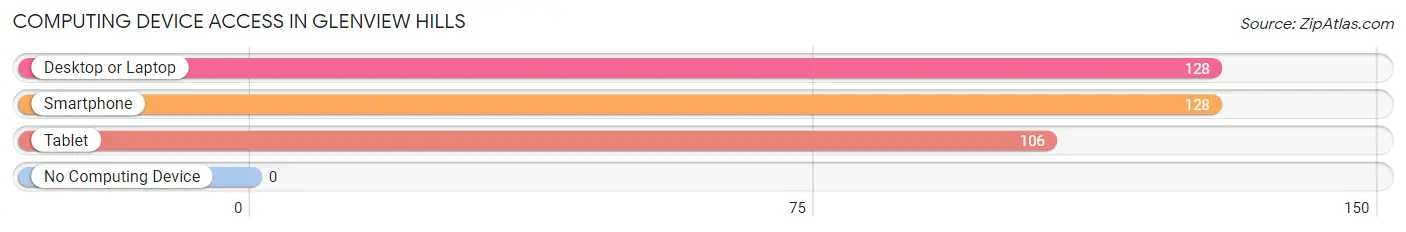
| Device Type | # Households | % Households |
| Desktop or Laptop | 128 | 97.0% |
| Smartphone | 128 | 97.0% |
| Tablet | 106 | 80.3% |
| No Computing Device | 0 | 0.0% |
| Total | 132 | 100.0% |
Internet Access in Glenview Hills
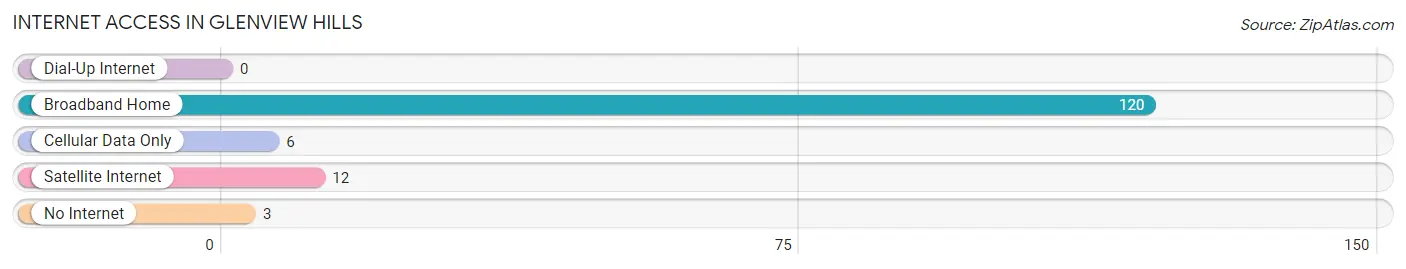
| Internet Type | # Households | % Households |
| Dial-Up Internet | 0 | 0.0% |
| Broadband Home | 120 | 90.9% |
| Cellular Data Only | 6 | 4.5% |
| Satellite Internet | 12 | 9.1% |
| No Internet | 3 | 2.3% |
| Total | 132 | 100.0% |
Glenview Hills Summary
Glenview Hills is a small city located in the northern part of Kentucky, in the United States. It is part of the greater Cincinnati metropolitan area and is situated in the rolling hills of the Bluegrass region. The city has a population of approximately 4,000 people and is known for its small-town charm and friendly atmosphere.
History
Glenview Hills was founded in the late 1800s by a group of German immigrants who were looking for a place to settle and start a new life. The city was originally called “Glenview” and was named after the nearby Glenview Creek. The city was incorporated in 1891 and has since grown to become a thriving community.
Geography
Glenview Hills is located in the northern part of Kentucky, in the United States. It is situated in the rolling hills of the Bluegrass region and is part of the greater Cincinnati metropolitan area. The city is bordered by the cities of Fort Thomas, Cold Spring, and Alexandria. The city is located near the Ohio River and is approximately 20 miles from downtown Cincinnati.
Economy
Glenview Hills is a small city with a population of approximately 4,000 people. The city’s economy is largely based on small businesses and local services. The city is home to a variety of small businesses, including restaurants, retail stores, and professional services. The city also has a number of manufacturing and industrial businesses, including a large automotive parts manufacturer.
Demographics
As of the 2010 census, the population of Glenview Hills was 4,000 people. The racial makeup of the city was 94.2% White, 2.2% African American, 0.3% Native American, 0.7% Asian, 0.1% Pacific Islander, and 2.5% from other races. The median household income was $50,000 and the median family income was $60,000. The city has a high rate of homeownership, with approximately 75% of the population owning their own homes.
Conclusion
Glenview Hills is a small city located in the northern part of Kentucky, in the United States. It is part of the greater Cincinnati metropolitan area and is situated in the rolling hills of the Bluegrass region. The city has a population of approximately 4,000 people and is known for its small-town charm and friendly atmosphere. The city’s economy is largely based on small businesses and local services, and the city has a high rate of homeownership. Glenview Hills is a great place to live and work, and is a great example of a small city with a big heart.
Common Questions
What is Per Capita Income in Glenview Hills?
Per Capita income in Glenview Hills is $68,207.
What is the Median Family Income in Glenview Hills?
Median Family Income in Glenview Hills is $147,500.
What is the Median Household income in Glenview Hills?
Median Household Income in Glenview Hills is $141,667.
What is Income or Wage Gap in Glenview Hills?
Income or Wage Gap in Glenview Hills is 49.3%.
Women in Glenview Hills earn 50.7 cents for every dollar earned by a man.
What is Inequality or Gini Index in Glenview Hills?
Inequality or Gini Index in Glenview Hills is 0.38.
What is the Total Population of Glenview Hills?
Total Population of Glenview Hills is 345.
What is the Total Male Population of Glenview Hills?
Total Male Population of Glenview Hills is 168.
What is the Total Female Population of Glenview Hills?
Total Female Population of Glenview Hills is 177.
What is the Ratio of Males per 100 Females in Glenview Hills?
There are 94.92 Males per 100 Females in Glenview Hills.
What is the Ratio of Females per 100 Males in Glenview Hills?
There are 105.36 Females per 100 Males in Glenview Hills.
What is the Median Population Age in Glenview Hills?
Median Population Age in Glenview Hills is 48.5 Years.
What is the Average Family Size in Glenview Hills
Average Family Size in Glenview Hills is 3.0 People.
What is the Average Household Size in Glenview Hills
Average Household Size in Glenview Hills is 2.6 People.
How Large is the Labor Force in Glenview Hills?
There are 182 People in the Labor Forcein in Glenview Hills.
What is the Percentage of People in the Labor Force in Glenview Hills?
64.8% of People are in the Labor Force in Glenview Hills.