Georgetown, KY Map & Demographics
Georgetown Map
Georgetown Overview
$34,345
PER CAPITA INCOME
$84,572
AVG FAMILY INCOME
$74,530
AVG HOUSEHOLD INCOME
39.3%
WAGE / INCOME GAP [ % ]
60.7¢/ $1
WAGE / INCOME GAP [ $ ]
0.38
INEQUALITY / GINI INDEX
37,510
TOTAL POPULATION
18,002
MALE POPULATION
19,508
FEMALE POPULATION
92.28
MALES / 100 FEMALES
108.37
FEMALES / 100 MALES
32.8
MEDIAN AGE
3.0
AVG FAMILY SIZE
2.5
AVG HOUSEHOLD SIZE
20,137
LABOR FORCE [ PEOPLE ]
70.1%
PERCENT IN LABOR FORCE
3.6%
UNEMPLOYMENT RATE
Georgetown Zip Codes
Georgetown Area Codes
Income in Georgetown
Income Overview in Georgetown
Per Capita Income in Georgetown is $34,345, while median incomes of families and households are $84,572 and $74,530 respectively.
| Characteristic | Number | Measure |
| Per Capita Income | 37,510 | $34,345 |
| Median Family Income | 9,807 | $84,572 |
| Mean Family Income | 9,807 | $99,490 |
| Median Household Income | 14,388 | $74,530 |
| Mean Household Income | 14,388 | $88,295 |
| Income Deficit | 9,807 | $0 |
| Wage / Income Gap (%) | 37,510 | 39.32% |
| Wage / Income Gap ($) | 37,510 | 60.68¢ per $1 |
| Gini / Inequality Index | 37,510 | 0.38 |
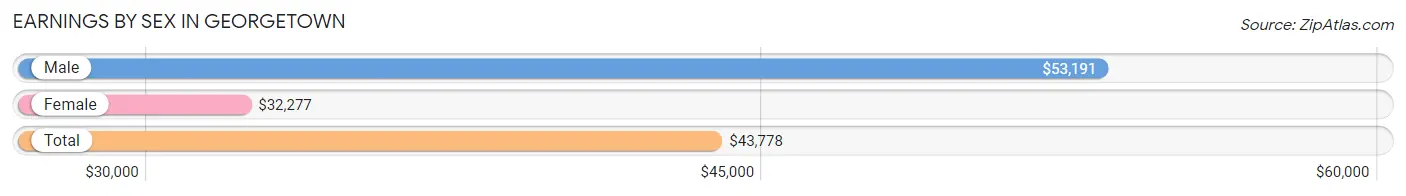
Earnings by Sex in Georgetown
Average Earnings in Georgetown are $43,778, $53,191 for men and $32,277 for women, a difference of 39.3%.
| Sex | Number | Average Earnings |
| Male | 10,990 (52.0%) | $53,191 |
| Female | 10,141 (48.0%) | $32,277 |
| Total | 21,131 (100.0%) | $43,778 |
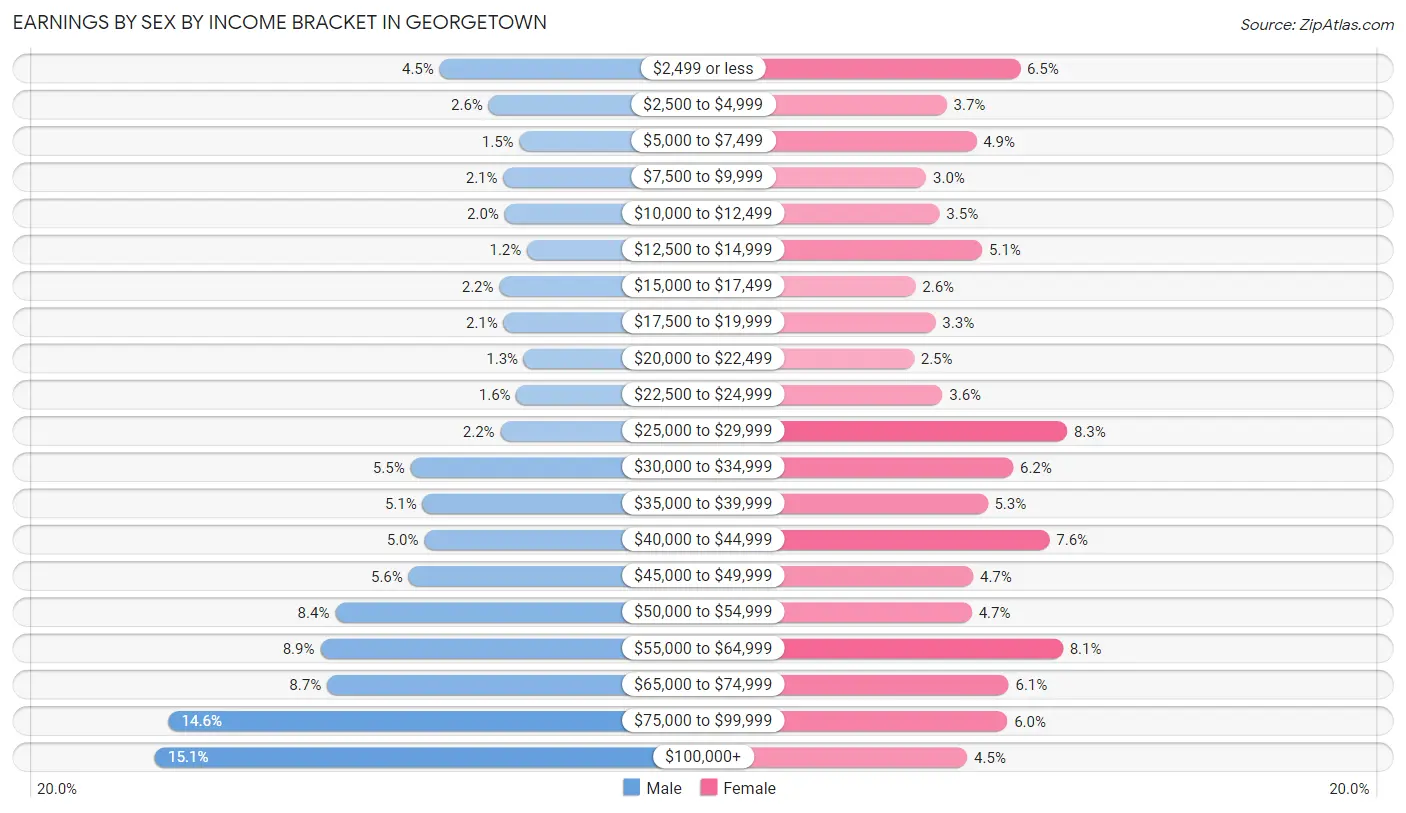
Earnings by Sex by Income Bracket in Georgetown
The most common earnings brackets in Georgetown are $100,000+ for men (1,661 | 15.1%) and $25,000 to $29,999 for women (837 | 8.3%).
| Income | Male | Female |
| $2,499 or less | 489 (4.4%) | 658 (6.5%) |
| $2,500 to $4,999 | 287 (2.6%) | 379 (3.7%) |
| $5,000 to $7,499 | 161 (1.5%) | 492 (4.9%) |
| $7,500 to $9,999 | 226 (2.1%) | 301 (3.0%) |
| $10,000 to $12,499 | 221 (2.0%) | 352 (3.5%) |
| $12,500 to $14,999 | 129 (1.2%) | 514 (5.1%) |
| $15,000 to $17,499 | 243 (2.2%) | 261 (2.6%) |
| $17,500 to $19,999 | 225 (2.1%) | 337 (3.3%) |
| $20,000 to $22,499 | 142 (1.3%) | 255 (2.5%) |
| $22,500 to $24,999 | 173 (1.6%) | 363 (3.6%) |
| $25,000 to $29,999 | 239 (2.2%) | 837 (8.3%) |
| $30,000 to $34,999 | 609 (5.5%) | 632 (6.2%) |
| $35,000 to $39,999 | 559 (5.1%) | 534 (5.3%) |
| $40,000 to $44,999 | 552 (5.0%) | 770 (7.6%) |
| $45,000 to $49,999 | 617 (5.6%) | 480 (4.7%) |
| $50,000 to $54,999 | 919 (8.4%) | 475 (4.7%) |
| $55,000 to $64,999 | 980 (8.9%) | 820 (8.1%) |
| $65,000 to $74,999 | 953 (8.7%) | 615 (6.1%) |
| $75,000 to $99,999 | 1,605 (14.6%) | 609 (6.0%) |
| $100,000+ | 1,661 (15.1%) | 457 (4.5%) |
| Total | 10,990 (100.0%) | 10,141 (100.0%) |
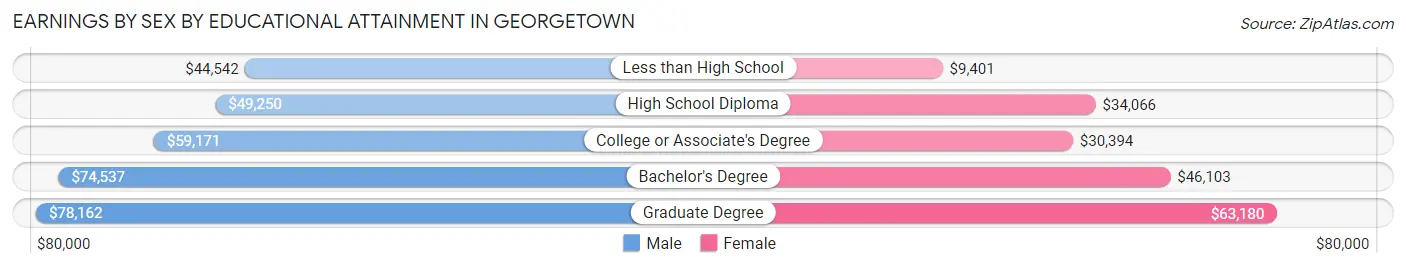
Earnings by Sex by Educational Attainment in Georgetown
Average earnings in Georgetown are $59,491 for men and $38,431 for women, a difference of 35.4%. Men with an educational attainment of graduate degree enjoy the highest average annual earnings of $78,162, while those with less than high school education earn the least with $44,542. Women with an educational attainment of graduate degree earn the most with the average annual earnings of $63,180, while those with less than high school education have the smallest earnings of $9,401.
| Educational Attainment | Male Income | Female Income |
| Less than High School | $44,542 | $9,401 |
| High School Diploma | $49,250 | $34,066 |
| College or Associate's Degree | $59,171 | $30,394 |
| Bachelor's Degree | $74,537 | $46,103 |
| Graduate Degree | $78,162 | $63,180 |
| Total | $59,491 | $38,431 |
Family Income in Georgetown
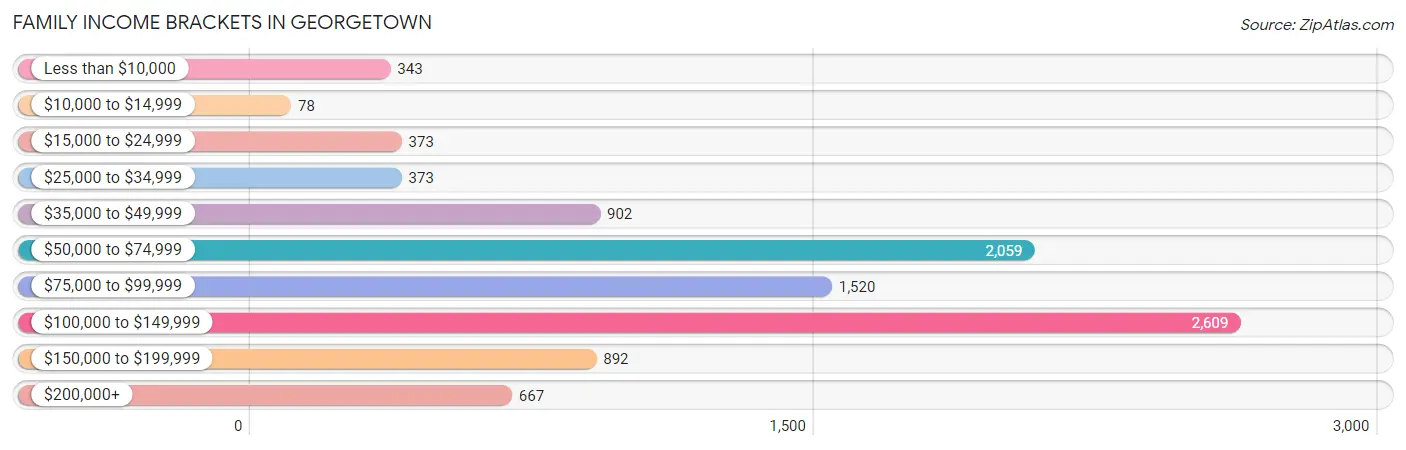
Family Income Brackets in Georgetown
According to the Georgetown family income data, there are 2,609 families falling into the $100,000 to $149,999 income range, which is the most common income bracket and makes up 26.6% of all families. Conversely, the $10,000 to $14,999 income bracket is the least frequent group with only 78 families (0.8%) belonging to this category.
| Income Bracket | # Families | % Families |
| Less than $10,000 | 343 | 3.5% |
| $10,000 to $14,999 | 78 | 0.8% |
| $15,000 to $24,999 | 373 | 3.8% |
| $25,000 to $34,999 | 373 | 3.8% |
| $35,000 to $49,999 | 902 | 9.2% |
| $50,000 to $74,999 | 2,059 | 21.0% |
| $75,000 to $99,999 | 1,520 | 15.5% |
| $100,000 to $149,999 | 2,609 | 26.6% |
| $150,000 to $199,999 | 892 | 9.1% |
| $200,000+ | 667 | 6.8% |
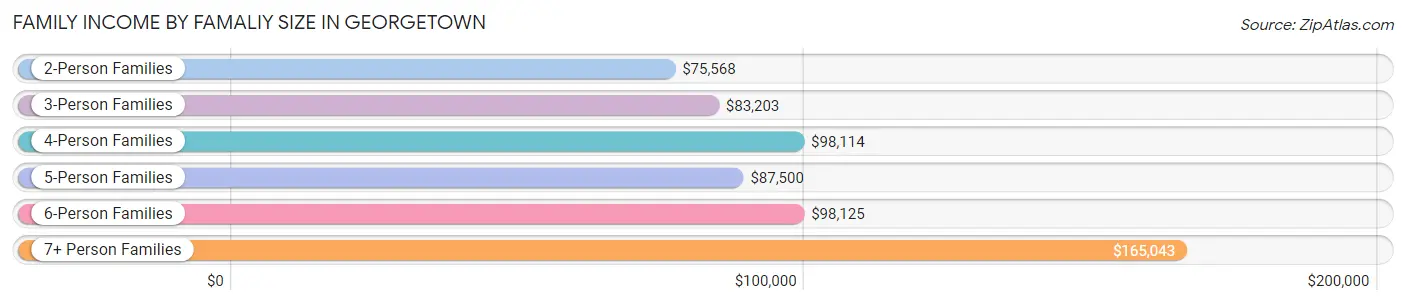
Family Income by Famaliy Size in Georgetown
7+ person families (91 | 0.9%) account for the highest median family income in Georgetown with $165,043 per family, while 2-person families (4,249 | 43.3%) have the highest median income of $37,784 per family member.
| Income Bracket | # Families | Median Income |
| 2-Person Families | 4,249 (43.3%) | $75,568 |
| 3-Person Families | 2,449 (25.0%) | $83,203 |
| 4-Person Families | 2,147 (21.9%) | $98,114 |
| 5-Person Families | 734 (7.5%) | $87,500 |
| 6-Person Families | 137 (1.4%) | $98,125 |
| 7+ Person Families | 91 (0.9%) | $165,043 |
| Total | 9,807 (100.0%) | $84,572 |
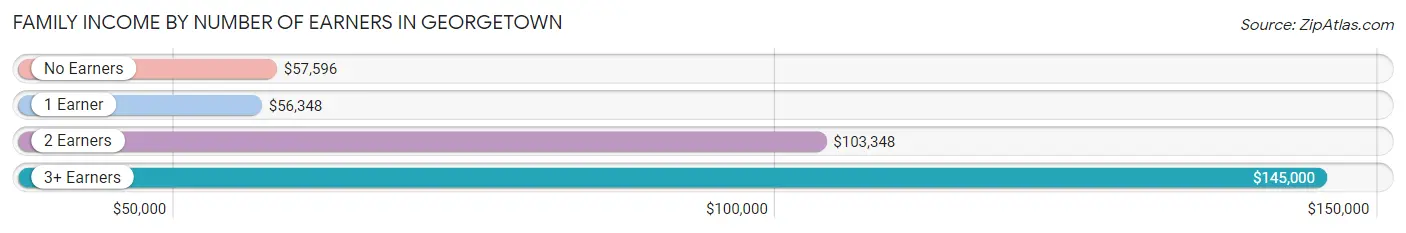
Family Income by Number of Earners in Georgetown
The median family income in Georgetown is $84,572, with families comprising 3+ earners (806) having the highest median family income of $145,000, while families with 1 earner (3,084) have the lowest median family income of $56,348, accounting for 8.2% and 31.5% of families, respectively.
| Number of Earners | # Families | Median Income |
| No Earners | 736 (7.5%) | $57,596 |
| 1 Earner | 3,084 (31.5%) | $56,348 |
| 2 Earners | 5,181 (52.8%) | $103,348 |
| 3+ Earners | 806 (8.2%) | $145,000 |
| Total | 9,807 (100.0%) | $84,572 |
Household Income in Georgetown
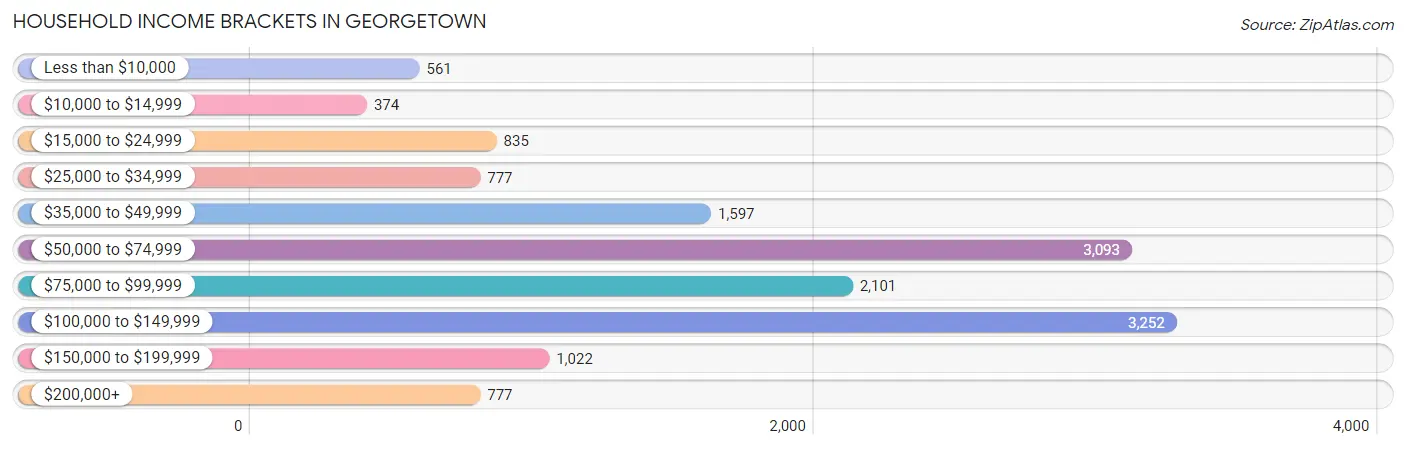
Household Income Brackets in Georgetown
With 3,252 households falling in the category, the $100,000 to $149,999 income range is the most frequent in Georgetown, accounting for 22.6% of all households. In contrast, only 374 households (2.6%) fall into the $10,000 to $14,999 income bracket, making it the least populous group.
| Income Bracket | # Households | % Households |
| Less than $10,000 | 561 | 3.9% |
| $10,000 to $14,999 | 374 | 2.6% |
| $15,000 to $24,999 | 835 | 5.8% |
| $25,000 to $34,999 | 777 | 5.4% |
| $35,000 to $49,999 | 1,597 | 11.1% |
| $50,000 to $74,999 | 3,093 | 21.5% |
| $75,000 to $99,999 | 2,101 | 14.6% |
| $100,000 to $149,999 | 3,252 | 22.6% |
| $150,000 to $199,999 | 1,022 | 7.1% |
| $200,000+ | 777 | 5.4% |
Household Income by Householder Age in Georgetown
The median household income in Georgetown is $74,530, with the highest median household income of $80,151 found in the 45 to 64 years age bracket for the primary householder. A total of 4,740 households (32.9%) fall into this category. Meanwhile, the 65+ years age bracket for the primary householder has the lowest median household income of $49,838, with 2,633 households (18.3%) in this group.
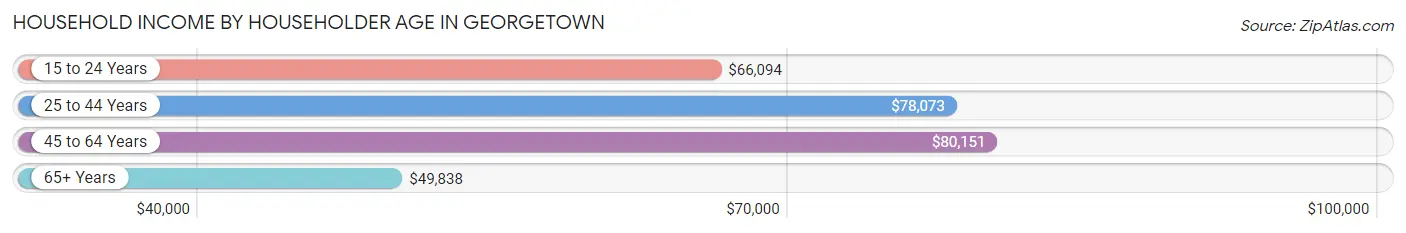
| Income Bracket | # Households | Median Income |
| 15 to 24 Years | 1,012 (7.0%) | $66,094 |
| 25 to 44 Years | 6,003 (41.7%) | $78,073 |
| 45 to 64 Years | 4,740 (32.9%) | $80,151 |
| 65+ Years | 2,633 (18.3%) | $49,838 |
| Total | 14,388 (100.0%) | $74,530 |
Poverty in Georgetown
Income Below Poverty by Sex and Age in Georgetown
With 9.4% poverty level for males and 12.8% for females among the residents of Georgetown, 15 year old males and 6 to 11 year old females are the most vulnerable to poverty, with 159 males (33.1%) and 275 females (19.8%) in their respective age groups living below the poverty level.
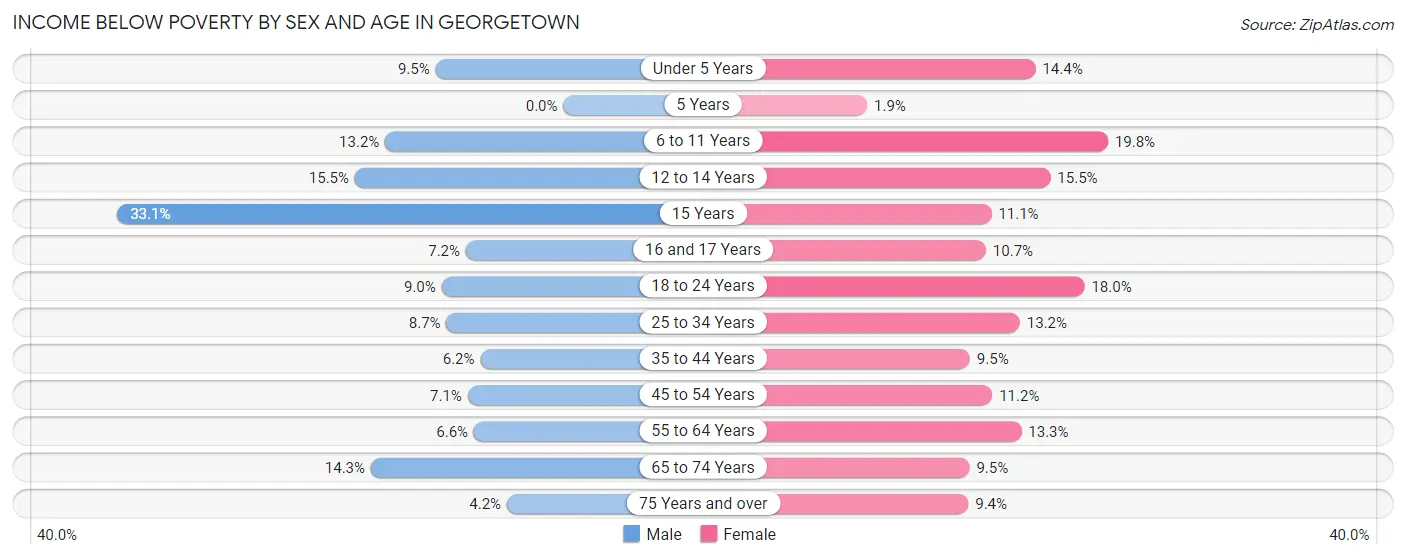
| Age Bracket | Male | Female |
| Under 5 Years | 101 (9.5%) | 215 (14.4%) |
| 5 Years | 0 (0.0%) | 8 (1.9%) |
| 6 to 11 Years | 168 (13.2%) | 275 (19.8%) |
| 12 to 14 Years | 144 (15.5%) | 138 (15.5%) |
| 15 Years | 159 (33.1%) | 33 (11.1%) |
| 16 and 17 Years | 28 (7.2%) | 38 (10.7%) |
| 18 to 24 Years | 155 (9.0%) | 324 (18.0%) |
| 25 to 34 Years | 274 (8.7%) | 389 (13.2%) |
| 35 to 44 Years | 154 (6.2%) | 254 (9.5%) |
| 45 to 54 Years | 157 (7.1%) | 241 (11.2%) |
| 55 to 64 Years | 124 (6.6%) | 265 (13.3%) |
| 65 to 74 Years | 150 (14.3%) | 130 (9.5%) |
| 75 Years and over | 20 (4.2%) | 91 (9.4%) |
| Total | 1,634 (9.4%) | 2,401 (12.8%) |
Income Above Poverty by Sex and Age in Georgetown
According to the poverty statistics in Georgetown, males aged 5 years and females aged 5 years are the age groups that are most secure financially, with 100.0% of males and 98.1% of females in these age groups living above the poverty line.
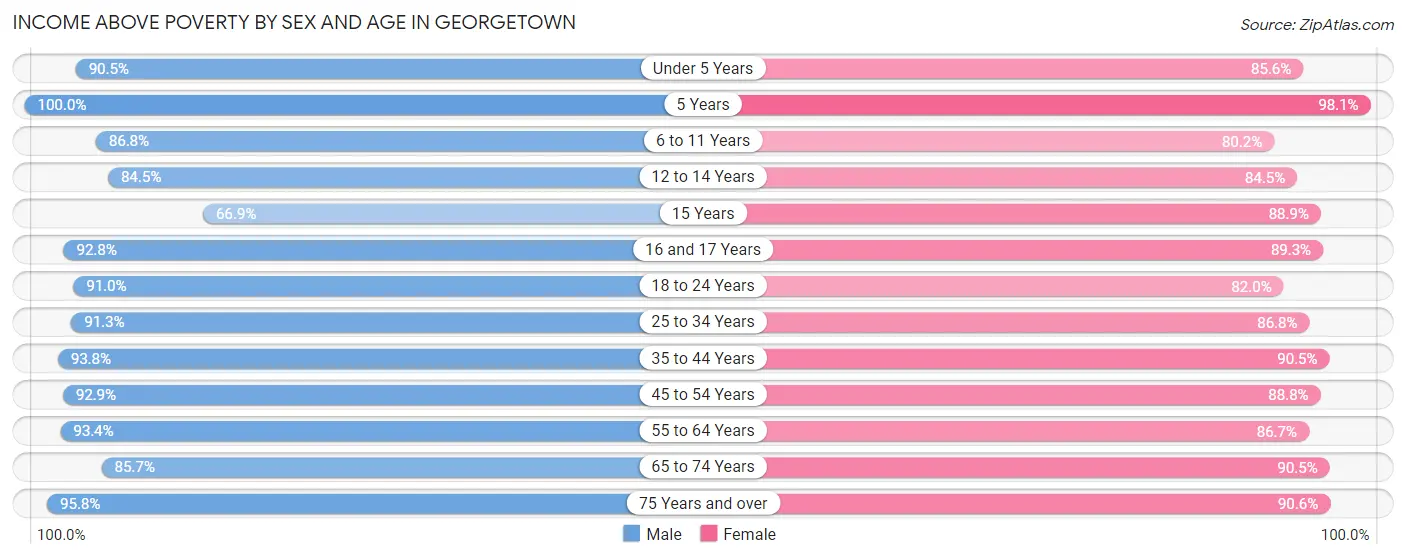
| Age Bracket | Male | Female |
| Under 5 Years | 963 (90.5%) | 1,280 (85.6%) |
| 5 Years | 198 (100.0%) | 418 (98.1%) |
| 6 to 11 Years | 1,102 (86.8%) | 1,117 (80.2%) |
| 12 to 14 Years | 786 (84.5%) | 753 (84.5%) |
| 15 Years | 321 (66.9%) | 264 (88.9%) |
| 16 and 17 Years | 359 (92.8%) | 317 (89.3%) |
| 18 to 24 Years | 1,559 (91.0%) | 1,474 (82.0%) |
| 25 to 34 Years | 2,884 (91.3%) | 2,554 (86.8%) |
| 35 to 44 Years | 2,347 (93.8%) | 2,417 (90.5%) |
| 45 to 54 Years | 2,053 (92.9%) | 1,916 (88.8%) |
| 55 to 64 Years | 1,743 (93.4%) | 1,723 (86.7%) |
| 65 to 74 Years | 900 (85.7%) | 1,241 (90.5%) |
| 75 Years and over | 457 (95.8%) | 878 (90.6%) |
| Total | 15,672 (90.6%) | 16,352 (87.2%) |
Income Below Poverty Among Married-Couple Families in Georgetown
The poverty statistics for married-couple families in Georgetown show that 4.8% or 340 of the total 7,110 families live below the poverty line. Families with 5 or more children have the highest poverty rate of 23.4%, comprising of 11 families. On the other hand, families with no children have the lowest poverty rate of 3.0%, which includes 106 families.
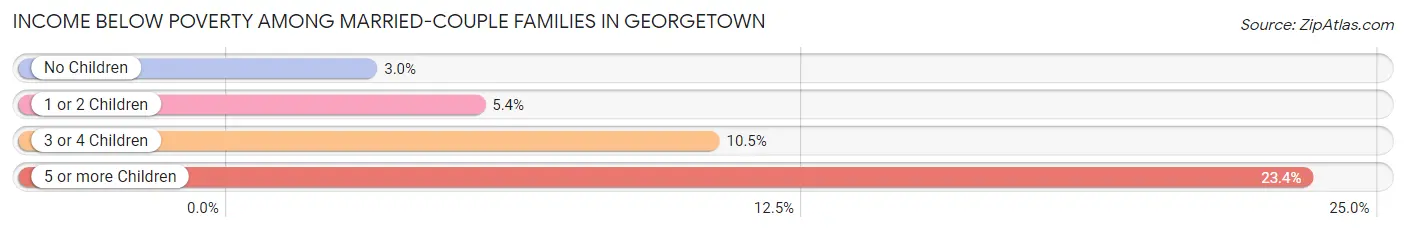
| Children | Above Poverty | Below Poverty |
| No Children | 3,398 (97.0%) | 106 (3.0%) |
| 1 or 2 Children | 2,781 (94.6%) | 158 (5.4%) |
| 3 or 4 Children | 555 (89.5%) | 65 (10.5%) |
| 5 or more Children | 36 (76.6%) | 11 (23.4%) |
| Total | 6,770 (95.2%) | 340 (4.8%) |
Income Below Poverty Among Single-Parent Households in Georgetown
According to the poverty data in Georgetown, 6.3% or 48 single-father households and 20.8% or 403 single-mother households are living below the poverty line. Among single-father households, those with 1 or 2 children have the highest poverty rate, with 39 households (10.9%) experiencing poverty. Likewise, among single-mother households, those with 3 or 4 children have the highest poverty rate, with 95 households (65.5%) falling below the poverty line.
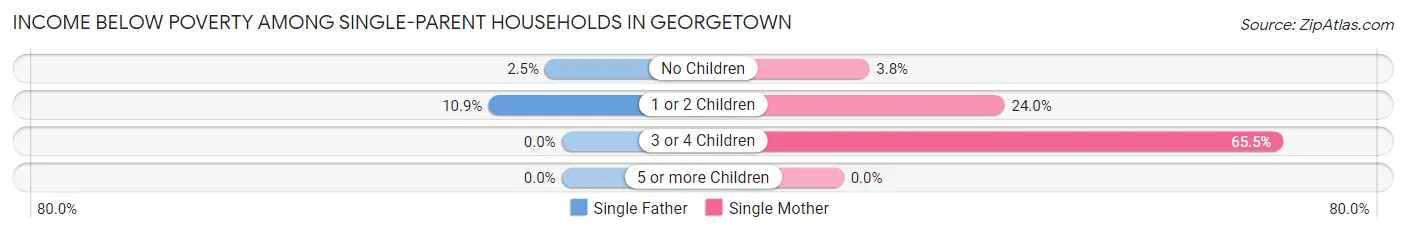
| Children | Single Father | Single Mother |
| No Children | 9 (2.5%) | 23 (3.8%) |
| 1 or 2 Children | 39 (10.9%) | 285 (24.0%) |
| 3 or 4 Children | 0 (0.0%) | 95 (65.5%) |
| 5 or more Children | 0 (0.0%) | 0 (0.0%) |
| Total | 48 (6.3%) | 403 (20.8%) |
Income Below Poverty Among Married-Couple vs Single-Parent Households in Georgetown
The poverty data for Georgetown shows that 340 of the married-couple family households (4.8%) and 451 of the single-parent households (16.7%) are living below the poverty level. Within the married-couple family households, those with 5 or more children have the highest poverty rate, with 11 households (23.4%) falling below the poverty line. Among the single-parent households, those with 3 or 4 children have the highest poverty rate, with 95 household (50.3%) living below poverty.
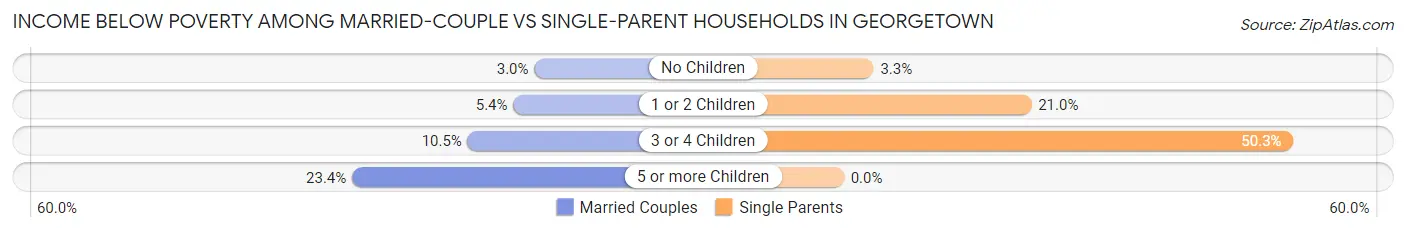
| Children | Married-Couple Families | Single-Parent Households |
| No Children | 106 (3.0%) | 32 (3.3%) |
| 1 or 2 Children | 158 (5.4%) | 324 (21.0%) |
| 3 or 4 Children | 65 (10.5%) | 95 (50.3%) |
| 5 or more Children | 11 (23.4%) | 0 (0.0%) |
| Total | 340 (4.8%) | 451 (16.7%) |
Race in Georgetown
The most populous races in Georgetown are White / Caucasian (31,857 | 84.9%), Black / African American (2,218 | 5.9%), and Two or more Races (2,067 | 5.5%).
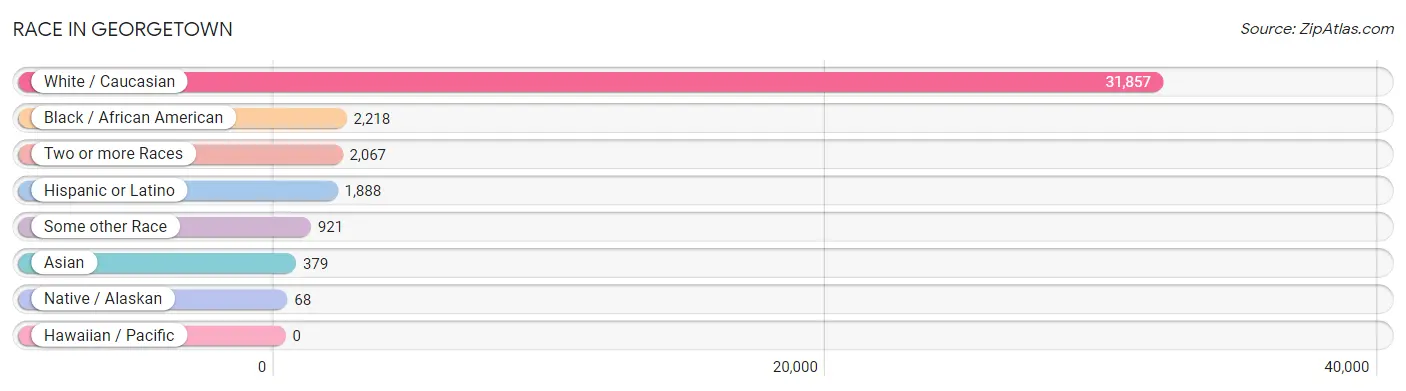
| Race | # Population | % Population |
| Asian | 379 | 1.0% |
| Black / African American | 2,218 | 5.9% |
| Hawaiian / Pacific | 0 | 0.0% |
| Hispanic or Latino | 1,888 | 5.0% |
| Native / Alaskan | 68 | 0.2% |
| White / Caucasian | 31,857 | 84.9% |
| Two or more Races | 2,067 | 5.5% |
| Some other Race | 921 | 2.5% |
| Total | 37,510 | 100.0% |
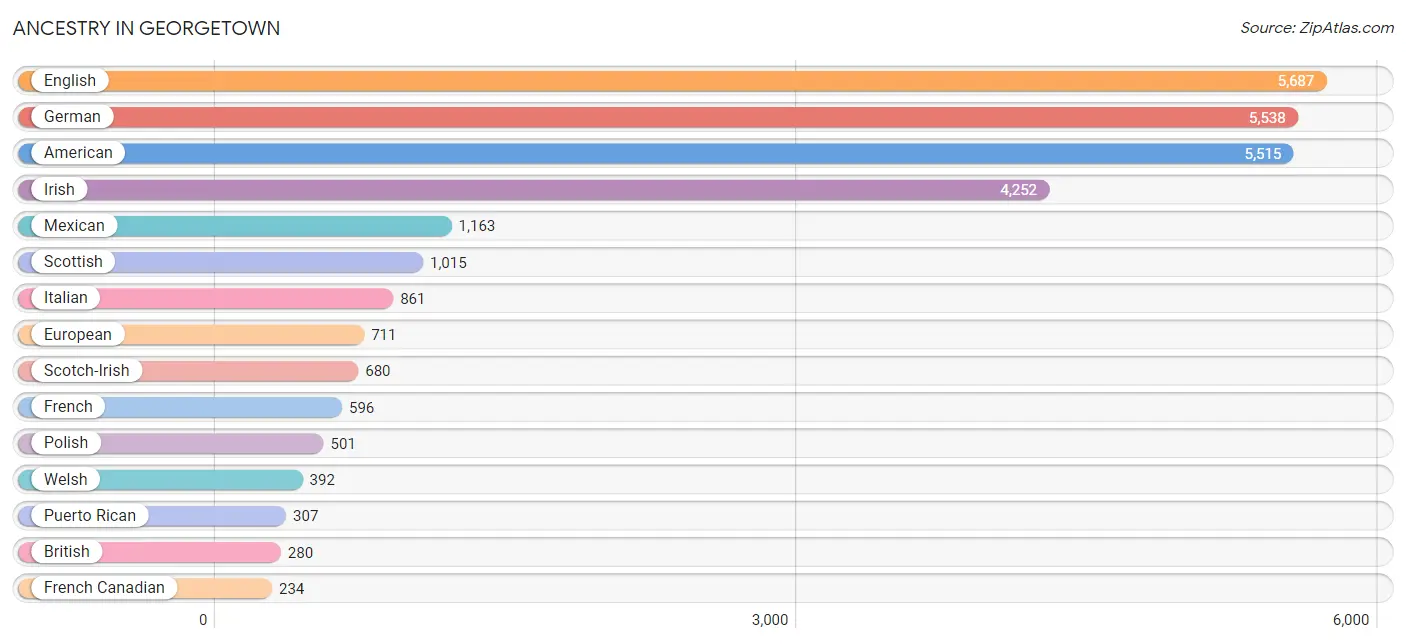
Ancestry in Georgetown
The most populous ancestries reported in Georgetown are English (5,687 | 15.2%), German (5,538 | 14.8%), American (5,515 | 14.7%), Irish (4,252 | 11.3%), and Mexican (1,163 | 3.1%), together accounting for 59.1% of all Georgetown residents.
| Ancestry | # Population | % Population |
| Afghan | 33 | 0.1% |
| African | 30 | 0.1% |
| American | 5,515 | 14.7% |
| Apache | 27 | 0.1% |
| Arab | 48 | 0.1% |
| Argentinean | 32 | 0.1% |
| Australian | 18 | 0.1% |
| Bhutanese | 76 | 0.2% |
| Bolivian | 9 | 0.0% |
| Brazilian | 4 | 0.0% |
| British | 280 | 0.7% |
| Burmese | 87 | 0.2% |
| Canadian | 71 | 0.2% |
| Central American | 97 | 0.3% |
| Cherokee | 179 | 0.5% |
| Chilean | 9 | 0.0% |
| Chippewa | 15 | 0.0% |
| Choctaw | 30 | 0.1% |
| Colombian | 22 | 0.1% |
| Croatian | 11 | 0.0% |
| Cuban | 150 | 0.4% |
| Czech | 96 | 0.3% |
| Czechoslovakian | 44 | 0.1% |
| Danish | 157 | 0.4% |
| Dutch | 232 | 0.6% |
| Eastern European | 29 | 0.1% |
| English | 5,687 | 15.2% |
| European | 711 | 1.9% |
| Finnish | 11 | 0.0% |
| French | 596 | 1.6% |
| French American Indian | 12 | 0.0% |
| French Canadian | 234 | 0.6% |
| German | 5,538 | 14.8% |
| Greek | 15 | 0.0% |
| Guatemalan | 10 | 0.0% |
| Honduran | 50 | 0.1% |
| Hungarian | 48 | 0.1% |
| Icelander | 7 | 0.0% |
| Indian (Asian) | 112 | 0.3% |
| Iraqi | 10 | 0.0% |
| Irish | 4,252 | 11.3% |
| Italian | 861 | 2.3% |
| Korean | 204 | 0.5% |
| Lebanese | 38 | 0.1% |
| Lumbee | 21 | 0.1% |
| Malaysian | 23 | 0.1% |
| Mexican | 1,163 | 3.1% |
| Native Hawaiian | 10 | 0.0% |
| Navajo | 11 | 0.0% |
| Nigerian | 17 | 0.1% |
| Northern European | 12 | 0.0% |
| Norwegian | 185 | 0.5% |
| Polish | 501 | 1.3% |
| Portuguese | 35 | 0.1% |
| Puerto Rican | 307 | 0.8% |
| Russian | 55 | 0.2% |
| Salvadoran | 37 | 0.1% |
| Scandinavian | 157 | 0.4% |
| Scotch-Irish | 680 | 1.8% |
| Scottish | 1,015 | 2.7% |
| Sioux | 12 | 0.0% |
| Slovak | 49 | 0.1% |
| South American | 72 | 0.2% |
| Spaniard | 45 | 0.1% |
| Sri Lankan | 44 | 0.1% |
| Subsaharan African | 47 | 0.1% |
| Swedish | 176 | 0.5% |
| Swiss | 29 | 0.1% |
| Thai | 43 | 0.1% |
| Ukrainian | 5 | 0.0% |
| Welsh | 392 | 1.1% | View All 71 Rows |
Immigrants in Georgetown
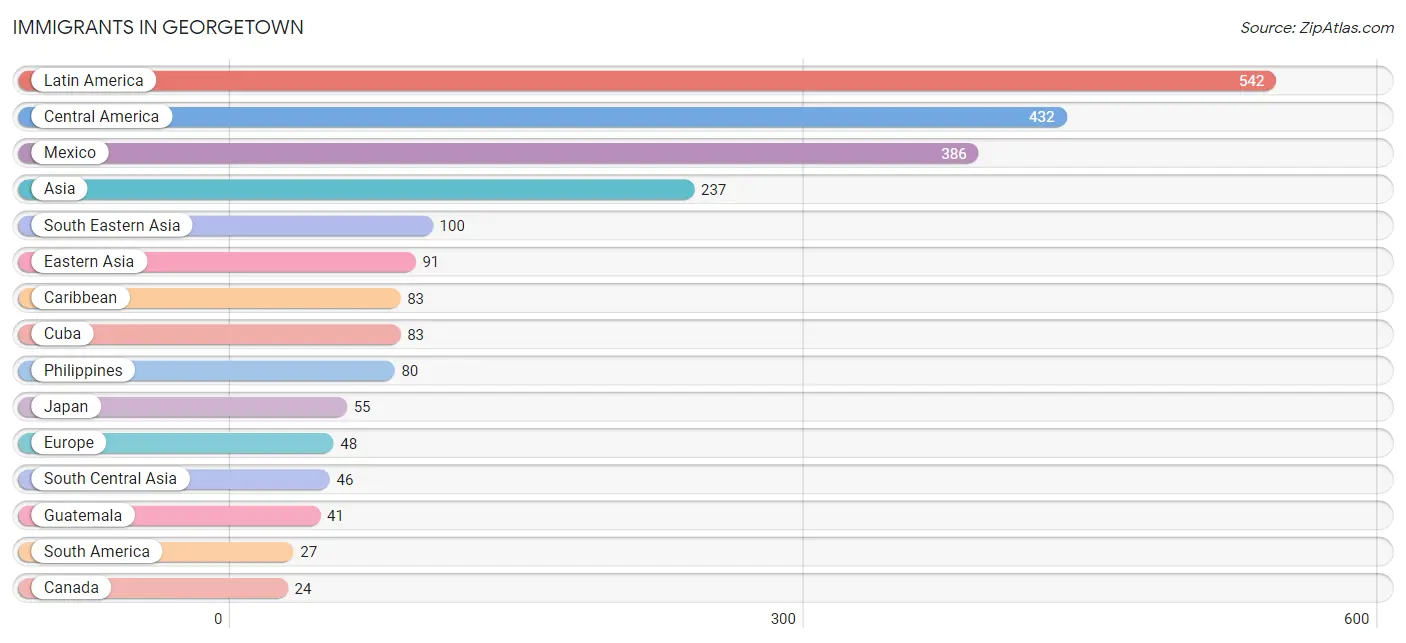
The most numerous immigrant groups reported in Georgetown came from Latin America (542 | 1.4%), Central America (432 | 1.1%), Mexico (386 | 1.0%), Asia (237 | 0.6%), and South Eastern Asia (100 | 0.3%), together accounting for 4.5% of all Georgetown residents.
| Immigration Origin | # Population | % Population |
| Afghanistan | 22 | 0.1% |
| Africa | 17 | 0.1% |
| Argentina | 14 | 0.0% |
| Asia | 237 | 0.6% |
| Australia | 18 | 0.1% |
| Brazil | 4 | 0.0% |
| Canada | 24 | 0.1% |
| Caribbean | 83 | 0.2% |
| Central America | 432 | 1.1% |
| Chile | 9 | 0.0% |
| China | 21 | 0.1% |
| Cuba | 83 | 0.2% |
| Czechoslovakia | 15 | 0.0% |
| Eastern Africa | 17 | 0.1% |
| Eastern Asia | 91 | 0.2% |
| Eastern Europe | 15 | 0.0% |
| El Salvador | 5 | 0.0% |
| Europe | 48 | 0.1% |
| France | 5 | 0.0% |
| Germany | 17 | 0.1% |
| Guatemala | 41 | 0.1% |
| India | 17 | 0.1% |
| Japan | 55 | 0.2% |
| Kenya | 17 | 0.1% |
| Korea | 15 | 0.0% |
| Latin America | 542 | 1.4% |
| Mexico | 386 | 1.0% |
| Nepal | 7 | 0.0% |
| Northern Europe | 11 | 0.0% |
| Oceania | 18 | 0.1% |
| Philippines | 80 | 0.2% |
| South America | 27 | 0.1% |
| South Central Asia | 46 | 0.1% |
| South Eastern Asia | 100 | 0.3% |
| Vietnam | 20 | 0.1% |
| Western Europe | 22 | 0.1% | View All 36 Rows |
Sex and Age in Georgetown
Sex and Age in Georgetown
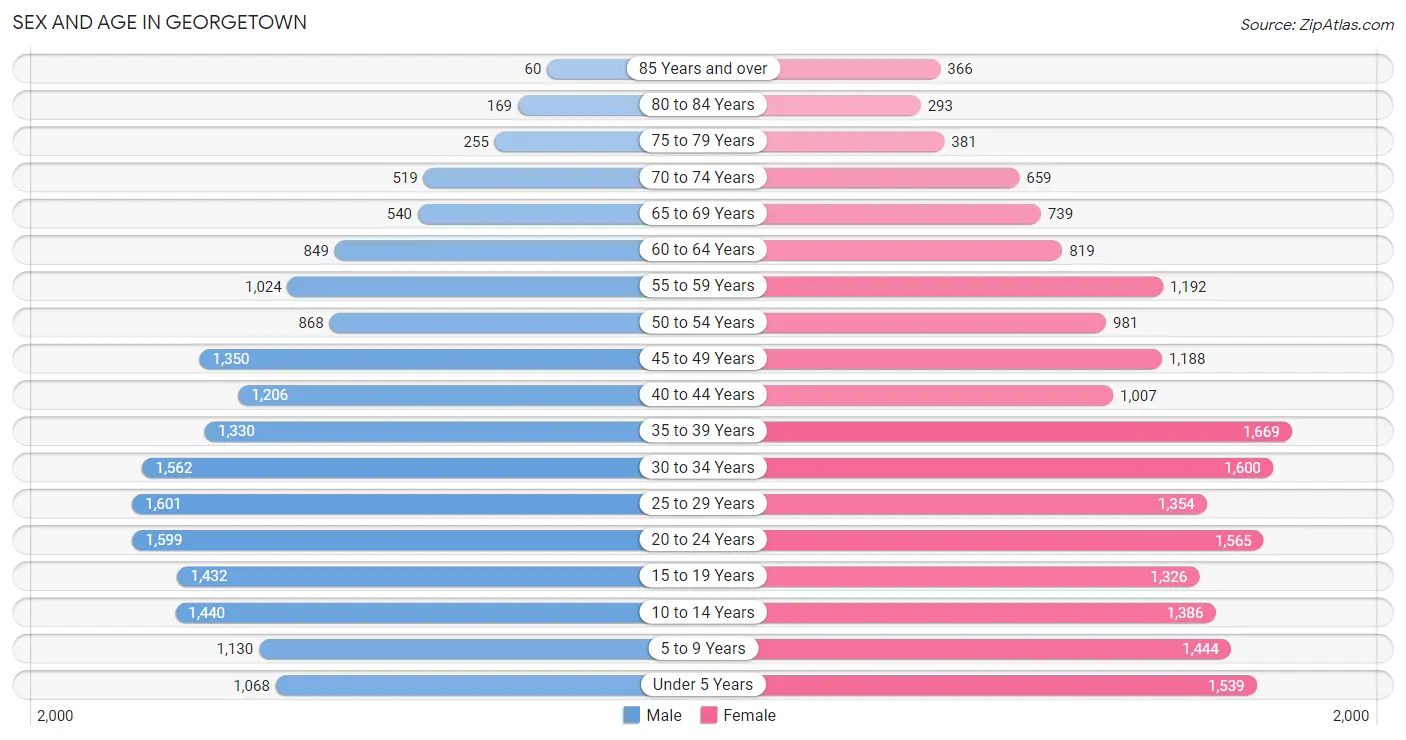
The most populous age groups in Georgetown are 25 to 29 Years (1,601 | 8.9%) for men and 35 to 39 Years (1,669 | 8.6%) for women.
| Age Bracket | Male | Female |
| Under 5 Years | 1,068 (5.9%) | 1,539 (7.9%) |
| 5 to 9 Years | 1,130 (6.3%) | 1,444 (7.4%) |
| 10 to 14 Years | 1,440 (8.0%) | 1,386 (7.1%) |
| 15 to 19 Years | 1,432 (8.0%) | 1,326 (6.8%) |
| 20 to 24 Years | 1,599 (8.9%) | 1,565 (8.0%) |
| 25 to 29 Years | 1,601 (8.9%) | 1,354 (6.9%) |
| 30 to 34 Years | 1,562 (8.7%) | 1,600 (8.2%) |
| 35 to 39 Years | 1,330 (7.4%) | 1,669 (8.6%) |
| 40 to 44 Years | 1,206 (6.7%) | 1,007 (5.2%) |
| 45 to 49 Years | 1,350 (7.5%) | 1,188 (6.1%) |
| 50 to 54 Years | 868 (4.8%) | 981 (5.0%) |
| 55 to 59 Years | 1,024 (5.7%) | 1,192 (6.1%) |
| 60 to 64 Years | 849 (4.7%) | 819 (4.2%) |
| 65 to 69 Years | 540 (3.0%) | 739 (3.8%) |
| 70 to 74 Years | 519 (2.9%) | 659 (3.4%) |
| 75 to 79 Years | 255 (1.4%) | 381 (1.9%) |
| 80 to 84 Years | 169 (0.9%) | 293 (1.5%) |
| 85 Years and over | 60 (0.3%) | 366 (1.9%) |
| Total | 18,002 (100.0%) | 19,508 (100.0%) |
Families and Households in Georgetown
Median Family Size in Georgetown
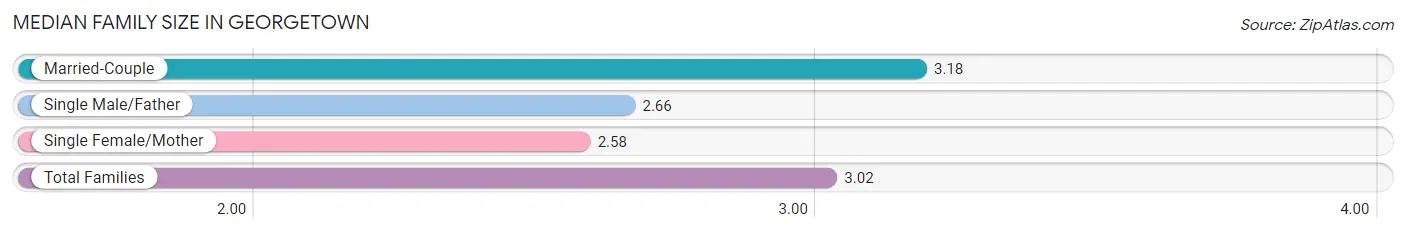
The median family size in Georgetown is 3.02 persons per family, with married-couple families (7,110 | 72.5%) accounting for the largest median family size of 3.18 persons per family. On the other hand, single female/mother families (1,935 | 19.7%) represent the smallest median family size with 2.58 persons per family.
| Family Type | # Families | Family Size |
| Married-Couple | 7,110 (72.5%) | 3.18 |
| Single Male/Father | 762 (7.8%) | 2.66 |
| Single Female/Mother | 1,935 (19.7%) | 2.58 |
| Total Families | 9,807 (100.0%) | 3.02 |
Median Household Size in Georgetown
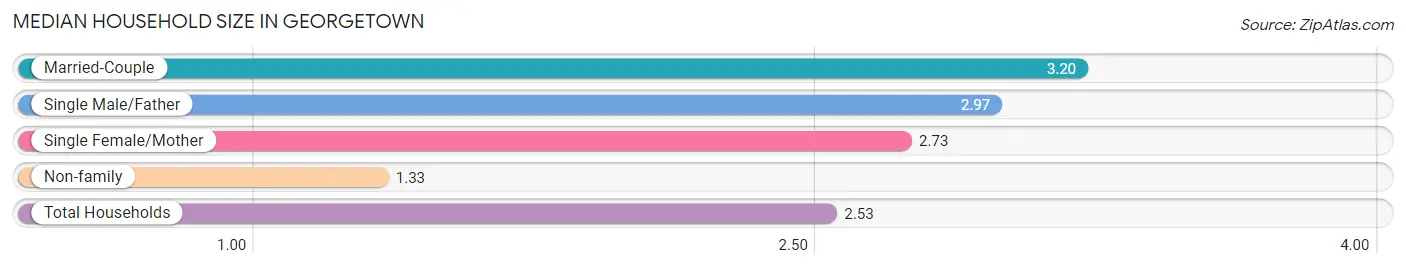
The median household size in Georgetown is 2.53 persons per household, with married-couple households (7,110 | 49.4%) accounting for the largest median household size of 3.2 persons per household. non-family households (4,581 | 31.8%) represent the smallest median household size with 1.33 persons per household.
| Household Type | # Households | Household Size |
| Married-Couple | 7,110 (49.4%) | 3.20 |
| Single Male/Father | 762 (5.3%) | 2.97 |
| Single Female/Mother | 1,935 (13.5%) | 2.73 |
| Non-family | 4,581 (31.8%) | 1.33 |
| Total Households | 14,388 (100.0%) | 2.53 |
Household Size by Marriage Status in Georgetown
Out of a total of 14,388 households in Georgetown, 9,807 (68.2%) are family households, while 4,581 (31.8%) are nonfamily households. The most numerous type of family households are 2-person households, comprising 3,973, and the most common type of nonfamily households are 1-person households, comprising 3,579.
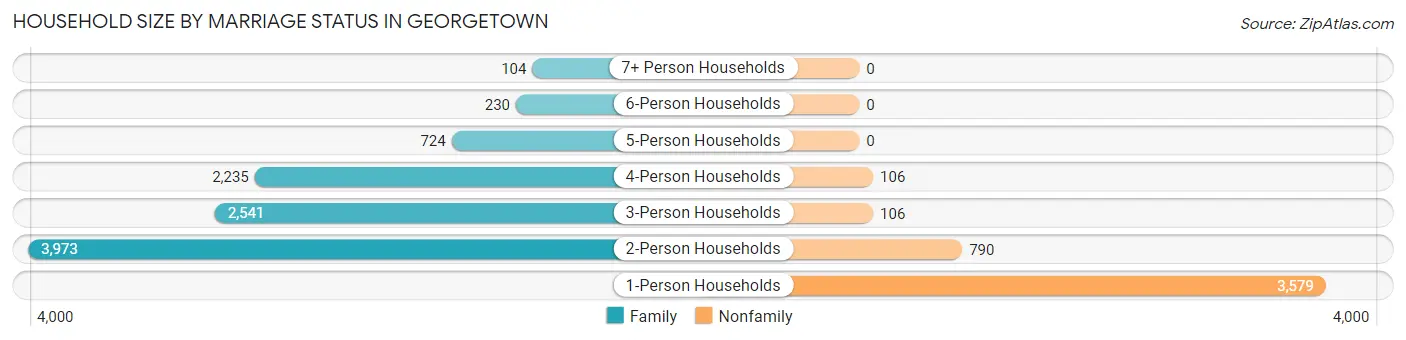
| Household Size | Family Households | Nonfamily Households |
| 1-Person Households | - | 3,579 (24.9%) |
| 2-Person Households | 3,973 (27.6%) | 790 (5.5%) |
| 3-Person Households | 2,541 (17.7%) | 106 (0.7%) |
| 4-Person Households | 2,235 (15.5%) | 106 (0.7%) |
| 5-Person Households | 724 (5.0%) | 0 (0.0%) |
| 6-Person Households | 230 (1.6%) | 0 (0.0%) |
| 7+ Person Households | 104 (0.7%) | 0 (0.0%) |
| Total | 9,807 (68.2%) | 4,581 (31.8%) |
Female Fertility in Georgetown
Fertility by Age in Georgetown
Average fertility rate in Georgetown is 51.0 births per 1,000 women. Women in the age bracket of 20 to 34 years have the highest fertility rate with 87.0 births per 1,000 women. Women in the age bracket of 20 to 34 years acount for 77.7% of all women with births.
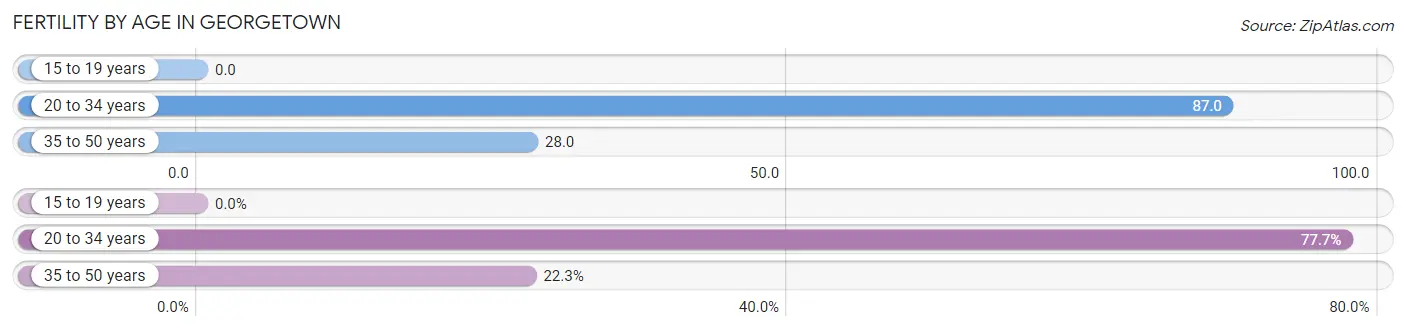
| Age Bracket | Women with Births | Births / 1,000 Women |
| 15 to 19 years | 0 (0.0%) | 0.0 |
| 20 to 34 years | 394 (77.7%) | 87.0 |
| 35 to 50 years | 113 (22.3%) | 28.0 |
| Total | 507 (100.0%) | 51.0 |
Fertility by Age by Marriage Status in Georgetown
75.0% of women with births (507) in Georgetown are married. The highest percentage of unmarried women with births falls into 20 to 34 years age bracket with 30.5% of them unmarried at the time of birth, while the lowest percentage of unmarried women with births belong to 35 to 50 years age bracket with 6.2% of them unmarried.
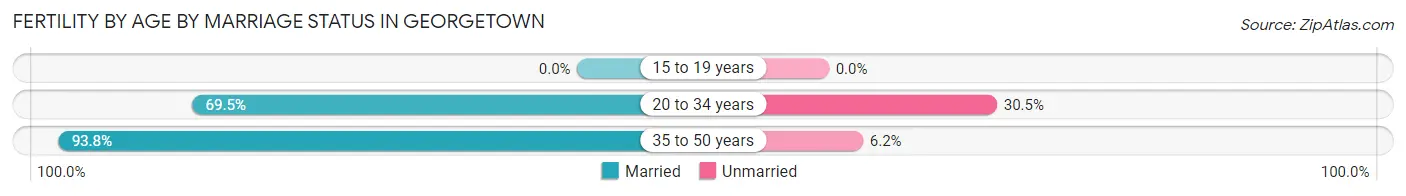
| Age Bracket | Married | Unmarried |
| 15 to 19 years | 0 (0.0%) | 0 (0.0%) |
| 20 to 34 years | 274 (69.5%) | 120 (30.5%) |
| 35 to 50 years | 106 (93.8%) | 7 (6.2%) |
| Total | 380 (75.0%) | 127 (25.1%) |
Fertility by Education in Georgetown
Average fertility rate in Georgetown is 51.0 births per 1,000 women. Women with the education attainment of graduate degree have the highest fertility rate of 85.0 births per 1,000 women, while women with the education attainment of college or associate's degree have the lowest fertility at 38.0 births per 1,000 women. Women with the education attainment of college or associate's degree represent 29.2% of all women with births.
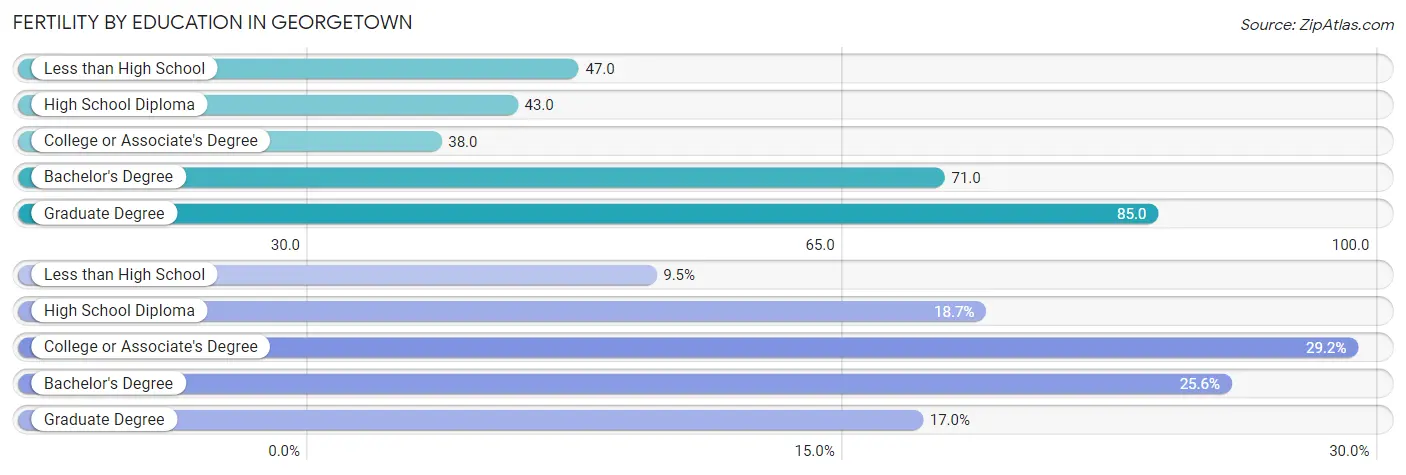
| Educational Attainment | Women with Births | Births / 1,000 Women |
| Less than High School | 48 (9.5%) | 47.0 |
| High School Diploma | 95 (18.7%) | 43.0 |
| College or Associate's Degree | 148 (29.2%) | 38.0 |
| Bachelor's Degree | 130 (25.6%) | 71.0 |
| Graduate Degree | 86 (17.0%) | 85.0 |
| Total | 507 (100.0%) | 51.0 |
Fertility by Education by Marriage Status in Georgetown
25.1% of women with births in Georgetown are unmarried. Women with the educational attainment of graduate degree are most likely to be married with 100.0% of them married at childbirth, while women with the educational attainment of less than high school are least likely to be married with 100.0% of them unmarried at childbirth.
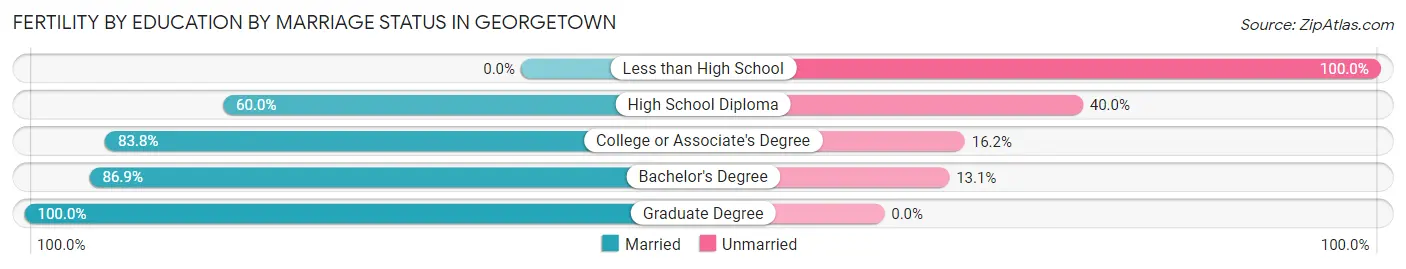
| Educational Attainment | Married | Unmarried |
| Less than High School | 0 (0.0%) | 48 (100.0%) |
| High School Diploma | 57 (60.0%) | 38 (40.0%) |
| College or Associate's Degree | 124 (83.8%) | 24 (16.2%) |
| Bachelor's Degree | 113 (86.9%) | 17 (13.1%) |
| Graduate Degree | 86 (100.0%) | 0 (0.0%) |
| Total | 380 (75.0%) | 127 (25.1%) |
Employment Characteristics in Georgetown
Employment by Class of Employer in Georgetown
Among the 19,069 employed individuals in Georgetown, private company employees (14,132 | 74.1%), state government employees (1,196 | 6.3%), and local government employees (1,141 | 6.0%) make up the most common classes of employment.
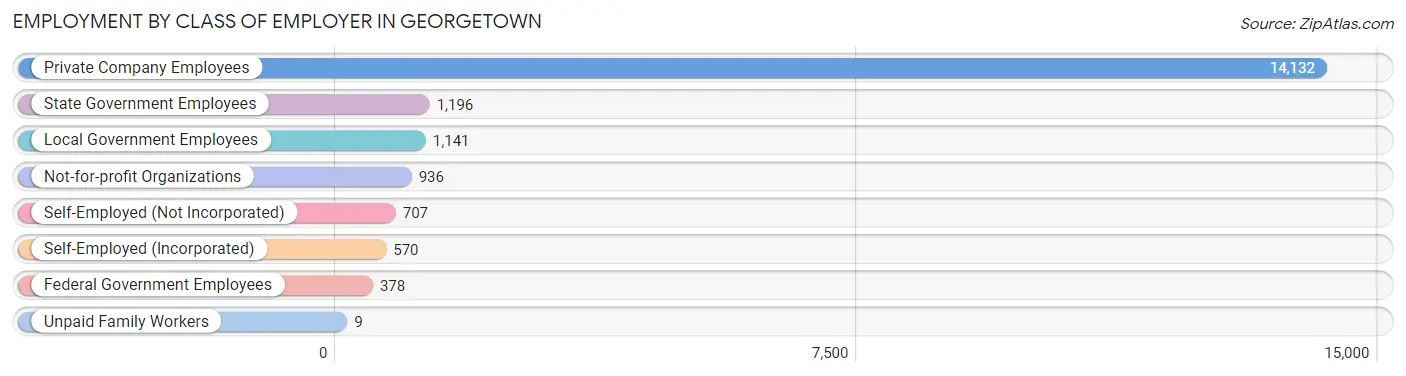
| Employer Class | # Employees | % Employees |
| Private Company Employees | 14,132 | 74.1% |
| Self-Employed (Incorporated) | 570 | 3.0% |
| Self-Employed (Not Incorporated) | 707 | 3.7% |
| Not-for-profit Organizations | 936 | 4.9% |
| Local Government Employees | 1,141 | 6.0% |
| State Government Employees | 1,196 | 6.3% |
| Federal Government Employees | 378 | 2.0% |
| Unpaid Family Workers | 9 | 0.1% |
| Total | 19,069 | 100.0% |
Employment Status by Age in Georgetown
According to the labor force statistics for Georgetown, out of the total population over 16 years of age (28,726), 70.1% or 20,137 individuals are in the labor force, with 3.6% or 725 of them unemployed. The age group with the highest labor force participation rate is 30 to 34 years, with 89.8% or 2,839 individuals in the labor force. Within the labor force, the 16 to 19 years age range has the highest percentage of unemployed individuals, with 8.0% or 69 of them being unemployed.
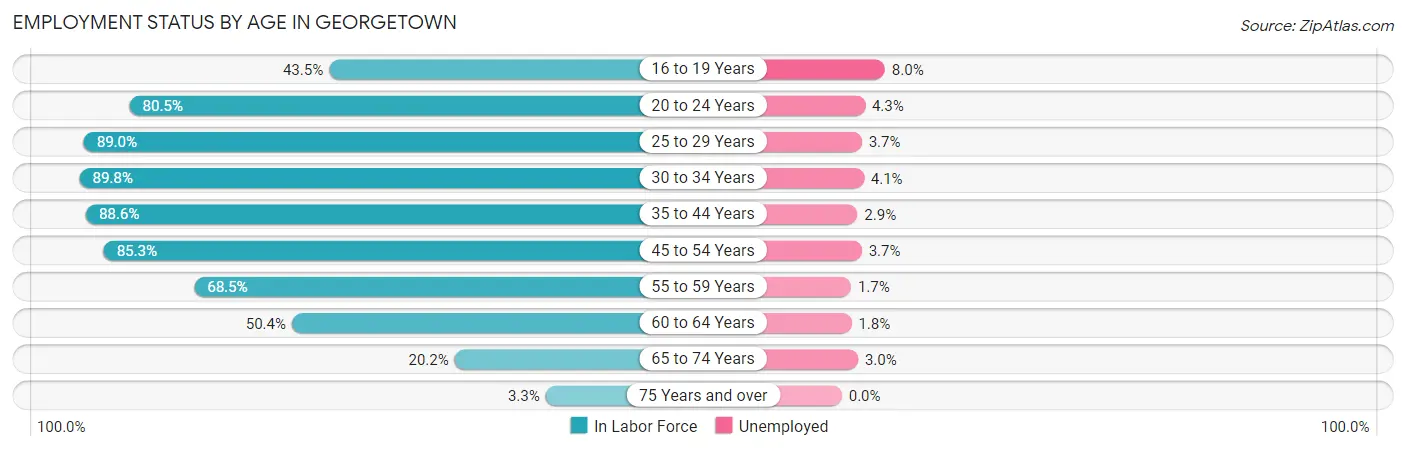
| Age Bracket | In Labor Force | Unemployed |
| 16 to 19 Years | 862 (43.5%) | 69 (8.0%) |
| 20 to 24 Years | 2,547 (80.5%) | 110 (4.3%) |
| 25 to 29 Years | 2,630 (89.0%) | 97 (3.7%) |
| 30 to 34 Years | 2,839 (89.8%) | 116 (4.1%) |
| 35 to 44 Years | 4,618 (88.6%) | 134 (2.9%) |
| 45 to 54 Years | 3,742 (85.3%) | 138 (3.7%) |
| 55 to 59 Years | 1,518 (68.5%) | 26 (1.7%) |
| 60 to 64 Years | 841 (50.4%) | 15 (1.8%) |
| 65 to 74 Years | 496 (20.2%) | 15 (3.0%) |
| 75 Years and over | 50 (3.3%) | 0 (0.0%) |
| Total | 20,137 (70.1%) | 725 (3.6%) |
Employment Status by Educational Attainment in Georgetown
According to labor force statistics for Georgetown, 82.6% of individuals (16,190) out of the total population between 25 and 64 years of age (19,600) are in the labor force, with 3.2% or 518 of them being unemployed. The group with the highest labor force participation rate are those with the educational attainment of bachelor's degree or higher, with 87.7% or 5,432 individuals in the labor force. Within the labor force, individuals with high school diploma education have the highest percentage of unemployment, with 5.5% or 221 of them being unemployed.
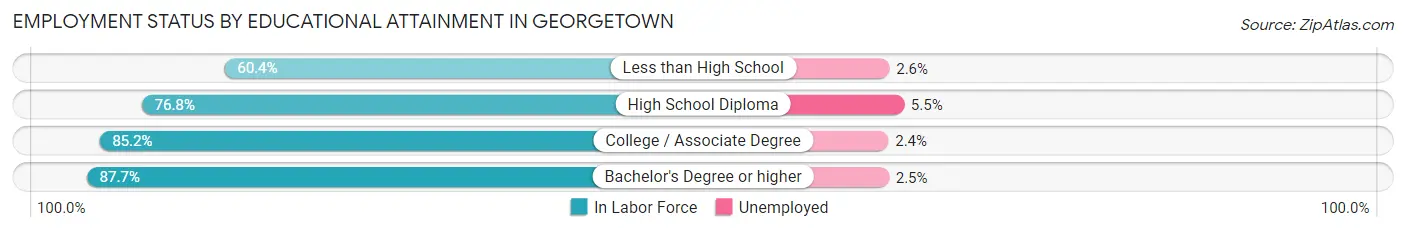
| Educational Attainment | In Labor Force | Unemployed |
| Less than High School | 548 (60.4%) | 24 (2.6%) |
| High School Diploma | 4,018 (76.8%) | 288 (5.5%) |
| College / Associate Degree | 6,191 (85.2%) | 174 (2.4%) |
| Bachelor's Degree or higher | 5,432 (87.7%) | 155 (2.5%) |
| Total | 16,190 (82.6%) | 627 (3.2%) |
Employment Occupations by Sex in Georgetown
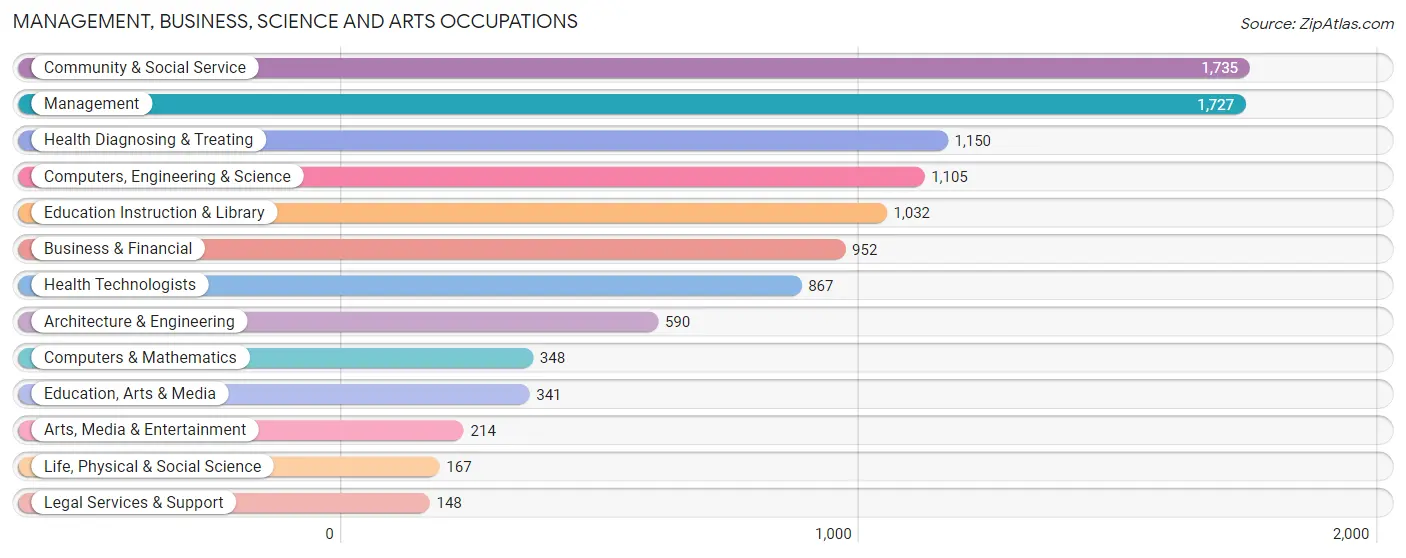
Management, Business, Science and Arts Occupations
The most common Management, Business, Science and Arts occupations in Georgetown are Community & Social Service (1,735 | 8.9%), Management (1,727 | 8.9%), Health Diagnosing & Treating (1,150 | 5.9%), Computers, Engineering & Science (1,105 | 5.7%), and Education Instruction & Library (1,032 | 5.3%).
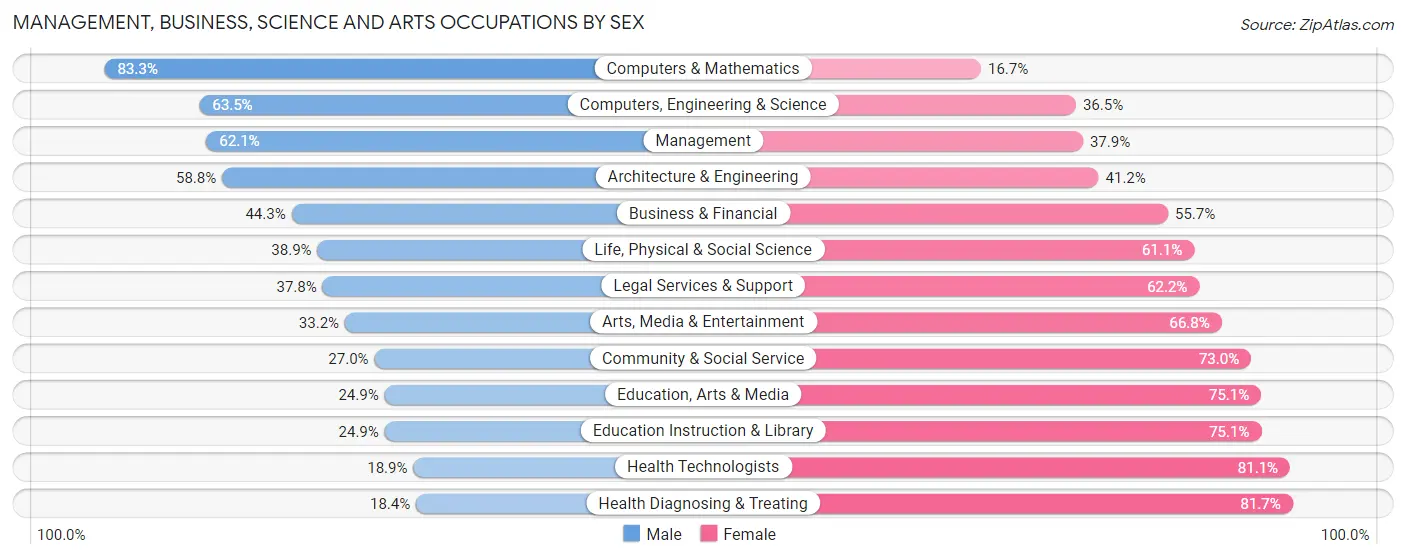
Management, Business, Science and Arts Occupations by Sex
Within the Management, Business, Science and Arts occupations in Georgetown, the most male-oriented occupations are Computers & Mathematics (83.3%), Computers, Engineering & Science (63.5%), and Management (62.1%), while the most female-oriented occupations are Health Diagnosing & Treating (81.7%), Health Technologists (81.1%), and Education Instruction & Library (75.1%).
| Occupation | Male | Female |
| Management | 1,072 (62.1%) | 655 (37.9%) |
| Business & Financial | 422 (44.3%) | 530 (55.7%) |
| Computers, Engineering & Science | 702 (63.5%) | 403 (36.5%) |
| Computers & Mathematics | 290 (83.3%) | 58 (16.7%) |
| Architecture & Engineering | 347 (58.8%) | 243 (41.2%) |
| Life, Physical & Social Science | 65 (38.9%) | 102 (61.1%) |
| Community & Social Service | 469 (27.0%) | 1,266 (73.0%) |
| Education, Arts & Media | 85 (24.9%) | 256 (75.1%) |
| Legal Services & Support | 56 (37.8%) | 92 (62.2%) |
| Education Instruction & Library | 257 (24.9%) | 775 (75.1%) |
| Arts, Media & Entertainment | 71 (33.2%) | 143 (66.8%) |
| Health Diagnosing & Treating | 211 (18.3%) | 939 (81.7%) |
| Health Technologists | 164 (18.9%) | 703 (81.1%) |
| Total (Category) | 2,876 (43.1%) | 3,793 (56.9%) |
| Total (Overall) | 10,136 (52.2%) | 9,288 (47.8%) |
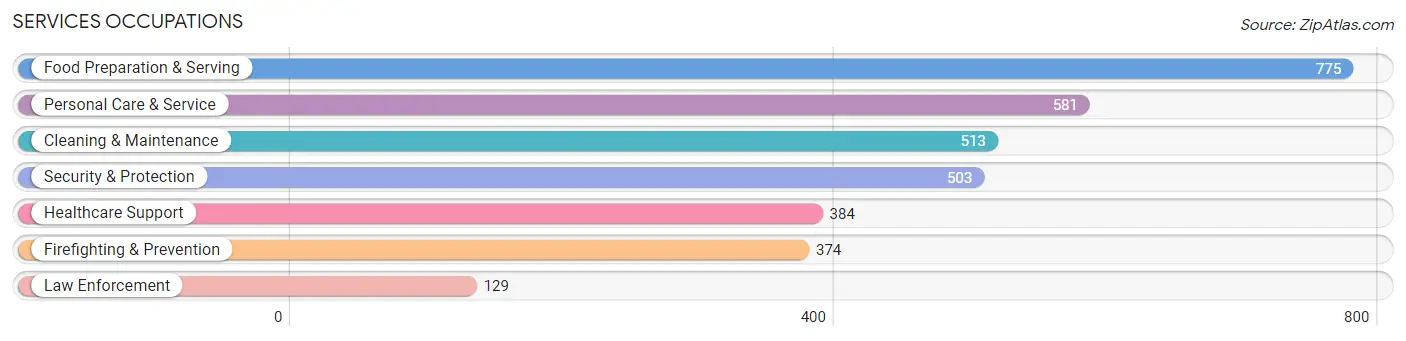
Services Occupations
The most common Services occupations in Georgetown are Food Preparation & Serving (775 | 4.0%), Personal Care & Service (581 | 3.0%), Cleaning & Maintenance (513 | 2.6%), Security & Protection (503 | 2.6%), and Healthcare Support (384 | 2.0%).
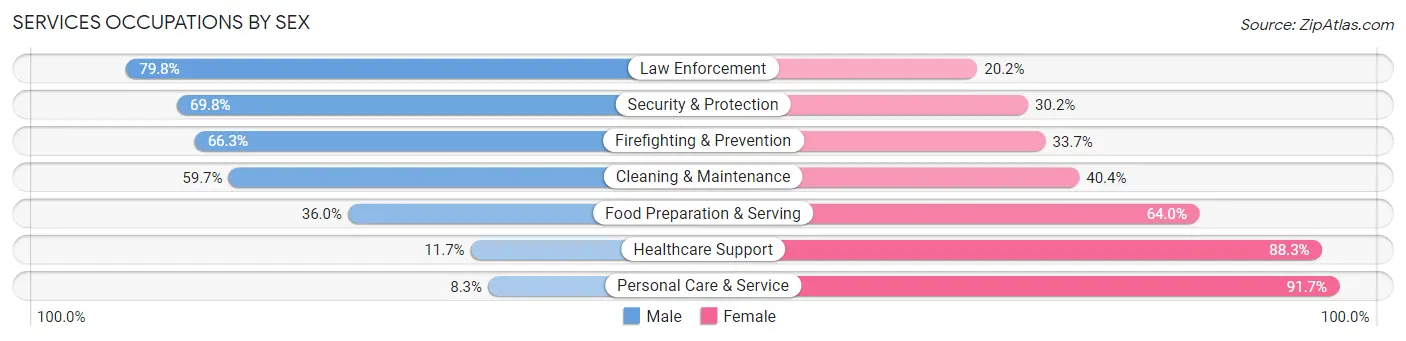
Services Occupations by Sex
Within the Services occupations in Georgetown, the most male-oriented occupations are Law Enforcement (79.8%), Security & Protection (69.8%), and Firefighting & Prevention (66.3%), while the most female-oriented occupations are Personal Care & Service (91.7%), Healthcare Support (88.3%), and Food Preparation & Serving (64.0%).
| Occupation | Male | Female |
| Healthcare Support | 45 (11.7%) | 339 (88.3%) |
| Security & Protection | 351 (69.8%) | 152 (30.2%) |
| Firefighting & Prevention | 248 (66.3%) | 126 (33.7%) |
| Law Enforcement | 103 (79.8%) | 26 (20.2%) |
| Food Preparation & Serving | 279 (36.0%) | 496 (64.0%) |
| Cleaning & Maintenance | 306 (59.7%) | 207 (40.4%) |
| Personal Care & Service | 48 (8.3%) | 533 (91.7%) |
| Total (Category) | 1,029 (37.3%) | 1,727 (62.7%) |
| Total (Overall) | 10,136 (52.2%) | 9,288 (47.8%) |
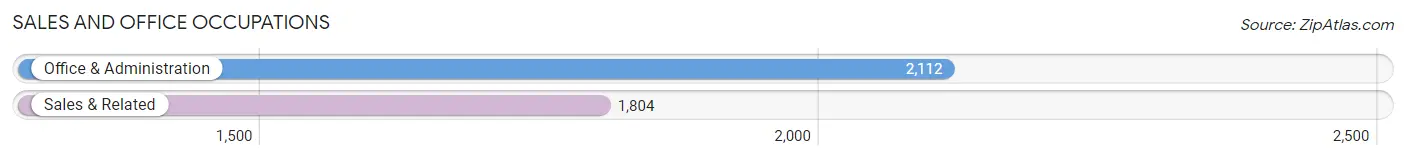
Sales and Office Occupations
The most common Sales and Office occupations in Georgetown are Office & Administration (2,112 | 10.9%), and Sales & Related (1,804 | 9.3%).
Sales and Office Occupations by Sex
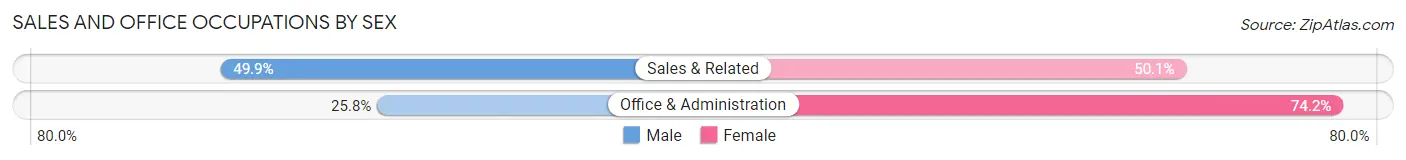
| Occupation | Male | Female |
| Sales & Related | 900 (49.9%) | 904 (50.1%) |
| Office & Administration | 544 (25.8%) | 1,568 (74.2%) |
| Total (Category) | 1,444 (36.9%) | 2,472 (63.1%) |
| Total (Overall) | 10,136 (52.2%) | 9,288 (47.8%) |
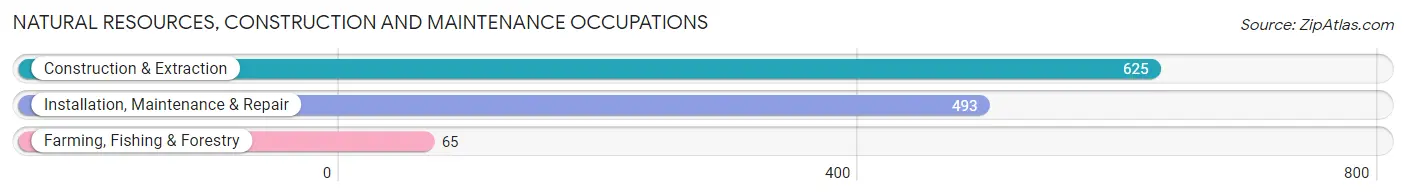
Natural Resources, Construction and Maintenance Occupations
The most common Natural Resources, Construction and Maintenance occupations in Georgetown are Construction & Extraction (625 | 3.2%), Installation, Maintenance & Repair (493 | 2.5%), and Farming, Fishing & Forestry (65 | 0.3%).
Natural Resources, Construction and Maintenance Occupations by Sex
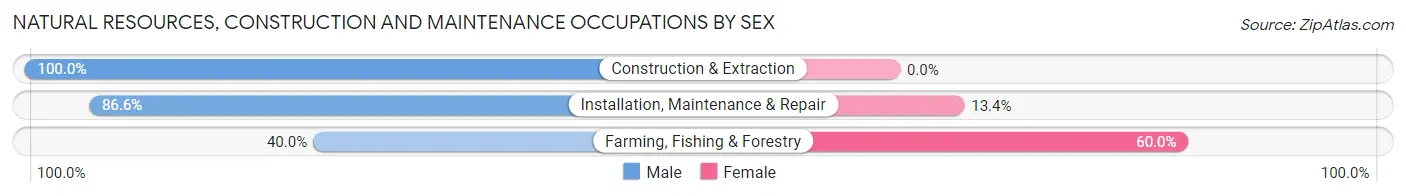
| Occupation | Male | Female |
| Farming, Fishing & Forestry | 26 (40.0%) | 39 (60.0%) |
| Construction & Extraction | 625 (100.0%) | 0 (0.0%) |
| Installation, Maintenance & Repair | 427 (86.6%) | 66 (13.4%) |
| Total (Category) | 1,078 (91.1%) | 105 (8.9%) |
| Total (Overall) | 10,136 (52.2%) | 9,288 (47.8%) |
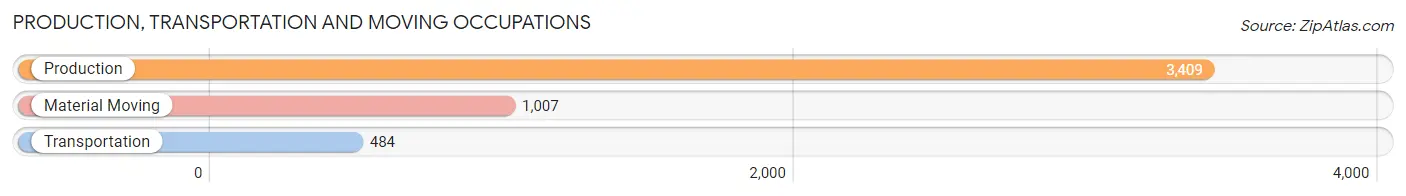
Production, Transportation and Moving Occupations
The most common Production, Transportation and Moving occupations in Georgetown are Production (3,409 | 17.5%), Material Moving (1,007 | 5.2%), and Transportation (484 | 2.5%).
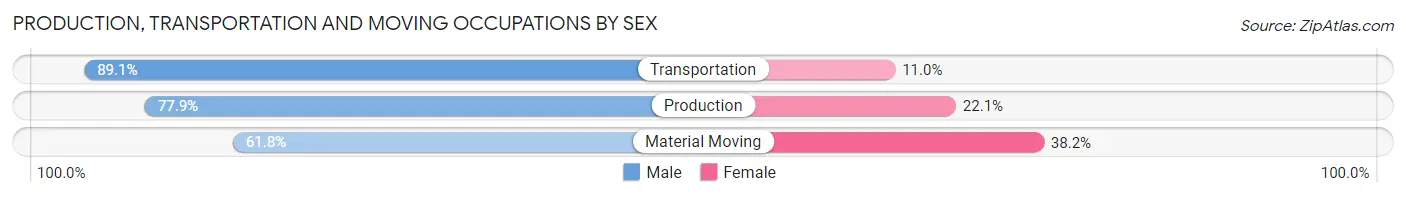
Production, Transportation and Moving Occupations by Sex
| Occupation | Male | Female |
| Production | 2,656 (77.9%) | 753 (22.1%) |
| Transportation | 431 (89.0%) | 53 (11.0%) |
| Material Moving | 622 (61.8%) | 385 (38.2%) |
| Total (Category) | 3,709 (75.7%) | 1,191 (24.3%) |
| Total (Overall) | 10,136 (52.2%) | 9,288 (47.8%) |
Employment Industries by Sex in Georgetown
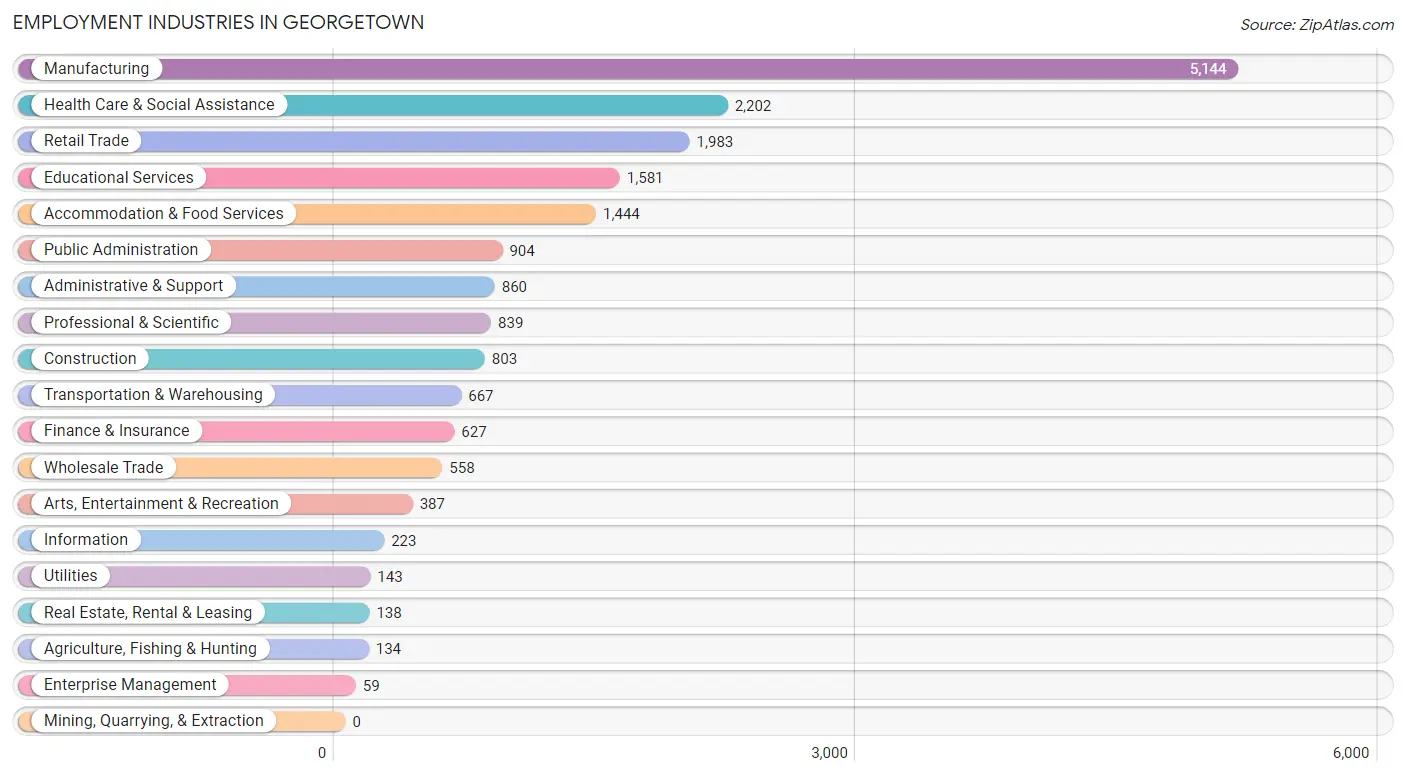
Employment Industries in Georgetown
The major employment industries in Georgetown include Manufacturing (5,144 | 26.5%), Health Care & Social Assistance (2,202 | 11.3%), Retail Trade (1,983 | 10.2%), Educational Services (1,581 | 8.1%), and Accommodation & Food Services (1,444 | 7.4%).
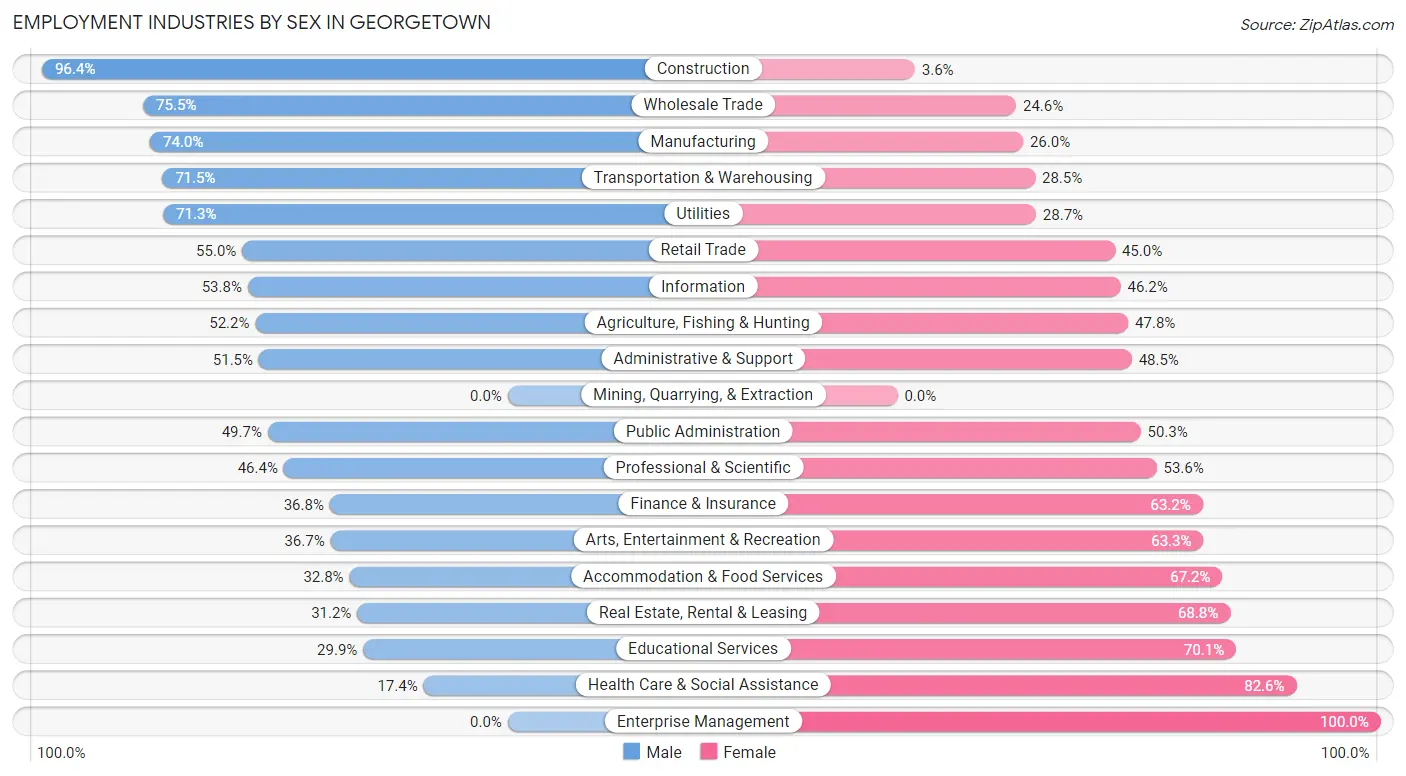
Employment Industries by Sex in Georgetown
The Georgetown industries that see more men than women are Construction (96.4%), Wholesale Trade (75.4%), and Manufacturing (74.0%), whereas the industries that tend to have a higher number of women are Enterprise Management (100.0%), Health Care & Social Assistance (82.6%), and Educational Services (70.1%).
| Industry | Male | Female |
| Agriculture, Fishing & Hunting | 70 (52.2%) | 64 (47.8%) |
| Mining, Quarrying, & Extraction | 0 (0.0%) | 0 (0.0%) |
| Construction | 774 (96.4%) | 29 (3.6%) |
| Manufacturing | 3,807 (74.0%) | 1,337 (26.0%) |
| Wholesale Trade | 421 (75.4%) | 137 (24.5%) |
| Retail Trade | 1,090 (55.0%) | 893 (45.0%) |
| Transportation & Warehousing | 477 (71.5%) | 190 (28.5%) |
| Utilities | 102 (71.3%) | 41 (28.7%) |
| Information | 120 (53.8%) | 103 (46.2%) |
| Finance & Insurance | 231 (36.8%) | 396 (63.2%) |
| Real Estate, Rental & Leasing | 43 (31.2%) | 95 (68.8%) |
| Professional & Scientific | 389 (46.4%) | 450 (53.6%) |
| Enterprise Management | 0 (0.0%) | 59 (100.0%) |
| Administrative & Support | 443 (51.5%) | 417 (48.5%) |
| Educational Services | 473 (29.9%) | 1,108 (70.1%) |
| Health Care & Social Assistance | 384 (17.4%) | 1,818 (82.6%) |
| Arts, Entertainment & Recreation | 142 (36.7%) | 245 (63.3%) |
| Accommodation & Food Services | 473 (32.8%) | 971 (67.2%) |
| Public Administration | 449 (49.7%) | 455 (50.3%) |
| Total | 10,136 (52.2%) | 9,288 (47.8%) |
Education in Georgetown
School Enrollment in Georgetown
The most common levels of schooling among the 10,015 students in Georgetown are middle school (2,395 | 23.9%), college / undergraduate (2,319 | 23.2%), and elementary school (2,022 | 20.2%).
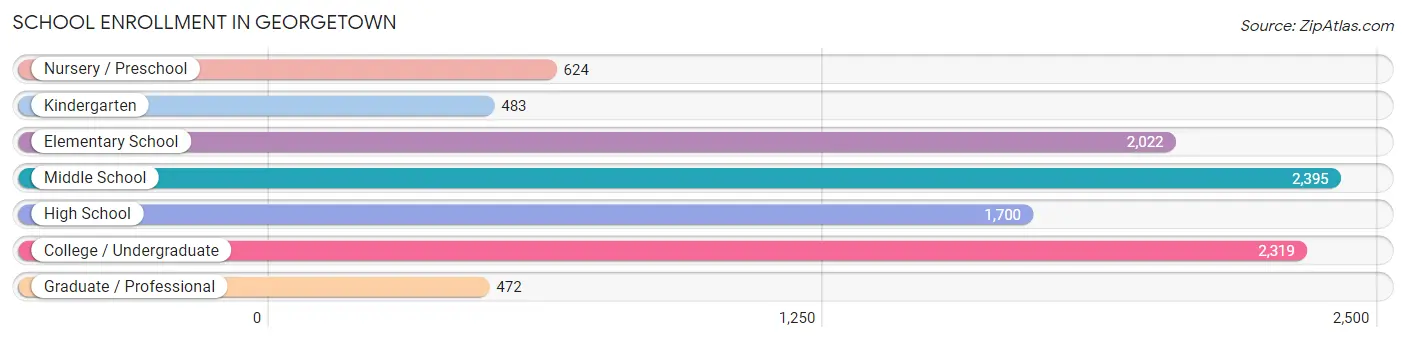
| School Level | # Students | % Students |
| Nursery / Preschool | 624 | 6.2% |
| Kindergarten | 483 | 4.8% |
| Elementary School | 2,022 | 20.2% |
| Middle School | 2,395 | 23.9% |
| High School | 1,700 | 17.0% |
| College / Undergraduate | 2,319 | 23.2% |
| Graduate / Professional | 472 | 4.7% |
| Total | 10,015 | 100.0% |
School Enrollment by Age by Funding Source in Georgetown
Out of a total of 10,015 students who are enrolled in schools in Georgetown, 2,233 (22.3%) attend a private institution, while the remaining 7,782 (77.7%) are enrolled in public schools. The age group of 3 to 4 year olds has the highest likelihood of being enrolled in private schools, with 339 (72.1% in the age bracket) enrolled. Conversely, the age group of 15 to 17 year olds has the lowest likelihood of being enrolled in a private school, with 1,324 (90.3% in the age bracket) attending a public institution.
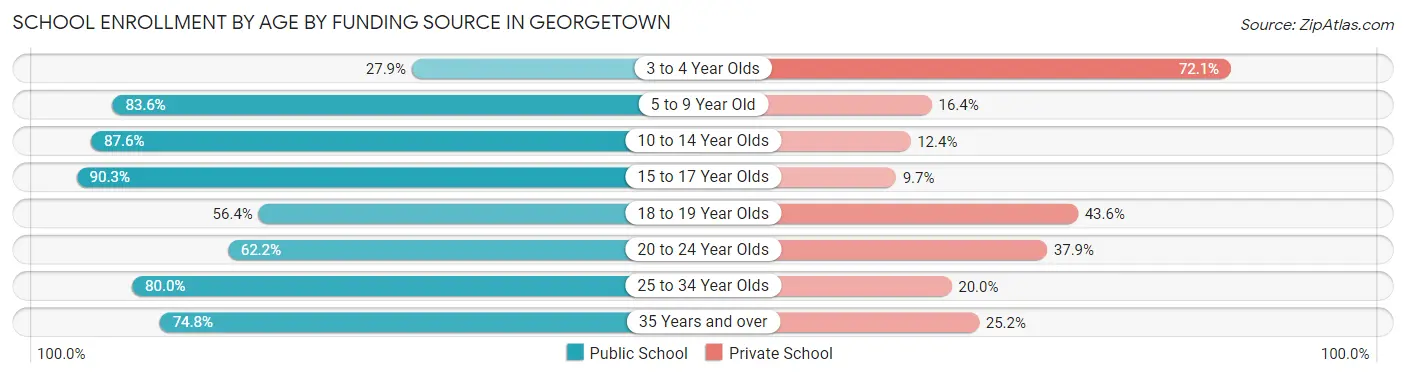
| Age Bracket | Public School | Private School |
| 3 to 4 Year Olds | 131 (27.9%) | 339 (72.1%) |
| 5 to 9 Year Old | 1,962 (83.6%) | 384 (16.4%) |
| 10 to 14 Year Olds | 2,415 (87.6%) | 342 (12.4%) |
| 15 to 17 Year Olds | 1,324 (90.3%) | 142 (9.7%) |
| 18 to 19 Year Olds | 582 (56.4%) | 450 (43.6%) |
| 20 to 24 Year Olds | 578 (62.2%) | 352 (37.9%) |
| 25 to 34 Year Olds | 455 (80.0%) | 114 (20.0%) |
| 35 Years and over | 333 (74.8%) | 112 (25.2%) |
| Total | 7,782 (77.7%) | 2,233 (22.3%) |
Educational Attainment by Field of Study in Georgetown
Business (1,661 | 21.7%), education (1,090 | 14.2%), science & technology (872 | 11.4%), arts & humanities (630 | 8.2%), and social sciences (579 | 7.5%) are the most common fields of study among 7,668 individuals in Georgetown who have obtained a bachelor's degree or higher.
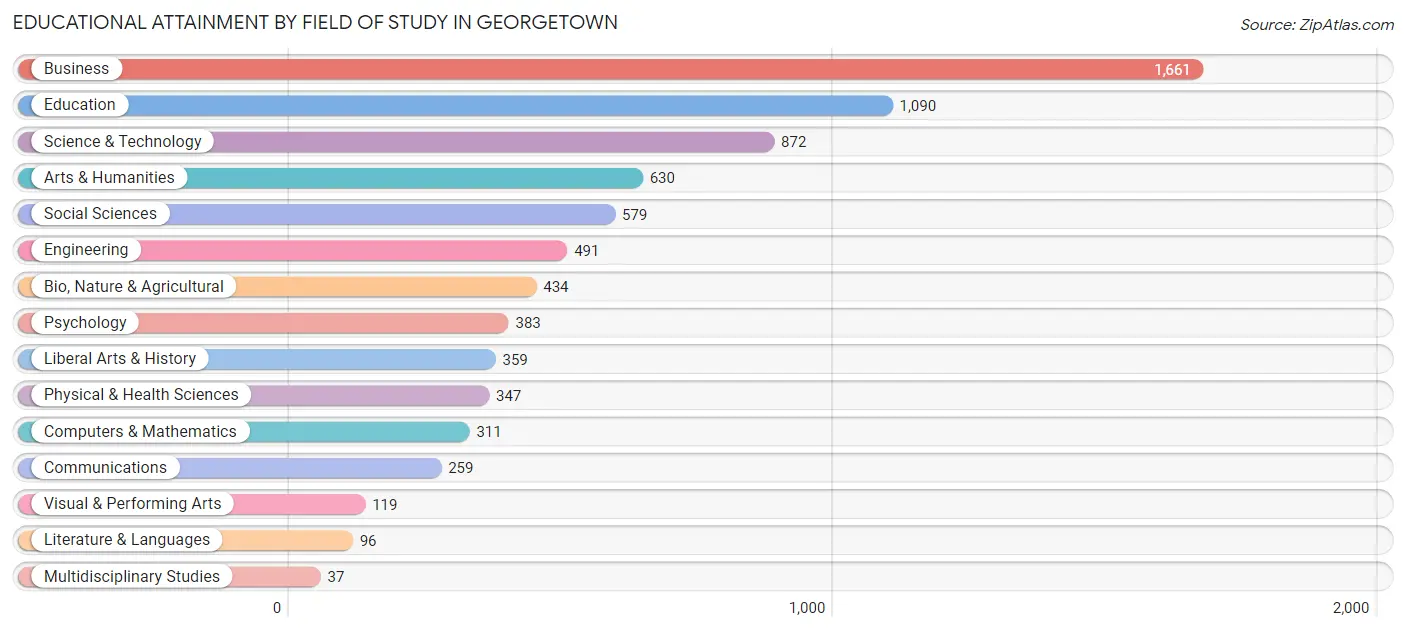
| Field of Study | # Graduates | % Graduates |
| Computers & Mathematics | 311 | 4.1% |
| Bio, Nature & Agricultural | 434 | 5.7% |
| Physical & Health Sciences | 347 | 4.5% |
| Psychology | 383 | 5.0% |
| Social Sciences | 579 | 7.5% |
| Engineering | 491 | 6.4% |
| Multidisciplinary Studies | 37 | 0.5% |
| Science & Technology | 872 | 11.4% |
| Business | 1,661 | 21.7% |
| Education | 1,090 | 14.2% |
| Literature & Languages | 96 | 1.3% |
| Liberal Arts & History | 359 | 4.7% |
| Visual & Performing Arts | 119 | 1.5% |
| Communications | 259 | 3.4% |
| Arts & Humanities | 630 | 8.2% |
| Total | 7,668 | 100.0% |
Transportation & Commute in Georgetown
Vehicle Availability by Sex in Georgetown
The most prevalent vehicle ownership categories in Georgetown are males with 2 vehicles (5,052, accounting for 51.2%) and females with 2 vehicles (4,611, making up 56.8%).
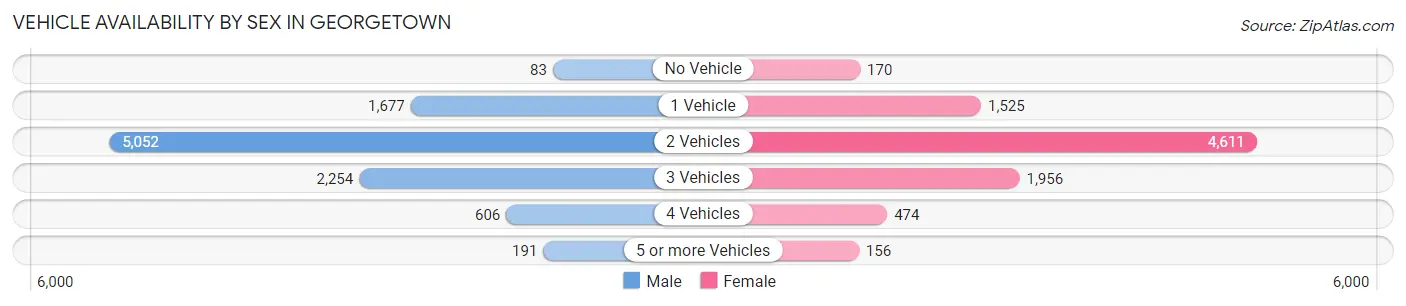
| Vehicles Available | Male | Female |
| No Vehicle | 83 (0.8%) | 170 (1.9%) |
| 1 Vehicle | 1,677 (17.0%) | 1,525 (17.2%) |
| 2 Vehicles | 5,052 (51.2%) | 4,611 (51.9%) |
| 3 Vehicles | 2,254 (22.9%) | 1,956 (22.0%) |
| 4 Vehicles | 606 (6.1%) | 474 (5.3%) |
| 5 or more Vehicles | 191 (1.9%) | 156 (1.8%) |
| Total | 9,863 (100.0%) | 8,892 (100.0%) |
Commute Time in Georgetown
The most frequently occuring commute durations in Georgetown are 10 to 14 minutes (3,648 commuters, 20.9%), 5 to 9 minutes (3,071 commuters, 17.6%), and 30 to 34 minutes (2,617 commuters, 15.0%).
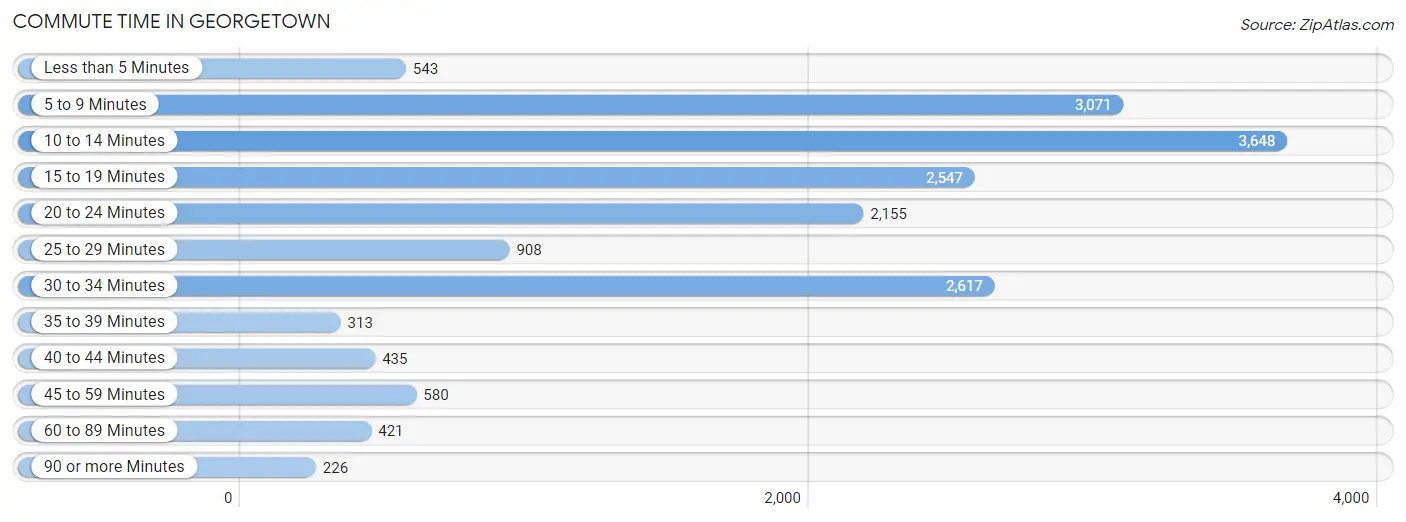
| Commute Time | # Commuters | % Commuters |
| Less than 5 Minutes | 543 | 3.1% |
| 5 to 9 Minutes | 3,071 | 17.6% |
| 10 to 14 Minutes | 3,648 | 20.9% |
| 15 to 19 Minutes | 2,547 | 14.6% |
| 20 to 24 Minutes | 2,155 | 12.3% |
| 25 to 29 Minutes | 908 | 5.2% |
| 30 to 34 Minutes | 2,617 | 15.0% |
| 35 to 39 Minutes | 313 | 1.8% |
| 40 to 44 Minutes | 435 | 2.5% |
| 45 to 59 Minutes | 580 | 3.3% |
| 60 to 89 Minutes | 421 | 2.4% |
| 90 or more Minutes | 226 | 1.3% |
Commute Time by Sex in Georgetown
The most common commute times in Georgetown are 10 to 14 minutes (1,916 commuters, 20.5%) for males and 10 to 14 minutes (1,732 commuters, 21.3%) for females.
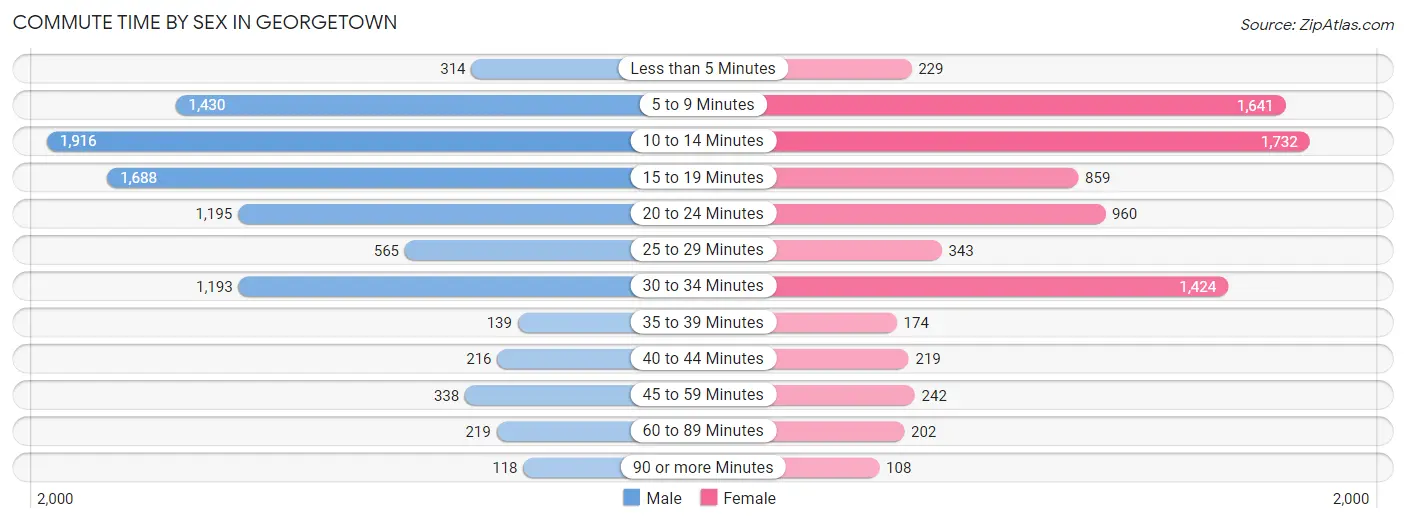
| Commute Time | Male | Female |
| Less than 5 Minutes | 314 (3.4%) | 229 (2.8%) |
| 5 to 9 Minutes | 1,430 (15.3%) | 1,641 (20.2%) |
| 10 to 14 Minutes | 1,916 (20.5%) | 1,732 (21.3%) |
| 15 to 19 Minutes | 1,688 (18.1%) | 859 (10.6%) |
| 20 to 24 Minutes | 1,195 (12.8%) | 960 (11.8%) |
| 25 to 29 Minutes | 565 (6.1%) | 343 (4.2%) |
| 30 to 34 Minutes | 1,193 (12.8%) | 1,424 (17.5%) |
| 35 to 39 Minutes | 139 (1.5%) | 174 (2.1%) |
| 40 to 44 Minutes | 216 (2.3%) | 219 (2.7%) |
| 45 to 59 Minutes | 338 (3.6%) | 242 (3.0%) |
| 60 to 89 Minutes | 219 (2.4%) | 202 (2.5%) |
| 90 or more Minutes | 118 (1.3%) | 108 (1.3%) |
Time of Departure to Work by Sex in Georgetown
The most frequent times of departure to work in Georgetown are 4:00 PM to 11:59 PM (1,400, 15.0%) for males and 7:00 AM to 7:29 AM (1,388, 17.1%) for females.
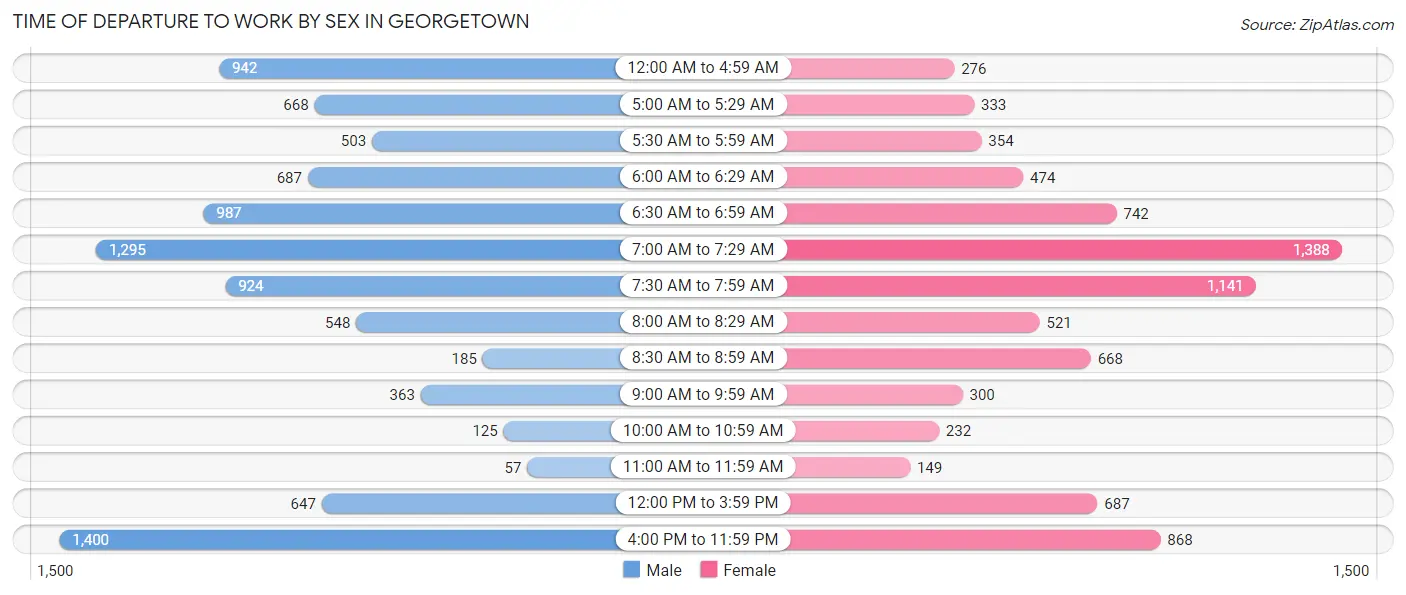
| Time of Departure | Male | Female |
| 12:00 AM to 4:59 AM | 942 (10.1%) | 276 (3.4%) |
| 5:00 AM to 5:29 AM | 668 (7.2%) | 333 (4.1%) |
| 5:30 AM to 5:59 AM | 503 (5.4%) | 354 (4.3%) |
| 6:00 AM to 6:29 AM | 687 (7.4%) | 474 (5.8%) |
| 6:30 AM to 6:59 AM | 987 (10.6%) | 742 (9.1%) |
| 7:00 AM to 7:29 AM | 1,295 (13.9%) | 1,388 (17.1%) |
| 7:30 AM to 7:59 AM | 924 (9.9%) | 1,141 (14.0%) |
| 8:00 AM to 8:29 AM | 548 (5.9%) | 521 (6.4%) |
| 8:30 AM to 8:59 AM | 185 (2.0%) | 668 (8.2%) |
| 9:00 AM to 9:59 AM | 363 (3.9%) | 300 (3.7%) |
| 10:00 AM to 10:59 AM | 125 (1.3%) | 232 (2.9%) |
| 11:00 AM to 11:59 AM | 57 (0.6%) | 149 (1.8%) |
| 12:00 PM to 3:59 PM | 647 (6.9%) | 687 (8.5%) |
| 4:00 PM to 11:59 PM | 1,400 (15.0%) | 868 (10.7%) |
| Total | 9,331 (100.0%) | 8,133 (100.0%) |
Housing Occupancy in Georgetown
Occupancy by Ownership in Georgetown
Of the total 14,388 dwellings in Georgetown, owner-occupied units account for 9,411 (65.4%), while renter-occupied units make up 4,977 (34.6%).
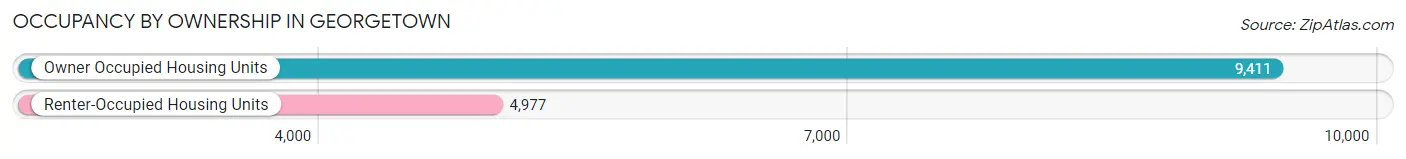
| Occupancy | # Housing Units | % Housing Units |
| Owner Occupied Housing Units | 9,411 | 65.4% |
| Renter-Occupied Housing Units | 4,977 | 34.6% |
| Total Occupied Housing Units | 14,388 | 100.0% |
Occupancy by Household Size in Georgetown
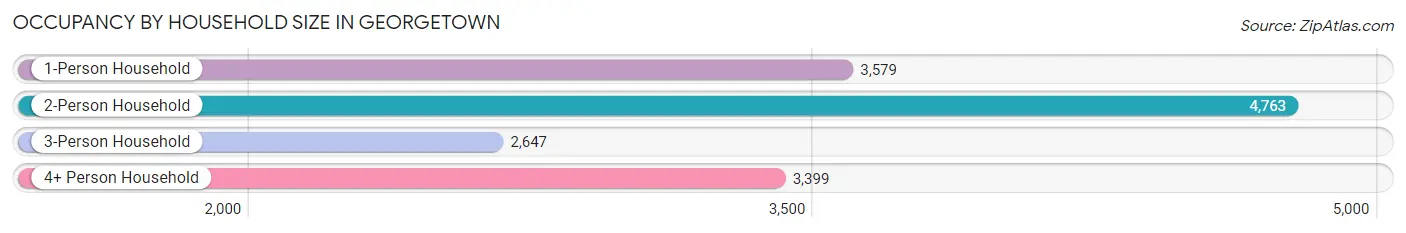
| Household Size | # Housing Units | % Housing Units |
| 1-Person Household | 3,579 | 24.9% |
| 2-Person Household | 4,763 | 33.1% |
| 3-Person Household | 2,647 | 18.4% |
| 4+ Person Household | 3,399 | 23.6% |
| Total Housing Units | 14,388 | 100.0% |
Occupancy by Ownership by Household Size in Georgetown
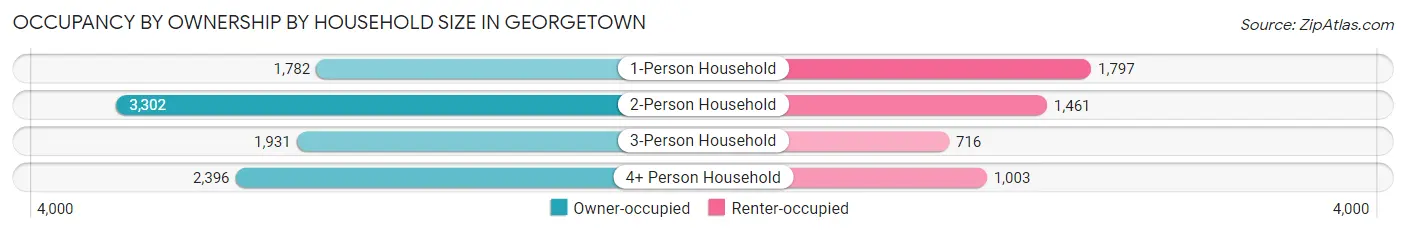
| Household Size | Owner-occupied | Renter-occupied |
| 1-Person Household | 1,782 (49.8%) | 1,797 (50.2%) |
| 2-Person Household | 3,302 (69.3%) | 1,461 (30.7%) |
| 3-Person Household | 1,931 (73.0%) | 716 (27.1%) |
| 4+ Person Household | 2,396 (70.5%) | 1,003 (29.5%) |
| Total Housing Units | 9,411 (65.4%) | 4,977 (34.6%) |
Occupancy by Educational Attainment in Georgetown
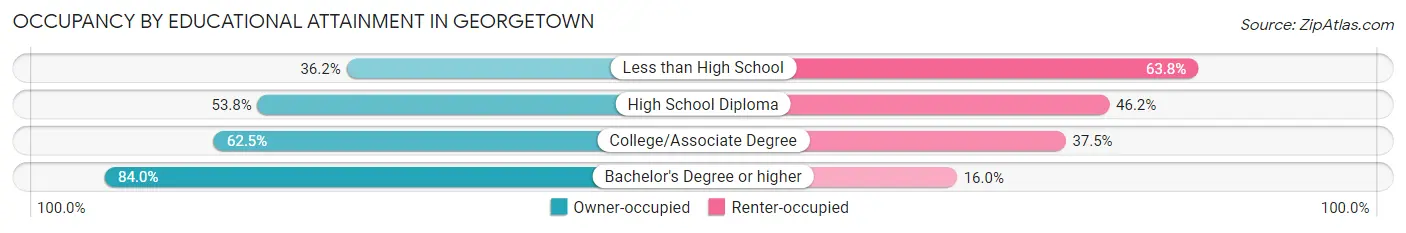
| Household Size | Owner-occupied | Renter-occupied |
| Less than High School | 280 (36.2%) | 494 (63.8%) |
| High School Diploma | 2,168 (53.8%) | 1,860 (46.2%) |
| College/Associate Degree | 3,164 (62.5%) | 1,901 (37.5%) |
| Bachelor's Degree or higher | 3,799 (84.0%) | 722 (16.0%) |
Occupancy by Age of Householder in Georgetown
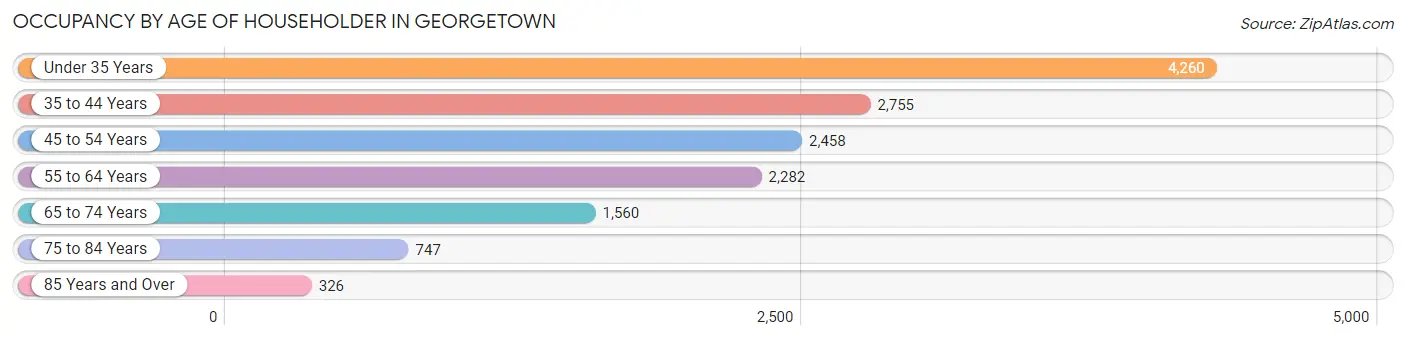
| Age Bracket | # Households | % Households |
| Under 35 Years | 4,260 | 29.6% |
| 35 to 44 Years | 2,755 | 19.2% |
| 45 to 54 Years | 2,458 | 17.1% |
| 55 to 64 Years | 2,282 | 15.9% |
| 65 to 74 Years | 1,560 | 10.8% |
| 75 to 84 Years | 747 | 5.2% |
| 85 Years and Over | 326 | 2.3% |
| Total | 14,388 | 100.0% |
Housing Finances in Georgetown
Median Income by Occupancy in Georgetown
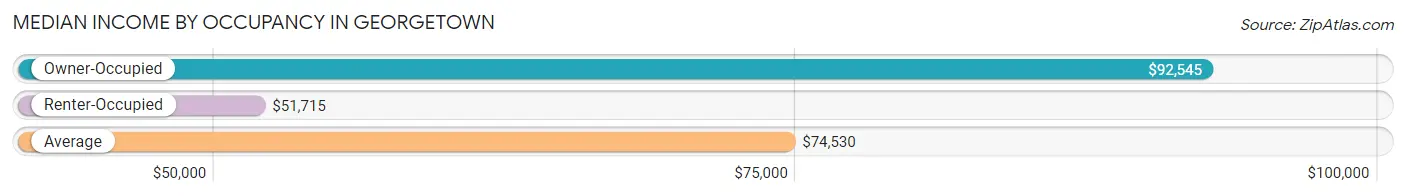
| Occupancy Type | # Households | Median Income |
| Owner-Occupied | 9,411 (65.4%) | $92,545 |
| Renter-Occupied | 4,977 (34.6%) | $51,715 |
| Average | 14,388 (100.0%) | $74,530 |
Occupancy by Householder Income Bracket in Georgetown
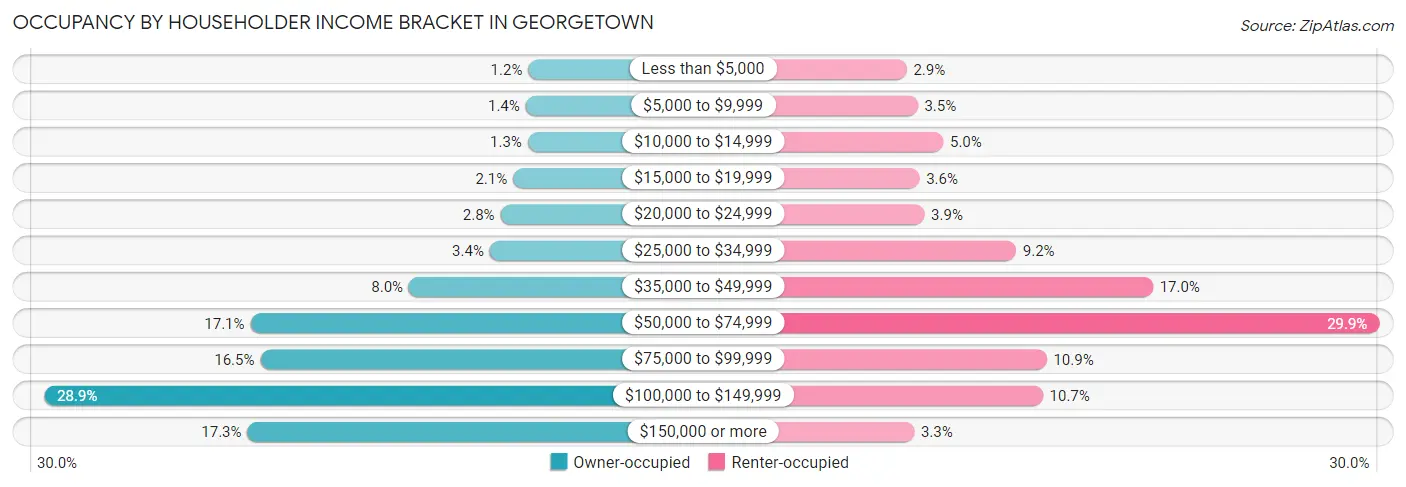
| Income Bracket | Owner-occupied | Renter-occupied |
| Less than $5,000 | 115 (1.2%) | 145 (2.9%) |
| $5,000 to $9,999 | 129 (1.4%) | 176 (3.5%) |
| $10,000 to $14,999 | 118 (1.3%) | 249 (5.0%) |
| $15,000 to $19,999 | 197 (2.1%) | 181 (3.6%) |
| $20,000 to $24,999 | 264 (2.8%) | 195 (3.9%) |
| $25,000 to $34,999 | 322 (3.4%) | 456 (9.2%) |
| $35,000 to $49,999 | 757 (8.0%) | 845 (17.0%) |
| $50,000 to $74,999 | 1,609 (17.1%) | 1,489 (29.9%) |
| $75,000 to $99,999 | 1,556 (16.5%) | 543 (10.9%) |
| $100,000 to $149,999 | 2,719 (28.9%) | 532 (10.7%) |
| $150,000 or more | 1,625 (17.3%) | 166 (3.3%) |
| Total | 9,411 (100.0%) | 4,977 (100.0%) |
Monthly Housing Cost Tiers in Georgetown
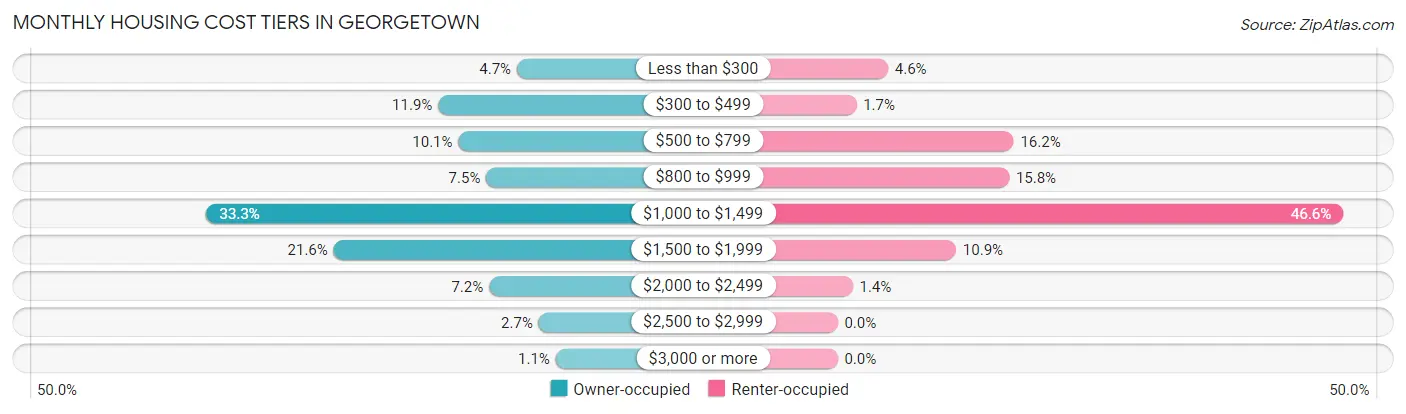
| Monthly Cost | Owner-occupied | Renter-occupied |
| Less than $300 | 440 (4.7%) | 231 (4.6%) |
| $300 to $499 | 1,123 (11.9%) | 86 (1.7%) |
| $500 to $799 | 948 (10.1%) | 807 (16.2%) |
| $800 to $999 | 706 (7.5%) | 786 (15.8%) |
| $1,000 to $1,499 | 3,130 (33.3%) | 2,317 (46.6%) |
| $1,500 to $1,999 | 2,028 (21.5%) | 543 (10.9%) |
| $2,000 to $2,499 | 681 (7.2%) | 69 (1.4%) |
| $2,500 to $2,999 | 251 (2.7%) | 0 (0.0%) |
| $3,000 or more | 104 (1.1%) | 0 (0.0%) |
| Total | 9,411 (100.0%) | 4,977 (100.0%) |
Physical Housing Characteristics in Georgetown
Housing Structures in Georgetown
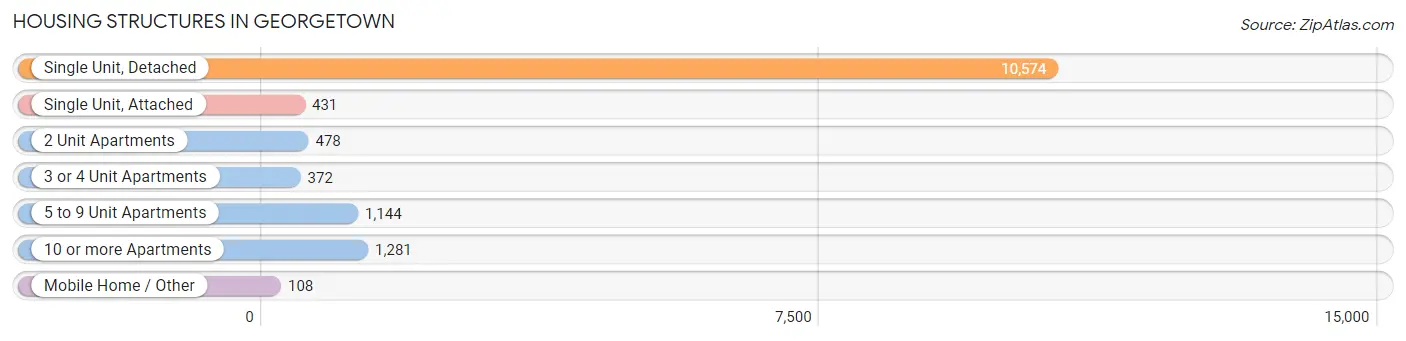
| Structure Type | # Housing Units | % Housing Units |
| Single Unit, Detached | 10,574 | 73.5% |
| Single Unit, Attached | 431 | 3.0% |
| 2 Unit Apartments | 478 | 3.3% |
| 3 or 4 Unit Apartments | 372 | 2.6% |
| 5 to 9 Unit Apartments | 1,144 | 8.0% |
| 10 or more Apartments | 1,281 | 8.9% |
| Mobile Home / Other | 108 | 0.7% |
| Total | 14,388 | 100.0% |
Housing Structures by Occupancy in Georgetown
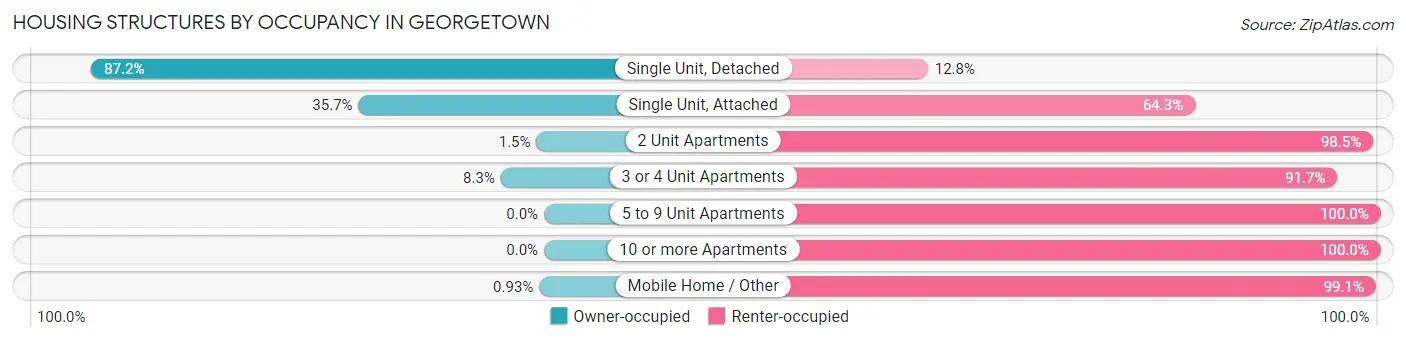
| Structure Type | Owner-occupied | Renter-occupied |
| Single Unit, Detached | 9,218 (87.2%) | 1,356 (12.8%) |
| Single Unit, Attached | 154 (35.7%) | 277 (64.3%) |
| 2 Unit Apartments | 7 (1.5%) | 471 (98.5%) |
| 3 or 4 Unit Apartments | 31 (8.3%) | 341 (91.7%) |
| 5 to 9 Unit Apartments | 0 (0.0%) | 1,144 (100.0%) |
| 10 or more Apartments | 0 (0.0%) | 1,281 (100.0%) |
| Mobile Home / Other | 1 (0.9%) | 107 (99.1%) |
| Total | 9,411 (65.4%) | 4,977 (34.6%) |
Housing Structures by Number of Rooms in Georgetown
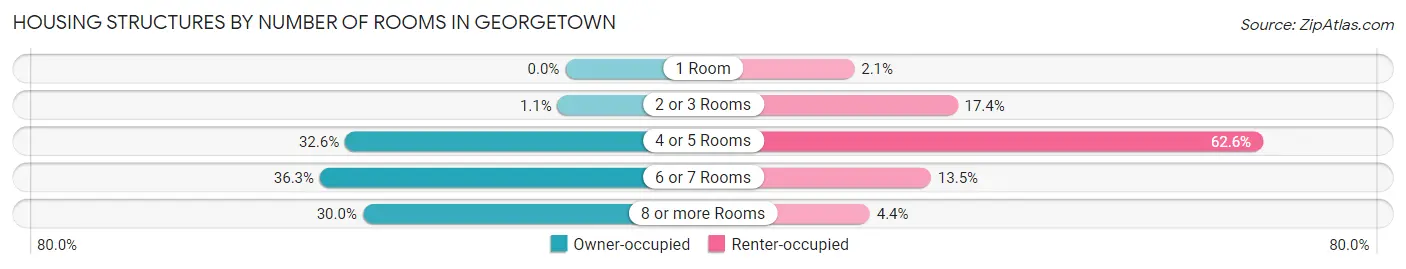
| Number of Rooms | Owner-occupied | Renter-occupied |
| 1 Room | 0 (0.0%) | 106 (2.1%) |
| 2 or 3 Rooms | 107 (1.1%) | 866 (17.4%) |
| 4 or 5 Rooms | 3,067 (32.6%) | 3,115 (62.6%) |
| 6 or 7 Rooms | 3,417 (36.3%) | 670 (13.5%) |
| 8 or more Rooms | 2,820 (30.0%) | 220 (4.4%) |
| Total | 9,411 (100.0%) | 4,977 (100.0%) |
Housing Structure by Heating Type in Georgetown
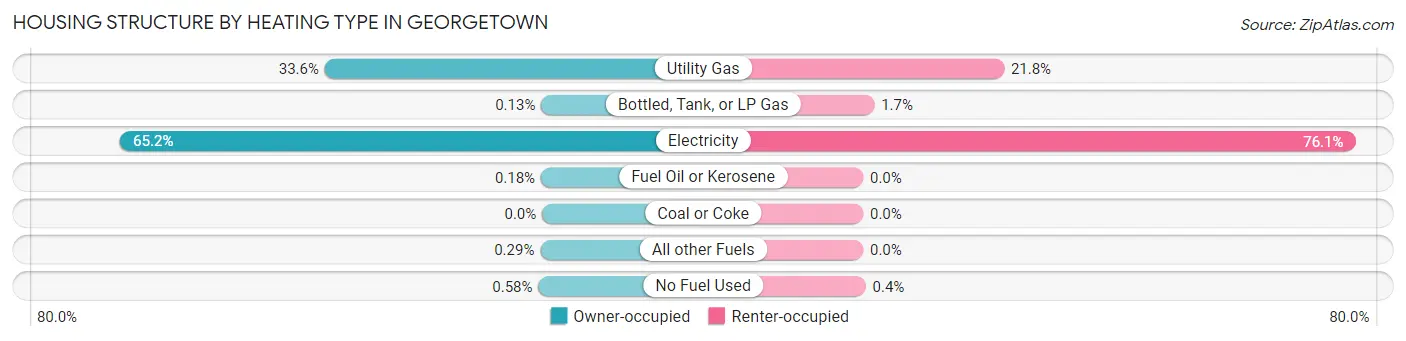
| Heating Type | Owner-occupied | Renter-occupied |
| Utility Gas | 3,161 (33.6%) | 1,084 (21.8%) |
| Bottled, Tank, or LP Gas | 12 (0.1%) | 86 (1.7%) |
| Electricity | 6,139 (65.2%) | 3,787 (76.1%) |
| Fuel Oil or Kerosene | 17 (0.2%) | 0 (0.0%) |
| Coal or Coke | 0 (0.0%) | 0 (0.0%) |
| All other Fuels | 27 (0.3%) | 0 (0.0%) |
| No Fuel Used | 55 (0.6%) | 20 (0.4%) |
| Total | 9,411 (100.0%) | 4,977 (100.0%) |
Household Vehicle Usage in Georgetown
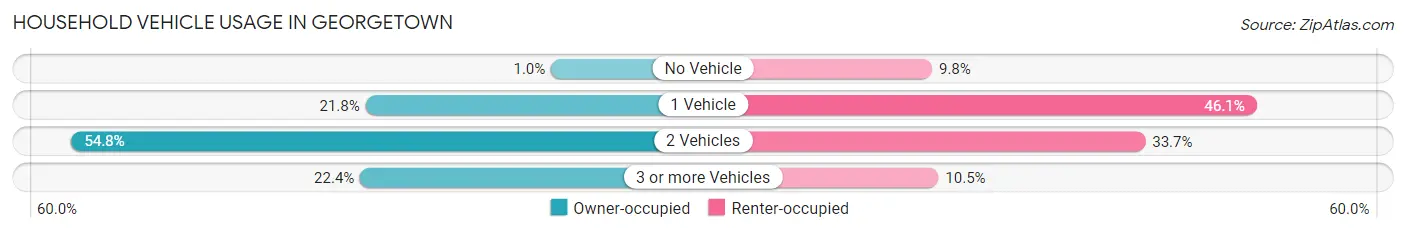
| Vehicles per Household | Owner-occupied | Renter-occupied |
| No Vehicle | 96 (1.0%) | 486 (9.8%) |
| 1 Vehicle | 2,053 (21.8%) | 2,295 (46.1%) |
| 2 Vehicles | 5,153 (54.8%) | 1,675 (33.7%) |
| 3 or more Vehicles | 2,109 (22.4%) | 521 (10.5%) |
| Total | 9,411 (100.0%) | 4,977 (100.0%) |
Real Estate & Mortgages in Georgetown
Real Estate and Mortgage Overview in Georgetown
| Characteristic | Without Mortgage | With Mortgage |
| Housing Units | 2,258 | 7,153 |
| Median Property Value | $198,500 | $233,700 |
| Median Household Income | $58,598 | $1,420 |
| Monthly Housing Costs | $429 | $104 |
| Real Estate Taxes | $1,267 | $255 |
Property Value by Mortgage Status in Georgetown
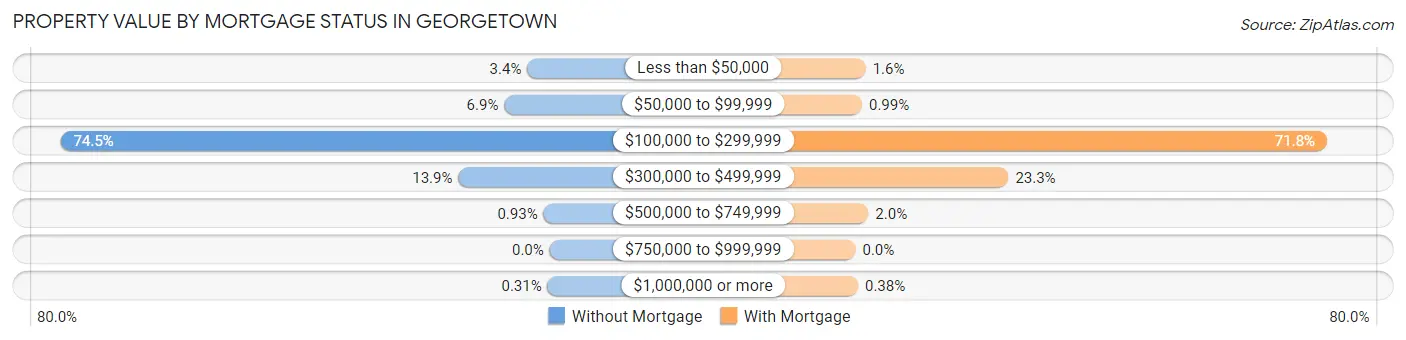
| Property Value | Without Mortgage | With Mortgage |
| Less than $50,000 | 77 (3.4%) | 111 (1.5%) |
| $50,000 to $99,999 | 156 (6.9%) | 71 (1.0%) |
| $100,000 to $299,999 | 1,683 (74.5%) | 5,137 (71.8%) |
| $300,000 to $499,999 | 314 (13.9%) | 1,667 (23.3%) |
| $500,000 to $749,999 | 21 (0.9%) | 140 (2.0%) |
| $750,000 to $999,999 | 0 (0.0%) | 0 (0.0%) |
| $1,000,000 or more | 7 (0.3%) | 27 (0.4%) |
| Total | 2,258 (100.0%) | 7,153 (100.0%) |
Household Income by Mortgage Status in Georgetown
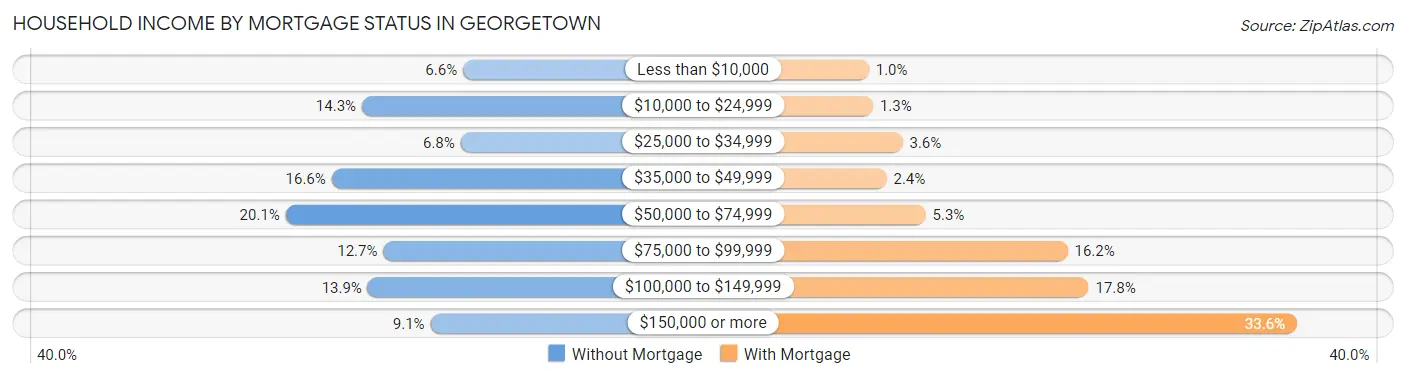
| Household Income | Without Mortgage | With Mortgage |
| Less than $10,000 | 149 (6.6%) | 72 (1.0%) |
| $10,000 to $24,999 | 323 (14.3%) | 95 (1.3%) |
| $25,000 to $34,999 | 153 (6.8%) | 256 (3.6%) |
| $35,000 to $49,999 | 375 (16.6%) | 169 (2.4%) |
| $50,000 to $74,999 | 454 (20.1%) | 382 (5.3%) |
| $75,000 to $99,999 | 286 (12.7%) | 1,155 (16.2%) |
| $100,000 to $149,999 | 313 (13.9%) | 1,270 (17.7%) |
| $150,000 or more | 205 (9.1%) | 2,406 (33.6%) |
| Total | 2,258 (100.0%) | 7,153 (100.0%) |
Property Value to Household Income Ratio in Georgetown
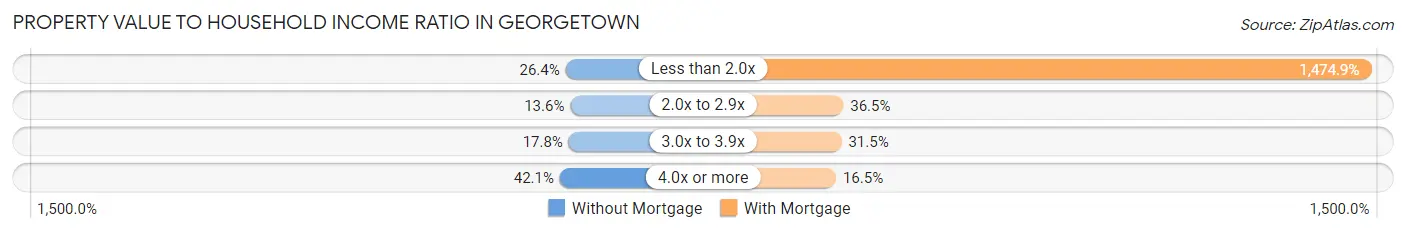
| Value-to-Income Ratio | Without Mortgage | With Mortgage |
| Less than 2.0x | 597 (26.4%) | 105,499 (1,474.9%) |
| 2.0x to 2.9x | 308 (13.6%) | 2,609 (36.5%) |
| 3.0x to 3.9x | 402 (17.8%) | 2,251 (31.5%) |
| 4.0x or more | 951 (42.1%) | 1,183 (16.5%) |
| Total | 2,258 (100.0%) | 7,153 (100.0%) |
Real Estate Taxes by Mortgage Status in Georgetown
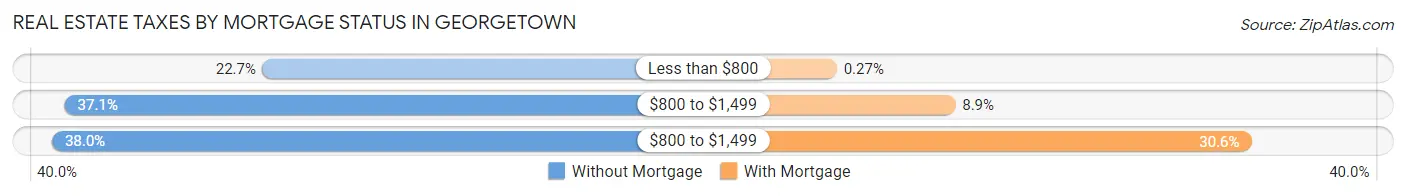
| Property Taxes | Without Mortgage | With Mortgage |
| Less than $800 | 512 (22.7%) | 19 (0.3%) |
| $800 to $1,499 | 837 (37.1%) | 639 (8.9%) |
| $800 to $1,499 | 858 (38.0%) | 2,186 (30.6%) |
| Total | 2,258 (100.0%) | 7,153 (100.0%) |
Health & Disability in Georgetown
Health Insurance Coverage by Age in Georgetown
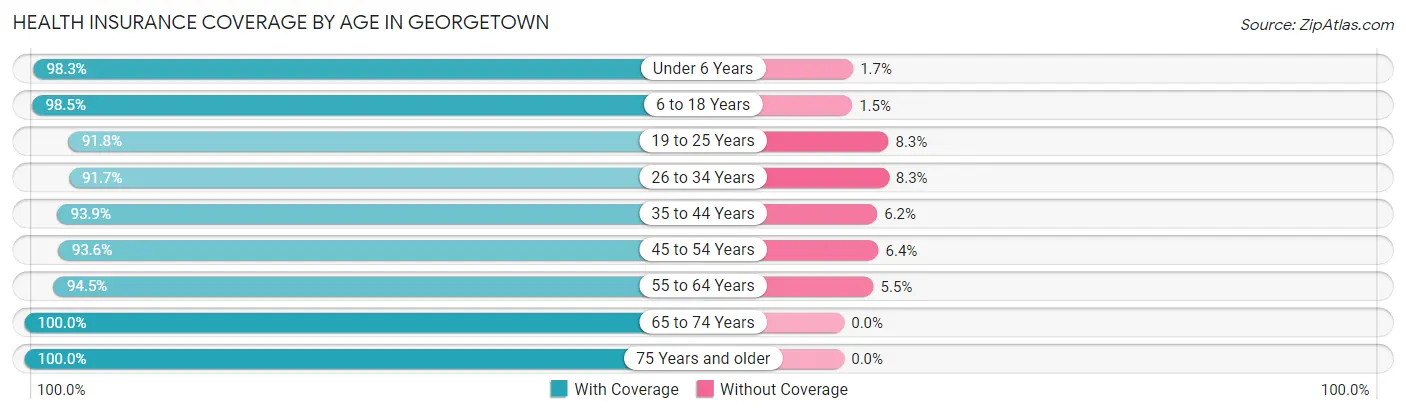
| Age Bracket | With Coverage | Without Coverage |
| Under 6 Years | 3,193 (98.3%) | 54 (1.7%) |
| 6 to 18 Years | 6,601 (98.5%) | 99 (1.5%) |
| 19 to 25 Years | 4,117 (91.7%) | 370 (8.3%) |
| 26 to 34 Years | 5,122 (91.7%) | 464 (8.3%) |
| 35 to 44 Years | 4,850 (93.9%) | 318 (6.1%) |
| 45 to 54 Years | 4,088 (93.6%) | 279 (6.4%) |
| 55 to 64 Years | 3,644 (94.5%) | 211 (5.5%) |
| 65 to 74 Years | 2,421 (100.0%) | 0 (0.0%) |
| 75 Years and older | 1,446 (100.0%) | 0 (0.0%) |
| Total | 35,482 (95.2%) | 1,795 (4.8%) |
Health Insurance Coverage by Citizenship Status in Georgetown
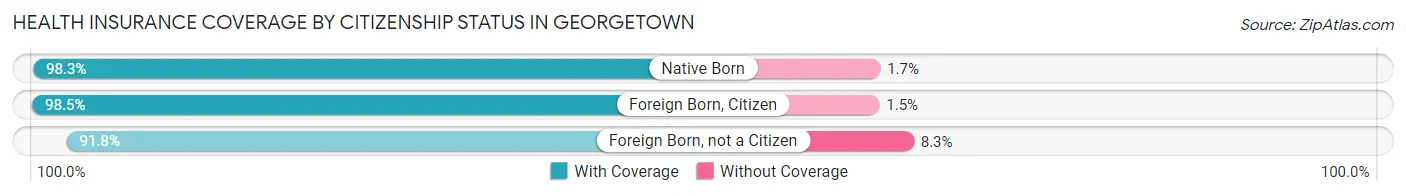
| Citizenship Status | With Coverage | Without Coverage |
| Native Born | 3,193 (98.3%) | 54 (1.7%) |
| Foreign Born, Citizen | 6,601 (98.5%) | 99 (1.5%) |
| Foreign Born, not a Citizen | 4,117 (91.7%) | 370 (8.3%) |
Health Insurance Coverage by Household Income in Georgetown
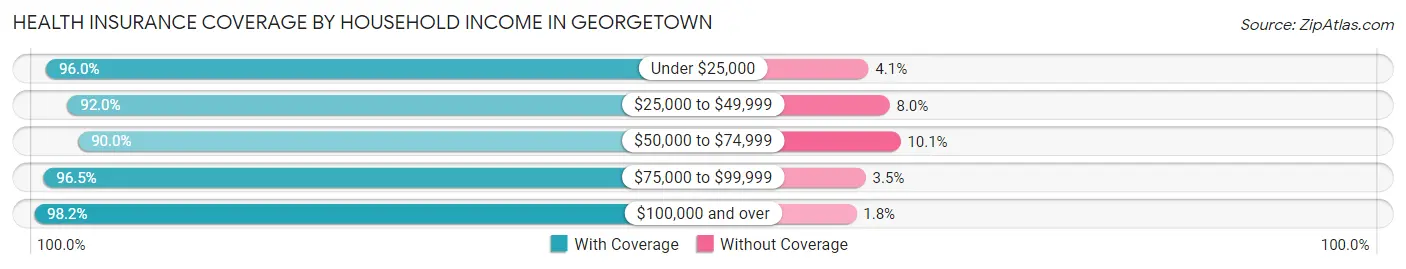
| Household Income | With Coverage | Without Coverage |
| Under $25,000 | 3,338 (96.0%) | 141 (4.1%) |
| $25,000 to $49,999 | 4,413 (92.0%) | 384 (8.0%) |
| $50,000 to $74,999 | 6,709 (89.9%) | 750 (10.1%) |
| $75,000 to $99,999 | 5,736 (96.5%) | 210 (3.5%) |
| $100,000 and over | 14,448 (98.2%) | 263 (1.8%) |
Public vs Private Health Insurance Coverage by Age in Georgetown
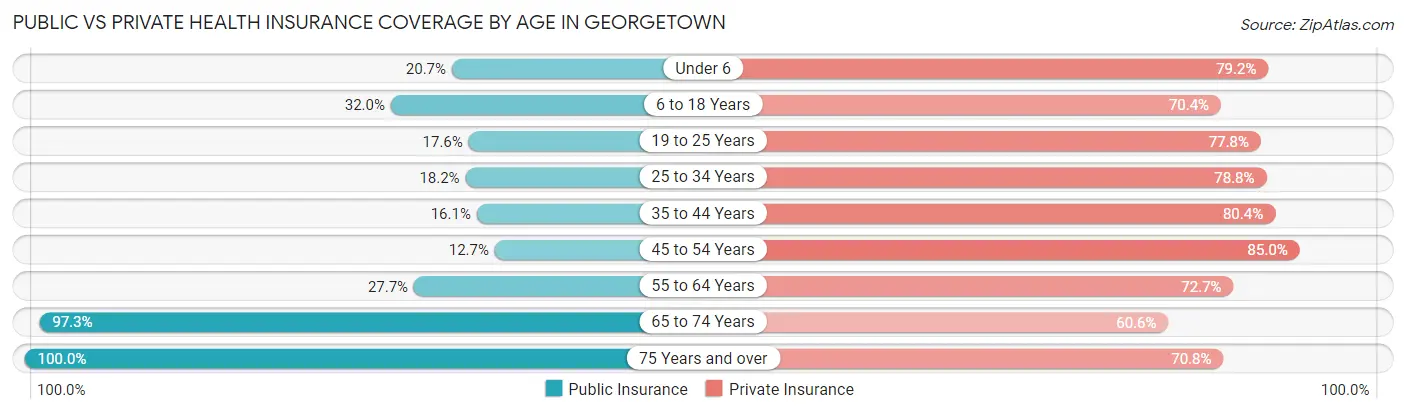
| Age Bracket | Public Insurance | Private Insurance |
| Under 6 | 672 (20.7%) | 2,570 (79.1%) |
| 6 to 18 Years | 2,146 (32.0%) | 4,715 (70.4%) |
| 19 to 25 Years | 789 (17.6%) | 3,490 (77.8%) |
| 25 to 34 Years | 1,015 (18.2%) | 4,402 (78.8%) |
| 35 to 44 Years | 831 (16.1%) | 4,155 (80.4%) |
| 45 to 54 Years | 556 (12.7%) | 3,711 (85.0%) |
| 55 to 64 Years | 1,069 (27.7%) | 2,802 (72.7%) |
| 65 to 74 Years | 2,355 (97.3%) | 1,467 (60.6%) |
| 75 Years and over | 1,446 (100.0%) | 1,024 (70.8%) |
| Total | 10,879 (29.2%) | 28,336 (76.0%) |
Disability Status by Sex by Age in Georgetown
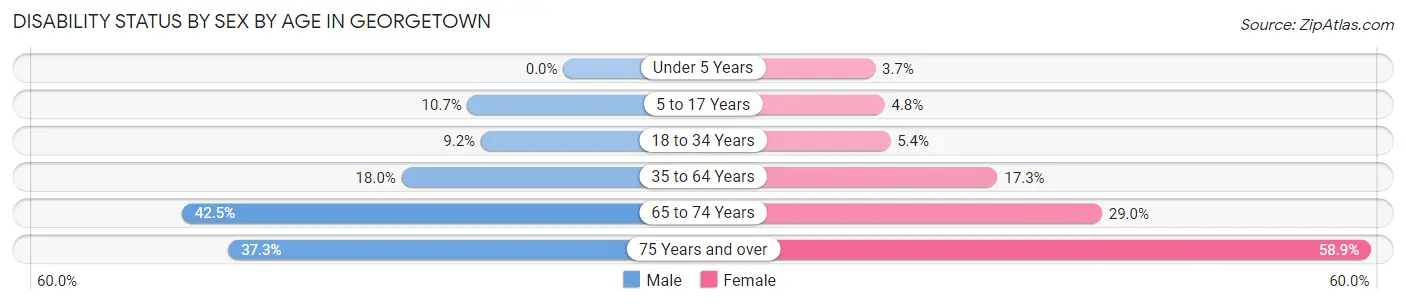
| Age Bracket | Male | Female |
| Under 5 Years | 0 (0.0%) | 57 (3.7%) |
| 5 to 17 Years | 367 (10.7%) | 166 (4.8%) |
| 18 to 34 Years | 487 (9.2%) | 279 (5.4%) |
| 35 to 64 Years | 1,184 (18.0%) | 1,181 (17.3%) |
| 65 to 74 Years | 446 (42.5%) | 397 (29.0%) |
| 75 Years and over | 178 (37.3%) | 571 (58.9%) |
Disability Class by Sex by Age in Georgetown
Disability Class: Hearing Difficulty
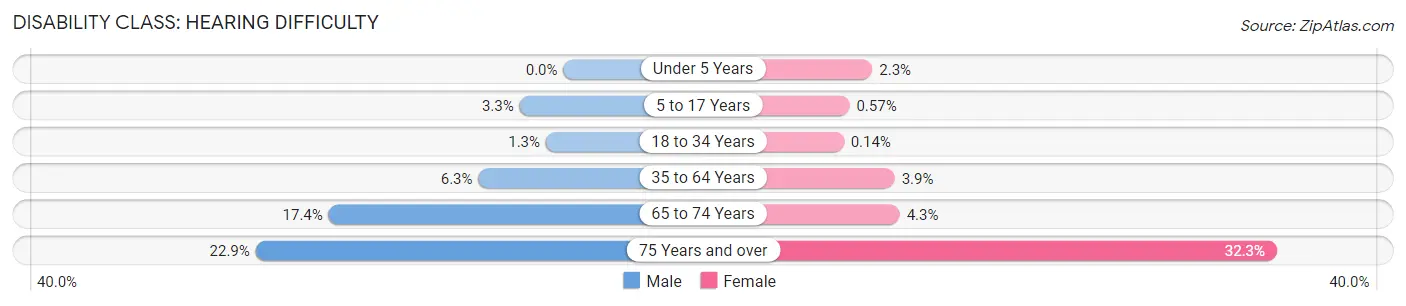
| Age Bracket | Male | Female |
| Under 5 Years | 0 (0.0%) | 35 (2.3%) |
| 5 to 17 Years | 112 (3.3%) | 20 (0.6%) |
| 18 to 34 Years | 69 (1.3%) | 7 (0.1%) |
| 35 to 64 Years | 415 (6.3%) | 268 (3.9%) |
| 65 to 74 Years | 183 (17.4%) | 59 (4.3%) |
| 75 Years and over | 109 (22.9%) | 313 (32.3%) |
Disability Class: Vision Difficulty
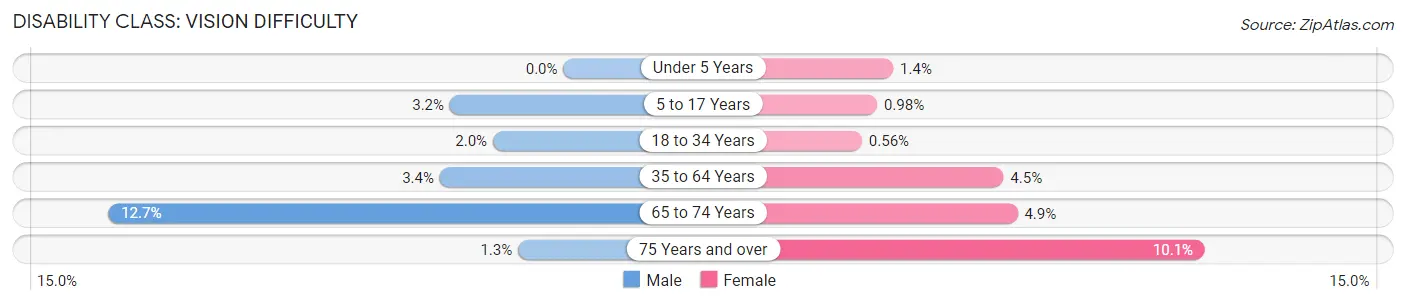
| Age Bracket | Male | Female |
| Under 5 Years | 0 (0.0%) | 22 (1.4%) |
| 5 to 17 Years | 109 (3.2%) | 34 (1.0%) |
| 18 to 34 Years | 104 (2.0%) | 29 (0.6%) |
| 35 to 64 Years | 226 (3.4%) | 307 (4.5%) |
| 65 to 74 Years | 133 (12.7%) | 67 (4.9%) |
| 75 Years and over | 6 (1.3%) | 98 (10.1%) |
Disability Class: Cognitive Difficulty
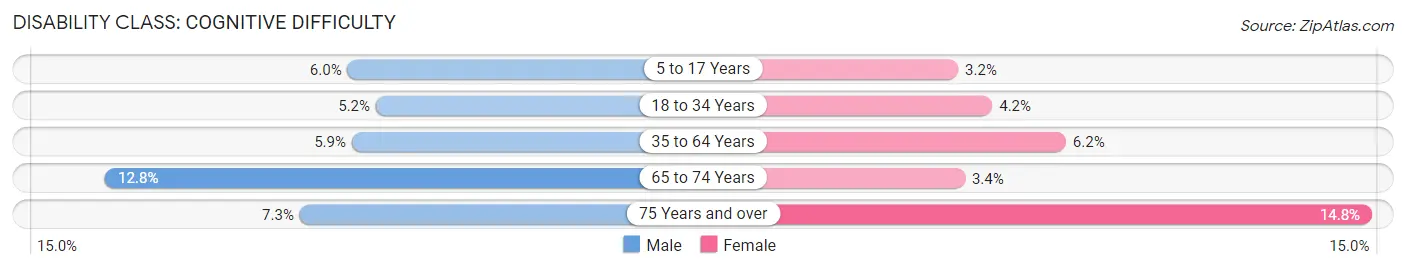
| Age Bracket | Male | Female |
| 5 to 17 Years | 207 (6.0%) | 113 (3.2%) |
| 18 to 34 Years | 277 (5.2%) | 217 (4.2%) |
| 35 to 64 Years | 387 (5.9%) | 425 (6.2%) |
| 65 to 74 Years | 134 (12.8%) | 47 (3.4%) |
| 75 Years and over | 35 (7.3%) | 143 (14.8%) |
Disability Class: Ambulatory Difficulty
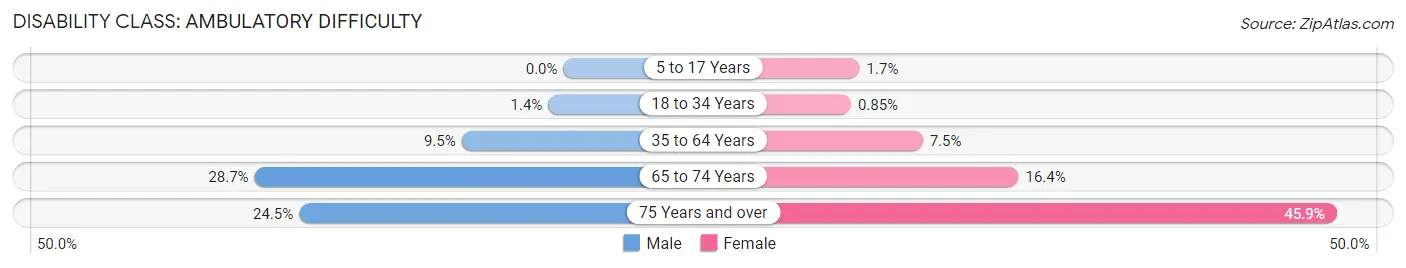
| Age Bracket | Male | Female |
| 5 to 17 Years | 0 (0.0%) | 58 (1.7%) |
| 18 to 34 Years | 75 (1.4%) | 44 (0.9%) |
| 35 to 64 Years | 621 (9.5%) | 512 (7.5%) |
| 65 to 74 Years | 301 (28.7%) | 225 (16.4%) |
| 75 Years and over | 117 (24.5%) | 445 (45.9%) |
Disability Class: Self-Care Difficulty
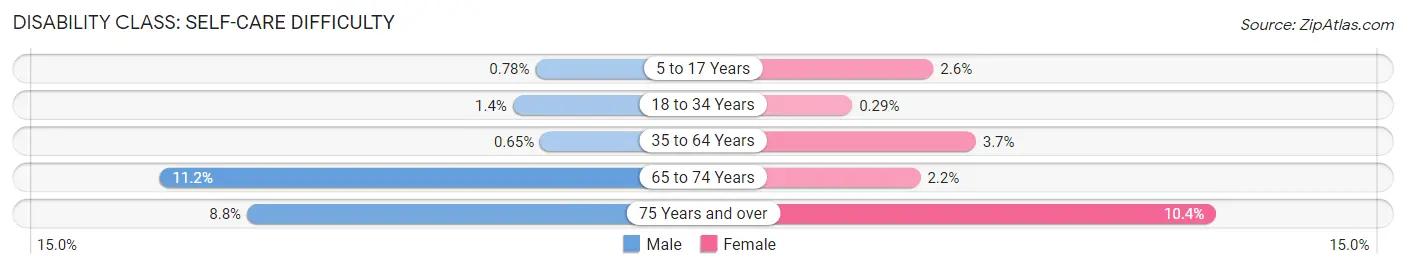
| Age Bracket | Male | Female |
| 5 to 17 Years | 27 (0.8%) | 89 (2.5%) |
| 18 to 34 Years | 75 (1.4%) | 15 (0.3%) |
| 35 to 64 Years | 43 (0.6%) | 254 (3.7%) |
| 65 to 74 Years | 118 (11.2%) | 30 (2.2%) |
| 75 Years and over | 42 (8.8%) | 101 (10.4%) |
Technology Access in Georgetown
Computing Device Access in Georgetown
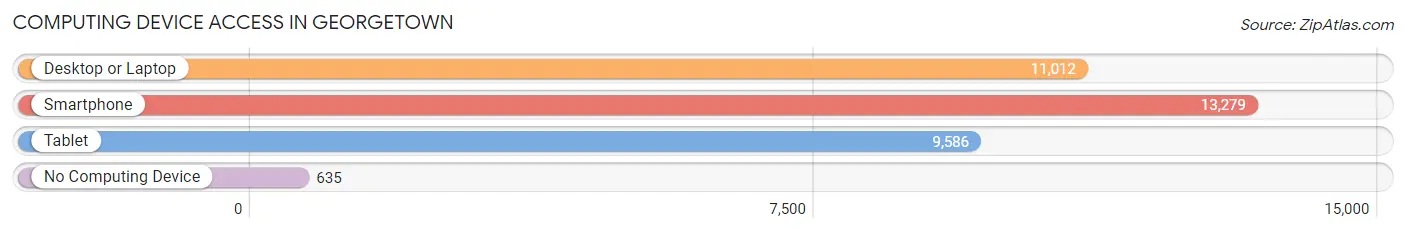
| Device Type | # Households | % Households |
| Desktop or Laptop | 11,012 | 76.5% |
| Smartphone | 13,279 | 92.3% |
| Tablet | 9,586 | 66.6% |
| No Computing Device | 635 | 4.4% |
| Total | 14,388 | 100.0% |
Internet Access in Georgetown
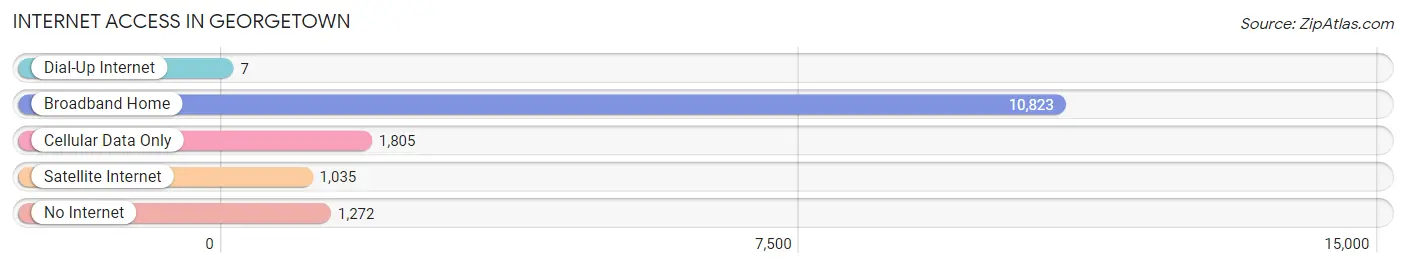
| Internet Type | # Households | % Households |
| Dial-Up Internet | 7 | 0.1% |
| Broadband Home | 10,823 | 75.2% |
| Cellular Data Only | 1,805 | 12.6% |
| Satellite Internet | 1,035 | 7.2% |
| No Internet | 1,272 | 8.8% |
| Total | 14,388 | 100.0% |
Georgetown Summary
Georgetown is a city located in Scott County, Kentucky, United States. It is the county seat of Scott County and the principal city of the Georgetown-Scott County Metropolitan Statistical Area. The population was 32,356 at the 2010 census, making it the 7th-largest city in the state of Kentucky. It is the home of Georgetown College, a private liberal arts college affiliated with the Presbyterian Church.
Geography
Georgetown is located in the Bluegrass region of central Kentucky at 38°20'N 84°39'W (38.33, -84.65). It is situated on the Elkhorn Creek in the heart of the Bluegrass region of Kentucky. The city is approximately 20 miles north of Lexington and is bordered by the cities of Sadieville, Stamping Ground, and Paris.
Georgetown is located in the Inner Bluegrass region of Kentucky, which is characterized by rolling hills and fertile soil. The area is known for its horse farms and is home to several thoroughbred horse farms, including Three Chimneys Farm, Darby Dan Farm, and Spendthrift Farm.
Climate
Georgetown has a humid subtropical climate, with hot, humid summers and mild winters. The average annual temperature is 57.2°F (14°C). The average annual precipitation is 45.2 inches (1150 mm).
Demographics
As of the 2010 census, there were 32,356 people, 12,890 households, and 8,845 families residing in the city. The population density was 1,092.3 people per square mile (421.7/km2). There were 13,851 housing units at an average density of 463.3 per square mile (179.0/km2). The racial makeup of the city was 90.2% White, 6.2% African American, 0.2% Native American, 1.2% Asian, 0.1% Pacific Islander, 0.7% from other races, and 1.2% from two or more races. Hispanic or Latino of any race were 1.9% of the population.
Economy
Georgetown is home to several major employers, including Toyota Motor Manufacturing Kentucky, which is the largest private employer in the state. Other major employers include Georgetown College, Scott County Public Schools, and St. Elizabeth Healthcare.
Georgetown is also home to several small businesses, including restaurants, retail stores, and professional services. The city is also home to several tourist attractions, including the Kentucky Horse Park, the Georgetown and Scott County Museum, and the Georgetown and Scott County Public Library.
Georgetown is also home to several annual festivals and events, including the Georgetown Festival of the Horse, the Georgetown Festival of the Arts, and the Georgetown Christmas Parade.
Conclusion
Georgetown is a city located in Scott County, Kentucky, United States. It is the county seat of Scott County and the principal city of the Georgetown-Scott County Metropolitan Statistical Area. The population was 32,356 at the 2010 census, making it the 7th-largest city in the state of Kentucky. It is the home of Georgetown College, a private liberal arts college affiliated with the Presbyterian Church. Georgetown has a humid subtropical climate, with hot, humid summers and mild winters. The city is home to several major employers, including Toyota Motor Manufacturing Kentucky, Georgetown College, Scott County Public Schools, and St. Elizabeth Healthcare. Georgetown is also home to several small businesses, tourist attractions, and annual festivals and events.
Common Questions
What is Per Capita Income in Georgetown?
Per Capita income in Georgetown is $34,345.
What is the Median Family Income in Georgetown?
Median Family Income in Georgetown is $84,572.
What is the Median Household income in Georgetown?
Median Household Income in Georgetown is $74,530.
What is Income or Wage Gap in Georgetown?
Income or Wage Gap in Georgetown is 39.3%.
Women in Georgetown earn 60.7 cents for every dollar earned by a man.
What is Inequality or Gini Index in Georgetown?
Inequality or Gini Index in Georgetown is 0.38.
What is the Total Population of Georgetown?
Total Population of Georgetown is 37,510.
What is the Total Male Population of Georgetown?
Total Male Population of Georgetown is 18,002.
What is the Total Female Population of Georgetown?
Total Female Population of Georgetown is 19,508.
What is the Ratio of Males per 100 Females in Georgetown?
There are 92.28 Males per 100 Females in Georgetown.
What is the Ratio of Females per 100 Males in Georgetown?
There are 108.37 Females per 100 Males in Georgetown.
What is the Median Population Age in Georgetown?
Median Population Age in Georgetown is 32.8 Years.
What is the Average Family Size in Georgetown
Average Family Size in Georgetown is 3.0 People.
What is the Average Household Size in Georgetown
Average Household Size in Georgetown is 2.5 People.
How Large is the Labor Force in Georgetown?
There are 20,137 People in the Labor Forcein in Georgetown.
What is the Percentage of People in the Labor Force in Georgetown?
70.1% of People are in the Labor Force in Georgetown.
What is the Unemployment Rate in Georgetown?
Unemployment Rate in Georgetown is 3.6%.