Shively, KY Map & Demographics
Shively Map
Shively Overview
$30,292
PER CAPITA INCOME
$56,066
AVG FAMILY INCOME
$45,953
AVG HOUSEHOLD INCOME
1.1%
WAGE / INCOME GAP [ % ]
98.9¢/ $1
WAGE / INCOME GAP [ $ ]
0.50
INEQUALITY / GINI INDEX
15,595
TOTAL POPULATION
7,708
MALE POPULATION
7,887
FEMALE POPULATION
97.73
MALES / 100 FEMALES
102.32
FEMALES / 100 MALES
43.7
MEDIAN AGE
3.0
AVG FAMILY SIZE
2.2
AVG HOUSEHOLD SIZE
7,508
LABOR FORCE [ PEOPLE ]
60.1%
PERCENT IN LABOR FORCE
5.7%
UNEMPLOYMENT RATE
Shively Area Codes
Income in Shively
Income Overview in Shively
Per Capita Income in Shively is $30,292, while median incomes of families and households are $56,066 and $45,953 respectively.
| Characteristic | Number | Measure |
| Per Capita Income | 15,595 | $30,292 |
| Median Family Income | 3,618 | $56,066 |
| Mean Family Income | 3,618 | $65,088 |
| Median Household Income | 6,925 | $45,953 |
| Mean Household Income | 6,925 | $65,873 |
| Income Deficit | 3,618 | $0 |
| Wage / Income Gap (%) | 15,595 | 1.08% |
| Wage / Income Gap ($) | 15,595 | 98.92¢ per $1 |
| Gini / Inequality Index | 15,595 | 0.50 |
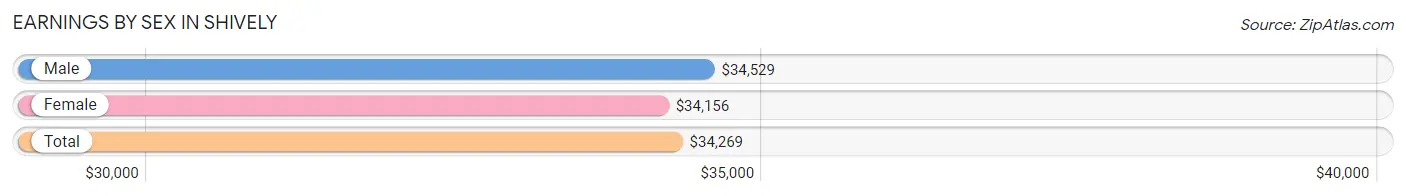
Earnings by Sex in Shively
Average Earnings in Shively are $34,269, $34,529 for men and $34,156 for women, a difference of 1.1%.
| Sex | Number | Average Earnings |
| Male | 3,793 (49.6%) | $34,529 |
| Female | 3,855 (50.4%) | $34,156 |
| Total | 7,648 (100.0%) | $34,269 |
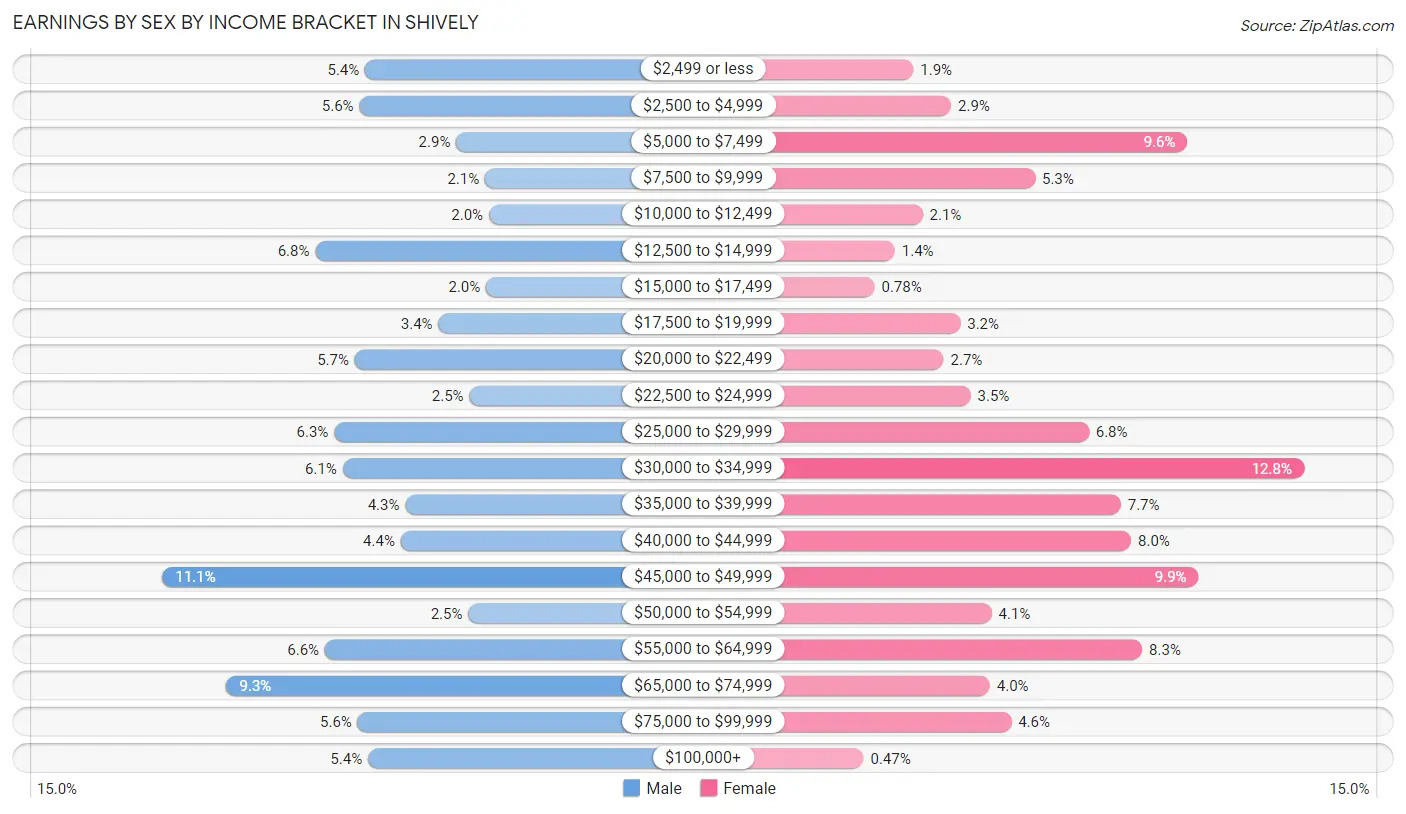
Earnings by Sex by Income Bracket in Shively
The most common earnings brackets in Shively are $45,000 to $49,999 for men (422 | 11.1%) and $30,000 to $34,999 for women (495 | 12.8%).
| Income | Male | Female |
| $2,499 or less | 206 (5.4%) | 72 (1.9%) |
| $2,500 to $4,999 | 212 (5.6%) | 113 (2.9%) |
| $5,000 to $7,499 | 109 (2.9%) | 369 (9.6%) |
| $7,500 to $9,999 | 78 (2.1%) | 204 (5.3%) |
| $10,000 to $12,499 | 74 (1.9%) | 82 (2.1%) |
| $12,500 to $14,999 | 259 (6.8%) | 52 (1.3%) |
| $15,000 to $17,499 | 77 (2.0%) | 30 (0.8%) |
| $17,500 to $19,999 | 128 (3.4%) | 123 (3.2%) |
| $20,000 to $22,499 | 217 (5.7%) | 105 (2.7%) |
| $22,500 to $24,999 | 95 (2.5%) | 134 (3.5%) |
| $25,000 to $29,999 | 239 (6.3%) | 262 (6.8%) |
| $30,000 to $34,999 | 230 (6.1%) | 495 (12.8%) |
| $35,000 to $39,999 | 163 (4.3%) | 297 (7.7%) |
| $40,000 to $44,999 | 168 (4.4%) | 308 (8.0%) |
| $45,000 to $49,999 | 422 (11.1%) | 381 (9.9%) |
| $50,000 to $54,999 | 96 (2.5%) | 157 (4.1%) |
| $55,000 to $64,999 | 249 (6.6%) | 320 (8.3%) |
| $65,000 to $74,999 | 354 (9.3%) | 155 (4.0%) |
| $75,000 to $99,999 | 214 (5.6%) | 178 (4.6%) |
| $100,000+ | 203 (5.3%) | 18 (0.5%) |
| Total | 3,793 (100.0%) | 3,855 (100.0%) |
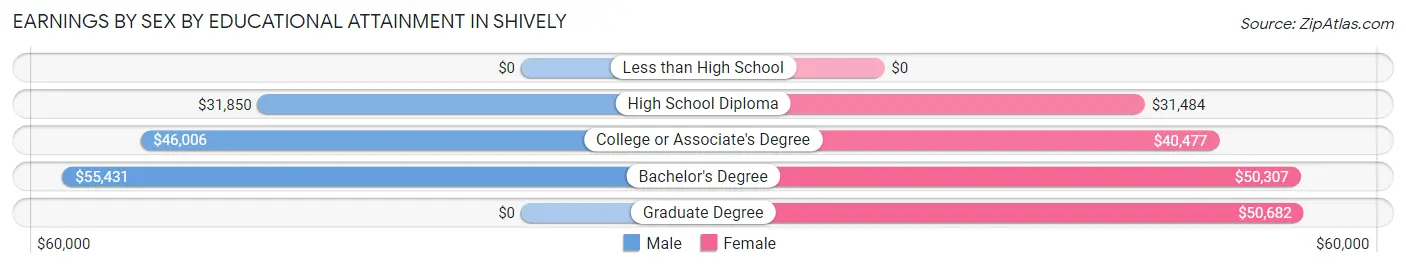
Earnings by Sex by Educational Attainment in Shively
Average earnings in Shively are $37,270 for men and $36,075 for women, a difference of 3.2%. Men with an educational attainment of bachelor's degree enjoy the highest average annual earnings of $55,431, while those with high school diploma education earn the least with $31,850. Women with an educational attainment of graduate degree earn the most with the average annual earnings of $50,682, while those with high school diploma education have the smallest earnings of $31,484.
| Educational Attainment | Male Income | Female Income |
| Less than High School | - | - |
| High School Diploma | $31,850 | $31,484 |
| College or Associate's Degree | $46,006 | $40,477 |
| Bachelor's Degree | $55,431 | $50,307 |
| Graduate Degree | - | - |
| Total | $37,270 | $36,075 |
Family Income in Shively
Family Income Brackets in Shively
According to the Shively family income data, there are 991 families falling into the $50,000 to $74,999 income range, which is the most common income bracket and makes up 27.4% of all families. Conversely, the $10,000 to $14,999 income bracket is the least frequent group with only 29 families (0.8%) belonging to this category.
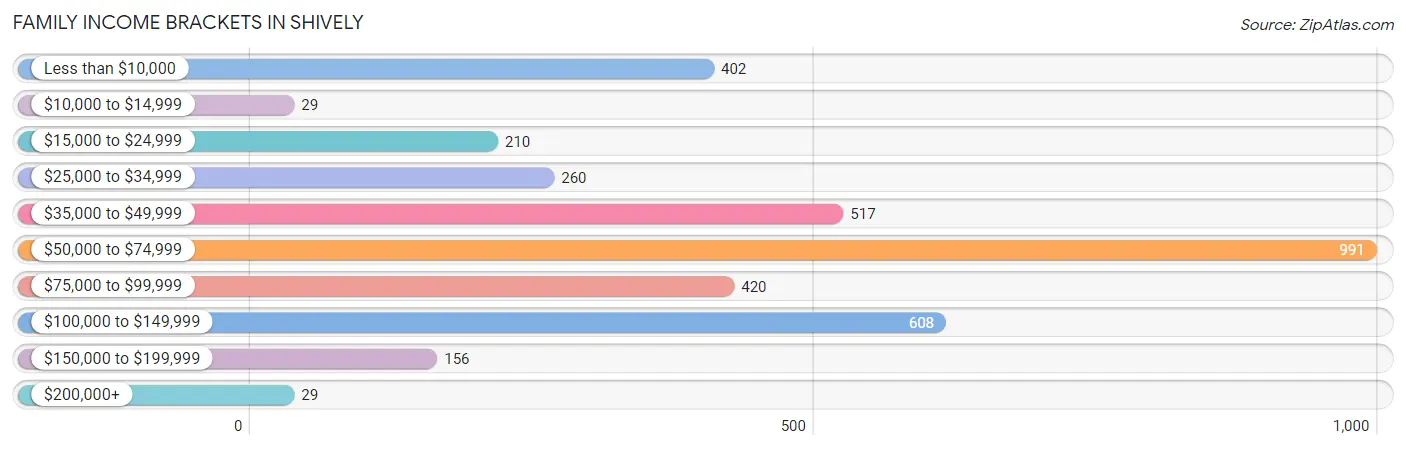
| Income Bracket | # Families | % Families |
| Less than $10,000 | 402 | 11.1% |
| $10,000 to $14,999 | 29 | 0.8% |
| $15,000 to $24,999 | 210 | 5.8% |
| $25,000 to $34,999 | 260 | 7.2% |
| $35,000 to $49,999 | 517 | 14.3% |
| $50,000 to $74,999 | 991 | 27.4% |
| $75,000 to $99,999 | 420 | 11.6% |
| $100,000 to $149,999 | 608 | 16.8% |
| $150,000 to $199,999 | 156 | 4.3% |
| $200,000+ | 29 | 0.8% |
Family Income by Famaliy Size in Shively
5-person families (288 | 8.0%) account for the highest median family income in Shively with $82,069 per family, while 2-person families (1,907 | 52.7%) have the highest median income of $26,125 per family member.
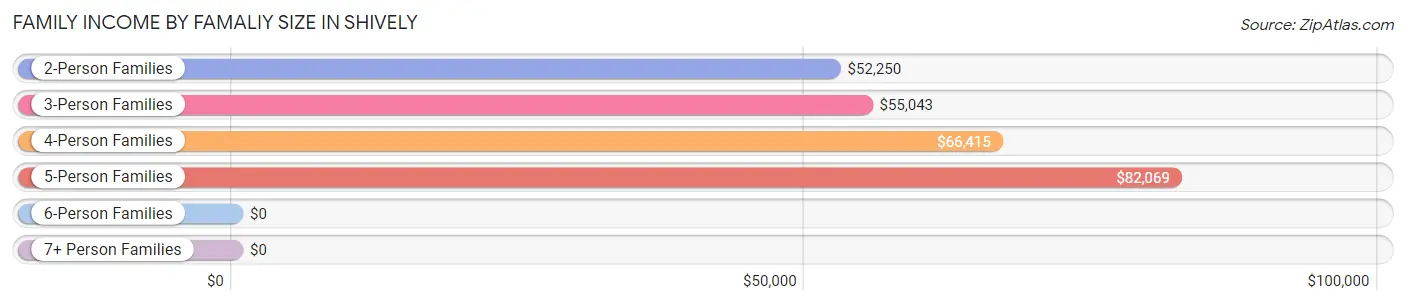
| Income Bracket | # Families | Median Income |
| 2-Person Families | 1,907 (52.7%) | $52,250 |
| 3-Person Families | 871 (24.1%) | $55,043 |
| 4-Person Families | 508 (14.0%) | $66,415 |
| 5-Person Families | 288 (8.0%) | $82,069 |
| 6-Person Families | 24 (0.7%) | $0 |
| 7+ Person Families | 20 (0.5%) | $0 |
| Total | 3,618 (100.0%) | $56,066 |
Family Income by Number of Earners in Shively
The median family income in Shively is $56,066, with families comprising 3+ earners (267) having the highest median family income of $102,611, while families with no earners (753) have the lowest median family income of $32,396, accounting for 7.4% and 20.8% of families, respectively.
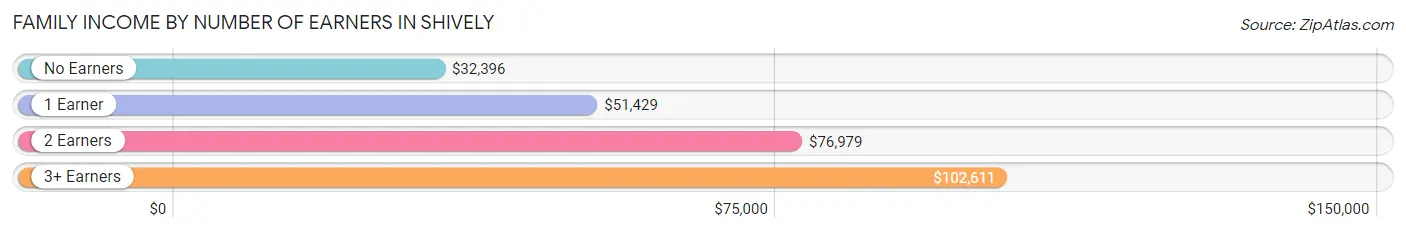
| Number of Earners | # Families | Median Income |
| No Earners | 753 (20.8%) | $32,396 |
| 1 Earner | 1,330 (36.8%) | $51,429 |
| 2 Earners | 1,268 (35.0%) | $76,979 |
| 3+ Earners | 267 (7.4%) | $102,611 |
| Total | 3,618 (100.0%) | $56,066 |
Household Income in Shively
Household Income Brackets in Shively
With 1,371 households falling in the category, the $50,000 to $74,999 income range is the most frequent in Shively, accounting for 19.8% of all households. In contrast, only 111 households (1.6%) fall into the $200,000+ income bracket, making it the least populous group.
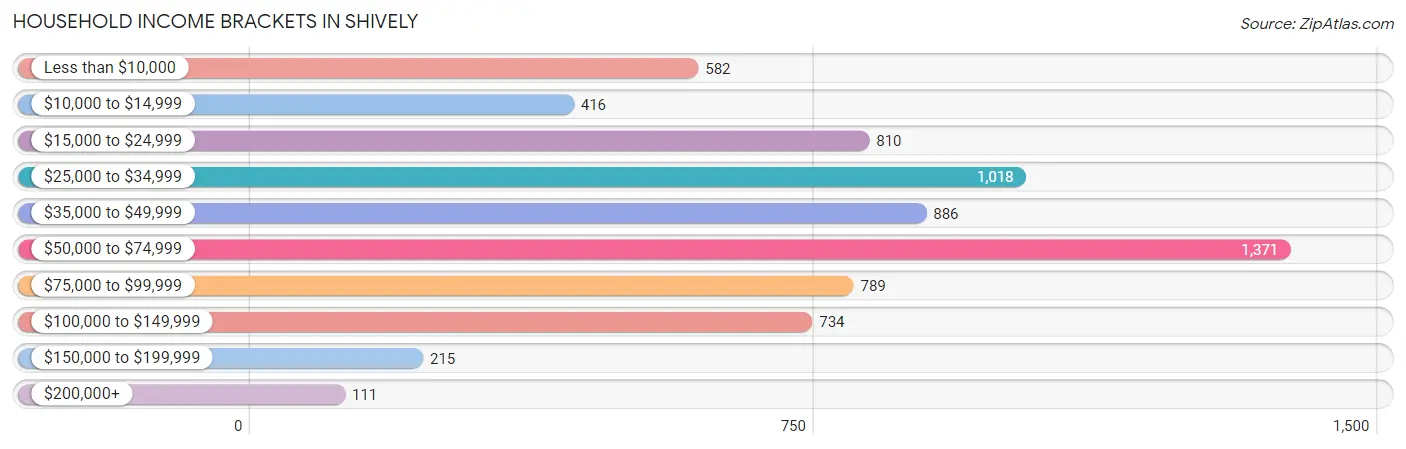
| Income Bracket | # Households | % Households |
| Less than $10,000 | 582 | 8.4% |
| $10,000 to $14,999 | 416 | 6.0% |
| $15,000 to $24,999 | 810 | 11.7% |
| $25,000 to $34,999 | 1,018 | 14.7% |
| $35,000 to $49,999 | 886 | 12.8% |
| $50,000 to $74,999 | 1,371 | 19.8% |
| $75,000 to $99,999 | 789 | 11.4% |
| $100,000 to $149,999 | 734 | 10.6% |
| $150,000 to $199,999 | 215 | 3.1% |
| $200,000+ | 111 | 1.6% |
Household Income by Householder Age in Shively
The median household income in Shively is $45,953, with the highest median household income of $56,386 found in the 45 to 64 years age bracket for the primary householder. A total of 2,899 households (41.9%) fall into this category. Meanwhile, the 65+ years age bracket for the primary householder has the lowest median household income of $27,213, with 2,243 households (32.4%) in this group.
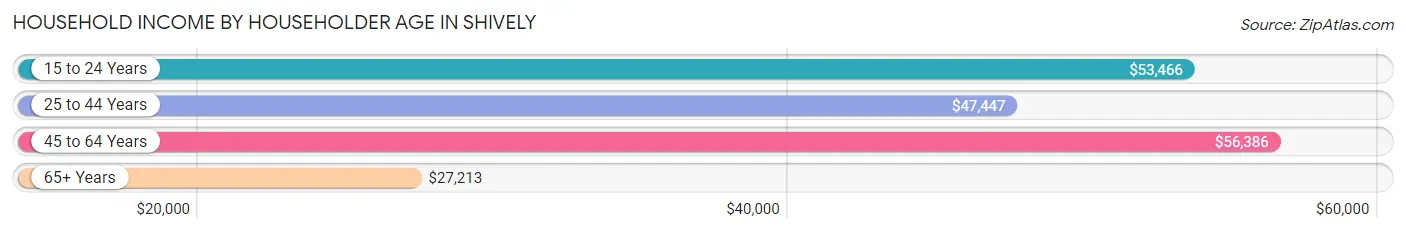
| Income Bracket | # Households | Median Income |
| 15 to 24 Years | 115 (1.7%) | $53,466 |
| 25 to 44 Years | 1,668 (24.1%) | $47,447 |
| 45 to 64 Years | 2,899 (41.9%) | $56,386 |
| 65+ Years | 2,243 (32.4%) | $27,213 |
| Total | 6,925 (100.0%) | $45,953 |
Poverty in Shively
Income Below Poverty by Sex and Age in Shively
With 17.9% poverty level for males and 20.2% for females among the residents of Shively, 15 year old males and 5 year old females are the most vulnerable to poverty, with 101 males (46.1%) and 77 females (89.5%) in their respective age groups living below the poverty level.
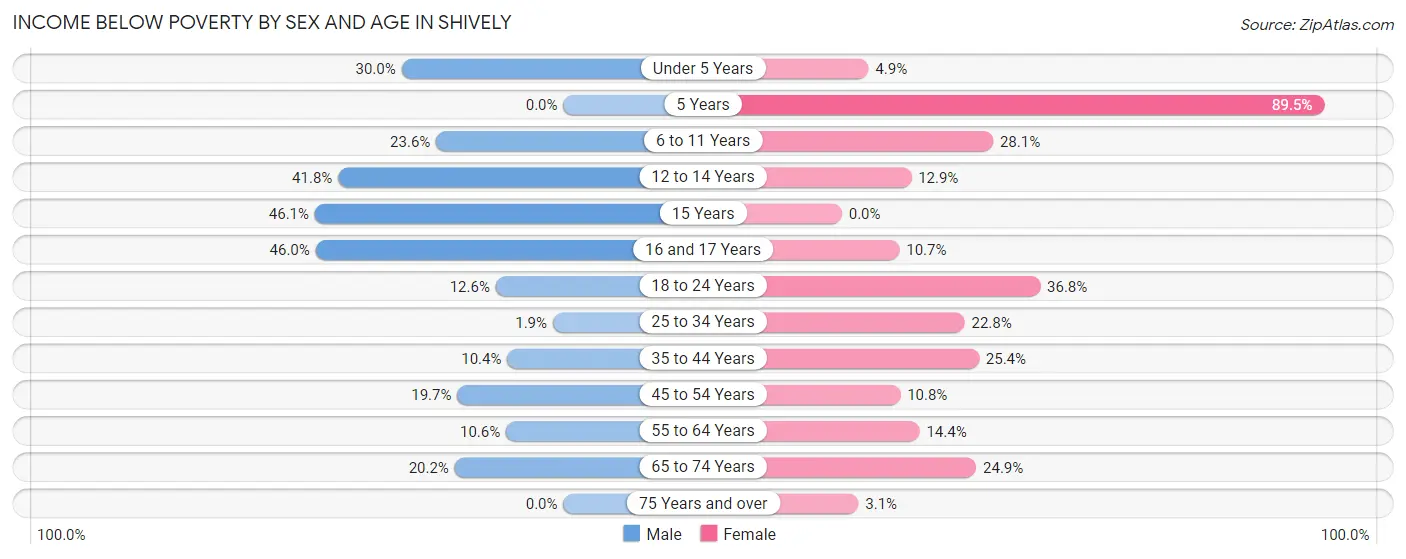
| Age Bracket | Male | Female |
| Under 5 Years | 94 (30.0%) | 13 (4.9%) |
| 5 Years | 0 (0.0%) | 77 (89.5%) |
| 6 to 11 Years | 161 (23.6%) | 156 (28.1%) |
| 12 to 14 Years | 135 (41.8%) | 59 (12.9%) |
| 15 Years | 101 (46.1%) | 0 (0.0%) |
| 16 and 17 Years | 149 (46.0%) | 16 (10.7%) |
| 18 to 24 Years | 63 (12.6%) | 159 (36.8%) |
| 25 to 34 Years | 15 (1.9%) | 177 (22.8%) |
| 35 to 44 Years | 83 (10.4%) | 287 (25.4%) |
| 45 to 54 Years | 208 (19.7%) | 125 (10.8%) |
| 55 to 64 Years | 122 (10.6%) | 150 (14.4%) |
| 65 to 74 Years | 210 (20.2%) | 337 (24.9%) |
| 75 Years and over | 0 (0.0%) | 9 (3.1%) |
| Total | 1,341 (17.9%) | 1,565 (20.2%) |
Income Above Poverty by Sex and Age in Shively
According to the poverty statistics in Shively, males aged 75 years and over and females aged 15 years are the age groups that are most secure financially, with 100.0% of males and 100.0% of females in these age groups living above the poverty line.
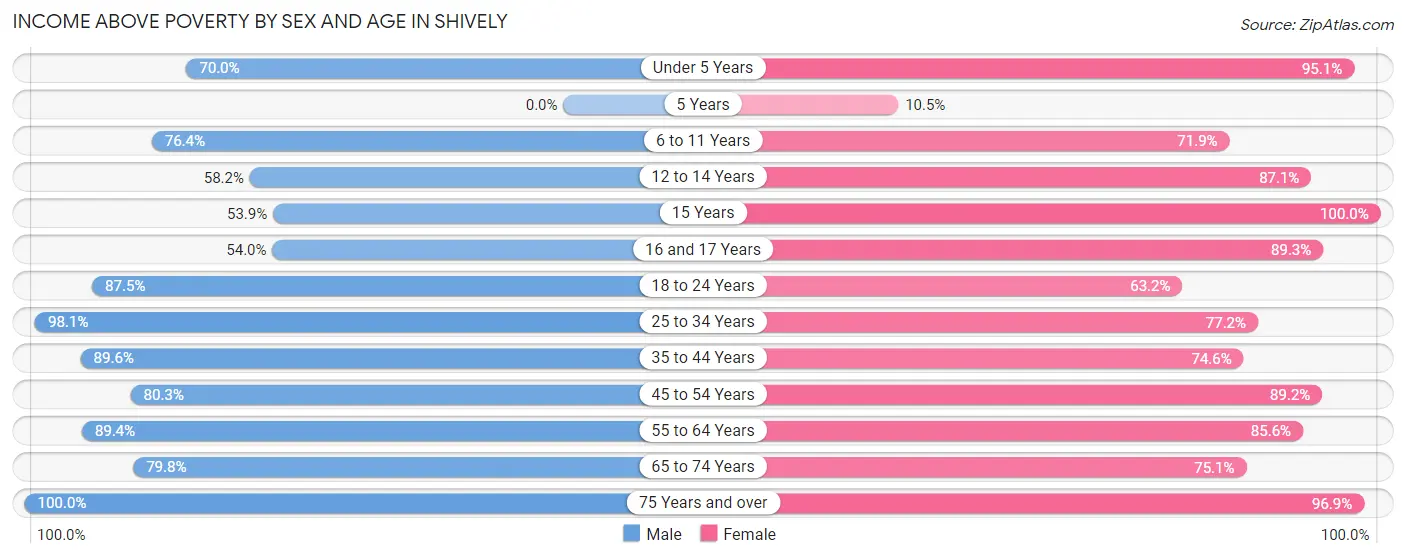
| Age Bracket | Male | Female |
| Under 5 Years | 219 (70.0%) | 250 (95.1%) |
| 5 Years | 0 (0.0%) | 9 (10.5%) |
| 6 to 11 Years | 521 (76.4%) | 400 (71.9%) |
| 12 to 14 Years | 188 (58.2%) | 399 (87.1%) |
| 15 Years | 118 (53.9%) | 58 (100.0%) |
| 16 and 17 Years | 175 (54.0%) | 134 (89.3%) |
| 18 to 24 Years | 439 (87.5%) | 273 (63.2%) |
| 25 to 34 Years | 759 (98.1%) | 600 (77.2%) |
| 35 to 44 Years | 714 (89.6%) | 841 (74.6%) |
| 45 to 54 Years | 849 (80.3%) | 1,028 (89.2%) |
| 55 to 64 Years | 1,026 (89.4%) | 890 (85.6%) |
| 65 to 74 Years | 831 (79.8%) | 1,015 (75.1%) |
| 75 Years and over | 326 (100.0%) | 284 (96.9%) |
| Total | 6,165 (82.1%) | 6,181 (79.8%) |
Income Below Poverty Among Married-Couple Families in Shively
The poverty statistics for married-couple families in Shively show that 6.8% or 111 of the total 1,635 families live below the poverty line. Families with no children have the highest poverty rate of 9.9%, comprising of 111 families. On the other hand, families with 1 or 2 children have the lowest poverty rate of 0.0%, which includes 0 families.
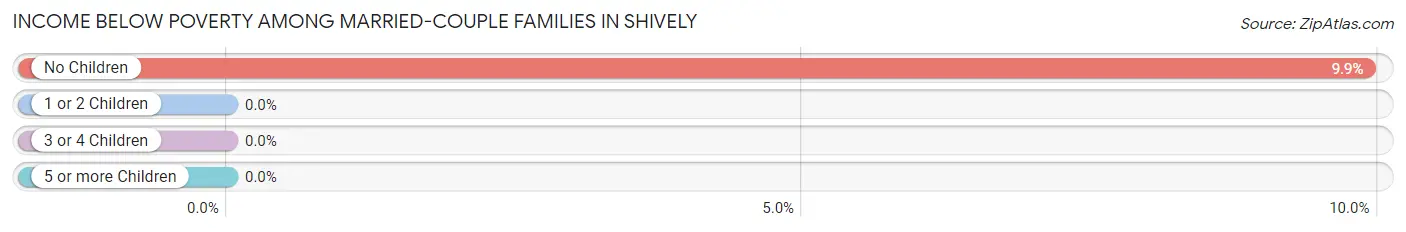
| Children | Above Poverty | Below Poverty |
| No Children | 1,010 (90.1%) | 111 (9.9%) |
| 1 or 2 Children | 426 (100.0%) | 0 (0.0%) |
| 3 or 4 Children | 88 (100.0%) | 0 (0.0%) |
| 5 or more Children | 0 (0.0%) | 0 (0.0%) |
| Total | 1,524 (93.2%) | 111 (6.8%) |
Income Below Poverty Among Single-Parent Households in Shively
According to the poverty data in Shively, 14.3% or 95 single-father households and 29.6% or 391 single-mother households are living below the poverty line. Among single-father households, those with 3 or 4 children have the highest poverty rate, with 24 households (100.0%) experiencing poverty. Likewise, among single-mother households, those with 3 or 4 children have the highest poverty rate, with 74 households (92.5%) falling below the poverty line.
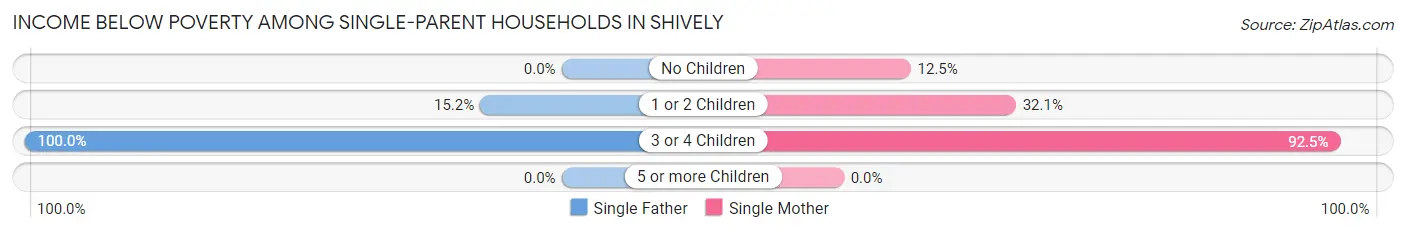
| Children | Single Father | Single Mother |
| No Children | 0 (0.0%) | 51 (12.5%) |
| 1 or 2 Children | 71 (15.2%) | 266 (32.1%) |
| 3 or 4 Children | 24 (100.0%) | 74 (92.5%) |
| 5 or more Children | 0 (0.0%) | 0 (0.0%) |
| Total | 95 (14.3%) | 391 (29.6%) |
Income Below Poverty Among Married-Couple vs Single-Parent Households in Shively
The poverty data for Shively shows that 111 of the married-couple family households (6.8%) and 486 of the single-parent households (24.5%) are living below the poverty level. Within the married-couple family households, those with no children have the highest poverty rate, with 111 households (9.9%) falling below the poverty line. Among the single-parent households, those with 3 or 4 children have the highest poverty rate, with 98 household (94.2%) living below poverty.
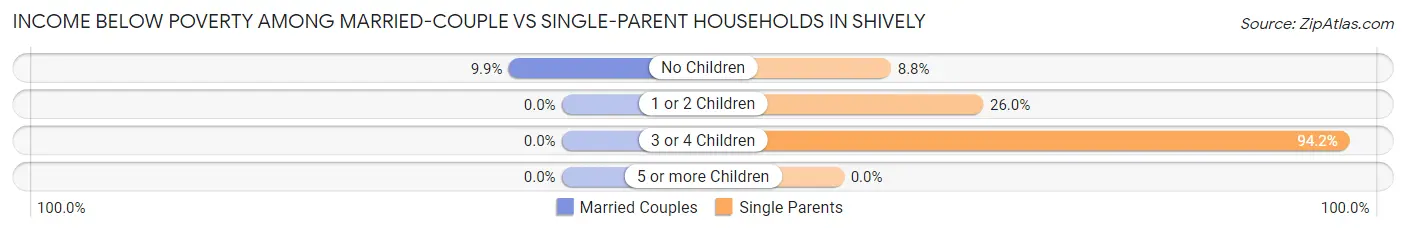
| Children | Married-Couple Families | Single-Parent Households |
| No Children | 111 (9.9%) | 51 (8.8%) |
| 1 or 2 Children | 0 (0.0%) | 337 (26.0%) |
| 3 or 4 Children | 0 (0.0%) | 98 (94.2%) |
| 5 or more Children | 0 (0.0%) | 0 (0.0%) |
| Total | 111 (6.8%) | 486 (24.5%) |
Race in Shively
The most populous races in Shively are Black / African American (8,260 | 53.0%), White / Caucasian (6,142 | 39.4%), and Two or more Races (1,097 | 7.0%).
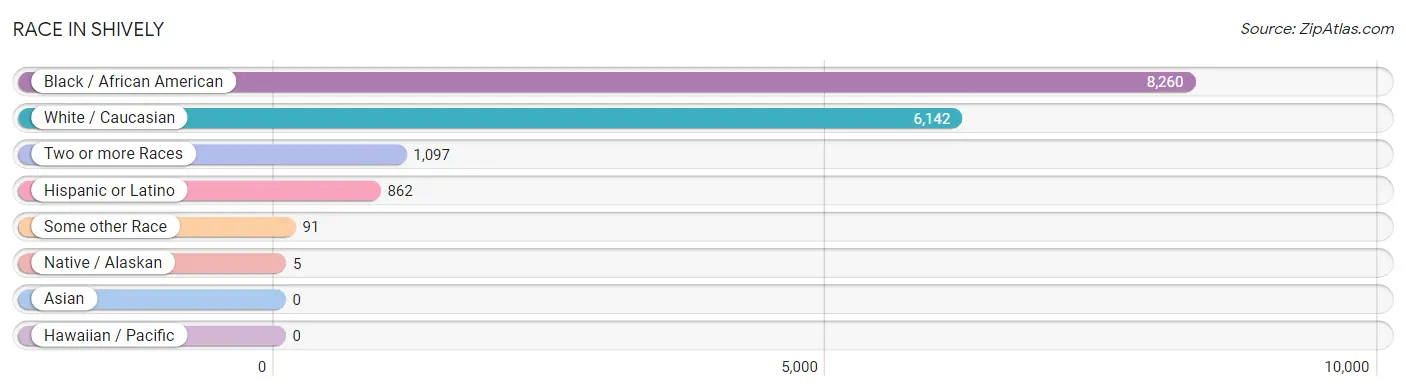
| Race | # Population | % Population |
| Asian | 0 | 0.0% |
| Black / African American | 8,260 | 53.0% |
| Hawaiian / Pacific | 0 | 0.0% |
| Hispanic or Latino | 862 | 5.5% |
| Native / Alaskan | 5 | 0.0% |
| White / Caucasian | 6,142 | 39.4% |
| Two or more Races | 1,097 | 7.0% |
| Some other Race | 91 | 0.6% |
| Total | 15,595 | 100.0% |
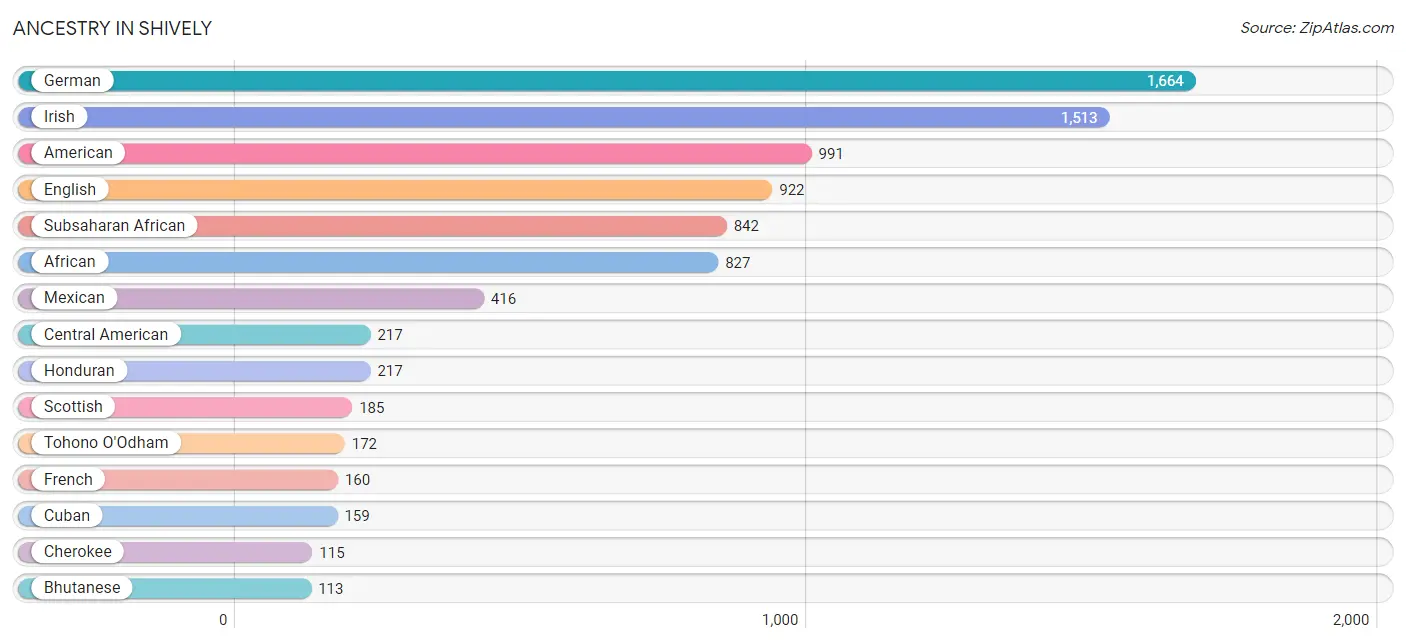
Ancestry in Shively
The most populous ancestries reported in Shively are German (1,664 | 10.7%), Irish (1,513 | 9.7%), American (991 | 6.4%), English (922 | 5.9%), and Subsaharan African (842 | 5.4%), together accounting for 38.0% of all Shively residents.
| Ancestry | # Population | % Population |
| African | 827 | 5.3% |
| American | 991 | 6.4% |
| Arab | 9 | 0.1% |
| Australian | 10 | 0.1% |
| Bhutanese | 113 | 0.7% |
| Blackfeet | 5 | 0.0% |
| British | 23 | 0.2% |
| British West Indian | 99 | 0.6% |
| Burmese | 113 | 0.7% |
| Central American | 217 | 1.4% |
| Cherokee | 115 | 0.7% |
| Colombian | 18 | 0.1% |
| Cuban | 159 | 1.0% |
| Danish | 10 | 0.1% |
| Dutch | 65 | 0.4% |
| English | 922 | 5.9% |
| European | 89 | 0.6% |
| French | 160 | 1.0% |
| French Canadian | 55 | 0.4% |
| German | 1,664 | 10.7% |
| Haitian | 63 | 0.4% |
| Honduran | 217 | 1.4% |
| Indian (Asian) | 113 | 0.7% |
| Irish | 1,513 | 9.7% |
| Italian | 73 | 0.5% |
| Korean | 113 | 0.7% |
| Mexican | 416 | 2.7% |
| Norwegian | 17 | 0.1% |
| Palestinian | 9 | 0.1% |
| Polish | 47 | 0.3% |
| Puerto Rican | 52 | 0.3% |
| Russian | 11 | 0.1% |
| Scotch-Irish | 43 | 0.3% |
| Scottish | 185 | 1.2% |
| Sioux | 5 | 0.0% |
| South American | 18 | 0.1% |
| Sri Lankan | 113 | 0.7% |
| Subsaharan African | 842 | 5.4% |
| Swedish | 24 | 0.2% |
| Thai | 113 | 0.7% |
| Tohono O'Odham | 172 | 1.1% |
| Welsh | 25 | 0.2% | View All 42 Rows |
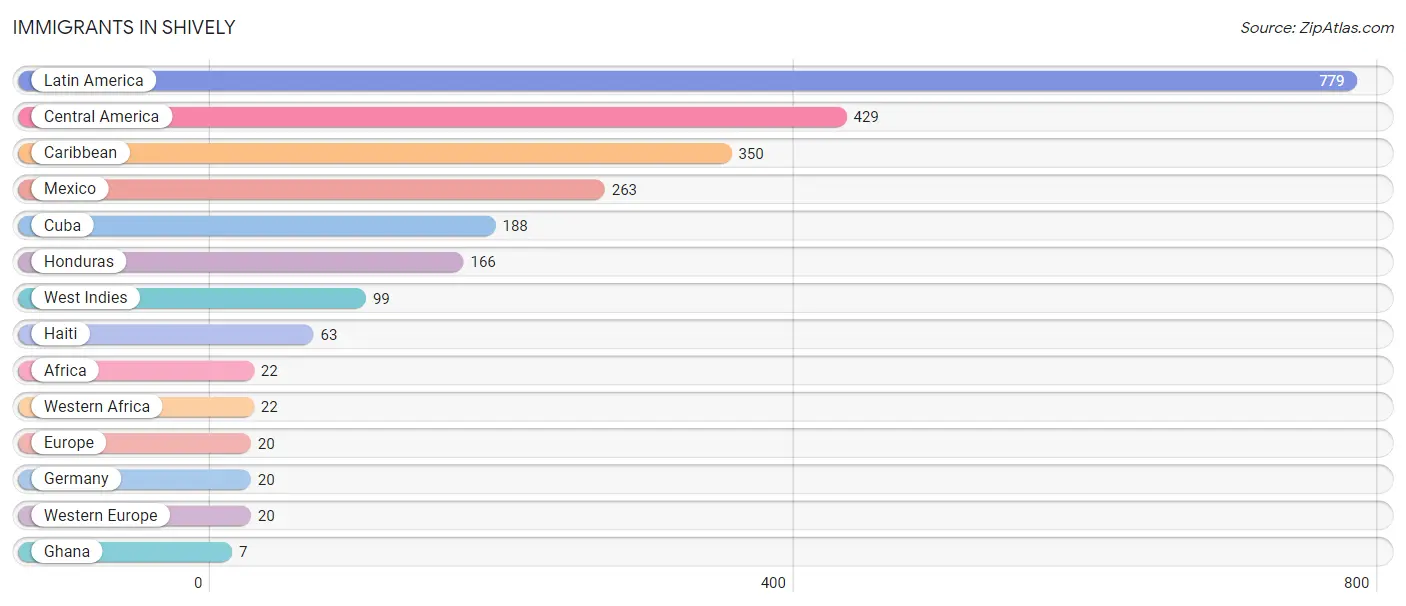
Immigrants in Shively
The most numerous immigrant groups reported in Shively came from Latin America (779 | 5.0%), Central America (429 | 2.8%), Caribbean (350 | 2.2%), Mexico (263 | 1.7%), and Cuba (188 | 1.2%), together accounting for 12.9% of all Shively residents.
| Immigration Origin | # Population | % Population |
| Africa | 22 | 0.1% |
| Caribbean | 350 | 2.2% |
| Central America | 429 | 2.8% |
| Cuba | 188 | 1.2% |
| Europe | 20 | 0.1% |
| Germany | 20 | 0.1% |
| Ghana | 7 | 0.0% |
| Haiti | 63 | 0.4% |
| Honduras | 166 | 1.1% |
| Latin America | 779 | 5.0% |
| Mexico | 263 | 1.7% |
| West Indies | 99 | 0.6% |
| Western Africa | 22 | 0.1% |
| Western Europe | 20 | 0.1% | View All 14 Rows |
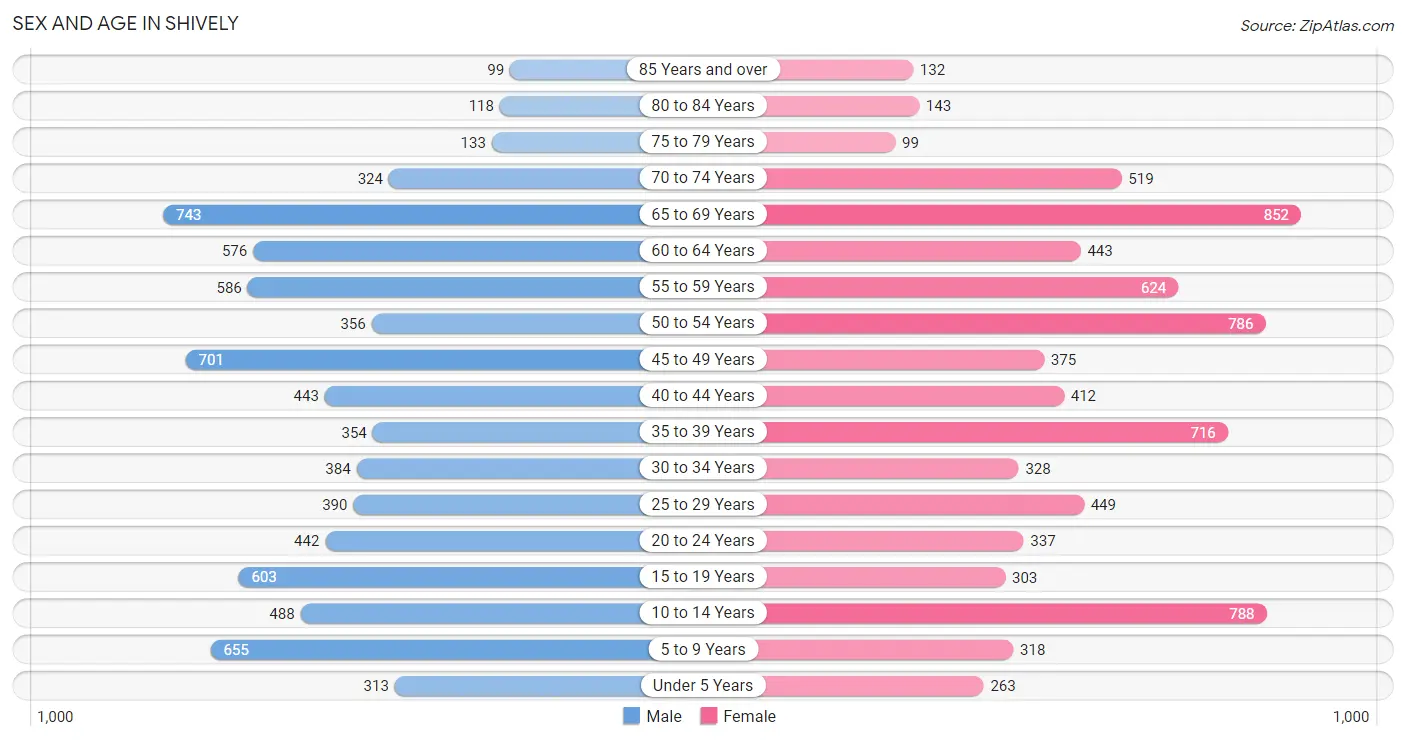
Sex and Age in Shively
Sex and Age in Shively
The most populous age groups in Shively are 65 to 69 Years (743 | 9.6%) for men and 65 to 69 Years (852 | 10.8%) for women.
| Age Bracket | Male | Female |
| Under 5 Years | 313 (4.1%) | 263 (3.3%) |
| 5 to 9 Years | 655 (8.5%) | 318 (4.0%) |
| 10 to 14 Years | 488 (6.3%) | 788 (10.0%) |
| 15 to 19 Years | 603 (7.8%) | 303 (3.8%) |
| 20 to 24 Years | 442 (5.7%) | 337 (4.3%) |
| 25 to 29 Years | 390 (5.1%) | 449 (5.7%) |
| 30 to 34 Years | 384 (5.0%) | 328 (4.2%) |
| 35 to 39 Years | 354 (4.6%) | 716 (9.1%) |
| 40 to 44 Years | 443 (5.8%) | 412 (5.2%) |
| 45 to 49 Years | 701 (9.1%) | 375 (4.8%) |
| 50 to 54 Years | 356 (4.6%) | 786 (10.0%) |
| 55 to 59 Years | 586 (7.6%) | 624 (7.9%) |
| 60 to 64 Years | 576 (7.5%) | 443 (5.6%) |
| 65 to 69 Years | 743 (9.6%) | 852 (10.8%) |
| 70 to 74 Years | 324 (4.2%) | 519 (6.6%) |
| 75 to 79 Years | 133 (1.7%) | 99 (1.3%) |
| 80 to 84 Years | 118 (1.5%) | 143 (1.8%) |
| 85 Years and over | 99 (1.3%) | 132 (1.7%) |
| Total | 7,708 (100.0%) | 7,887 (100.0%) |
Families and Households in Shively
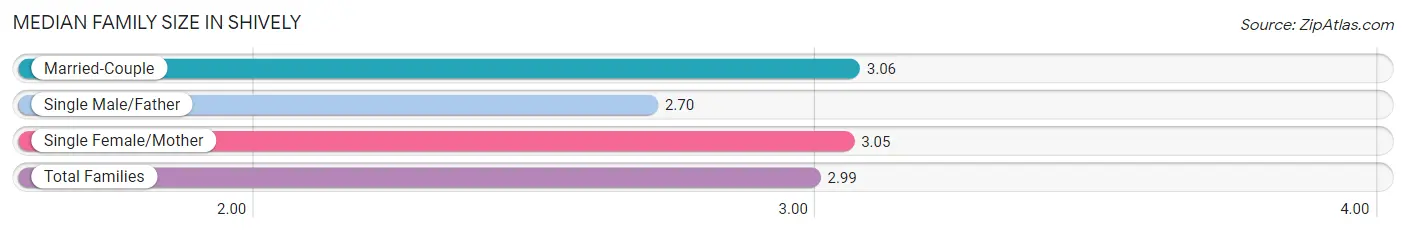
Median Family Size in Shively
The median family size in Shively is 2.99 persons per family, with married-couple families (1,635 | 45.2%) accounting for the largest median family size of 3.06 persons per family. On the other hand, single male/father families (664 | 18.3%) represent the smallest median family size with 2.70 persons per family.
| Family Type | # Families | Family Size |
| Married-Couple | 1,635 (45.2%) | 3.06 |
| Single Male/Father | 664 (18.3%) | 2.70 |
| Single Female/Mother | 1,319 (36.5%) | 3.05 |
| Total Families | 3,618 (100.0%) | 2.99 |
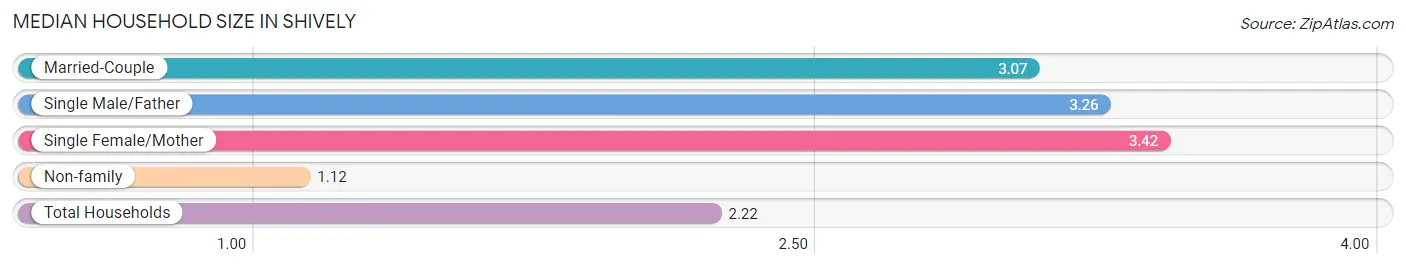
Median Household Size in Shively
The median household size in Shively is 2.22 persons per household, with single female/mother households (1,319 | 19.1%) accounting for the largest median household size of 3.42 persons per household. non-family households (3,307 | 47.7%) represent the smallest median household size with 1.12 persons per household.
| Household Type | # Households | Household Size |
| Married-Couple | 1,635 (23.6%) | 3.07 |
| Single Male/Father | 664 (9.6%) | 3.26 |
| Single Female/Mother | 1,319 (19.1%) | 3.42 |
| Non-family | 3,307 (47.7%) | 1.12 |
| Total Households | 6,925 (100.0%) | 2.22 |
Household Size by Marriage Status in Shively
Out of a total of 6,925 households in Shively, 3,618 (52.2%) are family households, while 3,307 (47.7%) are nonfamily households. The most numerous type of family households are 2-person households, comprising 1,645, and the most common type of nonfamily households are 1-person households, comprising 3,016.
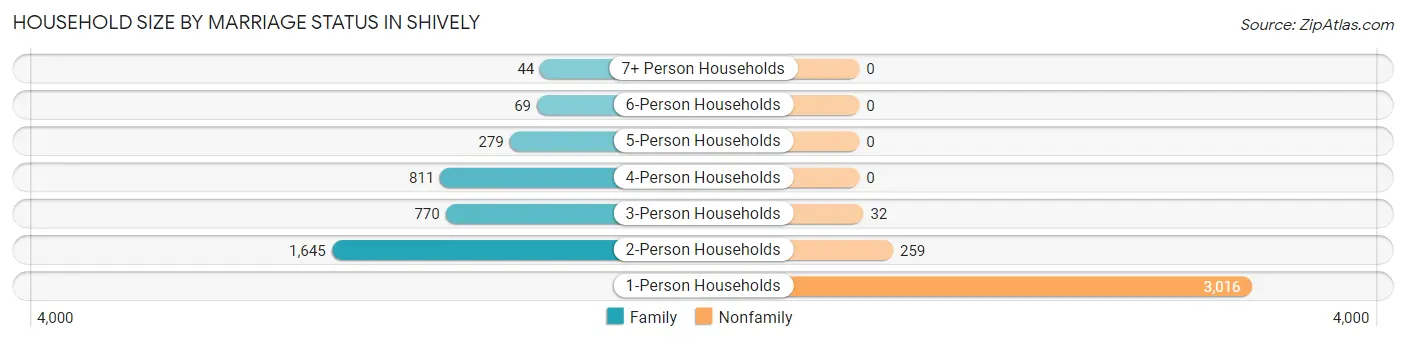
| Household Size | Family Households | Nonfamily Households |
| 1-Person Households | - | 3,016 (43.5%) |
| 2-Person Households | 1,645 (23.7%) | 259 (3.7%) |
| 3-Person Households | 770 (11.1%) | 32 (0.5%) |
| 4-Person Households | 811 (11.7%) | 0 (0.0%) |
| 5-Person Households | 279 (4.0%) | 0 (0.0%) |
| 6-Person Households | 69 (1.0%) | 0 (0.0%) |
| 7+ Person Households | 44 (0.6%) | 0 (0.0%) |
| Total | 3,618 (52.2%) | 3,307 (47.7%) |
Female Fertility in Shively
Fertility by Age in Shively
Average fertility rate in Shively is 24.0 births per 1,000 women. Women in the age bracket of 35 to 50 years have the highest fertility rate with 28.0 births per 1,000 women. Women in the age bracket of 35 to 50 years acount for 61.3% of all women with births.
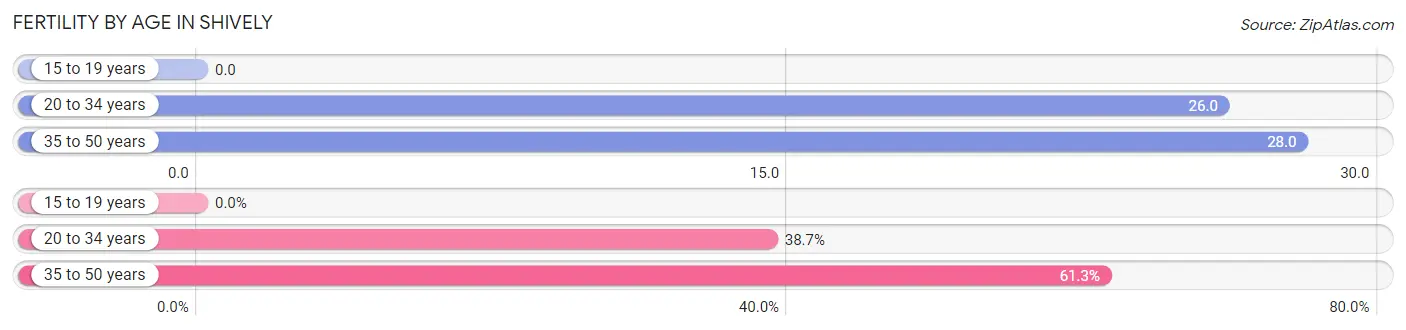
| Age Bracket | Women with Births | Births / 1,000 Women |
| 15 to 19 years | 0 (0.0%) | 0.0 |
| 20 to 34 years | 29 (38.7%) | 26.0 |
| 35 to 50 years | 46 (61.3%) | 28.0 |
| Total | 75 (100.0%) | 24.0 |
Fertility by Age by Marriage Status in Shively
38.7% of women with births (75) in Shively are married. The highest percentage of unmarried women with births falls into 35 to 50 years age bracket with 100.0% of them unmarried at the time of birth, while the lowest percentage of unmarried women with births belong to 20 to 34 years age bracket with 0.0% of them unmarried.
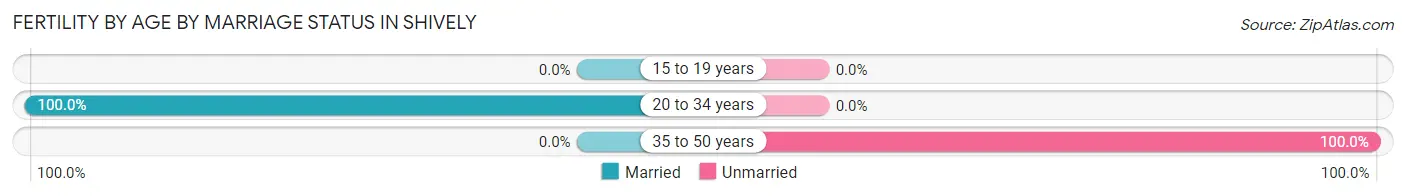
| Age Bracket | Married | Unmarried |
| 15 to 19 years | 0 (0.0%) | 0 (0.0%) |
| 20 to 34 years | 29 (100.0%) | 0 (0.0%) |
| 35 to 50 years | 0 (0.0%) | 46 (100.0%) |
| Total | 29 (38.7%) | 46 (61.3%) |
Fertility by Education in Shively
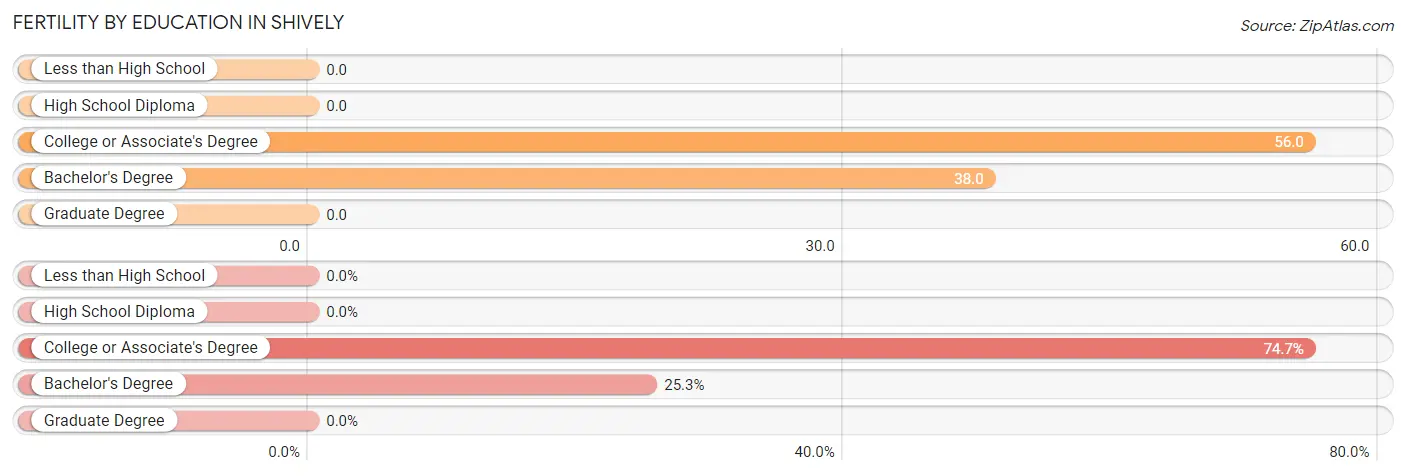
| Educational Attainment | Women with Births | Births / 1,000 Women |
| Less than High School | 0 (0.0%) | 0.0 |
| High School Diploma | 0 (0.0%) | 0.0 |
| College or Associate's Degree | 56 (74.7%) | 56.0 |
| Bachelor's Degree | 19 (25.3%) | 38.0 |
| Graduate Degree | 0 (0.0%) | 0.0 |
| Total | 75 (100.0%) | 24.0 |
Fertility by Education by Marriage Status in Shively
61.3% of women with births in Shively are unmarried. Women with the educational attainment of college or associate's degree are most likely to be married with 51.8% of them married at childbirth, while women with the educational attainment of bachelor's degree are least likely to be married with 100.0% of them unmarried at childbirth.
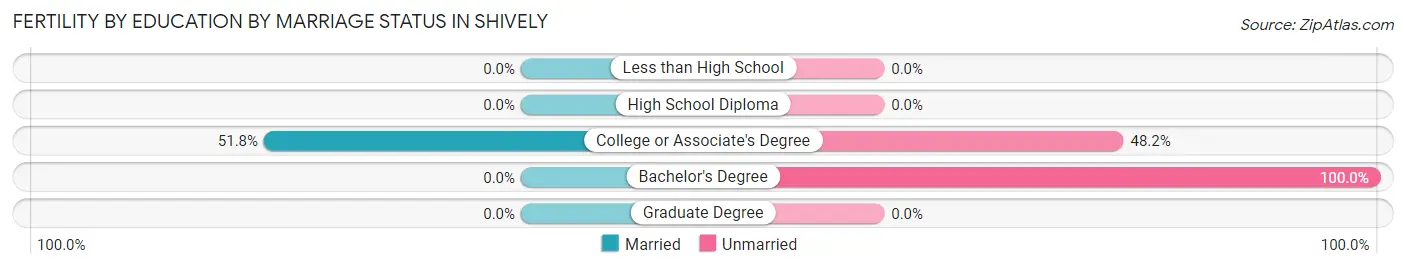
| Educational Attainment | Married | Unmarried |
| Less than High School | 0 (0.0%) | 0 (0.0%) |
| High School Diploma | 0 (0.0%) | 0 (0.0%) |
| College or Associate's Degree | 29 (51.8%) | 27 (48.2%) |
| Bachelor's Degree | 0 (0.0%) | 19 (100.0%) |
| Graduate Degree | 0 (0.0%) | 0 (0.0%) |
| Total | 29 (38.7%) | 46 (61.3%) |
Employment Characteristics in Shively
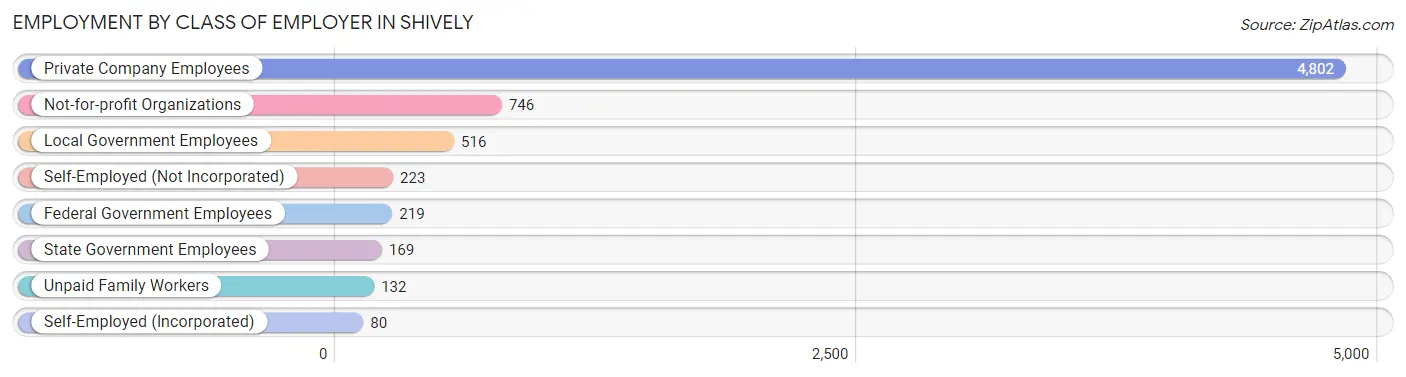
Employment by Class of Employer in Shively
Among the 6,887 employed individuals in Shively, private company employees (4,802 | 69.7%), not-for-profit organizations (746 | 10.8%), and local government employees (516 | 7.5%) make up the most common classes of employment.
| Employer Class | # Employees | % Employees |
| Private Company Employees | 4,802 | 69.7% |
| Self-Employed (Incorporated) | 80 | 1.2% |
| Self-Employed (Not Incorporated) | 223 | 3.2% |
| Not-for-profit Organizations | 746 | 10.8% |
| Local Government Employees | 516 | 7.5% |
| State Government Employees | 169 | 2.5% |
| Federal Government Employees | 219 | 3.2% |
| Unpaid Family Workers | 132 | 1.9% |
| Total | 6,887 | 100.0% |
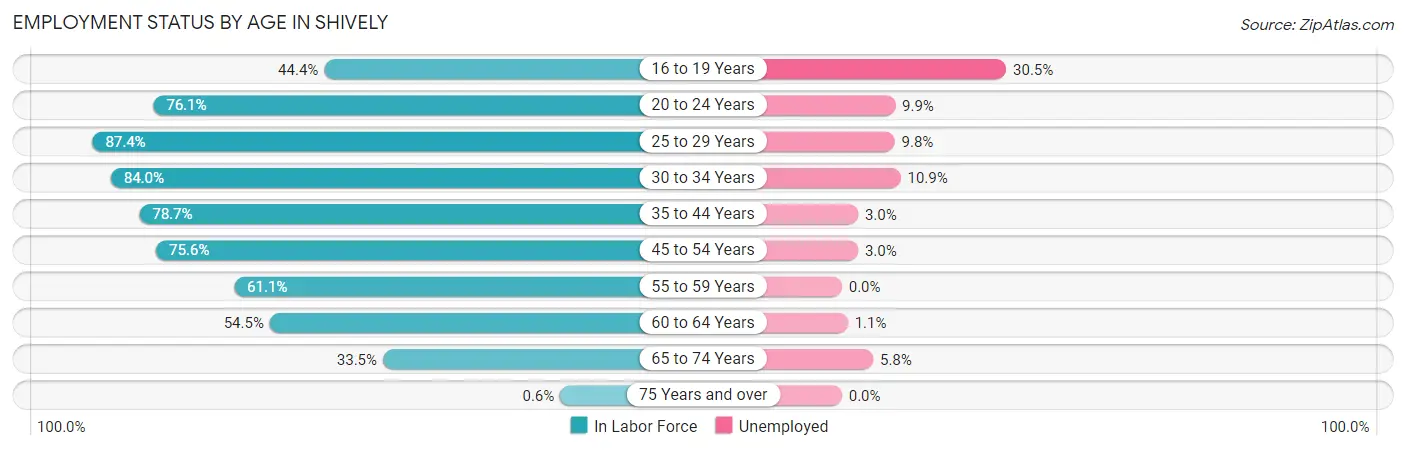
Employment Status by Age in Shively
According to the labor force statistics for Shively, out of the total population over 16 years of age (12,493), 60.1% or 7,508 individuals are in the labor force, with 5.7% or 428 of them unemployed. The age group with the highest labor force participation rate is 25 to 29 years, with 87.4% or 733 individuals in the labor force. Within the labor force, the 16 to 19 years age range has the highest percentage of unemployed individuals, with 30.5% or 85 of them being unemployed.
| Age Bracket | In Labor Force | Unemployed |
| 16 to 19 Years | 279 (44.4%) | 85 (30.5%) |
| 20 to 24 Years | 593 (76.1%) | 59 (9.9%) |
| 25 to 29 Years | 733 (87.4%) | 72 (9.8%) |
| 30 to 34 Years | 598 (84.0%) | 65 (10.9%) |
| 35 to 44 Years | 1,515 (78.7%) | 45 (3.0%) |
| 45 to 54 Years | 1,677 (75.6%) | 50 (3.0%) |
| 55 to 59 Years | 739 (61.1%) | 0 (0.0%) |
| 60 to 64 Years | 555 (54.5%) | 6 (1.1%) |
| 65 to 74 Years | 817 (33.5%) | 47 (5.8%) |
| 75 Years and over | 4 (0.6%) | 0 (0.0%) |
| Total | 7,508 (60.1%) | 428 (5.7%) |
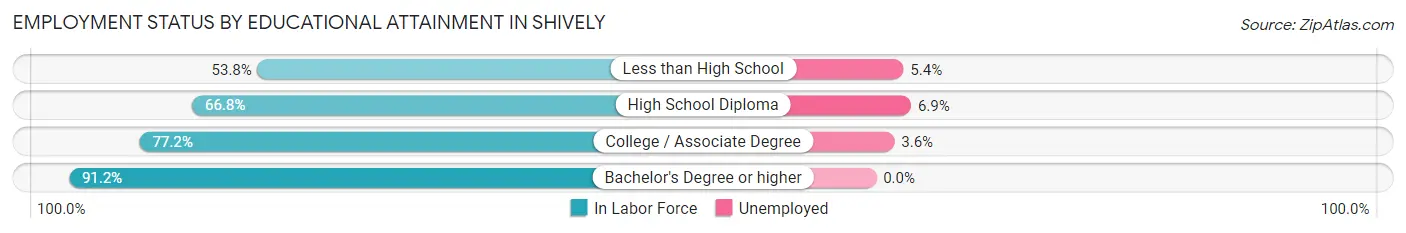
Employment Status by Educational Attainment in Shively
According to labor force statistics for Shively, 73.4% of individuals (5,815) out of the total population between 25 and 64 years of age (7,923) are in the labor force, with 4.1% or 238 of them being unemployed. The group with the highest labor force participation rate are those with the educational attainment of bachelor's degree or higher, with 91.2% or 1,146 individuals in the labor force. Within the labor force, individuals with high school diploma education have the highest percentage of unemployment, with 6.9% or 137 of them being unemployed.
| Educational Attainment | In Labor Force | Unemployed |
| Less than High School | 388 (53.8%) | 39 (5.4%) |
| High School Diploma | 1,979 (66.8%) | 204 (6.9%) |
| College / Associate Degree | 2,303 (77.2%) | 107 (3.6%) |
| Bachelor's Degree or higher | 1,146 (91.2%) | 0 (0.0%) |
| Total | 5,815 (73.4%) | 325 (4.1%) |
Employment Occupations by Sex in Shively
Management, Business, Science and Arts Occupations
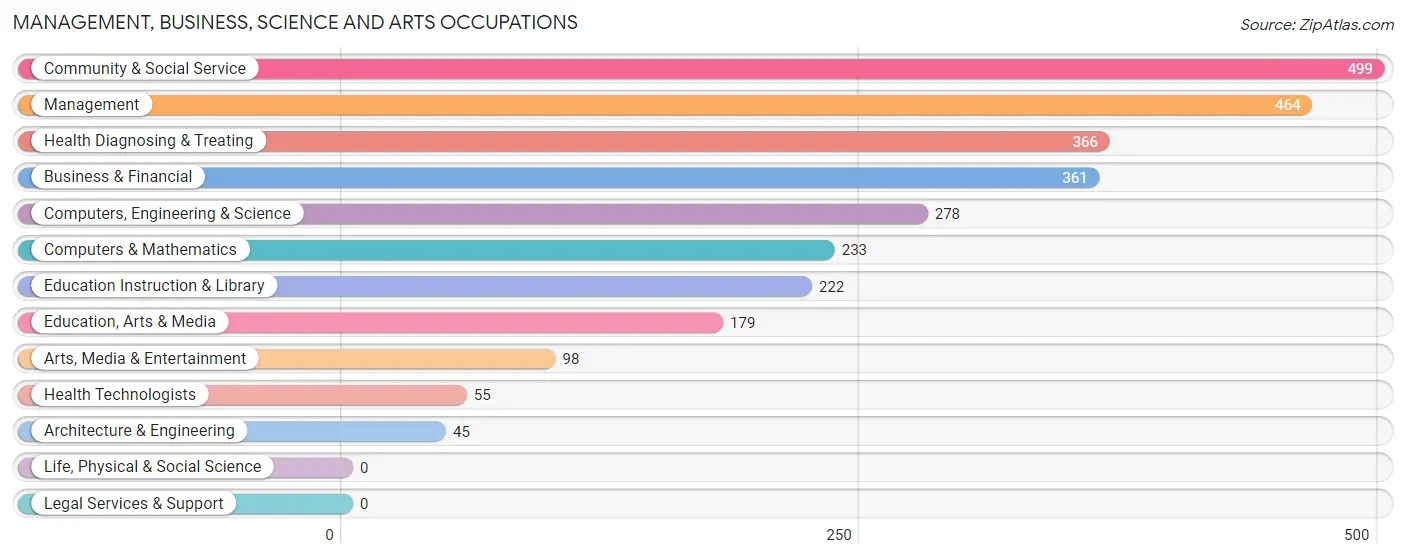
The most common Management, Business, Science and Arts occupations in Shively are Community & Social Service (499 | 7.0%), Management (464 | 6.6%), Health Diagnosing & Treating (366 | 5.2%), Business & Financial (361 | 5.1%), and Computers, Engineering & Science (278 | 3.9%).
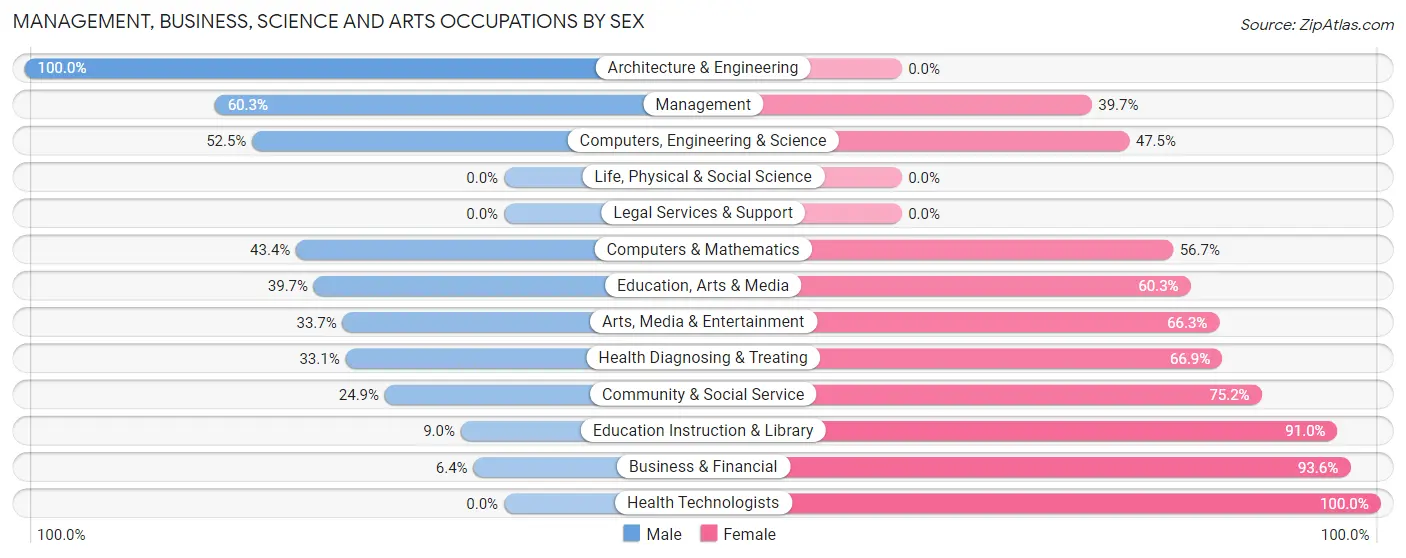
Management, Business, Science and Arts Occupations by Sex
Within the Management, Business, Science and Arts occupations in Shively, the most male-oriented occupations are Architecture & Engineering (100.0%), Management (60.3%), and Computers, Engineering & Science (52.5%), while the most female-oriented occupations are Health Technologists (100.0%), Business & Financial (93.6%), and Education Instruction & Library (91.0%).
| Occupation | Male | Female |
| Management | 280 (60.3%) | 184 (39.7%) |
| Business & Financial | 23 (6.4%) | 338 (93.6%) |
| Computers, Engineering & Science | 146 (52.5%) | 132 (47.5%) |
| Computers & Mathematics | 101 (43.3%) | 132 (56.7%) |
| Architecture & Engineering | 45 (100.0%) | 0 (0.0%) |
| Life, Physical & Social Science | 0 (0.0%) | 0 (0.0%) |
| Community & Social Service | 124 (24.8%) | 375 (75.1%) |
| Education, Arts & Media | 71 (39.7%) | 108 (60.3%) |
| Legal Services & Support | 0 (0.0%) | 0 (0.0%) |
| Education Instruction & Library | 20 (9.0%) | 202 (91.0%) |
| Arts, Media & Entertainment | 33 (33.7%) | 65 (66.3%) |
| Health Diagnosing & Treating | 121 (33.1%) | 245 (66.9%) |
| Health Technologists | 0 (0.0%) | 55 (100.0%) |
| Total (Category) | 694 (35.3%) | 1,274 (64.7%) |
| Total (Overall) | 3,345 (47.3%) | 3,733 (52.7%) |
Services Occupations
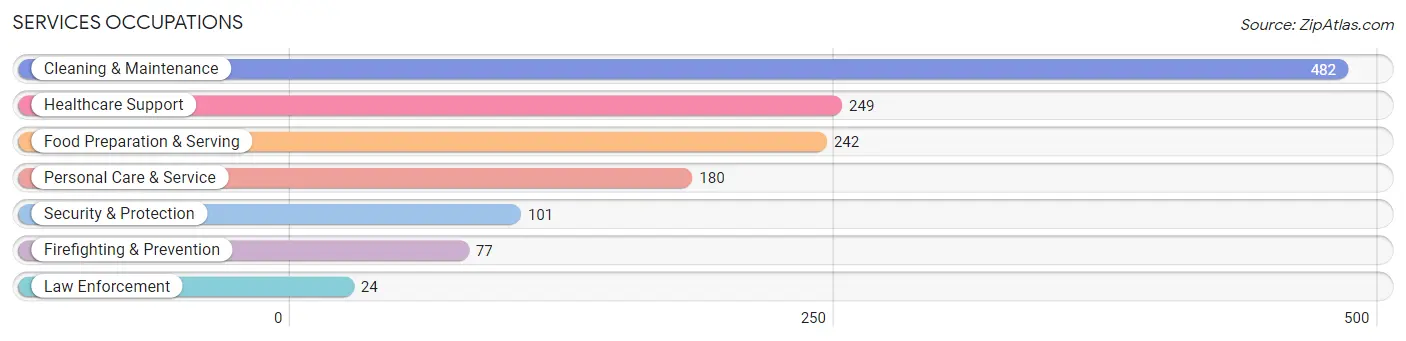
The most common Services occupations in Shively are Cleaning & Maintenance (482 | 6.8%), Healthcare Support (249 | 3.5%), Food Preparation & Serving (242 | 3.4%), Personal Care & Service (180 | 2.5%), and Security & Protection (101 | 1.4%).
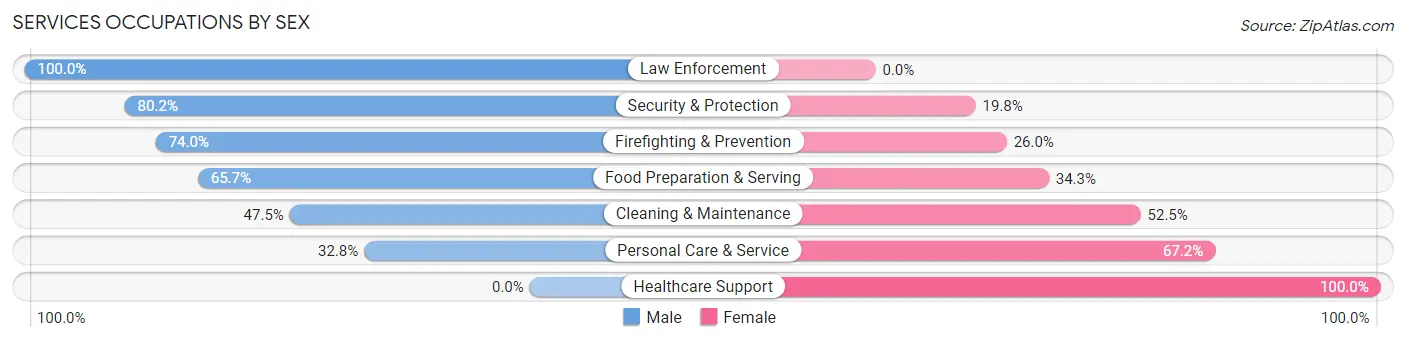
Services Occupations by Sex
Within the Services occupations in Shively, the most male-oriented occupations are Law Enforcement (100.0%), Security & Protection (80.2%), and Firefighting & Prevention (74.0%), while the most female-oriented occupations are Healthcare Support (100.0%), Personal Care & Service (67.2%), and Cleaning & Maintenance (52.5%).
| Occupation | Male | Female |
| Healthcare Support | 0 (0.0%) | 249 (100.0%) |
| Security & Protection | 81 (80.2%) | 20 (19.8%) |
| Firefighting & Prevention | 57 (74.0%) | 20 (26.0%) |
| Law Enforcement | 24 (100.0%) | 0 (0.0%) |
| Food Preparation & Serving | 159 (65.7%) | 83 (34.3%) |
| Cleaning & Maintenance | 229 (47.5%) | 253 (52.5%) |
| Personal Care & Service | 59 (32.8%) | 121 (67.2%) |
| Total (Category) | 528 (42.1%) | 726 (57.9%) |
| Total (Overall) | 3,345 (47.3%) | 3,733 (52.7%) |
Sales and Office Occupations
The most common Sales and Office occupations in Shively are Office & Administration (592 | 8.4%), and Sales & Related (584 | 8.3%).
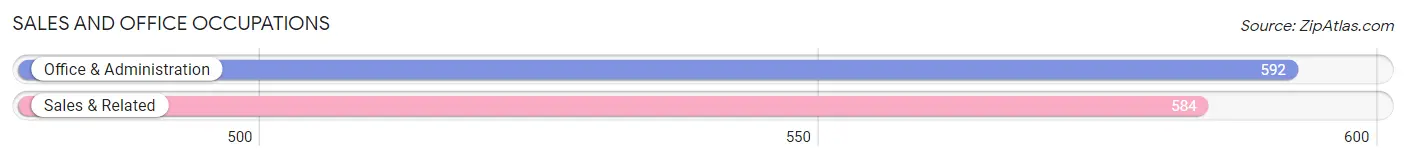
Sales and Office Occupations by Sex
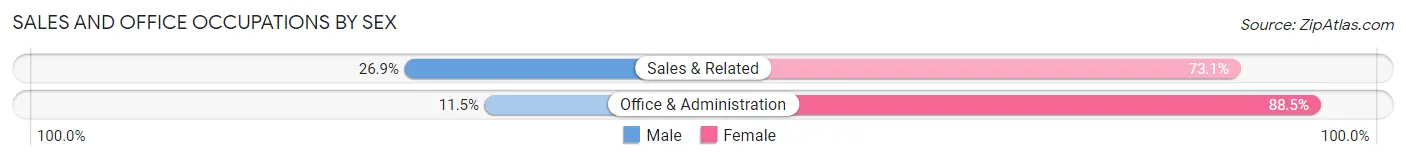
| Occupation | Male | Female |
| Sales & Related | 157 (26.9%) | 427 (73.1%) |
| Office & Administration | 68 (11.5%) | 524 (88.5%) |
| Total (Category) | 225 (19.1%) | 951 (80.9%) |
| Total (Overall) | 3,345 (47.3%) | 3,733 (52.7%) |
Natural Resources, Construction and Maintenance Occupations
The most common Natural Resources, Construction and Maintenance occupations in Shively are Construction & Extraction (360 | 5.1%), Installation, Maintenance & Repair (260 | 3.7%), and Farming, Fishing & Forestry (15 | 0.2%).
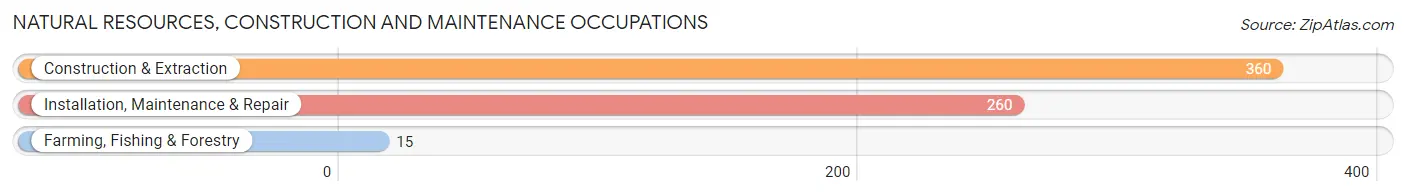
Natural Resources, Construction and Maintenance Occupations by Sex
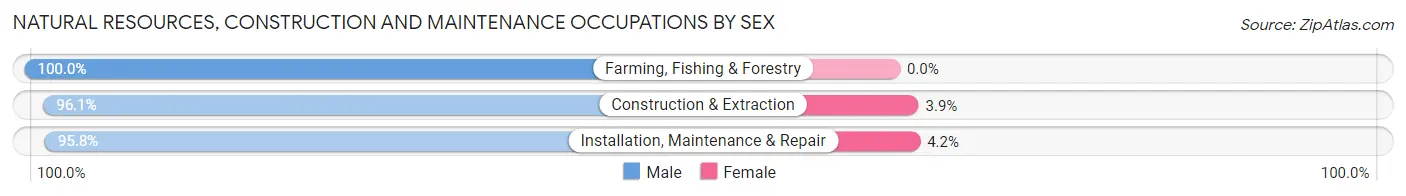
| Occupation | Male | Female |
| Farming, Fishing & Forestry | 15 (100.0%) | 0 (0.0%) |
| Construction & Extraction | 346 (96.1%) | 14 (3.9%) |
| Installation, Maintenance & Repair | 249 (95.8%) | 11 (4.2%) |
| Total (Category) | 610 (96.1%) | 25 (3.9%) |
| Total (Overall) | 3,345 (47.3%) | 3,733 (52.7%) |
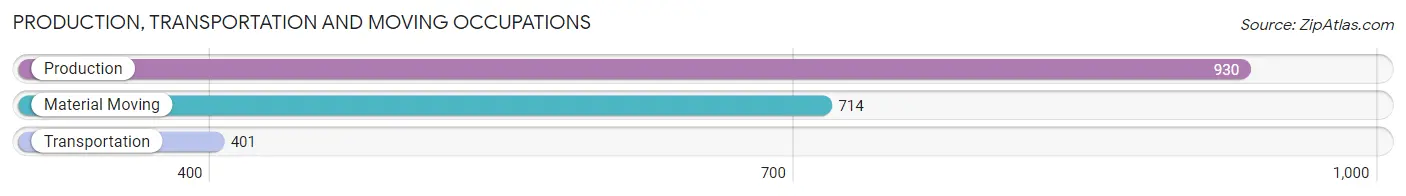
Production, Transportation and Moving Occupations
The most common Production, Transportation and Moving occupations in Shively are Production (930 | 13.1%), Material Moving (714 | 10.1%), and Transportation (401 | 5.7%).
Production, Transportation and Moving Occupations by Sex
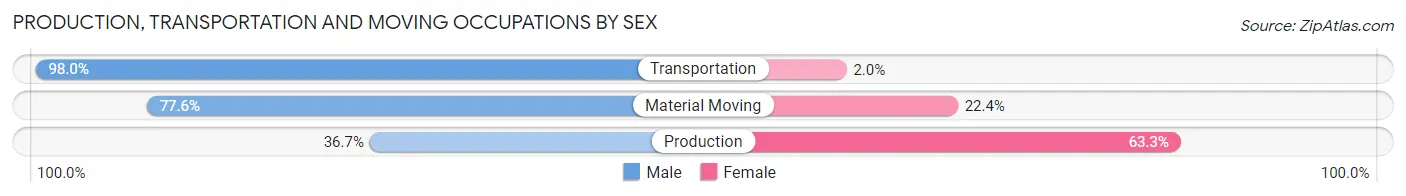
| Occupation | Male | Female |
| Production | 341 (36.7%) | 589 (63.3%) |
| Transportation | 393 (98.0%) | 8 (2.0%) |
| Material Moving | 554 (77.6%) | 160 (22.4%) |
| Total (Category) | 1,288 (63.0%) | 757 (37.0%) |
| Total (Overall) | 3,345 (47.3%) | 3,733 (52.7%) |
Employment Industries by Sex in Shively
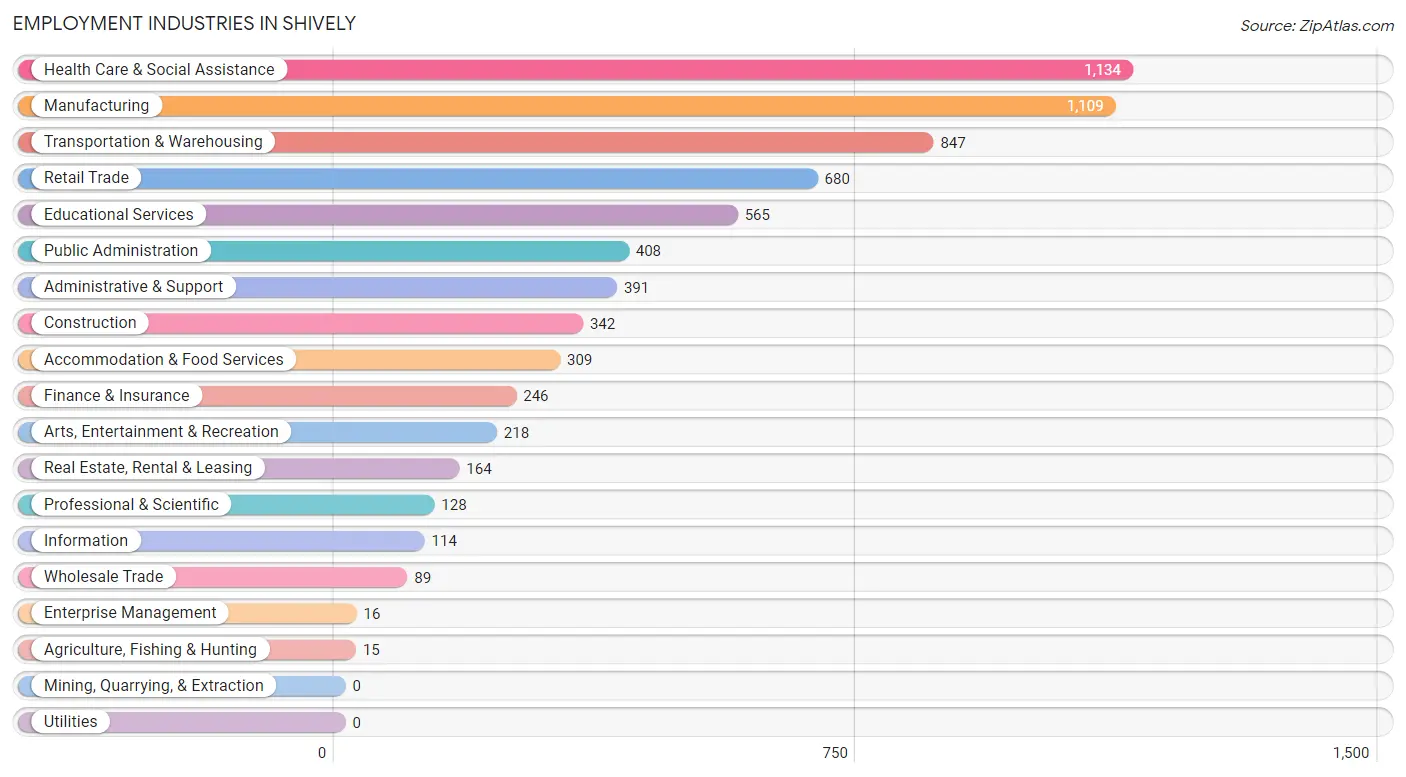
Employment Industries in Shively
The major employment industries in Shively include Health Care & Social Assistance (1,134 | 16.0%), Manufacturing (1,109 | 15.7%), Transportation & Warehousing (847 | 12.0%), Retail Trade (680 | 9.6%), and Educational Services (565 | 8.0%).
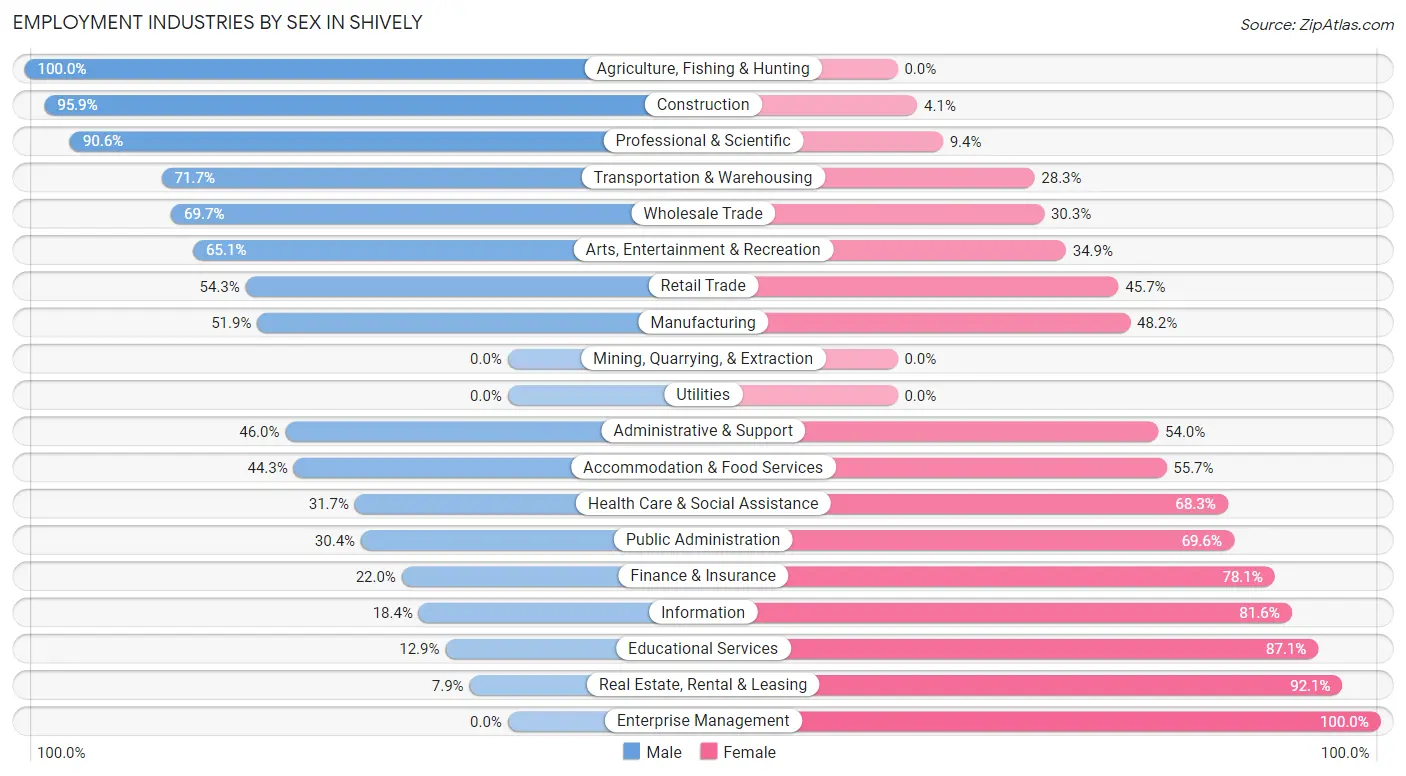
Employment Industries by Sex in Shively
The Shively industries that see more men than women are Agriculture, Fishing & Hunting (100.0%), Construction (95.9%), and Professional & Scientific (90.6%), whereas the industries that tend to have a higher number of women are Enterprise Management (100.0%), Real Estate, Rental & Leasing (92.1%), and Educational Services (87.1%).
| Industry | Male | Female |
| Agriculture, Fishing & Hunting | 15 (100.0%) | 0 (0.0%) |
| Mining, Quarrying, & Extraction | 0 (0.0%) | 0 (0.0%) |
| Construction | 328 (95.9%) | 14 (4.1%) |
| Manufacturing | 575 (51.8%) | 534 (48.1%) |
| Wholesale Trade | 62 (69.7%) | 27 (30.3%) |
| Retail Trade | 369 (54.3%) | 311 (45.7%) |
| Transportation & Warehousing | 607 (71.7%) | 240 (28.3%) |
| Utilities | 0 (0.0%) | 0 (0.0%) |
| Information | 21 (18.4%) | 93 (81.6%) |
| Finance & Insurance | 54 (22.0%) | 192 (78.0%) |
| Real Estate, Rental & Leasing | 13 (7.9%) | 151 (92.1%) |
| Professional & Scientific | 116 (90.6%) | 12 (9.4%) |
| Enterprise Management | 0 (0.0%) | 16 (100.0%) |
| Administrative & Support | 180 (46.0%) | 211 (54.0%) |
| Educational Services | 73 (12.9%) | 492 (87.1%) |
| Health Care & Social Assistance | 359 (31.7%) | 775 (68.3%) |
| Arts, Entertainment & Recreation | 142 (65.1%) | 76 (34.9%) |
| Accommodation & Food Services | 137 (44.3%) | 172 (55.7%) |
| Public Administration | 124 (30.4%) | 284 (69.6%) |
| Total | 3,345 (47.3%) | 3,733 (52.7%) |
Education in Shively
School Enrollment in Shively
The most common levels of schooling among the 3,276 students in Shively are middle school (990 | 30.2%), high school (865 | 26.4%), and elementary school (608 | 18.6%).
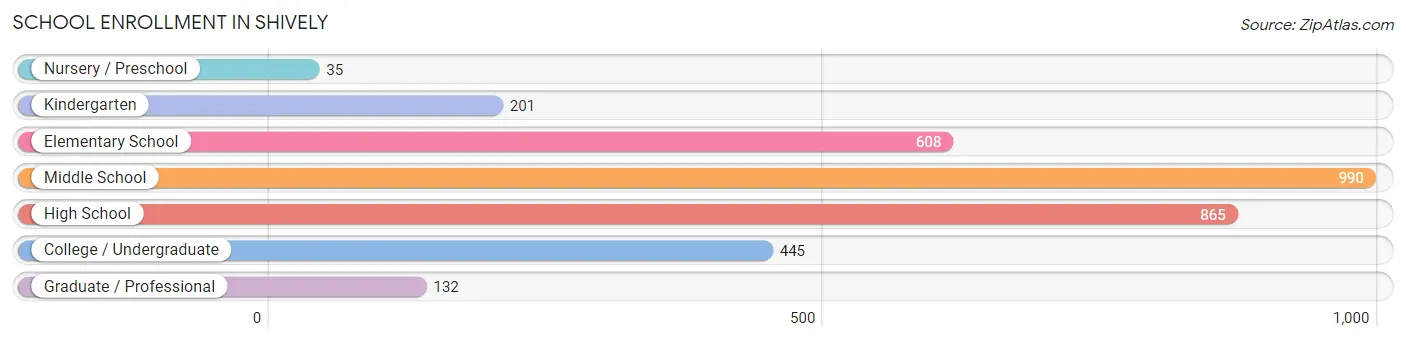
| School Level | # Students | % Students |
| Nursery / Preschool | 35 | 1.1% |
| Kindergarten | 201 | 6.1% |
| Elementary School | 608 | 18.6% |
| Middle School | 990 | 30.2% |
| High School | 865 | 26.4% |
| College / Undergraduate | 445 | 13.6% |
| Graduate / Professional | 132 | 4.0% |
| Total | 3,276 | 100.0% |
School Enrollment by Age by Funding Source in Shively
Out of a total of 3,276 students who are enrolled in schools in Shively, 308 (9.4%) attend a private institution, while the remaining 2,968 (90.6%) are enrolled in public schools. The age group of 3 to 4 year olds has the highest likelihood of being enrolled in private schools, with 16 (45.7% in the age bracket) enrolled. Conversely, the age group of 18 to 19 year olds has the lowest likelihood of being enrolled in a private school, with 155 (100.0% in the age bracket) attending a public institution.
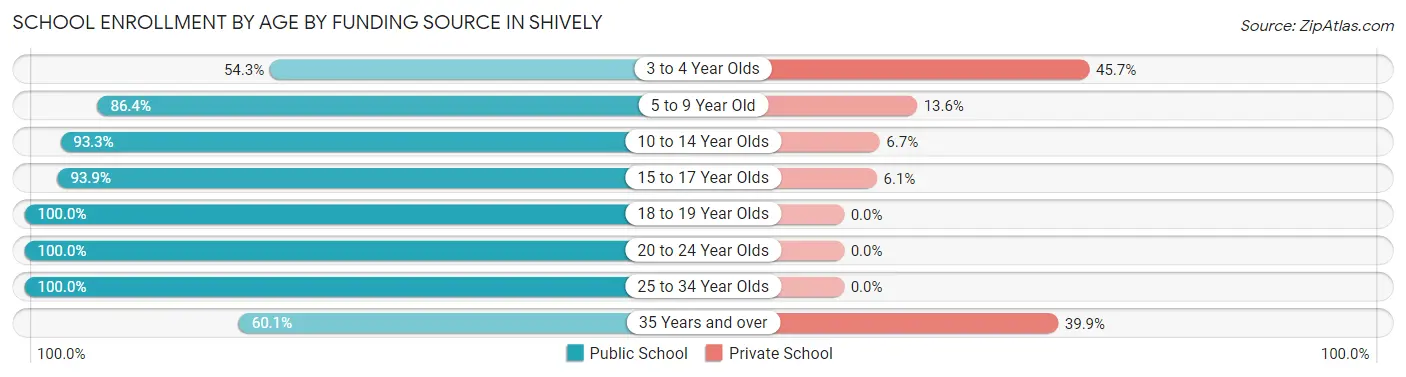
| Age Bracket | Public School | Private School |
| 3 to 4 Year Olds | 19 (54.3%) | 16 (45.7%) |
| 5 to 9 Year Old | 540 (86.4%) | 85 (13.6%) |
| 10 to 14 Year Olds | 1,107 (93.3%) | 79 (6.7%) |
| 15 to 17 Year Olds | 705 (93.9%) | 46 (6.1%) |
| 18 to 19 Year Olds | 155 (100.0%) | 0 (0.0%) |
| 20 to 24 Year Olds | 242 (100.0%) | 0 (0.0%) |
| 25 to 34 Year Olds | 74 (100.0%) | 0 (0.0%) |
| 35 Years and over | 125 (60.1%) | 83 (39.9%) |
| Total | 2,968 (90.6%) | 308 (9.4%) |
Educational Attainment by Field of Study in Shively
Business (356 | 22.6%), science & technology (176 | 11.2%), education (162 | 10.3%), arts & humanities (147 | 9.3%), and psychology (113 | 7.2%) are the most common fields of study among 1,573 individuals in Shively who have obtained a bachelor's degree or higher.
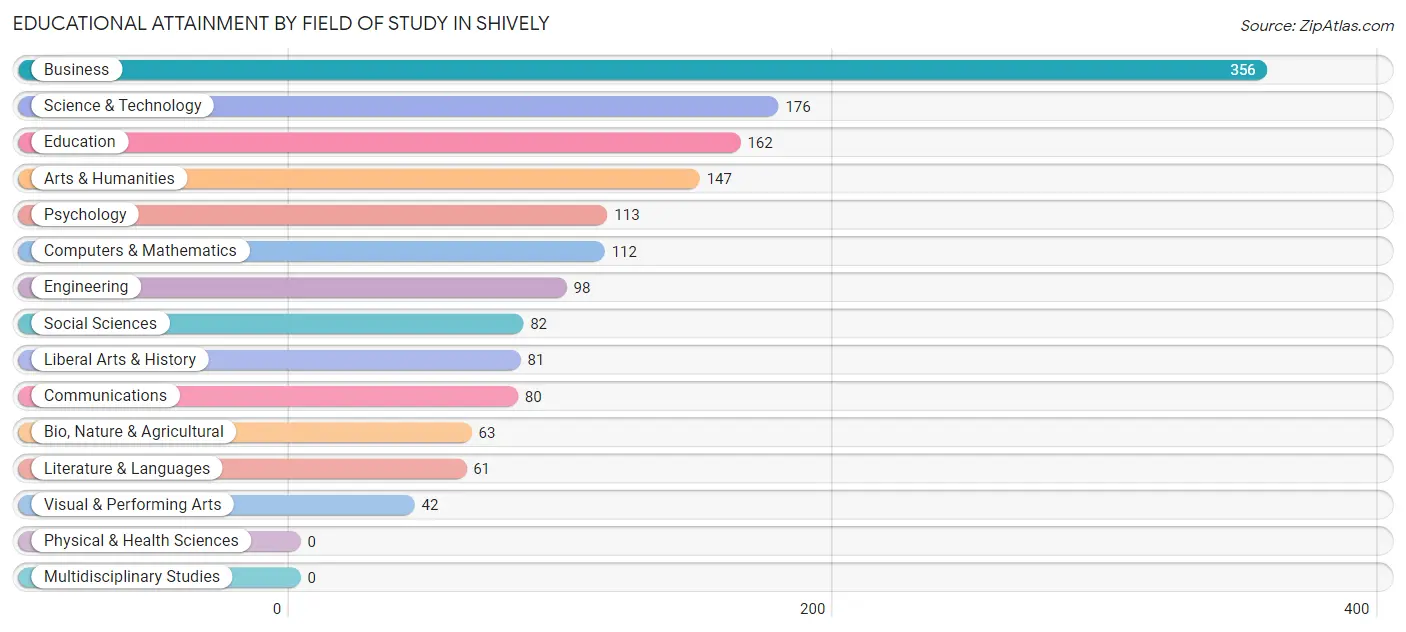
| Field of Study | # Graduates | % Graduates |
| Computers & Mathematics | 112 | 7.1% |
| Bio, Nature & Agricultural | 63 | 4.0% |
| Physical & Health Sciences | 0 | 0.0% |
| Psychology | 113 | 7.2% |
| Social Sciences | 82 | 5.2% |
| Engineering | 98 | 6.2% |
| Multidisciplinary Studies | 0 | 0.0% |
| Science & Technology | 176 | 11.2% |
| Business | 356 | 22.6% |
| Education | 162 | 10.3% |
| Literature & Languages | 61 | 3.9% |
| Liberal Arts & History | 81 | 5.1% |
| Visual & Performing Arts | 42 | 2.7% |
| Communications | 80 | 5.1% |
| Arts & Humanities | 147 | 9.3% |
| Total | 1,573 | 100.0% |
Transportation & Commute in Shively
Vehicle Availability by Sex in Shively
The most prevalent vehicle ownership categories in Shively are males with 2 vehicles (1,309, accounting for 41.1%) and females with 2 vehicles (1,207, making up 35.3%).
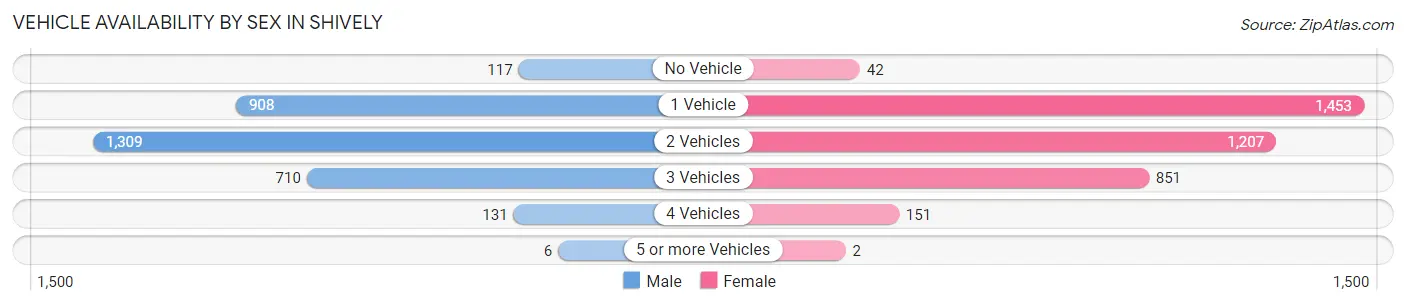
| Vehicles Available | Male | Female |
| No Vehicle | 117 (3.7%) | 42 (1.1%) |
| 1 Vehicle | 908 (28.5%) | 1,453 (39.2%) |
| 2 Vehicles | 1,309 (41.1%) | 1,207 (32.6%) |
| 3 Vehicles | 710 (22.3%) | 851 (23.0%) |
| 4 Vehicles | 131 (4.1%) | 151 (4.1%) |
| 5 or more Vehicles | 6 (0.2%) | 2 (0.1%) |
| Total | 3,181 (100.0%) | 3,706 (100.0%) |
Commute Time in Shively
The most frequently occuring commute durations in Shively are 15 to 19 minutes (1,372 commuters, 21.9%), 20 to 24 minutes (1,208 commuters, 19.3%), and 30 to 34 minutes (1,152 commuters, 18.4%).
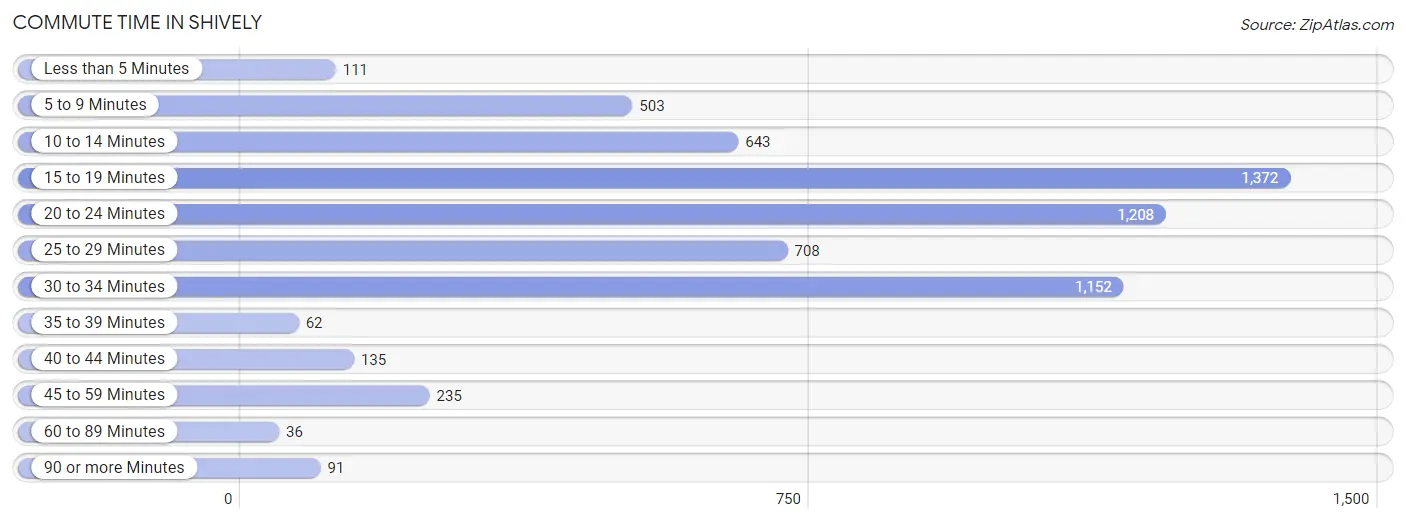
| Commute Time | # Commuters | % Commuters |
| Less than 5 Minutes | 111 | 1.8% |
| 5 to 9 Minutes | 503 | 8.0% |
| 10 to 14 Minutes | 643 | 10.3% |
| 15 to 19 Minutes | 1,372 | 21.9% |
| 20 to 24 Minutes | 1,208 | 19.3% |
| 25 to 29 Minutes | 708 | 11.3% |
| 30 to 34 Minutes | 1,152 | 18.4% |
| 35 to 39 Minutes | 62 | 1.0% |
| 40 to 44 Minutes | 135 | 2.2% |
| 45 to 59 Minutes | 235 | 3.8% |
| 60 to 89 Minutes | 36 | 0.6% |
| 90 or more Minutes | 91 | 1.5% |
Commute Time by Sex in Shively
The most common commute times in Shively are 15 to 19 minutes (975 commuters, 32.5%) for males and 20 to 24 minutes (890 commuters, 27.4%) for females.
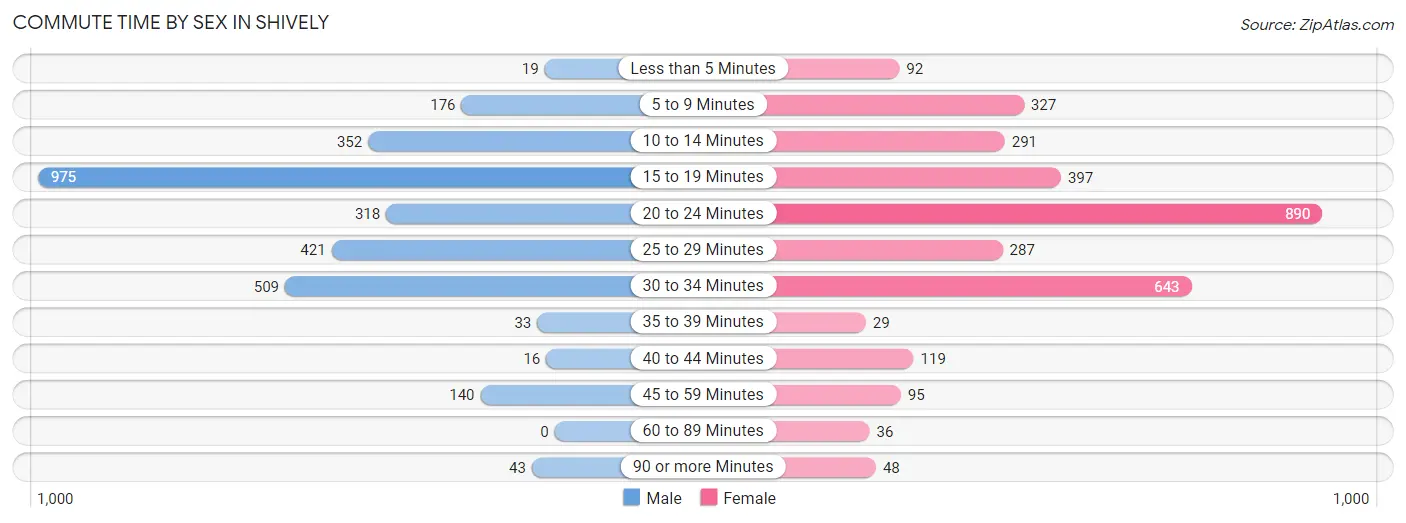
| Commute Time | Male | Female |
| Less than 5 Minutes | 19 (0.6%) | 92 (2.8%) |
| 5 to 9 Minutes | 176 (5.9%) | 327 (10.1%) |
| 10 to 14 Minutes | 352 (11.7%) | 291 (8.9%) |
| 15 to 19 Minutes | 975 (32.5%) | 397 (12.2%) |
| 20 to 24 Minutes | 318 (10.6%) | 890 (27.4%) |
| 25 to 29 Minutes | 421 (14.0%) | 287 (8.8%) |
| 30 to 34 Minutes | 509 (17.0%) | 643 (19.8%) |
| 35 to 39 Minutes | 33 (1.1%) | 29 (0.9%) |
| 40 to 44 Minutes | 16 (0.5%) | 119 (3.7%) |
| 45 to 59 Minutes | 140 (4.7%) | 95 (2.9%) |
| 60 to 89 Minutes | 0 (0.0%) | 36 (1.1%) |
| 90 or more Minutes | 43 (1.4%) | 48 (1.5%) |
Time of Departure to Work by Sex in Shively
The most frequent times of departure to work in Shively are 7:00 AM to 7:29 AM (457, 15.2%) for males and 7:00 AM to 7:29 AM (502, 15.4%) for females.
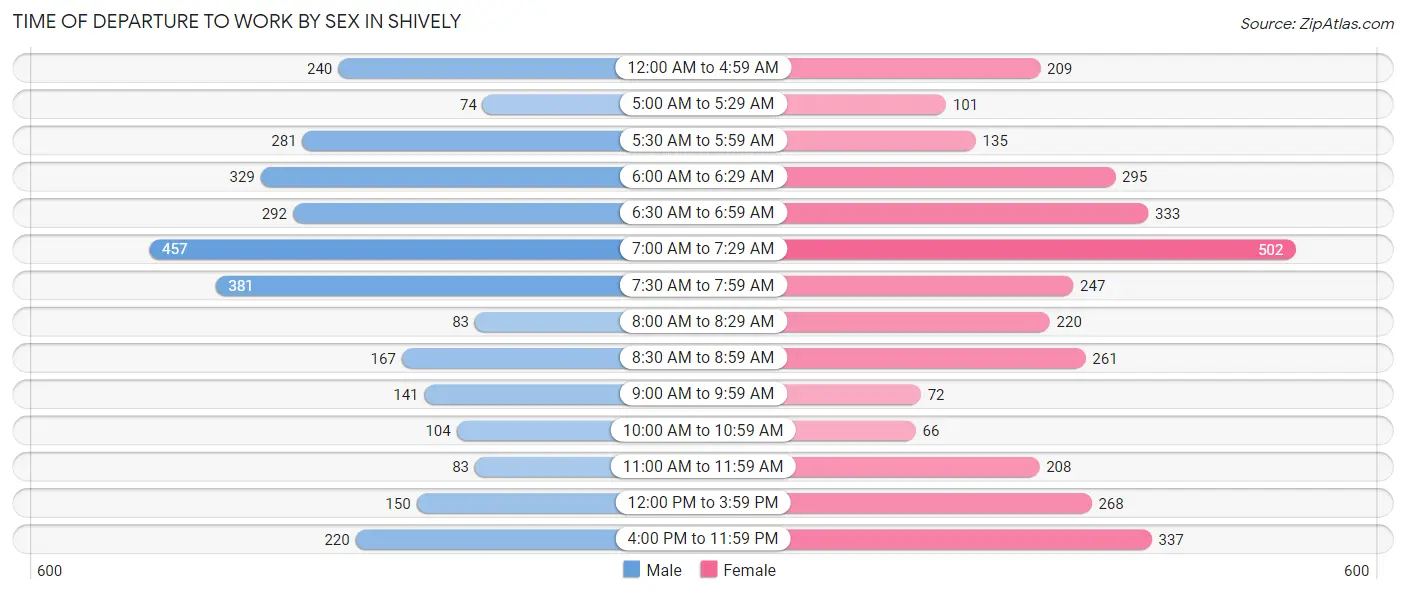
| Time of Departure | Male | Female |
| 12:00 AM to 4:59 AM | 240 (8.0%) | 209 (6.4%) |
| 5:00 AM to 5:29 AM | 74 (2.5%) | 101 (3.1%) |
| 5:30 AM to 5:59 AM | 281 (9.4%) | 135 (4.2%) |
| 6:00 AM to 6:29 AM | 329 (11.0%) | 295 (9.1%) |
| 6:30 AM to 6:59 AM | 292 (9.7%) | 333 (10.2%) |
| 7:00 AM to 7:29 AM | 457 (15.2%) | 502 (15.4%) |
| 7:30 AM to 7:59 AM | 381 (12.7%) | 247 (7.6%) |
| 8:00 AM to 8:29 AM | 83 (2.8%) | 220 (6.8%) |
| 8:30 AM to 8:59 AM | 167 (5.6%) | 261 (8.0%) |
| 9:00 AM to 9:59 AM | 141 (4.7%) | 72 (2.2%) |
| 10:00 AM to 10:59 AM | 104 (3.5%) | 66 (2.0%) |
| 11:00 AM to 11:59 AM | 83 (2.8%) | 208 (6.4%) |
| 12:00 PM to 3:59 PM | 150 (5.0%) | 268 (8.2%) |
| 4:00 PM to 11:59 PM | 220 (7.3%) | 337 (10.4%) |
| Total | 3,002 (100.0%) | 3,254 (100.0%) |
Housing Occupancy in Shively
Occupancy by Ownership in Shively
Of the total 6,925 dwellings in Shively, owner-occupied units account for 3,790 (54.7%), while renter-occupied units make up 3,135 (45.3%).
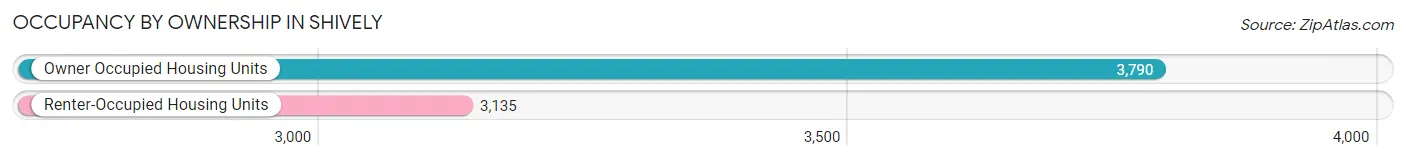
| Occupancy | # Housing Units | % Housing Units |
| Owner Occupied Housing Units | 3,790 | 54.7% |
| Renter-Occupied Housing Units | 3,135 | 45.3% |
| Total Occupied Housing Units | 6,925 | 100.0% |
Occupancy by Household Size in Shively
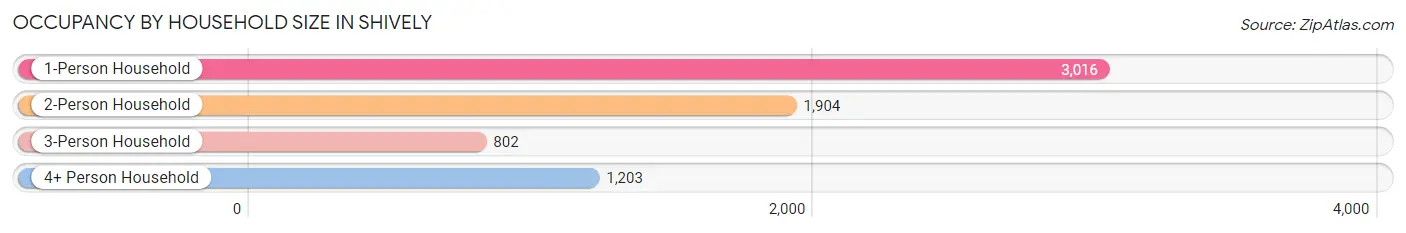
| Household Size | # Housing Units | % Housing Units |
| 1-Person Household | 3,016 | 43.5% |
| 2-Person Household | 1,904 | 27.5% |
| 3-Person Household | 802 | 11.6% |
| 4+ Person Household | 1,203 | 17.4% |
| Total Housing Units | 6,925 | 100.0% |
Occupancy by Ownership by Household Size in Shively
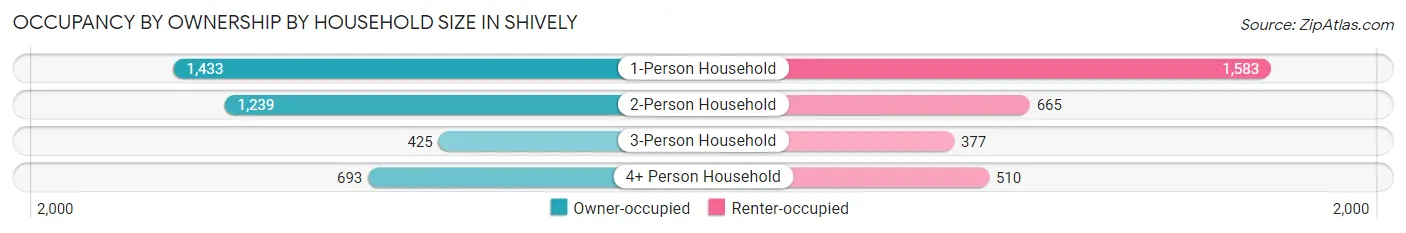
| Household Size | Owner-occupied | Renter-occupied |
| 1-Person Household | 1,433 (47.5%) | 1,583 (52.5%) |
| 2-Person Household | 1,239 (65.1%) | 665 (34.9%) |
| 3-Person Household | 425 (53.0%) | 377 (47.0%) |
| 4+ Person Household | 693 (57.6%) | 510 (42.4%) |
| Total Housing Units | 3,790 (54.7%) | 3,135 (45.3%) |
Occupancy by Educational Attainment in Shively
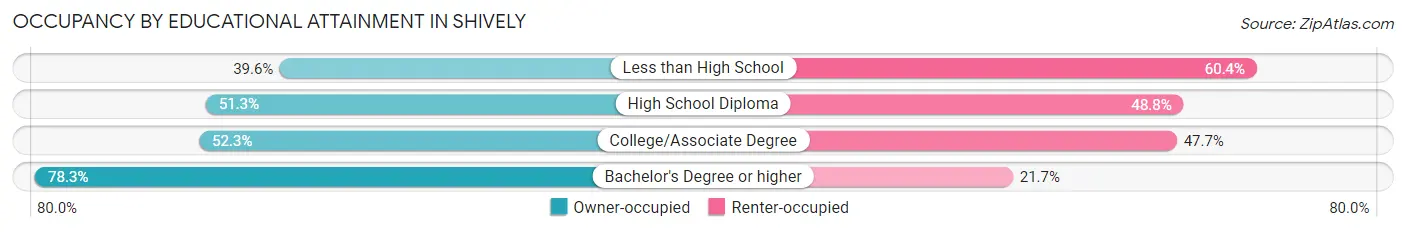
| Household Size | Owner-occupied | Renter-occupied |
| Less than High School | 271 (39.6%) | 413 (60.4%) |
| High School Diploma | 1,316 (51.2%) | 1,252 (48.7%) |
| College/Associate Degree | 1,357 (52.3%) | 1,236 (47.7%) |
| Bachelor's Degree or higher | 846 (78.3%) | 234 (21.7%) |
Occupancy by Age of Householder in Shively
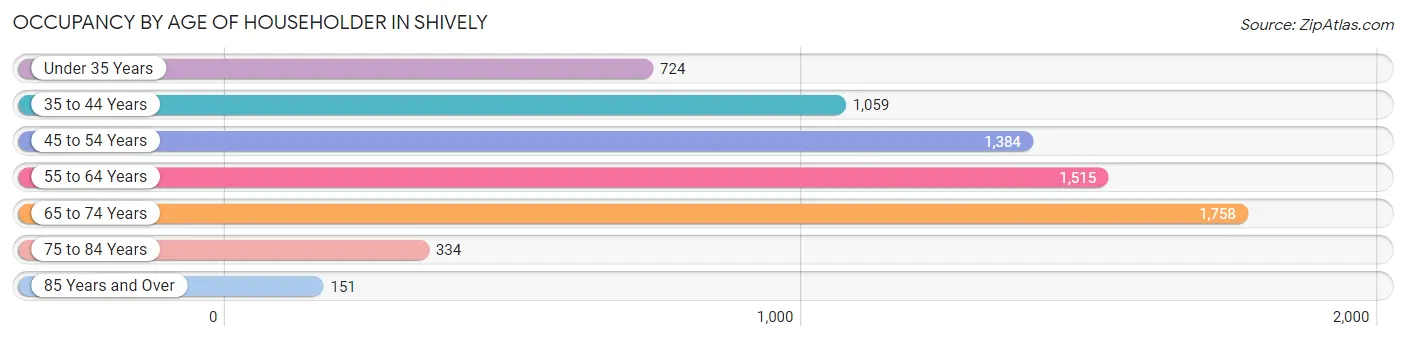
| Age Bracket | # Households | % Households |
| Under 35 Years | 724 | 10.4% |
| 35 to 44 Years | 1,059 | 15.3% |
| 45 to 54 Years | 1,384 | 20.0% |
| 55 to 64 Years | 1,515 | 21.9% |
| 65 to 74 Years | 1,758 | 25.4% |
| 75 to 84 Years | 334 | 4.8% |
| 85 Years and Over | 151 | 2.2% |
| Total | 6,925 | 100.0% |
Housing Finances in Shively
Median Income by Occupancy in Shively
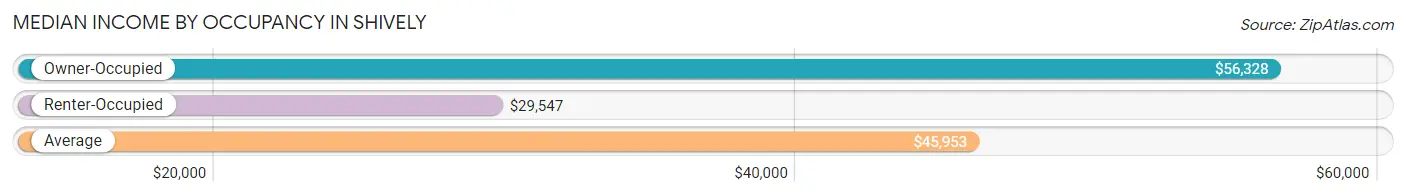
| Occupancy Type | # Households | Median Income |
| Owner-Occupied | 3,790 (54.7%) | $56,328 |
| Renter-Occupied | 3,135 (45.3%) | $29,547 |
| Average | 6,925 (100.0%) | $45,953 |
Occupancy by Householder Income Bracket in Shively
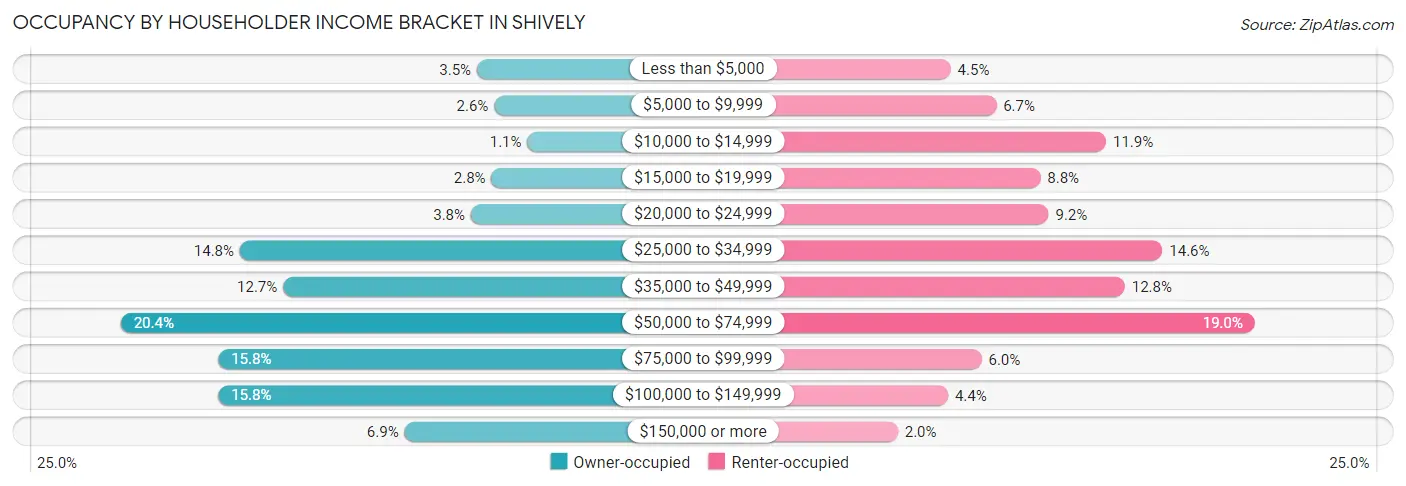
| Income Bracket | Owner-occupied | Renter-occupied |
| Less than $5,000 | 131 (3.5%) | 142 (4.5%) |
| $5,000 to $9,999 | 100 (2.6%) | 210 (6.7%) |
| $10,000 to $14,999 | 40 (1.1%) | 374 (11.9%) |
| $15,000 to $19,999 | 105 (2.8%) | 276 (8.8%) |
| $20,000 to $24,999 | 142 (3.7%) | 288 (9.2%) |
| $25,000 to $34,999 | 559 (14.7%) | 458 (14.6%) |
| $35,000 to $49,999 | 481 (12.7%) | 402 (12.8%) |
| $50,000 to $74,999 | 774 (20.4%) | 596 (19.0%) |
| $75,000 to $99,999 | 598 (15.8%) | 188 (6.0%) |
| $100,000 to $149,999 | 598 (15.8%) | 138 (4.4%) |
| $150,000 or more | 262 (6.9%) | 63 (2.0%) |
| Total | 3,790 (100.0%) | 3,135 (100.0%) |
Monthly Housing Cost Tiers in Shively
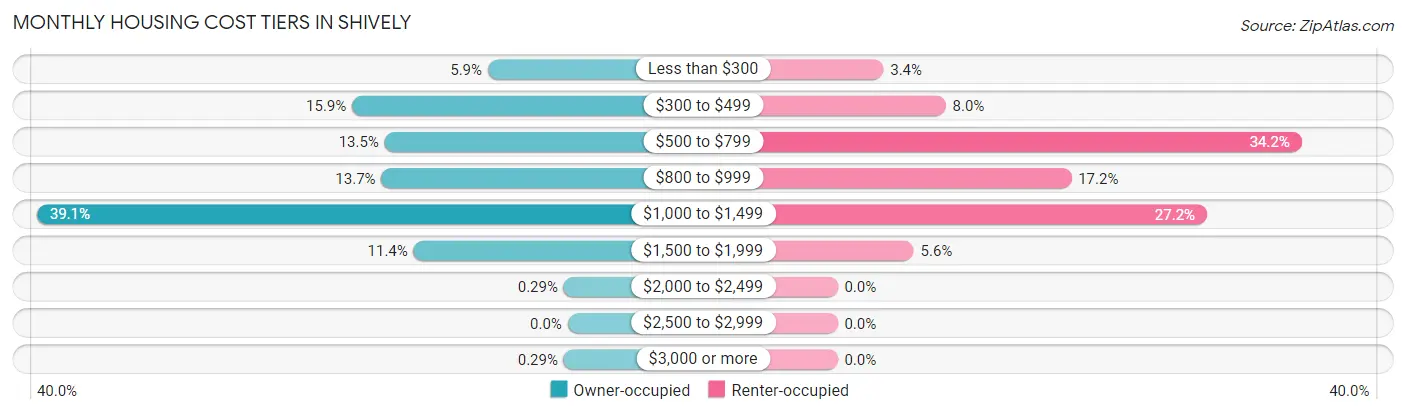
| Monthly Cost | Owner-occupied | Renter-occupied |
| Less than $300 | 223 (5.9%) | 106 (3.4%) |
| $300 to $499 | 602 (15.9%) | 250 (8.0%) |
| $500 to $799 | 511 (13.5%) | 1,072 (34.2%) |
| $800 to $999 | 520 (13.7%) | 540 (17.2%) |
| $1,000 to $1,499 | 1,482 (39.1%) | 853 (27.2%) |
| $1,500 to $1,999 | 430 (11.4%) | 176 (5.6%) |
| $2,000 to $2,499 | 11 (0.3%) | 0 (0.0%) |
| $2,500 to $2,999 | 0 (0.0%) | 0 (0.0%) |
| $3,000 or more | 11 (0.3%) | 0 (0.0%) |
| Total | 3,790 (100.0%) | 3,135 (100.0%) |
Physical Housing Characteristics in Shively
Housing Structures in Shively
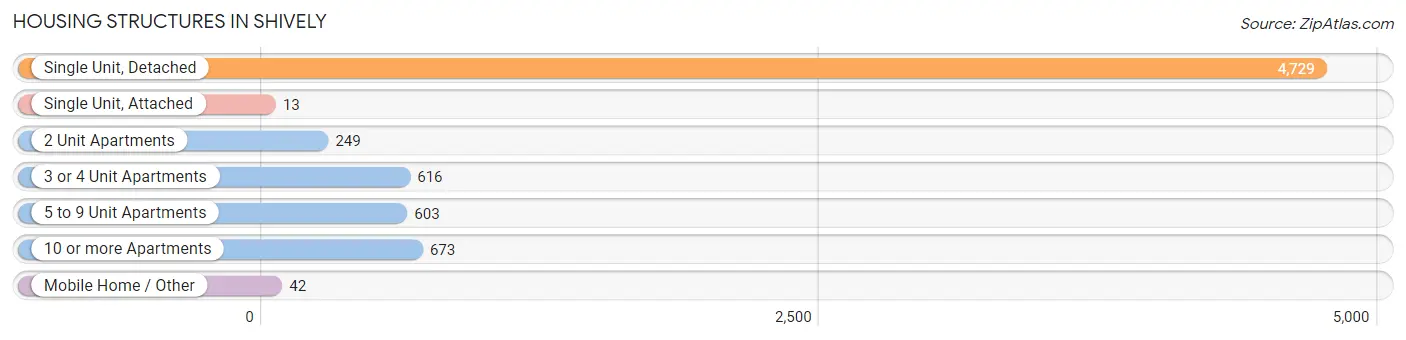
| Structure Type | # Housing Units | % Housing Units |
| Single Unit, Detached | 4,729 | 68.3% |
| Single Unit, Attached | 13 | 0.2% |
| 2 Unit Apartments | 249 | 3.6% |
| 3 or 4 Unit Apartments | 616 | 8.9% |
| 5 to 9 Unit Apartments | 603 | 8.7% |
| 10 or more Apartments | 673 | 9.7% |
| Mobile Home / Other | 42 | 0.6% |
| Total | 6,925 | 100.0% |
Housing Structures by Occupancy in Shively
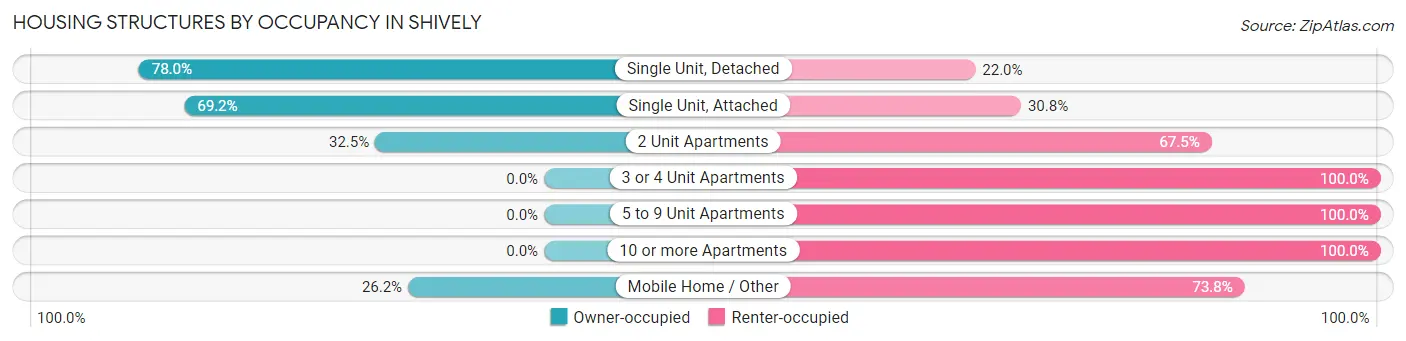
| Structure Type | Owner-occupied | Renter-occupied |
| Single Unit, Detached | 3,689 (78.0%) | 1,040 (22.0%) |
| Single Unit, Attached | 9 (69.2%) | 4 (30.8%) |
| 2 Unit Apartments | 81 (32.5%) | 168 (67.5%) |
| 3 or 4 Unit Apartments | 0 (0.0%) | 616 (100.0%) |
| 5 to 9 Unit Apartments | 0 (0.0%) | 603 (100.0%) |
| 10 or more Apartments | 0 (0.0%) | 673 (100.0%) |
| Mobile Home / Other | 11 (26.2%) | 31 (73.8%) |
| Total | 3,790 (54.7%) | 3,135 (45.3%) |
Housing Structures by Number of Rooms in Shively
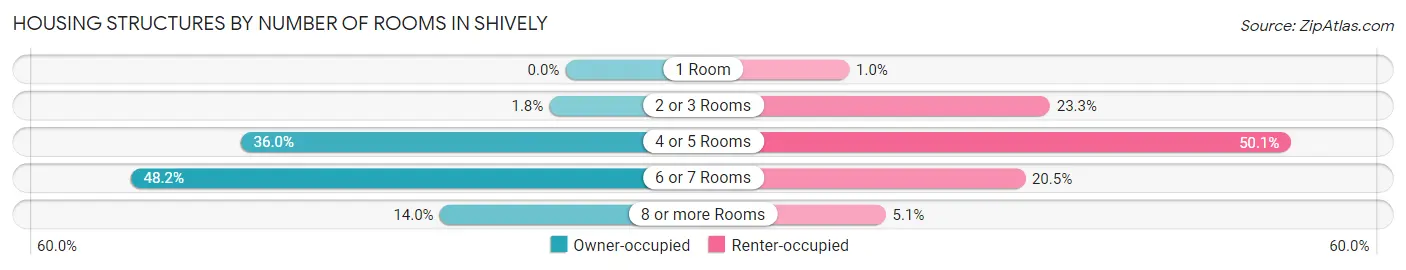
| Number of Rooms | Owner-occupied | Renter-occupied |
| 1 Room | 0 (0.0%) | 32 (1.0%) |
| 2 or 3 Rooms | 68 (1.8%) | 730 (23.3%) |
| 4 or 5 Rooms | 1,365 (36.0%) | 1,570 (50.1%) |
| 6 or 7 Rooms | 1,828 (48.2%) | 644 (20.5%) |
| 8 or more Rooms | 529 (14.0%) | 159 (5.1%) |
| Total | 3,790 (100.0%) | 3,135 (100.0%) |
Housing Structure by Heating Type in Shively
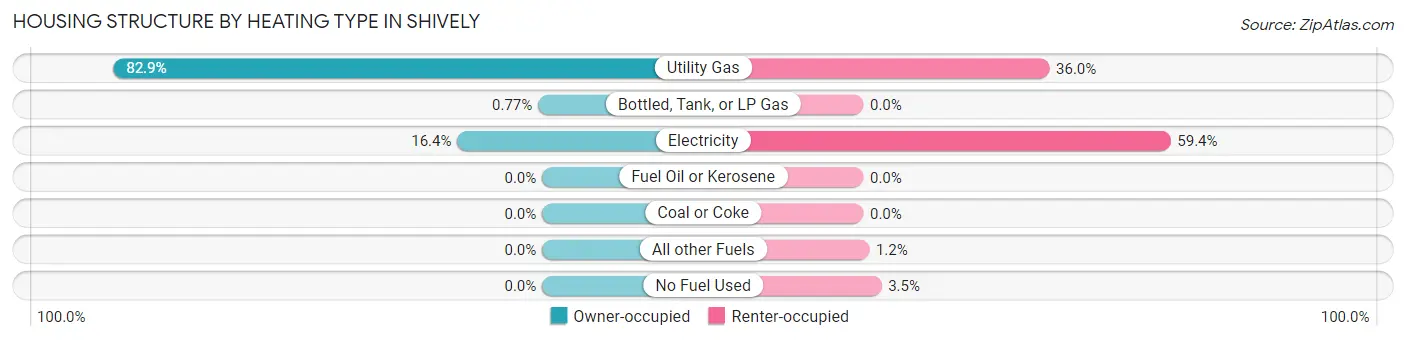
| Heating Type | Owner-occupied | Renter-occupied |
| Utility Gas | 3,140 (82.9%) | 1,127 (35.9%) |
| Bottled, Tank, or LP Gas | 29 (0.8%) | 0 (0.0%) |
| Electricity | 621 (16.4%) | 1,862 (59.4%) |
| Fuel Oil or Kerosene | 0 (0.0%) | 0 (0.0%) |
| Coal or Coke | 0 (0.0%) | 0 (0.0%) |
| All other Fuels | 0 (0.0%) | 36 (1.1%) |
| No Fuel Used | 0 (0.0%) | 110 (3.5%) |
| Total | 3,790 (100.0%) | 3,135 (100.0%) |
Household Vehicle Usage in Shively
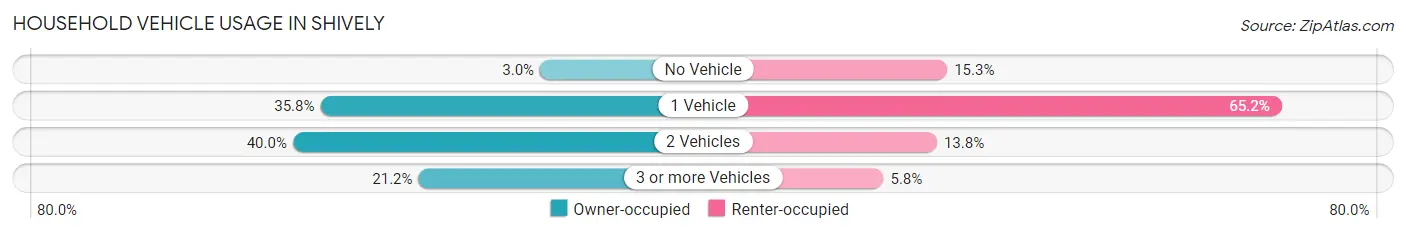
| Vehicles per Household | Owner-occupied | Renter-occupied |
| No Vehicle | 115 (3.0%) | 479 (15.3%) |
| 1 Vehicle | 1,358 (35.8%) | 2,044 (65.2%) |
| 2 Vehicles | 1,514 (40.0%) | 431 (13.8%) |
| 3 or more Vehicles | 803 (21.2%) | 181 (5.8%) |
| Total | 3,790 (100.0%) | 3,135 (100.0%) |
Real Estate & Mortgages in Shively
Real Estate and Mortgage Overview in Shively
| Characteristic | Without Mortgage | With Mortgage |
| Housing Units | 1,091 | 2,699 |
| Median Property Value | $118,500 | $139,700 |
| Median Household Income | $45,257 | $210 |
| Monthly Housing Costs | $422 | $11 |
| Real Estate Taxes | $993 | $122 |
Property Value by Mortgage Status in Shively
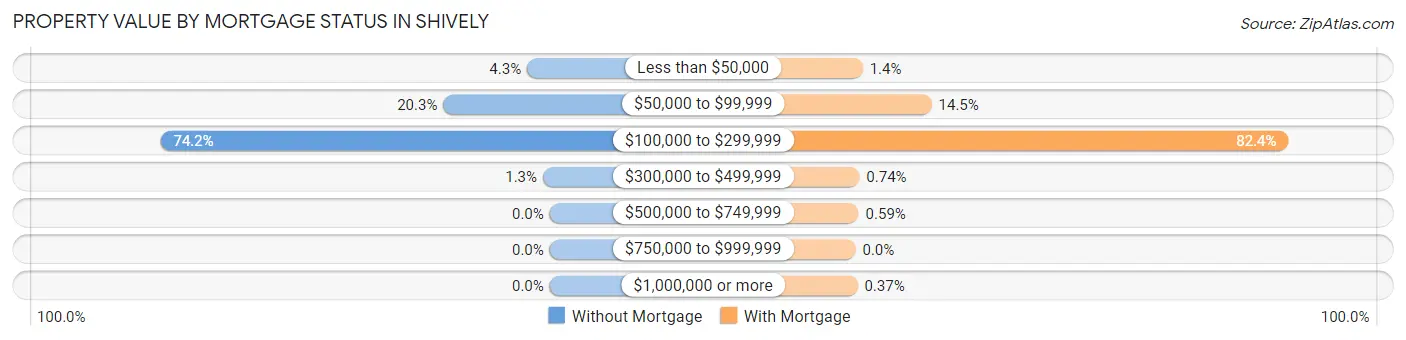
| Property Value | Without Mortgage | With Mortgage |
| Less than $50,000 | 47 (4.3%) | 37 (1.4%) |
| $50,000 to $99,999 | 221 (20.3%) | 391 (14.5%) |
| $100,000 to $299,999 | 809 (74.2%) | 2,225 (82.4%) |
| $300,000 to $499,999 | 14 (1.3%) | 20 (0.7%) |
| $500,000 to $749,999 | 0 (0.0%) | 16 (0.6%) |
| $750,000 to $999,999 | 0 (0.0%) | 0 (0.0%) |
| $1,000,000 or more | 0 (0.0%) | 10 (0.4%) |
| Total | 1,091 (100.0%) | 2,699 (100.0%) |
Household Income by Mortgage Status in Shively
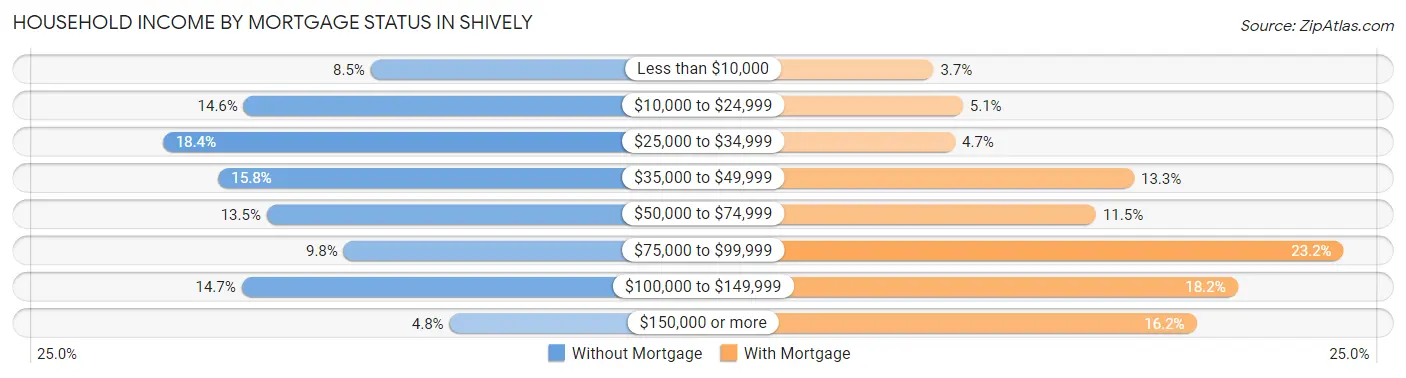
| Household Income | Without Mortgage | With Mortgage |
| Less than $10,000 | 93 (8.5%) | 100 (3.7%) |
| $10,000 to $24,999 | 159 (14.6%) | 138 (5.1%) |
| $25,000 to $34,999 | 201 (18.4%) | 128 (4.7%) |
| $35,000 to $49,999 | 172 (15.8%) | 358 (13.3%) |
| $50,000 to $74,999 | 147 (13.5%) | 309 (11.5%) |
| $75,000 to $99,999 | 107 (9.8%) | 627 (23.2%) |
| $100,000 to $149,999 | 160 (14.7%) | 491 (18.2%) |
| $150,000 or more | 52 (4.8%) | 438 (16.2%) |
| Total | 1,091 (100.0%) | 2,699 (100.0%) |
Property Value to Household Income Ratio in Shively
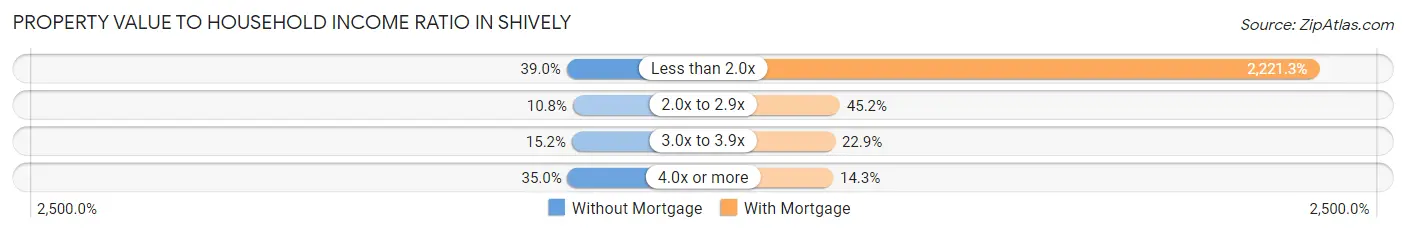
| Value-to-Income Ratio | Without Mortgage | With Mortgage |
| Less than 2.0x | 425 (39.0%) | 59,952 (2,221.3%) |
| 2.0x to 2.9x | 118 (10.8%) | 1,220 (45.2%) |
| 3.0x to 3.9x | 166 (15.2%) | 618 (22.9%) |
| 4.0x or more | 382 (35.0%) | 385 (14.3%) |
| Total | 1,091 (100.0%) | 2,699 (100.0%) |
Real Estate Taxes by Mortgage Status in Shively
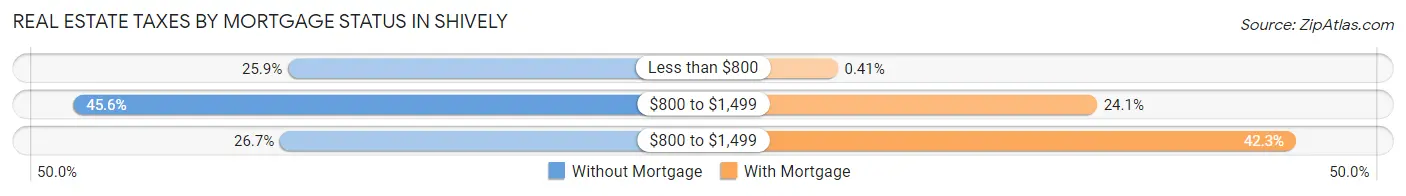
| Property Taxes | Without Mortgage | With Mortgage |
| Less than $800 | 283 (25.9%) | 11 (0.4%) |
| $800 to $1,499 | 497 (45.6%) | 650 (24.1%) |
| $800 to $1,499 | 291 (26.7%) | 1,141 (42.3%) |
| Total | 1,091 (100.0%) | 2,699 (100.0%) |
Health & Disability in Shively
Health Insurance Coverage by Age in Shively
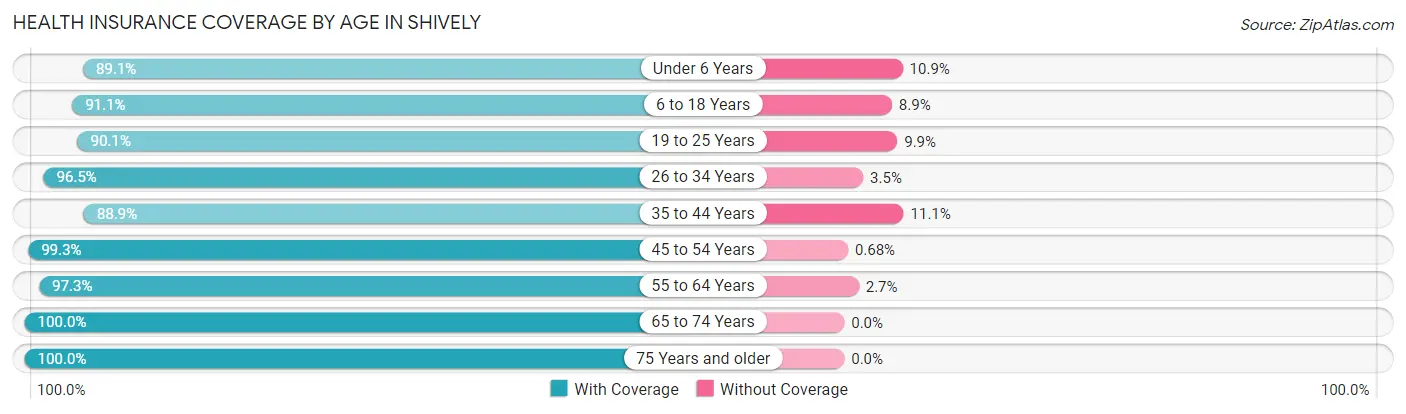
| Age Bracket | With Coverage | Without Coverage |
| Under 6 Years | 590 (89.1%) | 72 (10.9%) |
| 6 to 18 Years | 2,720 (91.1%) | 265 (8.9%) |
| 19 to 25 Years | 894 (90.1%) | 98 (9.9%) |
| 26 to 34 Years | 1,372 (96.5%) | 50 (3.5%) |
| 35 to 44 Years | 1,712 (88.9%) | 213 (11.1%) |
| 45 to 54 Years | 2,195 (99.3%) | 15 (0.7%) |
| 55 to 64 Years | 2,129 (97.3%) | 59 (2.7%) |
| 65 to 74 Years | 2,393 (100.0%) | 0 (0.0%) |
| 75 Years and older | 619 (100.0%) | 0 (0.0%) |
| Total | 14,624 (95.0%) | 772 (5.0%) |
Health Insurance Coverage by Citizenship Status in Shively
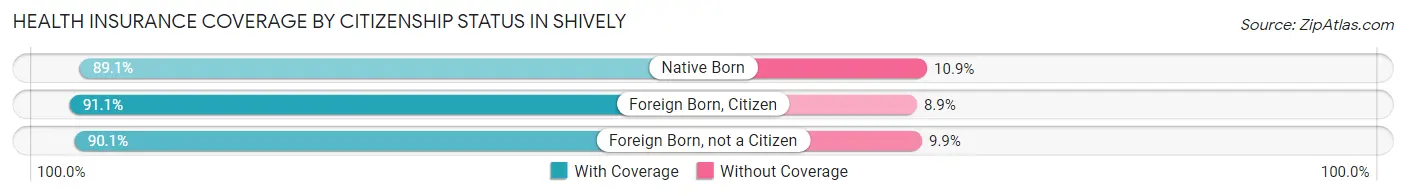
| Citizenship Status | With Coverage | Without Coverage |
| Native Born | 590 (89.1%) | 72 (10.9%) |
| Foreign Born, Citizen | 2,720 (91.1%) | 265 (8.9%) |
| Foreign Born, not a Citizen | 894 (90.1%) | 98 (9.9%) |
Health Insurance Coverage by Household Income in Shively
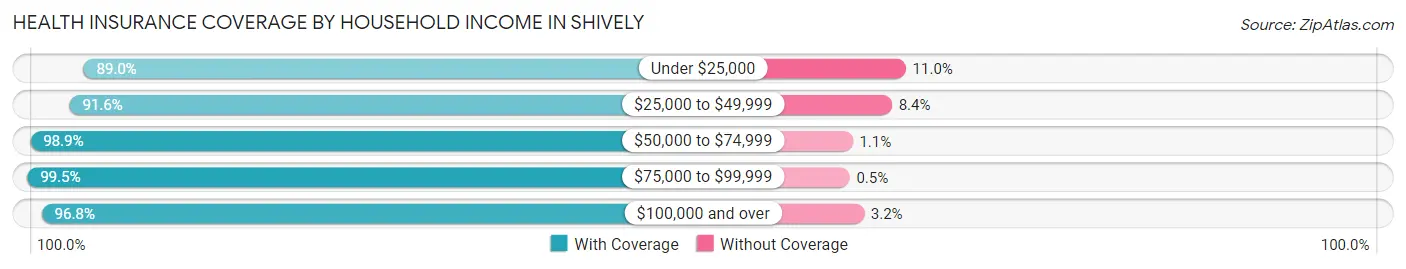
| Household Income | With Coverage | Without Coverage |
| Under $25,000 | 2,758 (89.0%) | 342 (11.0%) |
| $25,000 to $49,999 | 2,994 (91.6%) | 275 (8.4%) |
| $50,000 to $74,999 | 2,906 (98.9%) | 31 (1.1%) |
| $75,000 to $99,999 | 2,602 (99.5%) | 13 (0.5%) |
| $100,000 and over | 3,364 (96.8%) | 111 (3.2%) |
Public vs Private Health Insurance Coverage by Age in Shively
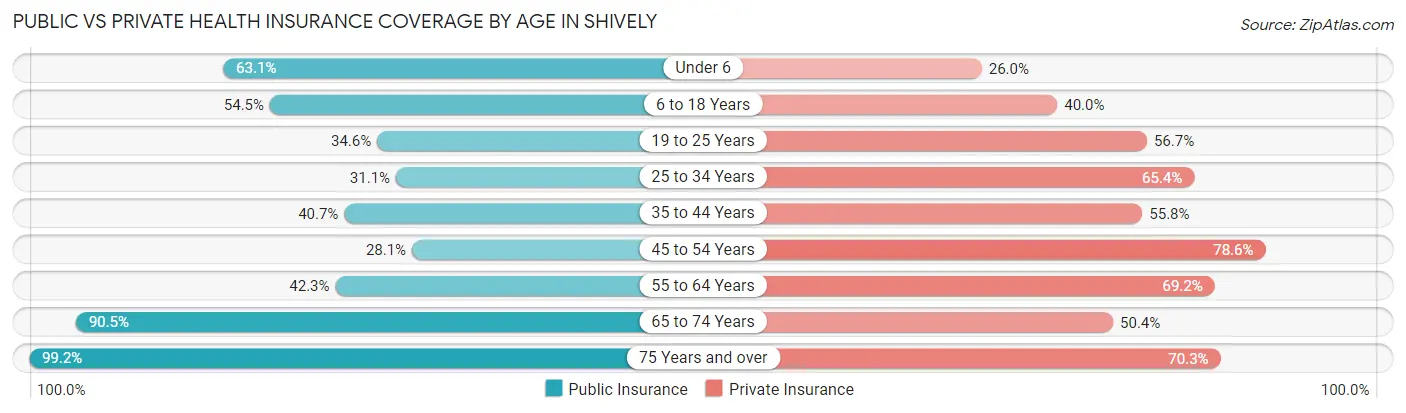
| Age Bracket | Public Insurance | Private Insurance |
| Under 6 | 418 (63.1%) | 172 (26.0%) |
| 6 to 18 Years | 1,626 (54.5%) | 1,194 (40.0%) |
| 19 to 25 Years | 343 (34.6%) | 562 (56.7%) |
| 25 to 34 Years | 442 (31.1%) | 930 (65.4%) |
| 35 to 44 Years | 783 (40.7%) | 1,074 (55.8%) |
| 45 to 54 Years | 621 (28.1%) | 1,737 (78.6%) |
| 55 to 64 Years | 926 (42.3%) | 1,514 (69.2%) |
| 65 to 74 Years | 2,166 (90.5%) | 1,205 (50.4%) |
| 75 Years and over | 614 (99.2%) | 435 (70.3%) |
| Total | 7,939 (51.6%) | 8,823 (57.3%) |
Disability Status by Sex by Age in Shively
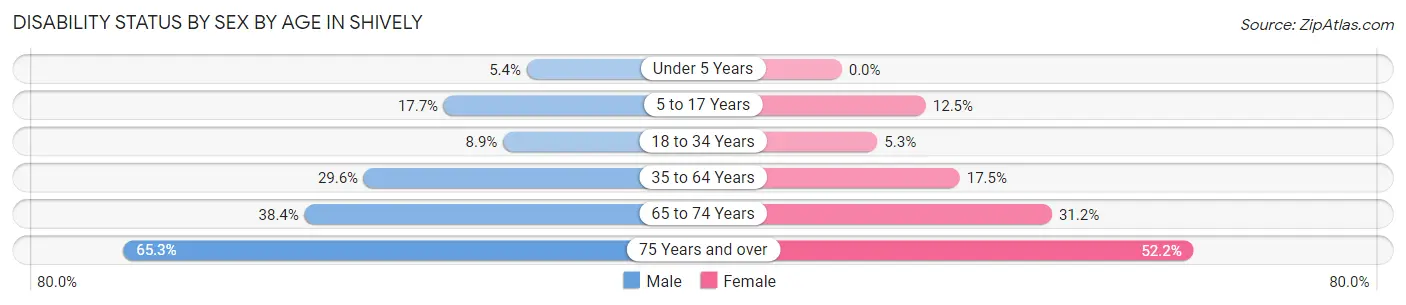
| Age Bracket | Male | Female |
| Under 5 Years | 17 (5.4%) | 0 (0.0%) |
| 5 to 17 Years | 299 (17.7%) | 164 (12.5%) |
| 18 to 34 Years | 114 (8.9%) | 64 (5.3%) |
| 35 to 64 Years | 889 (29.6%) | 582 (17.5%) |
| 65 to 74 Years | 400 (38.4%) | 422 (31.2%) |
| 75 Years and over | 213 (65.3%) | 153 (52.2%) |
Disability Class by Sex by Age in Shively
Disability Class: Hearing Difficulty
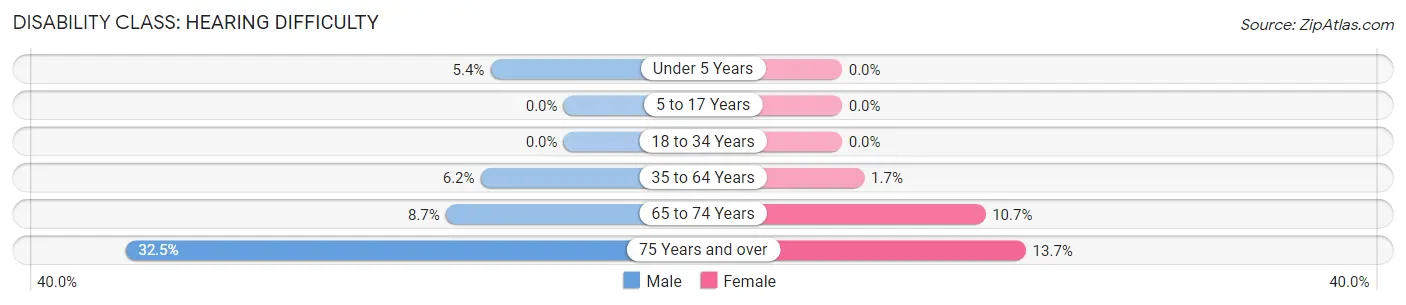
| Age Bracket | Male | Female |
| Under 5 Years | 17 (5.4%) | 0 (0.0%) |
| 5 to 17 Years | 0 (0.0%) | 0 (0.0%) |
| 18 to 34 Years | 0 (0.0%) | 0 (0.0%) |
| 35 to 64 Years | 185 (6.2%) | 55 (1.7%) |
| 65 to 74 Years | 91 (8.7%) | 144 (10.6%) |
| 75 Years and over | 106 (32.5%) | 40 (13.7%) |
Disability Class: Vision Difficulty
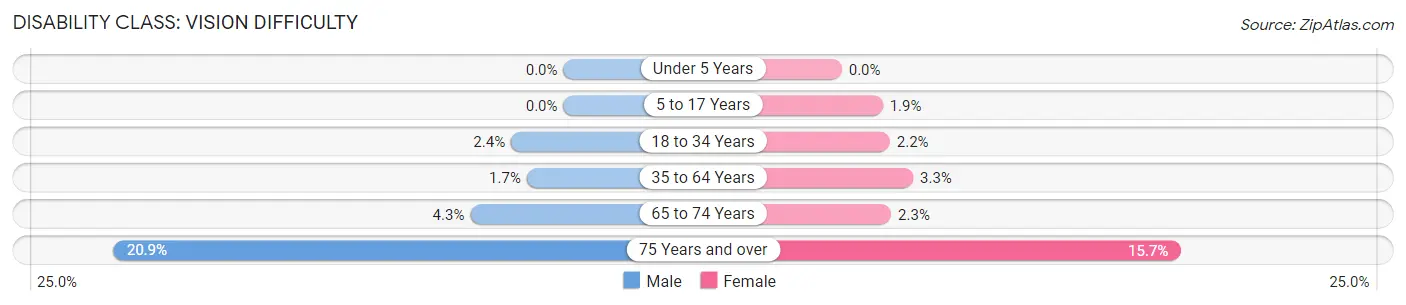
| Age Bracket | Male | Female |
| Under 5 Years | 0 (0.0%) | 0 (0.0%) |
| 5 to 17 Years | 0 (0.0%) | 25 (1.9%) |
| 18 to 34 Years | 31 (2.4%) | 27 (2.2%) |
| 35 to 64 Years | 51 (1.7%) | 110 (3.3%) |
| 65 to 74 Years | 45 (4.3%) | 31 (2.3%) |
| 75 Years and over | 68 (20.9%) | 46 (15.7%) |
Disability Class: Cognitive Difficulty
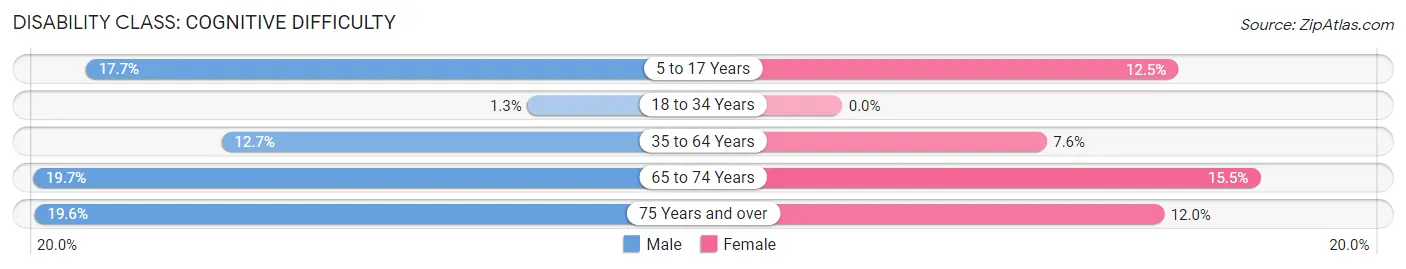
| Age Bracket | Male | Female |
| 5 to 17 Years | 299 (17.7%) | 164 (12.5%) |
| 18 to 34 Years | 17 (1.3%) | 0 (0.0%) |
| 35 to 64 Years | 381 (12.7%) | 252 (7.6%) |
| 65 to 74 Years | 205 (19.7%) | 210 (15.5%) |
| 75 Years and over | 64 (19.6%) | 35 (11.9%) |
Disability Class: Ambulatory Difficulty
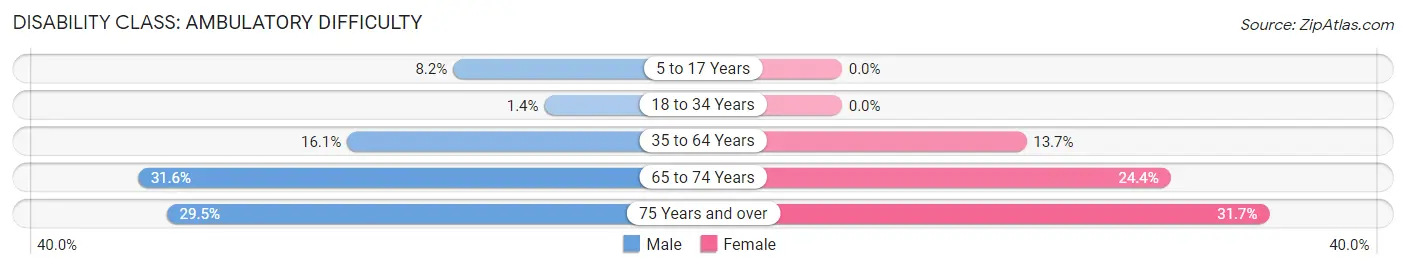
| Age Bracket | Male | Female |
| 5 to 17 Years | 138 (8.2%) | 0 (0.0%) |
| 18 to 34 Years | 18 (1.4%) | 0 (0.0%) |
| 35 to 64 Years | 482 (16.1%) | 455 (13.7%) |
| 65 to 74 Years | 329 (31.6%) | 330 (24.4%) |
| 75 Years and over | 96 (29.4%) | 93 (31.7%) |
Disability Class: Self-Care Difficulty
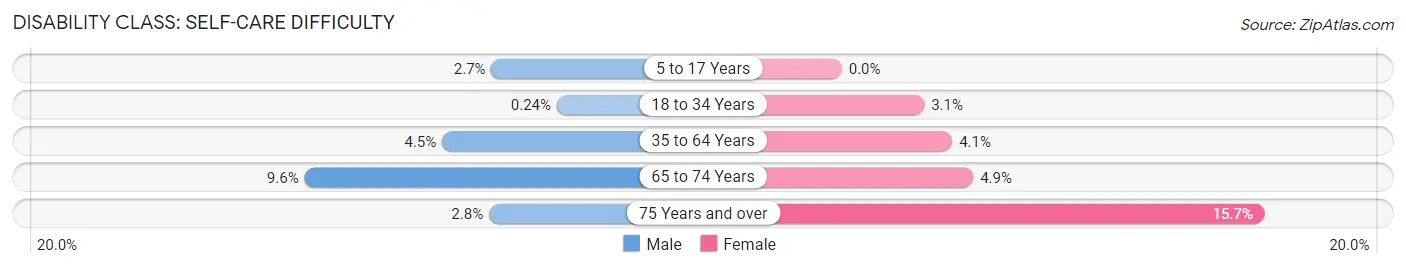
| Age Bracket | Male | Female |
| 5 to 17 Years | 45 (2.7%) | 0 (0.0%) |
| 18 to 34 Years | 3 (0.2%) | 37 (3.1%) |
| 35 to 64 Years | 135 (4.5%) | 136 (4.1%) |
| 65 to 74 Years | 100 (9.6%) | 66 (4.9%) |
| 75 Years and over | 9 (2.8%) | 46 (15.7%) |
Technology Access in Shively
Computing Device Access in Shively
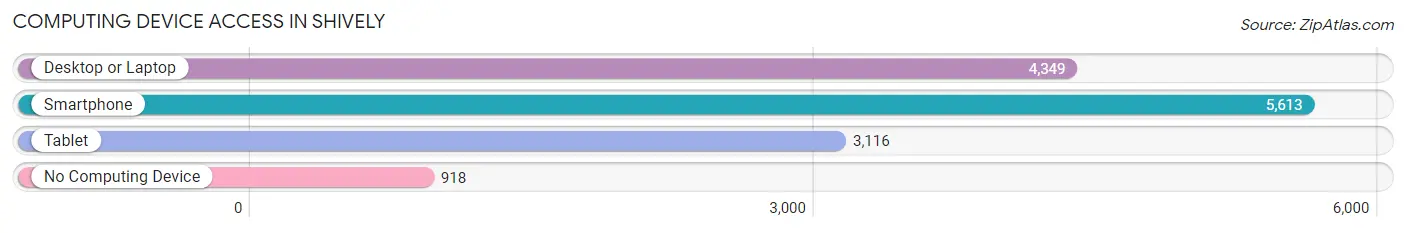
| Device Type | # Households | % Households |
| Desktop or Laptop | 4,349 | 62.8% |
| Smartphone | 5,613 | 81.0% |
| Tablet | 3,116 | 45.0% |
| No Computing Device | 918 | 13.3% |
| Total | 6,925 | 100.0% |
Internet Access in Shively
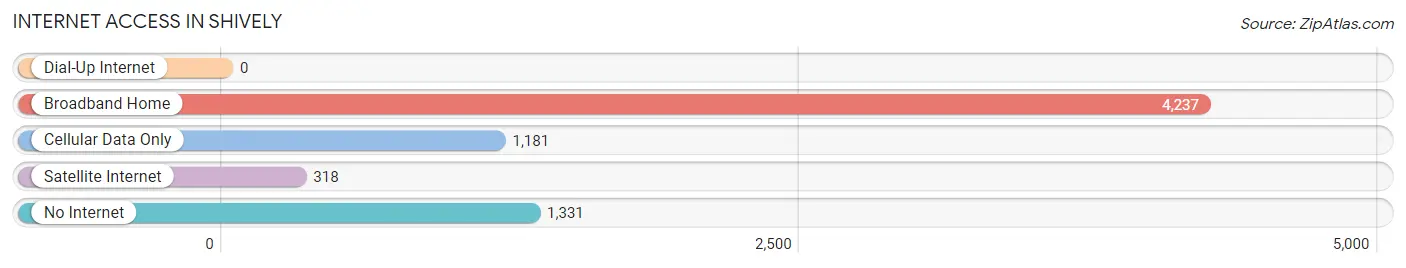
| Internet Type | # Households | % Households |
| Dial-Up Internet | 0 | 0.0% |
| Broadband Home | 4,237 | 61.2% |
| Cellular Data Only | 1,181 | 17.1% |
| Satellite Internet | 318 | 4.6% |
| No Internet | 1,331 | 19.2% |
| Total | 6,925 | 100.0% |
Shively Summary
Shively, Kentucky is a city located in Jefferson County, Kentucky, United States. It is a suburb of Louisville and is part of the Louisville Metro area. The population was 15,264 at the 2010 census.
History
Shively was founded in the late 19th century as a small farming community. The city was named after its first postmaster, John Shively. The city was incorporated in 1938.
In the 1950s, Shively began to experience rapid growth due to its proximity to Louisville. The city was annexed by Louisville in 2003, becoming part of the Louisville Metro area.
Geography
Shively is located at 38°13'25" North, 85°45'17" West (38.223611, -85.754722). The city is situated in the rolling hills of central Kentucky, about 8 miles south of downtown Louisville.
The city has a total area of 4 2 square miles all of which is land
Economy
Shively’s economy is largely based on its proximity to Louisville. The city is home to several large employers, including UPS, Ford Motor Company, and Brown-Forman.
Shively is also home to several small businesses, including restaurants, retail stores, and service providers.
Demographics
As of the 2010 census, Shively had a population of 15,264. The racial makeup of the city was 79.2% White, 15.3% African American, 0.4% Native American, 1.2% Asian, 0.1% Pacific Islander, 1.3% from other races, and 2.5% from two or more races. Hispanic or Latino of any race were 3.2% of the population.
The median income for a household in Shively was $37,945, and the median income for a family was $45,945. The per capita income for the city was $19,945. About 11.2% of families and 13.3% of the population were below the poverty line, including 18.2% of those under age 18 and 8.2% of those age 65 or over.
Conclusion
Shively, Kentucky is a city located in Jefferson County, Kentucky, United States. It is a suburb of Louisville and is part of the Louisville Metro area. The city was founded in the late 19th century as a small farming community and was incorporated in 1938. In the 1950s, Shively began to experience rapid growth due to its proximity to Louisville. The city has a population of 15,264 and is home to several large employers, including UPS, Ford Motor Company, and Brown-Forman. The city also has several small businesses, including restaurants, retail stores, and service providers. The median income for a household in Shively was $37,945, and the median income for a family was $45,945. About 11.2% of families and 13.3% of the population were below the poverty line.
Common Questions
What is Per Capita Income in Shively?
Per Capita income in Shively is $30,292.
What is the Median Family Income in Shively?
Median Family Income in Shively is $56,066.
What is the Median Household income in Shively?
Median Household Income in Shively is $45,953.
What is Income or Wage Gap in Shively?
Income or Wage Gap in Shively is 1.1%.
Women in Shively earn 98.9 cents for every dollar earned by a man.
What is Inequality or Gini Index in Shively?
Inequality or Gini Index in Shively is 0.50.
What is the Total Population of Shively?
Total Population of Shively is 15,595.
What is the Total Male Population of Shively?
Total Male Population of Shively is 7,708.
What is the Total Female Population of Shively?
Total Female Population of Shively is 7,887.
What is the Ratio of Males per 100 Females in Shively?
There are 97.73 Males per 100 Females in Shively.
What is the Ratio of Females per 100 Males in Shively?
There are 102.32 Females per 100 Males in Shively.
What is the Median Population Age in Shively?
Median Population Age in Shively is 43.7 Years.
What is the Average Family Size in Shively
Average Family Size in Shively is 3.0 People.
What is the Average Household Size in Shively
Average Household Size in Shively is 2.2 People.
How Large is the Labor Force in Shively?
There are 7,508 People in the Labor Forcein in Shively.
What is the Percentage of People in the Labor Force in Shively?
60.1% of People are in the Labor Force in Shively.
What is the Unemployment Rate in Shively?
Unemployment Rate in Shively is 5.7%.