Crestview, KY Map & Demographics
Crestview Map
Crestview Overview
$39,042
PER CAPITA INCOME
$104,000
AVG FAMILY INCOME
$86,250
AVG HOUSEHOLD INCOME
38.2%
WAGE / INCOME GAP [ % ]
61.8¢/ $1
WAGE / INCOME GAP [ $ ]
0.28
INEQUALITY / GINI INDEX
488
TOTAL POPULATION
241
MALE POPULATION
247
FEMALE POPULATION
97.57
MALES / 100 FEMALES
102.49
FEMALES / 100 MALES
36.4
MEDIAN AGE
2.9
AVG FAMILY SIZE
2.4
AVG HOUSEHOLD SIZE
337
LABOR FORCE [ PEOPLE ]
84.9%
PERCENT IN LABOR FORCE
2.4%
UNEMPLOYMENT RATE
Income in Crestview
Income Overview in Crestview
Per Capita Income in Crestview is $39,042, while median incomes of families and households are $104,000 and $86,250 respectively.
| Characteristic | Number | Measure |
| Per Capita Income | 488 | $39,042 |
| Median Family Income | 112 | $104,000 |
| Mean Family Income | 112 | $101,270 |
| Median Household Income | 204 | $86,250 |
| Mean Household Income | 204 | $90,610 |
| Income Deficit | 112 | $0 |
| Wage / Income Gap (%) | 488 | 38.20% |
| Wage / Income Gap ($) | 488 | 61.80¢ per $1 |
| Gini / Inequality Index | 488 | 0.28 |
Earnings by Sex in Crestview
Average Earnings in Crestview are $50,500, $62,250 for men and $38,472 for women, a difference of 38.2%.
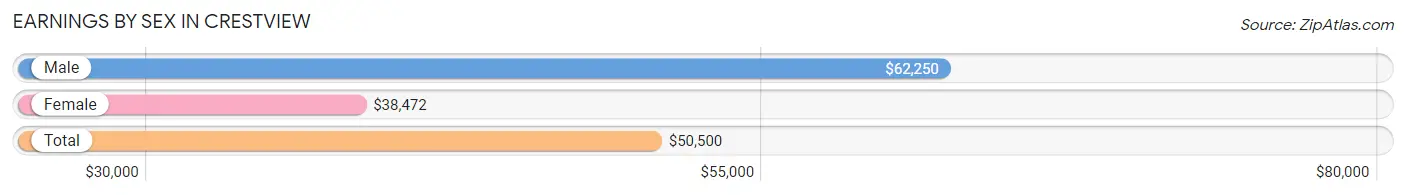
| Sex | Number | Average Earnings |
| Male | 165 (49.1%) | $62,250 |
| Female | 171 (50.9%) | $38,472 |
| Total | 336 (100.0%) | $50,500 |
Earnings by Sex by Income Bracket in Crestview
The most common earnings brackets in Crestview are $65,000 to $74,999 for men (62 | 37.6%) and $65,000 to $74,999 for women (19 | 11.1%).
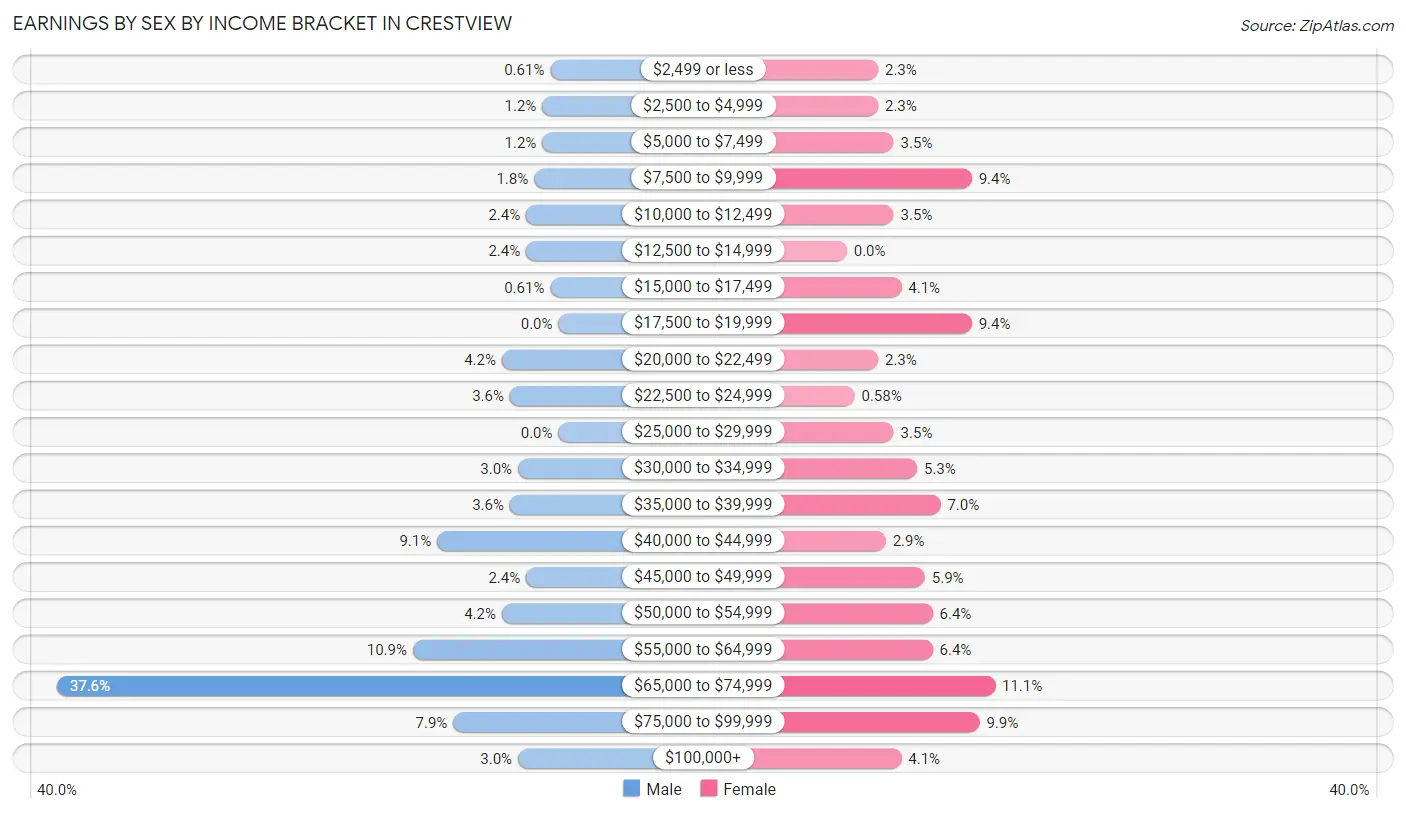
| Income | Male | Female |
| $2,499 or less | 1 (0.6%) | 4 (2.3%) |
| $2,500 to $4,999 | 2 (1.2%) | 4 (2.3%) |
| $5,000 to $7,499 | 2 (1.2%) | 6 (3.5%) |
| $7,500 to $9,999 | 3 (1.8%) | 16 (9.4%) |
| $10,000 to $12,499 | 4 (2.4%) | 6 (3.5%) |
| $12,500 to $14,999 | 4 (2.4%) | 0 (0.0%) |
| $15,000 to $17,499 | 1 (0.6%) | 7 (4.1%) |
| $17,500 to $19,999 | 0 (0.0%) | 16 (9.4%) |
| $20,000 to $22,499 | 7 (4.2%) | 4 (2.3%) |
| $22,500 to $24,999 | 6 (3.6%) | 1 (0.6%) |
| $25,000 to $29,999 | 0 (0.0%) | 6 (3.5%) |
| $30,000 to $34,999 | 5 (3.0%) | 9 (5.3%) |
| $35,000 to $39,999 | 6 (3.6%) | 12 (7.0%) |
| $40,000 to $44,999 | 15 (9.1%) | 5 (2.9%) |
| $45,000 to $49,999 | 4 (2.4%) | 10 (5.9%) |
| $50,000 to $54,999 | 7 (4.2%) | 11 (6.4%) |
| $55,000 to $64,999 | 18 (10.9%) | 11 (6.4%) |
| $65,000 to $74,999 | 62 (37.6%) | 19 (11.1%) |
| $75,000 to $99,999 | 13 (7.9%) | 17 (9.9%) |
| $100,000+ | 5 (3.0%) | 7 (4.1%) |
| Total | 165 (100.0%) | 171 (100.0%) |
Earnings by Sex by Educational Attainment in Crestview
Average earnings in Crestview are $65,714 for men and $45,781 for women, a difference of 30.3%. Men with an educational attainment of less than high school enjoy the highest average annual earnings of $72,750, while those with college or associate's degree education earn the least with $56,250. Women with an educational attainment of college or associate's degree earn the most with the average annual earnings of $59,375, while those with bachelor's degree education have the smallest earnings of $33,125.
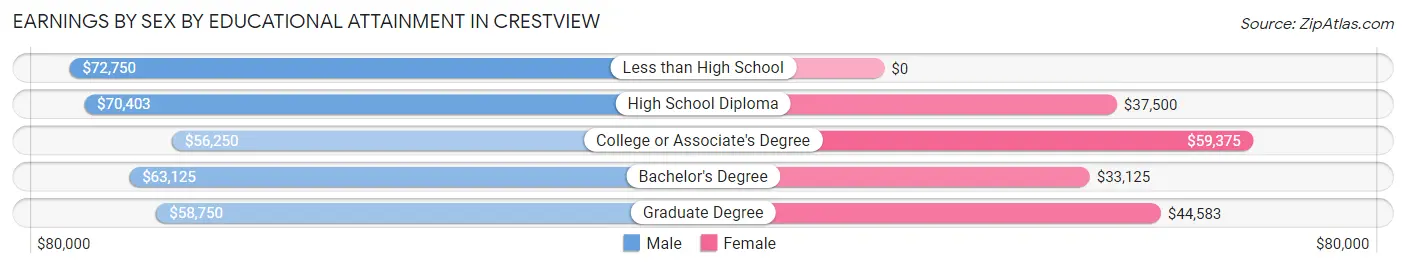
| Educational Attainment | Male Income | Female Income |
| Less than High School | $72,750 | $0 |
| High School Diploma | $70,403 | $37,500 |
| College or Associate's Degree | $56,250 | $59,375 |
| Bachelor's Degree | $63,125 | $33,125 |
| Graduate Degree | $58,750 | $44,583 |
| Total | $65,714 | $45,781 |
Family Income in Crestview
Family Income Brackets in Crestview
According to the Crestview family income data, there are 42 families falling into the $100,000 to $149,999 income range, which is the most common income bracket and makes up 37.5% of all families.
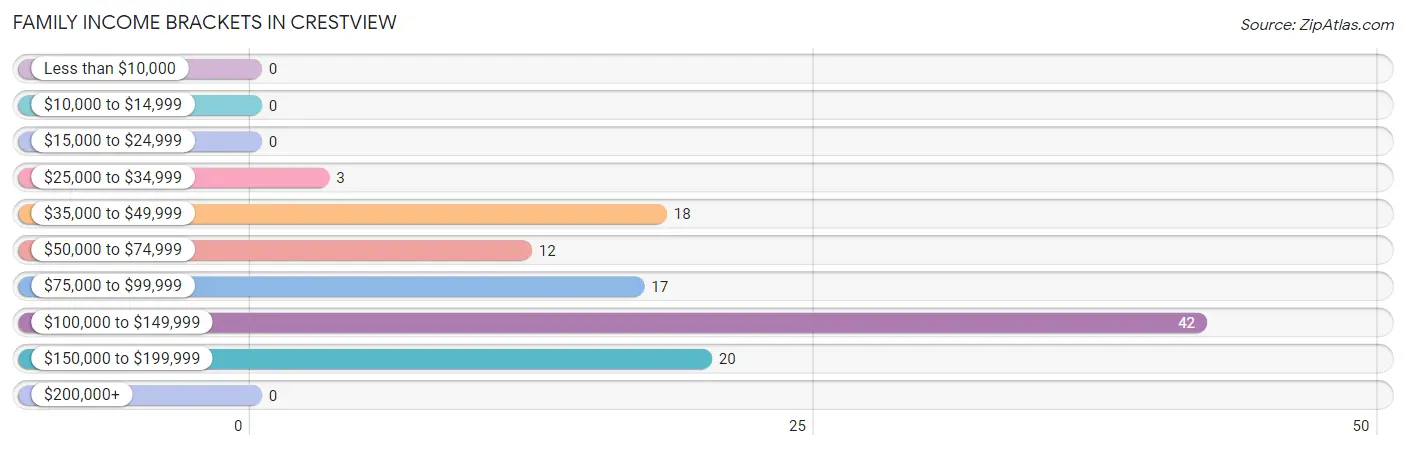
| Income Bracket | # Families | % Families |
| Less than $10,000 | 0 | 0.0% |
| $10,000 to $14,999 | 0 | 0.0% |
| $15,000 to $24,999 | 0 | 0.0% |
| $25,000 to $34,999 | 3 | 2.7% |
| $35,000 to $49,999 | 18 | 16.1% |
| $50,000 to $74,999 | 12 | 10.7% |
| $75,000 to $99,999 | 17 | 15.2% |
| $100,000 to $149,999 | 42 | 37.5% |
| $150,000 to $199,999 | 20 | 17.9% |
| $200,000+ | 0 | 0.0% |
Family Income by Famaliy Size in Crestview
5-person families (8 | 7.1%) account for the highest median family income in Crestview with $110,000 per family, while 2-person families (47 | 42.0%) have the highest median income of $39,688 per family member.
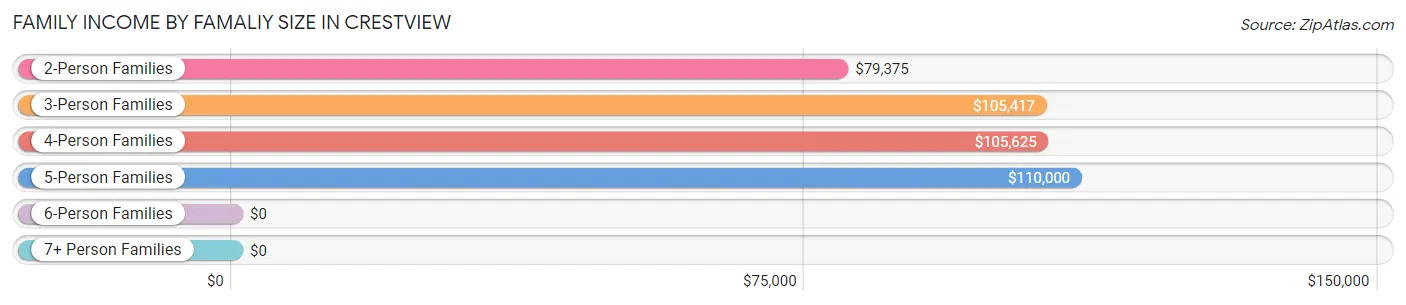
| Income Bracket | # Families | Median Income |
| 2-Person Families | 47 (42.0%) | $79,375 |
| 3-Person Families | 39 (34.8%) | $105,417 |
| 4-Person Families | 14 (12.5%) | $105,625 |
| 5-Person Families | 8 (7.1%) | $110,000 |
| 6-Person Families | 2 (1.8%) | $0 |
| 7+ Person Families | 2 (1.8%) | $0 |
| Total | 112 (100.0%) | $104,000 |
Family Income by Number of Earners in Crestview
The median family income in Crestview is $104,000, with families comprising 3+ earners (14) having the highest median family income of $121,250, while families with 1 earner (22) have the lowest median family income of $48,125, accounting for 12.5% and 19.6% of families, respectively.
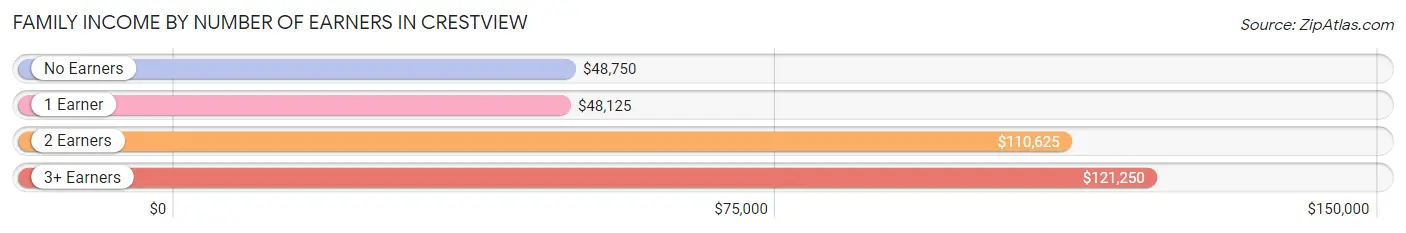
| Number of Earners | # Families | Median Income |
| No Earners | 7 (6.2%) | $48,750 |
| 1 Earner | 22 (19.6%) | $48,125 |
| 2 Earners | 69 (61.6%) | $110,625 |
| 3+ Earners | 14 (12.5%) | $121,250 |
| Total | 112 (100.0%) | $104,000 |
Household Income in Crestview
Household Income Brackets in Crestview
With 63 households falling in the category, the $100,000 to $149,999 income range is the most frequent in Crestview, accounting for 30.9% of all households.
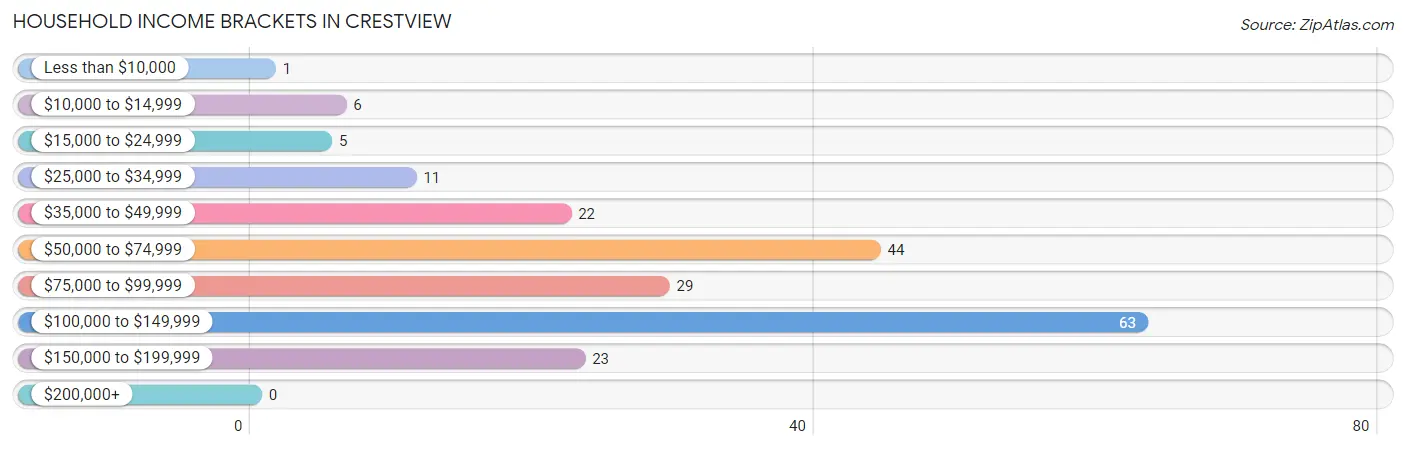
| Income Bracket | # Households | % Households |
| Less than $10,000 | 1 | 0.5% |
| $10,000 to $14,999 | 6 | 2.9% |
| $15,000 to $24,999 | 5 | 2.5% |
| $25,000 to $34,999 | 11 | 5.4% |
| $35,000 to $49,999 | 22 | 10.8% |
| $50,000 to $74,999 | 44 | 21.6% |
| $75,000 to $99,999 | 29 | 14.2% |
| $100,000 to $149,999 | 63 | 30.9% |
| $150,000 to $199,999 | 23 | 11.3% |
| $200,000+ | 0 | 0.0% |
Household Income by Householder Age in Crestview
The median household income in Crestview is $86,250, with the highest median household income of $101,875 found in the 25 to 44 years age bracket for the primary householder. A total of 75 households (36.8%) fall into this category. Meanwhile, the 15 to 24 years age bracket for the primary householder has the lowest median household income of $0, with 7 households (3.4%) in this group.
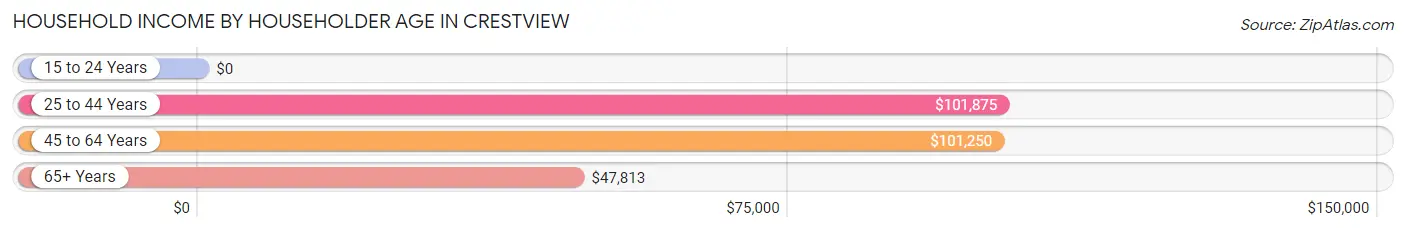
| Income Bracket | # Households | Median Income |
| 15 to 24 Years | 7 (3.4%) | $0 |
| 25 to 44 Years | 75 (36.8%) | $101,875 |
| 45 to 64 Years | 85 (41.7%) | $101,250 |
| 65+ Years | 37 (18.1%) | $47,813 |
| Total | 204 (100.0%) | $86,250 |
Poverty in Crestview
Income Below Poverty by Sex and Age in Crestview
With 2.5% poverty level for males and 8.1% for females among the residents of Crestview, 65 to 74 year old males and 18 to 24 year old females are the most vulnerable to poverty, with 6 males (26.1%) and 17 females (40.5%) in their respective age groups living below the poverty level.
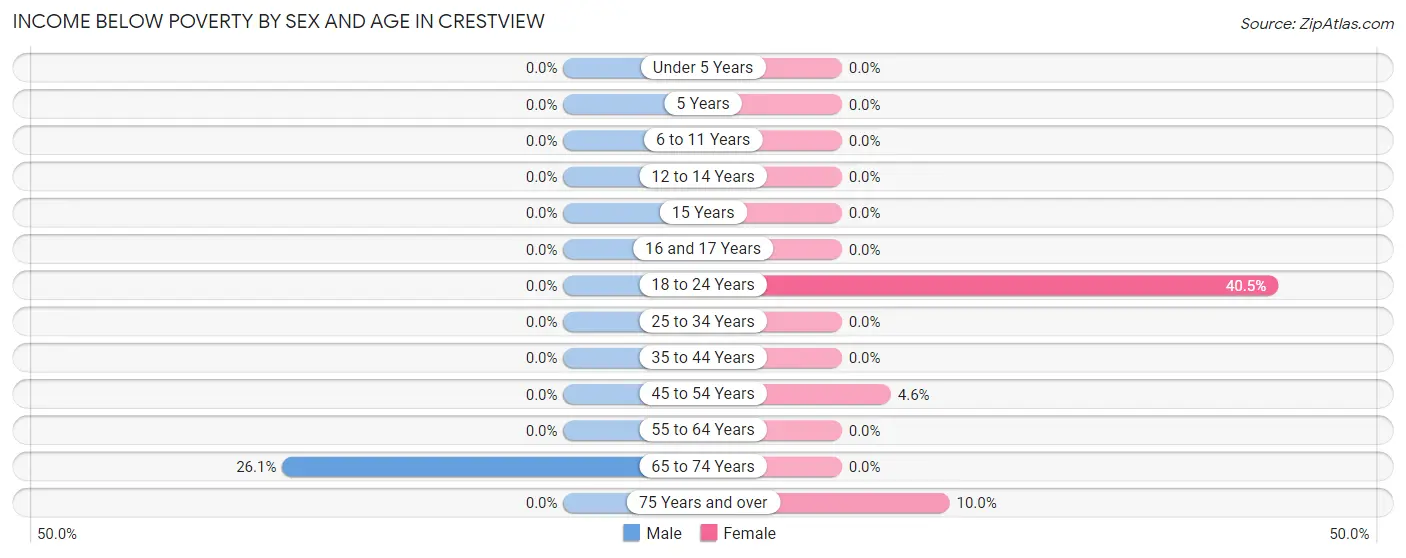
| Age Bracket | Male | Female |
| Under 5 Years | 0 (0.0%) | 0 (0.0%) |
| 5 Years | 0 (0.0%) | 0 (0.0%) |
| 6 to 11 Years | 0 (0.0%) | 0 (0.0%) |
| 12 to 14 Years | 0 (0.0%) | 0 (0.0%) |
| 15 Years | 0 (0.0%) | 0 (0.0%) |
| 16 and 17 Years | 0 (0.0%) | 0 (0.0%) |
| 18 to 24 Years | 0 (0.0%) | 17 (40.5%) |
| 25 to 34 Years | 0 (0.0%) | 0 (0.0%) |
| 35 to 44 Years | 0 (0.0%) | 0 (0.0%) |
| 45 to 54 Years | 0 (0.0%) | 2 (4.5%) |
| 55 to 64 Years | 0 (0.0%) | 0 (0.0%) |
| 65 to 74 Years | 6 (26.1%) | 0 (0.0%) |
| 75 Years and over | 0 (0.0%) | 1 (10.0%) |
| Total | 6 (2.5%) | 20 (8.1%) |
Income Above Poverty by Sex and Age in Crestview
According to the poverty statistics in Crestview, males aged under 5 years and females aged under 5 years are the age groups that are most secure financially, with 100.0% of males and 100.0% of females in these age groups living above the poverty line.
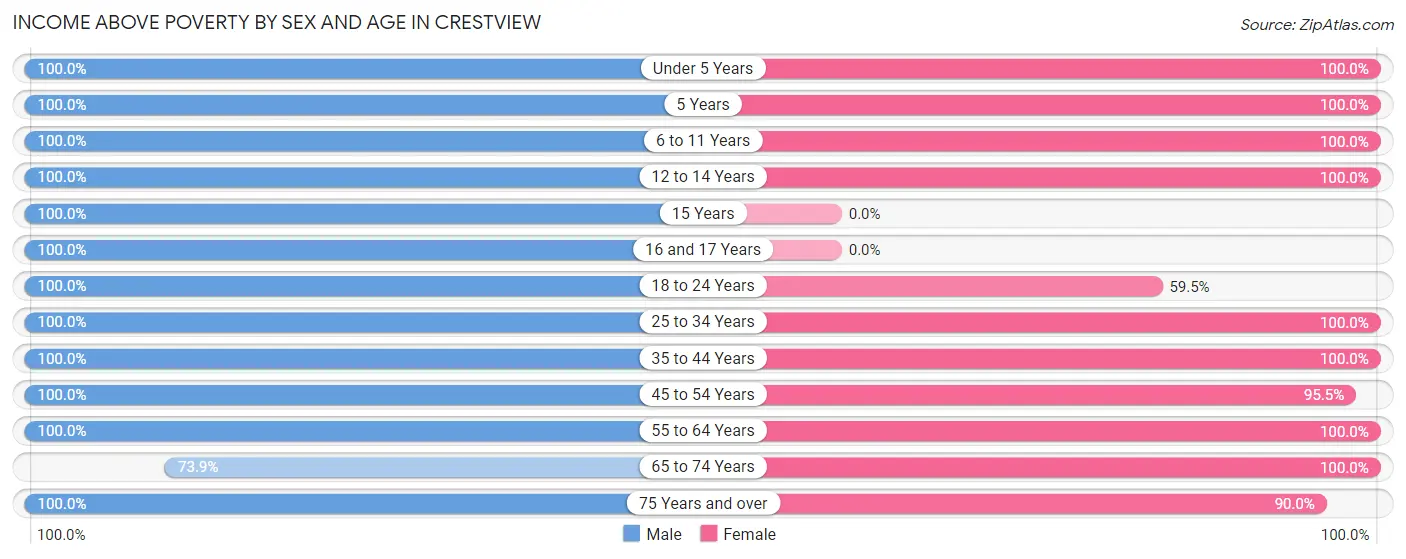
| Age Bracket | Male | Female |
| Under 5 Years | 14 (100.0%) | 12 (100.0%) |
| 5 Years | 5 (100.0%) | 6 (100.0%) |
| 6 to 11 Years | 17 (100.0%) | 23 (100.0%) |
| 12 to 14 Years | 8 (100.0%) | 1 (100.0%) |
| 15 Years | 2 (100.0%) | 0 (0.0%) |
| 16 and 17 Years | 4 (100.0%) | 0 (0.0%) |
| 18 to 24 Years | 8 (100.0%) | 25 (59.5%) |
| 25 to 34 Years | 38 (100.0%) | 43 (100.0%) |
| 35 to 44 Years | 40 (100.0%) | 31 (100.0%) |
| 45 to 54 Years | 59 (100.0%) | 42 (95.5%) |
| 55 to 64 Years | 16 (100.0%) | 24 (100.0%) |
| 65 to 74 Years | 17 (73.9%) | 10 (100.0%) |
| 75 Years and over | 5 (100.0%) | 9 (90.0%) |
| Total | 233 (97.5%) | 226 (91.9%) |
Income Below Poverty Among Married-Couple Families in Crestview
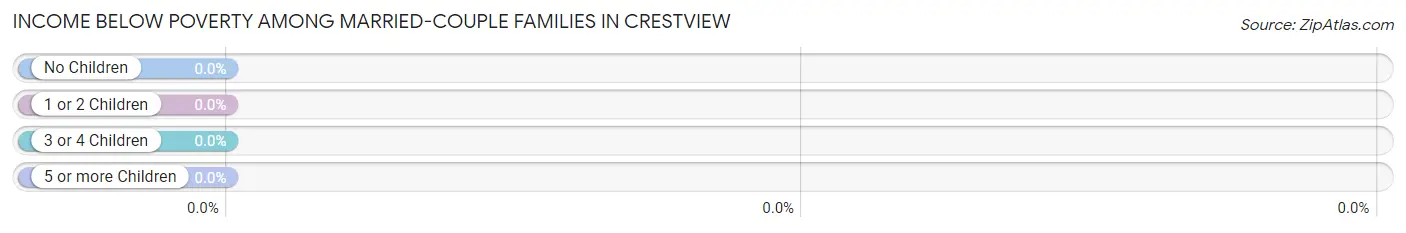
| Children | Above Poverty | Below Poverty |
| No Children | 39 (100.0%) | 0 (0.0%) |
| 1 or 2 Children | 32 (100.0%) | 0 (0.0%) |
| 3 or 4 Children | 8 (100.0%) | 0 (0.0%) |
| 5 or more Children | 0 (0.0%) | 0 (0.0%) |
| Total | 79 (100.0%) | 0 (0.0%) |
Income Below Poverty Among Single-Parent Households in Crestview
| Children | Single Father | Single Mother |
| No Children | 0 (0.0%) | 0 (0.0%) |
| 1 or 2 Children | 0 (0.0%) | 0 (0.0%) |
| 3 or 4 Children | 0 (0.0%) | 0 (0.0%) |
| 5 or more Children | 0 (0.0%) | 0 (0.0%) |
| Total | 0 (0.0%) | 0 (0.0%) |
Income Below Poverty Among Married-Couple vs Single-Parent Households in Crestview
| Children | Married-Couple Families | Single-Parent Households |
| No Children | 0 (0.0%) | 0 (0.0%) |
| 1 or 2 Children | 0 (0.0%) | 0 (0.0%) |
| 3 or 4 Children | 0 (0.0%) | 0 (0.0%) |
| 5 or more Children | 0 (0.0%) | 0 (0.0%) |
| Total | 0 (0.0%) | 0 (0.0%) |
Race in Crestview
The most populous races in Crestview are White / Caucasian (471 | 96.5%), Two or more Races (16 | 3.3%), and Asian (1 | 0.2%).
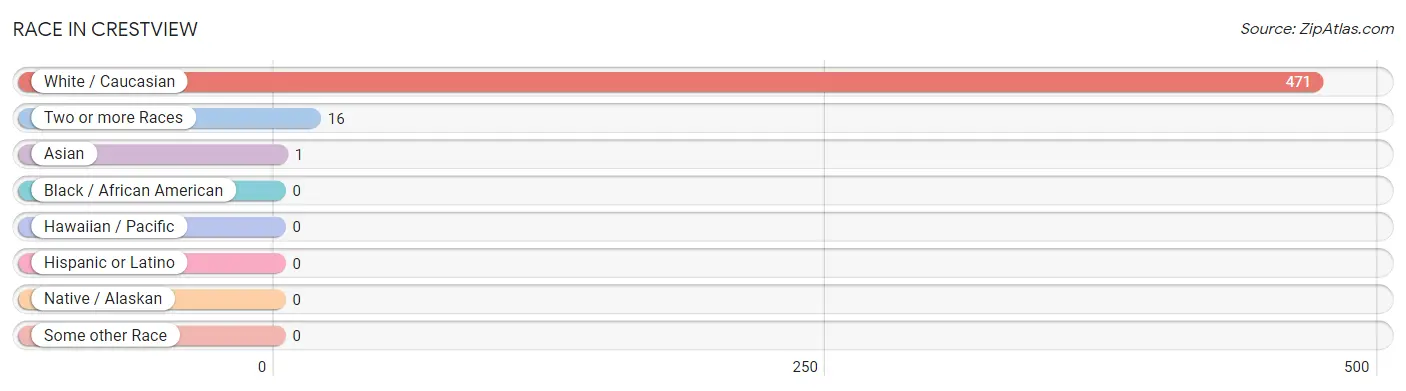
| Race | # Population | % Population |
| Asian | 1 | 0.2% |
| Black / African American | 0 | 0.0% |
| Hawaiian / Pacific | 0 | 0.0% |
| Hispanic or Latino | 0 | 0.0% |
| Native / Alaskan | 0 | 0.0% |
| White / Caucasian | 471 | 96.5% |
| Two or more Races | 16 | 3.3% |
| Some other Race | 0 | 0.0% |
| Total | 488 | 100.0% |
Ancestry in Crestview
The most populous ancestries reported in Crestview are German (179 | 36.7%), Irish (102 | 20.9%), American (65 | 13.3%), English (37 | 7.6%), and Italian (13 | 2.7%), together accounting for 81.1% of all Crestview residents.
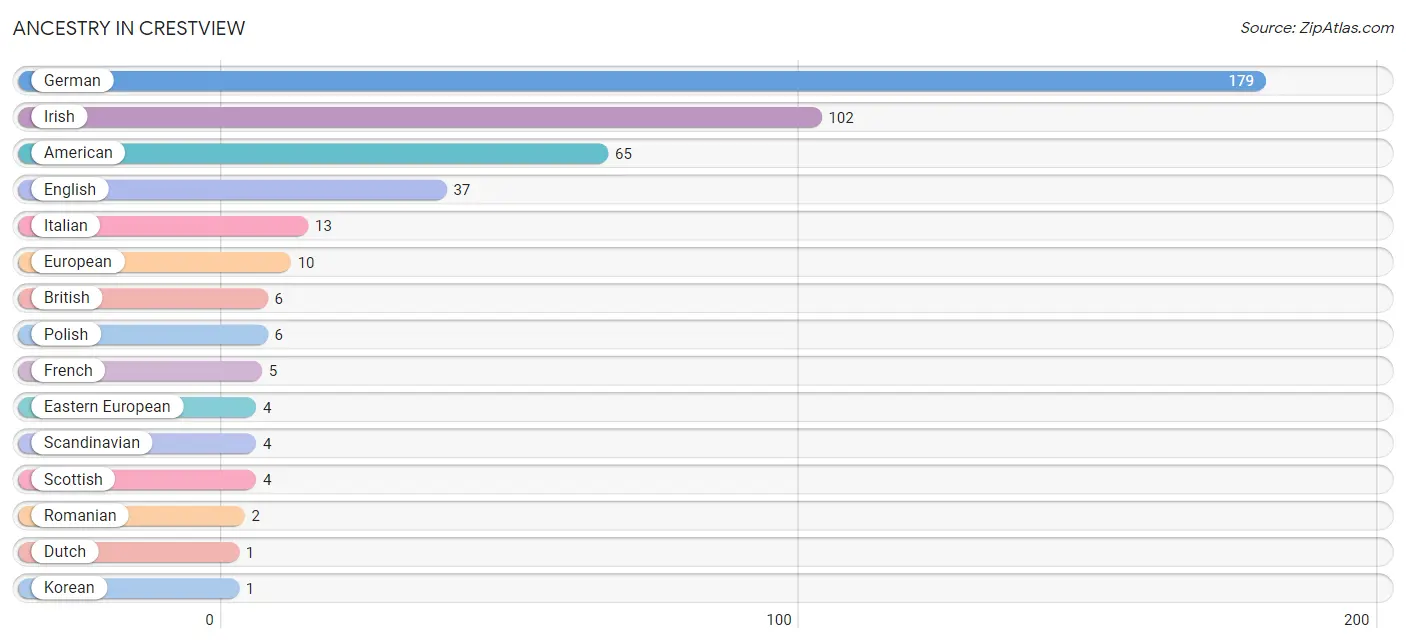
| Ancestry | # Population | % Population |
| American | 65 | 13.3% |
| British | 6 | 1.2% |
| Dutch | 1 | 0.2% |
| Eastern European | 4 | 0.8% |
| English | 37 | 7.6% |
| European | 10 | 2.1% |
| French | 5 | 1.0% |
| German | 179 | 36.7% |
| Irish | 102 | 20.9% |
| Italian | 13 | 2.7% |
| Korean | 1 | 0.2% |
| Northern European | 1 | 0.2% |
| Polish | 6 | 1.2% |
| Romanian | 2 | 0.4% |
| Scandinavian | 4 | 0.8% |
| Scottish | 4 | 0.8% |
| Sioux | 1 | 0.2% | View All 17 Rows |
Immigrants in Crestview
The most numerous immigrant groups reported in Crestview came from Europe (4 | 0.8%), Germany (4 | 0.8%), and Western Europe (4 | 0.8%), together accounting for 2.5% of all Crestview residents.
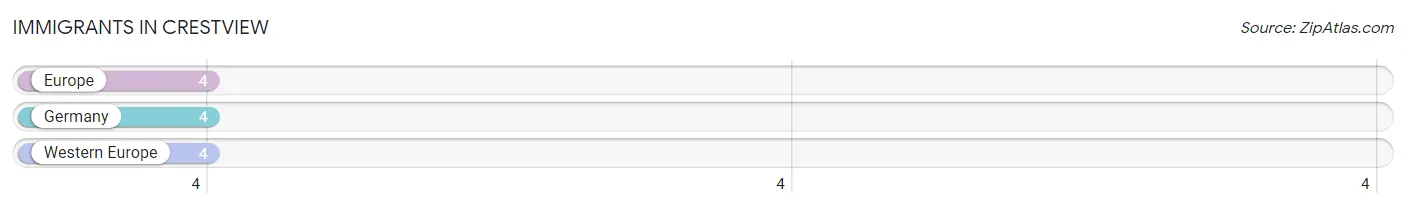
| Immigration Origin | # Population | % Population |
| Europe | 4 | 0.8% |
| Germany | 4 | 0.8% |
| Western Europe | 4 | 0.8% | View All 3 Rows |
Sex and Age in Crestview
Sex and Age in Crestview
The most populous age groups in Crestview are 50 to 54 Years (42 | 17.4%) for men and 20 to 24 Years (36 | 14.6%) for women.
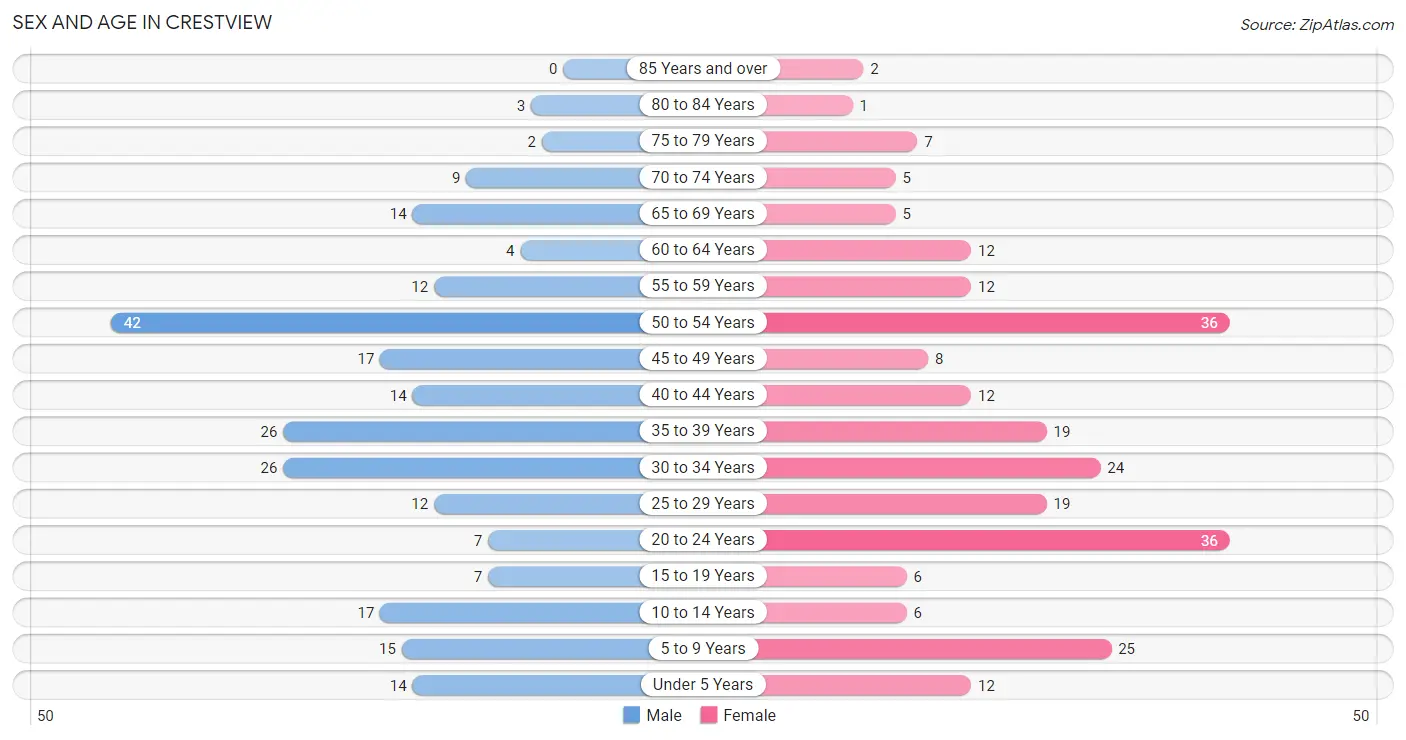
| Age Bracket | Male | Female |
| Under 5 Years | 14 (5.8%) | 12 (4.9%) |
| 5 to 9 Years | 15 (6.2%) | 25 (10.1%) |
| 10 to 14 Years | 17 (7.0%) | 6 (2.4%) |
| 15 to 19 Years | 7 (2.9%) | 6 (2.4%) |
| 20 to 24 Years | 7 (2.9%) | 36 (14.6%) |
| 25 to 29 Years | 12 (5.0%) | 19 (7.7%) |
| 30 to 34 Years | 26 (10.8%) | 24 (9.7%) |
| 35 to 39 Years | 26 (10.8%) | 19 (7.7%) |
| 40 to 44 Years | 14 (5.8%) | 12 (4.9%) |
| 45 to 49 Years | 17 (7.0%) | 8 (3.2%) |
| 50 to 54 Years | 42 (17.4%) | 36 (14.6%) |
| 55 to 59 Years | 12 (5.0%) | 12 (4.9%) |
| 60 to 64 Years | 4 (1.7%) | 12 (4.9%) |
| 65 to 69 Years | 14 (5.8%) | 5 (2.0%) |
| 70 to 74 Years | 9 (3.7%) | 5 (2.0%) |
| 75 to 79 Years | 2 (0.8%) | 7 (2.8%) |
| 80 to 84 Years | 3 (1.2%) | 1 (0.4%) |
| 85 Years and over | 0 (0.0%) | 2 (0.8%) |
| Total | 241 (100.0%) | 247 (100.0%) |
Families and Households in Crestview
Median Family Size in Crestview
The median family size in Crestview is 2.89 persons per family, with married-couple families (79 | 70.5%) accounting for the largest median family size of 3 persons per family. On the other hand, single male/father families (8 | 7.1%) represent the smallest median family size with 2.63 persons per family.
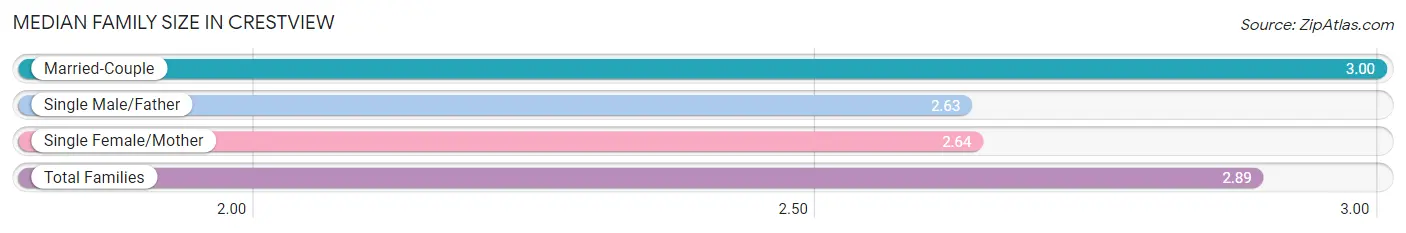
| Family Type | # Families | Family Size |
| Married-Couple | 79 (70.5%) | 3.00 |
| Single Male/Father | 8 (7.1%) | 2.63 |
| Single Female/Mother | 25 (22.3%) | 2.64 |
| Total Families | 112 (100.0%) | 2.89 |
Median Household Size in Crestview
The median household size in Crestview is 2.39 persons per household, with single female/mother households (25 | 12.2%) accounting for the largest median household size of 3.32 persons per household. non-family households (92 | 45.1%) represent the smallest median household size with 1.54 persons per household.
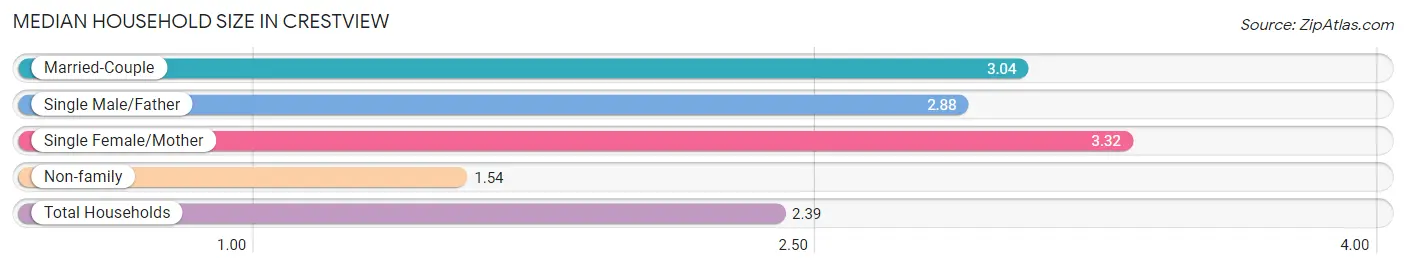
| Household Type | # Households | Household Size |
| Married-Couple | 79 (38.7%) | 3.04 |
| Single Male/Father | 8 (3.9%) | 2.88 |
| Single Female/Mother | 25 (12.2%) | 3.32 |
| Non-family | 92 (45.1%) | 1.54 |
| Total Households | 204 (100.0%) | 2.39 |
Household Size by Marriage Status in Crestview
Out of a total of 204 households in Crestview, 112 (54.9%) are family households, while 92 (45.1%) are nonfamily households. The most numerous type of family households are 2-person households, comprising 39, and the most common type of nonfamily households are 1-person households, comprising 60.
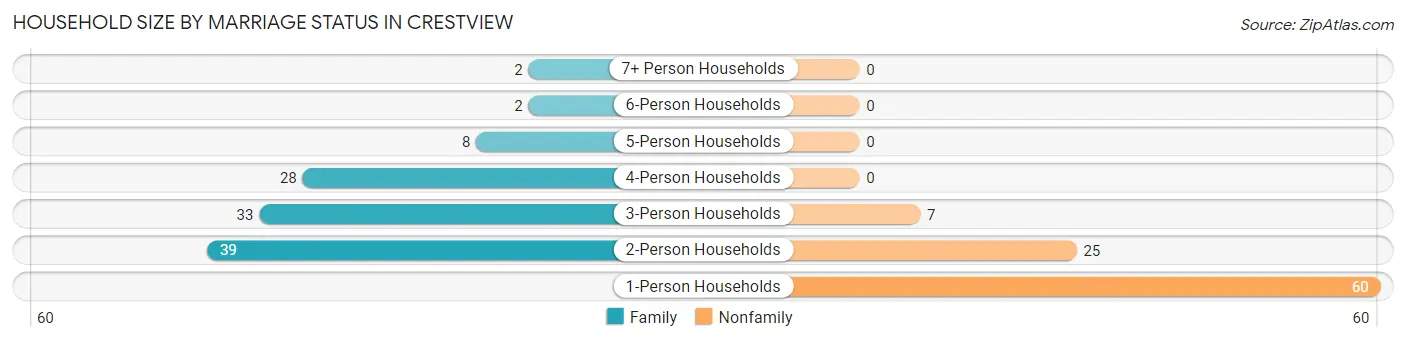
| Household Size | Family Households | Nonfamily Households |
| 1-Person Households | - | 60 (29.4%) |
| 2-Person Households | 39 (19.1%) | 25 (12.2%) |
| 3-Person Households | 33 (16.2%) | 7 (3.4%) |
| 4-Person Households | 28 (13.7%) | 0 (0.0%) |
| 5-Person Households | 8 (3.9%) | 0 (0.0%) |
| 6-Person Households | 2 (1.0%) | 0 (0.0%) |
| 7+ Person Households | 2 (1.0%) | 0 (0.0%) |
| Total | 112 (54.9%) | 92 (45.1%) |
Female Fertility in Crestview
Fertility by Age in Crestview
Average fertility rate in Crestview is 34.0 births per 1,000 women. Women in the age bracket of 35 to 50 years have the highest fertility rate with 50.0 births per 1,000 women. Women in the age bracket of 35 to 50 years acount for 60.0% of all women with births.
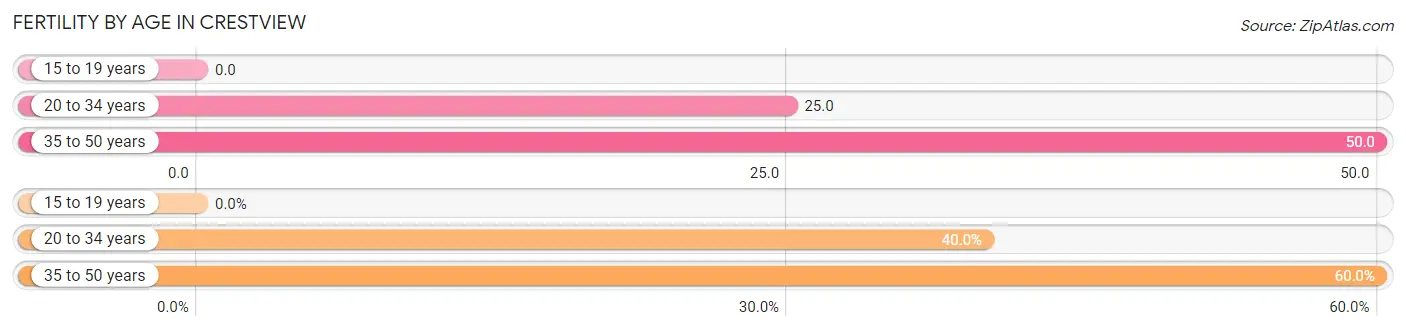
| Age Bracket | Women with Births | Births / 1,000 Women |
| 15 to 19 years | 0 (0.0%) | 0.0 |
| 20 to 34 years | 2 (40.0%) | 25.0 |
| 35 to 50 years | 3 (60.0%) | 50.0 |
| Total | 5 (100.0%) | 34.0 |
Fertility by Age by Marriage Status in Crestview
80.0% of women with births (5) in Crestview are married. The highest percentage of unmarried women with births falls into 20 to 34 years age bracket with 50.0% of them unmarried at the time of birth, while the lowest percentage of unmarried women with births belong to 35 to 50 years age bracket with 0.0% of them unmarried.
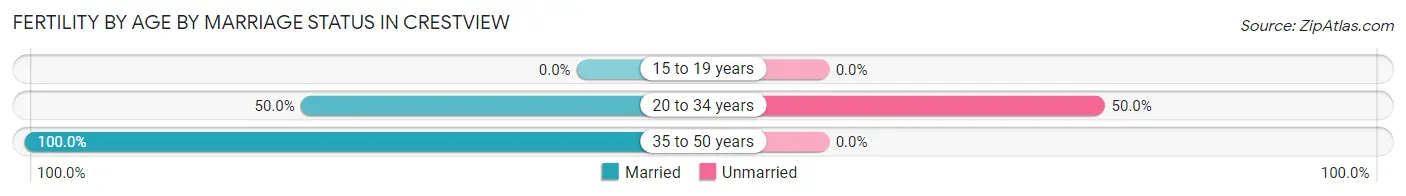
| Age Bracket | Married | Unmarried |
| 15 to 19 years | 0 (0.0%) | 0 (0.0%) |
| 20 to 34 years | 1 (50.0%) | 1 (50.0%) |
| 35 to 50 years | 3 (100.0%) | 0 (0.0%) |
| Total | 4 (80.0%) | 1 (20.0%) |
Fertility by Education in Crestview
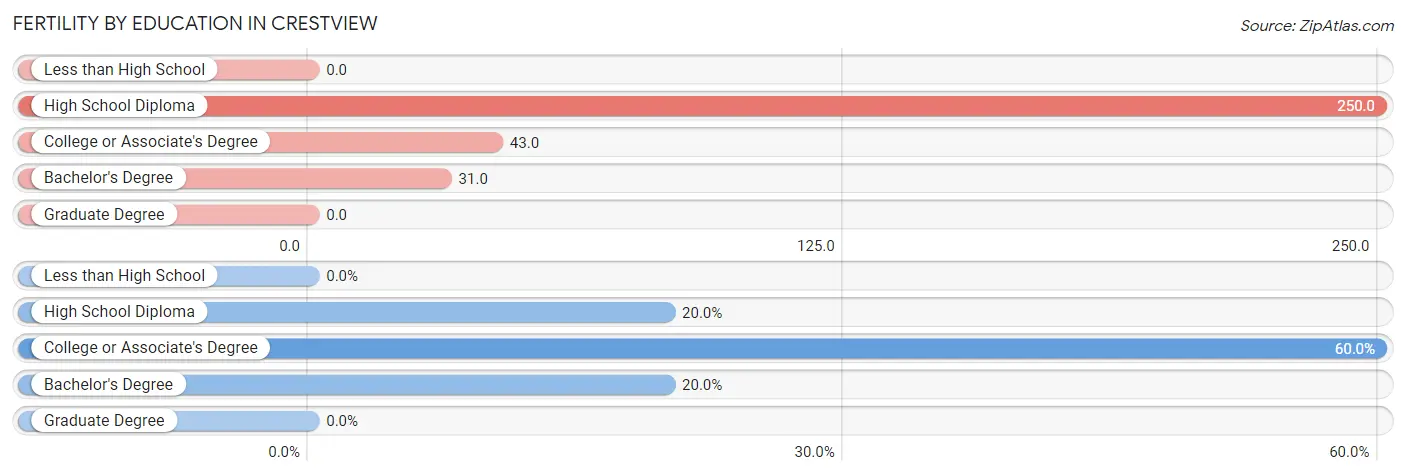
| Educational Attainment | Women with Births | Births / 1,000 Women |
| Less than High School | 0 (0.0%) | 0.0 |
| High School Diploma | 1 (20.0%) | 250.0 |
| College or Associate's Degree | 3 (60.0%) | 43.0 |
| Bachelor's Degree | 1 (20.0%) | 31.0 |
| Graduate Degree | 0 (0.0%) | 0.0 |
| Total | 5 (100.0%) | 34.0 |
Fertility by Education by Marriage Status in Crestview
20.0% of women with births in Crestview are unmarried. Women with the educational attainment of college or associate's degree are most likely to be married with 100.0% of them married at childbirth, while women with the educational attainment of high school diploma are least likely to be married with 100.0% of them unmarried at childbirth.
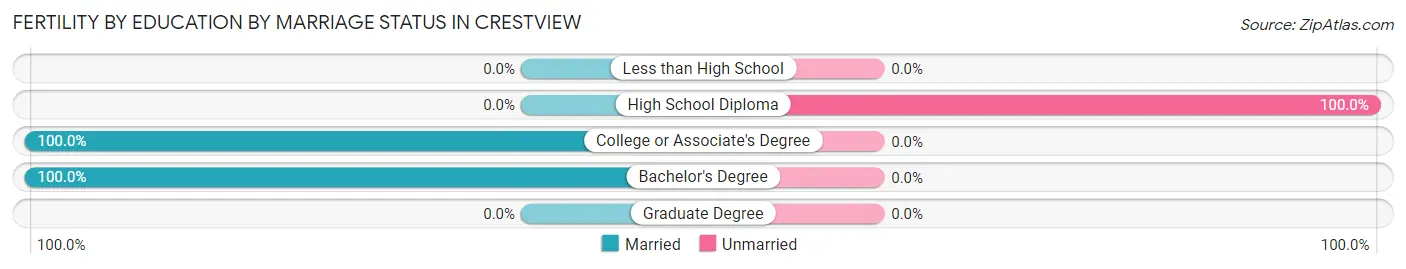
| Educational Attainment | Married | Unmarried |
| Less than High School | 0 (0.0%) | 0 (0.0%) |
| High School Diploma | 0 (0.0%) | 1 (100.0%) |
| College or Associate's Degree | 3 (100.0%) | 0 (0.0%) |
| Bachelor's Degree | 1 (100.0%) | 0 (0.0%) |
| Graduate Degree | 0 (0.0%) | 0 (0.0%) |
| Total | 4 (80.0%) | 1 (20.0%) |
Employment Characteristics in Crestview
Employment by Class of Employer in Crestview
Among the 320 employed individuals in Crestview, private company employees (229 | 71.6%), local government employees (37 | 11.6%), and not-for-profit organizations (20 | 6.2%) make up the most common classes of employment.
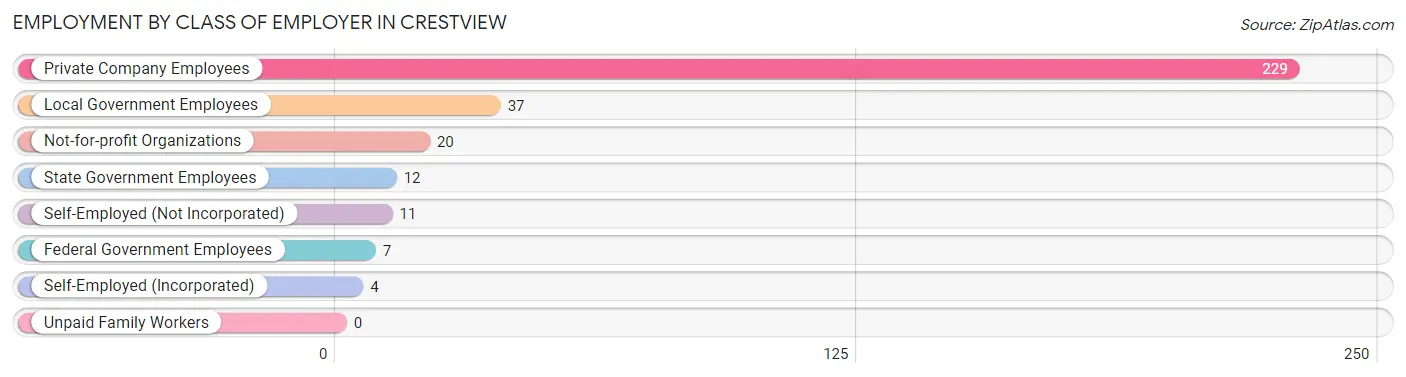
| Employer Class | # Employees | % Employees |
| Private Company Employees | 229 | 71.6% |
| Self-Employed (Incorporated) | 4 | 1.3% |
| Self-Employed (Not Incorporated) | 11 | 3.4% |
| Not-for-profit Organizations | 20 | 6.2% |
| Local Government Employees | 37 | 11.6% |
| State Government Employees | 12 | 3.7% |
| Federal Government Employees | 7 | 2.2% |
| Unpaid Family Workers | 0 | 0.0% |
| Total | 320 | 100.0% |
Employment Status by Age in Crestview
According to the labor force statistics for Crestview, out of the total population over 16 years of age (397), 84.9% or 337 individuals are in the labor force, with 2.4% or 8 of them unemployed. The age group with the highest labor force participation rate is 35 to 44 years, with 100.0% or 71 individuals in the labor force. Within the labor force, the 45 to 54 years age range has the highest percentage of unemployed individuals, with 4.9% or 5 of them being unemployed.
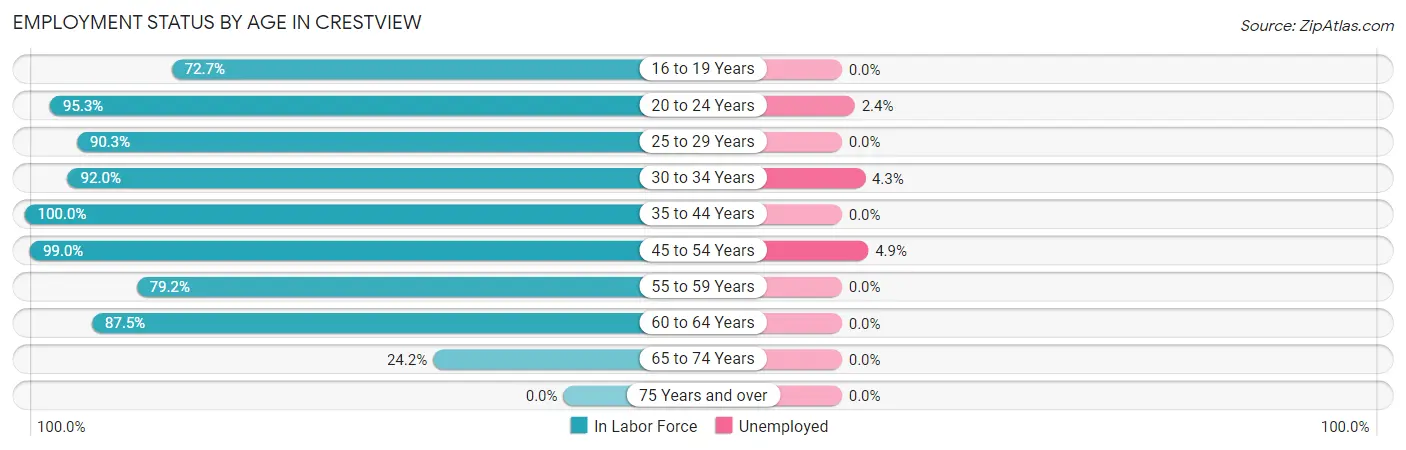
| Age Bracket | In Labor Force | Unemployed |
| 16 to 19 Years | 8 (72.7%) | 0 (0.0%) |
| 20 to 24 Years | 41 (95.3%) | 1 (2.4%) |
| 25 to 29 Years | 28 (90.3%) | 0 (0.0%) |
| 30 to 34 Years | 46 (92.0%) | 2 (4.3%) |
| 35 to 44 Years | 71 (100.0%) | 0 (0.0%) |
| 45 to 54 Years | 102 (99.0%) | 5 (4.9%) |
| 55 to 59 Years | 19 (79.2%) | 0 (0.0%) |
| 60 to 64 Years | 14 (87.5%) | 0 (0.0%) |
| 65 to 74 Years | 8 (24.2%) | 0 (0.0%) |
| 75 Years and over | 0 (0.0%) | 0 (0.0%) |
| Total | 337 (84.9%) | 8 (2.4%) |
Employment Status by Educational Attainment in Crestview
According to labor force statistics for Crestview, 94.9% of individuals (280) out of the total population between 25 and 64 years of age (295) are in the labor force, with 2.5% or 7 of them being unemployed. The group with the highest labor force participation rate are those with the educational attainment of bachelor's degree or higher, with 97.7% or 125 individuals in the labor force. Within the labor force, individuals with high school diploma education have the highest percentage of unemployment, with 8.1% or 6 of them being unemployed.
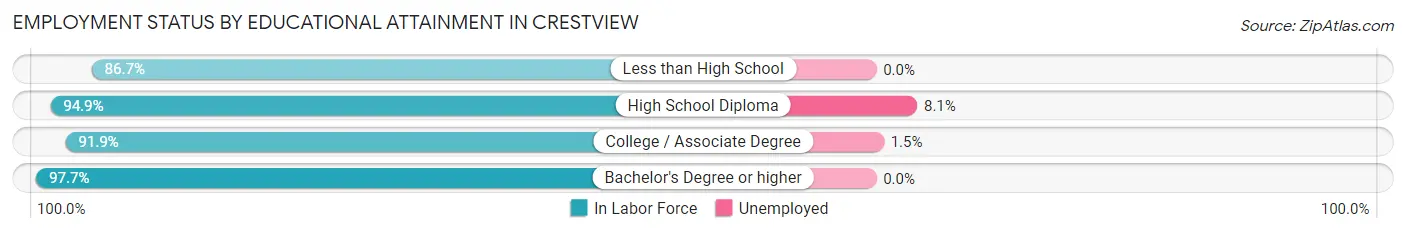
| Educational Attainment | In Labor Force | Unemployed |
| Less than High School | 13 (86.7%) | 0 (0.0%) |
| High School Diploma | 74 (94.9%) | 6 (8.1%) |
| College / Associate Degree | 68 (91.9%) | 1 (1.5%) |
| Bachelor's Degree or higher | 125 (97.7%) | 0 (0.0%) |
| Total | 280 (94.9%) | 7 (2.5%) |
Employment Occupations by Sex in Crestview
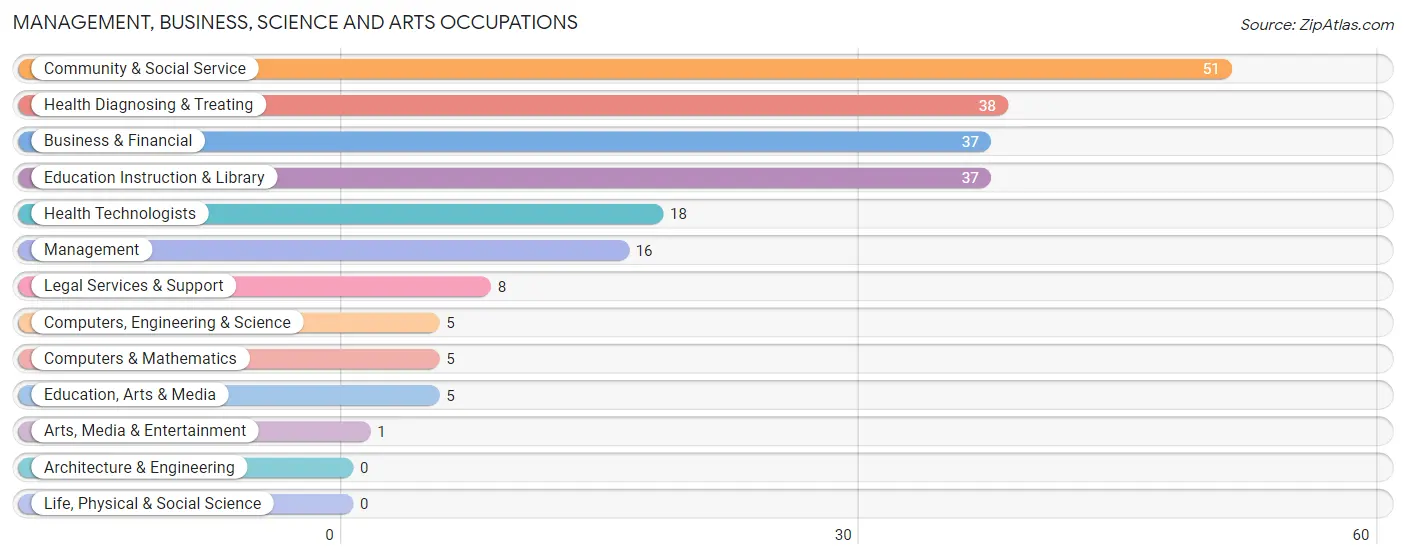
Management, Business, Science and Arts Occupations
The most common Management, Business, Science and Arts occupations in Crestview are Community & Social Service (51 | 15.5%), Health Diagnosing & Treating (38 | 11.6%), Business & Financial (37 | 11.3%), Education Instruction & Library (37 | 11.3%), and Health Technologists (18 | 5.5%).
Management, Business, Science and Arts Occupations by Sex
Within the Management, Business, Science and Arts occupations in Crestview, the most male-oriented occupations are Arts, Media & Entertainment (100.0%), Computers, Engineering & Science (80.0%), and Computers & Mathematics (80.0%), while the most female-oriented occupations are Health Diagnosing & Treating (84.2%), Education Instruction & Library (75.7%), and Management (75.0%).
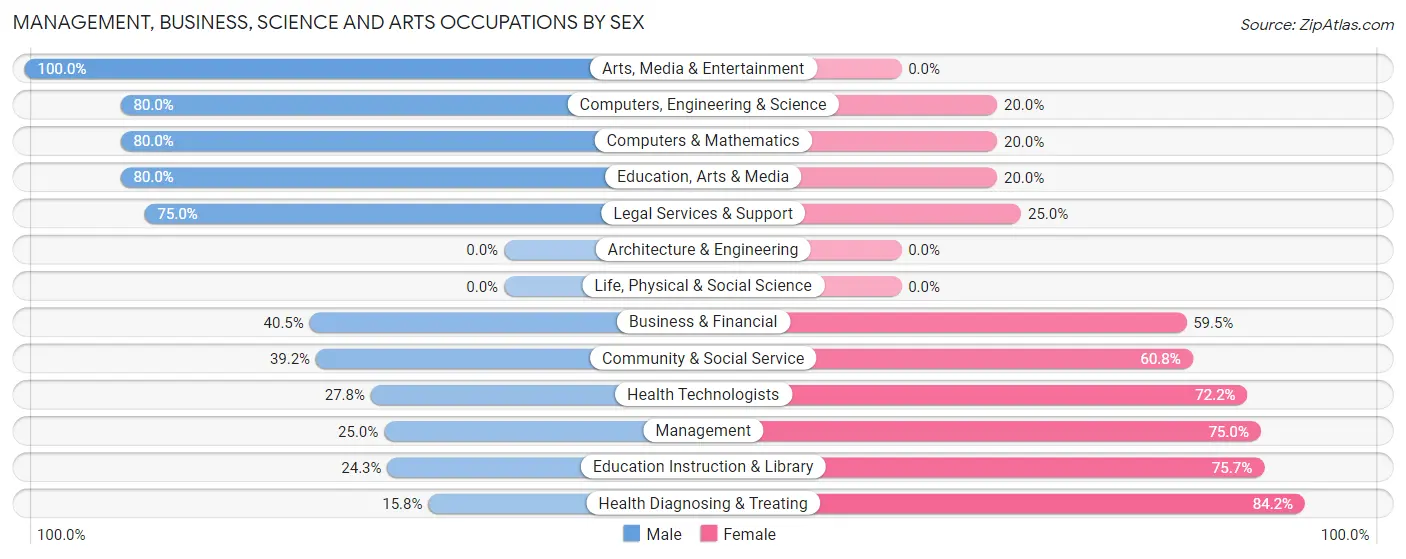
| Occupation | Male | Female |
| Management | 4 (25.0%) | 12 (75.0%) |
| Business & Financial | 15 (40.5%) | 22 (59.5%) |
| Computers, Engineering & Science | 4 (80.0%) | 1 (20.0%) |
| Computers & Mathematics | 4 (80.0%) | 1 (20.0%) |
| Architecture & Engineering | 0 (0.0%) | 0 (0.0%) |
| Life, Physical & Social Science | 0 (0.0%) | 0 (0.0%) |
| Community & Social Service | 20 (39.2%) | 31 (60.8%) |
| Education, Arts & Media | 4 (80.0%) | 1 (20.0%) |
| Legal Services & Support | 6 (75.0%) | 2 (25.0%) |
| Education Instruction & Library | 9 (24.3%) | 28 (75.7%) |
| Arts, Media & Entertainment | 1 (100.0%) | 0 (0.0%) |
| Health Diagnosing & Treating | 6 (15.8%) | 32 (84.2%) |
| Health Technologists | 5 (27.8%) | 13 (72.2%) |
| Total (Category) | 49 (33.3%) | 98 (66.7%) |
| Total (Overall) | 160 (48.6%) | 169 (51.4%) |
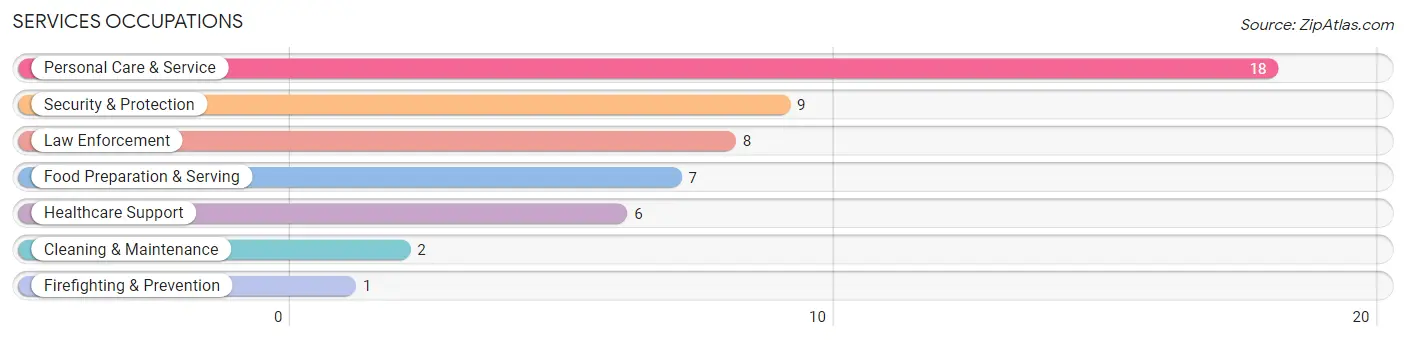
Services Occupations
The most common Services occupations in Crestview are Personal Care & Service (18 | 5.5%), Security & Protection (9 | 2.7%), Law Enforcement (8 | 2.4%), Food Preparation & Serving (7 | 2.1%), and Healthcare Support (6 | 1.8%).
Services Occupations by Sex
Within the Services occupations in Crestview, the most male-oriented occupations are Cleaning & Maintenance (100.0%), Healthcare Support (50.0%), and Food Preparation & Serving (14.3%), while the most female-oriented occupations are Security & Protection (100.0%), Firefighting & Prevention (100.0%), and Law Enforcement (100.0%).
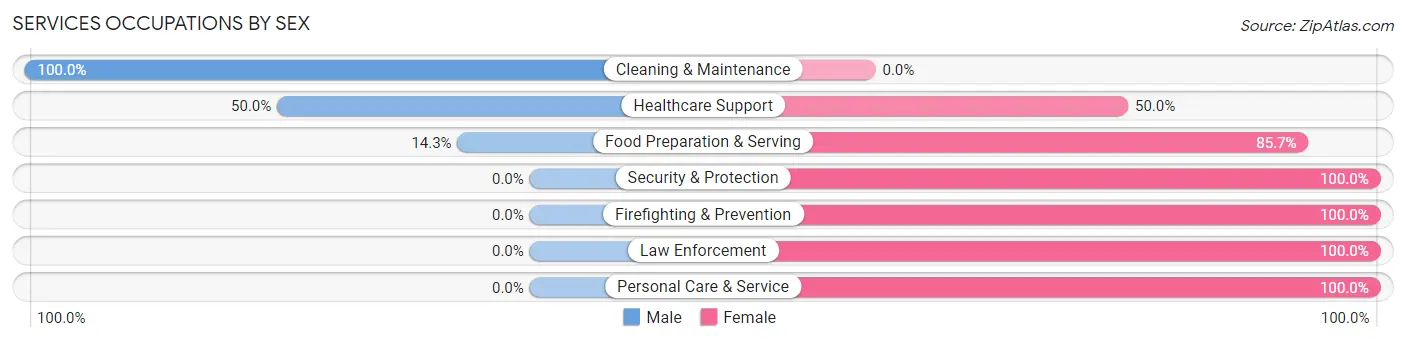
| Occupation | Male | Female |
| Healthcare Support | 3 (50.0%) | 3 (50.0%) |
| Security & Protection | 0 (0.0%) | 9 (100.0%) |
| Firefighting & Prevention | 0 (0.0%) | 1 (100.0%) |
| Law Enforcement | 0 (0.0%) | 8 (100.0%) |
| Food Preparation & Serving | 1 (14.3%) | 6 (85.7%) |
| Cleaning & Maintenance | 2 (100.0%) | 0 (0.0%) |
| Personal Care & Service | 0 (0.0%) | 18 (100.0%) |
| Total (Category) | 6 (14.3%) | 36 (85.7%) |
| Total (Overall) | 160 (48.6%) | 169 (51.4%) |
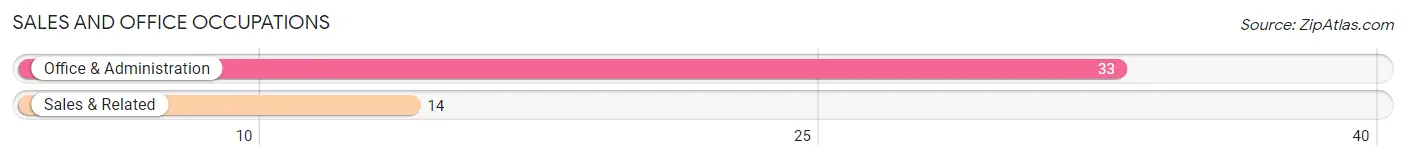
Sales and Office Occupations
The most common Sales and Office occupations in Crestview are Office & Administration (33 | 10.0%), and Sales & Related (14 | 4.3%).
Sales and Office Occupations by Sex
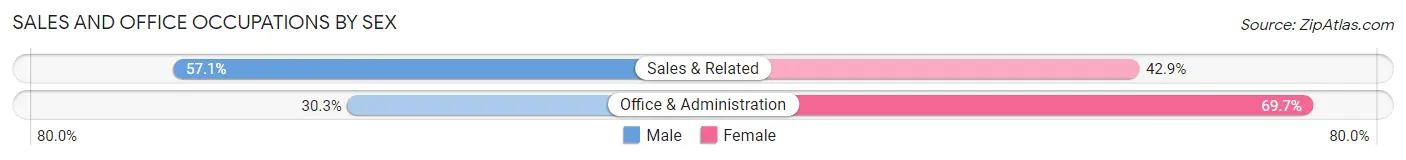
| Occupation | Male | Female |
| Sales & Related | 8 (57.1%) | 6 (42.9%) |
| Office & Administration | 10 (30.3%) | 23 (69.7%) |
| Total (Category) | 18 (38.3%) | 29 (61.7%) |
| Total (Overall) | 160 (48.6%) | 169 (51.4%) |
Natural Resources, Construction and Maintenance Occupations
The most common Natural Resources, Construction and Maintenance occupations in Crestview are Construction & Extraction (49 | 14.9%), and Installation, Maintenance & Repair (12 | 3.6%).
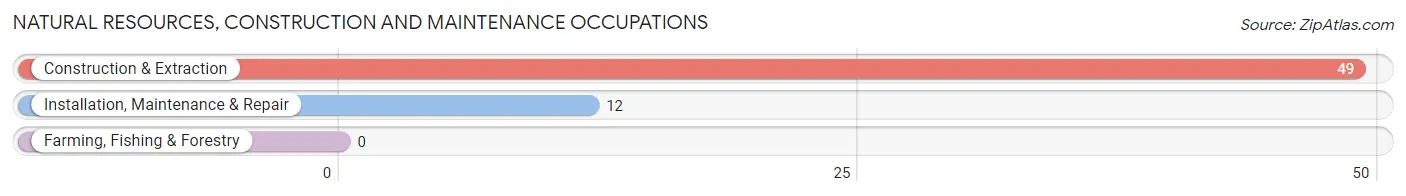
Natural Resources, Construction and Maintenance Occupations by Sex
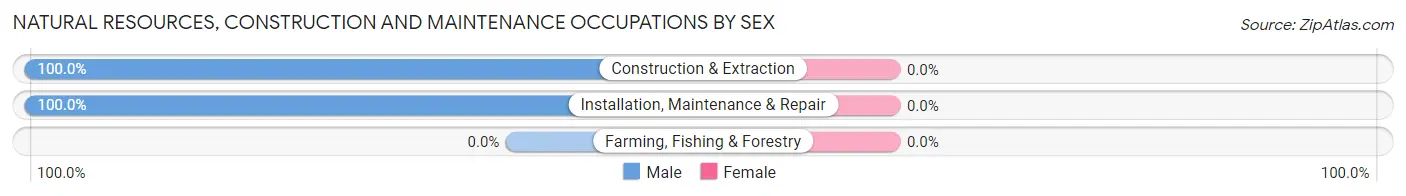
| Occupation | Male | Female |
| Farming, Fishing & Forestry | 0 (0.0%) | 0 (0.0%) |
| Construction & Extraction | 49 (100.0%) | 0 (0.0%) |
| Installation, Maintenance & Repair | 12 (100.0%) | 0 (0.0%) |
| Total (Category) | 61 (100.0%) | 0 (0.0%) |
| Total (Overall) | 160 (48.6%) | 169 (51.4%) |
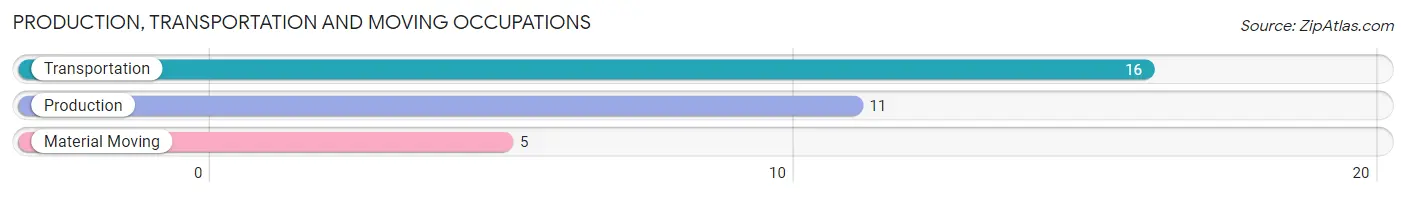
Production, Transportation and Moving Occupations
The most common Production, Transportation and Moving occupations in Crestview are Transportation (16 | 4.9%), Production (11 | 3.3%), and Material Moving (5 | 1.5%).
Production, Transportation and Moving Occupations by Sex
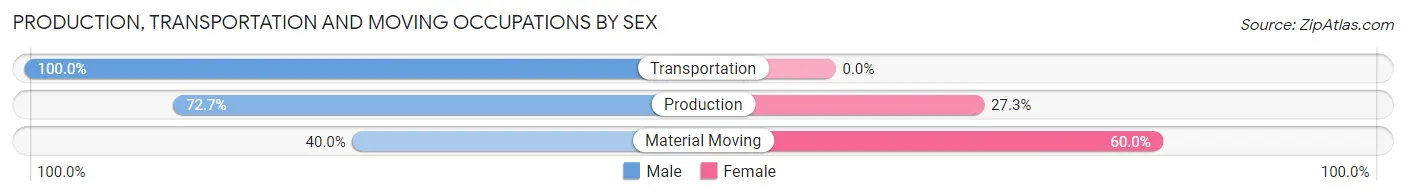
| Occupation | Male | Female |
| Production | 8 (72.7%) | 3 (27.3%) |
| Transportation | 16 (100.0%) | 0 (0.0%) |
| Material Moving | 2 (40.0%) | 3 (60.0%) |
| Total (Category) | 26 (81.2%) | 6 (18.8%) |
| Total (Overall) | 160 (48.6%) | 169 (51.4%) |
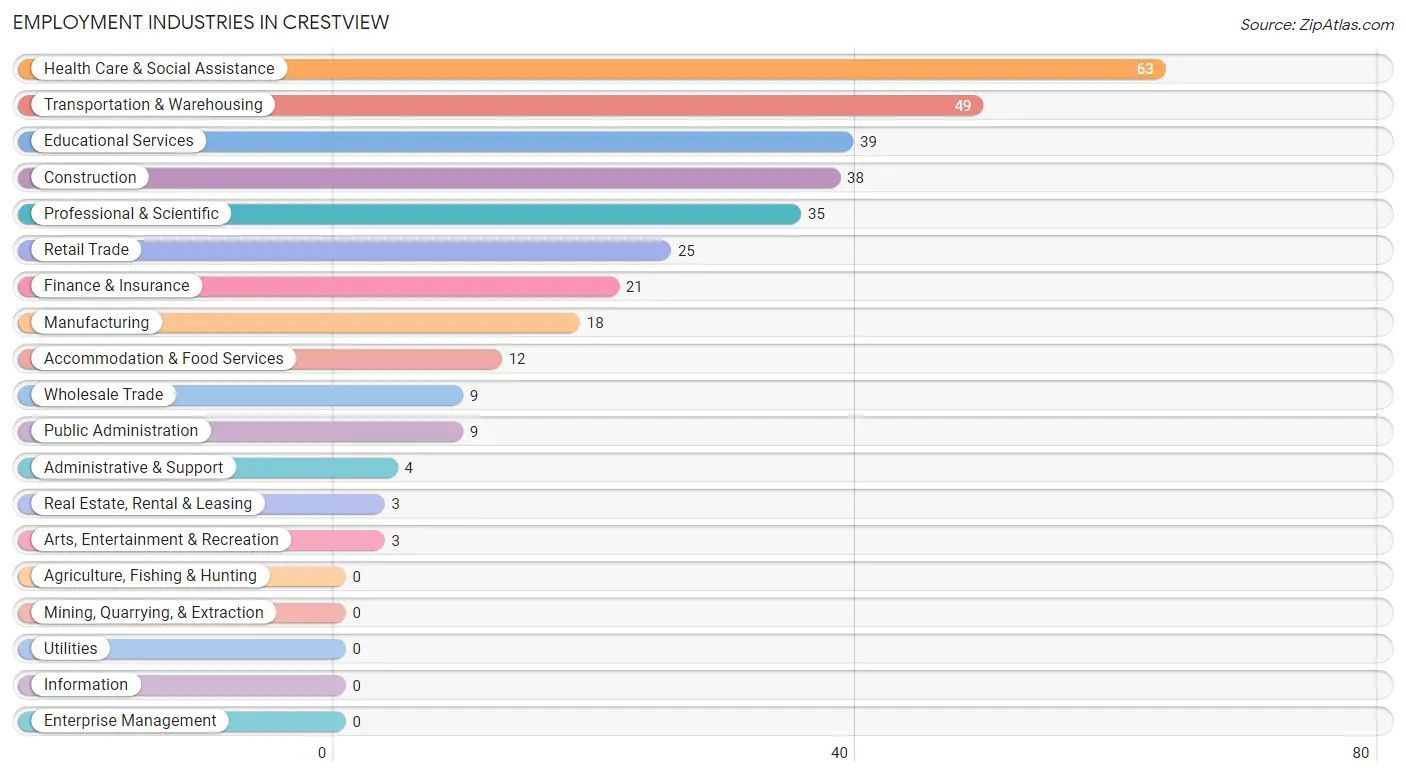
Employment Industries by Sex in Crestview
Employment Industries in Crestview
The major employment industries in Crestview include Health Care & Social Assistance (63 | 19.2%), Transportation & Warehousing (49 | 14.9%), Educational Services (39 | 11.8%), Construction (38 | 11.6%), and Professional & Scientific (35 | 10.6%).
Employment Industries by Sex in Crestview
The Crestview industries that see more men than women are Real Estate, Rental & Leasing (100.0%), Transportation & Warehousing (87.8%), and Manufacturing (83.3%), whereas the industries that tend to have a higher number of women are Administrative & Support (100.0%), Public Administration (100.0%), and Health Care & Social Assistance (77.8%).
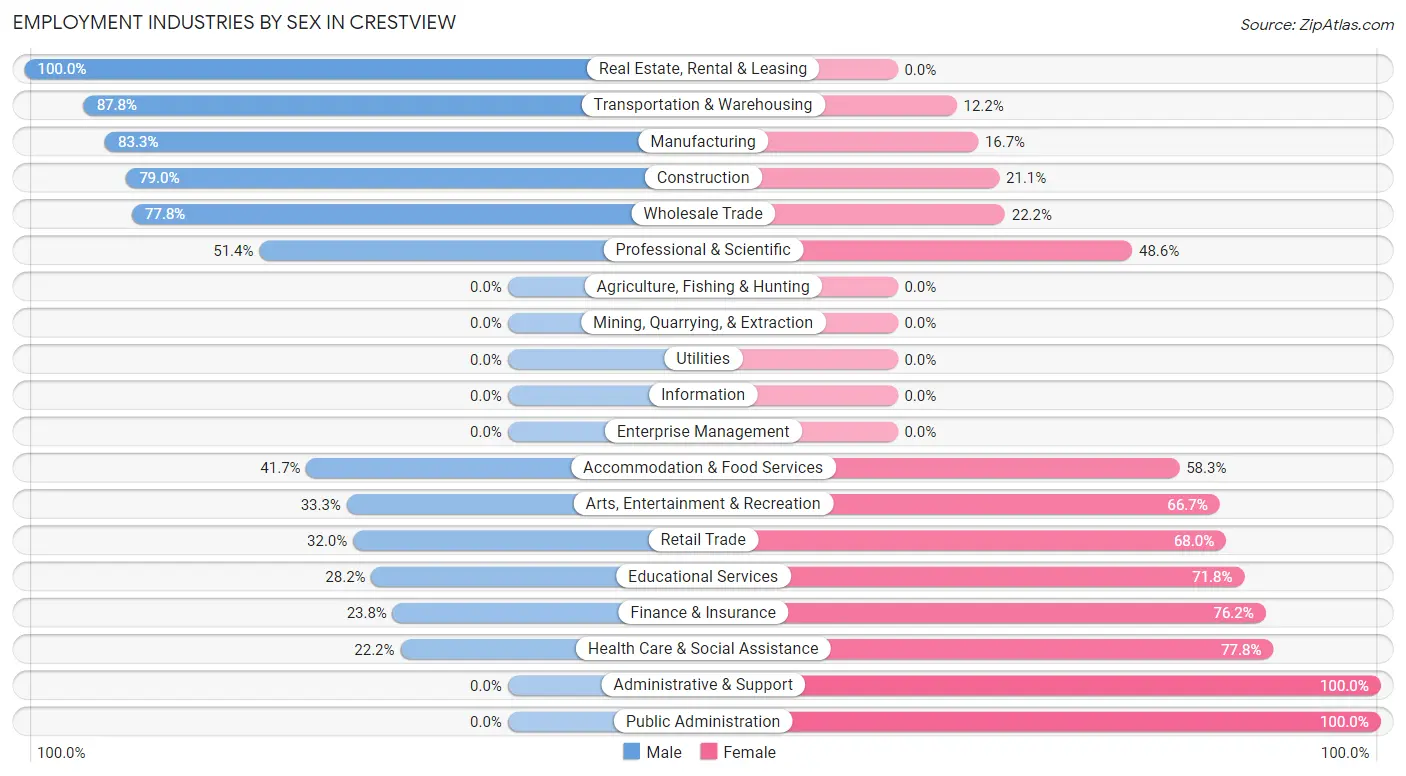
| Industry | Male | Female |
| Agriculture, Fishing & Hunting | 0 (0.0%) | 0 (0.0%) |
| Mining, Quarrying, & Extraction | 0 (0.0%) | 0 (0.0%) |
| Construction | 30 (78.9%) | 8 (21.0%) |
| Manufacturing | 15 (83.3%) | 3 (16.7%) |
| Wholesale Trade | 7 (77.8%) | 2 (22.2%) |
| Retail Trade | 8 (32.0%) | 17 (68.0%) |
| Transportation & Warehousing | 43 (87.8%) | 6 (12.2%) |
| Utilities | 0 (0.0%) | 0 (0.0%) |
| Information | 0 (0.0%) | 0 (0.0%) |
| Finance & Insurance | 5 (23.8%) | 16 (76.2%) |
| Real Estate, Rental & Leasing | 3 (100.0%) | 0 (0.0%) |
| Professional & Scientific | 18 (51.4%) | 17 (48.6%) |
| Enterprise Management | 0 (0.0%) | 0 (0.0%) |
| Administrative & Support | 0 (0.0%) | 4 (100.0%) |
| Educational Services | 11 (28.2%) | 28 (71.8%) |
| Health Care & Social Assistance | 14 (22.2%) | 49 (77.8%) |
| Arts, Entertainment & Recreation | 1 (33.3%) | 2 (66.7%) |
| Accommodation & Food Services | 5 (41.7%) | 7 (58.3%) |
| Public Administration | 0 (0.0%) | 9 (100.0%) |
| Total | 160 (48.6%) | 169 (51.4%) |
Education in Crestview
School Enrollment in Crestview
The most common levels of schooling among the 113 students in Crestview are college / undergraduate (39 | 34.5%), elementary school (26 | 23.0%), and middle school (15 | 13.3%).
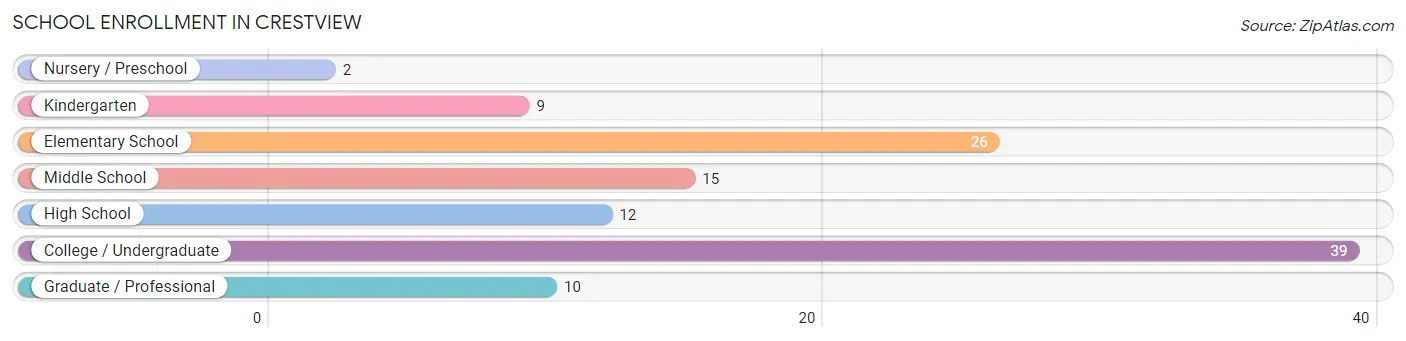
| School Level | # Students | % Students |
| Nursery / Preschool | 2 | 1.8% |
| Kindergarten | 9 | 8.0% |
| Elementary School | 26 | 23.0% |
| Middle School | 15 | 13.3% |
| High School | 12 | 10.6% |
| College / Undergraduate | 39 | 34.5% |
| Graduate / Professional | 10 | 8.8% |
| Total | 113 | 100.0% |
School Enrollment by Age by Funding Source in Crestview
Out of a total of 113 students who are enrolled in schools in Crestview, 9 (8.0%) attend a private institution, while the remaining 104 (92.0%) are enrolled in public schools. The age group of 3 to 4 year olds has the highest likelihood of being enrolled in private schools, with 1 (100.0% in the age bracket) enrolled. Conversely, the age group of 5 to 9 year old has the lowest likelihood of being enrolled in a private school, with 35 (100.0% in the age bracket) attending a public institution.

| Age Bracket | Public School | Private School |
| 3 to 4 Year Olds | 0 (0.0%) | 1 (100.0%) |
| 5 to 9 Year Old | 35 (100.0%) | 0 (0.0%) |
| 10 to 14 Year Olds | 17 (77.3%) | 5 (22.7%) |
| 15 to 17 Year Olds | 5 (83.3%) | 1 (16.7%) |
| 18 to 19 Year Olds | 5 (71.4%) | 2 (28.6%) |
| 20 to 24 Year Olds | 22 (100.0%) | 0 (0.0%) |
| 25 to 34 Year Olds | 16 (100.0%) | 0 (0.0%) |
| 35 Years and over | 4 (100.0%) | 0 (0.0%) |
| Total | 104 (92.0%) | 9 (8.0%) |
Educational Attainment by Field of Study in Crestview
Education (32 | 23.5%), science & technology (18 | 13.2%), business (16 | 11.8%), psychology (10 | 7.3%), and arts & humanities (9 | 6.6%) are the most common fields of study among 136 individuals in Crestview who have obtained a bachelor's degree or higher.
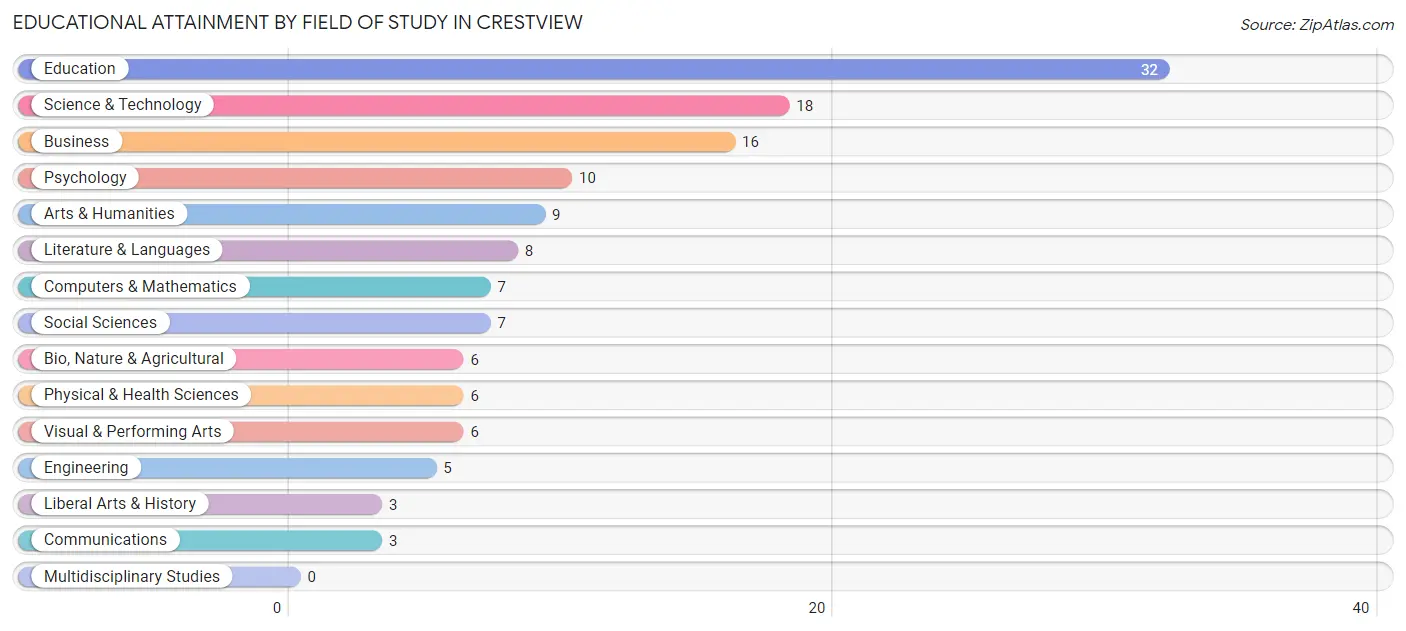
| Field of Study | # Graduates | % Graduates |
| Computers & Mathematics | 7 | 5.1% |
| Bio, Nature & Agricultural | 6 | 4.4% |
| Physical & Health Sciences | 6 | 4.4% |
| Psychology | 10 | 7.3% |
| Social Sciences | 7 | 5.1% |
| Engineering | 5 | 3.7% |
| Multidisciplinary Studies | 0 | 0.0% |
| Science & Technology | 18 | 13.2% |
| Business | 16 | 11.8% |
| Education | 32 | 23.5% |
| Literature & Languages | 8 | 5.9% |
| Liberal Arts & History | 3 | 2.2% |
| Visual & Performing Arts | 6 | 4.4% |
| Communications | 3 | 2.2% |
| Arts & Humanities | 9 | 6.6% |
| Total | 136 | 100.0% |
Transportation & Commute in Crestview
Vehicle Availability by Sex in Crestview
The most prevalent vehicle ownership categories in Crestview are males with 3 vehicles (76, accounting for 49.0%) and females with 3 vehicles (90, making up 46.1%).
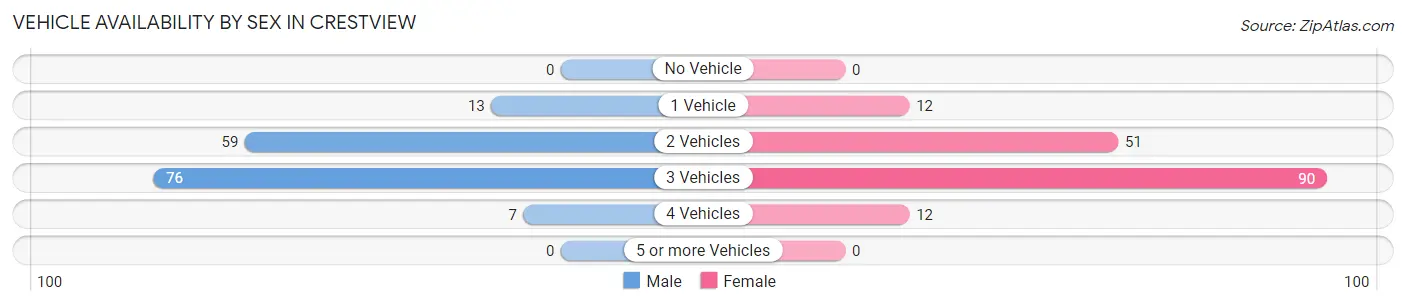
| Vehicles Available | Male | Female |
| No Vehicle | 0 (0.0%) | 0 (0.0%) |
| 1 Vehicle | 13 (8.4%) | 12 (7.3%) |
| 2 Vehicles | 59 (38.1%) | 51 (30.9%) |
| 3 Vehicles | 76 (49.0%) | 90 (54.5%) |
| 4 Vehicles | 7 (4.5%) | 12 (7.3%) |
| 5 or more Vehicles | 0 (0.0%) | 0 (0.0%) |
| Total | 155 (100.0%) | 165 (100.0%) |
Commute Time in Crestview
The most frequently occuring commute durations in Crestview are 30 to 34 minutes (60 commuters, 20.5%), 15 to 19 minutes (56 commuters, 19.1%), and 20 to 24 minutes (52 commuters, 17.7%).
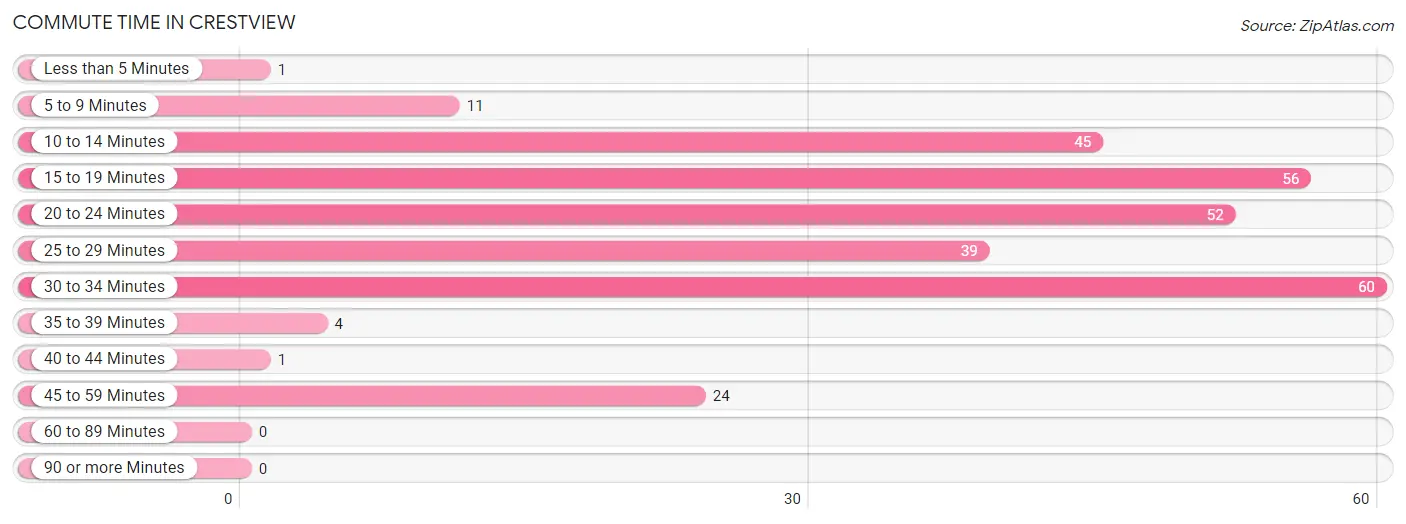
| Commute Time | # Commuters | % Commuters |
| Less than 5 Minutes | 1 | 0.3% |
| 5 to 9 Minutes | 11 | 3.7% |
| 10 to 14 Minutes | 45 | 15.4% |
| 15 to 19 Minutes | 56 | 19.1% |
| 20 to 24 Minutes | 52 | 17.7% |
| 25 to 29 Minutes | 39 | 13.3% |
| 30 to 34 Minutes | 60 | 20.5% |
| 35 to 39 Minutes | 4 | 1.4% |
| 40 to 44 Minutes | 1 | 0.3% |
| 45 to 59 Minutes | 24 | 8.2% |
| 60 to 89 Minutes | 0 | 0.0% |
| 90 or more Minutes | 0 | 0.0% |
Commute Time by Sex in Crestview
The most common commute times in Crestview are 20 to 24 minutes (43 commuters, 29.9%) for males and 30 to 34 minutes (40 commuters, 26.9%) for females.
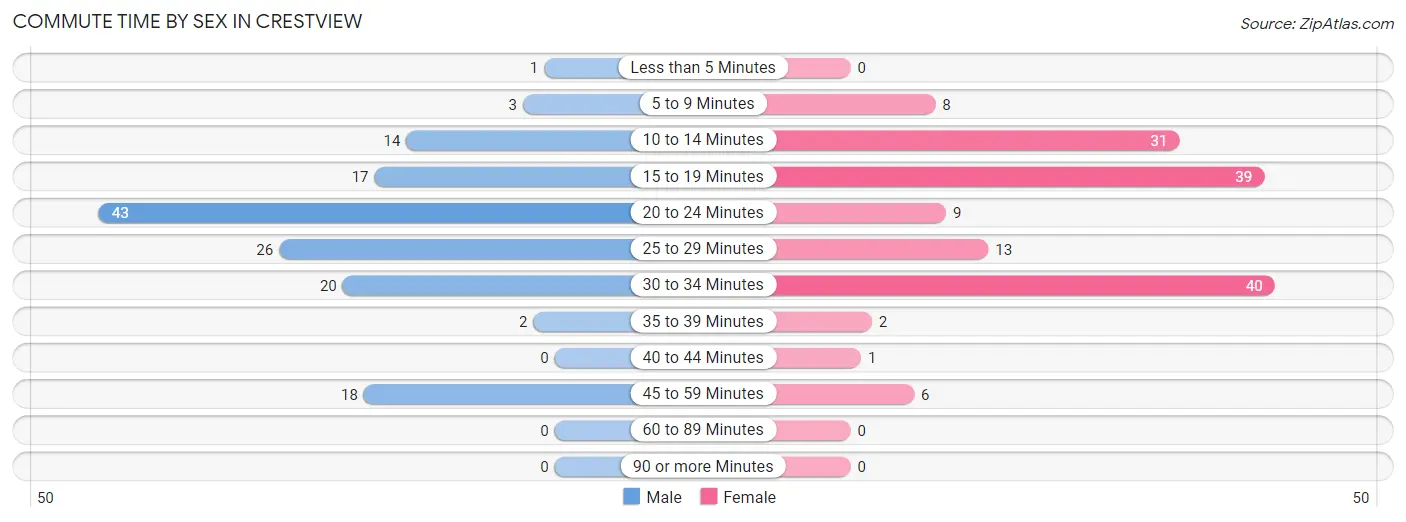
| Commute Time | Male | Female |
| Less than 5 Minutes | 1 (0.7%) | 0 (0.0%) |
| 5 to 9 Minutes | 3 (2.1%) | 8 (5.4%) |
| 10 to 14 Minutes | 14 (9.7%) | 31 (20.8%) |
| 15 to 19 Minutes | 17 (11.8%) | 39 (26.2%) |
| 20 to 24 Minutes | 43 (29.9%) | 9 (6.0%) |
| 25 to 29 Minutes | 26 (18.1%) | 13 (8.7%) |
| 30 to 34 Minutes | 20 (13.9%) | 40 (26.9%) |
| 35 to 39 Minutes | 2 (1.4%) | 2 (1.3%) |
| 40 to 44 Minutes | 0 (0.0%) | 1 (0.7%) |
| 45 to 59 Minutes | 18 (12.5%) | 6 (4.0%) |
| 60 to 89 Minutes | 0 (0.0%) | 0 (0.0%) |
| 90 or more Minutes | 0 (0.0%) | 0 (0.0%) |
Time of Departure to Work by Sex in Crestview
The most frequent times of departure to work in Crestview are 6:00 AM to 6:29 AM (56, 38.9%) for males and 7:30 AM to 7:59 AM (32, 21.5%) for females.
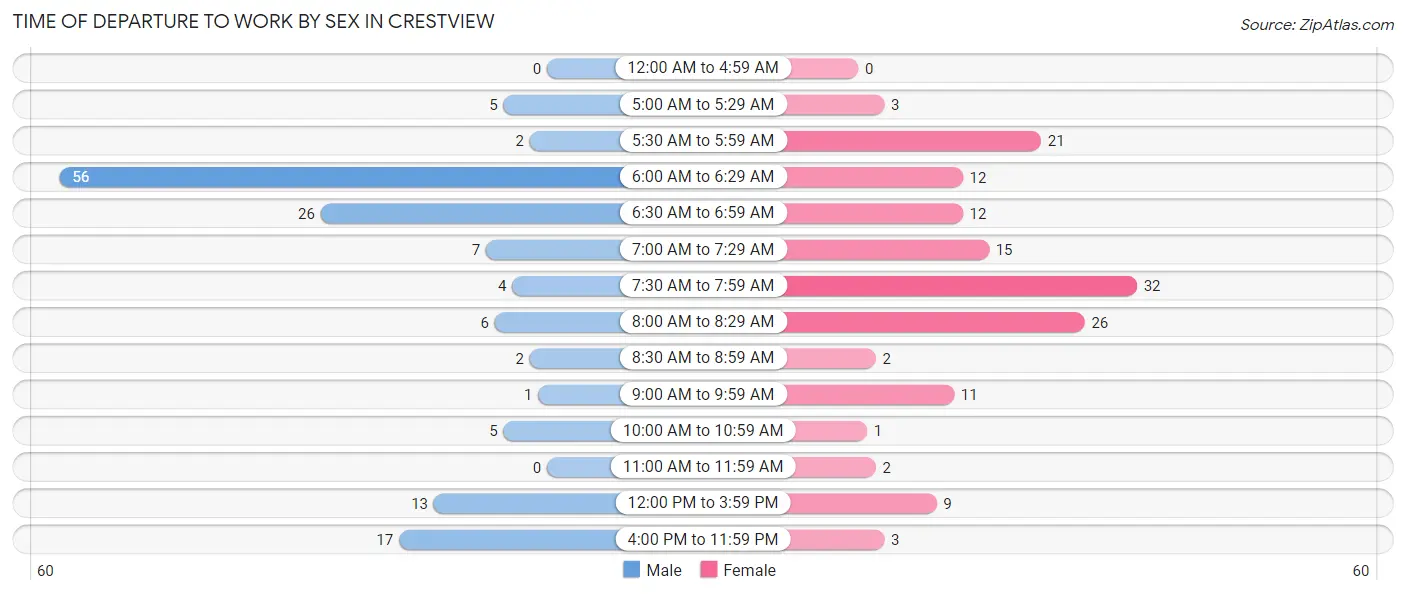
| Time of Departure | Male | Female |
| 12:00 AM to 4:59 AM | 0 (0.0%) | 0 (0.0%) |
| 5:00 AM to 5:29 AM | 5 (3.5%) | 3 (2.0%) |
| 5:30 AM to 5:59 AM | 2 (1.4%) | 21 (14.1%) |
| 6:00 AM to 6:29 AM | 56 (38.9%) | 12 (8.1%) |
| 6:30 AM to 6:59 AM | 26 (18.1%) | 12 (8.1%) |
| 7:00 AM to 7:29 AM | 7 (4.9%) | 15 (10.1%) |
| 7:30 AM to 7:59 AM | 4 (2.8%) | 32 (21.5%) |
| 8:00 AM to 8:29 AM | 6 (4.2%) | 26 (17.4%) |
| 8:30 AM to 8:59 AM | 2 (1.4%) | 2 (1.3%) |
| 9:00 AM to 9:59 AM | 1 (0.7%) | 11 (7.4%) |
| 10:00 AM to 10:59 AM | 5 (3.5%) | 1 (0.7%) |
| 11:00 AM to 11:59 AM | 0 (0.0%) | 2 (1.3%) |
| 12:00 PM to 3:59 PM | 13 (9.0%) | 9 (6.0%) |
| 4:00 PM to 11:59 PM | 17 (11.8%) | 3 (2.0%) |
| Total | 144 (100.0%) | 149 (100.0%) |
Housing Occupancy in Crestview
Occupancy by Ownership in Crestview
Of the total 204 dwellings in Crestview, owner-occupied units account for 183 (89.7%), while renter-occupied units make up 21 (10.3%).
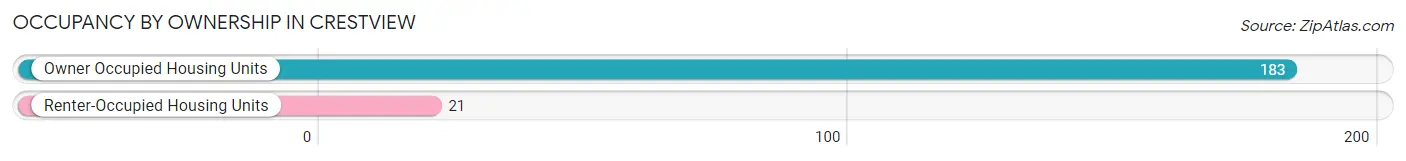
| Occupancy | # Housing Units | % Housing Units |
| Owner Occupied Housing Units | 183 | 89.7% |
| Renter-Occupied Housing Units | 21 | 10.3% |
| Total Occupied Housing Units | 204 | 100.0% |
Occupancy by Household Size in Crestview
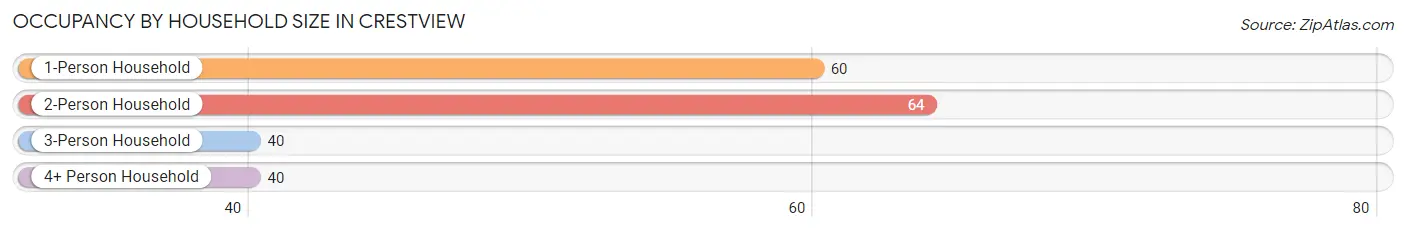
| Household Size | # Housing Units | % Housing Units |
| 1-Person Household | 60 | 29.4% |
| 2-Person Household | 64 | 31.4% |
| 3-Person Household | 40 | 19.6% |
| 4+ Person Household | 40 | 19.6% |
| Total Housing Units | 204 | 100.0% |
Occupancy by Ownership by Household Size in Crestview
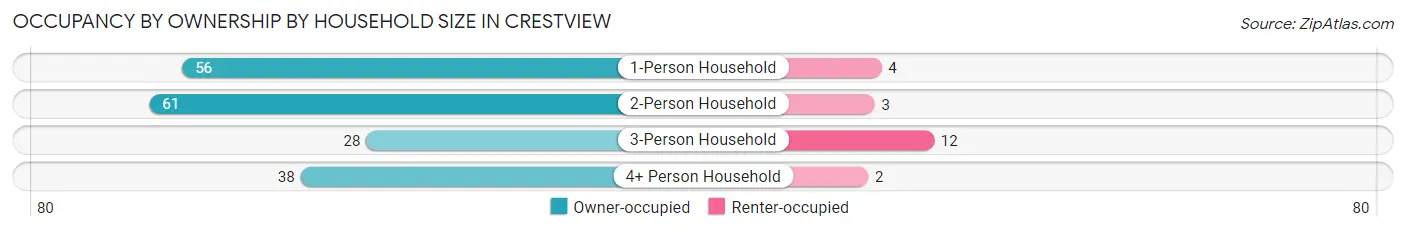
| Household Size | Owner-occupied | Renter-occupied |
| 1-Person Household | 56 (93.3%) | 4 (6.7%) |
| 2-Person Household | 61 (95.3%) | 3 (4.7%) |
| 3-Person Household | 28 (70.0%) | 12 (30.0%) |
| 4+ Person Household | 38 (95.0%) | 2 (5.0%) |
| Total Housing Units | 183 (89.7%) | 21 (10.3%) |
Occupancy by Educational Attainment in Crestview
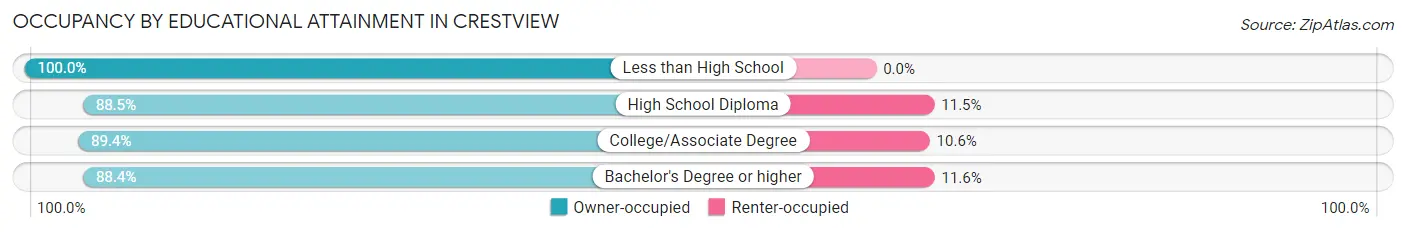
| Household Size | Owner-occupied | Renter-occupied |
| Less than High School | 17 (100.0%) | 0 (0.0%) |
| High School Diploma | 23 (88.5%) | 3 (11.5%) |
| College/Associate Degree | 59 (89.4%) | 7 (10.6%) |
| Bachelor's Degree or higher | 84 (88.4%) | 11 (11.6%) |
Occupancy by Age of Householder in Crestview
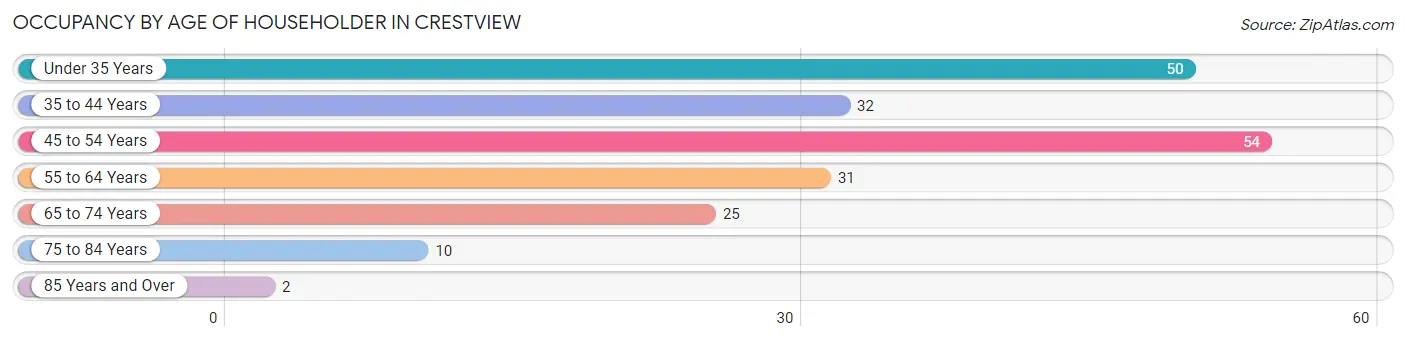
| Age Bracket | # Households | % Households |
| Under 35 Years | 50 | 24.5% |
| 35 to 44 Years | 32 | 15.7% |
| 45 to 54 Years | 54 | 26.5% |
| 55 to 64 Years | 31 | 15.2% |
| 65 to 74 Years | 25 | 12.2% |
| 75 to 84 Years | 10 | 4.9% |
| 85 Years and Over | 2 | 1.0% |
| Total | 204 | 100.0% |
Housing Finances in Crestview
Median Income by Occupancy in Crestview
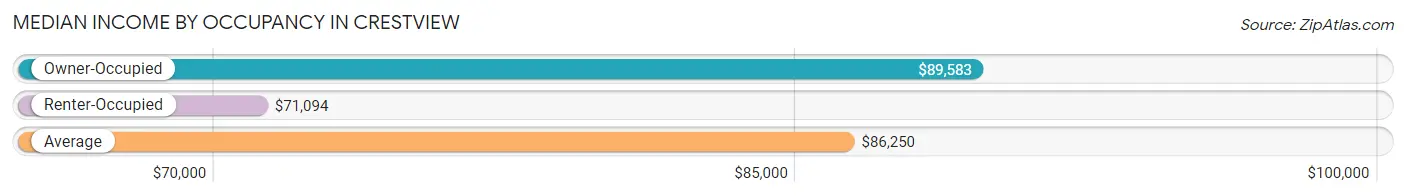
| Occupancy Type | # Households | Median Income |
| Owner-Occupied | 183 (89.7%) | $89,583 |
| Renter-Occupied | 21 (10.3%) | $71,094 |
| Average | 204 (100.0%) | $86,250 |
Occupancy by Householder Income Bracket in Crestview
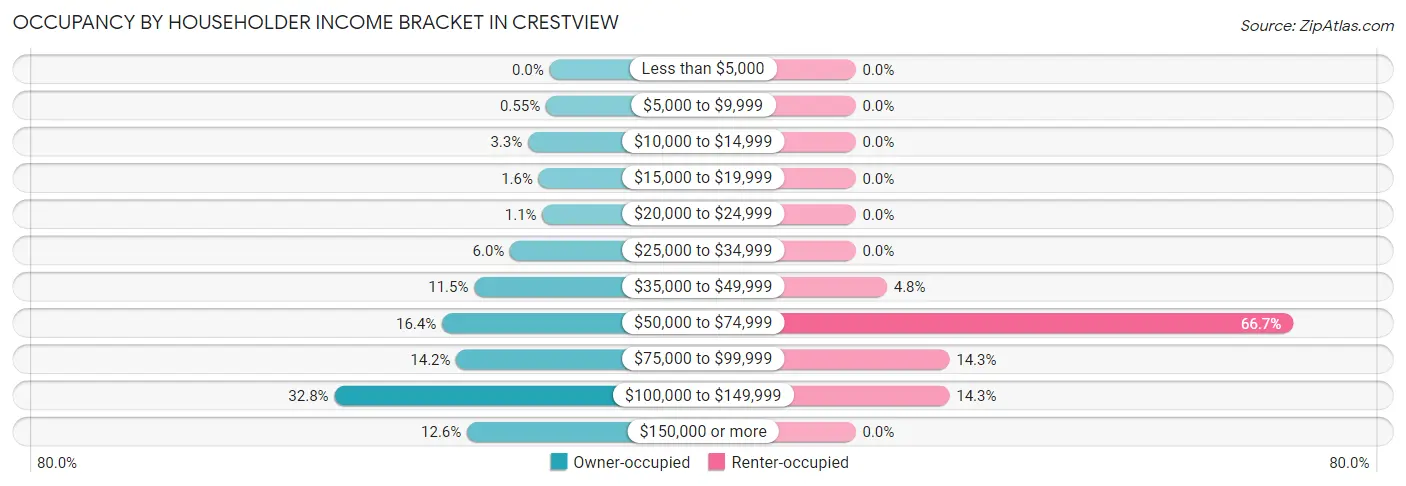
| Income Bracket | Owner-occupied | Renter-occupied |
| Less than $5,000 | 0 (0.0%) | 0 (0.0%) |
| $5,000 to $9,999 | 1 (0.5%) | 0 (0.0%) |
| $10,000 to $14,999 | 6 (3.3%) | 0 (0.0%) |
| $15,000 to $19,999 | 3 (1.6%) | 0 (0.0%) |
| $20,000 to $24,999 | 2 (1.1%) | 0 (0.0%) |
| $25,000 to $34,999 | 11 (6.0%) | 0 (0.0%) |
| $35,000 to $49,999 | 21 (11.5%) | 1 (4.8%) |
| $50,000 to $74,999 | 30 (16.4%) | 14 (66.7%) |
| $75,000 to $99,999 | 26 (14.2%) | 3 (14.3%) |
| $100,000 to $149,999 | 60 (32.8%) | 3 (14.3%) |
| $150,000 or more | 23 (12.6%) | 0 (0.0%) |
| Total | 183 (100.0%) | 21 (100.0%) |
Monthly Housing Cost Tiers in Crestview
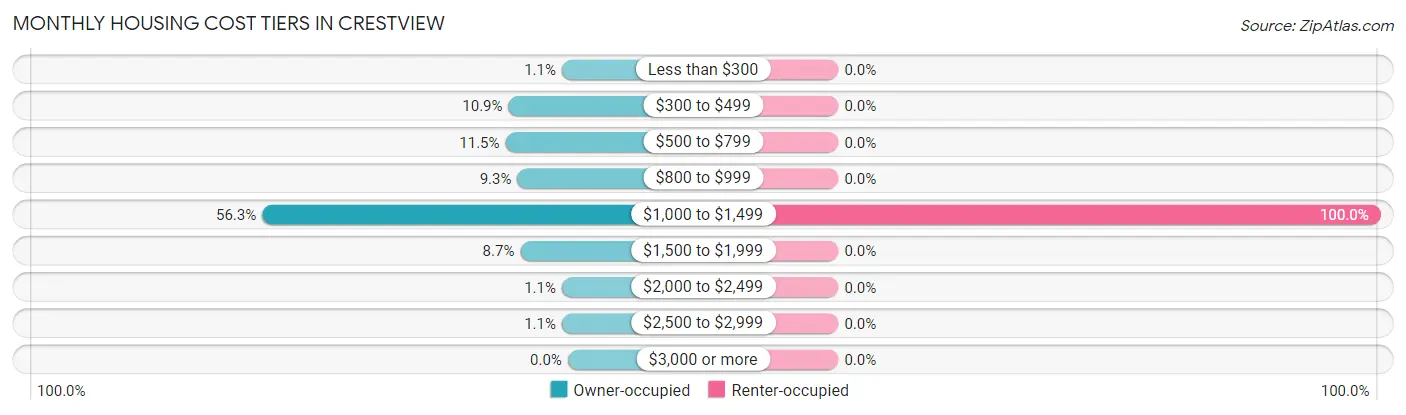
| Monthly Cost | Owner-occupied | Renter-occupied |
| Less than $300 | 2 (1.1%) | 0 (0.0%) |
| $300 to $499 | 20 (10.9%) | 0 (0.0%) |
| $500 to $799 | 21 (11.5%) | 0 (0.0%) |
| $800 to $999 | 17 (9.3%) | 0 (0.0%) |
| $1,000 to $1,499 | 103 (56.3%) | 21 (100.0%) |
| $1,500 to $1,999 | 16 (8.7%) | 0 (0.0%) |
| $2,000 to $2,499 | 2 (1.1%) | 0 (0.0%) |
| $2,500 to $2,999 | 2 (1.1%) | 0 (0.0%) |
| $3,000 or more | 0 (0.0%) | 0 (0.0%) |
| Total | 183 (100.0%) | 21 (100.0%) |
Physical Housing Characteristics in Crestview
Housing Structures in Crestview
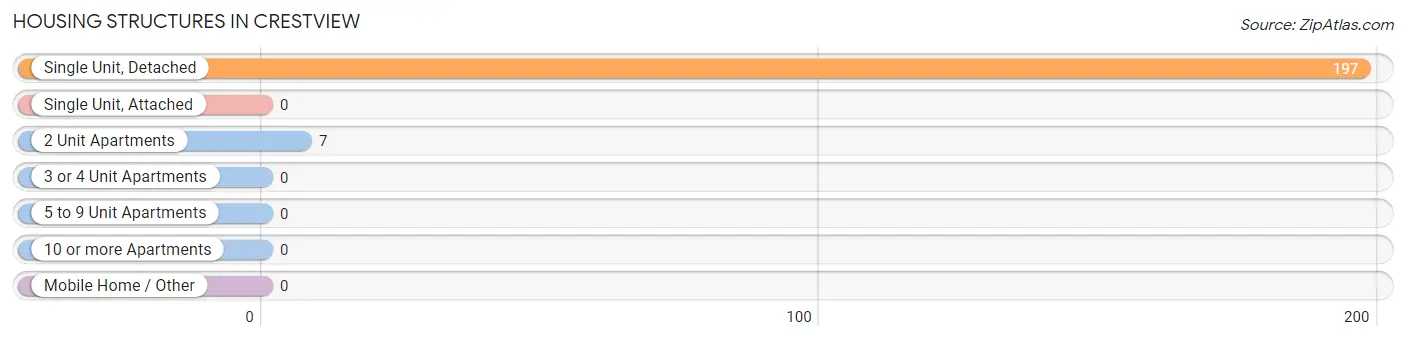
| Structure Type | # Housing Units | % Housing Units |
| Single Unit, Detached | 197 | 96.6% |
| Single Unit, Attached | 0 | 0.0% |
| 2 Unit Apartments | 7 | 3.4% |
| 3 or 4 Unit Apartments | 0 | 0.0% |
| 5 to 9 Unit Apartments | 0 | 0.0% |
| 10 or more Apartments | 0 | 0.0% |
| Mobile Home / Other | 0 | 0.0% |
| Total | 204 | 100.0% |
Housing Structures by Occupancy in Crestview
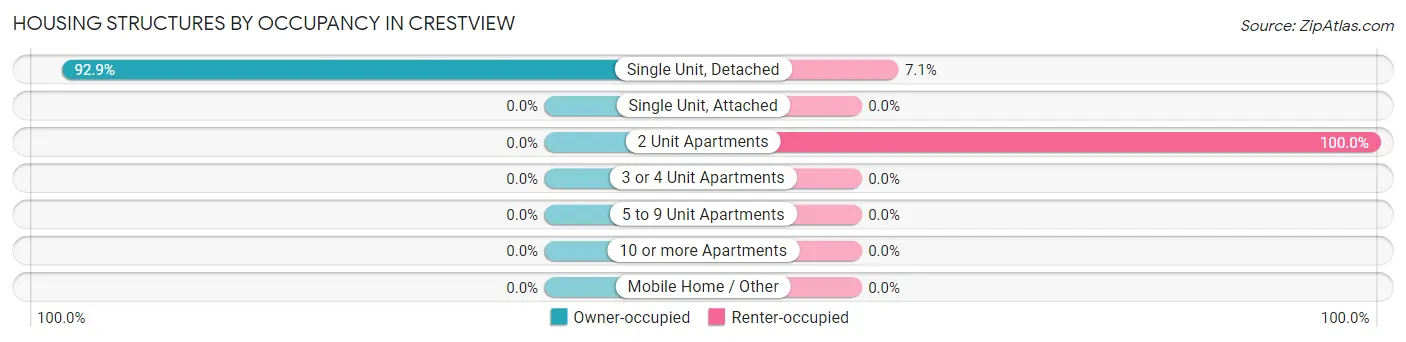
| Structure Type | Owner-occupied | Renter-occupied |
| Single Unit, Detached | 183 (92.9%) | 14 (7.1%) |
| Single Unit, Attached | 0 (0.0%) | 0 (0.0%) |
| 2 Unit Apartments | 0 (0.0%) | 7 (100.0%) |
| 3 or 4 Unit Apartments | 0 (0.0%) | 0 (0.0%) |
| 5 to 9 Unit Apartments | 0 (0.0%) | 0 (0.0%) |
| 10 or more Apartments | 0 (0.0%) | 0 (0.0%) |
| Mobile Home / Other | 0 (0.0%) | 0 (0.0%) |
| Total | 183 (89.7%) | 21 (10.3%) |
Housing Structures by Number of Rooms in Crestview
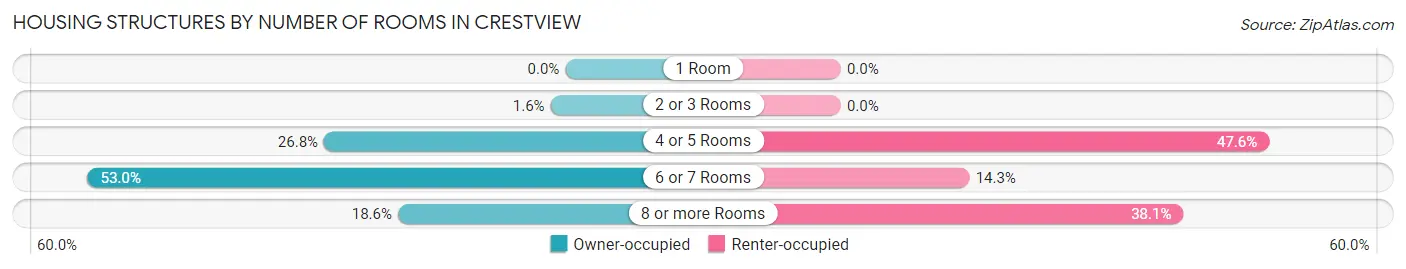
| Number of Rooms | Owner-occupied | Renter-occupied |
| 1 Room | 0 (0.0%) | 0 (0.0%) |
| 2 or 3 Rooms | 3 (1.6%) | 0 (0.0%) |
| 4 or 5 Rooms | 49 (26.8%) | 10 (47.6%) |
| 6 or 7 Rooms | 97 (53.0%) | 3 (14.3%) |
| 8 or more Rooms | 34 (18.6%) | 8 (38.1%) |
| Total | 183 (100.0%) | 21 (100.0%) |
Housing Structure by Heating Type in Crestview
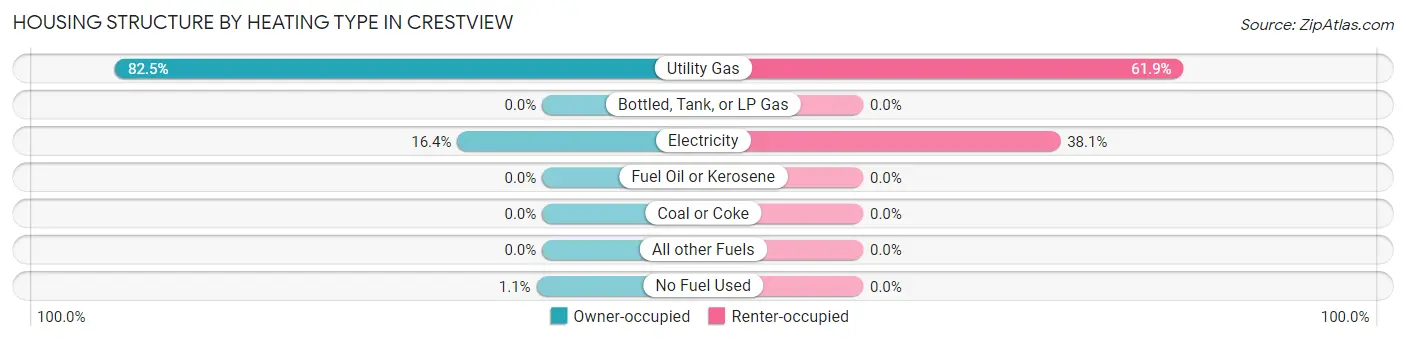
| Heating Type | Owner-occupied | Renter-occupied |
| Utility Gas | 151 (82.5%) | 13 (61.9%) |
| Bottled, Tank, or LP Gas | 0 (0.0%) | 0 (0.0%) |
| Electricity | 30 (16.4%) | 8 (38.1%) |
| Fuel Oil or Kerosene | 0 (0.0%) | 0 (0.0%) |
| Coal or Coke | 0 (0.0%) | 0 (0.0%) |
| All other Fuels | 0 (0.0%) | 0 (0.0%) |
| No Fuel Used | 2 (1.1%) | 0 (0.0%) |
| Total | 183 (100.0%) | 21 (100.0%) |
Household Vehicle Usage in Crestview
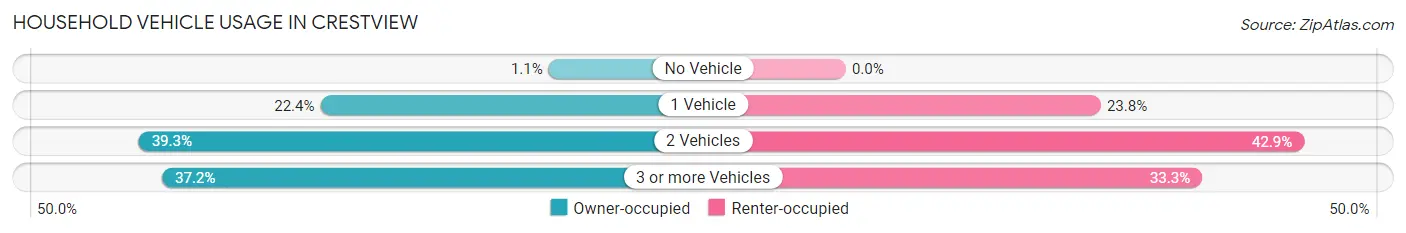
| Vehicles per Household | Owner-occupied | Renter-occupied |
| No Vehicle | 2 (1.1%) | 0 (0.0%) |
| 1 Vehicle | 41 (22.4%) | 5 (23.8%) |
| 2 Vehicles | 72 (39.3%) | 9 (42.9%) |
| 3 or more Vehicles | 68 (37.2%) | 7 (33.3%) |
| Total | 183 (100.0%) | 21 (100.0%) |
Real Estate & Mortgages in Crestview
Real Estate and Mortgage Overview in Crestview
| Characteristic | Without Mortgage | With Mortgage |
| Housing Units | 42 | 141 |
| Median Property Value | $155,400 | $162,900 |
| Median Household Income | $55,000 | $22 |
| Monthly Housing Costs | $492 | $0 |
| Real Estate Taxes | $1,571 | $12 |
Property Value by Mortgage Status in Crestview
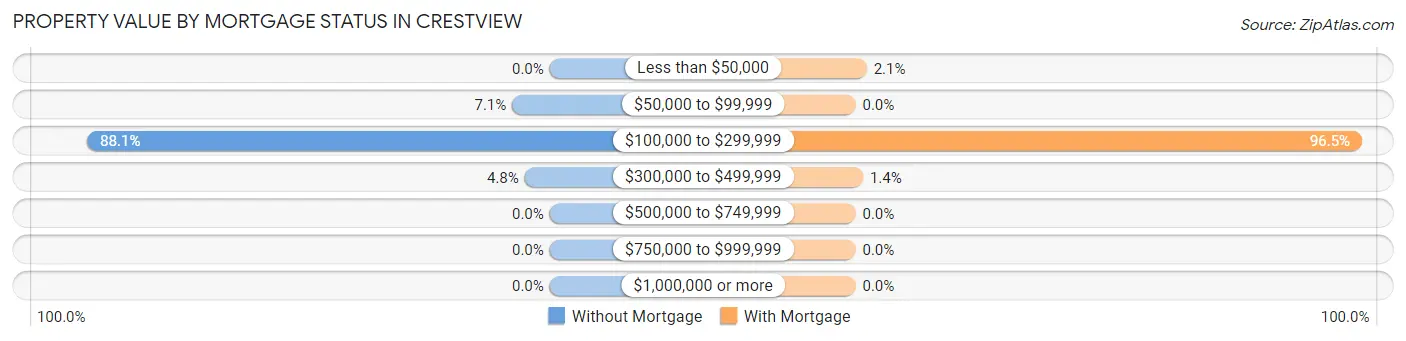
| Property Value | Without Mortgage | With Mortgage |
| Less than $50,000 | 0 (0.0%) | 3 (2.1%) |
| $50,000 to $99,999 | 3 (7.1%) | 0 (0.0%) |
| $100,000 to $299,999 | 37 (88.1%) | 136 (96.5%) |
| $300,000 to $499,999 | 2 (4.8%) | 2 (1.4%) |
| $500,000 to $749,999 | 0 (0.0%) | 0 (0.0%) |
| $750,000 to $999,999 | 0 (0.0%) | 0 (0.0%) |
| $1,000,000 or more | 0 (0.0%) | 0 (0.0%) |
| Total | 42 (100.0%) | 141 (100.0%) |
Household Income by Mortgage Status in Crestview
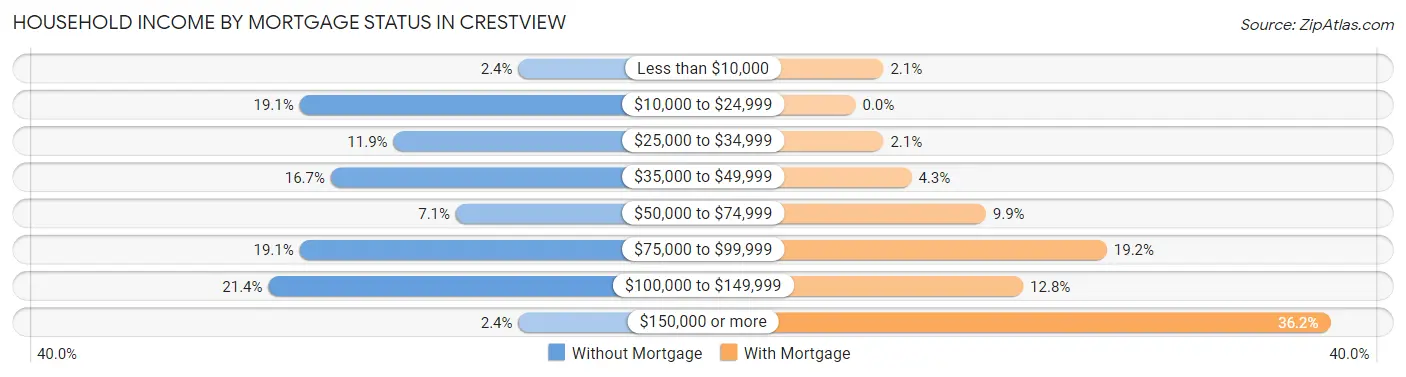
| Household Income | Without Mortgage | With Mortgage |
| Less than $10,000 | 1 (2.4%) | 3 (2.1%) |
| $10,000 to $24,999 | 8 (19.1%) | 0 (0.0%) |
| $25,000 to $34,999 | 5 (11.9%) | 3 (2.1%) |
| $35,000 to $49,999 | 7 (16.7%) | 6 (4.3%) |
| $50,000 to $74,999 | 3 (7.1%) | 14 (9.9%) |
| $75,000 to $99,999 | 8 (19.1%) | 27 (19.2%) |
| $100,000 to $149,999 | 9 (21.4%) | 18 (12.8%) |
| $150,000 or more | 1 (2.4%) | 51 (36.2%) |
| Total | 42 (100.0%) | 141 (100.0%) |
Property Value to Household Income Ratio in Crestview
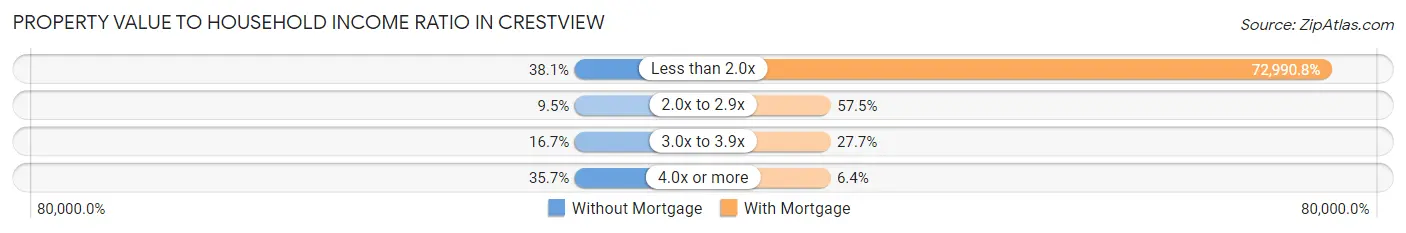
| Value-to-Income Ratio | Without Mortgage | With Mortgage |
| Less than 2.0x | 16 (38.1%) | 102,917 (72,990.8%) |
| 2.0x to 2.9x | 4 (9.5%) | 81 (57.5%) |
| 3.0x to 3.9x | 7 (16.7%) | 39 (27.7%) |
| 4.0x or more | 15 (35.7%) | 9 (6.4%) |
| Total | 42 (100.0%) | 141 (100.0%) |
Real Estate Taxes by Mortgage Status in Crestview
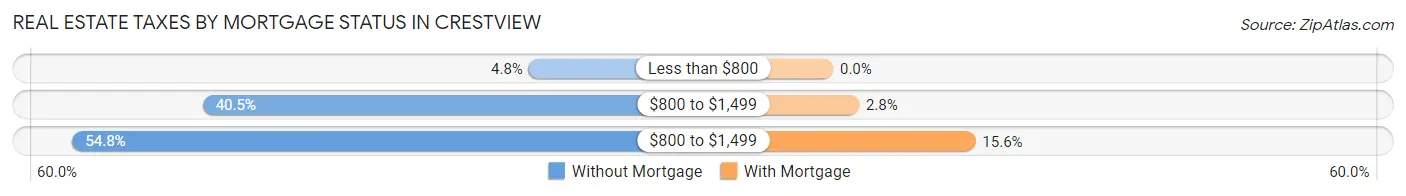
| Property Taxes | Without Mortgage | With Mortgage |
| Less than $800 | 2 (4.8%) | 0 (0.0%) |
| $800 to $1,499 | 17 (40.5%) | 4 (2.8%) |
| $800 to $1,499 | 23 (54.8%) | 22 (15.6%) |
| Total | 42 (100.0%) | 141 (100.0%) |
Health & Disability in Crestview
Health Insurance Coverage by Age in Crestview
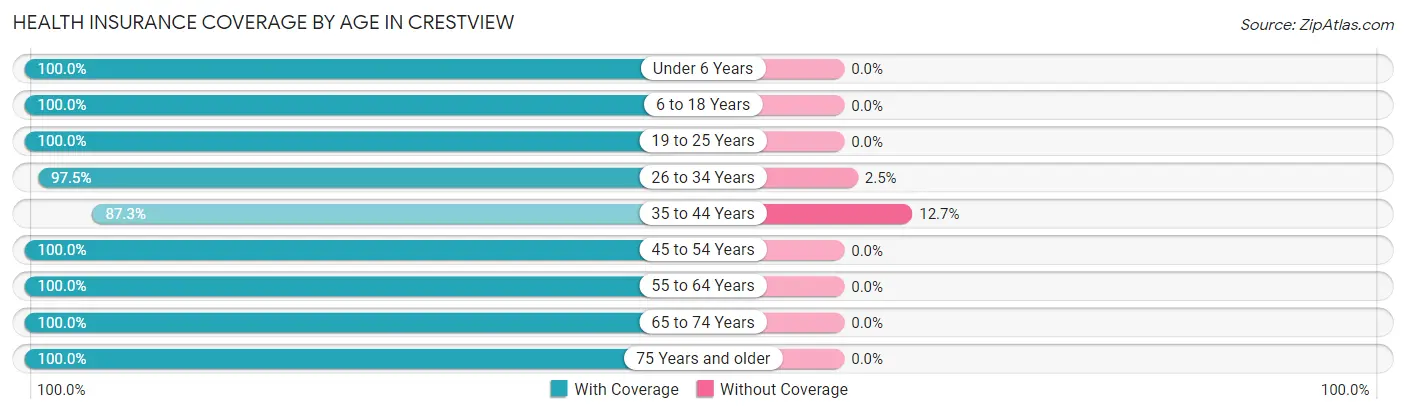
| Age Bracket | With Coverage | Without Coverage |
| Under 6 Years | 37 (100.0%) | 0 (0.0%) |
| 6 to 18 Years | 60 (100.0%) | 0 (0.0%) |
| 19 to 25 Years | 50 (100.0%) | 0 (0.0%) |
| 26 to 34 Years | 77 (97.5%) | 2 (2.5%) |
| 35 to 44 Years | 62 (87.3%) | 9 (12.7%) |
| 45 to 54 Years | 103 (100.0%) | 0 (0.0%) |
| 55 to 64 Years | 40 (100.0%) | 0 (0.0%) |
| 65 to 74 Years | 33 (100.0%) | 0 (0.0%) |
| 75 Years and older | 15 (100.0%) | 0 (0.0%) |
| Total | 477 (97.8%) | 11 (2.2%) |
Health Insurance Coverage by Citizenship Status in Crestview
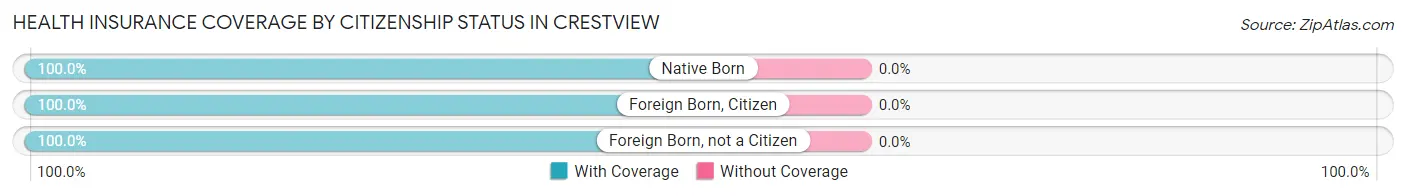
| Citizenship Status | With Coverage | Without Coverage |
| Native Born | 37 (100.0%) | 0 (0.0%) |
| Foreign Born, Citizen | 60 (100.0%) | 0 (0.0%) |
| Foreign Born, not a Citizen | 50 (100.0%) | 0 (0.0%) |
Health Insurance Coverage by Household Income in Crestview

| Household Income | With Coverage | Without Coverage |
| Under $25,000 | 12 (100.0%) | 0 (0.0%) |
| $25,000 to $49,999 | 61 (100.0%) | 0 (0.0%) |
| $50,000 to $74,999 | 73 (100.0%) | 0 (0.0%) |
| $75,000 to $99,999 | 71 (100.0%) | 0 (0.0%) |
| $100,000 and over | 260 (95.9%) | 11 (4.1%) |
Public vs Private Health Insurance Coverage by Age in Crestview
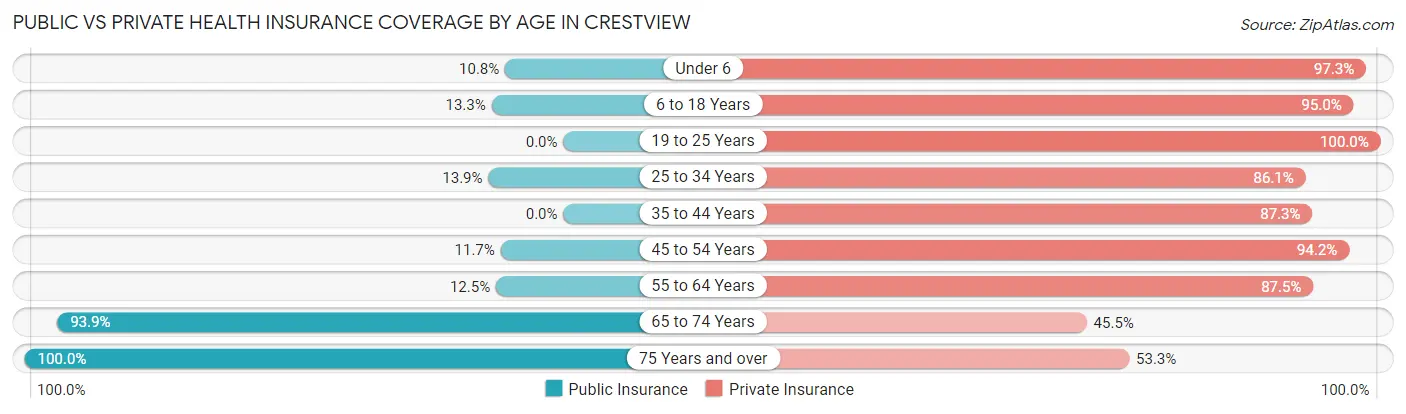
| Age Bracket | Public Insurance | Private Insurance |
| Under 6 | 4 (10.8%) | 36 (97.3%) |
| 6 to 18 Years | 8 (13.3%) | 57 (95.0%) |
| 19 to 25 Years | 0 (0.0%) | 50 (100.0%) |
| 25 to 34 Years | 11 (13.9%) | 68 (86.1%) |
| 35 to 44 Years | 0 (0.0%) | 62 (87.3%) |
| 45 to 54 Years | 12 (11.7%) | 97 (94.2%) |
| 55 to 64 Years | 5 (12.5%) | 35 (87.5%) |
| 65 to 74 Years | 31 (93.9%) | 15 (45.5%) |
| 75 Years and over | 15 (100.0%) | 8 (53.3%) |
| Total | 86 (17.6%) | 428 (87.7%) |
Disability Status by Sex by Age in Crestview
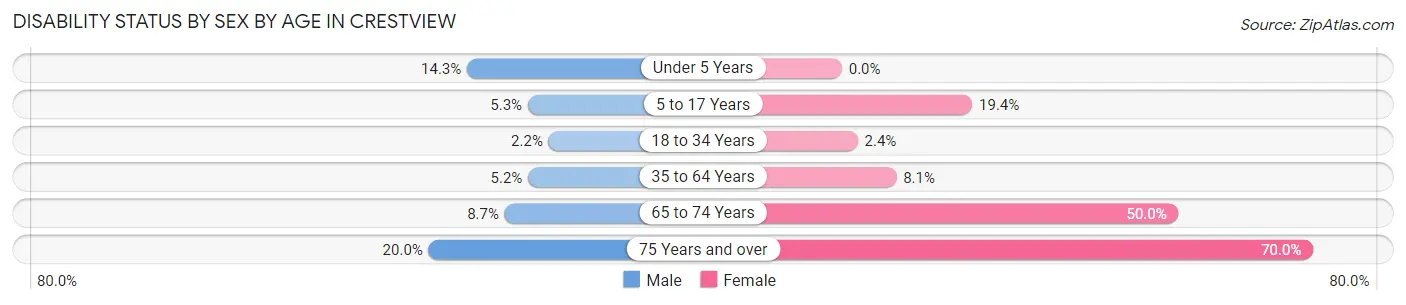
| Age Bracket | Male | Female |
| Under 5 Years | 2 (14.3%) | 0 (0.0%) |
| 5 to 17 Years | 2 (5.3%) | 6 (19.4%) |
| 18 to 34 Years | 1 (2.2%) | 2 (2.4%) |
| 35 to 64 Years | 6 (5.2%) | 8 (8.1%) |
| 65 to 74 Years | 2 (8.7%) | 5 (50.0%) |
| 75 Years and over | 1 (20.0%) | 7 (70.0%) |
Disability Class by Sex by Age in Crestview
Disability Class: Hearing Difficulty
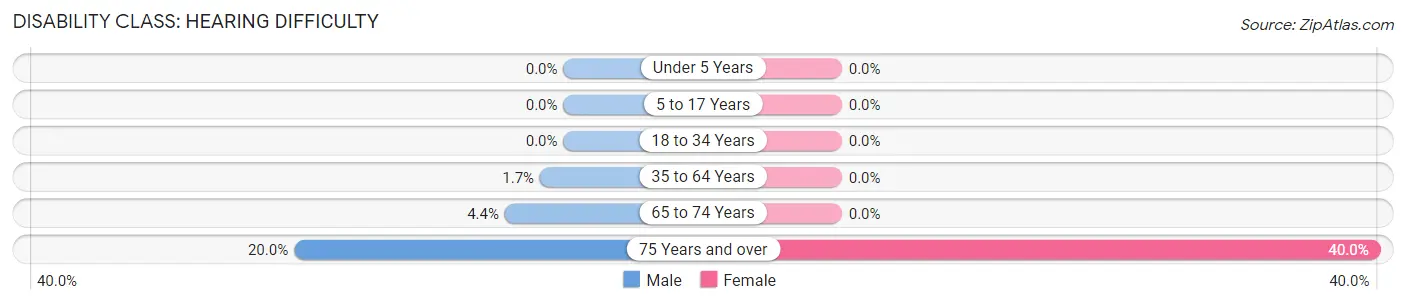
| Age Bracket | Male | Female |
| Under 5 Years | 0 (0.0%) | 0 (0.0%) |
| 5 to 17 Years | 0 (0.0%) | 0 (0.0%) |
| 18 to 34 Years | 0 (0.0%) | 0 (0.0%) |
| 35 to 64 Years | 2 (1.7%) | 0 (0.0%) |
| 65 to 74 Years | 1 (4.3%) | 0 (0.0%) |
| 75 Years and over | 1 (20.0%) | 4 (40.0%) |
Disability Class: Vision Difficulty
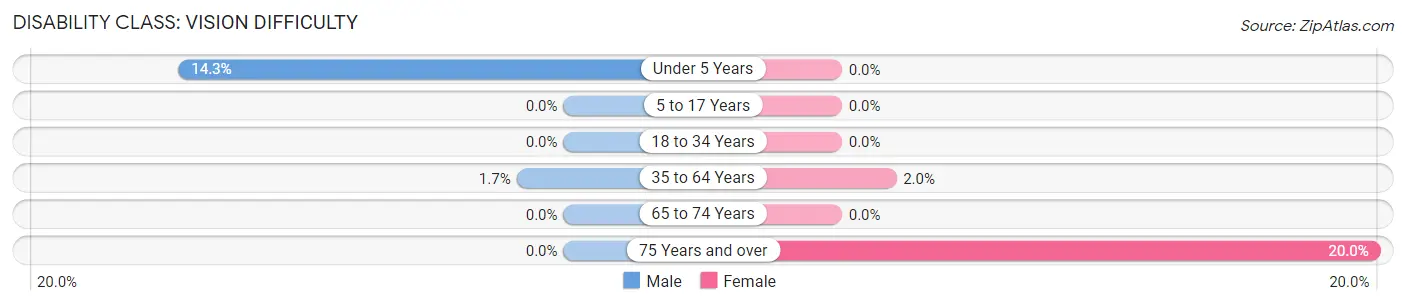
| Age Bracket | Male | Female |
| Under 5 Years | 2 (14.3%) | 0 (0.0%) |
| 5 to 17 Years | 0 (0.0%) | 0 (0.0%) |
| 18 to 34 Years | 0 (0.0%) | 0 (0.0%) |
| 35 to 64 Years | 2 (1.7%) | 2 (2.0%) |
| 65 to 74 Years | 0 (0.0%) | 0 (0.0%) |
| 75 Years and over | 0 (0.0%) | 2 (20.0%) |
Disability Class: Cognitive Difficulty
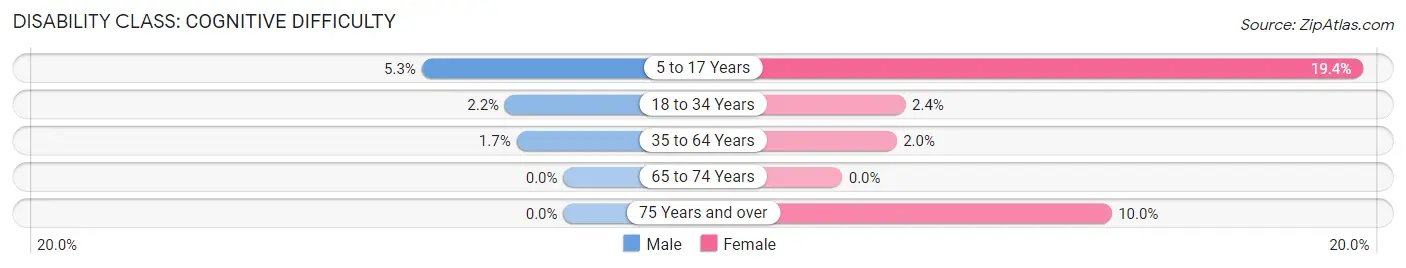
| Age Bracket | Male | Female |
| 5 to 17 Years | 2 (5.3%) | 6 (19.4%) |
| 18 to 34 Years | 1 (2.2%) | 2 (2.4%) |
| 35 to 64 Years | 2 (1.7%) | 2 (2.0%) |
| 65 to 74 Years | 0 (0.0%) | 0 (0.0%) |
| 75 Years and over | 0 (0.0%) | 1 (10.0%) |
Disability Class: Ambulatory Difficulty
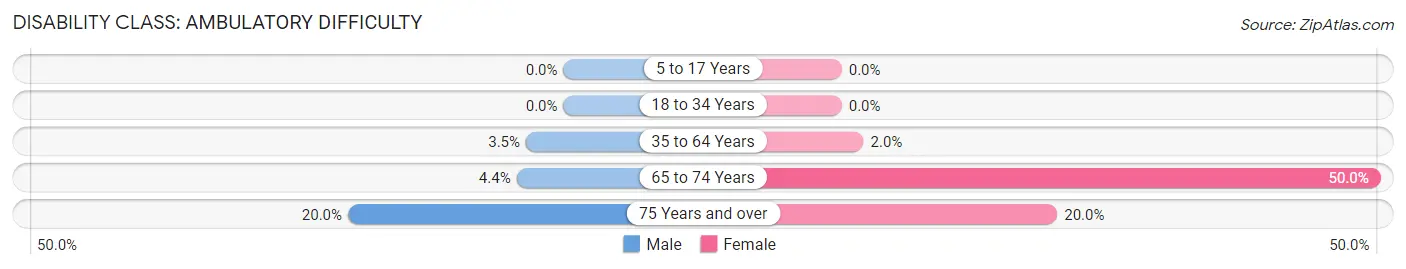
| Age Bracket | Male | Female |
| 5 to 17 Years | 0 (0.0%) | 0 (0.0%) |
| 18 to 34 Years | 0 (0.0%) | 0 (0.0%) |
| 35 to 64 Years | 4 (3.5%) | 2 (2.0%) |
| 65 to 74 Years | 1 (4.3%) | 5 (50.0%) |
| 75 Years and over | 1 (20.0%) | 2 (20.0%) |
Disability Class: Self-Care Difficulty
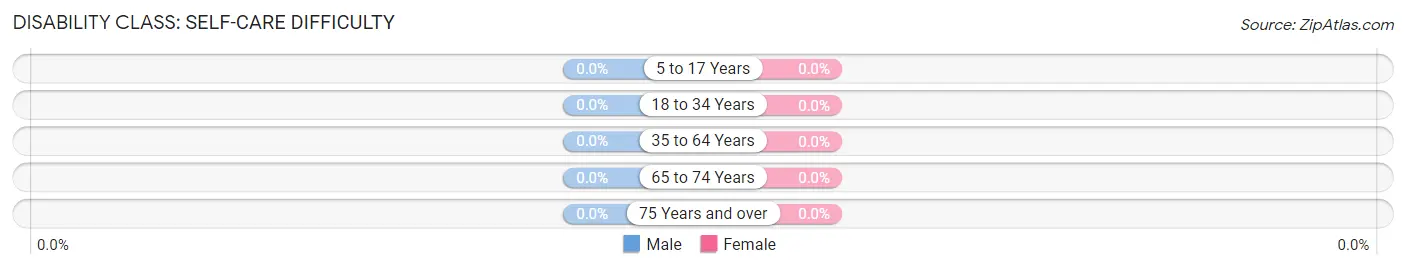
| Age Bracket | Male | Female |
| 5 to 17 Years | 0 (0.0%) | 0 (0.0%) |
| 18 to 34 Years | 0 (0.0%) | 0 (0.0%) |
| 35 to 64 Years | 0 (0.0%) | 0 (0.0%) |
| 65 to 74 Years | 0 (0.0%) | 0 (0.0%) |
| 75 Years and over | 0 (0.0%) | 0 (0.0%) |
Technology Access in Crestview
Computing Device Access in Crestview
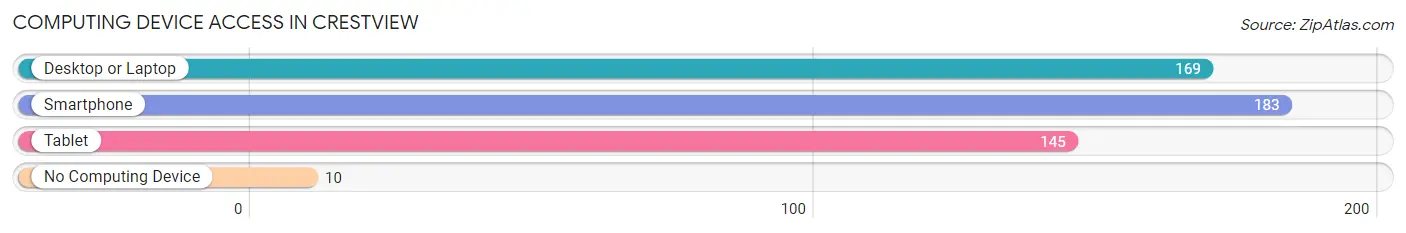
| Device Type | # Households | % Households |
| Desktop or Laptop | 169 | 82.8% |
| Smartphone | 183 | 89.7% |
| Tablet | 145 | 71.1% |
| No Computing Device | 10 | 4.9% |
| Total | 204 | 100.0% |
Internet Access in Crestview
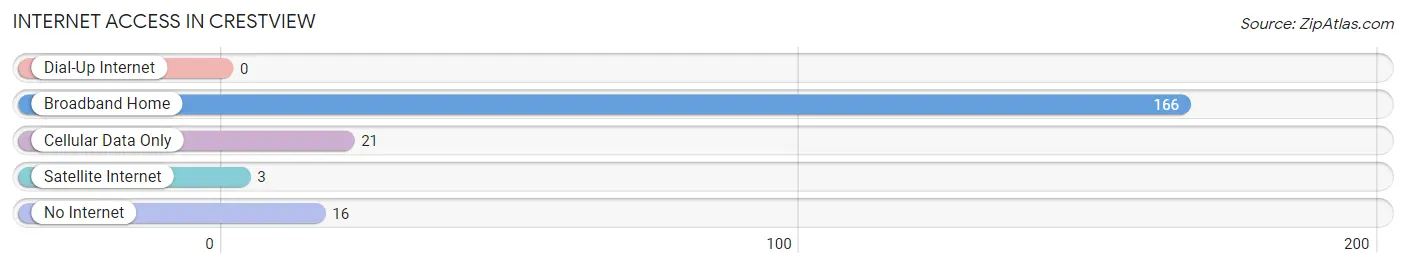
| Internet Type | # Households | % Households |
| Dial-Up Internet | 0 | 0.0% |
| Broadband Home | 166 | 81.4% |
| Cellular Data Only | 21 | 10.3% |
| Satellite Internet | 3 | 1.5% |
| No Internet | 16 | 7.8% |
| Total | 204 | 100.0% |
Crestview Summary
Crestview is a small unincorporated community located in the northern part of Kentucky, in the United States. It is situated in the foothills of the Appalachian Mountains, in the county of Boyd. The community is located along the banks of the Big Sandy River, and is home to a population of approximately 1,000 people.
History
The area that is now known as Crestview was first settled in the early 1800s by a group of settlers from Virginia. The settlers were attracted to the area due to its fertile soil and abundant natural resources. The community was originally known as “Crestview” due to its location at the top of a hill overlooking the Big Sandy River.
The community was officially established in 1820, when the first post office was opened. The post office was named after the nearby town of Crestview, Virginia. The community grew slowly over the years, and by the late 1800s, it had become a thriving agricultural center.
In the early 1900s, the community began to experience a period of growth and development. The railroad was extended to the area, and the town was connected to the larger cities of Ashland and Catlettsburg. This allowed for increased trade and commerce, and the town began to experience a period of prosperity.
In the mid-1900s, the town began to experience a period of decline. The railroad was abandoned, and the town’s economy began to suffer. In the late 1900s, the town began to experience a period of revitalization. The town was connected to the larger cities of Ashland and Catlettsburg once again, and the economy began to improve.
Geography
Crestview is located in the northern part of Kentucky, in the county of Boyd. The community is situated in the foothills of the Appalachian Mountains, along the banks of the Big Sandy River. The town is located at an elevation of approximately 1,000 feet above sea level.
The climate in Crestview is classified as humid subtropical. The summers are hot and humid, with temperatures reaching into the 90s. The winters are mild, with temperatures rarely dropping below freezing. The average annual precipitation is approximately 45 inches.
Economy
The economy of Crestview is largely based on agriculture. The town is home to several farms, which produce a variety of crops, including corn, soybeans, and wheat. The town is also home to several small businesses, including restaurants, retail stores, and service providers.
The town is also home to a small manufacturing sector. The town is home to several small factories, which produce a variety of products, including furniture, clothing, and electronics.
Demographics
As of the 2010 census, the population of Crestview was 1,000. The racial makeup of the town was 97.2% White, 0.7% African American, 0.3% Native American, 0.2% Asian, and 1.6% from other races. The median household income was $35,000, and the median family income was $41,000.
Conclusion
Crestview is a small unincorporated community located in the northern part of Kentucky, in the United States. It is situated in the foothills of the Appalachian Mountains, in the county of Boyd. The community is located along the banks of the Big Sandy River, and is home to a population of approximately 1,000 people. The economy of Crestview is largely based on agriculture, and the town is home to several small businesses. The racial makeup of the town is predominantly White, with a small percentage of African American, Native American, and Asian residents.
Common Questions
What is Per Capita Income in Crestview?
Per Capita income in Crestview is $39,042.
What is the Median Family Income in Crestview?
Median Family Income in Crestview is $104,000.
What is the Median Household income in Crestview?
Median Household Income in Crestview is $86,250.
What is Income or Wage Gap in Crestview?
Income or Wage Gap in Crestview is 38.2%.
Women in Crestview earn 61.8 cents for every dollar earned by a man.
What is Inequality or Gini Index in Crestview?
Inequality or Gini Index in Crestview is 0.28.
What is the Total Population of Crestview?
Total Population of Crestview is 488.
What is the Total Male Population of Crestview?
Total Male Population of Crestview is 241.
What is the Total Female Population of Crestview?
Total Female Population of Crestview is 247.
What is the Ratio of Males per 100 Females in Crestview?
There are 97.57 Males per 100 Females in Crestview.
What is the Ratio of Females per 100 Males in Crestview?
There are 102.49 Females per 100 Males in Crestview.
What is the Median Population Age in Crestview?
Median Population Age in Crestview is 36.4 Years.
What is the Average Family Size in Crestview
Average Family Size in Crestview is 2.9 People.
What is the Average Household Size in Crestview
Average Household Size in Crestview is 2.4 People.
How Large is the Labor Force in Crestview?
There are 337 People in the Labor Forcein in Crestview.
What is the Percentage of People in the Labor Force in Crestview?
84.9% of People are in the Labor Force in Crestview.
What is the Unemployment Rate in Crestview?
Unemployment Rate in Crestview is 2.4%.