Bardstown, KY Map & Demographics
Bardstown Map
Bardstown Overview
$27,338
PER CAPITA INCOME
$62,227
AVG FAMILY INCOME
$47,654
AVG HOUSEHOLD INCOME
29.8%
WAGE / INCOME GAP [ % ]
70.2¢/ $1
WAGE / INCOME GAP [ $ ]
$10,272
FAMILY INCOME DEFICIT
0.43
INEQUALITY / GINI INDEX
13,564
TOTAL POPULATION
6,630
MALE POPULATION
6,934
FEMALE POPULATION
95.62
MALES / 100 FEMALES
104.59
FEMALES / 100 MALES
38.1
MEDIAN AGE
3.0
AVG FAMILY SIZE
2.4
AVG HOUSEHOLD SIZE
6,429
LABOR FORCE [ PEOPLE ]
61.3%
PERCENT IN LABOR FORCE
3.4%
UNEMPLOYMENT RATE
Bardstown Zip Codes
Bardstown Area Codes
Income in Bardstown
Income Overview in Bardstown
Per Capita Income in Bardstown is $27,338, while median incomes of families and households are $62,227 and $47,654 respectively.
| Characteristic | Number | Measure |
| Per Capita Income | 13,564 | $27,338 |
| Median Family Income | 3,457 | $62,227 |
| Mean Family Income | 3,457 | $80,398 |
| Median Household Income | 5,566 | $47,654 |
| Mean Household Income | 5,566 | $66,670 |
| Income Deficit | 3,457 | $10,272 |
| Wage / Income Gap (%) | 13,564 | 29.84% |
| Wage / Income Gap ($) | 13,564 | 70.16¢ per $1 |
| Gini / Inequality Index | 13,564 | 0.43 |
Earnings by Sex in Bardstown
Average Earnings in Bardstown are $32,512, $40,984 for men and $28,756 for women, a difference of 29.8%.
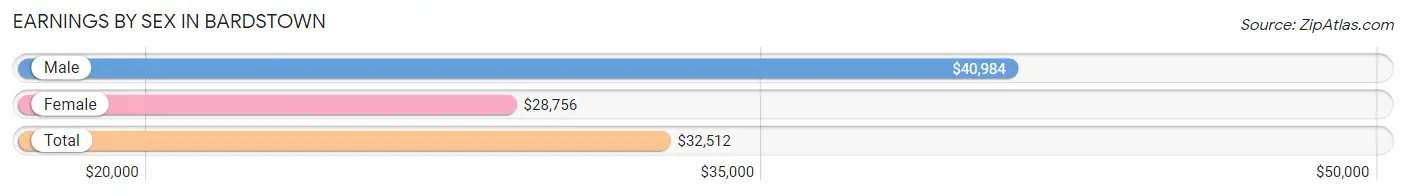
| Sex | Number | Average Earnings |
| Male | 3,376 (50.7%) | $40,984 |
| Female | 3,282 (49.3%) | $28,756 |
| Total | 6,658 (100.0%) | $32,512 |
Earnings by Sex by Income Bracket in Bardstown
The most common earnings brackets in Bardstown are $55,000 to $64,999 for men (413 | 12.2%) and $25,000 to $29,999 for women (295 | 9.0%).
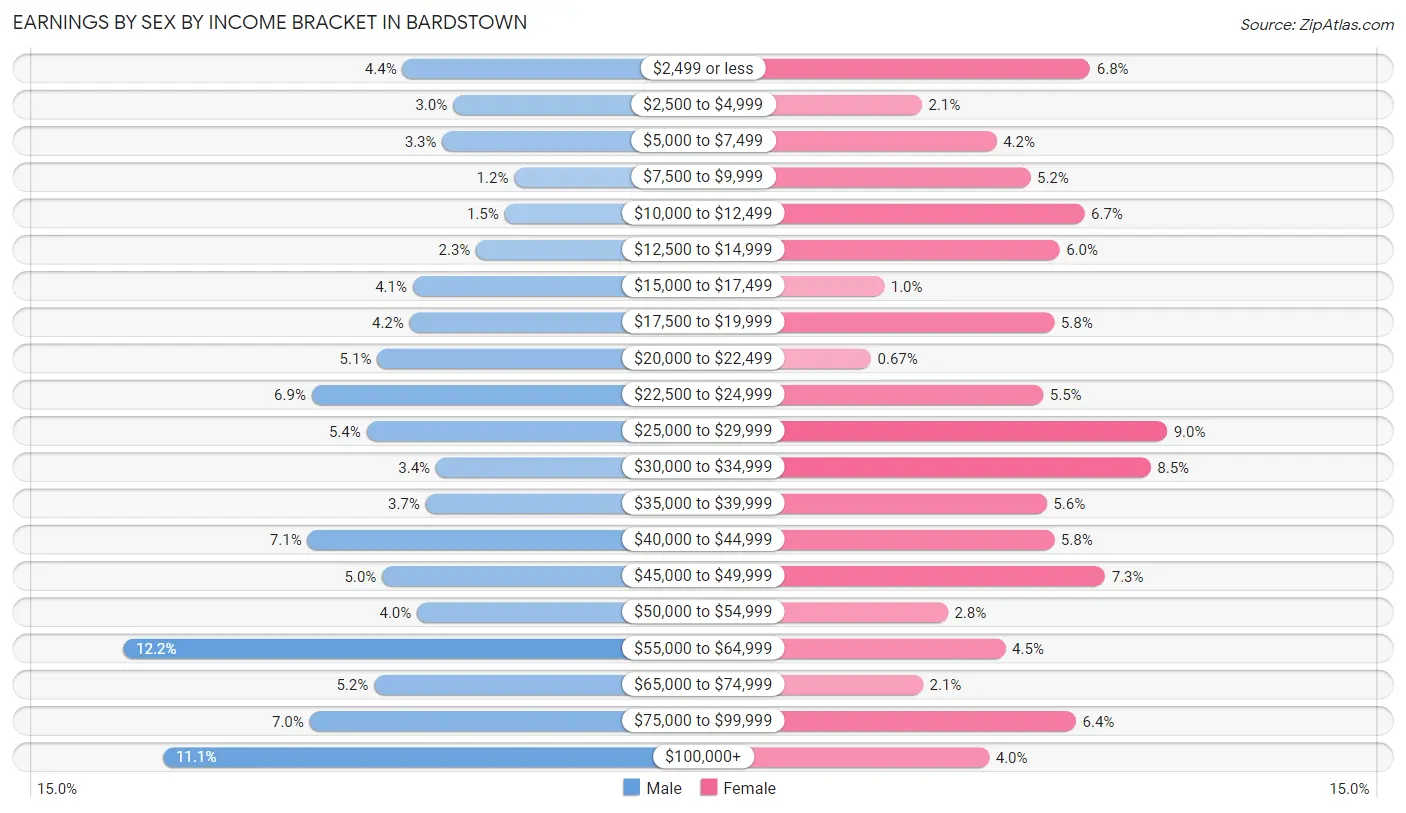
| Income | Male | Female |
| $2,499 or less | 148 (4.4%) | 224 (6.8%) |
| $2,500 to $4,999 | 100 (3.0%) | 69 (2.1%) |
| $5,000 to $7,499 | 110 (3.3%) | 138 (4.2%) |
| $7,500 to $9,999 | 42 (1.2%) | 169 (5.1%) |
| $10,000 to $12,499 | 51 (1.5%) | 219 (6.7%) |
| $12,500 to $14,999 | 78 (2.3%) | 196 (6.0%) |
| $15,000 to $17,499 | 138 (4.1%) | 34 (1.0%) |
| $17,500 to $19,999 | 141 (4.2%) | 191 (5.8%) |
| $20,000 to $22,499 | 172 (5.1%) | 22 (0.7%) |
| $22,500 to $24,999 | 234 (6.9%) | 181 (5.5%) |
| $25,000 to $29,999 | 182 (5.4%) | 295 (9.0%) |
| $30,000 to $34,999 | 116 (3.4%) | 280 (8.5%) |
| $35,000 to $39,999 | 126 (3.7%) | 184 (5.6%) |
| $40,000 to $44,999 | 238 (7.0%) | 191 (5.8%) |
| $45,000 to $49,999 | 167 (5.0%) | 238 (7.2%) |
| $50,000 to $54,999 | 134 (4.0%) | 93 (2.8%) |
| $55,000 to $64,999 | 413 (12.2%) | 146 (4.4%) |
| $65,000 to $74,999 | 175 (5.2%) | 70 (2.1%) |
| $75,000 to $99,999 | 236 (7.0%) | 211 (6.4%) |
| $100,000+ | 375 (11.1%) | 131 (4.0%) |
| Total | 3,376 (100.0%) | 3,282 (100.0%) |
Earnings by Sex by Educational Attainment in Bardstown
Average earnings in Bardstown are $47,414 for men and $31,014 for women, a difference of 34.6%. Men with an educational attainment of bachelor's degree enjoy the highest average annual earnings of $75,650, while those with less than high school education earn the least with $26,567. Women with an educational attainment of graduate degree earn the most with the average annual earnings of $68,977, while those with less than high school education have the smallest earnings of $14,116.
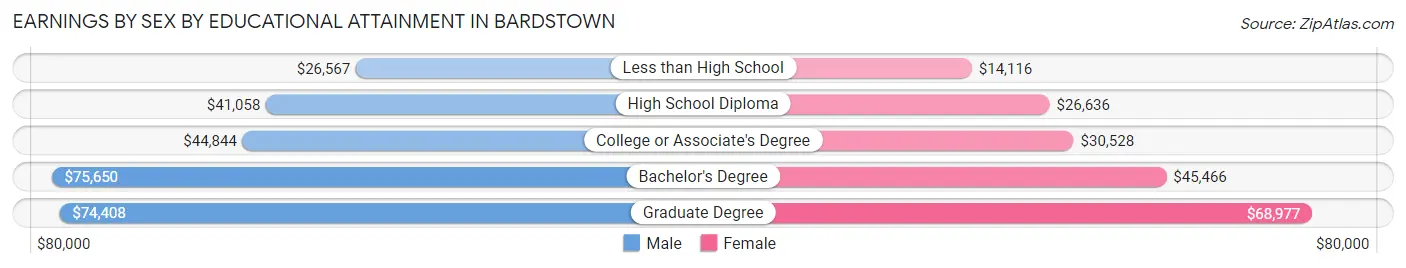
| Educational Attainment | Male Income | Female Income |
| Less than High School | $26,567 | $14,116 |
| High School Diploma | $41,058 | $26,636 |
| College or Associate's Degree | $44,844 | $30,528 |
| Bachelor's Degree | $75,650 | $45,466 |
| Graduate Degree | $74,408 | $68,977 |
| Total | $47,414 | $31,014 |
Family Income in Bardstown
Family Income Brackets in Bardstown
According to the Bardstown family income data, there are 844 families falling into the $50,000 to $74,999 income range, which is the most common income bracket and makes up 24.4% of all families. Conversely, the $10,000 to $14,999 income bracket is the least frequent group with only 59 families (1.7%) belonging to this category.
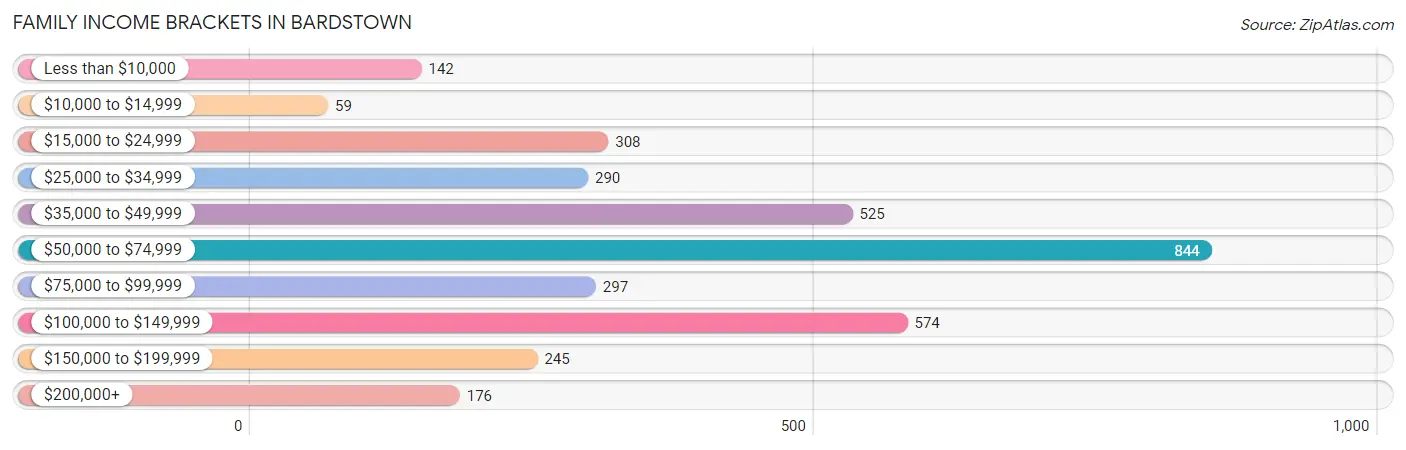
| Income Bracket | # Families | % Families |
| Less than $10,000 | 142 | 4.1% |
| $10,000 to $14,999 | 59 | 1.7% |
| $15,000 to $24,999 | 308 | 8.9% |
| $25,000 to $34,999 | 290 | 8.4% |
| $35,000 to $49,999 | 525 | 15.2% |
| $50,000 to $74,999 | 844 | 24.4% |
| $75,000 to $99,999 | 297 | 8.6% |
| $100,000 to $149,999 | 574 | 16.6% |
| $150,000 to $199,999 | 245 | 7.1% |
| $200,000+ | 176 | 5.1% |
Family Income by Famaliy Size in Bardstown
6-person families (188 | 5.4%) account for the highest median family income in Bardstown with $125,556 per family, while 2-person families (1,824 | 52.8%) have the highest median income of $26,986 per family member.
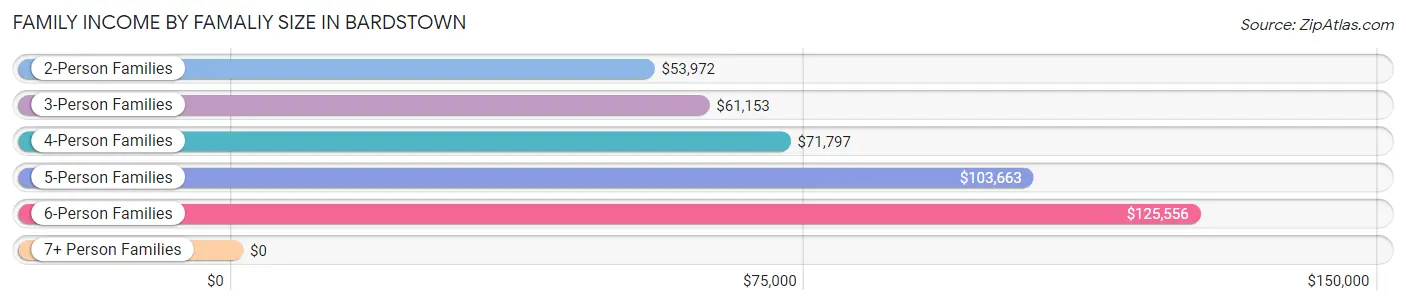
| Income Bracket | # Families | Median Income |
| 2-Person Families | 1,824 (52.8%) | $53,972 |
| 3-Person Families | 723 (20.9%) | $61,153 |
| 4-Person Families | 408 (11.8%) | $71,797 |
| 5-Person Families | 314 (9.1%) | $103,663 |
| 6-Person Families | 188 (5.4%) | $125,556 |
| 7+ Person Families | 0 (0.0%) | $0 |
| Total | 3,457 (100.0%) | $62,227 |
Family Income by Number of Earners in Bardstown
The median family income in Bardstown is $62,227, with families comprising 3+ earners (227) having the highest median family income of $147,163, while families with no earners (719) have the lowest median family income of $38,194, accounting for 6.6% and 20.8% of families, respectively.
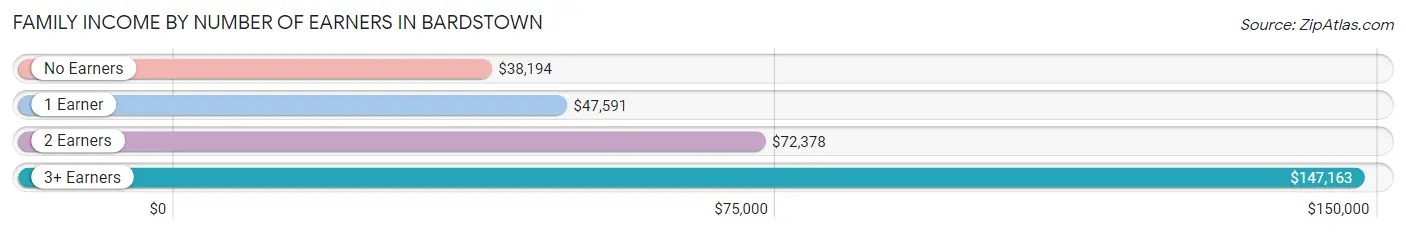
| Number of Earners | # Families | Median Income |
| No Earners | 719 (20.8%) | $38,194 |
| 1 Earner | 1,011 (29.2%) | $47,591 |
| 2 Earners | 1,500 (43.4%) | $72,378 |
| 3+ Earners | 227 (6.6%) | $147,163 |
| Total | 3,457 (100.0%) | $62,227 |
Household Income in Bardstown
Household Income Brackets in Bardstown
With 1,069 households falling in the category, the $50,000 to $74,999 income range is the most frequent in Bardstown, accounting for 19.2% of all households. In contrast, only 184 households (3.3%) fall into the less than $10,000 income bracket, making it the least populous group.
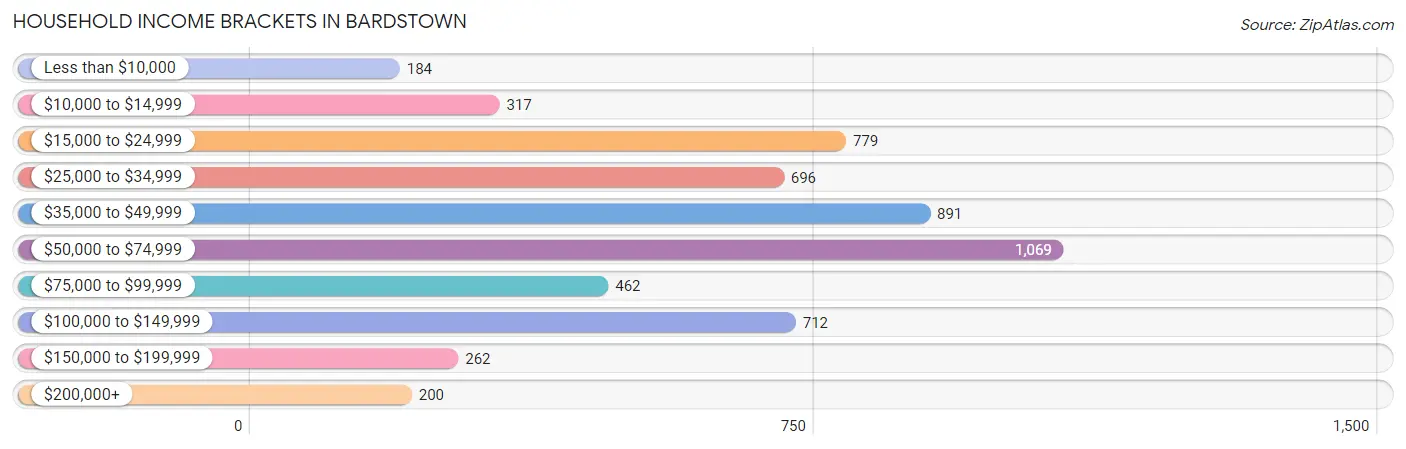
| Income Bracket | # Households | % Households |
| Less than $10,000 | 184 | 3.3% |
| $10,000 to $14,999 | 317 | 5.7% |
| $15,000 to $24,999 | 779 | 14.0% |
| $25,000 to $34,999 | 696 | 12.5% |
| $35,000 to $49,999 | 891 | 16.0% |
| $50,000 to $74,999 | 1,069 | 19.2% |
| $75,000 to $99,999 | 462 | 8.3% |
| $100,000 to $149,999 | 712 | 12.8% |
| $150,000 to $199,999 | 262 | 4.7% |
| $200,000+ | 200 | 3.6% |
Household Income by Householder Age in Bardstown
The median household income in Bardstown is $47,654, with the highest median household income of $67,132 found in the 25 to 44 years age bracket for the primary householder. A total of 1,683 households (30.2%) fall into this category. Meanwhile, the 15 to 24 years age bracket for the primary householder has the lowest median household income of $29,086, with 419 households (7.5%) in this group.
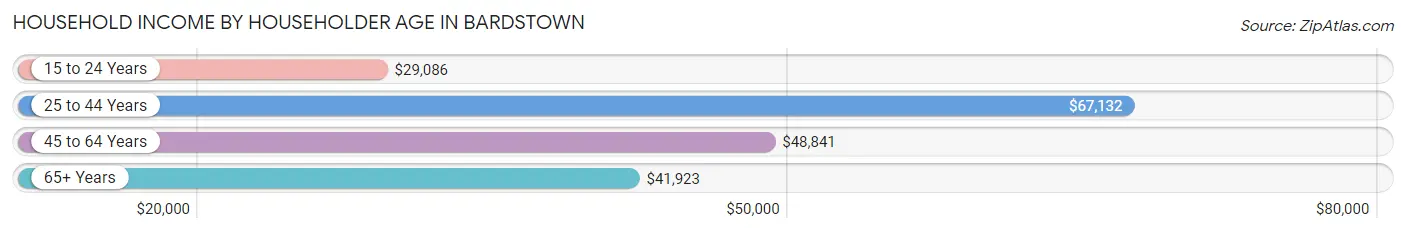
| Income Bracket | # Households | Median Income |
| 15 to 24 Years | 419 (7.5%) | $29,086 |
| 25 to 44 Years | 1,683 (30.2%) | $67,132 |
| 45 to 64 Years | 2,060 (37.0%) | $48,841 |
| 65+ Years | 1,404 (25.2%) | $41,923 |
| Total | 5,566 (100.0%) | $47,654 |
Poverty in Bardstown
Income Below Poverty by Sex and Age in Bardstown
With 12.2% poverty level for males and 12.6% for females among the residents of Bardstown, 55 to 64 year old males and under 5 year old females are the most vulnerable to poverty, with 235 males (30.1%) and 154 females (30.6%) in their respective age groups living below the poverty level.
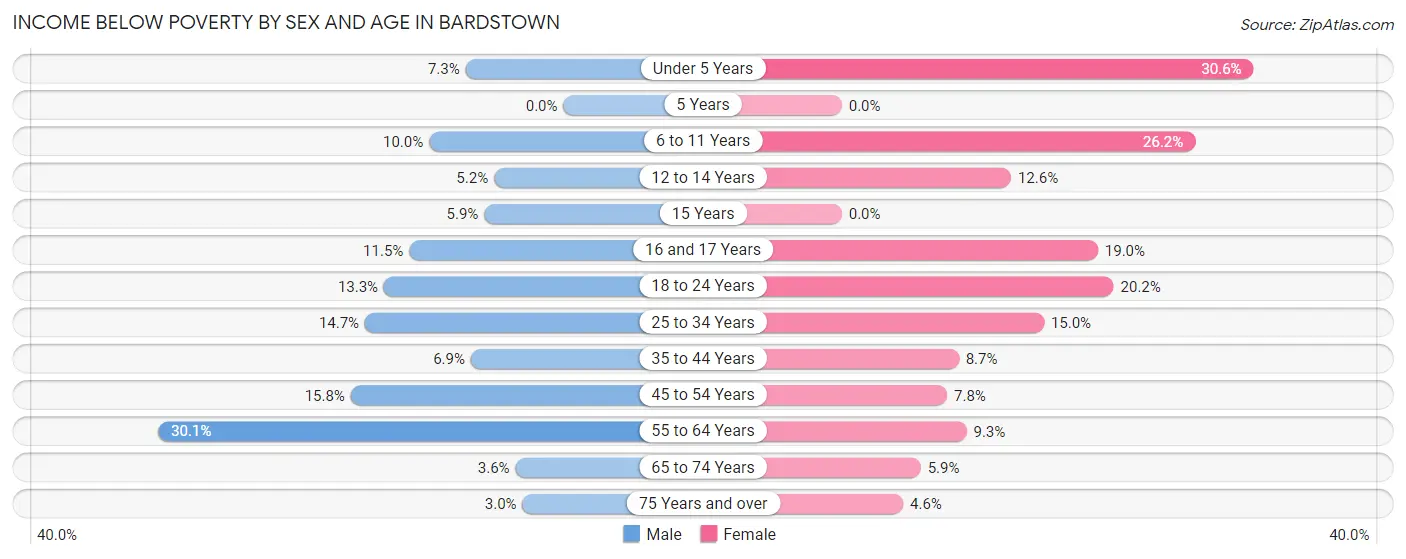
| Age Bracket | Male | Female |
| Under 5 Years | 50 (7.3%) | 154 (30.6%) |
| 5 Years | 0 (0.0%) | 0 (0.0%) |
| 6 to 11 Years | 33 (10.0%) | 139 (26.2%) |
| 12 to 14 Years | 7 (5.1%) | 27 (12.6%) |
| 15 Years | 7 (5.9%) | 0 (0.0%) |
| 16 and 17 Years | 19 (11.5%) | 23 (19.0%) |
| 18 to 24 Years | 85 (13.3%) | 88 (20.2%) |
| 25 to 34 Years | 147 (14.7%) | 142 (15.0%) |
| 35 to 44 Years | 56 (6.9%) | 67 (8.7%) |
| 45 to 54 Years | 105 (15.8%) | 57 (7.8%) |
| 55 to 64 Years | 235 (30.1%) | 93 (9.3%) |
| 65 to 74 Years | 20 (3.6%) | 39 (5.9%) |
| 75 Years and over | 11 (3.0%) | 24 (4.5%) |
| Total | 775 (12.2%) | 853 (12.6%) |
Income Above Poverty by Sex and Age in Bardstown
According to the poverty statistics in Bardstown, males aged 5 years and females aged 5 years are the age groups that are most secure financially, with 100.0% of males and 100.0% of females in these age groups living above the poverty line.
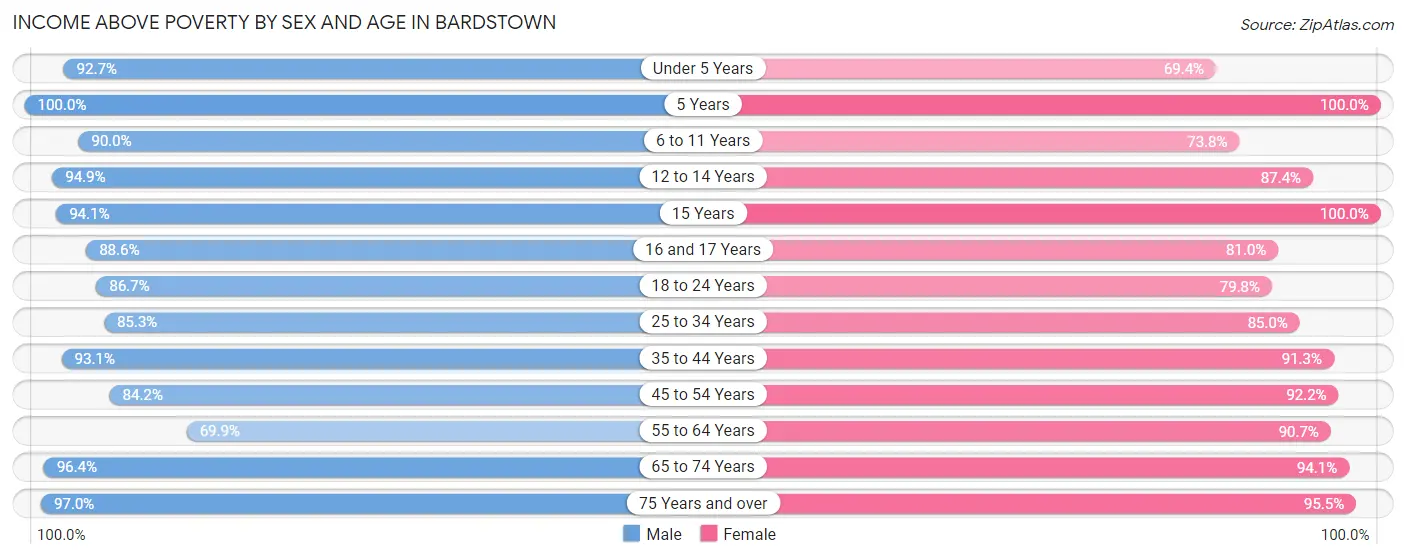
| Age Bracket | Male | Female |
| Under 5 Years | 639 (92.7%) | 350 (69.4%) |
| 5 Years | 94 (100.0%) | 287 (100.0%) |
| 6 to 11 Years | 298 (90.0%) | 391 (73.8%) |
| 12 to 14 Years | 129 (94.9%) | 188 (87.4%) |
| 15 Years | 112 (94.1%) | 38 (100.0%) |
| 16 and 17 Years | 147 (88.5%) | 98 (81.0%) |
| 18 to 24 Years | 553 (86.7%) | 348 (79.8%) |
| 25 to 34 Years | 851 (85.3%) | 804 (85.0%) |
| 35 to 44 Years | 759 (93.1%) | 705 (91.3%) |
| 45 to 54 Years | 560 (84.2%) | 672 (92.2%) |
| 55 to 64 Years | 546 (69.9%) | 911 (90.7%) |
| 65 to 74 Years | 542 (96.4%) | 626 (94.1%) |
| 75 Years and over | 351 (97.0%) | 504 (95.5%) |
| Total | 5,581 (87.8%) | 5,922 (87.4%) |
Income Below Poverty Among Married-Couple Families in Bardstown
The poverty statistics for married-couple families in Bardstown show that 1.2% or 27 of the total 2,333 families live below the poverty line. Families with no children have the highest poverty rate of 1.6%, comprising of 21 families. On the other hand, families with 3 or 4 children have the lowest poverty rate of 0.0%, which includes 0 families.
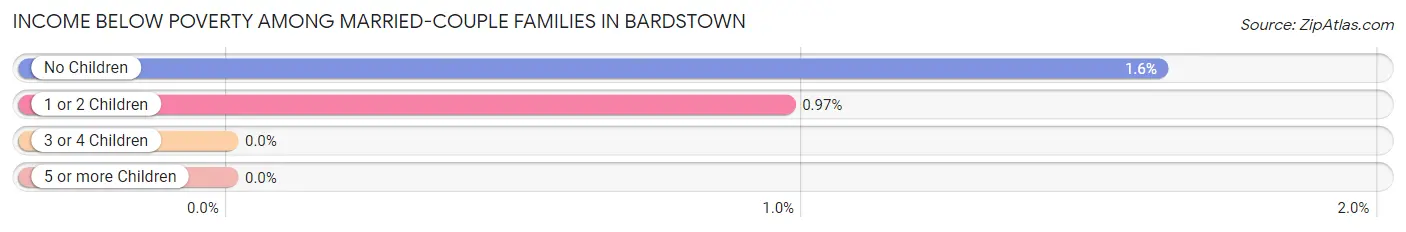
| Children | Above Poverty | Below Poverty |
| No Children | 1,276 (98.4%) | 21 (1.6%) |
| 1 or 2 Children | 614 (99.0%) | 6 (1.0%) |
| 3 or 4 Children | 416 (100.0%) | 0 (0.0%) |
| 5 or more Children | 0 (0.0%) | 0 (0.0%) |
| Total | 2,306 (98.8%) | 27 (1.2%) |
Income Below Poverty Among Single-Parent Households in Bardstown
According to the poverty data in Bardstown, 51.1% or 136 single-father households and 21.2% or 182 single-mother households are living below the poverty line. Among single-father households, those with 1 or 2 children have the highest poverty rate, with 118 households (79.2%) experiencing poverty. Likewise, among single-mother households, those with 1 or 2 children have the highest poverty rate, with 178 households (44.4%) falling below the poverty line.
| Children | Single Father | Single Mother |
| No Children | 18 (15.4%) | 4 (0.9%) |
| 1 or 2 Children | 118 (79.2%) | 178 (44.4%) |
| 3 or 4 Children | 0 (0.0%) | 0 (0.0%) |
| 5 or more Children | 0 (0.0%) | 0 (0.0%) |
| Total | 136 (51.1%) | 182 (21.2%) |
Income Below Poverty Among Married-Couple vs Single-Parent Households in Bardstown
The poverty data for Bardstown shows that 27 of the married-couple family households (1.2%) and 318 of the single-parent households (28.3%) are living below the poverty level. Within the married-couple family households, those with no children have the highest poverty rate, with 21 households (1.6%) falling below the poverty line. Among the single-parent households, those with 1 or 2 children have the highest poverty rate, with 296 household (53.8%) living below poverty.
| Children | Married-Couple Families | Single-Parent Households |
| No Children | 21 (1.6%) | 22 (4.0%) |
| 1 or 2 Children | 6 (1.0%) | 296 (53.8%) |
| 3 or 4 Children | 0 (0.0%) | 0 (0.0%) |
| 5 or more Children | 0 (0.0%) | 0 (0.0%) |
| Total | 27 (1.2%) | 318 (28.3%) |
Race in Bardstown
The most populous races in Bardstown are White / Caucasian (10,903 | 80.4%), Black / African American (1,745 | 12.9%), and Hispanic or Latino (734 | 5.4%).
| Race | # Population | % Population |
| Asian | 87 | 0.6% |
| Black / African American | 1,745 | 12.9% |
| Hawaiian / Pacific | 0 | 0.0% |
| Hispanic or Latino | 734 | 5.4% |
| Native / Alaskan | 19 | 0.1% |
| White / Caucasian | 10,903 | 80.4% |
| Two or more Races | 614 | 4.5% |
| Some other Race | 196 | 1.5% |
| Total | 13,564 | 100.0% |
Ancestry in Bardstown
The most populous ancestries reported in Bardstown are German (1,721 | 12.7%), Irish (1,668 | 12.3%), English (1,580 | 11.7%), American (1,093 | 8.1%), and Mexican (610 | 4.5%), together accounting for 49.2% of all Bardstown residents.
| Ancestry | # Population | % Population |
| African | 125 | 0.9% |
| American | 1,093 | 8.1% |
| Arab | 18 | 0.1% |
| Blackfeet | 26 | 0.2% |
| British | 54 | 0.4% |
| Burmese | 30 | 0.2% |
| Central American | 12 | 0.1% |
| Central American Indian | 12 | 0.1% |
| Cherokee | 35 | 0.3% |
| Choctaw | 18 | 0.1% |
| Dutch | 17 | 0.1% |
| English | 1,580 | 11.7% |
| European | 315 | 2.3% |
| French | 211 | 1.6% |
| French Canadian | 22 | 0.2% |
| German | 1,721 | 12.7% |
| Guatemalan | 12 | 0.1% |
| Hungarian | 17 | 0.1% |
| Indian (Asian) | 24 | 0.2% |
| Irish | 1,668 | 12.3% |
| Italian | 510 | 3.8% |
| Korean | 9 | 0.1% |
| Lithuanian | 16 | 0.1% |
| Mexican | 610 | 4.5% |
| Norwegian | 41 | 0.3% |
| Peruvian | 10 | 0.1% |
| Polish | 75 | 0.5% |
| Puerto Rican | 88 | 0.6% |
| Samoan | 26 | 0.2% |
| Scandinavian | 49 | 0.4% |
| Scotch-Irish | 102 | 0.7% |
| Scottish | 278 | 2.1% |
| Slovak | 14 | 0.1% |
| South American | 10 | 0.1% |
| Spaniard | 10 | 0.1% |
| Sri Lankan | 59 | 0.4% |
| Subsaharan African | 125 | 0.9% |
| Thai | 18 | 0.1% |
| Welsh | 200 | 1.5% | View All 39 Rows |
Immigrants in Bardstown
The most numerous immigrant groups reported in Bardstown came from Central America (236 | 1.7%), Latin America (236 | 1.7%), Mexico (180 | 1.3%), Europe (154 | 1.1%), and Africa (125 | 0.9%), together accounting for 6.9% of all Bardstown residents.
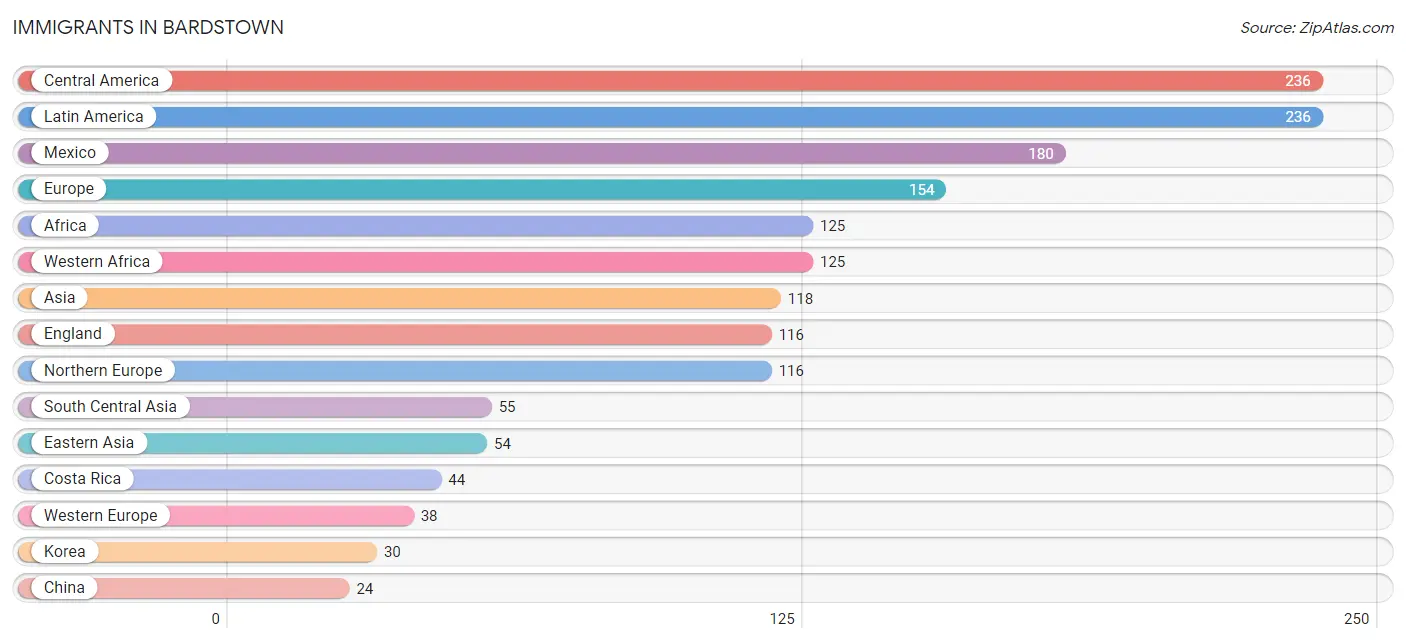
| Immigration Origin | # Population | % Population |
| Africa | 125 | 0.9% |
| Asia | 118 | 0.9% |
| Canada | 5 | 0.0% |
| Central America | 236 | 1.7% |
| China | 24 | 0.2% |
| Costa Rica | 44 | 0.3% |
| Eastern Asia | 54 | 0.4% |
| England | 116 | 0.9% |
| Europe | 154 | 1.1% |
| Germany | 21 | 0.2% |
| Guatemala | 12 | 0.1% |
| Korea | 30 | 0.2% |
| Latin America | 236 | 1.7% |
| Mexico | 180 | 1.3% |
| Netherlands | 17 | 0.1% |
| Northern Europe | 116 | 0.9% |
| Pakistan | 24 | 0.2% |
| Philippines | 9 | 0.1% |
| South Central Asia | 55 | 0.4% |
| South Eastern Asia | 9 | 0.1% |
| Western Africa | 125 | 0.9% |
| Western Europe | 38 | 0.3% | View All 22 Rows |
Sex and Age in Bardstown
Sex and Age in Bardstown
The most populous age groups in Bardstown are Under 5 Years (689 | 10.4%) for men and 5 to 9 Years (663 | 9.6%) for women.
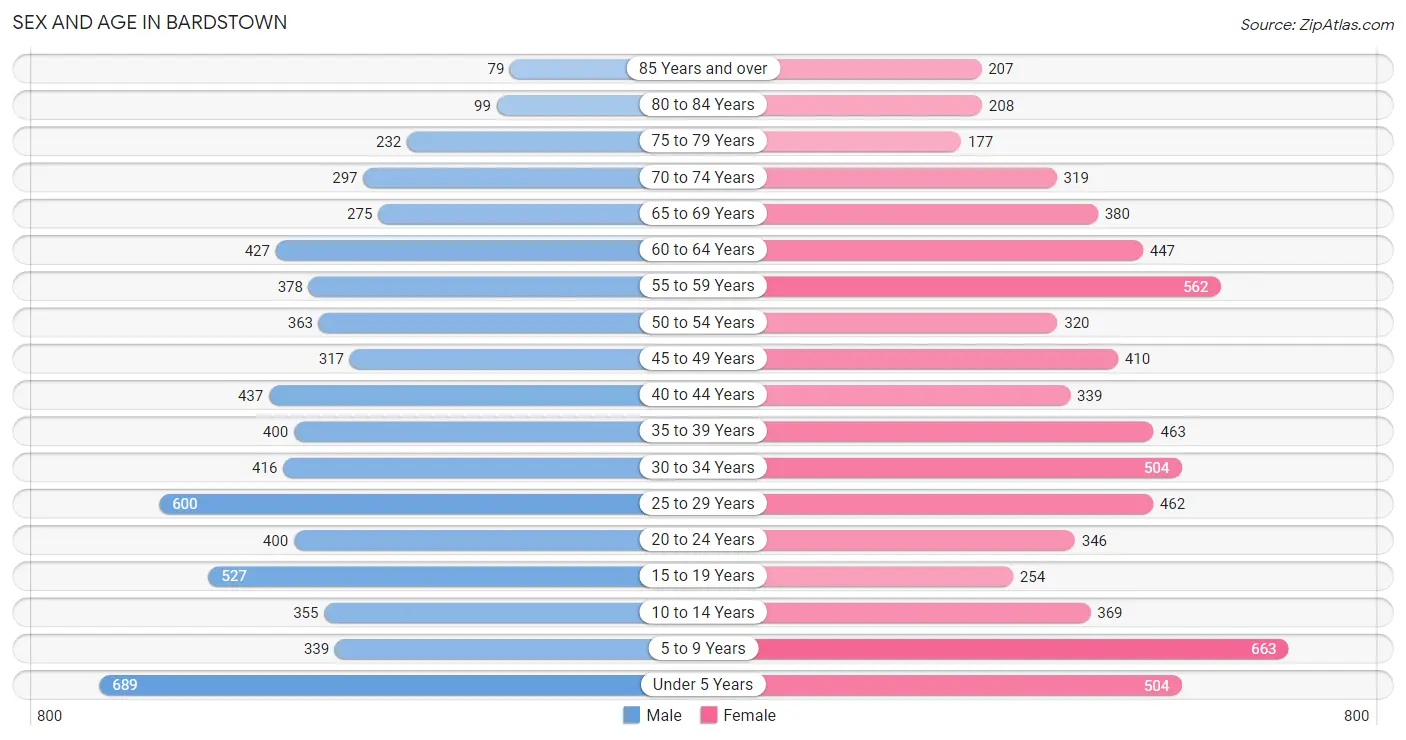
| Age Bracket | Male | Female |
| Under 5 Years | 689 (10.4%) | 504 (7.3%) |
| 5 to 9 Years | 339 (5.1%) | 663 (9.6%) |
| 10 to 14 Years | 355 (5.3%) | 369 (5.3%) |
| 15 to 19 Years | 527 (8.0%) | 254 (3.7%) |
| 20 to 24 Years | 400 (6.0%) | 346 (5.0%) |
| 25 to 29 Years | 600 (9.0%) | 462 (6.7%) |
| 30 to 34 Years | 416 (6.3%) | 504 (7.3%) |
| 35 to 39 Years | 400 (6.0%) | 463 (6.7%) |
| 40 to 44 Years | 437 (6.6%) | 339 (4.9%) |
| 45 to 49 Years | 317 (4.8%) | 410 (5.9%) |
| 50 to 54 Years | 363 (5.5%) | 320 (4.6%) |
| 55 to 59 Years | 378 (5.7%) | 562 (8.1%) |
| 60 to 64 Years | 427 (6.4%) | 447 (6.5%) |
| 65 to 69 Years | 275 (4.2%) | 380 (5.5%) |
| 70 to 74 Years | 297 (4.5%) | 319 (4.6%) |
| 75 to 79 Years | 232 (3.5%) | 177 (2.5%) |
| 80 to 84 Years | 99 (1.5%) | 208 (3.0%) |
| 85 Years and over | 79 (1.2%) | 207 (3.0%) |
| Total | 6,630 (100.0%) | 6,934 (100.0%) |
Families and Households in Bardstown
Median Family Size in Bardstown
The median family size in Bardstown is 3.02 persons per family, with married-couple families (2,333 | 67.5%) accounting for the largest median family size of 3.2 persons per family. On the other hand, single male/father families (266 | 7.7%) represent the smallest median family size with 2.20 persons per family.
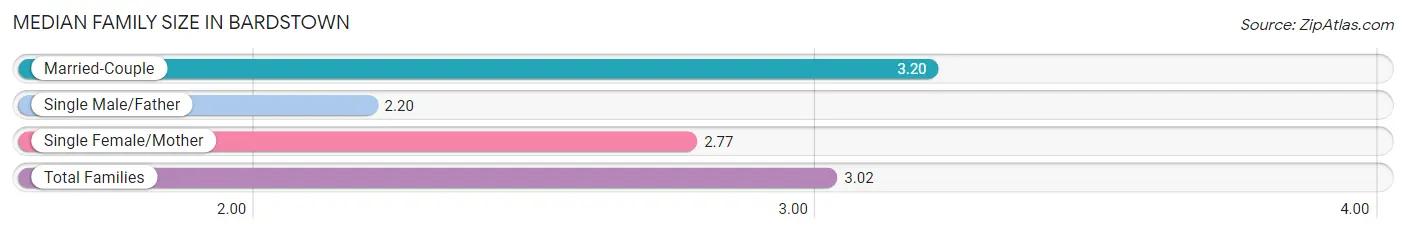
| Family Type | # Families | Family Size |
| Married-Couple | 2,333 (67.5%) | 3.20 |
| Single Male/Father | 266 (7.7%) | 2.20 |
| Single Female/Mother | 858 (24.8%) | 2.77 |
| Total Families | 3,457 (100.0%) | 3.02 |
Median Household Size in Bardstown
The median household size in Bardstown is 2.38 persons per household, with married-couple households (2,333 | 41.9%) accounting for the largest median household size of 3.2 persons per household. non-family households (2,109 | 37.9%) represent the smallest median household size with 1.18 persons per household.
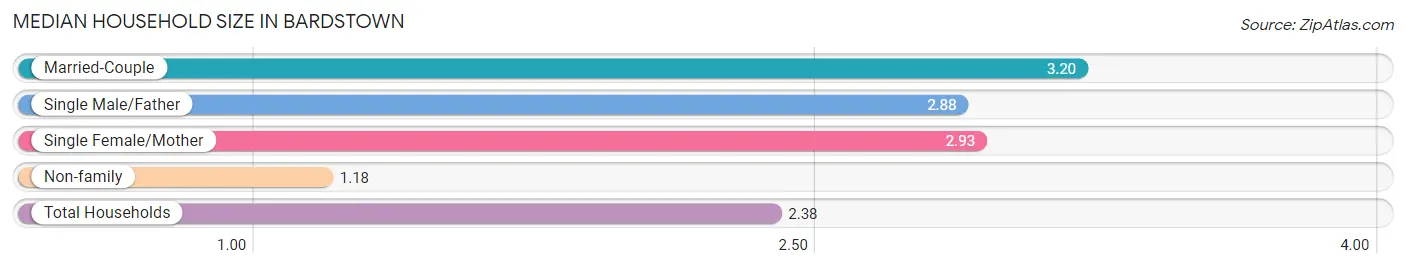
| Household Type | # Households | Household Size |
| Married-Couple | 2,333 (41.9%) | 3.20 |
| Single Male/Father | 266 (4.8%) | 2.88 |
| Single Female/Mother | 858 (15.4%) | 2.93 |
| Non-family | 2,109 (37.9%) | 1.18 |
| Total Households | 5,566 (100.0%) | 2.38 |
Household Size by Marriage Status in Bardstown
Out of a total of 5,566 households in Bardstown, 3,457 (62.1%) are family households, while 2,109 (37.9%) are nonfamily households. The most numerous type of family households are 2-person households, comprising 1,748, and the most common type of nonfamily households are 1-person households, comprising 1,827.
| Household Size | Family Households | Nonfamily Households |
| 1-Person Households | - | 1,827 (32.8%) |
| 2-Person Households | 1,748 (31.4%) | 211 (3.8%) |
| 3-Person Households | 694 (12.5%) | 71 (1.3%) |
| 4-Person Households | 435 (7.8%) | 0 (0.0%) |
| 5-Person Households | 382 (6.9%) | 0 (0.0%) |
| 6-Person Households | 198 (3.6%) | 0 (0.0%) |
| 7+ Person Households | 0 (0.0%) | 0 (0.0%) |
| Total | 3,457 (62.1%) | 2,109 (37.9%) |
Female Fertility in Bardstown
Fertility by Age in Bardstown
Average fertility rate in Bardstown is 43.0 births per 1,000 women. Women in the age bracket of 20 to 34 years have the highest fertility rate with 73.0 births per 1,000 women. Women in the age bracket of 20 to 34 years acount for 77.4% of all women with births.
| Age Bracket | Women with Births | Births / 1,000 Women |
| 15 to 19 years | 17 (13.7%) | 67.0 |
| 20 to 34 years | 96 (77.4%) | 73.0 |
| 35 to 50 years | 11 (8.9%) | 9.0 |
| Total | 124 (100.0%) | 43.0 |
Fertility by Age by Marriage Status in Bardstown
40.3% of women with births (124) in Bardstown are married. The highest percentage of unmarried women with births falls into 15 to 19 years age bracket with 100.0% of them unmarried at the time of birth, while the lowest percentage of unmarried women with births belong to 35 to 50 years age bracket with 0.0% of them unmarried.
| Age Bracket | Married | Unmarried |
| 15 to 19 years | 0 (0.0%) | 17 (100.0%) |
| 20 to 34 years | 39 (40.6%) | 57 (59.4%) |
| 35 to 50 years | 11 (100.0%) | 0 (0.0%) |
| Total | 50 (40.3%) | 74 (59.7%) |
Fertility by Education in Bardstown
| Educational Attainment | Women with Births | Births / 1,000 Women |
| Less than High School | 17 (13.7%) | 49.0 |
| High School Diploma | 58 (46.8%) | 79.0 |
| College or Associate's Degree | 15 (12.1%) | 15.0 |
| Bachelor's Degree | 34 (27.4%) | 99.0 |
| Graduate Degree | 0 (0.0%) | 0.0 |
| Total | 124 (100.0%) | 43.0 |
Fertility by Education by Marriage Status in Bardstown
59.7% of women with births in Bardstown are unmarried. Women with the educational attainment of bachelor's degree are most likely to be married with 100.0% of them married at childbirth, while women with the educational attainment of less than high school are least likely to be married with 100.0% of them unmarried at childbirth.
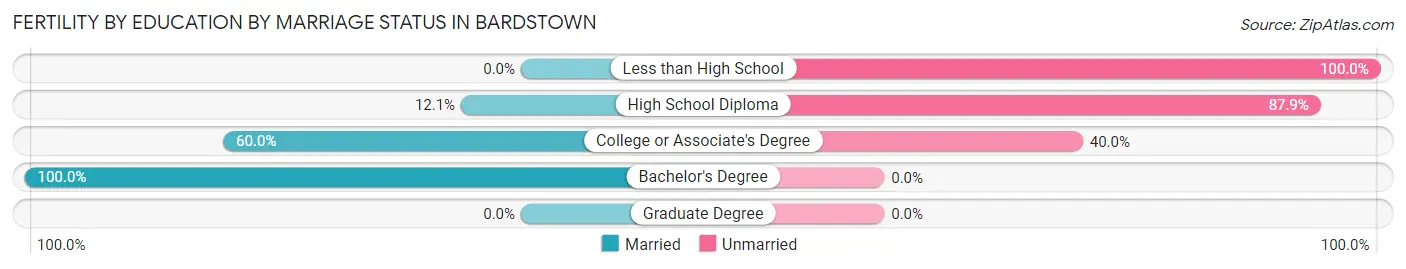
| Educational Attainment | Married | Unmarried |
| Less than High School | 0 (0.0%) | 17 (100.0%) |
| High School Diploma | 7 (12.1%) | 51 (87.9%) |
| College or Associate's Degree | 9 (60.0%) | 6 (40.0%) |
| Bachelor's Degree | 34 (100.0%) | 0 (0.0%) |
| Graduate Degree | 0 (0.0%) | 0 (0.0%) |
| Total | 50 (40.3%) | 74 (59.7%) |
Employment Characteristics in Bardstown
Employment by Class of Employer in Bardstown
Among the 6,183 employed individuals in Bardstown, private company employees (4,293 | 69.4%), not-for-profit organizations (473 | 7.6%), and local government employees (434 | 7.0%) make up the most common classes of employment.
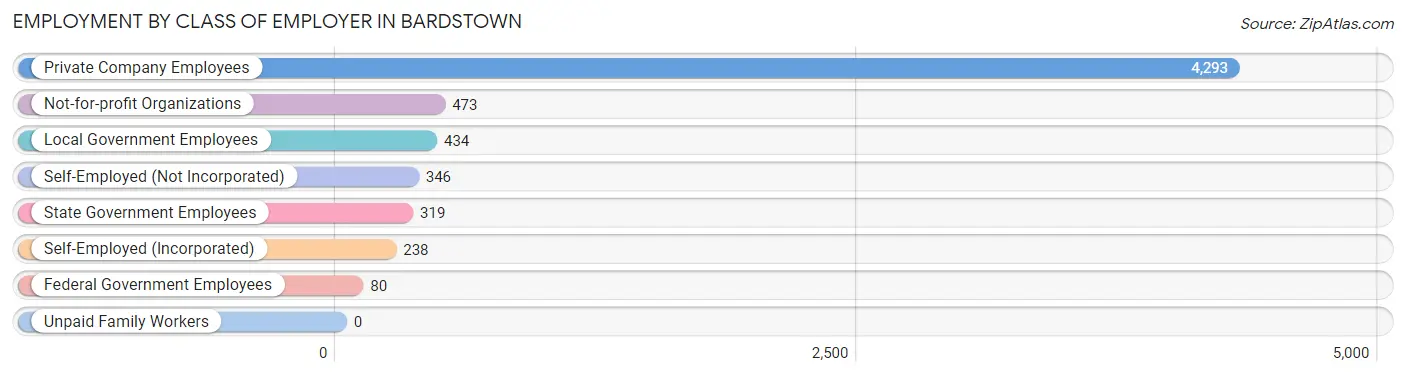
| Employer Class | # Employees | % Employees |
| Private Company Employees | 4,293 | 69.4% |
| Self-Employed (Incorporated) | 238 | 3.8% |
| Self-Employed (Not Incorporated) | 346 | 5.6% |
| Not-for-profit Organizations | 473 | 7.6% |
| Local Government Employees | 434 | 7.0% |
| State Government Employees | 319 | 5.2% |
| Federal Government Employees | 80 | 1.3% |
| Unpaid Family Workers | 0 | 0.0% |
| Total | 6,183 | 100.0% |
Employment Status by Age in Bardstown
According to the labor force statistics for Bardstown, out of the total population over 16 years of age (10,488), 61.3% or 6,429 individuals are in the labor force, with 3.4% or 219 of them unemployed. The age group with the highest labor force participation rate is 20 to 24 years, with 90.6% or 676 individuals in the labor force. Within the labor force, the 25 to 29 years age range has the highest percentage of unemployed individuals, with 13.8% or 104 of them being unemployed.
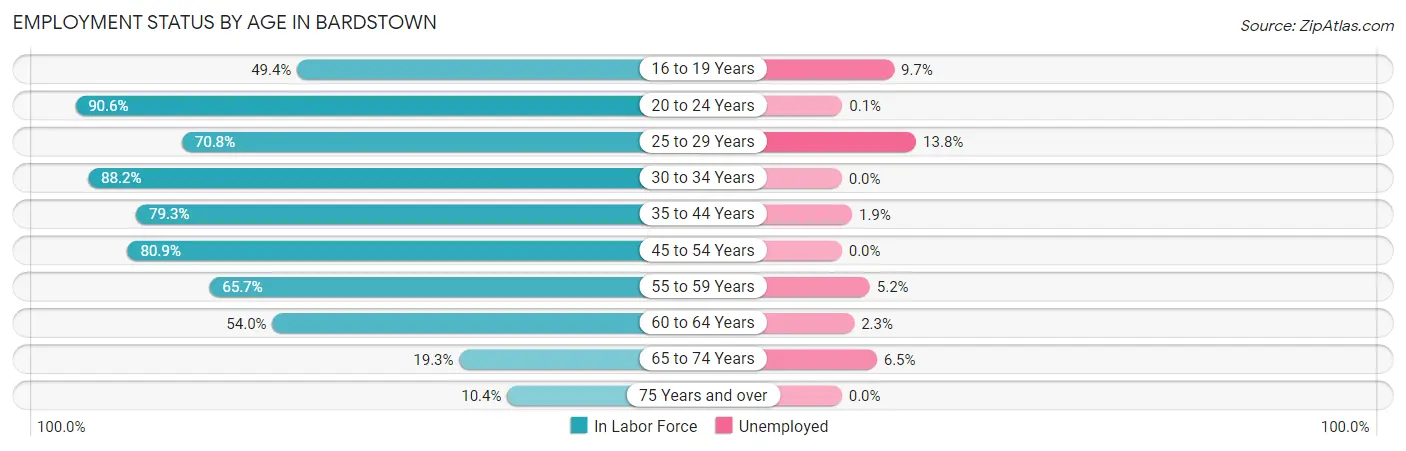
| Age Bracket | In Labor Force | Unemployed |
| 16 to 19 Years | 308 (49.4%) | 30 (9.7%) |
| 20 to 24 Years | 676 (90.6%) | 1 (0.1%) |
| 25 to 29 Years | 752 (70.8%) | 104 (13.8%) |
| 30 to 34 Years | 811 (88.2%) | 0 (0.0%) |
| 35 to 44 Years | 1,300 (79.3%) | 25 (1.9%) |
| 45 to 54 Years | 1,141 (80.9%) | 0 (0.0%) |
| 55 to 59 Years | 618 (65.7%) | 32 (5.2%) |
| 60 to 64 Years | 472 (54.0%) | 11 (2.3%) |
| 65 to 74 Years | 245 (19.3%) | 16 (6.5%) |
| 75 Years and over | 104 (10.4%) | 0 (0.0%) |
| Total | 6,429 (61.3%) | 219 (3.4%) |
Employment Status by Educational Attainment in Bardstown
According to labor force statistics for Bardstown, 74.4% of individuals (5,093) out of the total population between 25 and 64 years of age (6,845) are in the labor force, with 3.4% or 173 of them being unemployed. The group with the highest labor force participation rate are those with the educational attainment of bachelor's degree or higher, with 90.4% or 1,549 individuals in the labor force. Within the labor force, individuals with college / associate degree education have the highest percentage of unemployment, with 5.6% or 86 of them being unemployed.
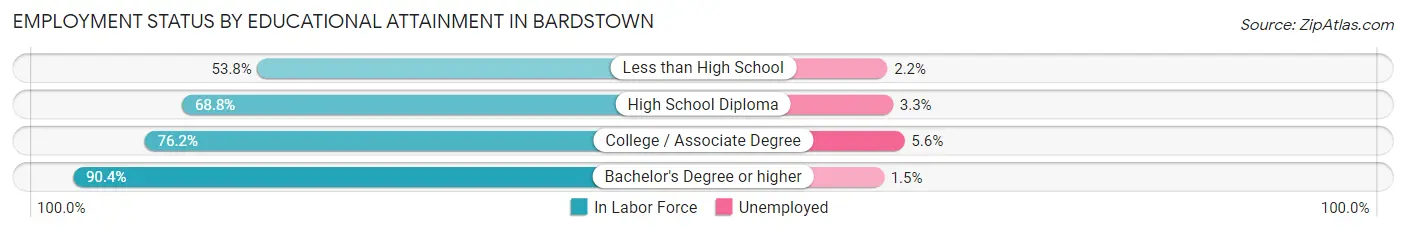
| Educational Attainment | In Labor Force | Unemployed |
| Less than High School | 491 (53.8%) | 20 (2.2%) |
| High School Diploma | 1,511 (68.8%) | 72 (3.3%) |
| College / Associate Degree | 1,541 (76.2%) | 113 (5.6%) |
| Bachelor's Degree or higher | 1,549 (90.4%) | 26 (1.5%) |
| Total | 5,093 (74.4%) | 233 (3.4%) |
Employment Occupations by Sex in Bardstown
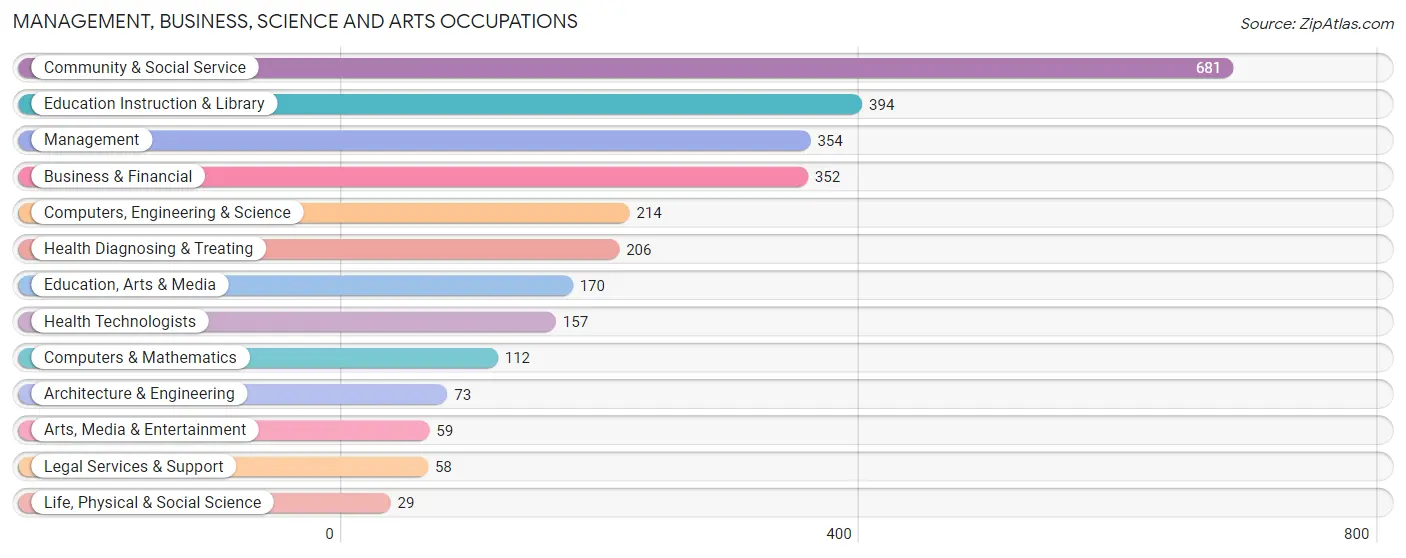
Management, Business, Science and Arts Occupations
The most common Management, Business, Science and Arts occupations in Bardstown are Community & Social Service (681 | 11.0%), Education Instruction & Library (394 | 6.4%), Management (354 | 5.7%), Business & Financial (352 | 5.7%), and Computers, Engineering & Science (214 | 3.5%).
Management, Business, Science and Arts Occupations by Sex
Within the Management, Business, Science and Arts occupations in Bardstown, the most male-oriented occupations are Legal Services & Support (84.5%), Architecture & Engineering (75.3%), and Computers & Mathematics (72.3%), while the most female-oriented occupations are Life, Physical & Social Science (100.0%), Health Technologists (93.0%), and Health Diagnosing & Treating (90.3%).
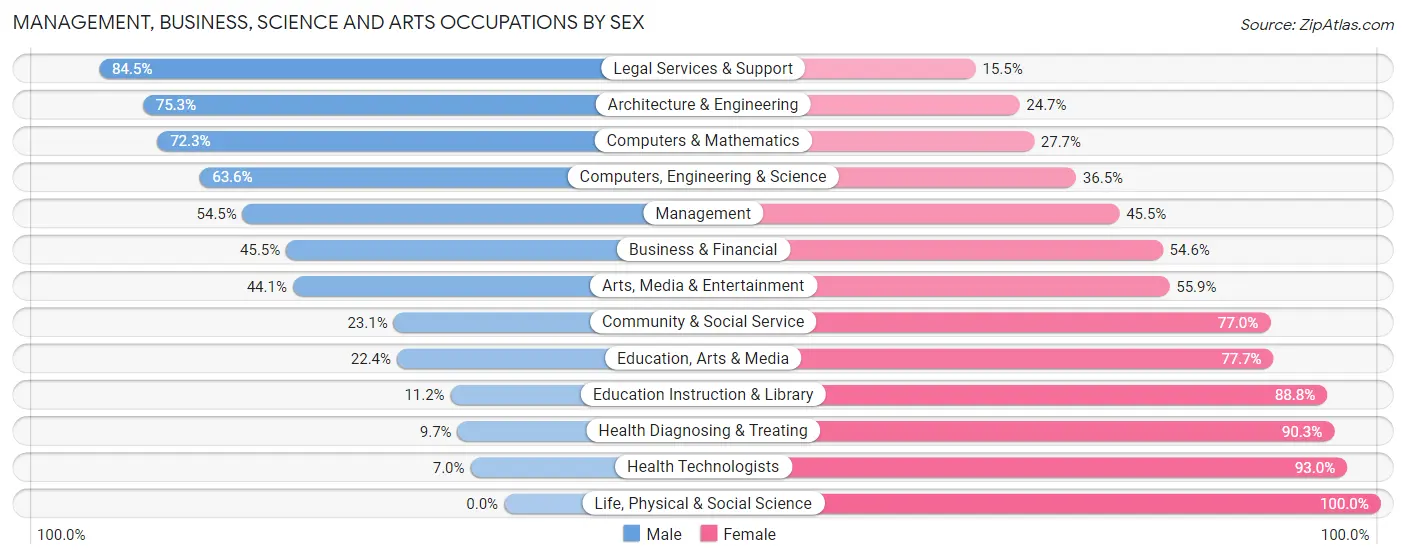
| Occupation | Male | Female |
| Management | 193 (54.5%) | 161 (45.5%) |
| Business & Financial | 160 (45.5%) | 192 (54.5%) |
| Computers, Engineering & Science | 136 (63.5%) | 78 (36.4%) |
| Computers & Mathematics | 81 (72.3%) | 31 (27.7%) |
| Architecture & Engineering | 55 (75.3%) | 18 (24.7%) |
| Life, Physical & Social Science | 0 (0.0%) | 29 (100.0%) |
| Community & Social Service | 157 (23.1%) | 524 (76.9%) |
| Education, Arts & Media | 38 (22.4%) | 132 (77.6%) |
| Legal Services & Support | 49 (84.5%) | 9 (15.5%) |
| Education Instruction & Library | 44 (11.2%) | 350 (88.8%) |
| Arts, Media & Entertainment | 26 (44.1%) | 33 (55.9%) |
| Health Diagnosing & Treating | 20 (9.7%) | 186 (90.3%) |
| Health Technologists | 11 (7.0%) | 146 (93.0%) |
| Total (Category) | 666 (36.9%) | 1,141 (63.1%) |
| Total (Overall) | 3,271 (52.7%) | 2,936 (47.3%) |
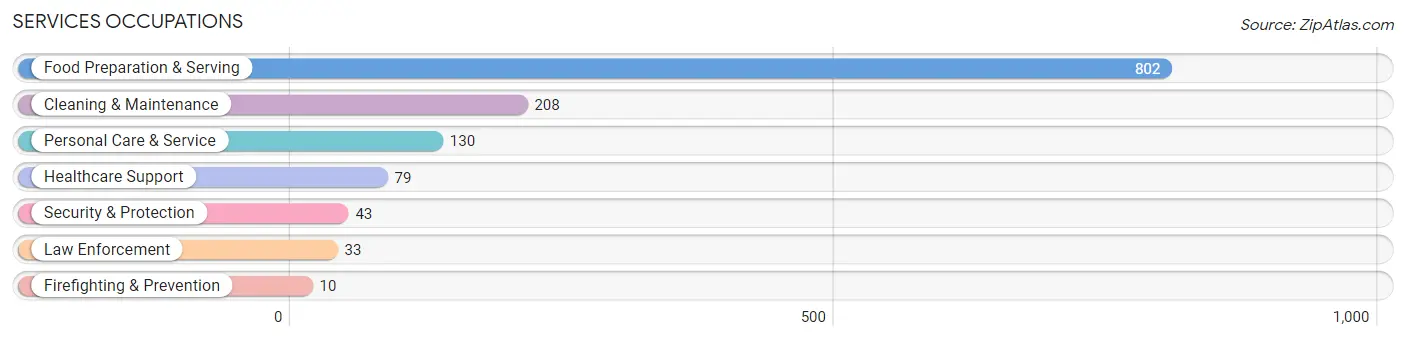
Services Occupations
The most common Services occupations in Bardstown are Food Preparation & Serving (802 | 12.9%), Cleaning & Maintenance (208 | 3.4%), Personal Care & Service (130 | 2.1%), Healthcare Support (79 | 1.3%), and Security & Protection (43 | 0.7%).
Services Occupations by Sex
Within the Services occupations in Bardstown, the most male-oriented occupations are Security & Protection (100.0%), Firefighting & Prevention (100.0%), and Law Enforcement (100.0%), while the most female-oriented occupations are Healthcare Support (100.0%), Personal Care & Service (100.0%), and Food Preparation & Serving (58.2%).
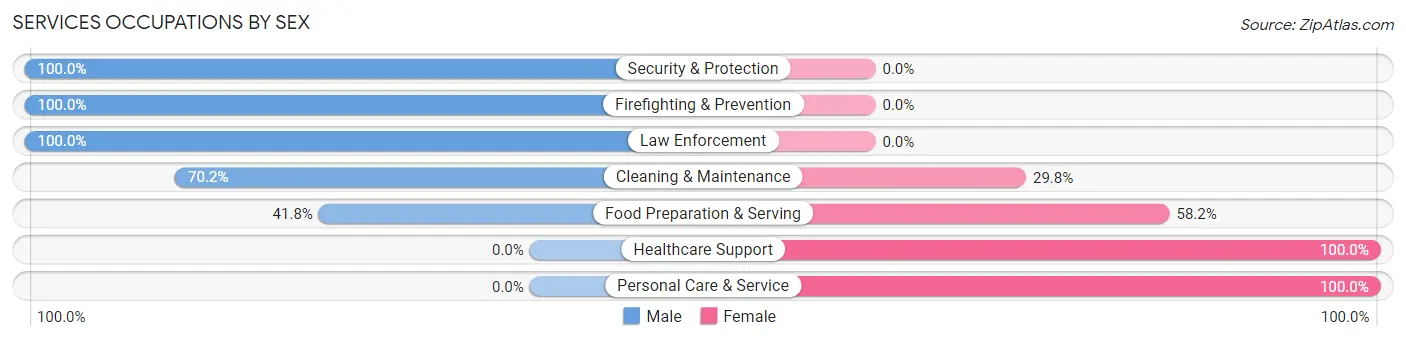
| Occupation | Male | Female |
| Healthcare Support | 0 (0.0%) | 79 (100.0%) |
| Security & Protection | 43 (100.0%) | 0 (0.0%) |
| Firefighting & Prevention | 10 (100.0%) | 0 (0.0%) |
| Law Enforcement | 33 (100.0%) | 0 (0.0%) |
| Food Preparation & Serving | 335 (41.8%) | 467 (58.2%) |
| Cleaning & Maintenance | 146 (70.2%) | 62 (29.8%) |
| Personal Care & Service | 0 (0.0%) | 130 (100.0%) |
| Total (Category) | 524 (41.5%) | 738 (58.5%) |
| Total (Overall) | 3,271 (52.7%) | 2,936 (47.3%) |
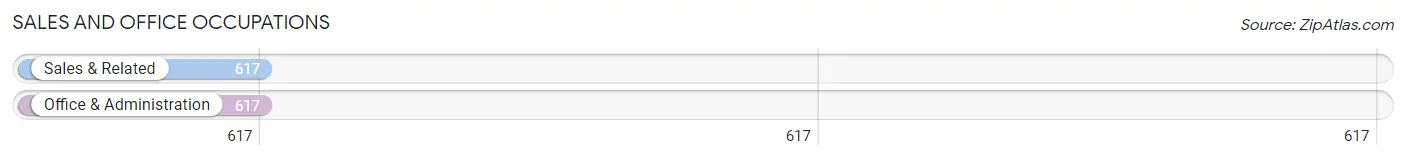
Sales and Office Occupations
The most common Sales and Office occupations in Bardstown are Sales & Related (617 | 9.9%), and Office & Administration (617 | 9.9%).
Sales and Office Occupations by Sex
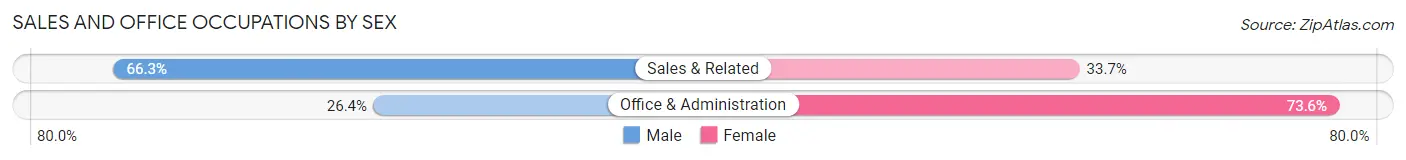
| Occupation | Male | Female |
| Sales & Related | 409 (66.3%) | 208 (33.7%) |
| Office & Administration | 163 (26.4%) | 454 (73.6%) |
| Total (Category) | 572 (46.4%) | 662 (53.6%) |
| Total (Overall) | 3,271 (52.7%) | 2,936 (47.3%) |
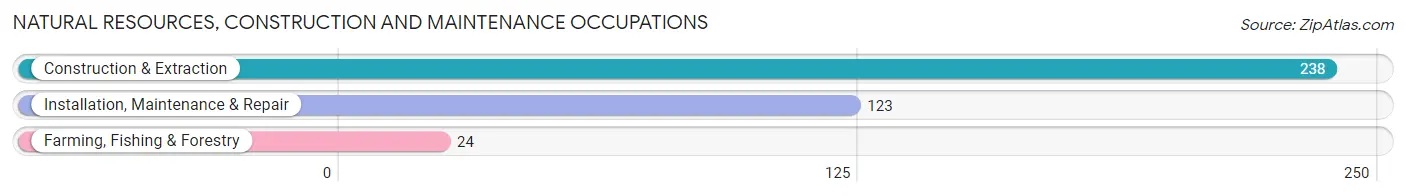
Natural Resources, Construction and Maintenance Occupations
The most common Natural Resources, Construction and Maintenance occupations in Bardstown are Construction & Extraction (238 | 3.8%), Installation, Maintenance & Repair (123 | 2.0%), and Farming, Fishing & Forestry (24 | 0.4%).
Natural Resources, Construction and Maintenance Occupations by Sex
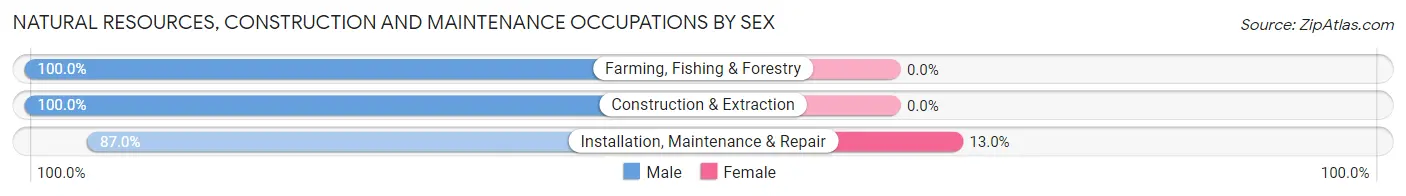
| Occupation | Male | Female |
| Farming, Fishing & Forestry | 24 (100.0%) | 0 (0.0%) |
| Construction & Extraction | 238 (100.0%) | 0 (0.0%) |
| Installation, Maintenance & Repair | 107 (87.0%) | 16 (13.0%) |
| Total (Category) | 369 (95.8%) | 16 (4.2%) |
| Total (Overall) | 3,271 (52.7%) | 2,936 (47.3%) |
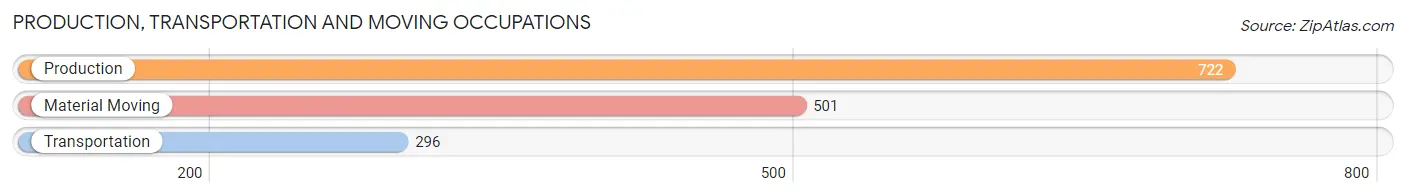
Production, Transportation and Moving Occupations
The most common Production, Transportation and Moving occupations in Bardstown are Production (722 | 11.6%), Material Moving (501 | 8.1%), and Transportation (296 | 4.8%).
Production, Transportation and Moving Occupations by Sex
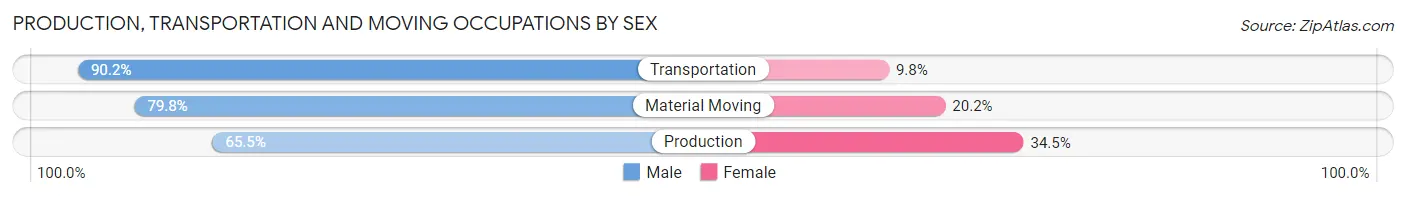
| Occupation | Male | Female |
| Production | 473 (65.5%) | 249 (34.5%) |
| Transportation | 267 (90.2%) | 29 (9.8%) |
| Material Moving | 400 (79.8%) | 101 (20.2%) |
| Total (Category) | 1,140 (75.0%) | 379 (24.9%) |
| Total (Overall) | 3,271 (52.7%) | 2,936 (47.3%) |
Employment Industries by Sex in Bardstown
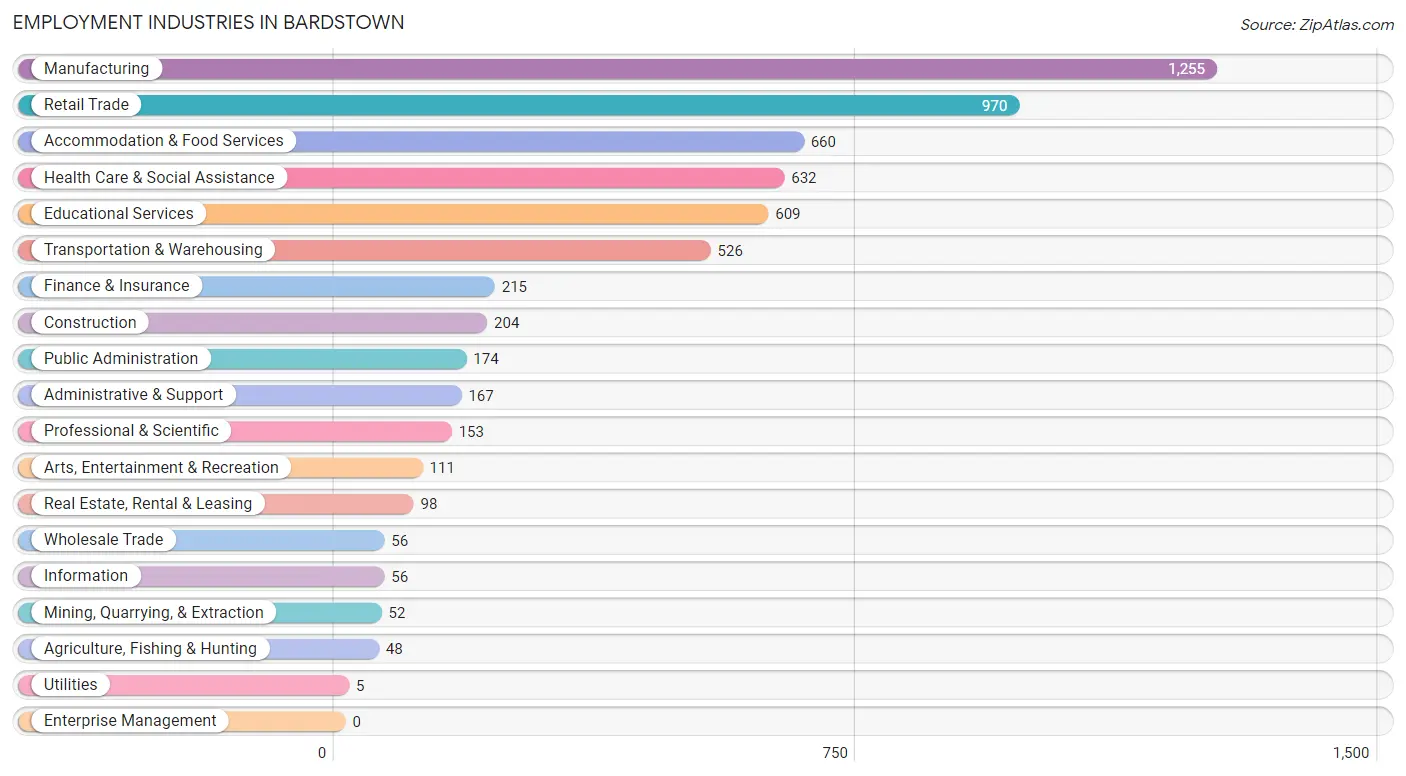
Employment Industries in Bardstown
The major employment industries in Bardstown include Manufacturing (1,255 | 20.2%), Retail Trade (970 | 15.6%), Accommodation & Food Services (660 | 10.6%), Health Care & Social Assistance (632 | 10.2%), and Educational Services (609 | 9.8%).
Employment Industries by Sex in Bardstown
The Bardstown industries that see more men than women are Agriculture, Fishing & Hunting (100.0%), Mining, Quarrying, & Extraction (100.0%), and Real Estate, Rental & Leasing (100.0%), whereas the industries that tend to have a higher number of women are Utilities (100.0%), Information (100.0%), and Health Care & Social Assistance (92.7%).
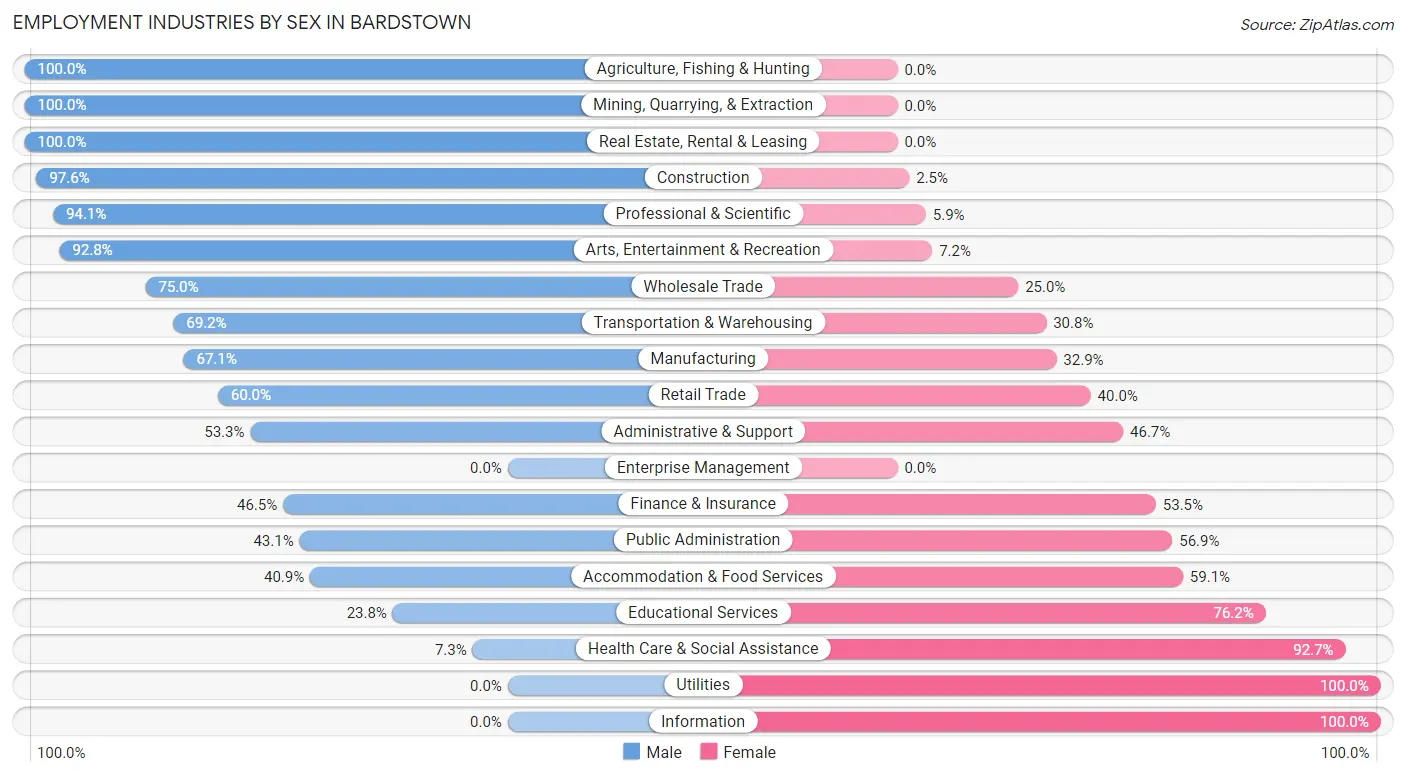
| Industry | Male | Female |
| Agriculture, Fishing & Hunting | 48 (100.0%) | 0 (0.0%) |
| Mining, Quarrying, & Extraction | 52 (100.0%) | 0 (0.0%) |
| Construction | 199 (97.6%) | 5 (2.5%) |
| Manufacturing | 842 (67.1%) | 413 (32.9%) |
| Wholesale Trade | 42 (75.0%) | 14 (25.0%) |
| Retail Trade | 582 (60.0%) | 388 (40.0%) |
| Transportation & Warehousing | 364 (69.2%) | 162 (30.8%) |
| Utilities | 0 (0.0%) | 5 (100.0%) |
| Information | 0 (0.0%) | 56 (100.0%) |
| Finance & Insurance | 100 (46.5%) | 115 (53.5%) |
| Real Estate, Rental & Leasing | 98 (100.0%) | 0 (0.0%) |
| Professional & Scientific | 144 (94.1%) | 9 (5.9%) |
| Enterprise Management | 0 (0.0%) | 0 (0.0%) |
| Administrative & Support | 89 (53.3%) | 78 (46.7%) |
| Educational Services | 145 (23.8%) | 464 (76.2%) |
| Health Care & Social Assistance | 46 (7.3%) | 586 (92.7%) |
| Arts, Entertainment & Recreation | 103 (92.8%) | 8 (7.2%) |
| Accommodation & Food Services | 270 (40.9%) | 390 (59.1%) |
| Public Administration | 75 (43.1%) | 99 (56.9%) |
| Total | 3,271 (52.7%) | 2,936 (47.3%) |
Education in Bardstown
School Enrollment in Bardstown
The most common levels of schooling among the 3,042 students in Bardstown are nursery / preschool (687 | 22.6%), elementary school (639 | 21.0%), and high school (536 | 17.6%).
| School Level | # Students | % Students |
| Nursery / Preschool | 687 | 22.6% |
| Kindergarten | 213 | 7.0% |
| Elementary School | 639 | 21.0% |
| Middle School | 497 | 16.3% |
| High School | 536 | 17.6% |
| College / Undergraduate | 443 | 14.6% |
| Graduate / Professional | 27 | 0.9% |
| Total | 3,042 | 100.0% |
School Enrollment by Age by Funding Source in Bardstown
Out of a total of 3,042 students who are enrolled in schools in Bardstown, 475 (15.6%) attend a private institution, while the remaining 2,567 (84.4%) are enrolled in public schools. The age group of 35 years and over has the highest likelihood of being enrolled in private schools, with 28 (40.0% in the age bracket) enrolled. Conversely, the age group of 25 to 34 year olds has the lowest likelihood of being enrolled in a private school, with 130 (100.0% in the age bracket) attending a public institution.
| Age Bracket | Public School | Private School |
| 3 to 4 Year Olds | 419 (84.1%) | 79 (15.9%) |
| 5 to 9 Year Old | 784 (84.3%) | 146 (15.7%) |
| 10 to 14 Year Olds | 602 (83.5%) | 119 (16.5%) |
| 15 to 17 Year Olds | 337 (81.6%) | 76 (18.4%) |
| 18 to 19 Year Olds | 95 (94.1%) | 6 (5.9%) |
| 20 to 24 Year Olds | 157 (87.7%) | 22 (12.3%) |
| 25 to 34 Year Olds | 130 (100.0%) | 0 (0.0%) |
| 35 Years and over | 42 (60.0%) | 28 (40.0%) |
| Total | 2,567 (84.4%) | 475 (15.6%) |
Educational Attainment by Field of Study in Bardstown
Business (685 | 29.1%), education (275 | 11.7%), science & technology (245 | 10.4%), arts & humanities (150 | 6.4%), and communications (137 | 5.8%) are the most common fields of study among 2,350 individuals in Bardstown who have obtained a bachelor's degree or higher.
| Field of Study | # Graduates | % Graduates |
| Computers & Mathematics | 114 | 4.9% |
| Bio, Nature & Agricultural | 113 | 4.8% |
| Physical & Health Sciences | 26 | 1.1% |
| Psychology | 120 | 5.1% |
| Social Sciences | 125 | 5.3% |
| Engineering | 60 | 2.5% |
| Multidisciplinary Studies | 19 | 0.8% |
| Science & Technology | 245 | 10.4% |
| Business | 685 | 29.1% |
| Education | 275 | 11.7% |
| Literature & Languages | 116 | 4.9% |
| Liberal Arts & History | 131 | 5.6% |
| Visual & Performing Arts | 34 | 1.5% |
| Communications | 137 | 5.8% |
| Arts & Humanities | 150 | 6.4% |
| Total | 2,350 | 100.0% |
Transportation & Commute in Bardstown
Vehicle Availability by Sex in Bardstown
The most prevalent vehicle ownership categories in Bardstown are males with 2 vehicles (1,259, accounting for 38.5%) and females with 2 vehicles (1,117, making up 43.3%).
| Vehicles Available | Male | Female |
| No Vehicle | 36 (1.1%) | 14 (0.5%) |
| 1 Vehicle | 837 (25.6%) | 972 (33.4%) |
| 2 Vehicles | 1,259 (38.5%) | 1,117 (38.4%) |
| 3 Vehicles | 815 (24.9%) | 497 (17.1%) |
| 4 Vehicles | 272 (8.3%) | 289 (9.9%) |
| 5 or more Vehicles | 49 (1.5%) | 21 (0.7%) |
| Total | 3,268 (100.0%) | 2,910 (100.0%) |
Commute Time in Bardstown
The most frequently occuring commute durations in Bardstown are 5 to 9 minutes (1,889 commuters, 31.6%), 10 to 14 minutes (1,086 commuters, 18.1%), and 15 to 19 minutes (559 commuters, 9.3%).
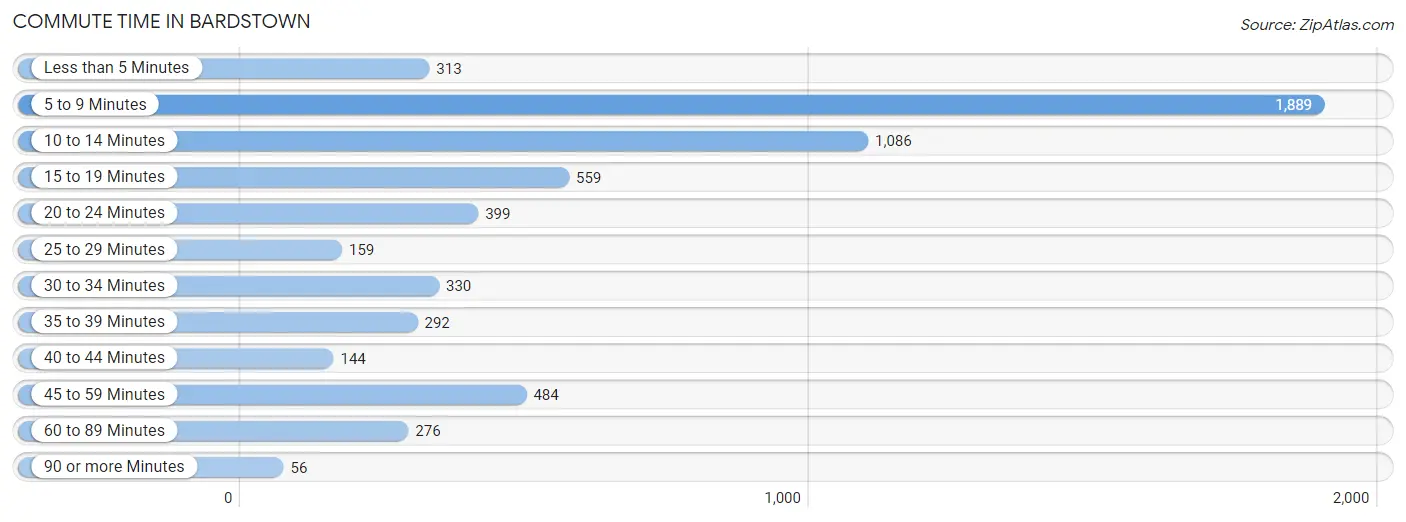
| Commute Time | # Commuters | % Commuters |
| Less than 5 Minutes | 313 | 5.2% |
| 5 to 9 Minutes | 1,889 | 31.6% |
| 10 to 14 Minutes | 1,086 | 18.1% |
| 15 to 19 Minutes | 559 | 9.3% |
| 20 to 24 Minutes | 399 | 6.7% |
| 25 to 29 Minutes | 159 | 2.7% |
| 30 to 34 Minutes | 330 | 5.5% |
| 35 to 39 Minutes | 292 | 4.9% |
| 40 to 44 Minutes | 144 | 2.4% |
| 45 to 59 Minutes | 484 | 8.1% |
| 60 to 89 Minutes | 276 | 4.6% |
| 90 or more Minutes | 56 | 0.9% |
Commute Time by Sex in Bardstown
The most common commute times in Bardstown are 5 to 9 minutes (1,233 commuters, 39.0%) for males and 10 to 14 minutes (778 commuters, 27.5%) for females.
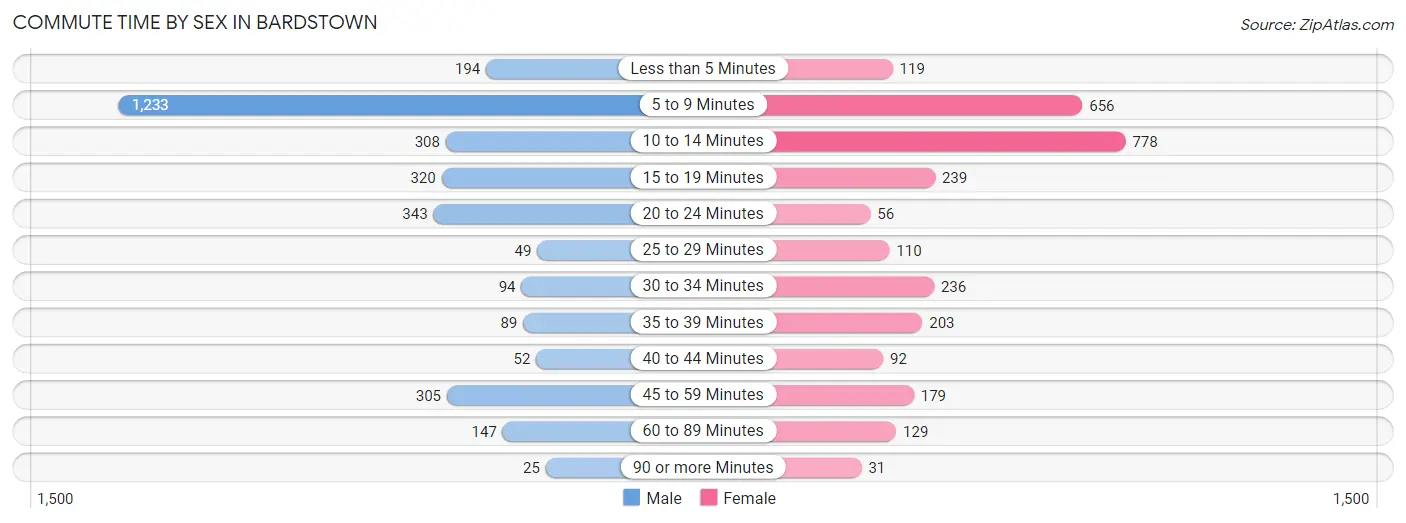
| Commute Time | Male | Female |
| Less than 5 Minutes | 194 (6.1%) | 119 (4.2%) |
| 5 to 9 Minutes | 1,233 (39.0%) | 656 (23.2%) |
| 10 to 14 Minutes | 308 (9.8%) | 778 (27.5%) |
| 15 to 19 Minutes | 320 (10.1%) | 239 (8.5%) |
| 20 to 24 Minutes | 343 (10.9%) | 56 (2.0%) |
| 25 to 29 Minutes | 49 (1.5%) | 110 (3.9%) |
| 30 to 34 Minutes | 94 (3.0%) | 236 (8.4%) |
| 35 to 39 Minutes | 89 (2.8%) | 203 (7.2%) |
| 40 to 44 Minutes | 52 (1.7%) | 92 (3.3%) |
| 45 to 59 Minutes | 305 (9.7%) | 179 (6.3%) |
| 60 to 89 Minutes | 147 (4.6%) | 129 (4.6%) |
| 90 or more Minutes | 25 (0.8%) | 31 (1.1%) |
Time of Departure to Work by Sex in Bardstown
The most frequent times of departure to work in Bardstown are 7:30 AM to 7:59 AM (523, 16.6%) for males and 7:30 AM to 7:59 AM (655, 23.2%) for females.
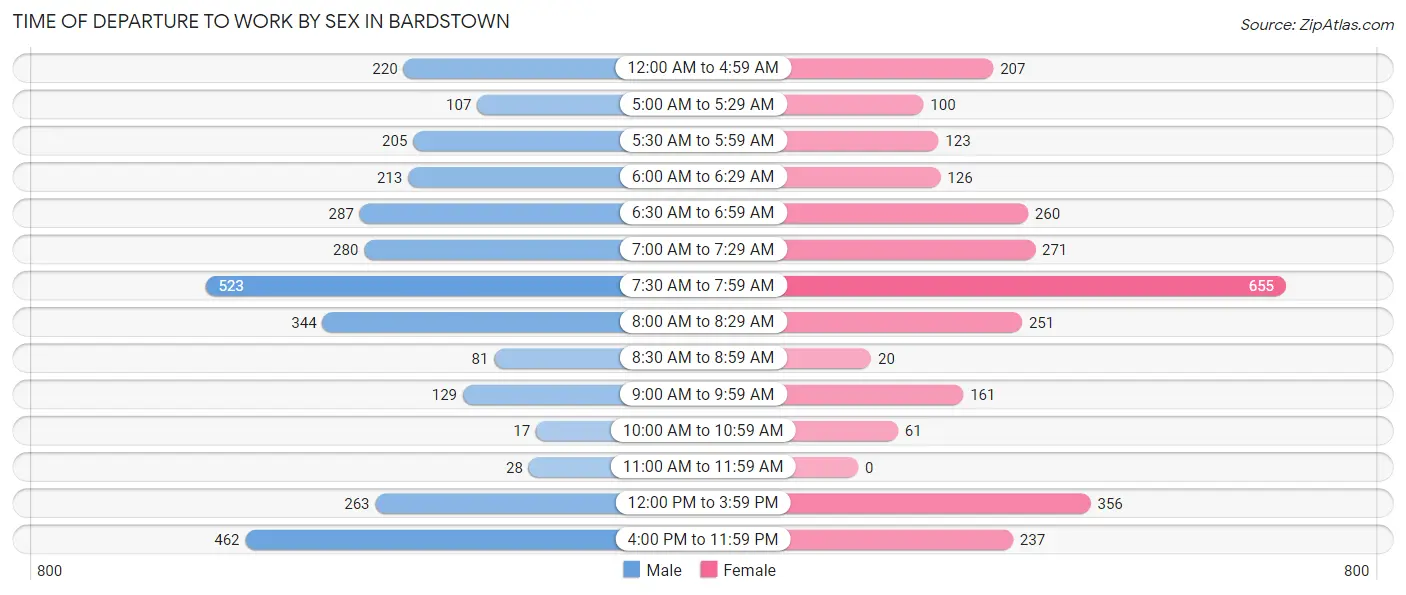
| Time of Departure | Male | Female |
| 12:00 AM to 4:59 AM | 220 (7.0%) | 207 (7.3%) |
| 5:00 AM to 5:29 AM | 107 (3.4%) | 100 (3.5%) |
| 5:30 AM to 5:59 AM | 205 (6.5%) | 123 (4.3%) |
| 6:00 AM to 6:29 AM | 213 (6.7%) | 126 (4.5%) |
| 6:30 AM to 6:59 AM | 287 (9.1%) | 260 (9.2%) |
| 7:00 AM to 7:29 AM | 280 (8.9%) | 271 (9.6%) |
| 7:30 AM to 7:59 AM | 523 (16.6%) | 655 (23.2%) |
| 8:00 AM to 8:29 AM | 344 (10.9%) | 251 (8.9%) |
| 8:30 AM to 8:59 AM | 81 (2.6%) | 20 (0.7%) |
| 9:00 AM to 9:59 AM | 129 (4.1%) | 161 (5.7%) |
| 10:00 AM to 10:59 AM | 17 (0.5%) | 61 (2.2%) |
| 11:00 AM to 11:59 AM | 28 (0.9%) | 0 (0.0%) |
| 12:00 PM to 3:59 PM | 263 (8.3%) | 356 (12.6%) |
| 4:00 PM to 11:59 PM | 462 (14.6%) | 237 (8.4%) |
| Total | 3,159 (100.0%) | 2,828 (100.0%) |
Housing Occupancy in Bardstown
Occupancy by Ownership in Bardstown
Of the total 5,566 dwellings in Bardstown, owner-occupied units account for 3,076 (55.3%), while renter-occupied units make up 2,490 (44.7%).
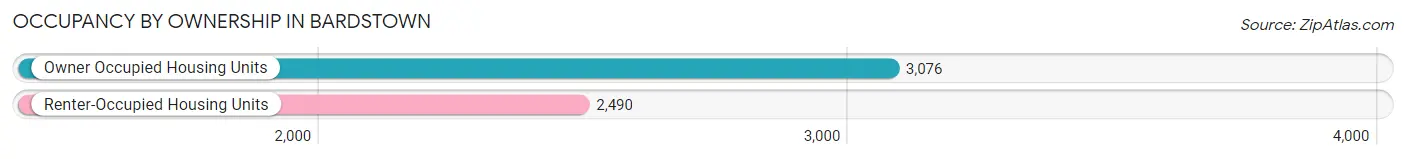
| Occupancy | # Housing Units | % Housing Units |
| Owner Occupied Housing Units | 3,076 | 55.3% |
| Renter-Occupied Housing Units | 2,490 | 44.7% |
| Total Occupied Housing Units | 5,566 | 100.0% |
Occupancy by Household Size in Bardstown
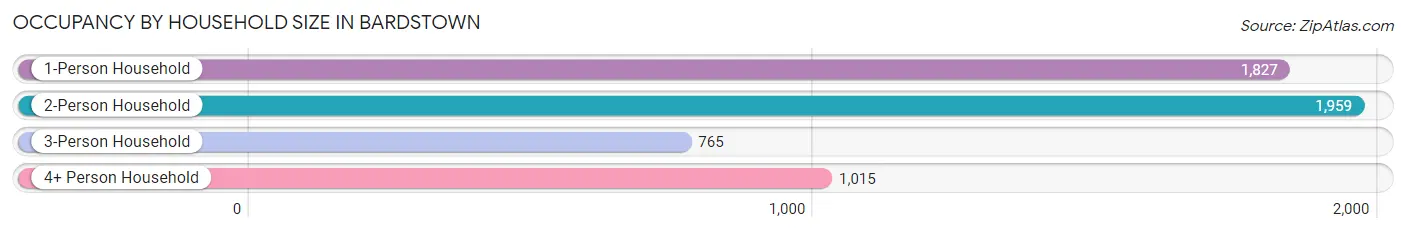
| Household Size | # Housing Units | % Housing Units |
| 1-Person Household | 1,827 | 32.8% |
| 2-Person Household | 1,959 | 35.2% |
| 3-Person Household | 765 | 13.7% |
| 4+ Person Household | 1,015 | 18.2% |
| Total Housing Units | 5,566 | 100.0% |
Occupancy by Ownership by Household Size in Bardstown
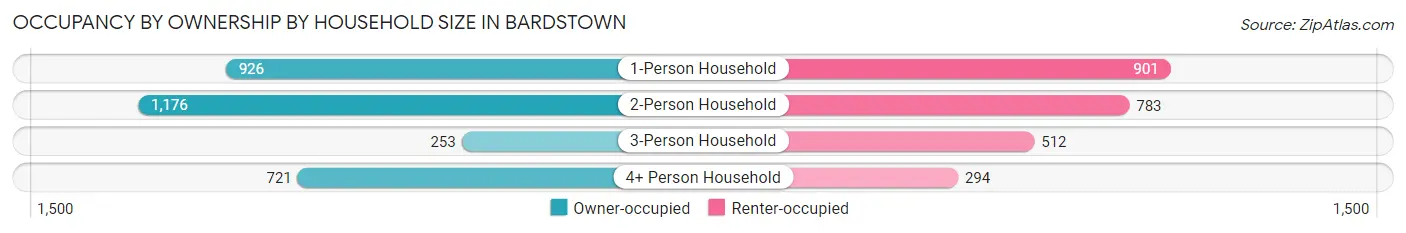
| Household Size | Owner-occupied | Renter-occupied |
| 1-Person Household | 926 (50.7%) | 901 (49.3%) |
| 2-Person Household | 1,176 (60.0%) | 783 (40.0%) |
| 3-Person Household | 253 (33.1%) | 512 (66.9%) |
| 4+ Person Household | 721 (71.0%) | 294 (29.0%) |
| Total Housing Units | 3,076 (55.3%) | 2,490 (44.7%) |
Occupancy by Educational Attainment in Bardstown
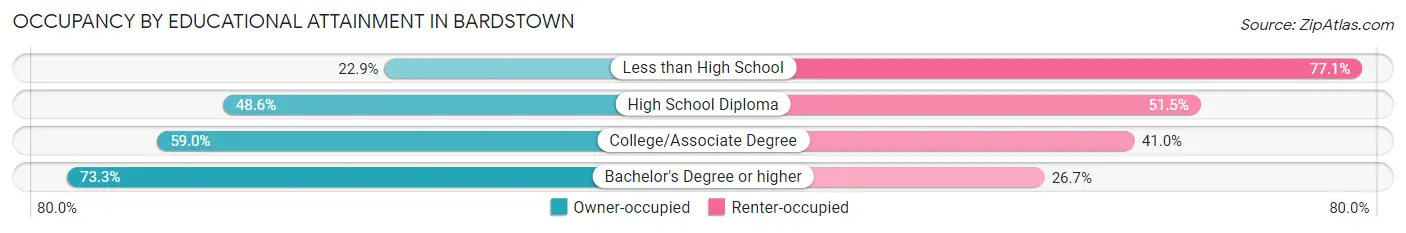
| Household Size | Owner-occupied | Renter-occupied |
| Less than High School | 105 (22.9%) | 353 (77.1%) |
| High School Diploma | 1,073 (48.5%) | 1,137 (51.4%) |
| College/Associate Degree | 928 (59.0%) | 646 (41.0%) |
| Bachelor's Degree or higher | 970 (73.3%) | 354 (26.7%) |
Occupancy by Age of Householder in Bardstown
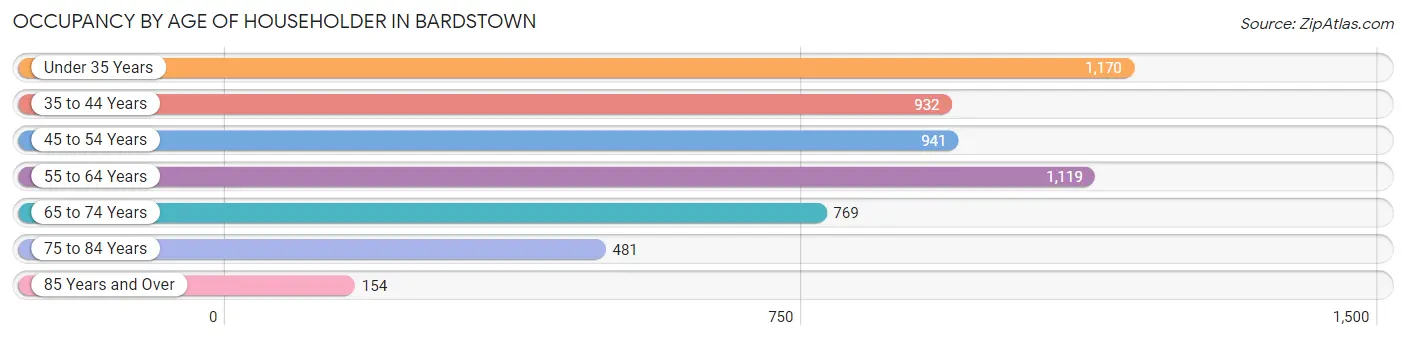
| Age Bracket | # Households | % Households |
| Under 35 Years | 1,170 | 21.0% |
| 35 to 44 Years | 932 | 16.7% |
| 45 to 54 Years | 941 | 16.9% |
| 55 to 64 Years | 1,119 | 20.1% |
| 65 to 74 Years | 769 | 13.8% |
| 75 to 84 Years | 481 | 8.6% |
| 85 Years and Over | 154 | 2.8% |
| Total | 5,566 | 100.0% |
Housing Finances in Bardstown
Median Income by Occupancy in Bardstown
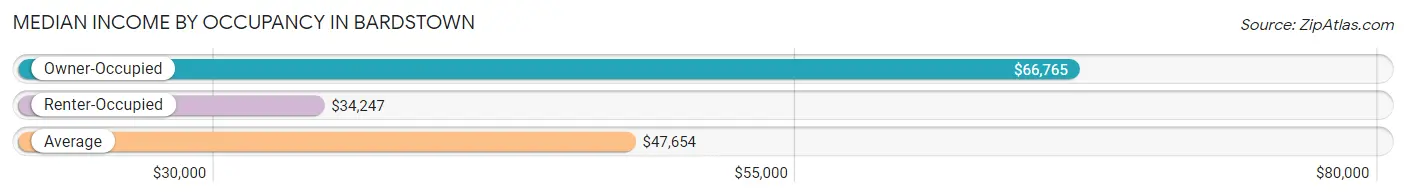
| Occupancy Type | # Households | Median Income |
| Owner-Occupied | 3,076 (55.3%) | $66,765 |
| Renter-Occupied | 2,490 (44.7%) | $34,247 |
| Average | 5,566 (100.0%) | $47,654 |
Occupancy by Householder Income Bracket in Bardstown
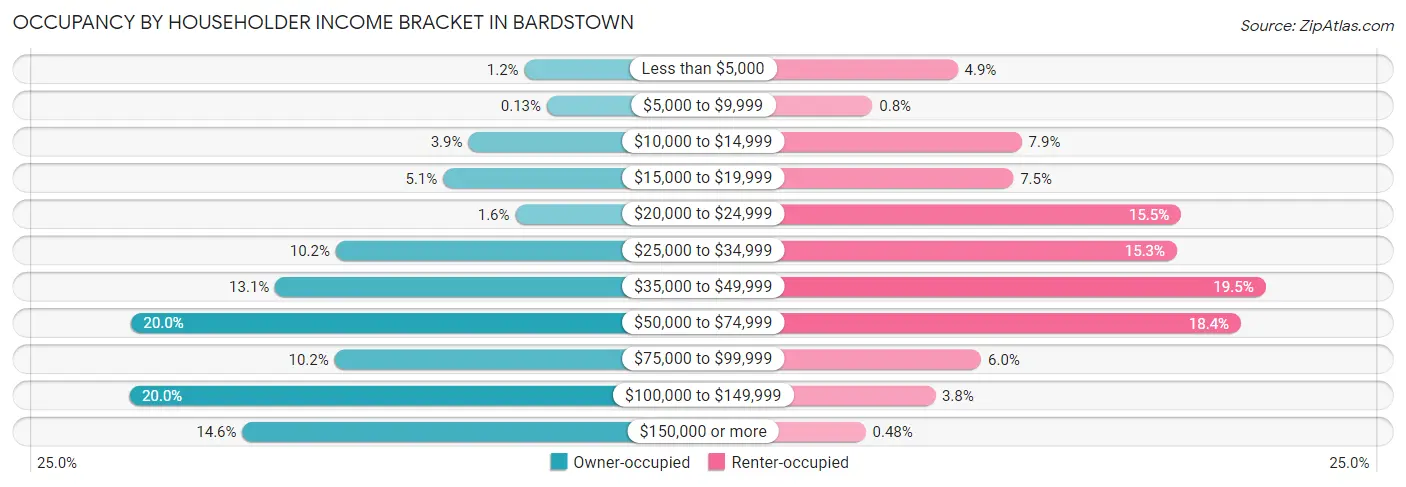
| Income Bracket | Owner-occupied | Renter-occupied |
| Less than $5,000 | 37 (1.2%) | 121 (4.9%) |
| $5,000 to $9,999 | 4 (0.1%) | 20 (0.8%) |
| $10,000 to $14,999 | 119 (3.9%) | 197 (7.9%) |
| $15,000 to $19,999 | 156 (5.1%) | 187 (7.5%) |
| $20,000 to $24,999 | 50 (1.6%) | 386 (15.5%) |
| $25,000 to $34,999 | 313 (10.2%) | 381 (15.3%) |
| $35,000 to $49,999 | 402 (13.1%) | 486 (19.5%) |
| $50,000 to $74,999 | 614 (20.0%) | 457 (18.3%) |
| $75,000 to $99,999 | 315 (10.2%) | 149 (6.0%) |
| $100,000 to $149,999 | 616 (20.0%) | 94 (3.8%) |
| $150,000 or more | 450 (14.6%) | 12 (0.5%) |
| Total | 3,076 (100.0%) | 2,490 (100.0%) |
Monthly Housing Cost Tiers in Bardstown
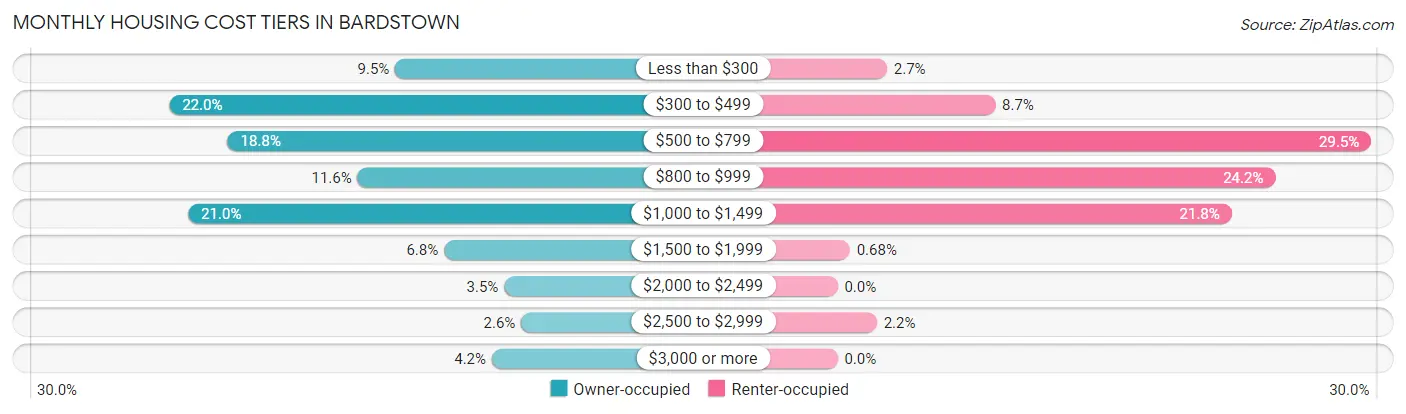
| Monthly Cost | Owner-occupied | Renter-occupied |
| Less than $300 | 293 (9.5%) | 68 (2.7%) |
| $300 to $499 | 677 (22.0%) | 217 (8.7%) |
| $500 to $799 | 578 (18.8%) | 734 (29.5%) |
| $800 to $999 | 357 (11.6%) | 602 (24.2%) |
| $1,000 to $1,499 | 645 (21.0%) | 542 (21.8%) |
| $1,500 to $1,999 | 210 (6.8%) | 17 (0.7%) |
| $2,000 to $2,499 | 108 (3.5%) | 0 (0.0%) |
| $2,500 to $2,999 | 79 (2.6%) | 54 (2.2%) |
| $3,000 or more | 129 (4.2%) | 0 (0.0%) |
| Total | 3,076 (100.0%) | 2,490 (100.0%) |
Physical Housing Characteristics in Bardstown
Housing Structures in Bardstown
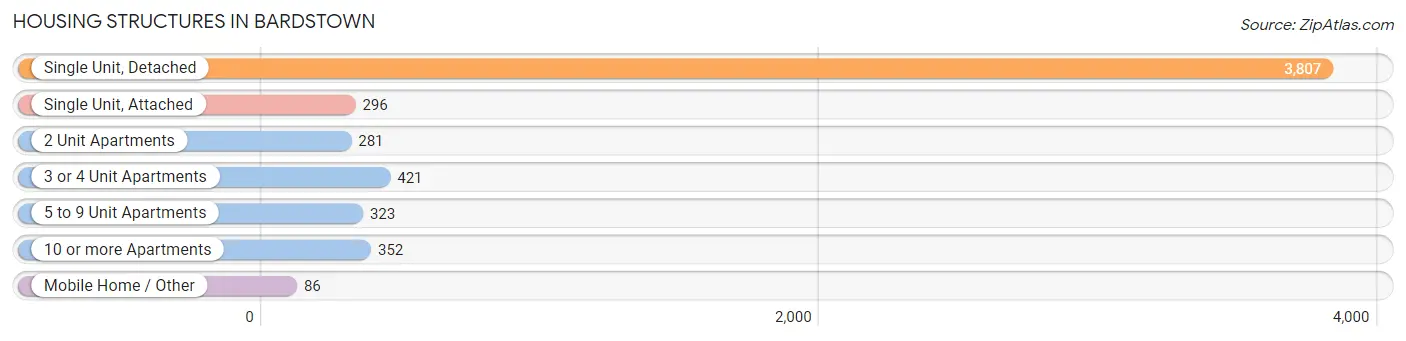
| Structure Type | # Housing Units | % Housing Units |
| Single Unit, Detached | 3,807 | 68.4% |
| Single Unit, Attached | 296 | 5.3% |
| 2 Unit Apartments | 281 | 5.1% |
| 3 or 4 Unit Apartments | 421 | 7.6% |
| 5 to 9 Unit Apartments | 323 | 5.8% |
| 10 or more Apartments | 352 | 6.3% |
| Mobile Home / Other | 86 | 1.5% |
| Total | 5,566 | 100.0% |
Housing Structures by Occupancy in Bardstown
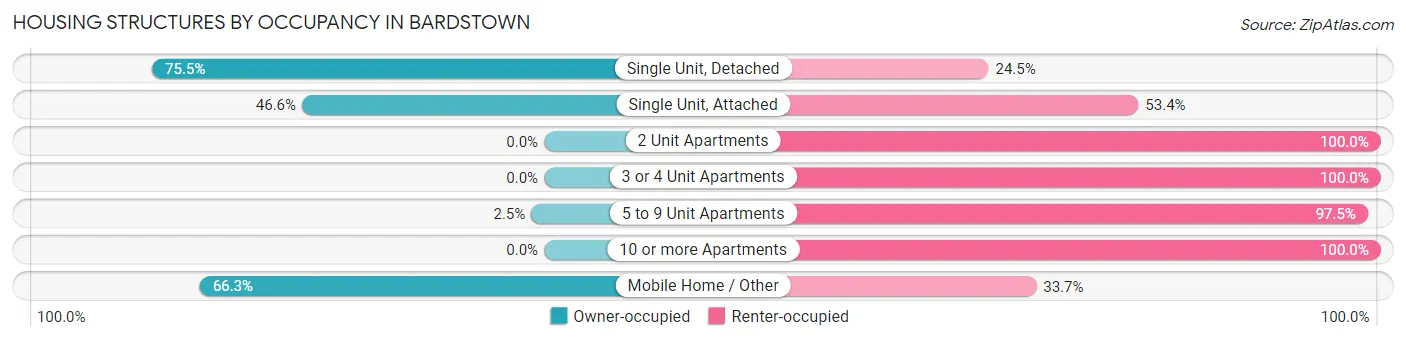
| Structure Type | Owner-occupied | Renter-occupied |
| Single Unit, Detached | 2,873 (75.5%) | 934 (24.5%) |
| Single Unit, Attached | 138 (46.6%) | 158 (53.4%) |
| 2 Unit Apartments | 0 (0.0%) | 281 (100.0%) |
| 3 or 4 Unit Apartments | 0 (0.0%) | 421 (100.0%) |
| 5 to 9 Unit Apartments | 8 (2.5%) | 315 (97.5%) |
| 10 or more Apartments | 0 (0.0%) | 352 (100.0%) |
| Mobile Home / Other | 57 (66.3%) | 29 (33.7%) |
| Total | 3,076 (55.3%) | 2,490 (44.7%) |
Housing Structures by Number of Rooms in Bardstown
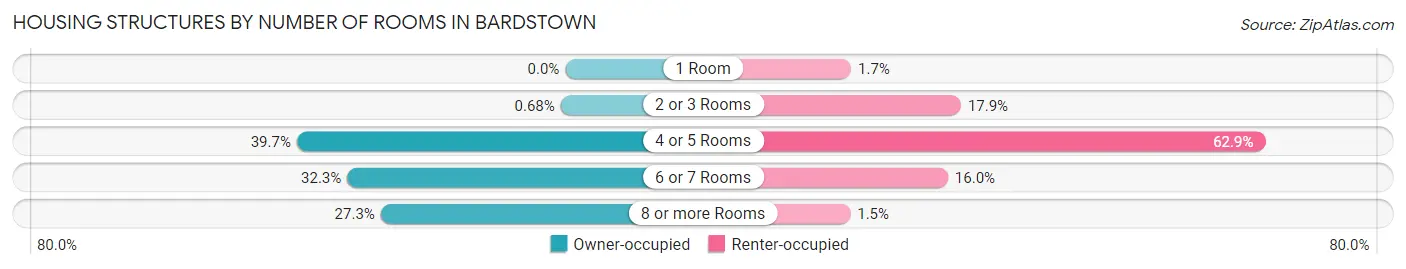
| Number of Rooms | Owner-occupied | Renter-occupied |
| 1 Room | 0 (0.0%) | 41 (1.7%) |
| 2 or 3 Rooms | 21 (0.7%) | 446 (17.9%) |
| 4 or 5 Rooms | 1,222 (39.7%) | 1,567 (62.9%) |
| 6 or 7 Rooms | 993 (32.3%) | 398 (16.0%) |
| 8 or more Rooms | 840 (27.3%) | 38 (1.5%) |
| Total | 3,076 (100.0%) | 2,490 (100.0%) |
Housing Structure by Heating Type in Bardstown
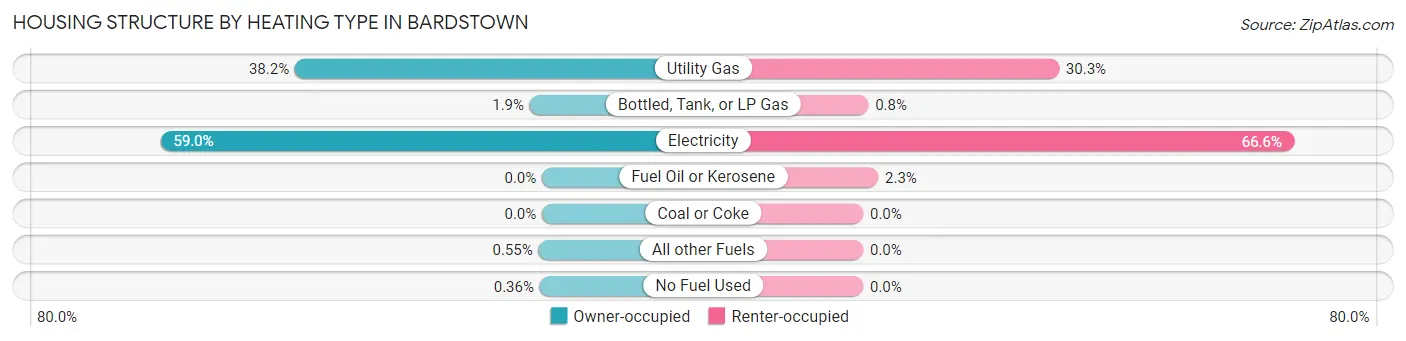
| Heating Type | Owner-occupied | Renter-occupied |
| Utility Gas | 1,175 (38.2%) | 754 (30.3%) |
| Bottled, Tank, or LP Gas | 58 (1.9%) | 20 (0.8%) |
| Electricity | 1,815 (59.0%) | 1,658 (66.6%) |
| Fuel Oil or Kerosene | 0 (0.0%) | 58 (2.3%) |
| Coal or Coke | 0 (0.0%) | 0 (0.0%) |
| All other Fuels | 17 (0.5%) | 0 (0.0%) |
| No Fuel Used | 11 (0.4%) | 0 (0.0%) |
| Total | 3,076 (100.0%) | 2,490 (100.0%) |
Household Vehicle Usage in Bardstown
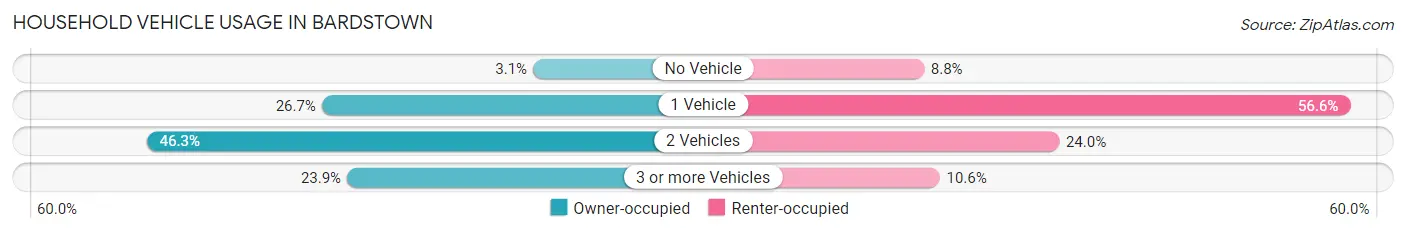
| Vehicles per Household | Owner-occupied | Renter-occupied |
| No Vehicle | 94 (3.1%) | 220 (8.8%) |
| 1 Vehicle | 822 (26.7%) | 1,409 (56.6%) |
| 2 Vehicles | 1,425 (46.3%) | 597 (24.0%) |
| 3 or more Vehicles | 735 (23.9%) | 264 (10.6%) |
| Total | 3,076 (100.0%) | 2,490 (100.0%) |
Real Estate & Mortgages in Bardstown
Real Estate and Mortgage Overview in Bardstown
| Characteristic | Without Mortgage | With Mortgage |
| Housing Units | 1,306 | 1,770 |
| Median Property Value | $174,200 | $172,300 |
| Median Household Income | $48,000 | $348 |
| Monthly Housing Costs | $432 | $129 |
| Real Estate Taxes | $1,467 | $33 |
Property Value by Mortgage Status in Bardstown
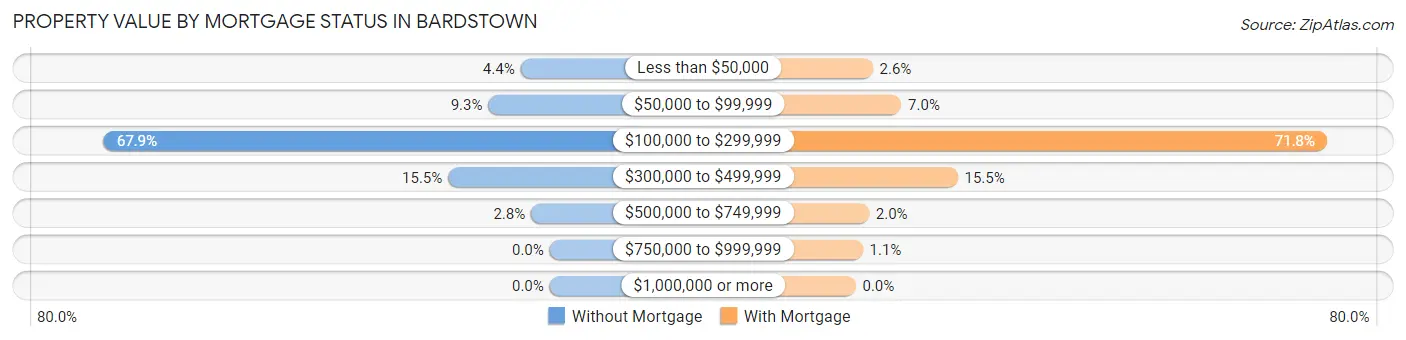
| Property Value | Without Mortgage | With Mortgage |
| Less than $50,000 | 58 (4.4%) | 46 (2.6%) |
| $50,000 to $99,999 | 122 (9.3%) | 123 (7.0%) |
| $100,000 to $299,999 | 887 (67.9%) | 1,271 (71.8%) |
| $300,000 to $499,999 | 202 (15.5%) | 275 (15.5%) |
| $500,000 to $749,999 | 37 (2.8%) | 36 (2.0%) |
| $750,000 to $999,999 | 0 (0.0%) | 19 (1.1%) |
| $1,000,000 or more | 0 (0.0%) | 0 (0.0%) |
| Total | 1,306 (100.0%) | 1,770 (100.0%) |
Household Income by Mortgage Status in Bardstown
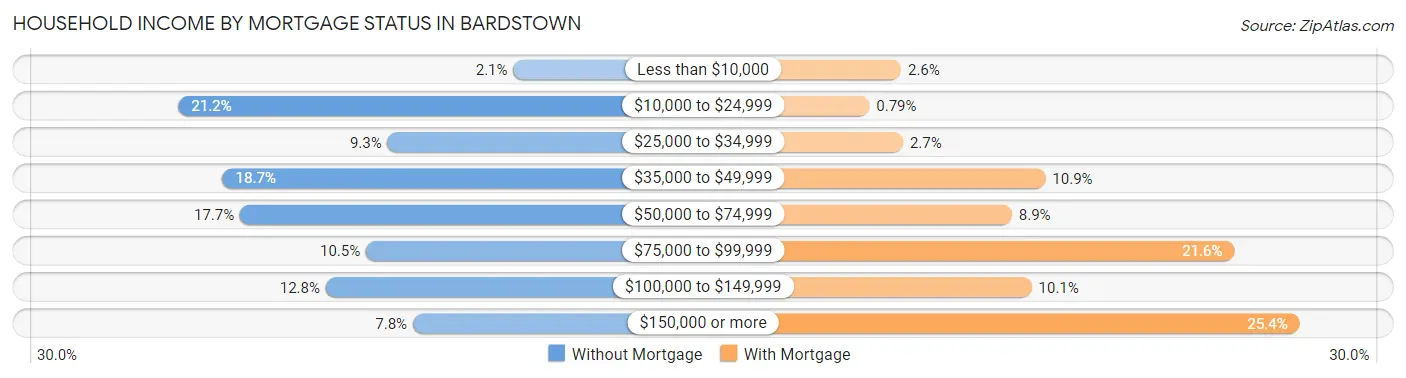
| Household Income | Without Mortgage | With Mortgage |
| Less than $10,000 | 27 (2.1%) | 46 (2.6%) |
| $10,000 to $24,999 | 277 (21.2%) | 14 (0.8%) |
| $25,000 to $34,999 | 121 (9.3%) | 48 (2.7%) |
| $35,000 to $49,999 | 244 (18.7%) | 192 (10.8%) |
| $50,000 to $74,999 | 231 (17.7%) | 158 (8.9%) |
| $75,000 to $99,999 | 137 (10.5%) | 383 (21.6%) |
| $100,000 to $149,999 | 167 (12.8%) | 178 (10.1%) |
| $150,000 or more | 102 (7.8%) | 449 (25.4%) |
| Total | 1,306 (100.0%) | 1,770 (100.0%) |
Property Value to Household Income Ratio in Bardstown
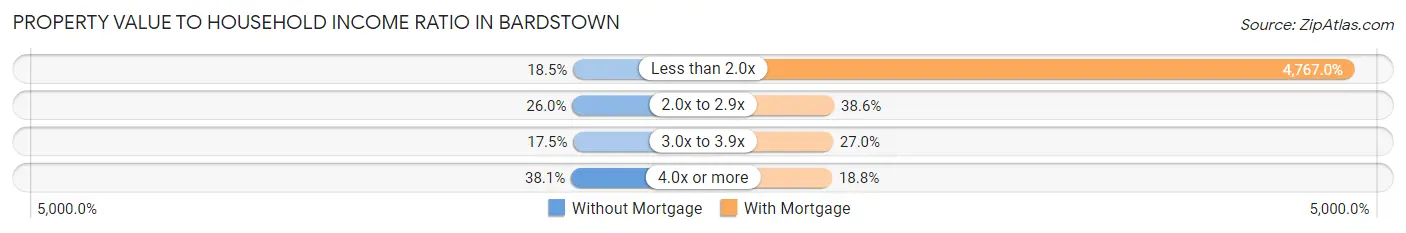
| Value-to-Income Ratio | Without Mortgage | With Mortgage |
| Less than 2.0x | 241 (18.4%) | 84,375 (4,766.9%) |
| 2.0x to 2.9x | 339 (26.0%) | 684 (38.6%) |
| 3.0x to 3.9x | 228 (17.5%) | 477 (27.0%) |
| 4.0x or more | 498 (38.1%) | 332 (18.8%) |
| Total | 1,306 (100.0%) | 1,770 (100.0%) |
Real Estate Taxes by Mortgage Status in Bardstown
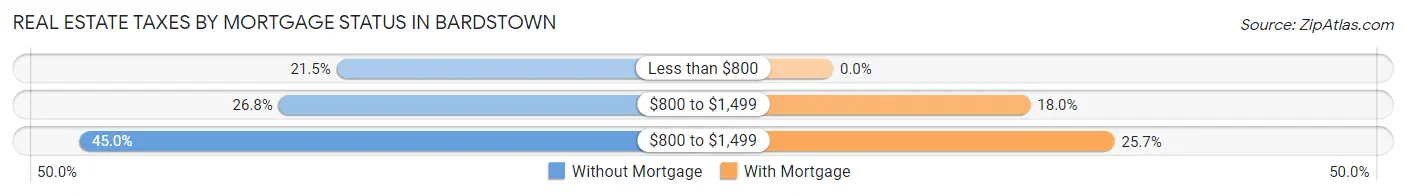
| Property Taxes | Without Mortgage | With Mortgage |
| Less than $800 | 281 (21.5%) | 0 (0.0%) |
| $800 to $1,499 | 350 (26.8%) | 319 (18.0%) |
| $800 to $1,499 | 588 (45.0%) | 455 (25.7%) |
| Total | 1,306 (100.0%) | 1,770 (100.0%) |
Health & Disability in Bardstown
Health Insurance Coverage by Age in Bardstown
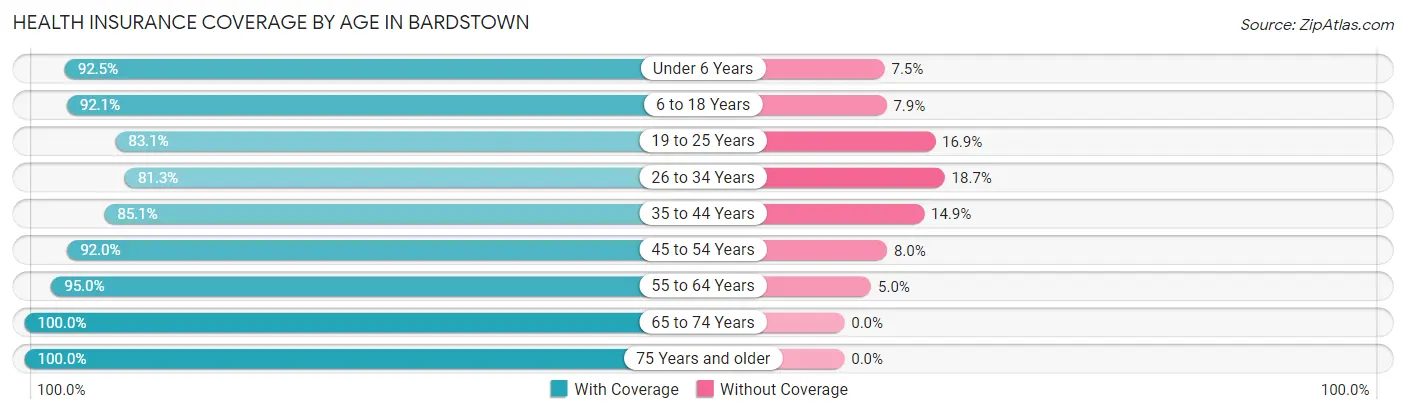
| Age Bracket | With Coverage | Without Coverage |
| Under 6 Years | 1,456 (92.5%) | 118 (7.5%) |
| 6 to 18 Years | 1,861 (92.1%) | 159 (7.9%) |
| 19 to 25 Years | 864 (83.1%) | 176 (16.9%) |
| 26 to 34 Years | 1,420 (81.3%) | 327 (18.7%) |
| 35 to 44 Years | 1,351 (85.1%) | 236 (14.9%) |
| 45 to 54 Years | 1,283 (92.0%) | 111 (8.0%) |
| 55 to 64 Years | 1,696 (95.0%) | 89 (5.0%) |
| 65 to 74 Years | 1,227 (100.0%) | 0 (0.0%) |
| 75 Years and older | 890 (100.0%) | 0 (0.0%) |
| Total | 12,048 (90.8%) | 1,216 (9.2%) |
Health Insurance Coverage by Citizenship Status in Bardstown
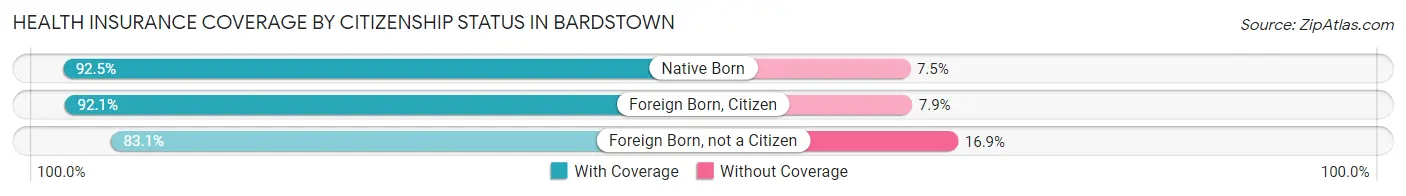
| Citizenship Status | With Coverage | Without Coverage |
| Native Born | 1,456 (92.5%) | 118 (7.5%) |
| Foreign Born, Citizen | 1,861 (92.1%) | 159 (7.9%) |
| Foreign Born, not a Citizen | 864 (83.1%) | 176 (16.9%) |
Health Insurance Coverage by Household Income in Bardstown
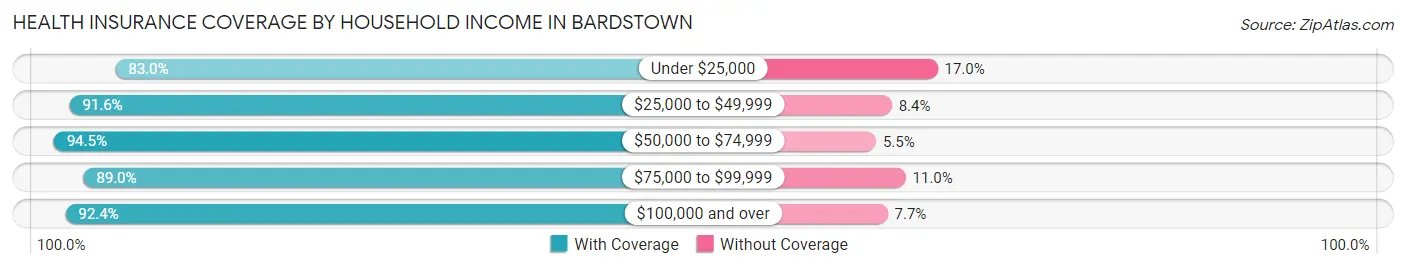
| Household Income | With Coverage | Without Coverage |
| Under $25,000 | 1,758 (83.0%) | 360 (17.0%) |
| $25,000 to $49,999 | 2,972 (91.6%) | 273 (8.4%) |
| $50,000 to $74,999 | 2,525 (94.5%) | 146 (5.5%) |
| $75,000 to $99,999 | 1,025 (89.0%) | 127 (11.0%) |
| $100,000 and over | 3,732 (92.3%) | 309 (7.6%) |
Public vs Private Health Insurance Coverage by Age in Bardstown
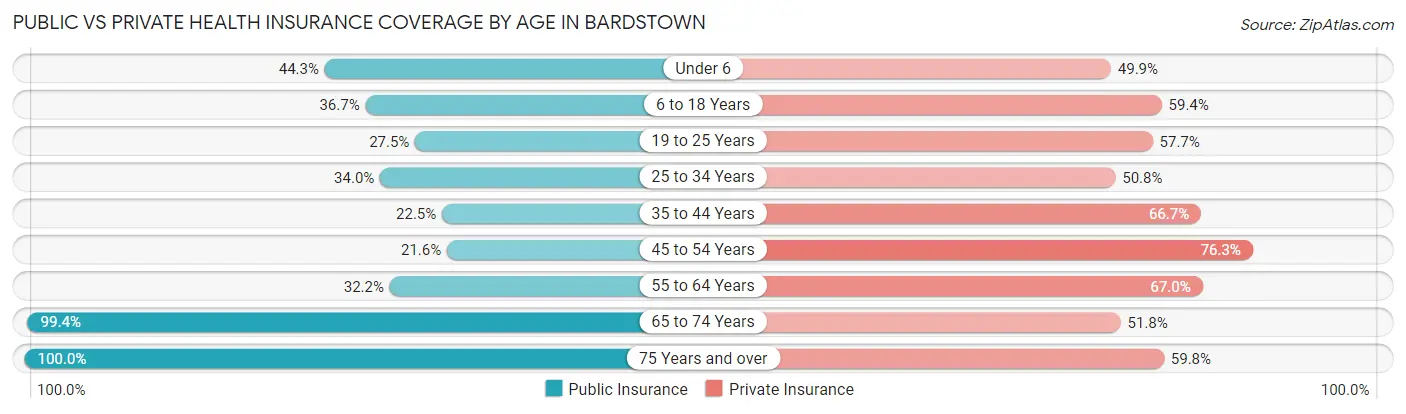
| Age Bracket | Public Insurance | Private Insurance |
| Under 6 | 697 (44.3%) | 786 (49.9%) |
| 6 to 18 Years | 742 (36.7%) | 1,199 (59.4%) |
| 19 to 25 Years | 286 (27.5%) | 600 (57.7%) |
| 25 to 34 Years | 594 (34.0%) | 887 (50.8%) |
| 35 to 44 Years | 357 (22.5%) | 1,058 (66.7%) |
| 45 to 54 Years | 301 (21.6%) | 1,063 (76.3%) |
| 55 to 64 Years | 575 (32.2%) | 1,195 (66.9%) |
| 65 to 74 Years | 1,220 (99.4%) | 635 (51.7%) |
| 75 Years and over | 890 (100.0%) | 532 (59.8%) |
| Total | 5,662 (42.7%) | 7,955 (60.0%) |
Disability Status by Sex by Age in Bardstown
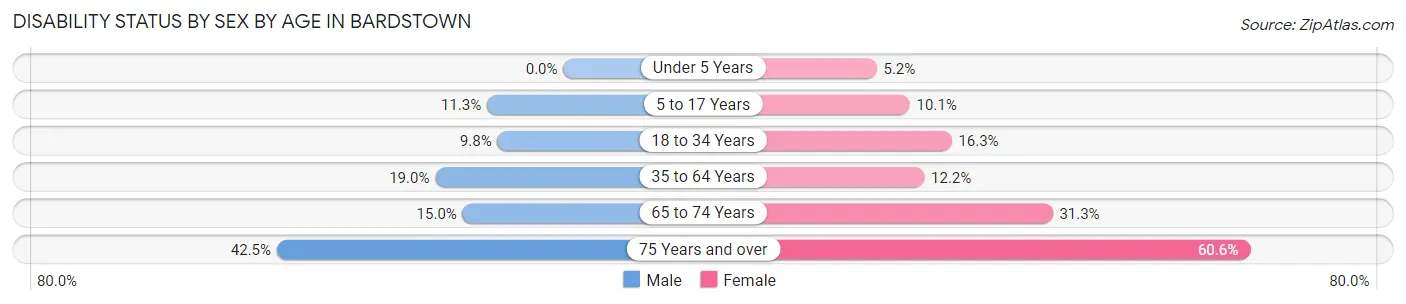
| Age Bracket | Male | Female |
| Under 5 Years | 0 (0.0%) | 26 (5.2%) |
| 5 to 17 Years | 111 (11.3%) | 120 (10.1%) |
| 18 to 34 Years | 160 (9.8%) | 225 (16.3%) |
| 35 to 64 Years | 430 (19.0%) | 306 (12.2%) |
| 65 to 74 Years | 84 (14.9%) | 208 (31.3%) |
| 75 Years and over | 154 (42.5%) | 320 (60.6%) |
Disability Class by Sex by Age in Bardstown
Disability Class: Hearing Difficulty
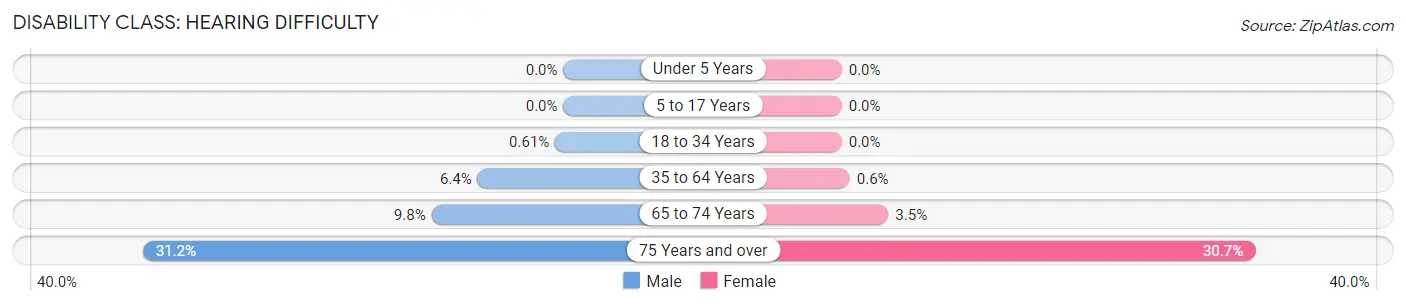
| Age Bracket | Male | Female |
| Under 5 Years | 0 (0.0%) | 0 (0.0%) |
| 5 to 17 Years | 0 (0.0%) | 0 (0.0%) |
| 18 to 34 Years | 10 (0.6%) | 0 (0.0%) |
| 35 to 64 Years | 144 (6.4%) | 15 (0.6%) |
| 65 to 74 Years | 55 (9.8%) | 23 (3.5%) |
| 75 Years and over | 113 (31.2%) | 162 (30.7%) |
Disability Class: Vision Difficulty
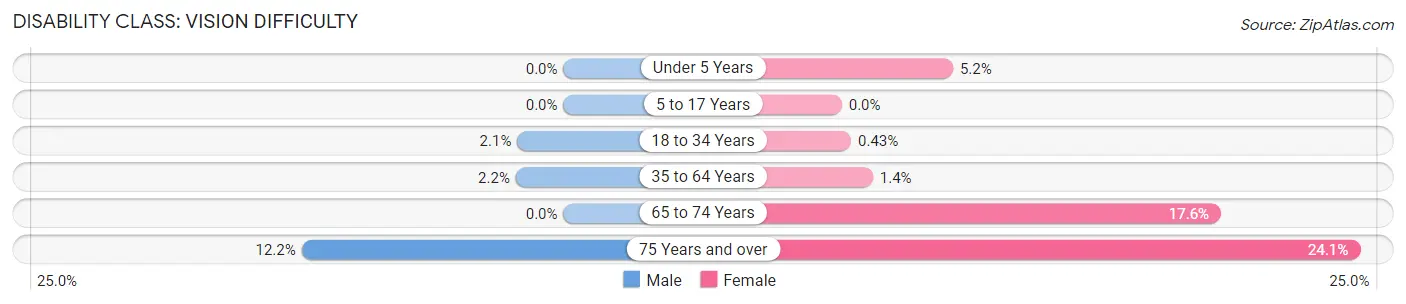
| Age Bracket | Male | Female |
| Under 5 Years | 0 (0.0%) | 26 (5.2%) |
| 5 to 17 Years | 0 (0.0%) | 0 (0.0%) |
| 18 to 34 Years | 35 (2.1%) | 6 (0.4%) |
| 35 to 64 Years | 50 (2.2%) | 36 (1.4%) |
| 65 to 74 Years | 0 (0.0%) | 117 (17.6%) |
| 75 Years and over | 44 (12.1%) | 127 (24.0%) |
Disability Class: Cognitive Difficulty
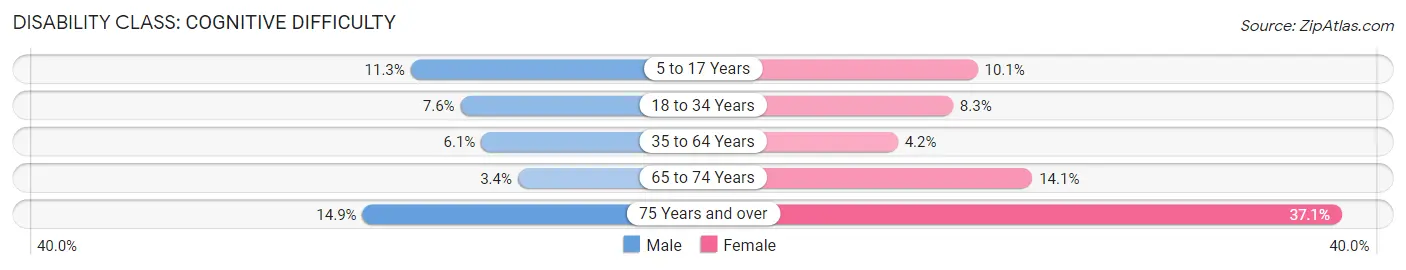
| Age Bracket | Male | Female |
| 5 to 17 Years | 111 (11.3%) | 120 (10.1%) |
| 18 to 34 Years | 125 (7.6%) | 114 (8.3%) |
| 35 to 64 Years | 138 (6.1%) | 104 (4.2%) |
| 65 to 74 Years | 19 (3.4%) | 94 (14.1%) |
| 75 Years and over | 54 (14.9%) | 196 (37.1%) |
Disability Class: Ambulatory Difficulty
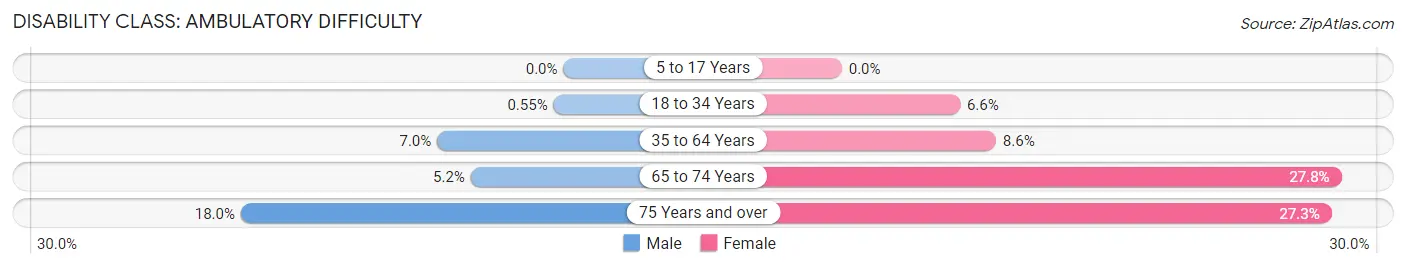
| Age Bracket | Male | Female |
| 5 to 17 Years | 0 (0.0%) | 0 (0.0%) |
| 18 to 34 Years | 9 (0.5%) | 91 (6.6%) |
| 35 to 64 Years | 159 (7.0%) | 215 (8.6%) |
| 65 to 74 Years | 29 (5.2%) | 185 (27.8%) |
| 75 Years and over | 65 (18.0%) | 144 (27.3%) |
Disability Class: Self-Care Difficulty
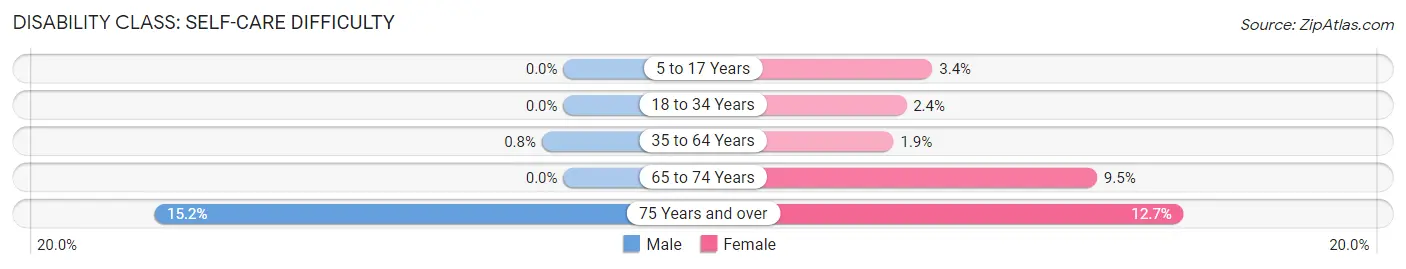
| Age Bracket | Male | Female |
| 5 to 17 Years | 0 (0.0%) | 40 (3.4%) |
| 18 to 34 Years | 0 (0.0%) | 33 (2.4%) |
| 35 to 64 Years | 18 (0.8%) | 48 (1.9%) |
| 65 to 74 Years | 0 (0.0%) | 63 (9.5%) |
| 75 Years and over | 55 (15.2%) | 67 (12.7%) |
Technology Access in Bardstown
Computing Device Access in Bardstown
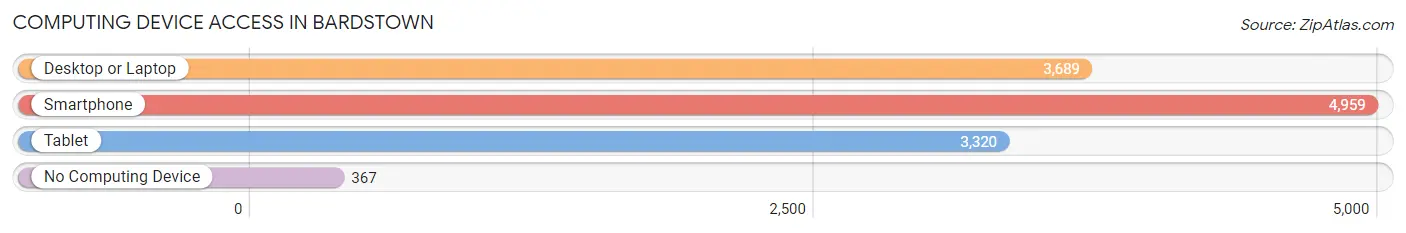
| Device Type | # Households | % Households |
| Desktop or Laptop | 3,689 | 66.3% |
| Smartphone | 4,959 | 89.1% |
| Tablet | 3,320 | 59.7% |
| No Computing Device | 367 | 6.6% |
| Total | 5,566 | 100.0% |
Internet Access in Bardstown
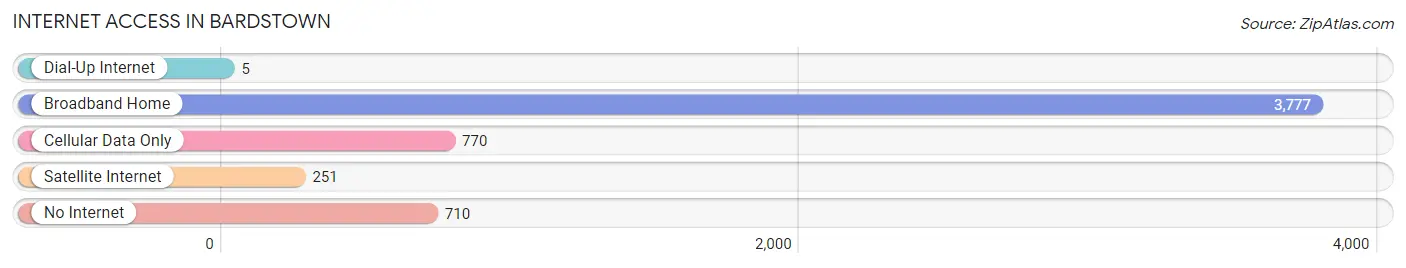
| Internet Type | # Households | % Households |
| Dial-Up Internet | 5 | 0.1% |
| Broadband Home | 3,777 | 67.9% |
| Cellular Data Only | 770 | 13.8% |
| Satellite Internet | 251 | 4.5% |
| No Internet | 710 | 12.8% |
| Total | 5,566 | 100.0% |
Bardstown Summary
Bardstown, Kentucky is a small city located in the heart of the Bluegrass region of the state. It is the county seat of Nelson County and is located about 40 miles south of Louisville. The city has a population of approximately 12,000 people and is known for its historic buildings, bourbon distilleries, and its annual Kentucky Bourbon Festival.
History
Bardstown was founded in 1780 by William Bard, a Revolutionary War veteran. The city was originally known as “Bard’s Town” and was the first permanent settlement in the area. The city was incorporated in 1838 and was named the county seat of Nelson County in 1839.
During the Civil War, Bardstown was a major supply center for the Confederate Army. The city was also the site of a major battle in 1862, known as the Battle of Bardstown. The city was occupied by Union forces for the remainder of the war.
In the late 19th century, Bardstown became a major center for the production of bourbon whiskey. The city was home to several distilleries, including the famous Jim Beam Distillery, which is still in operation today.
Geography
Bardstown is located in the Bluegrass region of Kentucky, about 40 miles south of Louisville. The city is situated in the rolling hills of the Nelson County countryside. The city is located at the intersection of two major highways, US 31E and US 150.
The climate in Bardstown is humid subtropical, with hot summers and mild winters. The average annual temperature is around 60 degrees Fahrenheit. The city receives an average of 45 inches of precipitation per year.
Economy
Bardstown’s economy is largely based on tourism and the production of bourbon whiskey. The city is home to several distilleries, including the Jim Beam Distillery, which is the largest bourbon distillery in the world. The city also hosts the annual Kentucky Bourbon Festival, which attracts thousands of visitors each year.
In addition to tourism and bourbon production, Bardstown is also home to several manufacturing companies, including a large automotive parts plant. The city also has a thriving retail sector, with several shopping centers and restaurants.
Demographics
As of the 2010 census, Bardstown had a population of 12,094 people. The racial makeup of the city was 90.3% White, 6.2% African American, 0.3% Native American, 0.7% Asian, 0.1% Pacific Islander, and 2.4% from other races. The median household income was $37,945, and the median family income was $45,945.
Bardstown is a small city with a rich history and a vibrant economy. The city is home to several distilleries and hosts the annual Kentucky Bourbon Festival. The city is also home to several manufacturing companies and a thriving retail sector. The population of Bardstown is diverse, with a mix of races and ethnicities.
Common Questions
What is Per Capita Income in Bardstown?
Per Capita income in Bardstown is $27,338.
What is the Median Family Income in Bardstown?
Median Family Income in Bardstown is $62,227.
What is the Median Household income in Bardstown?
Median Household Income in Bardstown is $47,654.
What is Income or Wage Gap in Bardstown?
Income or Wage Gap in Bardstown is 29.8%.
Women in Bardstown earn 70.2 cents for every dollar earned by a man.
What is Family Income Deficit in Bardstown?
Family Income Deficit in Bardstown is $10,272.
Families that are below poverty line in Bardstown earn $10,272 less on average than the poverty threshold level.
What is Inequality or Gini Index in Bardstown?
Inequality or Gini Index in Bardstown is 0.43.
What is the Total Population of Bardstown?
Total Population of Bardstown is 13,564.
What is the Total Male Population of Bardstown?
Total Male Population of Bardstown is 6,630.
What is the Total Female Population of Bardstown?
Total Female Population of Bardstown is 6,934.
What is the Ratio of Males per 100 Females in Bardstown?
There are 95.62 Males per 100 Females in Bardstown.
What is the Ratio of Females per 100 Males in Bardstown?
There are 104.59 Females per 100 Males in Bardstown.
What is the Median Population Age in Bardstown?
Median Population Age in Bardstown is 38.1 Years.
What is the Average Family Size in Bardstown
Average Family Size in Bardstown is 3.0 People.
What is the Average Household Size in Bardstown
Average Household Size in Bardstown is 2.4 People.
How Large is the Labor Force in Bardstown?
There are 6,429 People in the Labor Forcein in Bardstown.
What is the Percentage of People in the Labor Force in Bardstown?
61.3% of People are in the Labor Force in Bardstown.
What is the Unemployment Rate in Bardstown?
Unemployment Rate in Bardstown is 3.4%.