Hollow Creek, KY Map & Demographics
Hollow Creek Map
Hollow Creek Overview
$43,401
PER CAPITA INCOME
$110,486
AVG FAMILY INCOME
$91,875
AVG HOUSEHOLD INCOME
35.5%
WAGE / INCOME GAP [ % ]
64.5¢/ $1
WAGE / INCOME GAP [ $ ]
0.37
INEQUALITY / GINI INDEX
702
TOTAL POPULATION
302
MALE POPULATION
400
FEMALE POPULATION
75.50
MALES / 100 FEMALES
132.45
FEMALES / 100 MALES
51.2
MEDIAN AGE
2.9
AVG FAMILY SIZE
2.5
AVG HOUSEHOLD SIZE
348
LABOR FORCE [ PEOPLE ]
60.4%
PERCENT IN LABOR FORCE
1.2%
UNEMPLOYMENT RATE
Hollow Creek Area Codes
Income in Hollow Creek
Income Overview in Hollow Creek
Per Capita Income in Hollow Creek is $43,401, while median incomes of families and households are $110,486 and $91,875 respectively.
| Characteristic | Number | Measure |
| Per Capita Income | 702 | $43,401 |
| Median Family Income | 215 | $110,486 |
| Mean Family Income | 215 | $120,814 |
| Median Household Income | 277 | $91,875 |
| Mean Household Income | 277 | $108,944 |
| Income Deficit | 215 | $0 |
| Wage / Income Gap (%) | 702 | 35.50% |
| Wage / Income Gap ($) | 702 | 64.50¢ per $1 |
| Gini / Inequality Index | 702 | 0.37 |
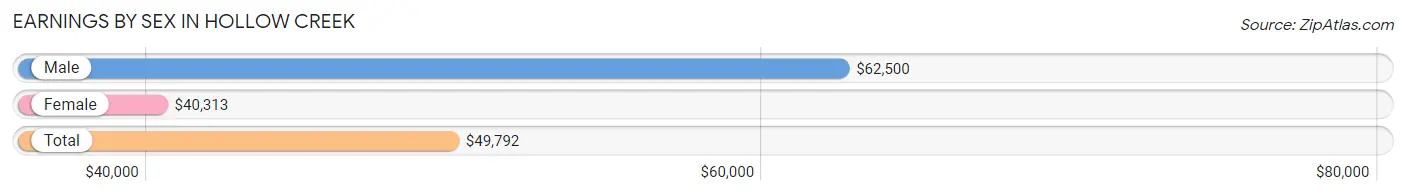
Earnings by Sex in Hollow Creek
Average Earnings in Hollow Creek are $49,792, $62,500 for men and $40,313 for women, a difference of 35.5%.
| Sex | Number | Average Earnings |
| Male | 176 (49.0%) | $62,500 |
| Female | 183 (51.0%) | $40,313 |
| Total | 359 (100.0%) | $49,792 |
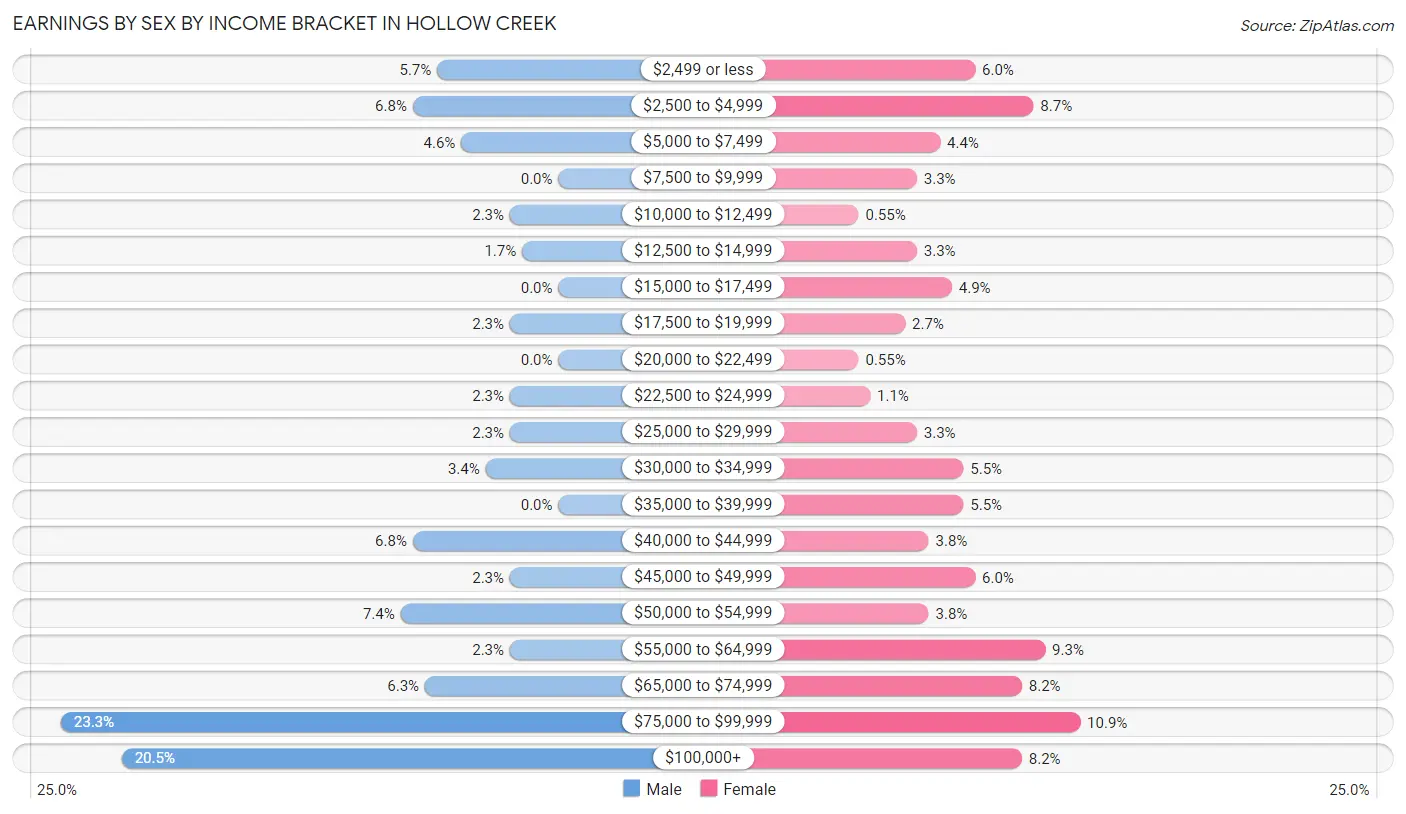
Earnings by Sex by Income Bracket in Hollow Creek
The most common earnings brackets in Hollow Creek are $75,000 to $99,999 for men (41 | 23.3%) and $75,000 to $99,999 for women (20 | 10.9%).
| Income | Male | Female |
| $2,499 or less | 10 (5.7%) | 11 (6.0%) |
| $2,500 to $4,999 | 12 (6.8%) | 16 (8.7%) |
| $5,000 to $7,499 | 8 (4.5%) | 8 (4.4%) |
| $7,500 to $9,999 | 0 (0.0%) | 6 (3.3%) |
| $10,000 to $12,499 | 4 (2.3%) | 1 (0.5%) |
| $12,500 to $14,999 | 3 (1.7%) | 6 (3.3%) |
| $15,000 to $17,499 | 0 (0.0%) | 9 (4.9%) |
| $17,500 to $19,999 | 4 (2.3%) | 5 (2.7%) |
| $20,000 to $22,499 | 0 (0.0%) | 1 (0.5%) |
| $22,500 to $24,999 | 4 (2.3%) | 2 (1.1%) |
| $25,000 to $29,999 | 4 (2.3%) | 6 (3.3%) |
| $30,000 to $34,999 | 6 (3.4%) | 10 (5.5%) |
| $35,000 to $39,999 | 0 (0.0%) | 10 (5.5%) |
| $40,000 to $44,999 | 12 (6.8%) | 7 (3.8%) |
| $45,000 to $49,999 | 4 (2.3%) | 11 (6.0%) |
| $50,000 to $54,999 | 13 (7.4%) | 7 (3.8%) |
| $55,000 to $64,999 | 4 (2.3%) | 17 (9.3%) |
| $65,000 to $74,999 | 11 (6.2%) | 15 (8.2%) |
| $75,000 to $99,999 | 41 (23.3%) | 20 (10.9%) |
| $100,000+ | 36 (20.4%) | 15 (8.2%) |
| Total | 176 (100.0%) | 183 (100.0%) |
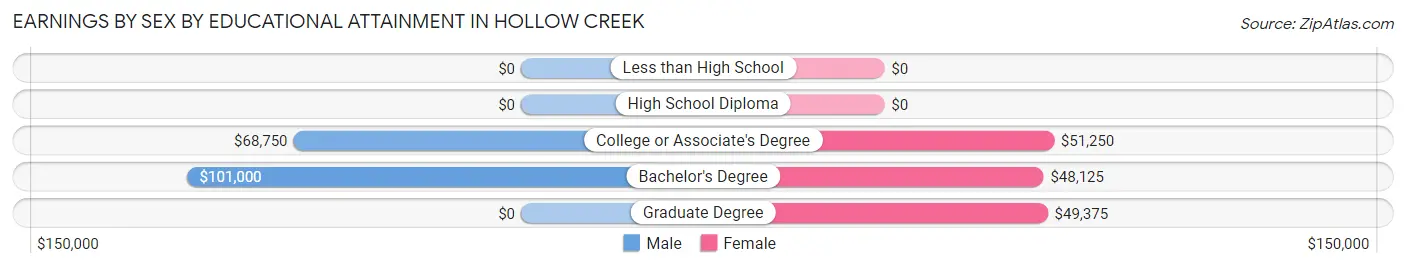
Earnings by Sex by Educational Attainment in Hollow Creek
Average earnings in Hollow Creek are $70,000 for men and $50,536 for women, a difference of 27.8%. Men with an educational attainment of bachelor's degree enjoy the highest average annual earnings of $101,000, while those with college or associate's degree education earn the least with $68,750. Women with an educational attainment of college or associate's degree earn the most with the average annual earnings of $51,250, while those with bachelor's degree education have the smallest earnings of $48,125.
| Educational Attainment | Male Income | Female Income |
| Less than High School | - | - |
| High School Diploma | - | - |
| College or Associate's Degree | $68,750 | $51,250 |
| Bachelor's Degree | $101,000 | $48,125 |
| Graduate Degree | - | - |
| Total | $70,000 | $50,536 |
Family Income in Hollow Creek
Family Income Brackets in Hollow Creek
According to the Hollow Creek family income data, there are 58 families falling into the $100,000 to $149,999 income range, which is the most common income bracket and makes up 27.0% of all families.
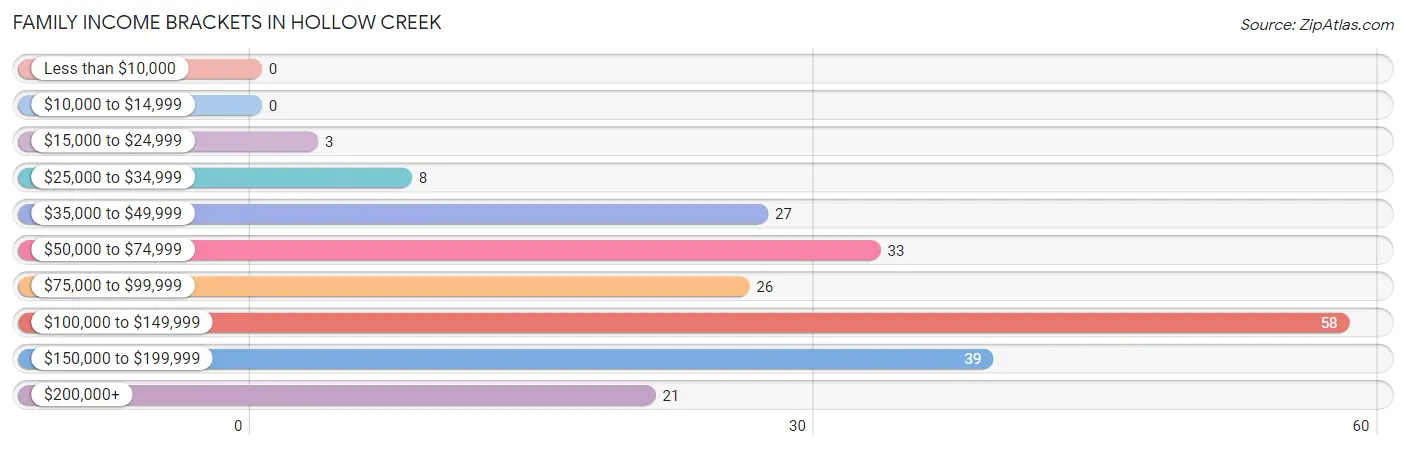
| Income Bracket | # Families | % Families |
| Less than $10,000 | 0 | 0.0% |
| $10,000 to $14,999 | 0 | 0.0% |
| $15,000 to $24,999 | 3 | 1.4% |
| $25,000 to $34,999 | 8 | 3.7% |
| $35,000 to $49,999 | 27 | 12.6% |
| $50,000 to $74,999 | 33 | 15.3% |
| $75,000 to $99,999 | 26 | 12.1% |
| $100,000 to $149,999 | 58 | 27.0% |
| $150,000 to $199,999 | 39 | 18.1% |
| $200,000+ | 21 | 9.8% |
Family Income by Famaliy Size in Hollow Creek
4-person families (31 | 14.4%) account for the highest median family income in Hollow Creek with $142,083 per family, while 2-person families (130 | 60.5%) have the highest median income of $41,094 per family member.
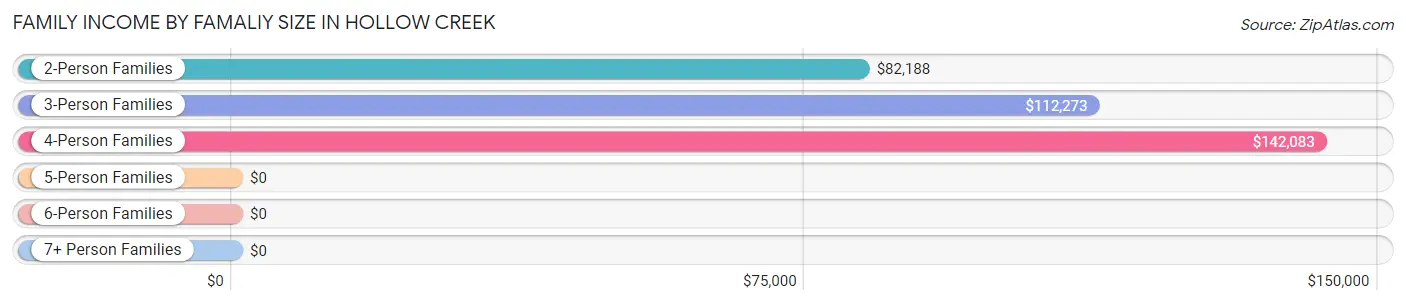
| Income Bracket | # Families | Median Income |
| 2-Person Families | 130 (60.5%) | $82,188 |
| 3-Person Families | 32 (14.9%) | $112,273 |
| 4-Person Families | 31 (14.4%) | $142,083 |
| 5-Person Families | 16 (7.4%) | $0 |
| 6-Person Families | 2 (0.9%) | $0 |
| 7+ Person Families | 4 (1.9%) | $0 |
| Total | 215 (100.0%) | $110,486 |
Family Income by Number of Earners in Hollow Creek
The median family income in Hollow Creek is $110,486, with families comprising 3+ earners (30) having the highest median family income of $170,750, while families with no earners (53) have the lowest median family income of $54,063, accounting for 14.0% and 24.6% of families, respectively.
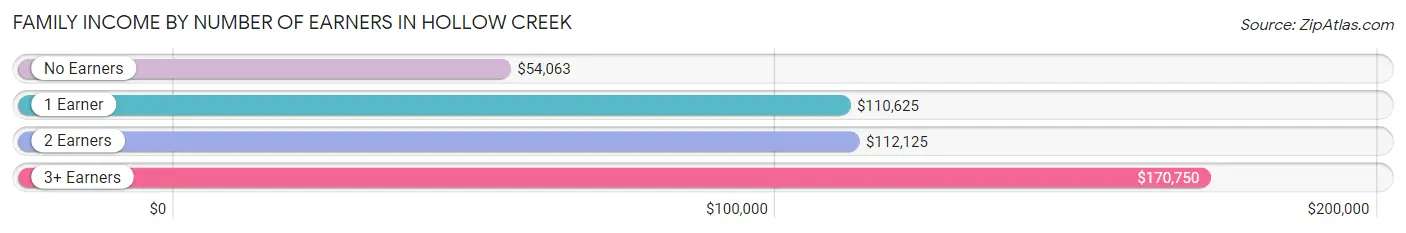
| Number of Earners | # Families | Median Income |
| No Earners | 53 (24.6%) | $54,063 |
| 1 Earner | 51 (23.7%) | $110,625 |
| 2 Earners | 81 (37.7%) | $112,125 |
| 3+ Earners | 30 (14.0%) | $170,750 |
| Total | 215 (100.0%) | $110,486 |
Household Income in Hollow Creek
Household Income Brackets in Hollow Creek
With 64 households falling in the category, the $100,000 to $149,999 income range is the most frequent in Hollow Creek, accounting for 23.1% of all households.
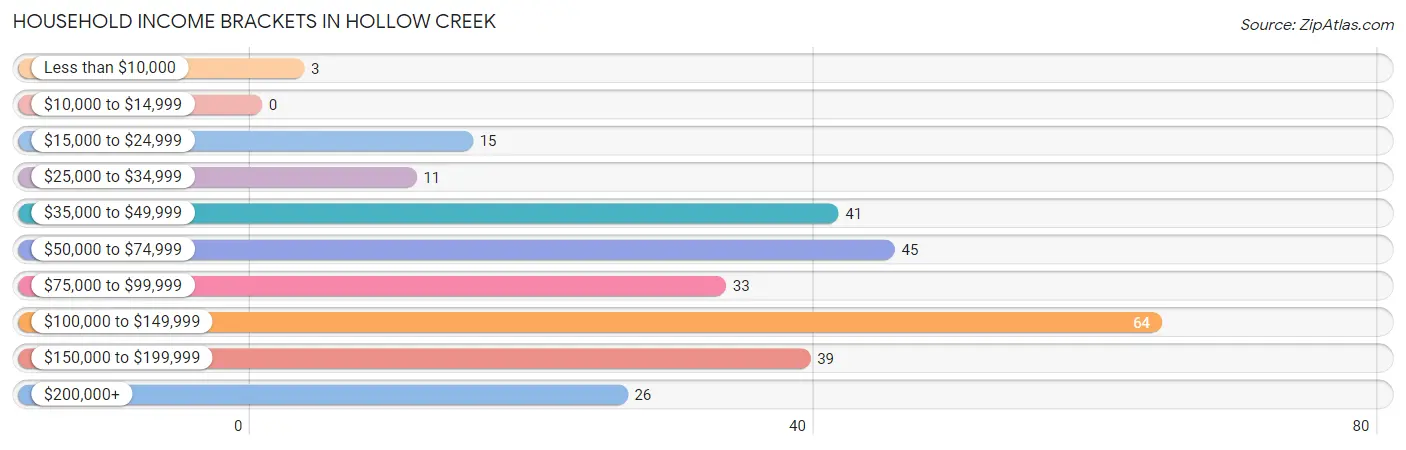
| Income Bracket | # Households | % Households |
| Less than $10,000 | 3 | 1.1% |
| $10,000 to $14,999 | 0 | 0.0% |
| $15,000 to $24,999 | 15 | 5.4% |
| $25,000 to $34,999 | 11 | 4.0% |
| $35,000 to $49,999 | 41 | 14.8% |
| $50,000 to $74,999 | 45 | 16.2% |
| $75,000 to $99,999 | 33 | 11.9% |
| $100,000 to $149,999 | 64 | 23.1% |
| $150,000 to $199,999 | 39 | 14.1% |
| $200,000+ | 26 | 9.4% |
Household Income by Householder Age in Hollow Creek
The median household income in Hollow Creek is $91,875, with the highest median household income of $112,500 found in the 25 to 44 years age bracket for the primary householder. A total of 52 households (18.8%) fall into this category. Meanwhile, the 15 to 24 years age bracket for the primary householder has the lowest median household income of $0, with 5 households (1.8%) in this group.
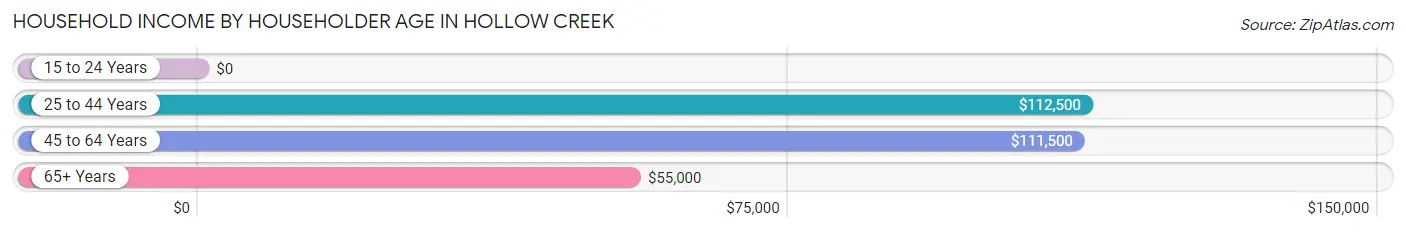
| Income Bracket | # Households | Median Income |
| 15 to 24 Years | 5 (1.8%) | $0 |
| 25 to 44 Years | 52 (18.8%) | $112,500 |
| 45 to 64 Years | 104 (37.6%) | $111,500 |
| 65+ Years | 116 (41.9%) | $55,000 |
| Total | 277 (100.0%) | $91,875 |
Poverty in Hollow Creek
Income Below Poverty by Sex and Age in Hollow Creek
With 2.6% poverty level for males and 2.3% for females among the residents of Hollow Creek, 16 and 17 year old males and 15 year old females are the most vulnerable to poverty, with 3 males (42.9%) and 1 females (100.0%) in their respective age groups living below the poverty level.
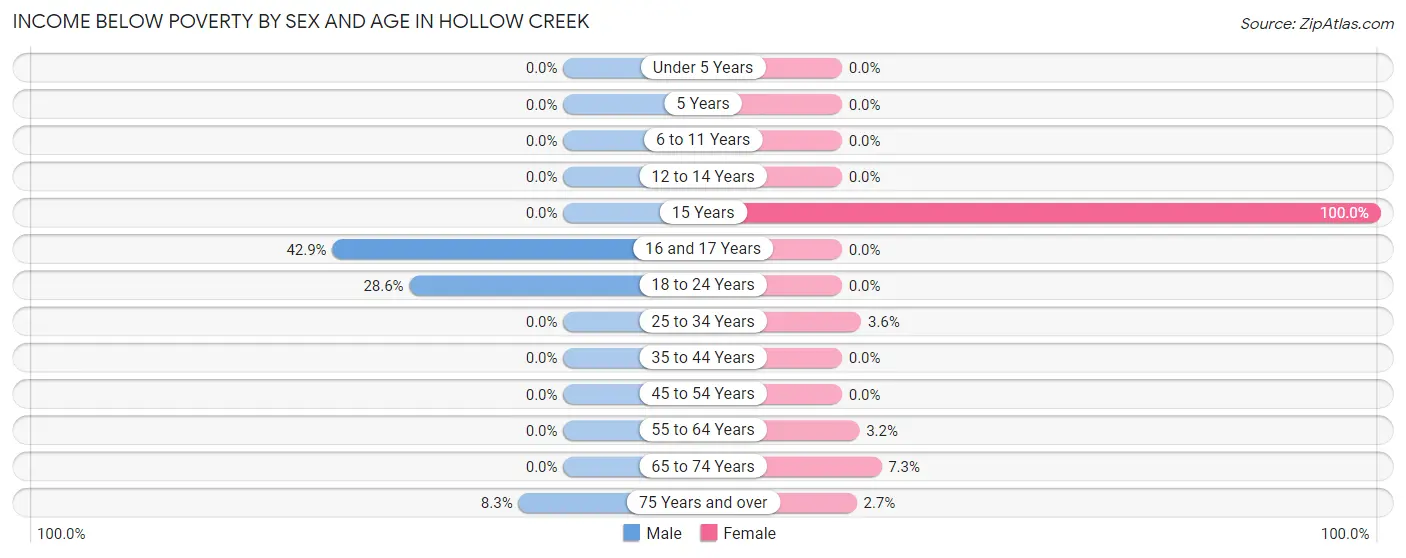
| Age Bracket | Male | Female |
| Under 5 Years | 0 (0.0%) | 0 (0.0%) |
| 5 Years | 0 (0.0%) | 0 (0.0%) |
| 6 to 11 Years | 0 (0.0%) | 0 (0.0%) |
| 12 to 14 Years | 0 (0.0%) | 0 (0.0%) |
| 15 Years | 0 (0.0%) | 1 (100.0%) |
| 16 and 17 Years | 3 (42.9%) | 0 (0.0%) |
| 18 to 24 Years | 2 (28.6%) | 0 (0.0%) |
| 25 to 34 Years | 0 (0.0%) | 1 (3.6%) |
| 35 to 44 Years | 0 (0.0%) | 0 (0.0%) |
| 45 to 54 Years | 0 (0.0%) | 0 (0.0%) |
| 55 to 64 Years | 0 (0.0%) | 2 (3.2%) |
| 65 to 74 Years | 0 (0.0%) | 3 (7.3%) |
| 75 Years and over | 3 (8.3%) | 2 (2.7%) |
| Total | 8 (2.6%) | 9 (2.3%) |
Income Above Poverty by Sex and Age in Hollow Creek
According to the poverty statistics in Hollow Creek, males aged under 5 years and females aged under 5 years are the age groups that are most secure financially, with 100.0% of males and 100.0% of females in these age groups living above the poverty line.
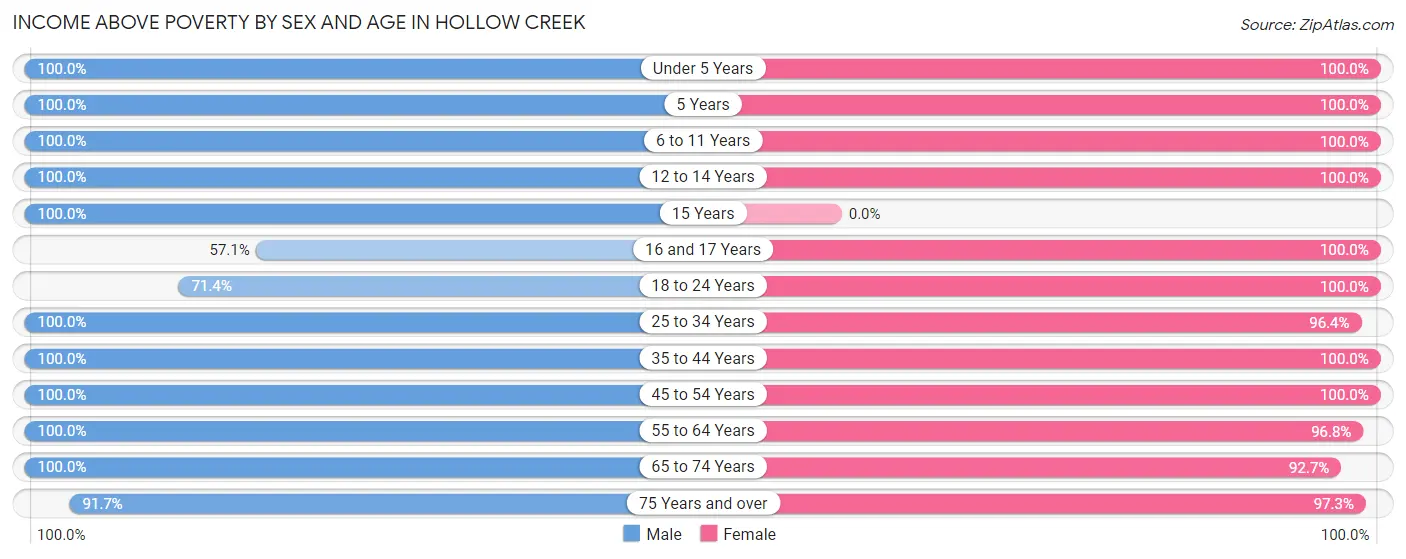
| Age Bracket | Male | Female |
| Under 5 Years | 5 (100.0%) | 29 (100.0%) |
| 5 Years | 7 (100.0%) | 2 (100.0%) |
| 6 to 11 Years | 25 (100.0%) | 32 (100.0%) |
| 12 to 14 Years | 9 (100.0%) | 11 (100.0%) |
| 15 Years | 3 (100.0%) | 0 (0.0%) |
| 16 and 17 Years | 4 (57.1%) | 17 (100.0%) |
| 18 to 24 Years | 5 (71.4%) | 31 (100.0%) |
| 25 to 34 Years | 31 (100.0%) | 27 (96.4%) |
| 35 to 44 Years | 27 (100.0%) | 35 (100.0%) |
| 45 to 54 Years | 41 (100.0%) | 36 (100.0%) |
| 55 to 64 Years | 55 (100.0%) | 60 (96.8%) |
| 65 to 74 Years | 49 (100.0%) | 38 (92.7%) |
| 75 Years and over | 33 (91.7%) | 71 (97.3%) |
| Total | 294 (97.4%) | 389 (97.7%) |
Income Below Poverty Among Married-Couple Families in Hollow Creek
The poverty statistics for married-couple families in Hollow Creek show that 1.6% or 3 of the total 183 families live below the poverty line. Families with 1 or 2 children have the highest poverty rate of 8.6%, comprising of 3 families. On the other hand, families with no children have the lowest poverty rate of 0.0%, which includes 0 families.
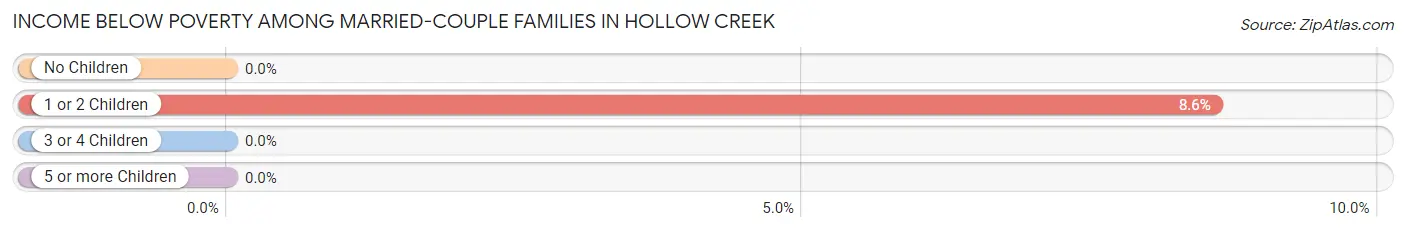
| Children | Above Poverty | Below Poverty |
| No Children | 130 (100.0%) | 0 (0.0%) |
| 1 or 2 Children | 32 (91.4%) | 3 (8.6%) |
| 3 or 4 Children | 18 (100.0%) | 0 (0.0%) |
| 5 or more Children | 0 (0.0%) | 0 (0.0%) |
| Total | 180 (98.4%) | 3 (1.6%) |
Income Below Poverty Among Single-Parent Households in Hollow Creek
| Children | Single Father | Single Mother |
| No Children | 0 (0.0%) | 0 (0.0%) |
| 1 or 2 Children | 0 (0.0%) | 0 (0.0%) |
| 3 or 4 Children | 0 (0.0%) | 0 (0.0%) |
| 5 or more Children | 0 (0.0%) | 0 (0.0%) |
| Total | 0 (0.0%) | 0 (0.0%) |
Income Below Poverty Among Married-Couple vs Single-Parent Households in Hollow Creek
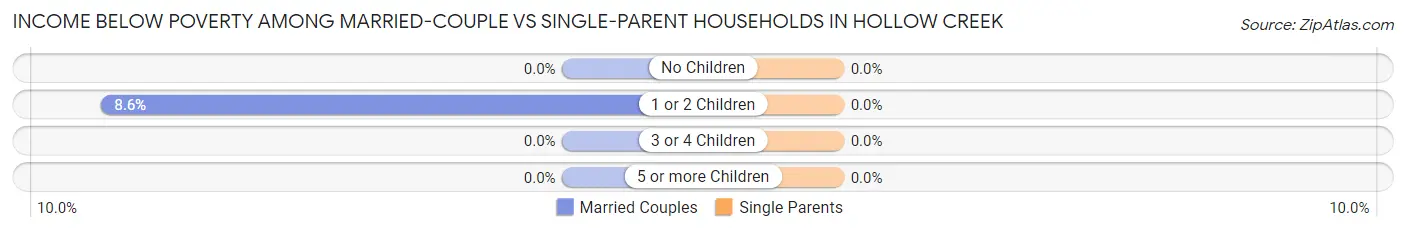
| Children | Married-Couple Families | Single-Parent Households |
| No Children | 0 (0.0%) | 0 (0.0%) |
| 1 or 2 Children | 3 (8.6%) | 0 (0.0%) |
| 3 or 4 Children | 0 (0.0%) | 0 (0.0%) |
| 5 or more Children | 0 (0.0%) | 0 (0.0%) |
| Total | 3 (1.6%) | 0 (0.0%) |
Race in Hollow Creek
The most populous races in Hollow Creek are White / Caucasian (644 | 91.7%), Hispanic or Latino (42 | 6.0%), and Black / African American (36 | 5.1%).
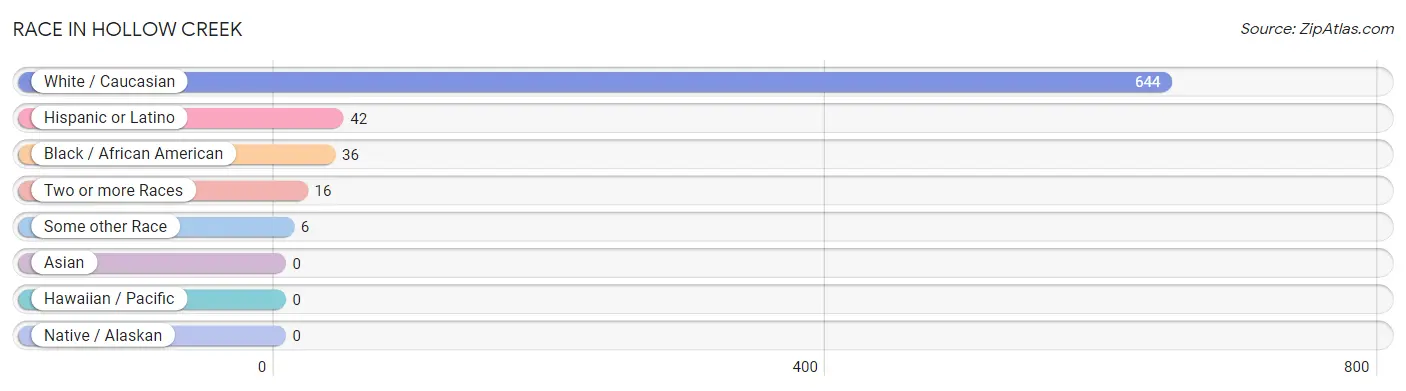
| Race | # Population | % Population |
| Asian | 0 | 0.0% |
| Black / African American | 36 | 5.1% |
| Hawaiian / Pacific | 0 | 0.0% |
| Hispanic or Latino | 42 | 6.0% |
| Native / Alaskan | 0 | 0.0% |
| White / Caucasian | 644 | 91.7% |
| Two or more Races | 16 | 2.3% |
| Some other Race | 6 | 0.9% |
| Total | 702 | 100.0% |
Ancestry in Hollow Creek
The most populous ancestries reported in Hollow Creek are German (168 | 23.9%), English (134 | 19.1%), Irish (127 | 18.1%), American (49 | 7.0%), and Dutch (29 | 4.1%), together accounting for 72.2% of all Hollow Creek residents.
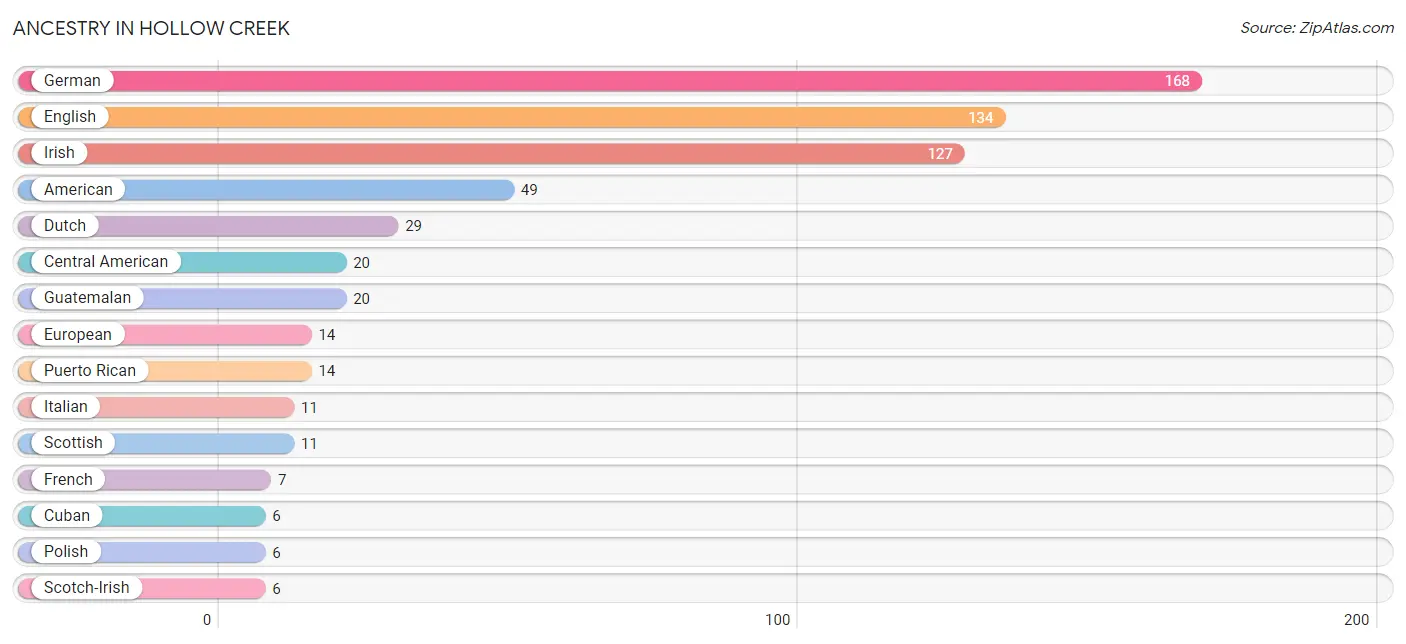
| Ancestry | # Population | % Population |
| American | 49 | 7.0% |
| Apache | 1 | 0.1% |
| British | 3 | 0.4% |
| Central American | 20 | 2.9% |
| Cherokee | 2 | 0.3% |
| Croatian | 2 | 0.3% |
| Cuban | 6 | 0.9% |
| Czech | 5 | 0.7% |
| Dutch | 29 | 4.1% |
| English | 134 | 19.1% |
| European | 14 | 2.0% |
| French | 7 | 1.0% |
| German | 168 | 23.9% |
| Greek | 2 | 0.3% |
| Guatemalan | 20 | 2.9% |
| Irish | 127 | 18.1% |
| Italian | 11 | 1.6% |
| Lithuanian | 2 | 0.3% |
| Mexican | 2 | 0.3% |
| Norwegian | 2 | 0.3% |
| Polish | 6 | 0.9% |
| Potawatomi | 2 | 0.3% |
| Puerto Rican | 14 | 2.0% |
| Scotch-Irish | 6 | 0.9% |
| Scottish | 11 | 1.6% |
| Slovak | 3 | 0.4% |
| Swedish | 2 | 0.3% |
| Swiss | 5 | 0.7% |
| Welsh | 6 | 0.9% | View All 29 Rows |
Immigrants in Hollow Creek
The most numerous immigrant groups reported in Hollow Creek came from Latin America (15 | 2.1%), Central America (11 | 1.6%), Guatemala (11 | 1.6%), Africa (4 | 0.6%), and Belarus (4 | 0.6%), together accounting for 6.4% of all Hollow Creek residents.
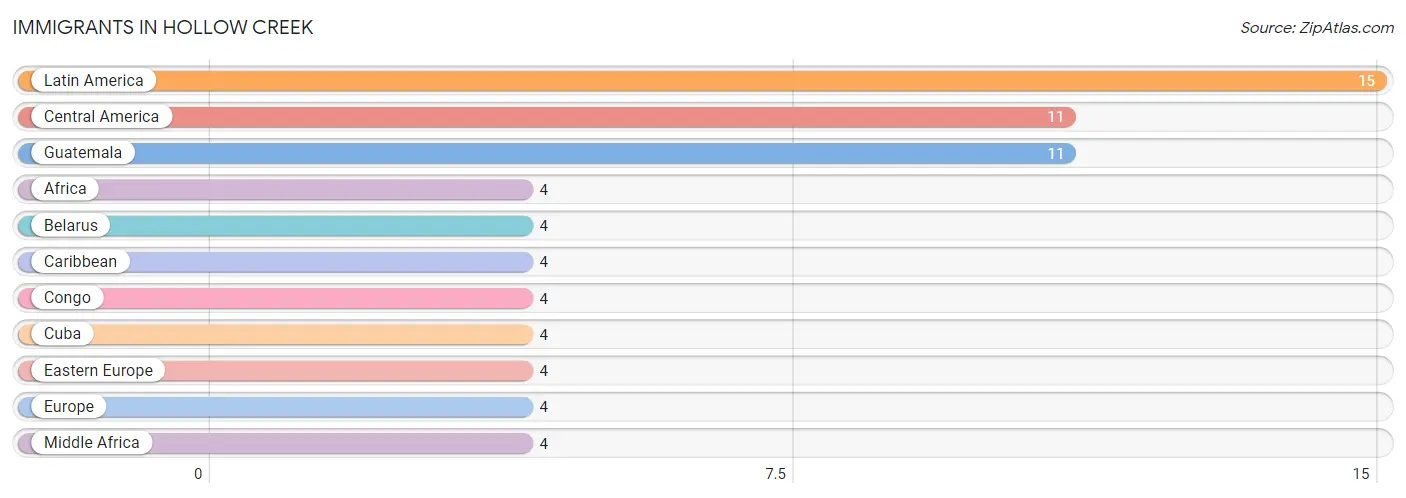
| Immigration Origin | # Population | % Population |
| Africa | 4 | 0.6% |
| Belarus | 4 | 0.6% |
| Caribbean | 4 | 0.6% |
| Central America | 11 | 1.6% |
| Congo | 4 | 0.6% |
| Cuba | 4 | 0.6% |
| Eastern Europe | 4 | 0.6% |
| Europe | 4 | 0.6% |
| Guatemala | 11 | 1.6% |
| Latin America | 15 | 2.1% |
| Middle Africa | 4 | 0.6% | View All 11 Rows |
Sex and Age in Hollow Creek
Sex and Age in Hollow Creek
The most populous age groups in Hollow Creek are 60 to 64 Years (34 | 11.3%) for men and 85 Years and over (40 | 10.0%) for women.
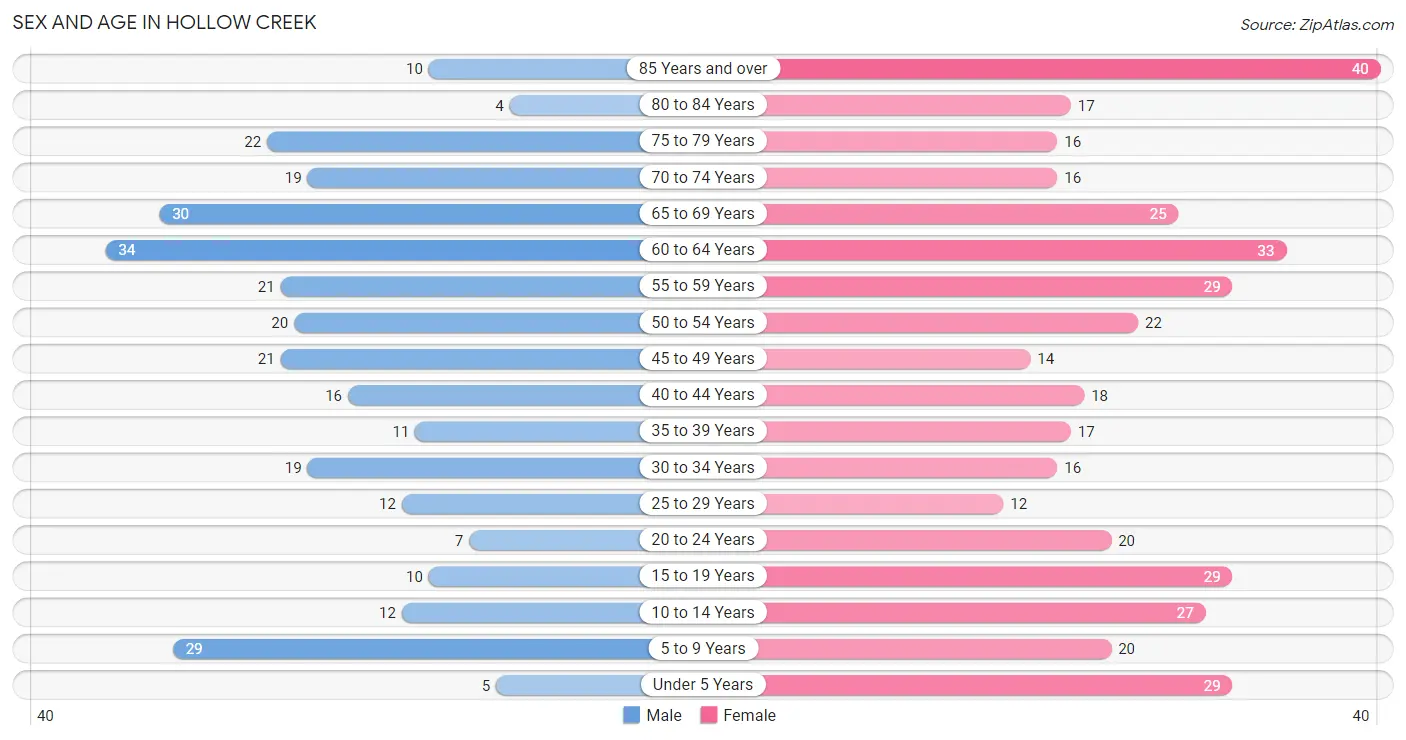
| Age Bracket | Male | Female |
| Under 5 Years | 5 (1.7%) | 29 (7.2%) |
| 5 to 9 Years | 29 (9.6%) | 20 (5.0%) |
| 10 to 14 Years | 12 (4.0%) | 27 (6.8%) |
| 15 to 19 Years | 10 (3.3%) | 29 (7.2%) |
| 20 to 24 Years | 7 (2.3%) | 20 (5.0%) |
| 25 to 29 Years | 12 (4.0%) | 12 (3.0%) |
| 30 to 34 Years | 19 (6.3%) | 16 (4.0%) |
| 35 to 39 Years | 11 (3.6%) | 17 (4.3%) |
| 40 to 44 Years | 16 (5.3%) | 18 (4.5%) |
| 45 to 49 Years | 21 (7.0%) | 14 (3.5%) |
| 50 to 54 Years | 20 (6.6%) | 22 (5.5%) |
| 55 to 59 Years | 21 (7.0%) | 29 (7.2%) |
| 60 to 64 Years | 34 (11.3%) | 33 (8.3%) |
| 65 to 69 Years | 30 (9.9%) | 25 (6.2%) |
| 70 to 74 Years | 19 (6.3%) | 16 (4.0%) |
| 75 to 79 Years | 22 (7.3%) | 16 (4.0%) |
| 80 to 84 Years | 4 (1.3%) | 17 (4.3%) |
| 85 Years and over | 10 (3.3%) | 40 (10.0%) |
| Total | 302 (100.0%) | 400 (100.0%) |
Families and Households in Hollow Creek
Median Family Size in Hollow Creek
The median family size in Hollow Creek is 2.87 persons per family, with single male/father families (17 | 7.9%) accounting for the largest median family size of 3.06 persons per family. On the other hand, single female/mother families (15 | 7.0%) represent the smallest median family size with 2.40 persons per family.
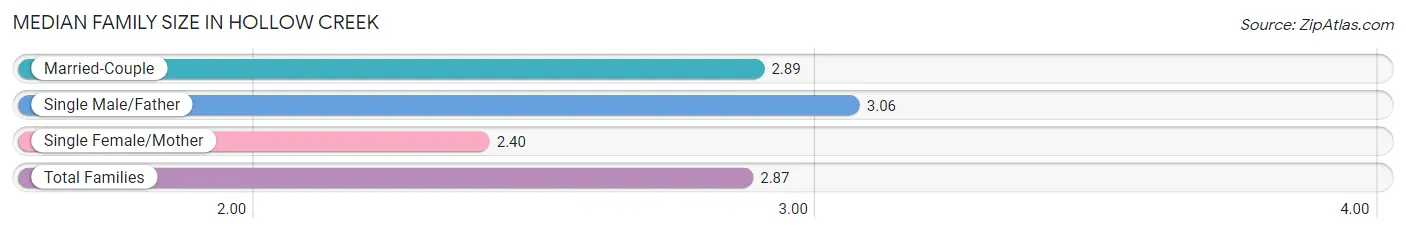
| Family Type | # Families | Family Size |
| Married-Couple | 183 (85.1%) | 2.89 |
| Single Male/Father | 17 (7.9%) | 3.06 |
| Single Female/Mother | 15 (7.0%) | 2.40 |
| Total Families | 215 (100.0%) | 2.87 |
Median Household Size in Hollow Creek
The median household size in Hollow Creek is 2.53 persons per household, with single male/father households (17 | 6.1%) accounting for the largest median household size of 3.06 persons per household. non-family households (62 | 22.4%) represent the smallest median household size with 1.18 persons per household.
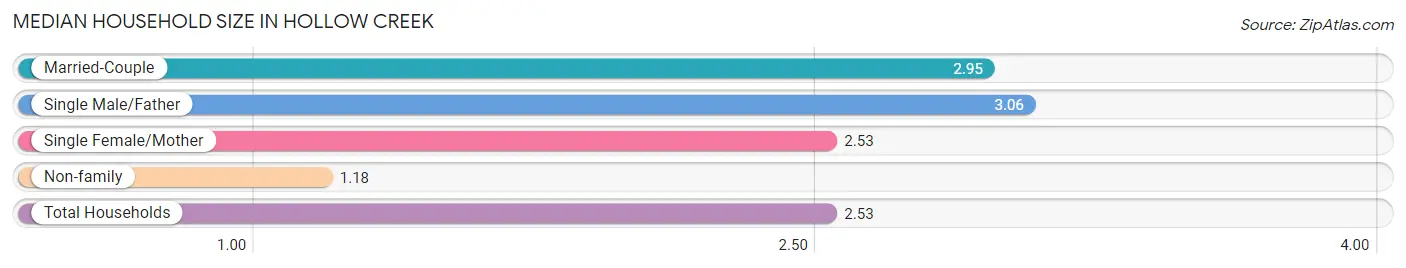
| Household Type | # Households | Household Size |
| Married-Couple | 183 (66.1%) | 2.95 |
| Single Male/Father | 17 (6.1%) | 3.06 |
| Single Female/Mother | 15 (5.4%) | 2.53 |
| Non-family | 62 (22.4%) | 1.18 |
| Total Households | 277 (100.0%) | 2.53 |
Household Size by Marriage Status in Hollow Creek
Out of a total of 277 households in Hollow Creek, 215 (77.6%) are family households, while 62 (22.4%) are nonfamily households. The most numerous type of family households are 2-person households, comprising 125, and the most common type of nonfamily households are 1-person households, comprising 50.
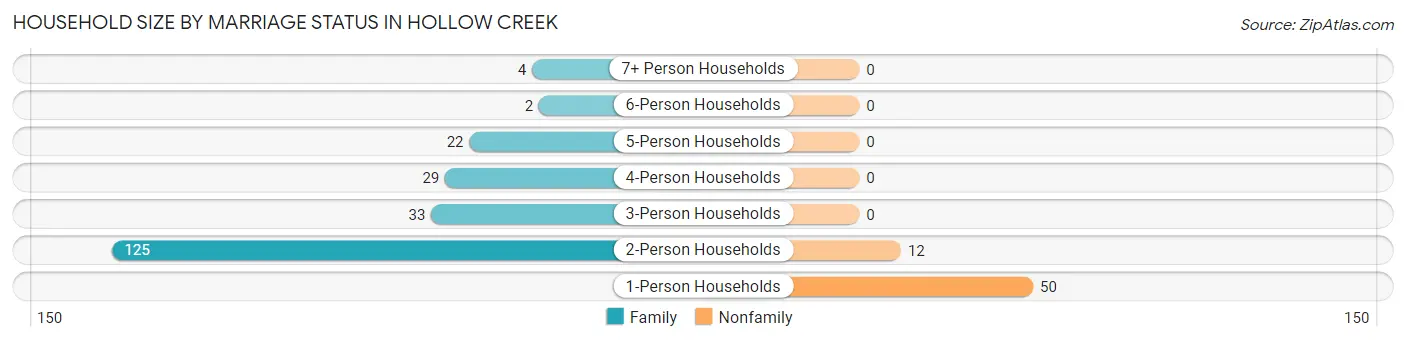
| Household Size | Family Households | Nonfamily Households |
| 1-Person Households | - | 50 (18.0%) |
| 2-Person Households | 125 (45.1%) | 12 (4.3%) |
| 3-Person Households | 33 (11.9%) | 0 (0.0%) |
| 4-Person Households | 29 (10.5%) | 0 (0.0%) |
| 5-Person Households | 22 (7.9%) | 0 (0.0%) |
| 6-Person Households | 2 (0.7%) | 0 (0.0%) |
| 7+ Person Households | 4 (1.4%) | 0 (0.0%) |
| Total | 215 (77.6%) | 62 (22.4%) |
Female Fertility in Hollow Creek
Fertility by Age in Hollow Creek
Average fertility rate in Hollow Creek is 53.0 births per 1,000 women. Women in the age bracket of 20 to 34 years have the highest fertility rate with 104.0 births per 1,000 women. Women in the age bracket of 20 to 34 years acount for 71.4% of all women with births.
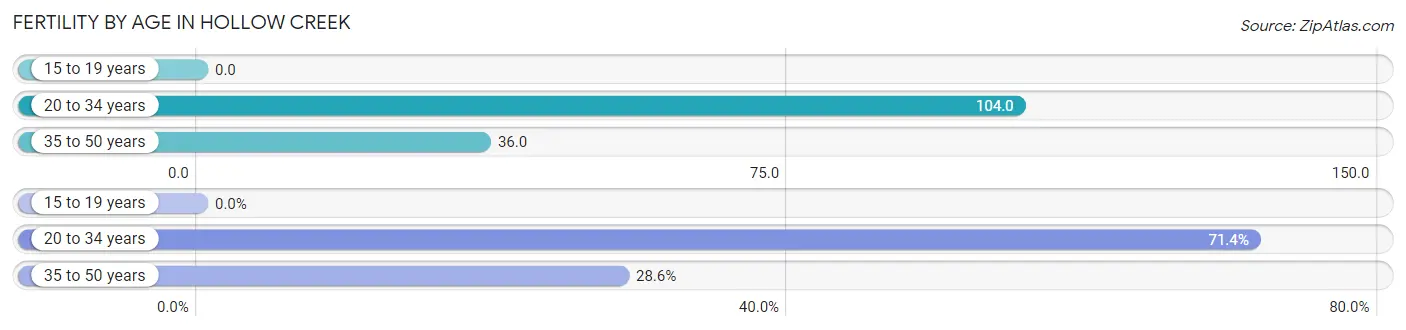
| Age Bracket | Women with Births | Births / 1,000 Women |
| 15 to 19 years | 0 (0.0%) | 0.0 |
| 20 to 34 years | 5 (71.4%) | 104.0 |
| 35 to 50 years | 2 (28.6%) | 36.0 |
| Total | 7 (100.0%) | 53.0 |
Fertility by Age by Marriage Status in Hollow Creek
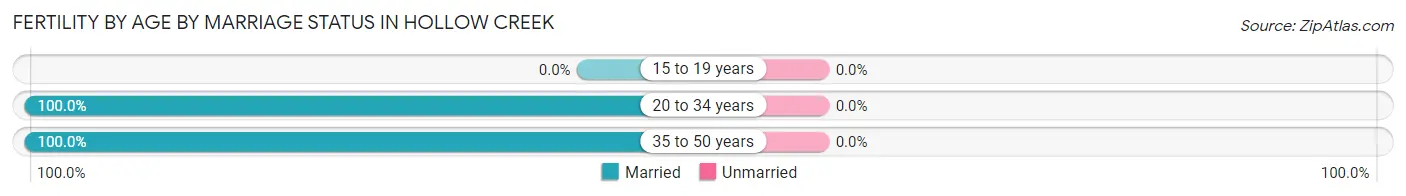
| Age Bracket | Married | Unmarried |
| 15 to 19 years | 0 (0.0%) | 0 (0.0%) |
| 20 to 34 years | 5 (100.0%) | 0 (0.0%) |
| 35 to 50 years | 2 (100.0%) | 0 (0.0%) |
| Total | 7 (100.0%) | 0 (0.0%) |
Fertility by Education in Hollow Creek
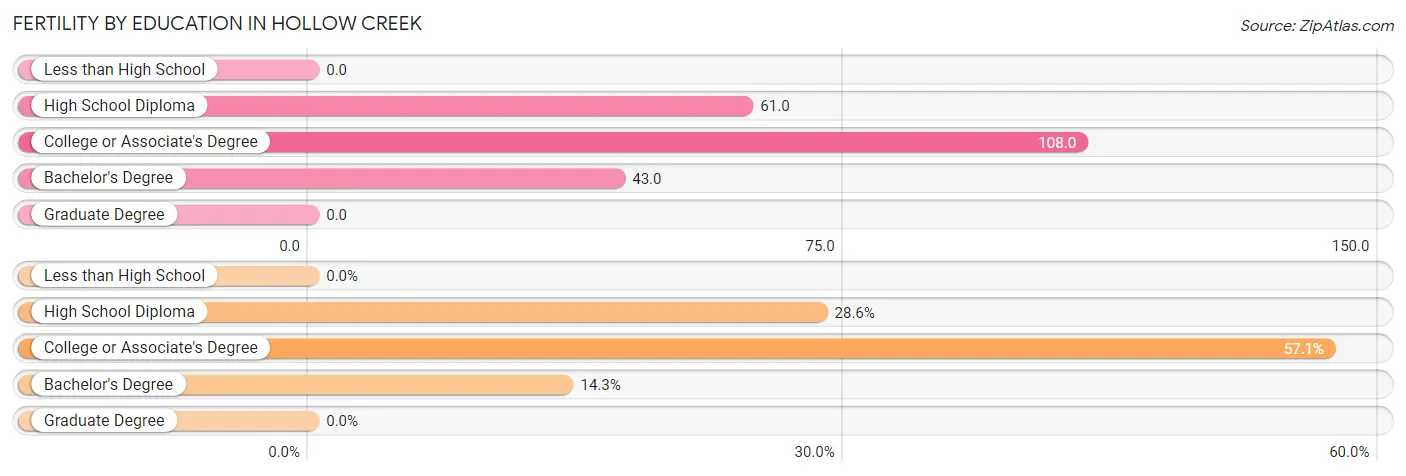
| Educational Attainment | Women with Births | Births / 1,000 Women |
| Less than High School | 0 (0.0%) | 0.0 |
| High School Diploma | 2 (28.6%) | 61.0 |
| College or Associate's Degree | 4 (57.1%) | 108.0 |
| Bachelor's Degree | 1 (14.3%) | 43.0 |
| Graduate Degree | 0 (0.0%) | 0.0 |
| Total | 7 (100.0%) | 53.0 |
Fertility by Education by Marriage Status in Hollow Creek
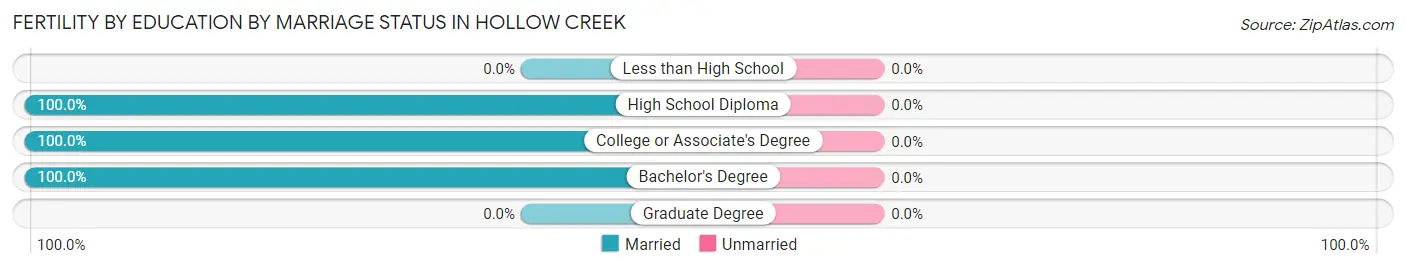
| Educational Attainment | Married | Unmarried |
| Less than High School | 0 (0.0%) | 0 (0.0%) |
| High School Diploma | 2 (100.0%) | 0 (0.0%) |
| College or Associate's Degree | 4 (100.0%) | 0 (0.0%) |
| Bachelor's Degree | 1 (100.0%) | 0 (0.0%) |
| Graduate Degree | 0 (0.0%) | 0 (0.0%) |
| Total | 7 (100.0%) | 0 (0.0%) |
Employment Characteristics in Hollow Creek
Employment by Class of Employer in Hollow Creek
Among the 344 employed individuals in Hollow Creek, private company employees (223 | 64.8%), not-for-profit organizations (31 | 9.0%), and local government employees (22 | 6.4%) make up the most common classes of employment.
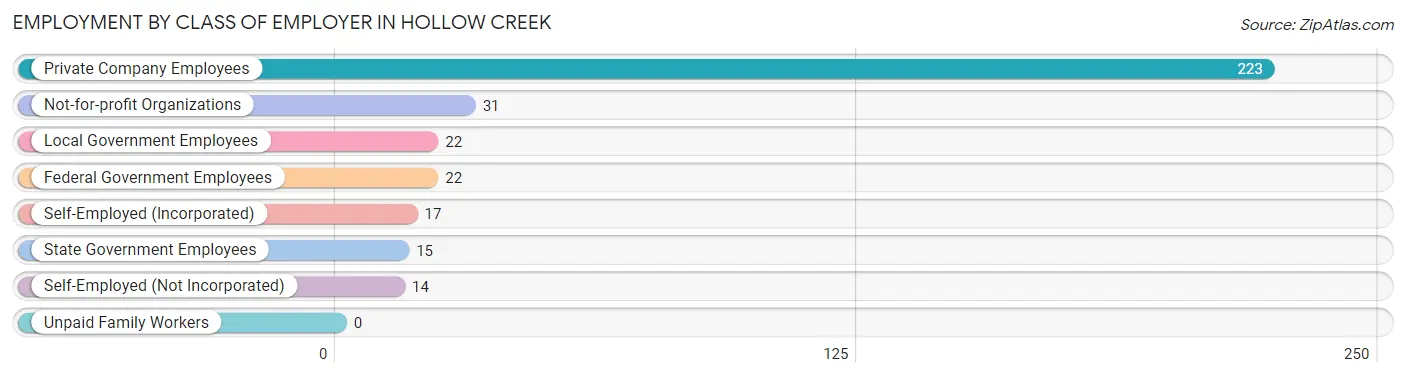
| Employer Class | # Employees | % Employees |
| Private Company Employees | 223 | 64.8% |
| Self-Employed (Incorporated) | 17 | 4.9% |
| Self-Employed (Not Incorporated) | 14 | 4.1% |
| Not-for-profit Organizations | 31 | 9.0% |
| Local Government Employees | 22 | 6.4% |
| State Government Employees | 15 | 4.4% |
| Federal Government Employees | 22 | 6.4% |
| Unpaid Family Workers | 0 | 0.0% |
| Total | 344 | 100.0% |
Employment Status by Age in Hollow Creek
According to the labor force statistics for Hollow Creek, out of the total population over 16 years of age (576), 60.4% or 348 individuals are in the labor force, with 1.2% or 4 of them unemployed. The age group with the highest labor force participation rate is 20 to 24 years, with 96.3% or 26 individuals in the labor force. Within the labor force, the 65 to 74 years age range has the highest percentage of unemployed individuals, with 8.7% or 2 of them being unemployed.
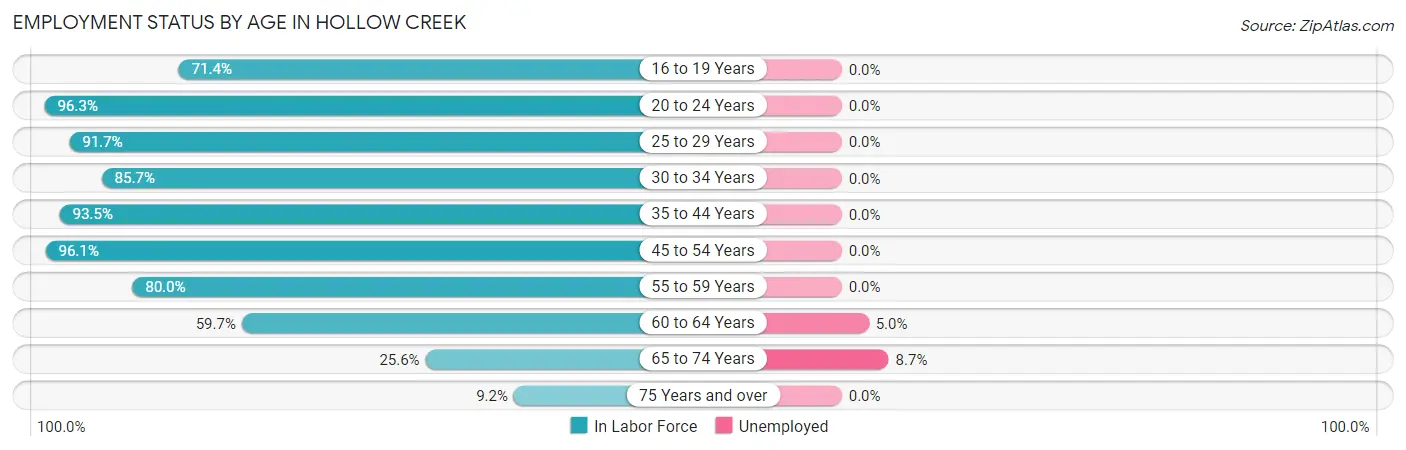
| Age Bracket | In Labor Force | Unemployed |
| 16 to 19 Years | 25 (71.4%) | 0 (0.0%) |
| 20 to 24 Years | 26 (96.3%) | 0 (0.0%) |
| 25 to 29 Years | 22 (91.7%) | 0 (0.0%) |
| 30 to 34 Years | 30 (85.7%) | 0 (0.0%) |
| 35 to 44 Years | 58 (93.5%) | 0 (0.0%) |
| 45 to 54 Years | 74 (96.1%) | 0 (0.0%) |
| 55 to 59 Years | 40 (80.0%) | 0 (0.0%) |
| 60 to 64 Years | 40 (59.7%) | 2 (5.0%) |
| 65 to 74 Years | 23 (25.6%) | 2 (8.7%) |
| 75 Years and over | 10 (9.2%) | 0 (0.0%) |
| Total | 348 (60.4%) | 4 (1.2%) |
Employment Status by Educational Attainment in Hollow Creek
According to labor force statistics for Hollow Creek, 83.8% of individuals (264) out of the total population between 25 and 64 years of age (315) are in the labor force, with 0.8% or 2 of them being unemployed. The group with the highest labor force participation rate are those with the educational attainment of less than high school, with 100.0% or 10 individuals in the labor force. Within the labor force, individuals with college / associate degree education have the highest percentage of unemployment, with 2.7% or 2 of them being unemployed.
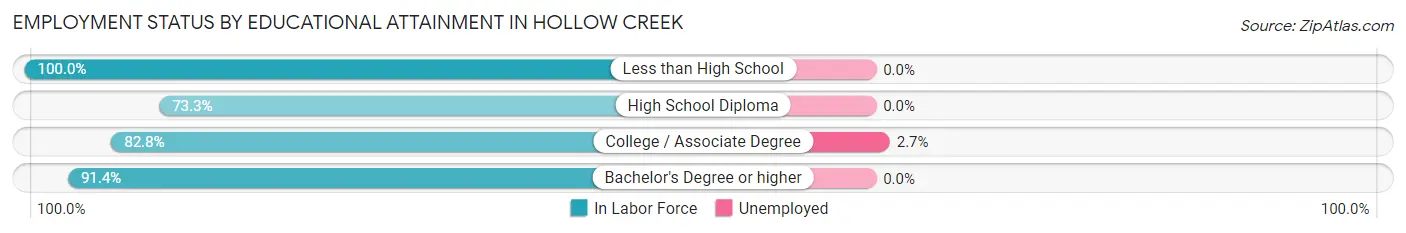
| Educational Attainment | In Labor Force | Unemployed |
| Less than High School | 10 (100.0%) | 0 (0.0%) |
| High School Diploma | 66 (73.3%) | 0 (0.0%) |
| College / Associate Degree | 82 (82.8%) | 3 (2.7%) |
| Bachelor's Degree or higher | 106 (91.4%) | 0 (0.0%) |
| Total | 264 (83.8%) | 3 (0.8%) |
Employment Occupations by Sex in Hollow Creek
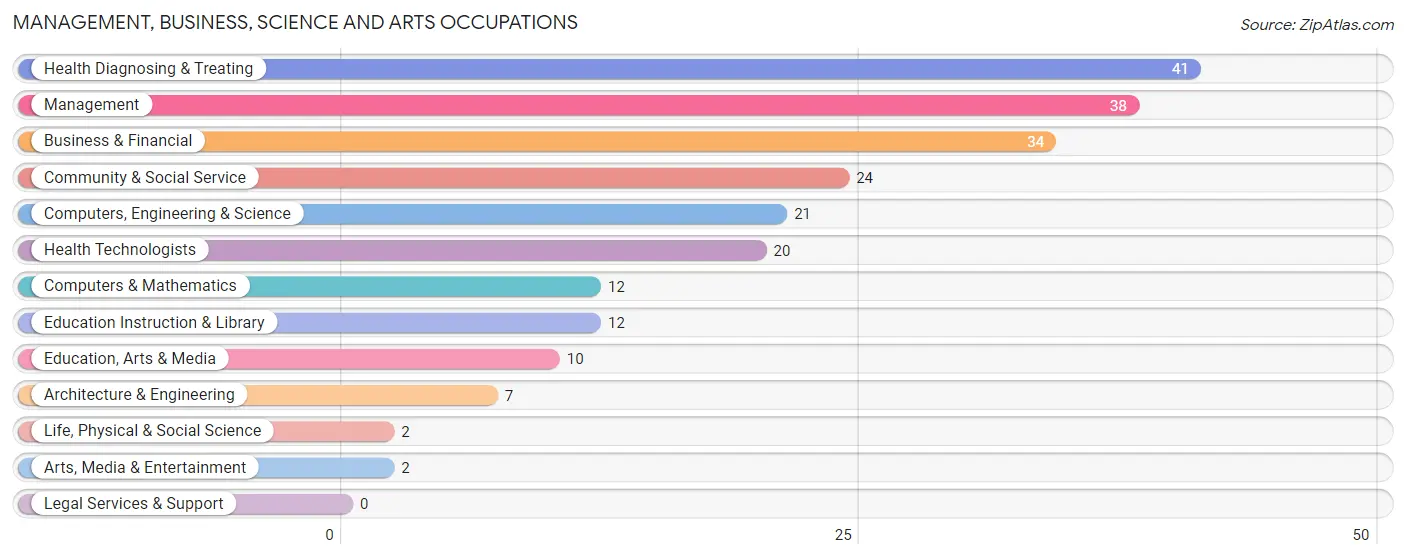
Management, Business, Science and Arts Occupations
The most common Management, Business, Science and Arts occupations in Hollow Creek are Health Diagnosing & Treating (41 | 12.4%), Management (38 | 11.5%), Business & Financial (34 | 10.3%), Community & Social Service (24 | 7.3%), and Computers, Engineering & Science (21 | 6.4%).
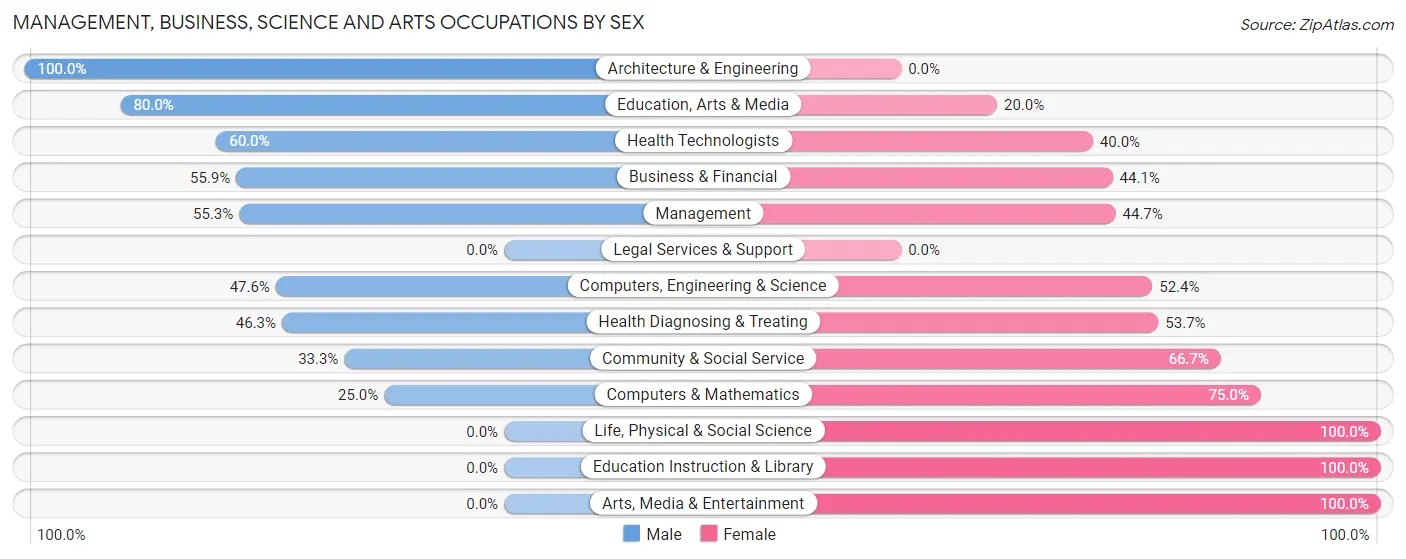
Management, Business, Science and Arts Occupations by Sex
Within the Management, Business, Science and Arts occupations in Hollow Creek, the most male-oriented occupations are Architecture & Engineering (100.0%), Education, Arts & Media (80.0%), and Health Technologists (60.0%), while the most female-oriented occupations are Life, Physical & Social Science (100.0%), Education Instruction & Library (100.0%), and Arts, Media & Entertainment (100.0%).
| Occupation | Male | Female |
| Management | 21 (55.3%) | 17 (44.7%) |
| Business & Financial | 19 (55.9%) | 15 (44.1%) |
| Computers, Engineering & Science | 10 (47.6%) | 11 (52.4%) |
| Computers & Mathematics | 3 (25.0%) | 9 (75.0%) |
| Architecture & Engineering | 7 (100.0%) | 0 (0.0%) |
| Life, Physical & Social Science | 0 (0.0%) | 2 (100.0%) |
| Community & Social Service | 8 (33.3%) | 16 (66.7%) |
| Education, Arts & Media | 8 (80.0%) | 2 (20.0%) |
| Legal Services & Support | 0 (0.0%) | 0 (0.0%) |
| Education Instruction & Library | 0 (0.0%) | 12 (100.0%) |
| Arts, Media & Entertainment | 0 (0.0%) | 2 (100.0%) |
| Health Diagnosing & Treating | 19 (46.3%) | 22 (53.7%) |
| Health Technologists | 12 (60.0%) | 8 (40.0%) |
| Total (Category) | 77 (48.7%) | 81 (51.3%) |
| Total (Overall) | 164 (49.7%) | 166 (50.3%) |
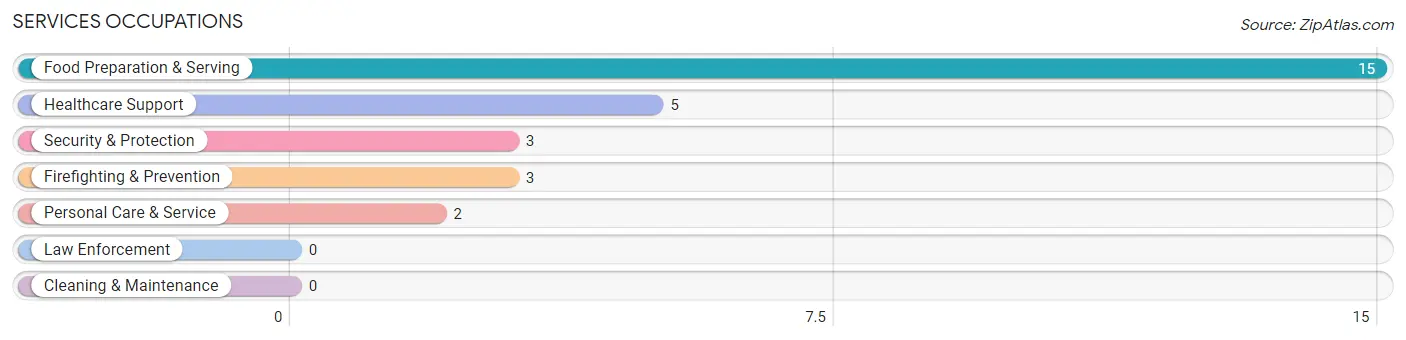
Services Occupations
The most common Services occupations in Hollow Creek are Food Preparation & Serving (15 | 4.5%), Healthcare Support (5 | 1.5%), Security & Protection (3 | 0.9%), Firefighting & Prevention (3 | 0.9%), and Personal Care & Service (2 | 0.6%).
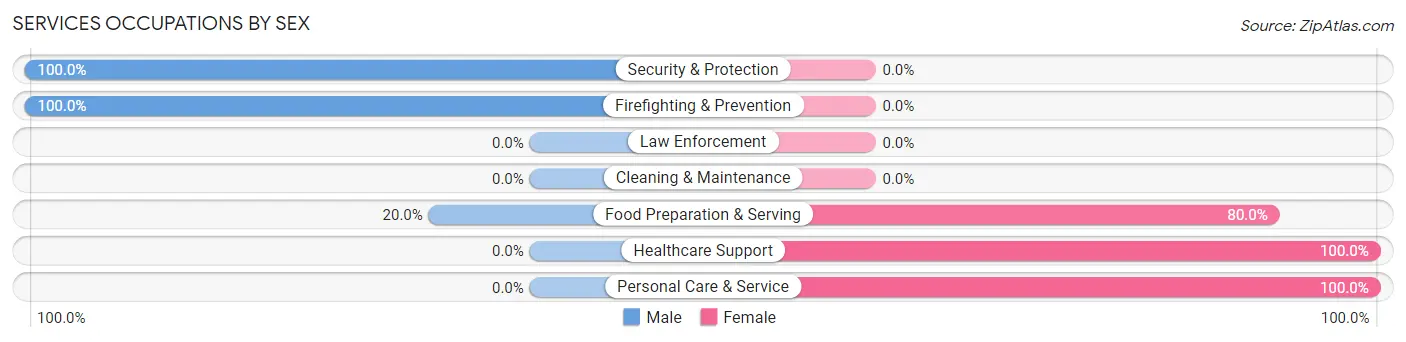
Services Occupations by Sex
Within the Services occupations in Hollow Creek, the most male-oriented occupations are Security & Protection (100.0%), Firefighting & Prevention (100.0%), and Food Preparation & Serving (20.0%), while the most female-oriented occupations are Healthcare Support (100.0%), Personal Care & Service (100.0%), and Food Preparation & Serving (80.0%).
| Occupation | Male | Female |
| Healthcare Support | 0 (0.0%) | 5 (100.0%) |
| Security & Protection | 3 (100.0%) | 0 (0.0%) |
| Firefighting & Prevention | 3 (100.0%) | 0 (0.0%) |
| Law Enforcement | 0 (0.0%) | 0 (0.0%) |
| Food Preparation & Serving | 3 (20.0%) | 12 (80.0%) |
| Cleaning & Maintenance | 0 (0.0%) | 0 (0.0%) |
| Personal Care & Service | 0 (0.0%) | 2 (100.0%) |
| Total (Category) | 6 (24.0%) | 19 (76.0%) |
| Total (Overall) | 164 (49.7%) | 166 (50.3%) |
Sales and Office Occupations
The most common Sales and Office occupations in Hollow Creek are Office & Administration (59 | 17.9%), and Sales & Related (34 | 10.3%).
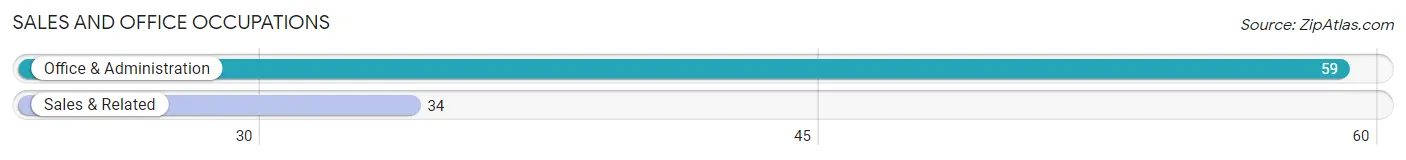
Sales and Office Occupations by Sex
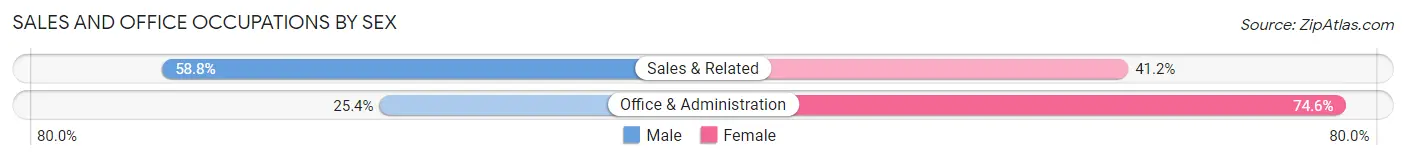
| Occupation | Male | Female |
| Sales & Related | 20 (58.8%) | 14 (41.2%) |
| Office & Administration | 15 (25.4%) | 44 (74.6%) |
| Total (Category) | 35 (37.6%) | 58 (62.4%) |
| Total (Overall) | 164 (49.7%) | 166 (50.3%) |
Natural Resources, Construction and Maintenance Occupations
The most common Natural Resources, Construction and Maintenance occupations in Hollow Creek are Construction & Extraction (16 | 4.9%), and Installation, Maintenance & Repair (9 | 2.7%).
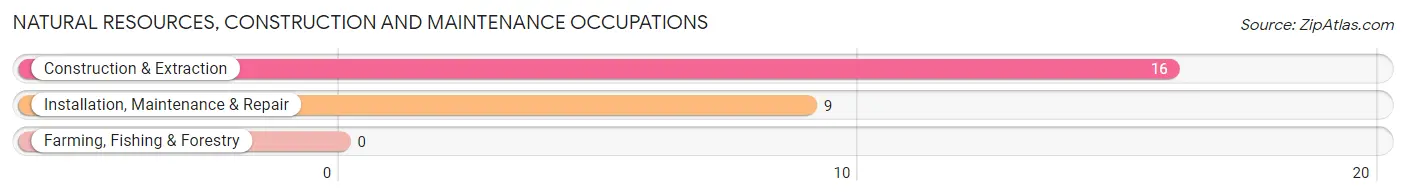
Natural Resources, Construction and Maintenance Occupations by Sex
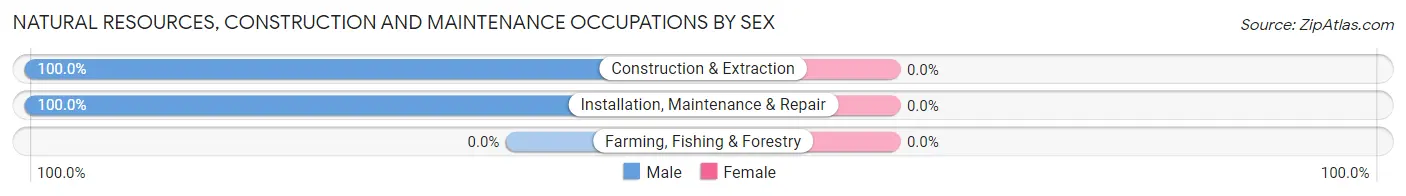
| Occupation | Male | Female |
| Farming, Fishing & Forestry | 0 (0.0%) | 0 (0.0%) |
| Construction & Extraction | 16 (100.0%) | 0 (0.0%) |
| Installation, Maintenance & Repair | 9 (100.0%) | 0 (0.0%) |
| Total (Category) | 25 (100.0%) | 0 (0.0%) |
| Total (Overall) | 164 (49.7%) | 166 (50.3%) |
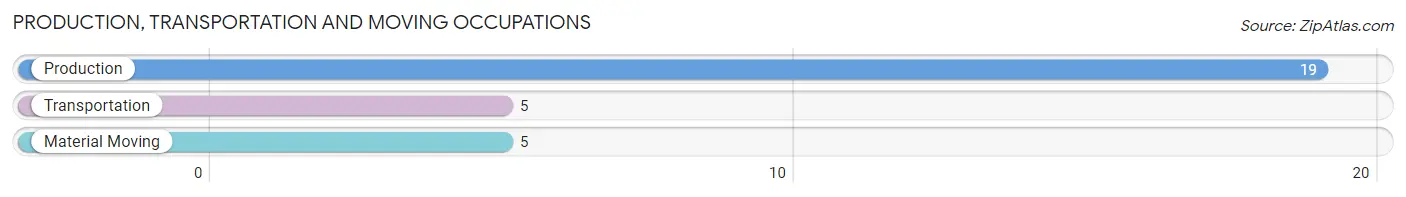
Production, Transportation and Moving Occupations
The most common Production, Transportation and Moving occupations in Hollow Creek are Production (19 | 5.8%), Transportation (5 | 1.5%), and Material Moving (5 | 1.5%).
Production, Transportation and Moving Occupations by Sex
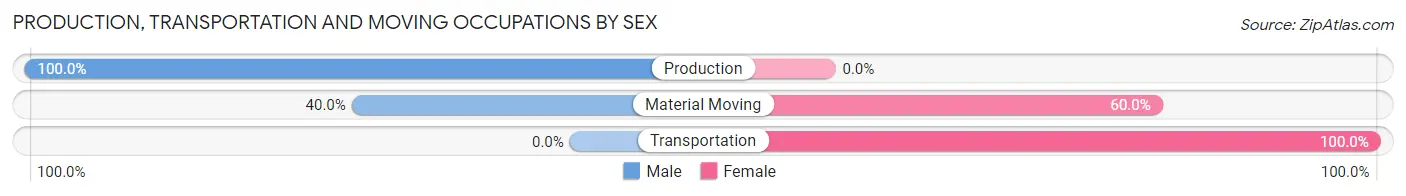
| Occupation | Male | Female |
| Production | 19 (100.0%) | 0 (0.0%) |
| Transportation | 0 (0.0%) | 5 (100.0%) |
| Material Moving | 2 (40.0%) | 3 (60.0%) |
| Total (Category) | 21 (72.4%) | 8 (27.6%) |
| Total (Overall) | 164 (49.7%) | 166 (50.3%) |
Employment Industries by Sex in Hollow Creek
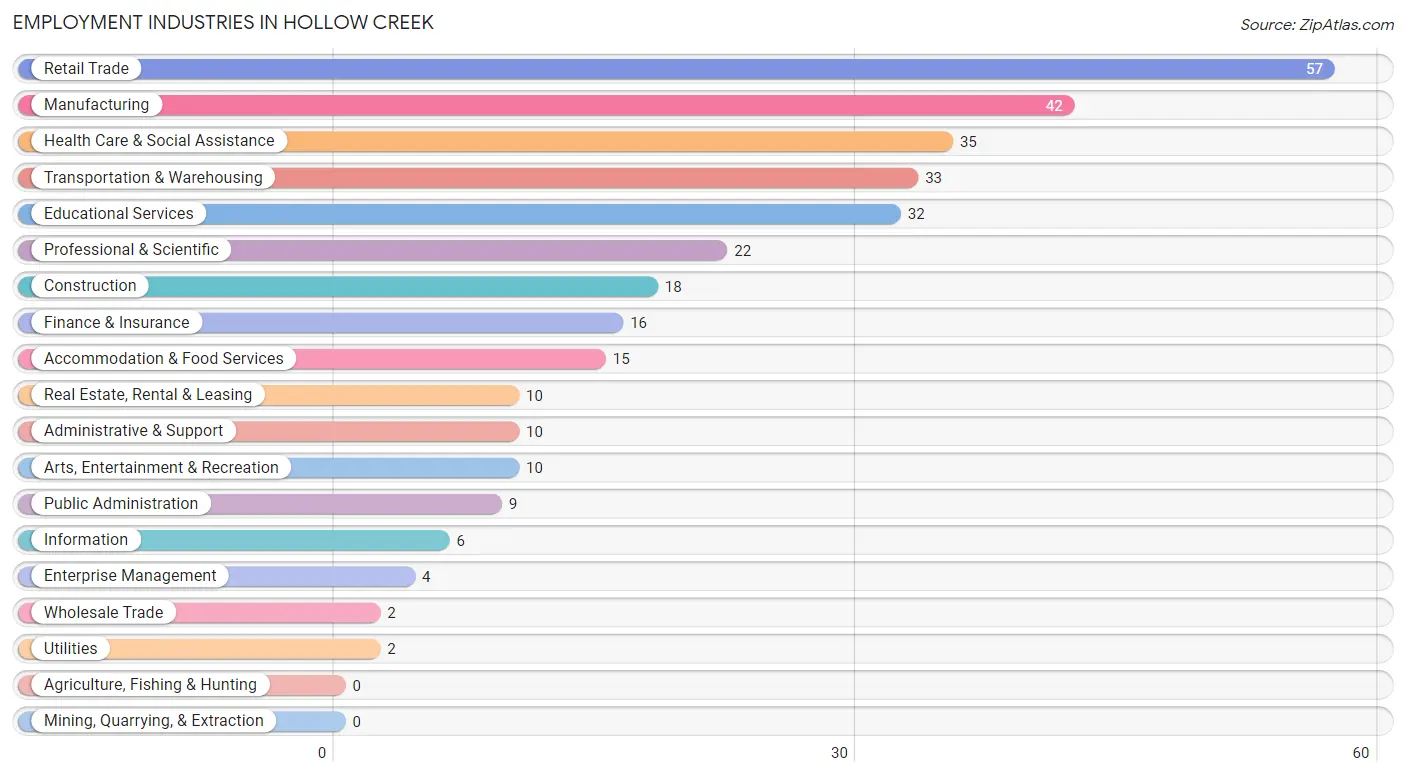
Employment Industries in Hollow Creek
The major employment industries in Hollow Creek include Retail Trade (57 | 17.3%), Manufacturing (42 | 12.7%), Health Care & Social Assistance (35 | 10.6%), Transportation & Warehousing (33 | 10.0%), and Educational Services (32 | 9.7%).
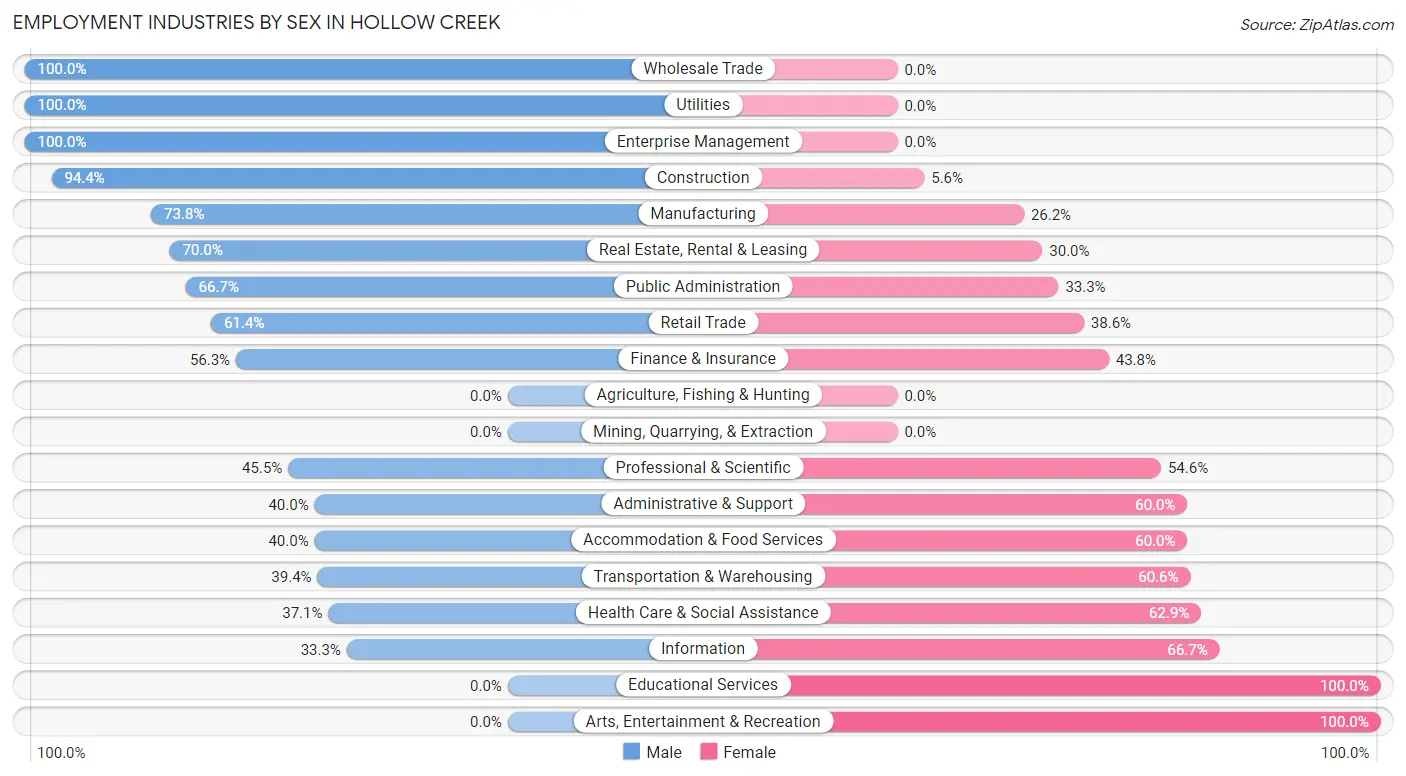
Employment Industries by Sex in Hollow Creek
The Hollow Creek industries that see more men than women are Wholesale Trade (100.0%), Utilities (100.0%), and Enterprise Management (100.0%), whereas the industries that tend to have a higher number of women are Educational Services (100.0%), Arts, Entertainment & Recreation (100.0%), and Information (66.7%).
| Industry | Male | Female |
| Agriculture, Fishing & Hunting | 0 (0.0%) | 0 (0.0%) |
| Mining, Quarrying, & Extraction | 0 (0.0%) | 0 (0.0%) |
| Construction | 17 (94.4%) | 1 (5.6%) |
| Manufacturing | 31 (73.8%) | 11 (26.2%) |
| Wholesale Trade | 2 (100.0%) | 0 (0.0%) |
| Retail Trade | 35 (61.4%) | 22 (38.6%) |
| Transportation & Warehousing | 13 (39.4%) | 20 (60.6%) |
| Utilities | 2 (100.0%) | 0 (0.0%) |
| Information | 2 (33.3%) | 4 (66.7%) |
| Finance & Insurance | 9 (56.2%) | 7 (43.8%) |
| Real Estate, Rental & Leasing | 7 (70.0%) | 3 (30.0%) |
| Professional & Scientific | 10 (45.5%) | 12 (54.5%) |
| Enterprise Management | 4 (100.0%) | 0 (0.0%) |
| Administrative & Support | 4 (40.0%) | 6 (60.0%) |
| Educational Services | 0 (0.0%) | 32 (100.0%) |
| Health Care & Social Assistance | 13 (37.1%) | 22 (62.9%) |
| Arts, Entertainment & Recreation | 0 (0.0%) | 10 (100.0%) |
| Accommodation & Food Services | 6 (40.0%) | 9 (60.0%) |
| Public Administration | 6 (66.7%) | 3 (33.3%) |
| Total | 164 (49.7%) | 166 (50.3%) |
Education in Hollow Creek
School Enrollment in Hollow Creek
The most common levels of schooling among the 151 students in Hollow Creek are elementary school (53 | 35.1%), high school (34 | 22.5%), and middle school (21 | 13.9%).
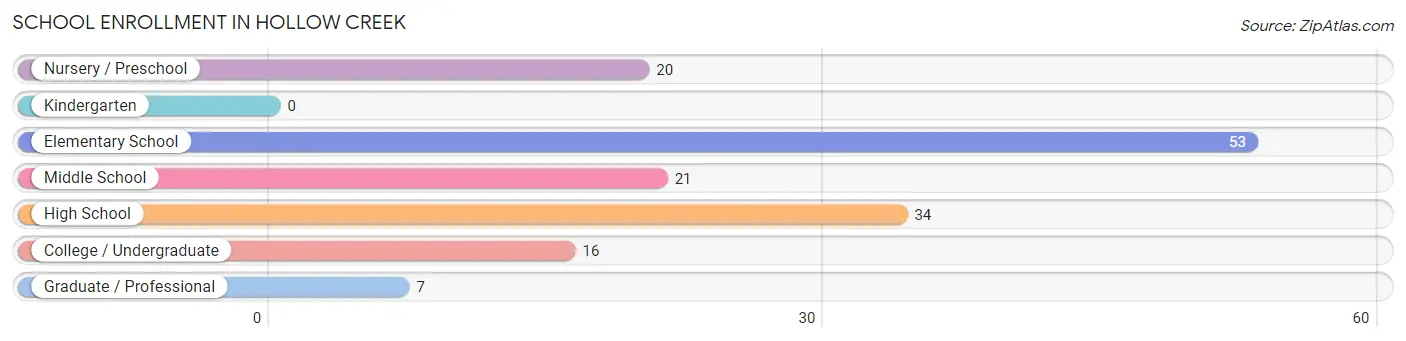
| School Level | # Students | % Students |
| Nursery / Preschool | 20 | 13.3% |
| Kindergarten | 0 | 0.0% |
| Elementary School | 53 | 35.1% |
| Middle School | 21 | 13.9% |
| High School | 34 | 22.5% |
| College / Undergraduate | 16 | 10.6% |
| Graduate / Professional | 7 | 4.6% |
| Total | 151 | 100.0% |
School Enrollment by Age by Funding Source in Hollow Creek
Out of a total of 151 students who are enrolled in schools in Hollow Creek, 32 (21.2%) attend a private institution, while the remaining 119 (78.8%) are enrolled in public schools. The age group of 25 to 34 year olds has the highest likelihood of being enrolled in private schools, with 3 (60.0% in the age bracket) enrolled. Conversely, the age group of 18 to 19 year olds has the lowest likelihood of being enrolled in a private school, with 2 (100.0% in the age bracket) attending a public institution.
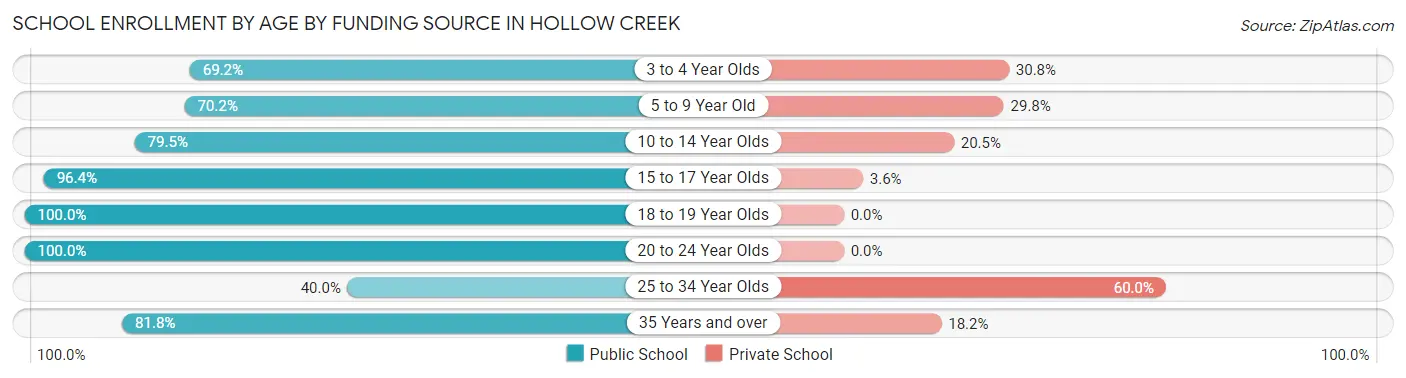
| Age Bracket | Public School | Private School |
| 3 to 4 Year Olds | 9 (69.2%) | 4 (30.8%) |
| 5 to 9 Year Old | 33 (70.2%) | 14 (29.8%) |
| 10 to 14 Year Olds | 31 (79.5%) | 8 (20.5%) |
| 15 to 17 Year Olds | 27 (96.4%) | 1 (3.6%) |
| 18 to 19 Year Olds | 2 (100.0%) | 0 (0.0%) |
| 20 to 24 Year Olds | 6 (100.0%) | 0 (0.0%) |
| 25 to 34 Year Olds | 2 (40.0%) | 3 (60.0%) |
| 35 Years and over | 9 (81.8%) | 2 (18.2%) |
| Total | 119 (78.8%) | 32 (21.2%) |
Educational Attainment by Field of Study in Hollow Creek
Business (36 | 19.2%), science & technology (18 | 9.6%), computers & mathematics (16 | 8.5%), bio, nature & agricultural (16 | 8.5%), and education (16 | 8.5%) are the most common fields of study among 188 individuals in Hollow Creek who have obtained a bachelor's degree or higher.
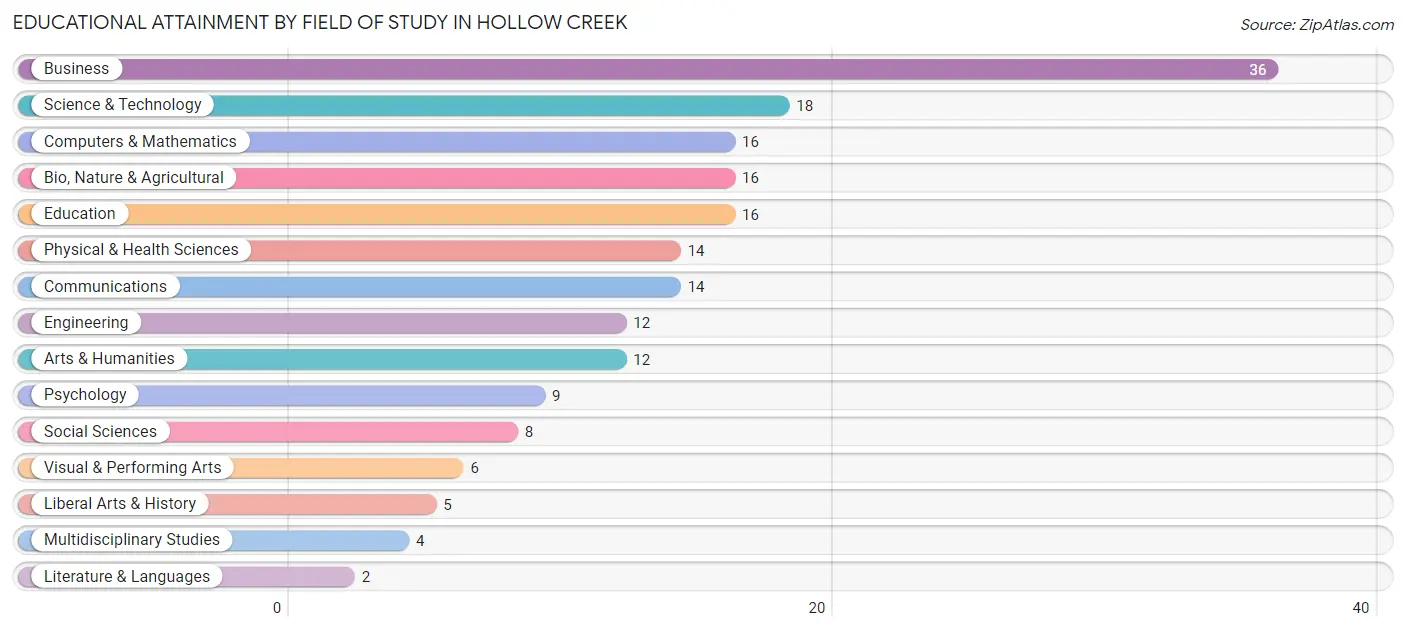
| Field of Study | # Graduates | % Graduates |
| Computers & Mathematics | 16 | 8.5% |
| Bio, Nature & Agricultural | 16 | 8.5% |
| Physical & Health Sciences | 14 | 7.4% |
| Psychology | 9 | 4.8% |
| Social Sciences | 8 | 4.3% |
| Engineering | 12 | 6.4% |
| Multidisciplinary Studies | 4 | 2.1% |
| Science & Technology | 18 | 9.6% |
| Business | 36 | 19.2% |
| Education | 16 | 8.5% |
| Literature & Languages | 2 | 1.1% |
| Liberal Arts & History | 5 | 2.7% |
| Visual & Performing Arts | 6 | 3.2% |
| Communications | 14 | 7.4% |
| Arts & Humanities | 12 | 6.4% |
| Total | 188 | 100.0% |
Transportation & Commute in Hollow Creek
Vehicle Availability by Sex in Hollow Creek
The most prevalent vehicle ownership categories in Hollow Creek are males with 2 vehicles (97, accounting for 56.7%) and females with 2 vehicles (80, making up 56.1%).
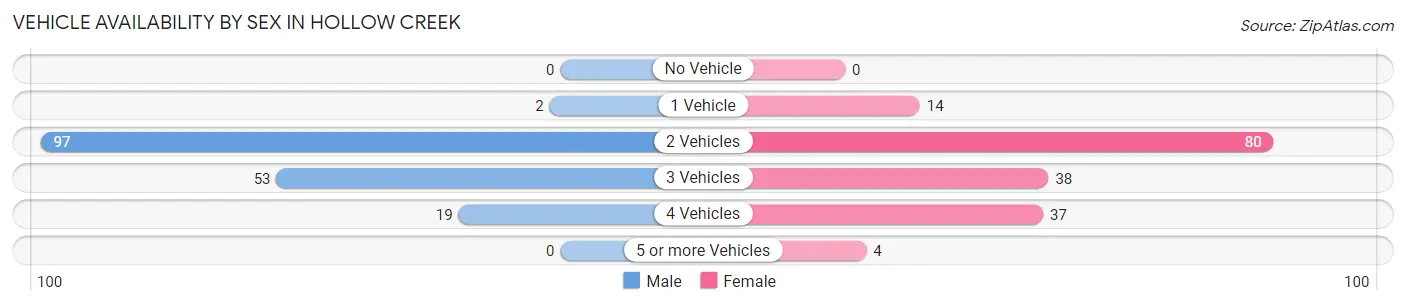
| Vehicles Available | Male | Female |
| No Vehicle | 0 (0.0%) | 0 (0.0%) |
| 1 Vehicle | 2 (1.2%) | 14 (8.1%) |
| 2 Vehicles | 97 (56.7%) | 80 (46.2%) |
| 3 Vehicles | 53 (31.0%) | 38 (22.0%) |
| 4 Vehicles | 19 (11.1%) | 37 (21.4%) |
| 5 or more Vehicles | 0 (0.0%) | 4 (2.3%) |
| Total | 171 (100.0%) | 173 (100.0%) |
Commute Time in Hollow Creek
The most frequently occuring commute durations in Hollow Creek are 15 to 19 minutes (70 commuters, 22.9%), 20 to 24 minutes (57 commuters, 18.6%), and 30 to 34 minutes (42 commuters, 13.7%).
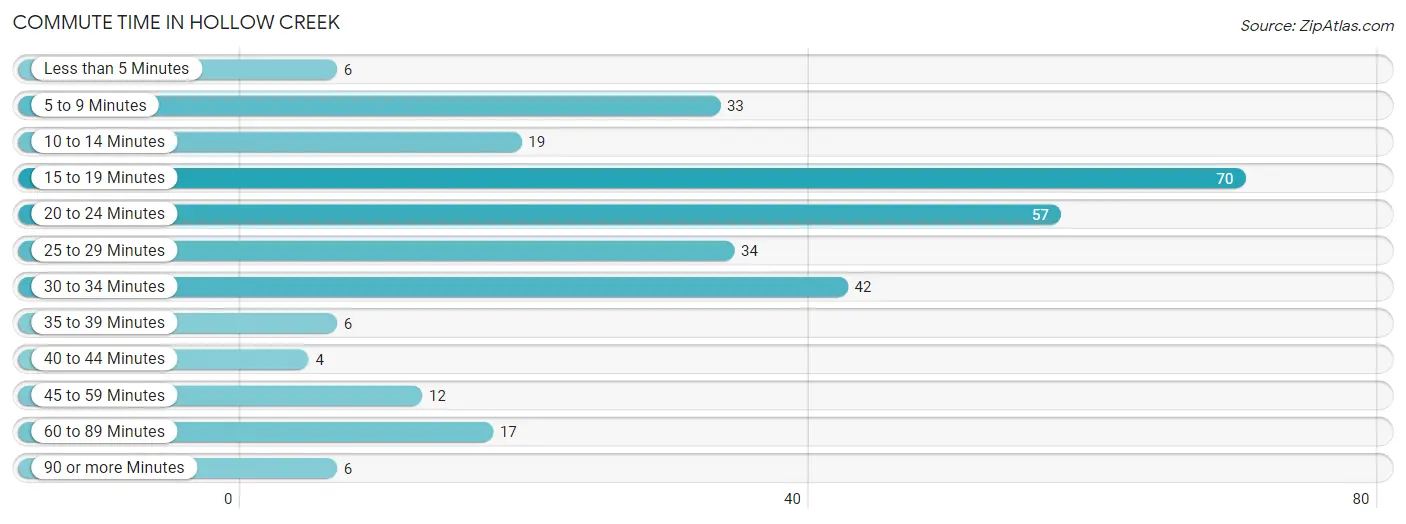
| Commute Time | # Commuters | % Commuters |
| Less than 5 Minutes | 6 | 2.0% |
| 5 to 9 Minutes | 33 | 10.8% |
| 10 to 14 Minutes | 19 | 6.2% |
| 15 to 19 Minutes | 70 | 22.9% |
| 20 to 24 Minutes | 57 | 18.6% |
| 25 to 29 Minutes | 34 | 11.1% |
| 30 to 34 Minutes | 42 | 13.7% |
| 35 to 39 Minutes | 6 | 2.0% |
| 40 to 44 Minutes | 4 | 1.3% |
| 45 to 59 Minutes | 12 | 3.9% |
| 60 to 89 Minutes | 17 | 5.6% |
| 90 or more Minutes | 6 | 2.0% |
Commute Time by Sex in Hollow Creek
The most common commute times in Hollow Creek are 20 to 24 minutes (31 commuters, 20.0%) for males and 15 to 19 minutes (56 commuters, 37.1%) for females.
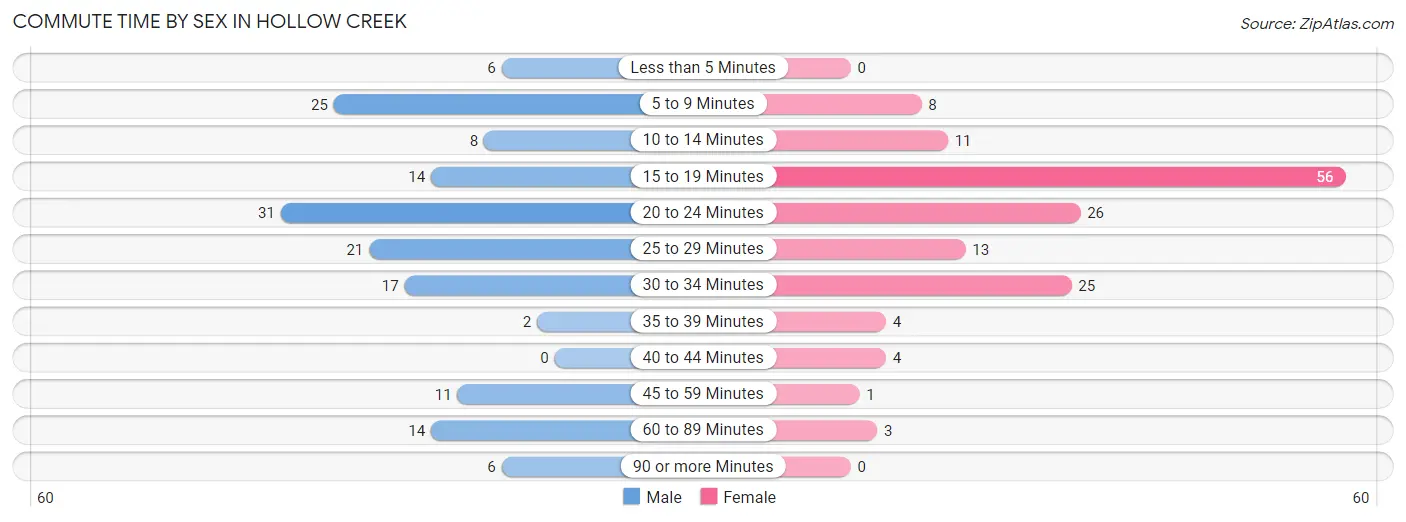
| Commute Time | Male | Female |
| Less than 5 Minutes | 6 (3.9%) | 0 (0.0%) |
| 5 to 9 Minutes | 25 (16.1%) | 8 (5.3%) |
| 10 to 14 Minutes | 8 (5.2%) | 11 (7.3%) |
| 15 to 19 Minutes | 14 (9.0%) | 56 (37.1%) |
| 20 to 24 Minutes | 31 (20.0%) | 26 (17.2%) |
| 25 to 29 Minutes | 21 (13.6%) | 13 (8.6%) |
| 30 to 34 Minutes | 17 (11.0%) | 25 (16.6%) |
| 35 to 39 Minutes | 2 (1.3%) | 4 (2.6%) |
| 40 to 44 Minutes | 0 (0.0%) | 4 (2.6%) |
| 45 to 59 Minutes | 11 (7.1%) | 1 (0.7%) |
| 60 to 89 Minutes | 14 (9.0%) | 3 (2.0%) |
| 90 or more Minutes | 6 (3.9%) | 0 (0.0%) |
Time of Departure to Work by Sex in Hollow Creek
The most frequent times of departure to work in Hollow Creek are 12:00 AM to 4:59 AM (23, 14.8%) for males and 7:30 AM to 7:59 AM (27, 17.9%) for females.
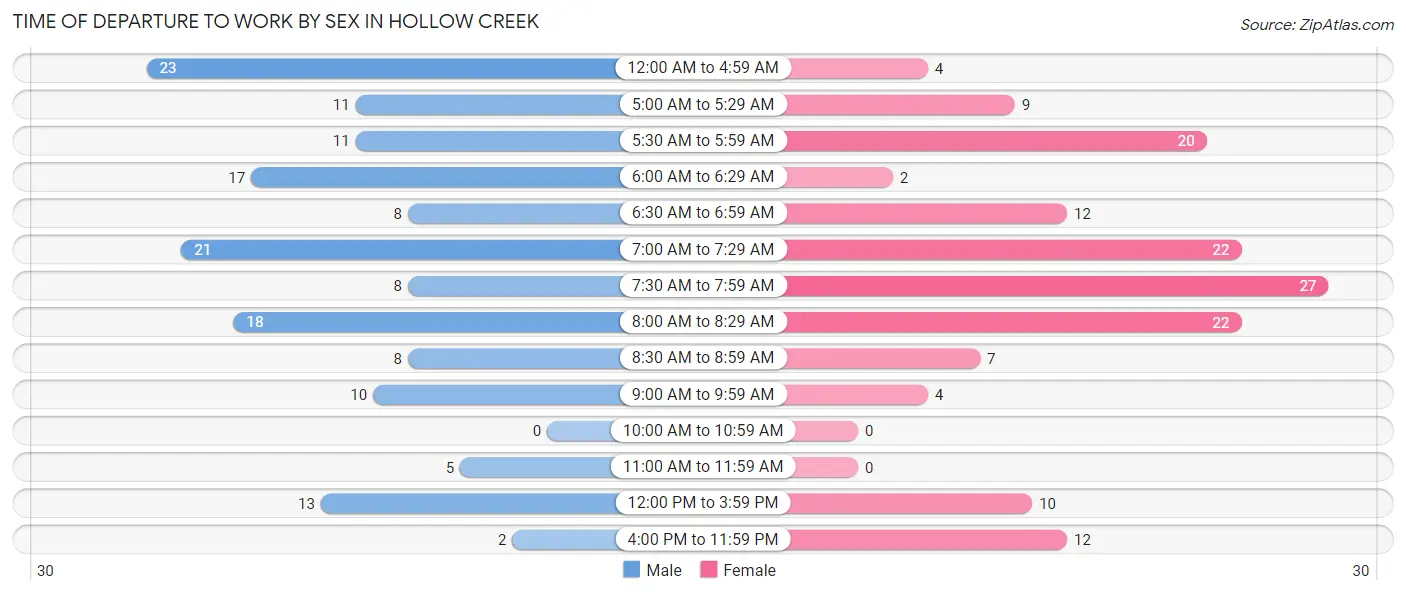
| Time of Departure | Male | Female |
| 12:00 AM to 4:59 AM | 23 (14.8%) | 4 (2.6%) |
| 5:00 AM to 5:29 AM | 11 (7.1%) | 9 (6.0%) |
| 5:30 AM to 5:59 AM | 11 (7.1%) | 20 (13.3%) |
| 6:00 AM to 6:29 AM | 17 (11.0%) | 2 (1.3%) |
| 6:30 AM to 6:59 AM | 8 (5.2%) | 12 (8.0%) |
| 7:00 AM to 7:29 AM | 21 (13.6%) | 22 (14.6%) |
| 7:30 AM to 7:59 AM | 8 (5.2%) | 27 (17.9%) |
| 8:00 AM to 8:29 AM | 18 (11.6%) | 22 (14.6%) |
| 8:30 AM to 8:59 AM | 8 (5.2%) | 7 (4.6%) |
| 9:00 AM to 9:59 AM | 10 (6.5%) | 4 (2.6%) |
| 10:00 AM to 10:59 AM | 0 (0.0%) | 0 (0.0%) |
| 11:00 AM to 11:59 AM | 5 (3.2%) | 0 (0.0%) |
| 12:00 PM to 3:59 PM | 13 (8.4%) | 10 (6.6%) |
| 4:00 PM to 11:59 PM | 2 (1.3%) | 12 (8.0%) |
| Total | 155 (100.0%) | 151 (100.0%) |
Housing Occupancy in Hollow Creek
Occupancy by Ownership in Hollow Creek
Of the total 277 dwellings in Hollow Creek, owner-occupied units account for 272 (98.2%), while renter-occupied units make up 5 (1.8%).
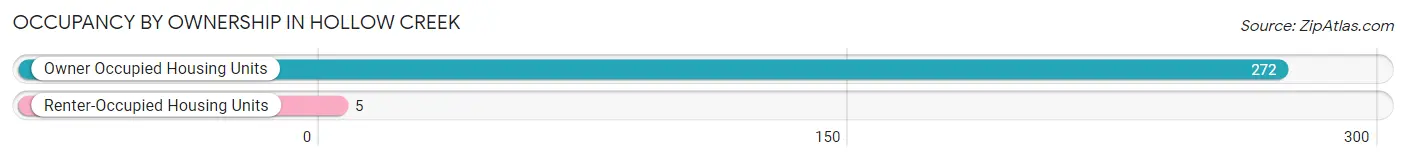
| Occupancy | # Housing Units | % Housing Units |
| Owner Occupied Housing Units | 272 | 98.2% |
| Renter-Occupied Housing Units | 5 | 1.8% |
| Total Occupied Housing Units | 277 | 100.0% |
Occupancy by Household Size in Hollow Creek
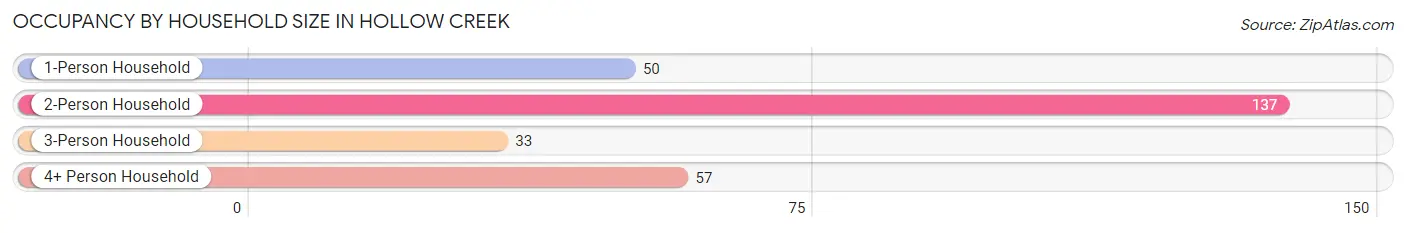
| Household Size | # Housing Units | % Housing Units |
| 1-Person Household | 50 | 18.0% |
| 2-Person Household | 137 | 49.5% |
| 3-Person Household | 33 | 11.9% |
| 4+ Person Household | 57 | 20.6% |
| Total Housing Units | 277 | 100.0% |
Occupancy by Ownership by Household Size in Hollow Creek
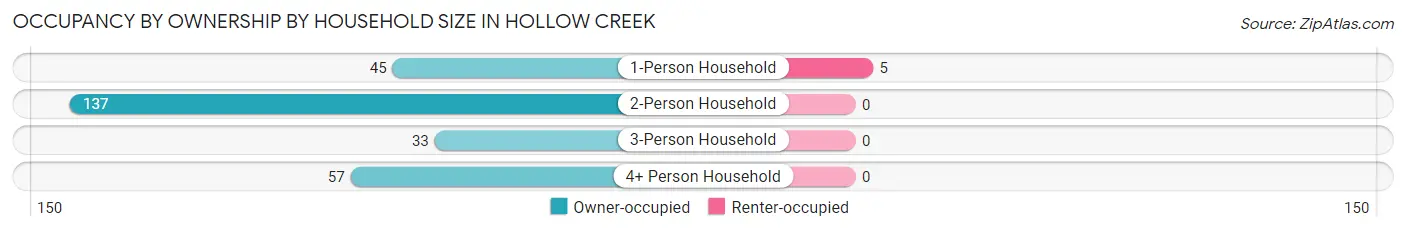
| Household Size | Owner-occupied | Renter-occupied |
| 1-Person Household | 45 (90.0%) | 5 (10.0%) |
| 2-Person Household | 137 (100.0%) | 0 (0.0%) |
| 3-Person Household | 33 (100.0%) | 0 (0.0%) |
| 4+ Person Household | 57 (100.0%) | 0 (0.0%) |
| Total Housing Units | 272 (98.2%) | 5 (1.8%) |
Occupancy by Educational Attainment in Hollow Creek
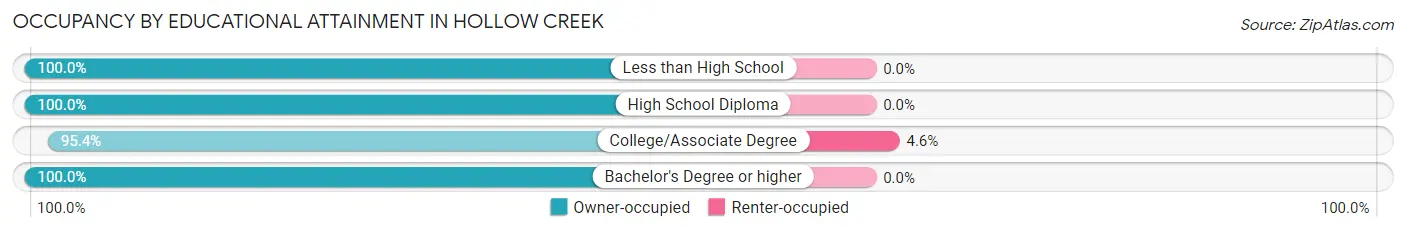
| Household Size | Owner-occupied | Renter-occupied |
| Less than High School | 4 (100.0%) | 0 (0.0%) |
| High School Diploma | 69 (100.0%) | 0 (0.0%) |
| College/Associate Degree | 103 (95.4%) | 5 (4.6%) |
| Bachelor's Degree or higher | 96 (100.0%) | 0 (0.0%) |
Occupancy by Age of Householder in Hollow Creek
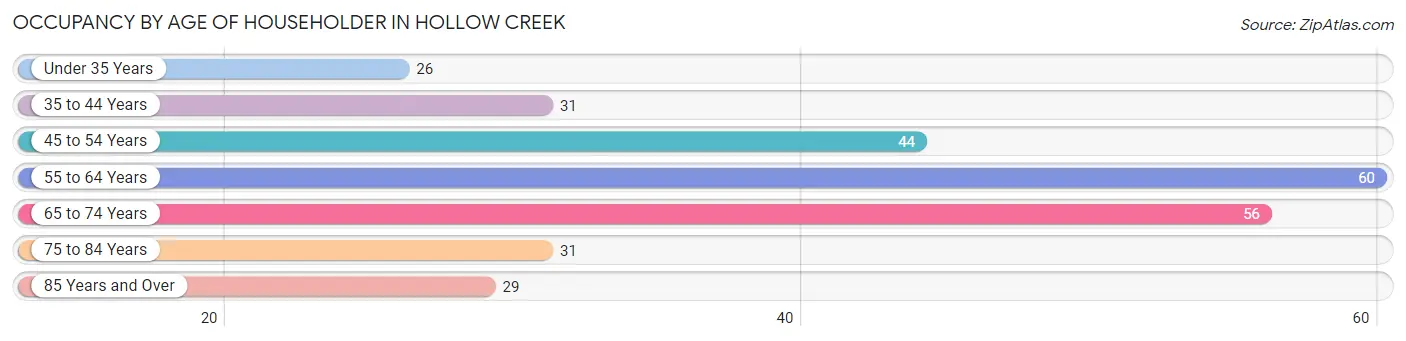
| Age Bracket | # Households | % Households |
| Under 35 Years | 26 | 9.4% |
| 35 to 44 Years | 31 | 11.2% |
| 45 to 54 Years | 44 | 15.9% |
| 55 to 64 Years | 60 | 21.7% |
| 65 to 74 Years | 56 | 20.2% |
| 75 to 84 Years | 31 | 11.2% |
| 85 Years and Over | 29 | 10.5% |
| Total | 277 | 100.0% |
Housing Finances in Hollow Creek
Median Income by Occupancy in Hollow Creek
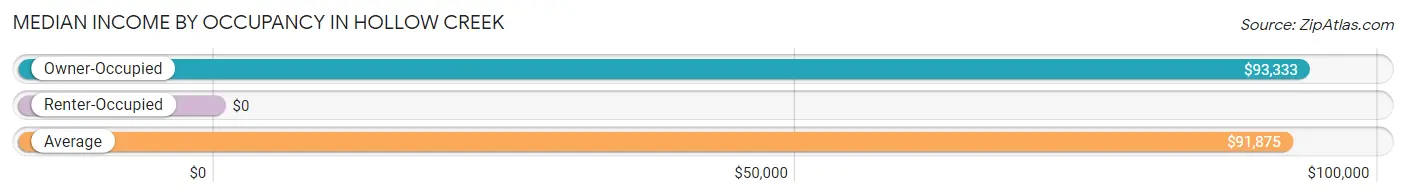
| Occupancy Type | # Households | Median Income |
| Owner-Occupied | 272 (98.2%) | $93,333 |
| Renter-Occupied | 5 (1.8%) | $0 |
| Average | 277 (100.0%) | $91,875 |
Occupancy by Householder Income Bracket in Hollow Creek
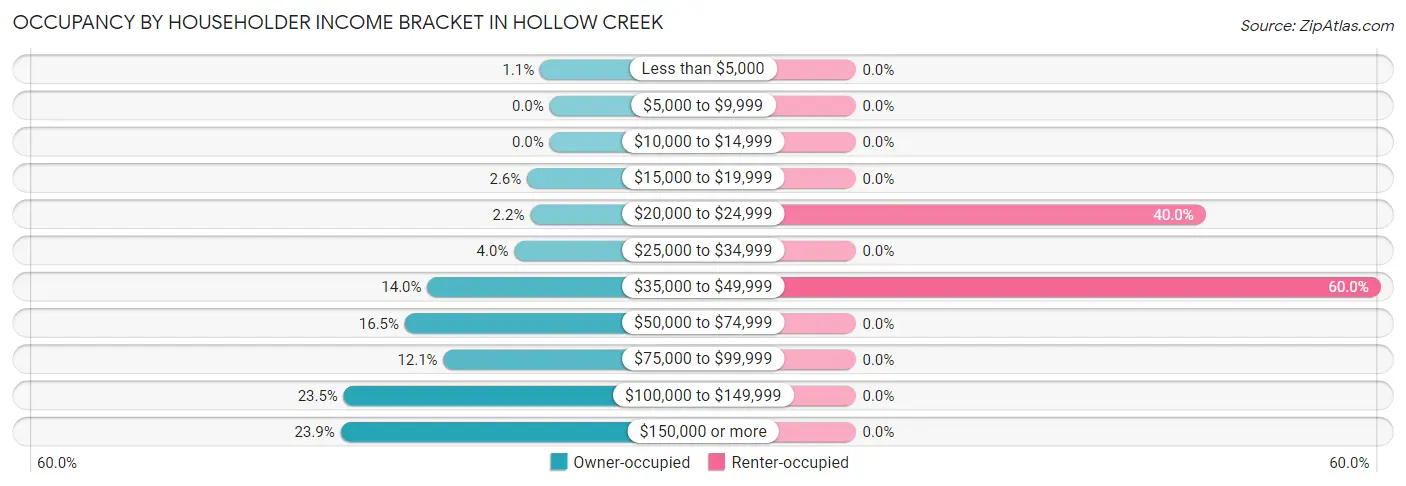
| Income Bracket | Owner-occupied | Renter-occupied |
| Less than $5,000 | 3 (1.1%) | 0 (0.0%) |
| $5,000 to $9,999 | 0 (0.0%) | 0 (0.0%) |
| $10,000 to $14,999 | 0 (0.0%) | 0 (0.0%) |
| $15,000 to $19,999 | 7 (2.6%) | 0 (0.0%) |
| $20,000 to $24,999 | 6 (2.2%) | 2 (40.0%) |
| $25,000 to $34,999 | 11 (4.0%) | 0 (0.0%) |
| $35,000 to $49,999 | 38 (14.0%) | 3 (60.0%) |
| $50,000 to $74,999 | 45 (16.5%) | 0 (0.0%) |
| $75,000 to $99,999 | 33 (12.1%) | 0 (0.0%) |
| $100,000 to $149,999 | 64 (23.5%) | 0 (0.0%) |
| $150,000 or more | 65 (23.9%) | 0 (0.0%) |
| Total | 272 (100.0%) | 5 (100.0%) |
Monthly Housing Cost Tiers in Hollow Creek
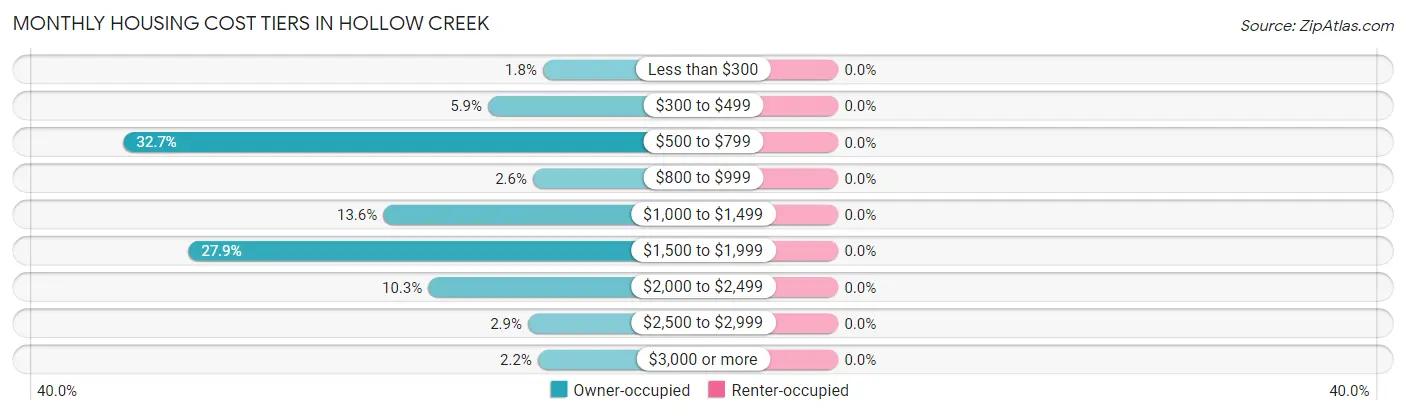
| Monthly Cost | Owner-occupied | Renter-occupied |
| Less than $300 | 5 (1.8%) | 0 (0.0%) |
| $300 to $499 | 16 (5.9%) | 0 (0.0%) |
| $500 to $799 | 89 (32.7%) | 0 (0.0%) |
| $800 to $999 | 7 (2.6%) | 0 (0.0%) |
| $1,000 to $1,499 | 37 (13.6%) | 0 (0.0%) |
| $1,500 to $1,999 | 76 (27.9%) | 0 (0.0%) |
| $2,000 to $2,499 | 28 (10.3%) | 0 (0.0%) |
| $2,500 to $2,999 | 8 (2.9%) | 0 (0.0%) |
| $3,000 or more | 6 (2.2%) | 0 (0.0%) |
| Total | 272 (100.0%) | 5 (100.0%) |
Physical Housing Characteristics in Hollow Creek
Housing Structures in Hollow Creek
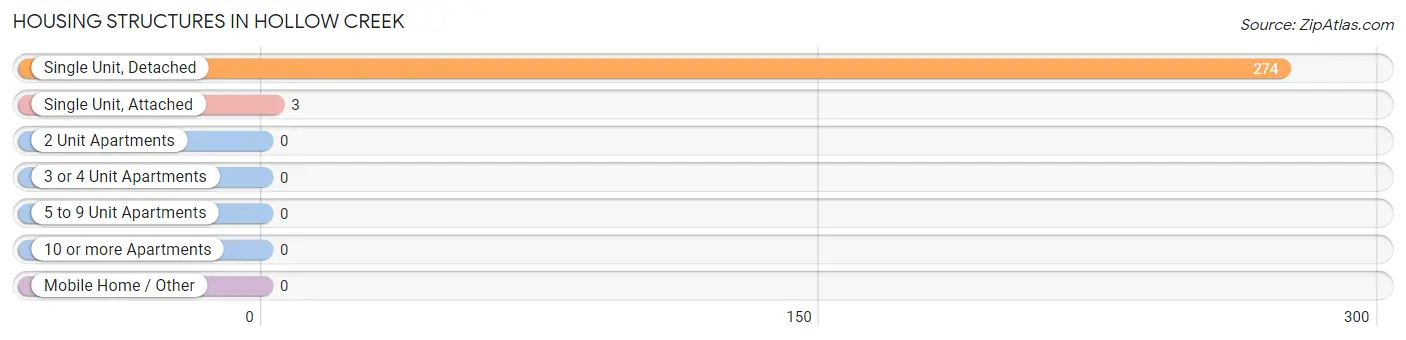
| Structure Type | # Housing Units | % Housing Units |
| Single Unit, Detached | 274 | 98.9% |
| Single Unit, Attached | 3 | 1.1% |
| 2 Unit Apartments | 0 | 0.0% |
| 3 or 4 Unit Apartments | 0 | 0.0% |
| 5 to 9 Unit Apartments | 0 | 0.0% |
| 10 or more Apartments | 0 | 0.0% |
| Mobile Home / Other | 0 | 0.0% |
| Total | 277 | 100.0% |
Housing Structures by Occupancy in Hollow Creek
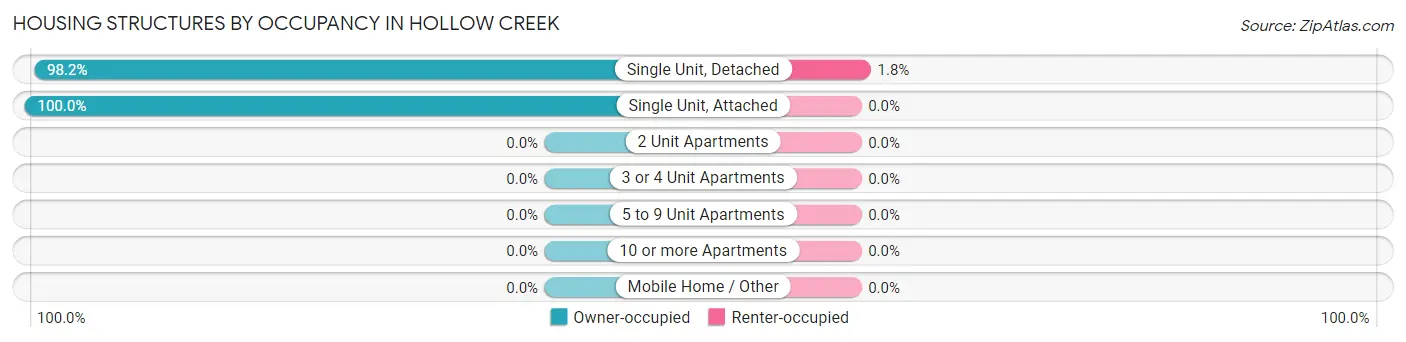
| Structure Type | Owner-occupied | Renter-occupied |
| Single Unit, Detached | 269 (98.2%) | 5 (1.8%) |
| Single Unit, Attached | 3 (100.0%) | 0 (0.0%) |
| 2 Unit Apartments | 0 (0.0%) | 0 (0.0%) |
| 3 or 4 Unit Apartments | 0 (0.0%) | 0 (0.0%) |
| 5 to 9 Unit Apartments | 0 (0.0%) | 0 (0.0%) |
| 10 or more Apartments | 0 (0.0%) | 0 (0.0%) |
| Mobile Home / Other | 0 (0.0%) | 0 (0.0%) |
| Total | 272 (98.2%) | 5 (1.8%) |
Housing Structures by Number of Rooms in Hollow Creek
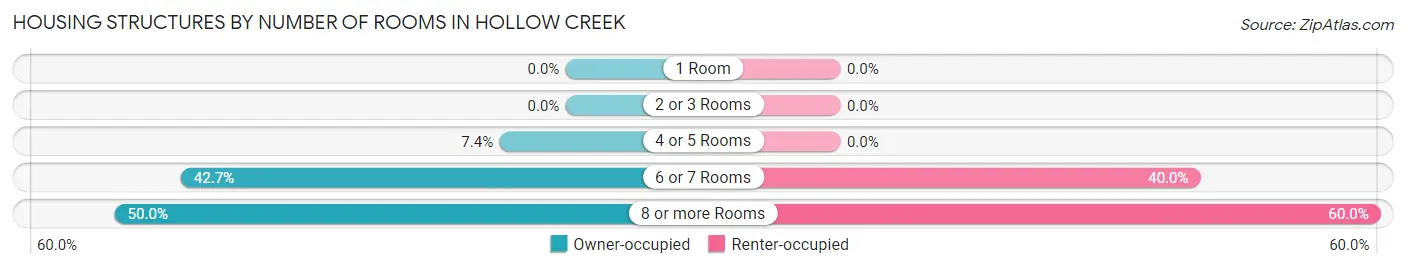
| Number of Rooms | Owner-occupied | Renter-occupied |
| 1 Room | 0 (0.0%) | 0 (0.0%) |
| 2 or 3 Rooms | 0 (0.0%) | 0 (0.0%) |
| 4 or 5 Rooms | 20 (7.3%) | 0 (0.0%) |
| 6 or 7 Rooms | 116 (42.6%) | 2 (40.0%) |
| 8 or more Rooms | 136 (50.0%) | 3 (60.0%) |
| Total | 272 (100.0%) | 5 (100.0%) |
Housing Structure by Heating Type in Hollow Creek
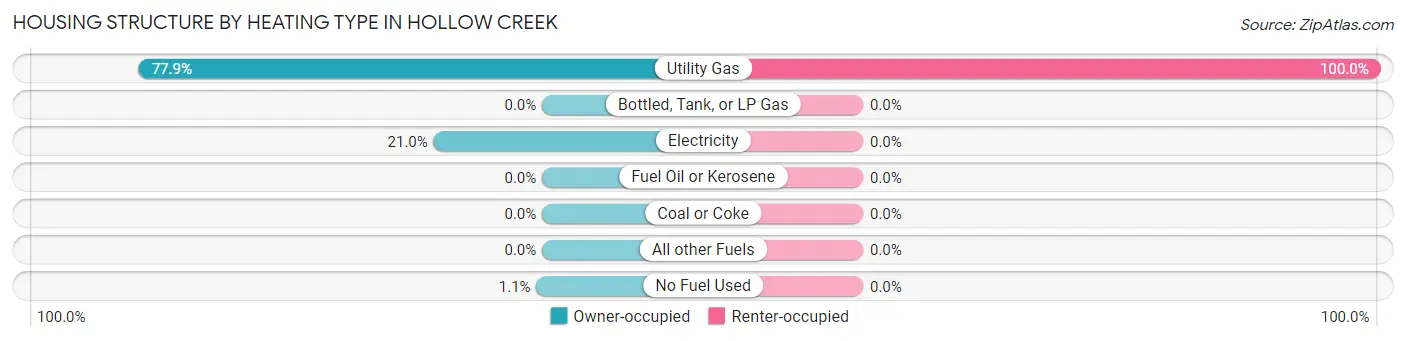
| Heating Type | Owner-occupied | Renter-occupied |
| Utility Gas | 212 (77.9%) | 5 (100.0%) |
| Bottled, Tank, or LP Gas | 0 (0.0%) | 0 (0.0%) |
| Electricity | 57 (21.0%) | 0 (0.0%) |
| Fuel Oil or Kerosene | 0 (0.0%) | 0 (0.0%) |
| Coal or Coke | 0 (0.0%) | 0 (0.0%) |
| All other Fuels | 0 (0.0%) | 0 (0.0%) |
| No Fuel Used | 3 (1.1%) | 0 (0.0%) |
| Total | 272 (100.0%) | 5 (100.0%) |
Household Vehicle Usage in Hollow Creek

| Vehicles per Household | Owner-occupied | Renter-occupied |
| No Vehicle | 12 (4.4%) | 0 (0.0%) |
| 1 Vehicle | 39 (14.3%) | 3 (60.0%) |
| 2 Vehicles | 142 (52.2%) | 0 (0.0%) |
| 3 or more Vehicles | 79 (29.0%) | 2 (40.0%) |
| Total | 272 (100.0%) | 5 (100.0%) |
Real Estate & Mortgages in Hollow Creek
Real Estate and Mortgage Overview in Hollow Creek
| Characteristic | Without Mortgage | With Mortgage |
| Housing Units | 105 | 167 |
| Median Property Value | $222,700 | $247,400 |
| Median Household Income | $54,028 | $48 |
| Monthly Housing Costs | $572 | $6 |
| Real Estate Taxes | $1,850 | $6 |
Property Value by Mortgage Status in Hollow Creek
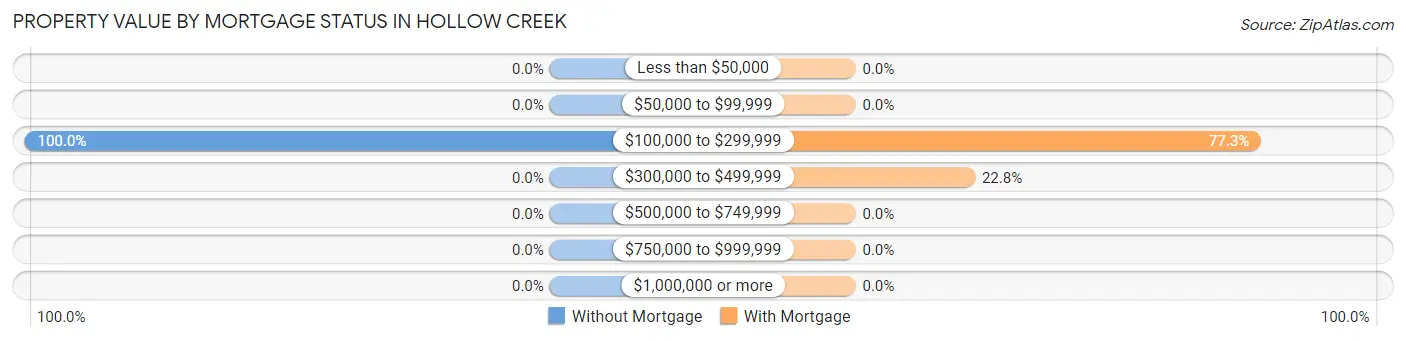
| Property Value | Without Mortgage | With Mortgage |
| Less than $50,000 | 0 (0.0%) | 0 (0.0%) |
| $50,000 to $99,999 | 0 (0.0%) | 0 (0.0%) |
| $100,000 to $299,999 | 105 (100.0%) | 129 (77.2%) |
| $300,000 to $499,999 | 0 (0.0%) | 38 (22.8%) |
| $500,000 to $749,999 | 0 (0.0%) | 0 (0.0%) |
| $750,000 to $999,999 | 0 (0.0%) | 0 (0.0%) |
| $1,000,000 or more | 0 (0.0%) | 0 (0.0%) |
| Total | 105 (100.0%) | 167 (100.0%) |
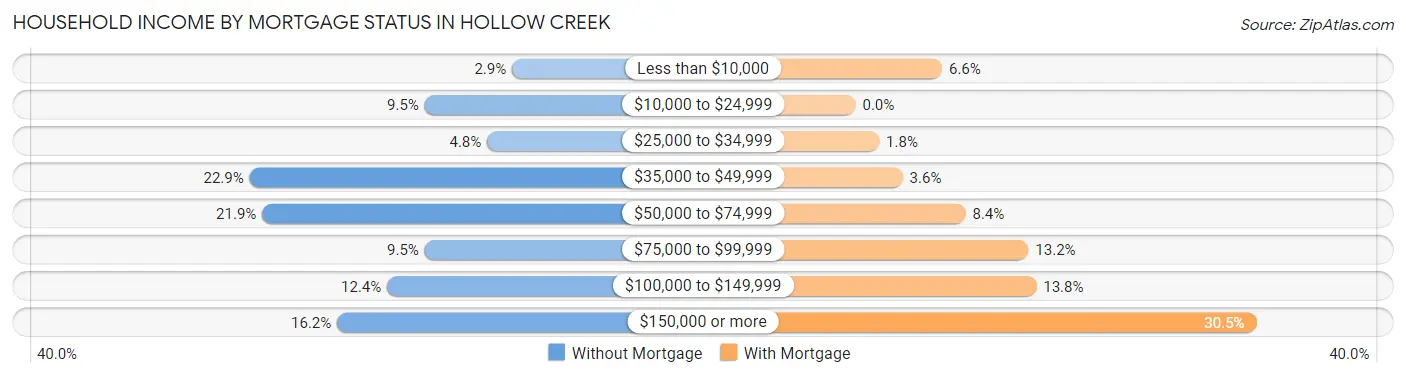
Household Income by Mortgage Status in Hollow Creek
| Household Income | Without Mortgage | With Mortgage |
| Less than $10,000 | 3 (2.9%) | 11 (6.6%) |
| $10,000 to $24,999 | 10 (9.5%) | 0 (0.0%) |
| $25,000 to $34,999 | 5 (4.8%) | 3 (1.8%) |
| $35,000 to $49,999 | 24 (22.9%) | 6 (3.6%) |
| $50,000 to $74,999 | 23 (21.9%) | 14 (8.4%) |
| $75,000 to $99,999 | 10 (9.5%) | 22 (13.2%) |
| $100,000 to $149,999 | 13 (12.4%) | 23 (13.8%) |
| $150,000 or more | 17 (16.2%) | 51 (30.5%) |
| Total | 105 (100.0%) | 167 (100.0%) |
Property Value to Household Income Ratio in Hollow Creek
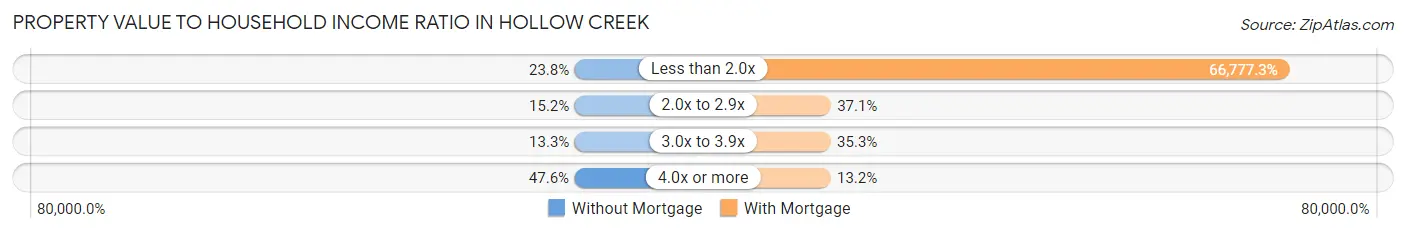
| Value-to-Income Ratio | Without Mortgage | With Mortgage |
| Less than 2.0x | 25 (23.8%) | 111,518 (66,777.3%) |
| 2.0x to 2.9x | 16 (15.2%) | 62 (37.1%) |
| 3.0x to 3.9x | 14 (13.3%) | 59 (35.3%) |
| 4.0x or more | 50 (47.6%) | 22 (13.2%) |
| Total | 105 (100.0%) | 167 (100.0%) |
Real Estate Taxes by Mortgage Status in Hollow Creek
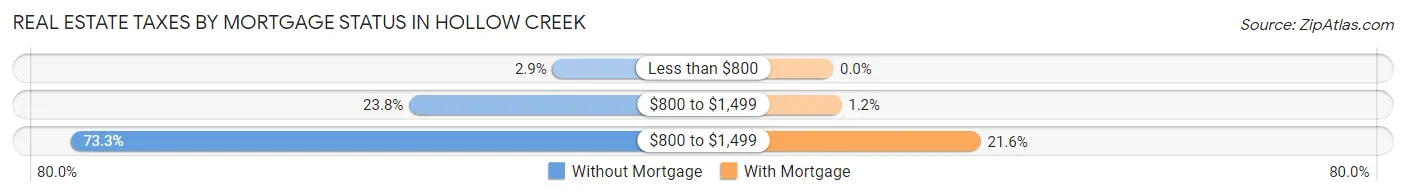
| Property Taxes | Without Mortgage | With Mortgage |
| Less than $800 | 3 (2.9%) | 0 (0.0%) |
| $800 to $1,499 | 25 (23.8%) | 2 (1.2%) |
| $800 to $1,499 | 77 (73.3%) | 36 (21.6%) |
| Total | 105 (100.0%) | 167 (100.0%) |
Health & Disability in Hollow Creek
Health Insurance Coverage by Age in Hollow Creek
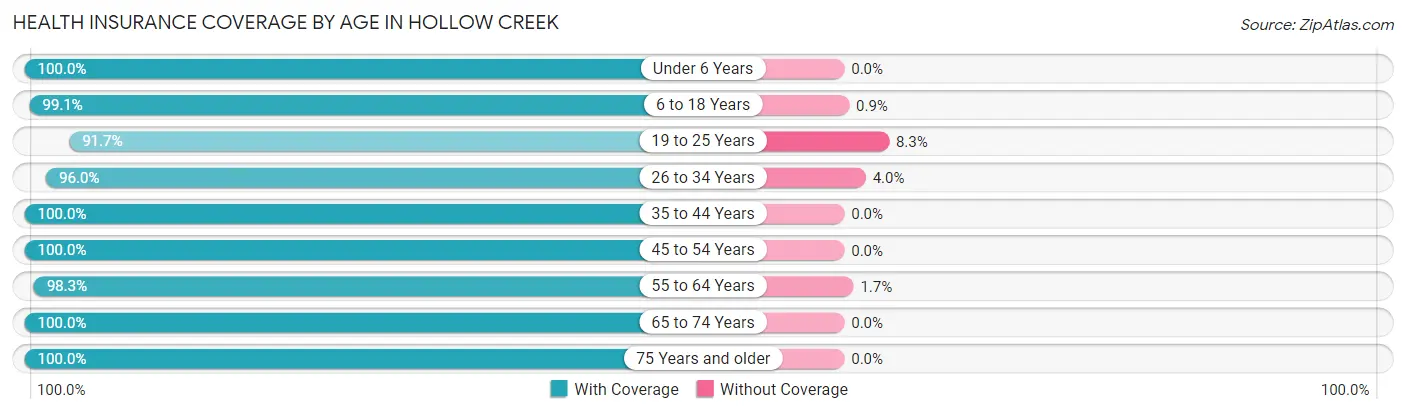
| Age Bracket | With Coverage | Without Coverage |
| Under 6 Years | 43 (100.0%) | 0 (0.0%) |
| 6 to 18 Years | 110 (99.1%) | 1 (0.9%) |
| 19 to 25 Years | 33 (91.7%) | 3 (8.3%) |
| 26 to 34 Years | 48 (96.0%) | 2 (4.0%) |
| 35 to 44 Years | 55 (100.0%) | 0 (0.0%) |
| 45 to 54 Years | 77 (100.0%) | 0 (0.0%) |
| 55 to 64 Years | 115 (98.3%) | 2 (1.7%) |
| 65 to 74 Years | 90 (100.0%) | 0 (0.0%) |
| 75 Years and older | 109 (100.0%) | 0 (0.0%) |
| Total | 680 (98.8%) | 8 (1.2%) |
Health Insurance Coverage by Citizenship Status in Hollow Creek
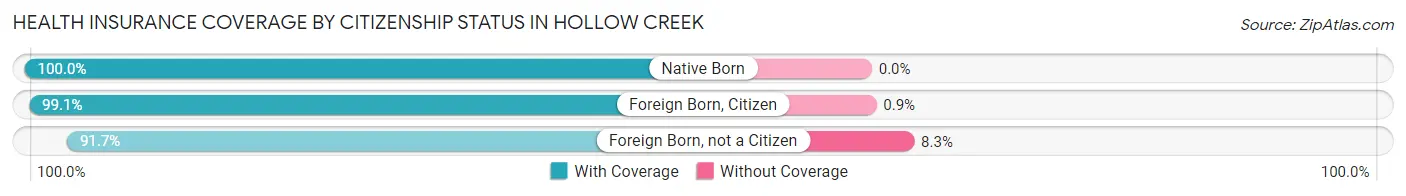
| Citizenship Status | With Coverage | Without Coverage |
| Native Born | 43 (100.0%) | 0 (0.0%) |
| Foreign Born, Citizen | 110 (99.1%) | 1 (0.9%) |
| Foreign Born, not a Citizen | 33 (91.7%) | 3 (8.3%) |
Health Insurance Coverage by Household Income in Hollow Creek
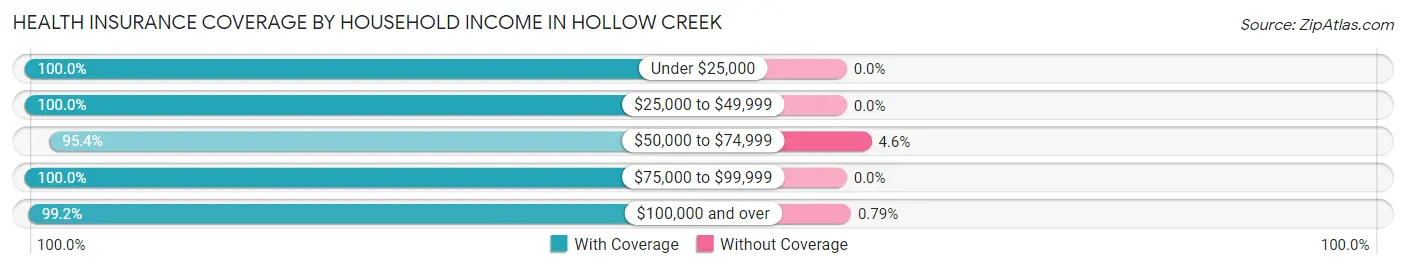
| Household Income | With Coverage | Without Coverage |
| Under $25,000 | 23 (100.0%) | 0 (0.0%) |
| $25,000 to $49,999 | 96 (100.0%) | 0 (0.0%) |
| $50,000 to $74,999 | 103 (95.4%) | 5 (4.6%) |
| $75,000 to $99,999 | 83 (100.0%) | 0 (0.0%) |
| $100,000 and over | 375 (99.2%) | 3 (0.8%) |
Public vs Private Health Insurance Coverage by Age in Hollow Creek
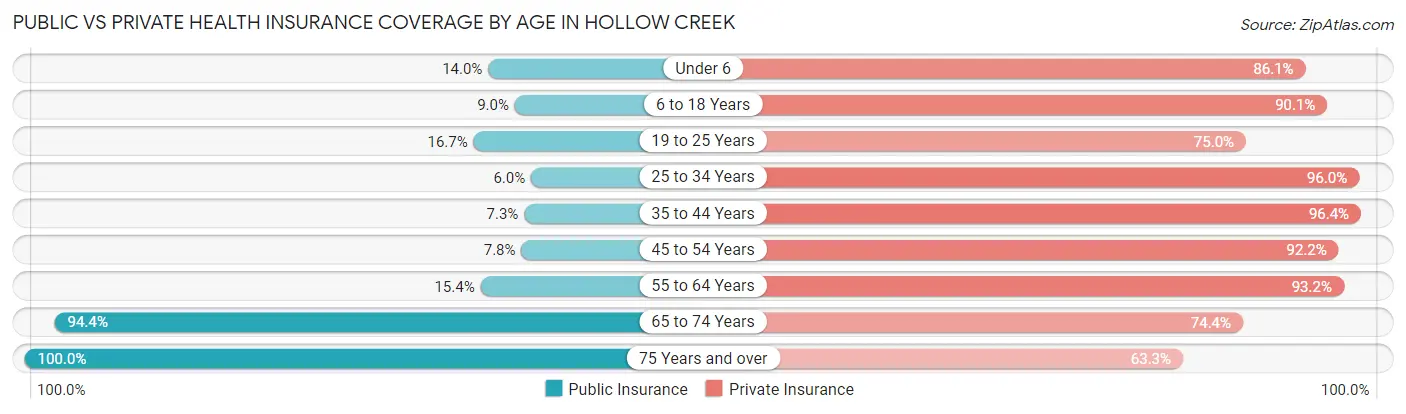
| Age Bracket | Public Insurance | Private Insurance |
| Under 6 | 6 (14.0%) | 37 (86.1%) |
| 6 to 18 Years | 10 (9.0%) | 100 (90.1%) |
| 19 to 25 Years | 6 (16.7%) | 27 (75.0%) |
| 25 to 34 Years | 3 (6.0%) | 48 (96.0%) |
| 35 to 44 Years | 4 (7.3%) | 53 (96.4%) |
| 45 to 54 Years | 6 (7.8%) | 71 (92.2%) |
| 55 to 64 Years | 18 (15.4%) | 109 (93.2%) |
| 65 to 74 Years | 85 (94.4%) | 67 (74.4%) |
| 75 Years and over | 109 (100.0%) | 69 (63.3%) |
| Total | 247 (35.9%) | 581 (84.5%) |
Disability Status by Sex by Age in Hollow Creek
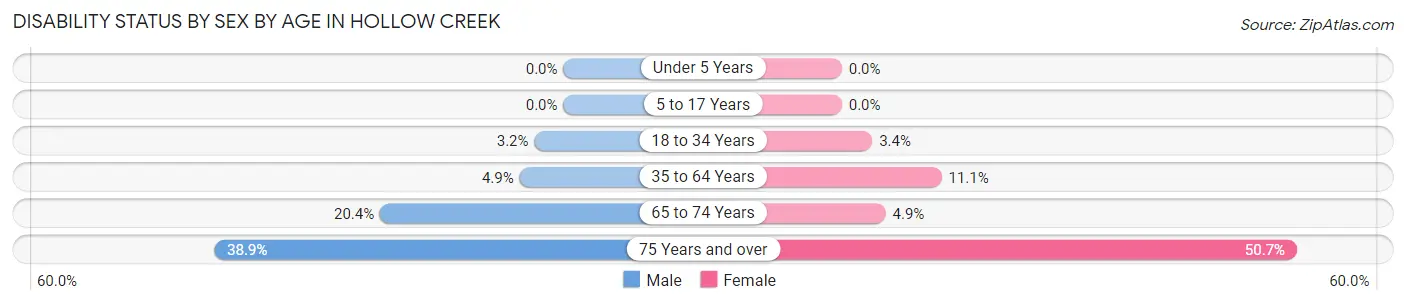
| Age Bracket | Male | Female |
| Under 5 Years | 0 (0.0%) | 0 (0.0%) |
| 5 to 17 Years | 0 (0.0%) | 0 (0.0%) |
| 18 to 34 Years | 1 (3.2%) | 2 (3.4%) |
| 35 to 64 Years | 6 (4.9%) | 14 (11.1%) |
| 65 to 74 Years | 10 (20.4%) | 2 (4.9%) |
| 75 Years and over | 14 (38.9%) | 37 (50.7%) |
Disability Class by Sex by Age in Hollow Creek
Disability Class: Hearing Difficulty
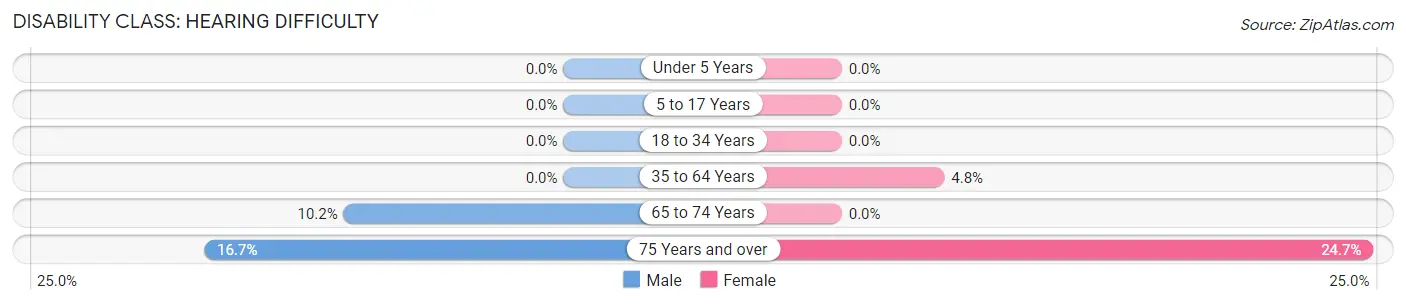
| Age Bracket | Male | Female |
| Under 5 Years | 0 (0.0%) | 0 (0.0%) |
| 5 to 17 Years | 0 (0.0%) | 0 (0.0%) |
| 18 to 34 Years | 0 (0.0%) | 0 (0.0%) |
| 35 to 64 Years | 0 (0.0%) | 6 (4.8%) |
| 65 to 74 Years | 5 (10.2%) | 0 (0.0%) |
| 75 Years and over | 6 (16.7%) | 18 (24.7%) |
Disability Class: Vision Difficulty
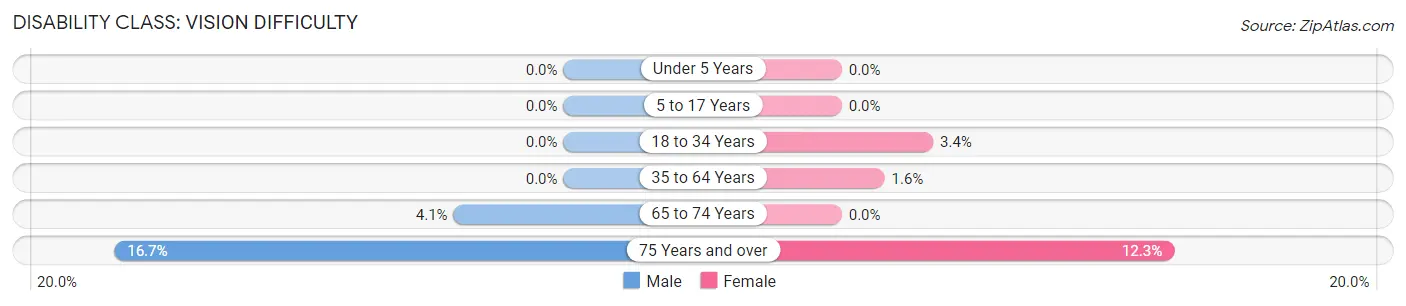
| Age Bracket | Male | Female |
| Under 5 Years | 0 (0.0%) | 0 (0.0%) |
| 5 to 17 Years | 0 (0.0%) | 0 (0.0%) |
| 18 to 34 Years | 0 (0.0%) | 2 (3.4%) |
| 35 to 64 Years | 0 (0.0%) | 2 (1.6%) |
| 65 to 74 Years | 2 (4.1%) | 0 (0.0%) |
| 75 Years and over | 6 (16.7%) | 9 (12.3%) |
Disability Class: Cognitive Difficulty
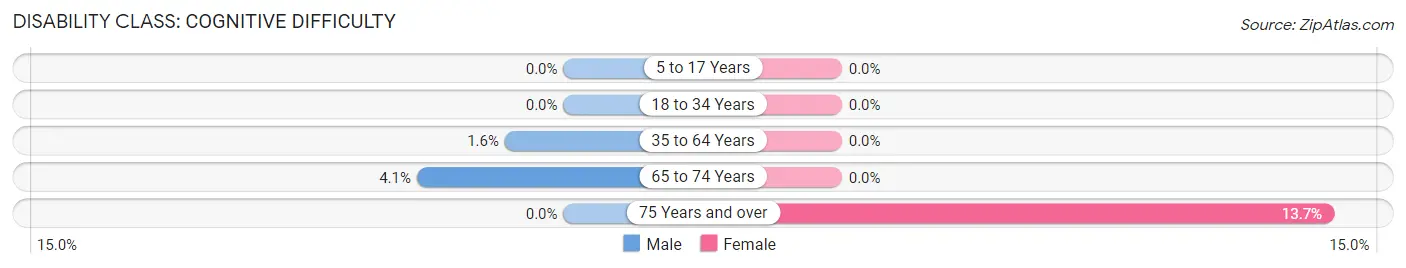
| Age Bracket | Male | Female |
| 5 to 17 Years | 0 (0.0%) | 0 (0.0%) |
| 18 to 34 Years | 0 (0.0%) | 0 (0.0%) |
| 35 to 64 Years | 2 (1.6%) | 0 (0.0%) |
| 65 to 74 Years | 2 (4.1%) | 0 (0.0%) |
| 75 Years and over | 0 (0.0%) | 10 (13.7%) |
Disability Class: Ambulatory Difficulty
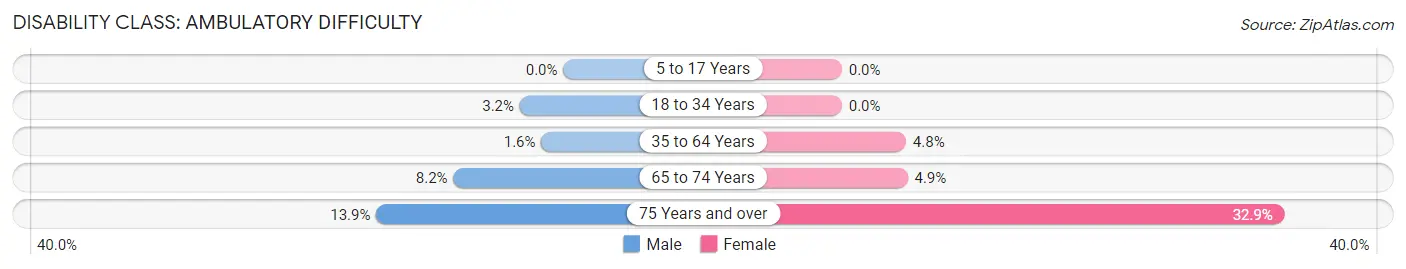
| Age Bracket | Male | Female |
| 5 to 17 Years | 0 (0.0%) | 0 (0.0%) |
| 18 to 34 Years | 1 (3.2%) | 0 (0.0%) |
| 35 to 64 Years | 2 (1.6%) | 6 (4.8%) |
| 65 to 74 Years | 4 (8.2%) | 2 (4.9%) |
| 75 Years and over | 5 (13.9%) | 24 (32.9%) |
Disability Class: Self-Care Difficulty
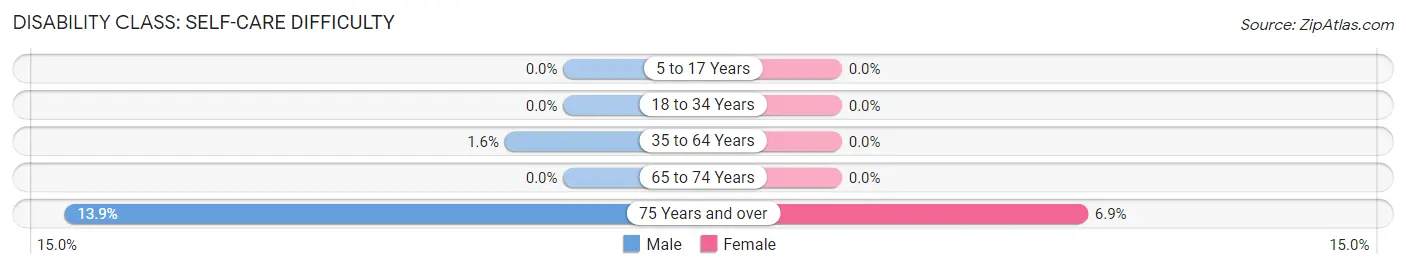
| Age Bracket | Male | Female |
| 5 to 17 Years | 0 (0.0%) | 0 (0.0%) |
| 18 to 34 Years | 0 (0.0%) | 0 (0.0%) |
| 35 to 64 Years | 2 (1.6%) | 0 (0.0%) |
| 65 to 74 Years | 0 (0.0%) | 0 (0.0%) |
| 75 Years and over | 5 (13.9%) | 5 (6.9%) |
Technology Access in Hollow Creek
Computing Device Access in Hollow Creek
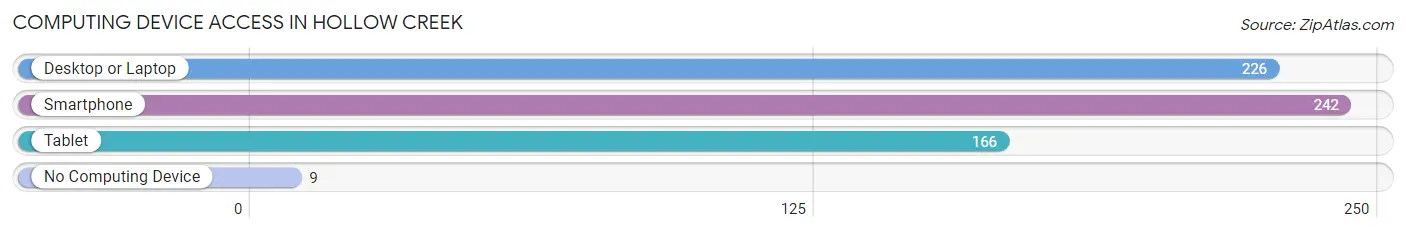
| Device Type | # Households | % Households |
| Desktop or Laptop | 226 | 81.6% |
| Smartphone | 242 | 87.4% |
| Tablet | 166 | 59.9% |
| No Computing Device | 9 | 3.3% |
| Total | 277 | 100.0% |
Internet Access in Hollow Creek
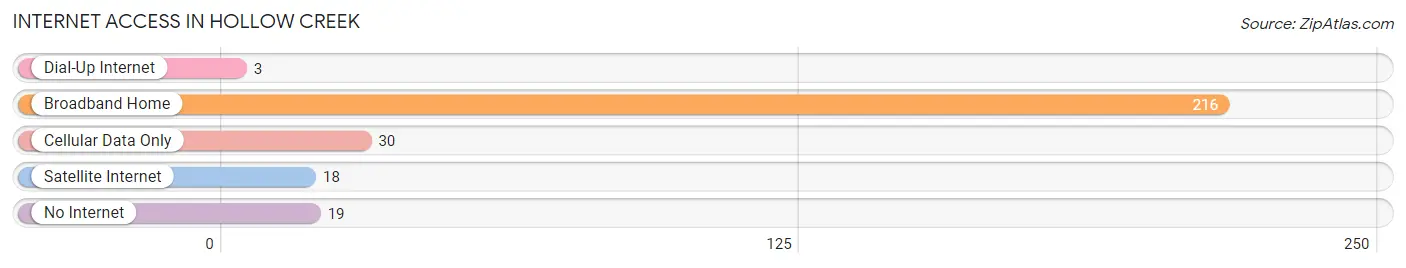
| Internet Type | # Households | % Households |
| Dial-Up Internet | 3 | 1.1% |
| Broadband Home | 216 | 78.0% |
| Cellular Data Only | 30 | 10.8% |
| Satellite Internet | 18 | 6.5% |
| No Internet | 19 | 6.9% |
| Total | 277 | 100.0% |
Hollow Creek Summary
Hollow Creek is a small unincorporated community located in the southeastern corner of Kentucky, in the foothills of the Appalachian Mountains. It is situated in the county of Harlan, and is part of the Harlan Micropolitan Statistical Area. The population of Hollow Creek was estimated to be around 500 people in 2020.
History
Hollow Creek was first settled in the early 1800s by a group of settlers from North Carolina. The settlers were attracted to the area due to its abundance of natural resources, such as timber and coal. The town was originally known as “Hollow Creek Settlement”, and was later shortened to “Hollow Creek”.
The town was officially incorporated in 1883, and the first post office was established in 1884. The town was named after the nearby creek, which was named for its hollowed-out appearance.
The town grew steadily throughout the late 19th and early 20th centuries, and by the 1950s, it had become a thriving coal mining town. The coal industry in the area declined in the late 20th century, and the town’s population began to decline as well.
Geography
Hollow Creek is located in the southeastern corner of Kentucky, in the foothills of the Appalachian Mountains. The town is situated in the county of Harlan, and is part of the Harlan Micropolitan Statistical Area.
The town is located at an elevation of 1,000 feet above sea level, and is surrounded by rolling hills and forests. The nearby creek, which the town is named after, is a tributary of the Cumberland River.
The climate in Hollow Creek is humid subtropical, with hot summers and mild winters. The average annual temperature is around 60 degrees Fahrenheit, and the average annual precipitation is around 45 inches.
Economy
The economy of Hollow Creek is largely based on agriculture and tourism. The town is home to several small farms, which produce a variety of crops, including corn, soybeans, and tobacco.
The town is also home to several tourist attractions, such as the Harlan County Coal Museum, the Harlan County Historical Society, and the Harlan County Courthouse. These attractions draw visitors from all over the region, and help to boost the local economy.
Demographics
As of the 2020 census, the population of Hollow Creek was estimated to be around 500 people. The racial makeup of the town was 97.2% White, 0.8% African American, 0.4% Native American, 0.2% Asian, and 1.4% from other races.
The median household income in Hollow Creek was $30,000, and the median home value was $90,000. The town has a poverty rate of 22.2%, and the unemployment rate was 5.2%.
Conclusion
Hollow Creek is a small unincorporated community located in the southeastern corner of Kentucky, in the foothills of the Appalachian Mountains. The town has a long history, and was originally settled in the early 1800s by a group of settlers from North Carolina. The town’s economy is largely based on agriculture and tourism, and the population of Hollow Creek was estimated to be around 500 people in 2020.
Common Questions
What is Per Capita Income in Hollow Creek?
Per Capita income in Hollow Creek is $43,401.
What is the Median Family Income in Hollow Creek?
Median Family Income in Hollow Creek is $110,486.
What is the Median Household income in Hollow Creek?
Median Household Income in Hollow Creek is $91,875.
What is Income or Wage Gap in Hollow Creek?
Income or Wage Gap in Hollow Creek is 35.5%.
Women in Hollow Creek earn 64.5 cents for every dollar earned by a man.
What is Inequality or Gini Index in Hollow Creek?
Inequality or Gini Index in Hollow Creek is 0.37.
What is the Total Population of Hollow Creek?
Total Population of Hollow Creek is 702.
What is the Total Male Population of Hollow Creek?
Total Male Population of Hollow Creek is 302.
What is the Total Female Population of Hollow Creek?
Total Female Population of Hollow Creek is 400.
What is the Ratio of Males per 100 Females in Hollow Creek?
There are 75.50 Males per 100 Females in Hollow Creek.
What is the Ratio of Females per 100 Males in Hollow Creek?
There are 132.45 Females per 100 Males in Hollow Creek.
What is the Median Population Age in Hollow Creek?
Median Population Age in Hollow Creek is 51.2 Years.
What is the Average Family Size in Hollow Creek
Average Family Size in Hollow Creek is 2.9 People.
What is the Average Household Size in Hollow Creek
Average Household Size in Hollow Creek is 2.5 People.
How Large is the Labor Force in Hollow Creek?
There are 348 People in the Labor Forcein in Hollow Creek.
What is the Percentage of People in the Labor Force in Hollow Creek?
60.4% of People are in the Labor Force in Hollow Creek.
What is the Unemployment Rate in Hollow Creek?
Unemployment Rate in Hollow Creek is 1.2%.