Bellewood, KY Map & Demographics
Bellewood Map
Bellewood Overview
$77,037
PER CAPITA INCOME
$158,750
AVG FAMILY INCOME
$155,750
AVG HOUSEHOLD INCOME
43.8%
WAGE / INCOME GAP [ % ]
56.2¢/ $1
WAGE / INCOME GAP [ $ ]
0.34
INEQUALITY / GINI INDEX
235
TOTAL POPULATION
124
MALE POPULATION
111
FEMALE POPULATION
111.71
MALES / 100 FEMALES
89.52
FEMALES / 100 MALES
45.4
MEDIAN AGE
2.9
AVG FAMILY SIZE
2.4
AVG HOUSEHOLD SIZE
123
LABOR FORCE [ PEOPLE ]
66.5%
PERCENT IN LABOR FORCE
Bellewood Area Codes
Income in Bellewood
Income Overview in Bellewood
Per Capita Income in Bellewood is $77,037, while median incomes of families and households are $158,750 and $155,750 respectively.
| Characteristic | Number | Measure |
| Per Capita Income | 235 | $77,037 |
| Median Family Income | 67 | $158,750 |
| Mean Family Income | 67 | $197,366 |
| Median Household Income | 99 | $155,750 |
| Mean Household Income | 99 | $175,683 |
| Income Deficit | 67 | $0 |
| Wage / Income Gap (%) | 235 | 43.82% |
| Wage / Income Gap ($) | 235 | 56.18¢ per $1 |
| Gini / Inequality Index | 235 | 0.34 |
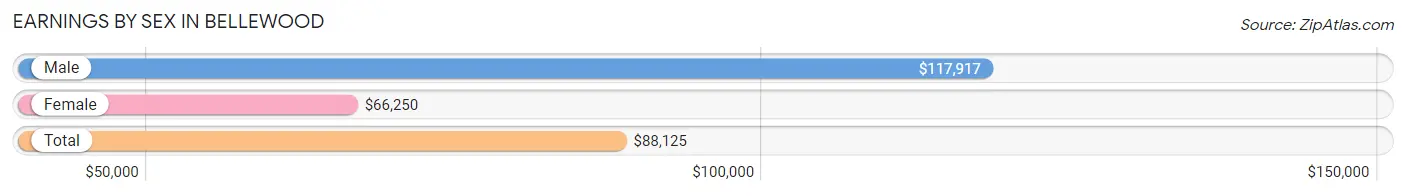
Earnings by Sex in Bellewood
Average Earnings in Bellewood are $88,125, $117,917 for men and $66,250 for women, a difference of 43.8%.
| Sex | Number | Average Earnings |
| Male | 65 (52.8%) | $117,917 |
| Female | 58 (47.1%) | $66,250 |
| Total | 123 (100.0%) | $88,125 |
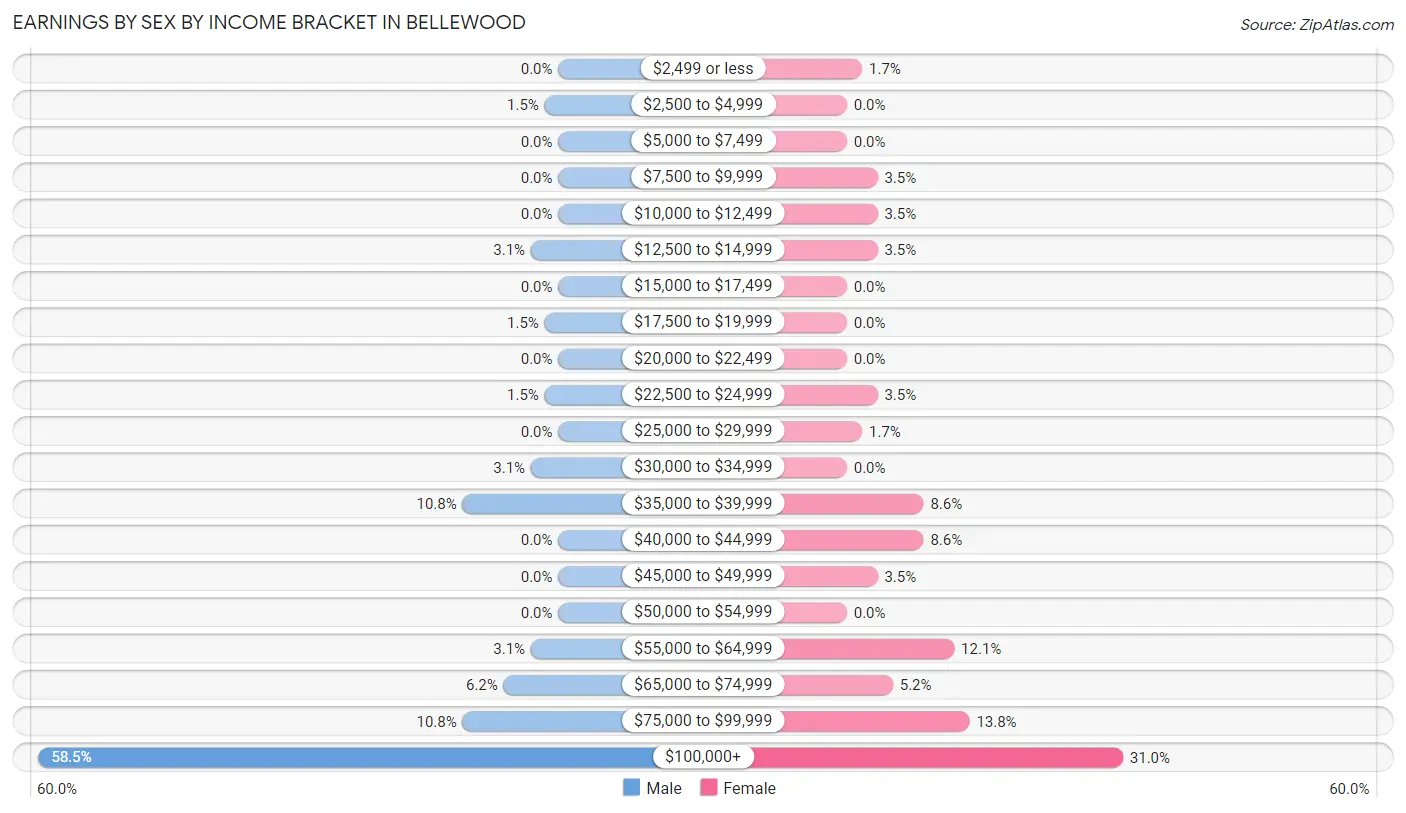
Earnings by Sex by Income Bracket in Bellewood
The most common earnings brackets in Bellewood are $100,000+ for men (38 | 58.5%) and $100,000+ for women (18 | 31.0%).
| Income | Male | Female |
| $2,499 or less | 0 (0.0%) | 1 (1.7%) |
| $2,500 to $4,999 | 1 (1.5%) | 0 (0.0%) |
| $5,000 to $7,499 | 0 (0.0%) | 0 (0.0%) |
| $7,500 to $9,999 | 0 (0.0%) | 2 (3.5%) |
| $10,000 to $12,499 | 0 (0.0%) | 2 (3.5%) |
| $12,500 to $14,999 | 2 (3.1%) | 2 (3.5%) |
| $15,000 to $17,499 | 0 (0.0%) | 0 (0.0%) |
| $17,500 to $19,999 | 1 (1.5%) | 0 (0.0%) |
| $20,000 to $22,499 | 0 (0.0%) | 0 (0.0%) |
| $22,500 to $24,999 | 1 (1.5%) | 2 (3.5%) |
| $25,000 to $29,999 | 0 (0.0%) | 1 (1.7%) |
| $30,000 to $34,999 | 2 (3.1%) | 0 (0.0%) |
| $35,000 to $39,999 | 7 (10.8%) | 5 (8.6%) |
| $40,000 to $44,999 | 0 (0.0%) | 5 (8.6%) |
| $45,000 to $49,999 | 0 (0.0%) | 2 (3.5%) |
| $50,000 to $54,999 | 0 (0.0%) | 0 (0.0%) |
| $55,000 to $64,999 | 2 (3.1%) | 7 (12.1%) |
| $65,000 to $74,999 | 4 (6.1%) | 3 (5.2%) |
| $75,000 to $99,999 | 7 (10.8%) | 8 (13.8%) |
| $100,000+ | 38 (58.5%) | 18 (31.0%) |
| Total | 65 (100.0%) | 58 (100.0%) |
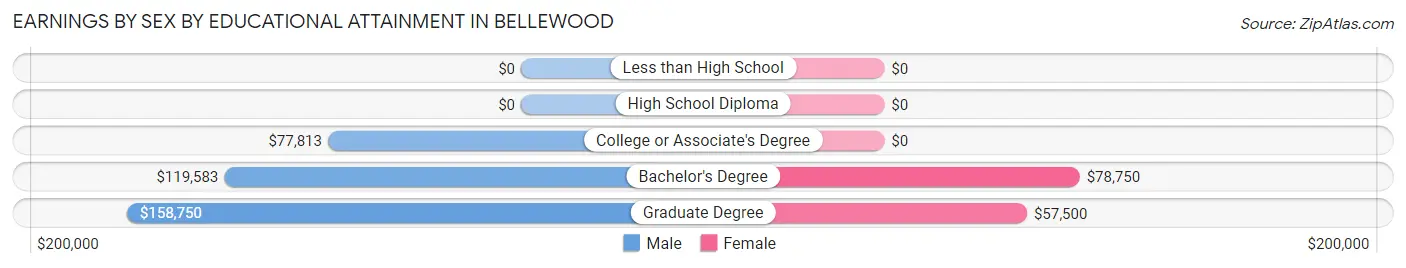
Earnings by Sex by Educational Attainment in Bellewood
Average earnings in Bellewood are $117,917 for men and $68,750 for women, a difference of 41.7%. Men with an educational attainment of graduate degree enjoy the highest average annual earnings of $158,750, while those with college or associate's degree education earn the least with $77,813. Women with an educational attainment of bachelor's degree earn the most with the average annual earnings of $78,750, while those with graduate degree education have the smallest earnings of $57,500.
| Educational Attainment | Male Income | Female Income |
| Less than High School | - | - |
| High School Diploma | - | - |
| College or Associate's Degree | $77,813 | $0 |
| Bachelor's Degree | $119,583 | $78,750 |
| Graduate Degree | $158,750 | $57,500 |
| Total | $117,917 | $68,750 |
Family Income in Bellewood
Family Income Brackets in Bellewood
According to the Bellewood family income data, there are 27 families falling into the $200,000+ income range, which is the most common income bracket and makes up 40.3% of all families.
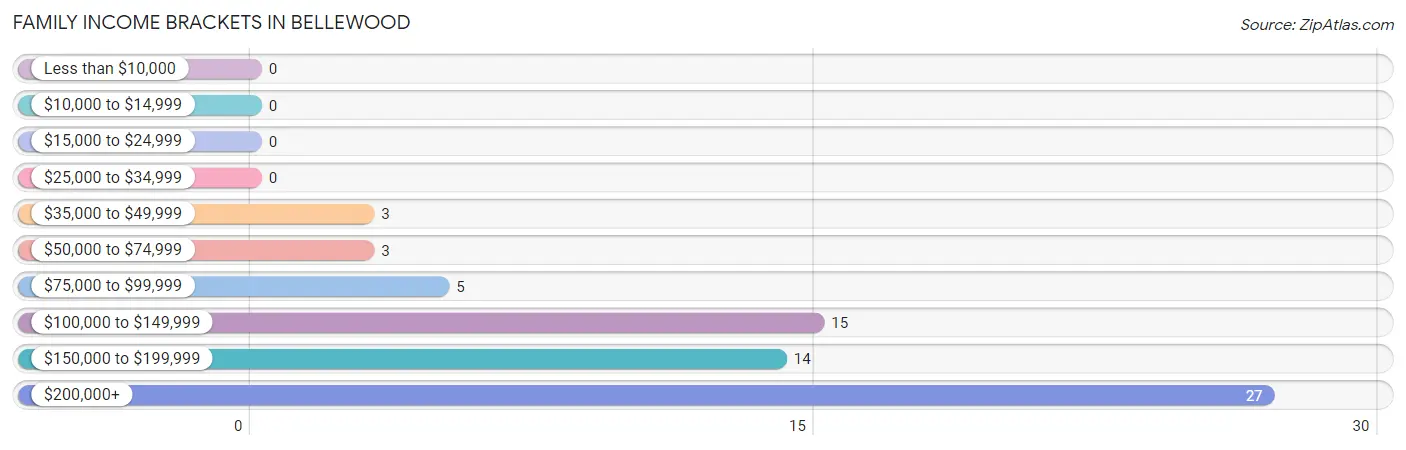
| Income Bracket | # Families | % Families |
| Less than $10,000 | 0 | 0.0% |
| $10,000 to $14,999 | 0 | 0.0% |
| $15,000 to $24,999 | 0 | 0.0% |
| $25,000 to $34,999 | 0 | 0.0% |
| $35,000 to $49,999 | 3 | 4.5% |
| $50,000 to $74,999 | 3 | 4.5% |
| $75,000 to $99,999 | 5 | 7.5% |
| $100,000 to $149,999 | 15 | 22.4% |
| $150,000 to $199,999 | 14 | 20.9% |
| $200,000+ | 27 | 40.3% |
Family Income by Famaliy Size in Bellewood
5-person families (8 | 11.9%) account for the highest median family income in Bellewood with $250,001 per family, while 3-person families (13 | 19.4%) have the highest median income of $79,583 per family member.
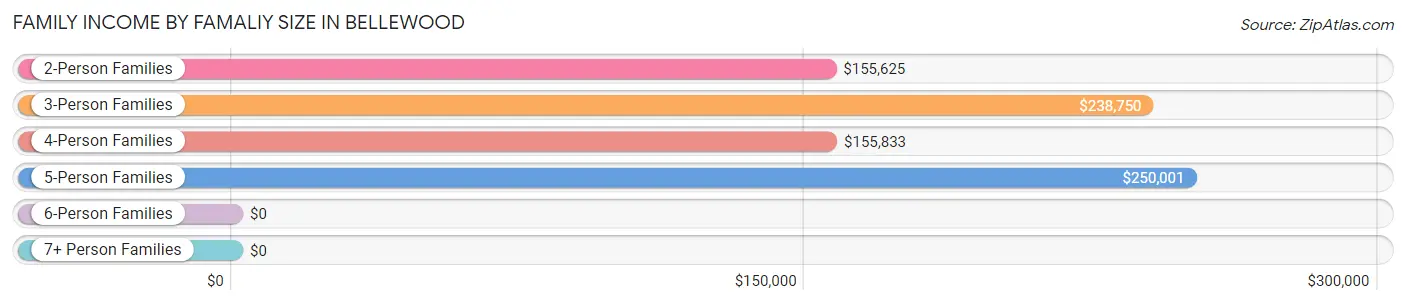
| Income Bracket | # Families | Median Income |
| 2-Person Families | 37 (55.2%) | $155,625 |
| 3-Person Families | 13 (19.4%) | $238,750 |
| 4-Person Families | 8 (11.9%) | $155,833 |
| 5-Person Families | 8 (11.9%) | $250,001 |
| 6-Person Families | 1 (1.5%) | $0 |
| 7+ Person Families | 0 (0.0%) | $0 |
| Total | 67 (100.0%) | $158,750 |
Family Income by Number of Earners in Bellewood
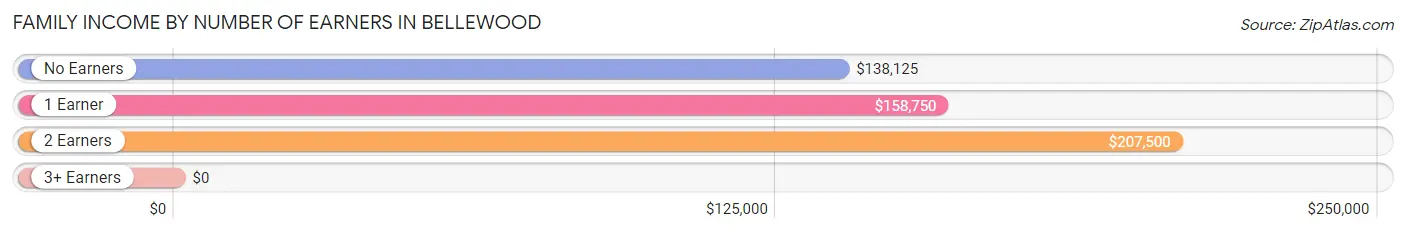
| Number of Earners | # Families | Median Income |
| No Earners | 13 (19.4%) | $138,125 |
| 1 Earner | 17 (25.4%) | $158,750 |
| 2 Earners | 36 (53.7%) | $207,500 |
| 3+ Earners | 1 (1.5%) | $0 |
| Total | 67 (100.0%) | $158,750 |
Household Income in Bellewood
Household Income Brackets in Bellewood
With 35 households falling in the category, the $200,000+ income range is the most frequent in Bellewood, accounting for 35.3% of all households.
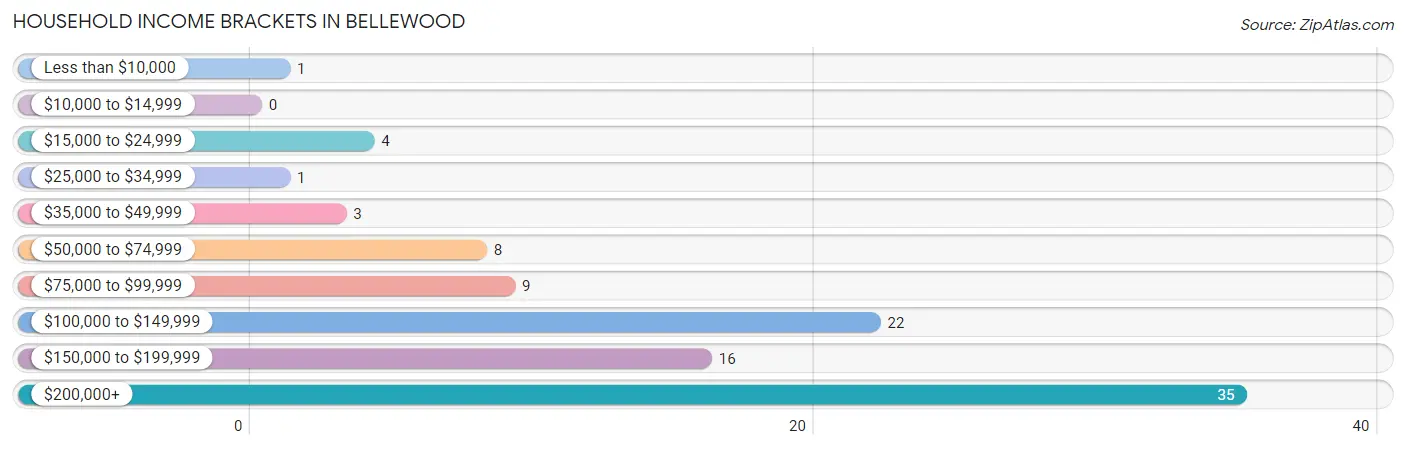
| Income Bracket | # Households | % Households |
| Less than $10,000 | 1 | 1.0% |
| $10,000 to $14,999 | 0 | 0.0% |
| $15,000 to $24,999 | 4 | 4.0% |
| $25,000 to $34,999 | 1 | 1.0% |
| $35,000 to $49,999 | 3 | 3.0% |
| $50,000 to $74,999 | 8 | 8.1% |
| $75,000 to $99,999 | 9 | 9.1% |
| $100,000 to $149,999 | 22 | 22.2% |
| $150,000 to $199,999 | 16 | 16.2% |
| $200,000+ | 35 | 35.4% |
Household Income by Householder Age in Bellewood
The median household income in Bellewood is $155,750, with the highest median household income of $218,125 found in the 45 to 64 years age bracket for the primary householder. A total of 31 households (31.3%) fall into this category.
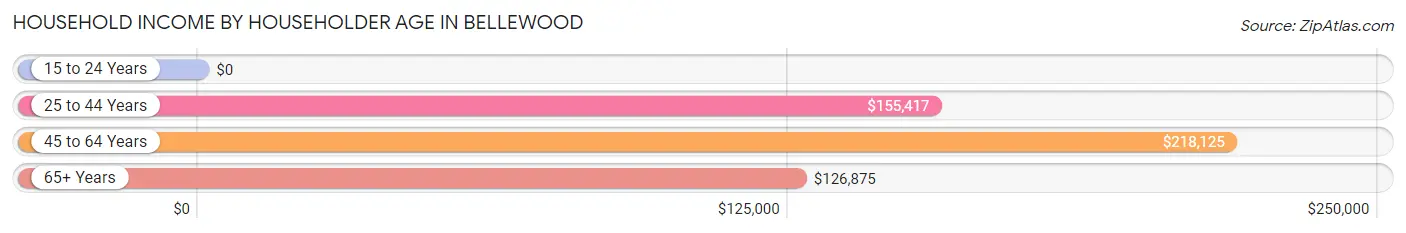
| Income Bracket | # Households | Median Income |
| 15 to 24 Years | 0 (0.0%) | $0 |
| 25 to 44 Years | 31 (31.3%) | $155,417 |
| 45 to 64 Years | 31 (31.3%) | $218,125 |
| 65+ Years | 37 (37.4%) | $126,875 |
| Total | 99 (100.0%) | $155,750 |
Poverty in Bellewood
Income Below Poverty by Sex and Age in Bellewood
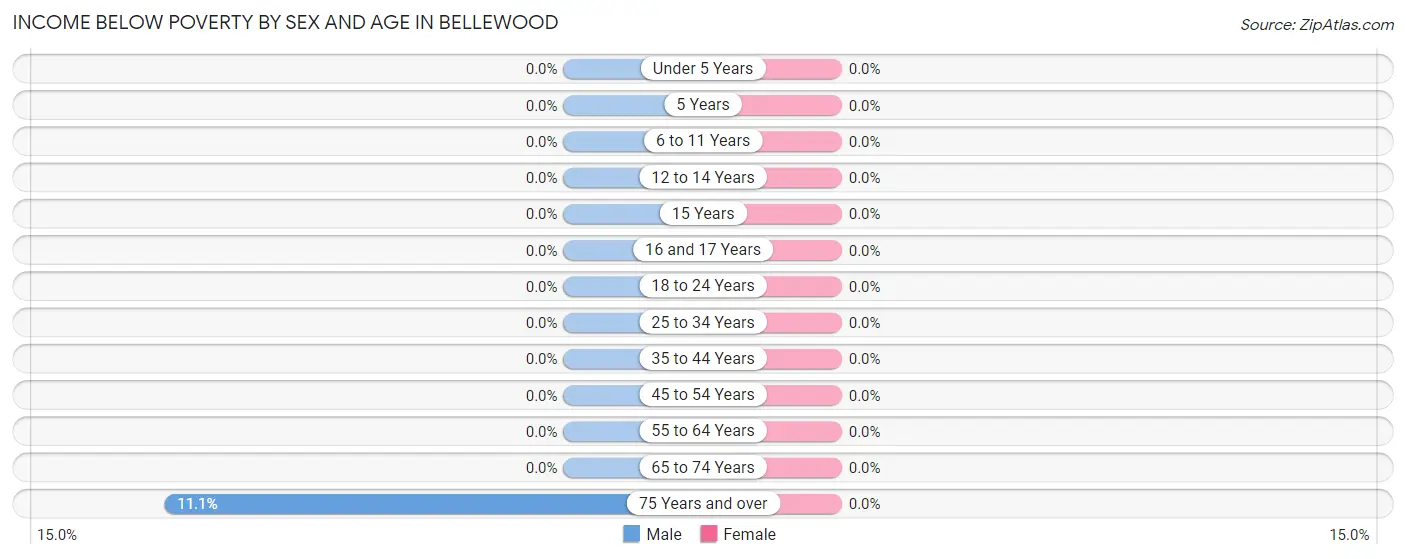
| Age Bracket | Male | Female |
| Under 5 Years | 0 (0.0%) | 0 (0.0%) |
| 5 Years | 0 (0.0%) | 0 (0.0%) |
| 6 to 11 Years | 0 (0.0%) | 0 (0.0%) |
| 12 to 14 Years | 0 (0.0%) | 0 (0.0%) |
| 15 Years | 0 (0.0%) | 0 (0.0%) |
| 16 and 17 Years | 0 (0.0%) | 0 (0.0%) |
| 18 to 24 Years | 0 (0.0%) | 0 (0.0%) |
| 25 to 34 Years | 0 (0.0%) | 0 (0.0%) |
| 35 to 44 Years | 0 (0.0%) | 0 (0.0%) |
| 45 to 54 Years | 0 (0.0%) | 0 (0.0%) |
| 55 to 64 Years | 0 (0.0%) | 0 (0.0%) |
| 65 to 74 Years | 0 (0.0%) | 0 (0.0%) |
| 75 Years and over | 1 (11.1%) | 0 (0.0%) |
| Total | 1 (0.8%) | 0 (0.0%) |
Income Above Poverty by Sex and Age in Bellewood
According to the poverty statistics in Bellewood, males aged under 5 years and females aged under 5 years are the age groups that are most secure financially, with 100.0% of males and 100.0% of females in these age groups living above the poverty line.
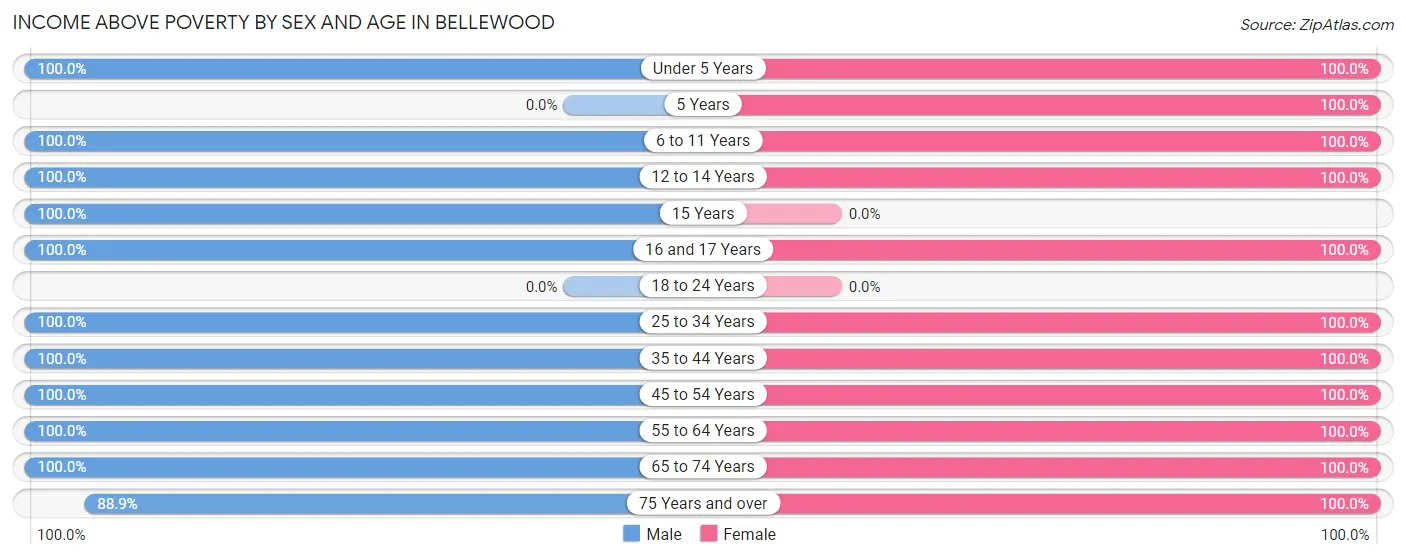
| Age Bracket | Male | Female |
| Under 5 Years | 10 (100.0%) | 7 (100.0%) |
| 5 Years | 0 (0.0%) | 1 (100.0%) |
| 6 to 11 Years | 15 (100.0%) | 8 (100.0%) |
| 12 to 14 Years | 4 (100.0%) | 4 (100.0%) |
| 15 Years | 1 (100.0%) | 0 (0.0%) |
| 16 and 17 Years | 1 (100.0%) | 1 (100.0%) |
| 18 to 24 Years | 0 (0.0%) | 0 (0.0%) |
| 25 to 34 Years | 14 (100.0%) | 10 (100.0%) |
| 35 to 44 Years | 18 (100.0%) | 21 (100.0%) |
| 45 to 54 Years | 12 (100.0%) | 12 (100.0%) |
| 55 to 64 Years | 20 (100.0%) | 19 (100.0%) |
| 65 to 74 Years | 20 (100.0%) | 17 (100.0%) |
| 75 Years and over | 8 (88.9%) | 11 (100.0%) |
| Total | 123 (99.2%) | 111 (100.0%) |
Income Below Poverty Among Married-Couple Families in Bellewood
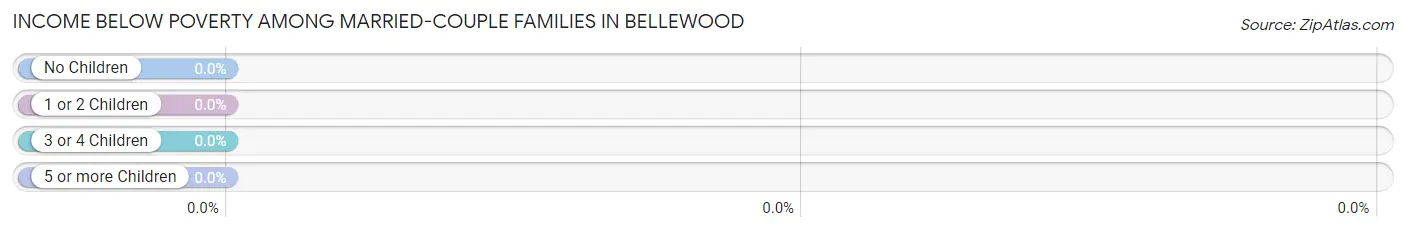
| Children | Above Poverty | Below Poverty |
| No Children | 34 (100.0%) | 0 (0.0%) |
| 1 or 2 Children | 14 (100.0%) | 0 (0.0%) |
| 3 or 4 Children | 9 (100.0%) | 0 (0.0%) |
| 5 or more Children | 0 (0.0%) | 0 (0.0%) |
| Total | 57 (100.0%) | 0 (0.0%) |
Income Below Poverty Among Single-Parent Households in Bellewood
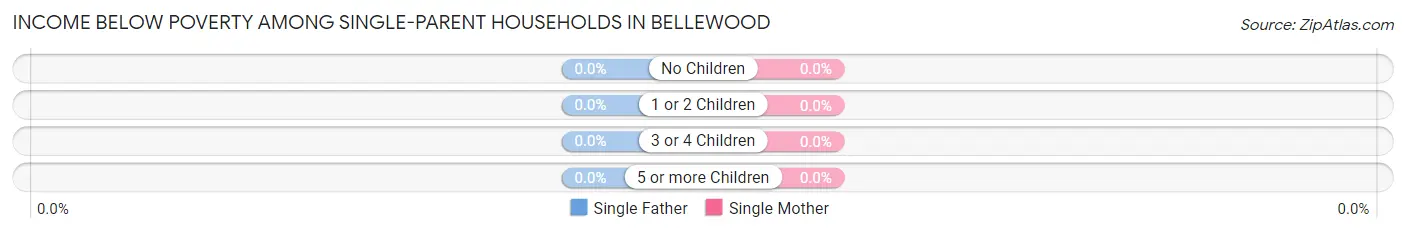
| Children | Single Father | Single Mother |
| No Children | 0 (0.0%) | 0 (0.0%) |
| 1 or 2 Children | 0 (0.0%) | 0 (0.0%) |
| 3 or 4 Children | 0 (0.0%) | 0 (0.0%) |
| 5 or more Children | 0 (0.0%) | 0 (0.0%) |
| Total | 0 (0.0%) | 0 (0.0%) |
Income Below Poverty Among Married-Couple vs Single-Parent Households in Bellewood
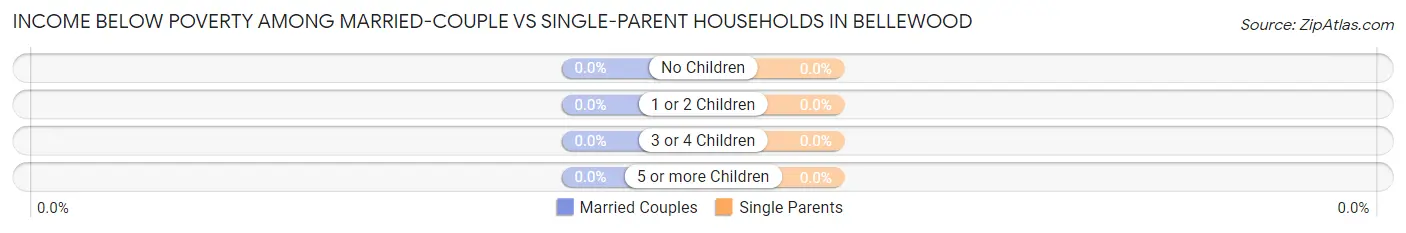
| Children | Married-Couple Families | Single-Parent Households |
| No Children | 0 (0.0%) | 0 (0.0%) |
| 1 or 2 Children | 0 (0.0%) | 0 (0.0%) |
| 3 or 4 Children | 0 (0.0%) | 0 (0.0%) |
| 5 or more Children | 0 (0.0%) | 0 (0.0%) |
| Total | 0 (0.0%) | 0 (0.0%) |
Race in Bellewood
The most populous races in Bellewood are White / Caucasian (218 | 92.8%), Hispanic or Latino (10 | 4.3%), and Some other Race (7 | 3.0%).
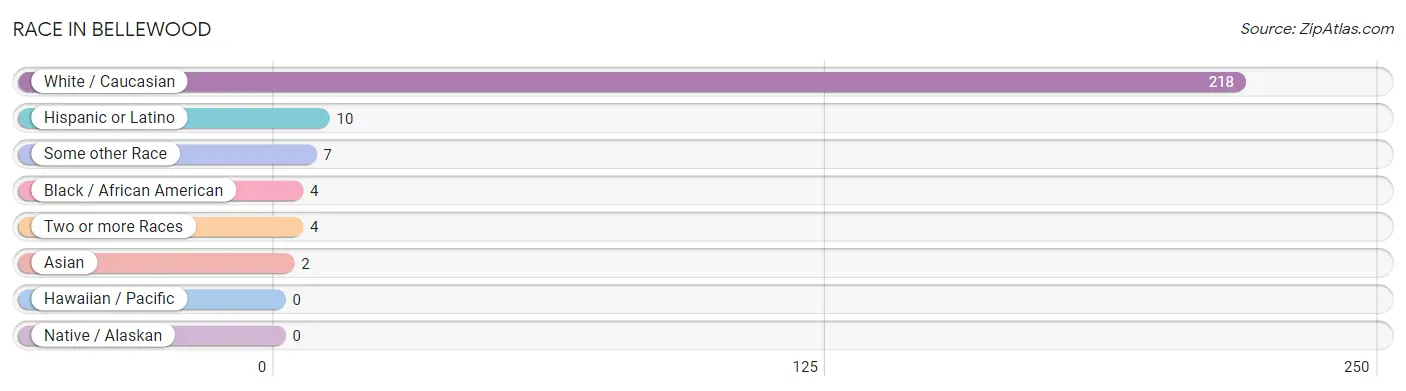
| Race | # Population | % Population |
| Asian | 2 | 0.9% |
| Black / African American | 4 | 1.7% |
| Hawaiian / Pacific | 0 | 0.0% |
| Hispanic or Latino | 10 | 4.3% |
| Native / Alaskan | 0 | 0.0% |
| White / Caucasian | 218 | 92.8% |
| Two or more Races | 4 | 1.7% |
| Some other Race | 7 | 3.0% |
| Total | 235 | 100.0% |
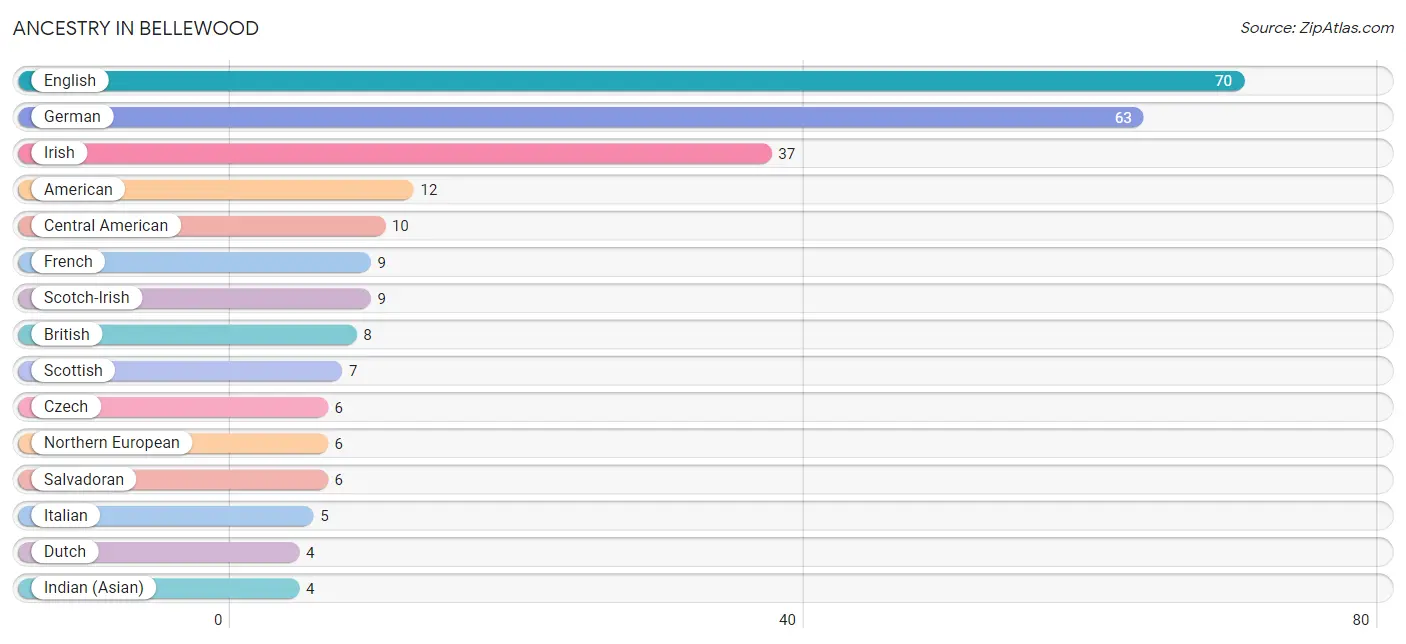
Ancestry in Bellewood
The most populous ancestries reported in Bellewood are English (70 | 29.8%), German (63 | 26.8%), Irish (37 | 15.7%), American (12 | 5.1%), and Central American (10 | 4.3%), together accounting for 81.7% of all Bellewood residents.
| Ancestry | # Population | % Population |
| Albanian | 1 | 0.4% |
| American | 12 | 5.1% |
| Arab | 1 | 0.4% |
| British | 8 | 3.4% |
| Celtic | 3 | 1.3% |
| Central American | 10 | 4.3% |
| Czech | 6 | 2.5% |
| Danish | 1 | 0.4% |
| Dutch | 4 | 1.7% |
| Eastern European | 1 | 0.4% |
| English | 70 | 29.8% |
| European | 3 | 1.3% |
| Finnish | 2 | 0.9% |
| French | 9 | 3.8% |
| French Canadian | 2 | 0.9% |
| German | 63 | 26.8% |
| Guatemalan | 2 | 0.9% |
| Honduran | 2 | 0.9% |
| Indian (Asian) | 4 | 1.7% |
| Irish | 37 | 15.7% |
| Italian | 5 | 2.1% |
| Northern European | 6 | 2.5% |
| Polish | 1 | 0.4% |
| Salvadoran | 6 | 2.5% |
| Scandinavian | 1 | 0.4% |
| Scotch-Irish | 9 | 3.8% |
| Scottish | 7 | 3.0% |
| Sri Lankan | 1 | 0.4% |
| Swedish | 2 | 0.9% |
| Swiss | 1 | 0.4% | View All 30 Rows |
Immigrants in Bellewood
The most numerous immigrant groups reported in Bellewood came from Canada (3 | 1.3%), Europe (3 | 1.3%), Asia (2 | 0.9%), Central America (2 | 0.9%), and Germany (2 | 0.9%), together accounting for 5.1% of all Bellewood residents.
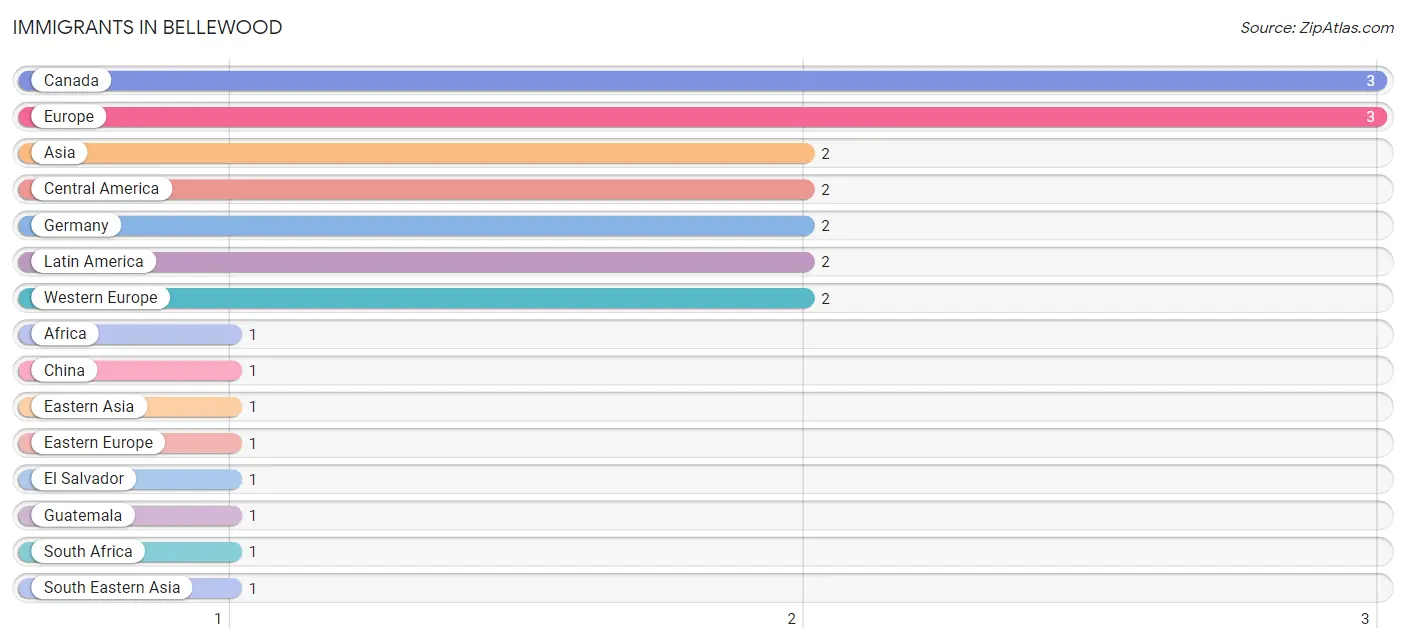
| Immigration Origin | # Population | % Population |
| Africa | 1 | 0.4% |
| Asia | 2 | 0.9% |
| Canada | 3 | 1.3% |
| Central America | 2 | 0.9% |
| China | 1 | 0.4% |
| Eastern Asia | 1 | 0.4% |
| Eastern Europe | 1 | 0.4% |
| El Salvador | 1 | 0.4% |
| Europe | 3 | 1.3% |
| Germany | 2 | 0.9% |
| Guatemala | 1 | 0.4% |
| Latin America | 2 | 0.9% |
| South Africa | 1 | 0.4% |
| South Eastern Asia | 1 | 0.4% |
| Ukraine | 1 | 0.4% |
| Vietnam | 1 | 0.4% |
| Western Europe | 2 | 0.9% | View All 17 Rows |
Sex and Age in Bellewood
Sex and Age in Bellewood
The most populous age groups in Bellewood are 60 to 64 Years (12 | 9.7%) for men and 35 to 39 Years (17 | 15.3%) for women.
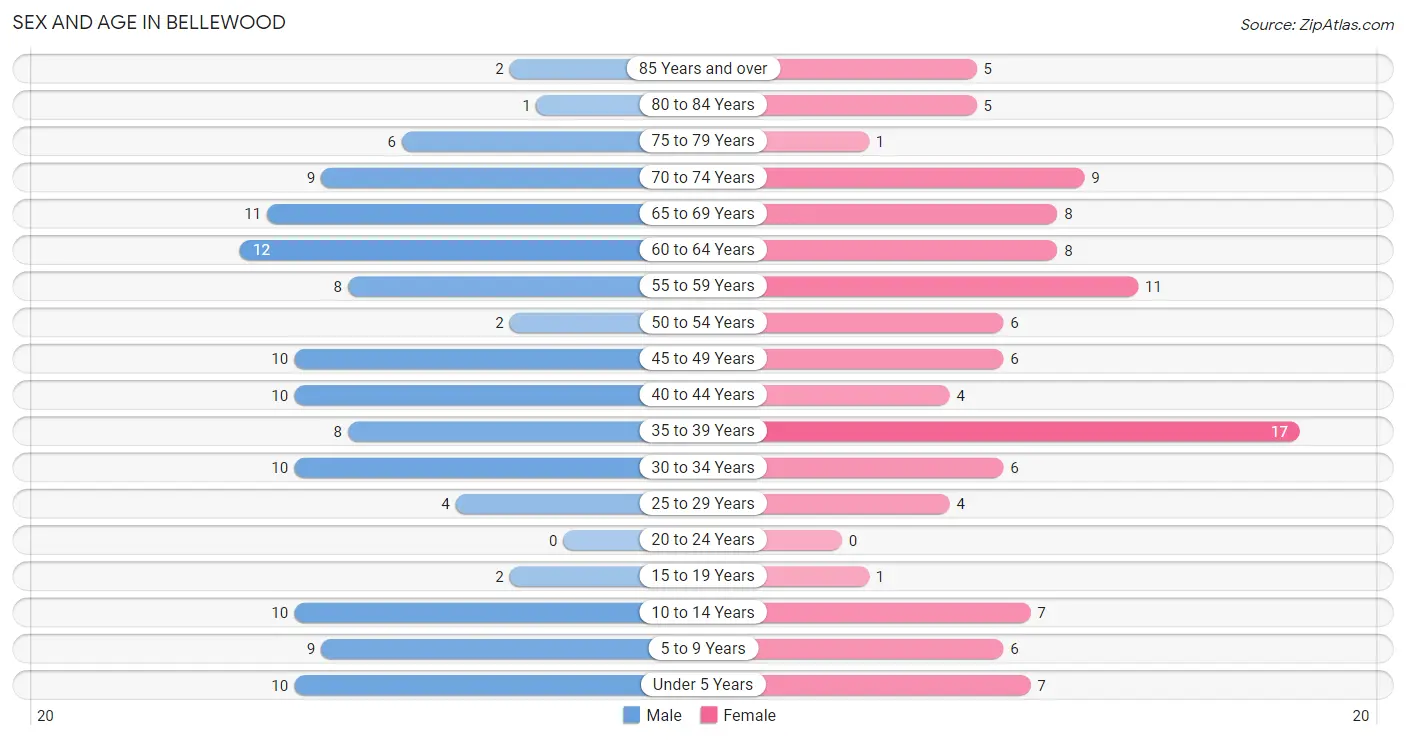
| Age Bracket | Male | Female |
| Under 5 Years | 10 (8.1%) | 7 (6.3%) |
| 5 to 9 Years | 9 (7.3%) | 6 (5.4%) |
| 10 to 14 Years | 10 (8.1%) | 7 (6.3%) |
| 15 to 19 Years | 2 (1.6%) | 1 (0.9%) |
| 20 to 24 Years | 0 (0.0%) | 0 (0.0%) |
| 25 to 29 Years | 4 (3.2%) | 4 (3.6%) |
| 30 to 34 Years | 10 (8.1%) | 6 (5.4%) |
| 35 to 39 Years | 8 (6.5%) | 17 (15.3%) |
| 40 to 44 Years | 10 (8.1%) | 4 (3.6%) |
| 45 to 49 Years | 10 (8.1%) | 6 (5.4%) |
| 50 to 54 Years | 2 (1.6%) | 6 (5.4%) |
| 55 to 59 Years | 8 (6.5%) | 11 (9.9%) |
| 60 to 64 Years | 12 (9.7%) | 8 (7.2%) |
| 65 to 69 Years | 11 (8.9%) | 8 (7.2%) |
| 70 to 74 Years | 9 (7.3%) | 9 (8.1%) |
| 75 to 79 Years | 6 (4.8%) | 1 (0.9%) |
| 80 to 84 Years | 1 (0.8%) | 5 (4.5%) |
| 85 Years and over | 2 (1.6%) | 5 (4.5%) |
| Total | 124 (100.0%) | 111 (100.0%) |
Families and Households in Bellewood
Median Family Size in Bellewood
The median family size in Bellewood is 2.88 persons per family, with married-couple families (57 | 85.1%) accounting for the largest median family size of 2.98 persons per family. On the other hand, single male/father families (4 | 6.0%) represent the smallest median family size with 2.25 persons per family.
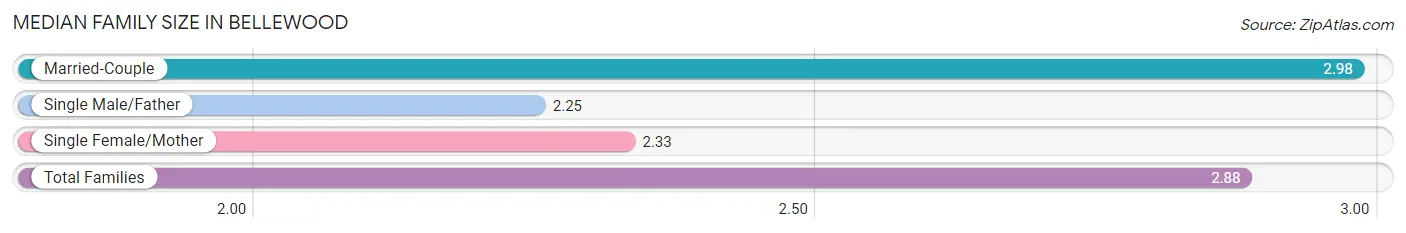
| Family Type | # Families | Family Size |
| Married-Couple | 57 (85.1%) | 2.98 |
| Single Male/Father | 4 (6.0%) | 2.25 |
| Single Female/Mother | 6 (9.0%) | 2.33 |
| Total Families | 67 (100.0%) | 2.88 |
Median Household Size in Bellewood
The median household size in Bellewood is 2.37 persons per household, with married-couple households (57 | 57.6%) accounting for the largest median household size of 2.98 persons per household. non-family households (32 | 32.3%) represent the smallest median household size with 1.31 persons per household.
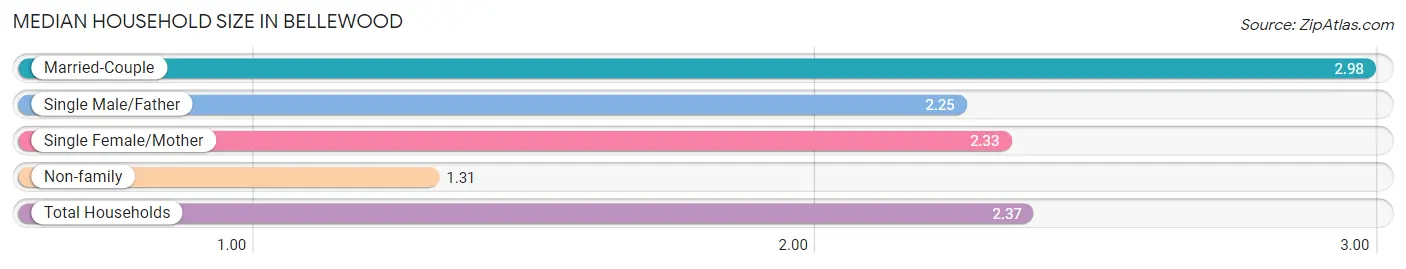
| Household Type | # Households | Household Size |
| Married-Couple | 57 (57.6%) | 2.98 |
| Single Male/Father | 4 (4.0%) | 2.25 |
| Single Female/Mother | 6 (6.1%) | 2.33 |
| Non-family | 32 (32.3%) | 1.31 |
| Total Households | 99 (100.0%) | 2.37 |
Household Size by Marriage Status in Bellewood
Out of a total of 99 households in Bellewood, 67 (67.7%) are family households, while 32 (32.3%) are nonfamily households. The most numerous type of family households are 2-person households, comprising 37, and the most common type of nonfamily households are 1-person households, comprising 23.
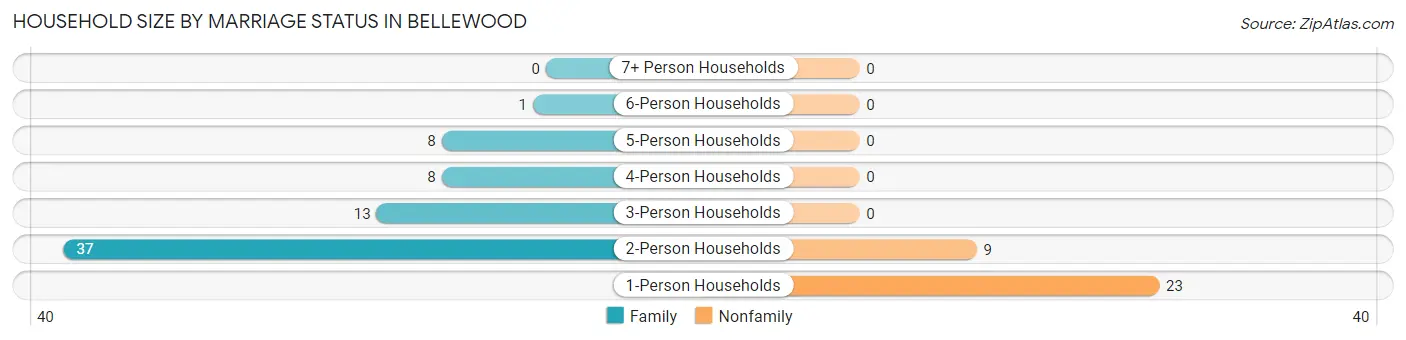
| Household Size | Family Households | Nonfamily Households |
| 1-Person Households | - | 23 (23.2%) |
| 2-Person Households | 37 (37.4%) | 9 (9.1%) |
| 3-Person Households | 13 (13.1%) | 0 (0.0%) |
| 4-Person Households | 8 (8.1%) | 0 (0.0%) |
| 5-Person Households | 8 (8.1%) | 0 (0.0%) |
| 6-Person Households | 1 (1.0%) | 0 (0.0%) |
| 7+ Person Households | 0 (0.0%) | 0 (0.0%) |
| Total | 67 (67.7%) | 32 (32.3%) |
Female Fertility in Bellewood
Fertility by Age in Bellewood
Average fertility rate in Bellewood is 77.0 births per 1,000 women. Women in the age bracket of 35 to 50 years have the highest fertility rate with 107.0 births per 1,000 women. Women in the age bracket of 35 to 50 years acount for 100.0% of all women with births.
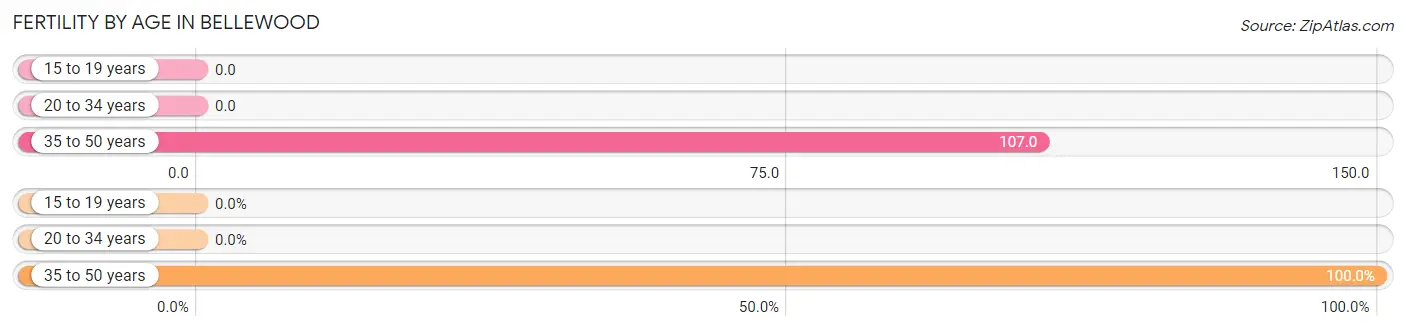
| Age Bracket | Women with Births | Births / 1,000 Women |
| 15 to 19 years | 0 (0.0%) | 0.0 |
| 20 to 34 years | 0 (0.0%) | 0.0 |
| 35 to 50 years | 3 (100.0%) | 107.0 |
| Total | 3 (100.0%) | 77.0 |
Fertility by Age by Marriage Status in Bellewood
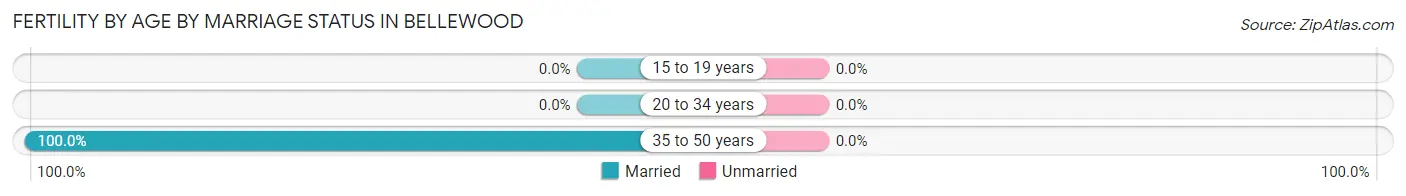
| Age Bracket | Married | Unmarried |
| 15 to 19 years | 0 (0.0%) | 0 (0.0%) |
| 20 to 34 years | 0 (0.0%) | 0 (0.0%) |
| 35 to 50 years | 3 (100.0%) | 0 (0.0%) |
| Total | 3 (100.0%) | 0 (0.0%) |
Fertility by Education in Bellewood
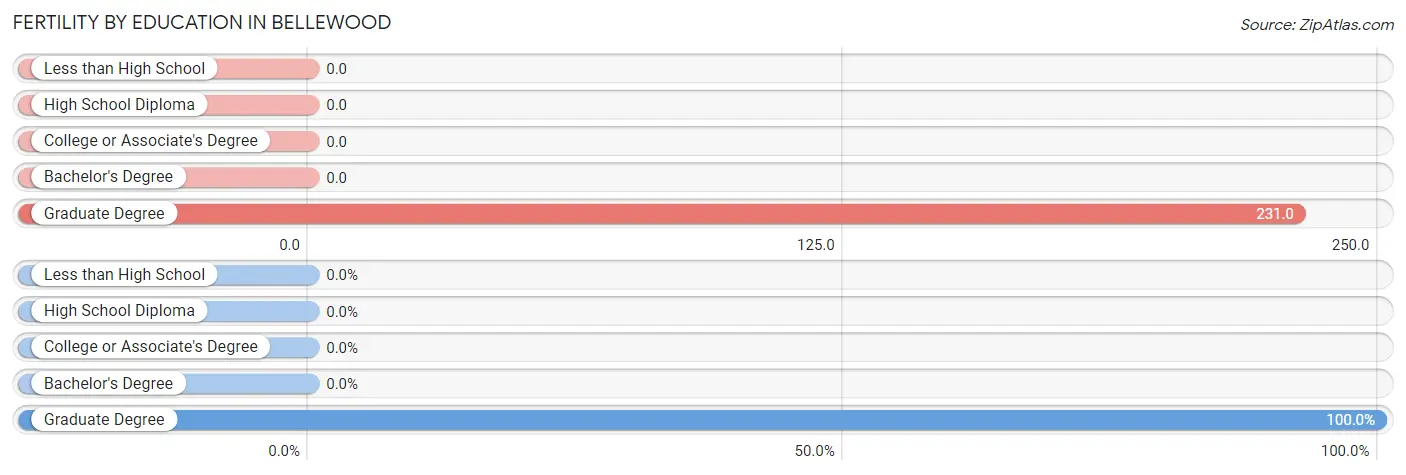
| Educational Attainment | Women with Births | Births / 1,000 Women |
| Less than High School | 0 (0.0%) | 0.0 |
| High School Diploma | 0 (0.0%) | 0.0 |
| College or Associate's Degree | 0 (0.0%) | 0.0 |
| Bachelor's Degree | 0 (0.0%) | 0.0 |
| Graduate Degree | 3 (100.0%) | 231.0 |
| Total | 3 (100.0%) | 77.0 |
Fertility by Education by Marriage Status in Bellewood
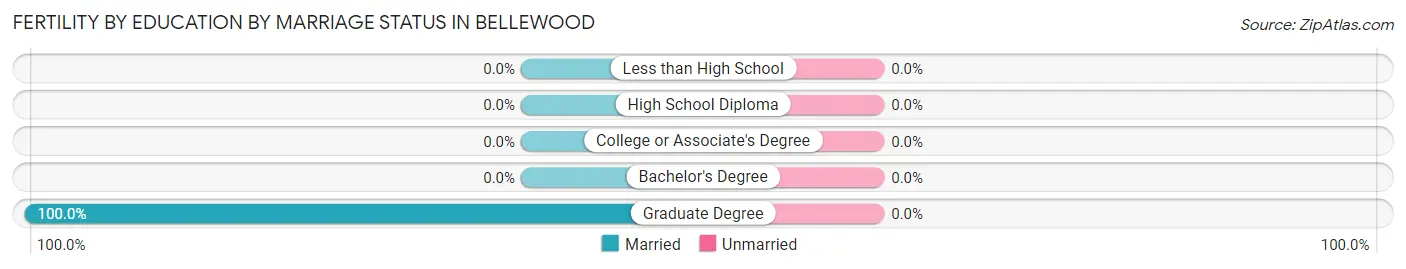
| Educational Attainment | Married | Unmarried |
| Less than High School | 0 (0.0%) | 0 (0.0%) |
| High School Diploma | 0 (0.0%) | 0 (0.0%) |
| College or Associate's Degree | 0 (0.0%) | 0 (0.0%) |
| Bachelor's Degree | 0 (0.0%) | 0 (0.0%) |
| Graduate Degree | 3 (100.0%) | 0 (0.0%) |
| Total | 3 (100.0%) | 0 (0.0%) |
Employment Characteristics in Bellewood
Employment by Class of Employer in Bellewood
Among the 123 employed individuals in Bellewood, private company employees (87 | 70.7%), self-employed (incorporated) (11 | 8.9%), and self-employed (not incorporated) (11 | 8.9%) make up the most common classes of employment.
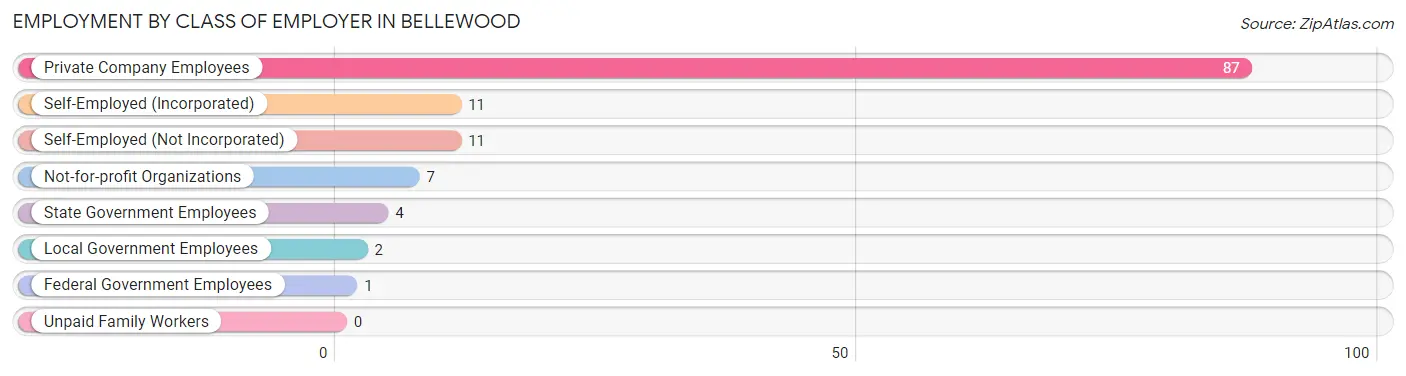
| Employer Class | # Employees | % Employees |
| Private Company Employees | 87 | 70.7% |
| Self-Employed (Incorporated) | 11 | 8.9% |
| Self-Employed (Not Incorporated) | 11 | 8.9% |
| Not-for-profit Organizations | 7 | 5.7% |
| Local Government Employees | 2 | 1.6% |
| State Government Employees | 4 | 3.3% |
| Federal Government Employees | 1 | 0.8% |
| Unpaid Family Workers | 0 | 0.0% |
| Total | 123 | 100.0% |
Employment Status by Age in Bellewood
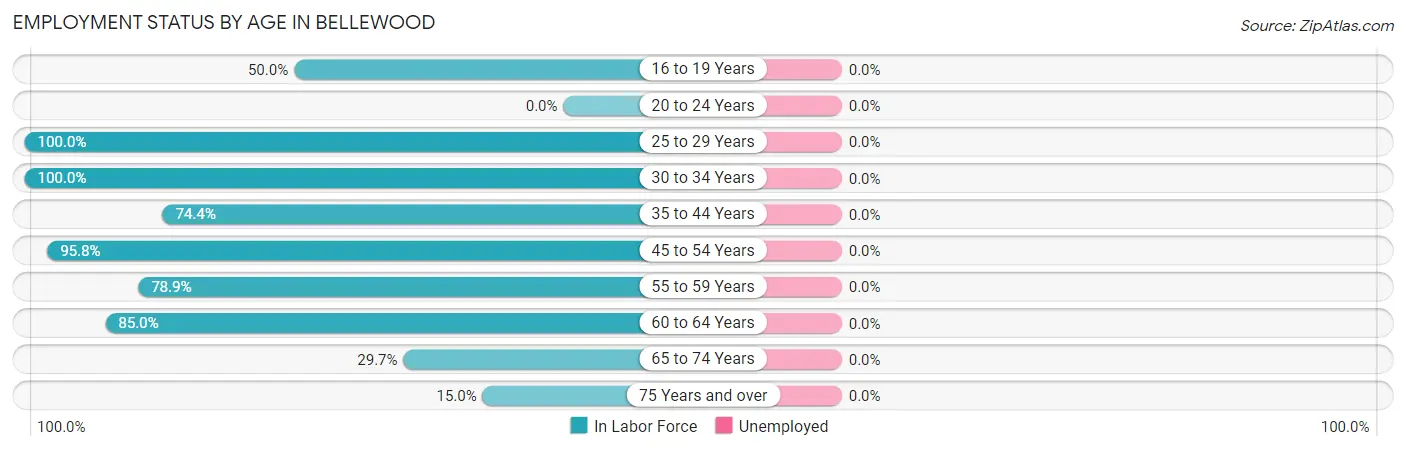
| Age Bracket | In Labor Force | Unemployed |
| 16 to 19 Years | 1 (50.0%) | 0 (0.0%) |
| 20 to 24 Years | 0 (0.0%) | 0 (0.0%) |
| 25 to 29 Years | 8 (100.0%) | 0 (0.0%) |
| 30 to 34 Years | 16 (100.0%) | 0 (0.0%) |
| 35 to 44 Years | 29 (74.4%) | 0 (0.0%) |
| 45 to 54 Years | 23 (95.8%) | 0 (0.0%) |
| 55 to 59 Years | 15 (78.9%) | 0 (0.0%) |
| 60 to 64 Years | 17 (85.0%) | 0 (0.0%) |
| 65 to 74 Years | 11 (29.7%) | 0 (0.0%) |
| 75 Years and over | 3 (15.0%) | 0 (0.0%) |
| Total | 123 (66.5%) | 0 (0.0%) |
Employment Status by Educational Attainment in Bellewood
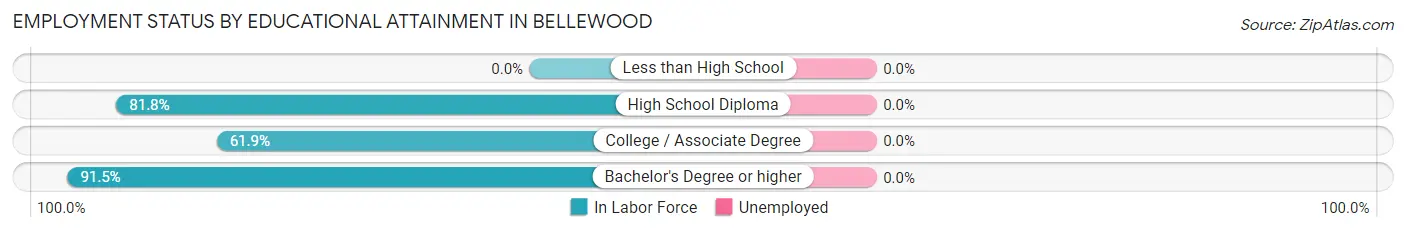
| Educational Attainment | In Labor Force | Unemployed |
| Less than High School | 0 (0.0%) | 0 (0.0%) |
| High School Diploma | 9 (81.8%) | 0 (0.0%) |
| College / Associate Degree | 13 (61.9%) | 0 (0.0%) |
| Bachelor's Degree or higher | 86 (91.5%) | 0 (0.0%) |
| Total | 108 (85.7%) | 0 (0.0%) |
Employment Occupations by Sex in Bellewood
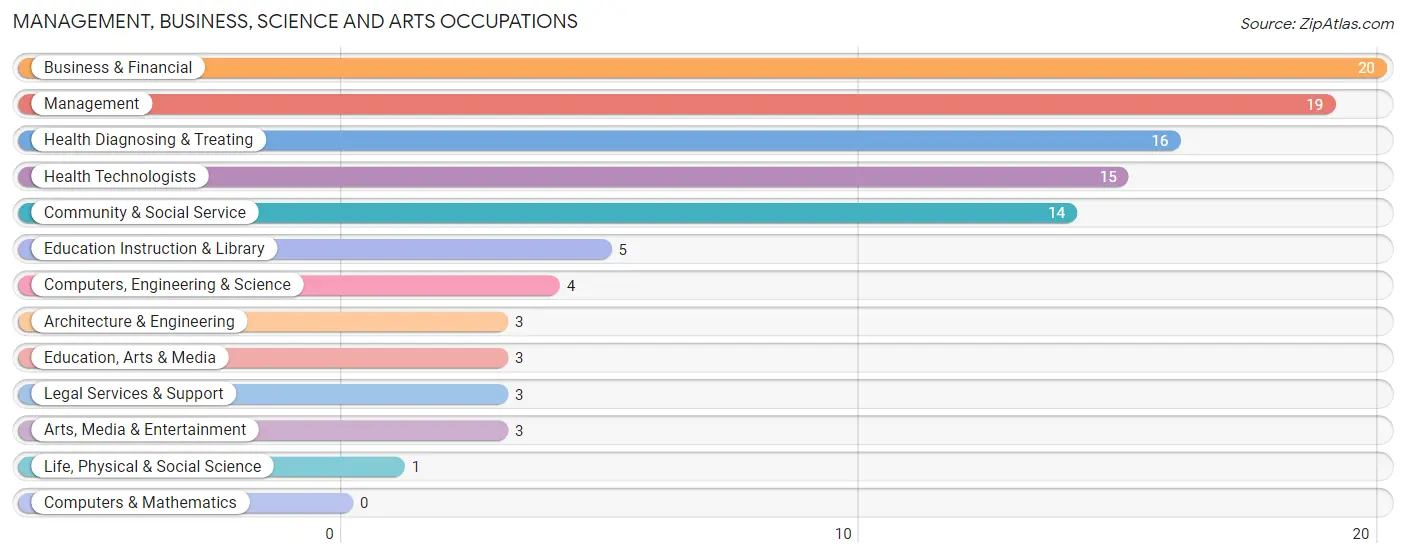
Management, Business, Science and Arts Occupations
The most common Management, Business, Science and Arts occupations in Bellewood are Business & Financial (20 | 16.3%), Management (19 | 15.4%), Health Diagnosing & Treating (16 | 13.0%), Health Technologists (15 | 12.2%), and Community & Social Service (14 | 11.4%).
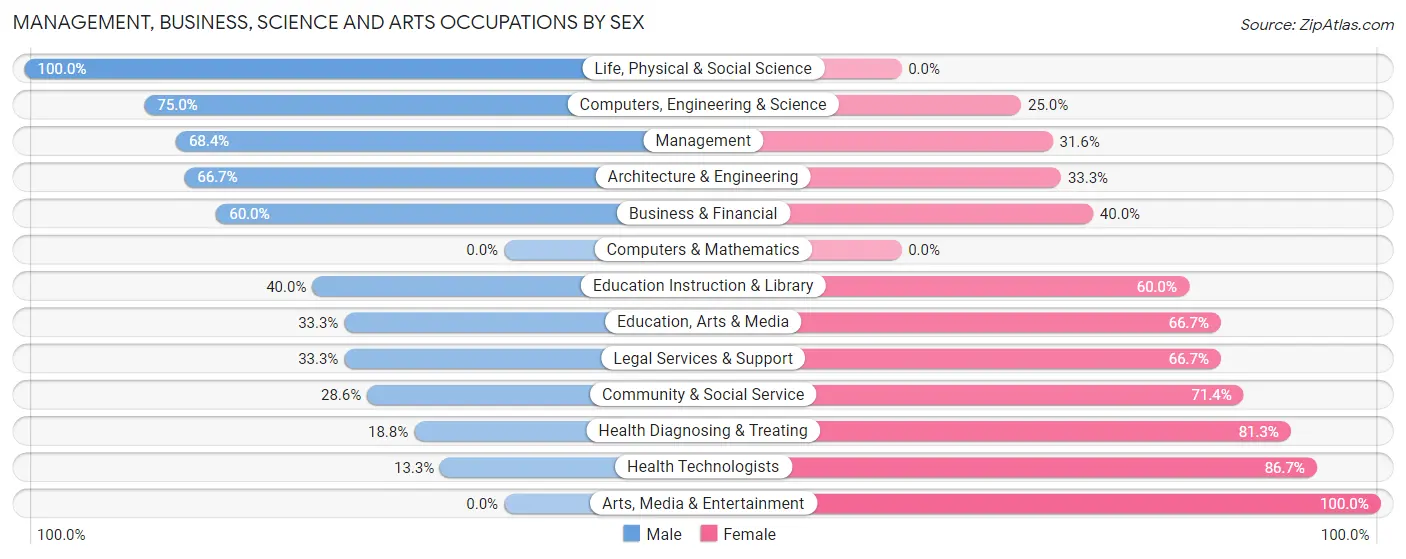
Management, Business, Science and Arts Occupations by Sex
Within the Management, Business, Science and Arts occupations in Bellewood, the most male-oriented occupations are Life, Physical & Social Science (100.0%), Computers, Engineering & Science (75.0%), and Management (68.4%), while the most female-oriented occupations are Arts, Media & Entertainment (100.0%), Health Technologists (86.7%), and Health Diagnosing & Treating (81.2%).
| Occupation | Male | Female |
| Management | 13 (68.4%) | 6 (31.6%) |
| Business & Financial | 12 (60.0%) | 8 (40.0%) |
| Computers, Engineering & Science | 3 (75.0%) | 1 (25.0%) |
| Computers & Mathematics | 0 (0.0%) | 0 (0.0%) |
| Architecture & Engineering | 2 (66.7%) | 1 (33.3%) |
| Life, Physical & Social Science | 1 (100.0%) | 0 (0.0%) |
| Community & Social Service | 4 (28.6%) | 10 (71.4%) |
| Education, Arts & Media | 1 (33.3%) | 2 (66.7%) |
| Legal Services & Support | 1 (33.3%) | 2 (66.7%) |
| Education Instruction & Library | 2 (40.0%) | 3 (60.0%) |
| Arts, Media & Entertainment | 0 (0.0%) | 3 (100.0%) |
| Health Diagnosing & Treating | 3 (18.8%) | 13 (81.2%) |
| Health Technologists | 2 (13.3%) | 13 (86.7%) |
| Total (Category) | 35 (47.9%) | 38 (52.0%) |
| Total (Overall) | 65 (52.8%) | 58 (47.1%) |
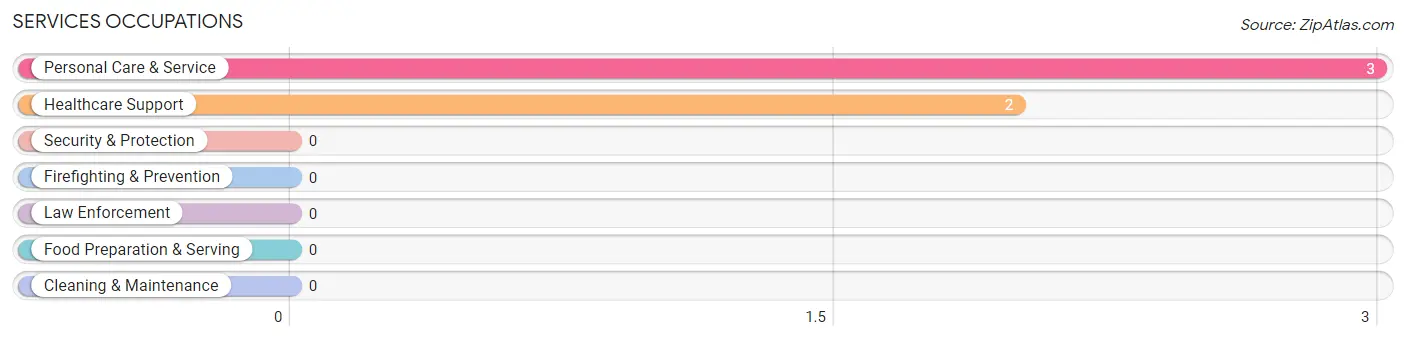
Services Occupations
The most common Services occupations in Bellewood are Personal Care & Service (3 | 2.4%), and Healthcare Support (2 | 1.6%).
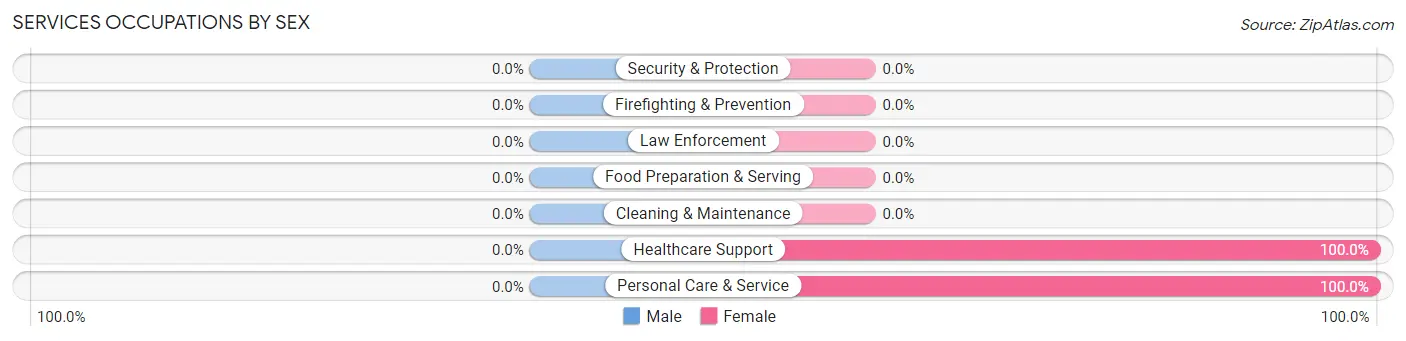
Services Occupations by Sex
| Occupation | Male | Female |
| Healthcare Support | 0 (0.0%) | 2 (100.0%) |
| Security & Protection | 0 (0.0%) | 0 (0.0%) |
| Firefighting & Prevention | 0 (0.0%) | 0 (0.0%) |
| Law Enforcement | 0 (0.0%) | 0 (0.0%) |
| Food Preparation & Serving | 0 (0.0%) | 0 (0.0%) |
| Cleaning & Maintenance | 0 (0.0%) | 0 (0.0%) |
| Personal Care & Service | 0 (0.0%) | 3 (100.0%) |
| Total (Category) | 0 (0.0%) | 5 (100.0%) |
| Total (Overall) | 65 (52.8%) | 58 (47.1%) |
Sales and Office Occupations
The most common Sales and Office occupations in Bellewood are Sales & Related (24 | 19.5%), and Office & Administration (9 | 7.3%).
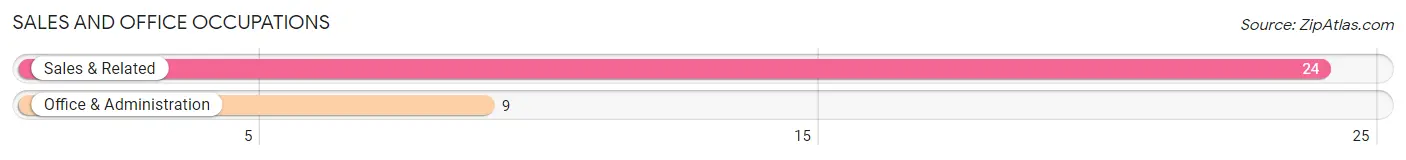
Sales and Office Occupations by Sex
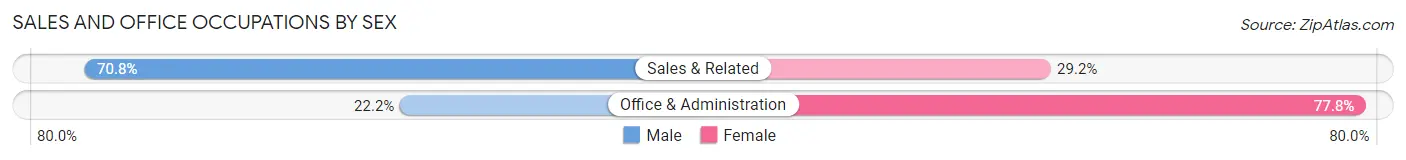
| Occupation | Male | Female |
| Sales & Related | 17 (70.8%) | 7 (29.2%) |
| Office & Administration | 2 (22.2%) | 7 (77.8%) |
| Total (Category) | 19 (57.6%) | 14 (42.4%) |
| Total (Overall) | 65 (52.8%) | 58 (47.1%) |
Natural Resources, Construction and Maintenance Occupations
The most common Natural Resources, Construction and Maintenance occupations in Bellewood are Construction & Extraction (2 | 1.6%), and Installation, Maintenance & Repair (1 | 0.8%).
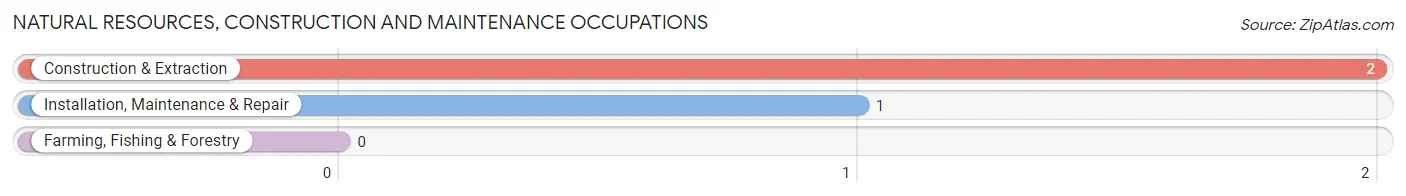
Natural Resources, Construction and Maintenance Occupations by Sex
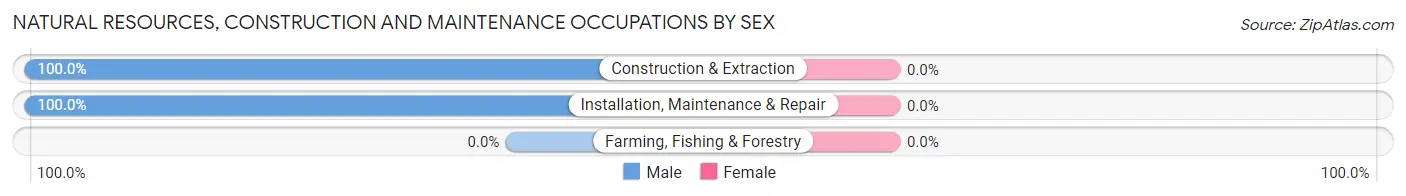
| Occupation | Male | Female |
| Farming, Fishing & Forestry | 0 (0.0%) | 0 (0.0%) |
| Construction & Extraction | 2 (100.0%) | 0 (0.0%) |
| Installation, Maintenance & Repair | 1 (100.0%) | 0 (0.0%) |
| Total (Category) | 3 (100.0%) | 0 (0.0%) |
| Total (Overall) | 65 (52.8%) | 58 (47.1%) |
Production, Transportation and Moving Occupations
The most common Production, Transportation and Moving occupations in Bellewood are Production (5 | 4.1%), and Material Moving (4 | 3.3%).
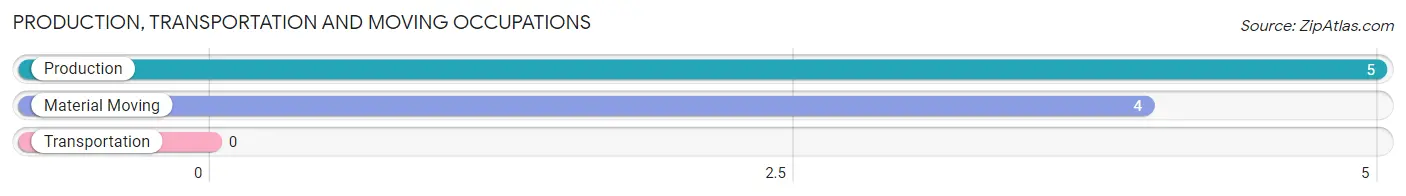
Production, Transportation and Moving Occupations by Sex
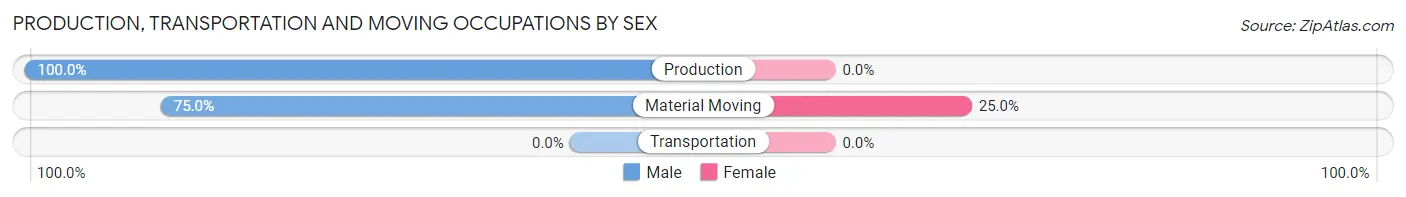
| Occupation | Male | Female |
| Production | 5 (100.0%) | 0 (0.0%) |
| Transportation | 0 (0.0%) | 0 (0.0%) |
| Material Moving | 3 (75.0%) | 1 (25.0%) |
| Total (Category) | 8 (88.9%) | 1 (11.1%) |
| Total (Overall) | 65 (52.8%) | 58 (47.1%) |
Employment Industries by Sex in Bellewood
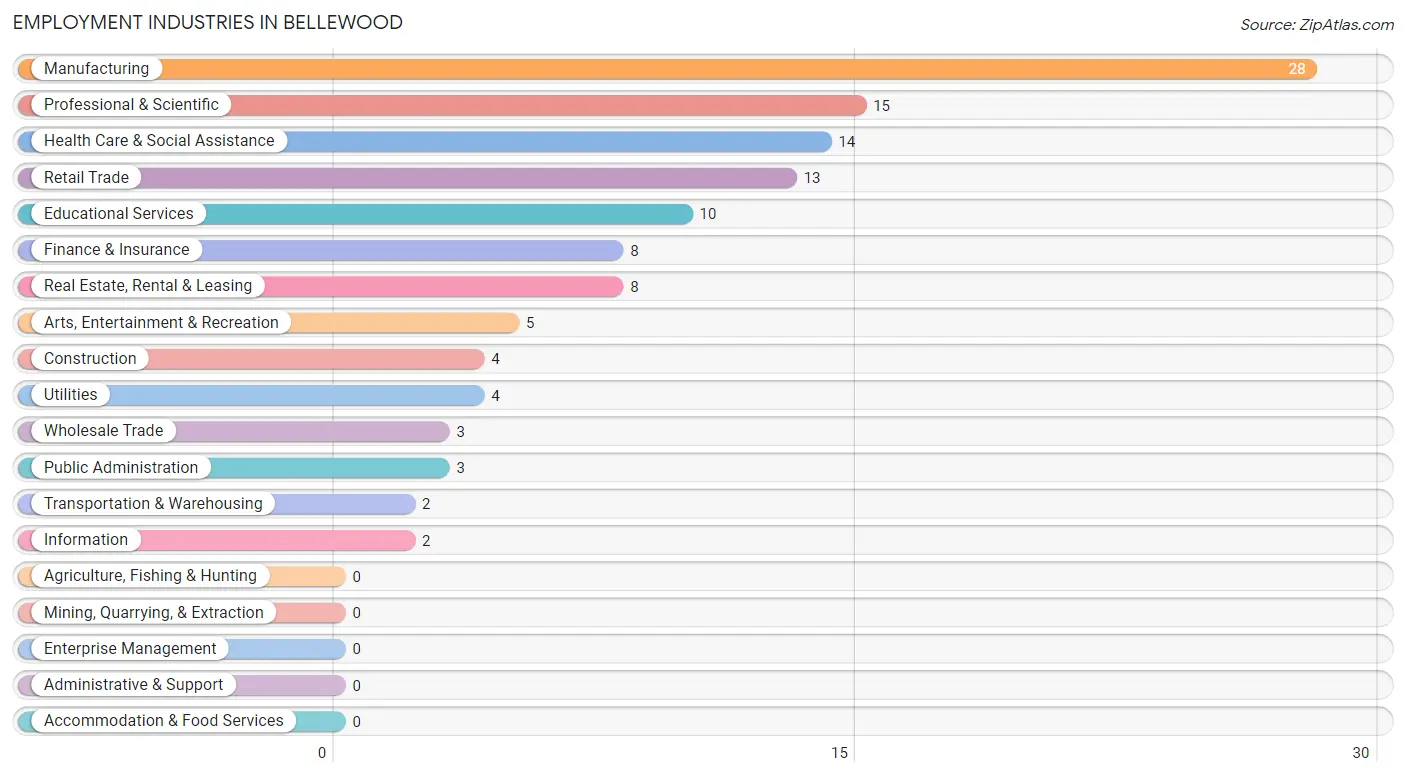
Employment Industries in Bellewood
The major employment industries in Bellewood include Manufacturing (28 | 22.8%), Professional & Scientific (15 | 12.2%), Health Care & Social Assistance (14 | 11.4%), Retail Trade (13 | 10.6%), and Educational Services (10 | 8.1%).
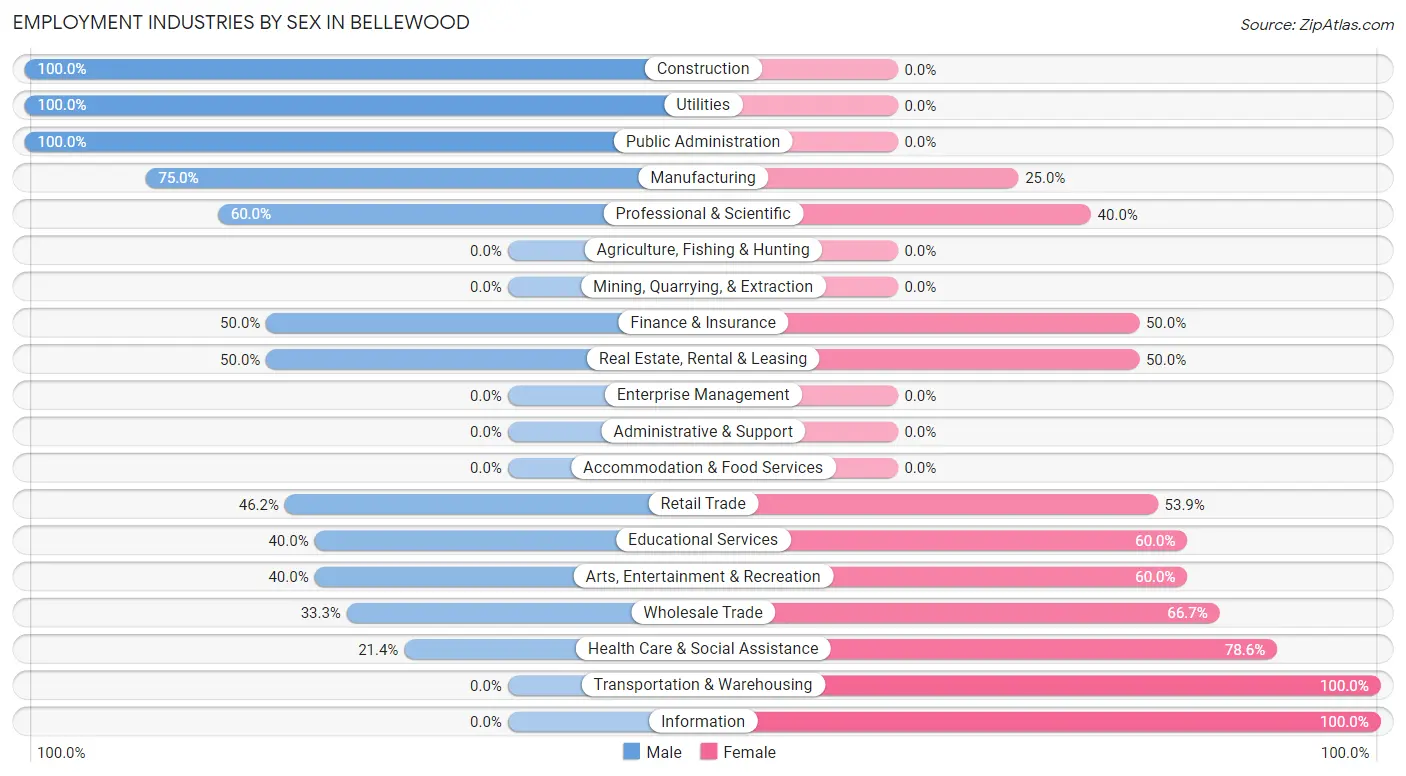
Employment Industries by Sex in Bellewood
The Bellewood industries that see more men than women are Construction (100.0%), Utilities (100.0%), and Public Administration (100.0%), whereas the industries that tend to have a higher number of women are Transportation & Warehousing (100.0%), Information (100.0%), and Health Care & Social Assistance (78.6%).
| Industry | Male | Female |
| Agriculture, Fishing & Hunting | 0 (0.0%) | 0 (0.0%) |
| Mining, Quarrying, & Extraction | 0 (0.0%) | 0 (0.0%) |
| Construction | 4 (100.0%) | 0 (0.0%) |
| Manufacturing | 21 (75.0%) | 7 (25.0%) |
| Wholesale Trade | 1 (33.3%) | 2 (66.7%) |
| Retail Trade | 6 (46.2%) | 7 (53.8%) |
| Transportation & Warehousing | 0 (0.0%) | 2 (100.0%) |
| Utilities | 4 (100.0%) | 0 (0.0%) |
| Information | 0 (0.0%) | 2 (100.0%) |
| Finance & Insurance | 4 (50.0%) | 4 (50.0%) |
| Real Estate, Rental & Leasing | 4 (50.0%) | 4 (50.0%) |
| Professional & Scientific | 9 (60.0%) | 6 (40.0%) |
| Enterprise Management | 0 (0.0%) | 0 (0.0%) |
| Administrative & Support | 0 (0.0%) | 0 (0.0%) |
| Educational Services | 4 (40.0%) | 6 (60.0%) |
| Health Care & Social Assistance | 3 (21.4%) | 11 (78.6%) |
| Arts, Entertainment & Recreation | 2 (40.0%) | 3 (60.0%) |
| Accommodation & Food Services | 0 (0.0%) | 0 (0.0%) |
| Public Administration | 3 (100.0%) | 0 (0.0%) |
| Total | 65 (52.8%) | 58 (47.1%) |
Education in Bellewood
School Enrollment in Bellewood
The most common levels of schooling among the 43 students in Bellewood are elementary school (18 | 41.9%), middle school (9 | 20.9%), and nursery / preschool (8 | 18.6%).
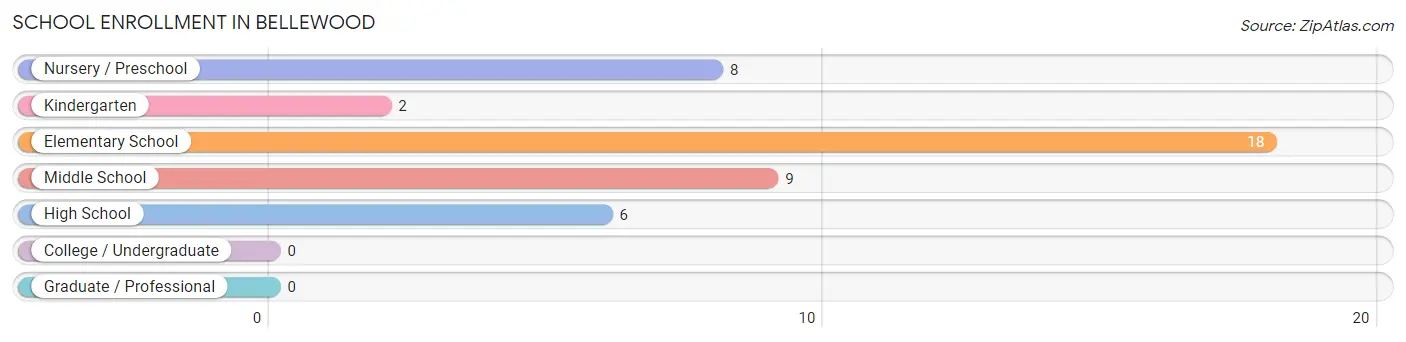
| School Level | # Students | % Students |
| Nursery / Preschool | 8 | 18.6% |
| Kindergarten | 2 | 4.6% |
| Elementary School | 18 | 41.9% |
| Middle School | 9 | 20.9% |
| High School | 6 | 14.0% |
| College / Undergraduate | 0 | 0.0% |
| Graduate / Professional | 0 | 0.0% |
| Total | 43 | 100.0% |
School Enrollment by Age by Funding Source in Bellewood
Out of a total of 43 students who are enrolled in schools in Bellewood, 42 (97.7%) attend a private institution, while the remaining 1 (2.3%) are enrolled in public schools. The age group of 3 to 4 year olds has the highest likelihood of being enrolled in private schools, with 8 (100.0% in the age bracket) enrolled. Conversely, the age group of 5 to 9 year old has the lowest likelihood of being enrolled in a private school, with 1 (6.7% in the age bracket) attending a public institution.
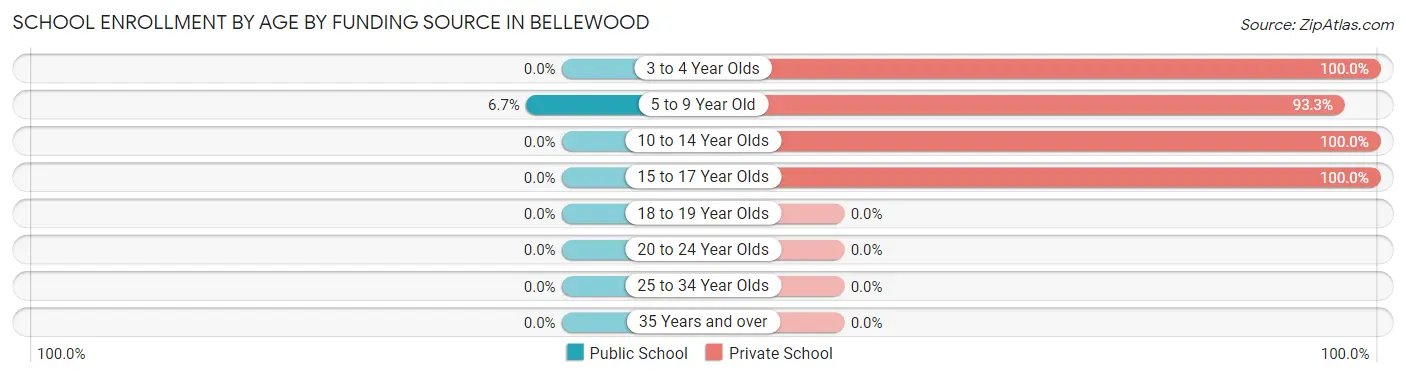
| Age Bracket | Public School | Private School |
| 3 to 4 Year Olds | 0 (0.0%) | 8 (100.0%) |
| 5 to 9 Year Old | 1 (6.7%) | 14 (93.3%) |
| 10 to 14 Year Olds | 0 (0.0%) | 17 (100.0%) |
| 15 to 17 Year Olds | 0 (0.0%) | 3 (100.0%) |
| 18 to 19 Year Olds | 0 (0.0%) | 0 (0.0%) |
| 20 to 24 Year Olds | 0 (0.0%) | 0 (0.0%) |
| 25 to 34 Year Olds | 0 (0.0%) | 0 (0.0%) |
| 35 Years and over | 0 (0.0%) | 0 (0.0%) |
| Total | 1 (2.3%) | 42 (97.7%) |
Educational Attainment by Field of Study in Bellewood
Business (34 | 23.1%), social sciences (18 | 12.2%), literature & languages (16 | 10.9%), science & technology (13 | 8.8%), and education (11 | 7.5%) are the most common fields of study among 147 individuals in Bellewood who have obtained a bachelor's degree or higher.
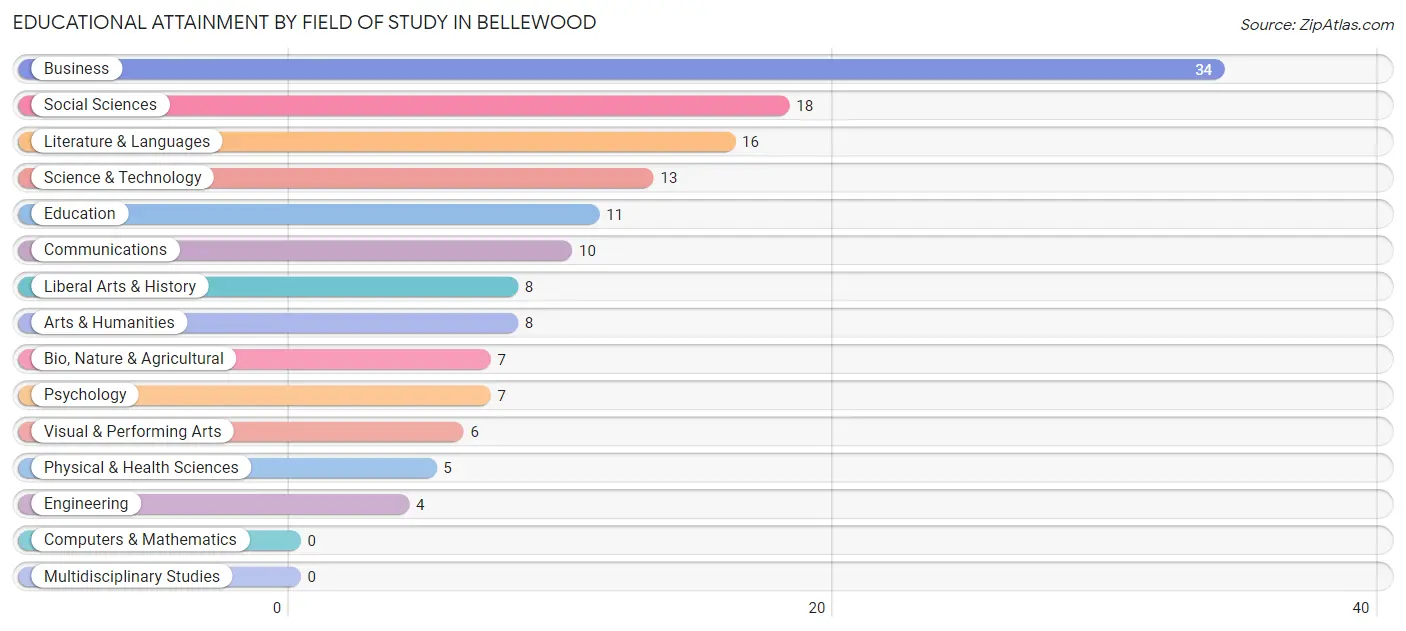
| Field of Study | # Graduates | % Graduates |
| Computers & Mathematics | 0 | 0.0% |
| Bio, Nature & Agricultural | 7 | 4.8% |
| Physical & Health Sciences | 5 | 3.4% |
| Psychology | 7 | 4.8% |
| Social Sciences | 18 | 12.2% |
| Engineering | 4 | 2.7% |
| Multidisciplinary Studies | 0 | 0.0% |
| Science & Technology | 13 | 8.8% |
| Business | 34 | 23.1% |
| Education | 11 | 7.5% |
| Literature & Languages | 16 | 10.9% |
| Liberal Arts & History | 8 | 5.4% |
| Visual & Performing Arts | 6 | 4.1% |
| Communications | 10 | 6.8% |
| Arts & Humanities | 8 | 5.4% |
| Total | 147 | 100.0% |
Transportation & Commute in Bellewood
Vehicle Availability by Sex in Bellewood
The most prevalent vehicle ownership categories in Bellewood are males with 2 vehicles (43, accounting for 66.1%) and females with 2 vehicles (32, making up 74.1%).
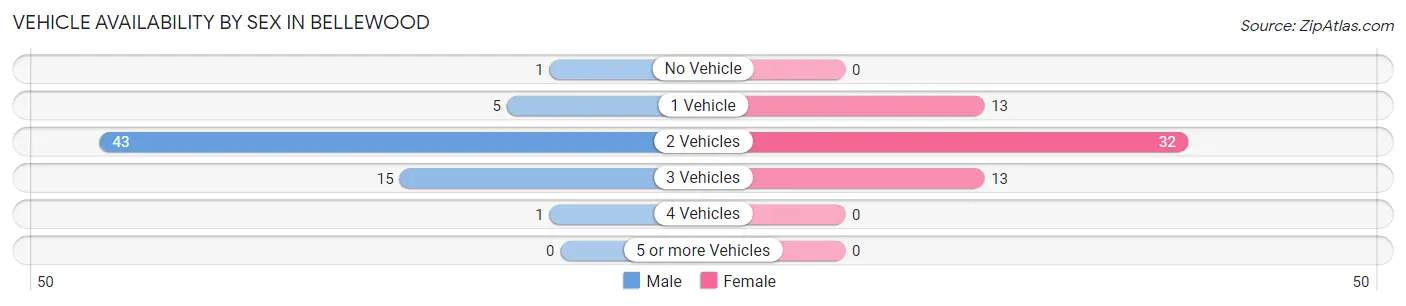
| Vehicles Available | Male | Female |
| No Vehicle | 1 (1.5%) | 0 (0.0%) |
| 1 Vehicle | 5 (7.7%) | 13 (22.4%) |
| 2 Vehicles | 43 (66.1%) | 32 (55.2%) |
| 3 Vehicles | 15 (23.1%) | 13 (22.4%) |
| 4 Vehicles | 1 (1.5%) | 0 (0.0%) |
| 5 or more Vehicles | 0 (0.0%) | 0 (0.0%) |
| Total | 65 (100.0%) | 58 (100.0%) |
Commute Time in Bellewood
The most frequently occuring commute durations in Bellewood are 20 to 24 minutes (24 commuters, 24.0%), 15 to 19 minutes (23 commuters, 23.0%), and 5 to 9 minutes (19 commuters, 19.0%).
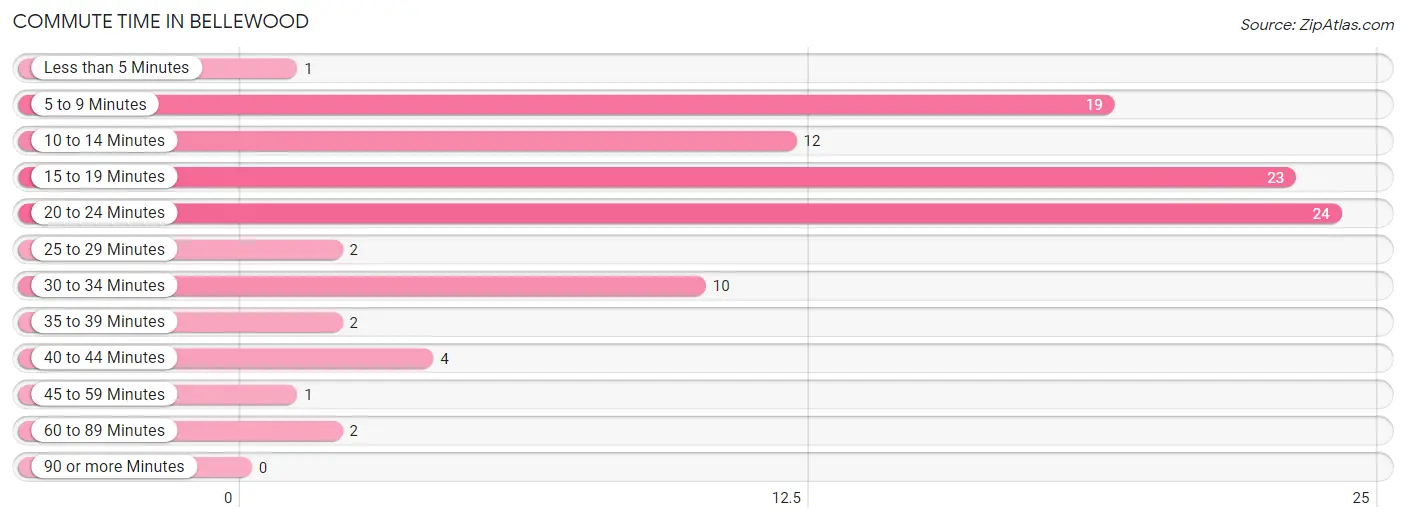
| Commute Time | # Commuters | % Commuters |
| Less than 5 Minutes | 1 | 1.0% |
| 5 to 9 Minutes | 19 | 19.0% |
| 10 to 14 Minutes | 12 | 12.0% |
| 15 to 19 Minutes | 23 | 23.0% |
| 20 to 24 Minutes | 24 | 24.0% |
| 25 to 29 Minutes | 2 | 2.0% |
| 30 to 34 Minutes | 10 | 10.0% |
| 35 to 39 Minutes | 2 | 2.0% |
| 40 to 44 Minutes | 4 | 4.0% |
| 45 to 59 Minutes | 1 | 1.0% |
| 60 to 89 Minutes | 2 | 2.0% |
| 90 or more Minutes | 0 | 0.0% |
Commute Time by Sex in Bellewood
The most common commute times in Bellewood are 20 to 24 minutes (13 commuters, 25.0%) for males and 15 to 19 minutes (14 commuters, 29.2%) for females.
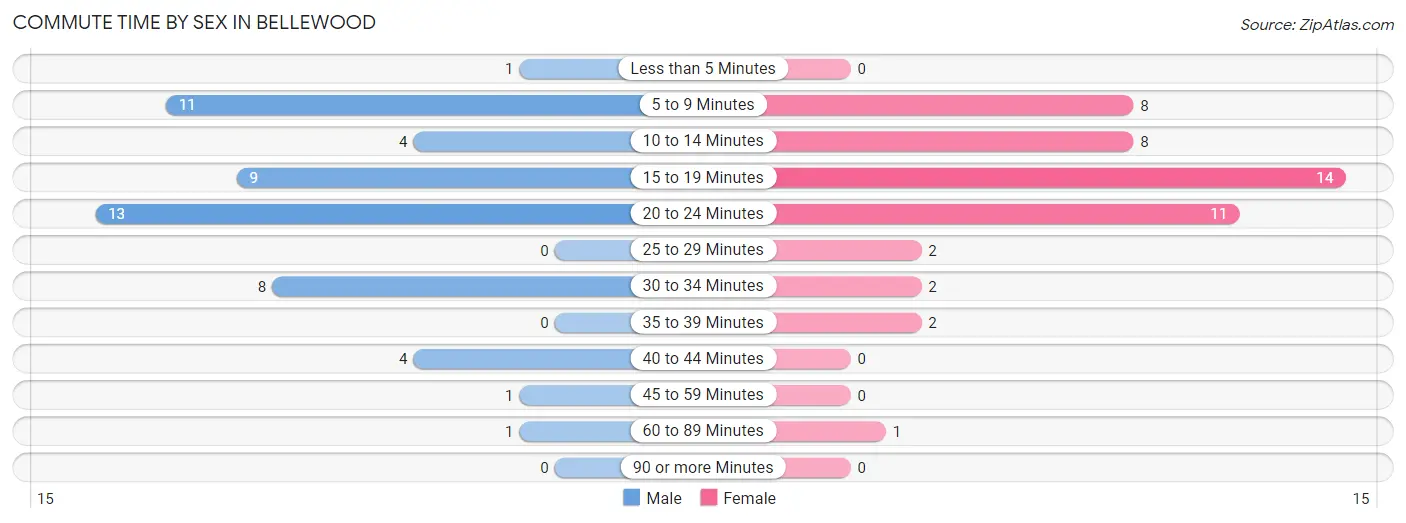
| Commute Time | Male | Female |
| Less than 5 Minutes | 1 (1.9%) | 0 (0.0%) |
| 5 to 9 Minutes | 11 (21.1%) | 8 (16.7%) |
| 10 to 14 Minutes | 4 (7.7%) | 8 (16.7%) |
| 15 to 19 Minutes | 9 (17.3%) | 14 (29.2%) |
| 20 to 24 Minutes | 13 (25.0%) | 11 (22.9%) |
| 25 to 29 Minutes | 0 (0.0%) | 2 (4.2%) |
| 30 to 34 Minutes | 8 (15.4%) | 2 (4.2%) |
| 35 to 39 Minutes | 0 (0.0%) | 2 (4.2%) |
| 40 to 44 Minutes | 4 (7.7%) | 0 (0.0%) |
| 45 to 59 Minutes | 1 (1.9%) | 0 (0.0%) |
| 60 to 89 Minutes | 1 (1.9%) | 1 (2.1%) |
| 90 or more Minutes | 0 (0.0%) | 0 (0.0%) |
Time of Departure to Work by Sex in Bellewood
The most frequent times of departure to work in Bellewood are 8:00 AM to 8:29 AM (18, 34.6%) for males and 8:00 AM to 8:29 AM (16, 33.3%) for females.
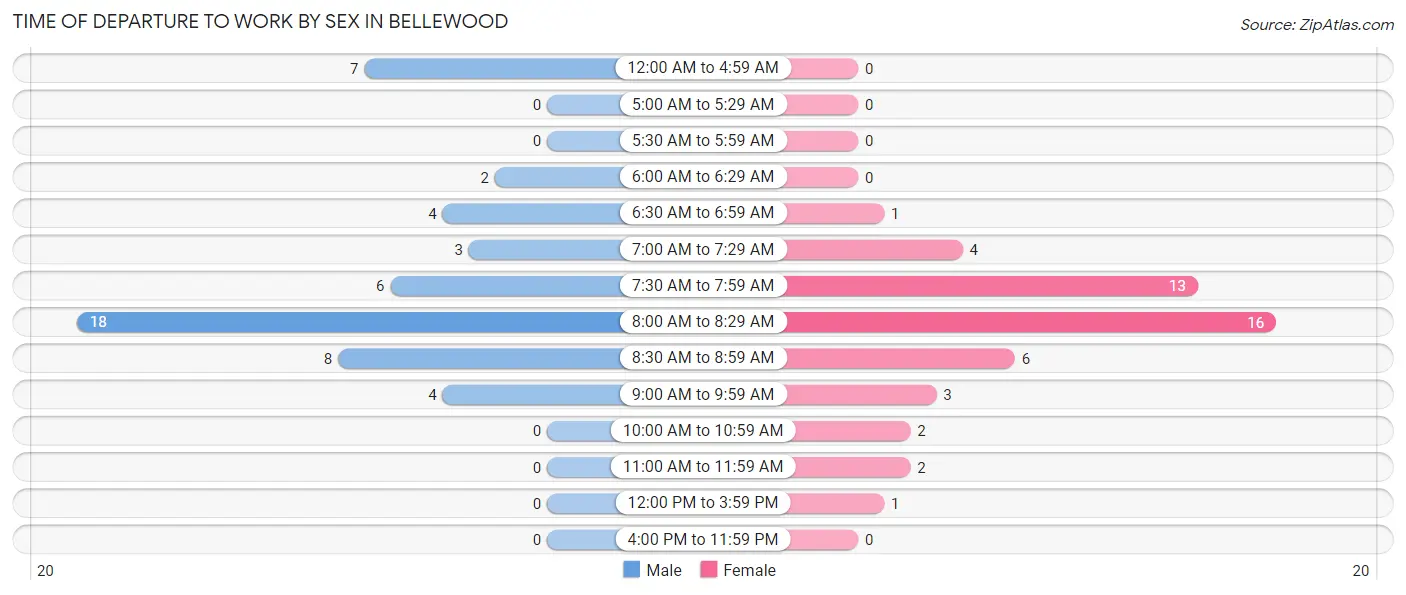
| Time of Departure | Male | Female |
| 12:00 AM to 4:59 AM | 7 (13.5%) | 0 (0.0%) |
| 5:00 AM to 5:29 AM | 0 (0.0%) | 0 (0.0%) |
| 5:30 AM to 5:59 AM | 0 (0.0%) | 0 (0.0%) |
| 6:00 AM to 6:29 AM | 2 (3.8%) | 0 (0.0%) |
| 6:30 AM to 6:59 AM | 4 (7.7%) | 1 (2.1%) |
| 7:00 AM to 7:29 AM | 3 (5.8%) | 4 (8.3%) |
| 7:30 AM to 7:59 AM | 6 (11.5%) | 13 (27.1%) |
| 8:00 AM to 8:29 AM | 18 (34.6%) | 16 (33.3%) |
| 8:30 AM to 8:59 AM | 8 (15.4%) | 6 (12.5%) |
| 9:00 AM to 9:59 AM | 4 (7.7%) | 3 (6.2%) |
| 10:00 AM to 10:59 AM | 0 (0.0%) | 2 (4.2%) |
| 11:00 AM to 11:59 AM | 0 (0.0%) | 2 (4.2%) |
| 12:00 PM to 3:59 PM | 0 (0.0%) | 1 (2.1%) |
| 4:00 PM to 11:59 PM | 0 (0.0%) | 0 (0.0%) |
| Total | 52 (100.0%) | 48 (100.0%) |
Housing Occupancy in Bellewood
Occupancy by Ownership in Bellewood
Of the total 99 dwellings in Bellewood, owner-occupied units account for 96 (97.0%), while renter-occupied units make up 3 (3.0%).
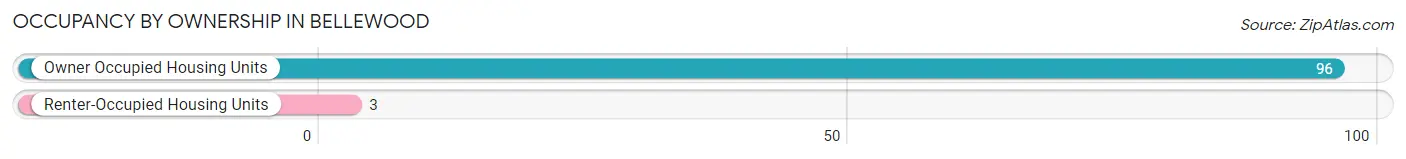
| Occupancy | # Housing Units | % Housing Units |
| Owner Occupied Housing Units | 96 | 97.0% |
| Renter-Occupied Housing Units | 3 | 3.0% |
| Total Occupied Housing Units | 99 | 100.0% |
Occupancy by Household Size in Bellewood
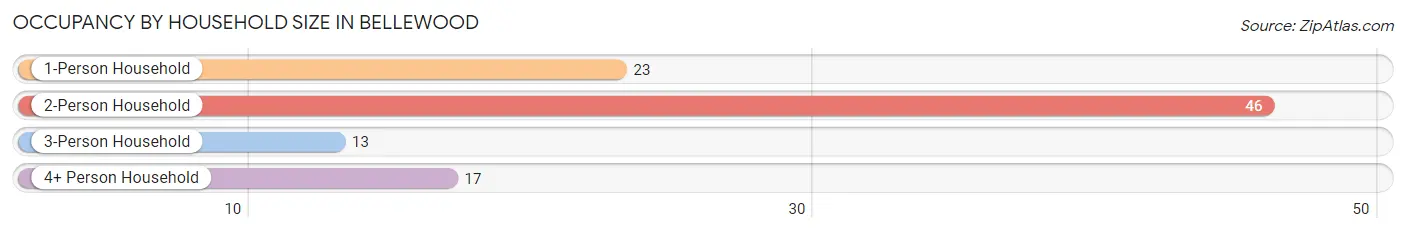
| Household Size | # Housing Units | % Housing Units |
| 1-Person Household | 23 | 23.2% |
| 2-Person Household | 46 | 46.5% |
| 3-Person Household | 13 | 13.1% |
| 4+ Person Household | 17 | 17.2% |
| Total Housing Units | 99 | 100.0% |
Occupancy by Ownership by Household Size in Bellewood
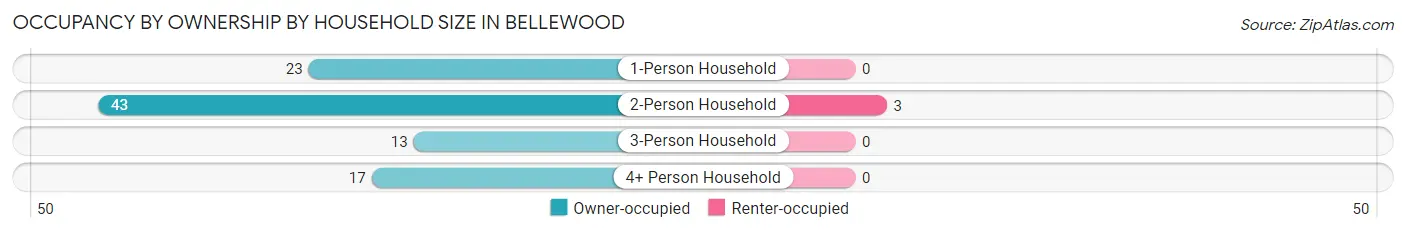
| Household Size | Owner-occupied | Renter-occupied |
| 1-Person Household | 23 (100.0%) | 0 (0.0%) |
| 2-Person Household | 43 (93.5%) | 3 (6.5%) |
| 3-Person Household | 13 (100.0%) | 0 (0.0%) |
| 4+ Person Household | 17 (100.0%) | 0 (0.0%) |
| Total Housing Units | 96 (97.0%) | 3 (3.0%) |
Occupancy by Educational Attainment in Bellewood
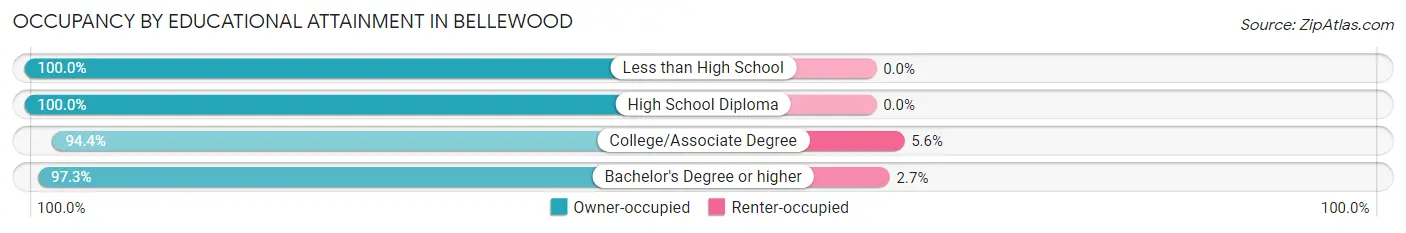
| Household Size | Owner-occupied | Renter-occupied |
| Less than High School | 2 (100.0%) | 0 (0.0%) |
| High School Diploma | 4 (100.0%) | 0 (0.0%) |
| College/Associate Degree | 17 (94.4%) | 1 (5.6%) |
| Bachelor's Degree or higher | 73 (97.3%) | 2 (2.7%) |
Occupancy by Age of Householder in Bellewood
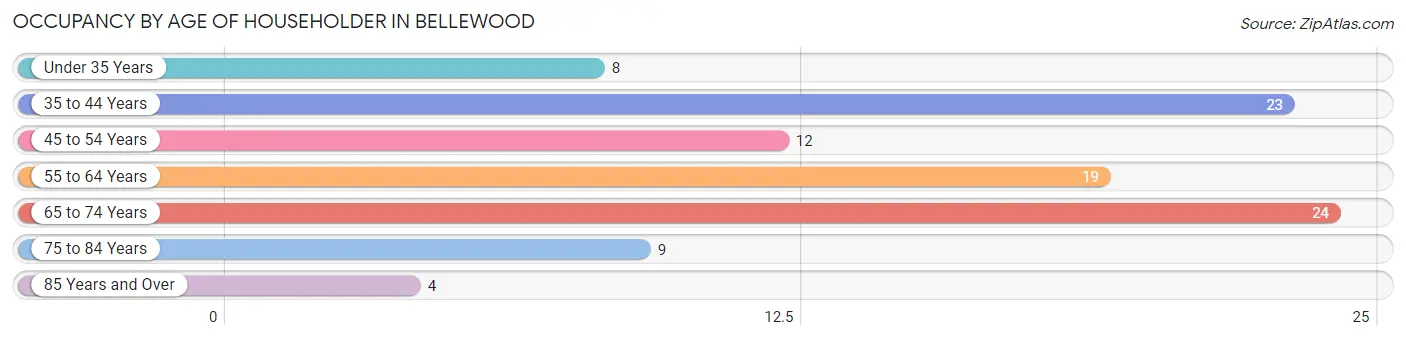
| Age Bracket | # Households | % Households |
| Under 35 Years | 8 | 8.1% |
| 35 to 44 Years | 23 | 23.2% |
| 45 to 54 Years | 12 | 12.1% |
| 55 to 64 Years | 19 | 19.2% |
| 65 to 74 Years | 24 | 24.2% |
| 75 to 84 Years | 9 | 9.1% |
| 85 Years and Over | 4 | 4.0% |
| Total | 99 | 100.0% |
Housing Finances in Bellewood
Median Income by Occupancy in Bellewood
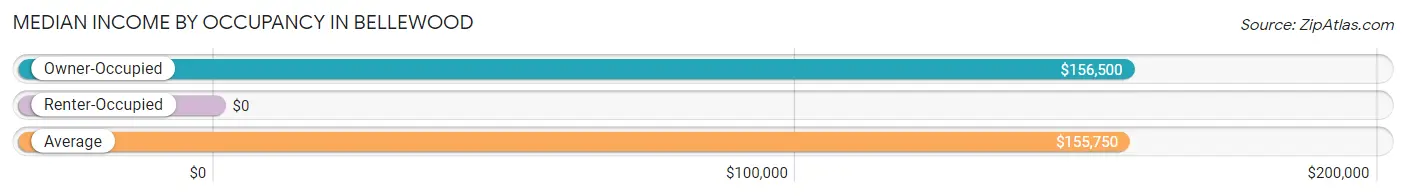
| Occupancy Type | # Households | Median Income |
| Owner-Occupied | 96 (97.0%) | $156,500 |
| Renter-Occupied | 3 (3.0%) | $0 |
| Average | 99 (100.0%) | $155,750 |
Occupancy by Householder Income Bracket in Bellewood
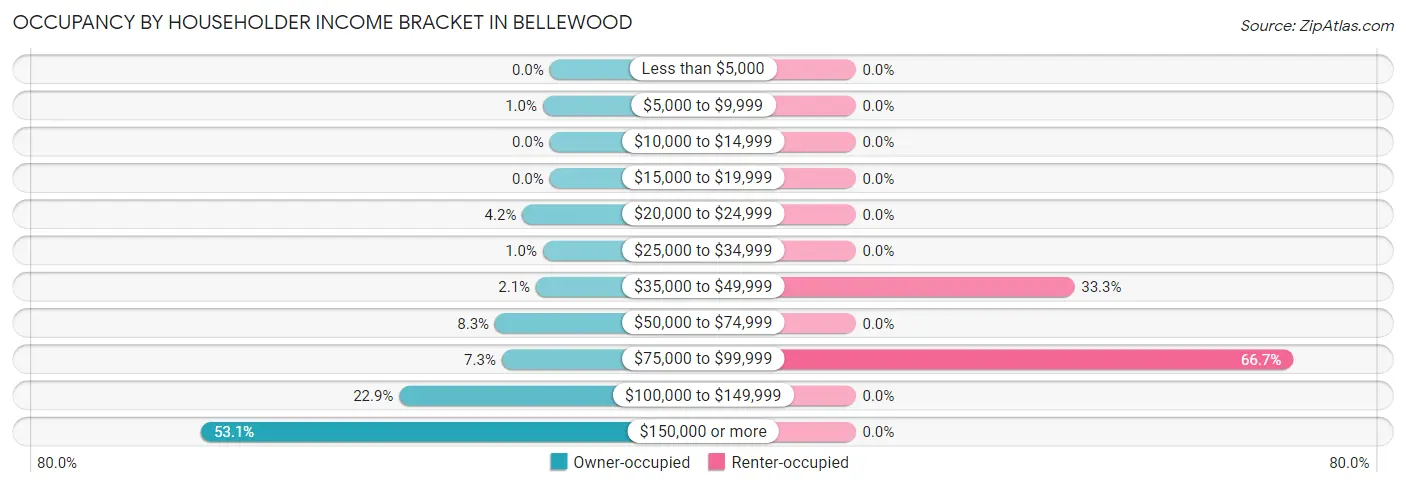
| Income Bracket | Owner-occupied | Renter-occupied |
| Less than $5,000 | 0 (0.0%) | 0 (0.0%) |
| $5,000 to $9,999 | 1 (1.0%) | 0 (0.0%) |
| $10,000 to $14,999 | 0 (0.0%) | 0 (0.0%) |
| $15,000 to $19,999 | 0 (0.0%) | 0 (0.0%) |
| $20,000 to $24,999 | 4 (4.2%) | 0 (0.0%) |
| $25,000 to $34,999 | 1 (1.0%) | 0 (0.0%) |
| $35,000 to $49,999 | 2 (2.1%) | 1 (33.3%) |
| $50,000 to $74,999 | 8 (8.3%) | 0 (0.0%) |
| $75,000 to $99,999 | 7 (7.3%) | 2 (66.7%) |
| $100,000 to $149,999 | 22 (22.9%) | 0 (0.0%) |
| $150,000 or more | 51 (53.1%) | 0 (0.0%) |
| Total | 96 (100.0%) | 3 (100.0%) |
Monthly Housing Cost Tiers in Bellewood
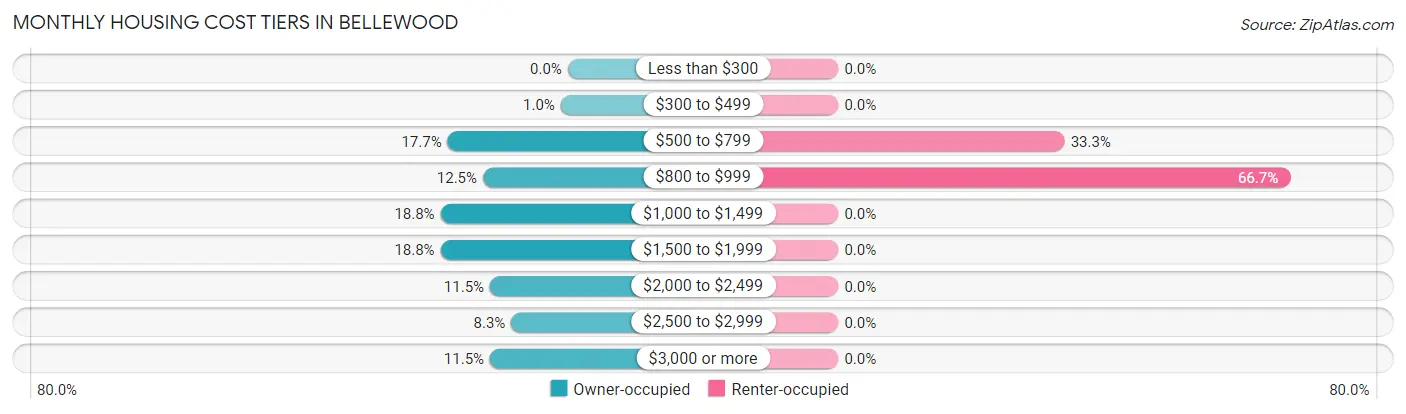
| Monthly Cost | Owner-occupied | Renter-occupied |
| Less than $300 | 0 (0.0%) | 0 (0.0%) |
| $300 to $499 | 1 (1.0%) | 0 (0.0%) |
| $500 to $799 | 17 (17.7%) | 1 (33.3%) |
| $800 to $999 | 12 (12.5%) | 2 (66.7%) |
| $1,000 to $1,499 | 18 (18.8%) | 0 (0.0%) |
| $1,500 to $1,999 | 18 (18.8%) | 0 (0.0%) |
| $2,000 to $2,499 | 11 (11.5%) | 0 (0.0%) |
| $2,500 to $2,999 | 8 (8.3%) | 0 (0.0%) |
| $3,000 or more | 11 (11.5%) | 0 (0.0%) |
| Total | 96 (100.0%) | 3 (100.0%) |
Physical Housing Characteristics in Bellewood
Housing Structures in Bellewood
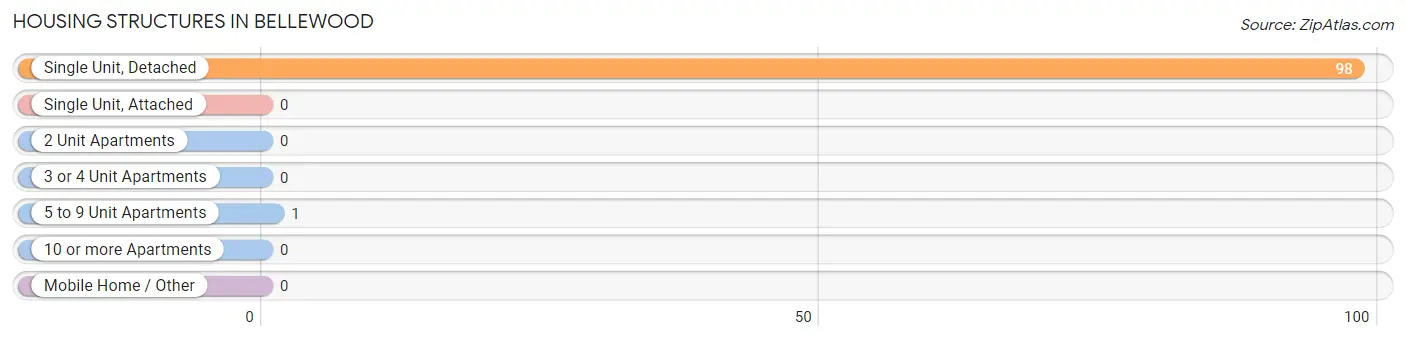
| Structure Type | # Housing Units | % Housing Units |
| Single Unit, Detached | 98 | 99.0% |
| Single Unit, Attached | 0 | 0.0% |
| 2 Unit Apartments | 0 | 0.0% |
| 3 or 4 Unit Apartments | 0 | 0.0% |
| 5 to 9 Unit Apartments | 1 | 1.0% |
| 10 or more Apartments | 0 | 0.0% |
| Mobile Home / Other | 0 | 0.0% |
| Total | 99 | 100.0% |
Housing Structures by Occupancy in Bellewood
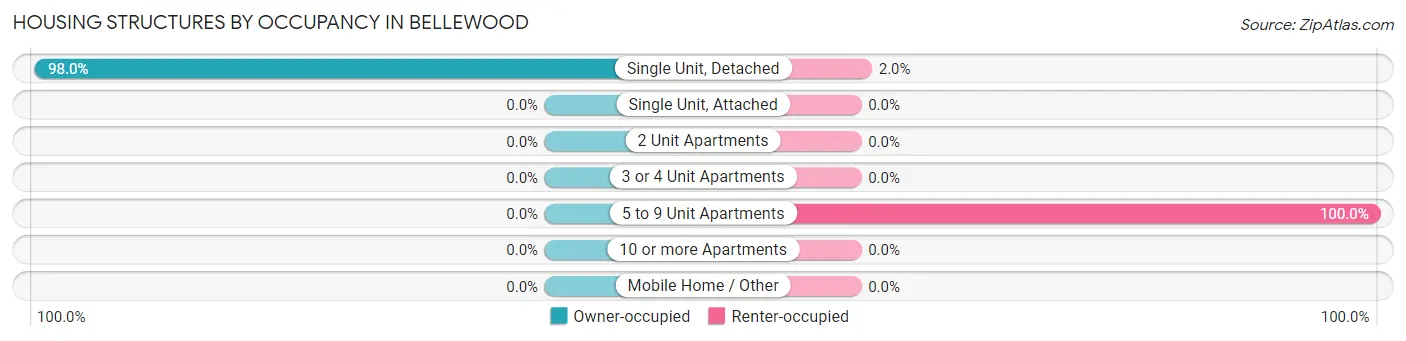
| Structure Type | Owner-occupied | Renter-occupied |
| Single Unit, Detached | 96 (98.0%) | 2 (2.0%) |
| Single Unit, Attached | 0 (0.0%) | 0 (0.0%) |
| 2 Unit Apartments | 0 (0.0%) | 0 (0.0%) |
| 3 or 4 Unit Apartments | 0 (0.0%) | 0 (0.0%) |
| 5 to 9 Unit Apartments | 0 (0.0%) | 1 (100.0%) |
| 10 or more Apartments | 0 (0.0%) | 0 (0.0%) |
| Mobile Home / Other | 0 (0.0%) | 0 (0.0%) |
| Total | 96 (97.0%) | 3 (3.0%) |
Housing Structures by Number of Rooms in Bellewood
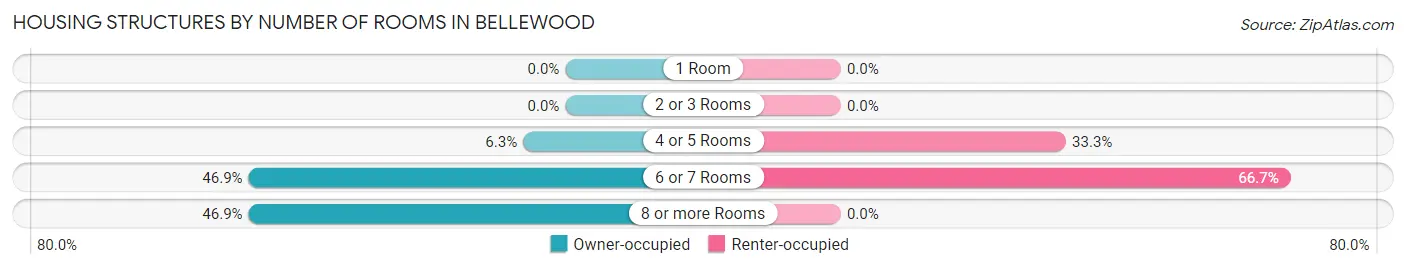
| Number of Rooms | Owner-occupied | Renter-occupied |
| 1 Room | 0 (0.0%) | 0 (0.0%) |
| 2 or 3 Rooms | 0 (0.0%) | 0 (0.0%) |
| 4 or 5 Rooms | 6 (6.2%) | 1 (33.3%) |
| 6 or 7 Rooms | 45 (46.9%) | 2 (66.7%) |
| 8 or more Rooms | 45 (46.9%) | 0 (0.0%) |
| Total | 96 (100.0%) | 3 (100.0%) |
Housing Structure by Heating Type in Bellewood
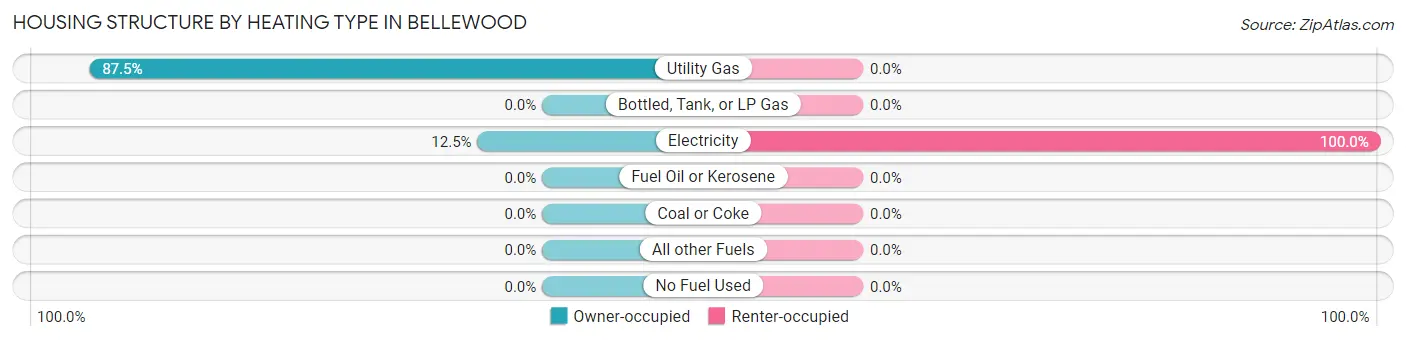
| Heating Type | Owner-occupied | Renter-occupied |
| Utility Gas | 84 (87.5%) | 0 (0.0%) |
| Bottled, Tank, or LP Gas | 0 (0.0%) | 0 (0.0%) |
| Electricity | 12 (12.5%) | 3 (100.0%) |
| Fuel Oil or Kerosene | 0 (0.0%) | 0 (0.0%) |
| Coal or Coke | 0 (0.0%) | 0 (0.0%) |
| All other Fuels | 0 (0.0%) | 0 (0.0%) |
| No Fuel Used | 0 (0.0%) | 0 (0.0%) |
| Total | 96 (100.0%) | 3 (100.0%) |
Household Vehicle Usage in Bellewood
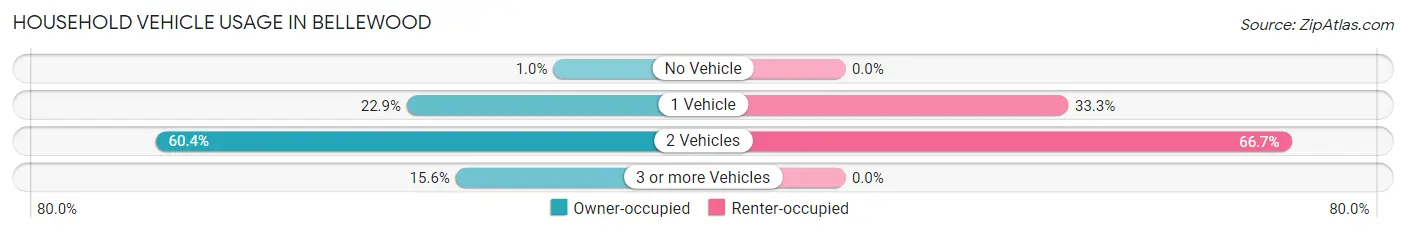
| Vehicles per Household | Owner-occupied | Renter-occupied |
| No Vehicle | 1 (1.0%) | 0 (0.0%) |
| 1 Vehicle | 22 (22.9%) | 1 (33.3%) |
| 2 Vehicles | 58 (60.4%) | 2 (66.7%) |
| 3 or more Vehicles | 15 (15.6%) | 0 (0.0%) |
| Total | 96 (100.0%) | 3 (100.0%) |
Real Estate & Mortgages in Bellewood
Real Estate and Mortgage Overview in Bellewood
| Characteristic | Without Mortgage | With Mortgage |
| Housing Units | 35 | 61 |
| Median Property Value | $445,000 | $467,500 |
| Median Household Income | $143,125 | $37 |
| Monthly Housing Costs | $793 | $11 |
| Real Estate Taxes | $3,708 | $1 |
Property Value by Mortgage Status in Bellewood
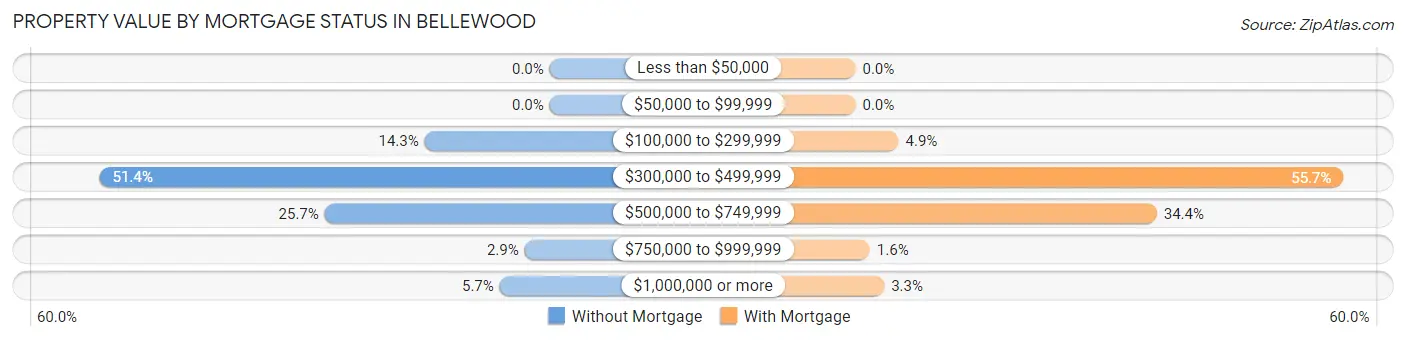
| Property Value | Without Mortgage | With Mortgage |
| Less than $50,000 | 0 (0.0%) | 0 (0.0%) |
| $50,000 to $99,999 | 0 (0.0%) | 0 (0.0%) |
| $100,000 to $299,999 | 5 (14.3%) | 3 (4.9%) |
| $300,000 to $499,999 | 18 (51.4%) | 34 (55.7%) |
| $500,000 to $749,999 | 9 (25.7%) | 21 (34.4%) |
| $750,000 to $999,999 | 1 (2.9%) | 1 (1.6%) |
| $1,000,000 or more | 2 (5.7%) | 2 (3.3%) |
| Total | 35 (100.0%) | 61 (100.0%) |
Household Income by Mortgage Status in Bellewood
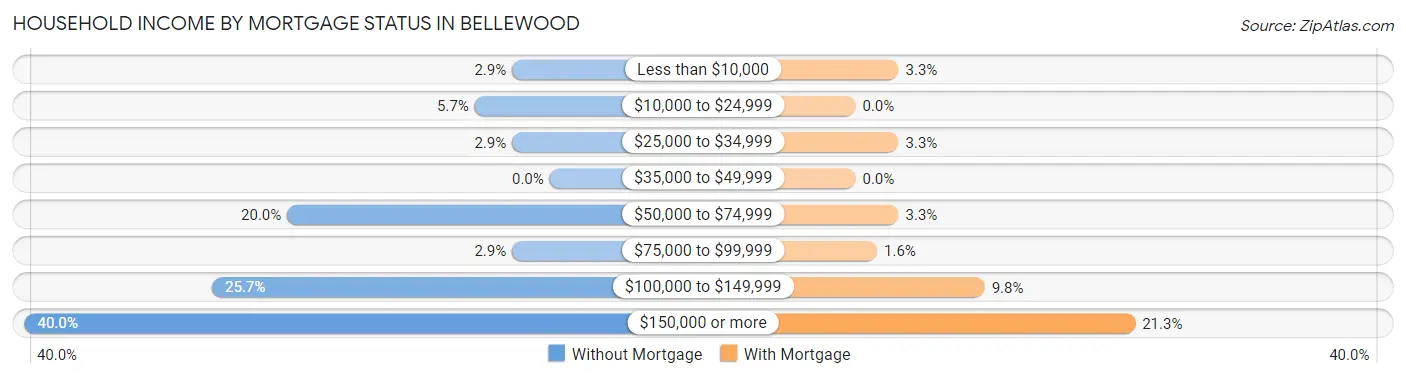
| Household Income | Without Mortgage | With Mortgage |
| Less than $10,000 | 1 (2.9%) | 2 (3.3%) |
| $10,000 to $24,999 | 2 (5.7%) | 0 (0.0%) |
| $25,000 to $34,999 | 1 (2.9%) | 2 (3.3%) |
| $35,000 to $49,999 | 0 (0.0%) | 0 (0.0%) |
| $50,000 to $74,999 | 7 (20.0%) | 2 (3.3%) |
| $75,000 to $99,999 | 1 (2.9%) | 1 (1.6%) |
| $100,000 to $149,999 | 9 (25.7%) | 6 (9.8%) |
| $150,000 or more | 14 (40.0%) | 13 (21.3%) |
| Total | 35 (100.0%) | 61 (100.0%) |
Property Value to Household Income Ratio in Bellewood
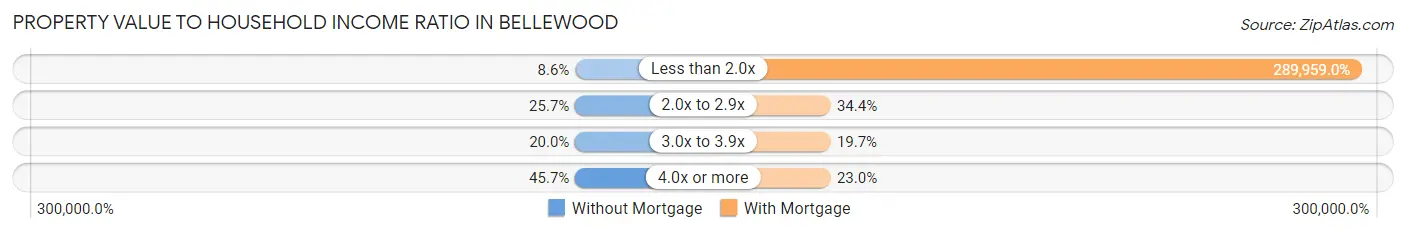
| Value-to-Income Ratio | Without Mortgage | With Mortgage |
| Less than 2.0x | 3 (8.6%) | 176,875 (289,959.0%) |
| 2.0x to 2.9x | 9 (25.7%) | 21 (34.4%) |
| 3.0x to 3.9x | 7 (20.0%) | 12 (19.7%) |
| 4.0x or more | 16 (45.7%) | 14 (23.0%) |
| Total | 35 (100.0%) | 61 (100.0%) |
Real Estate Taxes by Mortgage Status in Bellewood
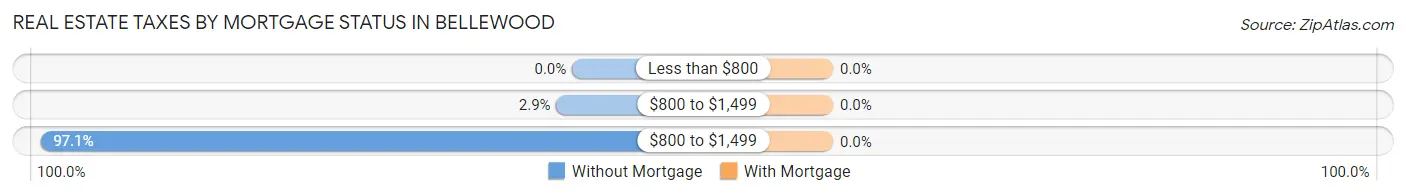
| Property Taxes | Without Mortgage | With Mortgage |
| Less than $800 | 0 (0.0%) | 0 (0.0%) |
| $800 to $1,499 | 1 (2.9%) | 0 (0.0%) |
| $800 to $1,499 | 34 (97.1%) | 0 (0.0%) |
| Total | 35 (100.0%) | 61 (100.0%) |
Health & Disability in Bellewood
Health Insurance Coverage by Age in Bellewood
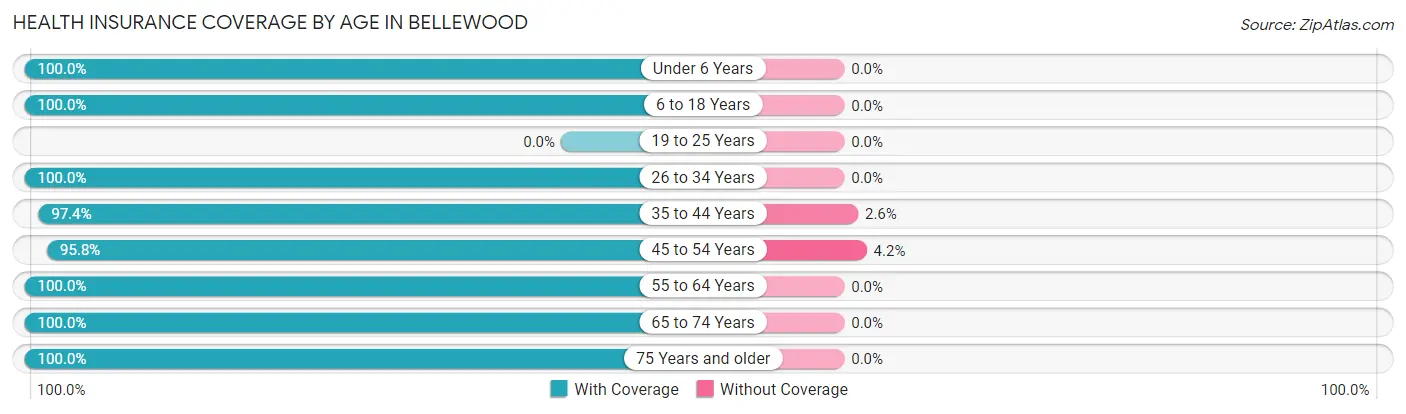
| Age Bracket | With Coverage | Without Coverage |
| Under 6 Years | 18 (100.0%) | 0 (0.0%) |
| 6 to 18 Years | 34 (100.0%) | 0 (0.0%) |
| 19 to 25 Years | 0 (0.0%) | 0 (0.0%) |
| 26 to 34 Years | 24 (100.0%) | 0 (0.0%) |
| 35 to 44 Years | 38 (97.4%) | 1 (2.6%) |
| 45 to 54 Years | 23 (95.8%) | 1 (4.2%) |
| 55 to 64 Years | 39 (100.0%) | 0 (0.0%) |
| 65 to 74 Years | 37 (100.0%) | 0 (0.0%) |
| 75 Years and older | 20 (100.0%) | 0 (0.0%) |
| Total | 233 (99.2%) | 2 (0.9%) |
Health Insurance Coverage by Citizenship Status in Bellewood
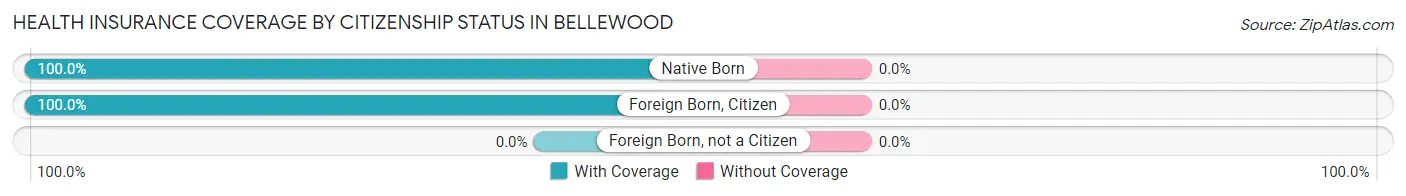
| Citizenship Status | With Coverage | Without Coverage |
| Native Born | 18 (100.0%) | 0 (0.0%) |
| Foreign Born, Citizen | 34 (100.0%) | 0 (0.0%) |
| Foreign Born, not a Citizen | 0 (0.0%) | 0 (0.0%) |
Health Insurance Coverage by Household Income in Bellewood
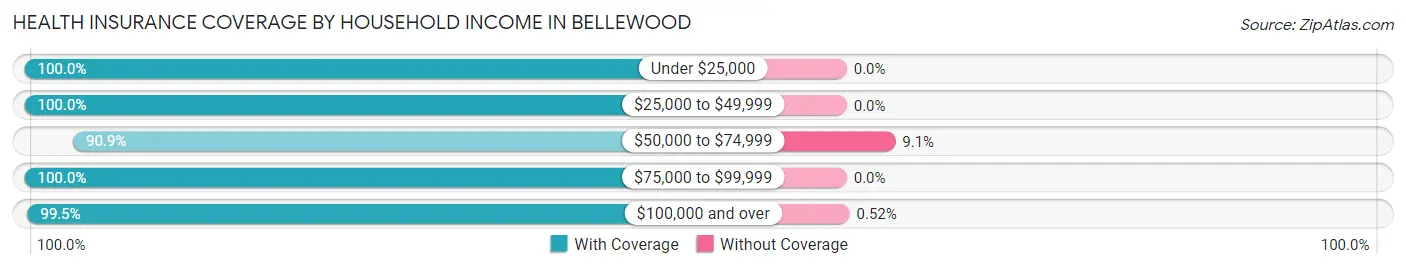
| Household Income | With Coverage | Without Coverage |
| Under $25,000 | 5 (100.0%) | 0 (0.0%) |
| $25,000 to $49,999 | 6 (100.0%) | 0 (0.0%) |
| $50,000 to $74,999 | 10 (90.9%) | 1 (9.1%) |
| $75,000 to $99,999 | 21 (100.0%) | 0 (0.0%) |
| $100,000 and over | 191 (99.5%) | 1 (0.5%) |
Public vs Private Health Insurance Coverage by Age in Bellewood
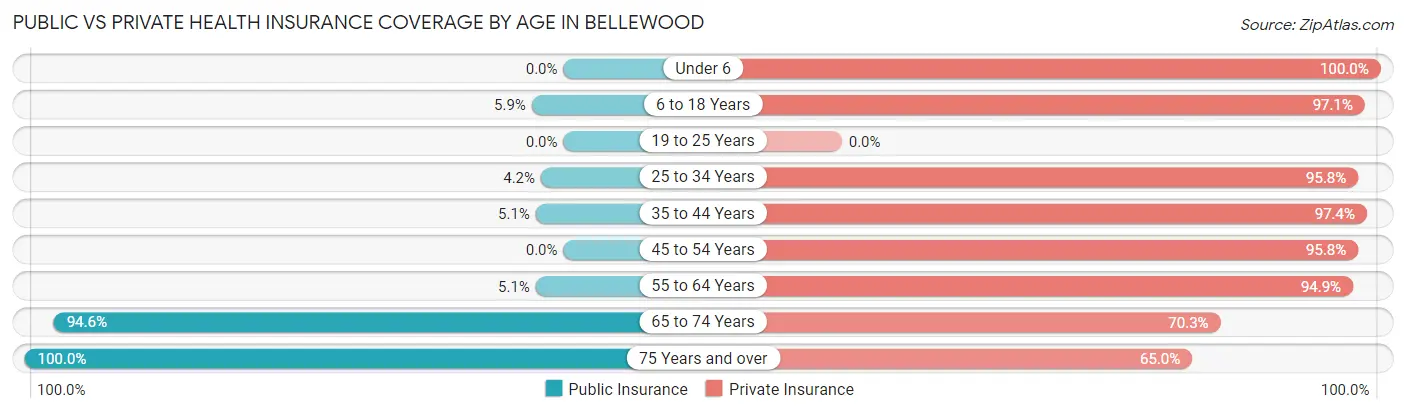
| Age Bracket | Public Insurance | Private Insurance |
| Under 6 | 0 (0.0%) | 18 (100.0%) |
| 6 to 18 Years | 2 (5.9%) | 33 (97.1%) |
| 19 to 25 Years | 0 (0.0%) | 0 (0.0%) |
| 25 to 34 Years | 1 (4.2%) | 23 (95.8%) |
| 35 to 44 Years | 2 (5.1%) | 38 (97.4%) |
| 45 to 54 Years | 0 (0.0%) | 23 (95.8%) |
| 55 to 64 Years | 2 (5.1%) | 37 (94.9%) |
| 65 to 74 Years | 35 (94.6%) | 26 (70.3%) |
| 75 Years and over | 20 (100.0%) | 13 (65.0%) |
| Total | 62 (26.4%) | 211 (89.8%) |
Disability Status by Sex by Age in Bellewood
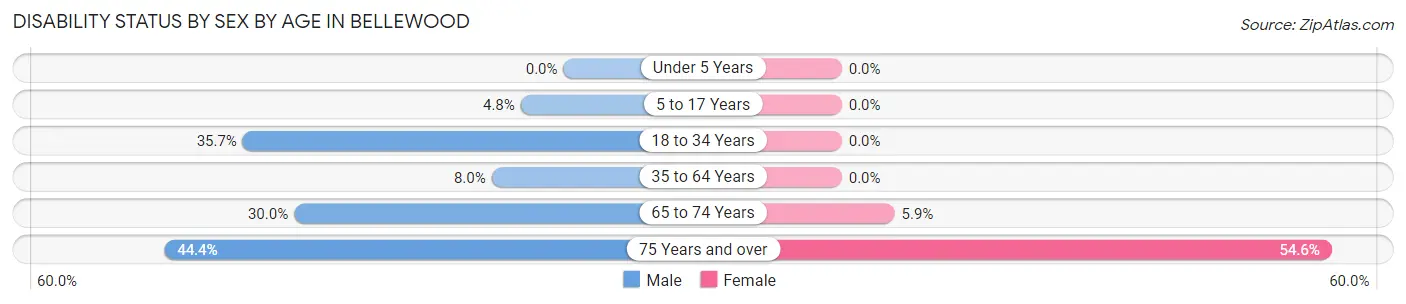
| Age Bracket | Male | Female |
| Under 5 Years | 0 (0.0%) | 0 (0.0%) |
| 5 to 17 Years | 1 (4.8%) | 0 (0.0%) |
| 18 to 34 Years | 5 (35.7%) | 0 (0.0%) |
| 35 to 64 Years | 4 (8.0%) | 0 (0.0%) |
| 65 to 74 Years | 6 (30.0%) | 1 (5.9%) |
| 75 Years and over | 4 (44.4%) | 6 (54.5%) |
Disability Class by Sex by Age in Bellewood
Disability Class: Hearing Difficulty
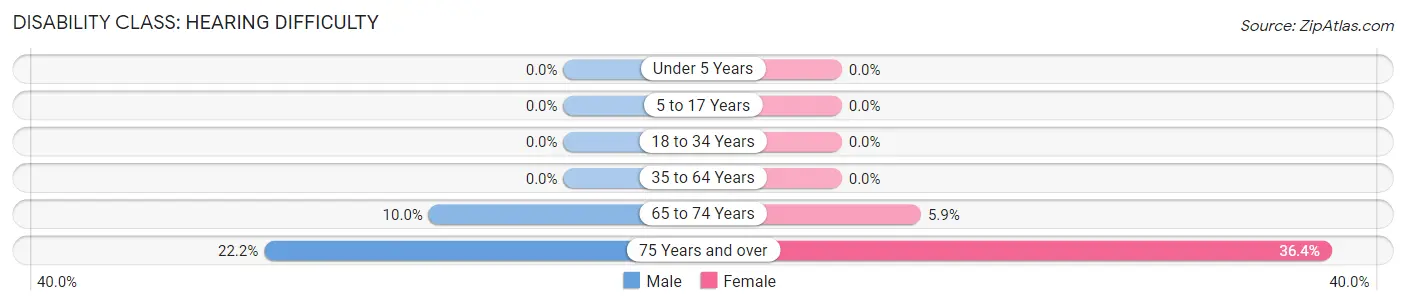
| Age Bracket | Male | Female |
| Under 5 Years | 0 (0.0%) | 0 (0.0%) |
| 5 to 17 Years | 0 (0.0%) | 0 (0.0%) |
| 18 to 34 Years | 0 (0.0%) | 0 (0.0%) |
| 35 to 64 Years | 0 (0.0%) | 0 (0.0%) |
| 65 to 74 Years | 2 (10.0%) | 1 (5.9%) |
| 75 Years and over | 2 (22.2%) | 4 (36.4%) |
Disability Class: Vision Difficulty
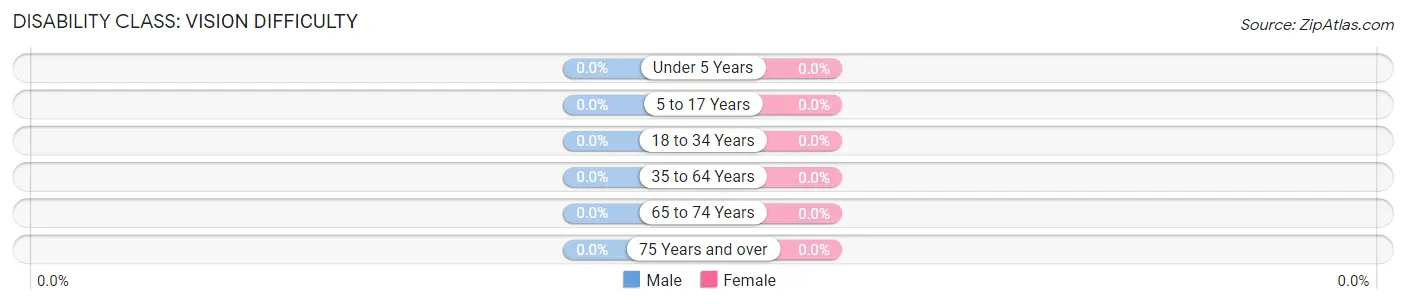
| Age Bracket | Male | Female |
| Under 5 Years | 0 (0.0%) | 0 (0.0%) |
| 5 to 17 Years | 0 (0.0%) | 0 (0.0%) |
| 18 to 34 Years | 0 (0.0%) | 0 (0.0%) |
| 35 to 64 Years | 0 (0.0%) | 0 (0.0%) |
| 65 to 74 Years | 0 (0.0%) | 0 (0.0%) |
| 75 Years and over | 0 (0.0%) | 0 (0.0%) |
Disability Class: Cognitive Difficulty
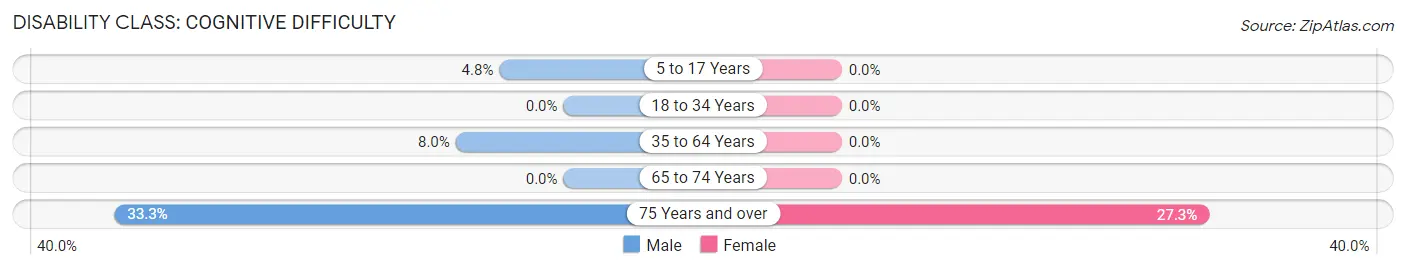
| Age Bracket | Male | Female |
| 5 to 17 Years | 1 (4.8%) | 0 (0.0%) |
| 18 to 34 Years | 0 (0.0%) | 0 (0.0%) |
| 35 to 64 Years | 4 (8.0%) | 0 (0.0%) |
| 65 to 74 Years | 0 (0.0%) | 0 (0.0%) |
| 75 Years and over | 3 (33.3%) | 3 (27.3%) |
Disability Class: Ambulatory Difficulty
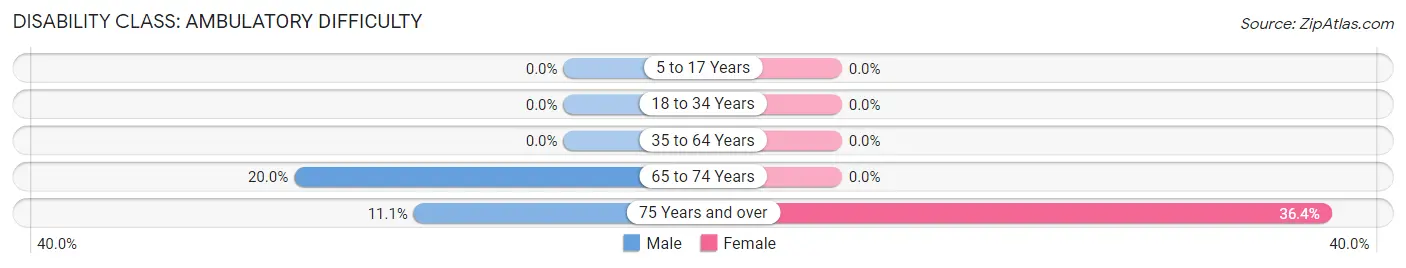
| Age Bracket | Male | Female |
| 5 to 17 Years | 0 (0.0%) | 0 (0.0%) |
| 18 to 34 Years | 0 (0.0%) | 0 (0.0%) |
| 35 to 64 Years | 0 (0.0%) | 0 (0.0%) |
| 65 to 74 Years | 4 (20.0%) | 0 (0.0%) |
| 75 Years and over | 1 (11.1%) | 4 (36.4%) |
Disability Class: Self-Care Difficulty
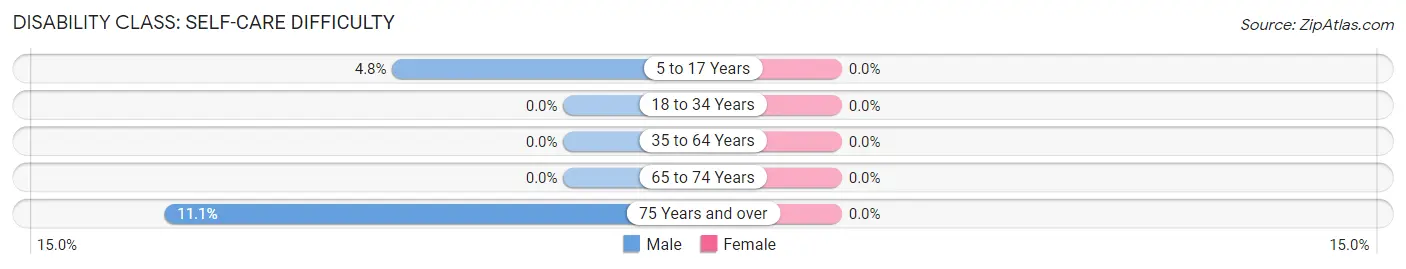
| Age Bracket | Male | Female |
| 5 to 17 Years | 1 (4.8%) | 0 (0.0%) |
| 18 to 34 Years | 0 (0.0%) | 0 (0.0%) |
| 35 to 64 Years | 0 (0.0%) | 0 (0.0%) |
| 65 to 74 Years | 0 (0.0%) | 0 (0.0%) |
| 75 Years and over | 1 (11.1%) | 0 (0.0%) |
Technology Access in Bellewood
Computing Device Access in Bellewood
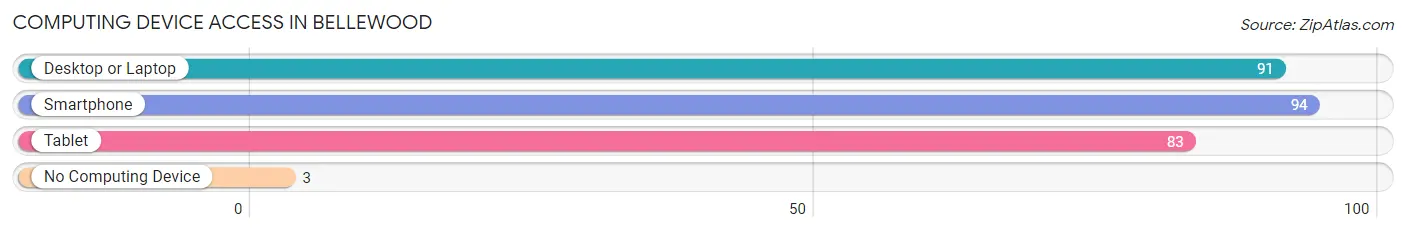
| Device Type | # Households | % Households |
| Desktop or Laptop | 91 | 91.9% |
| Smartphone | 94 | 95.0% |
| Tablet | 83 | 83.8% |
| No Computing Device | 3 | 3.0% |
| Total | 99 | 100.0% |
Internet Access in Bellewood
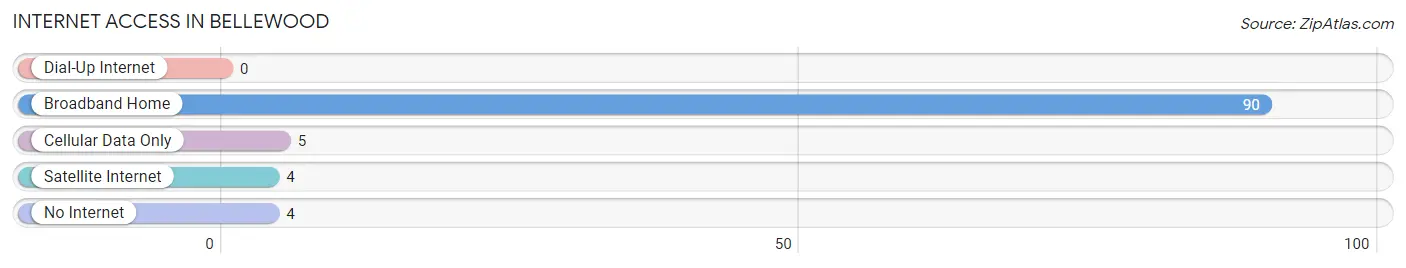
| Internet Type | # Households | % Households |
| Dial-Up Internet | 0 | 0.0% |
| Broadband Home | 90 | 90.9% |
| Cellular Data Only | 5 | 5.1% |
| Satellite Internet | 4 | 4.0% |
| No Internet | 4 | 4.0% |
| Total | 99 | 100.0% |
Bellewood Summary
Bellewood, Kentucky is a small town located in the western part of the state, in the foothills of the Appalachian Mountains. It is situated in the county of Bell County, and is part of the Middlesboro Micropolitan Statistical Area. The town has a population of just over 1,000 people, and is known for its rural charm and small-town atmosphere.
History
Bellewood was founded in 1883 by a group of settlers from the nearby town of Pineville. The town was named after the Bellewood Plantation, which was owned by the family of one of the settlers. The town was originally a farming community, and the main crops grown were tobacco, corn, and wheat. In the early 1900s, the town began to grow and develop, and by the 1920s it had become a thriving community.
In the 1950s, the town began to decline as many of its residents moved away in search of better economic opportunities. However, in the late 1970s, the town began to experience a resurgence as new businesses and industries moved into the area. Today, Bellewood is a small but vibrant community, with a variety of businesses and services.
Geography
Bellewood is located in the western part of Bell County, in the foothills of the Appalachian Mountains. The town is situated at an elevation of 1,000 feet above sea level, and is surrounded by rolling hills and lush forests. The town is located near the Cumberland Gap National Historical Park, which is a popular tourist destination. The town is also close to the Big South Fork National River and Recreation Area, which is a popular destination for outdoor activities such as hiking, camping, and fishing.
Economy
The economy of Bellewood is largely based on agriculture and tourism. The town is home to several farms, which produce a variety of crops such as tobacco, corn, and wheat. The town is also home to several small businesses, including restaurants, shops, and other services. Tourism is also an important part of the local economy, as the town is located near several popular tourist destinations.
Demographics
As of the 2010 census, the population of Bellewood was 1,072. The racial makeup of the town was 97.2% White, 0.9% African American, 0.2% Native American, 0.2% Asian, 0.1% Pacific Islander, and 1.4% from other races. The median household income was $25,972, and the median family income was $31,250. The per capita income was $14,945.
Bellewood is a small but vibrant community, with a variety of businesses and services. The town is known for its rural charm and small-town atmosphere, and is a popular destination for tourists and outdoor enthusiasts. The town is also home to a variety of cultural and recreational activities, making it an ideal place to live and visit.
Common Questions
What is Per Capita Income in Bellewood?
Per Capita income in Bellewood is $77,037.
What is the Median Family Income in Bellewood?
Median Family Income in Bellewood is $158,750.
What is the Median Household income in Bellewood?
Median Household Income in Bellewood is $155,750.
What is Income or Wage Gap in Bellewood?
Income or Wage Gap in Bellewood is 43.8%.
Women in Bellewood earn 56.2 cents for every dollar earned by a man.
What is Inequality or Gini Index in Bellewood?
Inequality or Gini Index in Bellewood is 0.34.
What is the Total Population of Bellewood?
Total Population of Bellewood is 235.
What is the Total Male Population of Bellewood?
Total Male Population of Bellewood is 124.
What is the Total Female Population of Bellewood?
Total Female Population of Bellewood is 111.
What is the Ratio of Males per 100 Females in Bellewood?
There are 111.71 Males per 100 Females in Bellewood.
What is the Ratio of Females per 100 Males in Bellewood?
There are 89.52 Females per 100 Males in Bellewood.
What is the Median Population Age in Bellewood?
Median Population Age in Bellewood is 45.4 Years.
What is the Average Family Size in Bellewood
Average Family Size in Bellewood is 2.9 People.
What is the Average Household Size in Bellewood
Average Household Size in Bellewood is 2.4 People.
How Large is the Labor Force in Bellewood?
There are 123 People in the Labor Forcein in Bellewood.
What is the Percentage of People in the Labor Force in Bellewood?
66.5% of People are in the Labor Force in Bellewood.