Brownsboro Farm, KY Map & Demographics
Brownsboro Farm Map
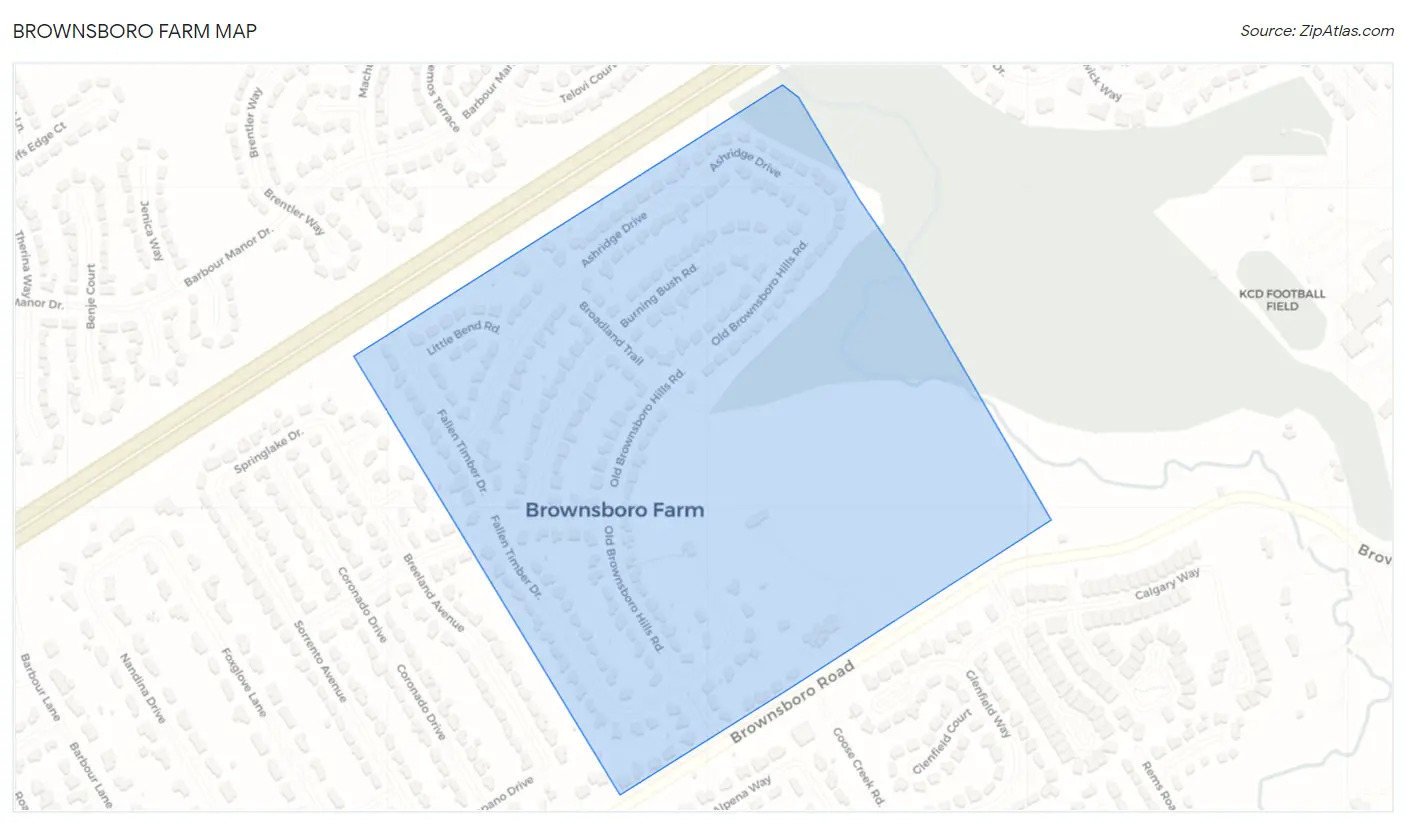
Brownsboro Farm Overview
$55,211
PER CAPITA INCOME
$150,179
AVG FAMILY INCOME
$133,542
AVG HOUSEHOLD INCOME
34.7%
WAGE / INCOME GAP [ % ]
65.3¢/ $1
WAGE / INCOME GAP [ $ ]
0.31
INEQUALITY / GINI INDEX
553
TOTAL POPULATION
295
MALE POPULATION
258
FEMALE POPULATION
114.34
MALES / 100 FEMALES
87.46
FEMALES / 100 MALES
49.4
MEDIAN AGE
2.8
AVG FAMILY SIZE
2.6
AVG HOUSEHOLD SIZE
296
LABOR FORCE [ PEOPLE ]
69.0%
PERCENT IN LABOR FORCE
2.4%
UNEMPLOYMENT RATE
Brownsboro Farm Area Codes
Income in Brownsboro Farm
Income Overview in Brownsboro Farm
Per Capita Income in Brownsboro Farm is $55,211, while median incomes of families and households are $150,179 and $133,542 respectively.
| Characteristic | Number | Measure |
| Per Capita Income | 553 | $55,211 |
| Median Family Income | 190 | $150,179 |
| Mean Family Income | 190 | $149,339 |
| Median Household Income | 211 | $133,542 |
| Mean Household Income | 211 | $142,108 |
| Income Deficit | 190 | $0 |
| Wage / Income Gap (%) | 553 | 34.69% |
| Wage / Income Gap ($) | 553 | 65.31¢ per $1 |
| Gini / Inequality Index | 553 | 0.31 |
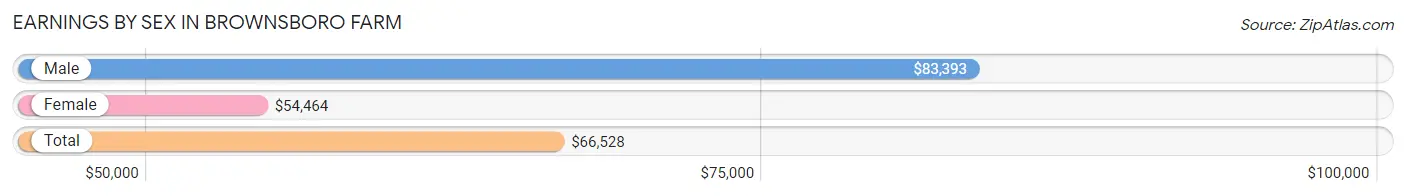
Earnings by Sex in Brownsboro Farm
Average Earnings in Brownsboro Farm are $66,528, $83,393 for men and $54,464 for women, a difference of 34.7%.
| Sex | Number | Average Earnings |
| Male | 166 (55.5%) | $83,393 |
| Female | 133 (44.5%) | $54,464 |
| Total | 299 (100.0%) | $66,528 |
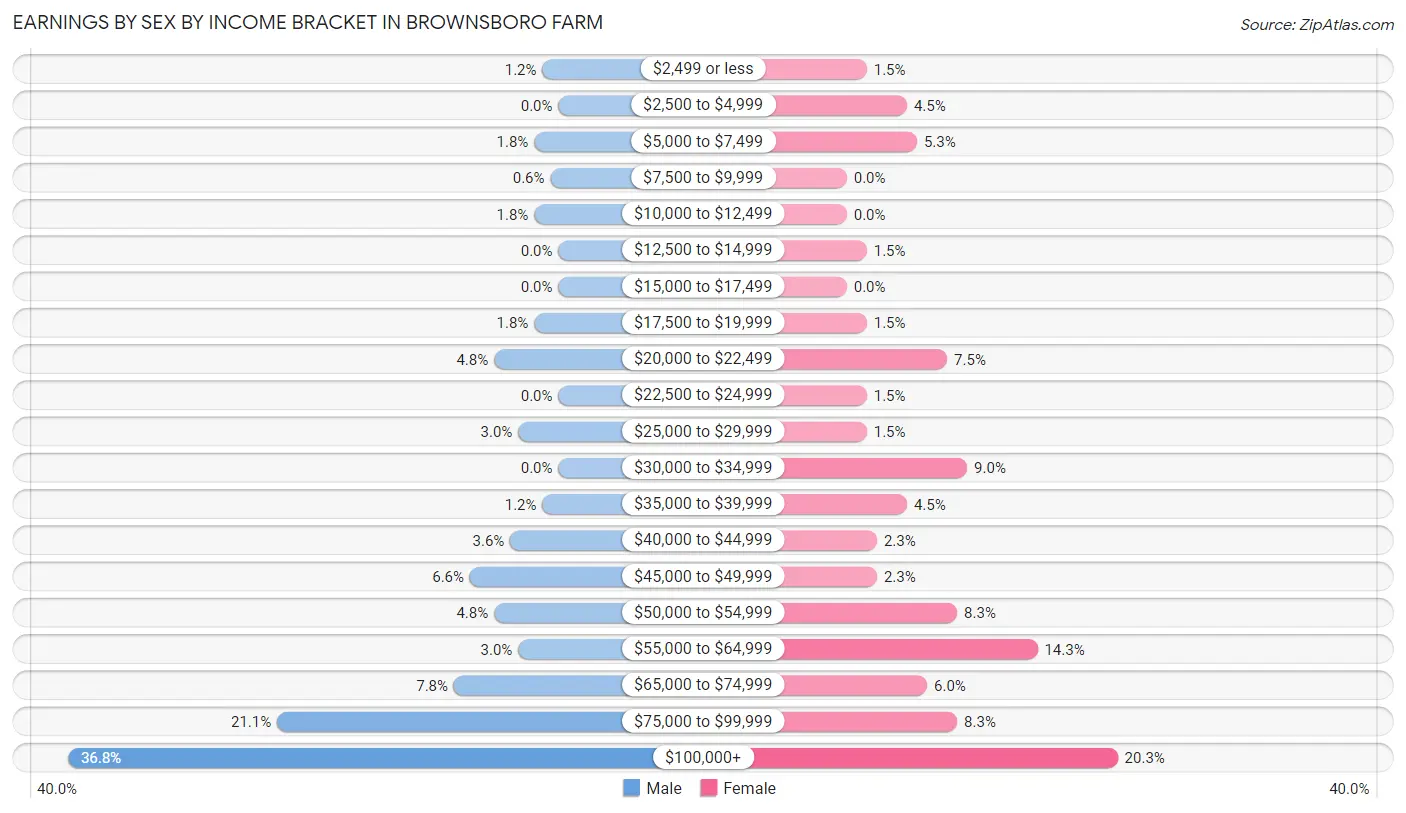
Earnings by Sex by Income Bracket in Brownsboro Farm
The most common earnings brackets in Brownsboro Farm are $100,000+ for men (61 | 36.7%) and $100,000+ for women (27 | 20.3%).
| Income | Male | Female |
| $2,499 or less | 2 (1.2%) | 2 (1.5%) |
| $2,500 to $4,999 | 0 (0.0%) | 6 (4.5%) |
| $5,000 to $7,499 | 3 (1.8%) | 7 (5.3%) |
| $7,500 to $9,999 | 1 (0.6%) | 0 (0.0%) |
| $10,000 to $12,499 | 3 (1.8%) | 0 (0.0%) |
| $12,500 to $14,999 | 0 (0.0%) | 2 (1.5%) |
| $15,000 to $17,499 | 0 (0.0%) | 0 (0.0%) |
| $17,500 to $19,999 | 3 (1.8%) | 2 (1.5%) |
| $20,000 to $22,499 | 8 (4.8%) | 10 (7.5%) |
| $22,500 to $24,999 | 0 (0.0%) | 2 (1.5%) |
| $25,000 to $29,999 | 5 (3.0%) | 2 (1.5%) |
| $30,000 to $34,999 | 0 (0.0%) | 12 (9.0%) |
| $35,000 to $39,999 | 2 (1.2%) | 6 (4.5%) |
| $40,000 to $44,999 | 6 (3.6%) | 3 (2.3%) |
| $45,000 to $49,999 | 11 (6.6%) | 3 (2.3%) |
| $50,000 to $54,999 | 8 (4.8%) | 11 (8.3%) |
| $55,000 to $64,999 | 5 (3.0%) | 19 (14.3%) |
| $65,000 to $74,999 | 13 (7.8%) | 8 (6.0%) |
| $75,000 to $99,999 | 35 (21.1%) | 11 (8.3%) |
| $100,000+ | 61 (36.7%) | 27 (20.3%) |
| Total | 166 (100.0%) | 133 (100.0%) |
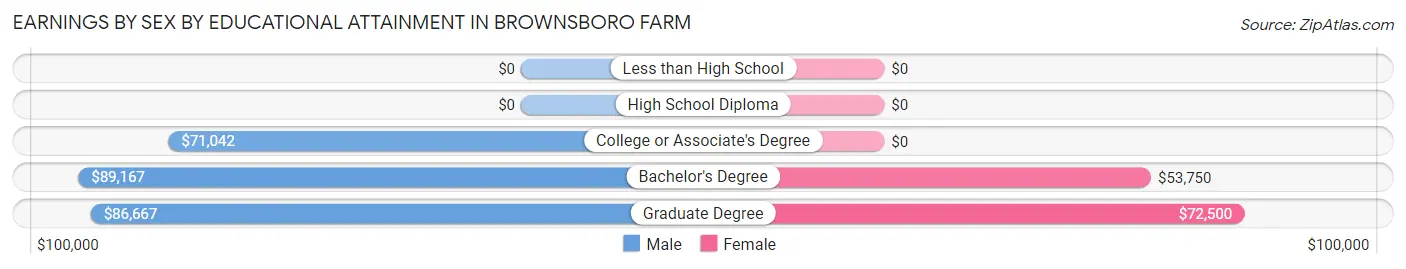
Earnings by Sex by Educational Attainment in Brownsboro Farm
Average earnings in Brownsboro Farm are $83,839 for men and $54,464 for women, a difference of 35.0%. Men with an educational attainment of bachelor's degree enjoy the highest average annual earnings of $89,167, while those with college or associate's degree education earn the least with $71,042. Women with an educational attainment of graduate degree earn the most with the average annual earnings of $72,500, while those with bachelor's degree education have the smallest earnings of $53,750.
| Educational Attainment | Male Income | Female Income |
| Less than High School | - | - |
| High School Diploma | - | - |
| College or Associate's Degree | $71,042 | $0 |
| Bachelor's Degree | $89,167 | $53,750 |
| Graduate Degree | $86,667 | $72,500 |
| Total | $83,839 | $54,464 |
Family Income in Brownsboro Farm
Family Income Brackets in Brownsboro Farm
According to the Brownsboro Farm family income data, there are 48 families falling into the $150,000 to $199,999 income range, which is the most common income bracket and makes up 25.3% of all families.
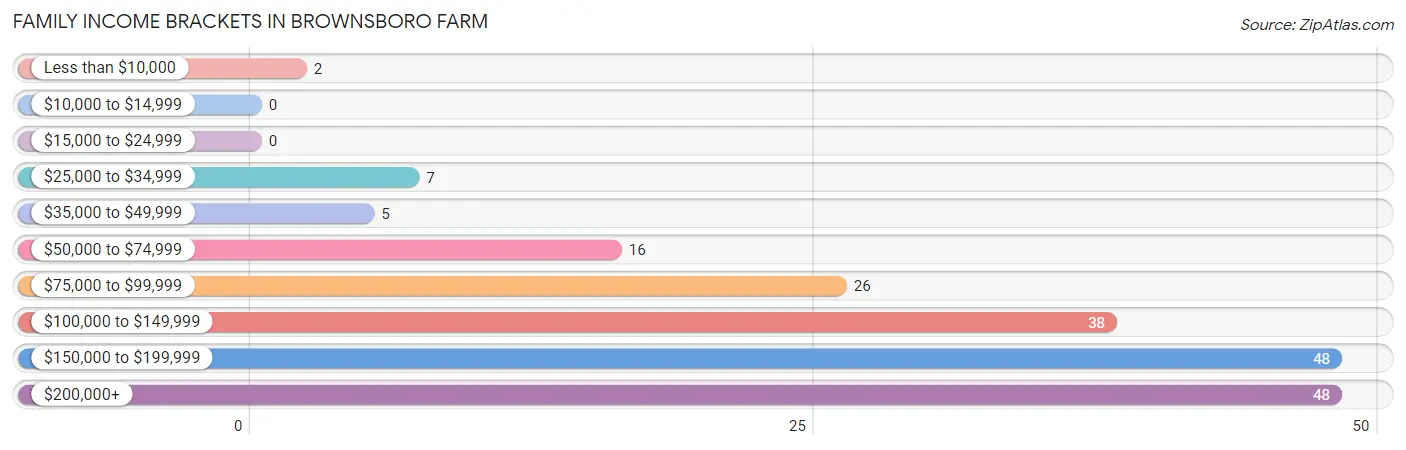
| Income Bracket | # Families | % Families |
| Less than $10,000 | 2 | 1.1% |
| $10,000 to $14,999 | 0 | 0.0% |
| $15,000 to $24,999 | 0 | 0.0% |
| $25,000 to $34,999 | 7 | 3.7% |
| $35,000 to $49,999 | 5 | 2.6% |
| $50,000 to $74,999 | 16 | 8.4% |
| $75,000 to $99,999 | 26 | 13.7% |
| $100,000 to $149,999 | 38 | 20.0% |
| $150,000 to $199,999 | 48 | 25.3% |
| $200,000+ | 48 | 25.3% |
Family Income by Famaliy Size in Brownsboro Farm
4-person families (36 | 19.0%) account for the highest median family income in Brownsboro Farm with $201,250 per family, while 2-person families (118 | 62.1%) have the highest median income of $55,625 per family member.
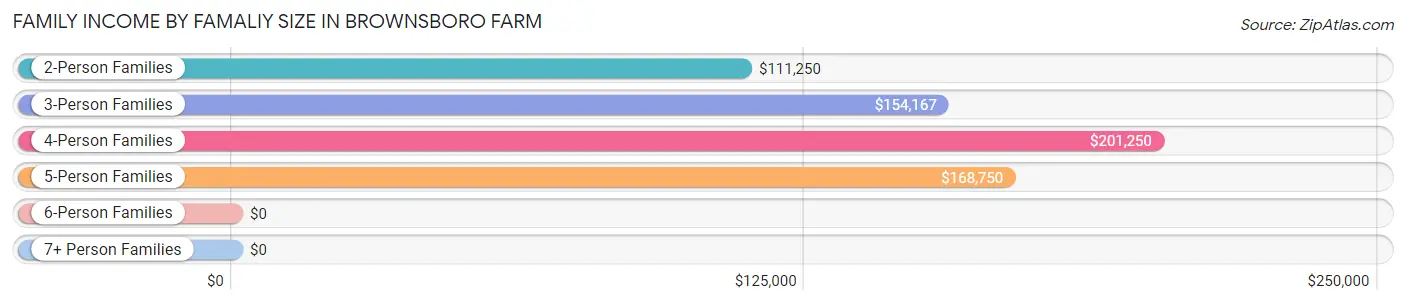
| Income Bracket | # Families | Median Income |
| 2-Person Families | 118 (62.1%) | $111,250 |
| 3-Person Families | 26 (13.7%) | $154,167 |
| 4-Person Families | 36 (19.0%) | $201,250 |
| 5-Person Families | 8 (4.2%) | $168,750 |
| 6-Person Families | 2 (1.1%) | $0 |
| 7+ Person Families | 0 (0.0%) | $0 |
| Total | 190 (100.0%) | $150,179 |
Family Income by Number of Earners in Brownsboro Farm
The median family income in Brownsboro Farm is $150,179, with families comprising 3+ earners (14) having the highest median family income of $211,250, while families with no earners (24) have the lowest median family income of $63,750, accounting for 7.4% and 12.6% of families, respectively.
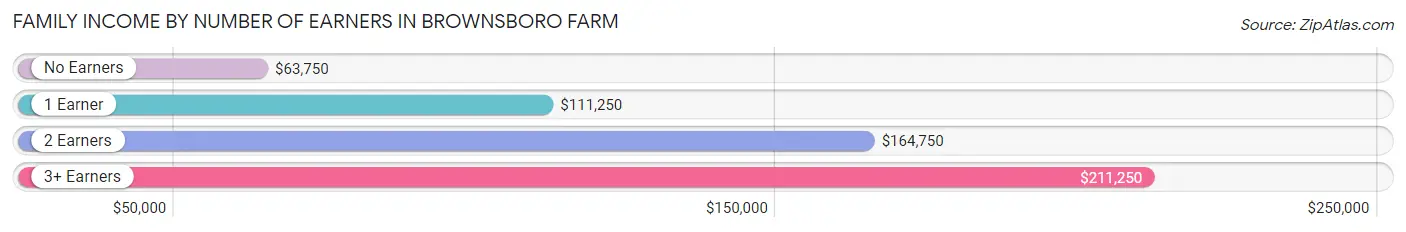
| Number of Earners | # Families | Median Income |
| No Earners | 24 (12.6%) | $63,750 |
| 1 Earner | 61 (32.1%) | $111,250 |
| 2 Earners | 91 (47.9%) | $164,750 |
| 3+ Earners | 14 (7.4%) | $211,250 |
| Total | 190 (100.0%) | $150,179 |
Household Income in Brownsboro Farm
Household Income Brackets in Brownsboro Farm
With 51 households falling in the category, the $150,000 to $199,999 income range is the most frequent in Brownsboro Farm, accounting for 24.2% of all households.
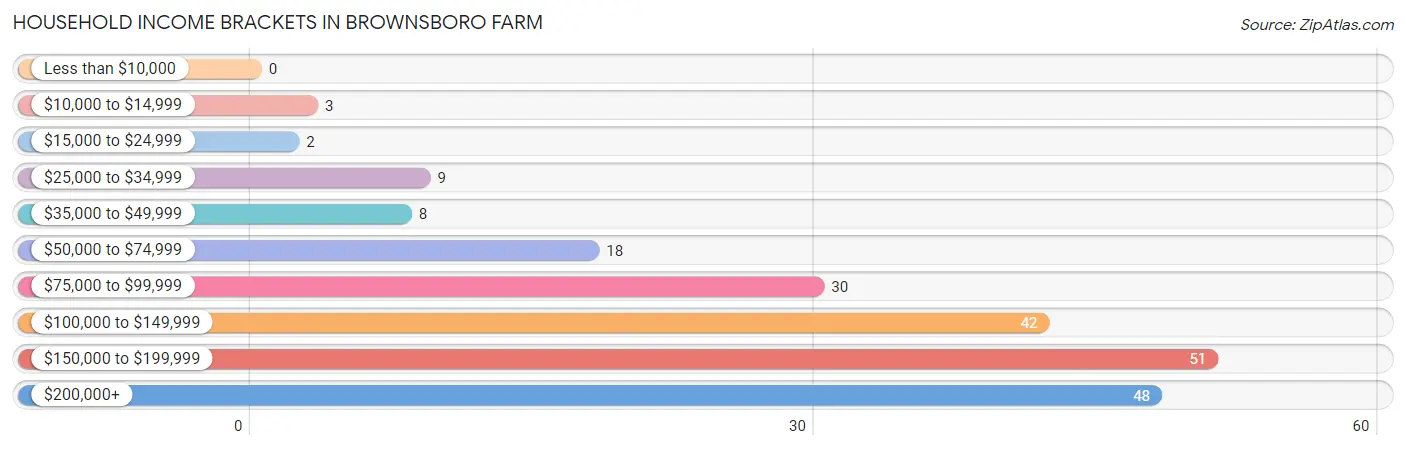
| Income Bracket | # Households | % Households |
| Less than $10,000 | 0 | 0.0% |
| $10,000 to $14,999 | 3 | 1.4% |
| $15,000 to $24,999 | 2 | 0.9% |
| $25,000 to $34,999 | 9 | 4.3% |
| $35,000 to $49,999 | 8 | 3.8% |
| $50,000 to $74,999 | 18 | 8.5% |
| $75,000 to $99,999 | 30 | 14.2% |
| $100,000 to $149,999 | 42 | 19.9% |
| $150,000 to $199,999 | 51 | 24.2% |
| $200,000+ | 48 | 22.7% |
Household Income by Householder Age in Brownsboro Farm
The median household income in Brownsboro Farm is $133,542, with the highest median household income of $176,875 found in the 25 to 44 years age bracket for the primary householder. A total of 47 households (22.3%) fall into this category. Meanwhile, the 15 to 24 years age bracket for the primary householder has the lowest median household income of $0, with 1 households (0.5%) in this group.
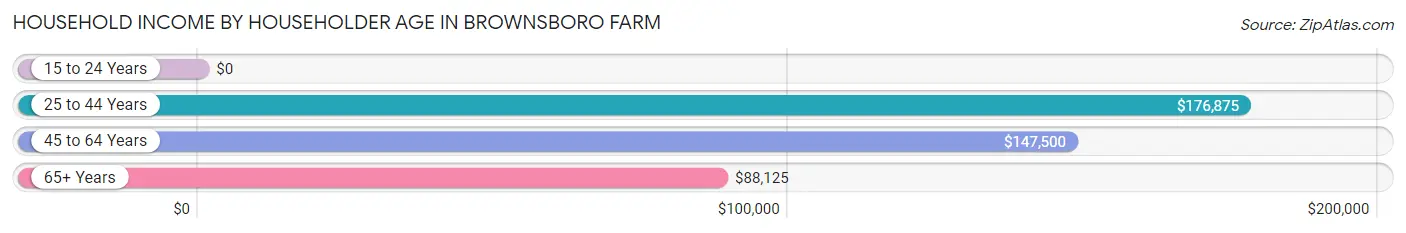
| Income Bracket | # Households | Median Income |
| 15 to 24 Years | 1 (0.5%) | $0 |
| 25 to 44 Years | 47 (22.3%) | $176,875 |
| 45 to 64 Years | 96 (45.5%) | $147,500 |
| 65+ Years | 67 (31.8%) | $88,125 |
| Total | 211 (100.0%) | $133,542 |
Poverty in Brownsboro Farm
Income Below Poverty by Sex and Age in Brownsboro Farm
With 1.0% poverty level for males and 1.6% for females among the residents of Brownsboro Farm, 35 to 44 year old males and under 5 year old females are the most vulnerable to poverty, with 2 males (7.1%) and 2 females (10.0%) in their respective age groups living below the poverty level.
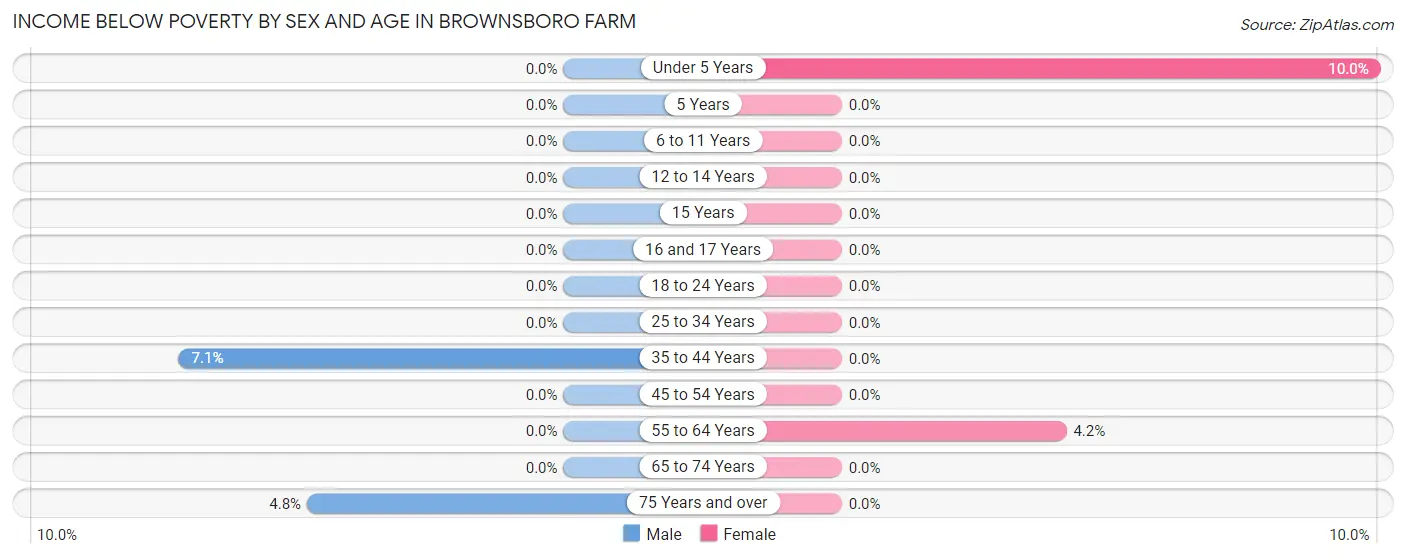
| Age Bracket | Male | Female |
| Under 5 Years | 0 (0.0%) | 2 (10.0%) |
| 5 Years | 0 (0.0%) | 0 (0.0%) |
| 6 to 11 Years | 0 (0.0%) | 0 (0.0%) |
| 12 to 14 Years | 0 (0.0%) | 0 (0.0%) |
| 15 Years | 0 (0.0%) | 0 (0.0%) |
| 16 and 17 Years | 0 (0.0%) | 0 (0.0%) |
| 18 to 24 Years | 0 (0.0%) | 0 (0.0%) |
| 25 to 34 Years | 0 (0.0%) | 0 (0.0%) |
| 35 to 44 Years | 2 (7.1%) | 0 (0.0%) |
| 45 to 54 Years | 0 (0.0%) | 0 (0.0%) |
| 55 to 64 Years | 0 (0.0%) | 2 (4.2%) |
| 65 to 74 Years | 0 (0.0%) | 0 (0.0%) |
| 75 Years and over | 1 (4.8%) | 0 (0.0%) |
| Total | 3 (1.0%) | 4 (1.6%) |
Income Above Poverty by Sex and Age in Brownsboro Farm
According to the poverty statistics in Brownsboro Farm, males aged under 5 years and females aged 5 years are the age groups that are most secure financially, with 100.0% of males and 100.0% of females in these age groups living above the poverty line.
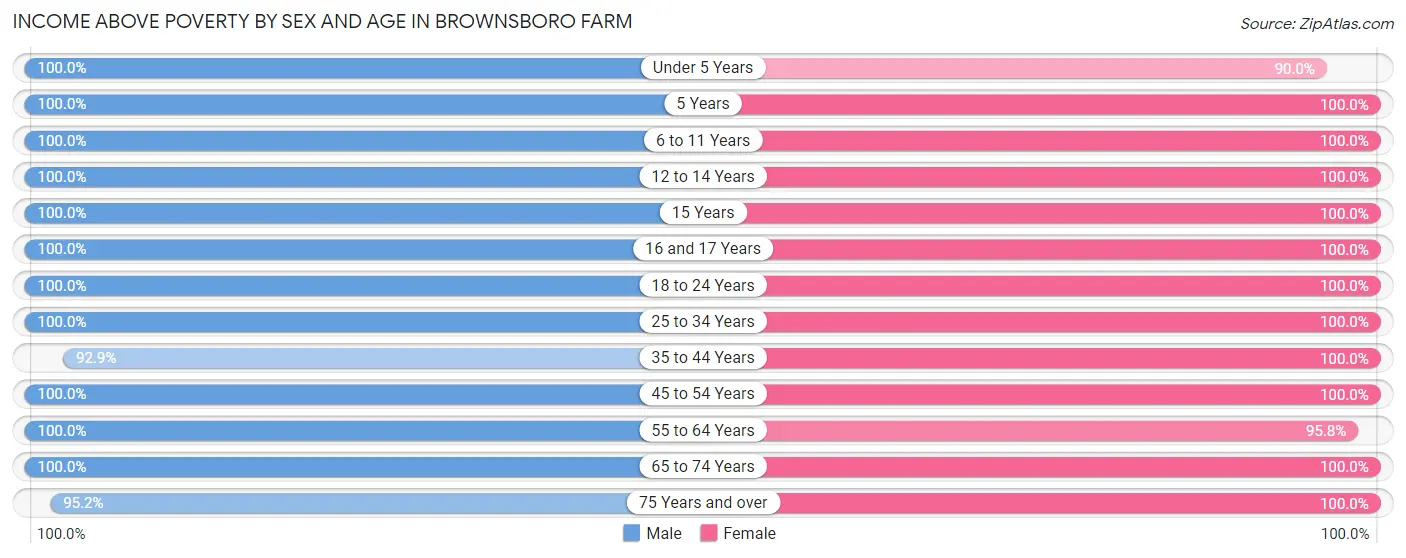
| Age Bracket | Male | Female |
| Under 5 Years | 32 (100.0%) | 18 (90.0%) |
| 5 Years | 1 (100.0%) | 3 (100.0%) |
| 6 to 11 Years | 37 (100.0%) | 9 (100.0%) |
| 12 to 14 Years | 6 (100.0%) | 11 (100.0%) |
| 15 Years | 1 (100.0%) | 2 (100.0%) |
| 16 and 17 Years | 4 (100.0%) | 3 (100.0%) |
| 18 to 24 Years | 5 (100.0%) | 2 (100.0%) |
| 25 to 34 Years | 33 (100.0%) | 19 (100.0%) |
| 35 to 44 Years | 26 (92.9%) | 36 (100.0%) |
| 45 to 54 Years | 47 (100.0%) | 40 (100.0%) |
| 55 to 64 Years | 44 (100.0%) | 46 (95.8%) |
| 65 to 74 Years | 36 (100.0%) | 36 (100.0%) |
| 75 Years and over | 20 (95.2%) | 27 (100.0%) |
| Total | 292 (99.0%) | 252 (98.4%) |
Income Below Poverty Among Married-Couple Families in Brownsboro Farm
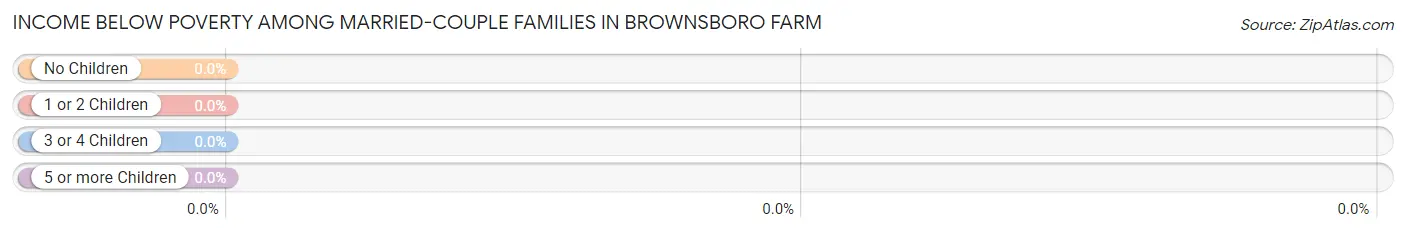
| Children | Above Poverty | Below Poverty |
| No Children | 110 (100.0%) | 0 (0.0%) |
| 1 or 2 Children | 50 (100.0%) | 0 (0.0%) |
| 3 or 4 Children | 10 (100.0%) | 0 (0.0%) |
| 5 or more Children | 0 (0.0%) | 0 (0.0%) |
| Total | 170 (100.0%) | 0 (0.0%) |
Income Below Poverty Among Single-Parent Households in Brownsboro Farm
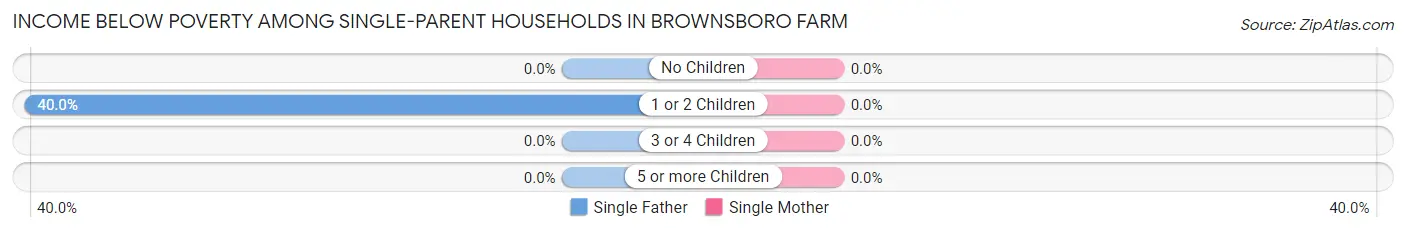
| Children | Single Father | Single Mother |
| No Children | 0 (0.0%) | 0 (0.0%) |
| 1 or 2 Children | 2 (40.0%) | 0 (0.0%) |
| 3 or 4 Children | 0 (0.0%) | 0 (0.0%) |
| 5 or more Children | 0 (0.0%) | 0 (0.0%) |
| Total | 2 (28.6%) | 0 (0.0%) |
Income Below Poverty Among Married-Couple vs Single-Parent Households in Brownsboro Farm
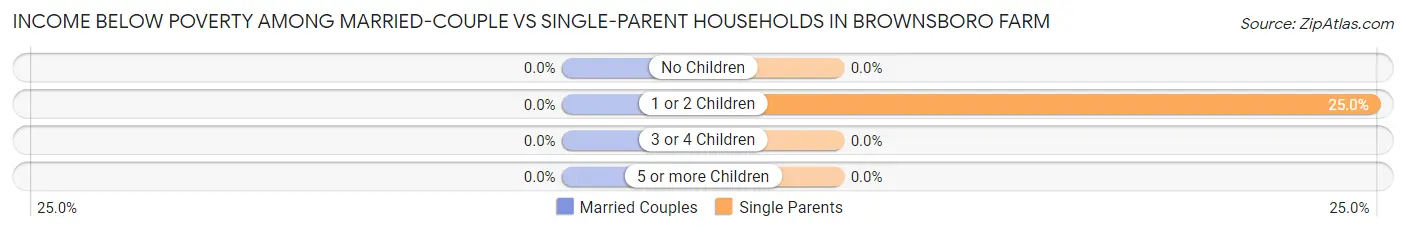
| Children | Married-Couple Families | Single-Parent Households |
| No Children | 0 (0.0%) | 0 (0.0%) |
| 1 or 2 Children | 0 (0.0%) | 2 (25.0%) |
| 3 or 4 Children | 0 (0.0%) | 0 (0.0%) |
| 5 or more Children | 0 (0.0%) | 0 (0.0%) |
| Total | 0 (0.0%) | 2 (10.0%) |
Race in Brownsboro Farm
The most populous races in Brownsboro Farm are White / Caucasian (512 | 92.6%), Two or more Races (14 | 2.5%), and Asian (10 | 1.8%).
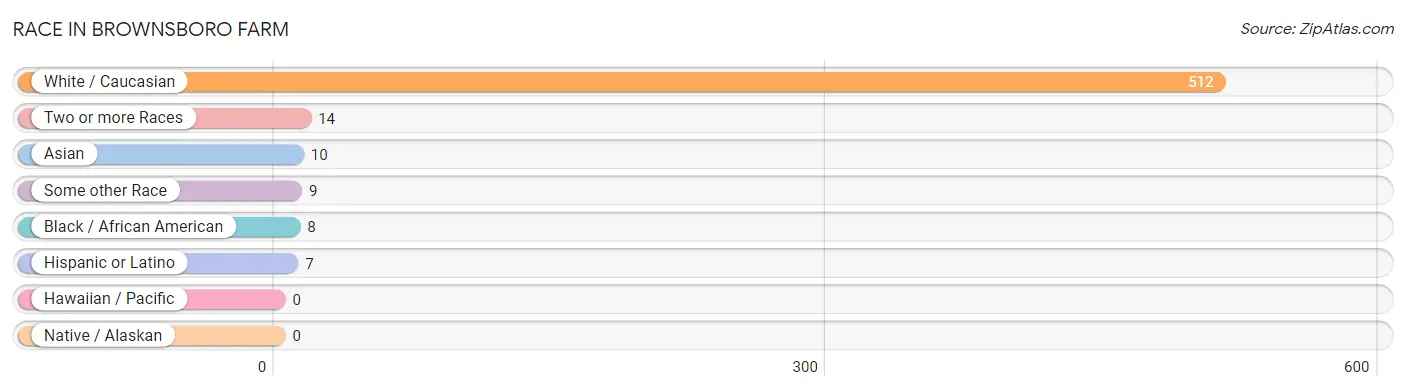
| Race | # Population | % Population |
| Asian | 10 | 1.8% |
| Black / African American | 8 | 1.5% |
| Hawaiian / Pacific | 0 | 0.0% |
| Hispanic or Latino | 7 | 1.3% |
| Native / Alaskan | 0 | 0.0% |
| White / Caucasian | 512 | 92.6% |
| Two or more Races | 14 | 2.5% |
| Some other Race | 9 | 1.6% |
| Total | 553 | 100.0% |
Ancestry in Brownsboro Farm
The most populous ancestries reported in Brownsboro Farm are German (103 | 18.6%), English (89 | 16.1%), Irish (65 | 11.7%), Italian (30 | 5.4%), and American (21 | 3.8%), together accounting for 55.7% of all Brownsboro Farm residents.
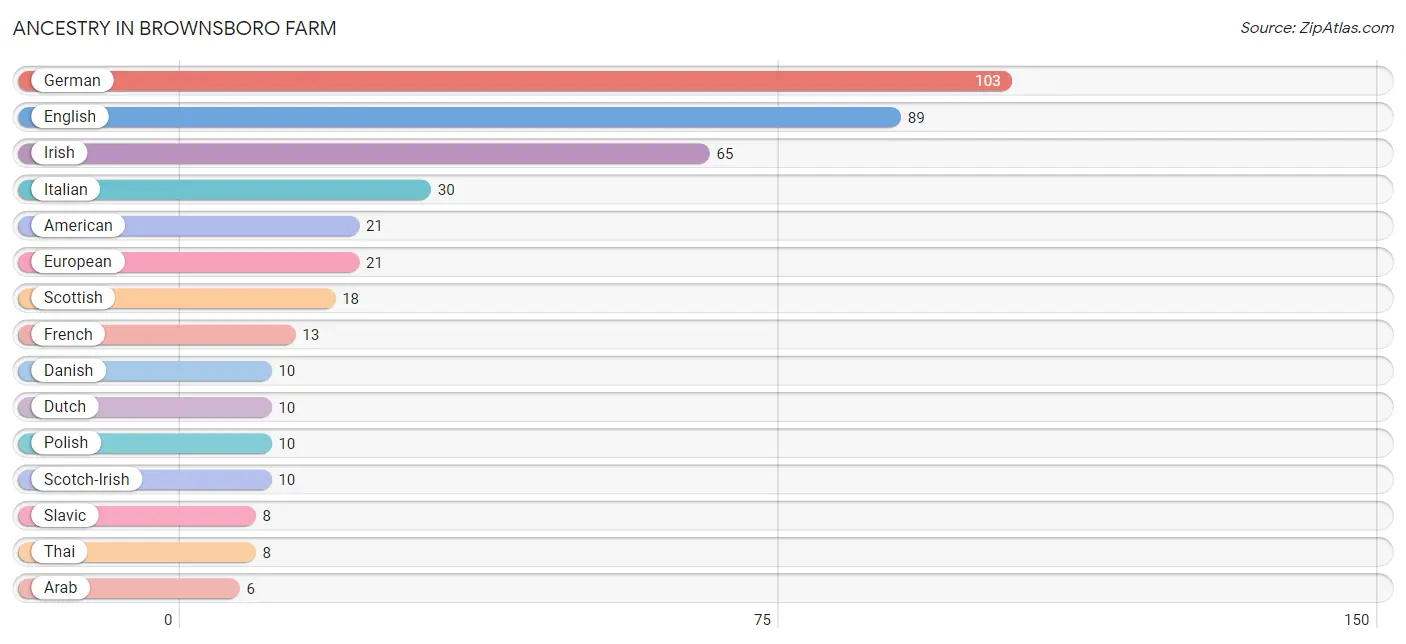
| Ancestry | # Population | % Population |
| American | 21 | 3.8% |
| Arab | 6 | 1.1% |
| Austrian | 2 | 0.4% |
| Canadian | 4 | 0.7% |
| Central American | 3 | 0.5% |
| Czech | 1 | 0.2% |
| Czechoslovakian | 2 | 0.4% |
| Danish | 10 | 1.8% |
| Dutch | 10 | 1.8% |
| English | 89 | 16.1% |
| European | 21 | 3.8% |
| French | 13 | 2.4% |
| French Canadian | 1 | 0.2% |
| German | 103 | 18.6% |
| Guatemalan | 3 | 0.5% |
| Iranian | 6 | 1.1% |
| Irish | 65 | 11.7% |
| Italian | 30 | 5.4% |
| Lebanese | 6 | 1.1% |
| Lithuanian | 1 | 0.2% |
| Mexican | 3 | 0.5% |
| Northern European | 4 | 0.7% |
| Norwegian | 2 | 0.4% |
| Polish | 10 | 1.8% |
| Scandinavian | 2 | 0.4% |
| Scotch-Irish | 10 | 1.8% |
| Scottish | 18 | 3.3% |
| Slavic | 8 | 1.5% |
| Slovene | 1 | 0.2% |
| Sri Lankan | 2 | 0.4% |
| Swedish | 4 | 0.7% |
| Swiss | 6 | 1.1% |
| Thai | 8 | 1.5% | View All 33 Rows |
Immigrants in Brownsboro Farm
The most numerous immigrant groups reported in Brownsboro Farm came from Asia (14 | 2.5%), South Central Asia (14 | 2.5%), India (8 | 1.5%), Iran (6 | 1.1%), and Canada (3 | 0.5%), together accounting for 8.1% of all Brownsboro Farm residents.
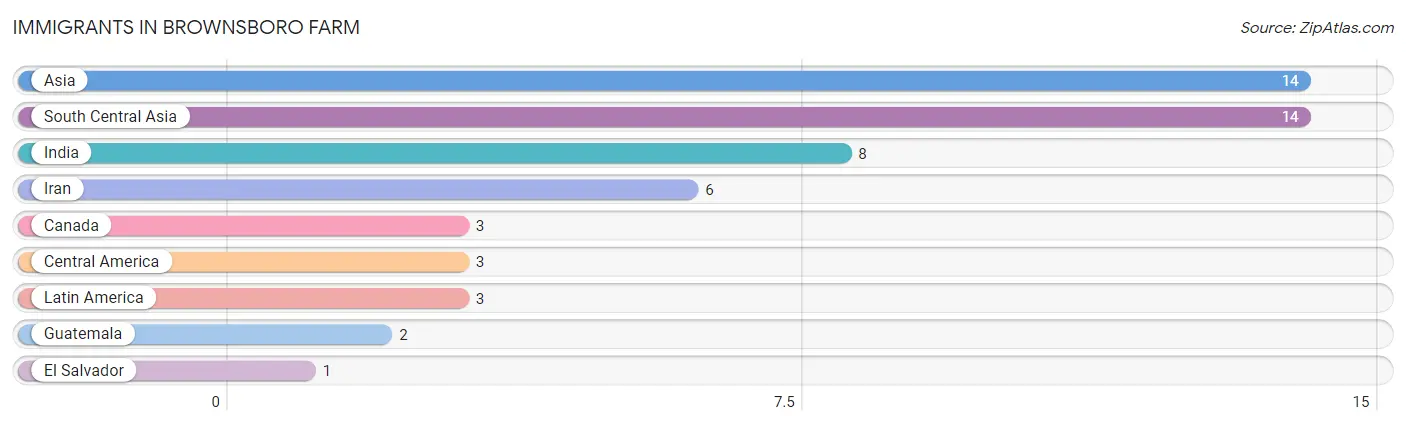
| Immigration Origin | # Population | % Population |
| Asia | 14 | 2.5% |
| Canada | 3 | 0.5% |
| Central America | 3 | 0.5% |
| El Salvador | 1 | 0.2% |
| Guatemala | 2 | 0.4% |
| India | 8 | 1.5% |
| Iran | 6 | 1.1% |
| Latin America | 3 | 0.5% |
| South Central Asia | 14 | 2.5% | View All 9 Rows |
Sex and Age in Brownsboro Farm
Sex and Age in Brownsboro Farm
The most populous age groups in Brownsboro Farm are 50 to 54 Years (36 | 12.2%) for men and 55 to 59 Years (31 | 12.0%) for women.
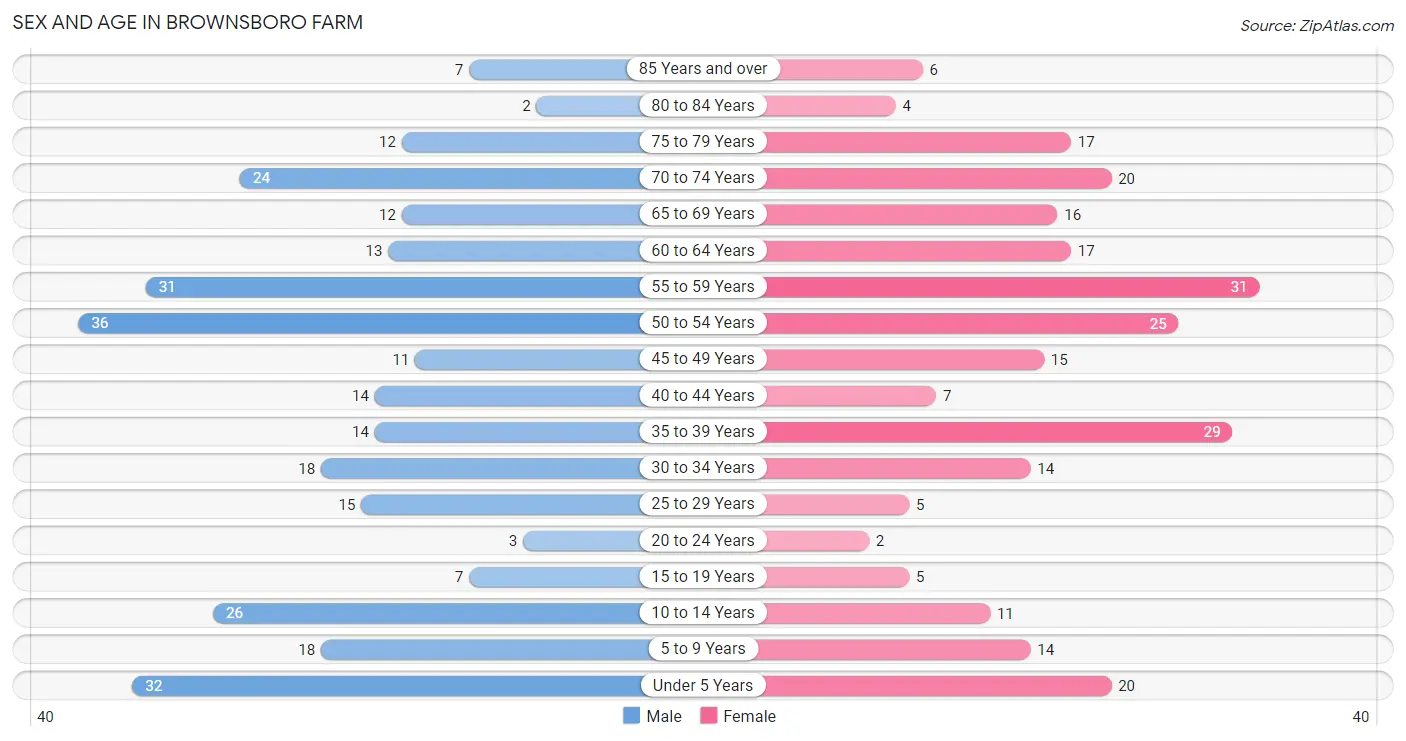
| Age Bracket | Male | Female |
| Under 5 Years | 32 (10.8%) | 20 (7.7%) |
| 5 to 9 Years | 18 (6.1%) | 14 (5.4%) |
| 10 to 14 Years | 26 (8.8%) | 11 (4.3%) |
| 15 to 19 Years | 7 (2.4%) | 5 (1.9%) |
| 20 to 24 Years | 3 (1.0%) | 2 (0.8%) |
| 25 to 29 Years | 15 (5.1%) | 5 (1.9%) |
| 30 to 34 Years | 18 (6.1%) | 14 (5.4%) |
| 35 to 39 Years | 14 (4.8%) | 29 (11.2%) |
| 40 to 44 Years | 14 (4.8%) | 7 (2.7%) |
| 45 to 49 Years | 11 (3.7%) | 15 (5.8%) |
| 50 to 54 Years | 36 (12.2%) | 25 (9.7%) |
| 55 to 59 Years | 31 (10.5%) | 31 (12.0%) |
| 60 to 64 Years | 13 (4.4%) | 17 (6.6%) |
| 65 to 69 Years | 12 (4.1%) | 16 (6.2%) |
| 70 to 74 Years | 24 (8.1%) | 20 (7.7%) |
| 75 to 79 Years | 12 (4.1%) | 17 (6.6%) |
| 80 to 84 Years | 2 (0.7%) | 4 (1.5%) |
| 85 Years and over | 7 (2.4%) | 6 (2.3%) |
| Total | 295 (100.0%) | 258 (100.0%) |
Families and Households in Brownsboro Farm
Median Family Size in Brownsboro Farm
The median family size in Brownsboro Farm is 2.77 persons per family, with married-couple families (170 | 89.5%) accounting for the largest median family size of 2.84 persons per family. On the other hand, single male/father families (7 | 3.7%) represent the smallest median family size with 2.14 persons per family.
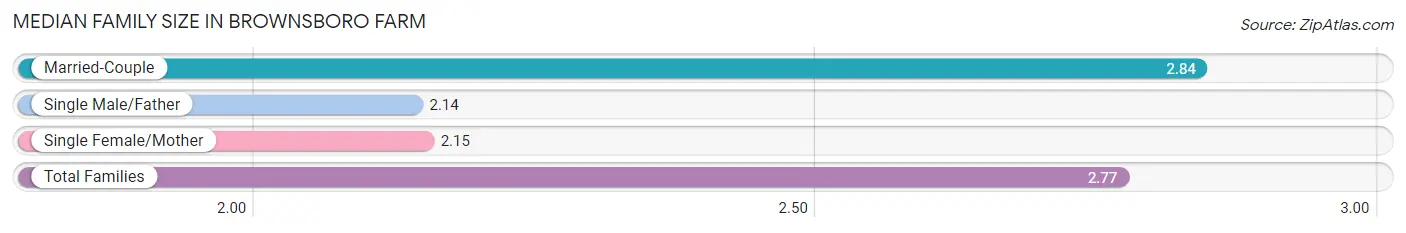
| Family Type | # Families | Family Size |
| Married-Couple | 170 (89.5%) | 2.84 |
| Single Male/Father | 7 (3.7%) | 2.14 |
| Single Female/Mother | 13 (6.8%) | 2.15 |
| Total Families | 190 (100.0%) | 2.77 |
Median Household Size in Brownsboro Farm
The median household size in Brownsboro Farm is 2.62 persons per household, with married-couple households (170 | 80.6%) accounting for the largest median household size of 2.84 persons per household. non-family households (21 | 10.0%) represent the smallest median household size with 1.10 persons per household.
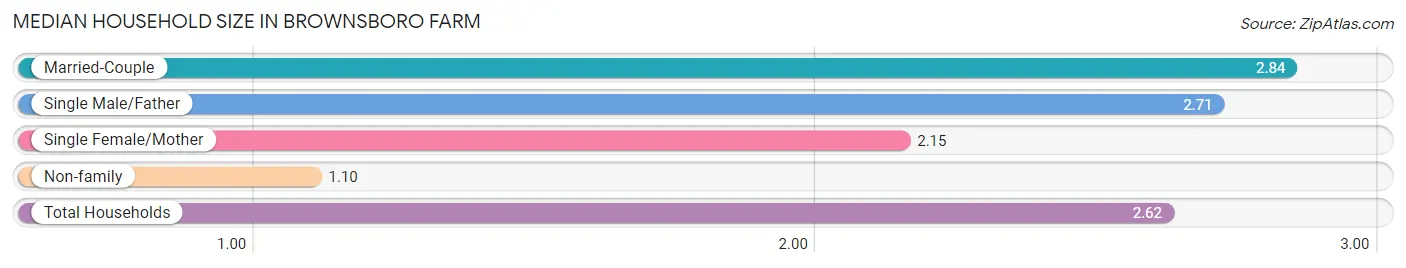
| Household Type | # Households | Household Size |
| Married-Couple | 170 (80.6%) | 2.84 |
| Single Male/Father | 7 (3.3%) | 2.71 |
| Single Female/Mother | 13 (6.2%) | 2.15 |
| Non-family | 21 (10.0%) | 1.10 |
| Total Households | 211 (100.0%) | 2.62 |
Household Size by Marriage Status in Brownsboro Farm
Out of a total of 211 households in Brownsboro Farm, 190 (90.0%) are family households, while 21 (10.0%) are nonfamily households. The most numerous type of family households are 2-person households, comprising 114, and the most common type of nonfamily households are 1-person households, comprising 20.
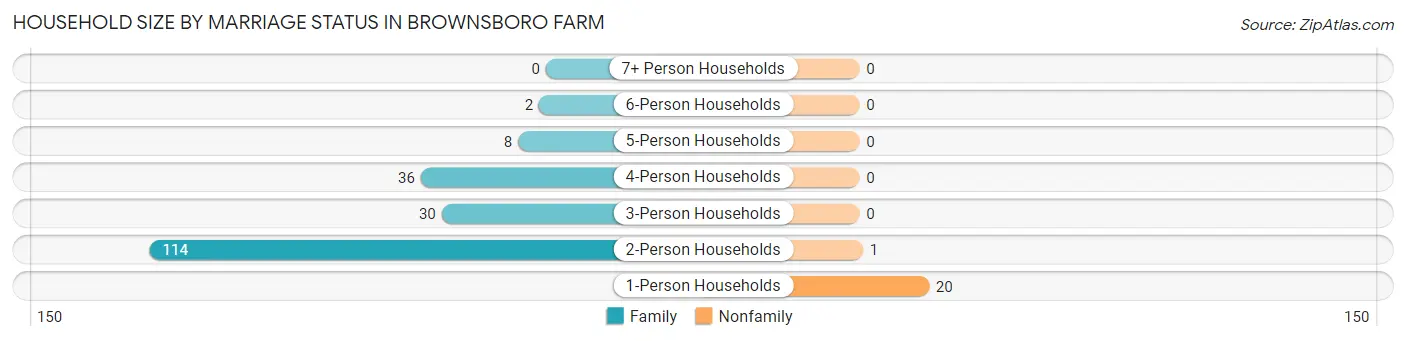
| Household Size | Family Households | Nonfamily Households |
| 1-Person Households | - | 20 (9.5%) |
| 2-Person Households | 114 (54.0%) | 1 (0.5%) |
| 3-Person Households | 30 (14.2%) | 0 (0.0%) |
| 4-Person Households | 36 (17.1%) | 0 (0.0%) |
| 5-Person Households | 8 (3.8%) | 0 (0.0%) |
| 6-Person Households | 2 (0.9%) | 0 (0.0%) |
| 7+ Person Households | 0 (0.0%) | 0 (0.0%) |
| Total | 190 (90.0%) | 21 (10.0%) |
Female Fertility in Brownsboro Farm
Fertility by Age in Brownsboro Farm
Average fertility rate in Brownsboro Farm is 51.0 births per 1,000 women. Women in the age bracket of 20 to 34 years have the highest fertility rate with 143.0 births per 1,000 women. Women in the age bracket of 20 to 34 years acount for 75.0% of all women with births.
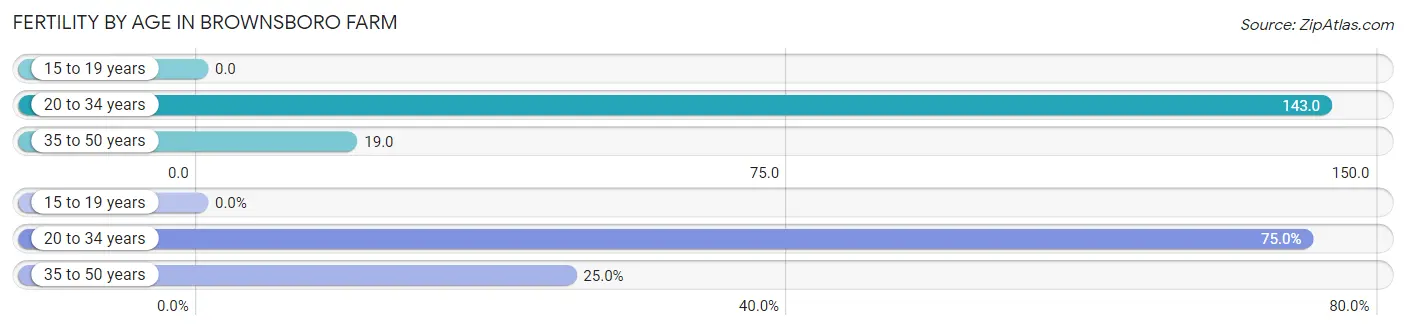
| Age Bracket | Women with Births | Births / 1,000 Women |
| 15 to 19 years | 0 (0.0%) | 0.0 |
| 20 to 34 years | 3 (75.0%) | 143.0 |
| 35 to 50 years | 1 (25.0%) | 19.0 |
| Total | 4 (100.0%) | 51.0 |
Fertility by Age by Marriage Status in Brownsboro Farm
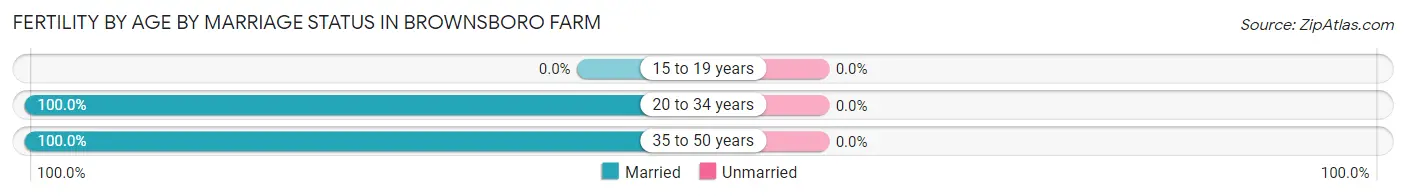
| Age Bracket | Married | Unmarried |
| 15 to 19 years | 0 (0.0%) | 0 (0.0%) |
| 20 to 34 years | 3 (100.0%) | 0 (0.0%) |
| 35 to 50 years | 1 (100.0%) | 0 (0.0%) |
| Total | 4 (100.0%) | 0 (0.0%) |
Fertility by Education in Brownsboro Farm
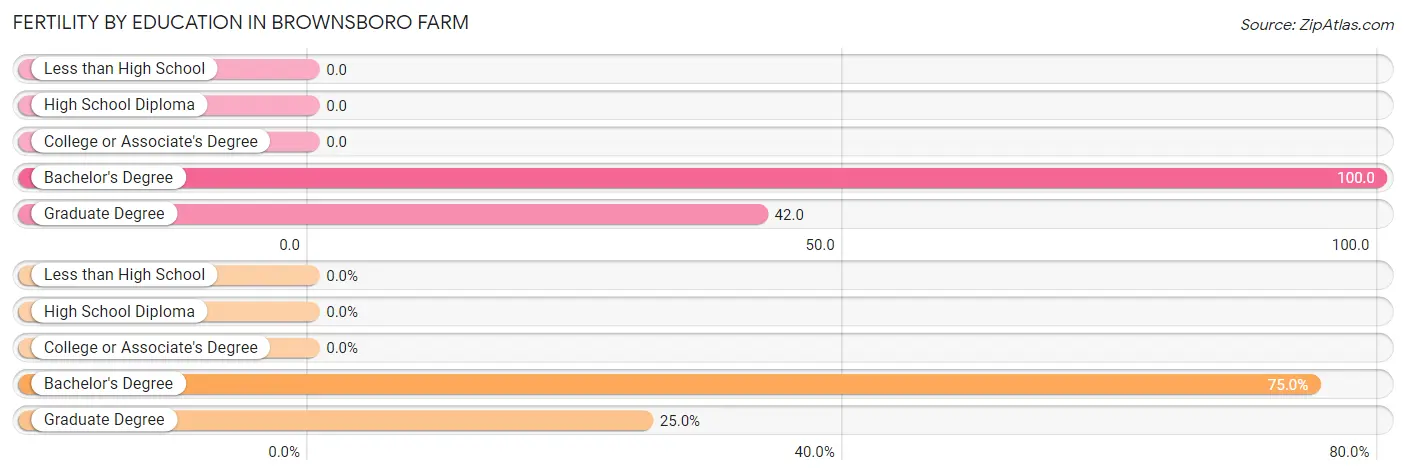
| Educational Attainment | Women with Births | Births / 1,000 Women |
| Less than High School | 0 (0.0%) | 0.0 |
| High School Diploma | 0 (0.0%) | 0.0 |
| College or Associate's Degree | 0 (0.0%) | 0.0 |
| Bachelor's Degree | 3 (75.0%) | 100.0 |
| Graduate Degree | 1 (25.0%) | 42.0 |
| Total | 4 (100.0%) | 51.0 |
Fertility by Education by Marriage Status in Brownsboro Farm
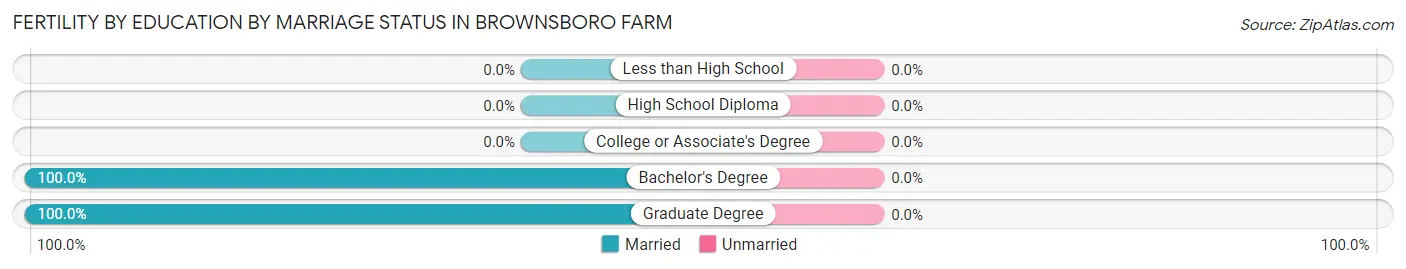
| Educational Attainment | Married | Unmarried |
| Less than High School | 0 (0.0%) | 0 (0.0%) |
| High School Diploma | 0 (0.0%) | 0 (0.0%) |
| College or Associate's Degree | 0 (0.0%) | 0 (0.0%) |
| Bachelor's Degree | 3 (100.0%) | 0 (0.0%) |
| Graduate Degree | 1 (100.0%) | 0 (0.0%) |
| Total | 4 (100.0%) | 0 (0.0%) |
Employment Characteristics in Brownsboro Farm
Employment by Class of Employer in Brownsboro Farm
Among the 289 employed individuals in Brownsboro Farm, private company employees (185 | 64.0%), not-for-profit organizations (45 | 15.6%), and local government employees (25 | 8.6%) make up the most common classes of employment.
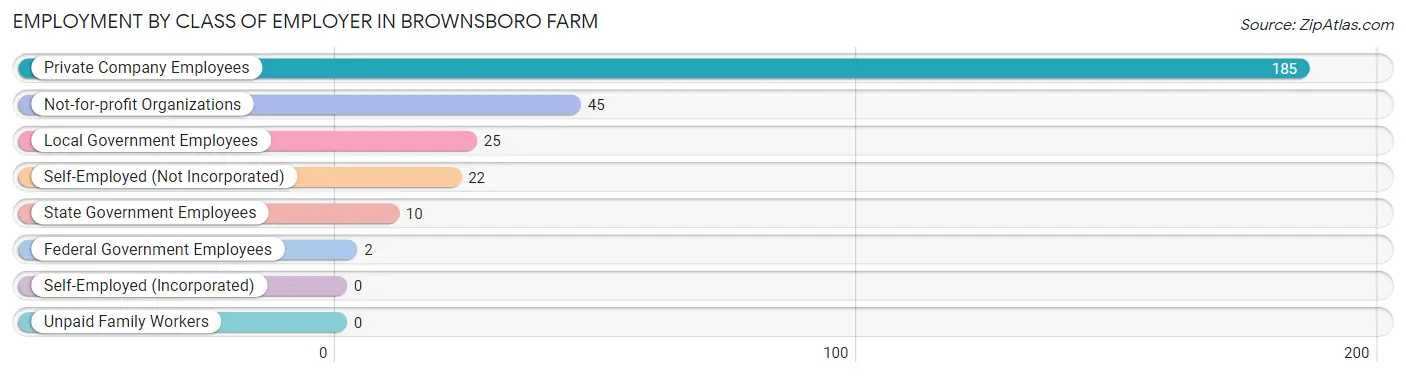
| Employer Class | # Employees | % Employees |
| Private Company Employees | 185 | 64.0% |
| Self-Employed (Incorporated) | 0 | 0.0% |
| Self-Employed (Not Incorporated) | 22 | 7.6% |
| Not-for-profit Organizations | 45 | 15.6% |
| Local Government Employees | 25 | 8.6% |
| State Government Employees | 10 | 3.5% |
| Federal Government Employees | 2 | 0.7% |
| Unpaid Family Workers | 0 | 0.0% |
| Total | 289 | 100.0% |
Employment Status by Age in Brownsboro Farm
According to the labor force statistics for Brownsboro Farm, out of the total population over 16 years of age (429), 69.0% or 296 individuals are in the labor force, with 2.4% or 7 of them unemployed. The age group with the highest labor force participation rate is 20 to 24 years, with 100.0% or 5 individuals in the labor force. Within the labor force, the 25 to 29 years age range has the highest percentage of unemployed individuals, with 17.6% or 3 of them being unemployed.
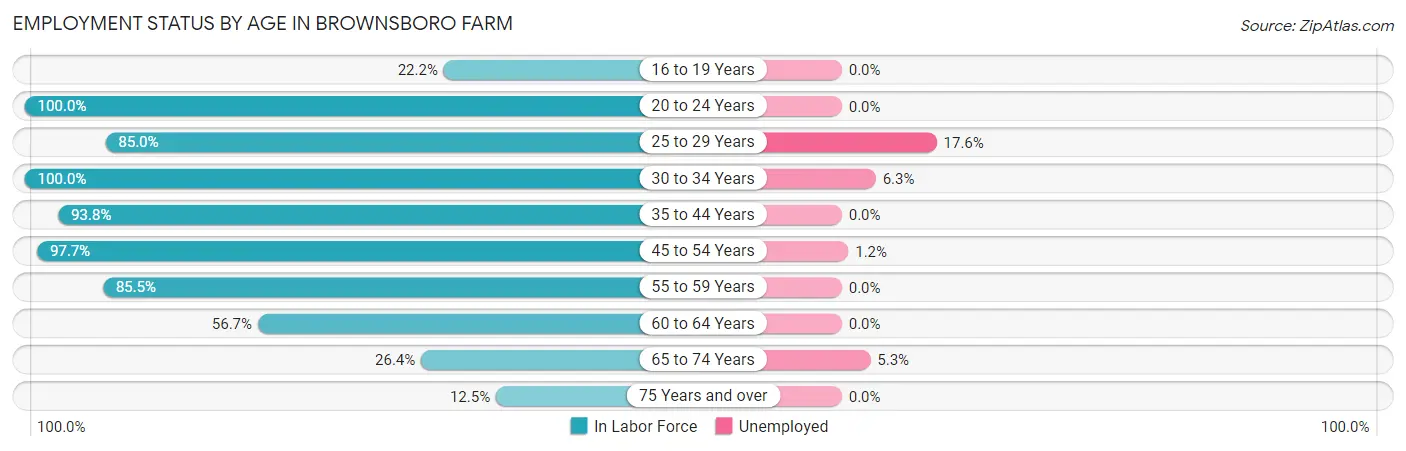
| Age Bracket | In Labor Force | Unemployed |
| 16 to 19 Years | 2 (22.2%) | 0 (0.0%) |
| 20 to 24 Years | 5 (100.0%) | 0 (0.0%) |
| 25 to 29 Years | 17 (85.0%) | 3 (17.6%) |
| 30 to 34 Years | 32 (100.0%) | 2 (6.3%) |
| 35 to 44 Years | 60 (93.8%) | 0 (0.0%) |
| 45 to 54 Years | 85 (97.7%) | 1 (1.2%) |
| 55 to 59 Years | 53 (85.5%) | 0 (0.0%) |
| 60 to 64 Years | 17 (56.7%) | 0 (0.0%) |
| 65 to 74 Years | 19 (26.4%) | 1 (5.3%) |
| 75 Years and over | 6 (12.5%) | 0 (0.0%) |
| Total | 296 (69.0%) | 7 (2.4%) |
Employment Status by Educational Attainment in Brownsboro Farm
According to labor force statistics for Brownsboro Farm, 89.5% of individuals (264) out of the total population between 25 and 64 years of age (295) are in the labor force, with 2.3% or 6 of them being unemployed. The group with the highest labor force participation rate are those with the educational attainment of less than high school, with 100.0% or 2 individuals in the labor force. Within the labor force, individuals with college / associate degree education have the highest percentage of unemployment, with 5.7% or 3 of them being unemployed.
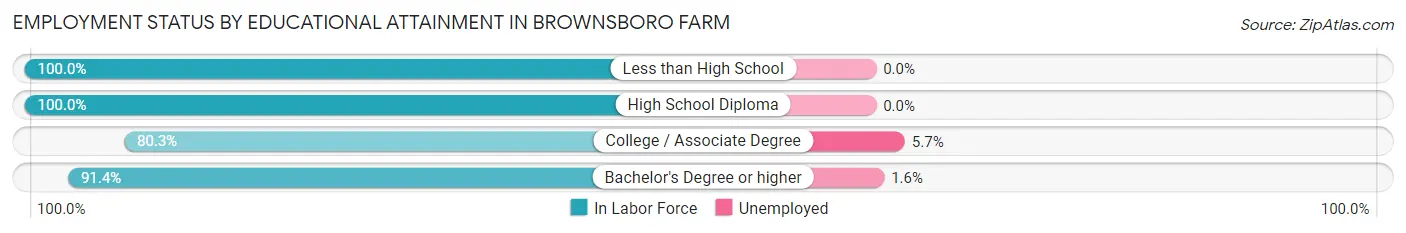
| Educational Attainment | In Labor Force | Unemployed |
| Less than High School | 2 (100.0%) | 0 (0.0%) |
| High School Diploma | 18 (100.0%) | 0 (0.0%) |
| College / Associate Degree | 53 (80.3%) | 4 (5.7%) |
| Bachelor's Degree or higher | 191 (91.4%) | 3 (1.6%) |
| Total | 264 (89.5%) | 7 (2.3%) |
Employment Occupations by Sex in Brownsboro Farm
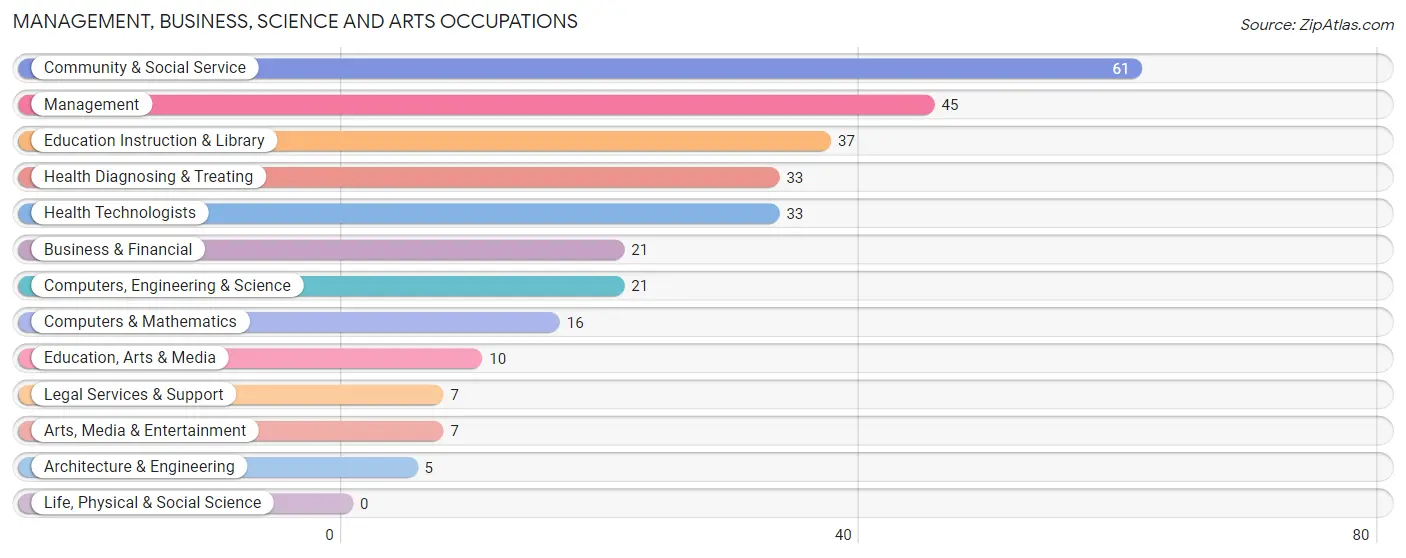
Management, Business, Science and Arts Occupations
The most common Management, Business, Science and Arts occupations in Brownsboro Farm are Community & Social Service (61 | 21.1%), Management (45 | 15.6%), Education Instruction & Library (37 | 12.8%), Health Diagnosing & Treating (33 | 11.4%), and Health Technologists (33 | 11.4%).
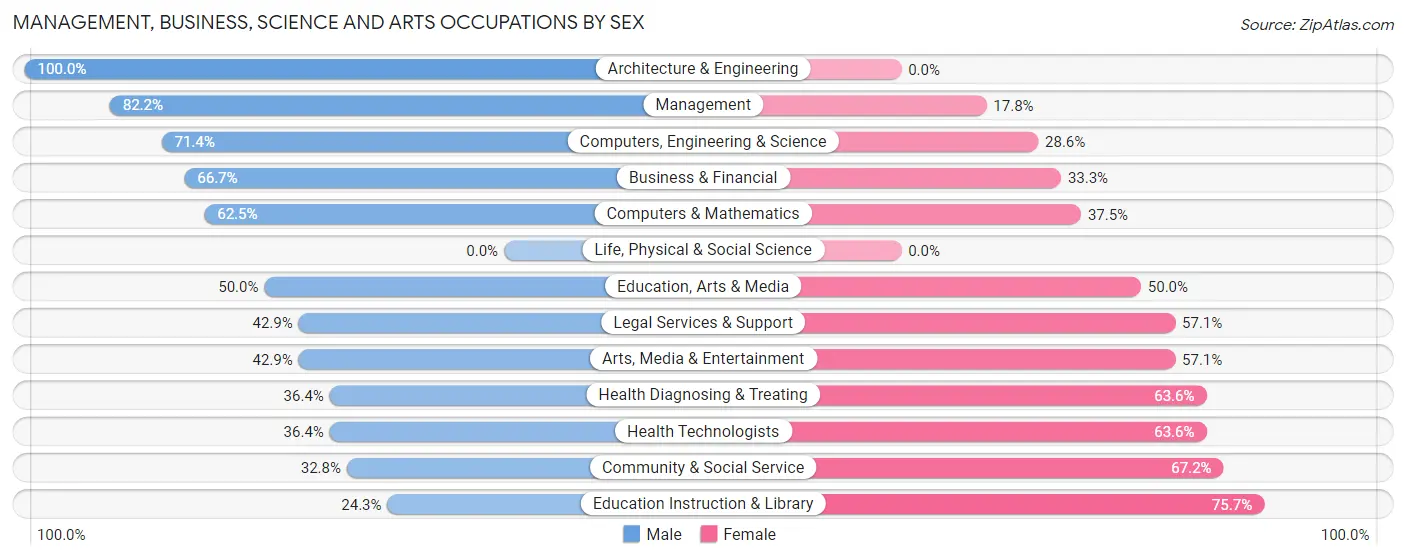
Management, Business, Science and Arts Occupations by Sex
Within the Management, Business, Science and Arts occupations in Brownsboro Farm, the most male-oriented occupations are Architecture & Engineering (100.0%), Management (82.2%), and Computers, Engineering & Science (71.4%), while the most female-oriented occupations are Education Instruction & Library (75.7%), Community & Social Service (67.2%), and Health Diagnosing & Treating (63.6%).
| Occupation | Male | Female |
| Management | 37 (82.2%) | 8 (17.8%) |
| Business & Financial | 14 (66.7%) | 7 (33.3%) |
| Computers, Engineering & Science | 15 (71.4%) | 6 (28.6%) |
| Computers & Mathematics | 10 (62.5%) | 6 (37.5%) |
| Architecture & Engineering | 5 (100.0%) | 0 (0.0%) |
| Life, Physical & Social Science | 0 (0.0%) | 0 (0.0%) |
| Community & Social Service | 20 (32.8%) | 41 (67.2%) |
| Education, Arts & Media | 5 (50.0%) | 5 (50.0%) |
| Legal Services & Support | 3 (42.9%) | 4 (57.1%) |
| Education Instruction & Library | 9 (24.3%) | 28 (75.7%) |
| Arts, Media & Entertainment | 3 (42.9%) | 4 (57.1%) |
| Health Diagnosing & Treating | 12 (36.4%) | 21 (63.6%) |
| Health Technologists | 12 (36.4%) | 21 (63.6%) |
| Total (Category) | 98 (54.1%) | 83 (45.9%) |
| Total (Overall) | 161 (55.7%) | 128 (44.3%) |
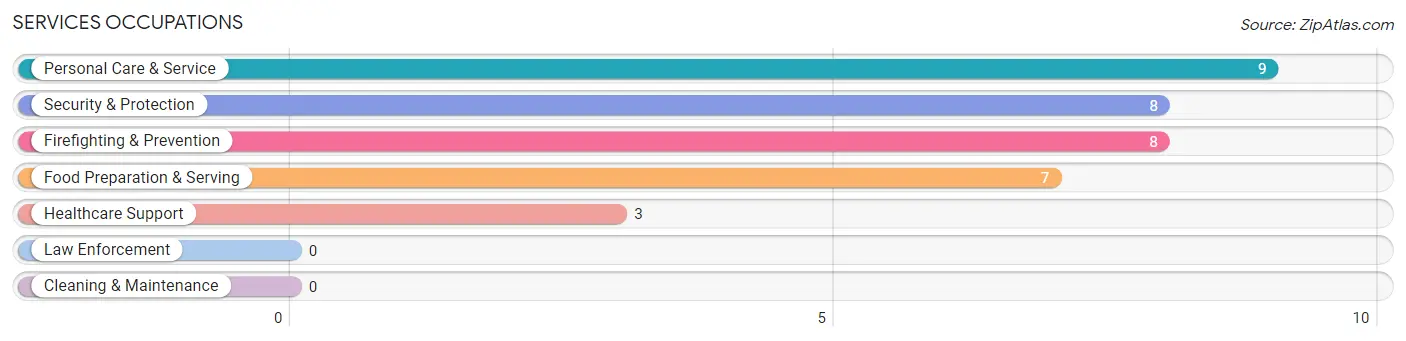
Services Occupations
The most common Services occupations in Brownsboro Farm are Personal Care & Service (9 | 3.1%), Security & Protection (8 | 2.8%), Firefighting & Prevention (8 | 2.8%), Food Preparation & Serving (7 | 2.4%), and Healthcare Support (3 | 1.0%).
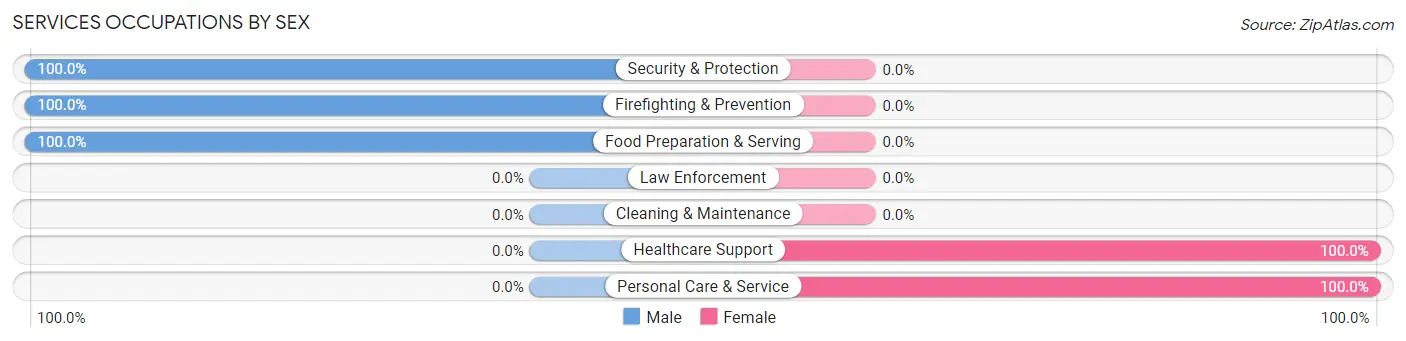
Services Occupations by Sex
Within the Services occupations in Brownsboro Farm, the most male-oriented occupations are Security & Protection (100.0%), Firefighting & Prevention (100.0%), and Food Preparation & Serving (100.0%), while the most female-oriented occupations are Healthcare Support (100.0%), and Personal Care & Service (100.0%).
| Occupation | Male | Female |
| Healthcare Support | 0 (0.0%) | 3 (100.0%) |
| Security & Protection | 8 (100.0%) | 0 (0.0%) |
| Firefighting & Prevention | 8 (100.0%) | 0 (0.0%) |
| Law Enforcement | 0 (0.0%) | 0 (0.0%) |
| Food Preparation & Serving | 7 (100.0%) | 0 (0.0%) |
| Cleaning & Maintenance | 0 (0.0%) | 0 (0.0%) |
| Personal Care & Service | 0 (0.0%) | 9 (100.0%) |
| Total (Category) | 15 (55.6%) | 12 (44.4%) |
| Total (Overall) | 161 (55.7%) | 128 (44.3%) |
Sales and Office Occupations
The most common Sales and Office occupations in Brownsboro Farm are Sales & Related (34 | 11.8%), and Office & Administration (13 | 4.5%).

Sales and Office Occupations by Sex
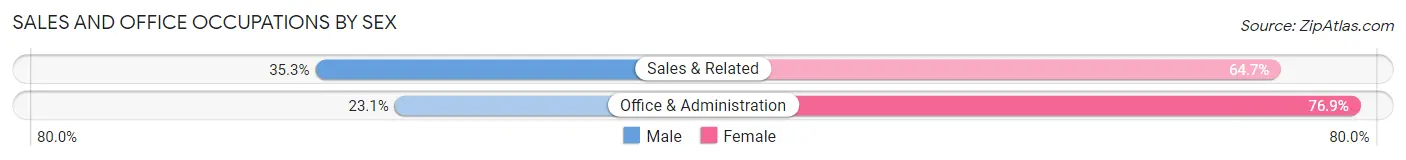
| Occupation | Male | Female |
| Sales & Related | 12 (35.3%) | 22 (64.7%) |
| Office & Administration | 3 (23.1%) | 10 (76.9%) |
| Total (Category) | 15 (31.9%) | 32 (68.1%) |
| Total (Overall) | 161 (55.7%) | 128 (44.3%) |
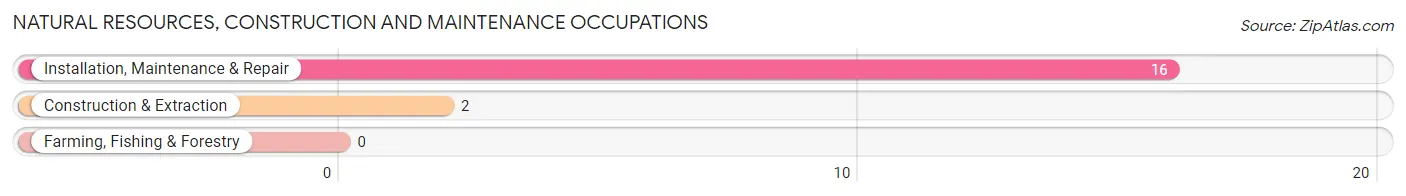
Natural Resources, Construction and Maintenance Occupations
The most common Natural Resources, Construction and Maintenance occupations in Brownsboro Farm are Installation, Maintenance & Repair (16 | 5.5%), and Construction & Extraction (2 | 0.7%).
Natural Resources, Construction and Maintenance Occupations by Sex
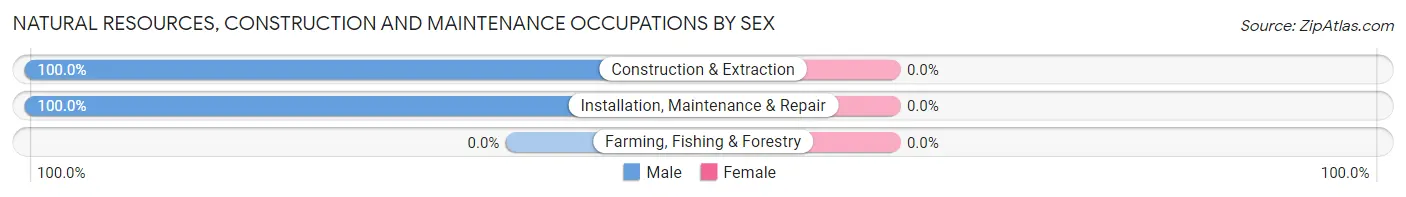
| Occupation | Male | Female |
| Farming, Fishing & Forestry | 0 (0.0%) | 0 (0.0%) |
| Construction & Extraction | 2 (100.0%) | 0 (0.0%) |
| Installation, Maintenance & Repair | 16 (100.0%) | 0 (0.0%) |
| Total (Category) | 18 (100.0%) | 0 (0.0%) |
| Total (Overall) | 161 (55.7%) | 128 (44.3%) |
Production, Transportation and Moving Occupations
The most common Production, Transportation and Moving occupations in Brownsboro Farm are Material Moving (10 | 3.5%), Production (5 | 1.7%), and Transportation (1 | 0.4%).
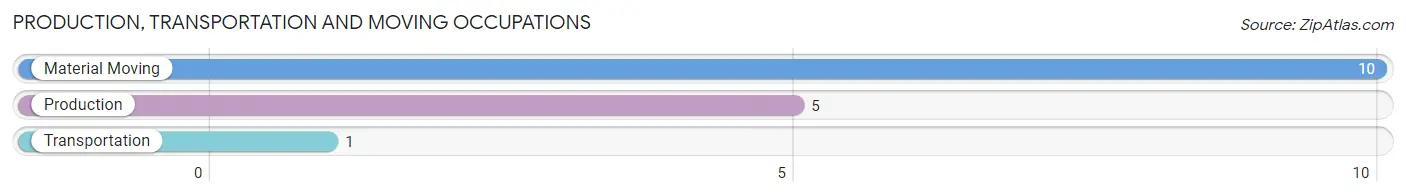
Production, Transportation and Moving Occupations by Sex
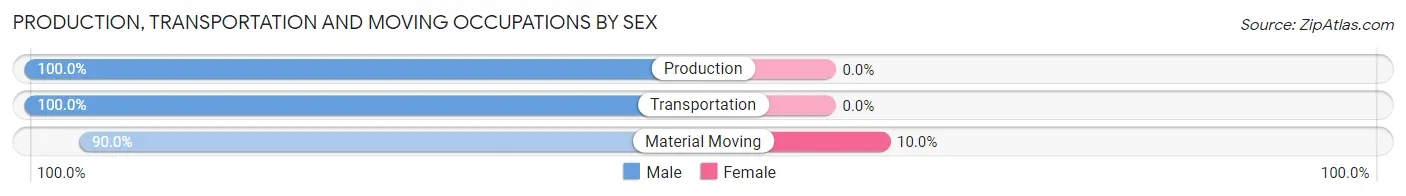
| Occupation | Male | Female |
| Production | 5 (100.0%) | 0 (0.0%) |
| Transportation | 1 (100.0%) | 0 (0.0%) |
| Material Moving | 9 (90.0%) | 1 (10.0%) |
| Total (Category) | 15 (93.8%) | 1 (6.2%) |
| Total (Overall) | 161 (55.7%) | 128 (44.3%) |
Employment Industries by Sex in Brownsboro Farm
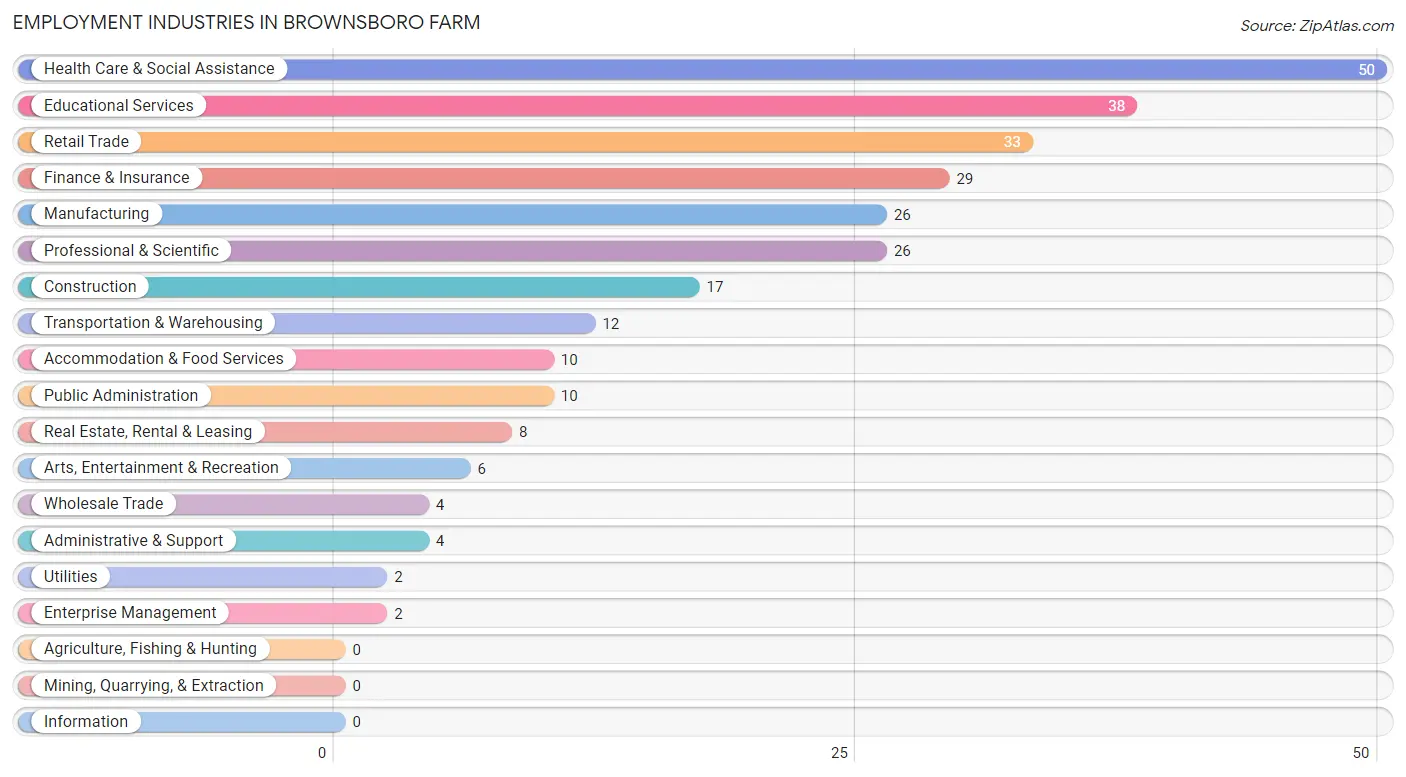
Employment Industries in Brownsboro Farm
The major employment industries in Brownsboro Farm include Health Care & Social Assistance (50 | 17.3%), Educational Services (38 | 13.2%), Retail Trade (33 | 11.4%), Finance & Insurance (29 | 10.0%), and Manufacturing (26 | 9.0%).
Employment Industries by Sex in Brownsboro Farm
The Brownsboro Farm industries that see more men than women are Construction (100.0%), Utilities (100.0%), and Administrative & Support (100.0%), whereas the industries that tend to have a higher number of women are Real Estate, Rental & Leasing (75.0%), Educational Services (73.7%), and Health Care & Social Assistance (70.0%).
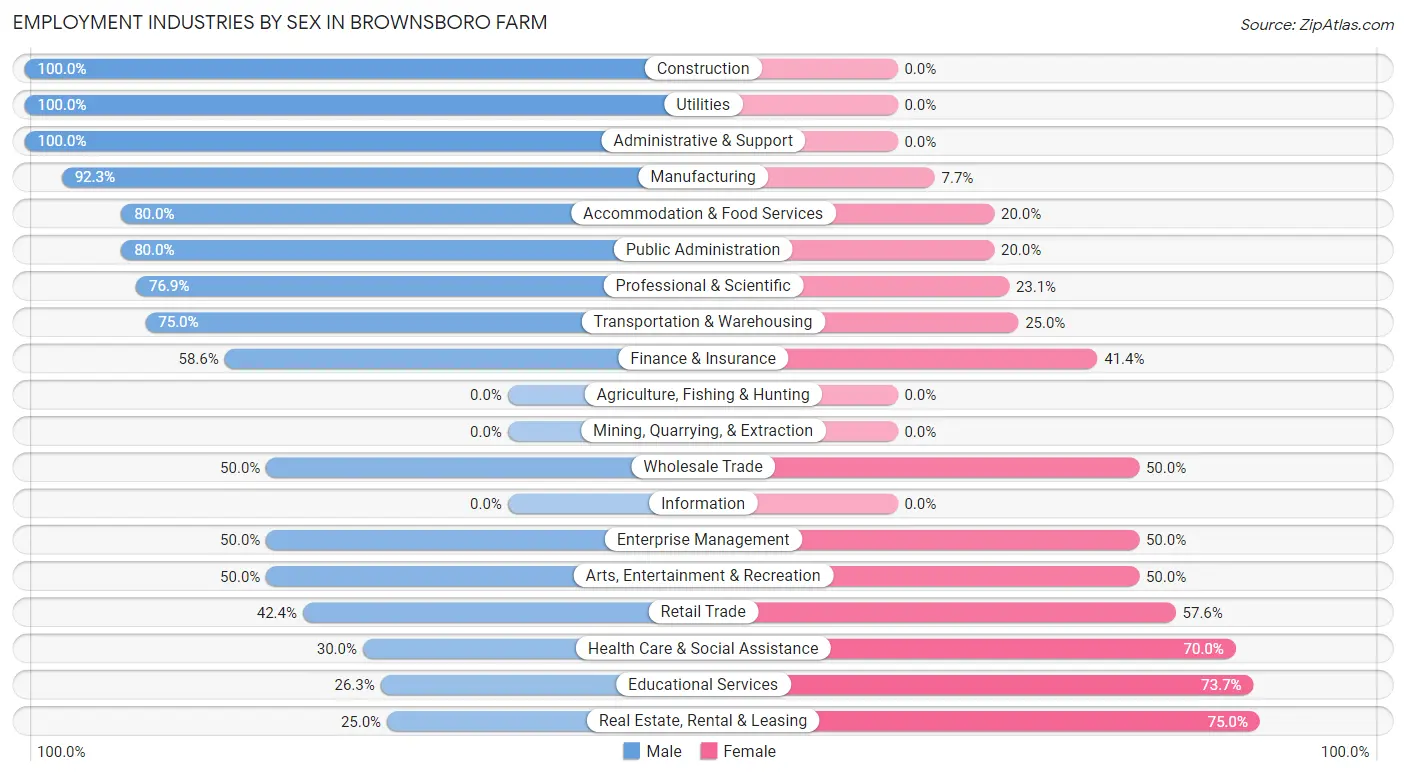
| Industry | Male | Female |
| Agriculture, Fishing & Hunting | 0 (0.0%) | 0 (0.0%) |
| Mining, Quarrying, & Extraction | 0 (0.0%) | 0 (0.0%) |
| Construction | 17 (100.0%) | 0 (0.0%) |
| Manufacturing | 24 (92.3%) | 2 (7.7%) |
| Wholesale Trade | 2 (50.0%) | 2 (50.0%) |
| Retail Trade | 14 (42.4%) | 19 (57.6%) |
| Transportation & Warehousing | 9 (75.0%) | 3 (25.0%) |
| Utilities | 2 (100.0%) | 0 (0.0%) |
| Information | 0 (0.0%) | 0 (0.0%) |
| Finance & Insurance | 17 (58.6%) | 12 (41.4%) |
| Real Estate, Rental & Leasing | 2 (25.0%) | 6 (75.0%) |
| Professional & Scientific | 20 (76.9%) | 6 (23.1%) |
| Enterprise Management | 1 (50.0%) | 1 (50.0%) |
| Administrative & Support | 4 (100.0%) | 0 (0.0%) |
| Educational Services | 10 (26.3%) | 28 (73.7%) |
| Health Care & Social Assistance | 15 (30.0%) | 35 (70.0%) |
| Arts, Entertainment & Recreation | 3 (50.0%) | 3 (50.0%) |
| Accommodation & Food Services | 8 (80.0%) | 2 (20.0%) |
| Public Administration | 8 (80.0%) | 2 (20.0%) |
| Total | 161 (55.7%) | 128 (44.3%) |
Education in Brownsboro Farm
School Enrollment in Brownsboro Farm
The most common levels of schooling among the 95 students in Brownsboro Farm are elementary school (33 | 34.7%), middle school (24 | 25.3%), and kindergarten (11 | 11.6%).
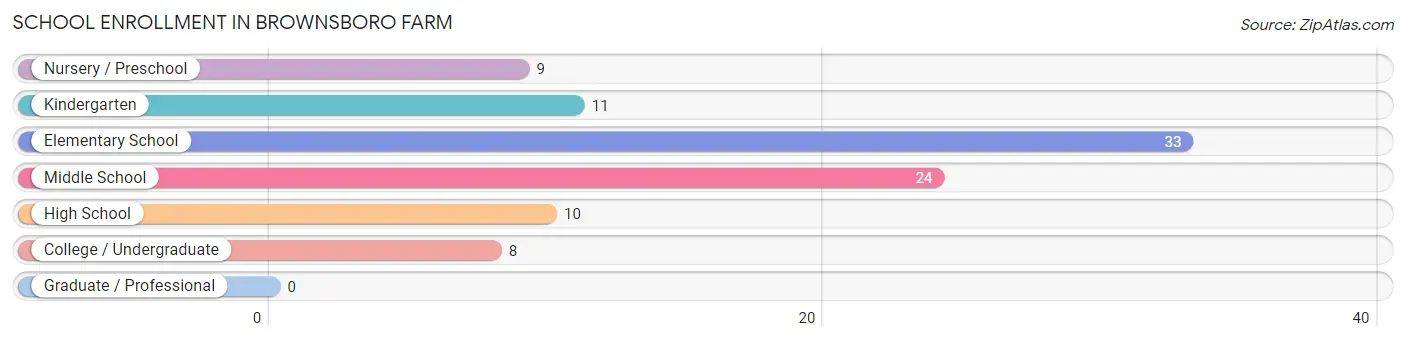
| School Level | # Students | % Students |
| Nursery / Preschool | 9 | 9.5% |
| Kindergarten | 11 | 11.6% |
| Elementary School | 33 | 34.7% |
| Middle School | 24 | 25.3% |
| High School | 10 | 10.5% |
| College / Undergraduate | 8 | 8.4% |
| Graduate / Professional | 0 | 0.0% |
| Total | 95 | 100.0% |
School Enrollment by Age by Funding Source in Brownsboro Farm
Out of a total of 95 students who are enrolled in schools in Brownsboro Farm, 28 (29.5%) attend a private institution, while the remaining 67 (70.5%) are enrolled in public schools. The age group of 3 to 4 year olds has the highest likelihood of being enrolled in private schools, with 8 (100.0% in the age bracket) enrolled. Conversely, the age group of 18 to 19 year olds has the lowest likelihood of being enrolled in a private school, with 2 (100.0% in the age bracket) attending a public institution.
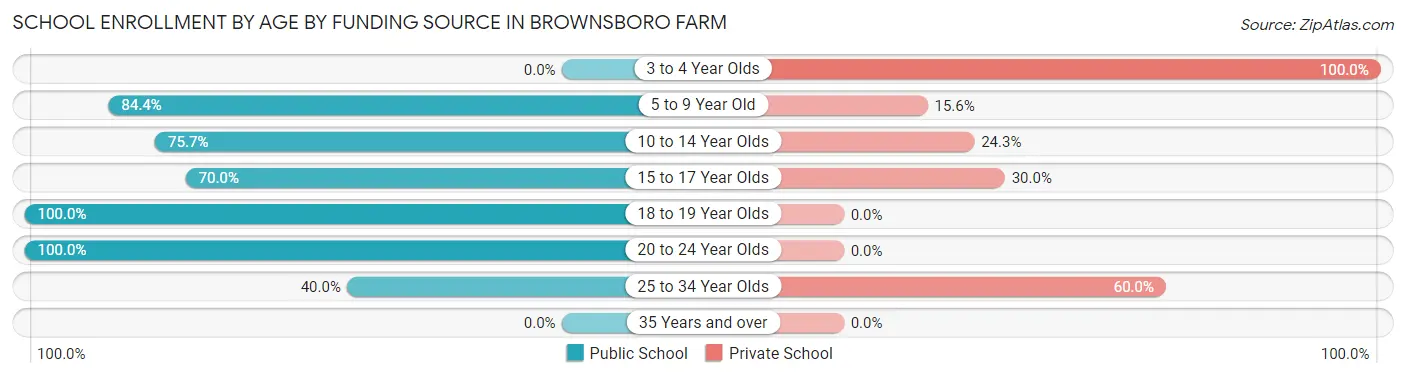
| Age Bracket | Public School | Private School |
| 3 to 4 Year Olds | 0 (0.0%) | 8 (100.0%) |
| 5 to 9 Year Old | 27 (84.4%) | 5 (15.6%) |
| 10 to 14 Year Olds | 28 (75.7%) | 9 (24.3%) |
| 15 to 17 Year Olds | 7 (70.0%) | 3 (30.0%) |
| 18 to 19 Year Olds | 2 (100.0%) | 0 (0.0%) |
| 20 to 24 Year Olds | 1 (100.0%) | 0 (0.0%) |
| 25 to 34 Year Olds | 2 (40.0%) | 3 (60.0%) |
| 35 Years and over | 0 (0.0%) | 0 (0.0%) |
| Total | 67 (70.5%) | 28 (29.5%) |
Educational Attainment by Field of Study in Brownsboro Farm
Business (62 | 20.9%), science & technology (35 | 11.8%), computers & mathematics (27 | 9.1%), bio, nature & agricultural (26 | 8.7%), and education (26 | 8.7%) are the most common fields of study among 297 individuals in Brownsboro Farm who have obtained a bachelor's degree or higher.
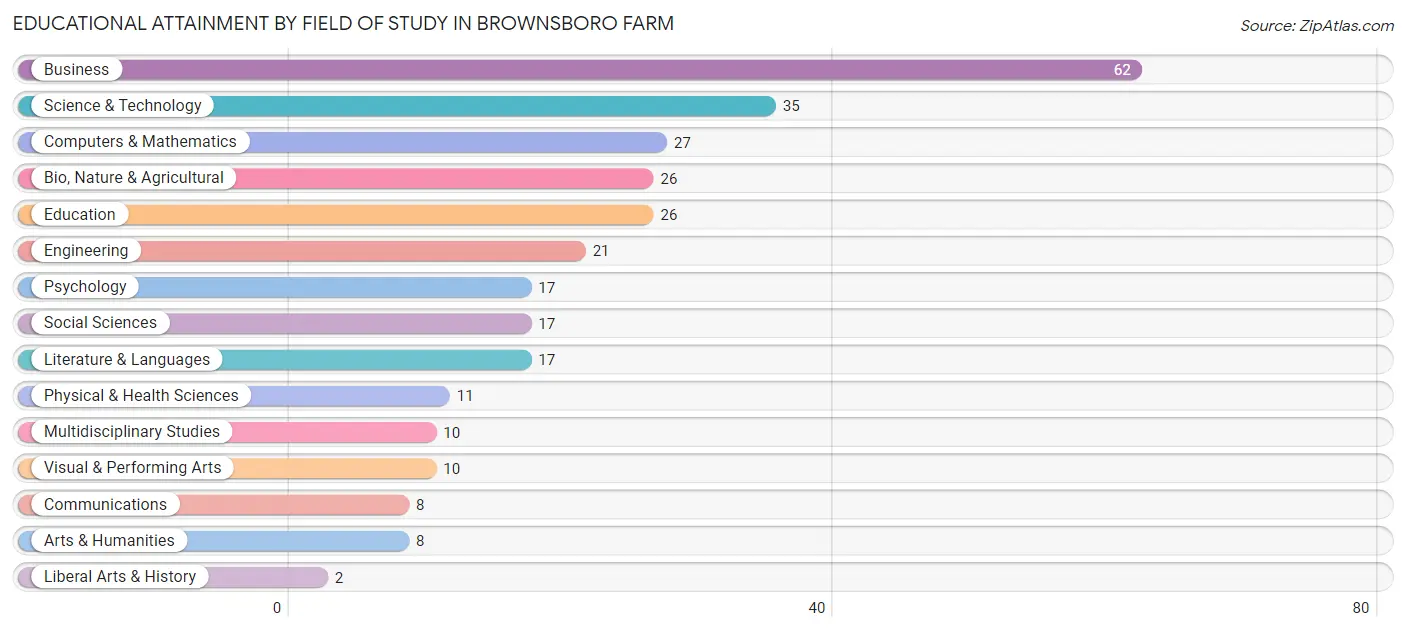
| Field of Study | # Graduates | % Graduates |
| Computers & Mathematics | 27 | 9.1% |
| Bio, Nature & Agricultural | 26 | 8.7% |
| Physical & Health Sciences | 11 | 3.7% |
| Psychology | 17 | 5.7% |
| Social Sciences | 17 | 5.7% |
| Engineering | 21 | 7.1% |
| Multidisciplinary Studies | 10 | 3.4% |
| Science & Technology | 35 | 11.8% |
| Business | 62 | 20.9% |
| Education | 26 | 8.7% |
| Literature & Languages | 17 | 5.7% |
| Liberal Arts & History | 2 | 0.7% |
| Visual & Performing Arts | 10 | 3.4% |
| Communications | 8 | 2.7% |
| Arts & Humanities | 8 | 2.7% |
| Total | 297 | 100.0% |
Transportation & Commute in Brownsboro Farm
Vehicle Availability by Sex in Brownsboro Farm
The most prevalent vehicle ownership categories in Brownsboro Farm are males with 2 vehicles (101, accounting for 62.7%) and females with 2 vehicles (88, making up 78.9%).
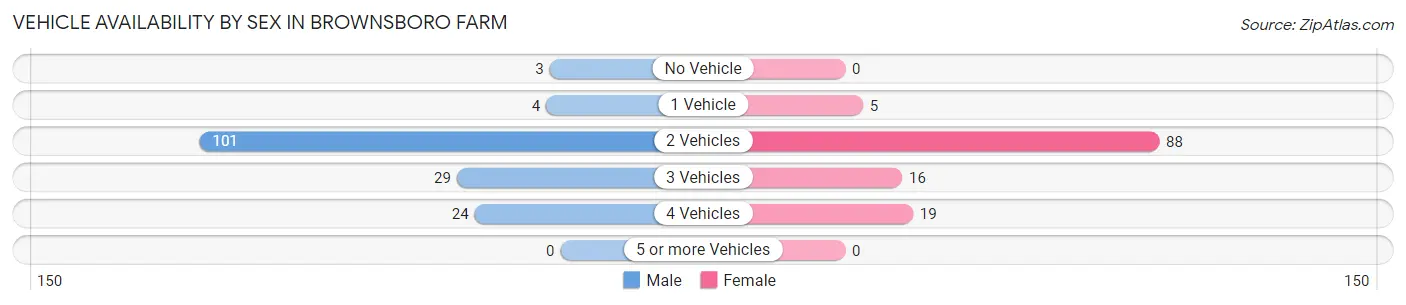
| Vehicles Available | Male | Female |
| No Vehicle | 3 (1.9%) | 0 (0.0%) |
| 1 Vehicle | 4 (2.5%) | 5 (3.9%) |
| 2 Vehicles | 101 (62.7%) | 88 (68.8%) |
| 3 Vehicles | 29 (18.0%) | 16 (12.5%) |
| 4 Vehicles | 24 (14.9%) | 19 (14.8%) |
| 5 or more Vehicles | 0 (0.0%) | 0 (0.0%) |
| Total | 161 (100.0%) | 128 (100.0%) |
Commute Time in Brownsboro Farm
The most frequently occuring commute durations in Brownsboro Farm are 20 to 24 minutes (62 commuters, 24.3%), 10 to 14 minutes (50 commuters, 19.6%), and 15 to 19 minutes (50 commuters, 19.6%).

| Commute Time | # Commuters | % Commuters |
| Less than 5 Minutes | 2 | 0.8% |
| 5 to 9 Minutes | 34 | 13.3% |
| 10 to 14 Minutes | 50 | 19.6% |
| 15 to 19 Minutes | 50 | 19.6% |
| 20 to 24 Minutes | 62 | 24.3% |
| 25 to 29 Minutes | 28 | 11.0% |
| 30 to 34 Minutes | 23 | 9.0% |
| 35 to 39 Minutes | 2 | 0.8% |
| 40 to 44 Minutes | 0 | 0.0% |
| 45 to 59 Minutes | 4 | 1.6% |
| 60 to 89 Minutes | 0 | 0.0% |
| 90 or more Minutes | 0 | 0.0% |
Commute Time by Sex in Brownsboro Farm
The most common commute times in Brownsboro Farm are 20 to 24 minutes (47 commuters, 34.1%) for males and 10 to 14 minutes (32 commuters, 27.4%) for females.
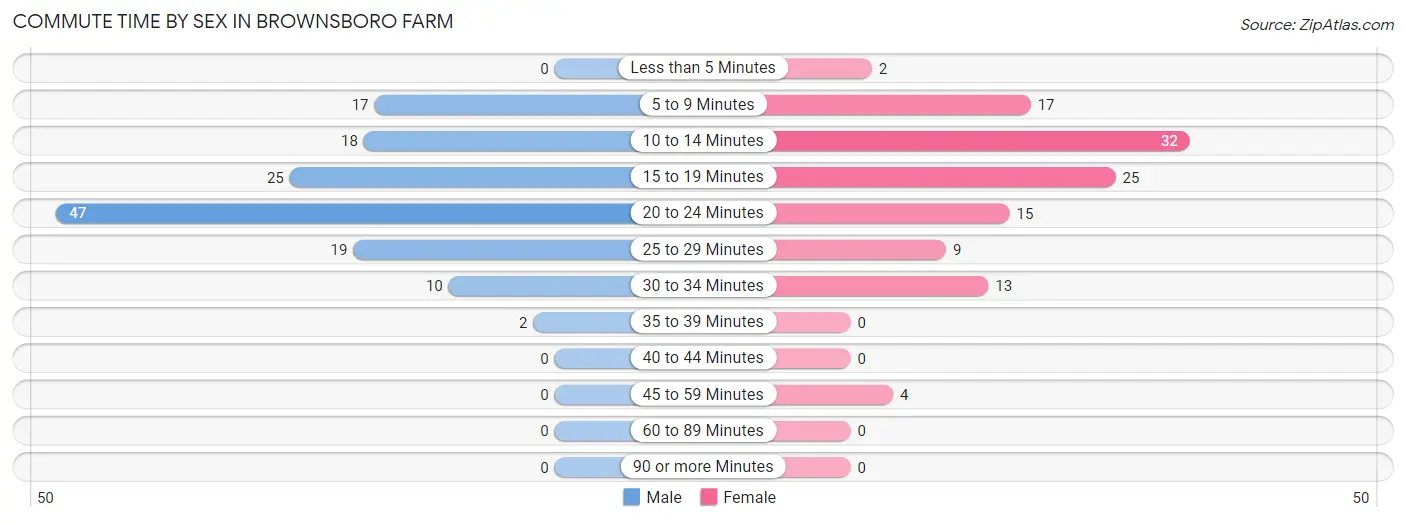
| Commute Time | Male | Female |
| Less than 5 Minutes | 0 (0.0%) | 2 (1.7%) |
| 5 to 9 Minutes | 17 (12.3%) | 17 (14.5%) |
| 10 to 14 Minutes | 18 (13.0%) | 32 (27.4%) |
| 15 to 19 Minutes | 25 (18.1%) | 25 (21.4%) |
| 20 to 24 Minutes | 47 (34.1%) | 15 (12.8%) |
| 25 to 29 Minutes | 19 (13.8%) | 9 (7.7%) |
| 30 to 34 Minutes | 10 (7.2%) | 13 (11.1%) |
| 35 to 39 Minutes | 2 (1.5%) | 0 (0.0%) |
| 40 to 44 Minutes | 0 (0.0%) | 0 (0.0%) |
| 45 to 59 Minutes | 0 (0.0%) | 4 (3.4%) |
| 60 to 89 Minutes | 0 (0.0%) | 0 (0.0%) |
| 90 or more Minutes | 0 (0.0%) | 0 (0.0%) |
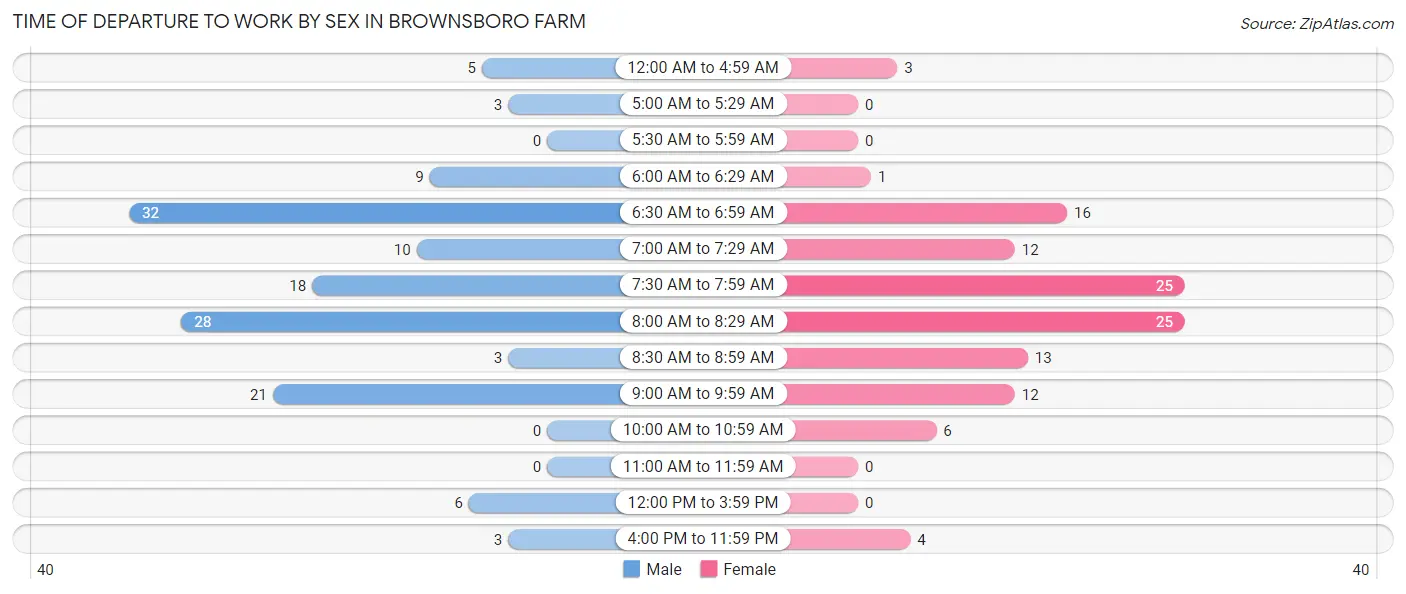
Time of Departure to Work by Sex in Brownsboro Farm
The most frequent times of departure to work in Brownsboro Farm are 6:30 AM to 6:59 AM (32, 23.2%) for males and 7:30 AM to 7:59 AM (25, 21.4%) for females.
| Time of Departure | Male | Female |
| 12:00 AM to 4:59 AM | 5 (3.6%) | 3 (2.6%) |
| 5:00 AM to 5:29 AM | 3 (2.2%) | 0 (0.0%) |
| 5:30 AM to 5:59 AM | 0 (0.0%) | 0 (0.0%) |
| 6:00 AM to 6:29 AM | 9 (6.5%) | 1 (0.9%) |
| 6:30 AM to 6:59 AM | 32 (23.2%) | 16 (13.7%) |
| 7:00 AM to 7:29 AM | 10 (7.2%) | 12 (10.3%) |
| 7:30 AM to 7:59 AM | 18 (13.0%) | 25 (21.4%) |
| 8:00 AM to 8:29 AM | 28 (20.3%) | 25 (21.4%) |
| 8:30 AM to 8:59 AM | 3 (2.2%) | 13 (11.1%) |
| 9:00 AM to 9:59 AM | 21 (15.2%) | 12 (10.3%) |
| 10:00 AM to 10:59 AM | 0 (0.0%) | 6 (5.1%) |
| 11:00 AM to 11:59 AM | 0 (0.0%) | 0 (0.0%) |
| 12:00 PM to 3:59 PM | 6 (4.3%) | 0 (0.0%) |
| 4:00 PM to 11:59 PM | 3 (2.2%) | 4 (3.4%) |
| Total | 138 (100.0%) | 117 (100.0%) |
Housing Occupancy in Brownsboro Farm
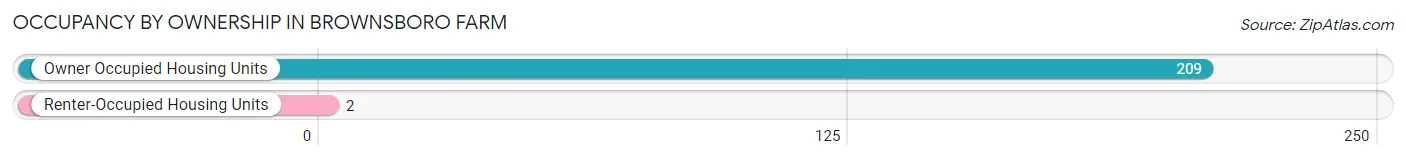
Occupancy by Ownership in Brownsboro Farm
Of the total 211 dwellings in Brownsboro Farm, owner-occupied units account for 209 (99.1%), while renter-occupied units make up 2 (0.9%).
| Occupancy | # Housing Units | % Housing Units |
| Owner Occupied Housing Units | 209 | 99.1% |
| Renter-Occupied Housing Units | 2 | 0.9% |
| Total Occupied Housing Units | 211 | 100.0% |
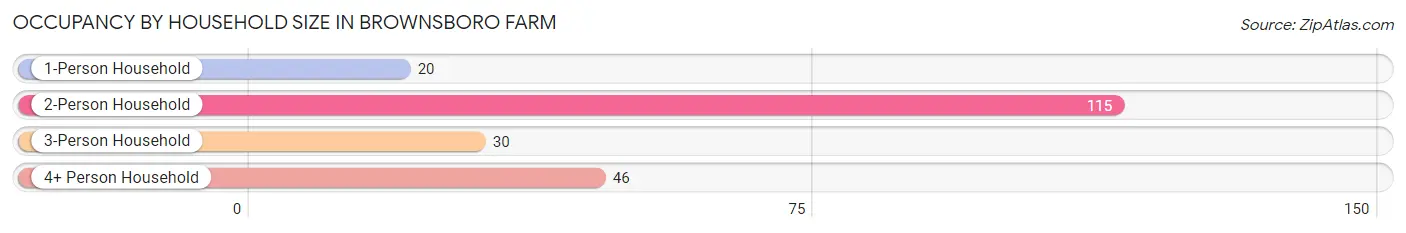
Occupancy by Household Size in Brownsboro Farm
| Household Size | # Housing Units | % Housing Units |
| 1-Person Household | 20 | 9.5% |
| 2-Person Household | 115 | 54.5% |
| 3-Person Household | 30 | 14.2% |
| 4+ Person Household | 46 | 21.8% |
| Total Housing Units | 211 | 100.0% |
Occupancy by Ownership by Household Size in Brownsboro Farm
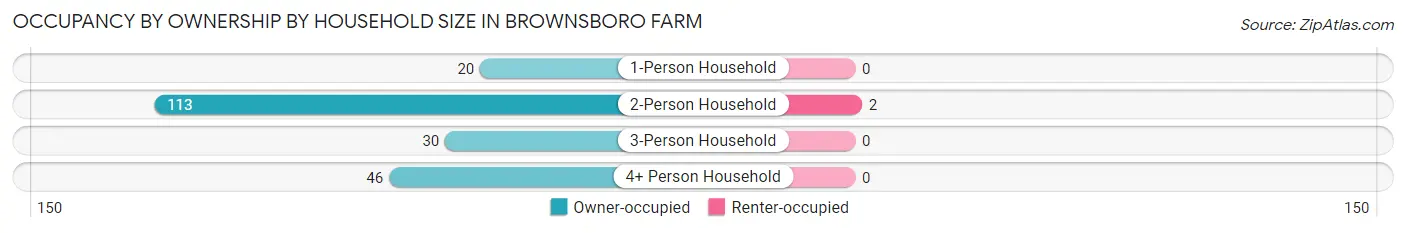
| Household Size | Owner-occupied | Renter-occupied |
| 1-Person Household | 20 (100.0%) | 0 (0.0%) |
| 2-Person Household | 113 (98.3%) | 2 (1.7%) |
| 3-Person Household | 30 (100.0%) | 0 (0.0%) |
| 4+ Person Household | 46 (100.0%) | 0 (0.0%) |
| Total Housing Units | 209 (99.1%) | 2 (0.9%) |
Occupancy by Educational Attainment in Brownsboro Farm
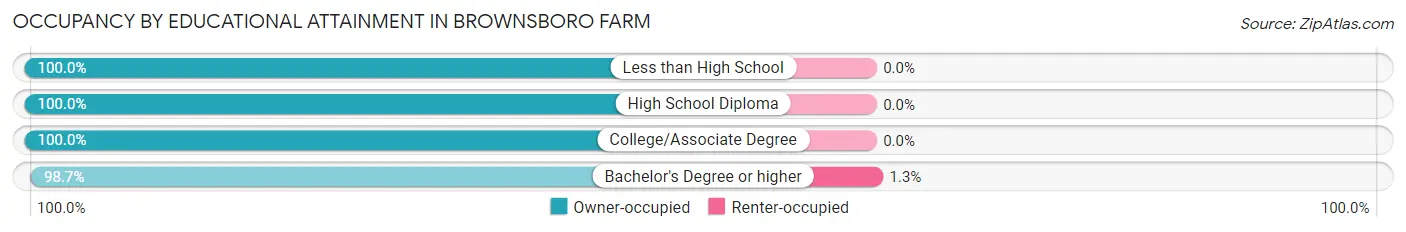
| Household Size | Owner-occupied | Renter-occupied |
| Less than High School | 3 (100.0%) | 0 (0.0%) |
| High School Diploma | 6 (100.0%) | 0 (0.0%) |
| College/Associate Degree | 46 (100.0%) | 0 (0.0%) |
| Bachelor's Degree or higher | 154 (98.7%) | 2 (1.3%) |
Occupancy by Age of Householder in Brownsboro Farm
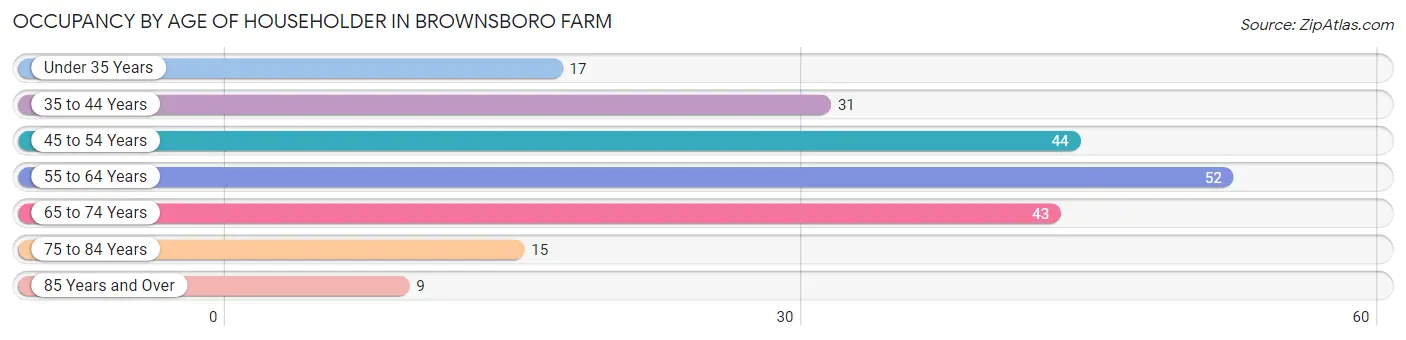
| Age Bracket | # Households | % Households |
| Under 35 Years | 17 | 8.1% |
| 35 to 44 Years | 31 | 14.7% |
| 45 to 54 Years | 44 | 20.8% |
| 55 to 64 Years | 52 | 24.6% |
| 65 to 74 Years | 43 | 20.4% |
| 75 to 84 Years | 15 | 7.1% |
| 85 Years and Over | 9 | 4.3% |
| Total | 211 | 100.0% |
Housing Finances in Brownsboro Farm
Median Income by Occupancy in Brownsboro Farm
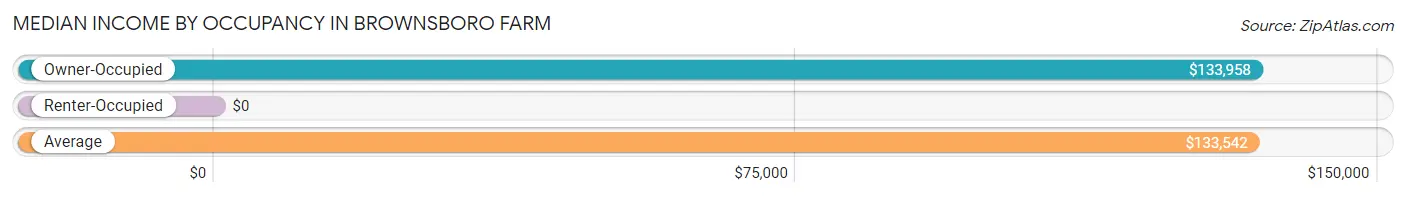
| Occupancy Type | # Households | Median Income |
| Owner-Occupied | 209 (99.1%) | $133,958 |
| Renter-Occupied | 2 (0.9%) | $0 |
| Average | 211 (100.0%) | $133,542 |
Occupancy by Householder Income Bracket in Brownsboro Farm
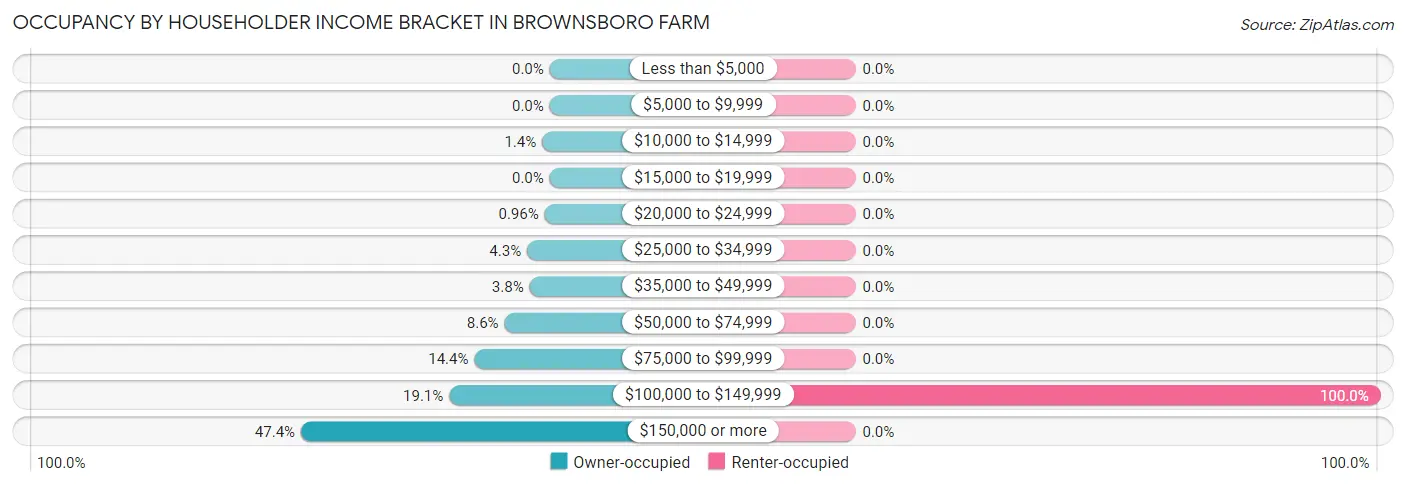
| Income Bracket | Owner-occupied | Renter-occupied |
| Less than $5,000 | 0 (0.0%) | 0 (0.0%) |
| $5,000 to $9,999 | 0 (0.0%) | 0 (0.0%) |
| $10,000 to $14,999 | 3 (1.4%) | 0 (0.0%) |
| $15,000 to $19,999 | 0 (0.0%) | 0 (0.0%) |
| $20,000 to $24,999 | 2 (1.0%) | 0 (0.0%) |
| $25,000 to $34,999 | 9 (4.3%) | 0 (0.0%) |
| $35,000 to $49,999 | 8 (3.8%) | 0 (0.0%) |
| $50,000 to $74,999 | 18 (8.6%) | 0 (0.0%) |
| $75,000 to $99,999 | 30 (14.3%) | 0 (0.0%) |
| $100,000 to $149,999 | 40 (19.1%) | 2 (100.0%) |
| $150,000 or more | 99 (47.4%) | 0 (0.0%) |
| Total | 209 (100.0%) | 2 (100.0%) |
Monthly Housing Cost Tiers in Brownsboro Farm
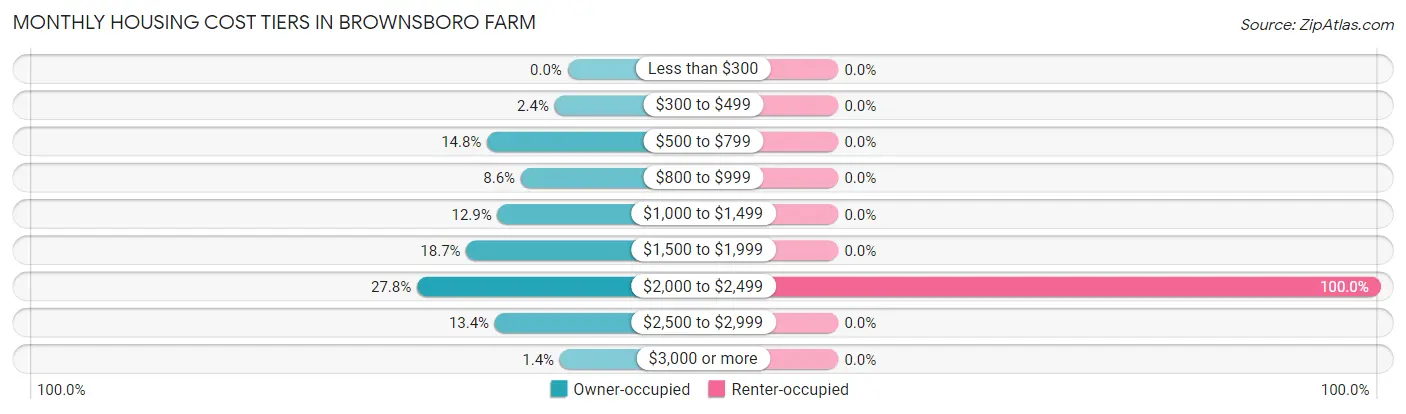
| Monthly Cost | Owner-occupied | Renter-occupied |
| Less than $300 | 0 (0.0%) | 0 (0.0%) |
| $300 to $499 | 5 (2.4%) | 0 (0.0%) |
| $500 to $799 | 31 (14.8%) | 0 (0.0%) |
| $800 to $999 | 18 (8.6%) | 0 (0.0%) |
| $1,000 to $1,499 | 27 (12.9%) | 0 (0.0%) |
| $1,500 to $1,999 | 39 (18.7%) | 0 (0.0%) |
| $2,000 to $2,499 | 58 (27.8%) | 2 (100.0%) |
| $2,500 to $2,999 | 28 (13.4%) | 0 (0.0%) |
| $3,000 or more | 3 (1.4%) | 0 (0.0%) |
| Total | 209 (100.0%) | 2 (100.0%) |
Physical Housing Characteristics in Brownsboro Farm
Housing Structures in Brownsboro Farm
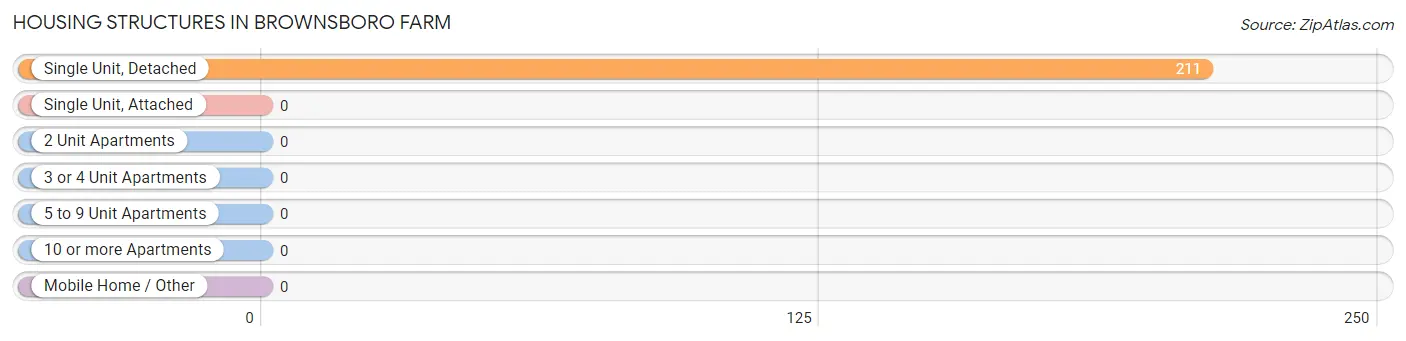
| Structure Type | # Housing Units | % Housing Units |
| Single Unit, Detached | 211 | 100.0% |
| Single Unit, Attached | 0 | 0.0% |
| 2 Unit Apartments | 0 | 0.0% |
| 3 or 4 Unit Apartments | 0 | 0.0% |
| 5 to 9 Unit Apartments | 0 | 0.0% |
| 10 or more Apartments | 0 | 0.0% |
| Mobile Home / Other | 0 | 0.0% |
| Total | 211 | 100.0% |
Housing Structures by Occupancy in Brownsboro Farm
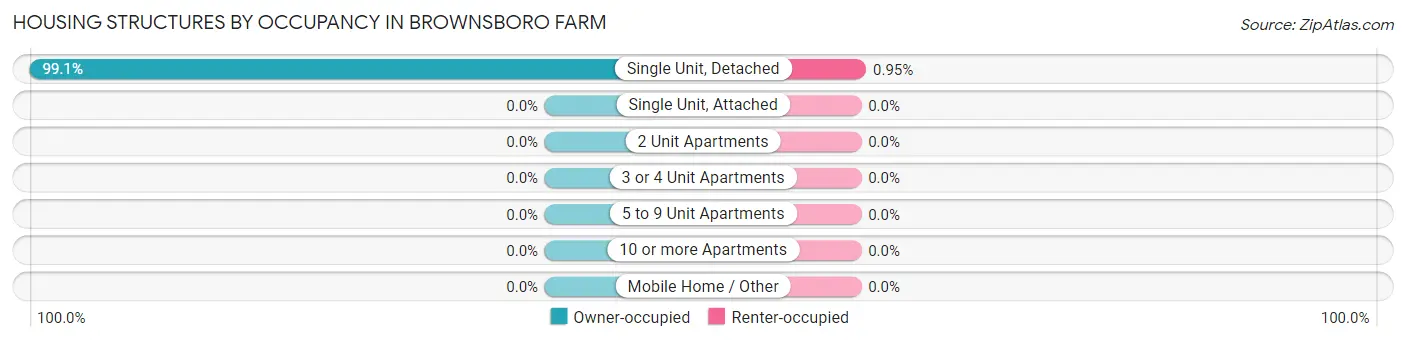
| Structure Type | Owner-occupied | Renter-occupied |
| Single Unit, Detached | 209 (99.1%) | 2 (0.9%) |
| Single Unit, Attached | 0 (0.0%) | 0 (0.0%) |
| 2 Unit Apartments | 0 (0.0%) | 0 (0.0%) |
| 3 or 4 Unit Apartments | 0 (0.0%) | 0 (0.0%) |
| 5 to 9 Unit Apartments | 0 (0.0%) | 0 (0.0%) |
| 10 or more Apartments | 0 (0.0%) | 0 (0.0%) |
| Mobile Home / Other | 0 (0.0%) | 0 (0.0%) |
| Total | 209 (99.1%) | 2 (0.9%) |
Housing Structures by Number of Rooms in Brownsboro Farm
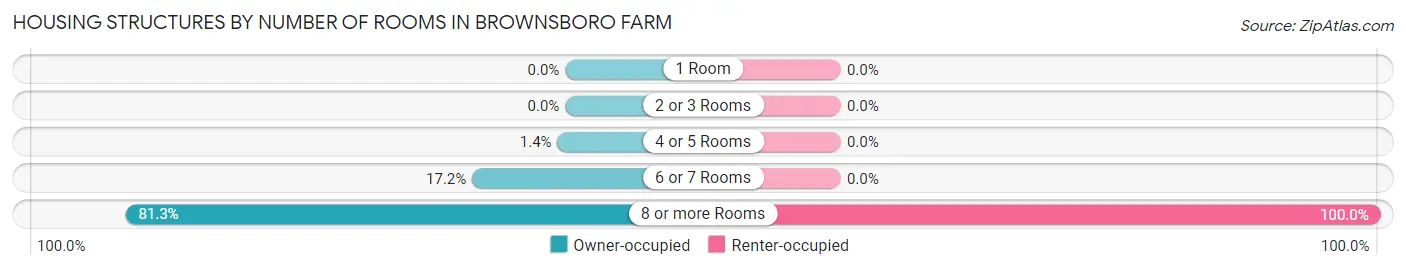
| Number of Rooms | Owner-occupied | Renter-occupied |
| 1 Room | 0 (0.0%) | 0 (0.0%) |
| 2 or 3 Rooms | 0 (0.0%) | 0 (0.0%) |
| 4 or 5 Rooms | 3 (1.4%) | 0 (0.0%) |
| 6 or 7 Rooms | 36 (17.2%) | 0 (0.0%) |
| 8 or more Rooms | 170 (81.3%) | 2 (100.0%) |
| Total | 209 (100.0%) | 2 (100.0%) |
Housing Structure by Heating Type in Brownsboro Farm
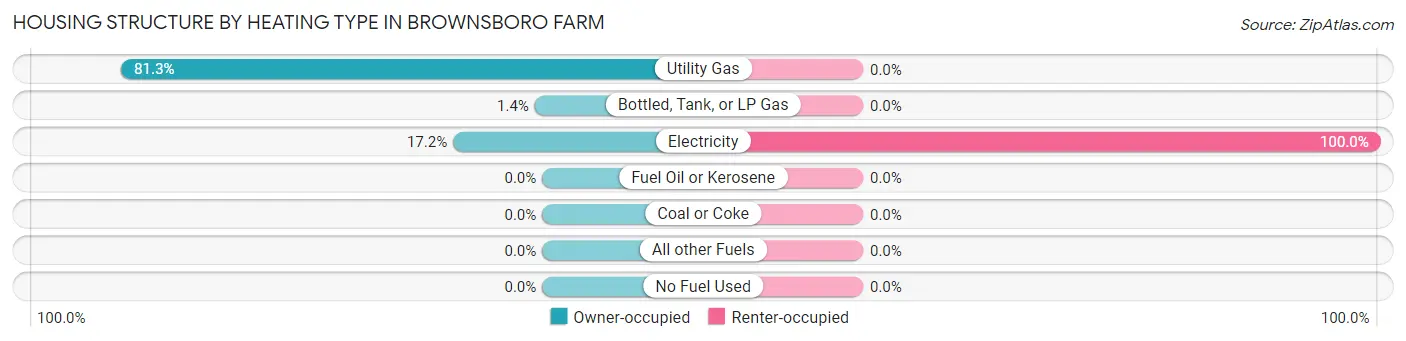
| Heating Type | Owner-occupied | Renter-occupied |
| Utility Gas | 170 (81.3%) | 0 (0.0%) |
| Bottled, Tank, or LP Gas | 3 (1.4%) | 0 (0.0%) |
| Electricity | 36 (17.2%) | 2 (100.0%) |
| Fuel Oil or Kerosene | 0 (0.0%) | 0 (0.0%) |
| Coal or Coke | 0 (0.0%) | 0 (0.0%) |
| All other Fuels | 0 (0.0%) | 0 (0.0%) |
| No Fuel Used | 0 (0.0%) | 0 (0.0%) |
| Total | 209 (100.0%) | 2 (100.0%) |
Household Vehicle Usage in Brownsboro Farm
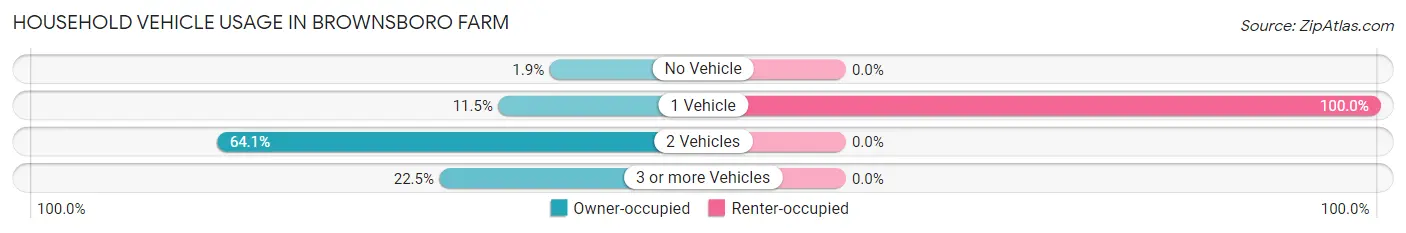
| Vehicles per Household | Owner-occupied | Renter-occupied |
| No Vehicle | 4 (1.9%) | 0 (0.0%) |
| 1 Vehicle | 24 (11.5%) | 2 (100.0%) |
| 2 Vehicles | 134 (64.1%) | 0 (0.0%) |
| 3 or more Vehicles | 47 (22.5%) | 0 (0.0%) |
| Total | 209 (100.0%) | 2 (100.0%) |
Real Estate & Mortgages in Brownsboro Farm
Real Estate and Mortgage Overview in Brownsboro Farm
| Characteristic | Without Mortgage | With Mortgage |
| Housing Units | 60 | 149 |
| Median Property Value | $363,600 | $338,400 |
| Median Household Income | $85,000 | $84 |
| Monthly Housing Costs | $756 | $1 |
| Real Estate Taxes | $3,154 | $2 |
Property Value by Mortgage Status in Brownsboro Farm
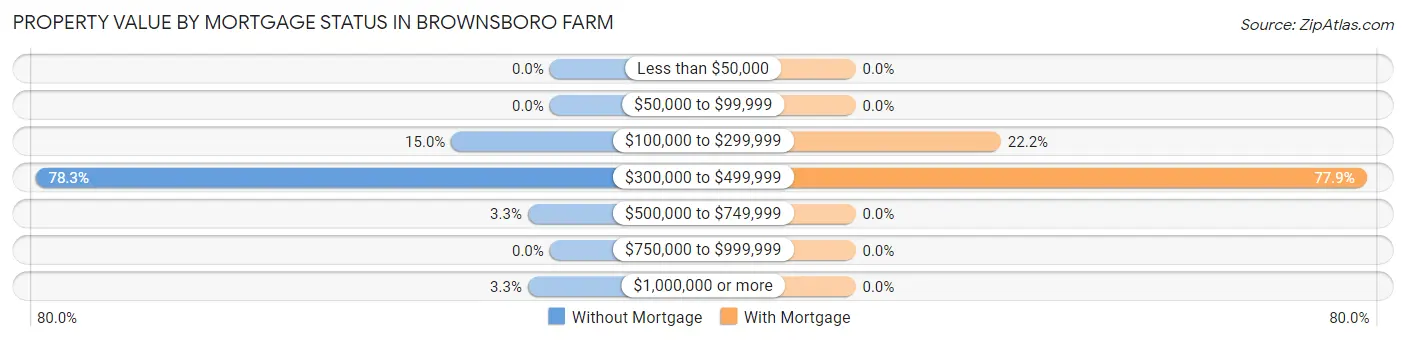
| Property Value | Without Mortgage | With Mortgage |
| Less than $50,000 | 0 (0.0%) | 0 (0.0%) |
| $50,000 to $99,999 | 0 (0.0%) | 0 (0.0%) |
| $100,000 to $299,999 | 9 (15.0%) | 33 (22.2%) |
| $300,000 to $499,999 | 47 (78.3%) | 116 (77.8%) |
| $500,000 to $749,999 | 2 (3.3%) | 0 (0.0%) |
| $750,000 to $999,999 | 0 (0.0%) | 0 (0.0%) |
| $1,000,000 or more | 2 (3.3%) | 0 (0.0%) |
| Total | 60 (100.0%) | 149 (100.0%) |
Household Income by Mortgage Status in Brownsboro Farm
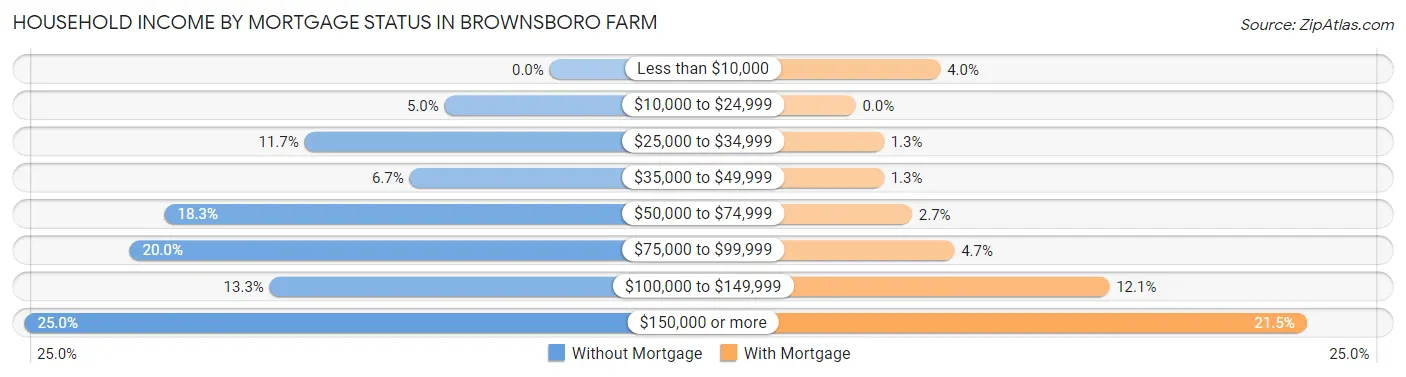
| Household Income | Without Mortgage | With Mortgage |
| Less than $10,000 | 0 (0.0%) | 6 (4.0%) |
| $10,000 to $24,999 | 3 (5.0%) | 0 (0.0%) |
| $25,000 to $34,999 | 7 (11.7%) | 2 (1.3%) |
| $35,000 to $49,999 | 4 (6.7%) | 2 (1.3%) |
| $50,000 to $74,999 | 11 (18.3%) | 4 (2.7%) |
| $75,000 to $99,999 | 12 (20.0%) | 7 (4.7%) |
| $100,000 to $149,999 | 8 (13.3%) | 18 (12.1%) |
| $150,000 or more | 15 (25.0%) | 32 (21.5%) |
| Total | 60 (100.0%) | 149 (100.0%) |
Property Value to Household Income Ratio in Brownsboro Farm
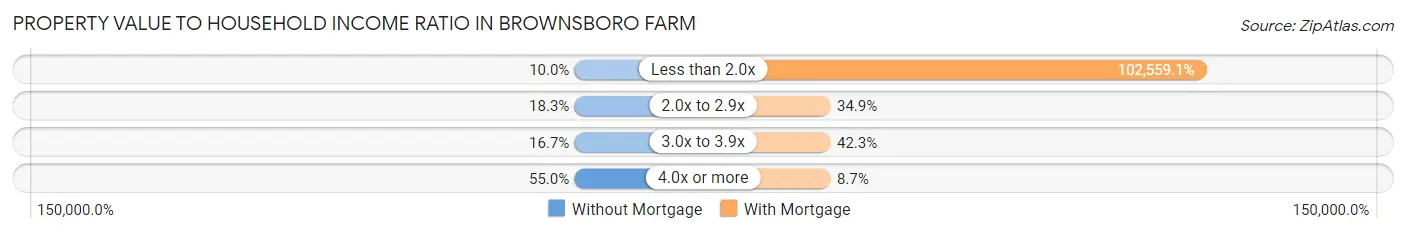
| Value-to-Income Ratio | Without Mortgage | With Mortgage |
| Less than 2.0x | 6 (10.0%) | 152,813 (102,559.1%) |
| 2.0x to 2.9x | 11 (18.3%) | 52 (34.9%) |
| 3.0x to 3.9x | 10 (16.7%) | 63 (42.3%) |
| 4.0x or more | 33 (55.0%) | 13 (8.7%) |
| Total | 60 (100.0%) | 149 (100.0%) |
Real Estate Taxes by Mortgage Status in Brownsboro Farm
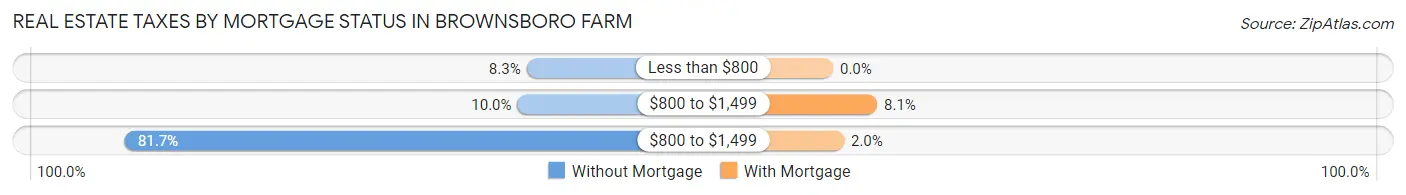
| Property Taxes | Without Mortgage | With Mortgage |
| Less than $800 | 5 (8.3%) | 0 (0.0%) |
| $800 to $1,499 | 6 (10.0%) | 12 (8.1%) |
| $800 to $1,499 | 49 (81.7%) | 3 (2.0%) |
| Total | 60 (100.0%) | 149 (100.0%) |
Health & Disability in Brownsboro Farm
Health Insurance Coverage by Age in Brownsboro Farm
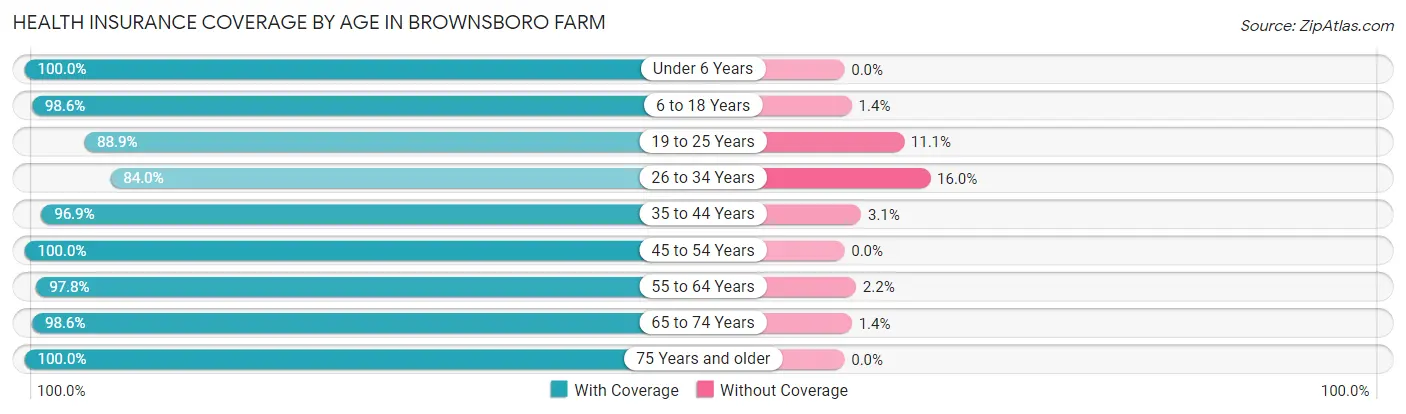
| Age Bracket | With Coverage | Without Coverage |
| Under 6 Years | 58 (100.0%) | 0 (0.0%) |
| 6 to 18 Years | 72 (98.6%) | 1 (1.4%) |
| 19 to 25 Years | 8 (88.9%) | 1 (11.1%) |
| 26 to 34 Years | 42 (84.0%) | 8 (16.0%) |
| 35 to 44 Years | 62 (96.9%) | 2 (3.1%) |
| 45 to 54 Years | 87 (100.0%) | 0 (0.0%) |
| 55 to 64 Years | 90 (97.8%) | 2 (2.2%) |
| 65 to 74 Years | 71 (98.6%) | 1 (1.4%) |
| 75 Years and older | 48 (100.0%) | 0 (0.0%) |
| Total | 538 (97.3%) | 15 (2.7%) |
Health Insurance Coverage by Citizenship Status in Brownsboro Farm
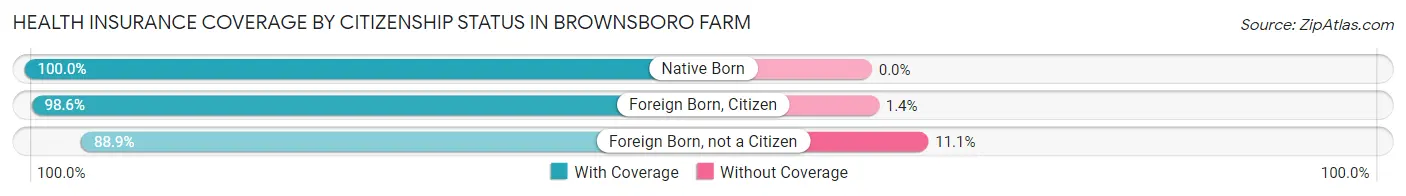
| Citizenship Status | With Coverage | Without Coverage |
| Native Born | 58 (100.0%) | 0 (0.0%) |
| Foreign Born, Citizen | 72 (98.6%) | 1 (1.4%) |
| Foreign Born, not a Citizen | 8 (88.9%) | 1 (11.1%) |
Health Insurance Coverage by Household Income in Brownsboro Farm
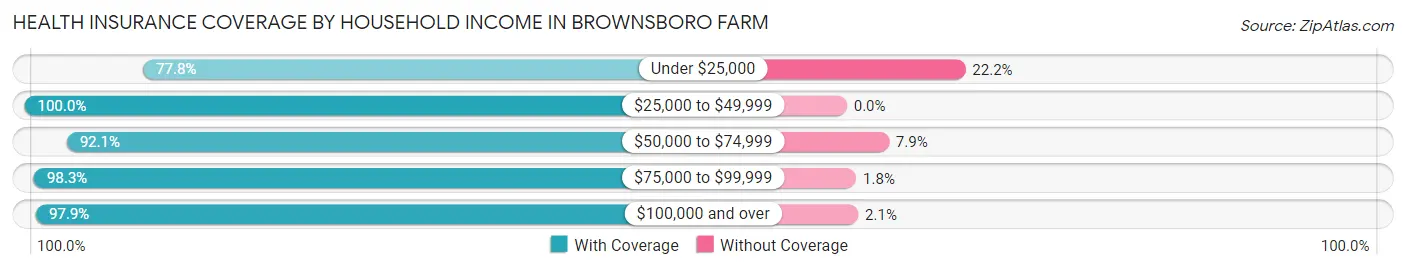
| Household Income | With Coverage | Without Coverage |
| Under $25,000 | 7 (77.8%) | 2 (22.2%) |
| $25,000 to $49,999 | 27 (100.0%) | 0 (0.0%) |
| $50,000 to $74,999 | 35 (92.1%) | 3 (7.9%) |
| $75,000 to $99,999 | 56 (98.3%) | 1 (1.8%) |
| $100,000 and over | 413 (97.9%) | 9 (2.1%) |
Public vs Private Health Insurance Coverage by Age in Brownsboro Farm
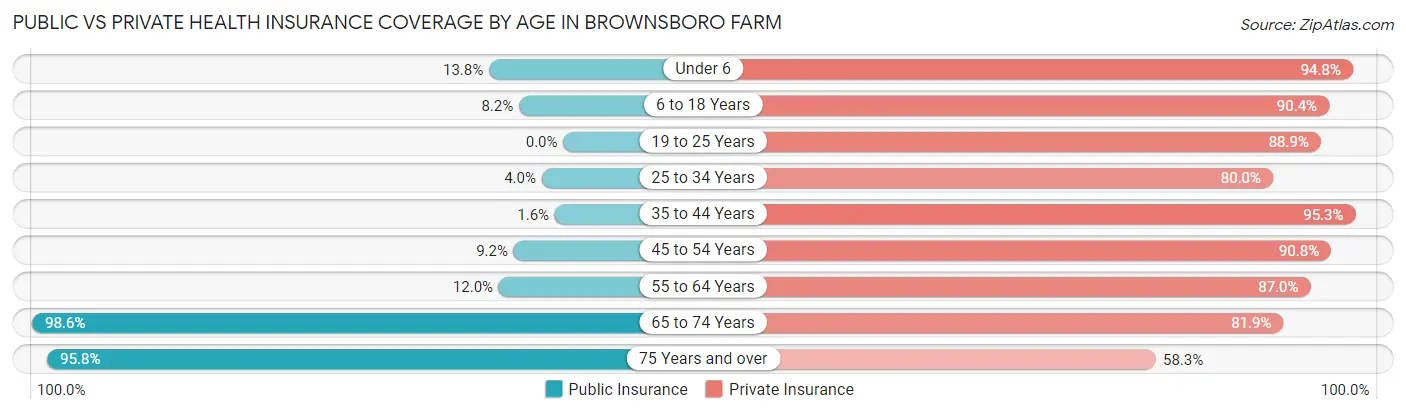
| Age Bracket | Public Insurance | Private Insurance |
| Under 6 | 8 (13.8%) | 55 (94.8%) |
| 6 to 18 Years | 6 (8.2%) | 66 (90.4%) |
| 19 to 25 Years | 0 (0.0%) | 8 (88.9%) |
| 25 to 34 Years | 2 (4.0%) | 40 (80.0%) |
| 35 to 44 Years | 1 (1.6%) | 61 (95.3%) |
| 45 to 54 Years | 8 (9.2%) | 79 (90.8%) |
| 55 to 64 Years | 11 (12.0%) | 80 (87.0%) |
| 65 to 74 Years | 71 (98.6%) | 59 (81.9%) |
| 75 Years and over | 46 (95.8%) | 28 (58.3%) |
| Total | 153 (27.7%) | 476 (86.1%) |
Disability Status by Sex by Age in Brownsboro Farm
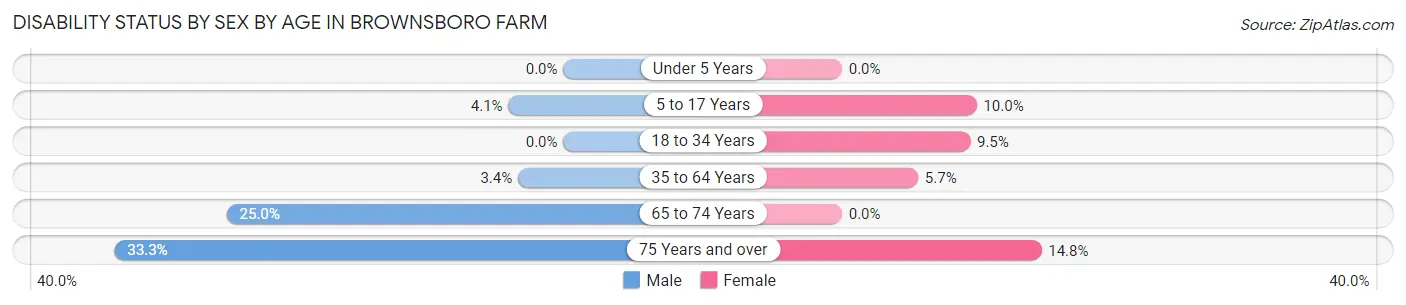
| Age Bracket | Male | Female |
| Under 5 Years | 0 (0.0%) | 0 (0.0%) |
| 5 to 17 Years | 2 (4.1%) | 3 (10.0%) |
| 18 to 34 Years | 0 (0.0%) | 2 (9.5%) |
| 35 to 64 Years | 4 (3.4%) | 7 (5.7%) |
| 65 to 74 Years | 9 (25.0%) | 0 (0.0%) |
| 75 Years and over | 7 (33.3%) | 4 (14.8%) |
Disability Class by Sex by Age in Brownsboro Farm
Disability Class: Hearing Difficulty
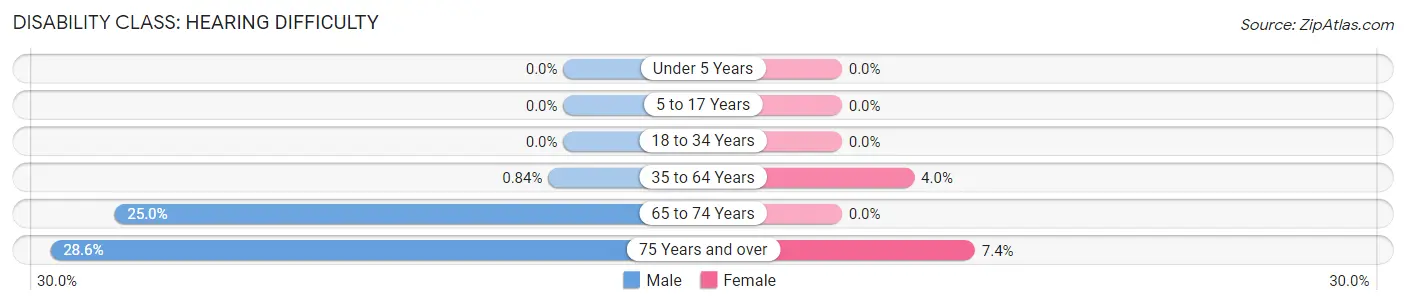
| Age Bracket | Male | Female |
| Under 5 Years | 0 (0.0%) | 0 (0.0%) |
| 5 to 17 Years | 0 (0.0%) | 0 (0.0%) |
| 18 to 34 Years | 0 (0.0%) | 0 (0.0%) |
| 35 to 64 Years | 1 (0.8%) | 5 (4.0%) |
| 65 to 74 Years | 9 (25.0%) | 0 (0.0%) |
| 75 Years and over | 6 (28.6%) | 2 (7.4%) |
Disability Class: Vision Difficulty
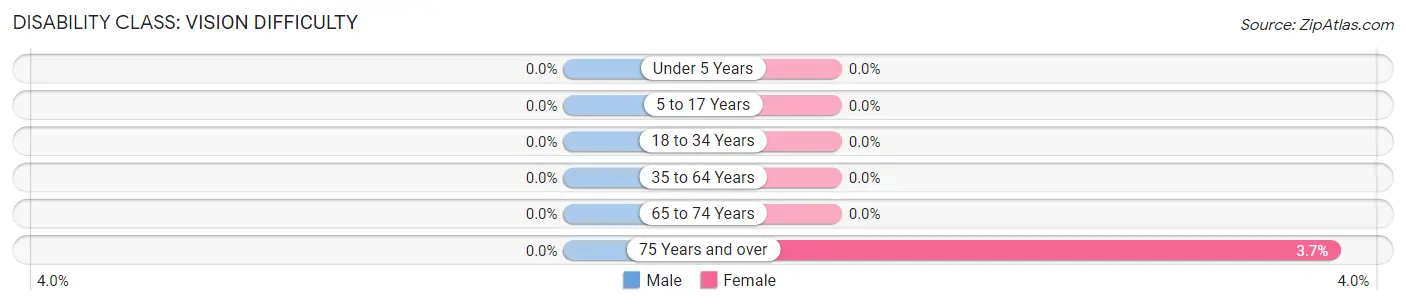
| Age Bracket | Male | Female |
| Under 5 Years | 0 (0.0%) | 0 (0.0%) |
| 5 to 17 Years | 0 (0.0%) | 0 (0.0%) |
| 18 to 34 Years | 0 (0.0%) | 0 (0.0%) |
| 35 to 64 Years | 0 (0.0%) | 0 (0.0%) |
| 65 to 74 Years | 0 (0.0%) | 0 (0.0%) |
| 75 Years and over | 0 (0.0%) | 1 (3.7%) |
Disability Class: Cognitive Difficulty
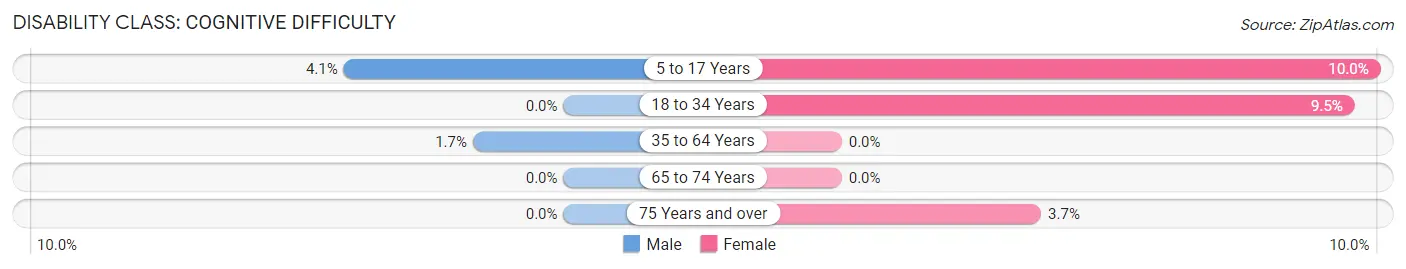
| Age Bracket | Male | Female |
| 5 to 17 Years | 2 (4.1%) | 3 (10.0%) |
| 18 to 34 Years | 0 (0.0%) | 2 (9.5%) |
| 35 to 64 Years | 2 (1.7%) | 0 (0.0%) |
| 65 to 74 Years | 0 (0.0%) | 0 (0.0%) |
| 75 Years and over | 0 (0.0%) | 1 (3.7%) |
Disability Class: Ambulatory Difficulty
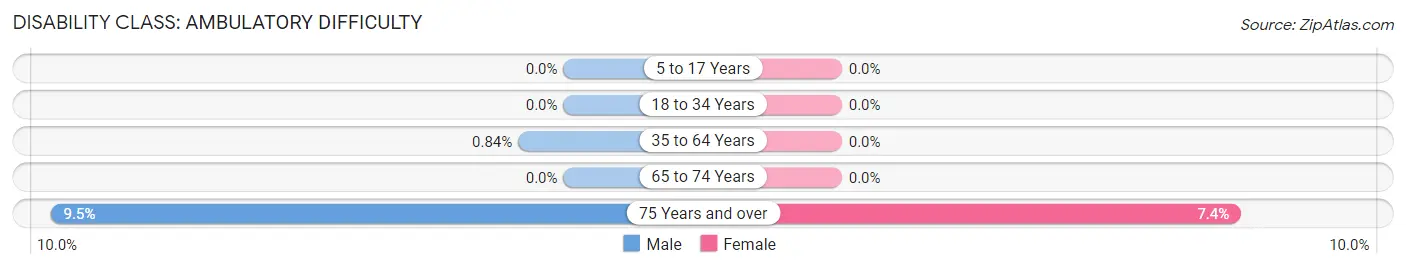
| Age Bracket | Male | Female |
| 5 to 17 Years | 0 (0.0%) | 0 (0.0%) |
| 18 to 34 Years | 0 (0.0%) | 0 (0.0%) |
| 35 to 64 Years | 1 (0.8%) | 0 (0.0%) |
| 65 to 74 Years | 0 (0.0%) | 0 (0.0%) |
| 75 Years and over | 2 (9.5%) | 2 (7.4%) |
Disability Class: Self-Care Difficulty
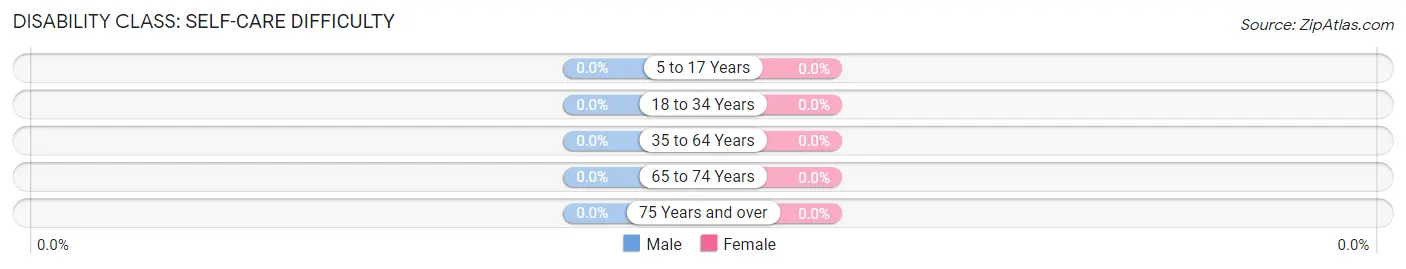
| Age Bracket | Male | Female |
| 5 to 17 Years | 0 (0.0%) | 0 (0.0%) |
| 18 to 34 Years | 0 (0.0%) | 0 (0.0%) |
| 35 to 64 Years | 0 (0.0%) | 0 (0.0%) |
| 65 to 74 Years | 0 (0.0%) | 0 (0.0%) |
| 75 Years and over | 0 (0.0%) | 0 (0.0%) |
Technology Access in Brownsboro Farm
Computing Device Access in Brownsboro Farm
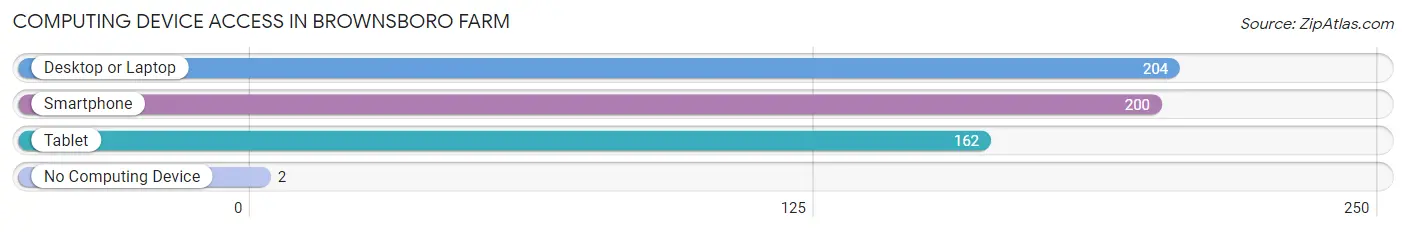
| Device Type | # Households | % Households |
| Desktop or Laptop | 204 | 96.7% |
| Smartphone | 200 | 94.8% |
| Tablet | 162 | 76.8% |
| No Computing Device | 2 | 0.9% |
| Total | 211 | 100.0% |
Internet Access in Brownsboro Farm
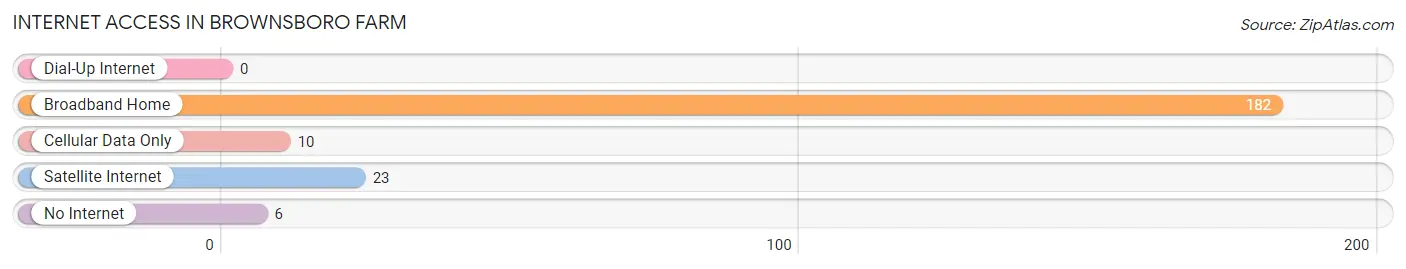
| Internet Type | # Households | % Households |
| Dial-Up Internet | 0 | 0.0% |
| Broadband Home | 182 | 86.3% |
| Cellular Data Only | 10 | 4.7% |
| Satellite Internet | 23 | 10.9% |
| No Internet | 6 | 2.8% |
| Total | 211 | 100.0% |
Brownsboro Farm Summary
Brownsboro Farm is a small unincorporated community located in the eastern part of Jefferson County, Kentucky. It is situated on the banks of the Ohio River, just north of the city of Louisville. The community is bordered by the cities of Prospect and Harrods Creek to the north, and the city of Anchorage to the south.
History
The area that is now Brownsboro Farm was first settled in the late 1700s by a group of German immigrants. The community was originally known as “Brown’s Station”, named after the first settler, John Brown. The area was primarily used for farming and the production of tobacco. In the early 1900s, the area was renamed “Brownsboro Farm”, and the community began to grow.
In the 1950s, the area began to experience rapid growth due to the development of the nearby Louisville International Airport. This led to the construction of several new homes and businesses in the area. The population of Brownsboro Farm continued to grow throughout the 1960s and 1970s, and by the 1980s, the community had become a popular suburb of Louisville.
Geography
Brownsboro Farm is located in the eastern part of Jefferson County, Kentucky. It is situated on the banks of the Ohio River, just north of the city of Louisville. The community is bordered by the cities of Prospect and Harrods Creek to the north, and the city of Anchorage to the south. The area is mostly flat, with some rolling hills in the northern part of the community. The climate is humid subtropical, with hot summers and mild winters.
Economy
The economy of Brownsboro Farm is largely based on the service industry. Many of the residents are employed in the nearby Louisville International Airport, as well as in the local retail and hospitality industries. The area is also home to several small businesses, including restaurants, shops, and professional services.
Demographics
As of the 2010 census, the population of Brownsboro Farm was 4,845. The racial makeup of the community was 87.3% White, 8.2% African American, 0.7% Asian, 0.3% Native American, and 3.5% from other races. The median household income was $63,917, and the median family income was $76,917. The per capita income was $30,917.
Conclusion
Brownsboro Farm is a small unincorporated community located in the eastern part of Jefferson County, Kentucky. It is situated on the banks of the Ohio River, just north of the city of Louisville. The community is bordered by the cities of Prospect and Harrods Creek to the north, and the city of Anchorage to the south. The area is mostly flat, with some rolling hills in the northern part of the community. The economy of Brownsboro Farm is largely based on the service industry, and the population of the community was 4,845 as of the 2010 census.
Common Questions
What is Per Capita Income in Brownsboro Farm?
Per Capita income in Brownsboro Farm is $55,211.
What is the Median Family Income in Brownsboro Farm?
Median Family Income in Brownsboro Farm is $150,179.
What is the Median Household income in Brownsboro Farm?
Median Household Income in Brownsboro Farm is $133,542.
What is Income or Wage Gap in Brownsboro Farm?
Income or Wage Gap in Brownsboro Farm is 34.7%.
Women in Brownsboro Farm earn 65.3 cents for every dollar earned by a man.
What is Inequality or Gini Index in Brownsboro Farm?
Inequality or Gini Index in Brownsboro Farm is 0.31.
What is the Total Population of Brownsboro Farm?
Total Population of Brownsboro Farm is 553.
What is the Total Male Population of Brownsboro Farm?
Total Male Population of Brownsboro Farm is 295.
What is the Total Female Population of Brownsboro Farm?
Total Female Population of Brownsboro Farm is 258.
What is the Ratio of Males per 100 Females in Brownsboro Farm?
There are 114.34 Males per 100 Females in Brownsboro Farm.
What is the Ratio of Females per 100 Males in Brownsboro Farm?
There are 87.46 Females per 100 Males in Brownsboro Farm.
What is the Median Population Age in Brownsboro Farm?
Median Population Age in Brownsboro Farm is 49.4 Years.
What is the Average Family Size in Brownsboro Farm
Average Family Size in Brownsboro Farm is 2.8 People.
What is the Average Household Size in Brownsboro Farm
Average Household Size in Brownsboro Farm is 2.6 People.
How Large is the Labor Force in Brownsboro Farm?
There are 296 People in the Labor Forcein in Brownsboro Farm.
What is the Percentage of People in the Labor Force in Brownsboro Farm?
69.0% of People are in the Labor Force in Brownsboro Farm.
What is the Unemployment Rate in Brownsboro Farm?
Unemployment Rate in Brownsboro Farm is 2.4%.