Mission, OR Map & Demographics
Mission Map
Mission Overview
$17,677
PER CAPITA INCOME
$44,375
AVG FAMILY INCOME
$41,500
AVG HOUSEHOLD INCOME
5.4%
WAGE / INCOME GAP [ % ]
94.6¢/ $1
WAGE / INCOME GAP [ $ ]
$13,745
FAMILY INCOME DEFICIT
0.50
INEQUALITY / GINI INDEX
1,024
TOTAL POPULATION
511
MALE POPULATION
513
FEMALE POPULATION
99.61
MALES / 100 FEMALES
100.39
FEMALES / 100 MALES
23.9
MEDIAN AGE
4.2
AVG FAMILY SIZE
3.7
AVG HOUSEHOLD SIZE
371
LABOR FORCE [ PEOPLE ]
48.1%
PERCENT IN LABOR FORCE
20.2%
UNEMPLOYMENT RATE
Income in Mission
Income Overview in Mission
Per Capita Income in Mission is $17,677, while median incomes of families and households are $44,375 and $41,500 respectively.
| Characteristic | Number | Measure |
| Per Capita Income | 1,024 | $17,677 |
| Median Family Income | 213 | $44,375 |
| Mean Family Income | 213 | $68,869 |
| Median Household Income | 278 | $41,500 |
| Mean Household Income | 278 | $63,236 |
| Income Deficit | 213 | $13,745 |
| Wage / Income Gap (%) | 1,024 | 5.42% |
| Wage / Income Gap ($) | 1,024 | 94.58¢ per $1 |
| Gini / Inequality Index | 1,024 | 0.50 |
Earnings by Sex in Mission
Average Earnings in Mission are $29,271, $29,605 for men and $28,000 for women, a difference of 5.4%.
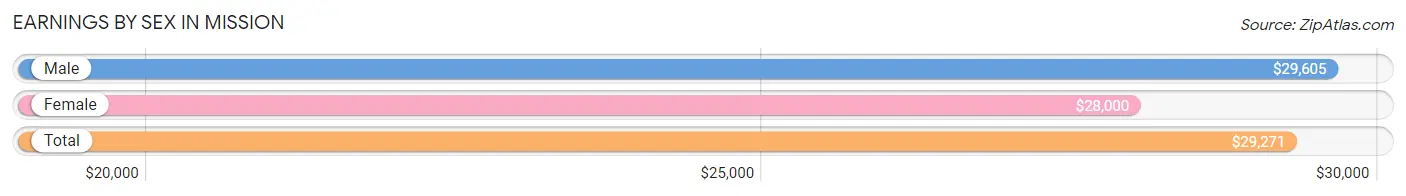
| Sex | Number | Average Earnings |
| Male | 188 (49.0%) | $29,605 |
| Female | 196 (51.0%) | $28,000 |
| Total | 384 (100.0%) | $29,271 |
Earnings by Sex by Income Bracket in Mission
The most common earnings brackets in Mission are $25,000 to $29,999 for men (29 | 15.4%) and $5,000 to $7,499 for women (23 | 11.7%).
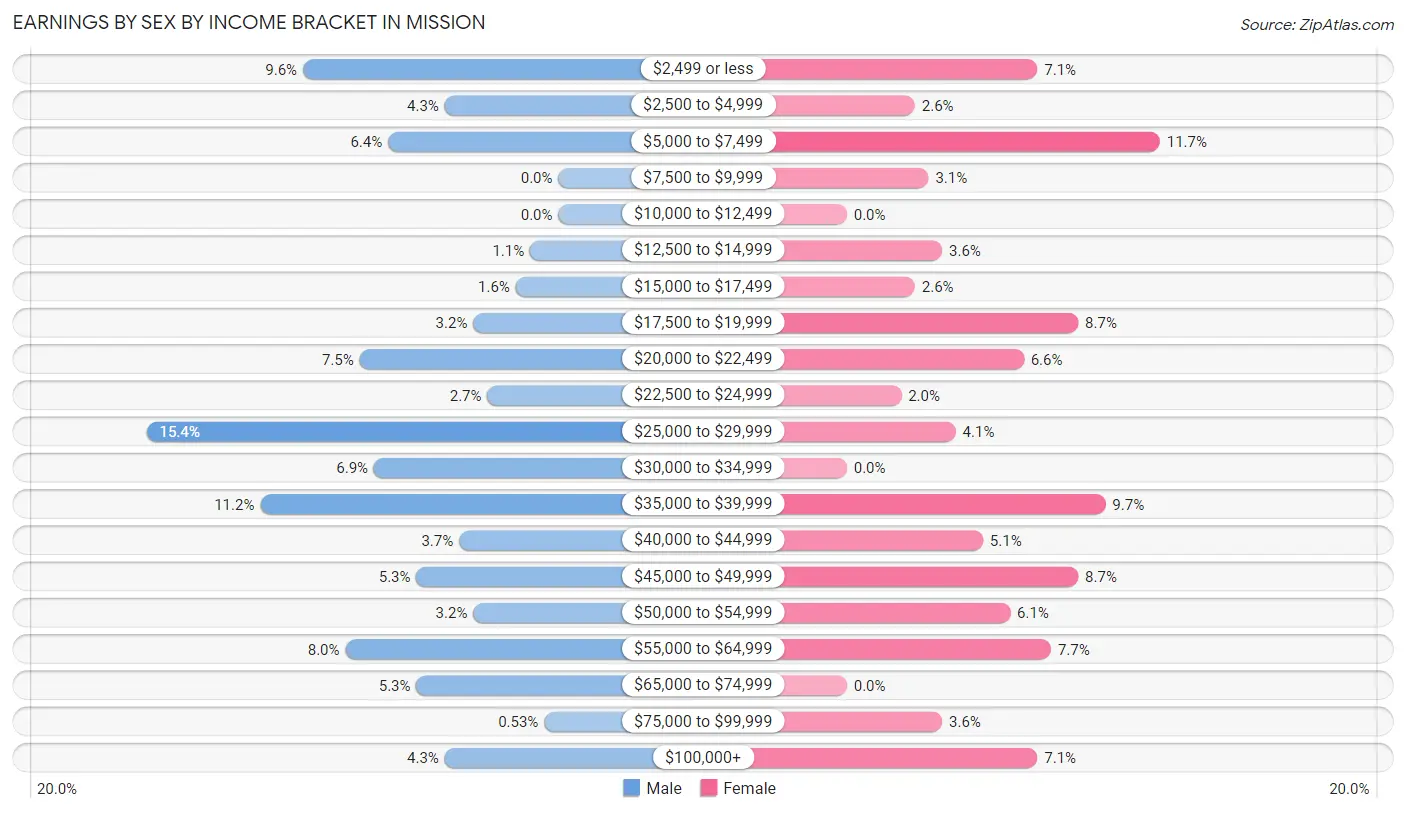
| Income | Male | Female |
| $2,499 or less | 18 (9.6%) | 14 (7.1%) |
| $2,500 to $4,999 | 8 (4.3%) | 5 (2.5%) |
| $5,000 to $7,499 | 12 (6.4%) | 23 (11.7%) |
| $7,500 to $9,999 | 0 (0.0%) | 6 (3.1%) |
| $10,000 to $12,499 | 0 (0.0%) | 0 (0.0%) |
| $12,500 to $14,999 | 2 (1.1%) | 7 (3.6%) |
| $15,000 to $17,499 | 3 (1.6%) | 5 (2.5%) |
| $17,500 to $19,999 | 6 (3.2%) | 17 (8.7%) |
| $20,000 to $22,499 | 14 (7.4%) | 13 (6.6%) |
| $22,500 to $24,999 | 5 (2.7%) | 4 (2.0%) |
| $25,000 to $29,999 | 29 (15.4%) | 8 (4.1%) |
| $30,000 to $34,999 | 13 (6.9%) | 0 (0.0%) |
| $35,000 to $39,999 | 21 (11.2%) | 19 (9.7%) |
| $40,000 to $44,999 | 7 (3.7%) | 10 (5.1%) |
| $45,000 to $49,999 | 10 (5.3%) | 17 (8.7%) |
| $50,000 to $54,999 | 6 (3.2%) | 12 (6.1%) |
| $55,000 to $64,999 | 15 (8.0%) | 15 (7.6%) |
| $65,000 to $74,999 | 10 (5.3%) | 0 (0.0%) |
| $75,000 to $99,999 | 1 (0.5%) | 7 (3.6%) |
| $100,000+ | 8 (4.3%) | 14 (7.1%) |
| Total | 188 (100.0%) | 196 (100.0%) |
Earnings by Sex by Educational Attainment in Mission
Average earnings in Mission are $35,938 for men and $36,667 for women, a difference of 2.0%. Men with an educational attainment of high school diploma enjoy the highest average annual earnings of $38,625, while those with college or associate's degree education earn the least with $29,318. Women with an educational attainment of bachelor's degree earn the most with the average annual earnings of $52,188, while those with high school diploma education have the smallest earnings of $20,156.
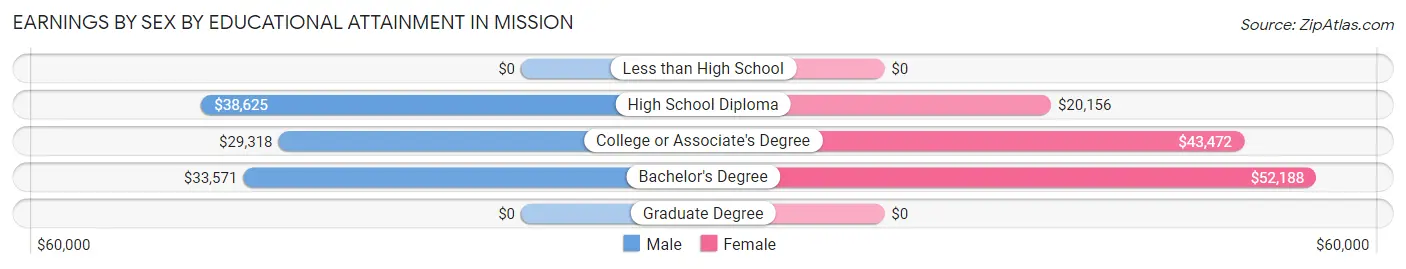
| Educational Attainment | Male Income | Female Income |
| Less than High School | - | - |
| High School Diploma | $38,625 | $20,156 |
| College or Associate's Degree | $29,318 | $43,472 |
| Bachelor's Degree | $33,571 | $52,188 |
| Graduate Degree | - | - |
| Total | $35,938 | $36,667 |
Family Income in Mission
Family Income Brackets in Mission
According to the Mission family income data, there are 41 families falling into the $35,000 to $49,999 income range, which is the most common income bracket and makes up 19.3% of all families. Conversely, the $10,000 to $14,999 income bracket is the least frequent group with only 3 families (1.4%) belonging to this category.
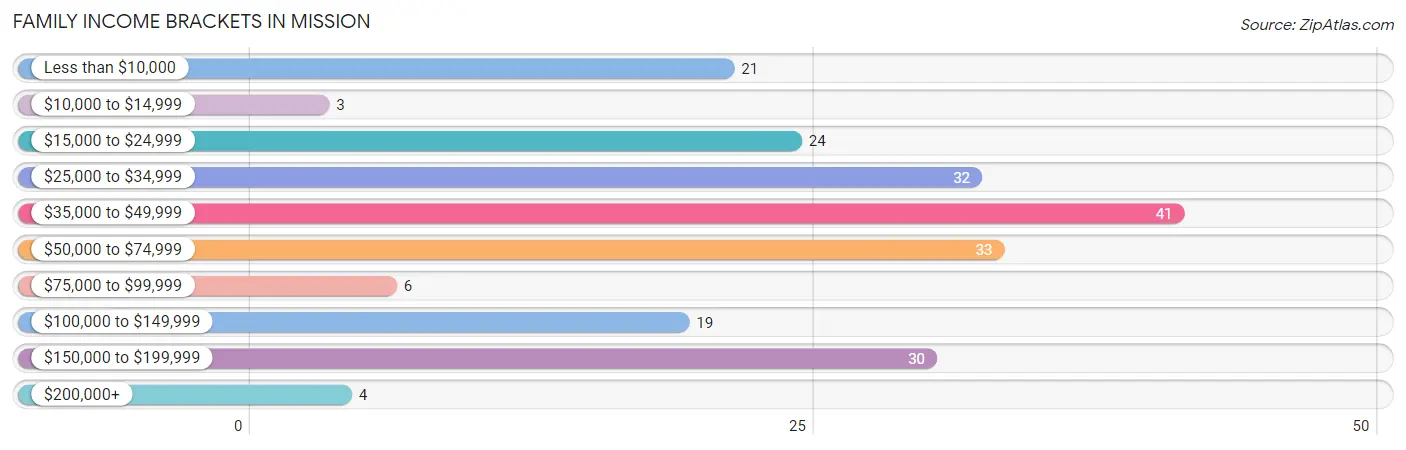
| Income Bracket | # Families | % Families |
| Less than $10,000 | 21 | 9.9% |
| $10,000 to $14,999 | 3 | 1.4% |
| $15,000 to $24,999 | 24 | 11.3% |
| $25,000 to $34,999 | 32 | 15.0% |
| $35,000 to $49,999 | 41 | 19.2% |
| $50,000 to $74,999 | 33 | 15.5% |
| $75,000 to $99,999 | 6 | 2.8% |
| $100,000 to $149,999 | 19 | 8.9% |
| $150,000 to $199,999 | 30 | 14.1% |
| $200,000+ | 4 | 1.9% |
Family Income by Famaliy Size in Mission
4-person families (28 | 13.2%) account for the highest median family income in Mission with $61,250 per family, while 2-person families (67 | 31.5%) have the highest median income of $16,875 per family member.
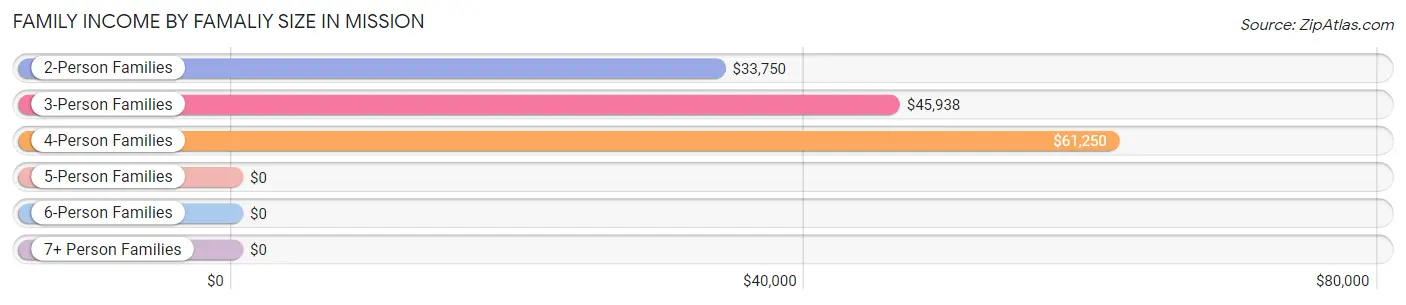
| Income Bracket | # Families | Median Income |
| 2-Person Families | 67 (31.5%) | $33,750 |
| 3-Person Families | 75 (35.2%) | $45,938 |
| 4-Person Families | 28 (13.2%) | $61,250 |
| 5-Person Families | 25 (11.7%) | $0 |
| 6-Person Families | 10 (4.7%) | $0 |
| 7+ Person Families | 8 (3.8%) | $0 |
| Total | 213 (100.0%) | $44,375 |
Family Income by Number of Earners in Mission
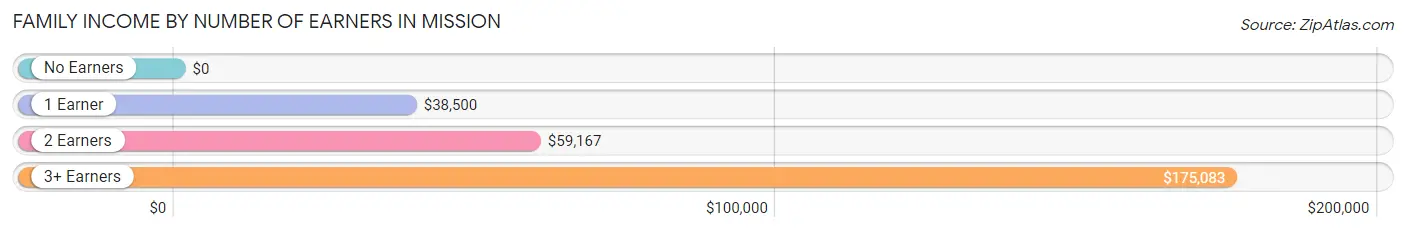
| Number of Earners | # Families | Median Income |
| No Earners | 38 (17.8%) | $0 |
| 1 Earner | 98 (46.0%) | $38,500 |
| 2 Earners | 40 (18.8%) | $59,167 |
| 3+ Earners | 37 (17.4%) | $175,083 |
| Total | 213 (100.0%) | $44,375 |
Household Income in Mission
Household Income Brackets in Mission
With 41 households falling in the category, the $35,000 to $49,999 income range is the most frequent in Mission, accounting for 14.7% of all households. In contrast, only 6 households (2.2%) fall into the $200,000+ income bracket, making it the least populous group.
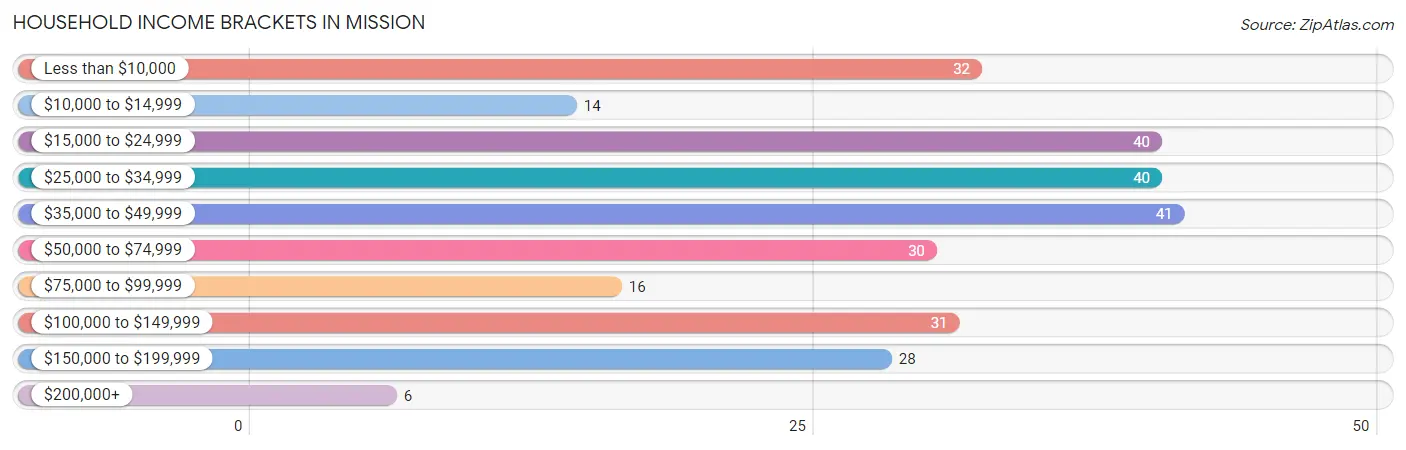
| Income Bracket | # Households | % Households |
| Less than $10,000 | 32 | 11.5% |
| $10,000 to $14,999 | 14 | 5.0% |
| $15,000 to $24,999 | 40 | 14.4% |
| $25,000 to $34,999 | 40 | 14.4% |
| $35,000 to $49,999 | 41 | 14.7% |
| $50,000 to $74,999 | 30 | 10.8% |
| $75,000 to $99,999 | 16 | 5.8% |
| $100,000 to $149,999 | 31 | 11.2% |
| $150,000 to $199,999 | 28 | 10.1% |
| $200,000+ | 6 | 2.2% |
Household Income by Householder Age in Mission
The median household income in Mission is $41,500, with the highest median household income of $45,625 found in the 45 to 64 years age bracket for the primary householder. A total of 109 households (39.2%) fall into this category. Meanwhile, the 15 to 24 years age bracket for the primary householder has the lowest median household income of $0, with 6 households (2.2%) in this group.
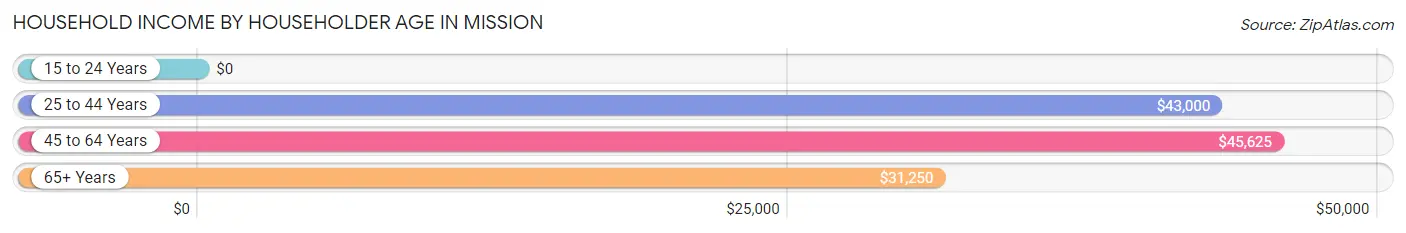
| Income Bracket | # Households | Median Income |
| 15 to 24 Years | 6 (2.2%) | $0 |
| 25 to 44 Years | 112 (40.3%) | $43,000 |
| 45 to 64 Years | 109 (39.2%) | $45,625 |
| 65+ Years | 51 (18.3%) | $31,250 |
| Total | 278 (100.0%) | $41,500 |
Poverty in Mission
Income Below Poverty by Sex and Age in Mission
With 43.1% poverty level for males and 25.9% for females among the residents of Mission, 6 to 11 year old males and 12 to 14 year old females are the most vulnerable to poverty, with 29 males (80.6%) and 6 females (66.7%) in their respective age groups living below the poverty level.
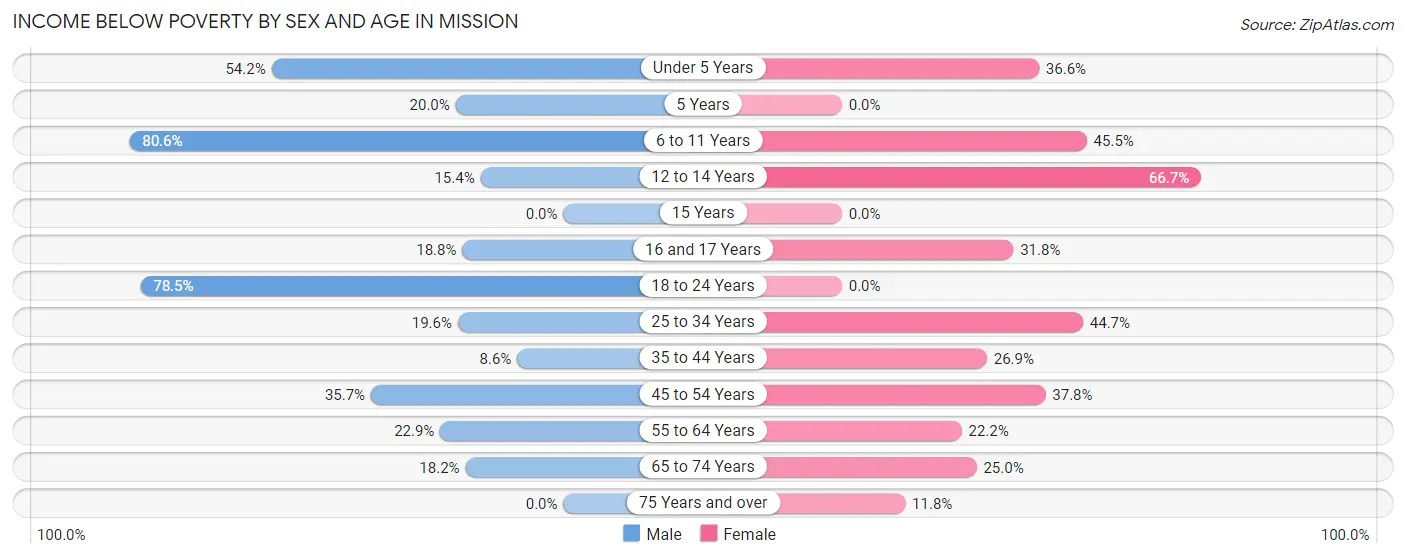
| Age Bracket | Male | Female |
| Under 5 Years | 26 (54.2%) | 15 (36.6%) |
| 5 Years | 3 (20.0%) | 0 (0.0%) |
| 6 to 11 Years | 29 (80.6%) | 20 (45.5%) |
| 12 to 14 Years | 4 (15.4%) | 6 (66.7%) |
| 15 Years | 0 (0.0%) | 0 (0.0%) |
| 16 and 17 Years | 3 (18.8%) | 7 (31.8%) |
| 18 to 24 Years | 106 (78.5%) | 0 (0.0%) |
| 25 to 34 Years | 19 (19.6%) | 34 (44.7%) |
| 35 to 44 Years | 3 (8.6%) | 14 (26.9%) |
| 45 to 54 Years | 15 (35.7%) | 17 (37.8%) |
| 55 to 64 Years | 8 (22.9%) | 10 (22.2%) |
| 65 to 74 Years | 4 (18.2%) | 7 (25.0%) |
| 75 Years and over | 0 (0.0%) | 2 (11.8%) |
| Total | 220 (43.1%) | 132 (25.9%) |
Income Above Poverty by Sex and Age in Mission
According to the poverty statistics in Mission, males aged 75 years and over and females aged 5 years are the age groups that are most secure financially, with 100.0% of males and 100.0% of females in these age groups living above the poverty line.
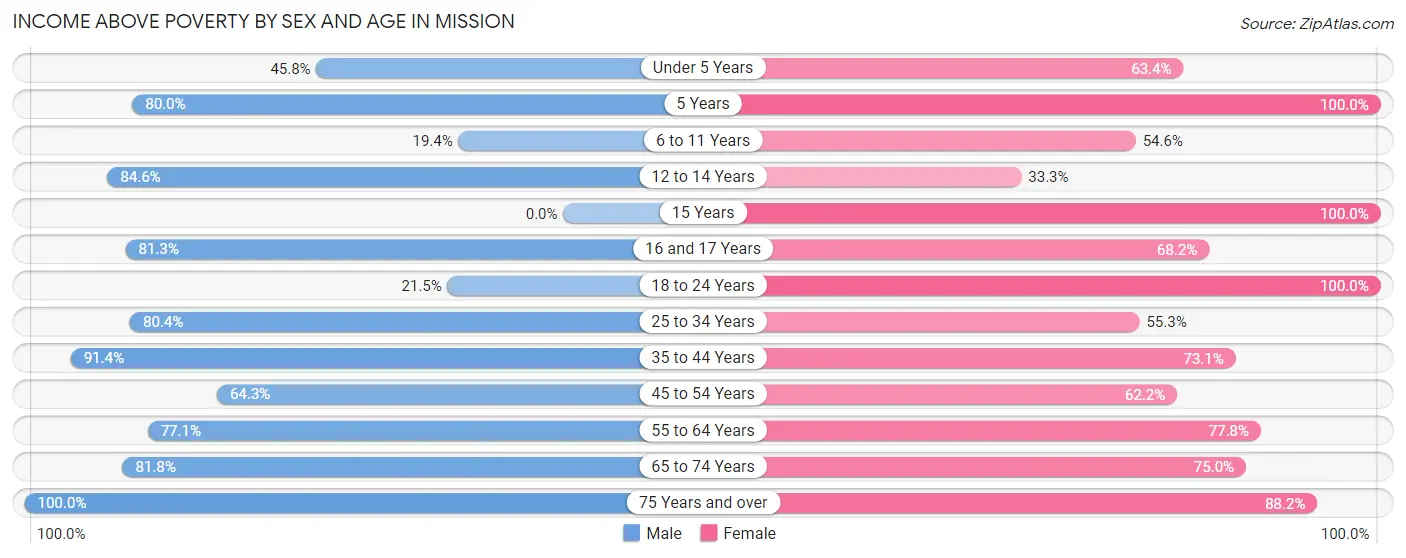
| Age Bracket | Male | Female |
| Under 5 Years | 22 (45.8%) | 26 (63.4%) |
| 5 Years | 12 (80.0%) | 6 (100.0%) |
| 6 to 11 Years | 7 (19.4%) | 24 (54.5%) |
| 12 to 14 Years | 22 (84.6%) | 3 (33.3%) |
| 15 Years | 0 (0.0%) | 23 (100.0%) |
| 16 and 17 Years | 13 (81.2%) | 15 (68.2%) |
| 18 to 24 Years | 29 (21.5%) | 102 (100.0%) |
| 25 to 34 Years | 78 (80.4%) | 42 (55.3%) |
| 35 to 44 Years | 32 (91.4%) | 38 (73.1%) |
| 45 to 54 Years | 27 (64.3%) | 28 (62.2%) |
| 55 to 64 Years | 27 (77.1%) | 35 (77.8%) |
| 65 to 74 Years | 18 (81.8%) | 21 (75.0%) |
| 75 Years and over | 3 (100.0%) | 15 (88.2%) |
| Total | 290 (56.9%) | 378 (74.1%) |
Income Below Poverty Among Married-Couple Families in Mission
The poverty statistics for married-couple families in Mission show that 22.2% or 16 of the total 72 families live below the poverty line. Families with 3 or 4 children have the highest poverty rate of 100.0%, comprising of 6 families. On the other hand, families with no children have the lowest poverty rate of 8.6%, which includes 3 families.
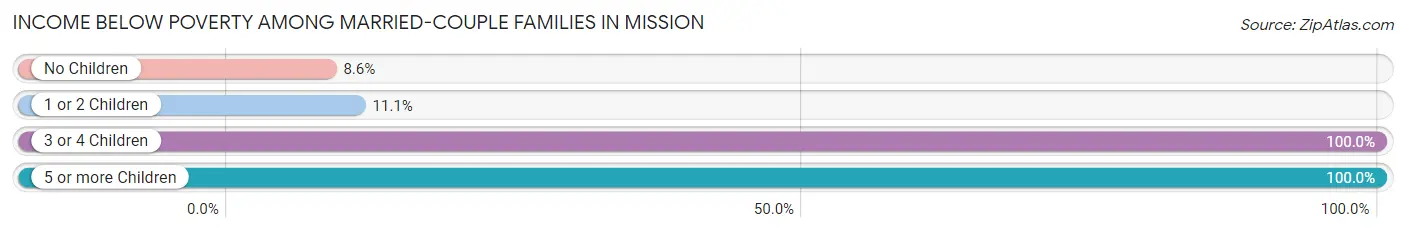
| Children | Above Poverty | Below Poverty |
| No Children | 32 (91.4%) | 3 (8.6%) |
| 1 or 2 Children | 24 (88.9%) | 3 (11.1%) |
| 3 or 4 Children | 0 (0.0%) | 6 (100.0%) |
| 5 or more Children | 0 (0.0%) | 4 (100.0%) |
| Total | 56 (77.8%) | 16 (22.2%) |
Income Below Poverty Among Single-Parent Households in Mission
According to the poverty data in Mission, 21.2% or 7 single-father households and 22.2% or 24 single-mother households are living below the poverty line. Among single-father households, those with 3 or 4 children have the highest poverty rate, with 2 households (40.0%) experiencing poverty. Likewise, among single-mother households, those with 5 or more children have the highest poverty rate, with 4 households (100.0%) falling below the poverty line.
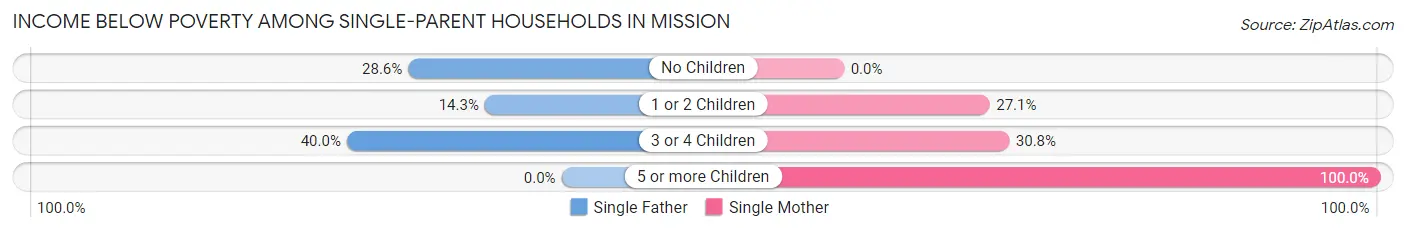
| Children | Single Father | Single Mother |
| No Children | 2 (28.6%) | 0 (0.0%) |
| 1 or 2 Children | 3 (14.3%) | 16 (27.1%) |
| 3 or 4 Children | 2 (40.0%) | 4 (30.8%) |
| 5 or more Children | 0 (0.0%) | 4 (100.0%) |
| Total | 7 (21.2%) | 24 (22.2%) |
Income Below Poverty Among Married-Couple vs Single-Parent Households in Mission
The poverty data for Mission shows that 16 of the married-couple family households (22.2%) and 31 of the single-parent households (22.0%) are living below the poverty level. Within the married-couple family households, those with 3 or 4 children have the highest poverty rate, with 6 households (100.0%) falling below the poverty line. Among the single-parent households, those with 5 or more children have the highest poverty rate, with 4 household (100.0%) living below poverty.
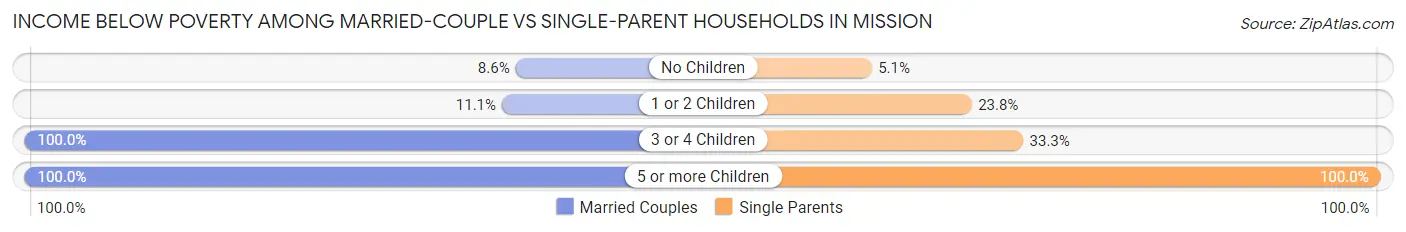
| Children | Married-Couple Families | Single-Parent Households |
| No Children | 3 (8.6%) | 2 (5.1%) |
| 1 or 2 Children | 3 (11.1%) | 19 (23.7%) |
| 3 or 4 Children | 6 (100.0%) | 6 (33.3%) |
| 5 or more Children | 4 (100.0%) | 4 (100.0%) |
| Total | 16 (22.2%) | 31 (22.0%) |
Race in Mission
The most populous races in Mission are Native / Alaskan (814 | 79.5%), White / Caucasian (119 | 11.6%), and Hispanic or Latino (94 | 9.2%).
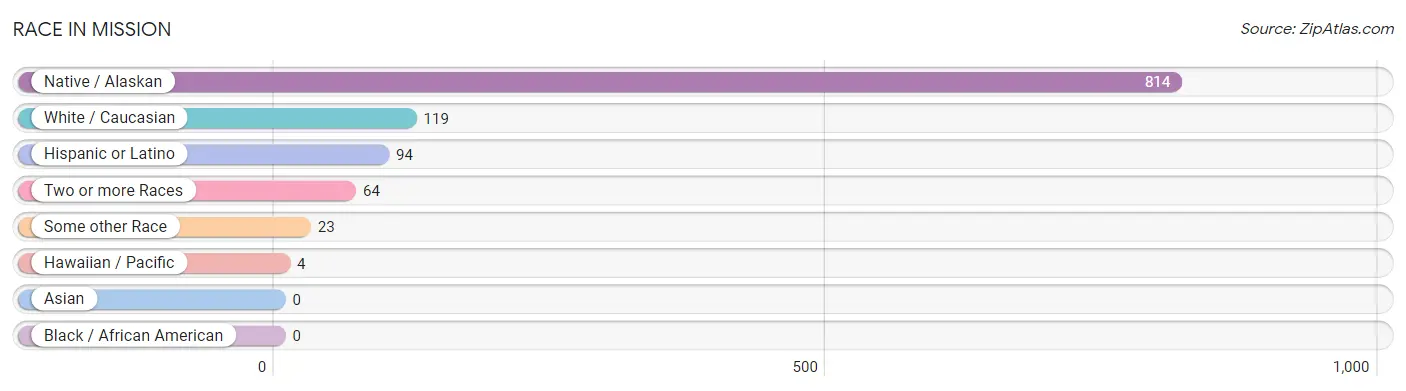
| Race | # Population | % Population |
| Asian | 0 | 0.0% |
| Black / African American | 0 | 0.0% |
| Hawaiian / Pacific | 4 | 0.4% |
| Hispanic or Latino | 94 | 9.2% |
| Native / Alaskan | 814 | 79.5% |
| White / Caucasian | 119 | 11.6% |
| Two or more Races | 64 | 6.2% |
| Some other Race | 23 | 2.2% |
| Total | 1,024 | 100.0% |
Ancestry in Mission
The most populous ancestries reported in Mission are Mexican (73 | 7.1%), German (37 | 3.6%), Irish (32 | 3.1%), Yakama (32 | 3.1%), and Sioux (31 | 3.0%), together accounting for 20.0% of all Mission residents.
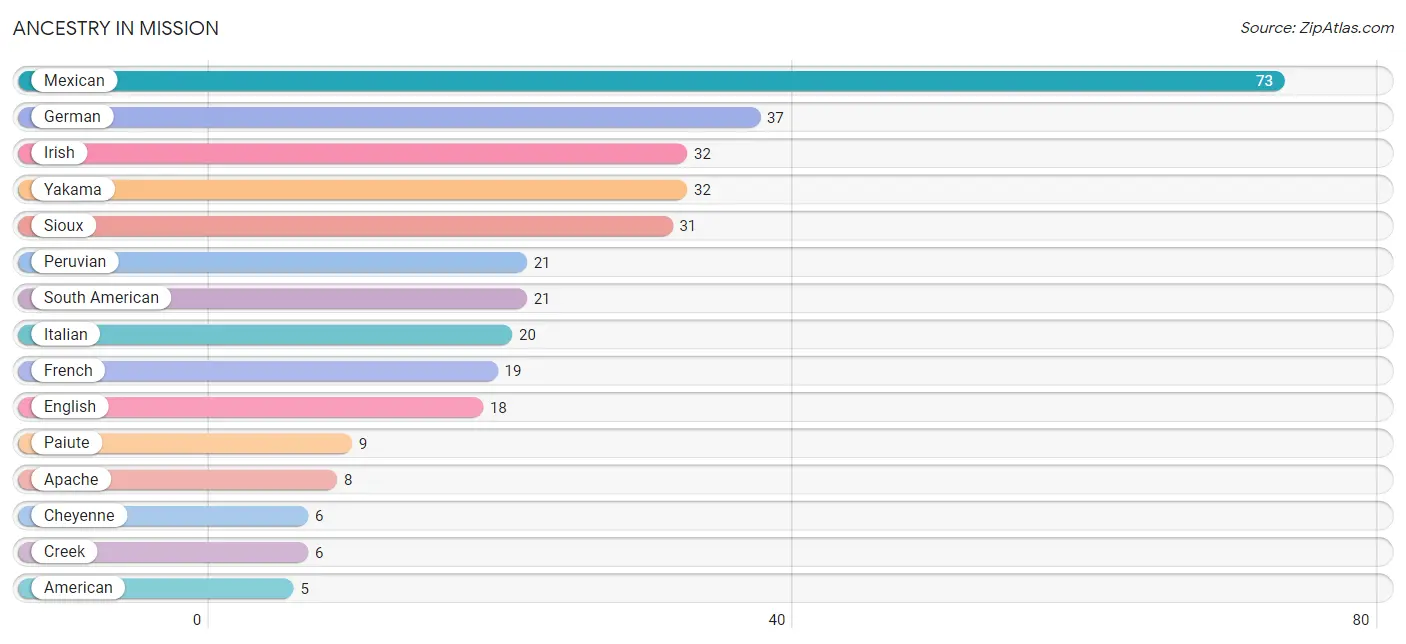
| Ancestry | # Population | % Population |
| American | 5 | 0.5% |
| Apache | 8 | 0.8% |
| Cheyenne | 6 | 0.6% |
| Chippewa | 5 | 0.5% |
| Colville | 5 | 0.5% |
| Creek | 6 | 0.6% |
| Crow | 3 | 0.3% |
| Delaware | 2 | 0.2% |
| English | 18 | 1.8% |
| European | 1 | 0.1% |
| French | 19 | 1.9% |
| French American Indian | 2 | 0.2% |
| German | 37 | 3.6% |
| Guamanian / Chamorro | 5 | 0.5% |
| Inupiat | 1 | 0.1% |
| Irish | 32 | 3.1% |
| Italian | 20 | 1.9% |
| Kiowa | 4 | 0.4% |
| Marshallese | 1 | 0.1% |
| Mexican | 73 | 7.1% |
| Norwegian | 4 | 0.4% |
| Paiute | 9 | 0.9% |
| Peruvian | 21 | 2.1% |
| Scotch-Irish | 3 | 0.3% |
| Scottish | 4 | 0.4% |
| Shoshone | 5 | 0.5% |
| Sioux | 31 | 3.0% |
| South American | 21 | 2.1% |
| Yakama | 32 | 3.1% | View All 29 Rows |
Immigrants in Mission

| Immigration Origin | # Population | % Population | View All 0 Rows |
Sex and Age in Mission
Sex and Age in Mission
The most populous age groups in Mission are 20 to 24 Years (124 | 24.3%) for men and 20 to 24 Years (82 | 16.0%) for women.
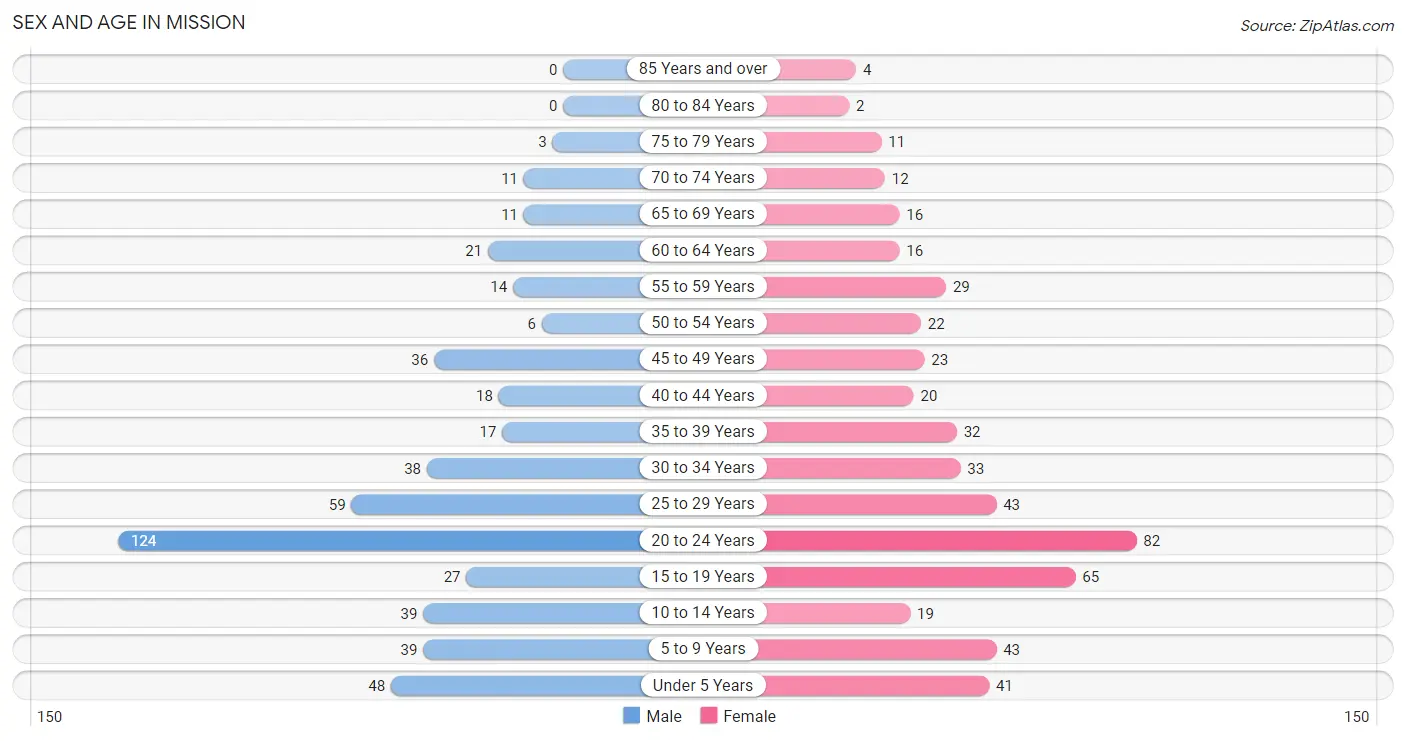
| Age Bracket | Male | Female |
| Under 5 Years | 48 (9.4%) | 41 (8.0%) |
| 5 to 9 Years | 39 (7.6%) | 43 (8.4%) |
| 10 to 14 Years | 39 (7.6%) | 19 (3.7%) |
| 15 to 19 Years | 27 (5.3%) | 65 (12.7%) |
| 20 to 24 Years | 124 (24.3%) | 82 (16.0%) |
| 25 to 29 Years | 59 (11.6%) | 43 (8.4%) |
| 30 to 34 Years | 38 (7.4%) | 33 (6.4%) |
| 35 to 39 Years | 17 (3.3%) | 32 (6.2%) |
| 40 to 44 Years | 18 (3.5%) | 20 (3.9%) |
| 45 to 49 Years | 36 (7.0%) | 23 (4.5%) |
| 50 to 54 Years | 6 (1.2%) | 22 (4.3%) |
| 55 to 59 Years | 14 (2.7%) | 29 (5.7%) |
| 60 to 64 Years | 21 (4.1%) | 16 (3.1%) |
| 65 to 69 Years | 11 (2.1%) | 16 (3.1%) |
| 70 to 74 Years | 11 (2.1%) | 12 (2.3%) |
| 75 to 79 Years | 3 (0.6%) | 11 (2.1%) |
| 80 to 84 Years | 0 (0.0%) | 2 (0.4%) |
| 85 Years and over | 0 (0.0%) | 4 (0.8%) |
| Total | 511 (100.0%) | 513 (100.0%) |
Families and Households in Mission
Median Family Size in Mission
The median family size in Mission is 4.22 persons per family, with single male/father families (33 | 15.5%) accounting for the largest median family size of 7.06 persons per family. On the other hand, single female/mother families (108 | 50.7%) represent the smallest median family size with 3.31 persons per family.
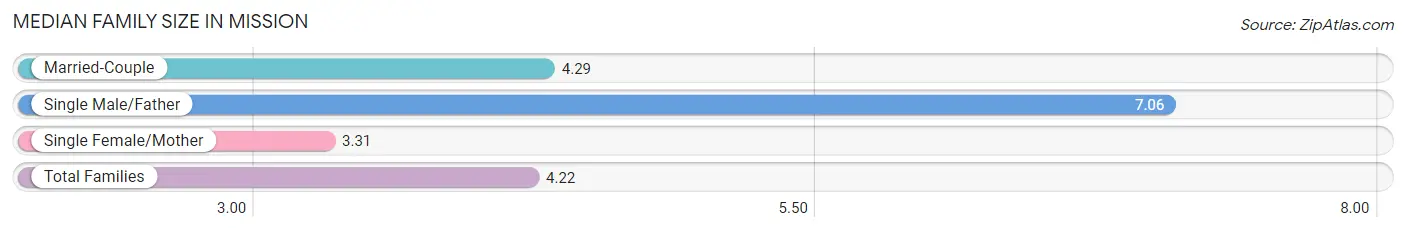
| Family Type | # Families | Family Size |
| Married-Couple | 72 (33.8%) | 4.29 |
| Single Male/Father | 33 (15.5%) | 7.06 |
| Single Female/Mother | 108 (50.7%) | 3.31 |
| Total Families | 213 (100.0%) | 4.22 |
Median Household Size in Mission
The median household size in Mission is 3.68 persons per household, with single male/father households (33 | 11.9%) accounting for the largest median household size of 7.39 persons per household. non-family households (65 | 23.4%) represent the smallest median household size with 1.18 persons per household.

| Household Type | # Households | Household Size |
| Married-Couple | 72 (25.9%) | 4.29 |
| Single Male/Father | 33 (11.9%) | 7.39 |
| Single Female/Mother | 108 (38.9%) | 3.65 |
| Non-family | 65 (23.4%) | 1.18 |
| Total Households | 278 (100.0%) | 3.68 |
Household Size by Marriage Status in Mission
Out of a total of 278 households in Mission, 213 (76.6%) are family households, while 65 (23.4%) are nonfamily households. The most numerous type of family households are 3-person households, comprising 71, and the most common type of nonfamily households are 1-person households, comprising 55.
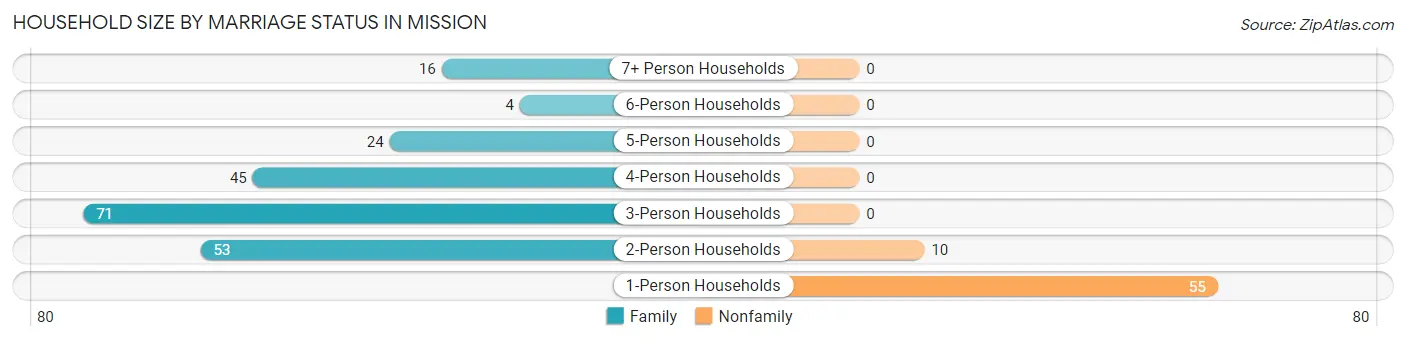
| Household Size | Family Households | Nonfamily Households |
| 1-Person Households | - | 55 (19.8%) |
| 2-Person Households | 53 (19.1%) | 10 (3.6%) |
| 3-Person Households | 71 (25.5%) | 0 (0.0%) |
| 4-Person Households | 45 (16.2%) | 0 (0.0%) |
| 5-Person Households | 24 (8.6%) | 0 (0.0%) |
| 6-Person Households | 4 (1.4%) | 0 (0.0%) |
| 7+ Person Households | 16 (5.8%) | 0 (0.0%) |
| Total | 213 (76.6%) | 65 (23.4%) |
Female Fertility in Mission
Fertility by Age in Mission
Average fertility rate in Mission is 74.0 births per 1,000 women. Women in the age bracket of 20 to 34 years have the highest fertility rate with 89.0 births per 1,000 women. Women in the age bracket of 20 to 34 years acount for 63.6% of all women with births.
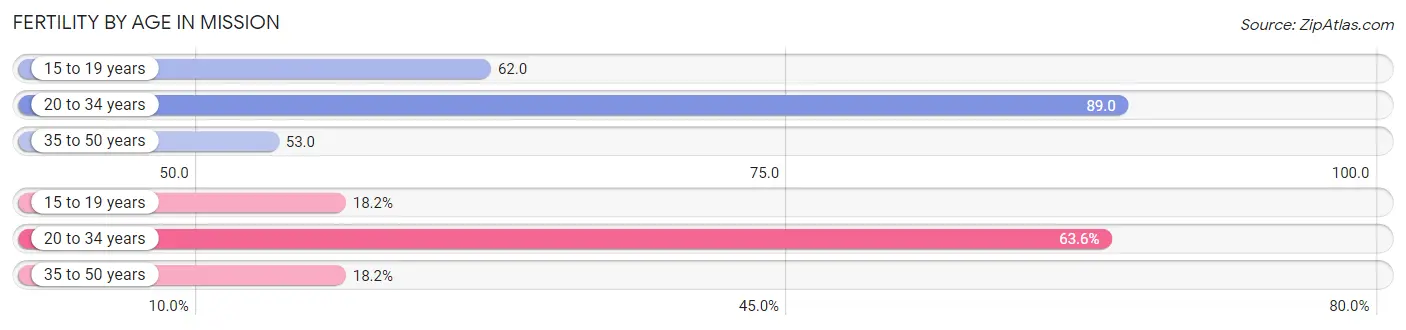
| Age Bracket | Women with Births | Births / 1,000 Women |
| 15 to 19 years | 4 (18.2%) | 62.0 |
| 20 to 34 years | 14 (63.6%) | 89.0 |
| 35 to 50 years | 4 (18.2%) | 53.0 |
| Total | 22 (100.0%) | 74.0 |
Fertility by Age by Marriage Status in Mission
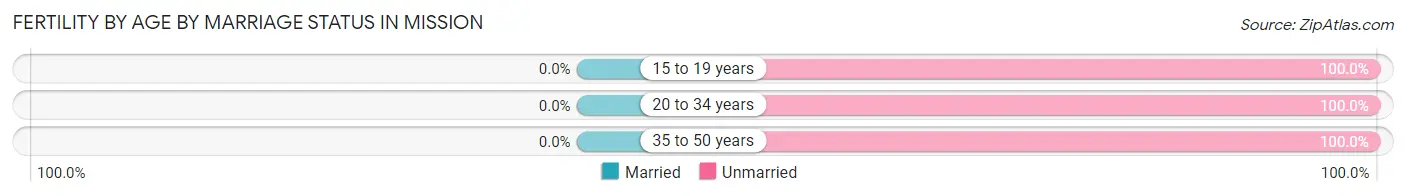
| Age Bracket | Married | Unmarried |
| 15 to 19 years | 0 (0.0%) | 4 (100.0%) |
| 20 to 34 years | 0 (0.0%) | 14 (100.0%) |
| 35 to 50 years | 0 (0.0%) | 4 (100.0%) |
| Total | 0 (0.0%) | 22 (100.0%) |
Fertility by Education in Mission
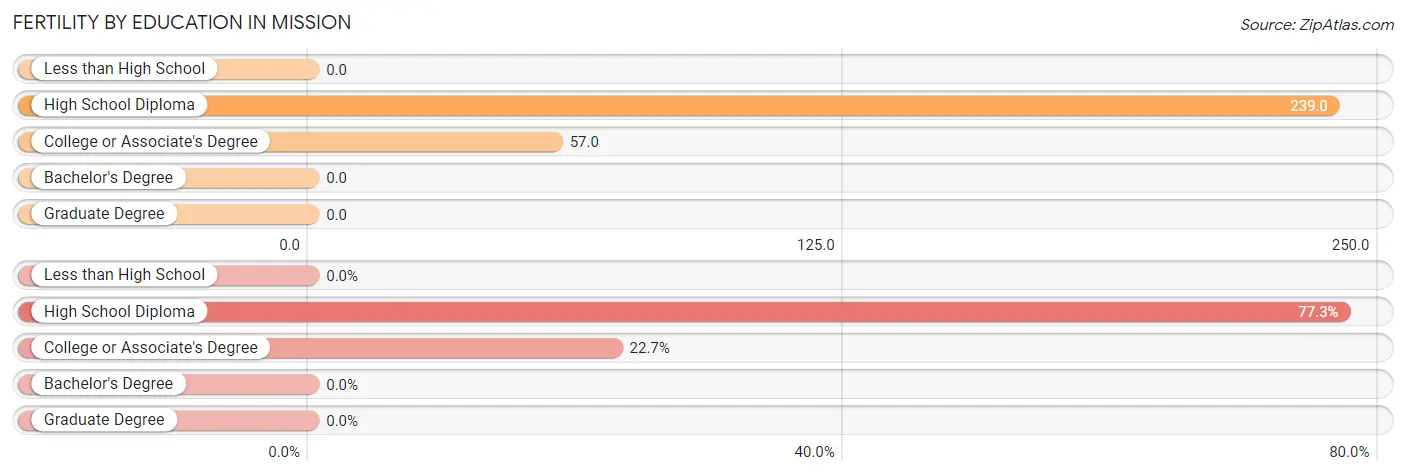
| Educational Attainment | Women with Births | Births / 1,000 Women |
| Less than High School | 0 (0.0%) | 0.0 |
| High School Diploma | 17 (77.3%) | 239.0 |
| College or Associate's Degree | 5 (22.7%) | 57.0 |
| Bachelor's Degree | 0 (0.0%) | 0.0 |
| Graduate Degree | 0 (0.0%) | 0.0 |
| Total | 22 (100.0%) | 74.0 |
Fertility by Education by Marriage Status in Mission
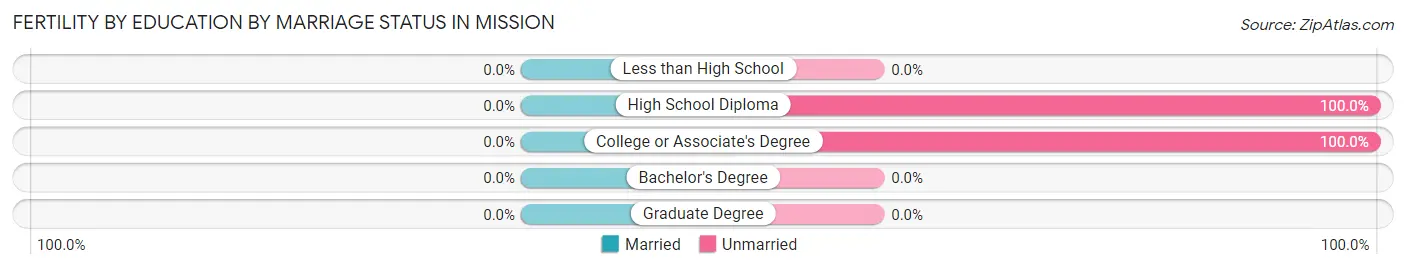
| Educational Attainment | Married | Unmarried |
| Less than High School | 0 (0.0%) | 0 (0.0%) |
| High School Diploma | 0 (0.0%) | 17 (100.0%) |
| College or Associate's Degree | 0 (0.0%) | 5 (100.0%) |
| Bachelor's Degree | 0 (0.0%) | 0 (0.0%) |
| Graduate Degree | 0 (0.0%) | 0 (0.0%) |
| Total | 0 (0.0%) | 22 (100.0%) |
Employment Characteristics in Mission
Employment by Class of Employer in Mission
Among the 292 employed individuals in Mission, private company employees (119 | 40.7%), local government employees (55 | 18.8%), and federal government employees (55 | 18.8%) make up the most common classes of employment.
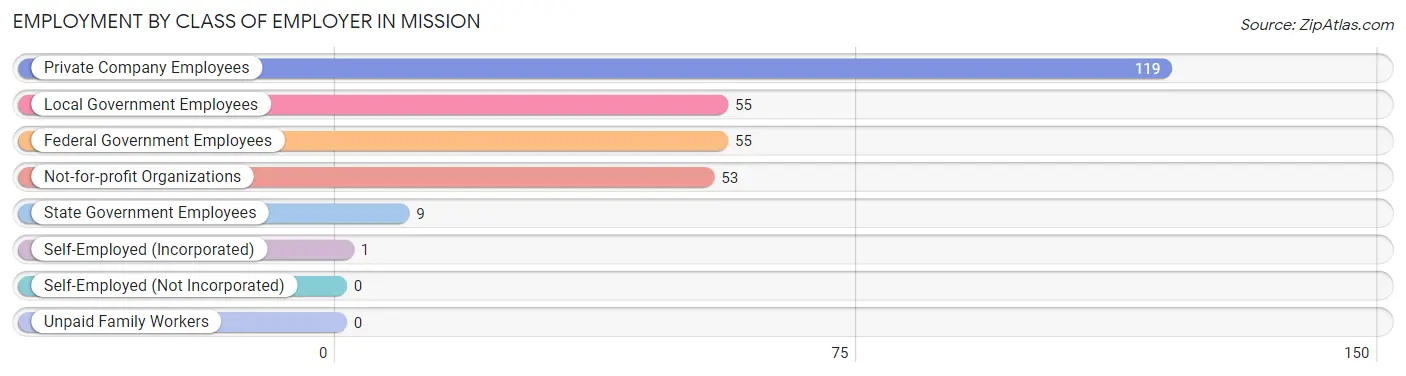
| Employer Class | # Employees | % Employees |
| Private Company Employees | 119 | 40.7% |
| Self-Employed (Incorporated) | 1 | 0.3% |
| Self-Employed (Not Incorporated) | 0 | 0.0% |
| Not-for-profit Organizations | 53 | 18.1% |
| Local Government Employees | 55 | 18.8% |
| State Government Employees | 9 | 3.1% |
| Federal Government Employees | 55 | 18.8% |
| Unpaid Family Workers | 0 | 0.0% |
| Total | 292 | 100.0% |
Employment Status by Age in Mission
According to the labor force statistics for Mission, out of the total population over 16 years of age (772), 48.1% or 371 individuals are in the labor force, with 20.2% or 75 of them unemployed. The age group with the highest labor force participation rate is 25 to 29 years, with 85.3% or 87 individuals in the labor force. Within the labor force, the 45 to 54 years age range has the highest percentage of unemployed individuals, with 45.0% or 27 of them being unemployed.
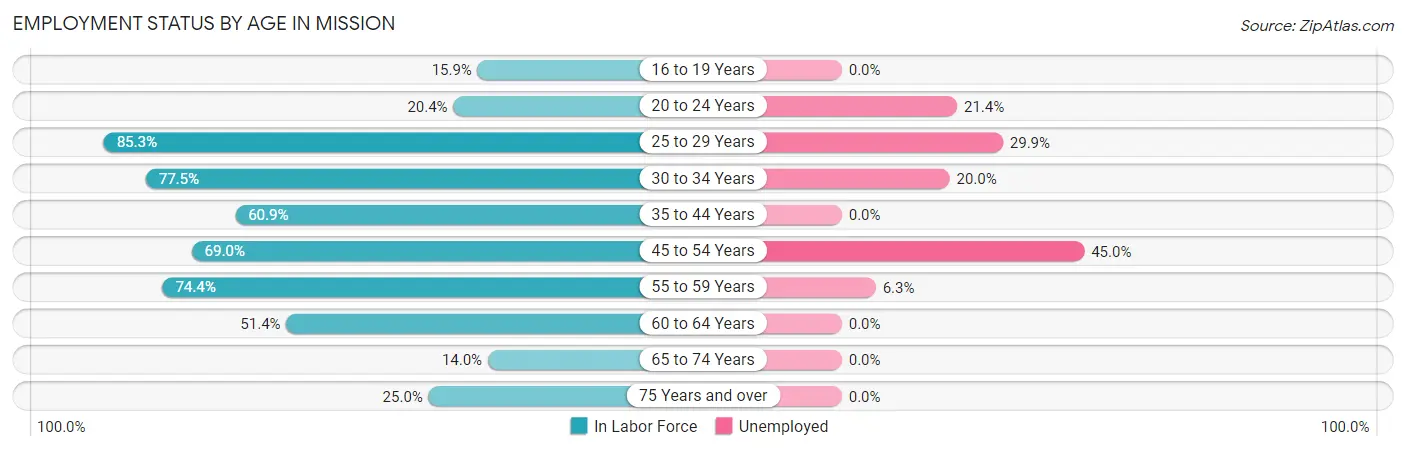
| Age Bracket | In Labor Force | Unemployed |
| 16 to 19 Years | 11 (15.9%) | 0 (0.0%) |
| 20 to 24 Years | 42 (20.4%) | 9 (21.4%) |
| 25 to 29 Years | 87 (85.3%) | 26 (29.9%) |
| 30 to 34 Years | 55 (77.5%) | 11 (20.0%) |
| 35 to 44 Years | 53 (60.9%) | 0 (0.0%) |
| 45 to 54 Years | 60 (69.0%) | 27 (45.0%) |
| 55 to 59 Years | 32 (74.4%) | 2 (6.3%) |
| 60 to 64 Years | 19 (51.4%) | 0 (0.0%) |
| 65 to 74 Years | 7 (14.0%) | 0 (0.0%) |
| 75 Years and over | 5 (25.0%) | 0 (0.0%) |
| Total | 371 (48.1%) | 75 (20.2%) |
Employment Status by Educational Attainment in Mission
According to labor force statistics for Mission, 71.7% of individuals (306) out of the total population between 25 and 64 years of age (427) are in the labor force, with 21.6% or 66 of them being unemployed. The group with the highest labor force participation rate are those with the educational attainment of bachelor's degree or higher, with 80.7% or 46 individuals in the labor force. Within the labor force, individuals with bachelor's degree or higher education have the highest percentage of unemployment, with 41.3% or 19 of them being unemployed.
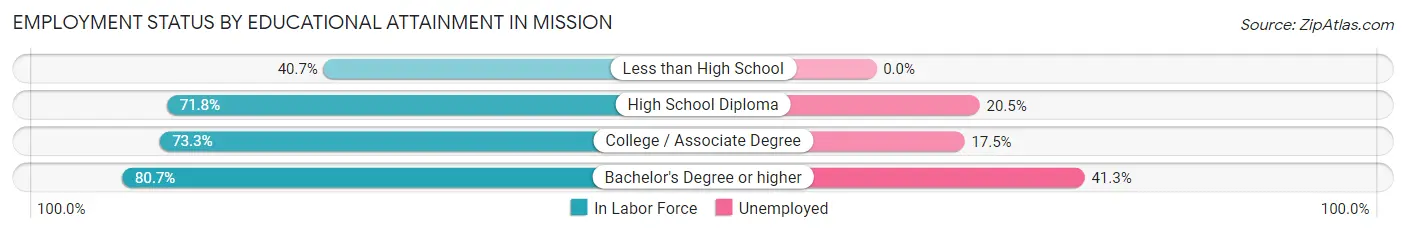
| Educational Attainment | In Labor Force | Unemployed |
| Less than High School | 11 (40.7%) | 0 (0.0%) |
| High School Diploma | 112 (71.8%) | 32 (20.5%) |
| College / Associate Degree | 137 (73.3%) | 33 (17.5%) |
| Bachelor's Degree or higher | 46 (80.7%) | 24 (41.3%) |
| Total | 306 (71.7%) | 92 (21.6%) |
Employment Occupations by Sex in Mission
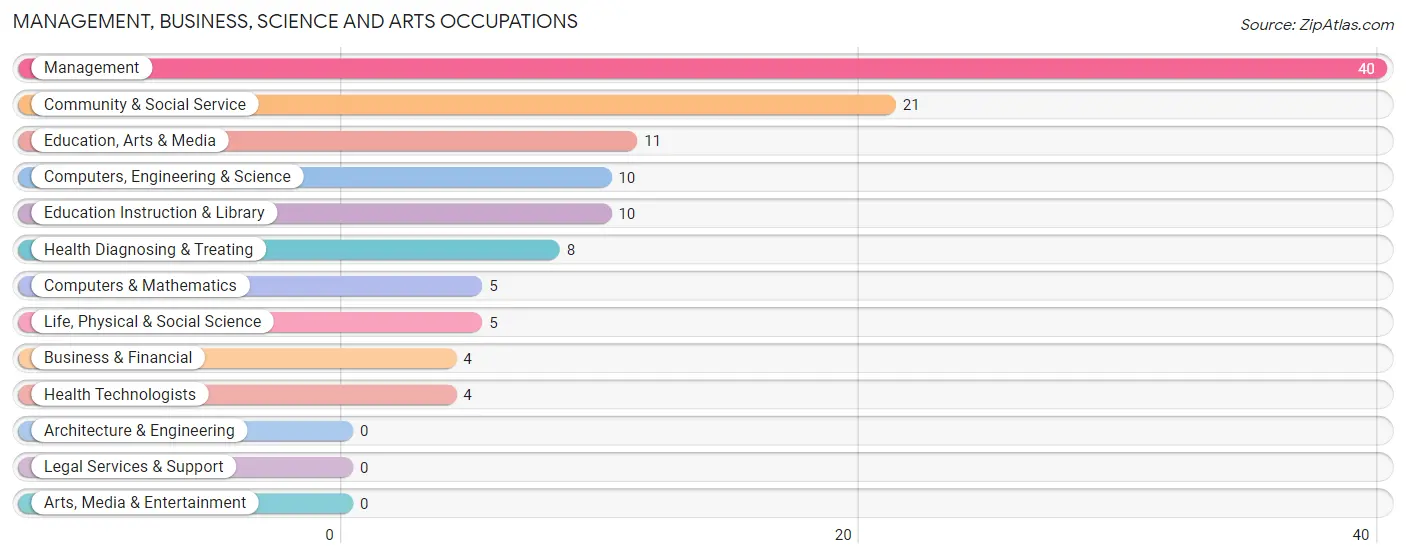
Management, Business, Science and Arts Occupations
The most common Management, Business, Science and Arts occupations in Mission are Management (40 | 13.5%), Community & Social Service (21 | 7.1%), Education, Arts & Media (11 | 3.7%), Computers, Engineering & Science (10 | 3.4%), and Education Instruction & Library (10 | 3.4%).
Management, Business, Science and Arts Occupations by Sex
Within the Management, Business, Science and Arts occupations in Mission, the most male-oriented occupations are Computers, Engineering & Science (100.0%), Computers & Mathematics (100.0%), and Life, Physical & Social Science (100.0%), while the most female-oriented occupations are Business & Financial (100.0%), Education, Arts & Media (100.0%), and Health Diagnosing & Treating (100.0%).
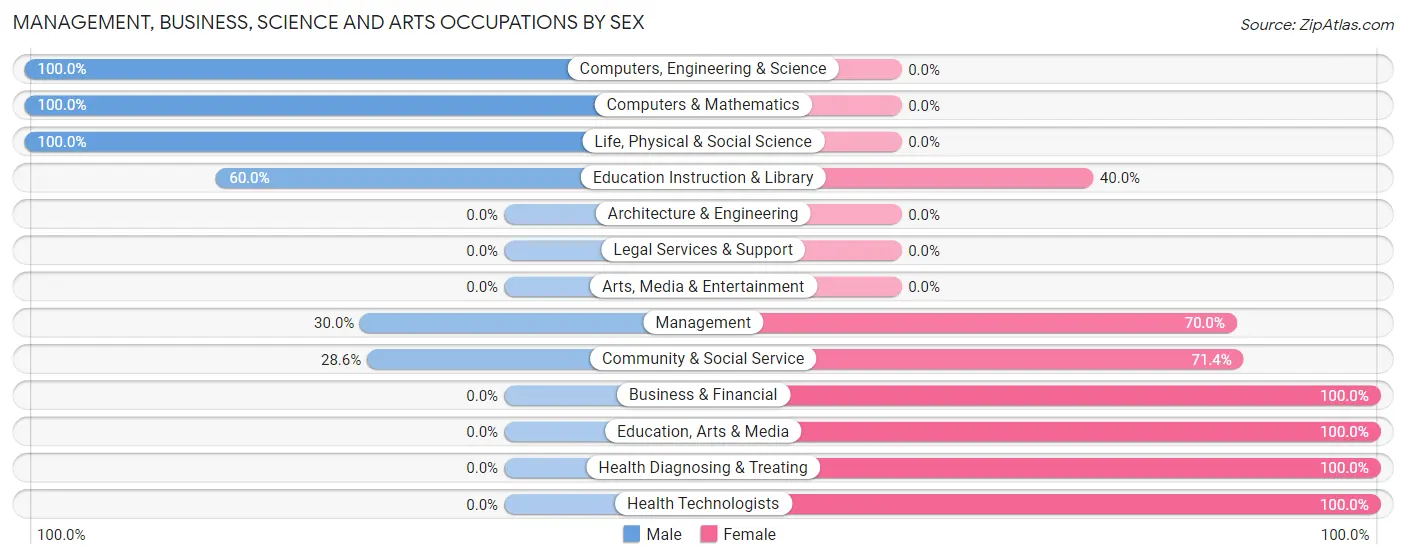
| Occupation | Male | Female |
| Management | 12 (30.0%) | 28 (70.0%) |
| Business & Financial | 0 (0.0%) | 4 (100.0%) |
| Computers, Engineering & Science | 10 (100.0%) | 0 (0.0%) |
| Computers & Mathematics | 5 (100.0%) | 0 (0.0%) |
| Architecture & Engineering | 0 (0.0%) | 0 (0.0%) |
| Life, Physical & Social Science | 5 (100.0%) | 0 (0.0%) |
| Community & Social Service | 6 (28.6%) | 15 (71.4%) |
| Education, Arts & Media | 0 (0.0%) | 11 (100.0%) |
| Legal Services & Support | 0 (0.0%) | 0 (0.0%) |
| Education Instruction & Library | 6 (60.0%) | 4 (40.0%) |
| Arts, Media & Entertainment | 0 (0.0%) | 0 (0.0%) |
| Health Diagnosing & Treating | 0 (0.0%) | 8 (100.0%) |
| Health Technologists | 0 (0.0%) | 4 (100.0%) |
| Total (Category) | 28 (33.7%) | 55 (66.3%) |
| Total (Overall) | 127 (42.9%) | 169 (57.1%) |
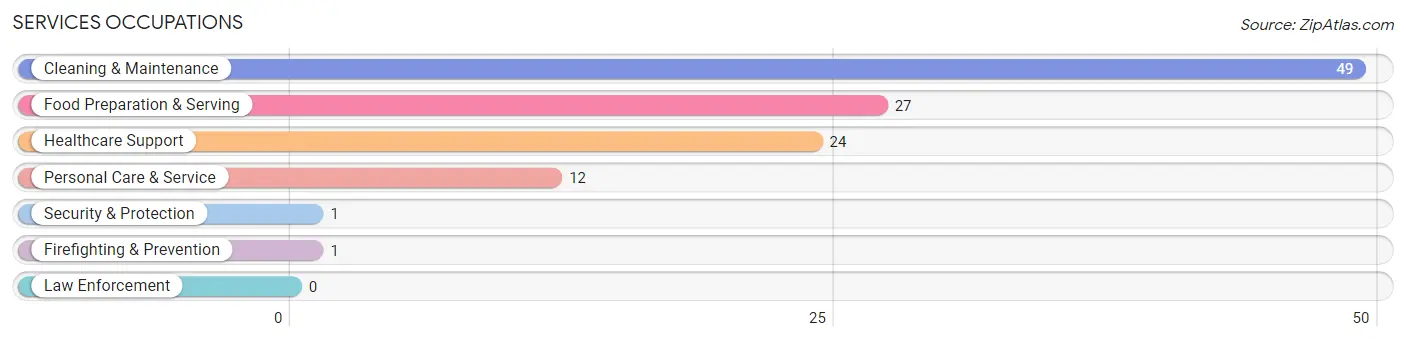
Services Occupations
The most common Services occupations in Mission are Cleaning & Maintenance (49 | 16.6%), Food Preparation & Serving (27 | 9.1%), Healthcare Support (24 | 8.1%), Personal Care & Service (12 | 4.1%), and Security & Protection (1 | 0.3%).
Services Occupations by Sex
Within the Services occupations in Mission, the most male-oriented occupations are Cleaning & Maintenance (73.5%), and Personal Care & Service (16.7%), while the most female-oriented occupations are Healthcare Support (100.0%), Security & Protection (100.0%), and Firefighting & Prevention (100.0%).
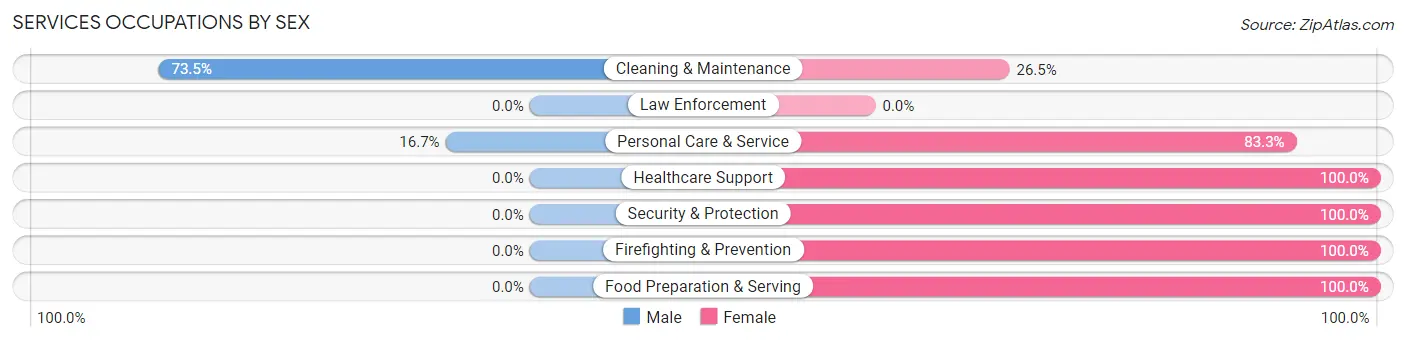
| Occupation | Male | Female |
| Healthcare Support | 0 (0.0%) | 24 (100.0%) |
| Security & Protection | 0 (0.0%) | 1 (100.0%) |
| Firefighting & Prevention | 0 (0.0%) | 1 (100.0%) |
| Law Enforcement | 0 (0.0%) | 0 (0.0%) |
| Food Preparation & Serving | 0 (0.0%) | 27 (100.0%) |
| Cleaning & Maintenance | 36 (73.5%) | 13 (26.5%) |
| Personal Care & Service | 2 (16.7%) | 10 (83.3%) |
| Total (Category) | 38 (33.6%) | 75 (66.4%) |
| Total (Overall) | 127 (42.9%) | 169 (57.1%) |
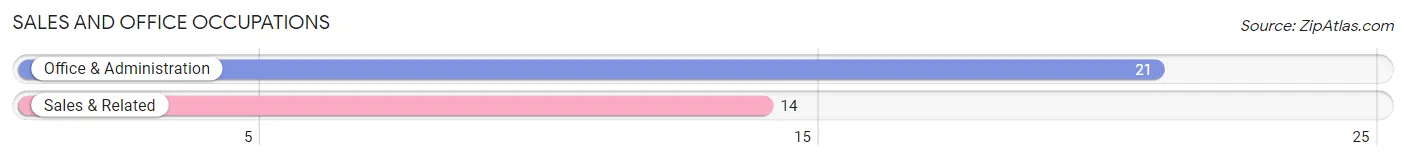
Sales and Office Occupations
The most common Sales and Office occupations in Mission are Office & Administration (21 | 7.1%), and Sales & Related (14 | 4.7%).
Sales and Office Occupations by Sex
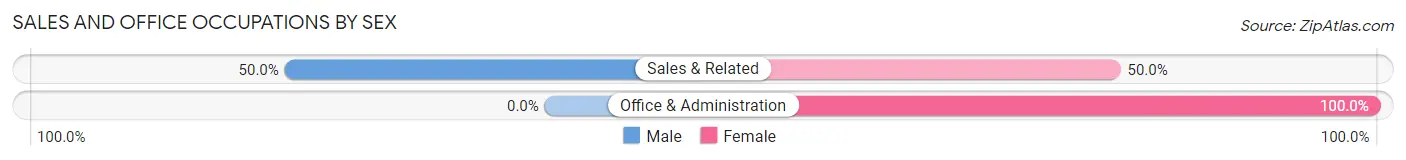
| Occupation | Male | Female |
| Sales & Related | 7 (50.0%) | 7 (50.0%) |
| Office & Administration | 0 (0.0%) | 21 (100.0%) |
| Total (Category) | 7 (20.0%) | 28 (80.0%) |
| Total (Overall) | 127 (42.9%) | 169 (57.1%) |
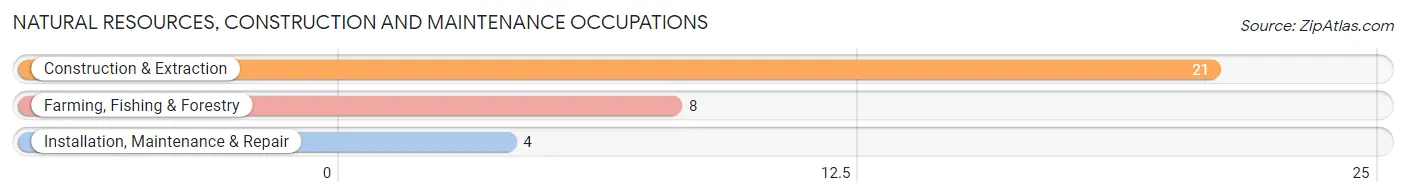
Natural Resources, Construction and Maintenance Occupations
The most common Natural Resources, Construction and Maintenance occupations in Mission are Construction & Extraction (21 | 7.1%), Farming, Fishing & Forestry (8 | 2.7%), and Installation, Maintenance & Repair (4 | 1.3%).
Natural Resources, Construction and Maintenance Occupations by Sex
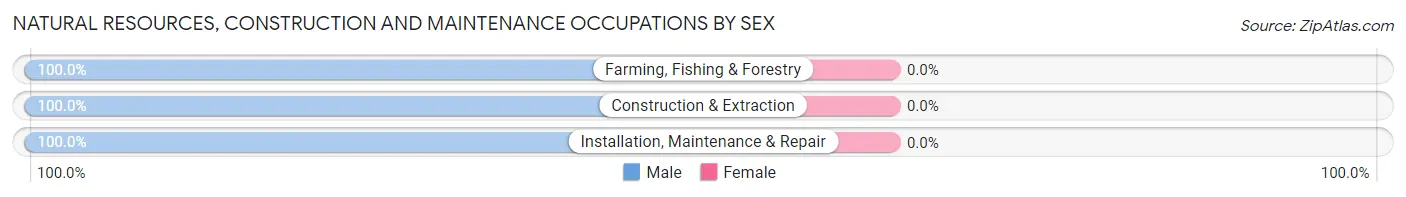
| Occupation | Male | Female |
| Farming, Fishing & Forestry | 8 (100.0%) | 0 (0.0%) |
| Construction & Extraction | 21 (100.0%) | 0 (0.0%) |
| Installation, Maintenance & Repair | 4 (100.0%) | 0 (0.0%) |
| Total (Category) | 33 (100.0%) | 0 (0.0%) |
| Total (Overall) | 127 (42.9%) | 169 (57.1%) |
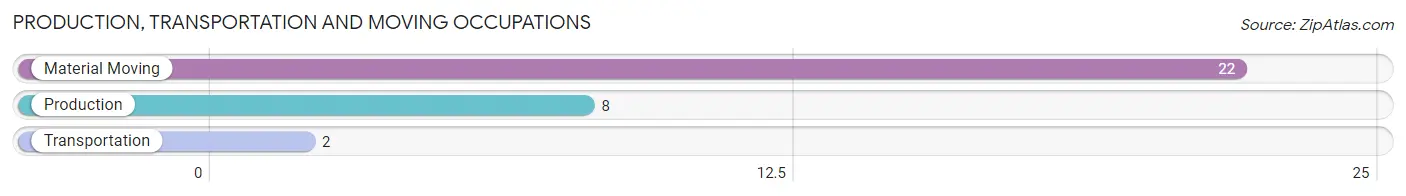
Production, Transportation and Moving Occupations
The most common Production, Transportation and Moving occupations in Mission are Material Moving (22 | 7.4%), Production (8 | 2.7%), and Transportation (2 | 0.7%).
Production, Transportation and Moving Occupations by Sex
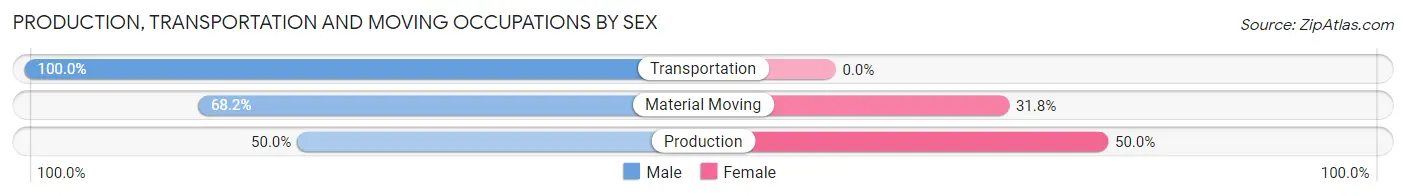
| Occupation | Male | Female |
| Production | 4 (50.0%) | 4 (50.0%) |
| Transportation | 2 (100.0%) | 0 (0.0%) |
| Material Moving | 15 (68.2%) | 7 (31.8%) |
| Total (Category) | 21 (65.6%) | 11 (34.4%) |
| Total (Overall) | 127 (42.9%) | 169 (57.1%) |
Employment Industries by Sex in Mission
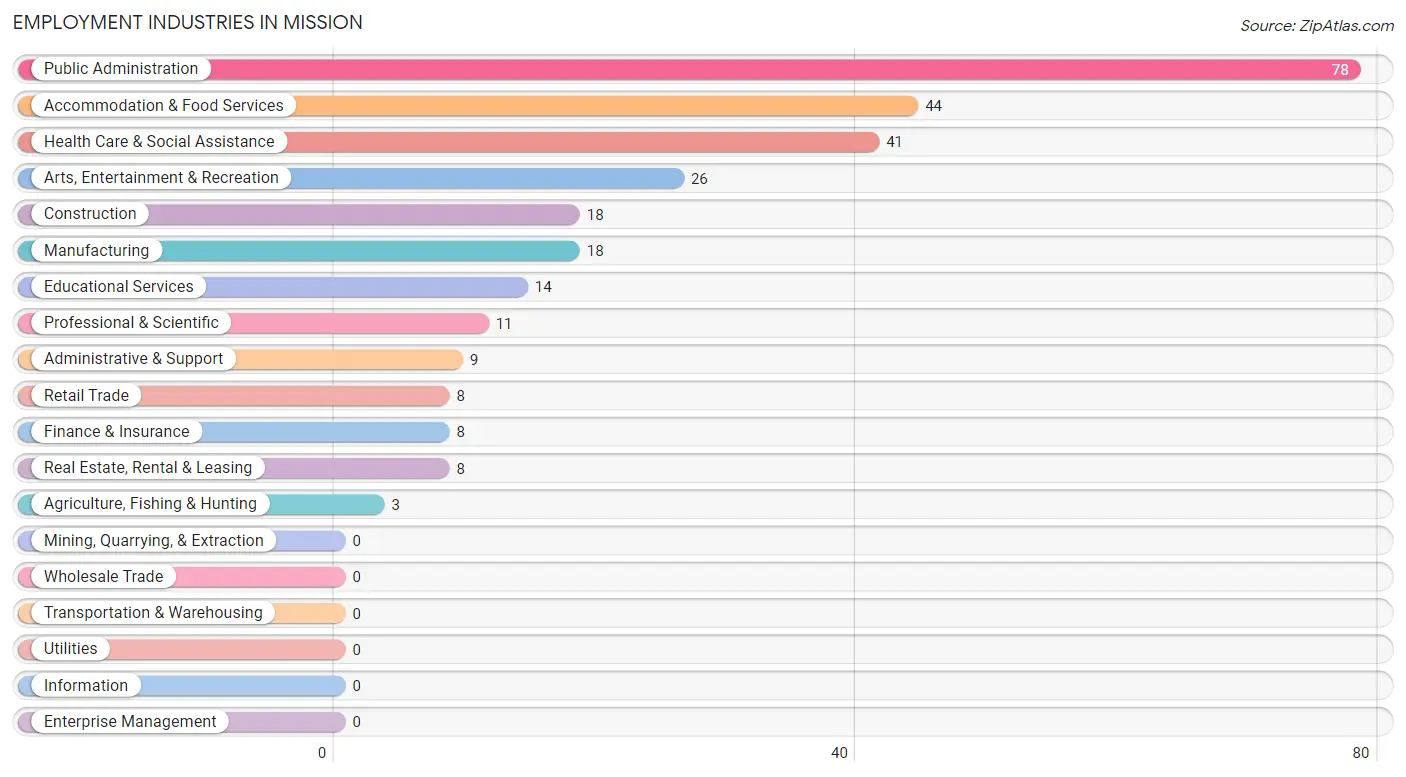
Employment Industries in Mission
The major employment industries in Mission include Public Administration (78 | 26.4%), Accommodation & Food Services (44 | 14.9%), Health Care & Social Assistance (41 | 13.9%), Arts, Entertainment & Recreation (26 | 8.8%), and Construction (18 | 6.1%).
Employment Industries by Sex in Mission
The Mission industries that see more men than women are Agriculture, Fishing & Hunting (100.0%), Construction (100.0%), and Administrative & Support (100.0%), whereas the industries that tend to have a higher number of women are Finance & Insurance (100.0%), Real Estate, Rental & Leasing (100.0%), and Health Care & Social Assistance (73.2%).
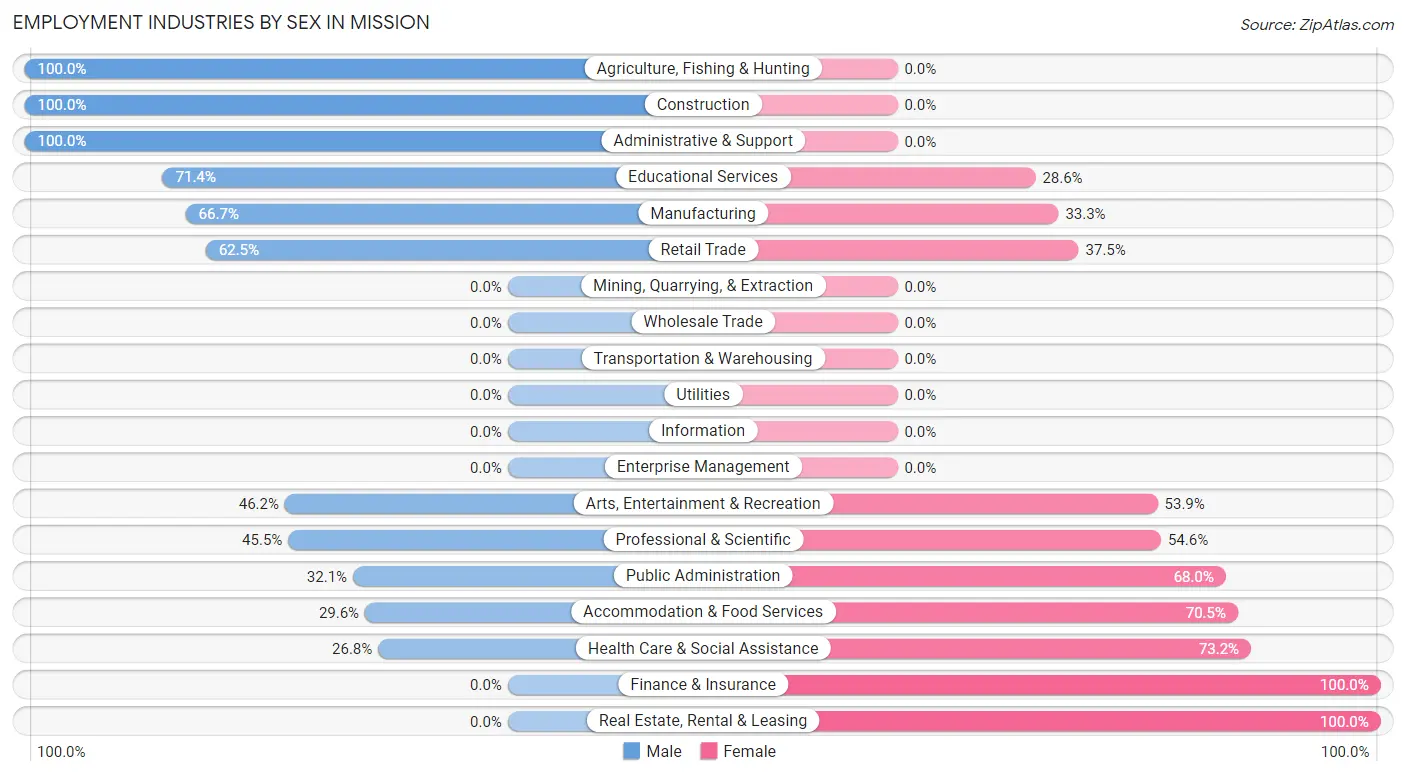
| Industry | Male | Female |
| Agriculture, Fishing & Hunting | 3 (100.0%) | 0 (0.0%) |
| Mining, Quarrying, & Extraction | 0 (0.0%) | 0 (0.0%) |
| Construction | 18 (100.0%) | 0 (0.0%) |
| Manufacturing | 12 (66.7%) | 6 (33.3%) |
| Wholesale Trade | 0 (0.0%) | 0 (0.0%) |
| Retail Trade | 5 (62.5%) | 3 (37.5%) |
| Transportation & Warehousing | 0 (0.0%) | 0 (0.0%) |
| Utilities | 0 (0.0%) | 0 (0.0%) |
| Information | 0 (0.0%) | 0 (0.0%) |
| Finance & Insurance | 0 (0.0%) | 8 (100.0%) |
| Real Estate, Rental & Leasing | 0 (0.0%) | 8 (100.0%) |
| Professional & Scientific | 5 (45.5%) | 6 (54.5%) |
| Enterprise Management | 0 (0.0%) | 0 (0.0%) |
| Administrative & Support | 9 (100.0%) | 0 (0.0%) |
| Educational Services | 10 (71.4%) | 4 (28.6%) |
| Health Care & Social Assistance | 11 (26.8%) | 30 (73.2%) |
| Arts, Entertainment & Recreation | 12 (46.2%) | 14 (53.8%) |
| Accommodation & Food Services | 13 (29.5%) | 31 (70.5%) |
| Public Administration | 25 (32.1%) | 53 (67.9%) |
| Total | 127 (42.9%) | 169 (57.1%) |
Education in Mission
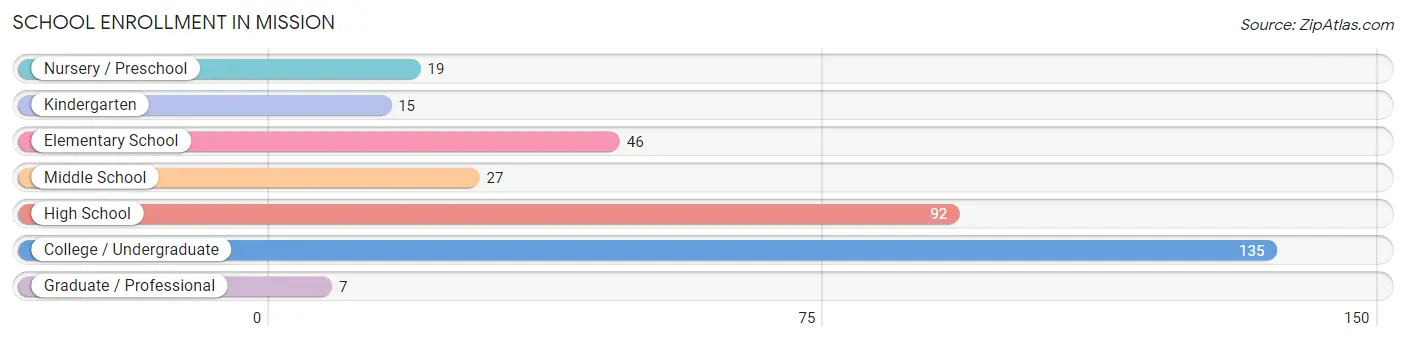
School Enrollment in Mission
The most common levels of schooling among the 341 students in Mission are college / undergraduate (135 | 39.6%), high school (92 | 27.0%), and elementary school (46 | 13.5%).
| School Level | # Students | % Students |
| Nursery / Preschool | 19 | 5.6% |
| Kindergarten | 15 | 4.4% |
| Elementary School | 46 | 13.5% |
| Middle School | 27 | 7.9% |
| High School | 92 | 27.0% |
| College / Undergraduate | 135 | 39.6% |
| Graduate / Professional | 7 | 2.1% |
| Total | 341 | 100.0% |
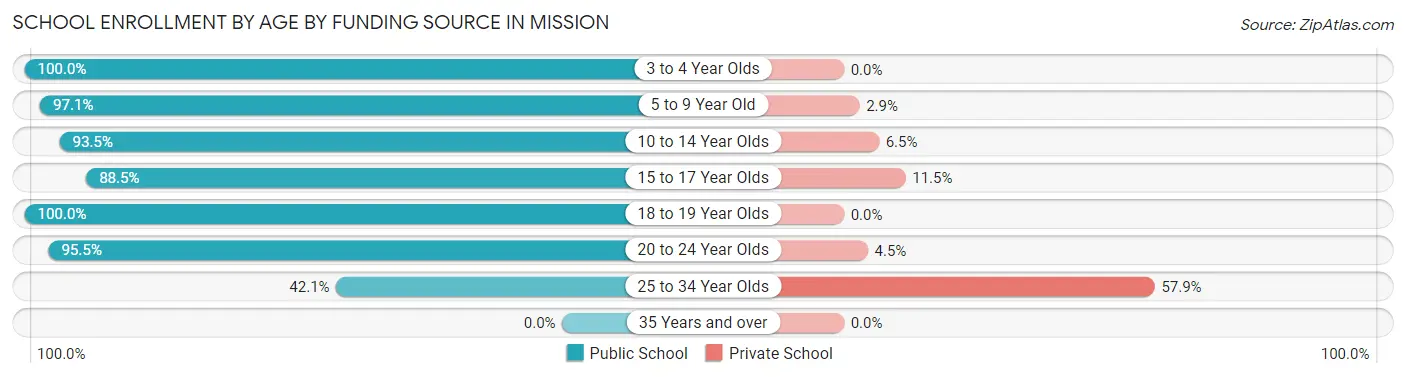
School Enrollment by Age by Funding Source in Mission
Out of a total of 341 students who are enrolled in schools in Mission, 28 (8.2%) attend a private institution, while the remaining 313 (91.8%) are enrolled in public schools. The age group of 25 to 34 year olds has the highest likelihood of being enrolled in private schools, with 11 (57.9% in the age bracket) enrolled. Conversely, the age group of 3 to 4 year olds has the lowest likelihood of being enrolled in a private school, with 10 (100.0% in the age bracket) attending a public institution.
| Age Bracket | Public School | Private School |
| 3 to 4 Year Olds | 10 (100.0%) | 0 (0.0%) |
| 5 to 9 Year Old | 67 (97.1%) | 2 (2.9%) |
| 10 to 14 Year Olds | 43 (93.5%) | 3 (6.5%) |
| 15 to 17 Year Olds | 54 (88.5%) | 7 (11.5%) |
| 18 to 19 Year Olds | 24 (100.0%) | 0 (0.0%) |
| 20 to 24 Year Olds | 107 (95.5%) | 5 (4.5%) |
| 25 to 34 Year Olds | 8 (42.1%) | 11 (57.9%) |
| 35 Years and over | 0 (0.0%) | 0 (0.0%) |
| Total | 313 (91.8%) | 28 (8.2%) |
Educational Attainment by Field of Study in Mission
Bio, nature & agricultural (14 | 19.4%), social sciences (11 | 15.3%), business (11 | 15.3%), arts & humanities (10 | 13.9%), and science & technology (7 | 9.7%) are the most common fields of study among 72 individuals in Mission who have obtained a bachelor's degree or higher.
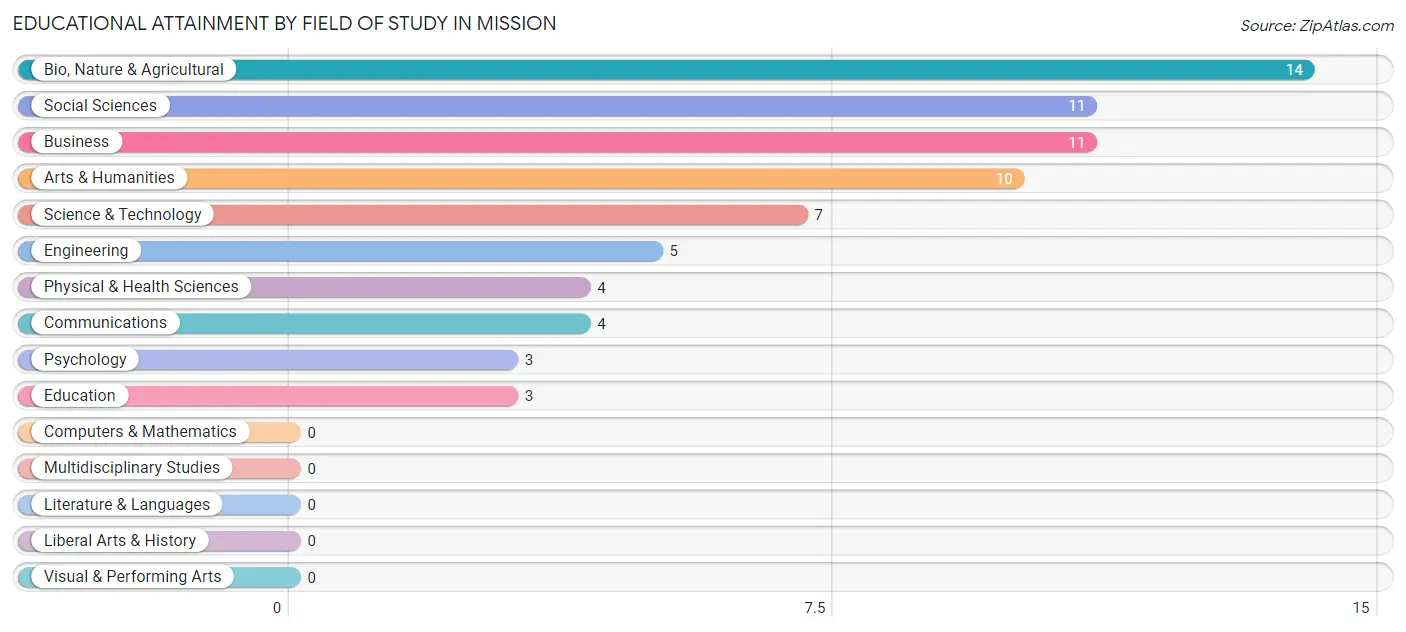
| Field of Study | # Graduates | % Graduates |
| Computers & Mathematics | 0 | 0.0% |
| Bio, Nature & Agricultural | 14 | 19.4% |
| Physical & Health Sciences | 4 | 5.6% |
| Psychology | 3 | 4.2% |
| Social Sciences | 11 | 15.3% |
| Engineering | 5 | 6.9% |
| Multidisciplinary Studies | 0 | 0.0% |
| Science & Technology | 7 | 9.7% |
| Business | 11 | 15.3% |
| Education | 3 | 4.2% |
| Literature & Languages | 0 | 0.0% |
| Liberal Arts & History | 0 | 0.0% |
| Visual & Performing Arts | 0 | 0.0% |
| Communications | 4 | 5.6% |
| Arts & Humanities | 10 | 13.9% |
| Total | 72 | 100.0% |
Transportation & Commute in Mission
Vehicle Availability by Sex in Mission
The most prevalent vehicle ownership categories in Mission are males with 2 vehicles (41, accounting for 32.3%) and females with 2 vehicles (53, making up 24.8%).
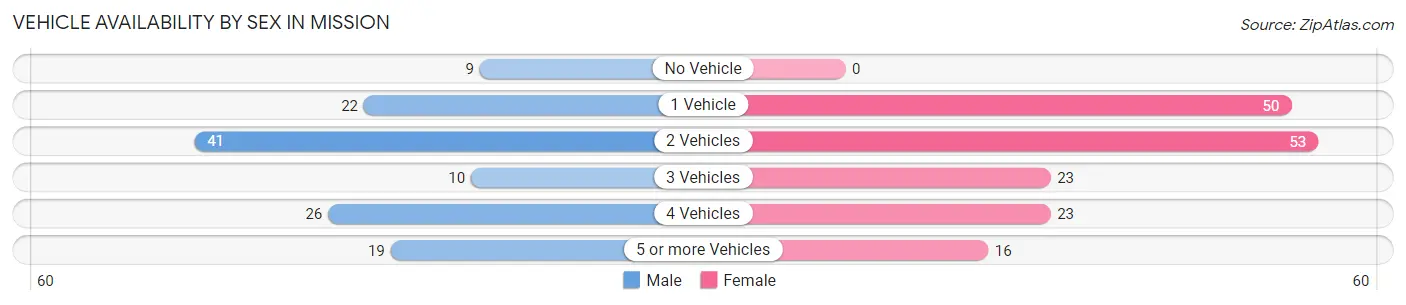
| Vehicles Available | Male | Female |
| No Vehicle | 9 (7.1%) | 0 (0.0%) |
| 1 Vehicle | 22 (17.3%) | 50 (30.3%) |
| 2 Vehicles | 41 (32.3%) | 53 (32.1%) |
| 3 Vehicles | 10 (7.9%) | 23 (13.9%) |
| 4 Vehicles | 26 (20.5%) | 23 (13.9%) |
| 5 or more Vehicles | 19 (15.0%) | 16 (9.7%) |
| Total | 127 (100.0%) | 165 (100.0%) |
Commute Time in Mission
The most frequently occuring commute durations in Mission are 5 to 9 minutes (149 commuters, 53.2%), 15 to 19 minutes (43 commuters, 15.4%), and 10 to 14 minutes (32 commuters, 11.4%).
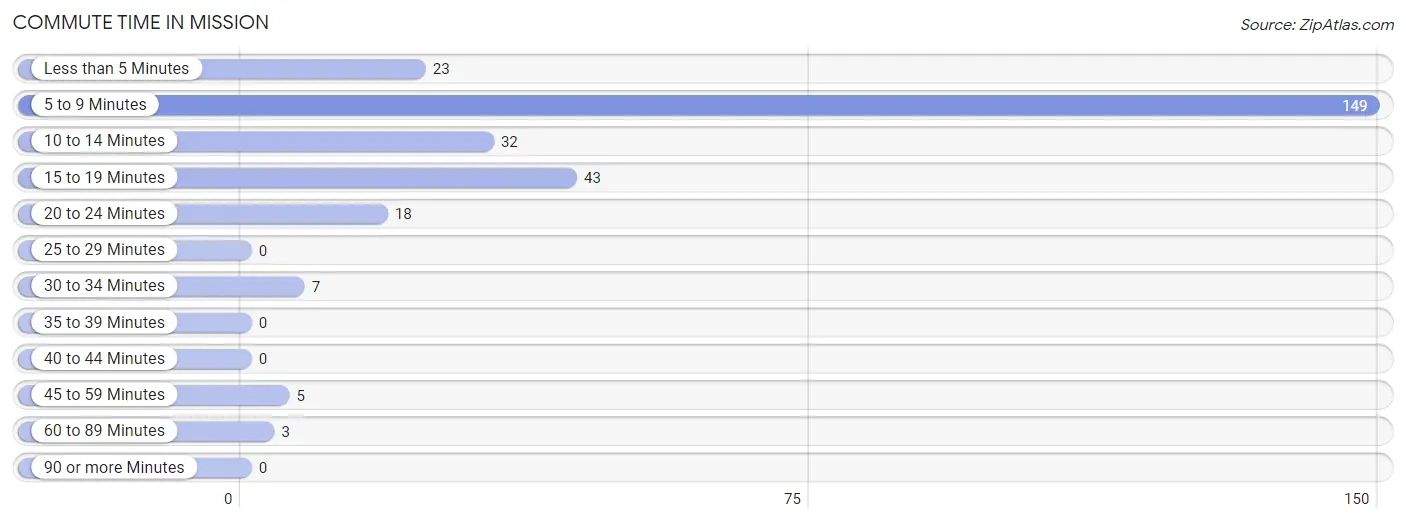
| Commute Time | # Commuters | % Commuters |
| Less than 5 Minutes | 23 | 8.2% |
| 5 to 9 Minutes | 149 | 53.2% |
| 10 to 14 Minutes | 32 | 11.4% |
| 15 to 19 Minutes | 43 | 15.4% |
| 20 to 24 Minutes | 18 | 6.4% |
| 25 to 29 Minutes | 0 | 0.0% |
| 30 to 34 Minutes | 7 | 2.5% |
| 35 to 39 Minutes | 0 | 0.0% |
| 40 to 44 Minutes | 0 | 0.0% |
| 45 to 59 Minutes | 5 | 1.8% |
| 60 to 89 Minutes | 3 | 1.1% |
| 90 or more Minutes | 0 | 0.0% |
Commute Time by Sex in Mission
The most common commute times in Mission are 5 to 9 minutes (66 commuters, 54.1%) for males and 5 to 9 minutes (83 commuters, 52.5%) for females.
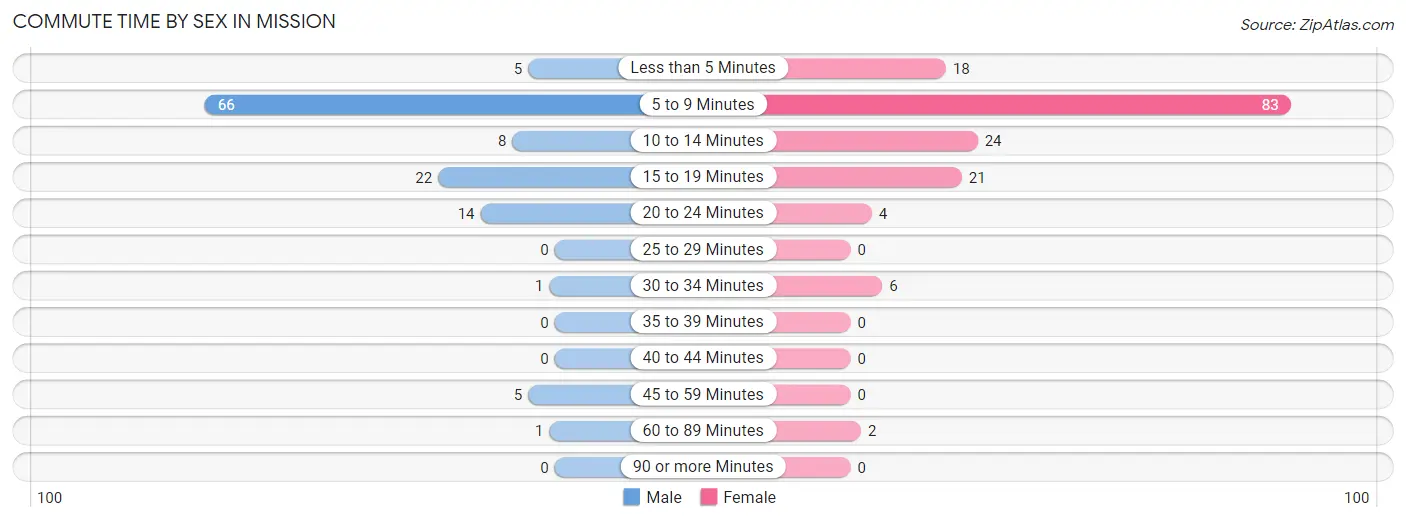
| Commute Time | Male | Female |
| Less than 5 Minutes | 5 (4.1%) | 18 (11.4%) |
| 5 to 9 Minutes | 66 (54.1%) | 83 (52.5%) |
| 10 to 14 Minutes | 8 (6.6%) | 24 (15.2%) |
| 15 to 19 Minutes | 22 (18.0%) | 21 (13.3%) |
| 20 to 24 Minutes | 14 (11.5%) | 4 (2.5%) |
| 25 to 29 Minutes | 0 (0.0%) | 0 (0.0%) |
| 30 to 34 Minutes | 1 (0.8%) | 6 (3.8%) |
| 35 to 39 Minutes | 0 (0.0%) | 0 (0.0%) |
| 40 to 44 Minutes | 0 (0.0%) | 0 (0.0%) |
| 45 to 59 Minutes | 5 (4.1%) | 0 (0.0%) |
| 60 to 89 Minutes | 1 (0.8%) | 2 (1.3%) |
| 90 or more Minutes | 0 (0.0%) | 0 (0.0%) |
Time of Departure to Work by Sex in Mission
The most frequent times of departure to work in Mission are 7:30 AM to 7:59 AM (32, 26.2%) for males and 7:00 AM to 7:29 AM (44, 27.9%) for females.
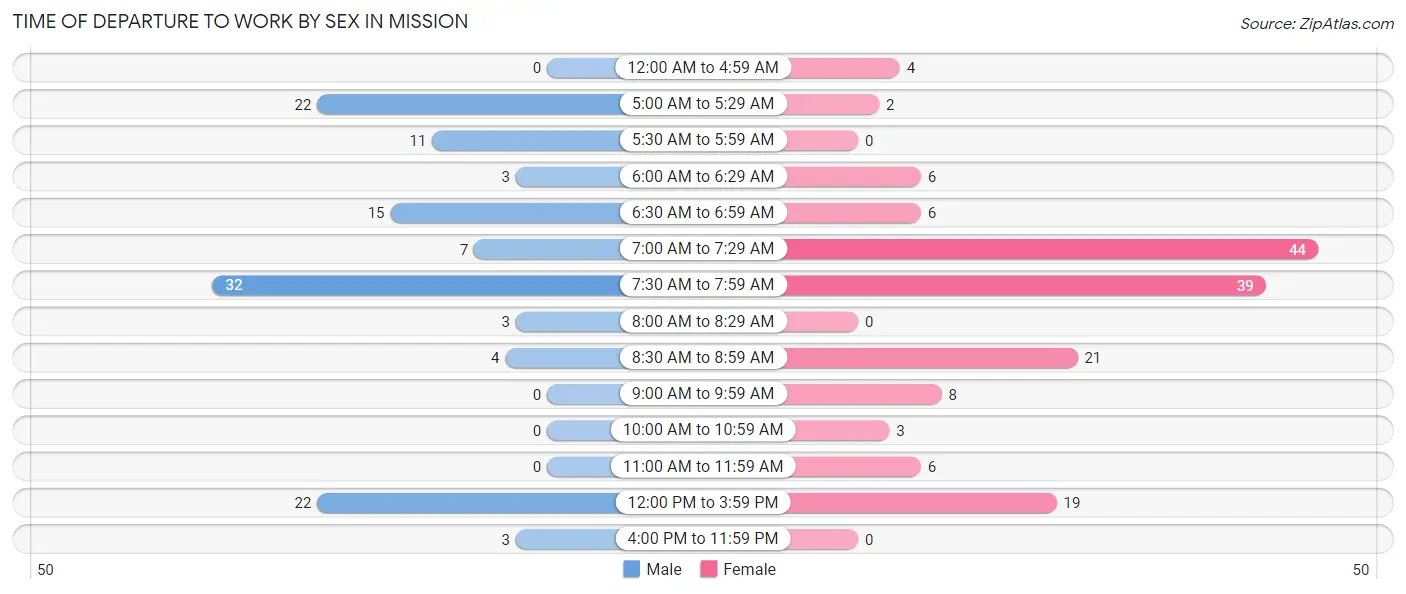
| Time of Departure | Male | Female |
| 12:00 AM to 4:59 AM | 0 (0.0%) | 4 (2.5%) |
| 5:00 AM to 5:29 AM | 22 (18.0%) | 2 (1.3%) |
| 5:30 AM to 5:59 AM | 11 (9.0%) | 0 (0.0%) |
| 6:00 AM to 6:29 AM | 3 (2.5%) | 6 (3.8%) |
| 6:30 AM to 6:59 AM | 15 (12.3%) | 6 (3.8%) |
| 7:00 AM to 7:29 AM | 7 (5.7%) | 44 (27.9%) |
| 7:30 AM to 7:59 AM | 32 (26.2%) | 39 (24.7%) |
| 8:00 AM to 8:29 AM | 3 (2.5%) | 0 (0.0%) |
| 8:30 AM to 8:59 AM | 4 (3.3%) | 21 (13.3%) |
| 9:00 AM to 9:59 AM | 0 (0.0%) | 8 (5.1%) |
| 10:00 AM to 10:59 AM | 0 (0.0%) | 3 (1.9%) |
| 11:00 AM to 11:59 AM | 0 (0.0%) | 6 (3.8%) |
| 12:00 PM to 3:59 PM | 22 (18.0%) | 19 (12.0%) |
| 4:00 PM to 11:59 PM | 3 (2.5%) | 0 (0.0%) |
| Total | 122 (100.0%) | 158 (100.0%) |
Housing Occupancy in Mission
Occupancy by Ownership in Mission
Of the total 278 dwellings in Mission, owner-occupied units account for 78 (28.1%), while renter-occupied units make up 200 (71.9%).
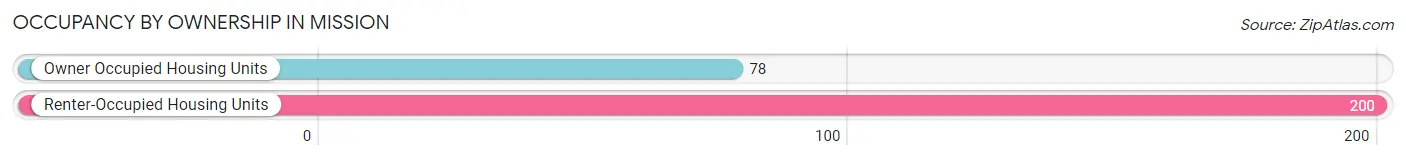
| Occupancy | # Housing Units | % Housing Units |
| Owner Occupied Housing Units | 78 | 28.1% |
| Renter-Occupied Housing Units | 200 | 71.9% |
| Total Occupied Housing Units | 278 | 100.0% |
Occupancy by Household Size in Mission
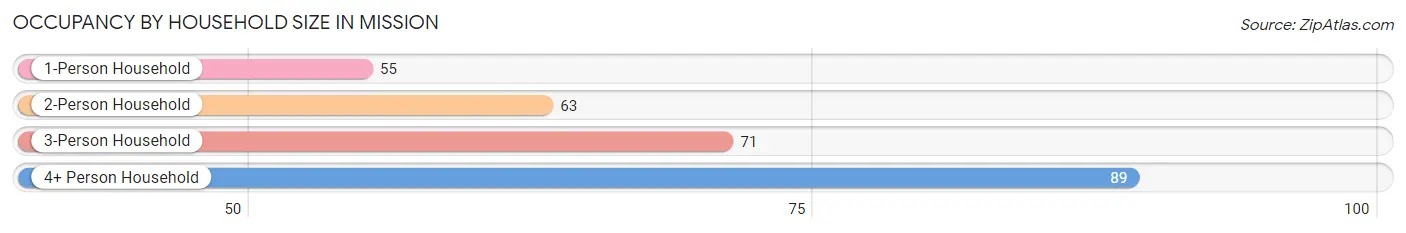
| Household Size | # Housing Units | % Housing Units |
| 1-Person Household | 55 | 19.8% |
| 2-Person Household | 63 | 22.7% |
| 3-Person Household | 71 | 25.5% |
| 4+ Person Household | 89 | 32.0% |
| Total Housing Units | 278 | 100.0% |
Occupancy by Ownership by Household Size in Mission
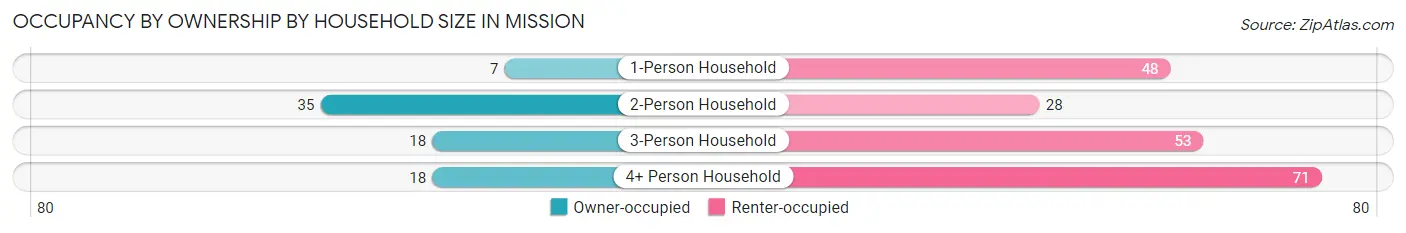
| Household Size | Owner-occupied | Renter-occupied |
| 1-Person Household | 7 (12.7%) | 48 (87.3%) |
| 2-Person Household | 35 (55.6%) | 28 (44.4%) |
| 3-Person Household | 18 (25.4%) | 53 (74.7%) |
| 4+ Person Household | 18 (20.2%) | 71 (79.8%) |
| Total Housing Units | 78 (28.1%) | 200 (71.9%) |
Occupancy by Educational Attainment in Mission
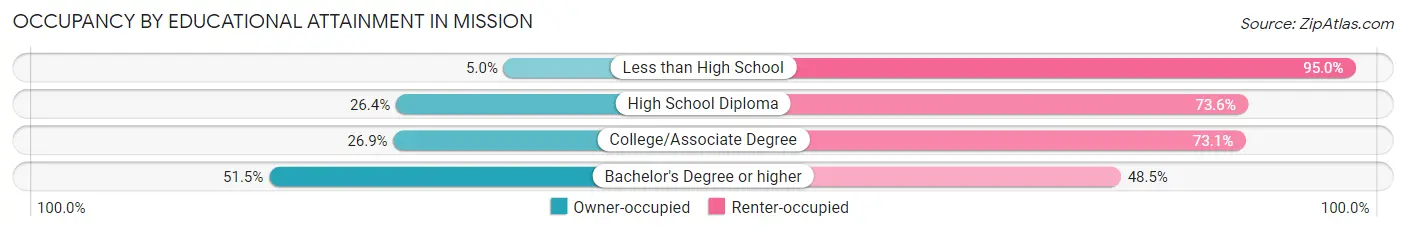
| Household Size | Owner-occupied | Renter-occupied |
| Less than High School | 1 (5.0%) | 19 (95.0%) |
| High School Diploma | 24 (26.4%) | 67 (73.6%) |
| College/Associate Degree | 36 (26.9%) | 98 (73.1%) |
| Bachelor's Degree or higher | 17 (51.5%) | 16 (48.5%) |
Occupancy by Age of Householder in Mission
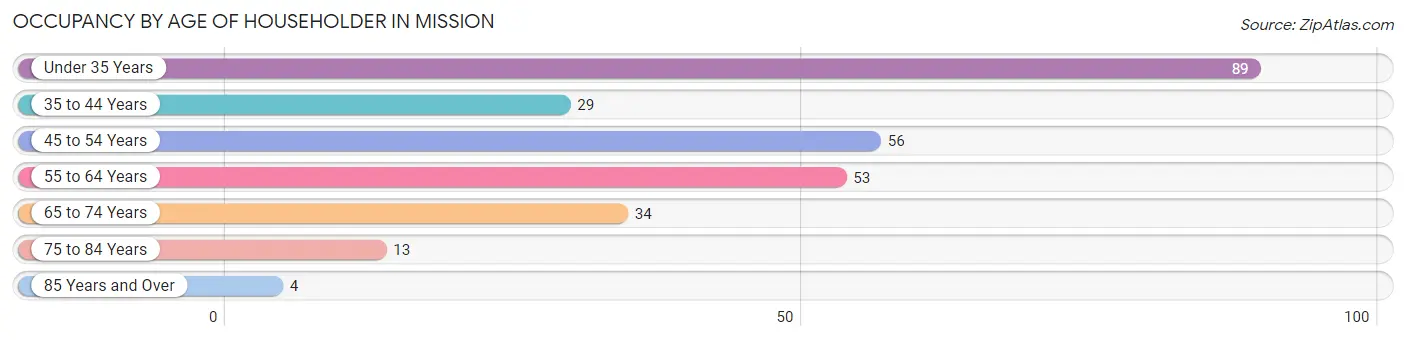
| Age Bracket | # Households | % Households |
| Under 35 Years | 89 | 32.0% |
| 35 to 44 Years | 29 | 10.4% |
| 45 to 54 Years | 56 | 20.1% |
| 55 to 64 Years | 53 | 19.1% |
| 65 to 74 Years | 34 | 12.2% |
| 75 to 84 Years | 13 | 4.7% |
| 85 Years and Over | 4 | 1.4% |
| Total | 278 | 100.0% |
Housing Finances in Mission
Median Income by Occupancy in Mission
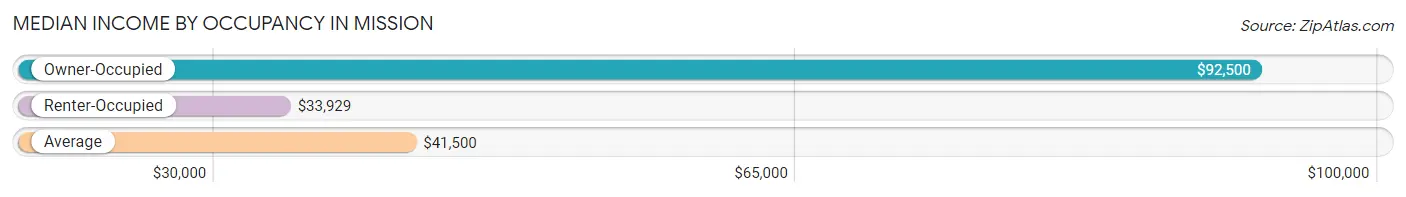
| Occupancy Type | # Households | Median Income |
| Owner-Occupied | 78 (28.1%) | $92,500 |
| Renter-Occupied | 200 (71.9%) | $33,929 |
| Average | 278 (100.0%) | $41,500 |
Occupancy by Householder Income Bracket in Mission
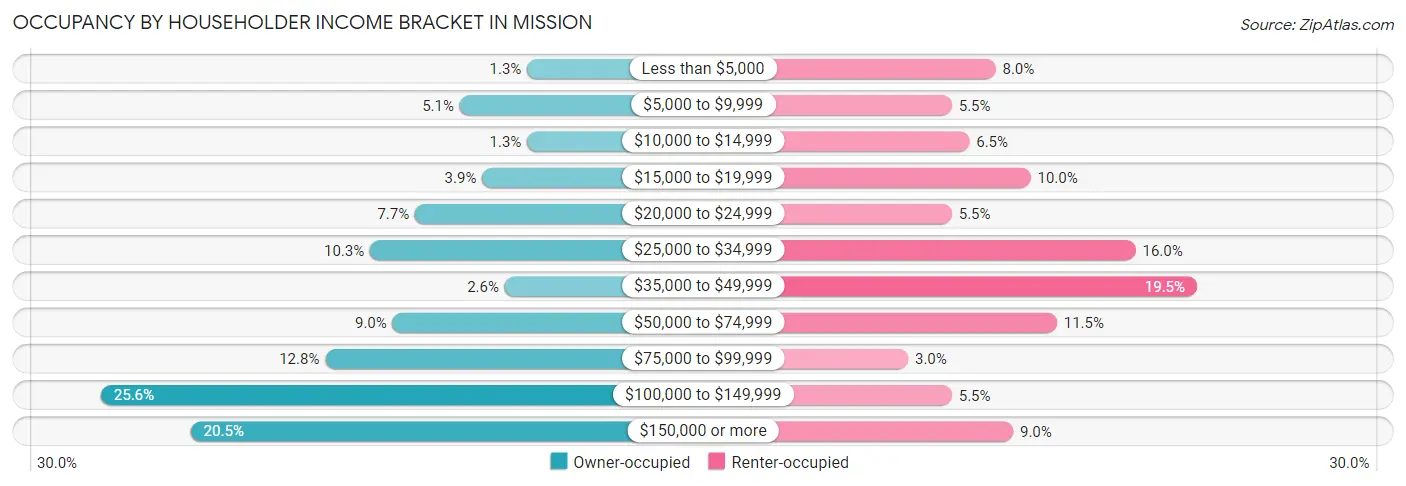
| Income Bracket | Owner-occupied | Renter-occupied |
| Less than $5,000 | 1 (1.3%) | 16 (8.0%) |
| $5,000 to $9,999 | 4 (5.1%) | 11 (5.5%) |
| $10,000 to $14,999 | 1 (1.3%) | 13 (6.5%) |
| $15,000 to $19,999 | 3 (3.8%) | 20 (10.0%) |
| $20,000 to $24,999 | 6 (7.7%) | 11 (5.5%) |
| $25,000 to $34,999 | 8 (10.3%) | 32 (16.0%) |
| $35,000 to $49,999 | 2 (2.6%) | 39 (19.5%) |
| $50,000 to $74,999 | 7 (9.0%) | 23 (11.5%) |
| $75,000 to $99,999 | 10 (12.8%) | 6 (3.0%) |
| $100,000 to $149,999 | 20 (25.6%) | 11 (5.5%) |
| $150,000 or more | 16 (20.5%) | 18 (9.0%) |
| Total | 78 (100.0%) | 200 (100.0%) |
Monthly Housing Cost Tiers in Mission
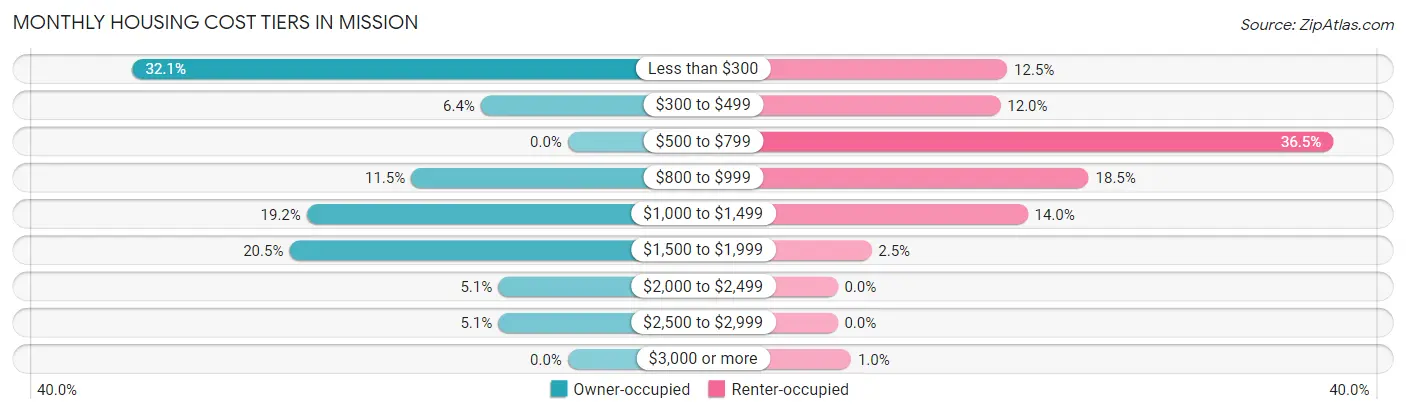
| Monthly Cost | Owner-occupied | Renter-occupied |
| Less than $300 | 25 (32.1%) | 25 (12.5%) |
| $300 to $499 | 5 (6.4%) | 24 (12.0%) |
| $500 to $799 | 0 (0.0%) | 73 (36.5%) |
| $800 to $999 | 9 (11.5%) | 37 (18.5%) |
| $1,000 to $1,499 | 15 (19.2%) | 28 (14.0%) |
| $1,500 to $1,999 | 16 (20.5%) | 5 (2.5%) |
| $2,000 to $2,499 | 4 (5.1%) | 0 (0.0%) |
| $2,500 to $2,999 | 4 (5.1%) | 0 (0.0%) |
| $3,000 or more | 0 (0.0%) | 2 (1.0%) |
| Total | 78 (100.0%) | 200 (100.0%) |
Physical Housing Characteristics in Mission
Housing Structures in Mission
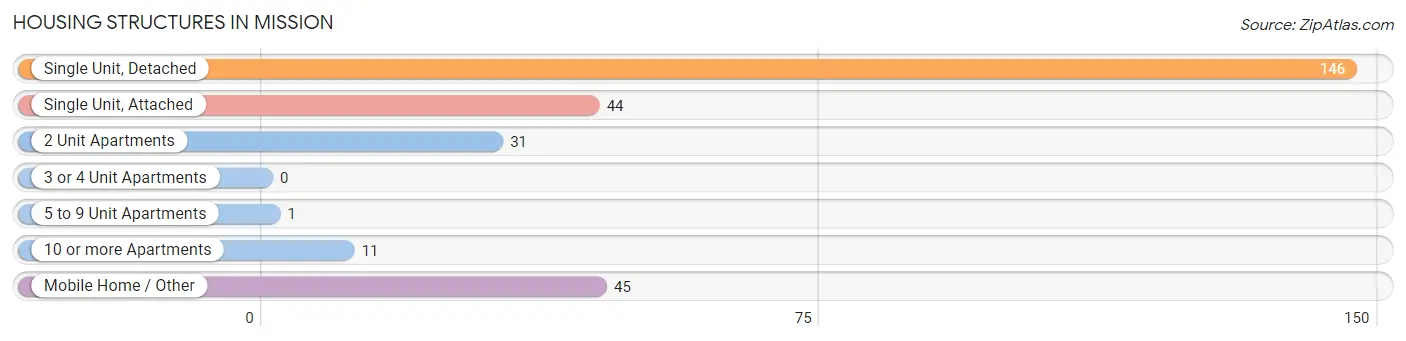
| Structure Type | # Housing Units | % Housing Units |
| Single Unit, Detached | 146 | 52.5% |
| Single Unit, Attached | 44 | 15.8% |
| 2 Unit Apartments | 31 | 11.2% |
| 3 or 4 Unit Apartments | 0 | 0.0% |
| 5 to 9 Unit Apartments | 1 | 0.4% |
| 10 or more Apartments | 11 | 4.0% |
| Mobile Home / Other | 45 | 16.2% |
| Total | 278 | 100.0% |
Housing Structures by Occupancy in Mission
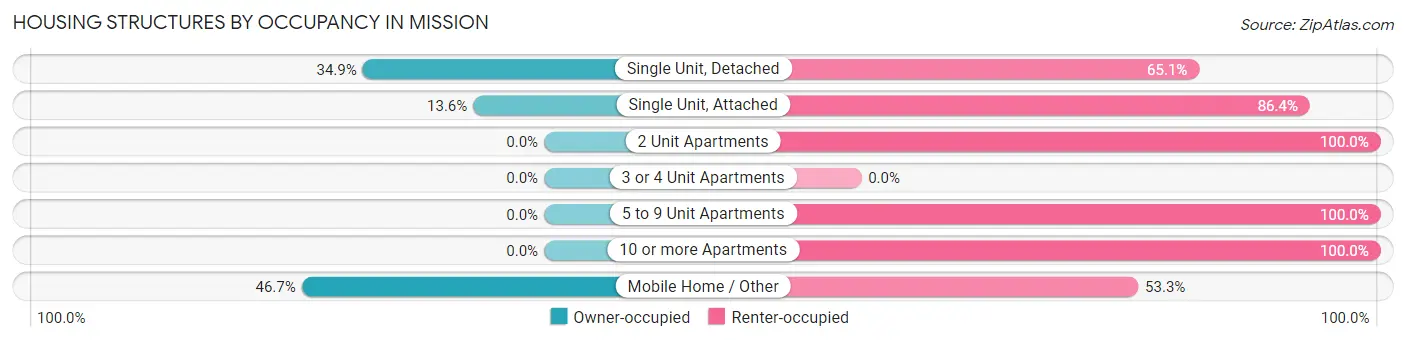
| Structure Type | Owner-occupied | Renter-occupied |
| Single Unit, Detached | 51 (34.9%) | 95 (65.1%) |
| Single Unit, Attached | 6 (13.6%) | 38 (86.4%) |
| 2 Unit Apartments | 0 (0.0%) | 31 (100.0%) |
| 3 or 4 Unit Apartments | 0 (0.0%) | 0 (0.0%) |
| 5 to 9 Unit Apartments | 0 (0.0%) | 1 (100.0%) |
| 10 or more Apartments | 0 (0.0%) | 11 (100.0%) |
| Mobile Home / Other | 21 (46.7%) | 24 (53.3%) |
| Total | 78 (28.1%) | 200 (71.9%) |
Housing Structures by Number of Rooms in Mission
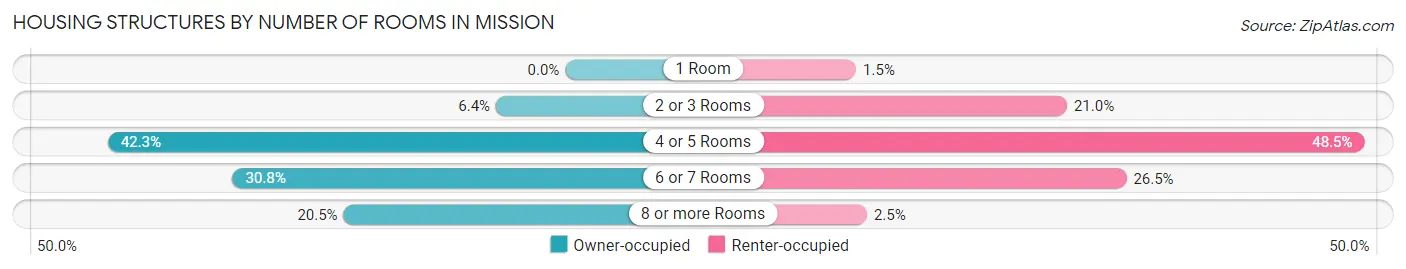
| Number of Rooms | Owner-occupied | Renter-occupied |
| 1 Room | 0 (0.0%) | 3 (1.5%) |
| 2 or 3 Rooms | 5 (6.4%) | 42 (21.0%) |
| 4 or 5 Rooms | 33 (42.3%) | 97 (48.5%) |
| 6 or 7 Rooms | 24 (30.8%) | 53 (26.5%) |
| 8 or more Rooms | 16 (20.5%) | 5 (2.5%) |
| Total | 78 (100.0%) | 200 (100.0%) |
Housing Structure by Heating Type in Mission
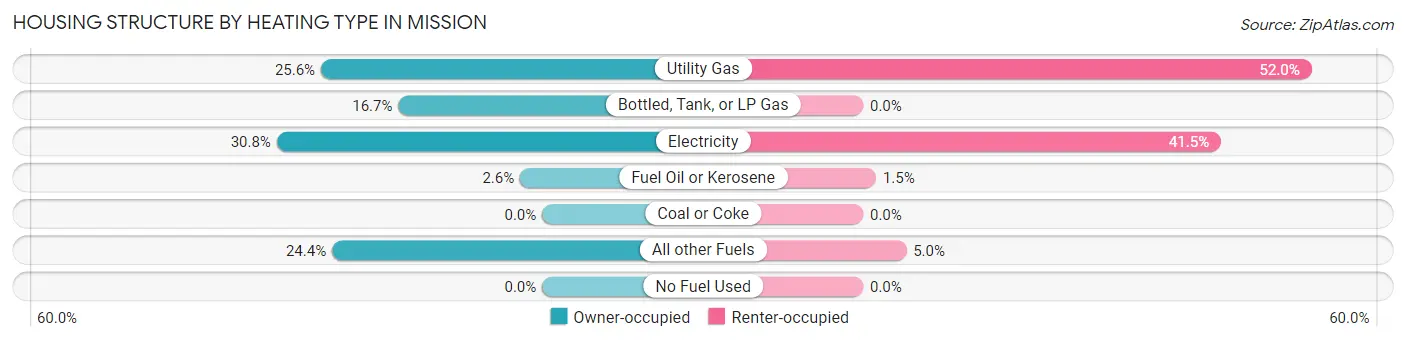
| Heating Type | Owner-occupied | Renter-occupied |
| Utility Gas | 20 (25.6%) | 104 (52.0%) |
| Bottled, Tank, or LP Gas | 13 (16.7%) | 0 (0.0%) |
| Electricity | 24 (30.8%) | 83 (41.5%) |
| Fuel Oil or Kerosene | 2 (2.6%) | 3 (1.5%) |
| Coal or Coke | 0 (0.0%) | 0 (0.0%) |
| All other Fuels | 19 (24.4%) | 10 (5.0%) |
| No Fuel Used | 0 (0.0%) | 0 (0.0%) |
| Total | 78 (100.0%) | 200 (100.0%) |
Household Vehicle Usage in Mission
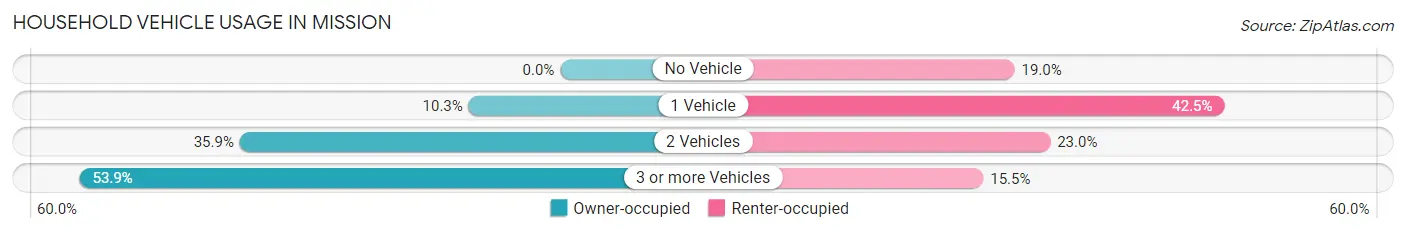
| Vehicles per Household | Owner-occupied | Renter-occupied |
| No Vehicle | 0 (0.0%) | 38 (19.0%) |
| 1 Vehicle | 8 (10.3%) | 85 (42.5%) |
| 2 Vehicles | 28 (35.9%) | 46 (23.0%) |
| 3 or more Vehicles | 42 (53.8%) | 31 (15.5%) |
| Total | 78 (100.0%) | 200 (100.0%) |
Real Estate & Mortgages in Mission
Real Estate and Mortgage Overview in Mission
| Characteristic | Without Mortgage | With Mortgage |
| Housing Units | 35 | 43 |
| Median Property Value | $169,600 | $283,900 |
| Median Household Income | $89,688 | $8 |
| Monthly Housing Costs | $198 | $0 |
| Real Estate Taxes | - | - |
Property Value by Mortgage Status in Mission
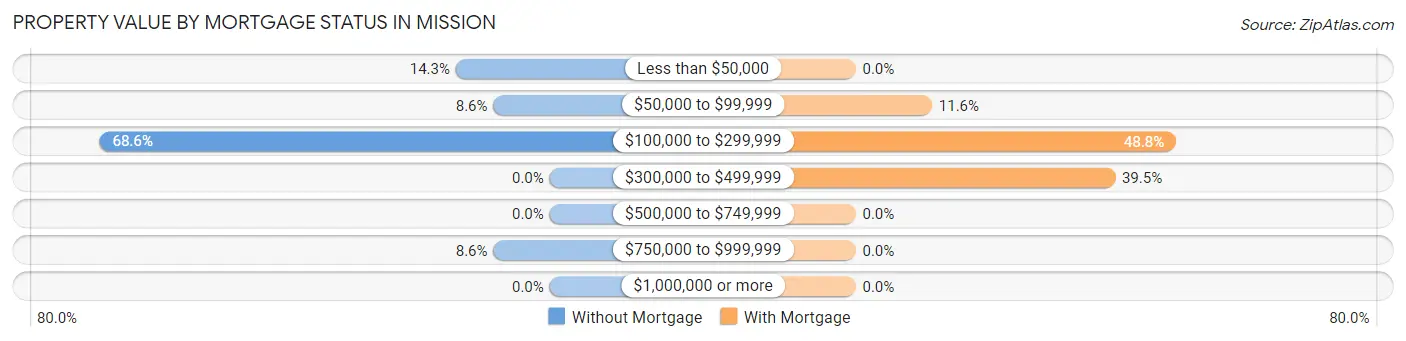
| Property Value | Without Mortgage | With Mortgage |
| Less than $50,000 | 5 (14.3%) | 0 (0.0%) |
| $50,000 to $99,999 | 3 (8.6%) | 5 (11.6%) |
| $100,000 to $299,999 | 24 (68.6%) | 21 (48.8%) |
| $300,000 to $499,999 | 0 (0.0%) | 17 (39.5%) |
| $500,000 to $749,999 | 0 (0.0%) | 0 (0.0%) |
| $750,000 to $999,999 | 3 (8.6%) | 0 (0.0%) |
| $1,000,000 or more | 0 (0.0%) | 0 (0.0%) |
| Total | 35 (100.0%) | 43 (100.0%) |
Household Income by Mortgage Status in Mission
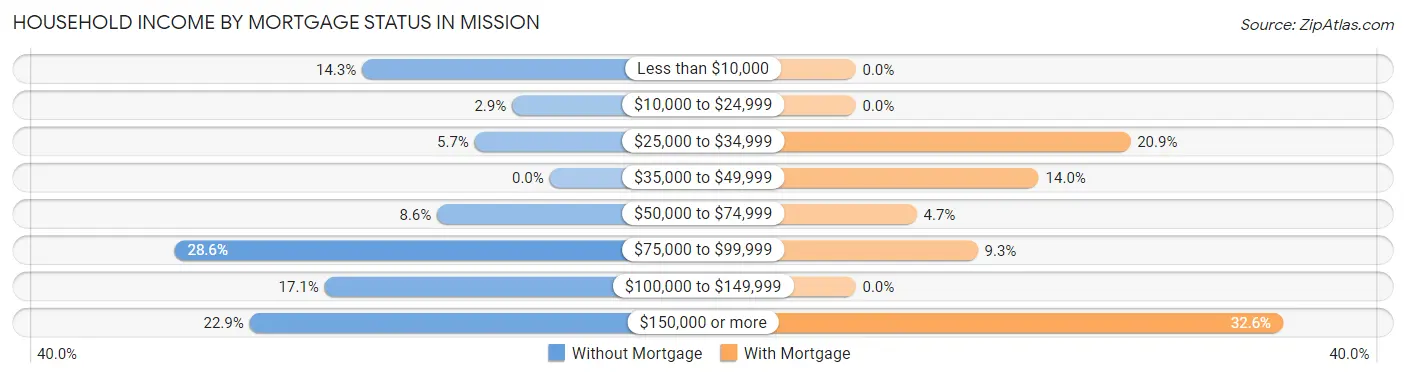
| Household Income | Without Mortgage | With Mortgage |
| Less than $10,000 | 5 (14.3%) | 0 (0.0%) |
| $10,000 to $24,999 | 1 (2.9%) | 0 (0.0%) |
| $25,000 to $34,999 | 2 (5.7%) | 9 (20.9%) |
| $35,000 to $49,999 | 0 (0.0%) | 6 (14.0%) |
| $50,000 to $74,999 | 3 (8.6%) | 2 (4.6%) |
| $75,000 to $99,999 | 10 (28.6%) | 4 (9.3%) |
| $100,000 to $149,999 | 6 (17.1%) | 0 (0.0%) |
| $150,000 or more | 8 (22.9%) | 14 (32.6%) |
| Total | 35 (100.0%) | 43 (100.0%) |
Property Value to Household Income Ratio in Mission
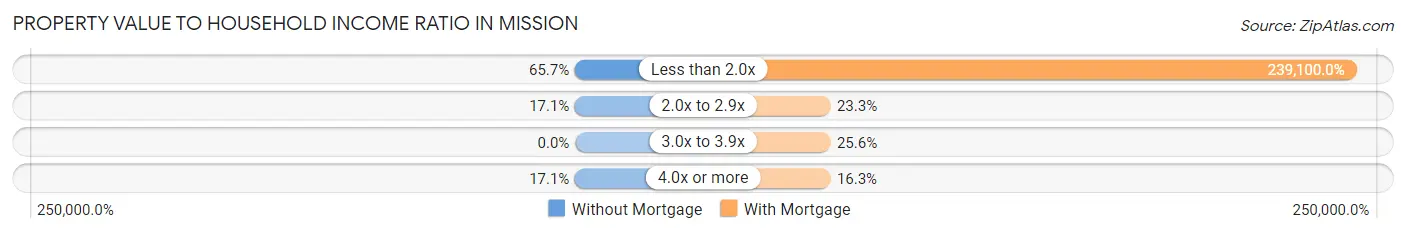
| Value-to-Income Ratio | Without Mortgage | With Mortgage |
| Less than 2.0x | 23 (65.7%) | 102,813 (239,100.0%) |
| 2.0x to 2.9x | 6 (17.1%) | 10 (23.3%) |
| 3.0x to 3.9x | 0 (0.0%) | 11 (25.6%) |
| 4.0x or more | 6 (17.1%) | 7 (16.3%) |
| Total | 35 (100.0%) | 43 (100.0%) |
Real Estate Taxes by Mortgage Status in Mission
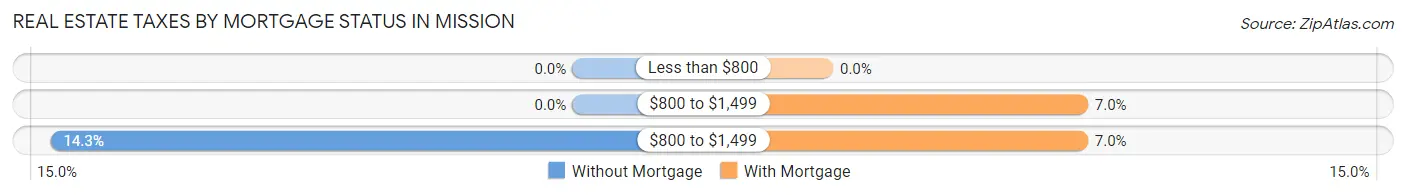
| Property Taxes | Without Mortgage | With Mortgage |
| Less than $800 | 0 (0.0%) | 0 (0.0%) |
| $800 to $1,499 | 0 (0.0%) | 3 (7.0%) |
| $800 to $1,499 | 5 (14.3%) | 3 (7.0%) |
| Total | 35 (100.0%) | 43 (100.0%) |
Health & Disability in Mission
Health Insurance Coverage by Age in Mission
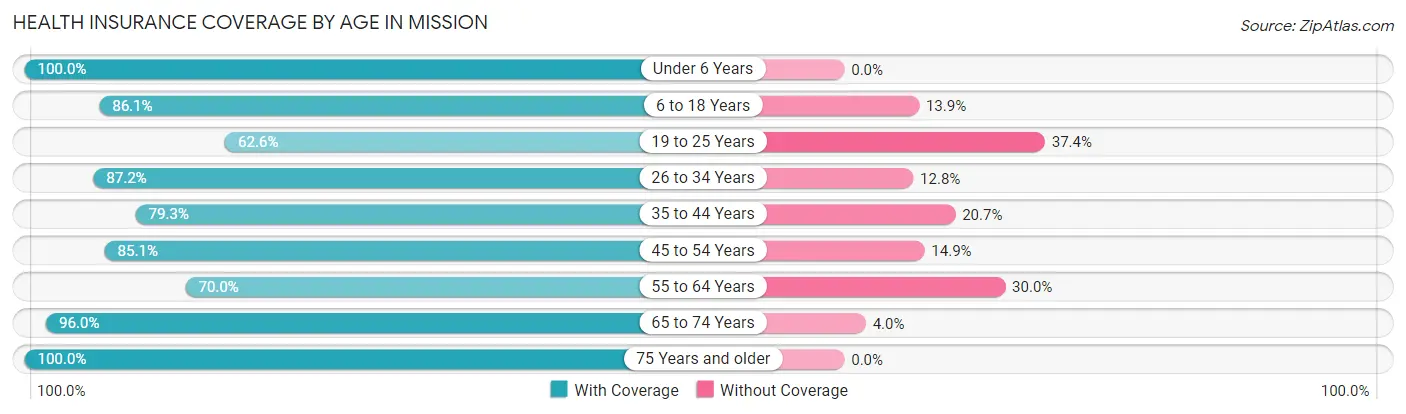
| Age Bracket | With Coverage | Without Coverage |
| Under 6 Years | 113 (100.0%) | 0 (0.0%) |
| 6 to 18 Years | 173 (86.1%) | 28 (13.9%) |
| 19 to 25 Years | 149 (62.6%) | 89 (37.4%) |
| 26 to 34 Years | 129 (87.2%) | 19 (12.8%) |
| 35 to 44 Years | 69 (79.3%) | 18 (20.7%) |
| 45 to 54 Years | 74 (85.1%) | 13 (14.9%) |
| 55 to 64 Years | 56 (70.0%) | 24 (30.0%) |
| 65 to 74 Years | 48 (96.0%) | 2 (4.0%) |
| 75 Years and older | 20 (100.0%) | 0 (0.0%) |
| Total | 831 (81.1%) | 193 (18.9%) |
Health Insurance Coverage by Citizenship Status in Mission
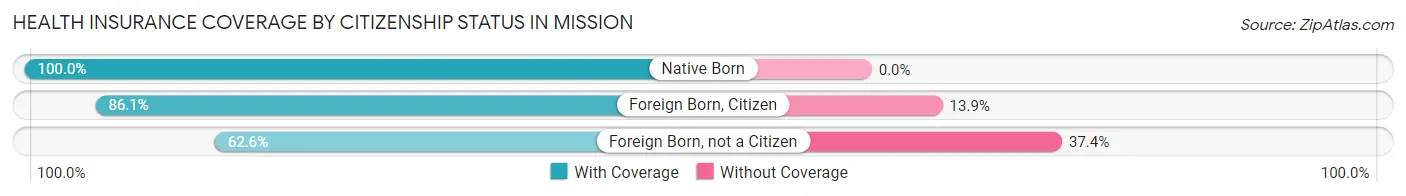
| Citizenship Status | With Coverage | Without Coverage |
| Native Born | 113 (100.0%) | 0 (0.0%) |
| Foreign Born, Citizen | 173 (86.1%) | 28 (13.9%) |
| Foreign Born, not a Citizen | 149 (62.6%) | 89 (37.4%) |
Health Insurance Coverage by Household Income in Mission
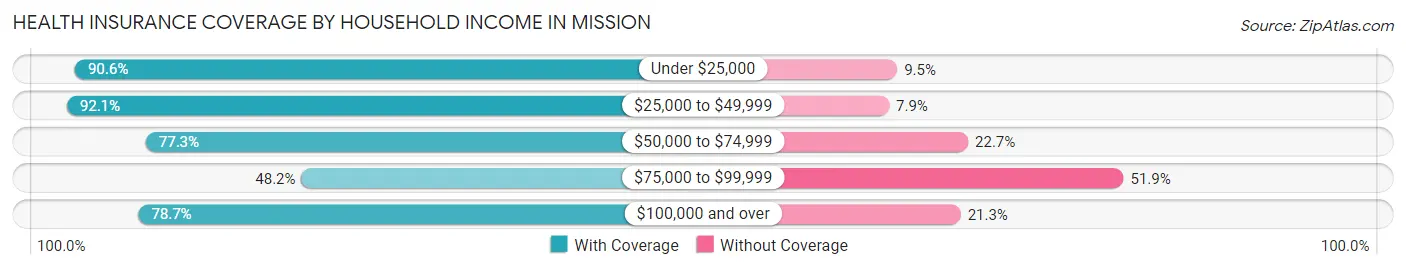
| Household Income | With Coverage | Without Coverage |
| Under $25,000 | 249 (90.5%) | 26 (9.5%) |
| $25,000 to $49,999 | 244 (92.1%) | 21 (7.9%) |
| $50,000 to $74,999 | 85 (77.3%) | 25 (22.7%) |
| $75,000 to $99,999 | 65 (48.1%) | 70 (51.8%) |
| $100,000 and over | 188 (78.7%) | 51 (21.3%) |
Public vs Private Health Insurance Coverage by Age in Mission
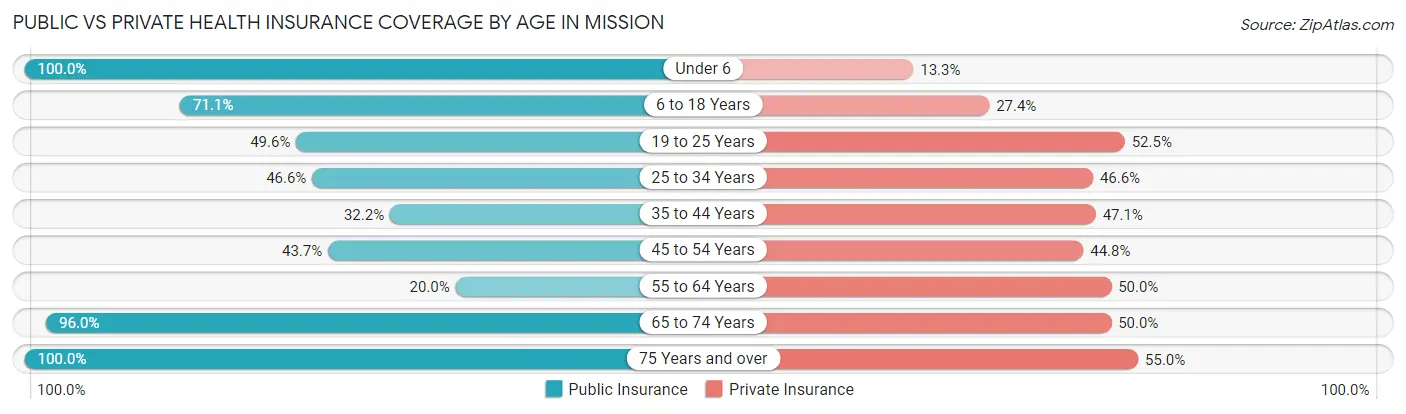
| Age Bracket | Public Insurance | Private Insurance |
| Under 6 | 113 (100.0%) | 15 (13.3%) |
| 6 to 18 Years | 143 (71.1%) | 55 (27.4%) |
| 19 to 25 Years | 118 (49.6%) | 125 (52.5%) |
| 25 to 34 Years | 69 (46.6%) | 69 (46.6%) |
| 35 to 44 Years | 28 (32.2%) | 41 (47.1%) |
| 45 to 54 Years | 38 (43.7%) | 39 (44.8%) |
| 55 to 64 Years | 16 (20.0%) | 40 (50.0%) |
| 65 to 74 Years | 48 (96.0%) | 25 (50.0%) |
| 75 Years and over | 20 (100.0%) | 11 (55.0%) |
| Total | 593 (57.9%) | 420 (41.0%) |
Disability Status by Sex by Age in Mission
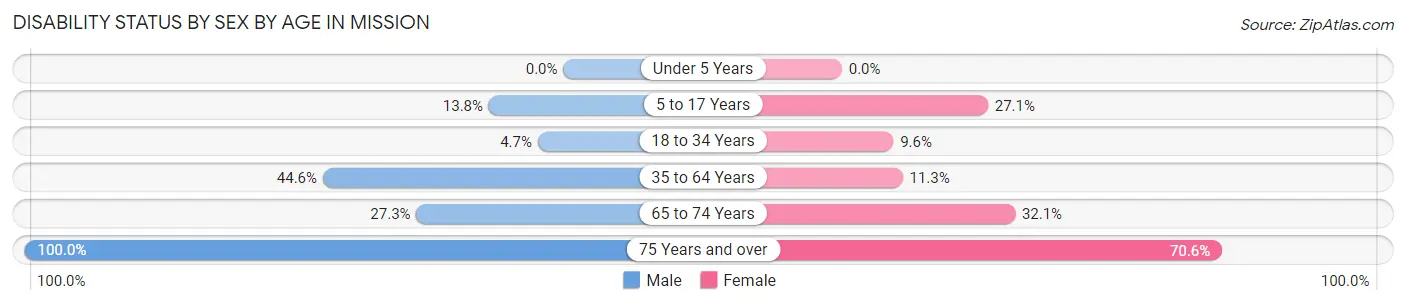
| Age Bracket | Male | Female |
| Under 5 Years | 0 (0.0%) | 0 (0.0%) |
| 5 to 17 Years | 13 (13.8%) | 29 (27.1%) |
| 18 to 34 Years | 11 (4.7%) | 17 (9.6%) |
| 35 to 64 Years | 50 (44.6%) | 16 (11.3%) |
| 65 to 74 Years | 6 (27.3%) | 9 (32.1%) |
| 75 Years and over | 3 (100.0%) | 12 (70.6%) |
Disability Class by Sex by Age in Mission
Disability Class: Hearing Difficulty
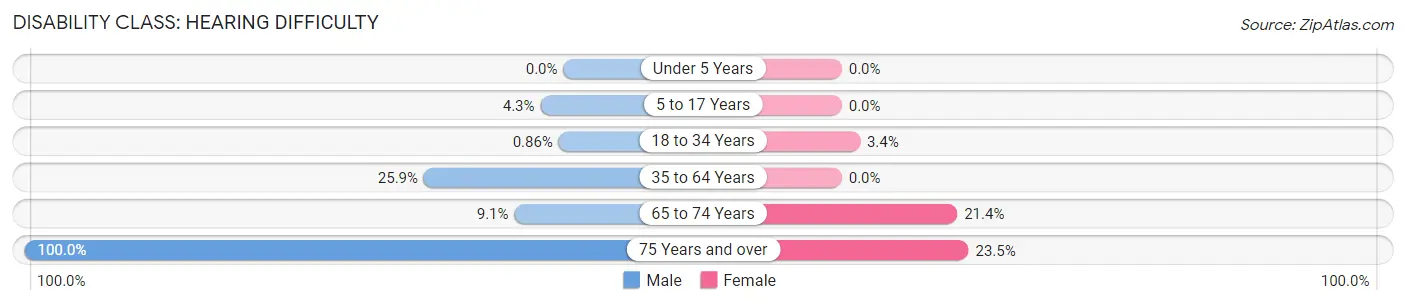
| Age Bracket | Male | Female |
| Under 5 Years | 0 (0.0%) | 0 (0.0%) |
| 5 to 17 Years | 4 (4.3%) | 0 (0.0%) |
| 18 to 34 Years | 2 (0.9%) | 6 (3.4%) |
| 35 to 64 Years | 29 (25.9%) | 0 (0.0%) |
| 65 to 74 Years | 2 (9.1%) | 6 (21.4%) |
| 75 Years and over | 3 (100.0%) | 4 (23.5%) |
Disability Class: Vision Difficulty
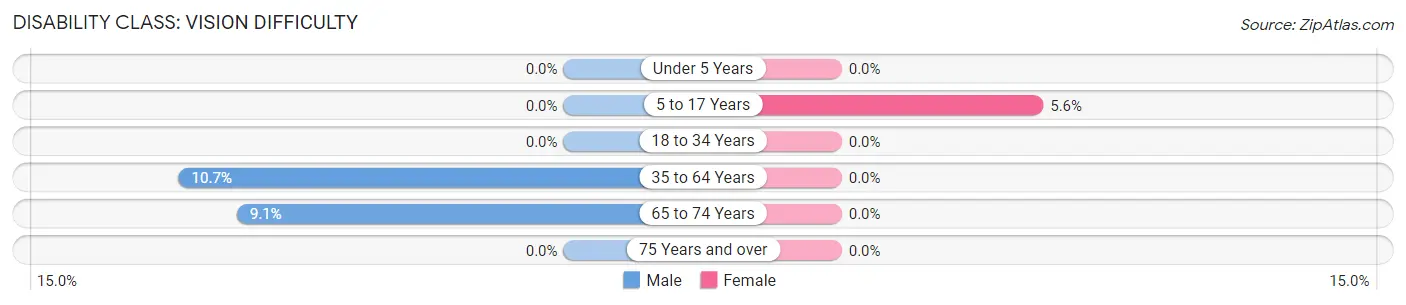
| Age Bracket | Male | Female |
| Under 5 Years | 0 (0.0%) | 0 (0.0%) |
| 5 to 17 Years | 0 (0.0%) | 6 (5.6%) |
| 18 to 34 Years | 0 (0.0%) | 0 (0.0%) |
| 35 to 64 Years | 12 (10.7%) | 0 (0.0%) |
| 65 to 74 Years | 2 (9.1%) | 0 (0.0%) |
| 75 Years and over | 0 (0.0%) | 0 (0.0%) |
Disability Class: Cognitive Difficulty
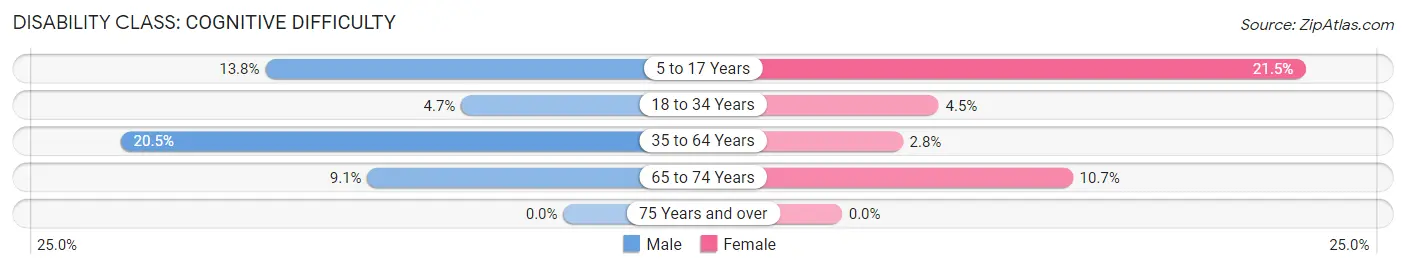
| Age Bracket | Male | Female |
| 5 to 17 Years | 13 (13.8%) | 23 (21.5%) |
| 18 to 34 Years | 11 (4.7%) | 8 (4.5%) |
| 35 to 64 Years | 23 (20.5%) | 4 (2.8%) |
| 65 to 74 Years | 2 (9.1%) | 3 (10.7%) |
| 75 Years and over | 0 (0.0%) | 0 (0.0%) |
Disability Class: Ambulatory Difficulty
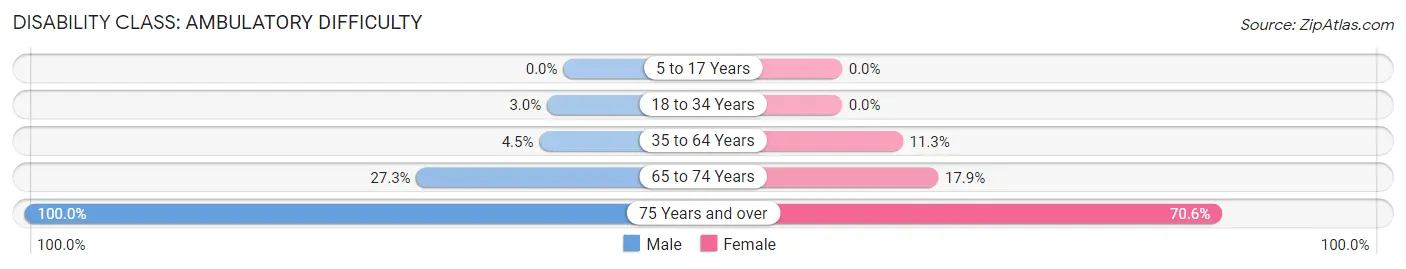
| Age Bracket | Male | Female |
| 5 to 17 Years | 0 (0.0%) | 0 (0.0%) |
| 18 to 34 Years | 7 (3.0%) | 0 (0.0%) |
| 35 to 64 Years | 5 (4.5%) | 16 (11.3%) |
| 65 to 74 Years | 6 (27.3%) | 5 (17.9%) |
| 75 Years and over | 3 (100.0%) | 12 (70.6%) |
Disability Class: Self-Care Difficulty
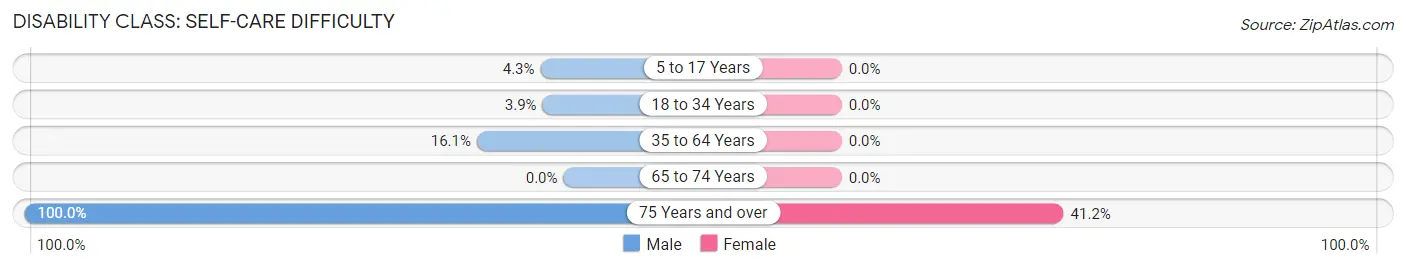
| Age Bracket | Male | Female |
| 5 to 17 Years | 4 (4.3%) | 0 (0.0%) |
| 18 to 34 Years | 9 (3.9%) | 0 (0.0%) |
| 35 to 64 Years | 18 (16.1%) | 0 (0.0%) |
| 65 to 74 Years | 0 (0.0%) | 0 (0.0%) |
| 75 Years and over | 3 (100.0%) | 7 (41.2%) |
Technology Access in Mission
Computing Device Access in Mission
| Device Type | # Households | % Households |
| Desktop or Laptop | 196 | 70.5% |
| Smartphone | 252 | 90.6% |
| Tablet | 197 | 70.9% |
| No Computing Device | 11 | 4.0% |
| Total | 278 | 100.0% |
Internet Access in Mission
| Internet Type | # Households | % Households |
| Dial-Up Internet | 0 | 0.0% |
| Broadband Home | 182 | 65.5% |
| Cellular Data Only | 22 | 7.9% |
| Satellite Internet | 18 | 6.5% |
| No Internet | 67 | 24.1% |
| Total | 278 | 100.0% |
Mission Summary
Mission is a city located in Hidalgo County, Texas, United States. It is one of the cities that make up the McAllen–Edinburg–Mission metropolitan area. As of the 2010 census, the city had a population of 77,058, and in 2019 the estimated population was 87,890.
History
Mission was founded in 1846 by the Spanish colonizers. The city was named after the Spanish mission Nuestra Señora de Guadalupe de Jesús, which was founded in 1749. The mission was abandoned in 1755, but the city of Mission was established in 1846.
In the late 19th century, Mission was a small farming community. The city was incorporated in 1909 and began to grow rapidly in the early 20th century. By the 1950s, Mission had become a major agricultural center, with cotton, corn, sorghum, and vegetables being the main crops.
Geography
Mission is located in the Rio Grande Valley of South Texas, about 20 miles (32 km) west of McAllen and about 30 miles (48 km) east of the Mexican border. The city is situated on the banks of the Rio Grande, which forms the border between the United States and Mexico.
Mission covers an area of 24.3 square miles (62.9 km2), of which 24.2 square miles (62.6 km2) is land and 0.1 square miles (0.3 km2) is water. The city is located in the humid subtropical climate zone, with hot summers and mild winters.
Economy
Mission is a major agricultural center, with cotton, corn, sorghum, and vegetables being the main crops. The city is also home to several manufacturing companies, including Mission Foods, a tortilla manufacturer, and Mission Pharmacal, a pharmaceutical company.
The city is also home to several retail stores, including Walmart, Target, and Lowe's. Mission is also home to several medical centers, including Mission Regional Medical Center and Mission Community Hospital.
Demographics
As of the 2010 census, there were 77,058 people, 24,813 households, and 19,845 families residing in the city. The population density was 3,164.3 people per square mile (1,220.7/km2). The racial makeup of the city was 77.2% White, 0.7% African American, 0.5% Native American, 0.5% Asian, 0.1% Pacific Islander, 19.3% from other races, and 2.7% from two or more races. Hispanic or Latino of any race were 97.2% of the population.
The median income for a household in the city was $30,917, and the median income for a family was $35,945. Males had a median income of $27,917 versus $20,945 for females. The per capita income for the city was $13,845. About 22.2% of families and 25.7% of the population were below the poverty line, including 36.2% of those under age 18 and 16.2% of those age 65 or over.
Common Questions
What is Per Capita Income in Mission?
Per Capita income in Mission is $17,677.
What is the Median Family Income in Mission?
Median Family Income in Mission is $44,375.
What is the Median Household income in Mission?
Median Household Income in Mission is $41,500.
What is Income or Wage Gap in Mission?
Income or Wage Gap in Mission is 5.4%.
Women in Mission earn 94.6 cents for every dollar earned by a man.
What is Family Income Deficit in Mission?
Family Income Deficit in Mission is $13,745.
Families that are below poverty line in Mission earn $13,745 less on average than the poverty threshold level.
What is Inequality or Gini Index in Mission?
Inequality or Gini Index in Mission is 0.50.
What is the Total Population of Mission?
Total Population of Mission is 1,024.
What is the Total Male Population of Mission?
Total Male Population of Mission is 511.
What is the Total Female Population of Mission?
Total Female Population of Mission is 513.
What is the Ratio of Males per 100 Females in Mission?
There are 99.61 Males per 100 Females in Mission.
What is the Ratio of Females per 100 Males in Mission?
There are 100.39 Females per 100 Males in Mission.
What is the Median Population Age in Mission?
Median Population Age in Mission is 23.9 Years.
What is the Average Family Size in Mission
Average Family Size in Mission is 4.2 People.
What is the Average Household Size in Mission
Average Household Size in Mission is 3.7 People.
How Large is the Labor Force in Mission?
There are 371 People in the Labor Forcein in Mission.
What is the Percentage of People in the Labor Force in Mission?
48.1% of People are in the Labor Force in Mission.
What is the Unemployment Rate in Mission?
Unemployment Rate in Mission is 20.2%.