Maywood Park, OR Map & Demographics
Maywood Park Map
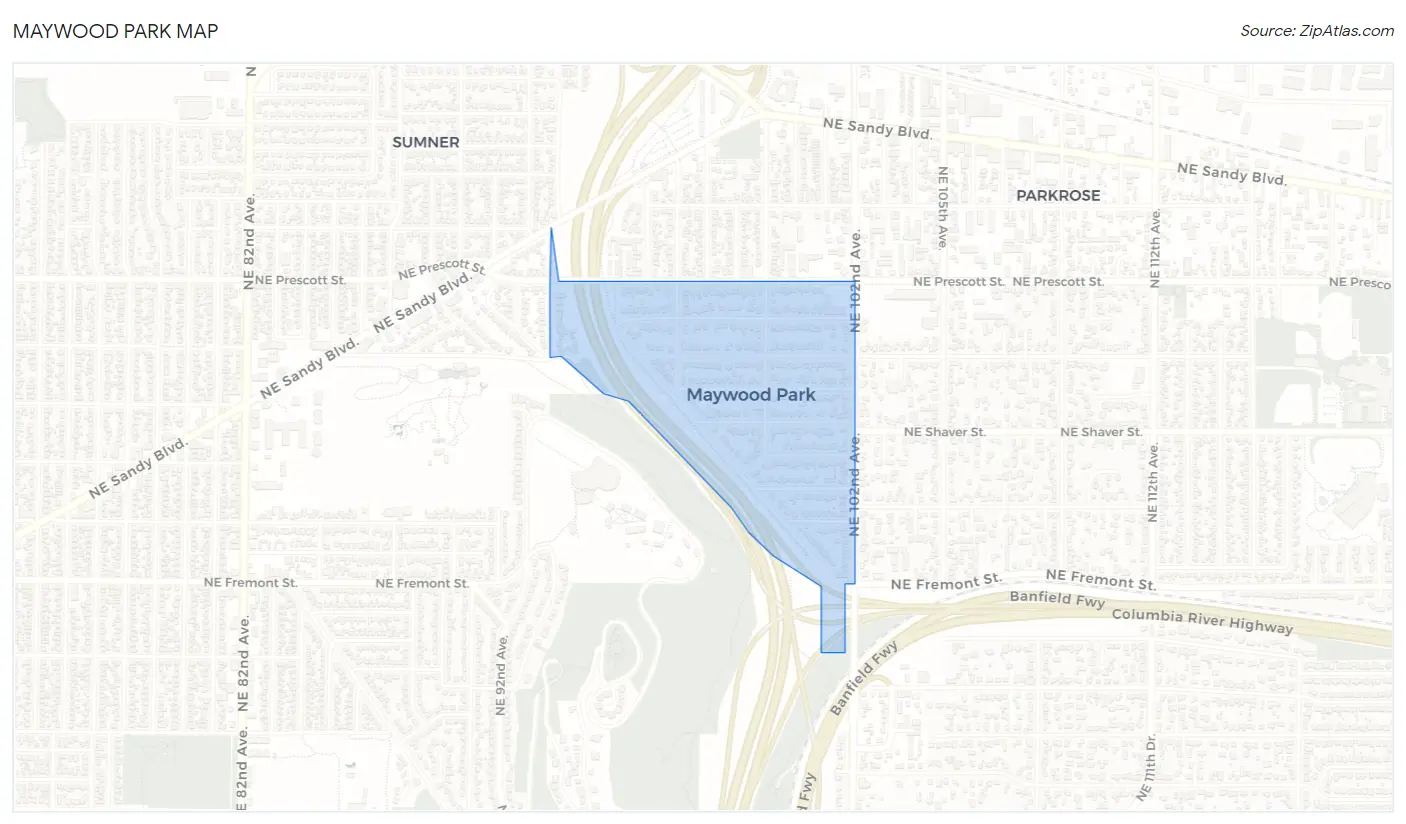
Maywood Park Overview
$57,078
PER CAPITA INCOME
$137,188
AVG FAMILY INCOME
$130,481
AVG HOUSEHOLD INCOME
32.3%
WAGE / INCOME GAP [ % ]
67.7¢/ $1
WAGE / INCOME GAP [ $ ]
0.40
INEQUALITY / GINI INDEX
1,043
TOTAL POPULATION
512
MALE POPULATION
531
FEMALE POPULATION
96.42
MALES / 100 FEMALES
103.71
FEMALES / 100 MALES
44.7
MEDIAN AGE
2.8
AVG FAMILY SIZE
2.8
AVG HOUSEHOLD SIZE
553
LABOR FORCE [ PEOPLE ]
62.1%
PERCENT IN LABOR FORCE
2.0%
UNEMPLOYMENT RATE
Income in Maywood Park
Income Overview in Maywood Park
Per Capita Income in Maywood Park is $57,078, while median incomes of families and households are $137,188 and $130,481 respectively.
| Characteristic | Number | Measure |
| Per Capita Income | 1,043 | $57,078 |
| Median Family Income | 279 | $137,188 |
| Mean Family Income | 279 | $174,541 |
| Median Household Income | 371 | $130,481 |
| Mean Household Income | 371 | $159,792 |
| Income Deficit | 279 | $0 |
| Wage / Income Gap (%) | 1,043 | 32.33% |
| Wage / Income Gap ($) | 1,043 | 67.67¢ per $1 |
| Gini / Inequality Index | 1,043 | 0.40 |
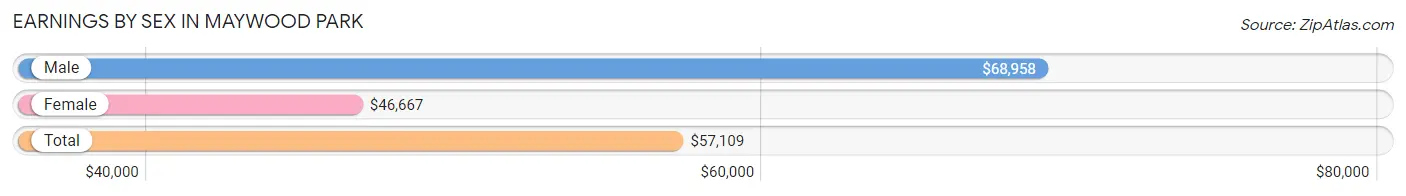
Earnings by Sex in Maywood Park
Average Earnings in Maywood Park are $57,109, $68,958 for men and $46,667 for women, a difference of 32.3%.
| Sex | Number | Average Earnings |
| Male | 307 (51.6%) | $68,958 |
| Female | 288 (48.4%) | $46,667 |
| Total | 595 (100.0%) | $57,109 |
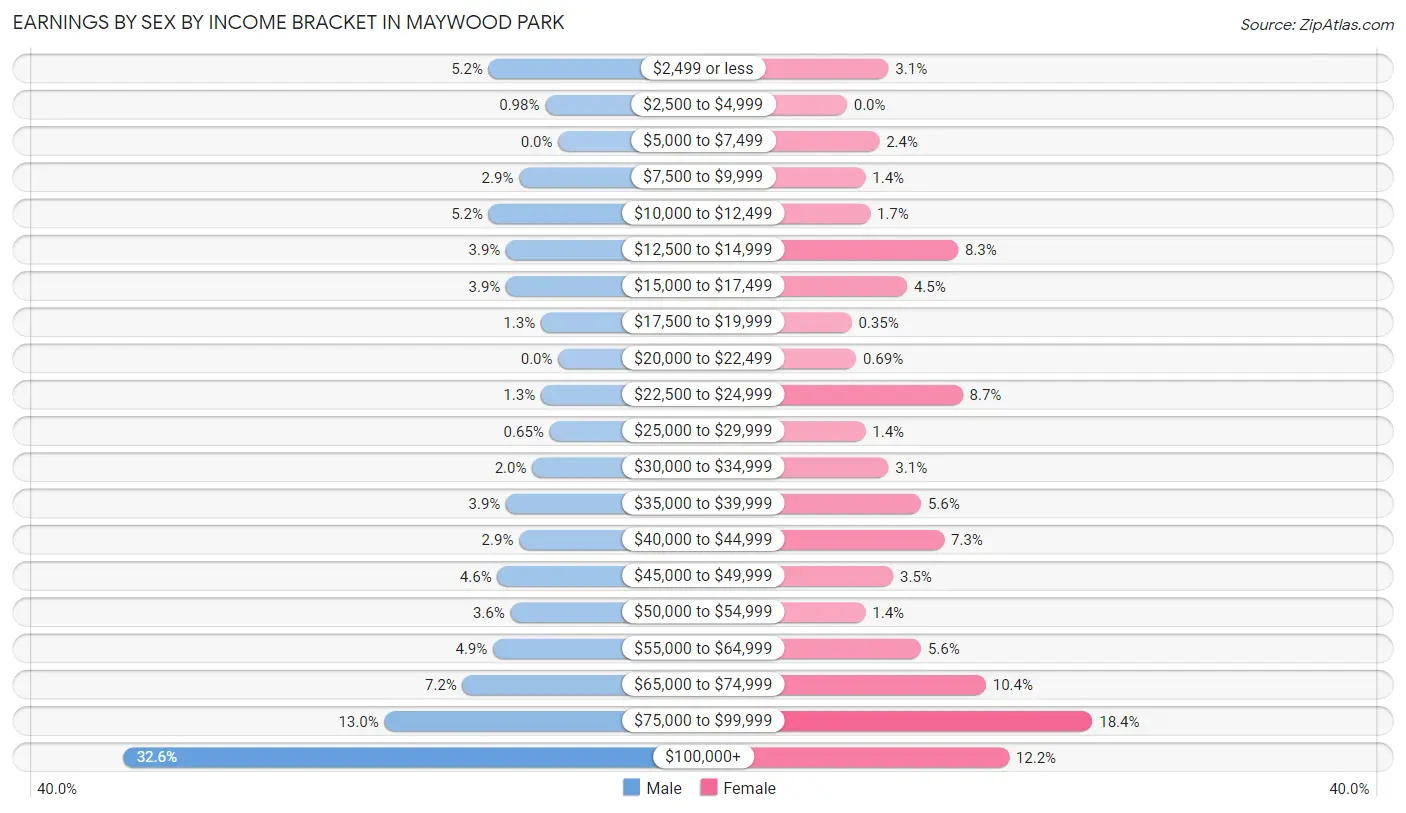
Earnings by Sex by Income Bracket in Maywood Park
The most common earnings brackets in Maywood Park are $100,000+ for men (100 | 32.6%) and $75,000 to $99,999 for women (53 | 18.4%).
| Income | Male | Female |
| $2,499 or less | 16 (5.2%) | 9 (3.1%) |
| $2,500 to $4,999 | 3 (1.0%) | 0 (0.0%) |
| $5,000 to $7,499 | 0 (0.0%) | 7 (2.4%) |
| $7,500 to $9,999 | 9 (2.9%) | 4 (1.4%) |
| $10,000 to $12,499 | 16 (5.2%) | 5 (1.7%) |
| $12,500 to $14,999 | 12 (3.9%) | 24 (8.3%) |
| $15,000 to $17,499 | 12 (3.9%) | 13 (4.5%) |
| $17,500 to $19,999 | 4 (1.3%) | 1 (0.4%) |
| $20,000 to $22,499 | 0 (0.0%) | 2 (0.7%) |
| $22,500 to $24,999 | 4 (1.3%) | 25 (8.7%) |
| $25,000 to $29,999 | 2 (0.6%) | 4 (1.4%) |
| $30,000 to $34,999 | 6 (1.9%) | 9 (3.1%) |
| $35,000 to $39,999 | 12 (3.9%) | 16 (5.6%) |
| $40,000 to $44,999 | 9 (2.9%) | 21 (7.3%) |
| $45,000 to $49,999 | 14 (4.6%) | 10 (3.5%) |
| $50,000 to $54,999 | 11 (3.6%) | 4 (1.4%) |
| $55,000 to $64,999 | 15 (4.9%) | 16 (5.6%) |
| $65,000 to $74,999 | 22 (7.2%) | 30 (10.4%) |
| $75,000 to $99,999 | 40 (13.0%) | 53 (18.4%) |
| $100,000+ | 100 (32.6%) | 35 (12.1%) |
| Total | 307 (100.0%) | 288 (100.0%) |
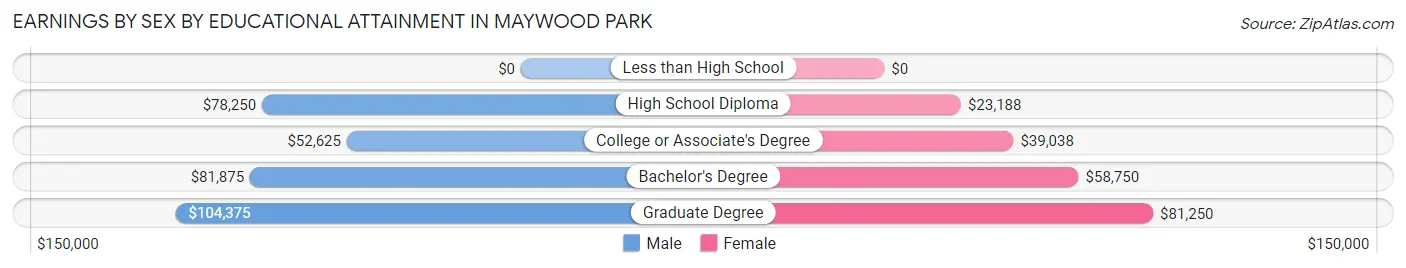
Earnings by Sex by Educational Attainment in Maywood Park
Average earnings in Maywood Park are $72,500 for men and $48,750 for women, a difference of 32.8%. Men with an educational attainment of graduate degree enjoy the highest average annual earnings of $104,375, while those with college or associate's degree education earn the least with $52,625. Women with an educational attainment of graduate degree earn the most with the average annual earnings of $81,250, while those with high school diploma education have the smallest earnings of $23,188.
| Educational Attainment | Male Income | Female Income |
| Less than High School | - | - |
| High School Diploma | $78,250 | $23,188 |
| College or Associate's Degree | $52,625 | $39,038 |
| Bachelor's Degree | $81,875 | $58,750 |
| Graduate Degree | $104,375 | $81,250 |
| Total | $72,500 | $48,750 |
Family Income in Maywood Park
Family Income Brackets in Maywood Park
According to the Maywood Park family income data, there are 82 families falling into the $100,000 to $149,999 income range, which is the most common income bracket and makes up 29.4% of all families.
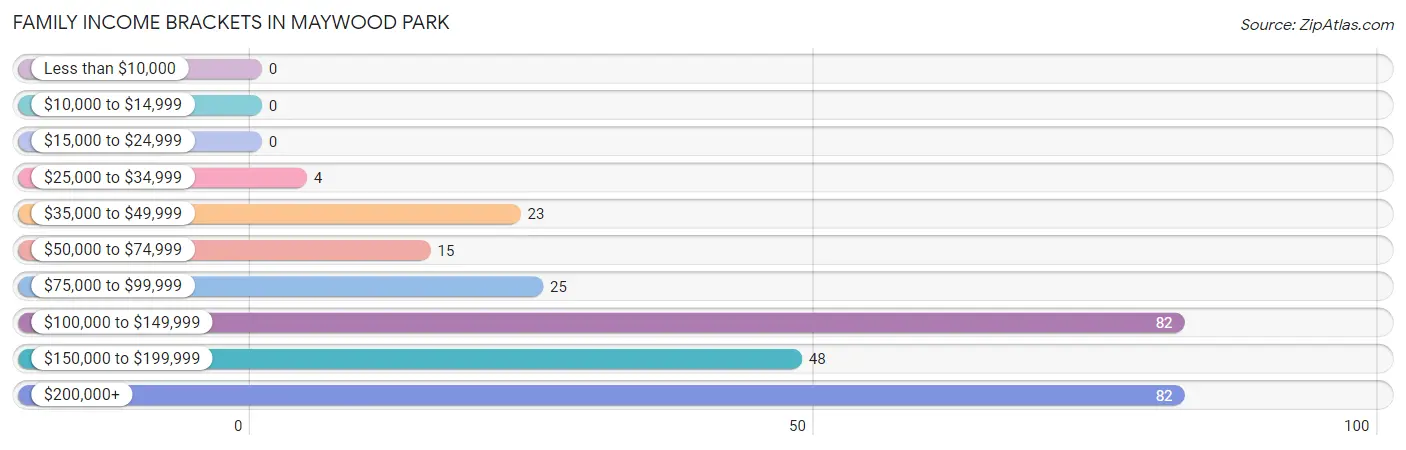
| Income Bracket | # Families | % Families |
| Less than $10,000 | 0 | 0.0% |
| $10,000 to $14,999 | 0 | 0.0% |
| $15,000 to $24,999 | 0 | 0.0% |
| $25,000 to $34,999 | 4 | 1.4% |
| $35,000 to $49,999 | 23 | 8.2% |
| $50,000 to $74,999 | 15 | 5.4% |
| $75,000 to $99,999 | 25 | 9.0% |
| $100,000 to $149,999 | 82 | 29.4% |
| $150,000 to $199,999 | 48 | 17.2% |
| $200,000+ | 82 | 29.4% |
Family Income by Famaliy Size in Maywood Park
4-person families (59 | 21.1%) account for the highest median family income in Maywood Park with $197,083 per family, while 2-person families (139 | 49.8%) have the highest median income of $61,172 per family member.
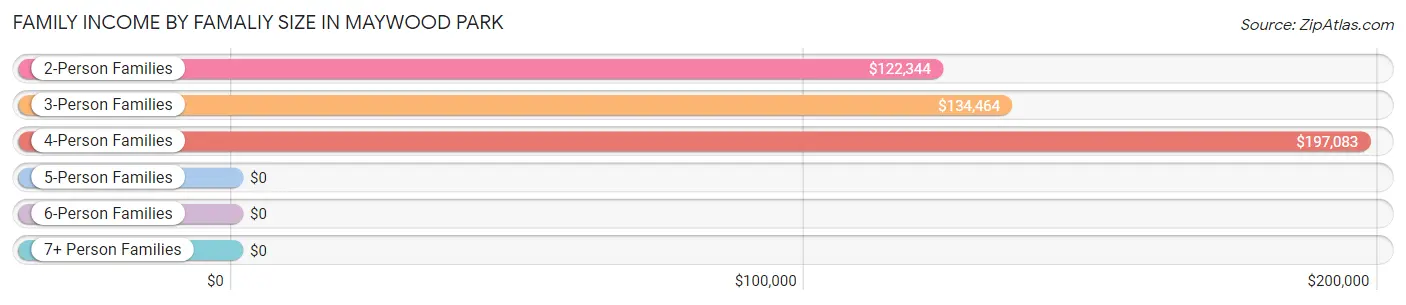
| Income Bracket | # Families | Median Income |
| 2-Person Families | 139 (49.8%) | $122,344 |
| 3-Person Families | 73 (26.2%) | $134,464 |
| 4-Person Families | 59 (21.1%) | $197,083 |
| 5-Person Families | 2 (0.7%) | $0 |
| 6-Person Families | 6 (2.1%) | $0 |
| 7+ Person Families | 0 (0.0%) | $0 |
| Total | 279 (100.0%) | $137,188 |
Family Income by Number of Earners in Maywood Park
The median family income in Maywood Park is $137,188, with families comprising 3+ earners (13) having the highest median family income of $250,001, while families with 1 earner (55) have the lowest median family income of $95,625, accounting for 4.7% and 19.7% of families, respectively.
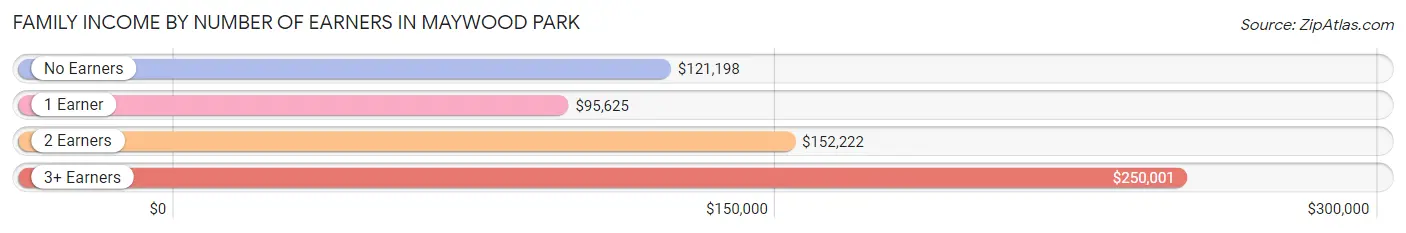
| Number of Earners | # Families | Median Income |
| No Earners | 35 (12.5%) | $121,198 |
| 1 Earner | 55 (19.7%) | $95,625 |
| 2 Earners | 176 (63.1%) | $152,222 |
| 3+ Earners | 13 (4.7%) | $250,001 |
| Total | 279 (100.0%) | $137,188 |
Household Income in Maywood Park
Household Income Brackets in Maywood Park
With 102 households falling in the category, the $100,000 to $149,999 income range is the most frequent in Maywood Park, accounting for 27.5% of all households. In contrast, only 2 households (0.5%) fall into the $25,000 to $34,999 income bracket, making it the least populous group.
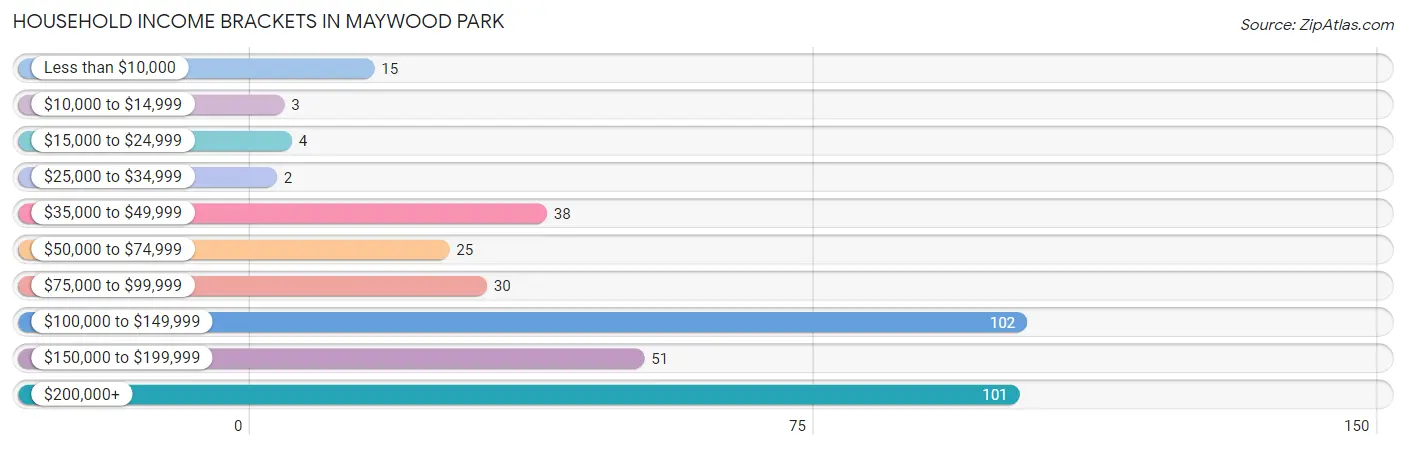
| Income Bracket | # Households | % Households |
| Less than $10,000 | 15 | 4.0% |
| $10,000 to $14,999 | 3 | 0.8% |
| $15,000 to $24,999 | 4 | 1.1% |
| $25,000 to $34,999 | 2 | 0.5% |
| $35,000 to $49,999 | 38 | 10.2% |
| $50,000 to $74,999 | 25 | 6.7% |
| $75,000 to $99,999 | 30 | 8.1% |
| $100,000 to $149,999 | 102 | 27.5% |
| $150,000 to $199,999 | 51 | 13.7% |
| $200,000+ | 101 | 27.2% |
Household Income by Householder Age in Maywood Park
The median household income in Maywood Park is $130,481, with the highest median household income of $174,583 found in the 25 to 44 years age bracket for the primary householder. A total of 107 households (28.8%) fall into this category.
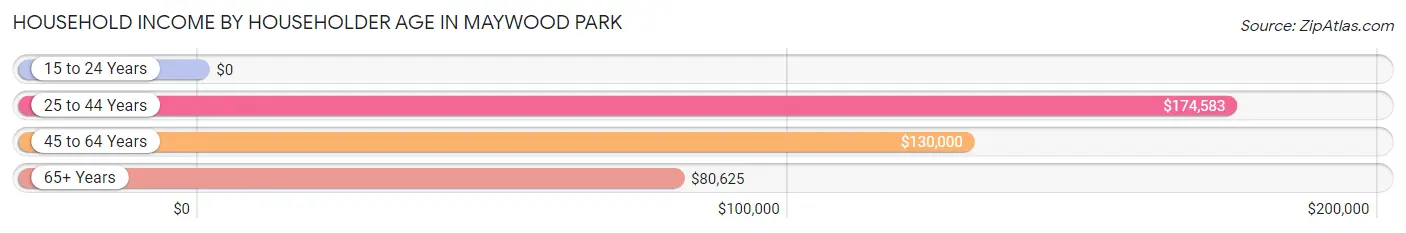
| Income Bracket | # Households | Median Income |
| 15 to 24 Years | 0 (0.0%) | $0 |
| 25 to 44 Years | 107 (28.8%) | $174,583 |
| 45 to 64 Years | 176 (47.4%) | $130,000 |
| 65+ Years | 88 (23.7%) | $80,625 |
| Total | 371 (100.0%) | $130,481 |
Poverty in Maywood Park
Income Below Poverty by Sex and Age in Maywood Park
With 4.7% poverty level for males and 3.2% for females among the residents of Maywood Park, 25 to 34 year old males and 18 to 24 year old females are the most vulnerable to poverty, with 15 males (18.8%) and 2 females (22.2%) in their respective age groups living below the poverty level.
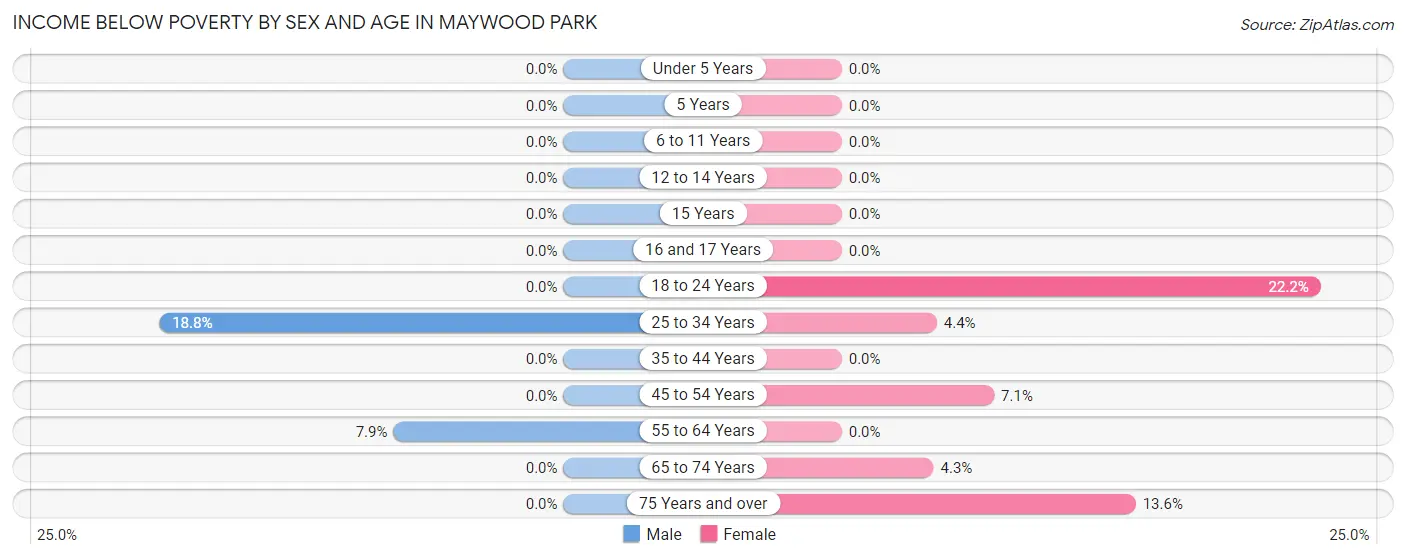
| Age Bracket | Male | Female |
| Under 5 Years | 0 (0.0%) | 0 (0.0%) |
| 5 Years | 0 (0.0%) | 0 (0.0%) |
| 6 to 11 Years | 0 (0.0%) | 0 (0.0%) |
| 12 to 14 Years | 0 (0.0%) | 0 (0.0%) |
| 15 Years | 0 (0.0%) | 0 (0.0%) |
| 16 and 17 Years | 0 (0.0%) | 0 (0.0%) |
| 18 to 24 Years | 0 (0.0%) | 2 (22.2%) |
| 25 to 34 Years | 15 (18.8%) | 3 (4.4%) |
| 35 to 44 Years | 0 (0.0%) | 0 (0.0%) |
| 45 to 54 Years | 0 (0.0%) | 7 (7.1%) |
| 55 to 64 Years | 9 (7.9%) | 0 (0.0%) |
| 65 to 74 Years | 0 (0.0%) | 2 (4.3%) |
| 75 Years and over | 0 (0.0%) | 3 (13.6%) |
| Total | 24 (4.7%) | 17 (3.2%) |
Income Above Poverty by Sex and Age in Maywood Park
According to the poverty statistics in Maywood Park, males aged under 5 years and females aged under 5 years are the age groups that are most secure financially, with 100.0% of males and 100.0% of females in these age groups living above the poverty line.
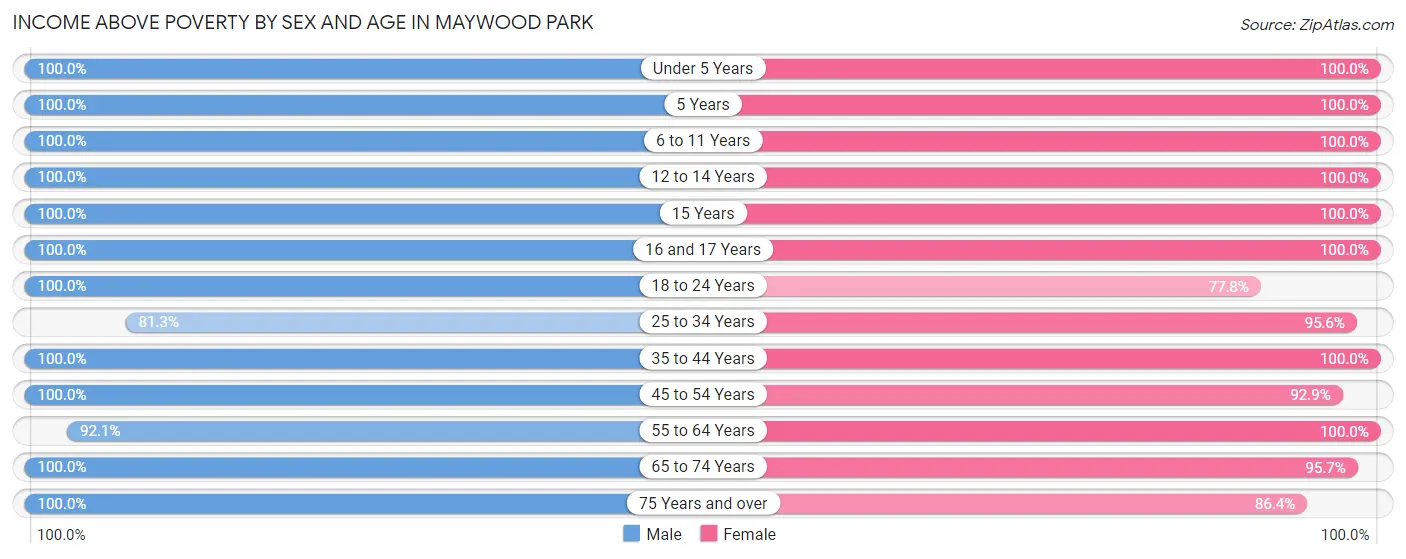
| Age Bracket | Male | Female |
| Under 5 Years | 30 (100.0%) | 22 (100.0%) |
| 5 Years | 4 (100.0%) | 13 (100.0%) |
| 6 to 11 Years | 12 (100.0%) | 18 (100.0%) |
| 12 to 14 Years | 12 (100.0%) | 25 (100.0%) |
| 15 Years | 6 (100.0%) | 2 (100.0%) |
| 16 and 17 Years | 39 (100.0%) | 3 (100.0%) |
| 18 to 24 Years | 17 (100.0%) | 7 (77.8%) |
| 25 to 34 Years | 65 (81.2%) | 65 (95.6%) |
| 35 to 44 Years | 69 (100.0%) | 88 (100.0%) |
| 45 to 54 Years | 48 (100.0%) | 92 (92.9%) |
| 55 to 64 Years | 105 (92.1%) | 111 (100.0%) |
| 65 to 74 Years | 50 (100.0%) | 45 (95.7%) |
| 75 Years and over | 27 (100.0%) | 19 (86.4%) |
| Total | 484 (95.3%) | 510 (96.8%) |
Income Below Poverty Among Married-Couple Families in Maywood Park
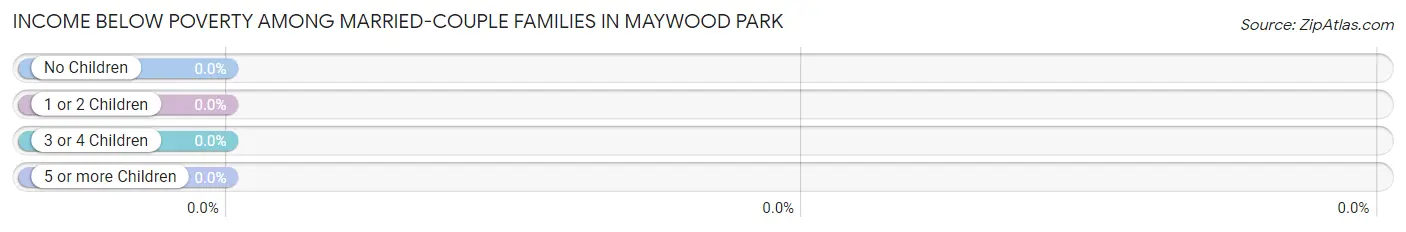
| Children | Above Poverty | Below Poverty |
| No Children | 139 (100.0%) | 0 (0.0%) |
| 1 or 2 Children | 99 (100.0%) | 0 (0.0%) |
| 3 or 4 Children | 8 (100.0%) | 0 (0.0%) |
| 5 or more Children | 0 (0.0%) | 0 (0.0%) |
| Total | 246 (100.0%) | 0 (0.0%) |
Income Below Poverty Among Single-Parent Households in Maywood Park
| Children | Single Father | Single Mother |
| No Children | 0 (0.0%) | 0 (0.0%) |
| 1 or 2 Children | 0 (0.0%) | 0 (0.0%) |
| 3 or 4 Children | 0 (0.0%) | 0 (0.0%) |
| 5 or more Children | 0 (0.0%) | 0 (0.0%) |
| Total | 0 (0.0%) | 0 (0.0%) |
Income Below Poverty Among Married-Couple vs Single-Parent Households in Maywood Park

| Children | Married-Couple Families | Single-Parent Households |
| No Children | 0 (0.0%) | 0 (0.0%) |
| 1 or 2 Children | 0 (0.0%) | 0 (0.0%) |
| 3 or 4 Children | 0 (0.0%) | 0 (0.0%) |
| 5 or more Children | 0 (0.0%) | 0 (0.0%) |
| Total | 0 (0.0%) | 0 (0.0%) |
Race in Maywood Park
The most populous races in Maywood Park are White / Caucasian (935 | 89.6%), Hispanic or Latino (71 | 6.8%), and Two or more Races (51 | 4.9%).
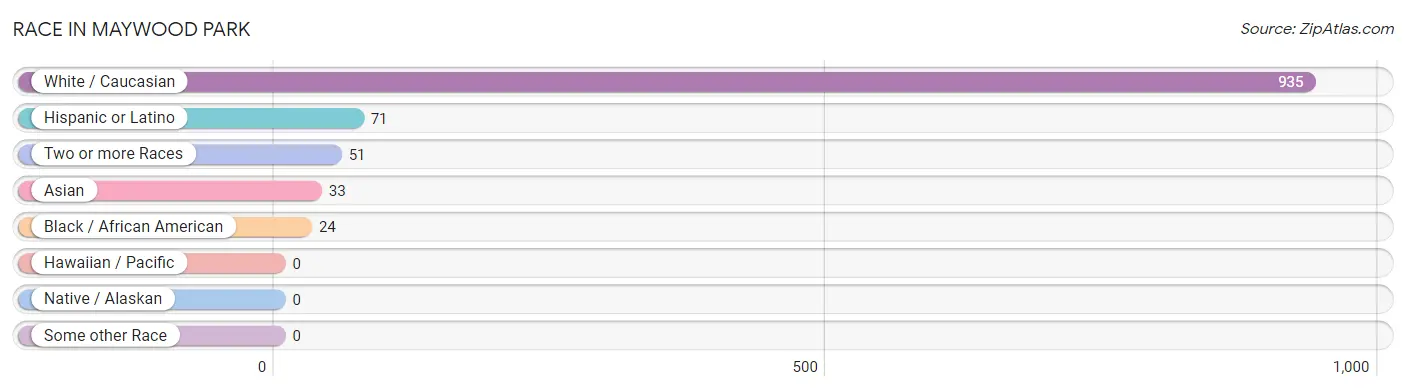
| Race | # Population | % Population |
| Asian | 33 | 3.2% |
| Black / African American | 24 | 2.3% |
| Hawaiian / Pacific | 0 | 0.0% |
| Hispanic or Latino | 71 | 6.8% |
| Native / Alaskan | 0 | 0.0% |
| White / Caucasian | 935 | 89.6% |
| Two or more Races | 51 | 4.9% |
| Some other Race | 0 | 0.0% |
| Total | 1,043 | 100.0% |
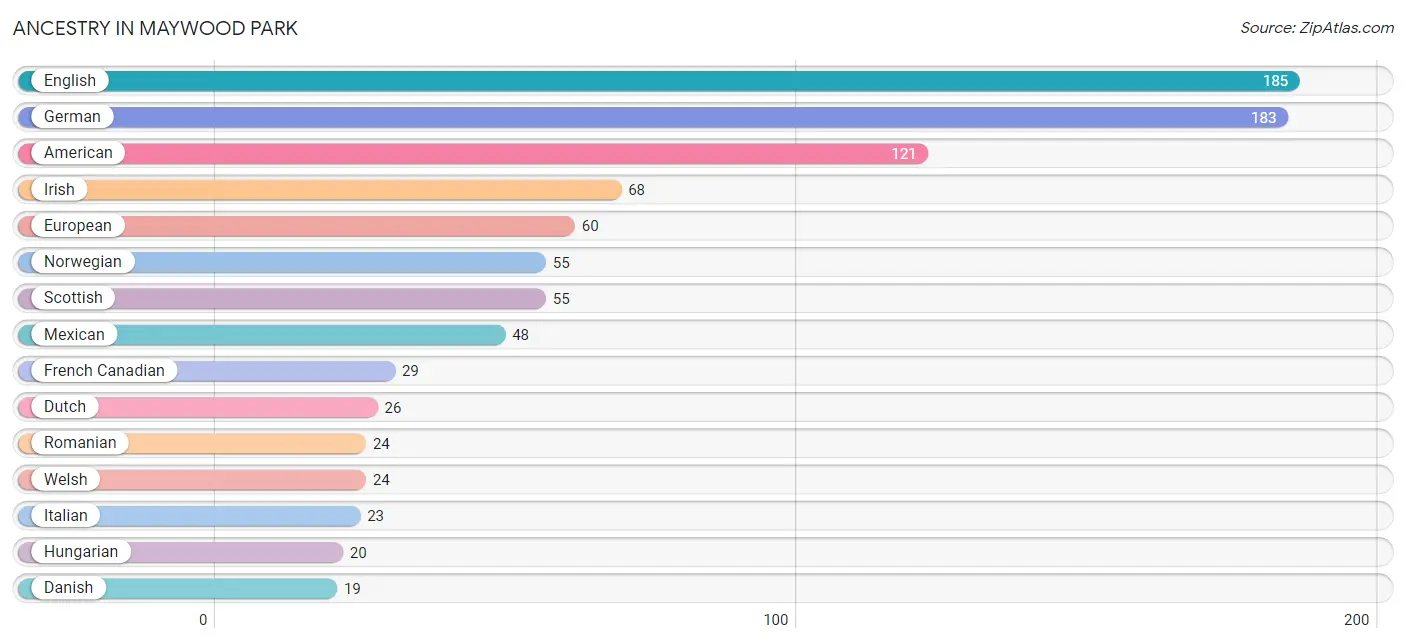
Ancestry in Maywood Park
The most populous ancestries reported in Maywood Park are English (185 | 17.7%), German (183 | 17.5%), American (121 | 11.6%), Irish (68 | 6.5%), and European (60 | 5.8%), together accounting for 59.2% of all Maywood Park residents.
| Ancestry | # Population | % Population |
| American | 121 | 11.6% |
| Arab | 3 | 0.3% |
| Belgian | 1 | 0.1% |
| British | 10 | 1.0% |
| Burmese | 12 | 1.1% |
| Cherokee | 7 | 0.7% |
| Croatian | 4 | 0.4% |
| Cuban | 6 | 0.6% |
| Czech | 6 | 0.6% |
| Czechoslovakian | 1 | 0.1% |
| Danish | 19 | 1.8% |
| Dutch | 26 | 2.5% |
| Eastern European | 3 | 0.3% |
| English | 185 | 17.7% |
| European | 60 | 5.8% |
| Finnish | 11 | 1.1% |
| French | 12 | 1.1% |
| French Canadian | 29 | 2.8% |
| German | 183 | 17.5% |
| Greek | 5 | 0.5% |
| Hungarian | 20 | 1.9% |
| Indian (Asian) | 5 | 0.5% |
| Irish | 68 | 6.5% |
| Italian | 23 | 2.2% |
| Lebanese | 3 | 0.3% |
| Luxembourger | 3 | 0.3% |
| Malaysian | 4 | 0.4% |
| Maltese | 2 | 0.2% |
| Mexican | 48 | 4.6% |
| Native Hawaiian | 2 | 0.2% |
| Norwegian | 55 | 5.3% |
| Polish | 9 | 0.9% |
| Portuguese | 2 | 0.2% |
| Puerto Rican | 9 | 0.9% |
| Puget Sound Salish | 2 | 0.2% |
| Romanian | 24 | 2.3% |
| Scandinavian | 1 | 0.1% |
| Scotch-Irish | 9 | 0.9% |
| Scottish | 55 | 5.3% |
| Spaniard | 8 | 0.8% |
| Sri Lankan | 8 | 0.8% |
| Swedish | 15 | 1.4% |
| Swiss | 1 | 0.1% |
| Thai | 7 | 0.7% |
| Ukrainian | 1 | 0.1% |
| Welsh | 24 | 2.3% |
| Yakama | 2 | 0.2% |
| Yugoslavian | 1 | 0.1% | View All 48 Rows |
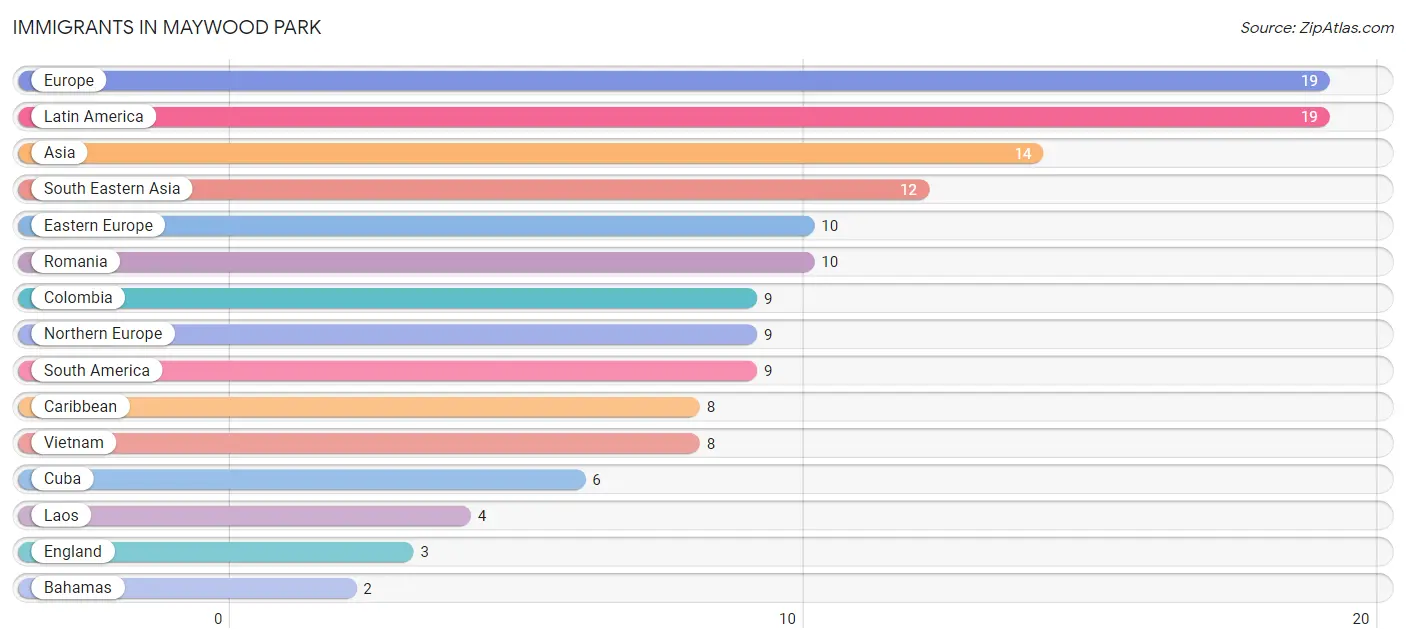
Immigrants in Maywood Park
The most numerous immigrant groups reported in Maywood Park came from Europe (19 | 1.8%), Latin America (19 | 1.8%), Asia (14 | 1.3%), South Eastern Asia (12 | 1.1%), and Eastern Europe (10 | 1.0%), together accounting for 7.1% of all Maywood Park residents.
| Immigration Origin | # Population | % Population |
| Asia | 14 | 1.3% |
| Bahamas | 2 | 0.2% |
| Caribbean | 8 | 0.8% |
| Central America | 2 | 0.2% |
| Colombia | 9 | 0.9% |
| Cuba | 6 | 0.6% |
| Denmark | 2 | 0.2% |
| Eastern Europe | 10 | 1.0% |
| England | 3 | 0.3% |
| Europe | 19 | 1.8% |
| Laos | 4 | 0.4% |
| Latin America | 19 | 1.8% |
| Mexico | 2 | 0.2% |
| Northern Europe | 9 | 0.9% |
| Oceania | 1 | 0.1% |
| Romania | 10 | 1.0% |
| South America | 9 | 0.9% |
| South Central Asia | 2 | 0.2% |
| South Eastern Asia | 12 | 1.1% |
| Sri Lanka | 2 | 0.2% |
| Vietnam | 8 | 0.8% | View All 21 Rows |
Sex and Age in Maywood Park
Sex and Age in Maywood Park
The most populous age groups in Maywood Park are 60 to 64 Years (71 | 13.9%) for men and 60 to 64 Years (91 | 17.1%) for women.
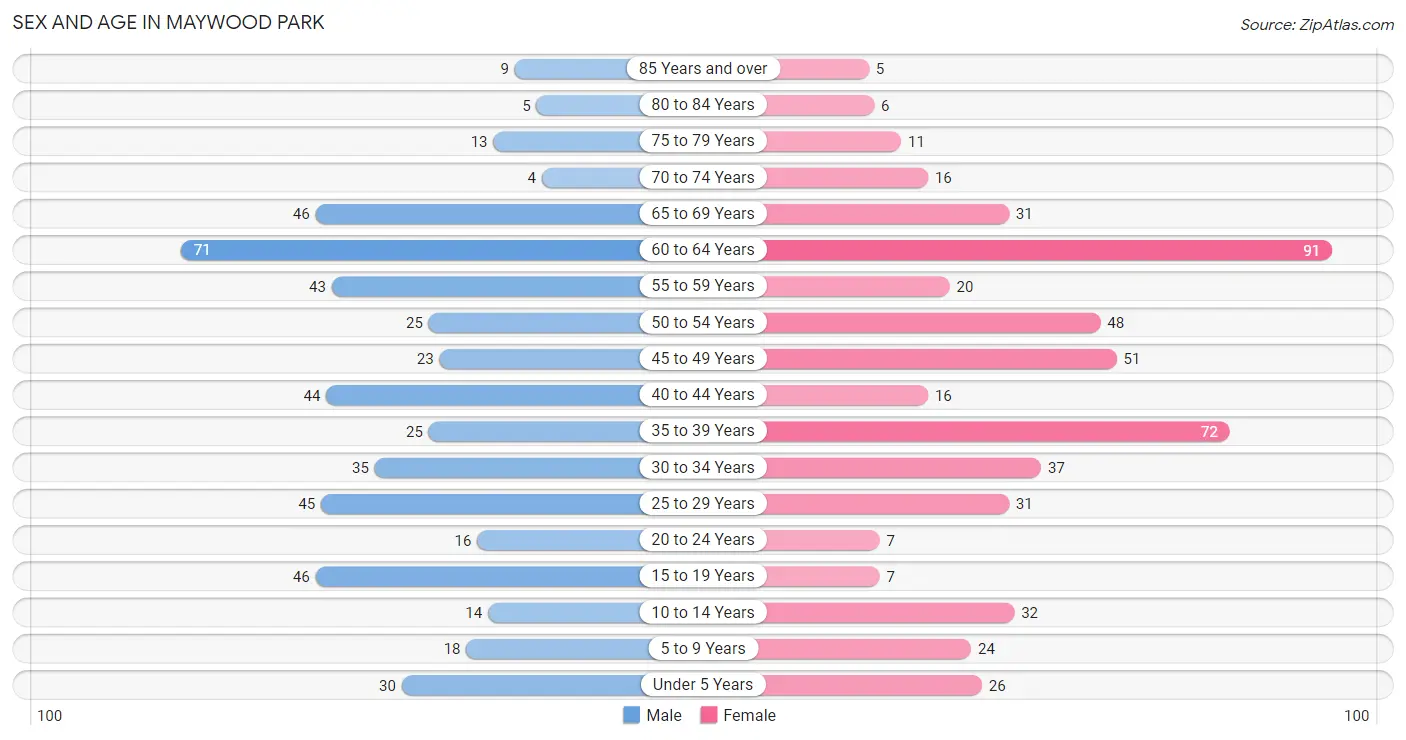
| Age Bracket | Male | Female |
| Under 5 Years | 30 (5.9%) | 26 (4.9%) |
| 5 to 9 Years | 18 (3.5%) | 24 (4.5%) |
| 10 to 14 Years | 14 (2.7%) | 32 (6.0%) |
| 15 to 19 Years | 46 (9.0%) | 7 (1.3%) |
| 20 to 24 Years | 16 (3.1%) | 7 (1.3%) |
| 25 to 29 Years | 45 (8.8%) | 31 (5.8%) |
| 30 to 34 Years | 35 (6.8%) | 37 (7.0%) |
| 35 to 39 Years | 25 (4.9%) | 72 (13.6%) |
| 40 to 44 Years | 44 (8.6%) | 16 (3.0%) |
| 45 to 49 Years | 23 (4.5%) | 51 (9.6%) |
| 50 to 54 Years | 25 (4.9%) | 48 (9.0%) |
| 55 to 59 Years | 43 (8.4%) | 20 (3.8%) |
| 60 to 64 Years | 71 (13.9%) | 91 (17.1%) |
| 65 to 69 Years | 46 (9.0%) | 31 (5.8%) |
| 70 to 74 Years | 4 (0.8%) | 16 (3.0%) |
| 75 to 79 Years | 13 (2.5%) | 11 (2.1%) |
| 80 to 84 Years | 5 (1.0%) | 6 (1.1%) |
| 85 Years and over | 9 (1.8%) | 5 (0.9%) |
| Total | 512 (100.0%) | 531 (100.0%) |
Families and Households in Maywood Park
Median Family Size in Maywood Park
The median family size in Maywood Park is 2.80 persons per family, with single female/mother families (26 | 9.3%) accounting for the largest median family size of 2.85 persons per family. On the other hand, single male/father families (7 | 2.5%) represent the smallest median family size with 1.57 persons per family.
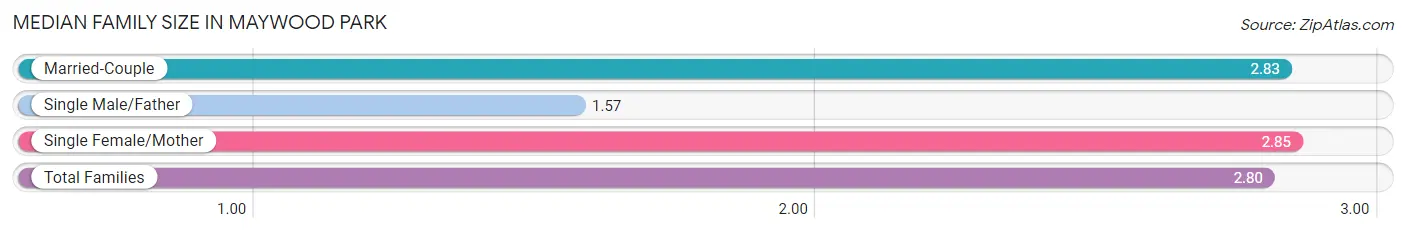
| Family Type | # Families | Family Size |
| Married-Couple | 246 (88.2%) | 2.83 |
| Single Male/Father | 7 (2.5%) | 1.57 |
| Single Female/Mother | 26 (9.3%) | 2.85 |
| Total Families | 279 (100.0%) | 2.80 |
Median Household Size in Maywood Park
The median household size in Maywood Park is 2.80 persons per household, with single female/mother households (26 | 7.0%) accounting for the largest median household size of 3.08 persons per household. single male/father households (7 | 1.9%) represent the smallest median household size with 1.86 persons per household.
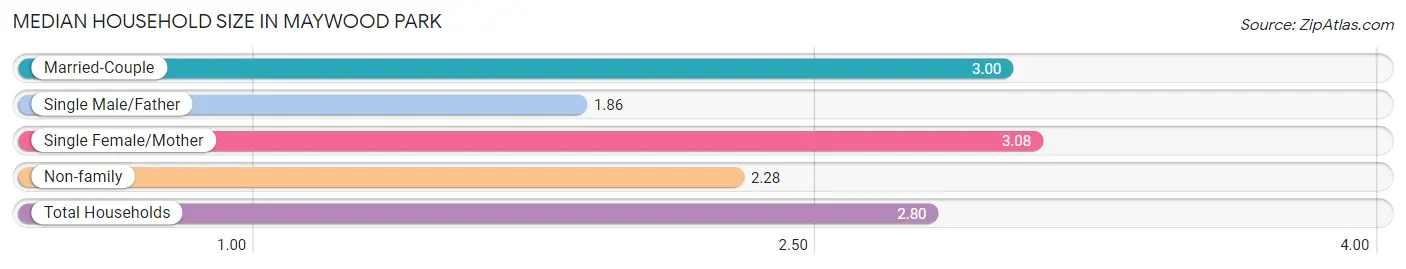
| Household Type | # Households | Household Size |
| Married-Couple | 246 (66.3%) | 3.00 |
| Single Male/Father | 7 (1.9%) | 1.86 |
| Single Female/Mother | 26 (7.0%) | 3.08 |
| Non-family | 92 (24.8%) | 2.28 |
| Total Households | 371 (100.0%) | 2.80 |
Household Size by Marriage Status in Maywood Park
Out of a total of 371 households in Maywood Park, 279 (75.2%) are family households, while 92 (24.8%) are nonfamily households. The most numerous type of family households are 2-person households, comprising 117, and the most common type of nonfamily households are 1-person households, comprising 48.
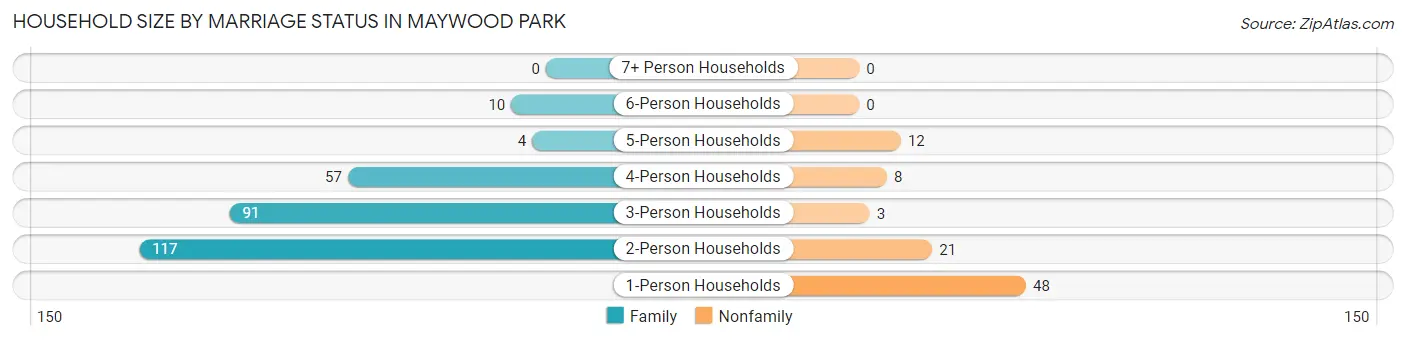
| Household Size | Family Households | Nonfamily Households |
| 1-Person Households | - | 48 (12.9%) |
| 2-Person Households | 117 (31.5%) | 21 (5.7%) |
| 3-Person Households | 91 (24.5%) | 3 (0.8%) |
| 4-Person Households | 57 (15.4%) | 8 (2.2%) |
| 5-Person Households | 4 (1.1%) | 12 (3.2%) |
| 6-Person Households | 10 (2.7%) | 0 (0.0%) |
| 7+ Person Households | 0 (0.0%) | 0 (0.0%) |
| Total | 279 (75.2%) | 92 (24.8%) |
Female Fertility in Maywood Park
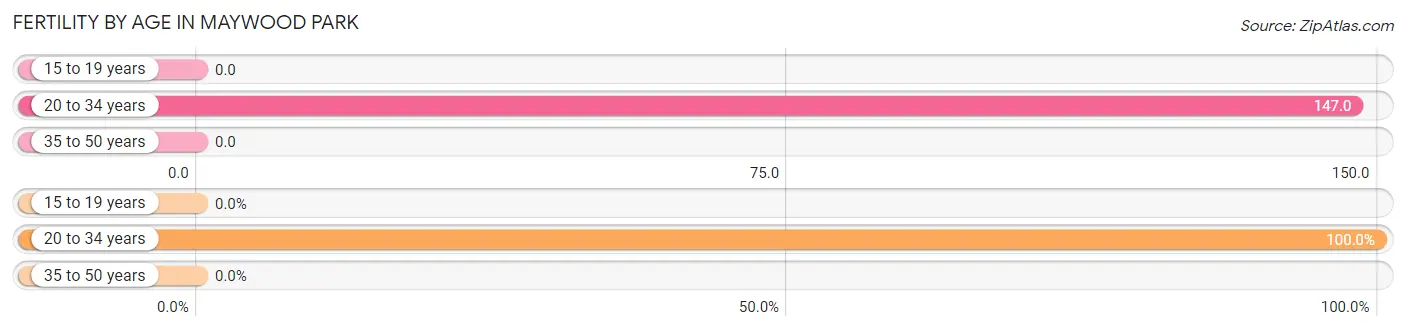
Fertility by Age in Maywood Park
Average fertility rate in Maywood Park is 46.0 births per 1,000 women. Women in the age bracket of 20 to 34 years have the highest fertility rate with 147.0 births per 1,000 women. Women in the age bracket of 20 to 34 years acount for 100.0% of all women with births.
| Age Bracket | Women with Births | Births / 1,000 Women |
| 15 to 19 years | 0 (0.0%) | 0.0 |
| 20 to 34 years | 11 (100.0%) | 147.0 |
| 35 to 50 years | 0 (0.0%) | 0.0 |
| Total | 11 (100.0%) | 46.0 |
Fertility by Age by Marriage Status in Maywood Park
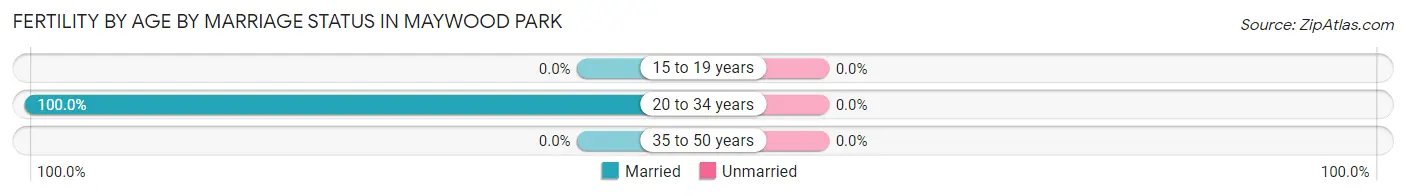
| Age Bracket | Married | Unmarried |
| 15 to 19 years | 0 (0.0%) | 0 (0.0%) |
| 20 to 34 years | 11 (100.0%) | 0 (0.0%) |
| 35 to 50 years | 0 (0.0%) | 0 (0.0%) |
| Total | 11 (100.0%) | 0 (0.0%) |
Fertility by Education in Maywood Park
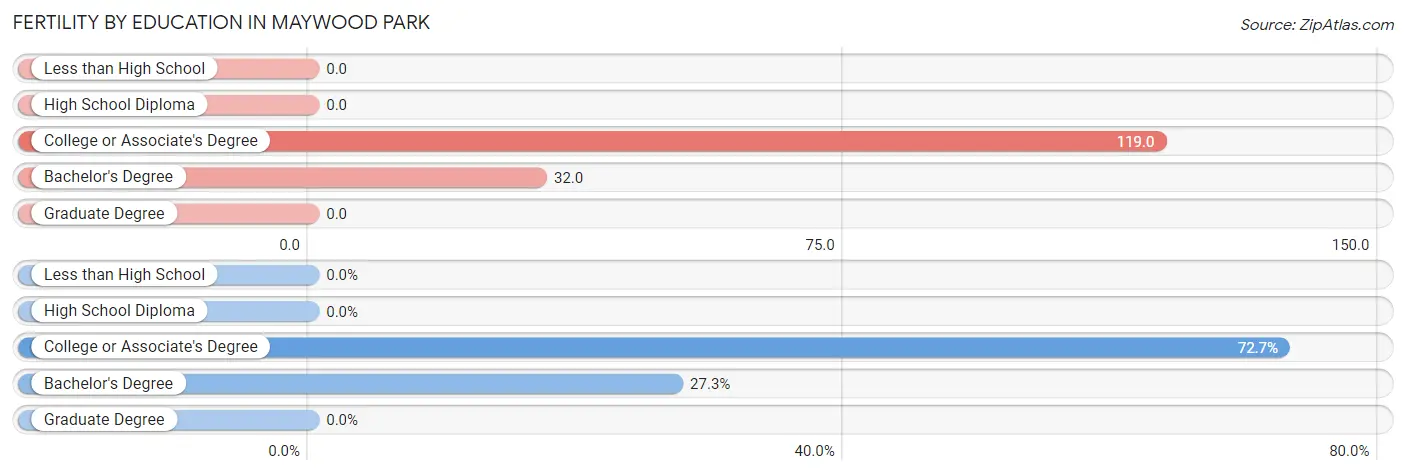
| Educational Attainment | Women with Births | Births / 1,000 Women |
| Less than High School | 0 (0.0%) | 0.0 |
| High School Diploma | 0 (0.0%) | 0.0 |
| College or Associate's Degree | 8 (72.7%) | 119.0 |
| Bachelor's Degree | 3 (27.3%) | 32.0 |
| Graduate Degree | 0 (0.0%) | 0.0 |
| Total | 11 (100.0%) | 46.0 |
Fertility by Education by Marriage Status in Maywood Park
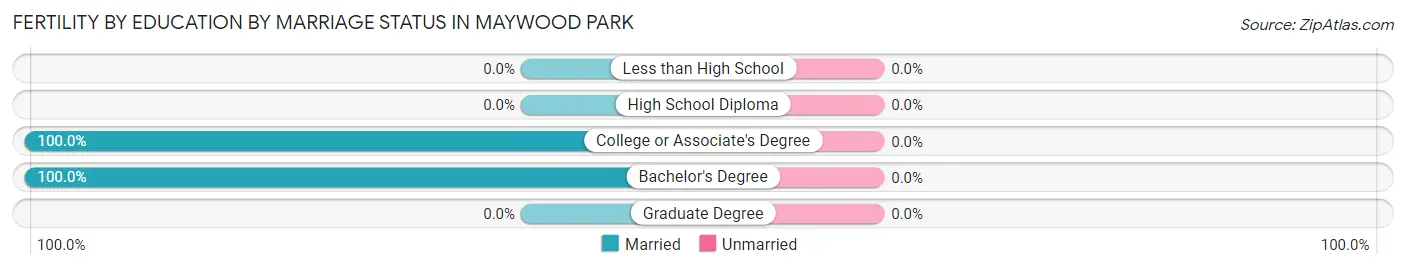
| Educational Attainment | Married | Unmarried |
| Less than High School | 0 (0.0%) | 0 (0.0%) |
| High School Diploma | 0 (0.0%) | 0 (0.0%) |
| College or Associate's Degree | 8 (100.0%) | 0 (0.0%) |
| Bachelor's Degree | 3 (100.0%) | 0 (0.0%) |
| Graduate Degree | 0 (0.0%) | 0 (0.0%) |
| Total | 11 (100.0%) | 0 (0.0%) |
Employment Characteristics in Maywood Park
Employment by Class of Employer in Maywood Park
Among the 541 employed individuals in Maywood Park, private company employees (302 | 55.8%), not-for-profit organizations (70 | 12.9%), and local government employees (38 | 7.0%) make up the most common classes of employment.
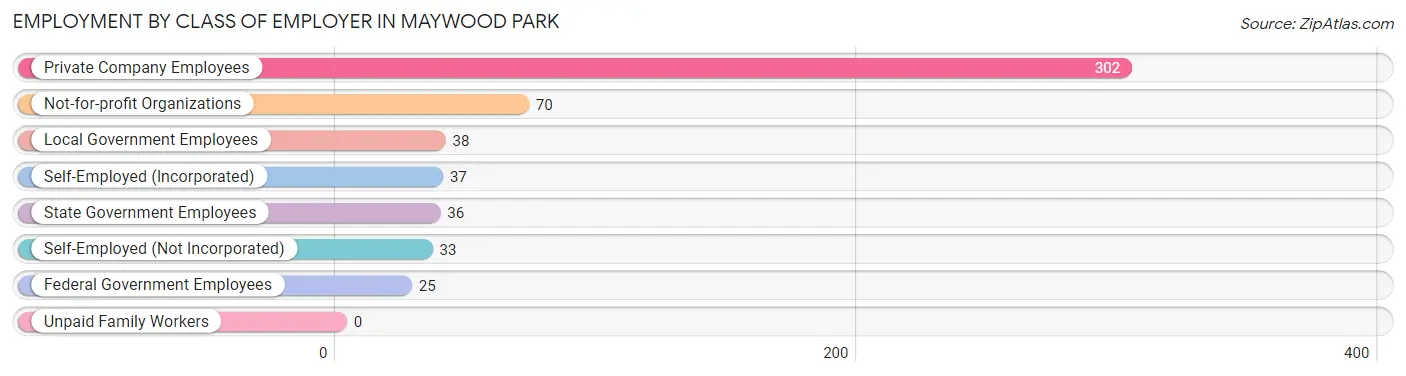
| Employer Class | # Employees | % Employees |
| Private Company Employees | 302 | 55.8% |
| Self-Employed (Incorporated) | 37 | 6.8% |
| Self-Employed (Not Incorporated) | 33 | 6.1% |
| Not-for-profit Organizations | 70 | 12.9% |
| Local Government Employees | 38 | 7.0% |
| State Government Employees | 36 | 6.7% |
| Federal Government Employees | 25 | 4.6% |
| Unpaid Family Workers | 0 | 0.0% |
| Total | 541 | 100.0% |
Employment Status by Age in Maywood Park
According to the labor force statistics for Maywood Park, out of the total population over 16 years of age (891), 62.1% or 553 individuals are in the labor force, with 2.0% or 11 of them unemployed. The age group with the highest labor force participation rate is 35 to 44 years, with 94.3% or 148 individuals in the labor force. Within the labor force, the 25 to 29 years age range has the highest percentage of unemployed individuals, with 12.2% or 6 of them being unemployed.
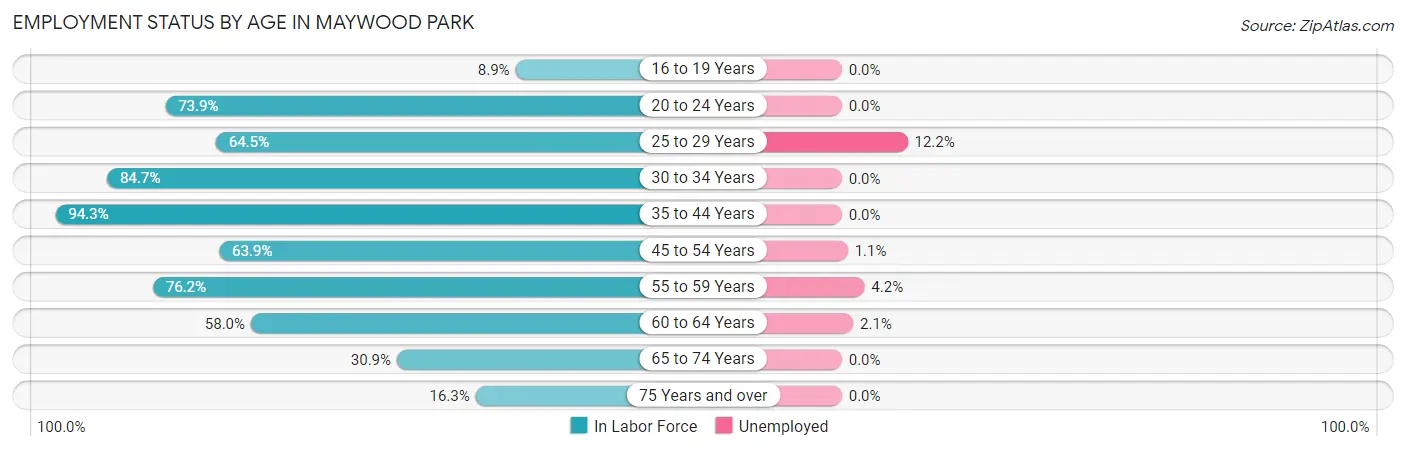
| Age Bracket | In Labor Force | Unemployed |
| 16 to 19 Years | 4 (8.9%) | 0 (0.0%) |
| 20 to 24 Years | 17 (73.9%) | 0 (0.0%) |
| 25 to 29 Years | 49 (64.5%) | 6 (12.2%) |
| 30 to 34 Years | 61 (84.7%) | 0 (0.0%) |
| 35 to 44 Years | 148 (94.3%) | 0 (0.0%) |
| 45 to 54 Years | 94 (63.9%) | 1 (1.1%) |
| 55 to 59 Years | 48 (76.2%) | 2 (4.2%) |
| 60 to 64 Years | 94 (58.0%) | 2 (2.1%) |
| 65 to 74 Years | 30 (30.9%) | 0 (0.0%) |
| 75 Years and over | 8 (16.3%) | 0 (0.0%) |
| Total | 553 (62.1%) | 11 (2.0%) |
Employment Status by Educational Attainment in Maywood Park
According to labor force statistics for Maywood Park, 73.0% of individuals (494) out of the total population between 25 and 64 years of age (677) are in the labor force, with 2.2% or 11 of them being unemployed. The group with the highest labor force participation rate are those with the educational attainment of bachelor's degree or higher, with 84.3% or 252 individuals in the labor force. Within the labor force, individuals with high school diploma education have the highest percentage of unemployment, with 7.8% or 6 of them being unemployed.
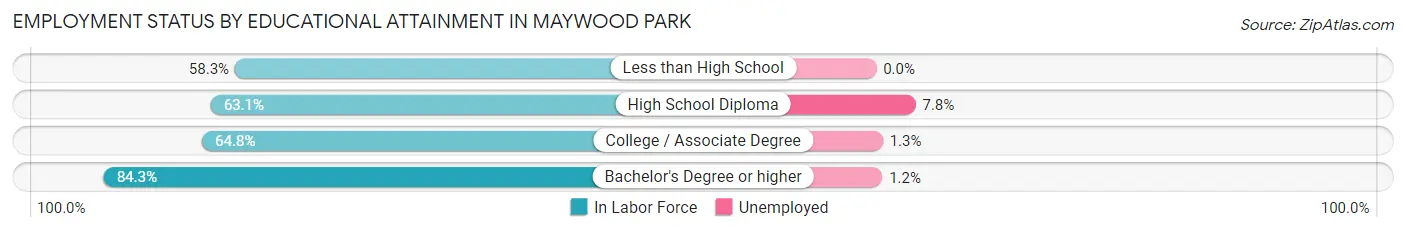
| Educational Attainment | In Labor Force | Unemployed |
| Less than High School | 7 (58.3%) | 0 (0.0%) |
| High School Diploma | 77 (63.1%) | 10 (7.8%) |
| College / Associate Degree | 158 (64.8%) | 3 (1.3%) |
| Bachelor's Degree or higher | 252 (84.3%) | 4 (1.2%) |
| Total | 494 (73.0%) | 15 (2.2%) |
Employment Occupations by Sex in Maywood Park
Management, Business, Science and Arts Occupations
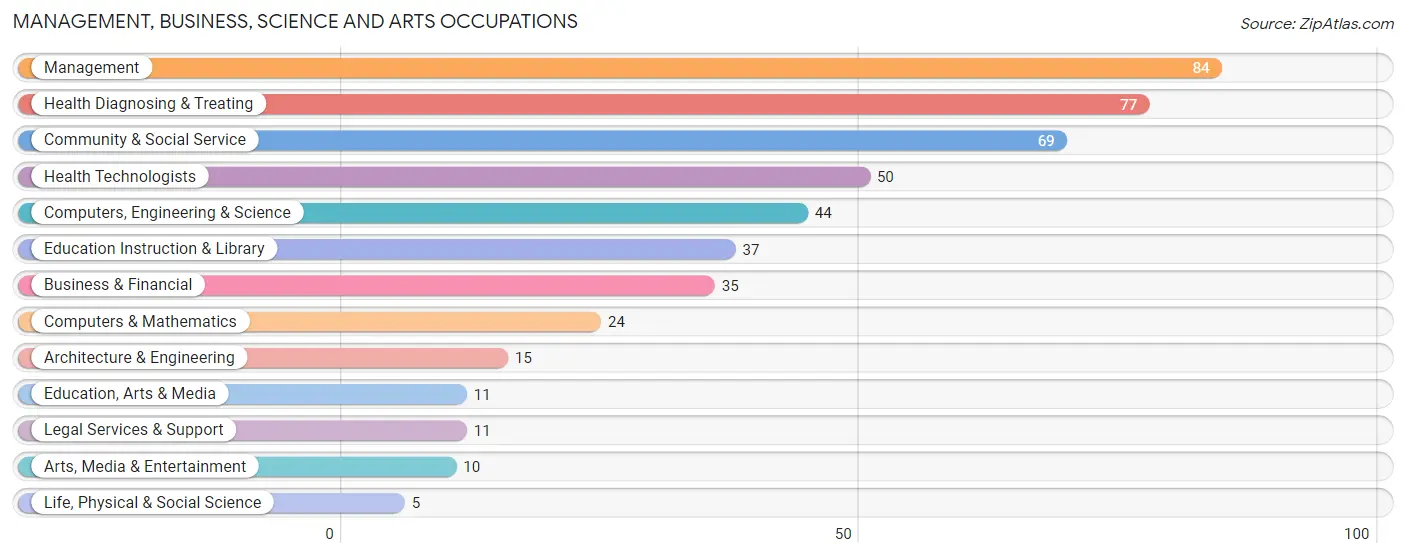
The most common Management, Business, Science and Arts occupations in Maywood Park are Management (84 | 15.5%), Health Diagnosing & Treating (77 | 14.2%), Community & Social Service (69 | 12.7%), Health Technologists (50 | 9.2%), and Computers, Engineering & Science (44 | 8.1%).
Management, Business, Science and Arts Occupations by Sex
Within the Management, Business, Science and Arts occupations in Maywood Park, the most male-oriented occupations are Architecture & Engineering (100.0%), Legal Services & Support (100.0%), and Computers, Engineering & Science (79.5%), while the most female-oriented occupations are Health Diagnosing & Treating (93.5%), Health Technologists (90.0%), and Business & Financial (74.3%).
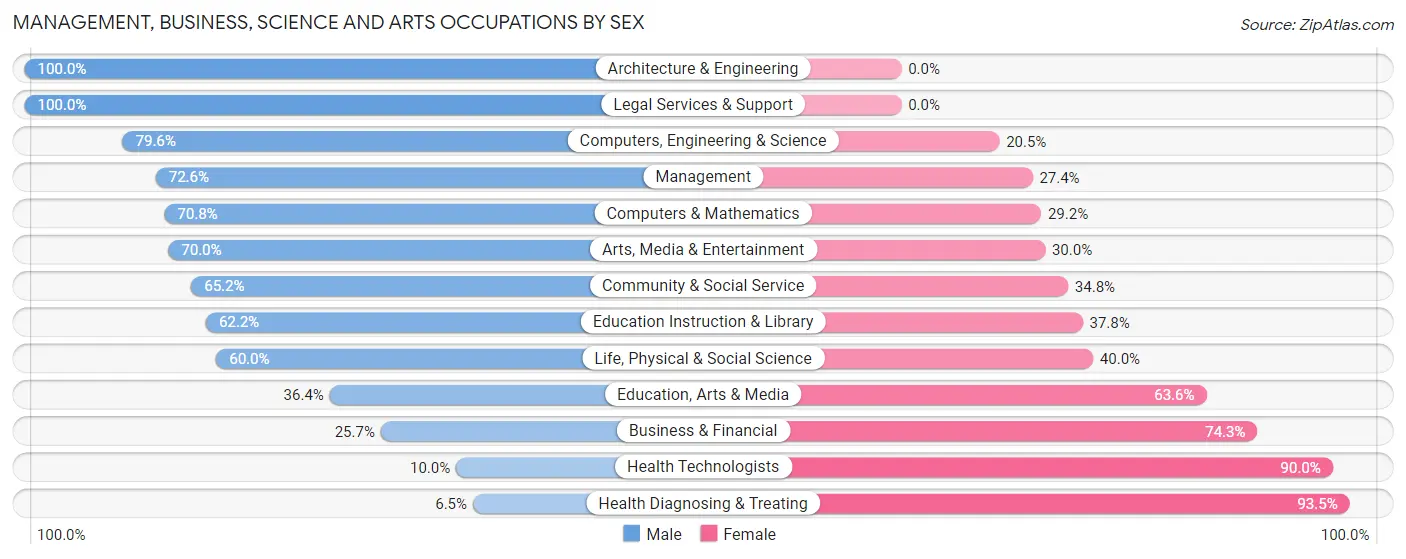
| Occupation | Male | Female |
| Management | 61 (72.6%) | 23 (27.4%) |
| Business & Financial | 9 (25.7%) | 26 (74.3%) |
| Computers, Engineering & Science | 35 (79.5%) | 9 (20.4%) |
| Computers & Mathematics | 17 (70.8%) | 7 (29.2%) |
| Architecture & Engineering | 15 (100.0%) | 0 (0.0%) |
| Life, Physical & Social Science | 3 (60.0%) | 2 (40.0%) |
| Community & Social Service | 45 (65.2%) | 24 (34.8%) |
| Education, Arts & Media | 4 (36.4%) | 7 (63.6%) |
| Legal Services & Support | 11 (100.0%) | 0 (0.0%) |
| Education Instruction & Library | 23 (62.2%) | 14 (37.8%) |
| Arts, Media & Entertainment | 7 (70.0%) | 3 (30.0%) |
| Health Diagnosing & Treating | 5 (6.5%) | 72 (93.5%) |
| Health Technologists | 5 (10.0%) | 45 (90.0%) |
| Total (Category) | 155 (50.2%) | 154 (49.8%) |
| Total (Overall) | 279 (51.5%) | 263 (48.5%) |
Services Occupations
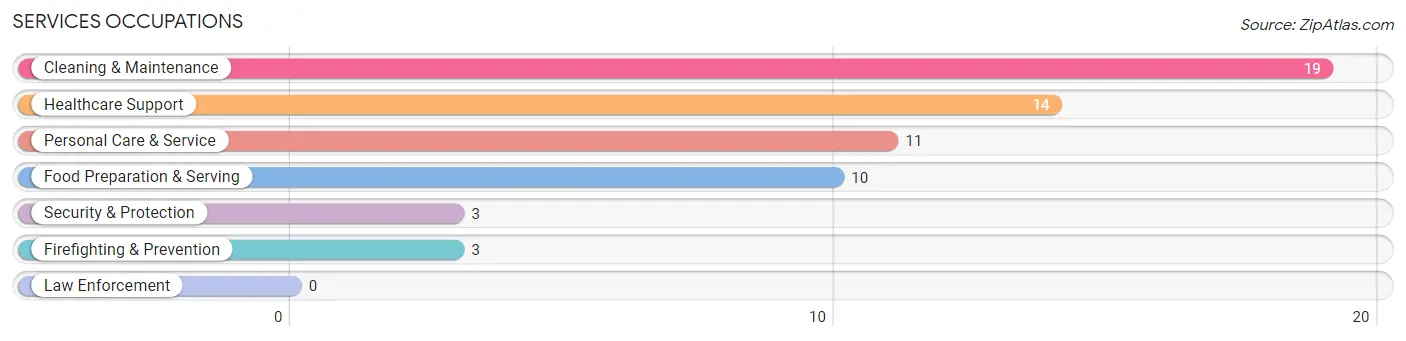
The most common Services occupations in Maywood Park are Cleaning & Maintenance (19 | 3.5%), Healthcare Support (14 | 2.6%), Personal Care & Service (11 | 2.0%), Food Preparation & Serving (10 | 1.8%), and Security & Protection (3 | 0.5%).
Services Occupations by Sex
Within the Services occupations in Maywood Park, the most male-oriented occupations are Food Preparation & Serving (60.0%), Personal Care & Service (45.5%), and Cleaning & Maintenance (5.3%), while the most female-oriented occupations are Healthcare Support (100.0%), Security & Protection (100.0%), and Firefighting & Prevention (100.0%).
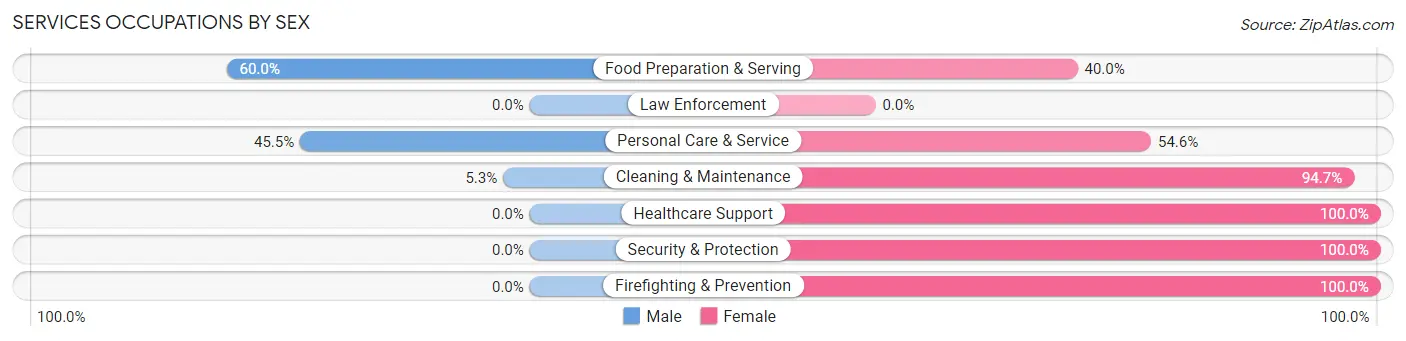
| Occupation | Male | Female |
| Healthcare Support | 0 (0.0%) | 14 (100.0%) |
| Security & Protection | 0 (0.0%) | 3 (100.0%) |
| Firefighting & Prevention | 0 (0.0%) | 3 (100.0%) |
| Law Enforcement | 0 (0.0%) | 0 (0.0%) |
| Food Preparation & Serving | 6 (60.0%) | 4 (40.0%) |
| Cleaning & Maintenance | 1 (5.3%) | 18 (94.7%) |
| Personal Care & Service | 5 (45.5%) | 6 (54.5%) |
| Total (Category) | 12 (21.0%) | 45 (78.9%) |
| Total (Overall) | 279 (51.5%) | 263 (48.5%) |
Sales and Office Occupations
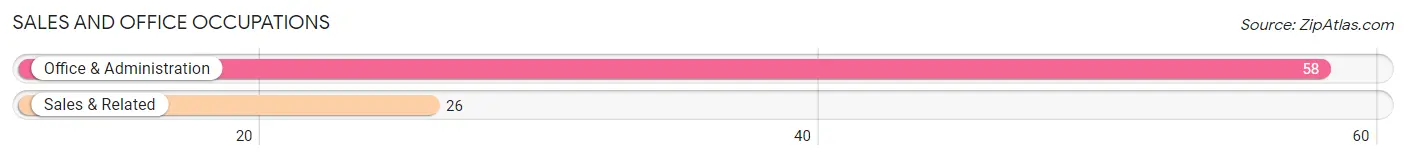
The most common Sales and Office occupations in Maywood Park are Office & Administration (58 | 10.7%), and Sales & Related (26 | 4.8%).
Sales and Office Occupations by Sex
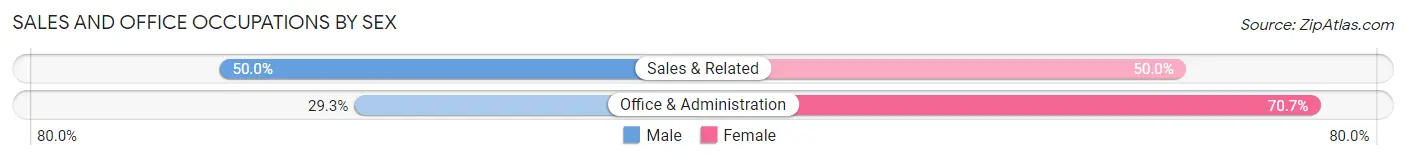
| Occupation | Male | Female |
| Sales & Related | 13 (50.0%) | 13 (50.0%) |
| Office & Administration | 17 (29.3%) | 41 (70.7%) |
| Total (Category) | 30 (35.7%) | 54 (64.3%) |
| Total (Overall) | 279 (51.5%) | 263 (48.5%) |
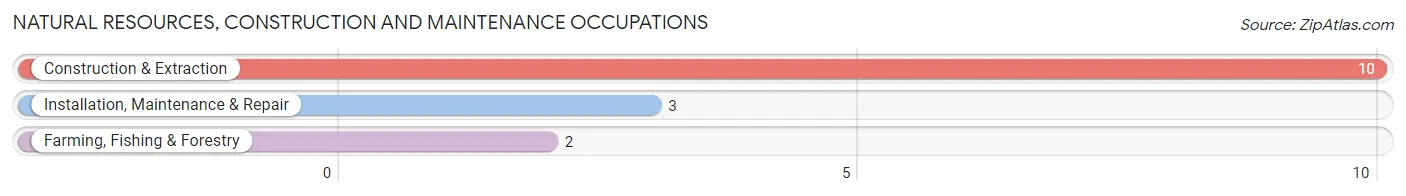
Natural Resources, Construction and Maintenance Occupations
The most common Natural Resources, Construction and Maintenance occupations in Maywood Park are Construction & Extraction (10 | 1.8%), Installation, Maintenance & Repair (3 | 0.5%), and Farming, Fishing & Forestry (2 | 0.4%).
Natural Resources, Construction and Maintenance Occupations by Sex
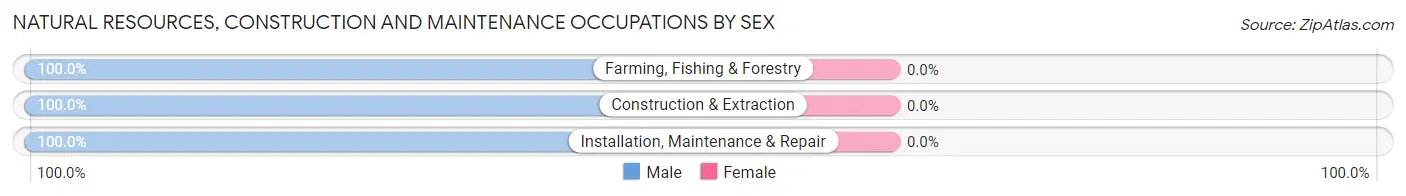
| Occupation | Male | Female |
| Farming, Fishing & Forestry | 2 (100.0%) | 0 (0.0%) |
| Construction & Extraction | 10 (100.0%) | 0 (0.0%) |
| Installation, Maintenance & Repair | 3 (100.0%) | 0 (0.0%) |
| Total (Category) | 15 (100.0%) | 0 (0.0%) |
| Total (Overall) | 279 (51.5%) | 263 (48.5%) |
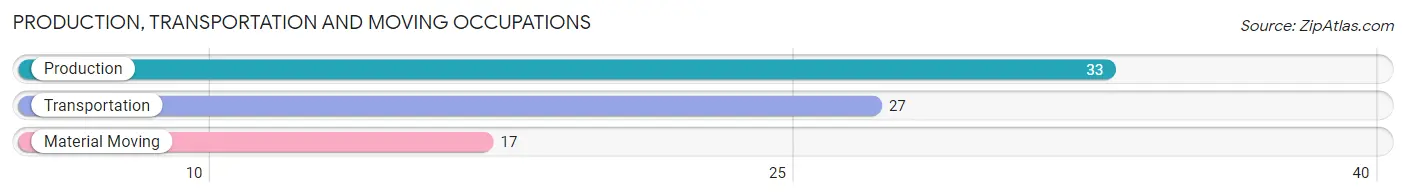
Production, Transportation and Moving Occupations
The most common Production, Transportation and Moving occupations in Maywood Park are Production (33 | 6.1%), Transportation (27 | 5.0%), and Material Moving (17 | 3.1%).
Production, Transportation and Moving Occupations by Sex
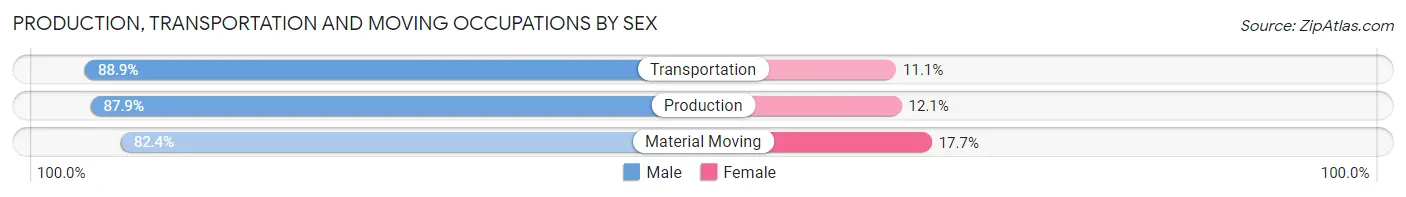
| Occupation | Male | Female |
| Production | 29 (87.9%) | 4 (12.1%) |
| Transportation | 24 (88.9%) | 3 (11.1%) |
| Material Moving | 14 (82.4%) | 3 (17.6%) |
| Total (Category) | 67 (87.0%) | 10 (13.0%) |
| Total (Overall) | 279 (51.5%) | 263 (48.5%) |
Employment Industries by Sex in Maywood Park
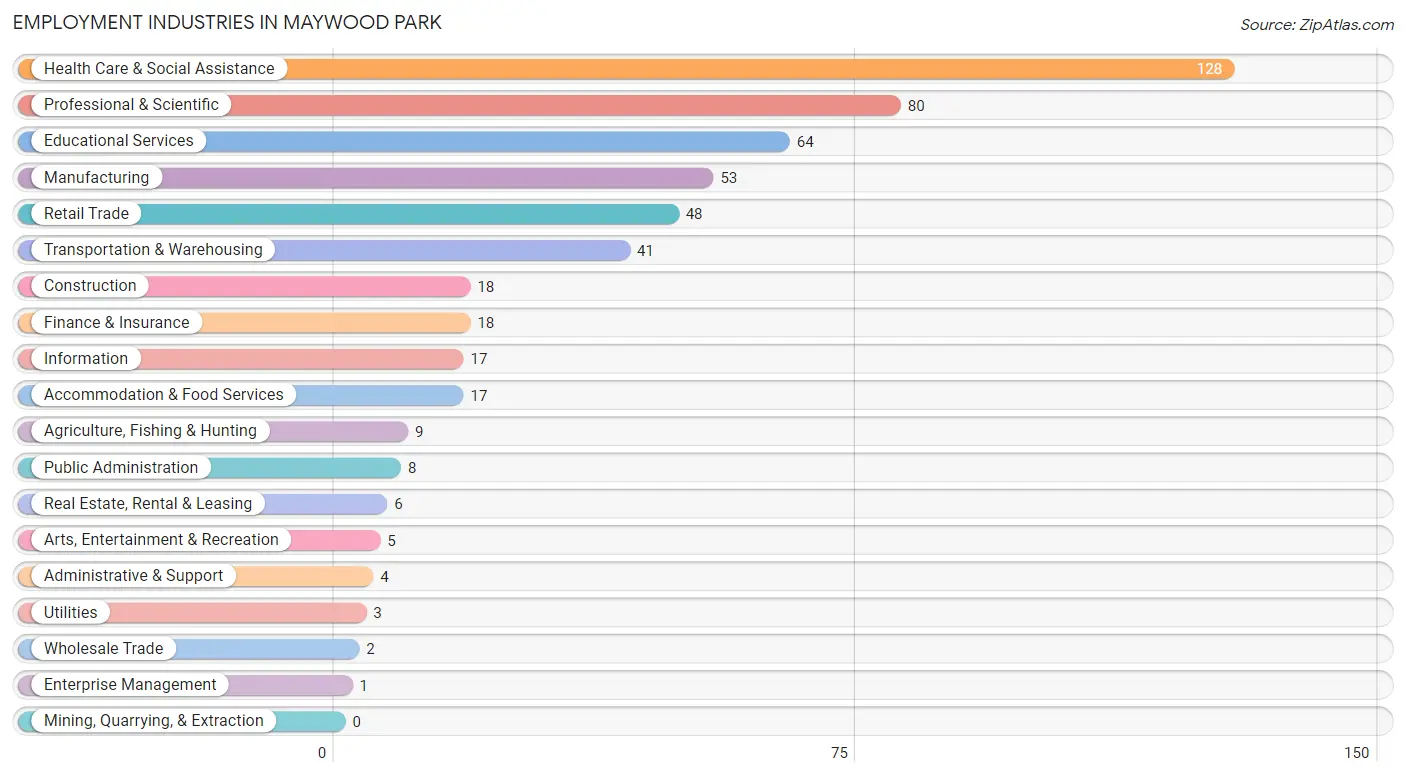
Employment Industries in Maywood Park
The major employment industries in Maywood Park include Health Care & Social Assistance (128 | 23.6%), Professional & Scientific (80 | 14.8%), Educational Services (64 | 11.8%), Manufacturing (53 | 9.8%), and Retail Trade (48 | 8.9%).
Employment Industries by Sex in Maywood Park
The Maywood Park industries that see more men than women are Agriculture, Fishing & Hunting (100.0%), Construction (100.0%), and Administrative & Support (100.0%), whereas the industries that tend to have a higher number of women are Wholesale Trade (100.0%), Enterprise Management (100.0%), and Health Care & Social Assistance (89.8%).
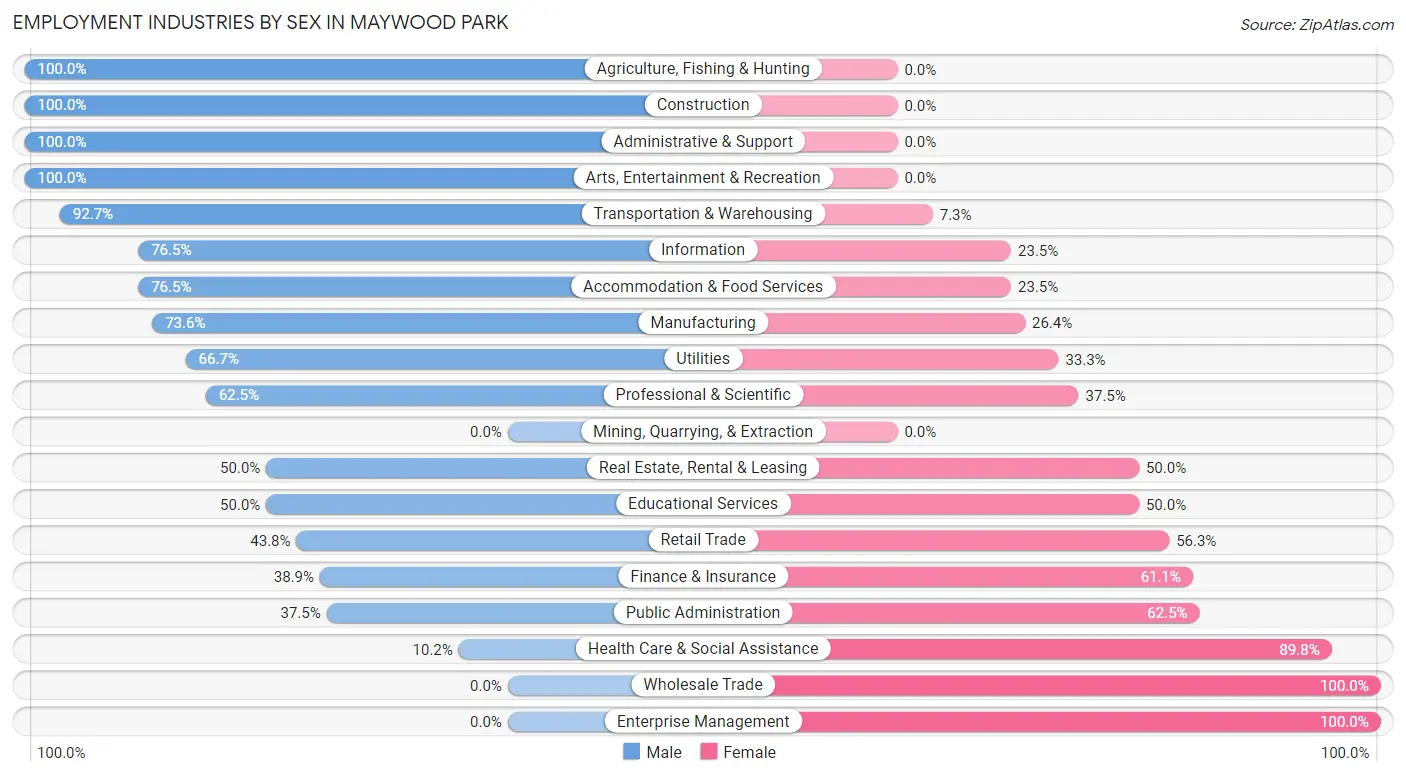
| Industry | Male | Female |
| Agriculture, Fishing & Hunting | 9 (100.0%) | 0 (0.0%) |
| Mining, Quarrying, & Extraction | 0 (0.0%) | 0 (0.0%) |
| Construction | 18 (100.0%) | 0 (0.0%) |
| Manufacturing | 39 (73.6%) | 14 (26.4%) |
| Wholesale Trade | 0 (0.0%) | 2 (100.0%) |
| Retail Trade | 21 (43.8%) | 27 (56.2%) |
| Transportation & Warehousing | 38 (92.7%) | 3 (7.3%) |
| Utilities | 2 (66.7%) | 1 (33.3%) |
| Information | 13 (76.5%) | 4 (23.5%) |
| Finance & Insurance | 7 (38.9%) | 11 (61.1%) |
| Real Estate, Rental & Leasing | 3 (50.0%) | 3 (50.0%) |
| Professional & Scientific | 50 (62.5%) | 30 (37.5%) |
| Enterprise Management | 0 (0.0%) | 1 (100.0%) |
| Administrative & Support | 4 (100.0%) | 0 (0.0%) |
| Educational Services | 32 (50.0%) | 32 (50.0%) |
| Health Care & Social Assistance | 13 (10.2%) | 115 (89.8%) |
| Arts, Entertainment & Recreation | 5 (100.0%) | 0 (0.0%) |
| Accommodation & Food Services | 13 (76.5%) | 4 (23.5%) |
| Public Administration | 3 (37.5%) | 5 (62.5%) |
| Total | 279 (51.5%) | 263 (48.5%) |
Education in Maywood Park
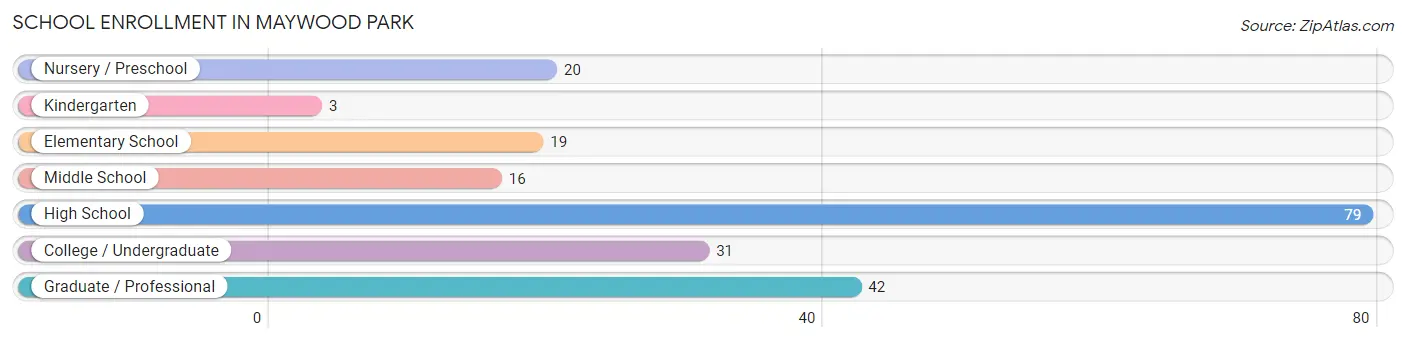
School Enrollment in Maywood Park
The most common levels of schooling among the 210 students in Maywood Park are high school (79 | 37.6%), graduate / professional (42 | 20.0%), and college / undergraduate (31 | 14.8%).
| School Level | # Students | % Students |
| Nursery / Preschool | 20 | 9.5% |
| Kindergarten | 3 | 1.4% |
| Elementary School | 19 | 9.0% |
| Middle School | 16 | 7.6% |
| High School | 79 | 37.6% |
| College / Undergraduate | 31 | 14.8% |
| Graduate / Professional | 42 | 20.0% |
| Total | 210 | 100.0% |
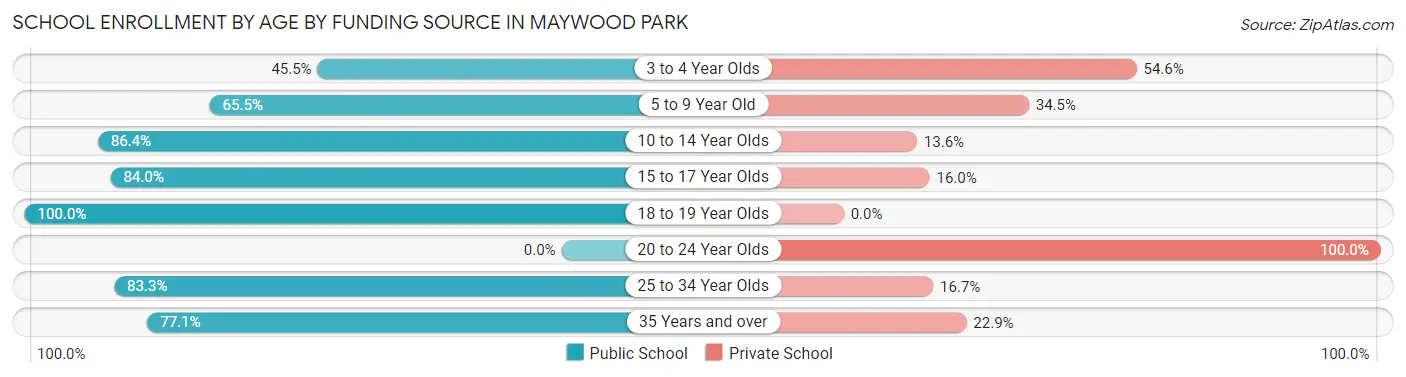
School Enrollment by Age by Funding Source in Maywood Park
Out of a total of 210 students who are enrolled in schools in Maywood Park, 46 (21.9%) attend a private institution, while the remaining 164 (78.1%) are enrolled in public schools. The age group of 20 to 24 year olds has the highest likelihood of being enrolled in private schools, with 2 (100.0% in the age bracket) enrolled. Conversely, the age group of 18 to 19 year olds has the lowest likelihood of being enrolled in a private school, with 3 (100.0% in the age bracket) attending a public institution.
| Age Bracket | Public School | Private School |
| 3 to 4 Year Olds | 5 (45.5%) | 6 (54.5%) |
| 5 to 9 Year Old | 19 (65.5%) | 10 (34.5%) |
| 10 to 14 Year Olds | 38 (86.4%) | 6 (13.6%) |
| 15 to 17 Year Olds | 42 (84.0%) | 8 (16.0%) |
| 18 to 19 Year Olds | 3 (100.0%) | 0 (0.0%) |
| 20 to 24 Year Olds | 0 (0.0%) | 2 (100.0%) |
| 25 to 34 Year Olds | 30 (83.3%) | 6 (16.7%) |
| 35 Years and over | 27 (77.1%) | 8 (22.9%) |
| Total | 164 (78.1%) | 46 (21.9%) |
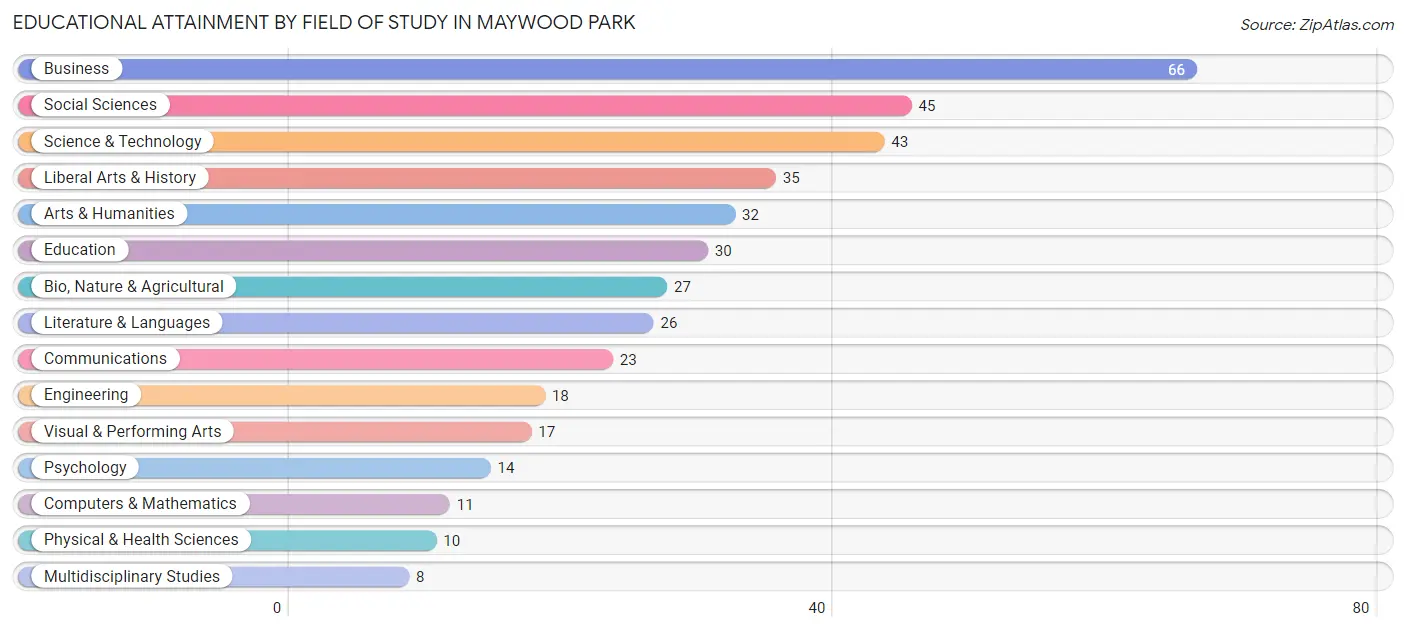
Educational Attainment by Field of Study in Maywood Park
Business (66 | 16.3%), social sciences (45 | 11.1%), science & technology (43 | 10.6%), liberal arts & history (35 | 8.6%), and arts & humanities (32 | 7.9%) are the most common fields of study among 405 individuals in Maywood Park who have obtained a bachelor's degree or higher.
| Field of Study | # Graduates | % Graduates |
| Computers & Mathematics | 11 | 2.7% |
| Bio, Nature & Agricultural | 27 | 6.7% |
| Physical & Health Sciences | 10 | 2.5% |
| Psychology | 14 | 3.5% |
| Social Sciences | 45 | 11.1% |
| Engineering | 18 | 4.4% |
| Multidisciplinary Studies | 8 | 2.0% |
| Science & Technology | 43 | 10.6% |
| Business | 66 | 16.3% |
| Education | 30 | 7.4% |
| Literature & Languages | 26 | 6.4% |
| Liberal Arts & History | 35 | 8.6% |
| Visual & Performing Arts | 17 | 4.2% |
| Communications | 23 | 5.7% |
| Arts & Humanities | 32 | 7.9% |
| Total | 405 | 100.0% |
Transportation & Commute in Maywood Park
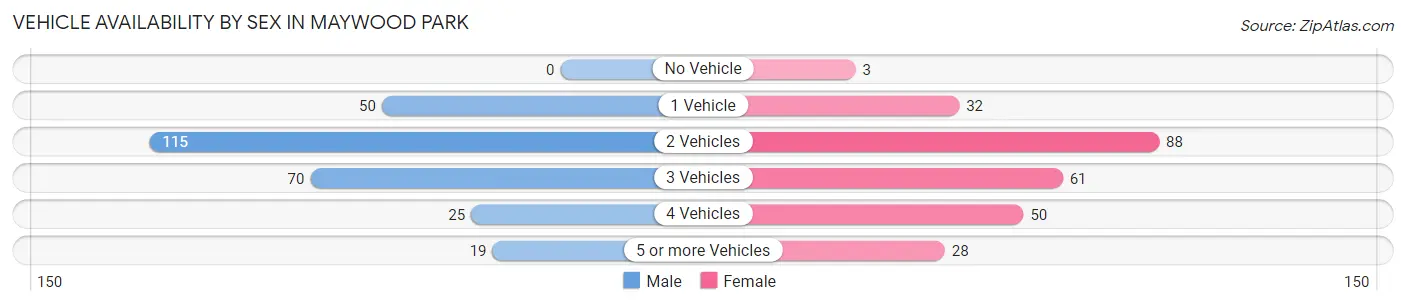
Vehicle Availability by Sex in Maywood Park
The most prevalent vehicle ownership categories in Maywood Park are males with 2 vehicles (115, accounting for 41.2%) and females with 2 vehicles (88, making up 43.9%).
| Vehicles Available | Male | Female |
| No Vehicle | 0 (0.0%) | 3 (1.1%) |
| 1 Vehicle | 50 (17.9%) | 32 (12.2%) |
| 2 Vehicles | 115 (41.2%) | 88 (33.6%) |
| 3 Vehicles | 70 (25.1%) | 61 (23.3%) |
| 4 Vehicles | 25 (9.0%) | 50 (19.1%) |
| 5 or more Vehicles | 19 (6.8%) | 28 (10.7%) |
| Total | 279 (100.0%) | 262 (100.0%) |
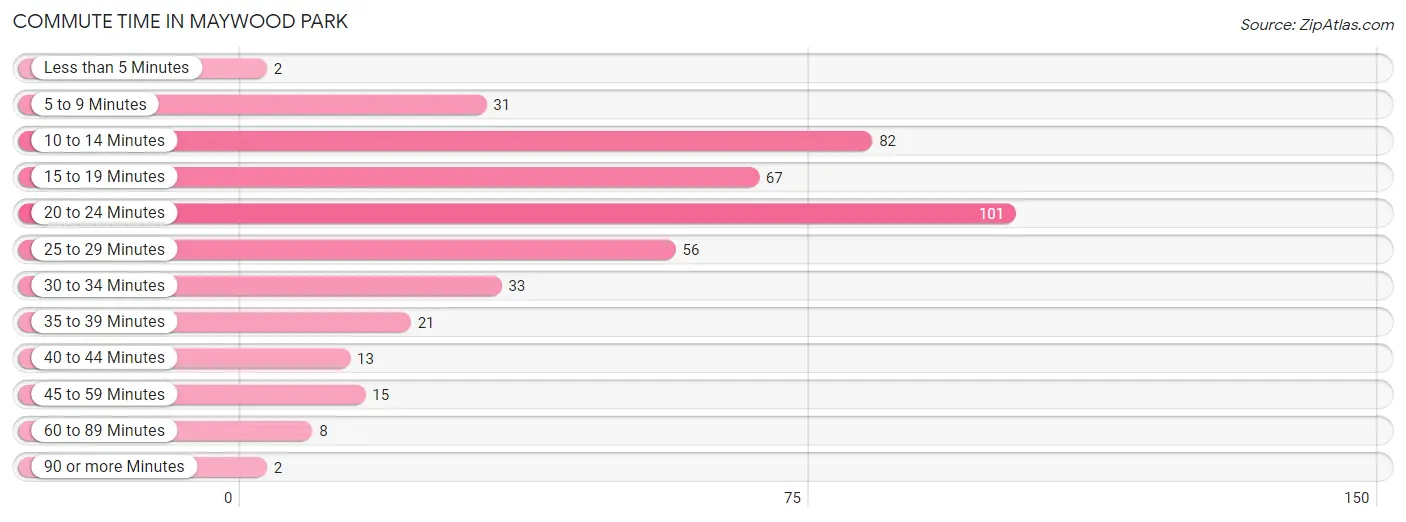
Commute Time in Maywood Park
The most frequently occuring commute durations in Maywood Park are 20 to 24 minutes (101 commuters, 23.4%), 10 to 14 minutes (82 commuters, 19.0%), and 15 to 19 minutes (67 commuters, 15.5%).
| Commute Time | # Commuters | % Commuters |
| Less than 5 Minutes | 2 | 0.5% |
| 5 to 9 Minutes | 31 | 7.2% |
| 10 to 14 Minutes | 82 | 19.0% |
| 15 to 19 Minutes | 67 | 15.5% |
| 20 to 24 Minutes | 101 | 23.4% |
| 25 to 29 Minutes | 56 | 13.0% |
| 30 to 34 Minutes | 33 | 7.7% |
| 35 to 39 Minutes | 21 | 4.9% |
| 40 to 44 Minutes | 13 | 3.0% |
| 45 to 59 Minutes | 15 | 3.5% |
| 60 to 89 Minutes | 8 | 1.9% |
| 90 or more Minutes | 2 | 0.5% |
Commute Time by Sex in Maywood Park
The most common commute times in Maywood Park are 10 to 14 minutes (45 commuters, 19.2%) for males and 20 to 24 minutes (74 commuters, 37.6%) for females.
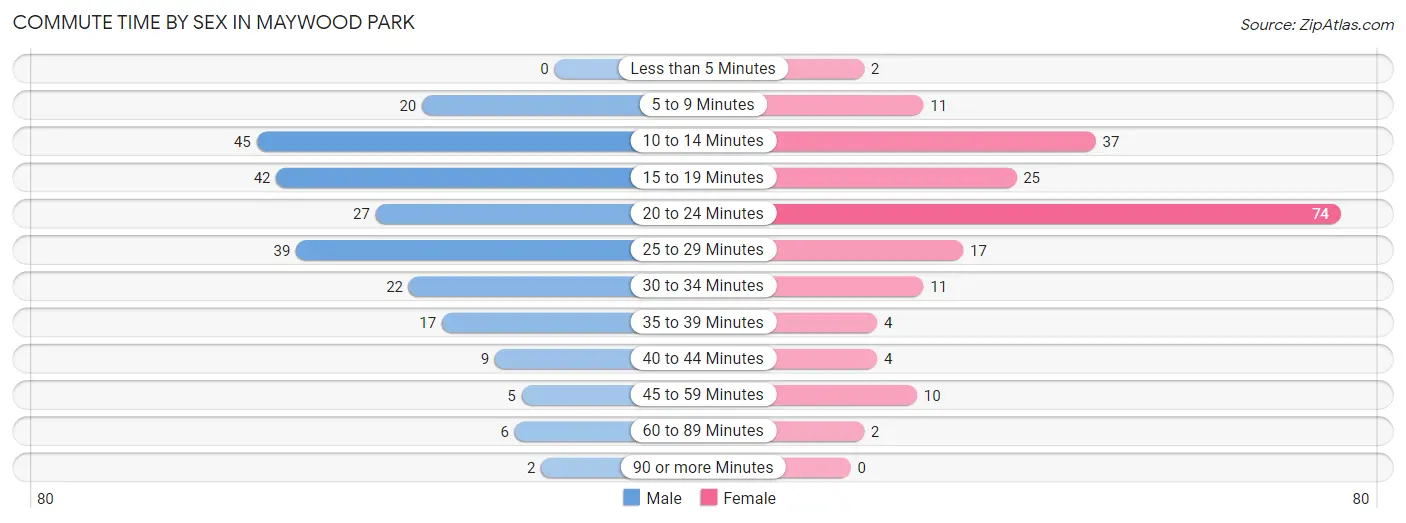
| Commute Time | Male | Female |
| Less than 5 Minutes | 0 (0.0%) | 2 (1.0%) |
| 5 to 9 Minutes | 20 (8.6%) | 11 (5.6%) |
| 10 to 14 Minutes | 45 (19.2%) | 37 (18.8%) |
| 15 to 19 Minutes | 42 (17.9%) | 25 (12.7%) |
| 20 to 24 Minutes | 27 (11.5%) | 74 (37.6%) |
| 25 to 29 Minutes | 39 (16.7%) | 17 (8.6%) |
| 30 to 34 Minutes | 22 (9.4%) | 11 (5.6%) |
| 35 to 39 Minutes | 17 (7.3%) | 4 (2.0%) |
| 40 to 44 Minutes | 9 (3.8%) | 4 (2.0%) |
| 45 to 59 Minutes | 5 (2.1%) | 10 (5.1%) |
| 60 to 89 Minutes | 6 (2.6%) | 2 (1.0%) |
| 90 or more Minutes | 2 (0.9%) | 0 (0.0%) |
Time of Departure to Work by Sex in Maywood Park
The most frequent times of departure to work in Maywood Park are 7:00 AM to 7:29 AM (53, 22.7%) for males and 8:00 AM to 8:29 AM (48, 24.4%) for females.
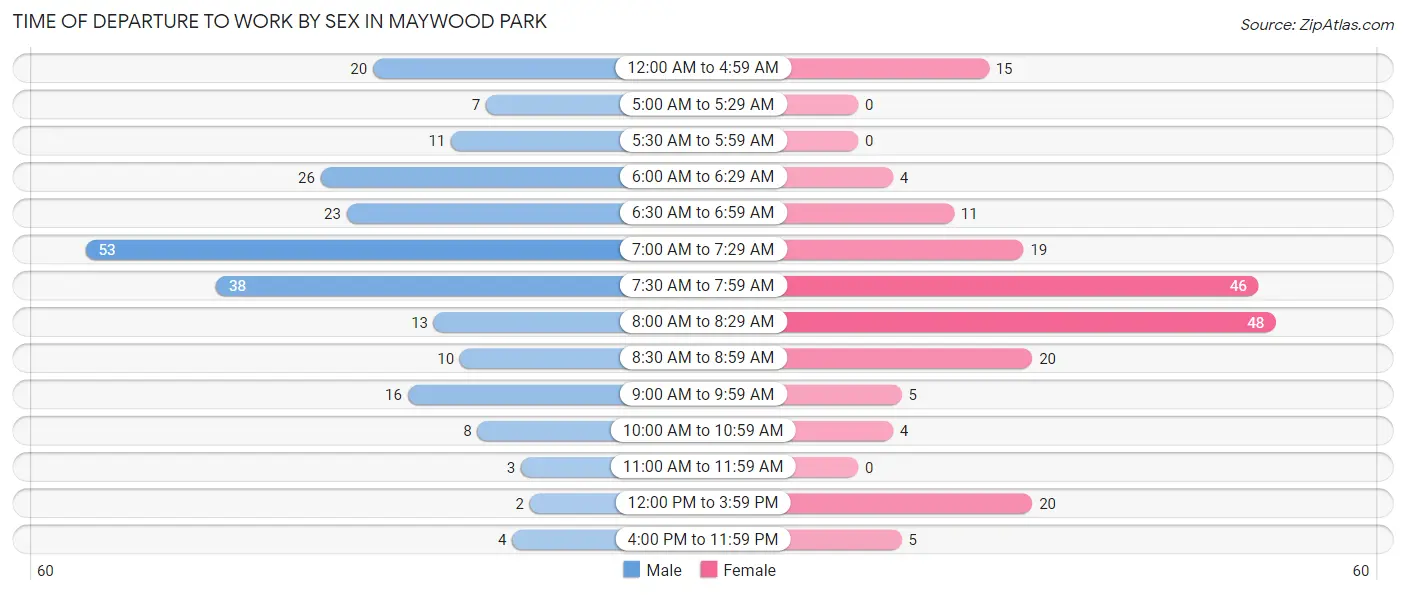
| Time of Departure | Male | Female |
| 12:00 AM to 4:59 AM | 20 (8.6%) | 15 (7.6%) |
| 5:00 AM to 5:29 AM | 7 (3.0%) | 0 (0.0%) |
| 5:30 AM to 5:59 AM | 11 (4.7%) | 0 (0.0%) |
| 6:00 AM to 6:29 AM | 26 (11.1%) | 4 (2.0%) |
| 6:30 AM to 6:59 AM | 23 (9.8%) | 11 (5.6%) |
| 7:00 AM to 7:29 AM | 53 (22.7%) | 19 (9.6%) |
| 7:30 AM to 7:59 AM | 38 (16.2%) | 46 (23.4%) |
| 8:00 AM to 8:29 AM | 13 (5.6%) | 48 (24.4%) |
| 8:30 AM to 8:59 AM | 10 (4.3%) | 20 (10.2%) |
| 9:00 AM to 9:59 AM | 16 (6.8%) | 5 (2.5%) |
| 10:00 AM to 10:59 AM | 8 (3.4%) | 4 (2.0%) |
| 11:00 AM to 11:59 AM | 3 (1.3%) | 0 (0.0%) |
| 12:00 PM to 3:59 PM | 2 (0.9%) | 20 (10.2%) |
| 4:00 PM to 11:59 PM | 4 (1.7%) | 5 (2.5%) |
| Total | 234 (100.0%) | 197 (100.0%) |
Housing Occupancy in Maywood Park
Occupancy by Ownership in Maywood Park
Of the total 371 dwellings in Maywood Park, owner-occupied units account for 348 (93.8%), while renter-occupied units make up 23 (6.2%).
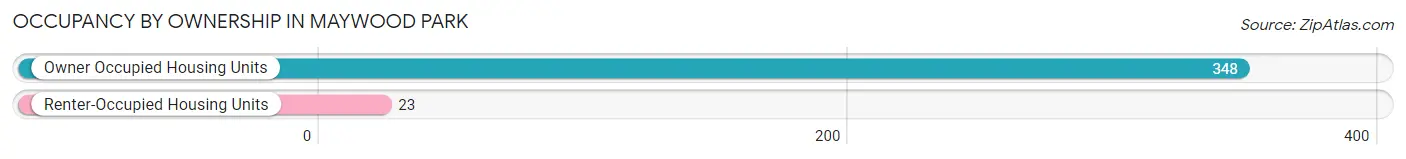
| Occupancy | # Housing Units | % Housing Units |
| Owner Occupied Housing Units | 348 | 93.8% |
| Renter-Occupied Housing Units | 23 | 6.2% |
| Total Occupied Housing Units | 371 | 100.0% |
Occupancy by Household Size in Maywood Park
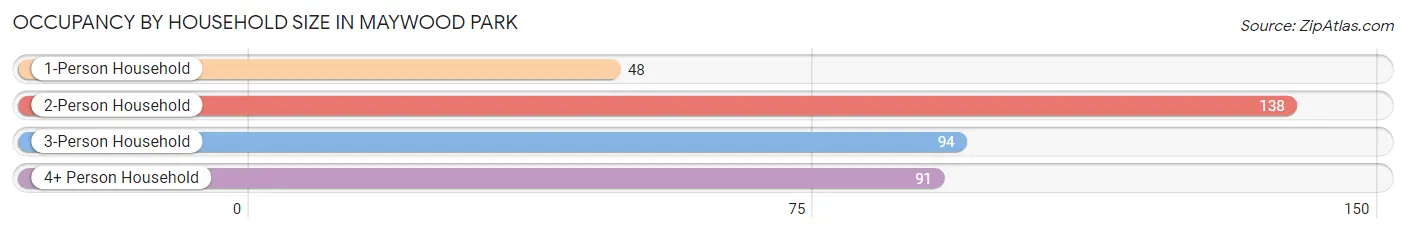
| Household Size | # Housing Units | % Housing Units |
| 1-Person Household | 48 | 12.9% |
| 2-Person Household | 138 | 37.2% |
| 3-Person Household | 94 | 25.3% |
| 4+ Person Household | 91 | 24.5% |
| Total Housing Units | 371 | 100.0% |
Occupancy by Ownership by Household Size in Maywood Park
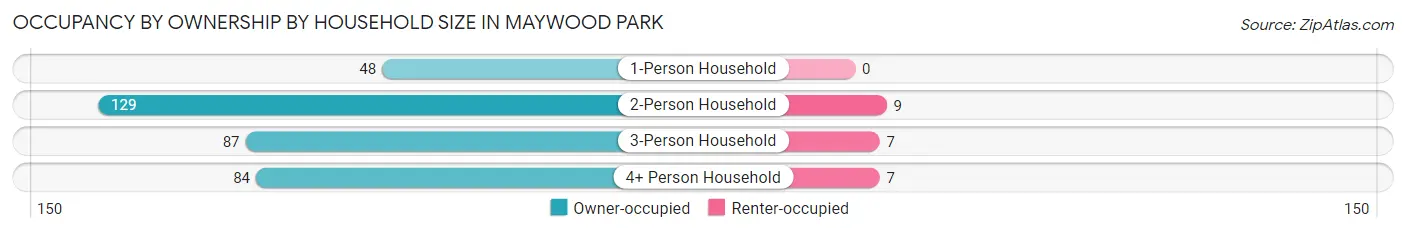
| Household Size | Owner-occupied | Renter-occupied |
| 1-Person Household | 48 (100.0%) | 0 (0.0%) |
| 2-Person Household | 129 (93.5%) | 9 (6.5%) |
| 3-Person Household | 87 (92.5%) | 7 (7.4%) |
| 4+ Person Household | 84 (92.3%) | 7 (7.7%) |
| Total Housing Units | 348 (93.8%) | 23 (6.2%) |
Occupancy by Educational Attainment in Maywood Park
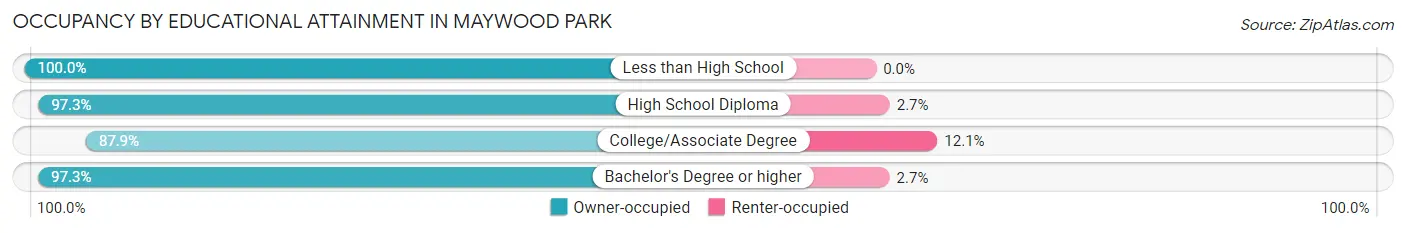
| Household Size | Owner-occupied | Renter-occupied |
| Less than High School | 7 (100.0%) | 0 (0.0%) |
| High School Diploma | 36 (97.3%) | 1 (2.7%) |
| College/Associate Degree | 123 (87.9%) | 17 (12.1%) |
| Bachelor's Degree or higher | 182 (97.3%) | 5 (2.7%) |
Occupancy by Age of Householder in Maywood Park
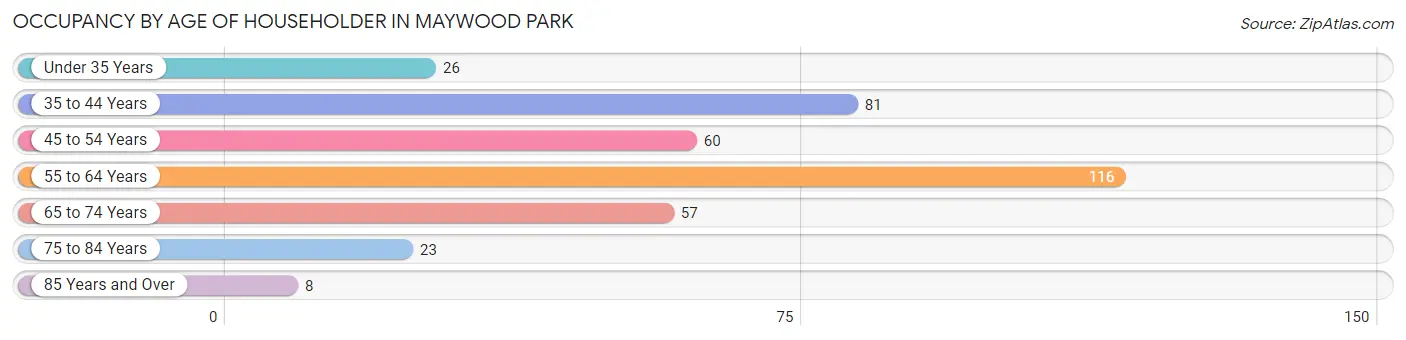
| Age Bracket | # Households | % Households |
| Under 35 Years | 26 | 7.0% |
| 35 to 44 Years | 81 | 21.8% |
| 45 to 54 Years | 60 | 16.2% |
| 55 to 64 Years | 116 | 31.3% |
| 65 to 74 Years | 57 | 15.4% |
| 75 to 84 Years | 23 | 6.2% |
| 85 Years and Over | 8 | 2.2% |
| Total | 371 | 100.0% |
Housing Finances in Maywood Park
Median Income by Occupancy in Maywood Park
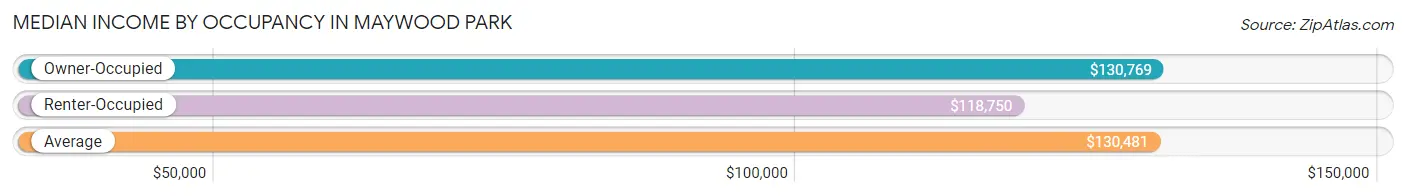
| Occupancy Type | # Households | Median Income |
| Owner-Occupied | 348 (93.8%) | $130,769 |
| Renter-Occupied | 23 (6.2%) | $118,750 |
| Average | 371 (100.0%) | $130,481 |
Occupancy by Householder Income Bracket in Maywood Park
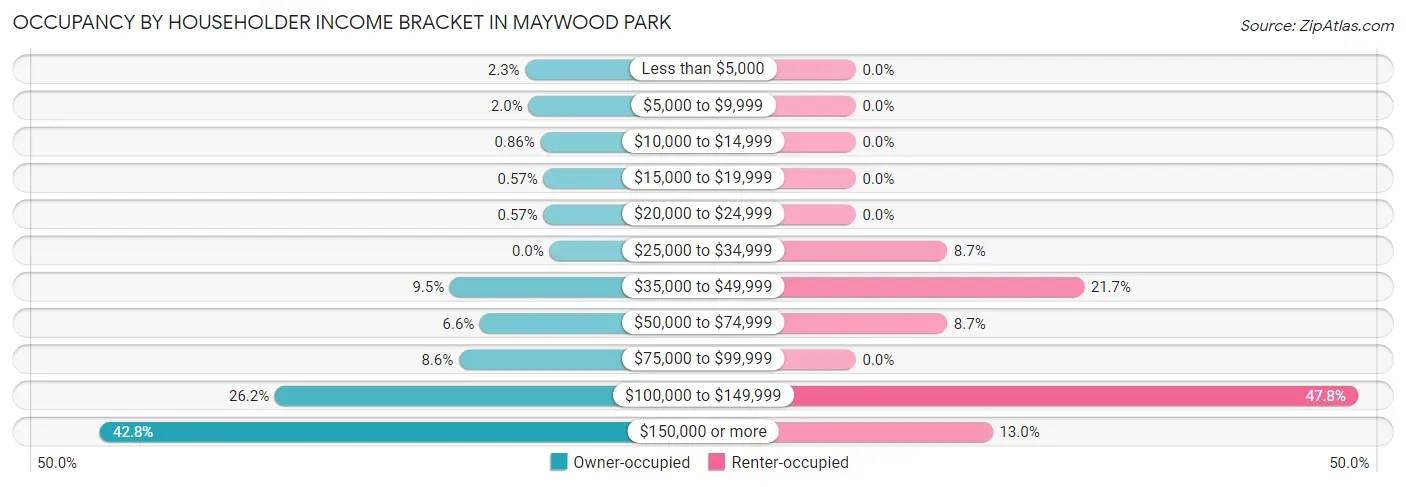
| Income Bracket | Owner-occupied | Renter-occupied |
| Less than $5,000 | 8 (2.3%) | 0 (0.0%) |
| $5,000 to $9,999 | 7 (2.0%) | 0 (0.0%) |
| $10,000 to $14,999 | 3 (0.9%) | 0 (0.0%) |
| $15,000 to $19,999 | 2 (0.6%) | 0 (0.0%) |
| $20,000 to $24,999 | 2 (0.6%) | 0 (0.0%) |
| $25,000 to $34,999 | 0 (0.0%) | 2 (8.7%) |
| $35,000 to $49,999 | 33 (9.5%) | 5 (21.7%) |
| $50,000 to $74,999 | 23 (6.6%) | 2 (8.7%) |
| $75,000 to $99,999 | 30 (8.6%) | 0 (0.0%) |
| $100,000 to $149,999 | 91 (26.2%) | 11 (47.8%) |
| $150,000 or more | 149 (42.8%) | 3 (13.0%) |
| Total | 348 (100.0%) | 23 (100.0%) |
Monthly Housing Cost Tiers in Maywood Park
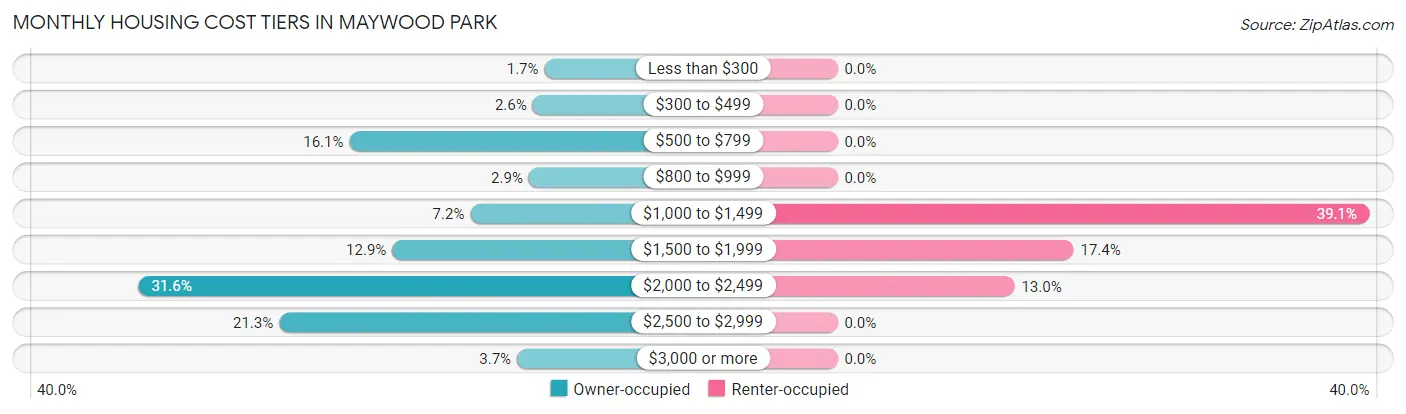
| Monthly Cost | Owner-occupied | Renter-occupied |
| Less than $300 | 6 (1.7%) | 0 (0.0%) |
| $300 to $499 | 9 (2.6%) | 0 (0.0%) |
| $500 to $799 | 56 (16.1%) | 0 (0.0%) |
| $800 to $999 | 10 (2.9%) | 0 (0.0%) |
| $1,000 to $1,499 | 25 (7.2%) | 9 (39.1%) |
| $1,500 to $1,999 | 45 (12.9%) | 4 (17.4%) |
| $2,000 to $2,499 | 110 (31.6%) | 3 (13.0%) |
| $2,500 to $2,999 | 74 (21.3%) | 0 (0.0%) |
| $3,000 or more | 13 (3.7%) | 0 (0.0%) |
| Total | 348 (100.0%) | 23 (100.0%) |
Physical Housing Characteristics in Maywood Park
Housing Structures in Maywood Park
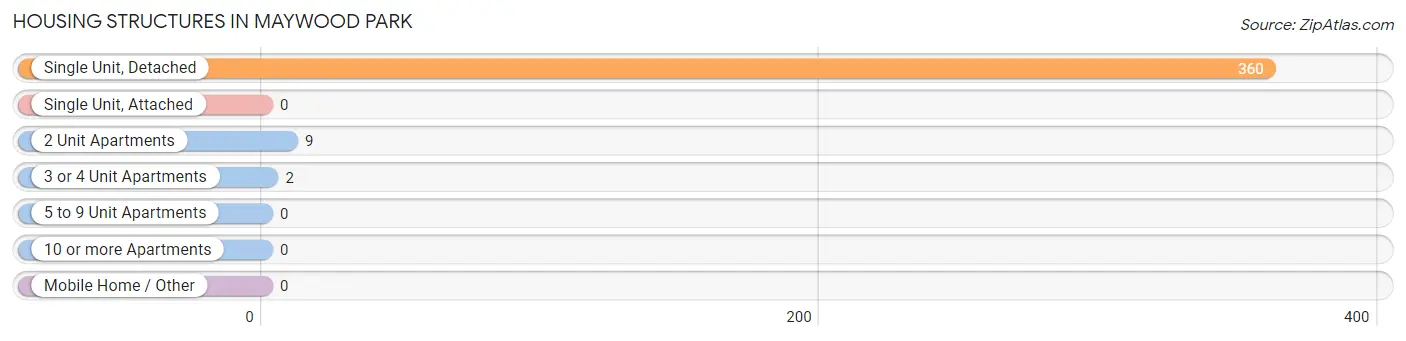
| Structure Type | # Housing Units | % Housing Units |
| Single Unit, Detached | 360 | 97.0% |
| Single Unit, Attached | 0 | 0.0% |
| 2 Unit Apartments | 9 | 2.4% |
| 3 or 4 Unit Apartments | 2 | 0.5% |
| 5 to 9 Unit Apartments | 0 | 0.0% |
| 10 or more Apartments | 0 | 0.0% |
| Mobile Home / Other | 0 | 0.0% |
| Total | 371 | 100.0% |
Housing Structures by Occupancy in Maywood Park
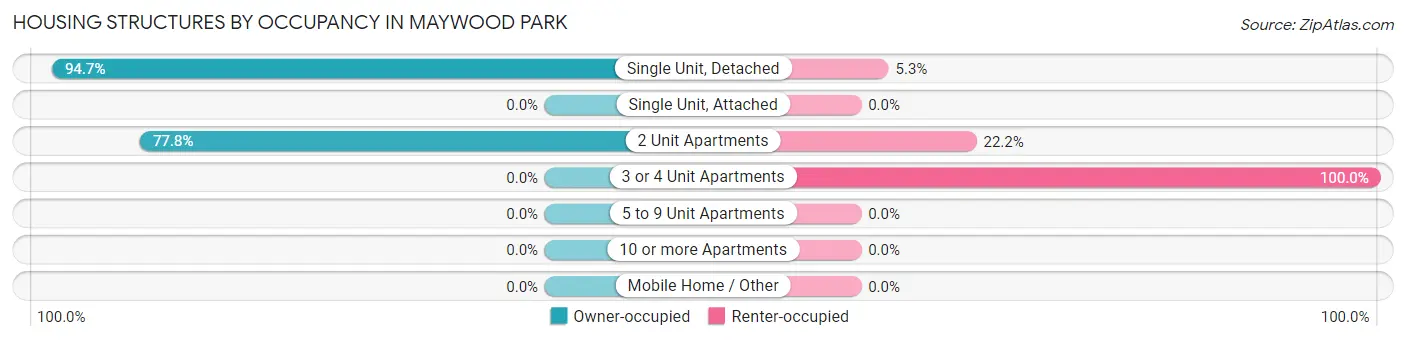
| Structure Type | Owner-occupied | Renter-occupied |
| Single Unit, Detached | 341 (94.7%) | 19 (5.3%) |
| Single Unit, Attached | 0 (0.0%) | 0 (0.0%) |
| 2 Unit Apartments | 7 (77.8%) | 2 (22.2%) |
| 3 or 4 Unit Apartments | 0 (0.0%) | 2 (100.0%) |
| 5 to 9 Unit Apartments | 0 (0.0%) | 0 (0.0%) |
| 10 or more Apartments | 0 (0.0%) | 0 (0.0%) |
| Mobile Home / Other | 0 (0.0%) | 0 (0.0%) |
| Total | 348 (93.8%) | 23 (6.2%) |
Housing Structures by Number of Rooms in Maywood Park
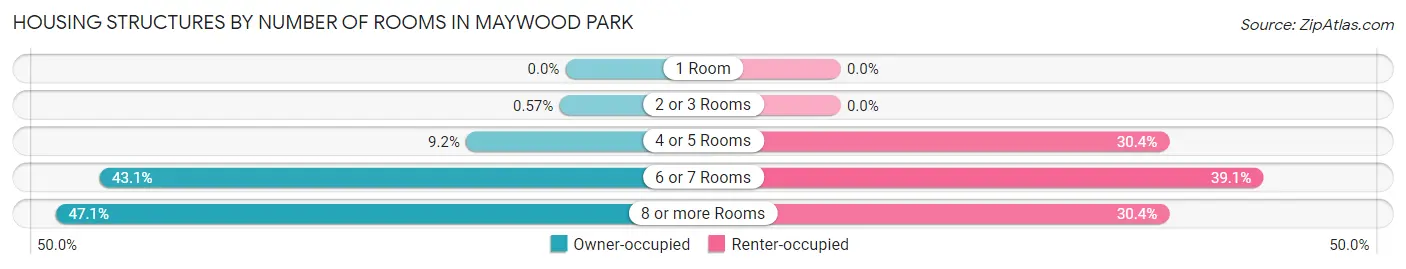
| Number of Rooms | Owner-occupied | Renter-occupied |
| 1 Room | 0 (0.0%) | 0 (0.0%) |
| 2 or 3 Rooms | 2 (0.6%) | 0 (0.0%) |
| 4 or 5 Rooms | 32 (9.2%) | 7 (30.4%) |
| 6 or 7 Rooms | 150 (43.1%) | 9 (39.1%) |
| 8 or more Rooms | 164 (47.1%) | 7 (30.4%) |
| Total | 348 (100.0%) | 23 (100.0%) |
Housing Structure by Heating Type in Maywood Park
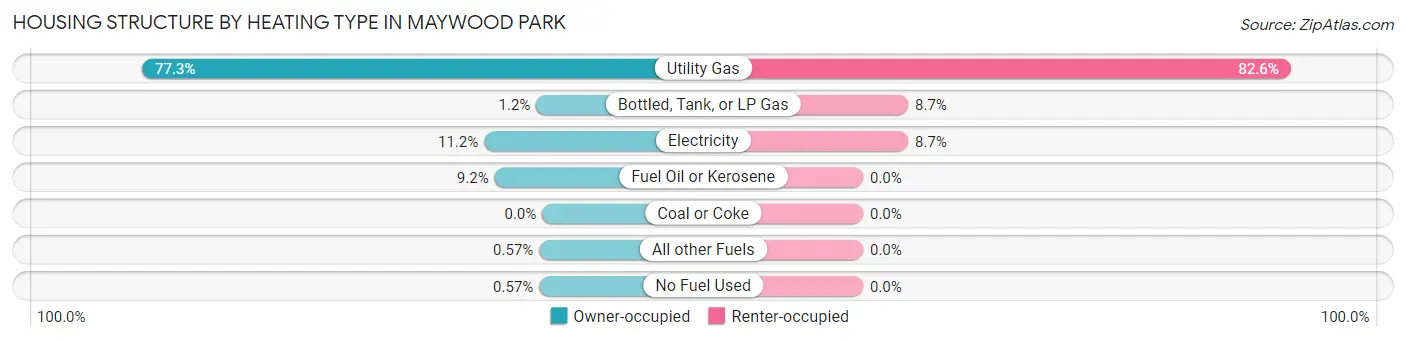
| Heating Type | Owner-occupied | Renter-occupied |
| Utility Gas | 269 (77.3%) | 19 (82.6%) |
| Bottled, Tank, or LP Gas | 4 (1.1%) | 2 (8.7%) |
| Electricity | 39 (11.2%) | 2 (8.7%) |
| Fuel Oil or Kerosene | 32 (9.2%) | 0 (0.0%) |
| Coal or Coke | 0 (0.0%) | 0 (0.0%) |
| All other Fuels | 2 (0.6%) | 0 (0.0%) |
| No Fuel Used | 2 (0.6%) | 0 (0.0%) |
| Total | 348 (100.0%) | 23 (100.0%) |
Household Vehicle Usage in Maywood Park
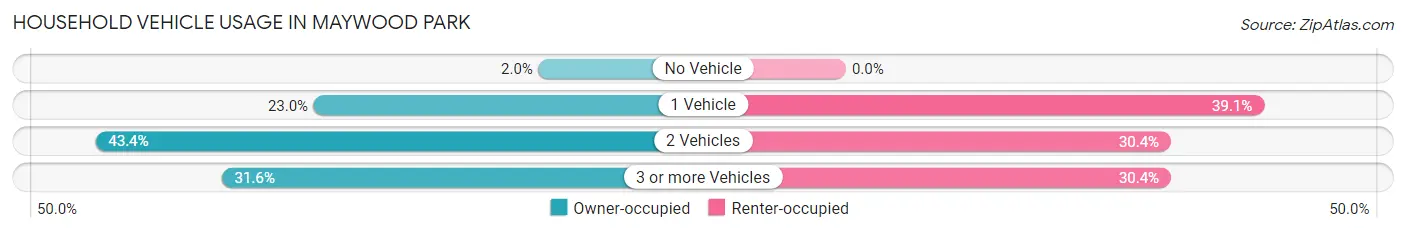
| Vehicles per Household | Owner-occupied | Renter-occupied |
| No Vehicle | 7 (2.0%) | 0 (0.0%) |
| 1 Vehicle | 80 (23.0%) | 9 (39.1%) |
| 2 Vehicles | 151 (43.4%) | 7 (30.4%) |
| 3 or more Vehicles | 110 (31.6%) | 7 (30.4%) |
| Total | 348 (100.0%) | 23 (100.0%) |
Real Estate & Mortgages in Maywood Park
Real Estate and Mortgage Overview in Maywood Park
| Characteristic | Without Mortgage | With Mortgage |
| Housing Units | 78 | 270 |
| Median Property Value | $495,800 | $500,000 |
| Median Household Income | $80,000 | $132 |
| Monthly Housing Costs | $645 | $13 |
| Real Estate Taxes | $4,500 | $0 |
Property Value by Mortgage Status in Maywood Park
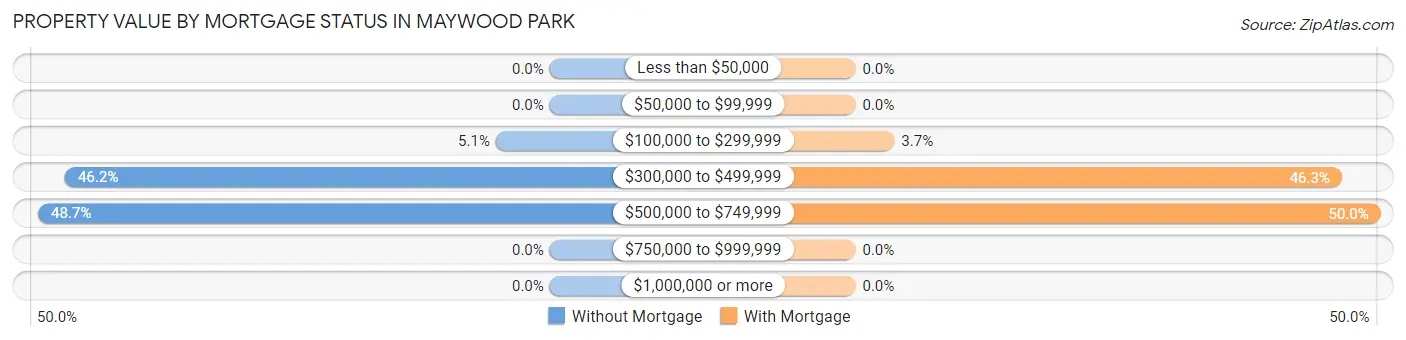
| Property Value | Without Mortgage | With Mortgage |
| Less than $50,000 | 0 (0.0%) | 0 (0.0%) |
| $50,000 to $99,999 | 0 (0.0%) | 0 (0.0%) |
| $100,000 to $299,999 | 4 (5.1%) | 10 (3.7%) |
| $300,000 to $499,999 | 36 (46.2%) | 125 (46.3%) |
| $500,000 to $749,999 | 38 (48.7%) | 135 (50.0%) |
| $750,000 to $999,999 | 0 (0.0%) | 0 (0.0%) |
| $1,000,000 or more | 0 (0.0%) | 0 (0.0%) |
| Total | 78 (100.0%) | 270 (100.0%) |
Household Income by Mortgage Status in Maywood Park
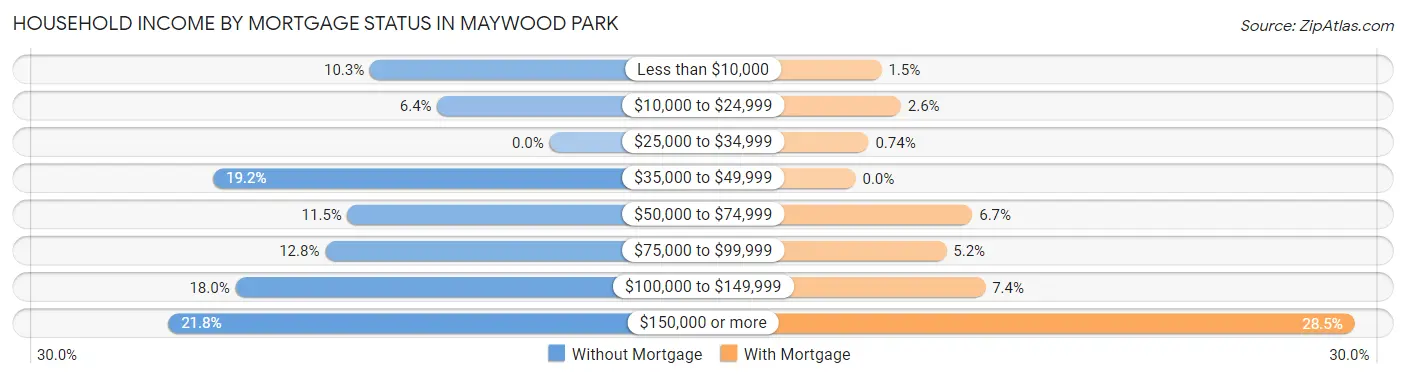
| Household Income | Without Mortgage | With Mortgage |
| Less than $10,000 | 8 (10.3%) | 4 (1.5%) |
| $10,000 to $24,999 | 5 (6.4%) | 7 (2.6%) |
| $25,000 to $34,999 | 0 (0.0%) | 2 (0.7%) |
| $35,000 to $49,999 | 15 (19.2%) | 0 (0.0%) |
| $50,000 to $74,999 | 9 (11.5%) | 18 (6.7%) |
| $75,000 to $99,999 | 10 (12.8%) | 14 (5.2%) |
| $100,000 to $149,999 | 14 (17.9%) | 20 (7.4%) |
| $150,000 or more | 17 (21.8%) | 77 (28.5%) |
| Total | 78 (100.0%) | 270 (100.0%) |
Property Value to Household Income Ratio in Maywood Park
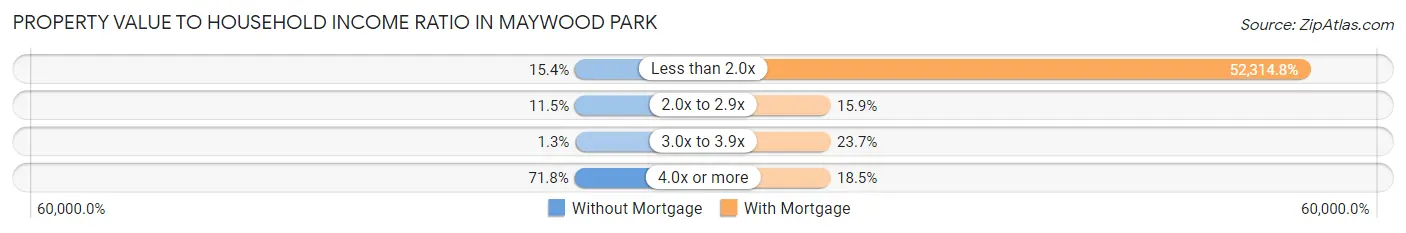
| Value-to-Income Ratio | Without Mortgage | With Mortgage |
| Less than 2.0x | 12 (15.4%) | 141,250 (52,314.8%) |
| 2.0x to 2.9x | 9 (11.5%) | 43 (15.9%) |
| 3.0x to 3.9x | 1 (1.3%) | 64 (23.7%) |
| 4.0x or more | 56 (71.8%) | 50 (18.5%) |
| Total | 78 (100.0%) | 270 (100.0%) |
Real Estate Taxes by Mortgage Status in Maywood Park
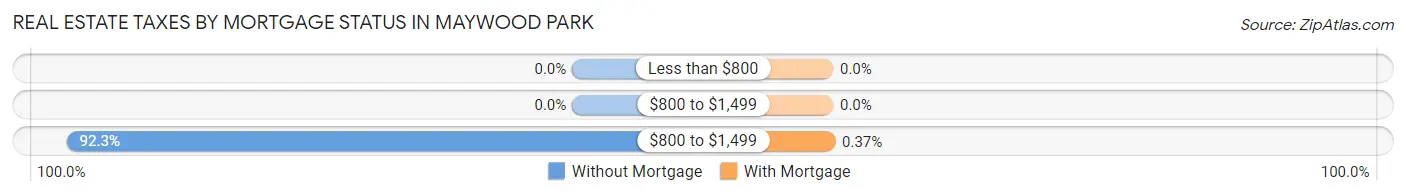
| Property Taxes | Without Mortgage | With Mortgage |
| Less than $800 | 0 (0.0%) | 0 (0.0%) |
| $800 to $1,499 | 0 (0.0%) | 0 (0.0%) |
| $800 to $1,499 | 72 (92.3%) | 1 (0.4%) |
| Total | 78 (100.0%) | 270 (100.0%) |
Health & Disability in Maywood Park
Health Insurance Coverage by Age in Maywood Park
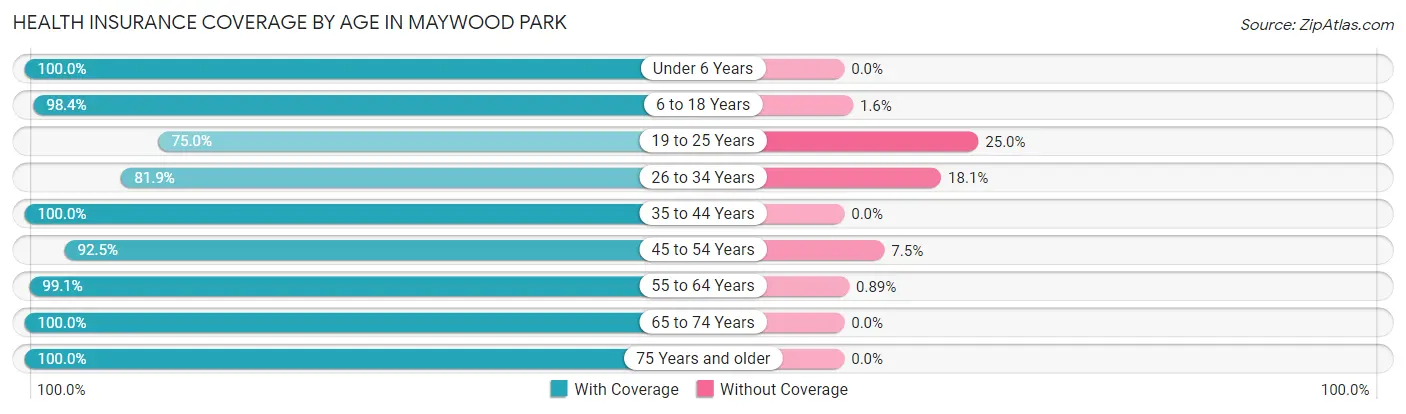
| Age Bracket | With Coverage | Without Coverage |
| Under 6 Years | 73 (100.0%) | 0 (0.0%) |
| 6 to 18 Years | 121 (98.4%) | 2 (1.6%) |
| 19 to 25 Years | 21 (75.0%) | 7 (25.0%) |
| 26 to 34 Years | 118 (81.9%) | 26 (18.1%) |
| 35 to 44 Years | 157 (100.0%) | 0 (0.0%) |
| 45 to 54 Years | 136 (92.5%) | 11 (7.5%) |
| 55 to 64 Years | 223 (99.1%) | 2 (0.9%) |
| 65 to 74 Years | 97 (100.0%) | 0 (0.0%) |
| 75 Years and older | 49 (100.0%) | 0 (0.0%) |
| Total | 995 (95.4%) | 48 (4.6%) |
Health Insurance Coverage by Citizenship Status in Maywood Park
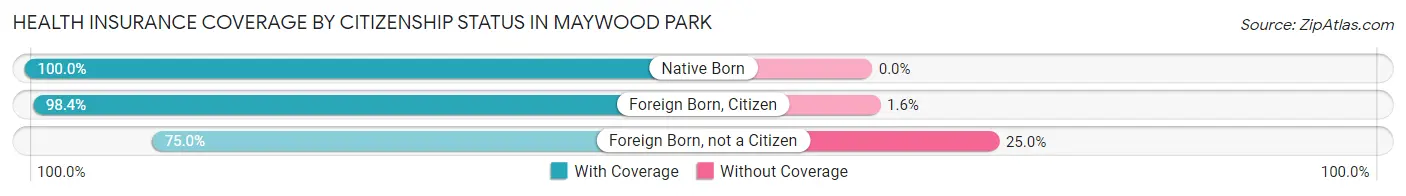
| Citizenship Status | With Coverage | Without Coverage |
| Native Born | 73 (100.0%) | 0 (0.0%) |
| Foreign Born, Citizen | 121 (98.4%) | 2 (1.6%) |
| Foreign Born, not a Citizen | 21 (75.0%) | 7 (25.0%) |
Health Insurance Coverage by Household Income in Maywood Park
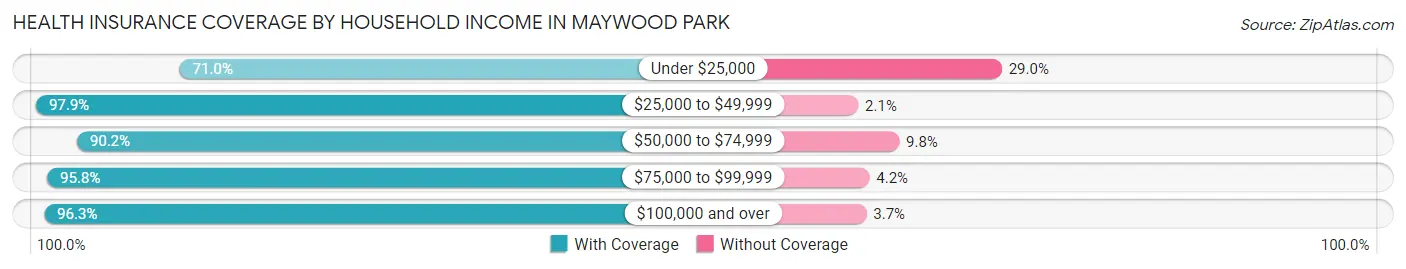
| Household Income | With Coverage | Without Coverage |
| Under $25,000 | 22 (71.0%) | 9 (29.0%) |
| $25,000 to $49,999 | 92 (97.9%) | 2 (2.1%) |
| $50,000 to $74,999 | 46 (90.2%) | 5 (9.8%) |
| $75,000 to $99,999 | 68 (95.8%) | 3 (4.2%) |
| $100,000 and over | 764 (96.3%) | 29 (3.7%) |
Public vs Private Health Insurance Coverage by Age in Maywood Park
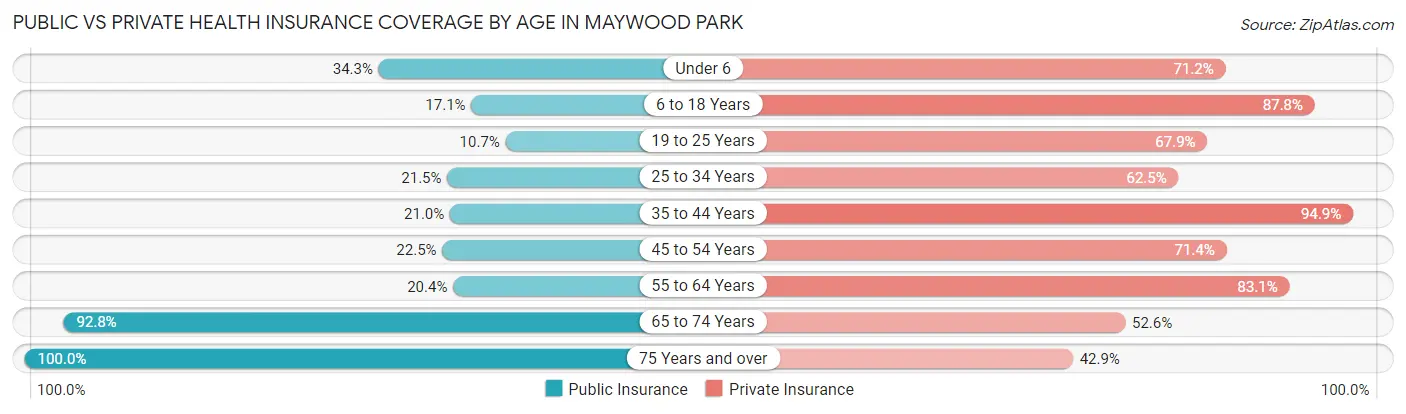
| Age Bracket | Public Insurance | Private Insurance |
| Under 6 | 25 (34.3%) | 52 (71.2%) |
| 6 to 18 Years | 21 (17.1%) | 108 (87.8%) |
| 19 to 25 Years | 3 (10.7%) | 19 (67.9%) |
| 25 to 34 Years | 31 (21.5%) | 90 (62.5%) |
| 35 to 44 Years | 33 (21.0%) | 149 (94.9%) |
| 45 to 54 Years | 33 (22.5%) | 105 (71.4%) |
| 55 to 64 Years | 46 (20.4%) | 187 (83.1%) |
| 65 to 74 Years | 90 (92.8%) | 51 (52.6%) |
| 75 Years and over | 49 (100.0%) | 21 (42.9%) |
| Total | 331 (31.7%) | 782 (75.0%) |
Disability Status by Sex by Age in Maywood Park
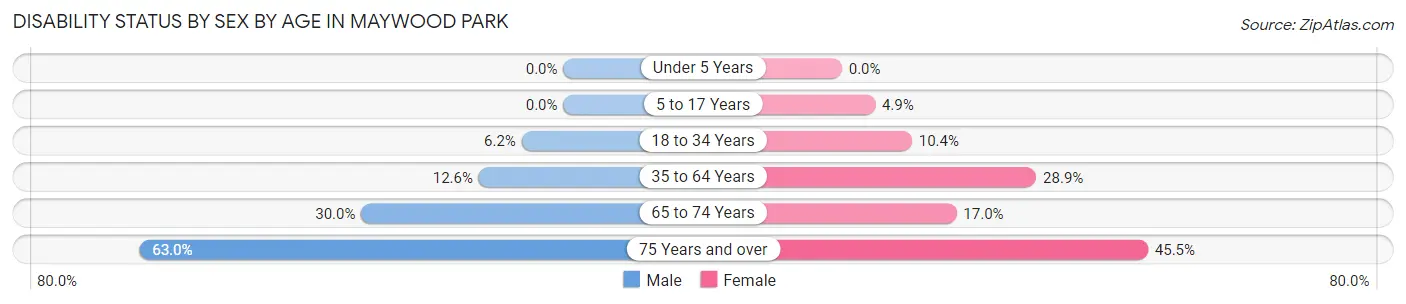
| Age Bracket | Male | Female |
| Under 5 Years | 0 (0.0%) | 0 (0.0%) |
| 5 to 17 Years | 0 (0.0%) | 3 (4.9%) |
| 18 to 34 Years | 6 (6.2%) | 8 (10.4%) |
| 35 to 64 Years | 29 (12.6%) | 86 (28.9%) |
| 65 to 74 Years | 15 (30.0%) | 8 (17.0%) |
| 75 Years and over | 17 (63.0%) | 10 (45.5%) |
Disability Class by Sex by Age in Maywood Park
Disability Class: Hearing Difficulty
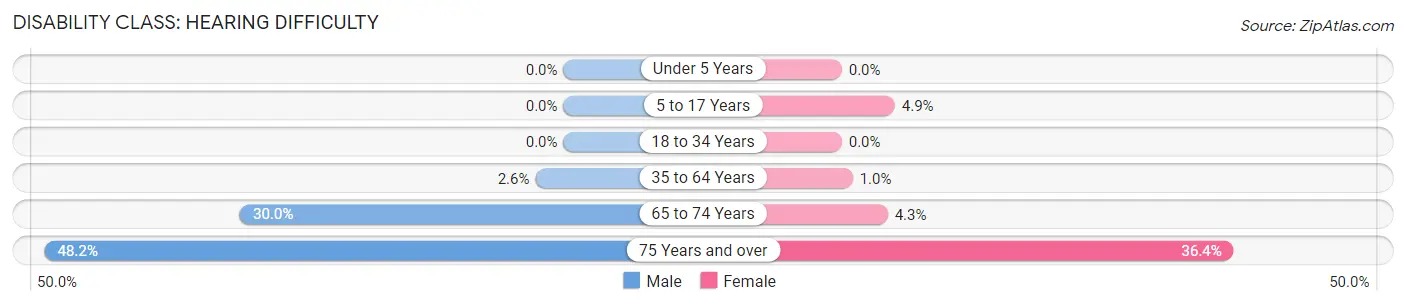
| Age Bracket | Male | Female |
| Under 5 Years | 0 (0.0%) | 0 (0.0%) |
| 5 to 17 Years | 0 (0.0%) | 3 (4.9%) |
| 18 to 34 Years | 0 (0.0%) | 0 (0.0%) |
| 35 to 64 Years | 6 (2.6%) | 3 (1.0%) |
| 65 to 74 Years | 15 (30.0%) | 2 (4.3%) |
| 75 Years and over | 13 (48.1%) | 8 (36.4%) |
Disability Class: Vision Difficulty
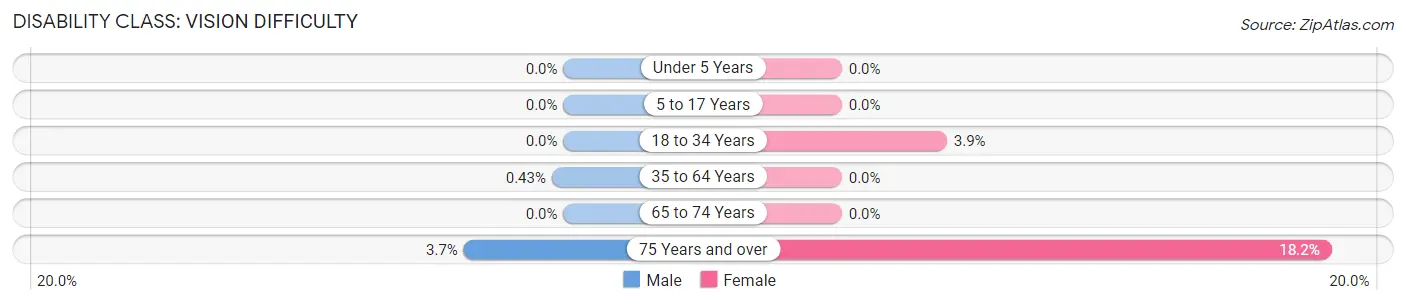
| Age Bracket | Male | Female |
| Under 5 Years | 0 (0.0%) | 0 (0.0%) |
| 5 to 17 Years | 0 (0.0%) | 0 (0.0%) |
| 18 to 34 Years | 0 (0.0%) | 3 (3.9%) |
| 35 to 64 Years | 1 (0.4%) | 0 (0.0%) |
| 65 to 74 Years | 0 (0.0%) | 0 (0.0%) |
| 75 Years and over | 1 (3.7%) | 4 (18.2%) |
Disability Class: Cognitive Difficulty
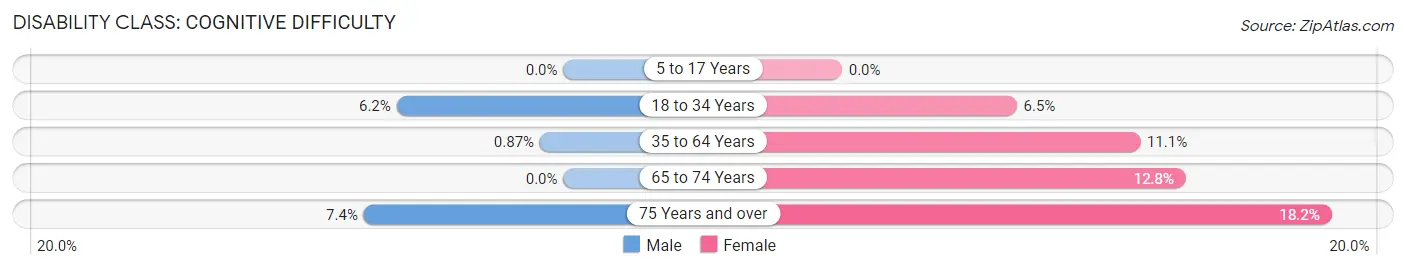
| Age Bracket | Male | Female |
| 5 to 17 Years | 0 (0.0%) | 0 (0.0%) |
| 18 to 34 Years | 6 (6.2%) | 5 (6.5%) |
| 35 to 64 Years | 2 (0.9%) | 33 (11.1%) |
| 65 to 74 Years | 0 (0.0%) | 6 (12.8%) |
| 75 Years and over | 2 (7.4%) | 4 (18.2%) |
Disability Class: Ambulatory Difficulty
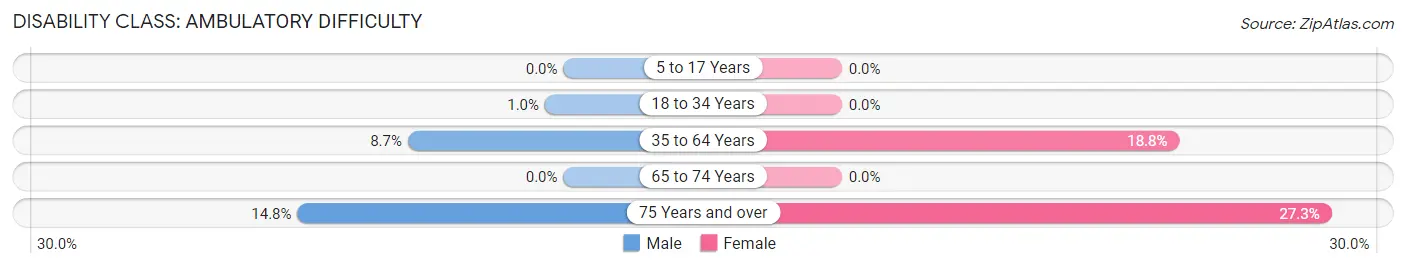
| Age Bracket | Male | Female |
| 5 to 17 Years | 0 (0.0%) | 0 (0.0%) |
| 18 to 34 Years | 1 (1.0%) | 0 (0.0%) |
| 35 to 64 Years | 20 (8.7%) | 56 (18.8%) |
| 65 to 74 Years | 0 (0.0%) | 0 (0.0%) |
| 75 Years and over | 4 (14.8%) | 6 (27.3%) |
Disability Class: Self-Care Difficulty
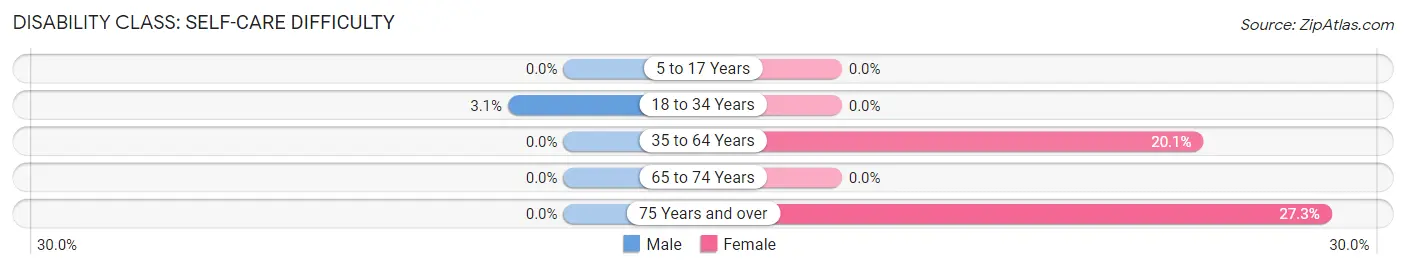
| Age Bracket | Male | Female |
| 5 to 17 Years | 0 (0.0%) | 0 (0.0%) |
| 18 to 34 Years | 3 (3.1%) | 0 (0.0%) |
| 35 to 64 Years | 0 (0.0%) | 60 (20.1%) |
| 65 to 74 Years | 0 (0.0%) | 0 (0.0%) |
| 75 Years and over | 0 (0.0%) | 6 (27.3%) |
Technology Access in Maywood Park
Computing Device Access in Maywood Park
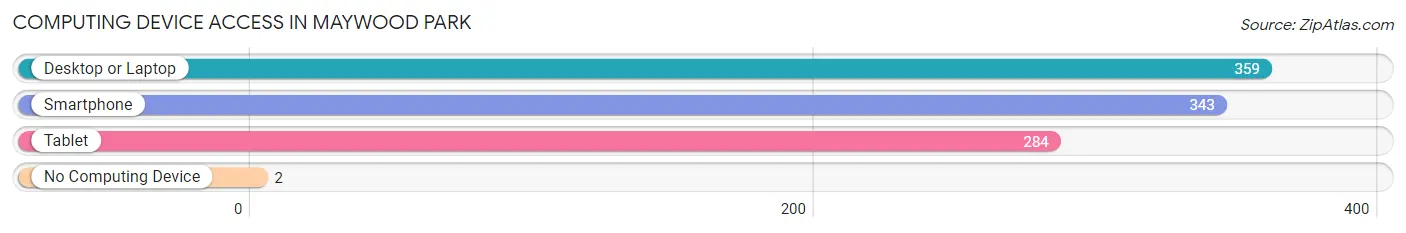
| Device Type | # Households | % Households |
| Desktop or Laptop | 359 | 96.8% |
| Smartphone | 343 | 92.4% |
| Tablet | 284 | 76.5% |
| No Computing Device | 2 | 0.5% |
| Total | 371 | 100.0% |
Internet Access in Maywood Park
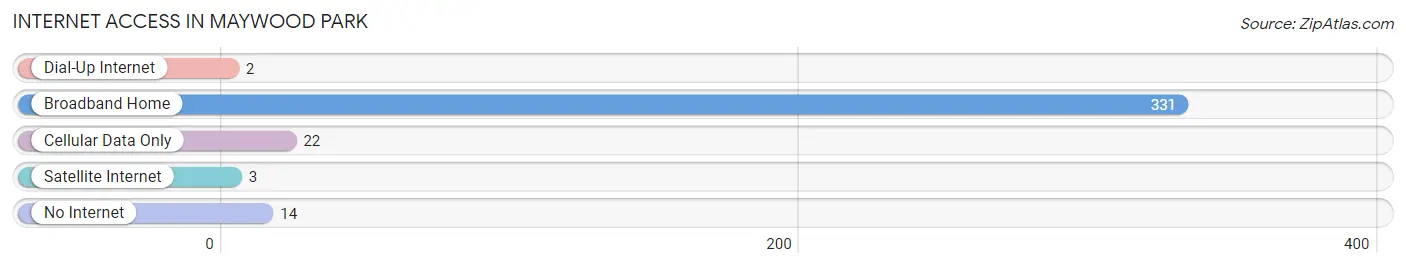
| Internet Type | # Households | % Households |
| Dial-Up Internet | 2 | 0.5% |
| Broadband Home | 331 | 89.2% |
| Cellular Data Only | 22 | 5.9% |
| Satellite Internet | 3 | 0.8% |
| No Internet | 14 | 3.8% |
| Total | 371 | 100.0% |
Maywood Park Summary
Maywood Park is a small city located in Multnomah County, Oregon, United States. It is a suburb of Portland and is located just east of the city. The population was 1,845 at the 2010 census.
History
Maywood Park was founded in the early 1900s by the Maywood family, who owned a large tract of land in the area. The family sold the land to developers in the 1920s, and the city was incorporated in 1929. The city was named after the Maywood family, who were prominent in the area.
The city was originally a rural farming community, but in the 1950s and 1960s, the city began to experience rapid growth as Portland's suburbs expanded. The city was annexed by Portland in the 1970s, and today it is a small, residential community.
Geography
Maywood Park is located in Multnomah County, Oregon, United States. It is located just east of Portland, and is bordered by the cities of Gresham and Troutdale to the east, and Portland to the west. The city has a total area of 1.2 square miles, all of which is land.
The city is located in the Tualatin Valley, and is situated on the banks of the Willamette River. The city is located at an elevation of approximately 200 feet above sea level.
Economy
Maywood Park is primarily a residential community, and the majority of its residents are employed in the Portland metropolitan area. The city does not have any major employers, but there are several small businesses located in the city.
The city is home to several parks, including Maywood Park, which is the city's largest park. The park features a playground, picnic areas, and a walking path.
Demographics
As of the 2010 census, there were 1,845 people, 745 households, and 486 families residing in the city. The population density was 1,527.3 people per square mile. The racial makeup of the city was 87.3% White, 4.2% African American, 0.7% Native American, 2.2% Asian, 0.1% Pacific Islander, 2.2% from other races, and 3.3% from two or more races. Hispanic or Latino of any race were 6.2% of the population.
The median income for a household in the city was $50,938, and the median income for a family was $60,938. The per capita income for the city was $25,938. About 6.2% of families and 8.2% of the population were below the poverty line, including 11.2% of those under age 18 and 4.2% of those age 65 or over.
Maywood Park is a small, residential community with a diverse population. The city is home to a variety of businesses, parks, and recreational activities, making it an attractive place to live.
Common Questions
What is Per Capita Income in Maywood Park?
Per Capita income in Maywood Park is $57,078.
What is the Median Family Income in Maywood Park?
Median Family Income in Maywood Park is $137,188.
What is the Median Household income in Maywood Park?
Median Household Income in Maywood Park is $130,481.
What is Income or Wage Gap in Maywood Park?
Income or Wage Gap in Maywood Park is 32.3%.
Women in Maywood Park earn 67.7 cents for every dollar earned by a man.
What is Inequality or Gini Index in Maywood Park?
Inequality or Gini Index in Maywood Park is 0.40.
What is the Total Population of Maywood Park?
Total Population of Maywood Park is 1,043.
What is the Total Male Population of Maywood Park?
Total Male Population of Maywood Park is 512.
What is the Total Female Population of Maywood Park?
Total Female Population of Maywood Park is 531.
What is the Ratio of Males per 100 Females in Maywood Park?
There are 96.42 Males per 100 Females in Maywood Park.
What is the Ratio of Females per 100 Males in Maywood Park?
There are 103.71 Females per 100 Males in Maywood Park.
What is the Median Population Age in Maywood Park?
Median Population Age in Maywood Park is 44.7 Years.
What is the Average Family Size in Maywood Park
Average Family Size in Maywood Park is 2.8 People.
What is the Average Household Size in Maywood Park
Average Household Size in Maywood Park is 2.8 People.
How Large is the Labor Force in Maywood Park?
There are 553 People in the Labor Forcein in Maywood Park.
What is the Percentage of People in the Labor Force in Maywood Park?
62.1% of People are in the Labor Force in Maywood Park.
What is the Unemployment Rate in Maywood Park?
Unemployment Rate in Maywood Park is 2.0%.