Grand Marais, MN Map & Demographics
Grand Marais Map
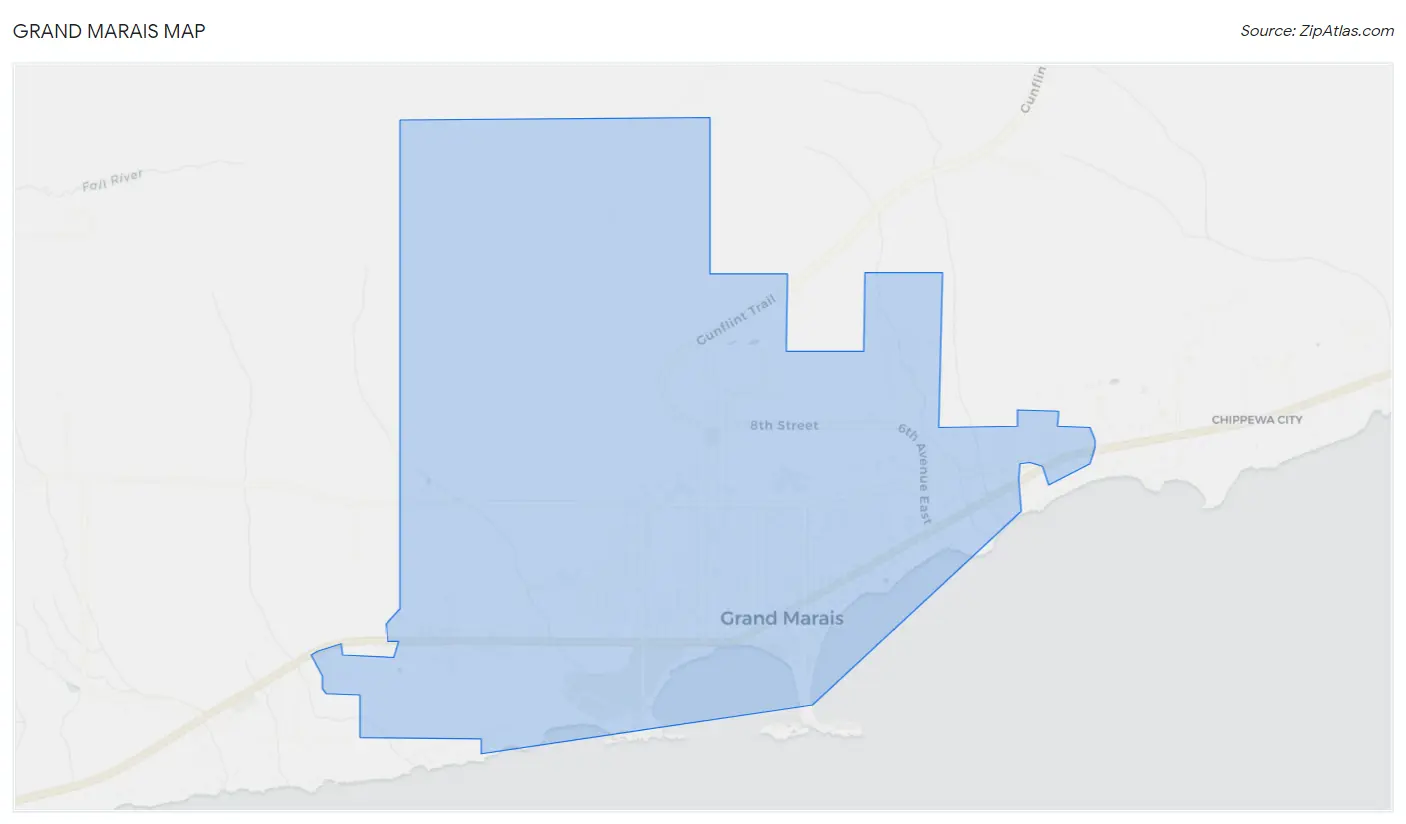
Grand Marais Overview
$36,814
PER CAPITA INCOME
$77,333
AVG FAMILY INCOME
$68,640
AVG HOUSEHOLD INCOME
26.3%
WAGE / INCOME GAP [ % ]
73.7¢/ $1
WAGE / INCOME GAP [ $ ]
0.33
INEQUALITY / GINI INDEX
1,768
TOTAL POPULATION
928
MALE POPULATION
840
FEMALE POPULATION
110.48
MALES / 100 FEMALES
90.52
FEMALES / 100 MALES
45.1
MEDIAN AGE
2.8
AVG FAMILY SIZE
2.1
AVG HOUSEHOLD SIZE
877
LABOR FORCE [ PEOPLE ]
59.2%
PERCENT IN LABOR FORCE
1.4%
UNEMPLOYMENT RATE
Grand Marais Zip Codes
Grand Marais Area Codes
Income in Grand Marais
Income Overview in Grand Marais
Per Capita Income in Grand Marais is $36,814, while median incomes of families and households are $77,333 and $68,640 respectively.
| Characteristic | Number | Measure |
| Per Capita Income | 1,768 | $36,814 |
| Median Family Income | 466 | $77,333 |
| Mean Family Income | 466 | $92,888 |
| Median Household Income | 831 | $68,640 |
| Mean Household Income | 831 | $76,360 |
| Income Deficit | 466 | $0 |
| Wage / Income Gap (%) | 1,768 | 26.25% |
| Wage / Income Gap ($) | 1,768 | 73.75¢ per $1 |
| Gini / Inequality Index | 1,768 | 0.33 |
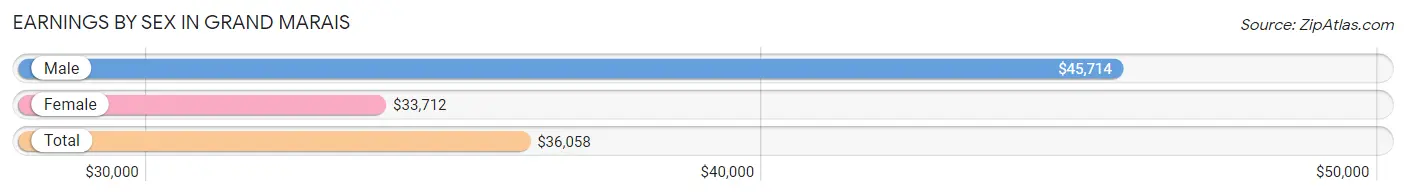
Earnings by Sex in Grand Marais
Average Earnings in Grand Marais are $36,058, $45,714 for men and $33,712 for women, a difference of 26.3%.
| Sex | Number | Average Earnings |
| Male | 504 (53.7%) | $45,714 |
| Female | 435 (46.3%) | $33,712 |
| Total | 939 (100.0%) | $36,058 |
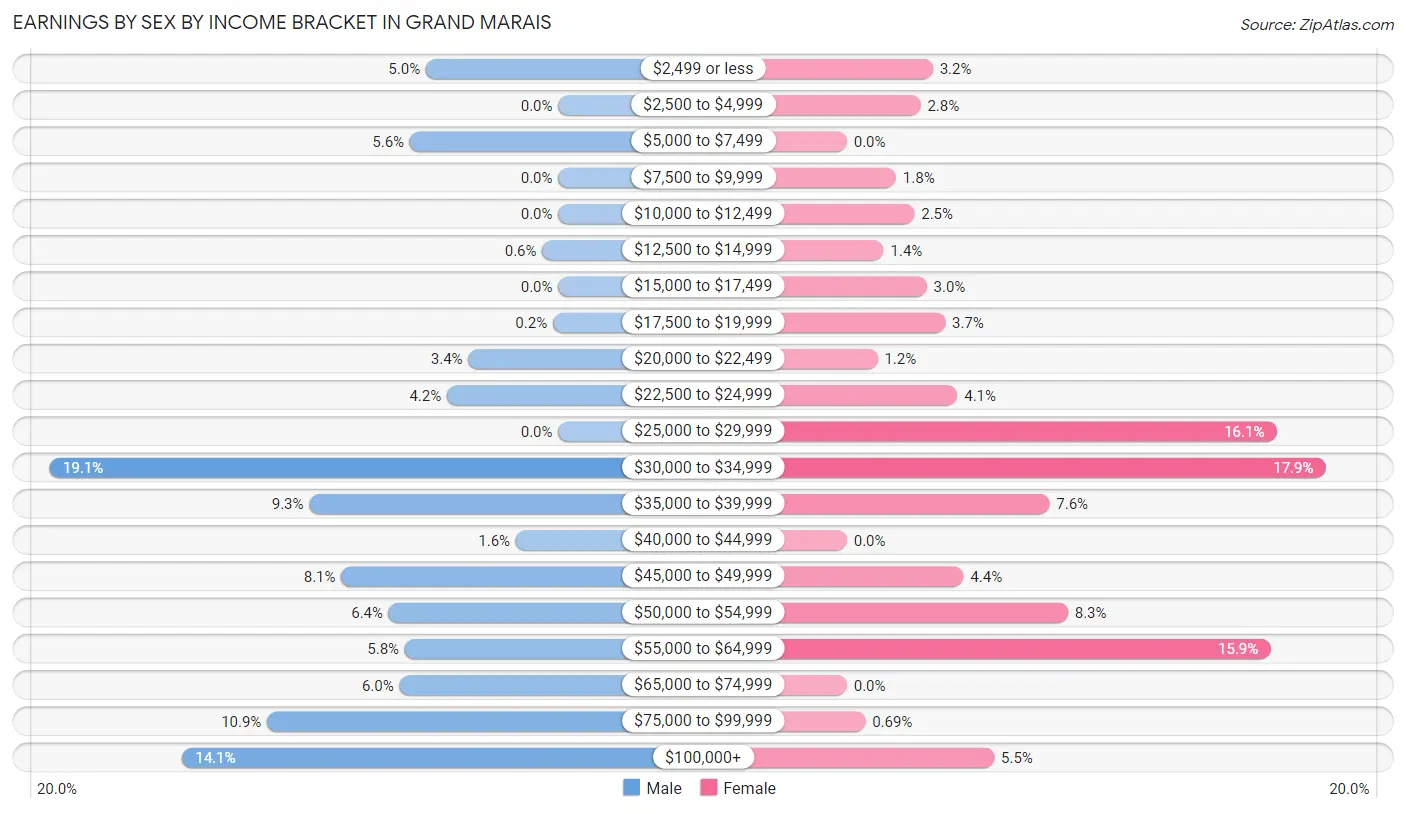
Earnings by Sex by Income Bracket in Grand Marais
The most common earnings brackets in Grand Marais are $30,000 to $34,999 for men (96 | 19.1%) and $30,000 to $34,999 for women (78 | 17.9%).
| Income | Male | Female |
| $2,499 or less | 25 (5.0%) | 14 (3.2%) |
| $2,500 to $4,999 | 0 (0.0%) | 12 (2.8%) |
| $5,000 to $7,499 | 28 (5.6%) | 0 (0.0%) |
| $7,500 to $9,999 | 0 (0.0%) | 8 (1.8%) |
| $10,000 to $12,499 | 0 (0.0%) | 11 (2.5%) |
| $12,500 to $14,999 | 3 (0.6%) | 6 (1.4%) |
| $15,000 to $17,499 | 0 (0.0%) | 13 (3.0%) |
| $17,500 to $19,999 | 1 (0.2%) | 16 (3.7%) |
| $20,000 to $22,499 | 17 (3.4%) | 5 (1.1%) |
| $22,500 to $24,999 | 21 (4.2%) | 18 (4.1%) |
| $25,000 to $29,999 | 0 (0.0%) | 70 (16.1%) |
| $30,000 to $34,999 | 96 (19.1%) | 78 (17.9%) |
| $35,000 to $39,999 | 47 (9.3%) | 33 (7.6%) |
| $40,000 to $44,999 | 8 (1.6%) | 0 (0.0%) |
| $45,000 to $49,999 | 41 (8.1%) | 19 (4.4%) |
| $50,000 to $54,999 | 32 (6.4%) | 36 (8.3%) |
| $55,000 to $64,999 | 29 (5.8%) | 69 (15.9%) |
| $65,000 to $74,999 | 30 (5.9%) | 0 (0.0%) |
| $75,000 to $99,999 | 55 (10.9%) | 3 (0.7%) |
| $100,000+ | 71 (14.1%) | 24 (5.5%) |
| Total | 504 (100.0%) | 435 (100.0%) |
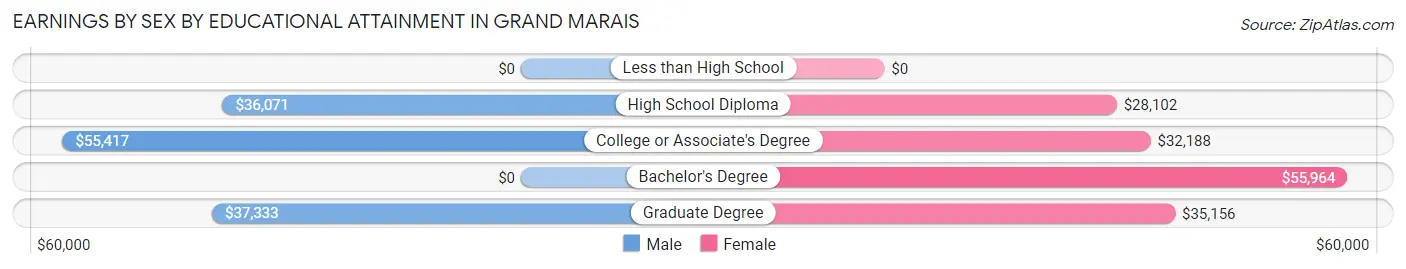
Earnings by Sex by Educational Attainment in Grand Marais
Average earnings in Grand Marais are $46,667 for men and $33,536 for women, a difference of 28.1%. Men with an educational attainment of college or associate's degree enjoy the highest average annual earnings of $55,417, while those with high school diploma education earn the least with $36,071. Women with an educational attainment of bachelor's degree earn the most with the average annual earnings of $55,964, while those with high school diploma education have the smallest earnings of $28,102.
| Educational Attainment | Male Income | Female Income |
| Less than High School | - | - |
| High School Diploma | $36,071 | $28,102 |
| College or Associate's Degree | $55,417 | $32,188 |
| Bachelor's Degree | - | - |
| Graduate Degree | $37,333 | $35,156 |
| Total | $46,667 | $33,536 |
Family Income in Grand Marais
Family Income Brackets in Grand Marais
According to the Grand Marais family income data, there are 137 families falling into the $50,000 to $74,999 income range, which is the most common income bracket and makes up 29.4% of all families.
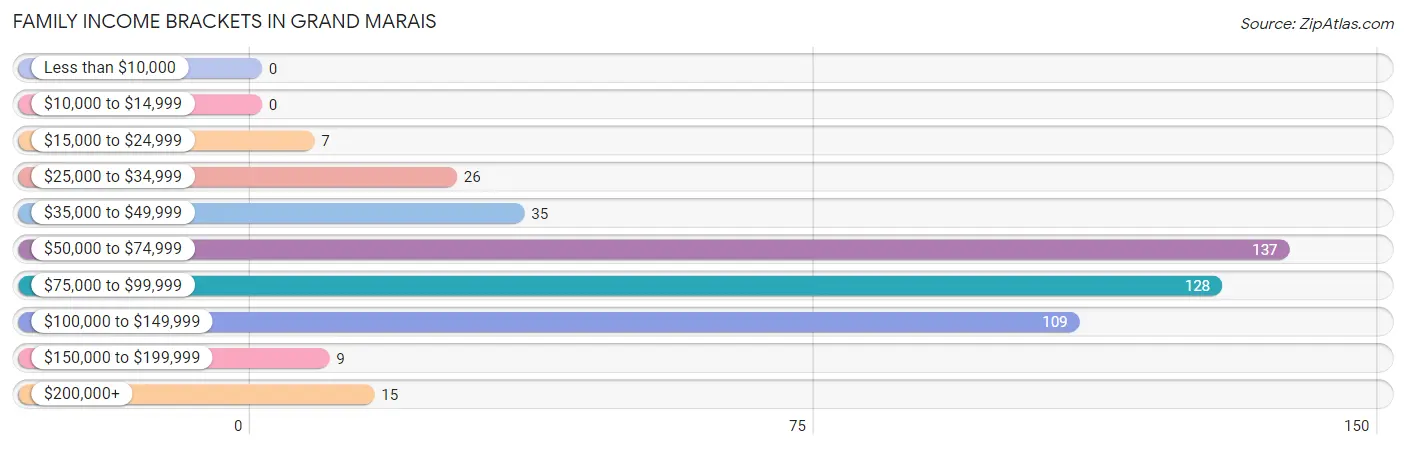
| Income Bracket | # Families | % Families |
| Less than $10,000 | 0 | 0.0% |
| $10,000 to $14,999 | 0 | 0.0% |
| $15,000 to $24,999 | 7 | 1.5% |
| $25,000 to $34,999 | 26 | 5.6% |
| $35,000 to $49,999 | 35 | 7.5% |
| $50,000 to $74,999 | 137 | 29.4% |
| $75,000 to $99,999 | 128 | 27.5% |
| $100,000 to $149,999 | 109 | 23.4% |
| $150,000 to $199,999 | 9 | 1.9% |
| $200,000+ | 15 | 3.2% |
Family Income by Famaliy Size in Grand Marais
5-person families (31 | 6.7%) account for the highest median family income in Grand Marais with $142,961 per family, while 2-person families (273 | 58.6%) have the highest median income of $41,220 per family member.
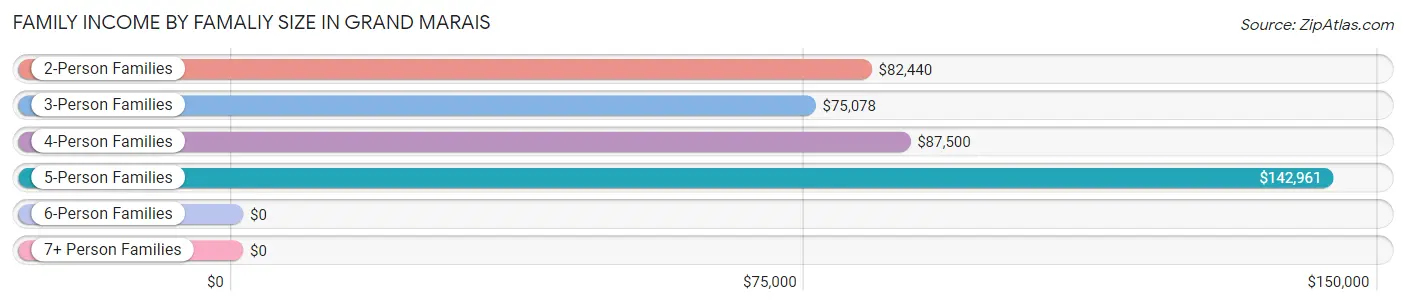
| Income Bracket | # Families | Median Income |
| 2-Person Families | 273 (58.6%) | $82,440 |
| 3-Person Families | 85 (18.2%) | $75,078 |
| 4-Person Families | 56 (12.0%) | $87,500 |
| 5-Person Families | 31 (6.7%) | $142,961 |
| 6-Person Families | 8 (1.7%) | $0 |
| 7+ Person Families | 13 (2.8%) | $0 |
| Total | 466 (100.0%) | $77,333 |
Family Income by Number of Earners in Grand Marais
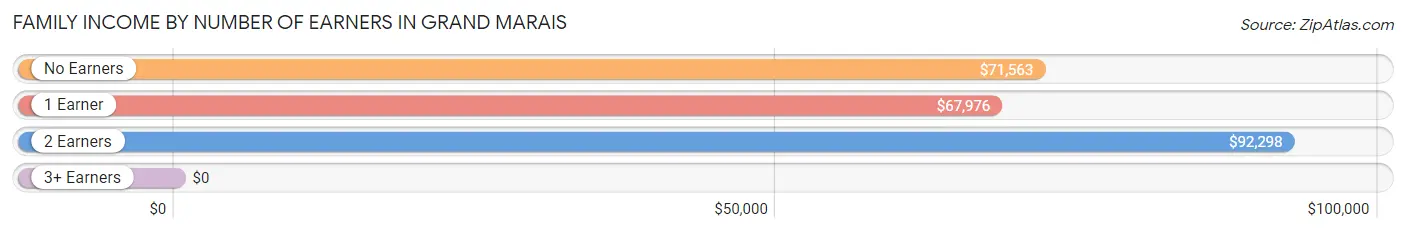
| Number of Earners | # Families | Median Income |
| No Earners | 99 (21.2%) | $71,563 |
| 1 Earner | 124 (26.6%) | $67,976 |
| 2 Earners | 199 (42.7%) | $92,298 |
| 3+ Earners | 44 (9.4%) | $0 |
| Total | 466 (100.0%) | $77,333 |
Household Income in Grand Marais
Household Income Brackets in Grand Marais
With 257 households falling in the category, the $50,000 to $74,999 income range is the most frequent in Grand Marais, accounting for 30.9% of all households. In contrast, only 11 households (1.3%) fall into the $10,000 to $14,999 income bracket, making it the least populous group.
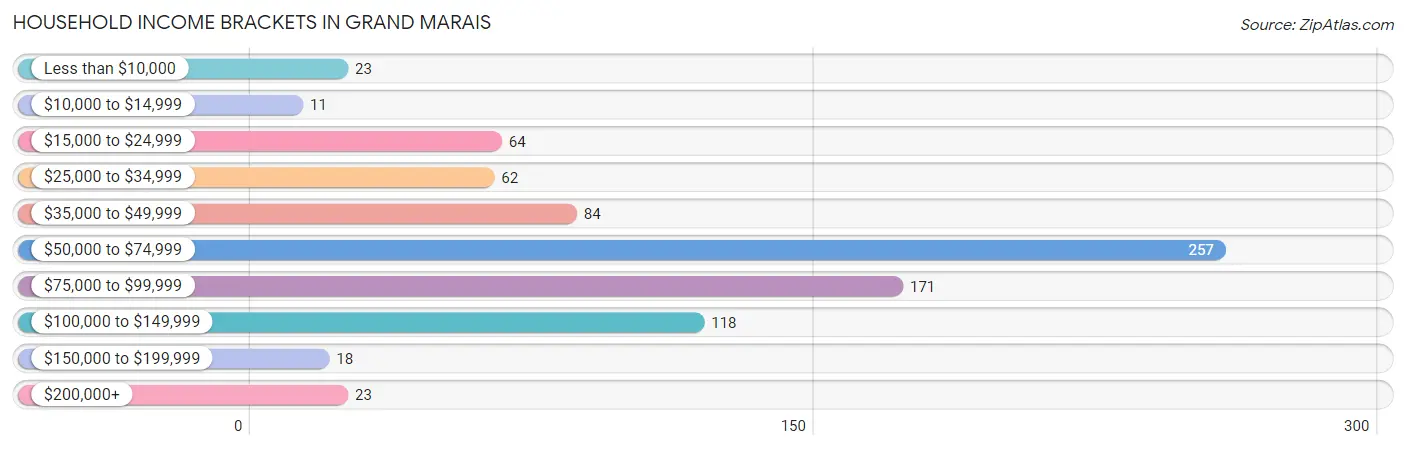
| Income Bracket | # Households | % Households |
| Less than $10,000 | 23 | 2.8% |
| $10,000 to $14,999 | 11 | 1.3% |
| $15,000 to $24,999 | 64 | 7.7% |
| $25,000 to $34,999 | 62 | 7.5% |
| $35,000 to $49,999 | 84 | 10.1% |
| $50,000 to $74,999 | 257 | 30.9% |
| $75,000 to $99,999 | 171 | 20.6% |
| $100,000 to $149,999 | 118 | 14.2% |
| $150,000 to $199,999 | 18 | 2.2% |
| $200,000+ | 23 | 2.8% |
Household Income by Householder Age in Grand Marais
The median household income in Grand Marais is $68,640, with the highest median household income of $71,932 found in the 25 to 44 years age bracket for the primary householder. A total of 254 households (30.6%) fall into this category. Meanwhile, the 15 to 24 years age bracket for the primary householder has the lowest median household income of $0, with 30 households (3.6%) in this group.
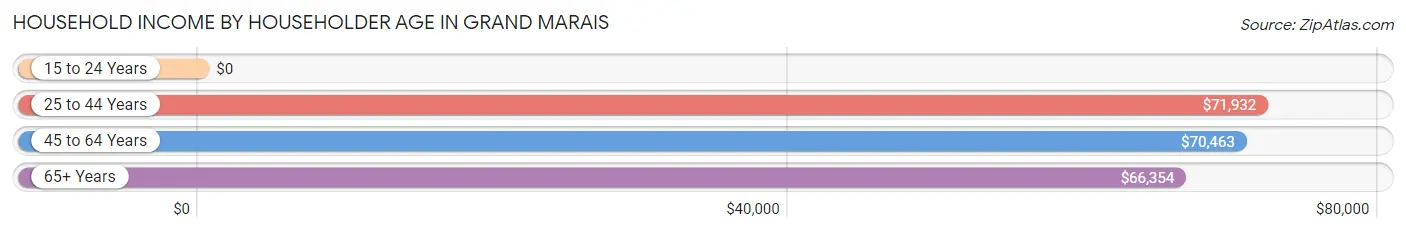
| Income Bracket | # Households | Median Income |
| 15 to 24 Years | 30 (3.6%) | $0 |
| 25 to 44 Years | 254 (30.6%) | $71,932 |
| 45 to 64 Years | 282 (33.9%) | $70,463 |
| 65+ Years | 265 (31.9%) | $66,354 |
| Total | 831 (100.0%) | $68,640 |
Poverty in Grand Marais
Income Below Poverty by Sex and Age in Grand Marais
With 10.7% poverty level for males and 7.1% for females among the residents of Grand Marais, 18 to 24 year old males and 12 to 14 year old females are the most vulnerable to poverty, with 25 males (62.5%) and 4 females (33.3%) in their respective age groups living below the poverty level.
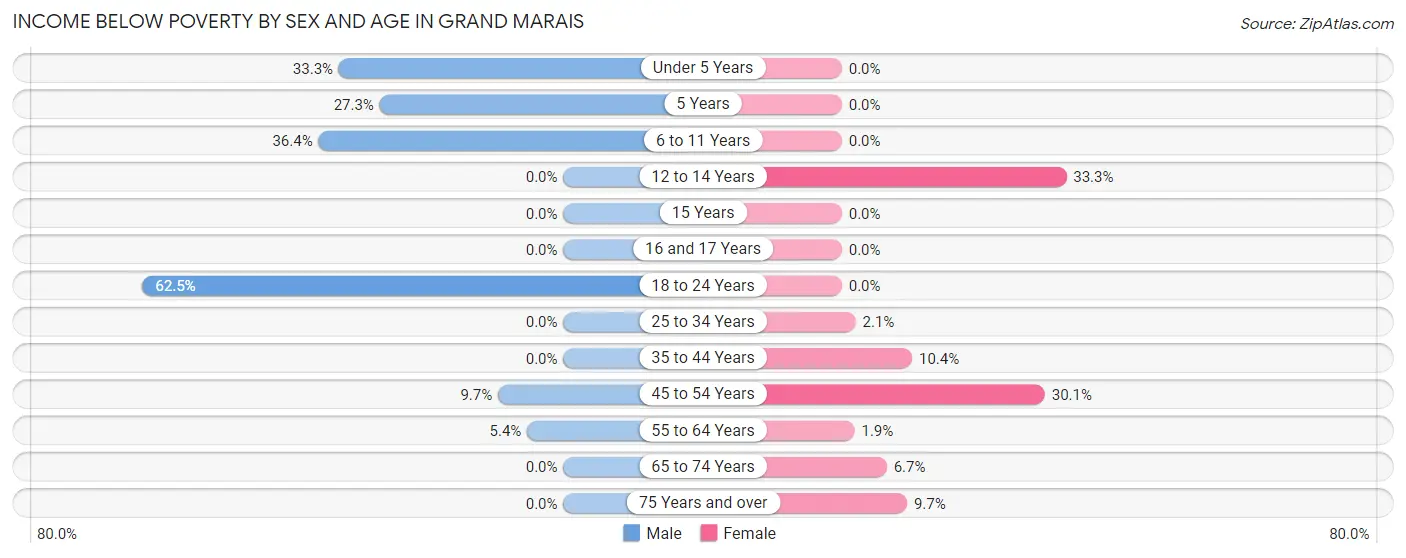
| Age Bracket | Male | Female |
| Under 5 Years | 24 (33.3%) | 0 (0.0%) |
| 5 Years | 3 (27.3%) | 0 (0.0%) |
| 6 to 11 Years | 24 (36.4%) | 0 (0.0%) |
| 12 to 14 Years | 0 (0.0%) | 4 (33.3%) |
| 15 Years | 0 (0.0%) | 0 (0.0%) |
| 16 and 17 Years | 0 (0.0%) | 0 (0.0%) |
| 18 to 24 Years | 25 (62.5%) | 0 (0.0%) |
| 25 to 34 Years | 0 (0.0%) | 3 (2.1%) |
| 35 to 44 Years | 0 (0.0%) | 12 (10.4%) |
| 45 to 54 Years | 13 (9.7%) | 22 (30.1%) |
| 55 to 64 Years | 8 (5.4%) | 2 (1.9%) |
| 65 to 74 Years | 0 (0.0%) | 9 (6.7%) |
| 75 Years and over | 0 (0.0%) | 6 (9.7%) |
| Total | 97 (10.7%) | 58 (7.1%) |
Income Above Poverty by Sex and Age in Grand Marais
According to the poverty statistics in Grand Marais, males aged 12 to 14 years and females aged under 5 years are the age groups that are most secure financially, with 100.0% of males and 100.0% of females in these age groups living above the poverty line.
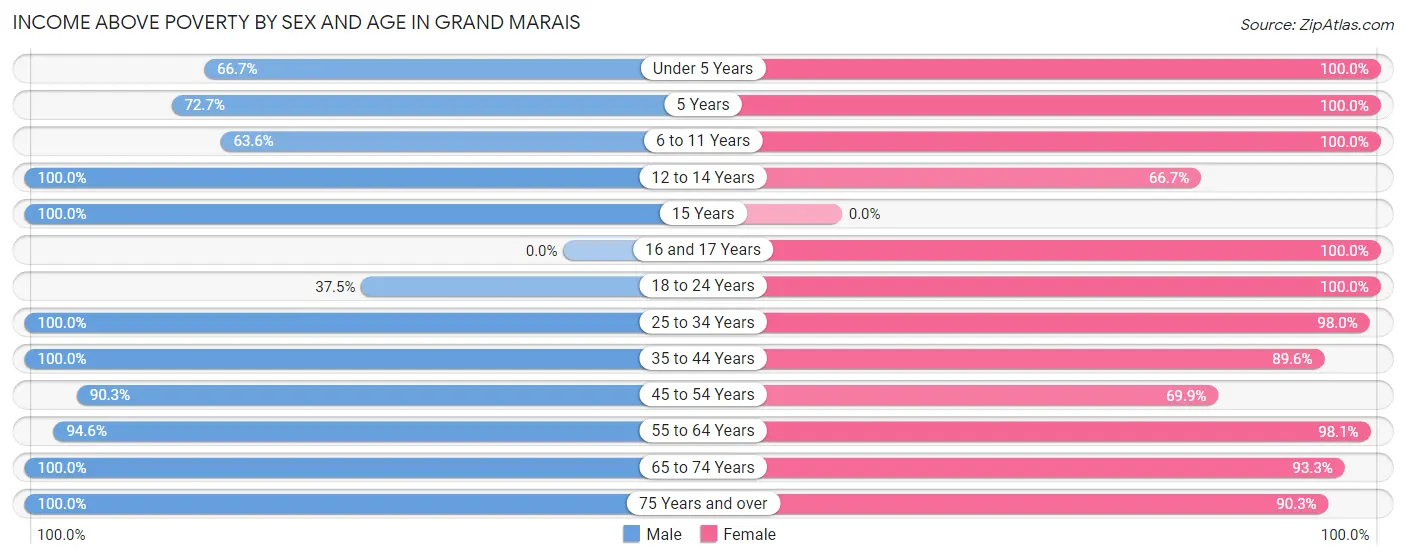
| Age Bracket | Male | Female |
| Under 5 Years | 48 (66.7%) | 42 (100.0%) |
| 5 Years | 8 (72.7%) | 11 (100.0%) |
| 6 to 11 Years | 42 (63.6%) | 38 (100.0%) |
| 12 to 14 Years | 24 (100.0%) | 8 (66.7%) |
| 15 Years | 10 (100.0%) | 0 (0.0%) |
| 16 and 17 Years | 0 (0.0%) | 15 (100.0%) |
| 18 to 24 Years | 15 (37.5%) | 58 (100.0%) |
| 25 to 34 Years | 110 (100.0%) | 143 (98.0%) |
| 35 to 44 Years | 101 (100.0%) | 103 (89.6%) |
| 45 to 54 Years | 121 (90.3%) | 51 (69.9%) |
| 55 to 64 Years | 141 (94.6%) | 104 (98.1%) |
| 65 to 74 Years | 133 (100.0%) | 126 (93.3%) |
| 75 Years and over | 59 (100.0%) | 56 (90.3%) |
| Total | 812 (89.3%) | 755 (92.9%) |
Income Below Poverty Among Married-Couple Families in Grand Marais
The poverty statistics for married-couple families in Grand Marais show that 3.0% or 13 of the total 428 families live below the poverty line. Families with 3 or 4 children have the highest poverty rate of 29.5%, comprising of 13 families. On the other hand, families with no children have the lowest poverty rate of 0.0%, which includes 0 families.
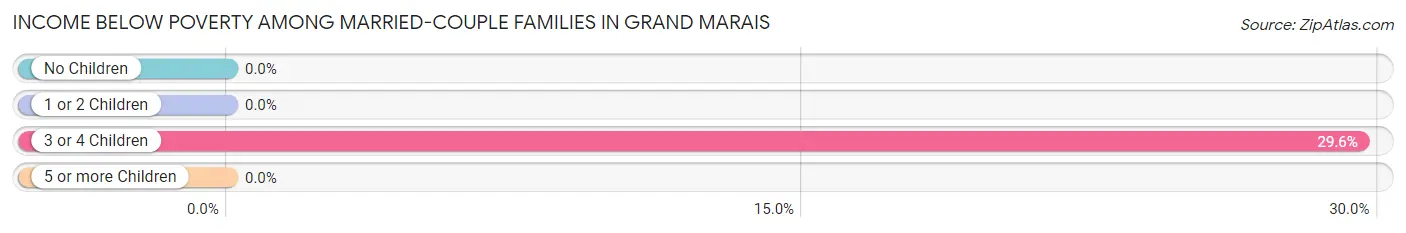
| Children | Above Poverty | Below Poverty |
| No Children | 295 (100.0%) | 0 (0.0%) |
| 1 or 2 Children | 89 (100.0%) | 0 (0.0%) |
| 3 or 4 Children | 31 (70.5%) | 13 (29.5%) |
| 5 or more Children | 0 (0.0%) | 0 (0.0%) |
| Total | 415 (97.0%) | 13 (3.0%) |
Income Below Poverty Among Single-Parent Households in Grand Marais
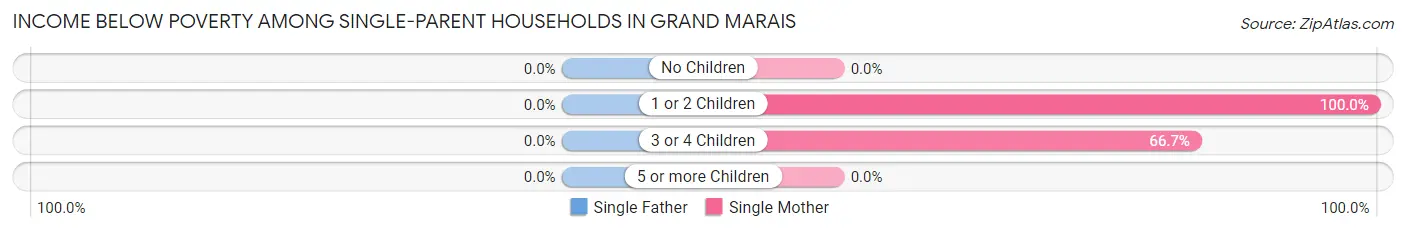
| Children | Single Father | Single Mother |
| No Children | 0 (0.0%) | 0 (0.0%) |
| 1 or 2 Children | 0 (0.0%) | 4 (100.0%) |
| 3 or 4 Children | 0 (0.0%) | 8 (66.7%) |
| 5 or more Children | 0 (0.0%) | 0 (0.0%) |
| Total | 0 (0.0%) | 12 (52.2%) |
Income Below Poverty Among Married-Couple vs Single-Parent Households in Grand Marais
The poverty data for Grand Marais shows that 13 of the married-couple family households (3.0%) and 12 of the single-parent households (31.6%) are living below the poverty level. Within the married-couple family households, those with 3 or 4 children have the highest poverty rate, with 13 households (29.5%) falling below the poverty line. Among the single-parent households, those with 3 or 4 children have the highest poverty rate, with 8 household (44.4%) living below poverty.

| Children | Married-Couple Families | Single-Parent Households |
| No Children | 0 (0.0%) | 0 (0.0%) |
| 1 or 2 Children | 0 (0.0%) | 4 (36.4%) |
| 3 or 4 Children | 13 (29.5%) | 8 (44.4%) |
| 5 or more Children | 0 (0.0%) | 0 (0.0%) |
| Total | 13 (3.0%) | 12 (31.6%) |
Race in Grand Marais
The most populous races in Grand Marais are White / Caucasian (1,605 | 90.8%), Two or more Races (70 | 4.0%), and Native / Alaskan (55 | 3.1%).
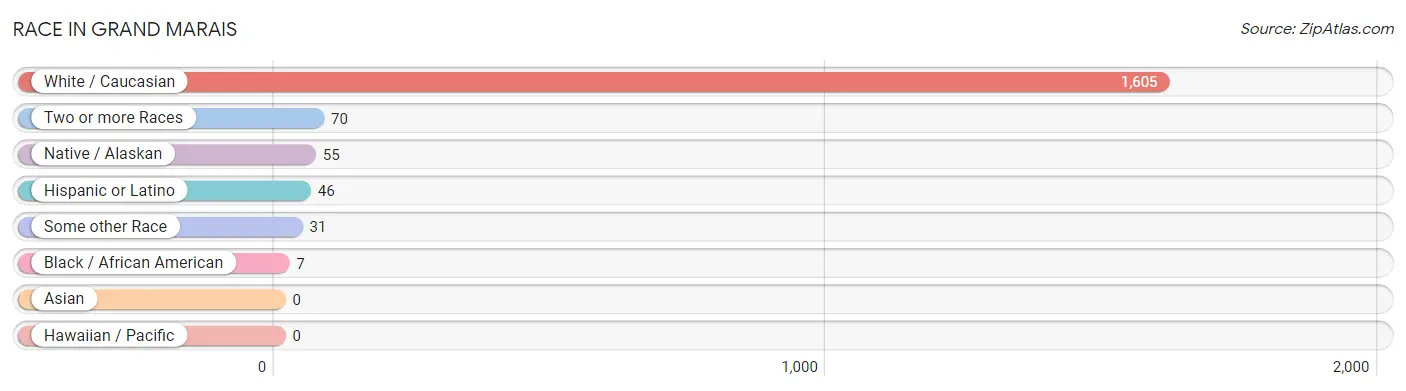
| Race | # Population | % Population |
| Asian | 0 | 0.0% |
| Black / African American | 7 | 0.4% |
| Hawaiian / Pacific | 0 | 0.0% |
| Hispanic or Latino | 46 | 2.6% |
| Native / Alaskan | 55 | 3.1% |
| White / Caucasian | 1,605 | 90.8% |
| Two or more Races | 70 | 4.0% |
| Some other Race | 31 | 1.8% |
| Total | 1,768 | 100.0% |
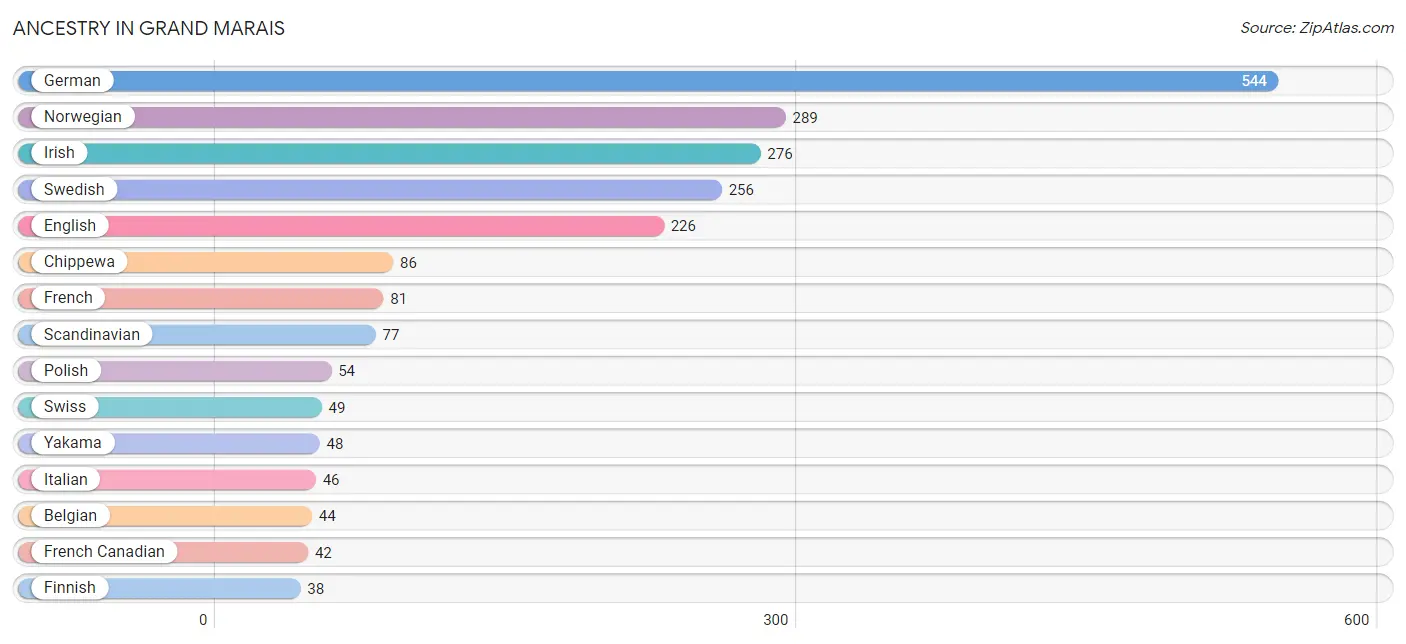
Ancestry in Grand Marais
The most populous ancestries reported in Grand Marais are German (544 | 30.8%), Norwegian (289 | 16.4%), Irish (276 | 15.6%), Swedish (256 | 14.5%), and English (226 | 12.8%), together accounting for 90.0% of all Grand Marais residents.
| Ancestry | # Population | % Population |
| American | 31 | 1.8% |
| Austrian | 12 | 0.7% |
| Belgian | 44 | 2.5% |
| British | 16 | 0.9% |
| Bulgarian | 20 | 1.1% |
| Central American | 15 | 0.9% |
| Chippewa | 86 | 4.9% |
| Croatian | 3 | 0.2% |
| Danish | 29 | 1.6% |
| Dutch | 3 | 0.2% |
| English | 226 | 12.8% |
| European | 18 | 1.0% |
| Finnish | 38 | 2.1% |
| French | 81 | 4.6% |
| French Canadian | 42 | 2.4% |
| German | 544 | 30.8% |
| Guatemalan | 15 | 0.9% |
| Hungarian | 27 | 1.5% |
| Irish | 276 | 15.6% |
| Italian | 46 | 2.6% |
| Korean | 4 | 0.2% |
| Mexican | 3 | 0.2% |
| Native Hawaiian | 11 | 0.6% |
| Northern European | 23 | 1.3% |
| Norwegian | 289 | 16.4% |
| Polish | 54 | 3.0% |
| Puerto Rican | 28 | 1.6% |
| Romanian | 4 | 0.2% |
| Scandinavian | 77 | 4.4% |
| Scottish | 15 | 0.9% |
| Sioux | 9 | 0.5% |
| Somali | 1 | 0.1% |
| Subsaharan African | 1 | 0.1% |
| Swedish | 256 | 14.5% |
| Swiss | 49 | 2.8% |
| Welsh | 10 | 0.6% |
| Yakama | 48 | 2.7% | View All 37 Rows |
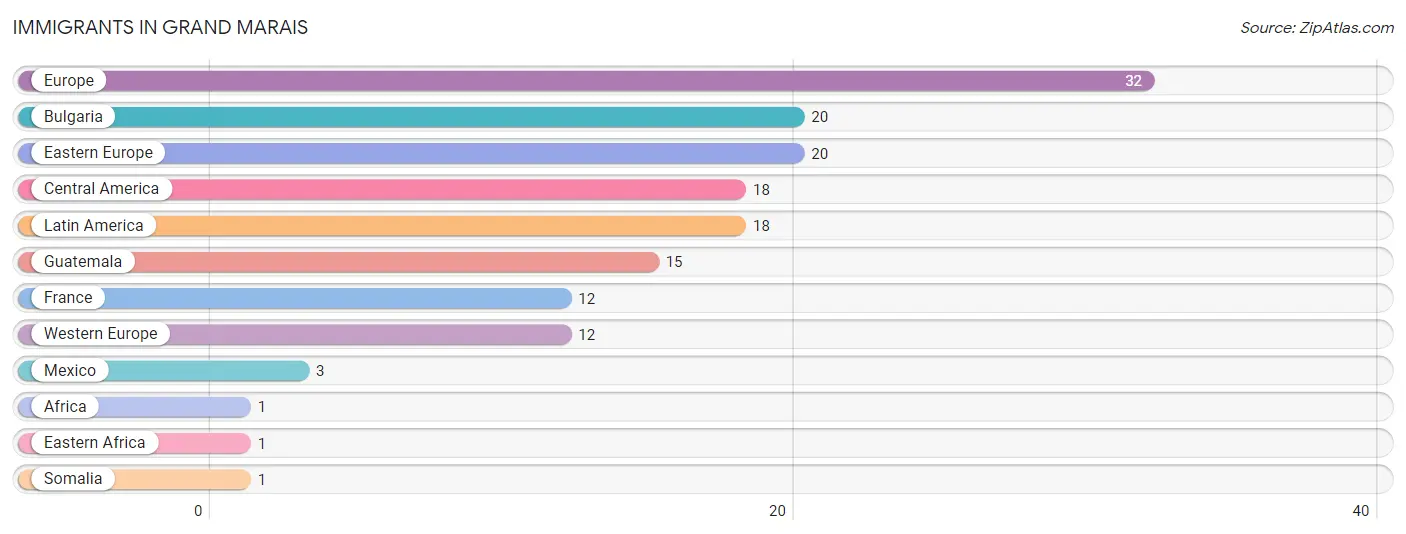
Immigrants in Grand Marais
The most numerous immigrant groups reported in Grand Marais came from Europe (32 | 1.8%), Bulgaria (20 | 1.1%), Eastern Europe (20 | 1.1%), Central America (18 | 1.0%), and Latin America (18 | 1.0%), together accounting for 6.1% of all Grand Marais residents.
| Immigration Origin | # Population | % Population |
| Africa | 1 | 0.1% |
| Bulgaria | 20 | 1.1% |
| Central America | 18 | 1.0% |
| Eastern Africa | 1 | 0.1% |
| Eastern Europe | 20 | 1.1% |
| Europe | 32 | 1.8% |
| France | 12 | 0.7% |
| Guatemala | 15 | 0.9% |
| Latin America | 18 | 1.0% |
| Mexico | 3 | 0.2% |
| Somalia | 1 | 0.1% |
| Western Europe | 12 | 0.7% | View All 12 Rows |
Sex and Age in Grand Marais
Sex and Age in Grand Marais
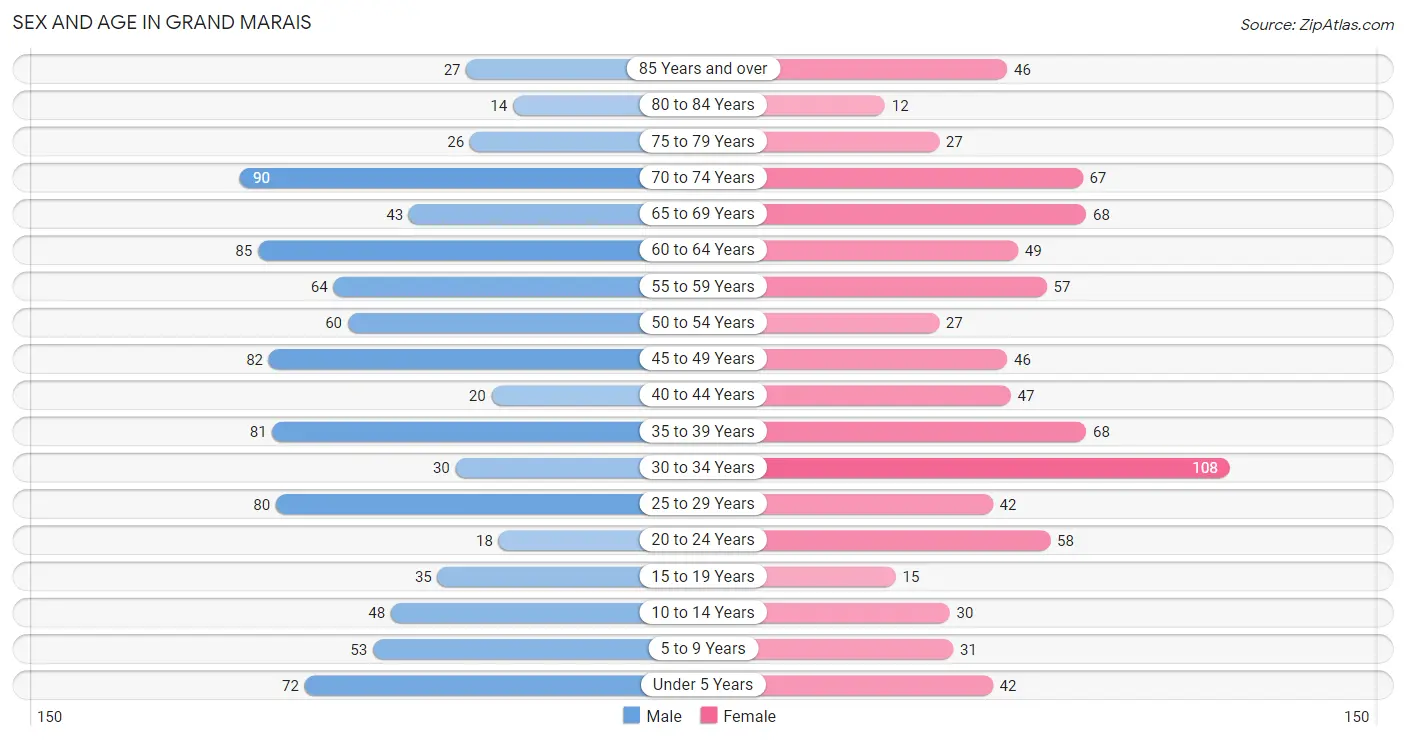
The most populous age groups in Grand Marais are 70 to 74 Years (90 | 9.7%) for men and 30 to 34 Years (108 | 12.9%) for women.
| Age Bracket | Male | Female |
| Under 5 Years | 72 (7.8%) | 42 (5.0%) |
| 5 to 9 Years | 53 (5.7%) | 31 (3.7%) |
| 10 to 14 Years | 48 (5.2%) | 30 (3.6%) |
| 15 to 19 Years | 35 (3.8%) | 15 (1.8%) |
| 20 to 24 Years | 18 (1.9%) | 58 (6.9%) |
| 25 to 29 Years | 80 (8.6%) | 42 (5.0%) |
| 30 to 34 Years | 30 (3.2%) | 108 (12.9%) |
| 35 to 39 Years | 81 (8.7%) | 68 (8.1%) |
| 40 to 44 Years | 20 (2.2%) | 47 (5.6%) |
| 45 to 49 Years | 82 (8.8%) | 46 (5.5%) |
| 50 to 54 Years | 60 (6.5%) | 27 (3.2%) |
| 55 to 59 Years | 64 (6.9%) | 57 (6.8%) |
| 60 to 64 Years | 85 (9.2%) | 49 (5.8%) |
| 65 to 69 Years | 43 (4.6%) | 68 (8.1%) |
| 70 to 74 Years | 90 (9.7%) | 67 (8.0%) |
| 75 to 79 Years | 26 (2.8%) | 27 (3.2%) |
| 80 to 84 Years | 14 (1.5%) | 12 (1.4%) |
| 85 Years and over | 27 (2.9%) | 46 (5.5%) |
| Total | 928 (100.0%) | 840 (100.0%) |
Families and Households in Grand Marais
Median Family Size in Grand Marais
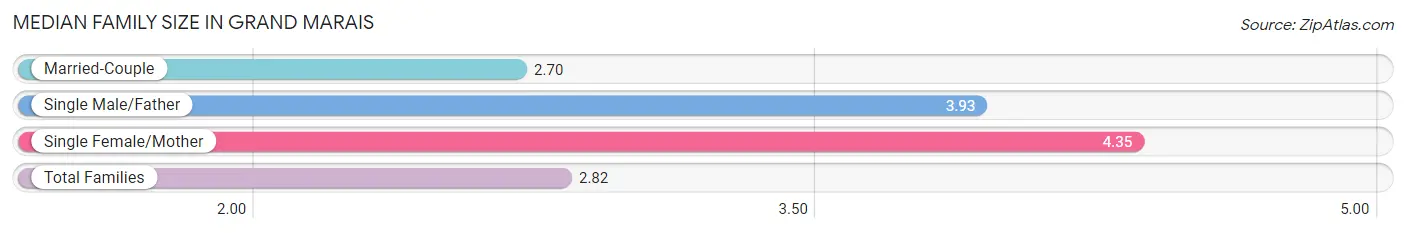
The median family size in Grand Marais is 2.82 persons per family, with single female/mother families (23 | 4.9%) accounting for the largest median family size of 4.35 persons per family. On the other hand, married-couple families (428 | 91.8%) represent the smallest median family size with 2.70 persons per family.
| Family Type | # Families | Family Size |
| Married-Couple | 428 (91.8%) | 2.70 |
| Single Male/Father | 15 (3.2%) | 3.93 |
| Single Female/Mother | 23 (4.9%) | 4.35 |
| Total Families | 466 (100.0%) | 2.82 |
Median Household Size in Grand Marais
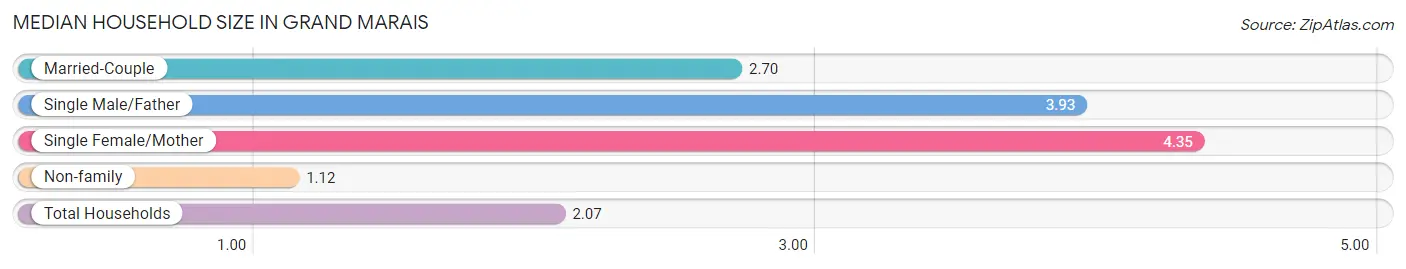
The median household size in Grand Marais is 2.07 persons per household, with single female/mother households (23 | 2.8%) accounting for the largest median household size of 4.35 persons per household. non-family households (365 | 43.9%) represent the smallest median household size with 1.12 persons per household.
| Household Type | # Households | Household Size |
| Married-Couple | 428 (51.5%) | 2.70 |
| Single Male/Father | 15 (1.8%) | 3.93 |
| Single Female/Mother | 23 (2.8%) | 4.35 |
| Non-family | 365 (43.9%) | 1.12 |
| Total Households | 831 (100.0%) | 2.07 |
Household Size by Marriage Status in Grand Marais
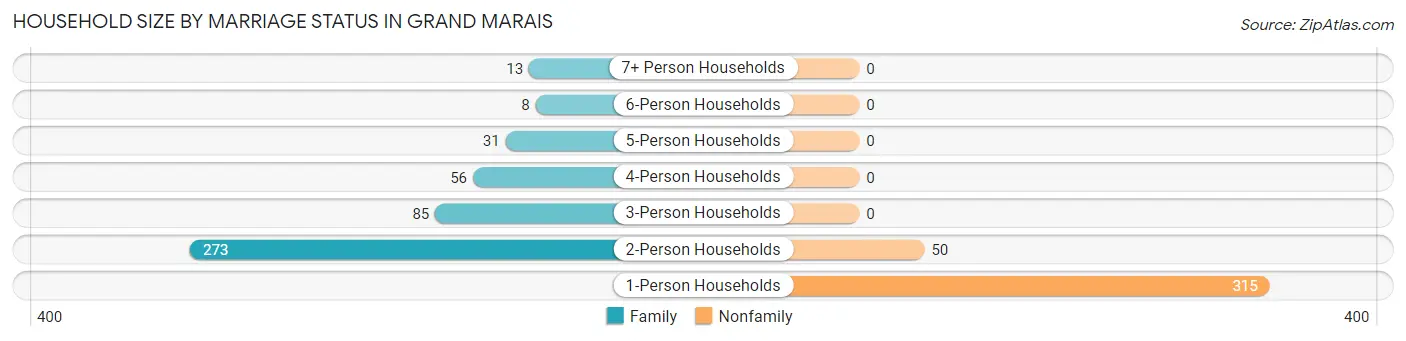
Out of a total of 831 households in Grand Marais, 466 (56.1%) are family households, while 365 (43.9%) are nonfamily households. The most numerous type of family households are 2-person households, comprising 273, and the most common type of nonfamily households are 1-person households, comprising 315.
| Household Size | Family Households | Nonfamily Households |
| 1-Person Households | - | 315 (37.9%) |
| 2-Person Households | 273 (32.9%) | 50 (6.0%) |
| 3-Person Households | 85 (10.2%) | 0 (0.0%) |
| 4-Person Households | 56 (6.7%) | 0 (0.0%) |
| 5-Person Households | 31 (3.7%) | 0 (0.0%) |
| 6-Person Households | 8 (1.0%) | 0 (0.0%) |
| 7+ Person Households | 13 (1.6%) | 0 (0.0%) |
| Total | 466 (56.1%) | 365 (43.9%) |
Female Fertility in Grand Marais
Fertility by Age in Grand Marais
Average fertility rate in Grand Marais is 96.0 births per 1,000 women. Women in the age bracket of 20 to 34 years have the highest fertility rate with 178.0 births per 1,000 women. Women in the age bracket of 20 to 34 years acount for 100.0% of all women with births.
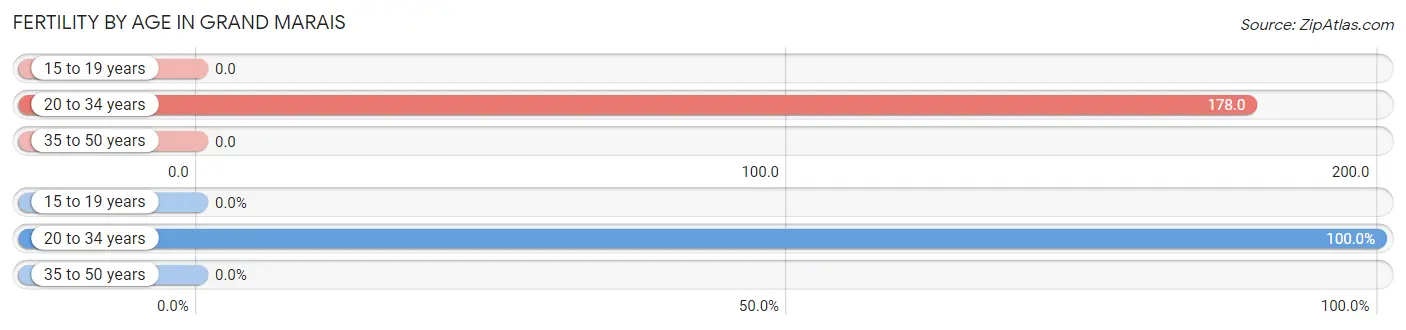
| Age Bracket | Women with Births | Births / 1,000 Women |
| 15 to 19 years | 0 (0.0%) | 0.0 |
| 20 to 34 years | 37 (100.0%) | 178.0 |
| 35 to 50 years | 0 (0.0%) | 0.0 |
| Total | 37 (100.0%) | 96.0 |
Fertility by Age by Marriage Status in Grand Marais
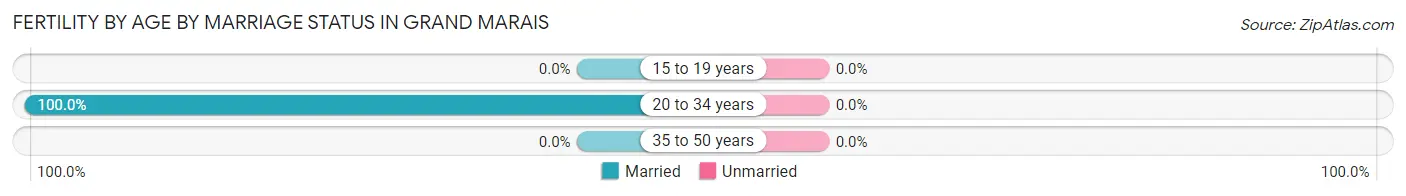
| Age Bracket | Married | Unmarried |
| 15 to 19 years | 0 (0.0%) | 0 (0.0%) |
| 20 to 34 years | 37 (100.0%) | 0 (0.0%) |
| 35 to 50 years | 0 (0.0%) | 0 (0.0%) |
| Total | 37 (100.0%) | 0 (0.0%) |
Fertility by Education in Grand Marais
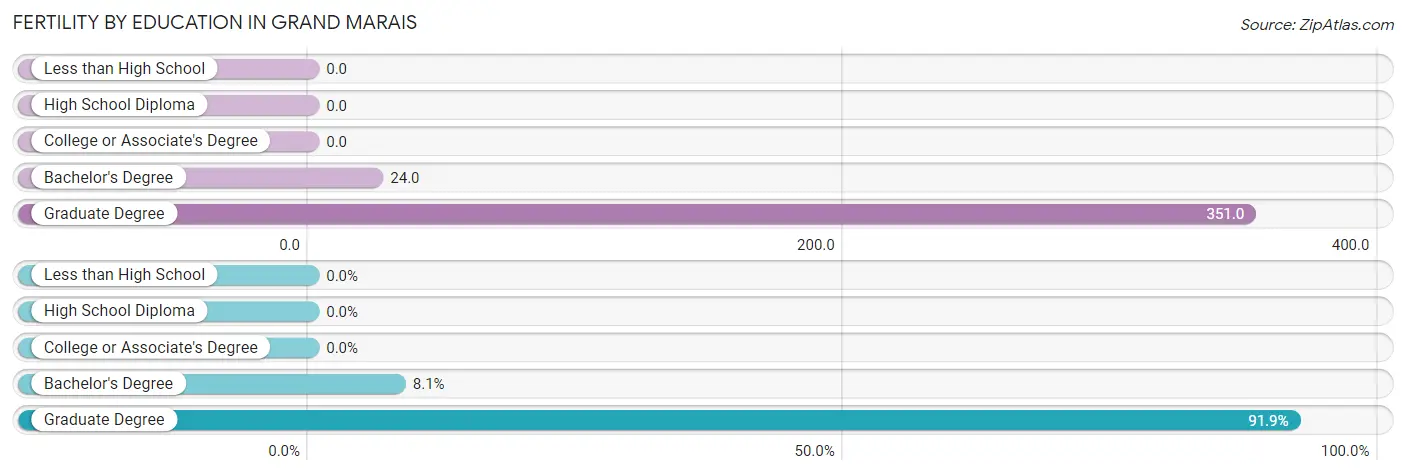
| Educational Attainment | Women with Births | Births / 1,000 Women |
| Less than High School | 0 (0.0%) | 0.0 |
| High School Diploma | 0 (0.0%) | 0.0 |
| College or Associate's Degree | 0 (0.0%) | 0.0 |
| Bachelor's Degree | 3 (8.1%) | 24.0 |
| Graduate Degree | 34 (91.9%) | 351.0 |
| Total | 37 (100.0%) | 96.0 |
Fertility by Education by Marriage Status in Grand Marais
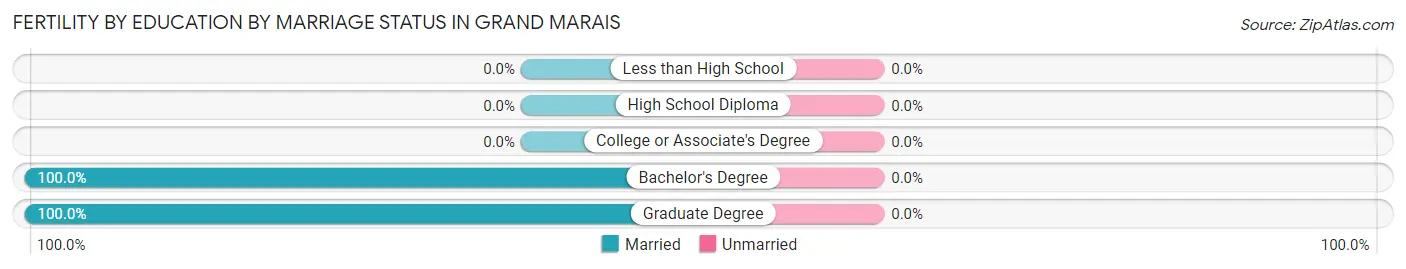
| Educational Attainment | Married | Unmarried |
| Less than High School | 0 (0.0%) | 0 (0.0%) |
| High School Diploma | 0 (0.0%) | 0 (0.0%) |
| College or Associate's Degree | 0 (0.0%) | 0 (0.0%) |
| Bachelor's Degree | 3 (100.0%) | 0 (0.0%) |
| Graduate Degree | 34 (100.0%) | 0 (0.0%) |
| Total | 37 (100.0%) | 0 (0.0%) |
Employment Characteristics in Grand Marais
Employment by Class of Employer in Grand Marais
Among the 849 employed individuals in Grand Marais, private company employees (309 | 36.4%), state government employees (136 | 16.0%), and local government employees (112 | 13.2%) make up the most common classes of employment.
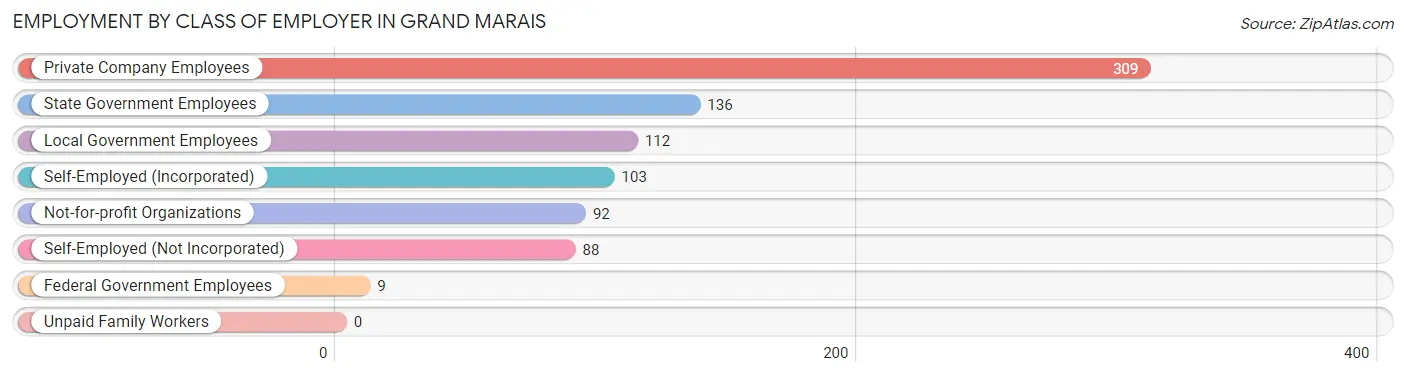
| Employer Class | # Employees | % Employees |
| Private Company Employees | 309 | 36.4% |
| Self-Employed (Incorporated) | 103 | 12.1% |
| Self-Employed (Not Incorporated) | 88 | 10.4% |
| Not-for-profit Organizations | 92 | 10.8% |
| Local Government Employees | 112 | 13.2% |
| State Government Employees | 136 | 16.0% |
| Federal Government Employees | 9 | 1.1% |
| Unpaid Family Workers | 0 | 0.0% |
| Total | 849 | 100.0% |
Employment Status by Age in Grand Marais
According to the labor force statistics for Grand Marais, out of the total population over 16 years of age (1,482), 59.2% or 877 individuals are in the labor force, with 1.4% or 12 of them unemployed. The age group with the highest labor force participation rate is 25 to 29 years, with 100.0% or 122 individuals in the labor force. Within the labor force, the 75 years and over age range has the highest percentage of unemployed individuals, with 100.0% or 5 of them being unemployed.
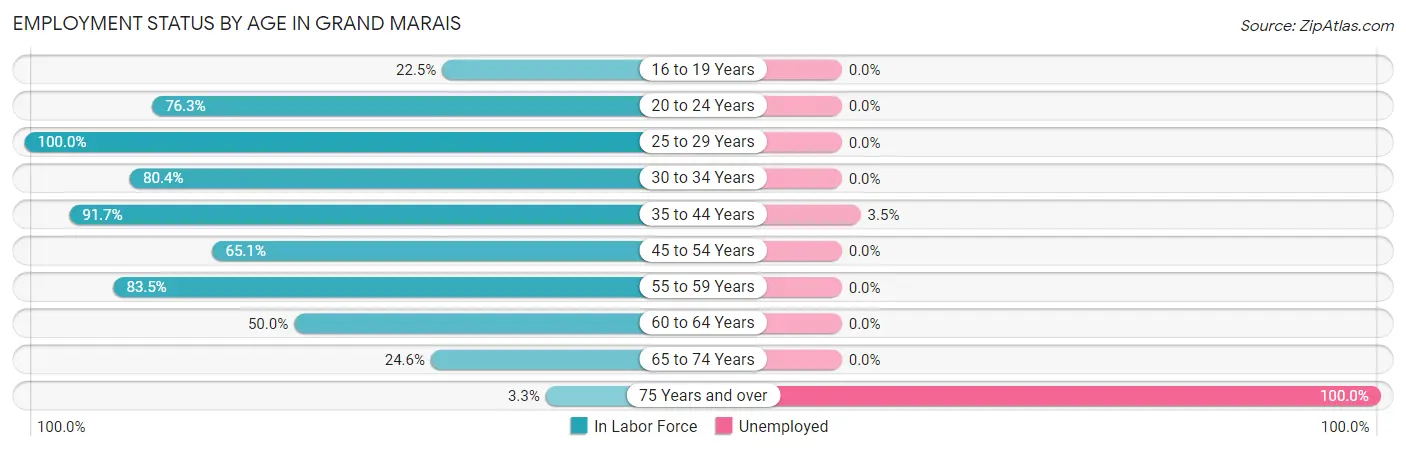
| Age Bracket | In Labor Force | Unemployed |
| 16 to 19 Years | 9 (22.5%) | 0 (0.0%) |
| 20 to 24 Years | 58 (76.3%) | 0 (0.0%) |
| 25 to 29 Years | 122 (100.0%) | 0 (0.0%) |
| 30 to 34 Years | 111 (80.4%) | 0 (0.0%) |
| 35 to 44 Years | 198 (91.7%) | 7 (3.5%) |
| 45 to 54 Years | 140 (65.1%) | 0 (0.0%) |
| 55 to 59 Years | 101 (83.5%) | 0 (0.0%) |
| 60 to 64 Years | 67 (50.0%) | 0 (0.0%) |
| 65 to 74 Years | 66 (24.6%) | 0 (0.0%) |
| 75 Years and over | 5 (3.3%) | 5 (100.0%) |
| Total | 877 (59.2%) | 12 (1.4%) |
Employment Status by Educational Attainment in Grand Marais
According to labor force statistics for Grand Marais, 78.1% of individuals (739) out of the total population between 25 and 64 years of age (946) are in the labor force, with 0.9% or 7 of them being unemployed. The group with the highest labor force participation rate are those with the educational attainment of less than high school, with 82.6% or 19 individuals in the labor force. Within the labor force, individuals with high school diploma education have the highest percentage of unemployment, with 3.6% or 7 of them being unemployed.
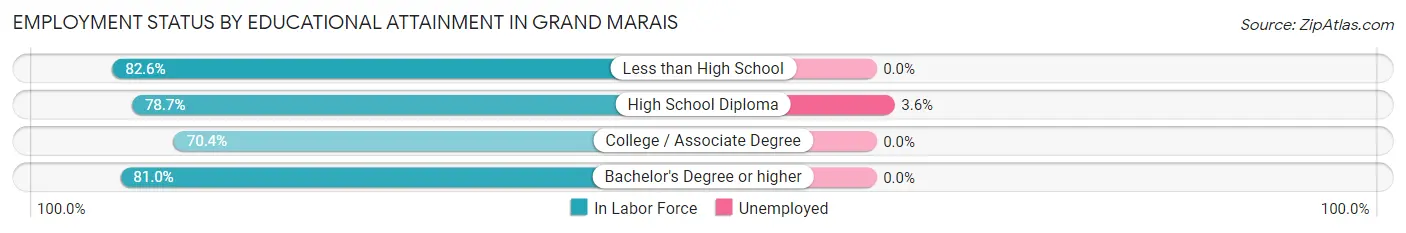
| Educational Attainment | In Labor Force | Unemployed |
| Less than High School | 19 (82.6%) | 0 (0.0%) |
| High School Diploma | 196 (78.7%) | 9 (3.6%) |
| College / Associate Degree | 145 (70.4%) | 0 (0.0%) |
| Bachelor's Degree or higher | 379 (81.0%) | 0 (0.0%) |
| Total | 739 (78.1%) | 9 (0.9%) |
Employment Occupations by Sex in Grand Marais
Management, Business, Science and Arts Occupations
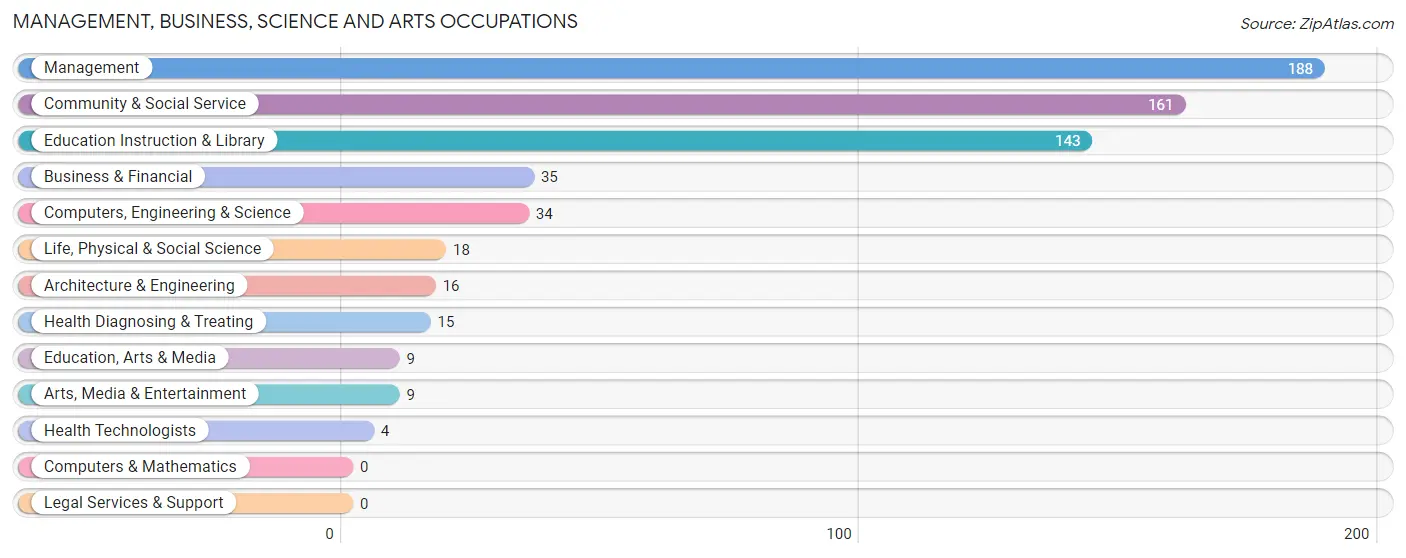
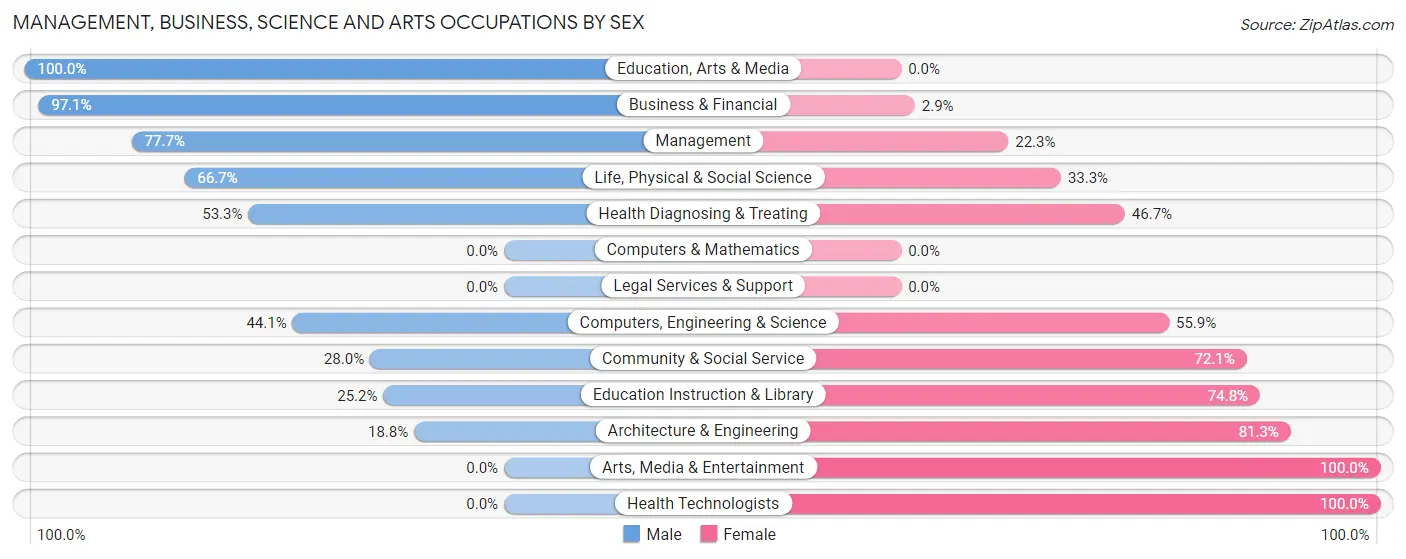
The most common Management, Business, Science and Arts occupations in Grand Marais are Management (188 | 21.7%), Community & Social Service (161 | 18.6%), Education Instruction & Library (143 | 16.5%), Business & Financial (35 | 4.1%), and Computers, Engineering & Science (34 | 3.9%).
Management, Business, Science and Arts Occupations by Sex
Within the Management, Business, Science and Arts occupations in Grand Marais, the most male-oriented occupations are Education, Arts & Media (100.0%), Business & Financial (97.1%), and Management (77.7%), while the most female-oriented occupations are Arts, Media & Entertainment (100.0%), Health Technologists (100.0%), and Architecture & Engineering (81.2%).
| Occupation | Male | Female |
| Management | 146 (77.7%) | 42 (22.3%) |
| Business & Financial | 34 (97.1%) | 1 (2.9%) |
| Computers, Engineering & Science | 15 (44.1%) | 19 (55.9%) |
| Computers & Mathematics | 0 (0.0%) | 0 (0.0%) |
| Architecture & Engineering | 3 (18.8%) | 13 (81.2%) |
| Life, Physical & Social Science | 12 (66.7%) | 6 (33.3%) |
| Community & Social Service | 45 (28.0%) | 116 (72.1%) |
| Education, Arts & Media | 9 (100.0%) | 0 (0.0%) |
| Legal Services & Support | 0 (0.0%) | 0 (0.0%) |
| Education Instruction & Library | 36 (25.2%) | 107 (74.8%) |
| Arts, Media & Entertainment | 0 (0.0%) | 9 (100.0%) |
| Health Diagnosing & Treating | 8 (53.3%) | 7 (46.7%) |
| Health Technologists | 0 (0.0%) | 4 (100.0%) |
| Total (Category) | 248 (57.3%) | 185 (42.7%) |
| Total (Overall) | 446 (51.6%) | 419 (48.4%) |
Services Occupations
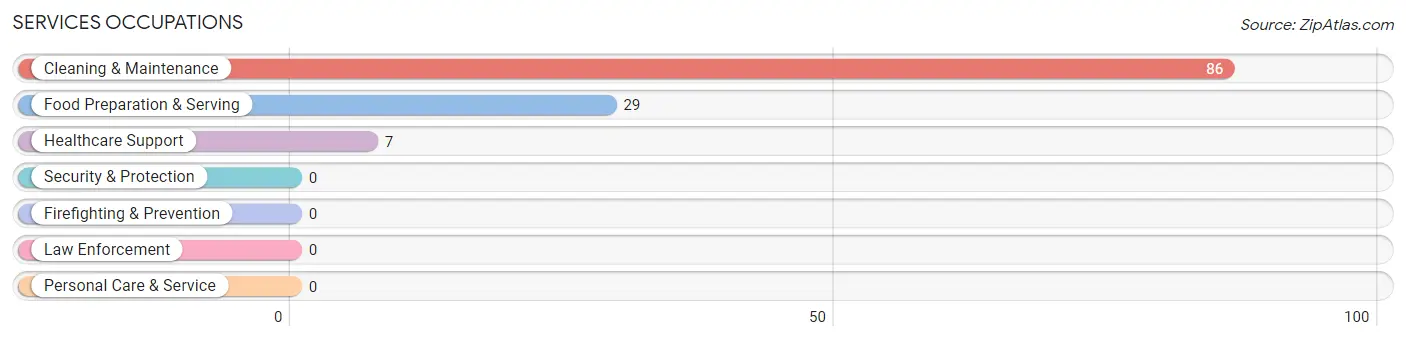
The most common Services occupations in Grand Marais are Cleaning & Maintenance (86 | 9.9%), Food Preparation & Serving (29 | 3.4%), and Healthcare Support (7 | 0.8%).
Services Occupations by Sex
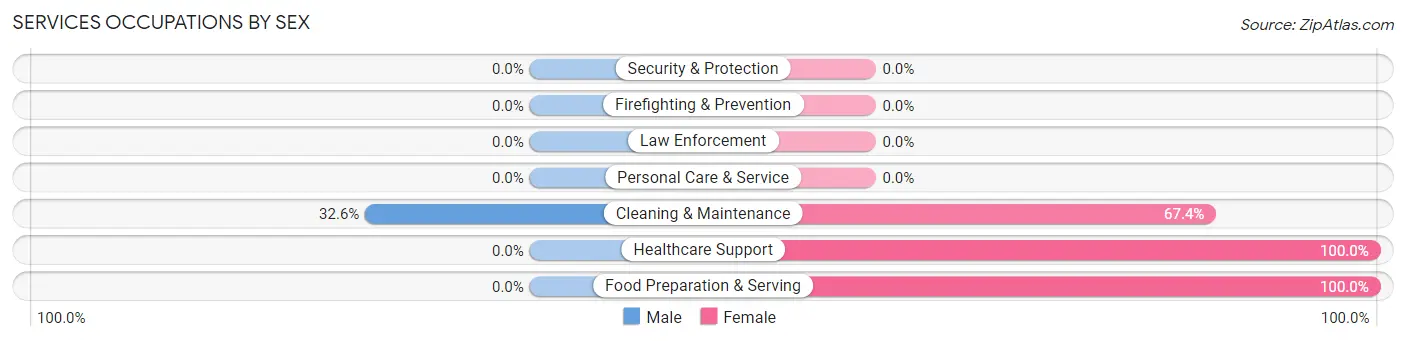
| Occupation | Male | Female |
| Healthcare Support | 0 (0.0%) | 7 (100.0%) |
| Security & Protection | 0 (0.0%) | 0 (0.0%) |
| Firefighting & Prevention | 0 (0.0%) | 0 (0.0%) |
| Law Enforcement | 0 (0.0%) | 0 (0.0%) |
| Food Preparation & Serving | 0 (0.0%) | 29 (100.0%) |
| Cleaning & Maintenance | 28 (32.6%) | 58 (67.4%) |
| Personal Care & Service | 0 (0.0%) | 0 (0.0%) |
| Total (Category) | 28 (23.0%) | 94 (77.0%) |
| Total (Overall) | 446 (51.6%) | 419 (48.4%) |
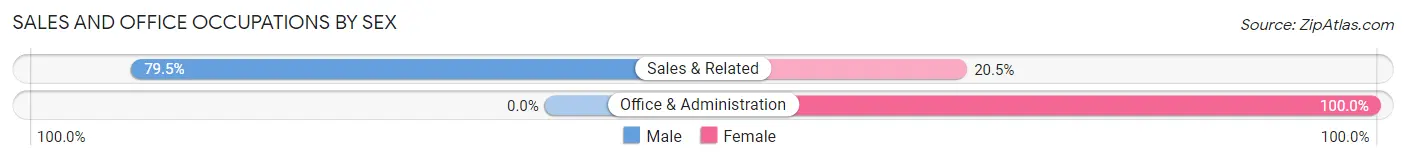
Sales and Office Occupations
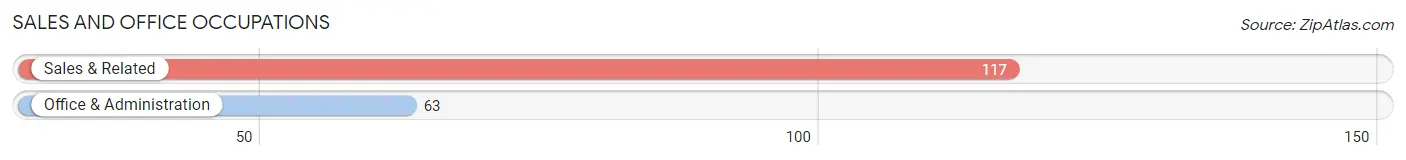
The most common Sales and Office occupations in Grand Marais are Sales & Related (117 | 13.5%), and Office & Administration (63 | 7.3%).
Sales and Office Occupations by Sex
| Occupation | Male | Female |
| Sales & Related | 93 (79.5%) | 24 (20.5%) |
| Office & Administration | 0 (0.0%) | 63 (100.0%) |
| Total (Category) | 93 (51.7%) | 87 (48.3%) |
| Total (Overall) | 446 (51.6%) | 419 (48.4%) |
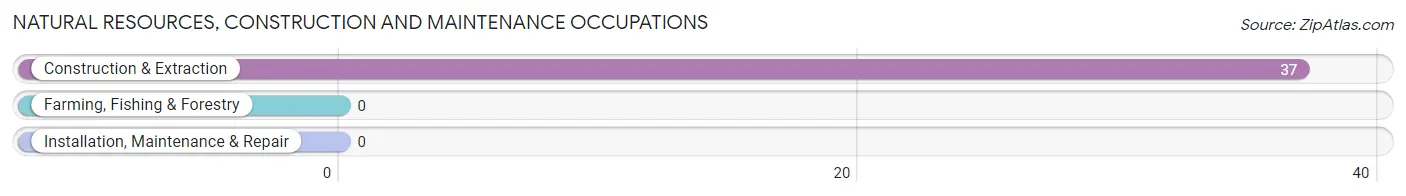
Natural Resources, Construction and Maintenance Occupations
The most common Natural Resources, Construction and Maintenance occupations in Grand Marais are , and Construction & Extraction (37 | 4.3%).
Natural Resources, Construction and Maintenance Occupations by Sex
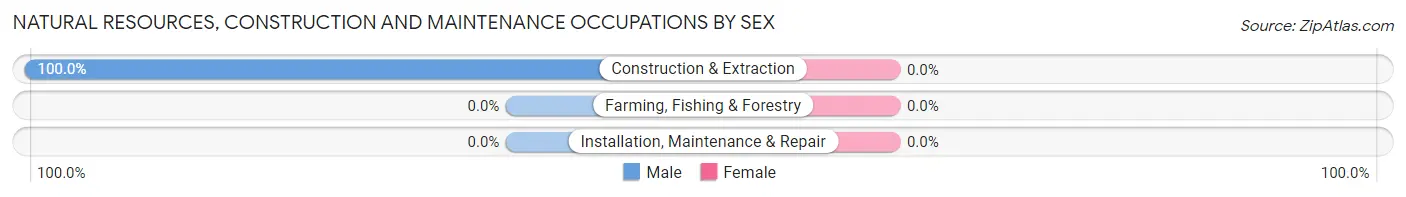
| Occupation | Male | Female |
| Farming, Fishing & Forestry | 0 (0.0%) | 0 (0.0%) |
| Construction & Extraction | 37 (100.0%) | 0 (0.0%) |
| Installation, Maintenance & Repair | 0 (0.0%) | 0 (0.0%) |
| Total (Category) | 37 (100.0%) | 0 (0.0%) |
| Total (Overall) | 446 (51.6%) | 419 (48.4%) |
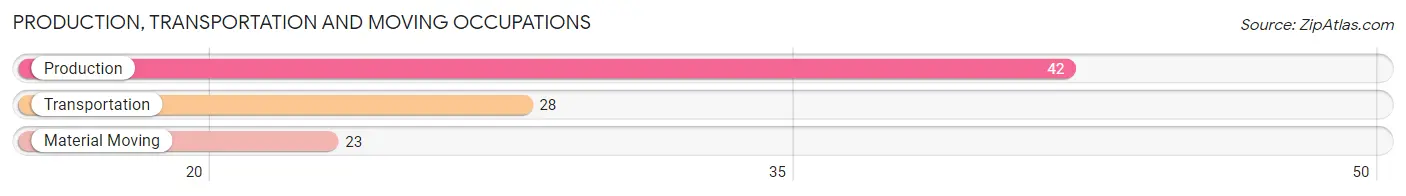
Production, Transportation and Moving Occupations
The most common Production, Transportation and Moving occupations in Grand Marais are Production (42 | 4.9%), Transportation (28 | 3.2%), and Material Moving (23 | 2.7%).
Production, Transportation and Moving Occupations by Sex
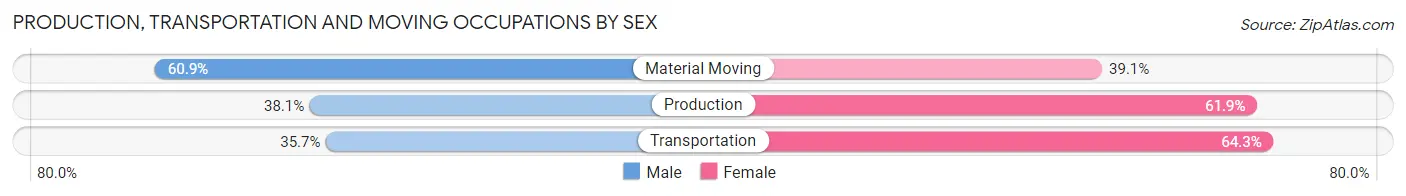
| Occupation | Male | Female |
| Production | 16 (38.1%) | 26 (61.9%) |
| Transportation | 10 (35.7%) | 18 (64.3%) |
| Material Moving | 14 (60.9%) | 9 (39.1%) |
| Total (Category) | 40 (43.0%) | 53 (57.0%) |
| Total (Overall) | 446 (51.6%) | 419 (48.4%) |
Employment Industries by Sex in Grand Marais
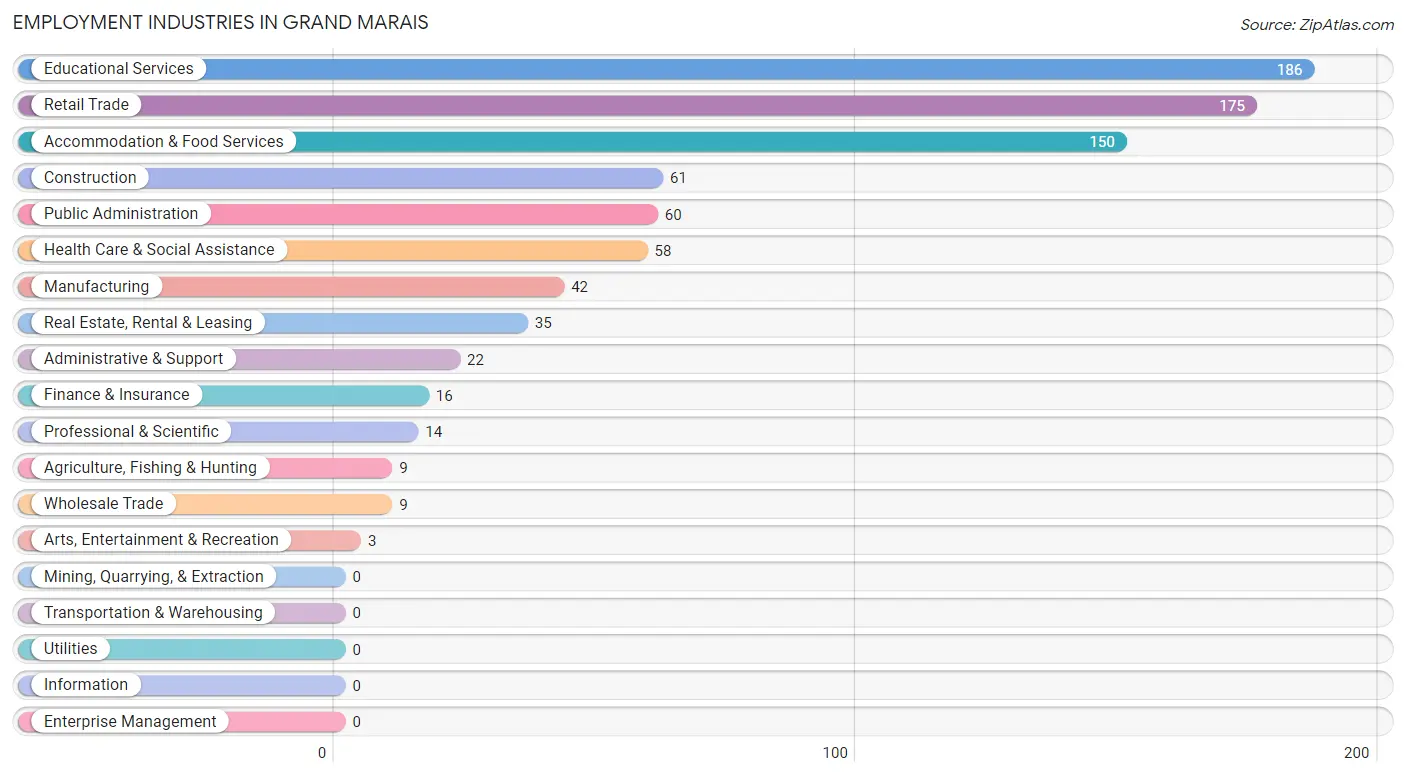
Employment Industries in Grand Marais
The major employment industries in Grand Marais include Educational Services (186 | 21.5%), Retail Trade (175 | 20.2%), Accommodation & Food Services (150 | 17.3%), Construction (61 | 7.0%), and Public Administration (60 | 6.9%).
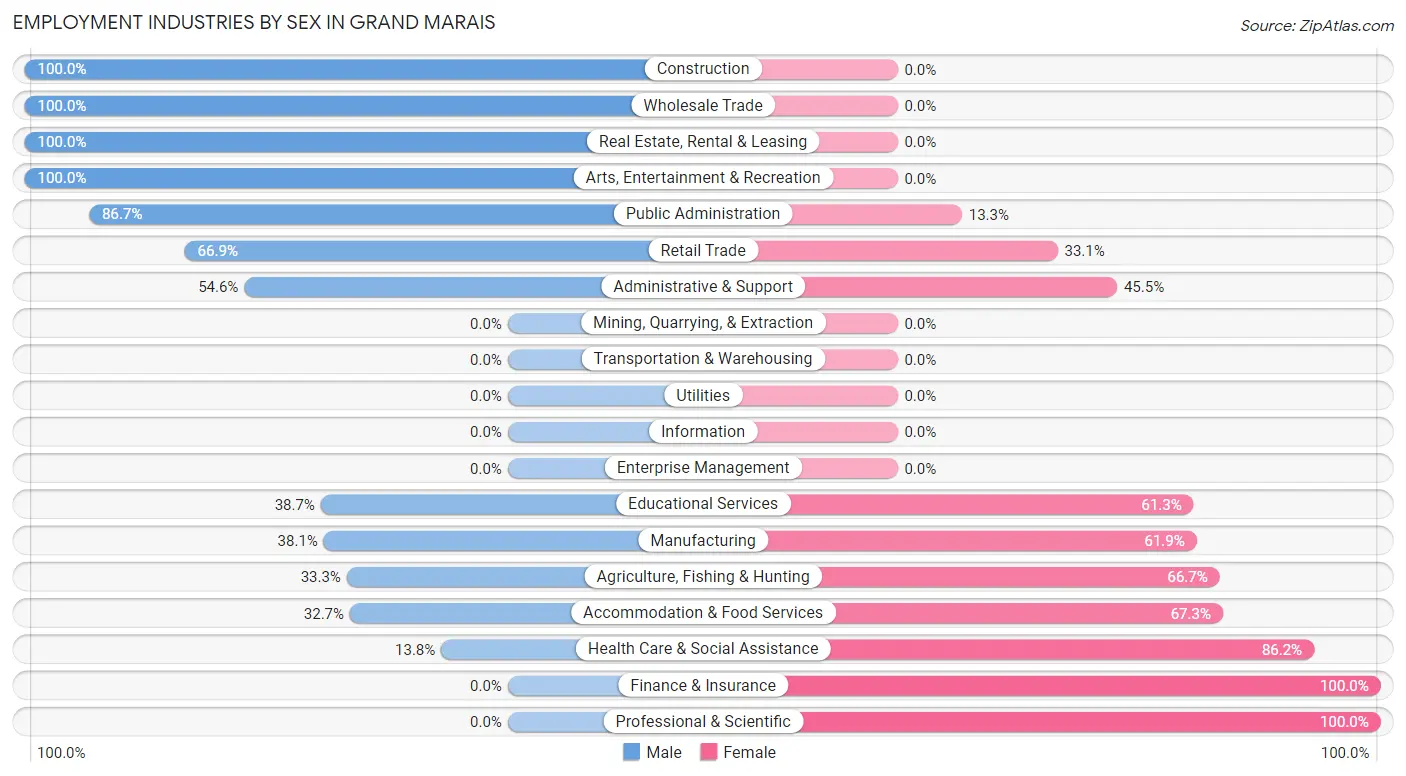
Employment Industries by Sex in Grand Marais
The Grand Marais industries that see more men than women are Construction (100.0%), Wholesale Trade (100.0%), and Real Estate, Rental & Leasing (100.0%), whereas the industries that tend to have a higher number of women are Finance & Insurance (100.0%), Professional & Scientific (100.0%), and Health Care & Social Assistance (86.2%).
| Industry | Male | Female |
| Agriculture, Fishing & Hunting | 3 (33.3%) | 6 (66.7%) |
| Mining, Quarrying, & Extraction | 0 (0.0%) | 0 (0.0%) |
| Construction | 61 (100.0%) | 0 (0.0%) |
| Manufacturing | 16 (38.1%) | 26 (61.9%) |
| Wholesale Trade | 9 (100.0%) | 0 (0.0%) |
| Retail Trade | 117 (66.9%) | 58 (33.1%) |
| Transportation & Warehousing | 0 (0.0%) | 0 (0.0%) |
| Utilities | 0 (0.0%) | 0 (0.0%) |
| Information | 0 (0.0%) | 0 (0.0%) |
| Finance & Insurance | 0 (0.0%) | 16 (100.0%) |
| Real Estate, Rental & Leasing | 35 (100.0%) | 0 (0.0%) |
| Professional & Scientific | 0 (0.0%) | 14 (100.0%) |
| Enterprise Management | 0 (0.0%) | 0 (0.0%) |
| Administrative & Support | 12 (54.5%) | 10 (45.5%) |
| Educational Services | 72 (38.7%) | 114 (61.3%) |
| Health Care & Social Assistance | 8 (13.8%) | 50 (86.2%) |
| Arts, Entertainment & Recreation | 3 (100.0%) | 0 (0.0%) |
| Accommodation & Food Services | 49 (32.7%) | 101 (67.3%) |
| Public Administration | 52 (86.7%) | 8 (13.3%) |
| Total | 446 (51.6%) | 419 (48.4%) |
Education in Grand Marais
School Enrollment in Grand Marais
The most common levels of schooling among the 229 students in Grand Marais are middle school (68 | 29.7%), elementary school (47 | 20.5%), and kindergarten (34 | 14.8%).
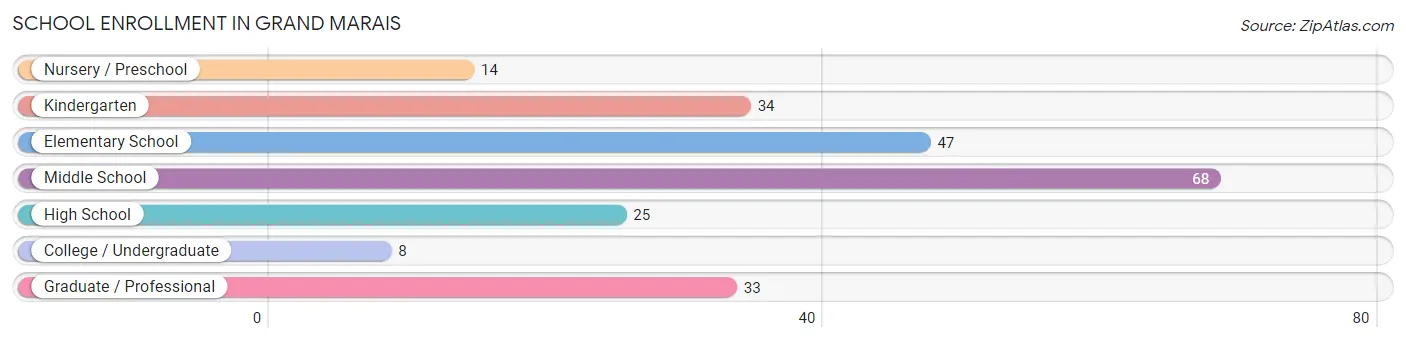
| School Level | # Students | % Students |
| Nursery / Preschool | 14 | 6.1% |
| Kindergarten | 34 | 14.8% |
| Elementary School | 47 | 20.5% |
| Middle School | 68 | 29.7% |
| High School | 25 | 10.9% |
| College / Undergraduate | 8 | 3.5% |
| Graduate / Professional | 33 | 14.4% |
| Total | 229 | 100.0% |
School Enrollment by Age by Funding Source in Grand Marais
Out of a total of 229 students who are enrolled in schools in Grand Marais, 17 (7.4%) attend a private institution, while the remaining 212 (92.6%) are enrolled in public schools. The age group of 35 years and over has the highest likelihood of being enrolled in private schools, with 11 (57.9% in the age bracket) enrolled. Conversely, the age group of 3 to 4 year olds has the lowest likelihood of being enrolled in a private school, with 11 (100.0% in the age bracket) attending a public institution.
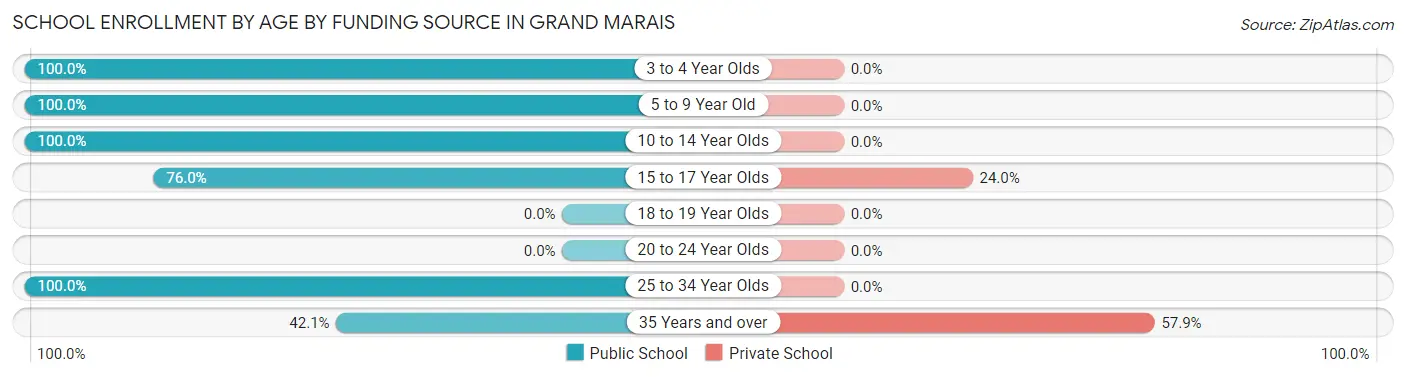
| Age Bracket | Public School | Private School |
| 3 to 4 Year Olds | 11 (100.0%) | 0 (0.0%) |
| 5 to 9 Year Old | 74 (100.0%) | 0 (0.0%) |
| 10 to 14 Year Olds | 78 (100.0%) | 0 (0.0%) |
| 15 to 17 Year Olds | 19 (76.0%) | 6 (24.0%) |
| 18 to 19 Year Olds | 0 (0.0%) | 0 (0.0%) |
| 20 to 24 Year Olds | 0 (0.0%) | 0 (0.0%) |
| 25 to 34 Year Olds | 22 (100.0%) | 0 (0.0%) |
| 35 Years and over | 8 (42.1%) | 11 (57.9%) |
| Total | 212 (92.6%) | 17 (7.4%) |
Educational Attainment by Field of Study in Grand Marais
Education (160 | 24.3%), bio, nature & agricultural (142 | 21.5%), liberal arts & history (96 | 14.6%), visual & performing arts (55 | 8.4%), and literature & languages (44 | 6.7%) are the most common fields of study among 659 individuals in Grand Marais who have obtained a bachelor's degree or higher.
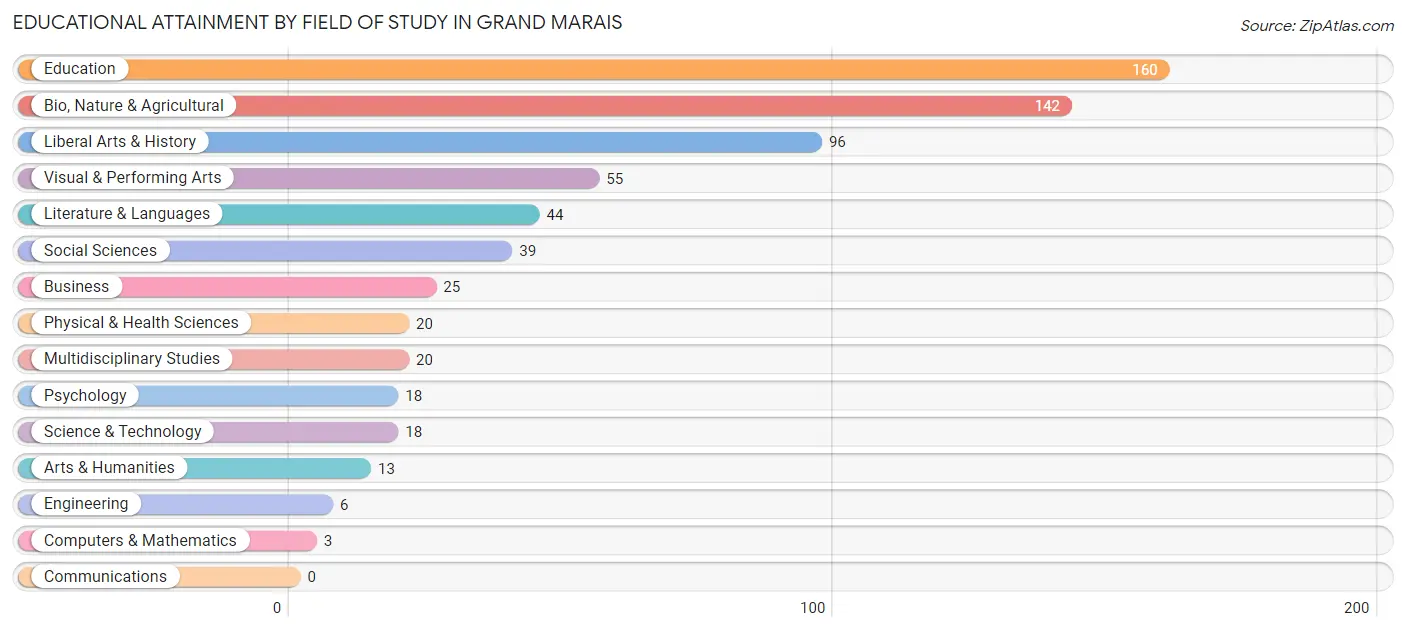
| Field of Study | # Graduates | % Graduates |
| Computers & Mathematics | 3 | 0.5% |
| Bio, Nature & Agricultural | 142 | 21.5% |
| Physical & Health Sciences | 20 | 3.0% |
| Psychology | 18 | 2.7% |
| Social Sciences | 39 | 5.9% |
| Engineering | 6 | 0.9% |
| Multidisciplinary Studies | 20 | 3.0% |
| Science & Technology | 18 | 2.7% |
| Business | 25 | 3.8% |
| Education | 160 | 24.3% |
| Literature & Languages | 44 | 6.7% |
| Liberal Arts & History | 96 | 14.6% |
| Visual & Performing Arts | 55 | 8.4% |
| Communications | 0 | 0.0% |
| Arts & Humanities | 13 | 2.0% |
| Total | 659 | 100.0% |
Transportation & Commute in Grand Marais
Vehicle Availability by Sex in Grand Marais
The most prevalent vehicle ownership categories in Grand Marais are males with 2 vehicles (207, accounting for 48.1%) and females with 2 vehicles (194, making up 49.4%).
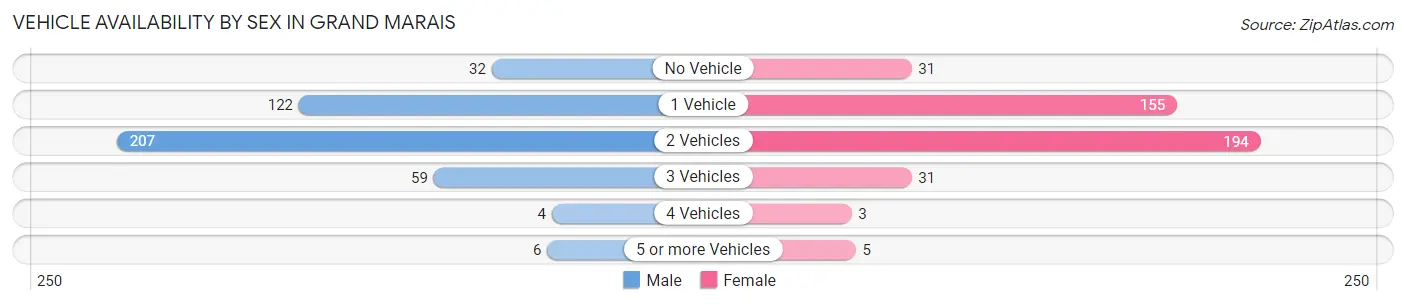
| Vehicles Available | Male | Female |
| No Vehicle | 32 (7.4%) | 31 (7.4%) |
| 1 Vehicle | 122 (28.4%) | 155 (37.0%) |
| 2 Vehicles | 207 (48.1%) | 194 (46.3%) |
| 3 Vehicles | 59 (13.7%) | 31 (7.4%) |
| 4 Vehicles | 4 (0.9%) | 3 (0.7%) |
| 5 or more Vehicles | 6 (1.4%) | 5 (1.2%) |
| Total | 430 (100.0%) | 419 (100.0%) |
Commute Time in Grand Marais
The most frequently occuring commute durations in Grand Marais are less than 5 minutes (248 commuters, 34.7%), 5 to 9 minutes (175 commuters, 24.5%), and 10 to 14 minutes (88 commuters, 12.3%).
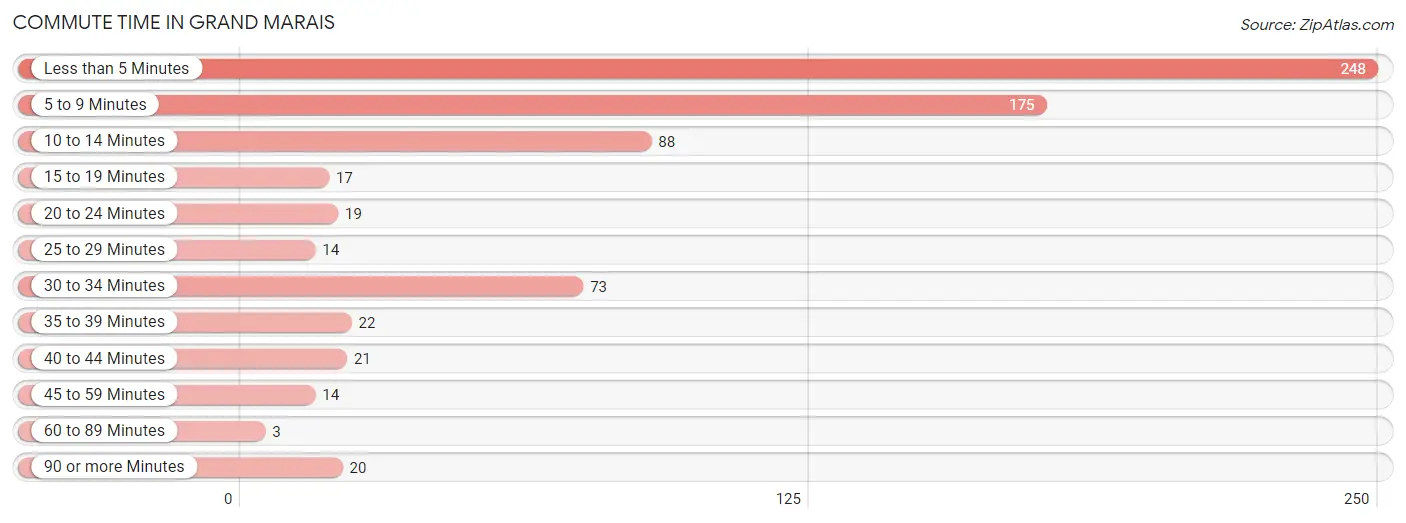
| Commute Time | # Commuters | % Commuters |
| Less than 5 Minutes | 248 | 34.7% |
| 5 to 9 Minutes | 175 | 24.5% |
| 10 to 14 Minutes | 88 | 12.3% |
| 15 to 19 Minutes | 17 | 2.4% |
| 20 to 24 Minutes | 19 | 2.7% |
| 25 to 29 Minutes | 14 | 2.0% |
| 30 to 34 Minutes | 73 | 10.2% |
| 35 to 39 Minutes | 22 | 3.1% |
| 40 to 44 Minutes | 21 | 2.9% |
| 45 to 59 Minutes | 14 | 2.0% |
| 60 to 89 Minutes | 3 | 0.4% |
| 90 or more Minutes | 20 | 2.8% |
Commute Time by Sex in Grand Marais
The most common commute times in Grand Marais are less than 5 minutes (138 commuters, 35.6%) for males and less than 5 minutes (110 commuters, 33.7%) for females.
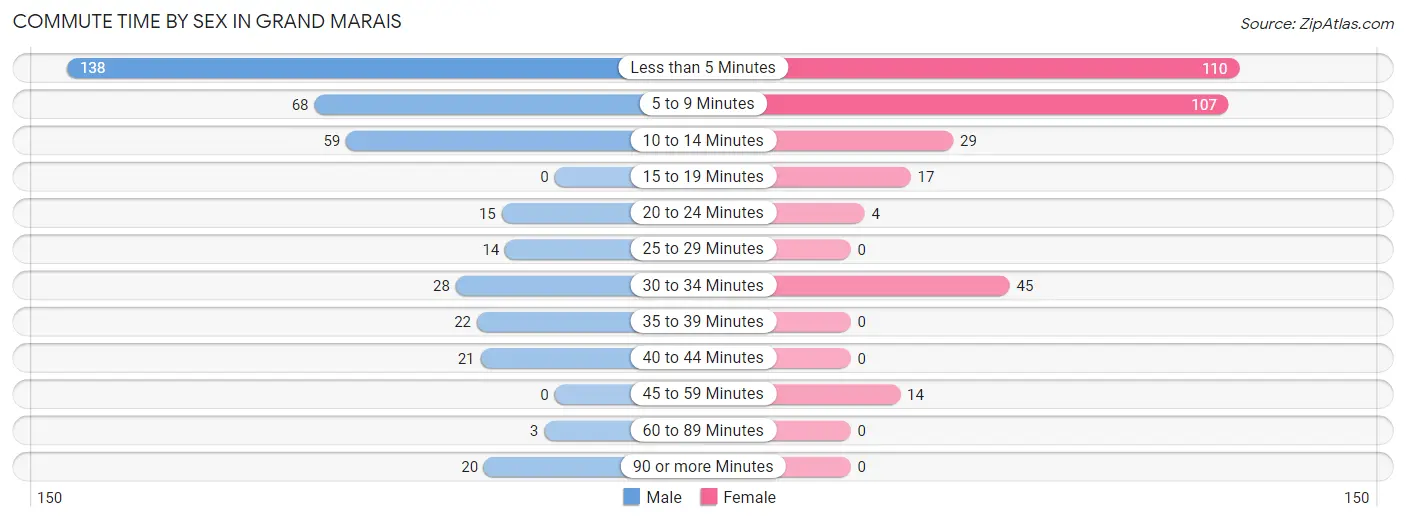
| Commute Time | Male | Female |
| Less than 5 Minutes | 138 (35.6%) | 110 (33.7%) |
| 5 to 9 Minutes | 68 (17.5%) | 107 (32.8%) |
| 10 to 14 Minutes | 59 (15.2%) | 29 (8.9%) |
| 15 to 19 Minutes | 0 (0.0%) | 17 (5.2%) |
| 20 to 24 Minutes | 15 (3.9%) | 4 (1.2%) |
| 25 to 29 Minutes | 14 (3.6%) | 0 (0.0%) |
| 30 to 34 Minutes | 28 (7.2%) | 45 (13.8%) |
| 35 to 39 Minutes | 22 (5.7%) | 0 (0.0%) |
| 40 to 44 Minutes | 21 (5.4%) | 0 (0.0%) |
| 45 to 59 Minutes | 0 (0.0%) | 14 (4.3%) |
| 60 to 89 Minutes | 3 (0.8%) | 0 (0.0%) |
| 90 or more Minutes | 20 (5.1%) | 0 (0.0%) |
Time of Departure to Work by Sex in Grand Marais
The most frequent times of departure to work in Grand Marais are 7:30 AM to 7:59 AM (69, 17.8%) for males and 12:00 PM to 3:59 PM (74, 22.7%) for females.
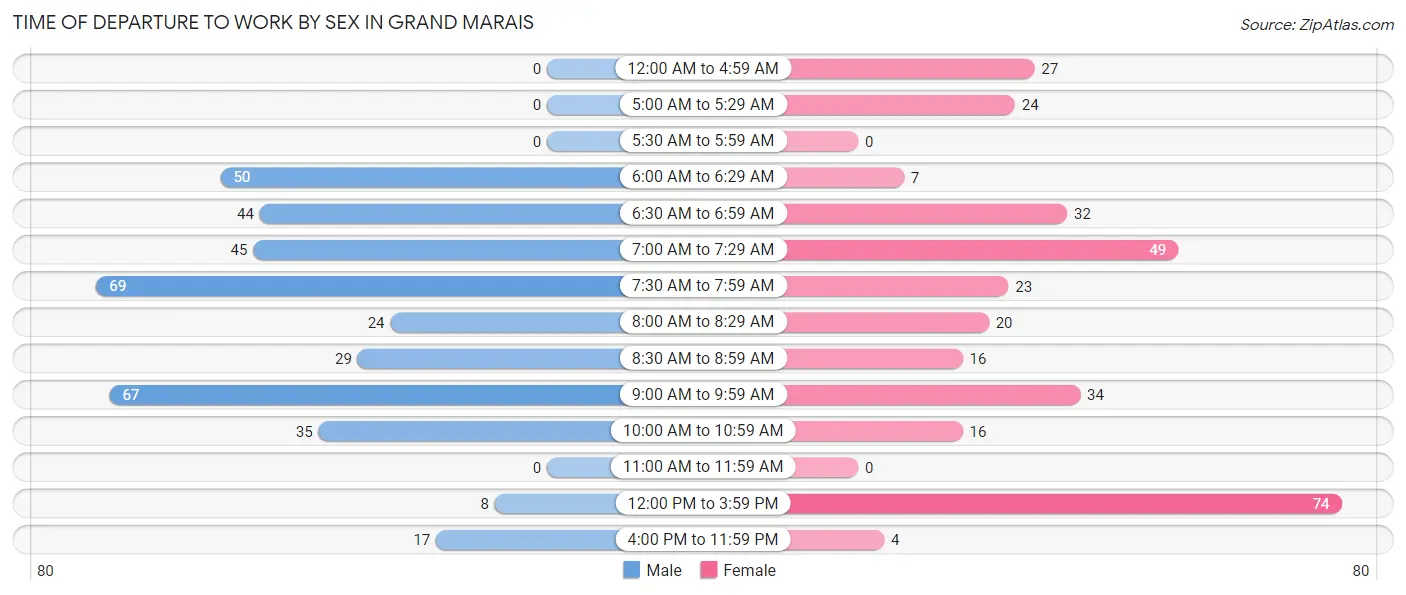
| Time of Departure | Male | Female |
| 12:00 AM to 4:59 AM | 0 (0.0%) | 27 (8.3%) |
| 5:00 AM to 5:29 AM | 0 (0.0%) | 24 (7.4%) |
| 5:30 AM to 5:59 AM | 0 (0.0%) | 0 (0.0%) |
| 6:00 AM to 6:29 AM | 50 (12.9%) | 7 (2.1%) |
| 6:30 AM to 6:59 AM | 44 (11.3%) | 32 (9.8%) |
| 7:00 AM to 7:29 AM | 45 (11.6%) | 49 (15.0%) |
| 7:30 AM to 7:59 AM | 69 (17.8%) | 23 (7.1%) |
| 8:00 AM to 8:29 AM | 24 (6.2%) | 20 (6.1%) |
| 8:30 AM to 8:59 AM | 29 (7.5%) | 16 (4.9%) |
| 9:00 AM to 9:59 AM | 67 (17.3%) | 34 (10.4%) |
| 10:00 AM to 10:59 AM | 35 (9.0%) | 16 (4.9%) |
| 11:00 AM to 11:59 AM | 0 (0.0%) | 0 (0.0%) |
| 12:00 PM to 3:59 PM | 8 (2.1%) | 74 (22.7%) |
| 4:00 PM to 11:59 PM | 17 (4.4%) | 4 (1.2%) |
| Total | 388 (100.0%) | 326 (100.0%) |
Housing Occupancy in Grand Marais
Occupancy by Ownership in Grand Marais
Of the total 831 dwellings in Grand Marais, owner-occupied units account for 515 (62.0%), while renter-occupied units make up 316 (38.0%).
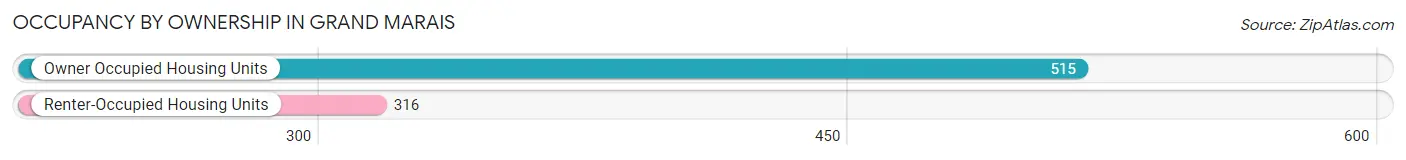
| Occupancy | # Housing Units | % Housing Units |
| Owner Occupied Housing Units | 515 | 62.0% |
| Renter-Occupied Housing Units | 316 | 38.0% |
| Total Occupied Housing Units | 831 | 100.0% |
Occupancy by Household Size in Grand Marais
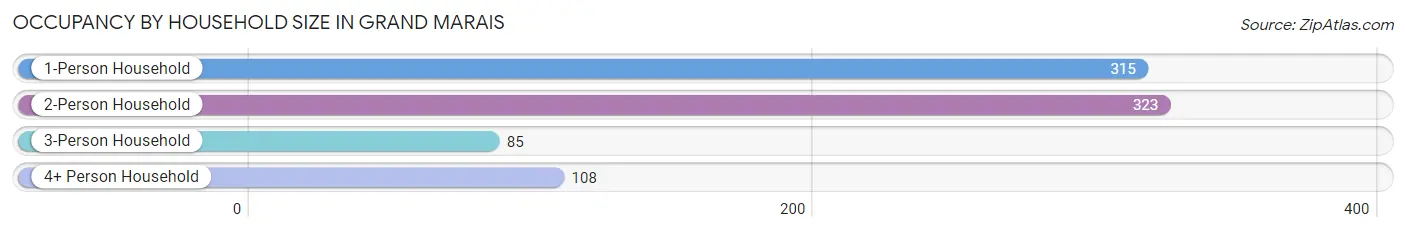
| Household Size | # Housing Units | % Housing Units |
| 1-Person Household | 315 | 37.9% |
| 2-Person Household | 323 | 38.9% |
| 3-Person Household | 85 | 10.2% |
| 4+ Person Household | 108 | 13.0% |
| Total Housing Units | 831 | 100.0% |
Occupancy by Ownership by Household Size in Grand Marais
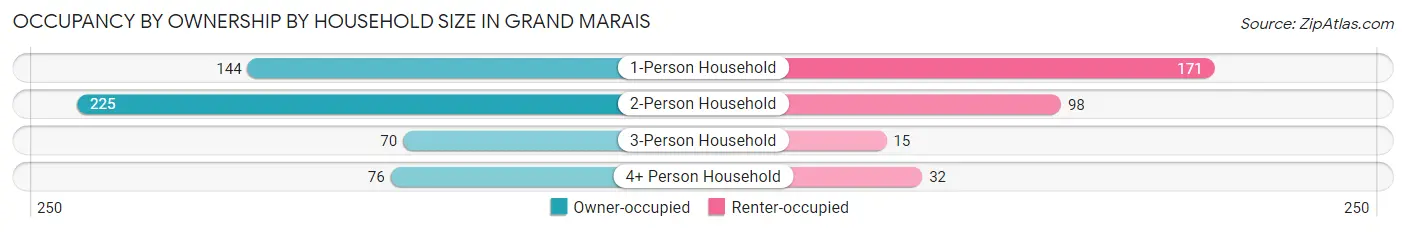
| Household Size | Owner-occupied | Renter-occupied |
| 1-Person Household | 144 (45.7%) | 171 (54.3%) |
| 2-Person Household | 225 (69.7%) | 98 (30.3%) |
| 3-Person Household | 70 (82.4%) | 15 (17.6%) |
| 4+ Person Household | 76 (70.4%) | 32 (29.6%) |
| Total Housing Units | 515 (62.0%) | 316 (38.0%) |
Occupancy by Educational Attainment in Grand Marais
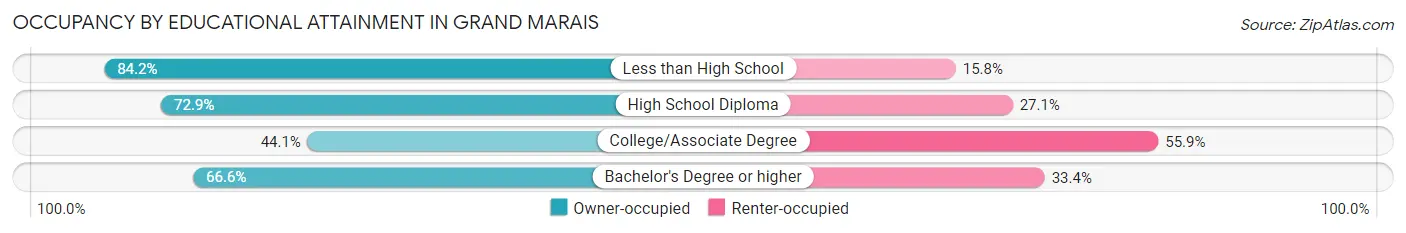
| Household Size | Owner-occupied | Renter-occupied |
| Less than High School | 16 (84.2%) | 3 (15.8%) |
| High School Diploma | 132 (72.9%) | 49 (27.1%) |
| College/Associate Degree | 104 (44.1%) | 132 (55.9%) |
| Bachelor's Degree or higher | 263 (66.6%) | 132 (33.4%) |
Occupancy by Age of Householder in Grand Marais
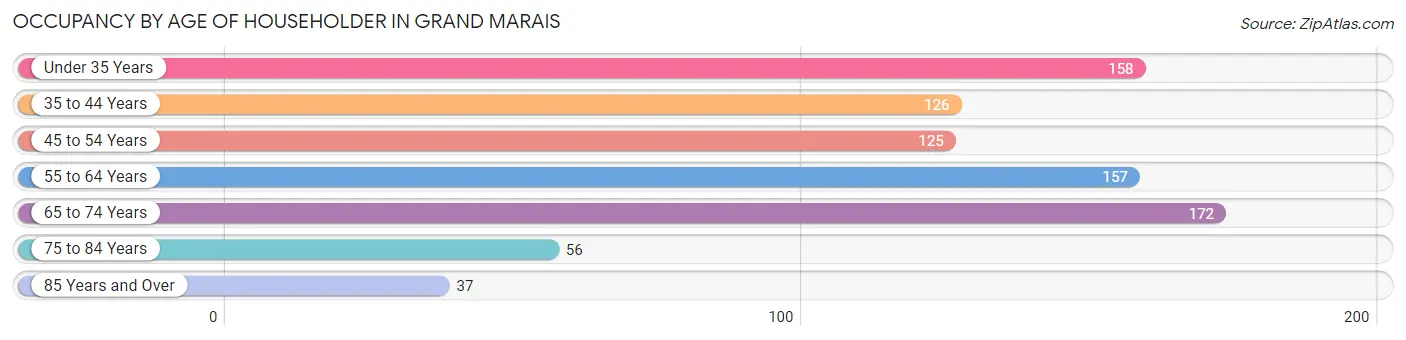
| Age Bracket | # Households | % Households |
| Under 35 Years | 158 | 19.0% |
| 35 to 44 Years | 126 | 15.2% |
| 45 to 54 Years | 125 | 15.0% |
| 55 to 64 Years | 157 | 18.9% |
| 65 to 74 Years | 172 | 20.7% |
| 75 to 84 Years | 56 | 6.7% |
| 85 Years and Over | 37 | 4.4% |
| Total | 831 | 100.0% |
Housing Finances in Grand Marais
Median Income by Occupancy in Grand Marais
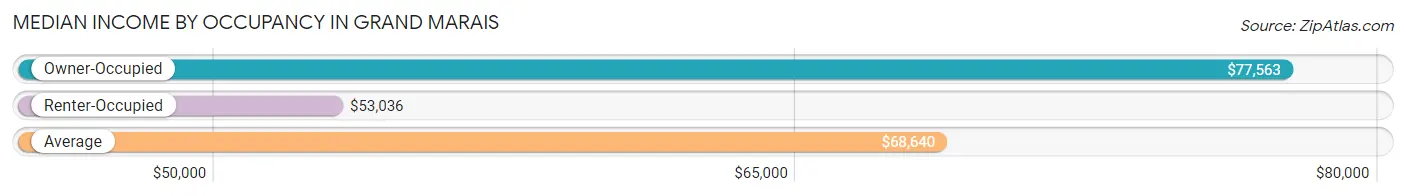
| Occupancy Type | # Households | Median Income |
| Owner-Occupied | 515 (62.0%) | $77,563 |
| Renter-Occupied | 316 (38.0%) | $53,036 |
| Average | 831 (100.0%) | $68,640 |
Occupancy by Householder Income Bracket in Grand Marais
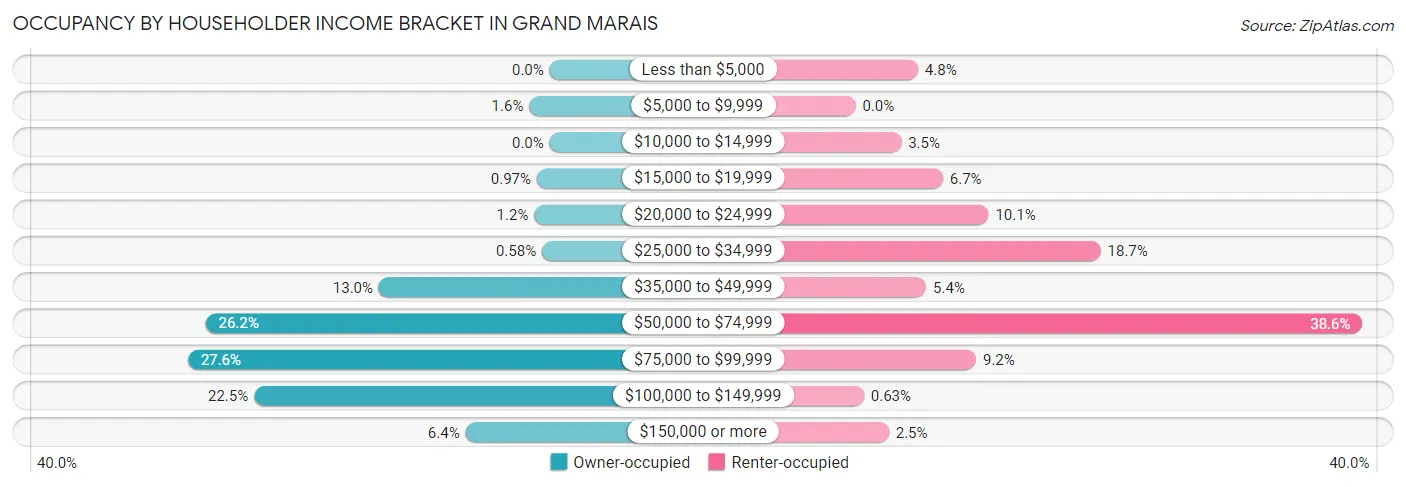
| Income Bracket | Owner-occupied | Renter-occupied |
| Less than $5,000 | 0 (0.0%) | 15 (4.8%) |
| $5,000 to $9,999 | 8 (1.5%) | 0 (0.0%) |
| $10,000 to $14,999 | 0 (0.0%) | 11 (3.5%) |
| $15,000 to $19,999 | 5 (1.0%) | 21 (6.7%) |
| $20,000 to $24,999 | 6 (1.2%) | 32 (10.1%) |
| $25,000 to $34,999 | 3 (0.6%) | 59 (18.7%) |
| $35,000 to $49,999 | 67 (13.0%) | 17 (5.4%) |
| $50,000 to $74,999 | 135 (26.2%) | 122 (38.6%) |
| $75,000 to $99,999 | 142 (27.6%) | 29 (9.2%) |
| $100,000 to $149,999 | 116 (22.5%) | 2 (0.6%) |
| $150,000 or more | 33 (6.4%) | 8 (2.5%) |
| Total | 515 (100.0%) | 316 (100.0%) |
Monthly Housing Cost Tiers in Grand Marais
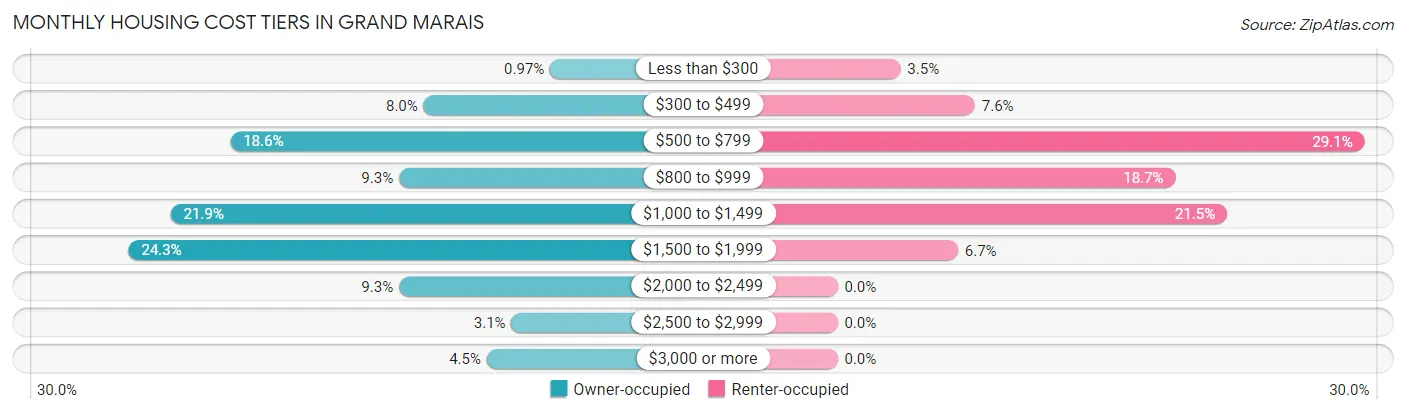
| Monthly Cost | Owner-occupied | Renter-occupied |
| Less than $300 | 5 (1.0%) | 11 (3.5%) |
| $300 to $499 | 41 (8.0%) | 24 (7.6%) |
| $500 to $799 | 96 (18.6%) | 92 (29.1%) |
| $800 to $999 | 48 (9.3%) | 59 (18.7%) |
| $1,000 to $1,499 | 113 (21.9%) | 68 (21.5%) |
| $1,500 to $1,999 | 125 (24.3%) | 21 (6.7%) |
| $2,000 to $2,499 | 48 (9.3%) | 0 (0.0%) |
| $2,500 to $2,999 | 16 (3.1%) | 0 (0.0%) |
| $3,000 or more | 23 (4.5%) | 0 (0.0%) |
| Total | 515 (100.0%) | 316 (100.0%) |
Physical Housing Characteristics in Grand Marais
Housing Structures in Grand Marais
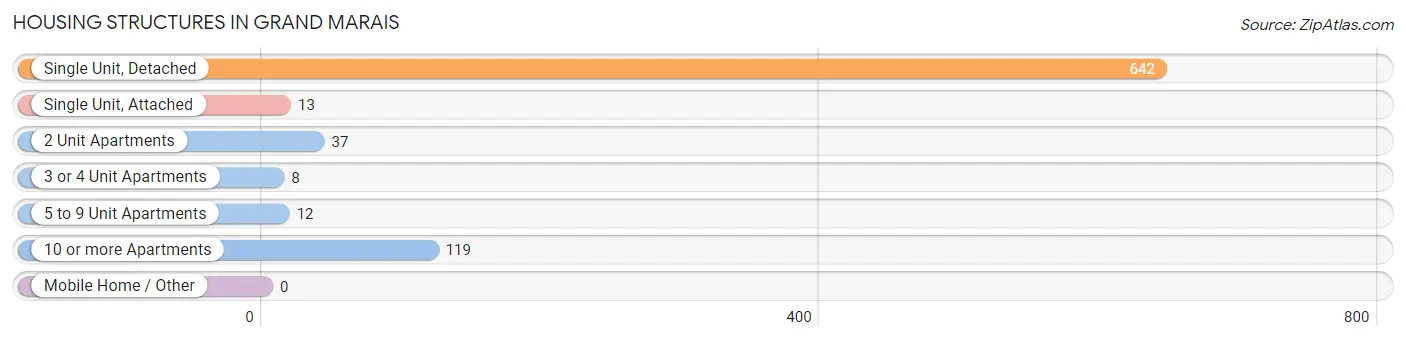
| Structure Type | # Housing Units | % Housing Units |
| Single Unit, Detached | 642 | 77.3% |
| Single Unit, Attached | 13 | 1.6% |
| 2 Unit Apartments | 37 | 4.4% |
| 3 or 4 Unit Apartments | 8 | 1.0% |
| 5 to 9 Unit Apartments | 12 | 1.4% |
| 10 or more Apartments | 119 | 14.3% |
| Mobile Home / Other | 0 | 0.0% |
| Total | 831 | 100.0% |
Housing Structures by Occupancy in Grand Marais
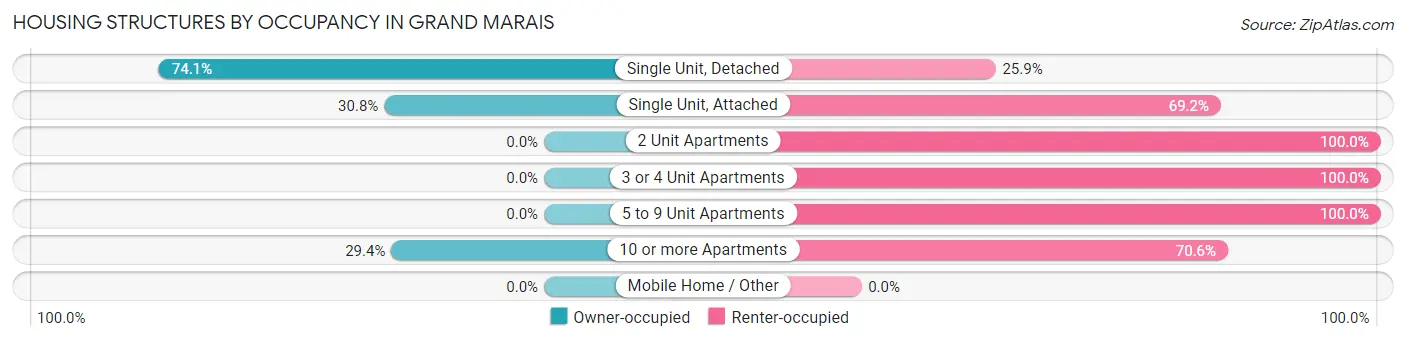
| Structure Type | Owner-occupied | Renter-occupied |
| Single Unit, Detached | 476 (74.1%) | 166 (25.9%) |
| Single Unit, Attached | 4 (30.8%) | 9 (69.2%) |
| 2 Unit Apartments | 0 (0.0%) | 37 (100.0%) |
| 3 or 4 Unit Apartments | 0 (0.0%) | 8 (100.0%) |
| 5 to 9 Unit Apartments | 0 (0.0%) | 12 (100.0%) |
| 10 or more Apartments | 35 (29.4%) | 84 (70.6%) |
| Mobile Home / Other | 0 (0.0%) | 0 (0.0%) |
| Total | 515 (62.0%) | 316 (38.0%) |
Housing Structures by Number of Rooms in Grand Marais
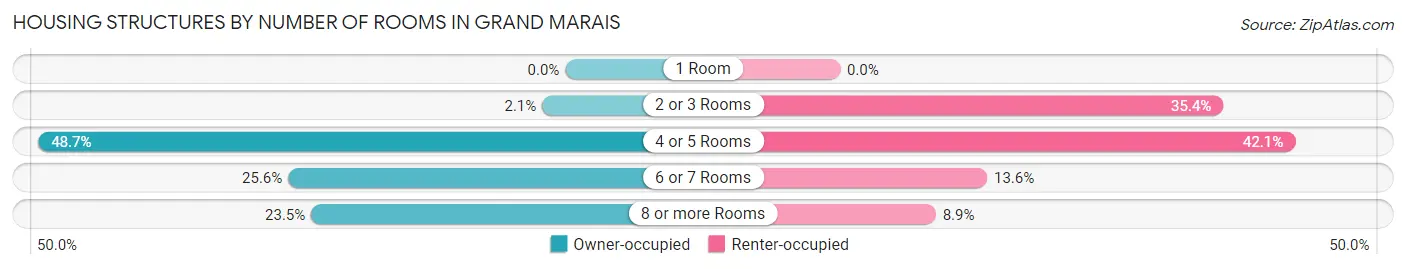
| Number of Rooms | Owner-occupied | Renter-occupied |
| 1 Room | 0 (0.0%) | 0 (0.0%) |
| 2 or 3 Rooms | 11 (2.1%) | 112 (35.4%) |
| 4 or 5 Rooms | 251 (48.7%) | 133 (42.1%) |
| 6 or 7 Rooms | 132 (25.6%) | 43 (13.6%) |
| 8 or more Rooms | 121 (23.5%) | 28 (8.9%) |
| Total | 515 (100.0%) | 316 (100.0%) |
Housing Structure by Heating Type in Grand Marais
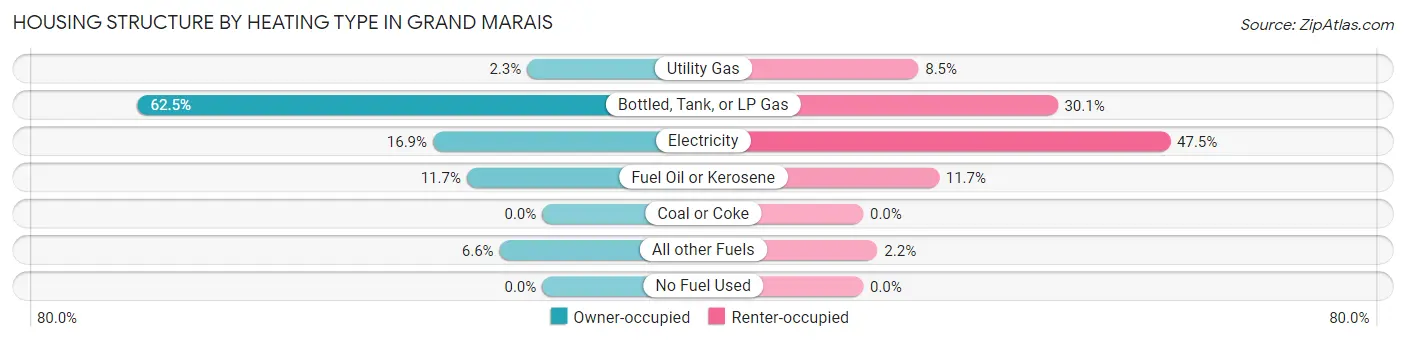
| Heating Type | Owner-occupied | Renter-occupied |
| Utility Gas | 12 (2.3%) | 27 (8.5%) |
| Bottled, Tank, or LP Gas | 322 (62.5%) | 95 (30.1%) |
| Electricity | 87 (16.9%) | 150 (47.5%) |
| Fuel Oil or Kerosene | 60 (11.7%) | 37 (11.7%) |
| Coal or Coke | 0 (0.0%) | 0 (0.0%) |
| All other Fuels | 34 (6.6%) | 7 (2.2%) |
| No Fuel Used | 0 (0.0%) | 0 (0.0%) |
| Total | 515 (100.0%) | 316 (100.0%) |
Household Vehicle Usage in Grand Marais
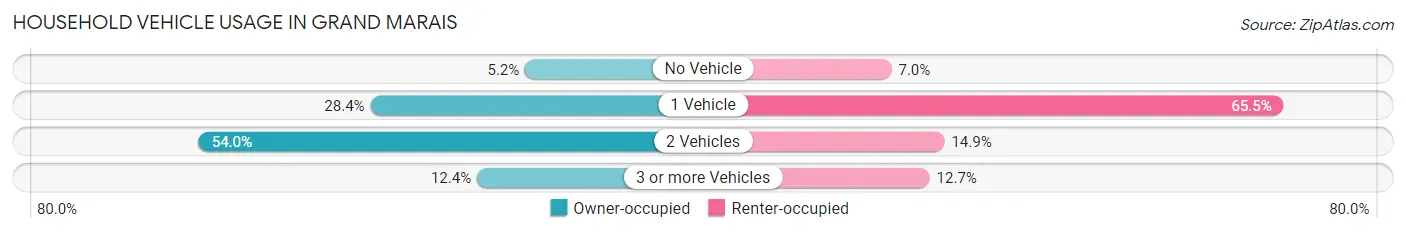
| Vehicles per Household | Owner-occupied | Renter-occupied |
| No Vehicle | 27 (5.2%) | 22 (7.0%) |
| 1 Vehicle | 146 (28.3%) | 207 (65.5%) |
| 2 Vehicles | 278 (54.0%) | 47 (14.9%) |
| 3 or more Vehicles | 64 (12.4%) | 40 (12.7%) |
| Total | 515 (100.0%) | 316 (100.0%) |
Real Estate & Mortgages in Grand Marais
Real Estate and Mortgage Overview in Grand Marais
| Characteristic | Without Mortgage | With Mortgage |
| Housing Units | 193 | 322 |
| Median Property Value | $267,200 | $256,000 |
| Median Household Income | $71,771 | $24 |
| Monthly Housing Costs | $640 | $23 |
| Real Estate Taxes | $2,242 | $0 |
Property Value by Mortgage Status in Grand Marais
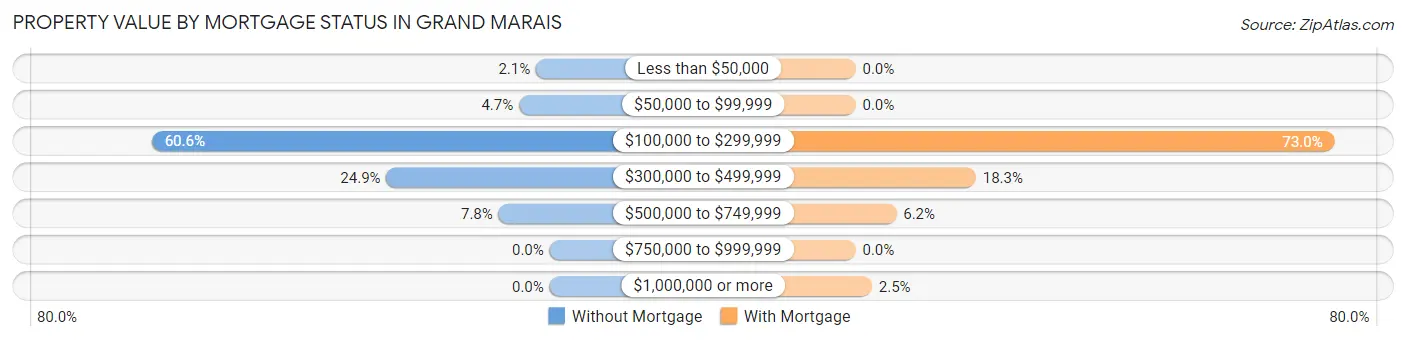
| Property Value | Without Mortgage | With Mortgage |
| Less than $50,000 | 4 (2.1%) | 0 (0.0%) |
| $50,000 to $99,999 | 9 (4.7%) | 0 (0.0%) |
| $100,000 to $299,999 | 117 (60.6%) | 235 (73.0%) |
| $300,000 to $499,999 | 48 (24.9%) | 59 (18.3%) |
| $500,000 to $749,999 | 15 (7.8%) | 20 (6.2%) |
| $750,000 to $999,999 | 0 (0.0%) | 0 (0.0%) |
| $1,000,000 or more | 0 (0.0%) | 8 (2.5%) |
| Total | 193 (100.0%) | 322 (100.0%) |
Household Income by Mortgage Status in Grand Marais
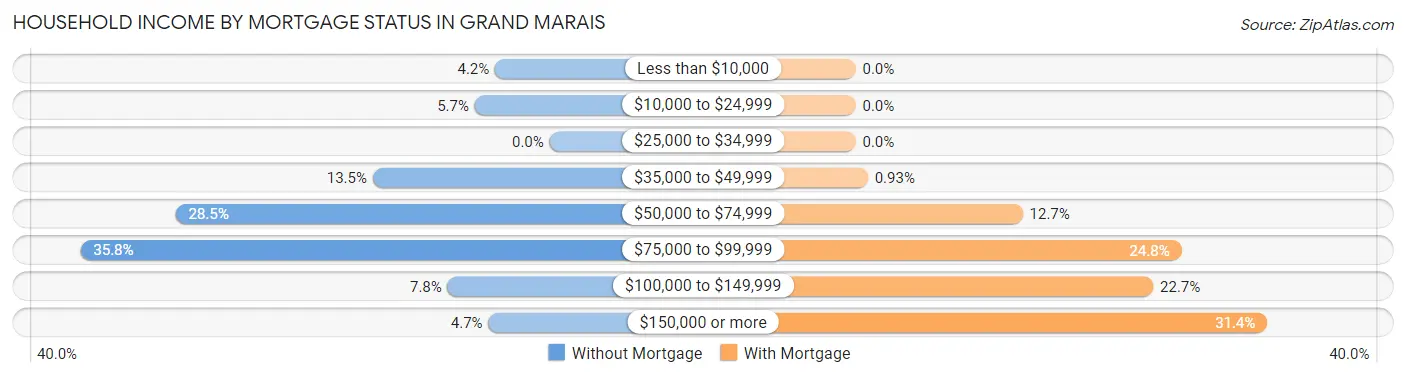
| Household Income | Without Mortgage | With Mortgage |
| Less than $10,000 | 8 (4.2%) | 0 (0.0%) |
| $10,000 to $24,999 | 11 (5.7%) | 0 (0.0%) |
| $25,000 to $34,999 | 0 (0.0%) | 0 (0.0%) |
| $35,000 to $49,999 | 26 (13.5%) | 3 (0.9%) |
| $50,000 to $74,999 | 55 (28.5%) | 41 (12.7%) |
| $75,000 to $99,999 | 69 (35.7%) | 80 (24.8%) |
| $100,000 to $149,999 | 15 (7.8%) | 73 (22.7%) |
| $150,000 or more | 9 (4.7%) | 101 (31.4%) |
| Total | 193 (100.0%) | 322 (100.0%) |
Property Value to Household Income Ratio in Grand Marais
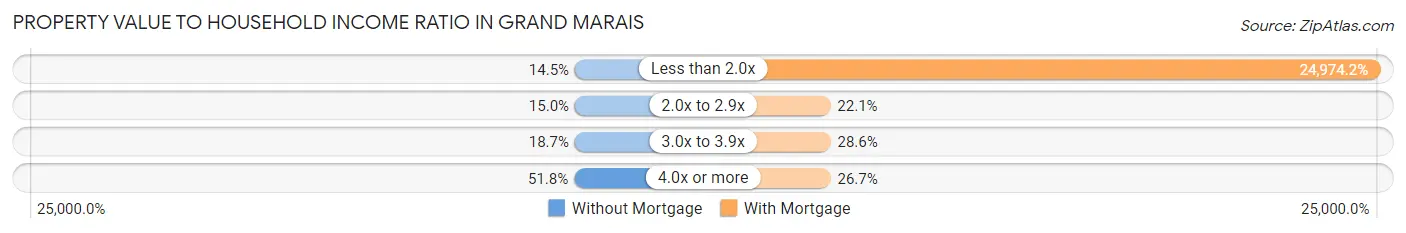
| Value-to-Income Ratio | Without Mortgage | With Mortgage |
| Less than 2.0x | 28 (14.5%) | 80,417 (24,974.2%) |
| 2.0x to 2.9x | 29 (15.0%) | 71 (22.1%) |
| 3.0x to 3.9x | 36 (18.6%) | 92 (28.6%) |
| 4.0x or more | 100 (51.8%) | 86 (26.7%) |
| Total | 193 (100.0%) | 322 (100.0%) |
Real Estate Taxes by Mortgage Status in Grand Marais
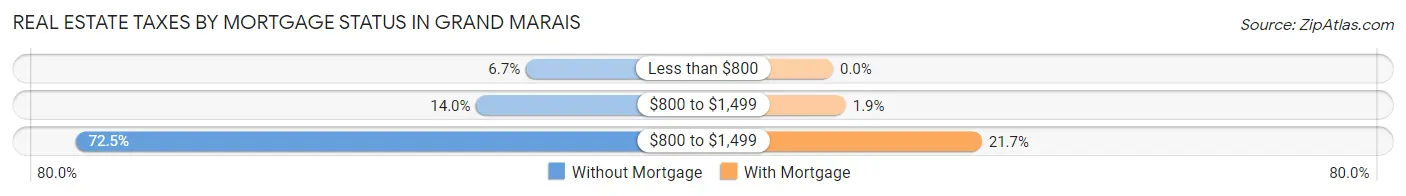
| Property Taxes | Without Mortgage | With Mortgage |
| Less than $800 | 13 (6.7%) | 0 (0.0%) |
| $800 to $1,499 | 27 (14.0%) | 6 (1.9%) |
| $800 to $1,499 | 140 (72.5%) | 70 (21.7%) |
| Total | 193 (100.0%) | 322 (100.0%) |
Health & Disability in Grand Marais
Health Insurance Coverage by Age in Grand Marais
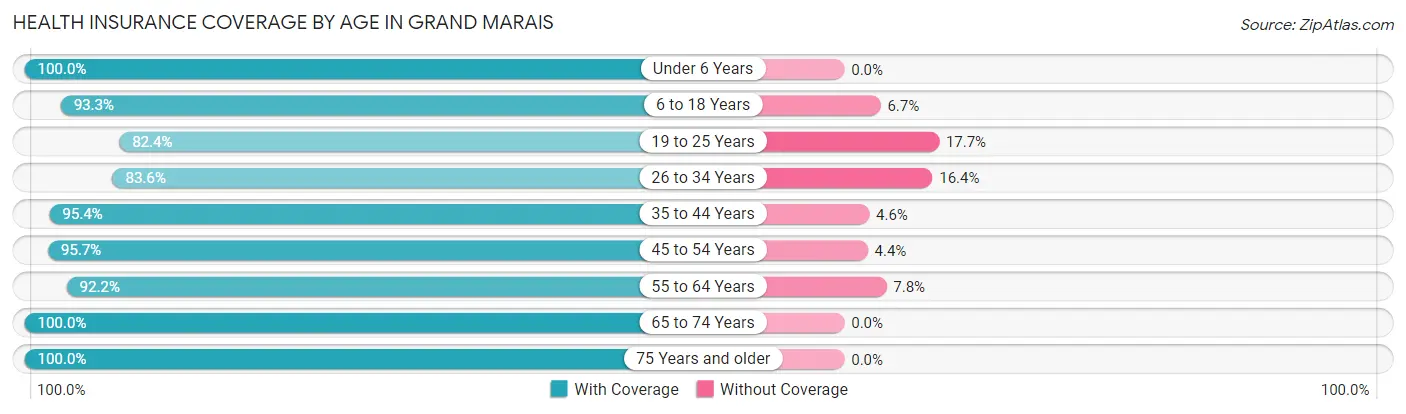
| Age Bracket | With Coverage | Without Coverage |
| Under 6 Years | 136 (100.0%) | 0 (0.0%) |
| 6 to 18 Years | 166 (93.3%) | 12 (6.7%) |
| 19 to 25 Years | 70 (82.4%) | 15 (17.6%) |
| 26 to 34 Years | 214 (83.6%) | 42 (16.4%) |
| 35 to 44 Years | 206 (95.4%) | 10 (4.6%) |
| 45 to 54 Years | 198 (95.7%) | 9 (4.3%) |
| 55 to 64 Years | 235 (92.2%) | 20 (7.8%) |
| 65 to 74 Years | 268 (100.0%) | 0 (0.0%) |
| 75 Years and older | 121 (100.0%) | 0 (0.0%) |
| Total | 1,614 (93.7%) | 108 (6.3%) |
Health Insurance Coverage by Citizenship Status in Grand Marais
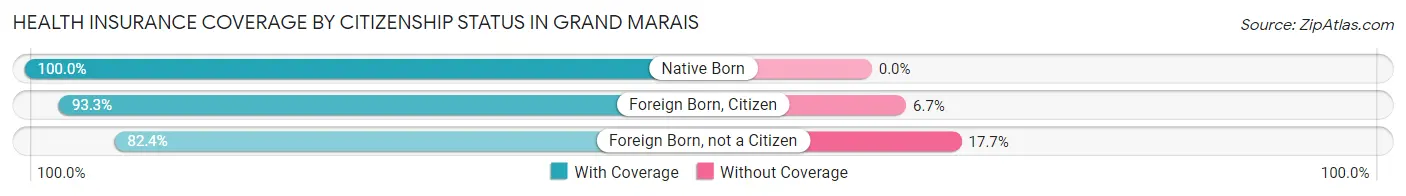
| Citizenship Status | With Coverage | Without Coverage |
| Native Born | 136 (100.0%) | 0 (0.0%) |
| Foreign Born, Citizen | 166 (93.3%) | 12 (6.7%) |
| Foreign Born, not a Citizen | 70 (82.4%) | 15 (17.6%) |
Health Insurance Coverage by Household Income in Grand Marais
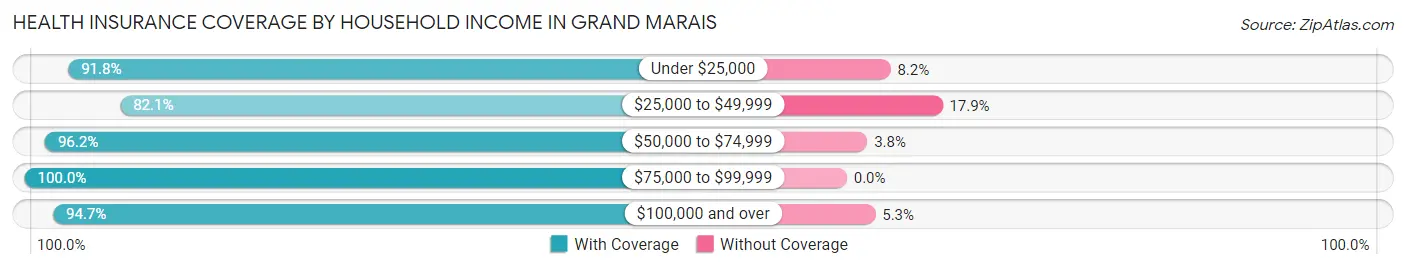
| Household Income | With Coverage | Without Coverage |
| Under $25,000 | 101 (91.8%) | 9 (8.2%) |
| $25,000 to $49,999 | 252 (82.1%) | 55 (17.9%) |
| $50,000 to $74,999 | 553 (96.2%) | 22 (3.8%) |
| $75,000 to $99,999 | 318 (100.0%) | 0 (0.0%) |
| $100,000 and over | 390 (94.7%) | 22 (5.3%) |
Public vs Private Health Insurance Coverage by Age in Grand Marais
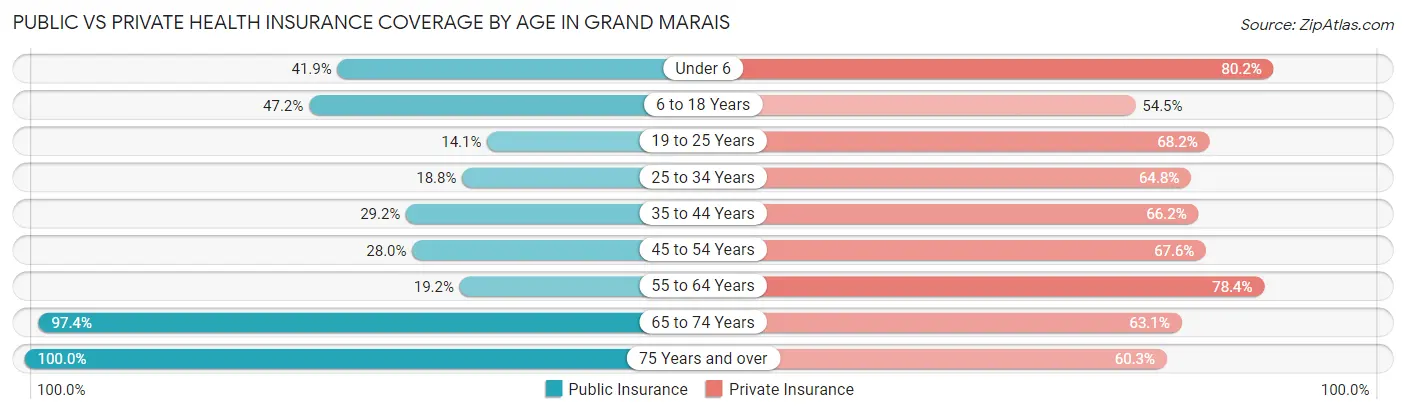
| Age Bracket | Public Insurance | Private Insurance |
| Under 6 | 57 (41.9%) | 109 (80.1%) |
| 6 to 18 Years | 84 (47.2%) | 97 (54.5%) |
| 19 to 25 Years | 12 (14.1%) | 58 (68.2%) |
| 25 to 34 Years | 48 (18.8%) | 166 (64.8%) |
| 35 to 44 Years | 63 (29.2%) | 143 (66.2%) |
| 45 to 54 Years | 58 (28.0%) | 140 (67.6%) |
| 55 to 64 Years | 49 (19.2%) | 200 (78.4%) |
| 65 to 74 Years | 261 (97.4%) | 169 (63.1%) |
| 75 Years and over | 121 (100.0%) | 73 (60.3%) |
| Total | 753 (43.7%) | 1,155 (67.1%) |
Disability Status by Sex by Age in Grand Marais
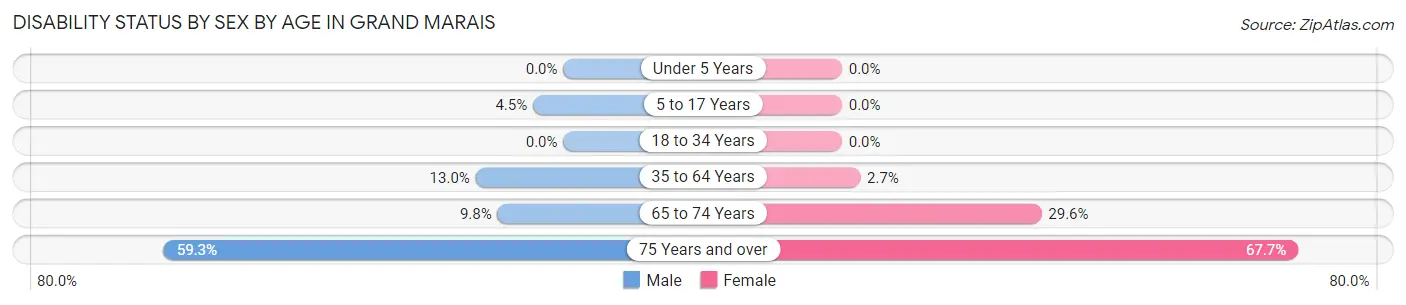
| Age Bracket | Male | Female |
| Under 5 Years | 0 (0.0%) | 0 (0.0%) |
| 5 to 17 Years | 5 (4.5%) | 0 (0.0%) |
| 18 to 34 Years | 0 (0.0%) | 0 (0.0%) |
| 35 to 64 Years | 50 (13.0%) | 8 (2.7%) |
| 65 to 74 Years | 13 (9.8%) | 40 (29.6%) |
| 75 Years and over | 35 (59.3%) | 42 (67.7%) |
Disability Class by Sex by Age in Grand Marais
Disability Class: Hearing Difficulty
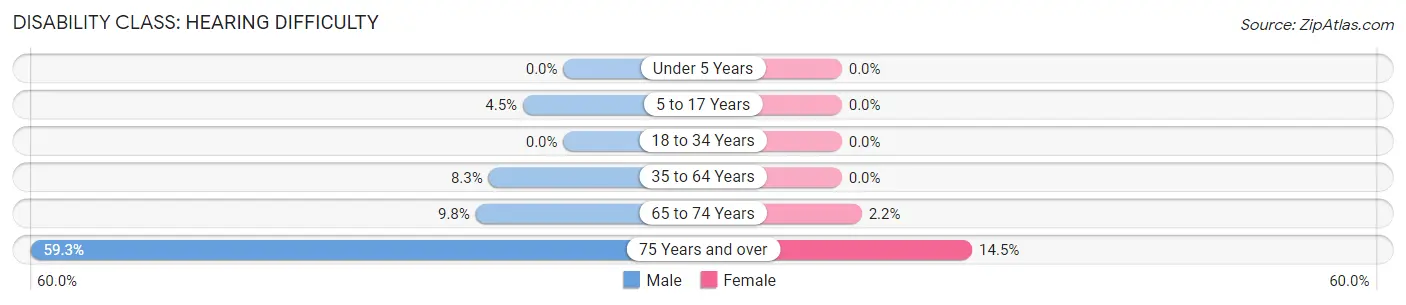
| Age Bracket | Male | Female |
| Under 5 Years | 0 (0.0%) | 0 (0.0%) |
| 5 to 17 Years | 5 (4.5%) | 0 (0.0%) |
| 18 to 34 Years | 0 (0.0%) | 0 (0.0%) |
| 35 to 64 Years | 32 (8.3%) | 0 (0.0%) |
| 65 to 74 Years | 13 (9.8%) | 3 (2.2%) |
| 75 Years and over | 35 (59.3%) | 9 (14.5%) |
Disability Class: Vision Difficulty
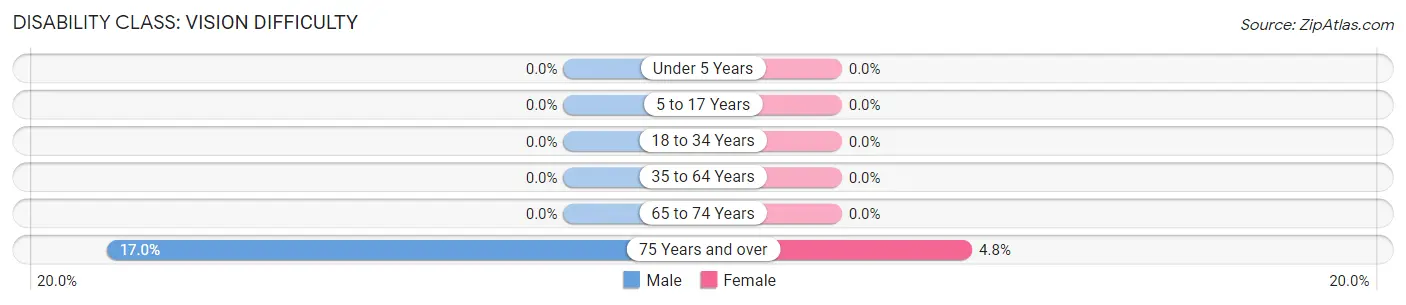
| Age Bracket | Male | Female |
| Under 5 Years | 0 (0.0%) | 0 (0.0%) |
| 5 to 17 Years | 0 (0.0%) | 0 (0.0%) |
| 18 to 34 Years | 0 (0.0%) | 0 (0.0%) |
| 35 to 64 Years | 0 (0.0%) | 0 (0.0%) |
| 65 to 74 Years | 0 (0.0%) | 0 (0.0%) |
| 75 Years and over | 10 (17.0%) | 3 (4.8%) |
Disability Class: Cognitive Difficulty
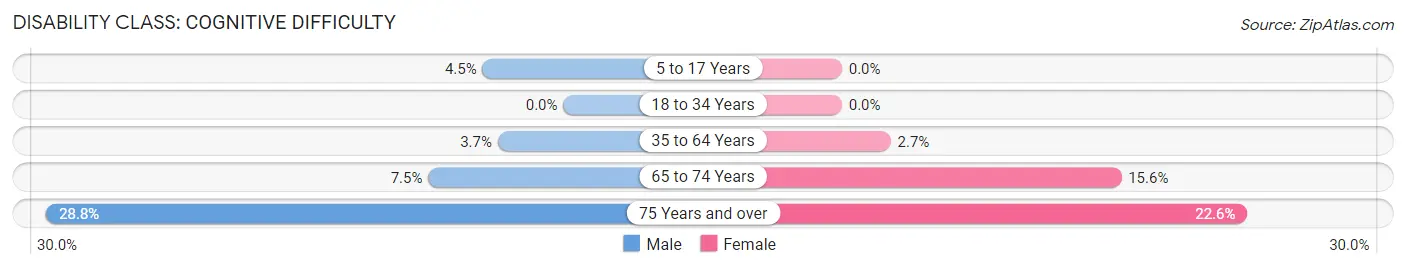
| Age Bracket | Male | Female |
| 5 to 17 Years | 5 (4.5%) | 0 (0.0%) |
| 18 to 34 Years | 0 (0.0%) | 0 (0.0%) |
| 35 to 64 Years | 14 (3.6%) | 8 (2.7%) |
| 65 to 74 Years | 10 (7.5%) | 21 (15.6%) |
| 75 Years and over | 17 (28.8%) | 14 (22.6%) |
Disability Class: Ambulatory Difficulty
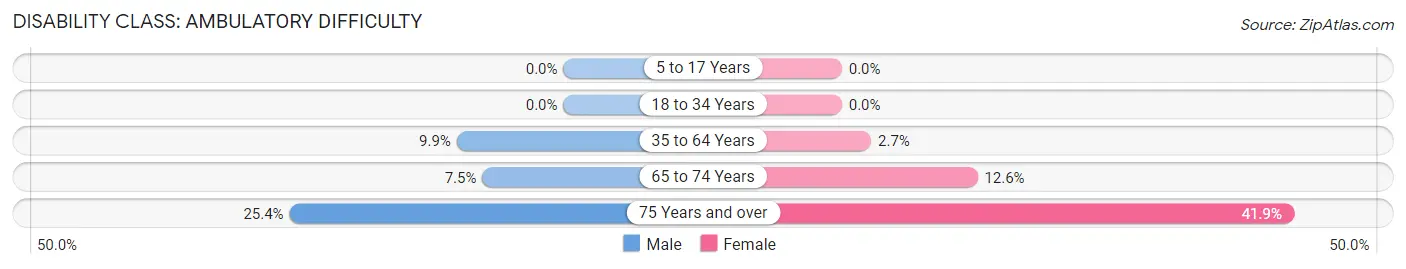
| Age Bracket | Male | Female |
| 5 to 17 Years | 0 (0.0%) | 0 (0.0%) |
| 18 to 34 Years | 0 (0.0%) | 0 (0.0%) |
| 35 to 64 Years | 38 (9.9%) | 8 (2.7%) |
| 65 to 74 Years | 10 (7.5%) | 17 (12.6%) |
| 75 Years and over | 15 (25.4%) | 26 (41.9%) |
Disability Class: Self-Care Difficulty
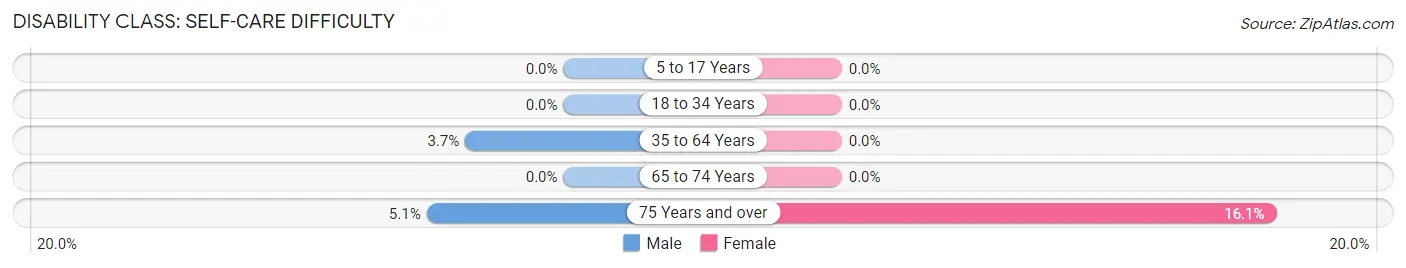
| Age Bracket | Male | Female |
| 5 to 17 Years | 0 (0.0%) | 0 (0.0%) |
| 18 to 34 Years | 0 (0.0%) | 0 (0.0%) |
| 35 to 64 Years | 14 (3.6%) | 0 (0.0%) |
| 65 to 74 Years | 0 (0.0%) | 0 (0.0%) |
| 75 Years and over | 3 (5.1%) | 10 (16.1%) |
Technology Access in Grand Marais
Computing Device Access in Grand Marais
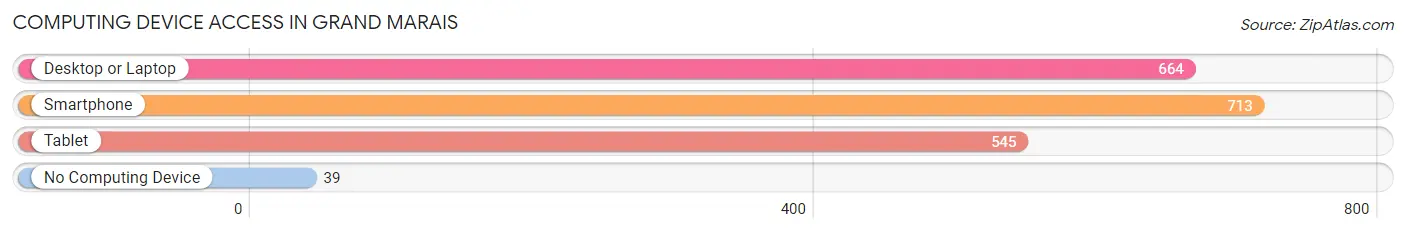
| Device Type | # Households | % Households |
| Desktop or Laptop | 664 | 79.9% |
| Smartphone | 713 | 85.8% |
| Tablet | 545 | 65.6% |
| No Computing Device | 39 | 4.7% |
| Total | 831 | 100.0% |
Internet Access in Grand Marais
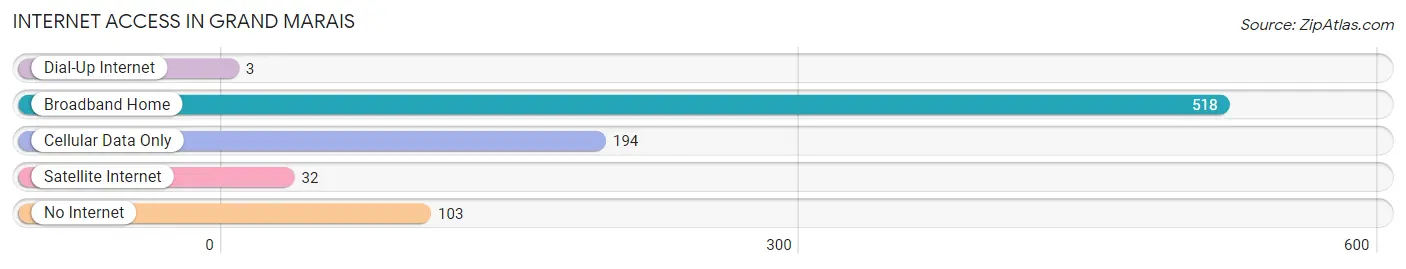
| Internet Type | # Households | % Households |
| Dial-Up Internet | 3 | 0.4% |
| Broadband Home | 518 | 62.3% |
| Cellular Data Only | 194 | 23.4% |
| Satellite Internet | 32 | 3.8% |
| No Internet | 103 | 12.4% |
| Total | 831 | 100.0% |
Grand Marais Summary
Marquette and Jolliet, two French explorers, were the first Europeans to visit the area that is now Grand Marais, Minnesota in 1693. The area was inhabited by the Ojibwe people, who had been living in the area for centuries. The Ojibwe called the area “Gichi-biitoobiig,” which means “great harbor.”
Grand Marais is located in Cook County, Minnesota, on the north shore of Lake Superior. It is the county seat of Cook County and is the only incorporated city in the county. The city is situated on the east side of the Sawtooth Mountains, which are part of the Superior National Forest. Grand Marais is located at the mouth of the Poplar River, which flows into Lake Superior. The city is surrounded by the Boundary Waters Canoe Area Wilderness, which is a popular destination for canoeing and camping.
Grand Marais has a total area of 4.2 square miles, of which 3.9 square miles is land and 0.3 square miles is water. The city has a humid continental climate, with cold, snowy winters and warm, humid summers. The average temperature in January is 8°F and the average temperature in July is 68°F.
As of the 2010 census, the population of Grand Marais was 1,351. The median age of the population was 47.7 years, and the median household income was $41,944. The racial makeup of the city was 95.3% White, 0.7% African American, 0.7% Native American, 0.3% Asian, 0.1% Pacific Islander, 0.7% from other races, and 2.1% from two or more races.
The economy of Grand Marais is largely based on tourism. The city is a popular destination for outdoor recreation, such as fishing, hunting, camping, and canoeing. The city is also home to several art galleries, restaurants, and shops. The Grand Marais Art Colony is a popular destination for art lovers, and the city hosts several festivals throughout the year, including the Grand Marais Arts Festival and the Grand Marais Music Festival.
The city is also home to several industries, including logging, fishing, and manufacturing. The Grand Marais Harbor is a popular destination for commercial fishing, and the city is home to several manufacturing companies, including a paper mill and a wood products plant.
Grand Marais is a popular destination for visitors from all over the world. The city is home to several attractions, including the Grand Marais Art Colony, the Grand Marais Music Festival, and the Grand Marais Harbor. The city is also home to several parks, including the Grand Marais State Park and the Grand Portage State Park. The city is also home to several museums, including the Grand Marais Historical Society Museum and the Grand Marais Maritime Museum.
Grand Marais is a unique and beautiful city with a rich history and culture. The city is a popular destination for outdoor recreation, art, and culture, and is home to several industries. The city is a great place to live, work, and visit.
Common Questions
What is Per Capita Income in Grand Marais?
Per Capita income in Grand Marais is $36,814.
What is the Median Family Income in Grand Marais?
Median Family Income in Grand Marais is $77,333.
What is the Median Household income in Grand Marais?
Median Household Income in Grand Marais is $68,640.
What is Income or Wage Gap in Grand Marais?
Income or Wage Gap in Grand Marais is 26.3%.
Women in Grand Marais earn 73.7 cents for every dollar earned by a man.
What is Inequality or Gini Index in Grand Marais?
Inequality or Gini Index in Grand Marais is 0.33.
What is the Total Population of Grand Marais?
Total Population of Grand Marais is 1,768.
What is the Total Male Population of Grand Marais?
Total Male Population of Grand Marais is 928.
What is the Total Female Population of Grand Marais?
Total Female Population of Grand Marais is 840.
What is the Ratio of Males per 100 Females in Grand Marais?
There are 110.48 Males per 100 Females in Grand Marais.
What is the Ratio of Females per 100 Males in Grand Marais?
There are 90.52 Females per 100 Males in Grand Marais.
What is the Median Population Age in Grand Marais?
Median Population Age in Grand Marais is 45.1 Years.
What is the Average Family Size in Grand Marais
Average Family Size in Grand Marais is 2.8 People.
What is the Average Household Size in Grand Marais
Average Household Size in Grand Marais is 2.1 People.
How Large is the Labor Force in Grand Marais?
There are 877 People in the Labor Forcein in Grand Marais.
What is the Percentage of People in the Labor Force in Grand Marais?
59.2% of People are in the Labor Force in Grand Marais.
What is the Unemployment Rate in Grand Marais?
Unemployment Rate in Grand Marais is 1.4%.