Mescal, AZ Map & Demographics
Mescal Map
Mescal Overview
$26,169
PER CAPITA INCOME
$42,727
AVG FAMILY INCOME
$52,969
AVG HOUSEHOLD INCOME
0.39
INEQUALITY / GINI INDEX
1,468
TOTAL POPULATION
731
MALE POPULATION
737
FEMALE POPULATION
99.19
MALES / 100 FEMALES
100.82
FEMALES / 100 MALES
59.0
MEDIAN AGE
3.0
AVG FAMILY SIZE
2.4
AVG HOUSEHOLD SIZE
456
LABOR FORCE [ PEOPLE ]
37.6%
PERCENT IN LABOR FORCE
Mescal Area Codes
Income in Mescal
Income Overview in Mescal
Per Capita Income in Mescal is $26,169, while median incomes of families and households are $42,727 and $52,969 respectively.
| Characteristic | Number | Measure |
| Per Capita Income | 1,468 | $26,169 |
| Median Family Income | 388 | $42,727 |
| Mean Family Income | 388 | $63,673 |
| Median Household Income | 611 | $52,969 |
| Mean Household Income | 611 | $61,697 |
| Income Deficit | 388 | $0 |
| Wage / Income Gap (%) | 1,468 | 0.00% |
| Wage / Income Gap ($) | 1,468 | 100.00¢ per $1 |
| Gini / Inequality Index | 1,468 | 0.39 |
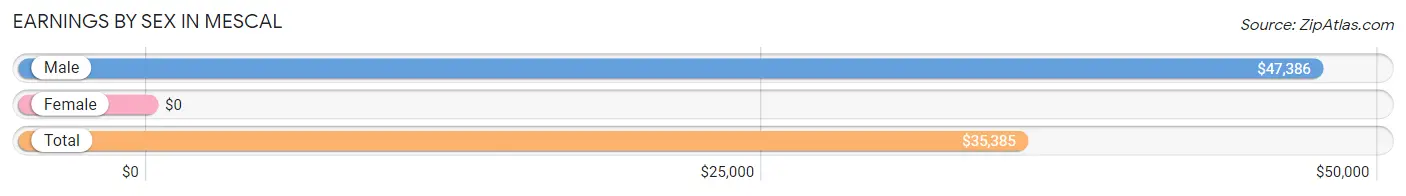
Earnings by Sex in Mescal
| Sex | Number | Average Earnings |
| Male | 257 (49.6%) | $47,386 |
| Female | 261 (50.4%) | $0 |
| Total | 518 (100.0%) | $35,385 |
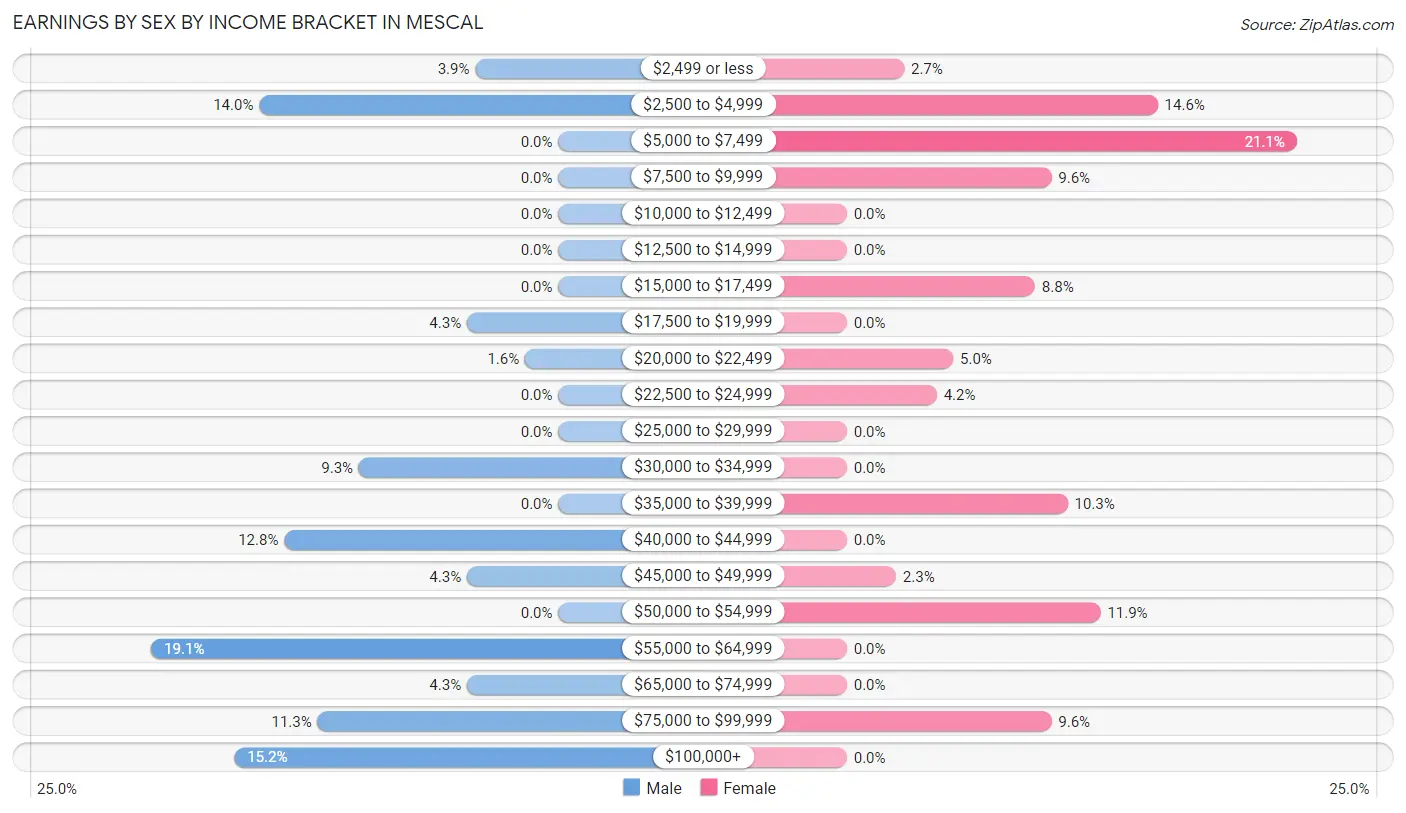
Earnings by Sex by Income Bracket in Mescal
The most common earnings brackets in Mescal are $55,000 to $64,999 for men (49 | 19.1%) and $5,000 to $7,499 for women (55 | 21.1%).
| Income | Male | Female |
| $2,499 or less | 10 (3.9%) | 7 (2.7%) |
| $2,500 to $4,999 | 36 (14.0%) | 38 (14.6%) |
| $5,000 to $7,499 | 0 (0.0%) | 55 (21.1%) |
| $7,500 to $9,999 | 0 (0.0%) | 25 (9.6%) |
| $10,000 to $12,499 | 0 (0.0%) | 0 (0.0%) |
| $12,500 to $14,999 | 0 (0.0%) | 0 (0.0%) |
| $15,000 to $17,499 | 0 (0.0%) | 23 (8.8%) |
| $17,500 to $19,999 | 11 (4.3%) | 0 (0.0%) |
| $20,000 to $22,499 | 4 (1.6%) | 13 (5.0%) |
| $22,500 to $24,999 | 0 (0.0%) | 11 (4.2%) |
| $25,000 to $29,999 | 0 (0.0%) | 0 (0.0%) |
| $30,000 to $34,999 | 24 (9.3%) | 0 (0.0%) |
| $35,000 to $39,999 | 0 (0.0%) | 27 (10.3%) |
| $40,000 to $44,999 | 33 (12.8%) | 0 (0.0%) |
| $45,000 to $49,999 | 11 (4.3%) | 6 (2.3%) |
| $50,000 to $54,999 | 0 (0.0%) | 31 (11.9%) |
| $55,000 to $64,999 | 49 (19.1%) | 0 (0.0%) |
| $65,000 to $74,999 | 11 (4.3%) | 0 (0.0%) |
| $75,000 to $99,999 | 29 (11.3%) | 25 (9.6%) |
| $100,000+ | 39 (15.2%) | 0 (0.0%) |
| Total | 257 (100.0%) | 261 (100.0%) |
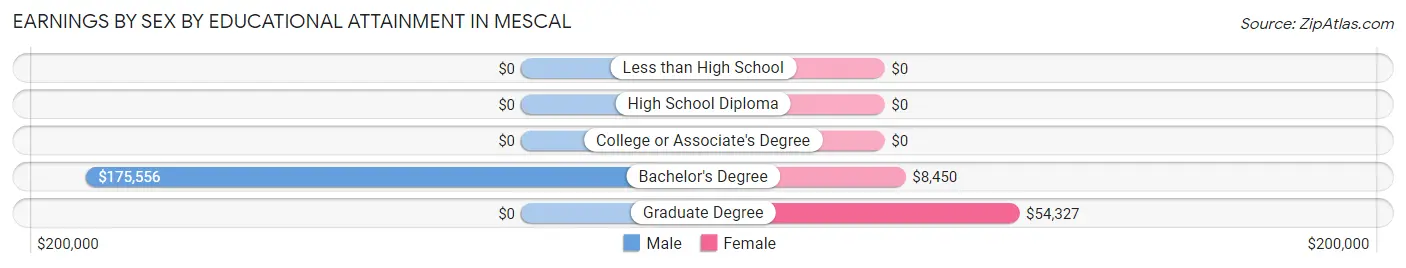
Earnings by Sex by Educational Attainment in Mescal
Average earnings in Mescal are $47,386 for men and $16,793 for women, a difference of 64.6%. Men with an educational attainment of bachelor's degree enjoy the highest average annual earnings of $175,556, while those with bachelor's degree education earn the least with $175,556. Women with an educational attainment of graduate degree earn the most with the average annual earnings of $54,327, while those with bachelor's degree education have the smallest earnings of $8,450.
| Educational Attainment | Male Income | Female Income |
| Less than High School | - | - |
| High School Diploma | - | - |
| College or Associate's Degree | - | - |
| Bachelor's Degree | $175,556 | $8,450 |
| Graduate Degree | - | - |
| Total | $47,386 | $16,793 |
Family Income in Mescal
Family Income Brackets in Mescal
According to the Mescal family income data, there are 79 families falling into the $50,000 to $74,999 income range, which is the most common income bracket and makes up 20.4% of all families. Conversely, the $10,000 to $14,999 income bracket is the least frequent group with only 7 families (1.8%) belonging to this category.
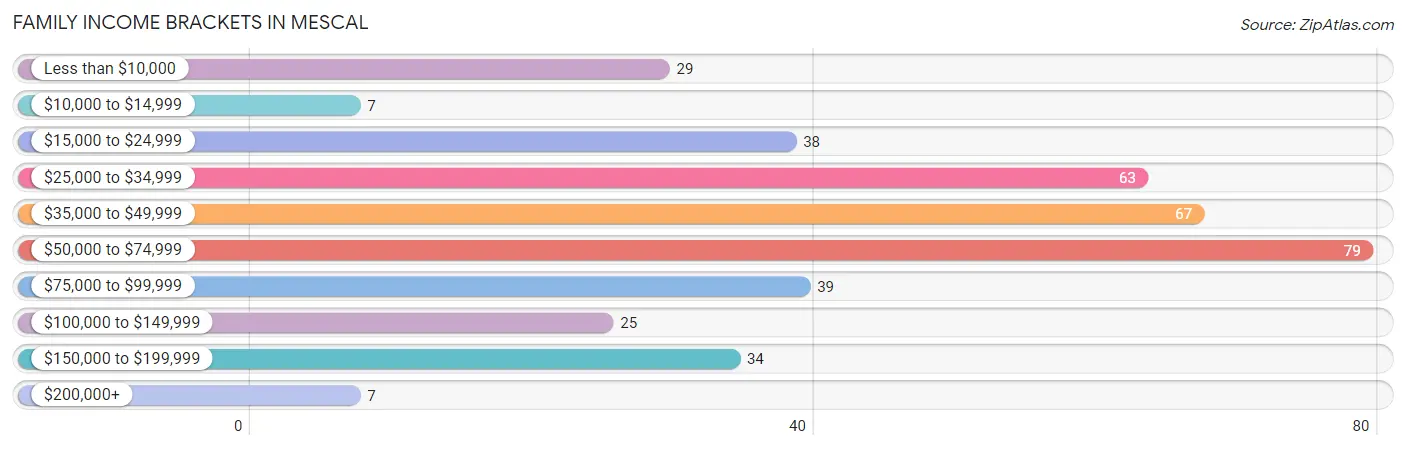
| Income Bracket | # Families | % Families |
| Less than $10,000 | 29 | 7.5% |
| $10,000 to $14,999 | 7 | 1.8% |
| $15,000 to $24,999 | 38 | 9.8% |
| $25,000 to $34,999 | 63 | 16.2% |
| $35,000 to $49,999 | 67 | 17.3% |
| $50,000 to $74,999 | 79 | 20.4% |
| $75,000 to $99,999 | 39 | 10.1% |
| $100,000 to $149,999 | 25 | 6.4% |
| $150,000 to $199,999 | 34 | 8.8% |
| $200,000+ | 7 | 1.8% |
Family Income by Famaliy Size in Mescal
2-person families (233 | 60.1%) account for the highest median family income in Mescal with $40,393 per family, while 2-person families (233 | 60.1%) have the highest median income of $20,196 per family member.
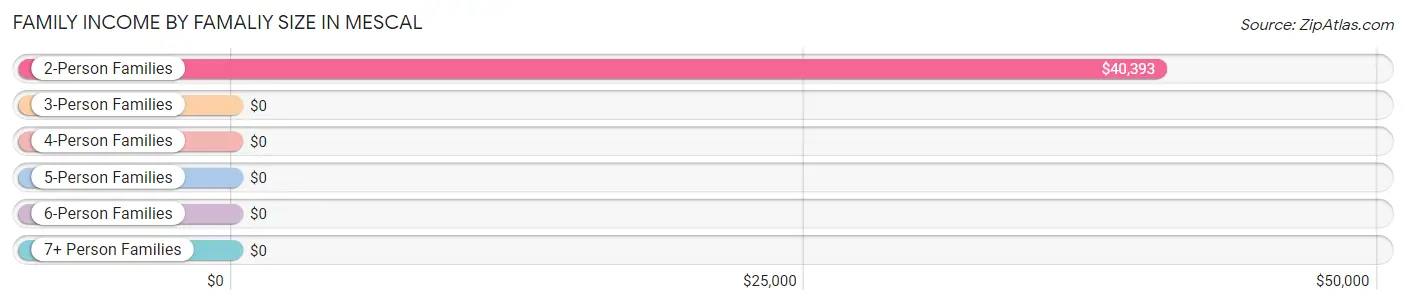
| Income Bracket | # Families | Median Income |
| 2-Person Families | 233 (60.1%) | $40,393 |
| 3-Person Families | 65 (16.8%) | $0 |
| 4-Person Families | 37 (9.5%) | $0 |
| 5-Person Families | 26 (6.7%) | $0 |
| 6-Person Families | 27 (7.0%) | $0 |
| 7+ Person Families | 0 (0.0%) | $0 |
| Total | 388 (100.0%) | $42,727 |
Family Income by Number of Earners in Mescal
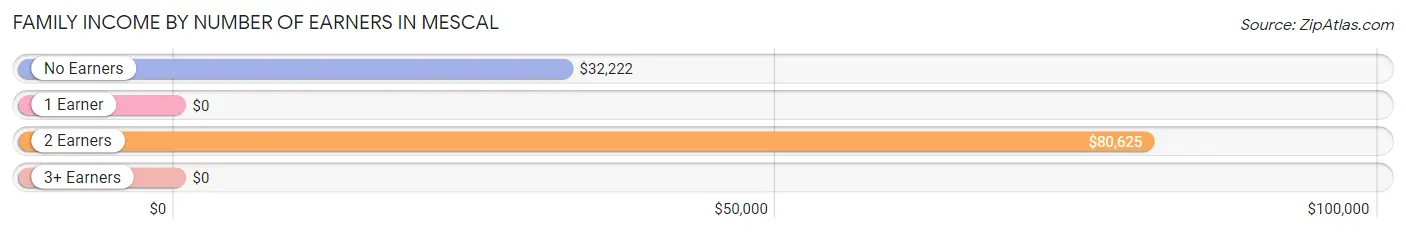
| Number of Earners | # Families | Median Income |
| No Earners | 178 (45.9%) | $32,222 |
| 1 Earner | 69 (17.8%) | $0 |
| 2 Earners | 107 (27.6%) | $80,625 |
| 3+ Earners | 34 (8.8%) | $0 |
| Total | 388 (100.0%) | $42,727 |
Household Income in Mescal
Household Income Brackets in Mescal
With 158 households falling in the category, the $50,000 to $74,999 income range is the most frequent in Mescal, accounting for 25.9% of all households. In contrast, only 10 households (1.6%) fall into the $10,000 to $14,999 income bracket, making it the least populous group.
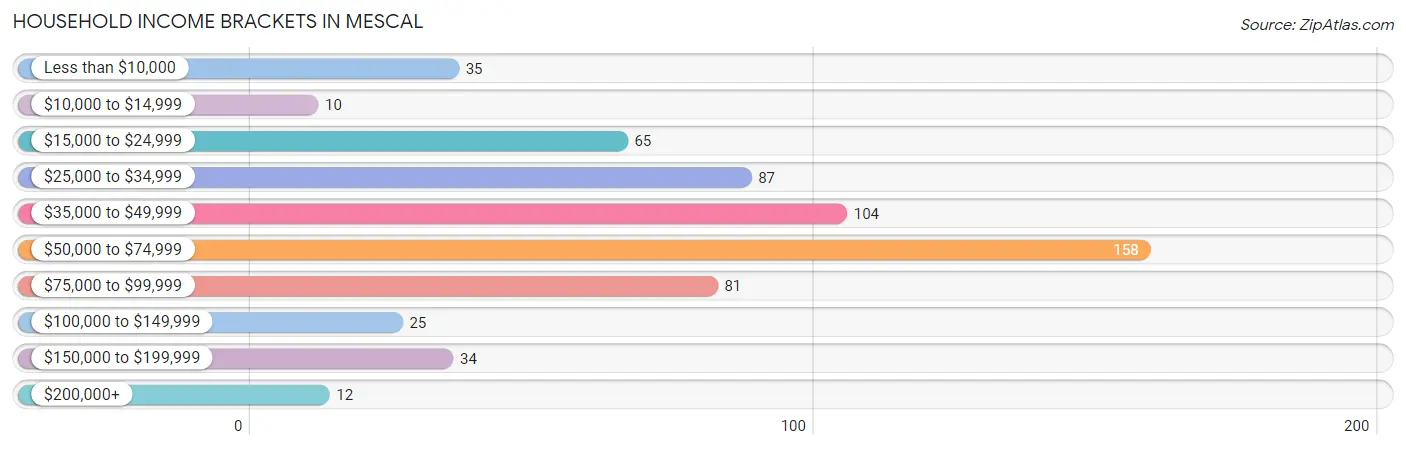
| Income Bracket | # Households | % Households |
| Less than $10,000 | 35 | 5.7% |
| $10,000 to $14,999 | 10 | 1.6% |
| $15,000 to $24,999 | 65 | 10.6% |
| $25,000 to $34,999 | 87 | 14.2% |
| $35,000 to $49,999 | 104 | 17.0% |
| $50,000 to $74,999 | 158 | 25.9% |
| $75,000 to $99,999 | 81 | 13.3% |
| $100,000 to $149,999 | 25 | 4.1% |
| $150,000 to $199,999 | 34 | 5.6% |
| $200,000+ | 12 | 2.0% |
Household Income by Householder Age in Mescal
The median household income in Mescal is $52,969, with the highest median household income of $67,458 found in the 25 to 44 years age bracket for the primary householder. A total of 59 households (9.7%) fall into this category.
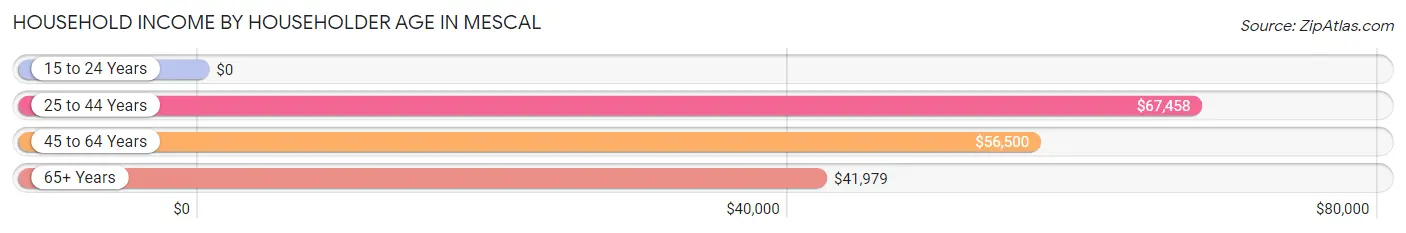
| Income Bracket | # Households | Median Income |
| 15 to 24 Years | 0 (0.0%) | $0 |
| 25 to 44 Years | 59 (9.7%) | $67,458 |
| 45 to 64 Years | 156 (25.5%) | $56,500 |
| 65+ Years | 396 (64.8%) | $41,979 |
| Total | 611 (100.0%) | $52,969 |
Poverty in Mescal
Income Below Poverty by Sex and Age in Mescal
With 14.8% poverty level for males and 17.1% for females among the residents of Mescal, 15 year old males and under 5 year old females are the most vulnerable to poverty, with 14 males (100.0%) and 21 females (67.7%) in their respective age groups living below the poverty level.
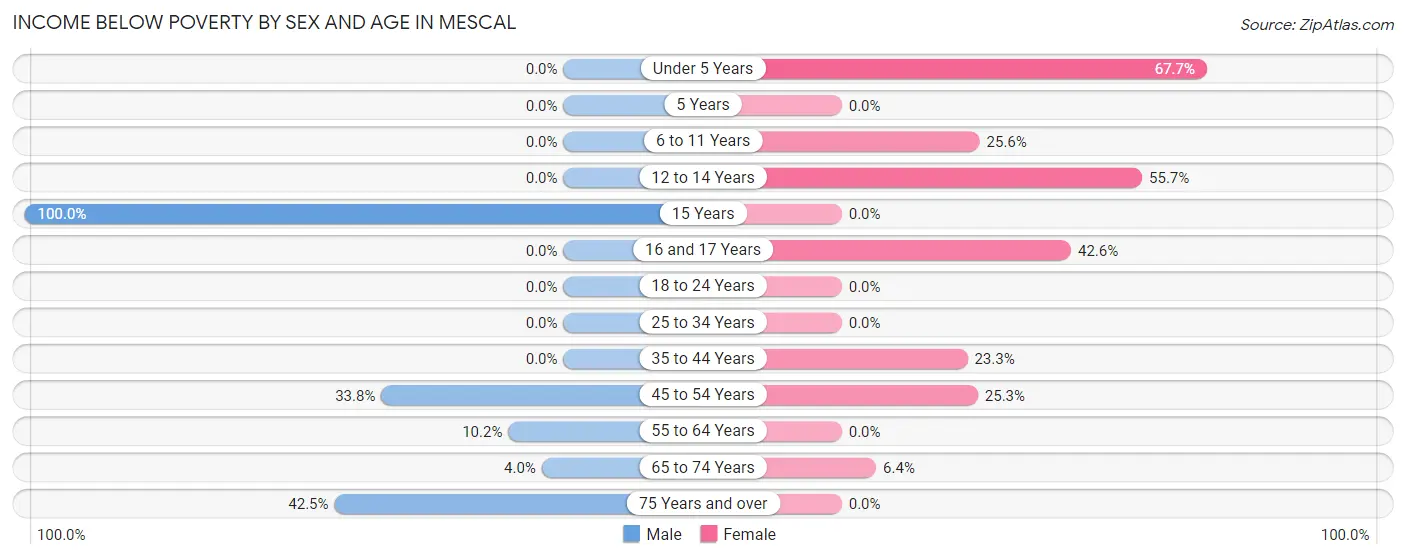
| Age Bracket | Male | Female |
| Under 5 Years | 0 (0.0%) | 21 (67.7%) |
| 5 Years | 0 (0.0%) | 0 (0.0%) |
| 6 to 11 Years | 0 (0.0%) | 11 (25.6%) |
| 12 to 14 Years | 0 (0.0%) | 34 (55.7%) |
| 15 Years | 14 (100.0%) | 0 (0.0%) |
| 16 and 17 Years | 0 (0.0%) | 20 (42.5%) |
| 18 to 24 Years | 0 (0.0%) | 0 (0.0%) |
| 25 to 34 Years | 0 (0.0%) | 0 (0.0%) |
| 35 to 44 Years | 0 (0.0%) | 7 (23.3%) |
| 45 to 54 Years | 24 (33.8%) | 24 (25.3%) |
| 55 to 64 Years | 9 (10.2%) | 0 (0.0%) |
| 65 to 74 Years | 10 (4.0%) | 9 (6.4%) |
| 75 Years and over | 51 (42.5%) | 0 (0.0%) |
| Total | 108 (14.8%) | 126 (17.1%) |
Income Above Poverty by Sex and Age in Mescal
According to the poverty statistics in Mescal, males aged under 5 years and females aged 15 years are the age groups that are most secure financially, with 100.0% of males and 100.0% of females in these age groups living above the poverty line.
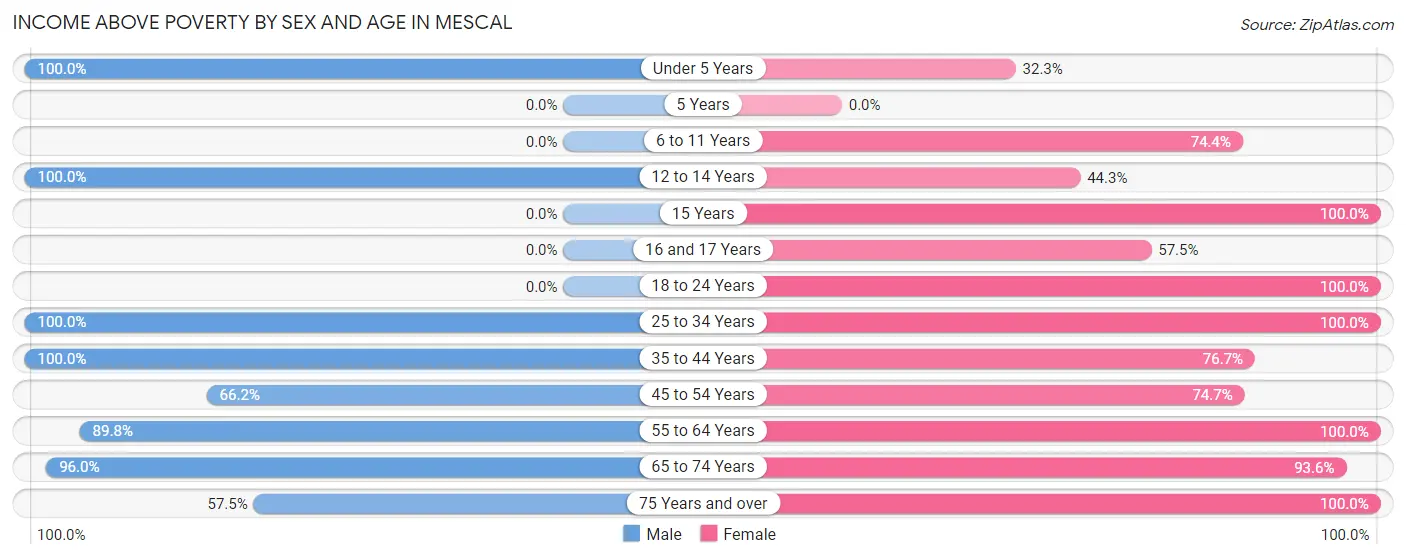
| Age Bracket | Male | Female |
| Under 5 Years | 51 (100.0%) | 10 (32.3%) |
| 5 Years | 0 (0.0%) | 0 (0.0%) |
| 6 to 11 Years | 0 (0.0%) | 32 (74.4%) |
| 12 to 14 Years | 29 (100.0%) | 27 (44.3%) |
| 15 Years | 0 (0.0%) | 26 (100.0%) |
| 16 and 17 Years | 0 (0.0%) | 27 (57.5%) |
| 18 to 24 Years | 0 (0.0%) | 22 (100.0%) |
| 25 to 34 Years | 98 (100.0%) | 68 (100.0%) |
| 35 to 44 Years | 11 (100.0%) | 23 (76.7%) |
| 45 to 54 Years | 47 (66.2%) | 71 (74.7%) |
| 55 to 64 Years | 79 (89.8%) | 85 (100.0%) |
| 65 to 74 Years | 239 (96.0%) | 132 (93.6%) |
| 75 Years and over | 69 (57.5%) | 88 (100.0%) |
| Total | 623 (85.2%) | 611 (82.9%) |
Income Below Poverty Among Married-Couple Families in Mescal
The poverty statistics for married-couple families in Mescal show that 10.0% or 35 of the total 349 families live below the poverty line. Families with 3 or 4 children have the highest poverty rate of 34.0%, comprising of 18 families. On the other hand, families with no children have the lowest poverty rate of 4.5%, which includes 11 families.
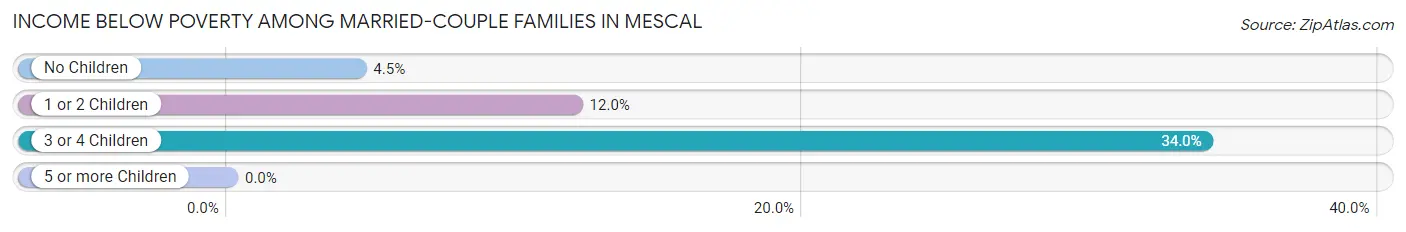
| Children | Above Poverty | Below Poverty |
| No Children | 235 (95.5%) | 11 (4.5%) |
| 1 or 2 Children | 44 (88.0%) | 6 (12.0%) |
| 3 or 4 Children | 35 (66.0%) | 18 (34.0%) |
| 5 or more Children | 0 (0.0%) | 0 (0.0%) |
| Total | 314 (90.0%) | 35 (10.0%) |
Income Below Poverty Among Single-Parent Households in Mescal
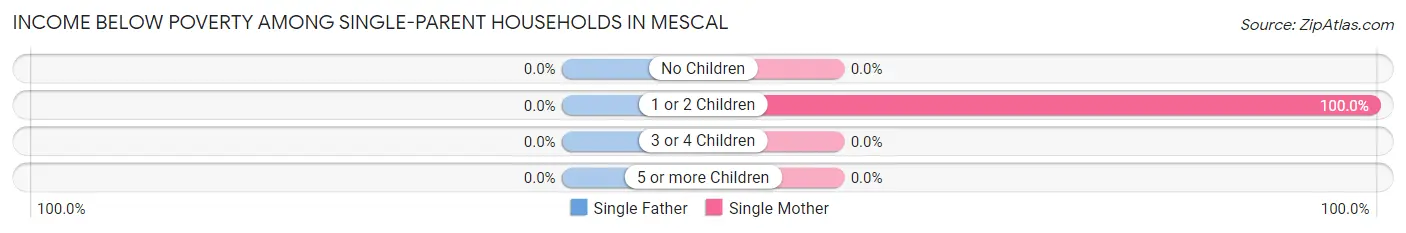
| Children | Single Father | Single Mother |
| No Children | 0 (0.0%) | 0 (0.0%) |
| 1 or 2 Children | 0 (0.0%) | 7 (100.0%) |
| 3 or 4 Children | 0 (0.0%) | 0 (0.0%) |
| 5 or more Children | 0 (0.0%) | 0 (0.0%) |
| Total | 0 (0.0%) | 7 (25.0%) |
Income Below Poverty Among Married-Couple vs Single-Parent Households in Mescal
The poverty data for Mescal shows that 35 of the married-couple family households (10.0%) and 7 of the single-parent households (17.9%) are living below the poverty level. Within the married-couple family households, those with 3 or 4 children have the highest poverty rate, with 18 households (34.0%) falling below the poverty line. Among the single-parent households, those with 1 or 2 children have the highest poverty rate, with 7 household (100.0%) living below poverty.
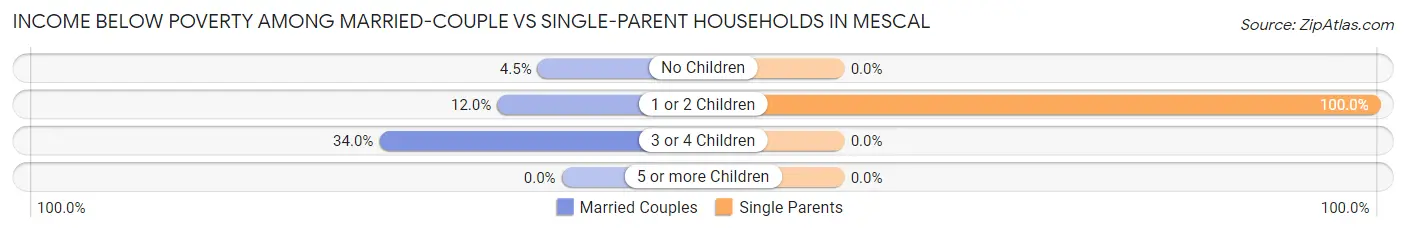
| Children | Married-Couple Families | Single-Parent Households |
| No Children | 11 (4.5%) | 0 (0.0%) |
| 1 or 2 Children | 6 (12.0%) | 7 (100.0%) |
| 3 or 4 Children | 18 (34.0%) | 0 (0.0%) |
| 5 or more Children | 0 (0.0%) | 0 (0.0%) |
| Total | 35 (10.0%) | 7 (17.9%) |
Race in Mescal
The most populous races in Mescal are White / Caucasian (1,296 | 88.3%), Hispanic or Latino (183 | 12.5%), and Two or more Races (150 | 10.2%).
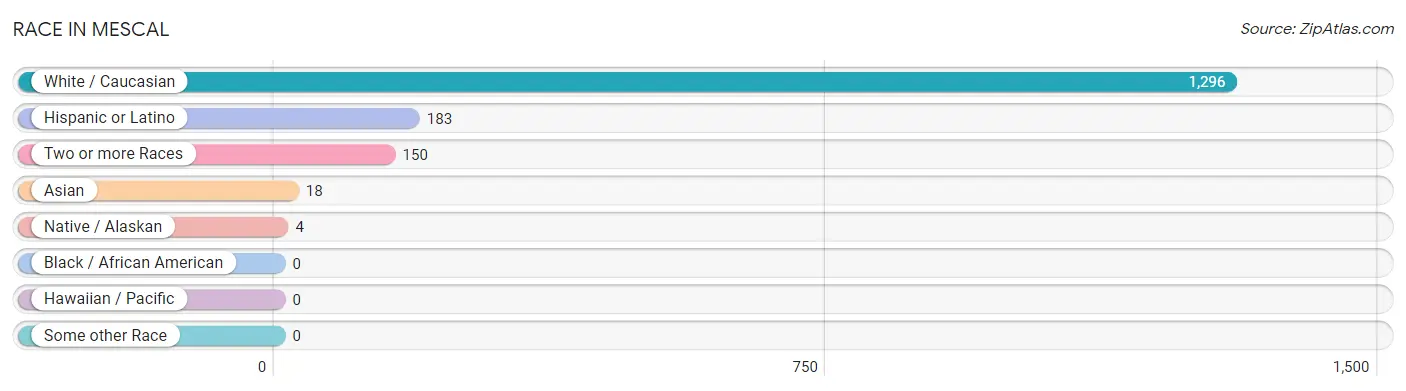
| Race | # Population | % Population |
| Asian | 18 | 1.2% |
| Black / African American | 0 | 0.0% |
| Hawaiian / Pacific | 0 | 0.0% |
| Hispanic or Latino | 183 | 12.5% |
| Native / Alaskan | 4 | 0.3% |
| White / Caucasian | 1,296 | 88.3% |
| Two or more Races | 150 | 10.2% |
| Some other Race | 0 | 0.0% |
| Total | 1,468 | 100.0% |
Ancestry in Mescal
The most populous ancestries reported in Mescal are German (369 | 25.1%), Mexican (183 | 12.5%), English (137 | 9.3%), Irish (122 | 8.3%), and French Canadian (64 | 4.4%), together accounting for 59.6% of all Mescal residents.
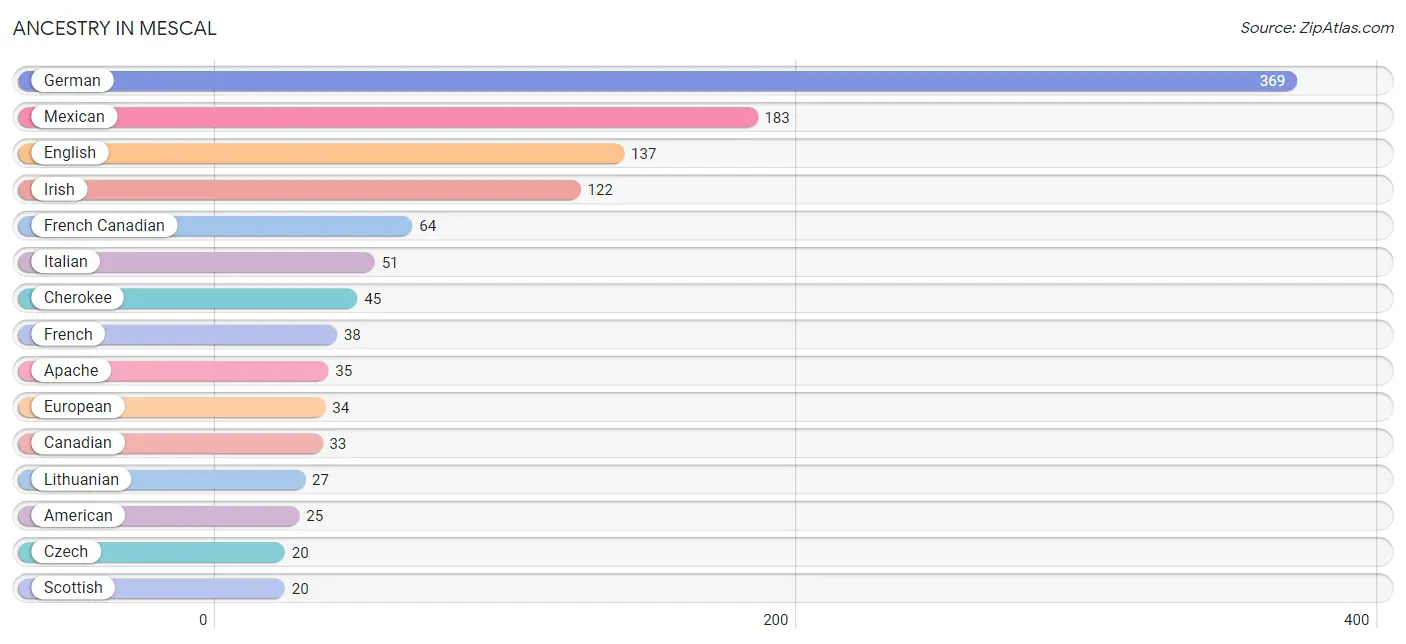
| Ancestry | # Population | % Population |
| African | 3 | 0.2% |
| American | 25 | 1.7% |
| Apache | 35 | 2.4% |
| Bhutanese | 18 | 1.2% |
| British | 3 | 0.2% |
| Canadian | 33 | 2.2% |
| Cherokee | 45 | 3.1% |
| Cree | 17 | 1.2% |
| Czech | 20 | 1.4% |
| Danish | 10 | 0.7% |
| Dutch | 11 | 0.7% |
| English | 137 | 9.3% |
| European | 34 | 2.3% |
| Finnish | 9 | 0.6% |
| French | 38 | 2.6% |
| French Canadian | 64 | 4.4% |
| German | 369 | 25.1% |
| Hungarian | 10 | 0.7% |
| Irish | 122 | 8.3% |
| Italian | 51 | 3.5% |
| Lithuanian | 27 | 1.8% |
| Mexican | 183 | 12.5% |
| Norwegian | 12 | 0.8% |
| Ottawa | 11 | 0.7% |
| Portuguese | 6 | 0.4% |
| Russian | 11 | 0.7% |
| Scandinavian | 17 | 1.2% |
| Scottish | 20 | 1.4% |
| Subsaharan African | 3 | 0.2% |
| Swedish | 17 | 1.2% |
| Welsh | 6 | 0.4% |
| Yakama | 17 | 1.2% | View All 32 Rows |
Immigrants in Mescal
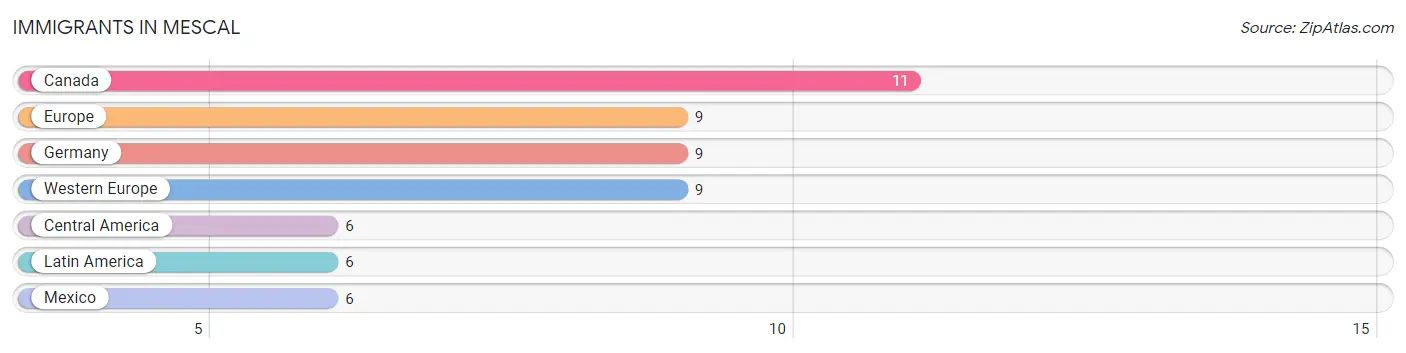
The most numerous immigrant groups reported in Mescal came from Canada (11 | 0.7%), Europe (9 | 0.6%), Germany (9 | 0.6%), Western Europe (9 | 0.6%), and Central America (6 | 0.4%), together accounting for 3.0% of all Mescal residents.
| Immigration Origin | # Population | % Population |
| Canada | 11 | 0.7% |
| Central America | 6 | 0.4% |
| Europe | 9 | 0.6% |
| Germany | 9 | 0.6% |
| Latin America | 6 | 0.4% |
| Mexico | 6 | 0.4% |
| Western Europe | 9 | 0.6% | View All 7 Rows |
Sex and Age in Mescal
Sex and Age in Mescal
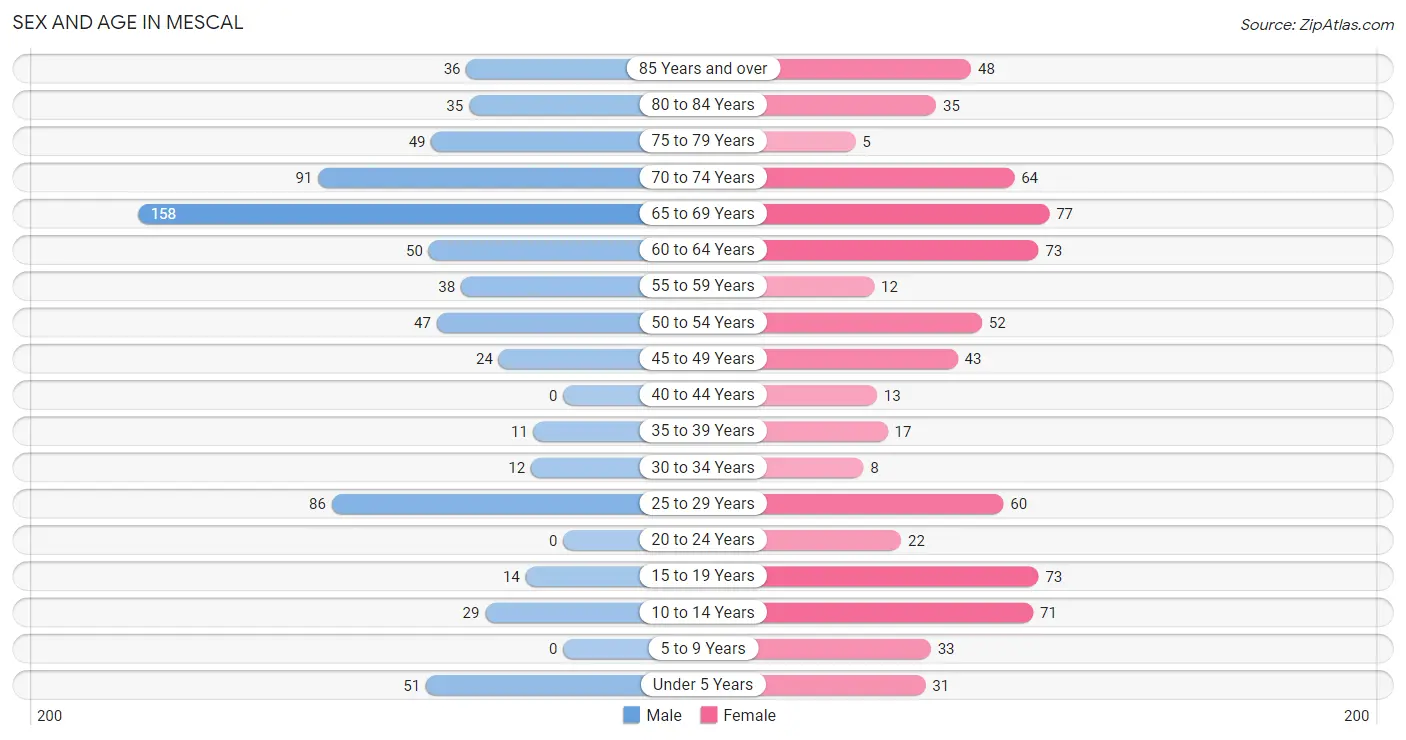
The most populous age groups in Mescal are 65 to 69 Years (158 | 21.6%) for men and 65 to 69 Years (77 | 10.4%) for women.
| Age Bracket | Male | Female |
| Under 5 Years | 51 (7.0%) | 31 (4.2%) |
| 5 to 9 Years | 0 (0.0%) | 33 (4.5%) |
| 10 to 14 Years | 29 (4.0%) | 71 (9.6%) |
| 15 to 19 Years | 14 (1.9%) | 73 (9.9%) |
| 20 to 24 Years | 0 (0.0%) | 22 (3.0%) |
| 25 to 29 Years | 86 (11.8%) | 60 (8.1%) |
| 30 to 34 Years | 12 (1.6%) | 8 (1.1%) |
| 35 to 39 Years | 11 (1.5%) | 17 (2.3%) |
| 40 to 44 Years | 0 (0.0%) | 13 (1.8%) |
| 45 to 49 Years | 24 (3.3%) | 43 (5.8%) |
| 50 to 54 Years | 47 (6.4%) | 52 (7.1%) |
| 55 to 59 Years | 38 (5.2%) | 12 (1.6%) |
| 60 to 64 Years | 50 (6.8%) | 73 (9.9%) |
| 65 to 69 Years | 158 (21.6%) | 77 (10.4%) |
| 70 to 74 Years | 91 (12.4%) | 64 (8.7%) |
| 75 to 79 Years | 49 (6.7%) | 5 (0.7%) |
| 80 to 84 Years | 35 (4.8%) | 35 (4.8%) |
| 85 Years and over | 36 (4.9%) | 48 (6.5%) |
| Total | 731 (100.0%) | 737 (100.0%) |
Families and Households in Mescal
Median Family Size in Mescal
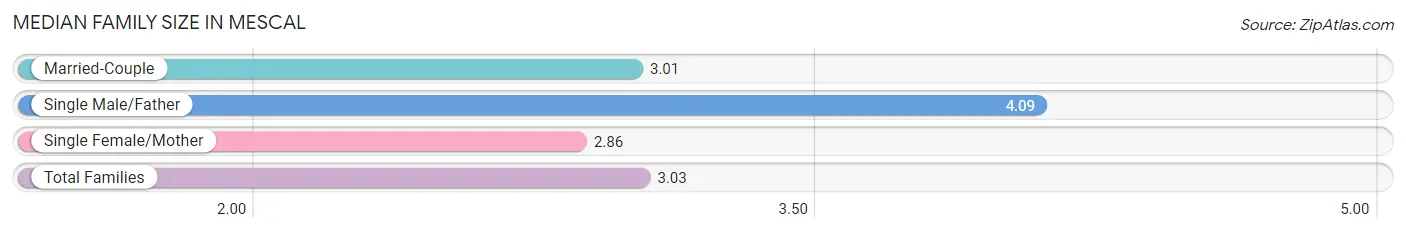
The median family size in Mescal is 3.03 persons per family, with single male/father families (11 | 2.8%) accounting for the largest median family size of 4.09 persons per family. On the other hand, single female/mother families (28 | 7.2%) represent the smallest median family size with 2.86 persons per family.
| Family Type | # Families | Family Size |
| Married-Couple | 349 (89.9%) | 3.01 |
| Single Male/Father | 11 (2.8%) | 4.09 |
| Single Female/Mother | 28 (7.2%) | 2.86 |
| Total Families | 388 (100.0%) | 3.03 |
Median Household Size in Mescal
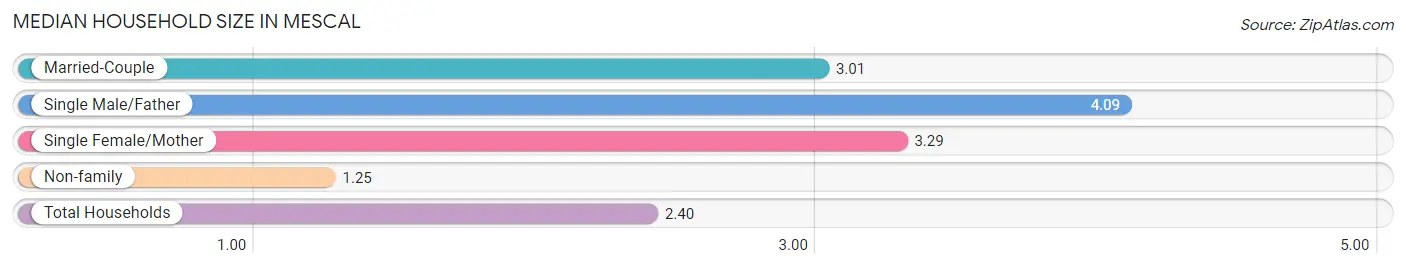
The median household size in Mescal is 2.40 persons per household, with single male/father households (11 | 1.8%) accounting for the largest median household size of 4.09 persons per household. non-family households (223 | 36.5%) represent the smallest median household size with 1.25 persons per household.
| Household Type | # Households | Household Size |
| Married-Couple | 349 (57.1%) | 3.01 |
| Single Male/Father | 11 (1.8%) | 4.09 |
| Single Female/Mother | 28 (4.6%) | 3.29 |
| Non-family | 223 (36.5%) | 1.25 |
| Total Households | 611 (100.0%) | 2.40 |
Household Size by Marriage Status in Mescal
Out of a total of 611 households in Mescal, 388 (63.5%) are family households, while 223 (36.5%) are nonfamily households. The most numerous type of family households are 2-person households, comprising 233, and the most common type of nonfamily households are 1-person households, comprising 154.
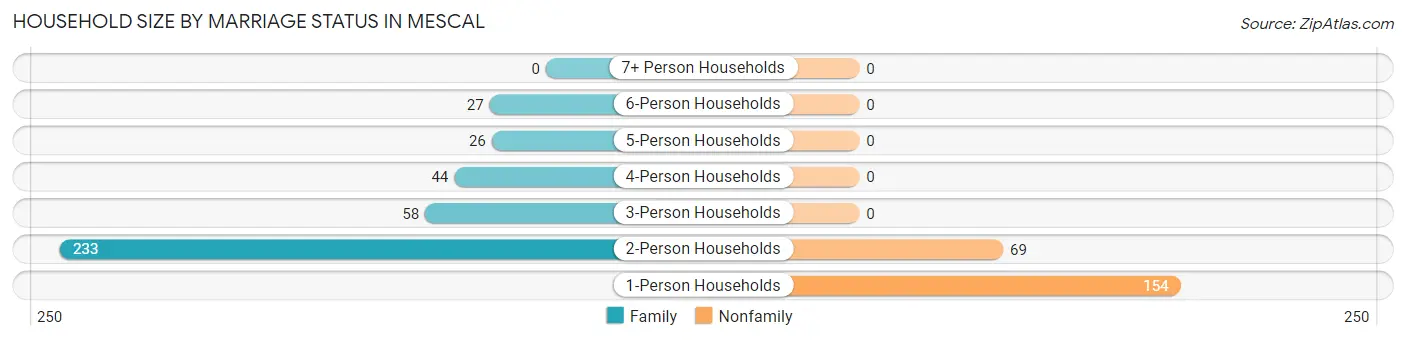
| Household Size | Family Households | Nonfamily Households |
| 1-Person Households | - | 154 (25.2%) |
| 2-Person Households | 233 (38.1%) | 69 (11.3%) |
| 3-Person Households | 58 (9.5%) | 0 (0.0%) |
| 4-Person Households | 44 (7.2%) | 0 (0.0%) |
| 5-Person Households | 26 (4.3%) | 0 (0.0%) |
| 6-Person Households | 27 (4.4%) | 0 (0.0%) |
| 7+ Person Households | 0 (0.0%) | 0 (0.0%) |
| Total | 388 (63.5%) | 223 (36.5%) |
Female Fertility in Mescal
Fertility by Age in Mescal
| Age Bracket | Women with Births | Births / 1,000 Women |
| 15 to 19 years | 0 (0.0%) | 0.0 |
| 20 to 34 years | 0 (0.0%) | 0.0 |
| 35 to 50 years | 0 (0.0%) | 0.0 |
| Total | 0 (0.0%) | 0.0 |
Fertility by Age by Marriage Status in Mescal
| Age Bracket | Married | Unmarried |
| 15 to 19 years | 0 (0.0%) | 0 (0.0%) |
| 20 to 34 years | 0 (0.0%) | 0 (0.0%) |
| 35 to 50 years | 0 (0.0%) | 0 (0.0%) |
| Total | 0 (0.0%) | 0 (0.0%) |
Fertility by Education in Mescal
| Educational Attainment | Women with Births | Births / 1,000 Women |
| Less than High School | 0 (0.0%) | 0.0 |
| High School Diploma | 0 (0.0%) | 0.0 |
| College or Associate's Degree | 0 (0.0%) | 0.0 |
| Bachelor's Degree | 0 (0.0%) | 0.0 |
| Graduate Degree | 0 (0.0%) | 0.0 |
| Total | 0 (0.0%) | 0.0 |
Fertility by Education by Marriage Status in Mescal
| Educational Attainment | Married | Unmarried |
| Less than High School | 0 (0.0%) | 0 (0.0%) |
| High School Diploma | 0 (0.0%) | 0 (0.0%) |
| College or Associate's Degree | 0 (0.0%) | 0 (0.0%) |
| Bachelor's Degree | 0 (0.0%) | 0 (0.0%) |
| Graduate Degree | 0 (0.0%) | 0 (0.0%) |
| Total | 0 (0.0%) | 0 (0.0%) |
Employment Characteristics in Mescal
Employment by Class of Employer in Mescal
Among the 456 employed individuals in Mescal, private company employees (294 | 64.5%), not-for-profit organizations (80 | 17.5%), and state government employees (32 | 7.0%) make up the most common classes of employment.
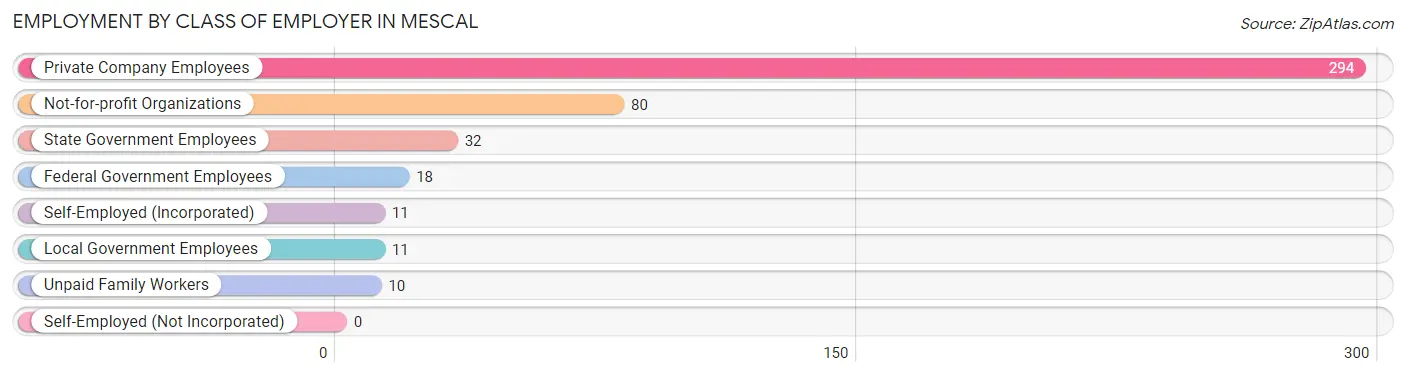
| Employer Class | # Employees | % Employees |
| Private Company Employees | 294 | 64.5% |
| Self-Employed (Incorporated) | 11 | 2.4% |
| Self-Employed (Not Incorporated) | 0 | 0.0% |
| Not-for-profit Organizations | 80 | 17.5% |
| Local Government Employees | 11 | 2.4% |
| State Government Employees | 32 | 7.0% |
| Federal Government Employees | 18 | 4.0% |
| Unpaid Family Workers | 10 | 2.2% |
| Total | 456 | 100.0% |
Employment Status by Age in Mescal
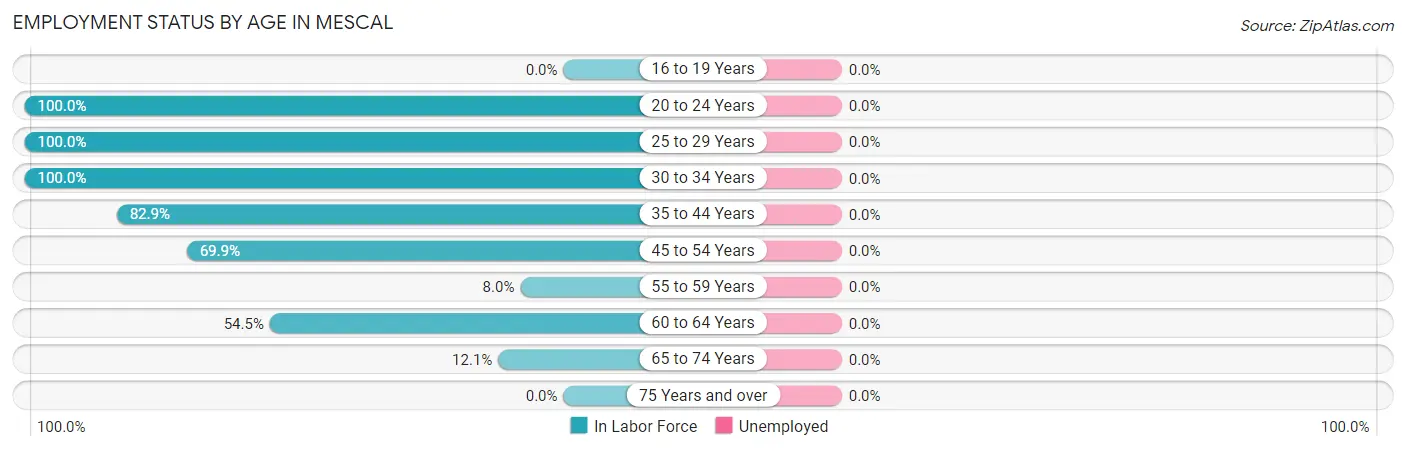
| Age Bracket | In Labor Force | Unemployed |
| 16 to 19 Years | 0 (0.0%) | 0 (0.0%) |
| 20 to 24 Years | 22 (100.0%) | 0 (0.0%) |
| 25 to 29 Years | 146 (100.0%) | 0 (0.0%) |
| 30 to 34 Years | 20 (100.0%) | 0 (0.0%) |
| 35 to 44 Years | 34 (82.9%) | 0 (0.0%) |
| 45 to 54 Years | 116 (69.9%) | 0 (0.0%) |
| 55 to 59 Years | 4 (8.0%) | 0 (0.0%) |
| 60 to 64 Years | 67 (54.5%) | 0 (0.0%) |
| 65 to 74 Years | 47 (12.1%) | 0 (0.0%) |
| 75 Years and over | 0 (0.0%) | 0 (0.0%) |
| Total | 456 (37.6%) | 0 (0.0%) |
Employment Status by Educational Attainment in Mescal
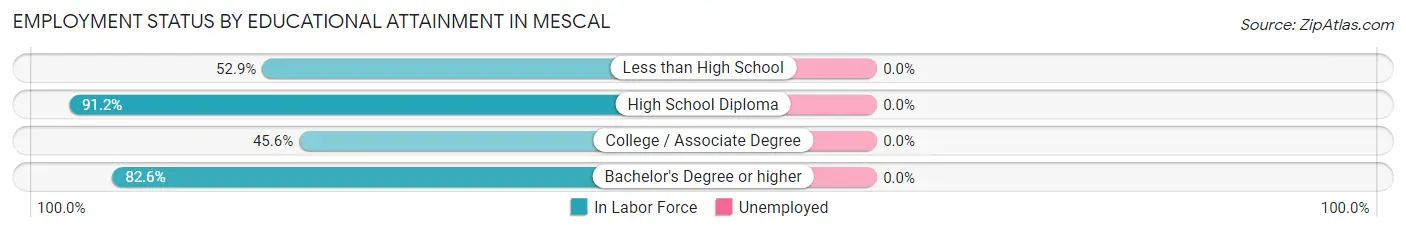
| Educational Attainment | In Labor Force | Unemployed |
| Less than High School | 9 (52.9%) | 0 (0.0%) |
| High School Diploma | 176 (91.2%) | 0 (0.0%) |
| College / Associate Degree | 93 (45.6%) | 0 (0.0%) |
| Bachelor's Degree or higher | 109 (82.6%) | 0 (0.0%) |
| Total | 387 (70.9%) | 0 (0.0%) |
Employment Occupations by Sex in Mescal
Management, Business, Science and Arts Occupations
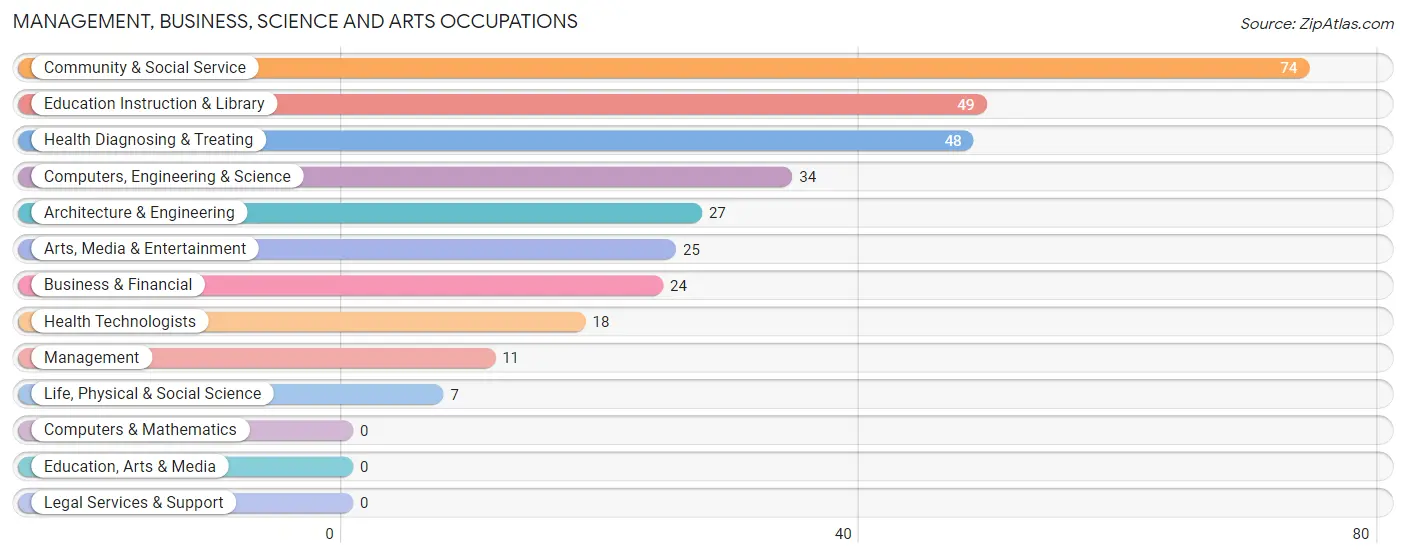
The most common Management, Business, Science and Arts occupations in Mescal are Community & Social Service (74 | 16.2%), Education Instruction & Library (49 | 10.7%), Health Diagnosing & Treating (48 | 10.5%), Computers, Engineering & Science (34 | 7.5%), and Architecture & Engineering (27 | 5.9%).
Management, Business, Science and Arts Occupations by Sex
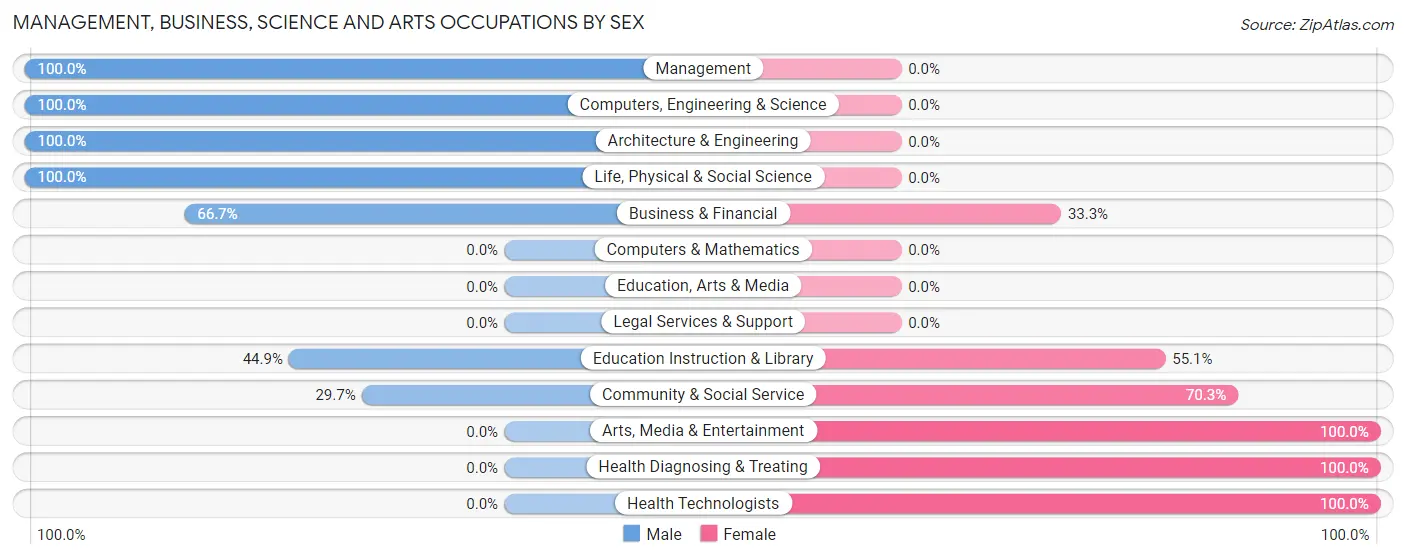
Within the Management, Business, Science and Arts occupations in Mescal, the most male-oriented occupations are Management (100.0%), Computers, Engineering & Science (100.0%), and Architecture & Engineering (100.0%), while the most female-oriented occupations are Arts, Media & Entertainment (100.0%), Health Diagnosing & Treating (100.0%), and Health Technologists (100.0%).
| Occupation | Male | Female |
| Management | 11 (100.0%) | 0 (0.0%) |
| Business & Financial | 16 (66.7%) | 8 (33.3%) |
| Computers, Engineering & Science | 34 (100.0%) | 0 (0.0%) |
| Computers & Mathematics | 0 (0.0%) | 0 (0.0%) |
| Architecture & Engineering | 27 (100.0%) | 0 (0.0%) |
| Life, Physical & Social Science | 7 (100.0%) | 0 (0.0%) |
| Community & Social Service | 22 (29.7%) | 52 (70.3%) |
| Education, Arts & Media | 0 (0.0%) | 0 (0.0%) |
| Legal Services & Support | 0 (0.0%) | 0 (0.0%) |
| Education Instruction & Library | 22 (44.9%) | 27 (55.1%) |
| Arts, Media & Entertainment | 0 (0.0%) | 25 (100.0%) |
| Health Diagnosing & Treating | 0 (0.0%) | 48 (100.0%) |
| Health Technologists | 0 (0.0%) | 18 (100.0%) |
| Total (Category) | 83 (43.5%) | 108 (56.5%) |
| Total (Overall) | 243 (53.3%) | 213 (46.7%) |
Services Occupations
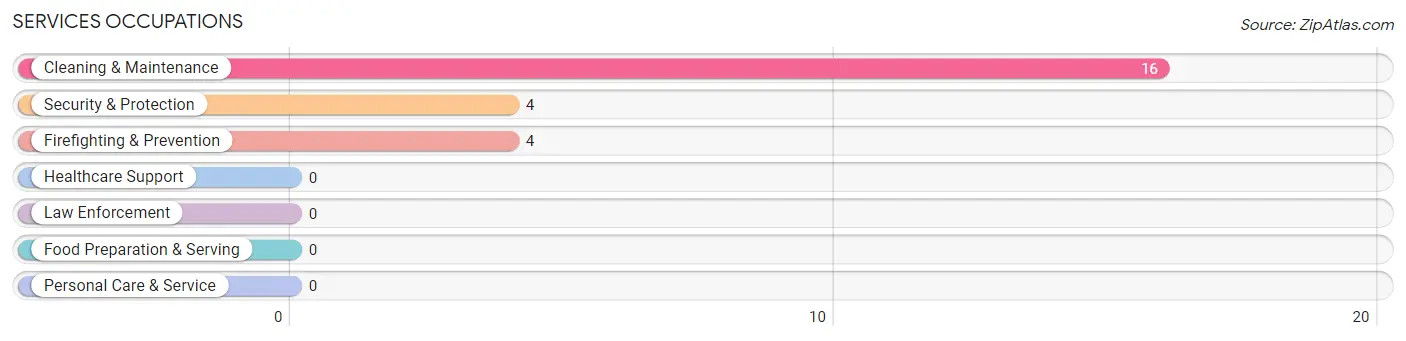
The most common Services occupations in Mescal are Cleaning & Maintenance (16 | 3.5%), Security & Protection (4 | 0.9%), and Firefighting & Prevention (4 | 0.9%).
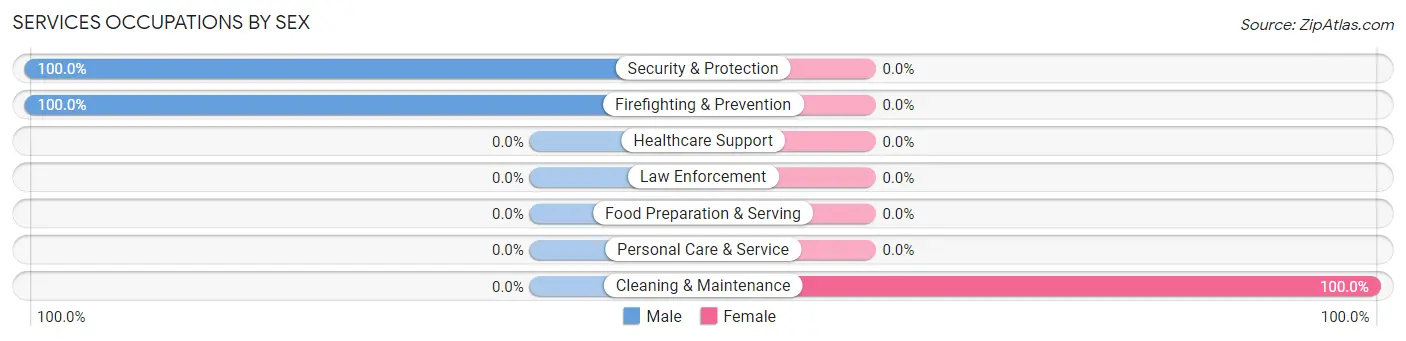
Services Occupations by Sex
| Occupation | Male | Female |
| Healthcare Support | 0 (0.0%) | 0 (0.0%) |
| Security & Protection | 4 (100.0%) | 0 (0.0%) |
| Firefighting & Prevention | 4 (100.0%) | 0 (0.0%) |
| Law Enforcement | 0 (0.0%) | 0 (0.0%) |
| Food Preparation & Serving | 0 (0.0%) | 0 (0.0%) |
| Cleaning & Maintenance | 0 (0.0%) | 16 (100.0%) |
| Personal Care & Service | 0 (0.0%) | 0 (0.0%) |
| Total (Category) | 4 (20.0%) | 16 (80.0%) |
| Total (Overall) | 243 (53.3%) | 213 (46.7%) |
Sales and Office Occupations
The most common Sales and Office occupations in Mescal are Sales & Related (73 | 16.0%), and Office & Administration (55 | 12.1%).
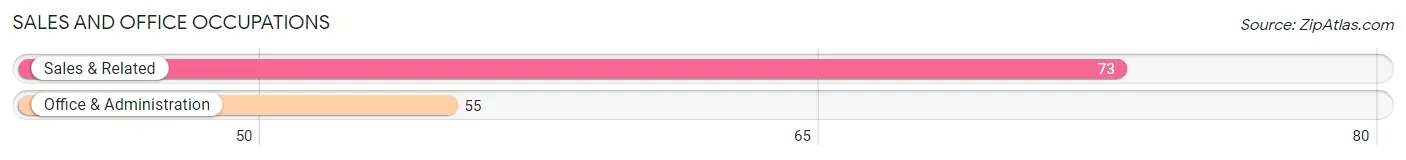
Sales and Office Occupations by Sex

| Occupation | Male | Female |
| Sales & Related | 52 (71.2%) | 21 (28.8%) |
| Office & Administration | 0 (0.0%) | 55 (100.0%) |
| Total (Category) | 52 (40.6%) | 76 (59.4%) |
| Total (Overall) | 243 (53.3%) | 213 (46.7%) |
Natural Resources, Construction and Maintenance Occupations
The most common Natural Resources, Construction and Maintenance occupations in Mescal are , and Installation, Maintenance & Repair (20 | 4.4%).
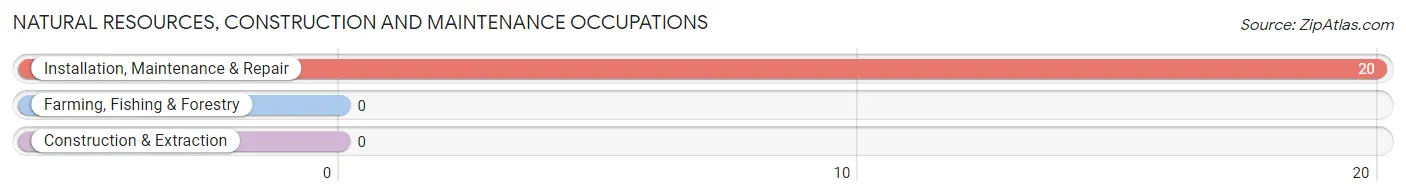
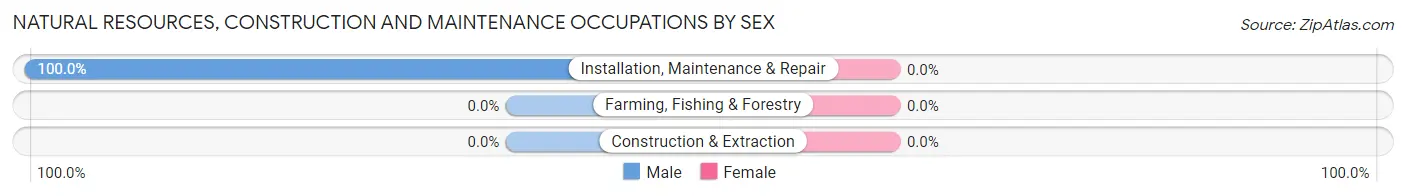
Natural Resources, Construction and Maintenance Occupations by Sex
| Occupation | Male | Female |
| Farming, Fishing & Forestry | 0 (0.0%) | 0 (0.0%) |
| Construction & Extraction | 0 (0.0%) | 0 (0.0%) |
| Installation, Maintenance & Repair | 20 (100.0%) | 0 (0.0%) |
| Total (Category) | 20 (100.0%) | 0 (0.0%) |
| Total (Overall) | 243 (53.3%) | 213 (46.7%) |
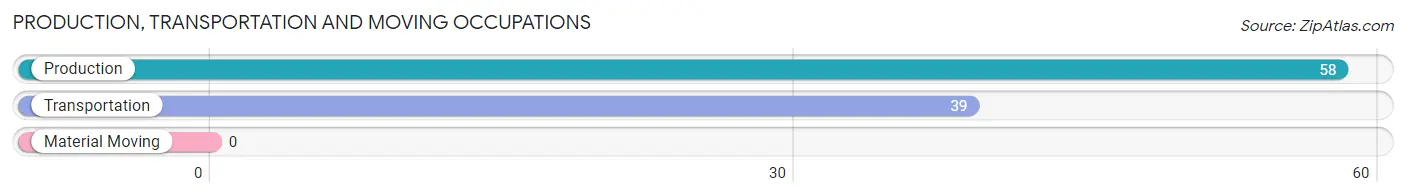
Production, Transportation and Moving Occupations
The most common Production, Transportation and Moving occupations in Mescal are Production (58 | 12.7%), and Transportation (39 | 8.6%).
Production, Transportation and Moving Occupations by Sex
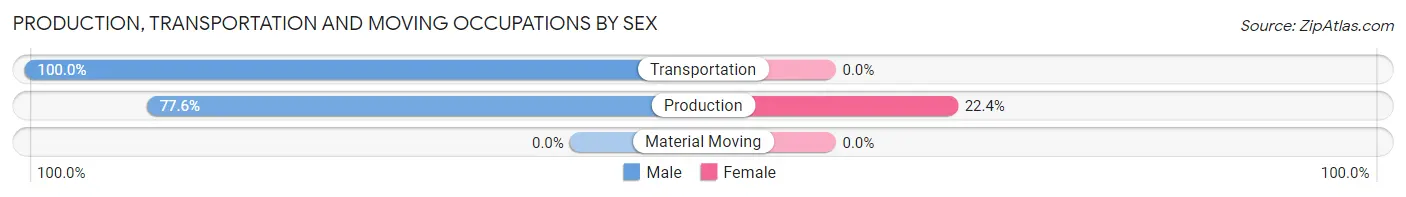
| Occupation | Male | Female |
| Production | 45 (77.6%) | 13 (22.4%) |
| Transportation | 39 (100.0%) | 0 (0.0%) |
| Material Moving | 0 (0.0%) | 0 (0.0%) |
| Total (Category) | 84 (86.6%) | 13 (13.4%) |
| Total (Overall) | 243 (53.3%) | 213 (46.7%) |
Employment Industries by Sex in Mescal
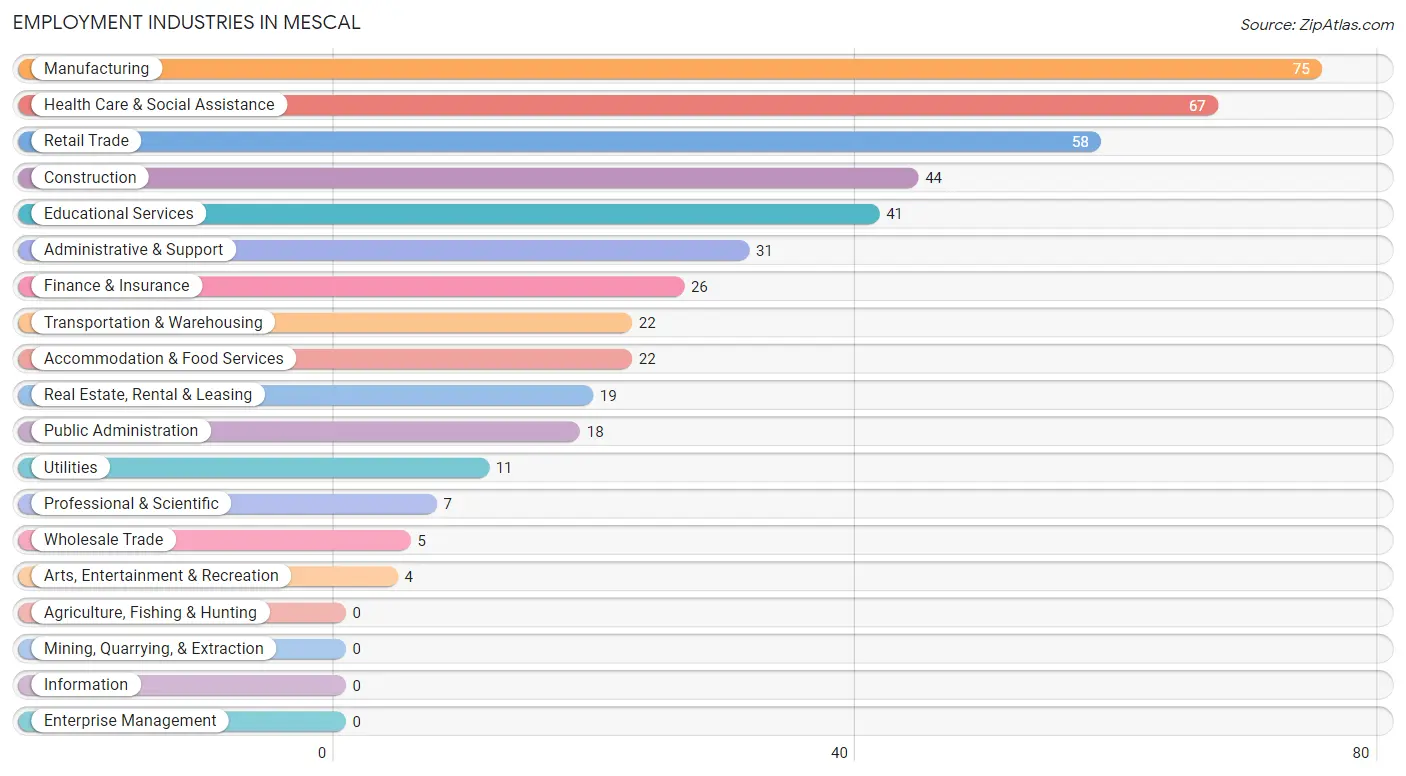
Employment Industries in Mescal
The major employment industries in Mescal include Manufacturing (75 | 16.5%), Health Care & Social Assistance (67 | 14.7%), Retail Trade (58 | 12.7%), Construction (44 | 9.7%), and Educational Services (41 | 9.0%).
Employment Industries by Sex in Mescal
The Mescal industries that see more men than women are Wholesale Trade (100.0%), Transportation & Warehousing (100.0%), and Utilities (100.0%), whereas the industries that tend to have a higher number of women are Professional & Scientific (100.0%), Administrative & Support (100.0%), and Health Care & Social Assistance (100.0%).
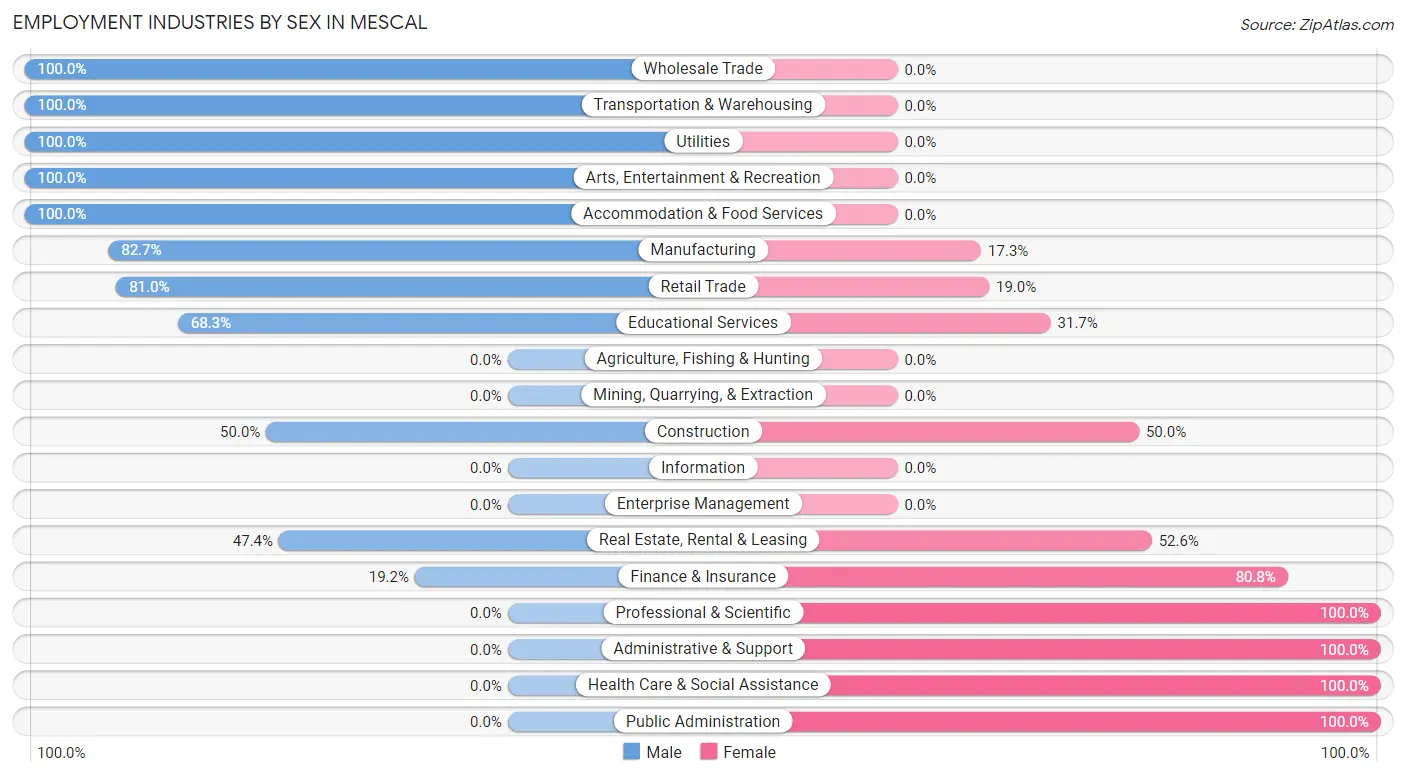
| Industry | Male | Female |
| Agriculture, Fishing & Hunting | 0 (0.0%) | 0 (0.0%) |
| Mining, Quarrying, & Extraction | 0 (0.0%) | 0 (0.0%) |
| Construction | 22 (50.0%) | 22 (50.0%) |
| Manufacturing | 62 (82.7%) | 13 (17.3%) |
| Wholesale Trade | 5 (100.0%) | 0 (0.0%) |
| Retail Trade | 47 (81.0%) | 11 (19.0%) |
| Transportation & Warehousing | 22 (100.0%) | 0 (0.0%) |
| Utilities | 11 (100.0%) | 0 (0.0%) |
| Information | 0 (0.0%) | 0 (0.0%) |
| Finance & Insurance | 5 (19.2%) | 21 (80.8%) |
| Real Estate, Rental & Leasing | 9 (47.4%) | 10 (52.6%) |
| Professional & Scientific | 0 (0.0%) | 7 (100.0%) |
| Enterprise Management | 0 (0.0%) | 0 (0.0%) |
| Administrative & Support | 0 (0.0%) | 31 (100.0%) |
| Educational Services | 28 (68.3%) | 13 (31.7%) |
| Health Care & Social Assistance | 0 (0.0%) | 67 (100.0%) |
| Arts, Entertainment & Recreation | 4 (100.0%) | 0 (0.0%) |
| Accommodation & Food Services | 22 (100.0%) | 0 (0.0%) |
| Public Administration | 0 (0.0%) | 18 (100.0%) |
| Total | 243 (53.3%) | 213 (46.7%) |
Education in Mescal
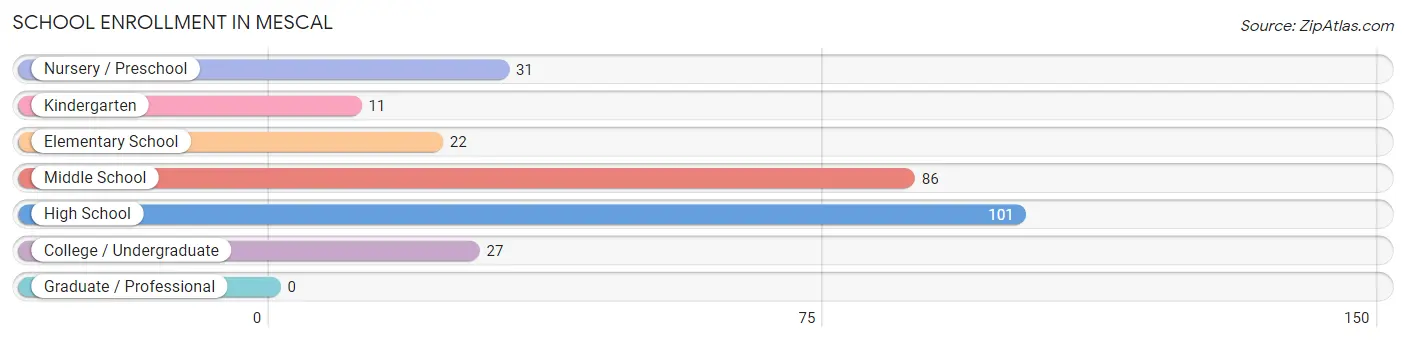
School Enrollment in Mescal
The most common levels of schooling among the 278 students in Mescal are high school (101 | 36.3%), middle school (86 | 30.9%), and nursery / preschool (31 | 11.2%).
| School Level | # Students | % Students |
| Nursery / Preschool | 31 | 11.2% |
| Kindergarten | 11 | 4.0% |
| Elementary School | 22 | 7.9% |
| Middle School | 86 | 30.9% |
| High School | 101 | 36.3% |
| College / Undergraduate | 27 | 9.7% |
| Graduate / Professional | 0 | 0.0% |
| Total | 278 | 100.0% |
School Enrollment by Age by Funding Source in Mescal
Out of a total of 278 students who are enrolled in schools in Mescal, 169 (60.8%) attend a private institution, while the remaining 109 (39.2%) are enrolled in public schools. The age group of 15 to 17 year olds has the highest likelihood of being enrolled in private schools, with 67 (77.0% in the age bracket) enrolled. Conversely, the age group of 35 years and over has the lowest likelihood of being enrolled in a private school, with 27 (100.0% in the age bracket) attending a public institution.
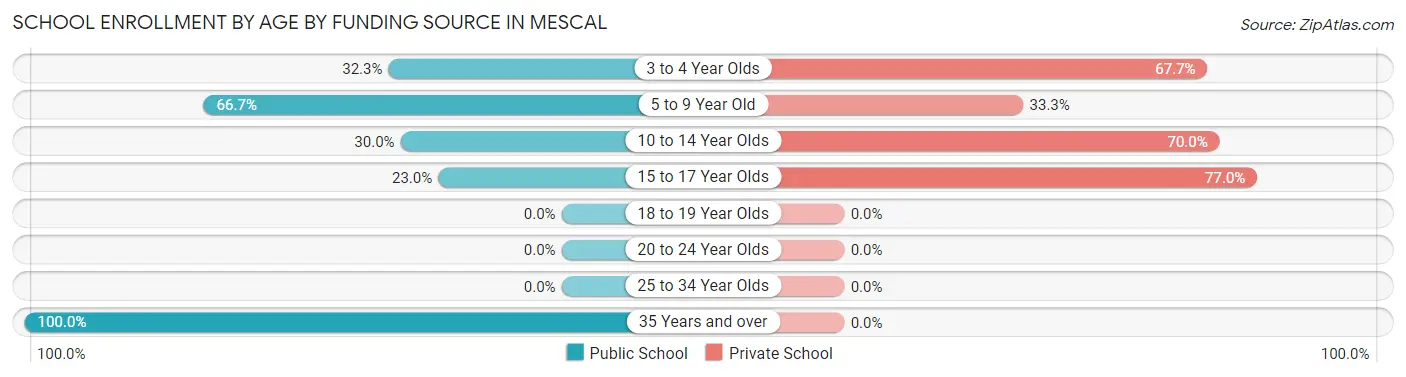
| Age Bracket | Public School | Private School |
| 3 to 4 Year Olds | 10 (32.3%) | 21 (67.7%) |
| 5 to 9 Year Old | 22 (66.7%) | 11 (33.3%) |
| 10 to 14 Year Olds | 30 (30.0%) | 70 (70.0%) |
| 15 to 17 Year Olds | 20 (23.0%) | 67 (77.0%) |
| 18 to 19 Year Olds | 0 (0.0%) | 0 (0.0%) |
| 20 to 24 Year Olds | 0 (0.0%) | 0 (0.0%) |
| 25 to 34 Year Olds | 0 (0.0%) | 0 (0.0%) |
| 35 Years and over | 27 (100.0%) | 0 (0.0%) |
| Total | 109 (39.2%) | 169 (60.8%) |
Educational Attainment by Field of Study in Mescal
Education (71 | 28.5%), bio, nature & agricultural (45 | 18.1%), social sciences (29 | 11.7%), engineering (27 | 10.8%), and computers & mathematics (26 | 10.4%) are the most common fields of study among 249 individuals in Mescal who have obtained a bachelor's degree or higher.
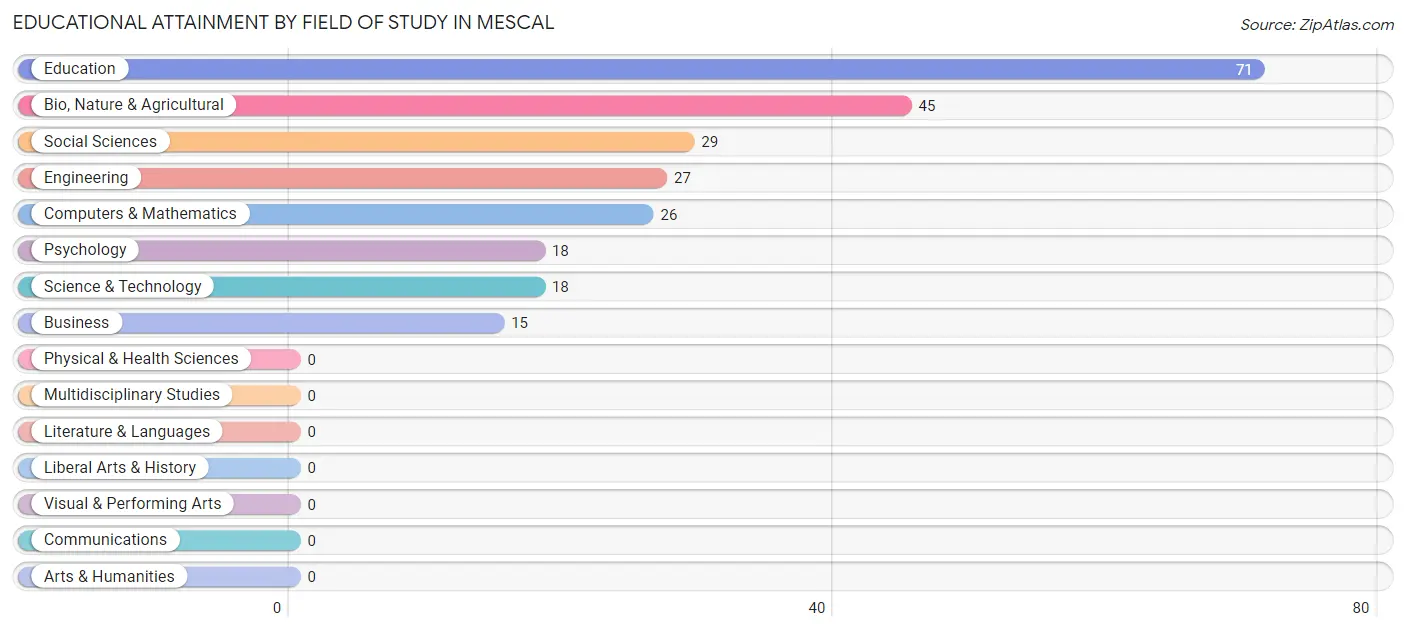
| Field of Study | # Graduates | % Graduates |
| Computers & Mathematics | 26 | 10.4% |
| Bio, Nature & Agricultural | 45 | 18.1% |
| Physical & Health Sciences | 0 | 0.0% |
| Psychology | 18 | 7.2% |
| Social Sciences | 29 | 11.7% |
| Engineering | 27 | 10.8% |
| Multidisciplinary Studies | 0 | 0.0% |
| Science & Technology | 18 | 7.2% |
| Business | 15 | 6.0% |
| Education | 71 | 28.5% |
| Literature & Languages | 0 | 0.0% |
| Liberal Arts & History | 0 | 0.0% |
| Visual & Performing Arts | 0 | 0.0% |
| Communications | 0 | 0.0% |
| Arts & Humanities | 0 | 0.0% |
| Total | 249 | 100.0% |
Transportation & Commute in Mescal
Vehicle Availability by Sex in Mescal
The most prevalent vehicle ownership categories in Mescal are males with 2 vehicles (101, accounting for 41.6%) and females with 2 vehicles (118, making up 47.4%).
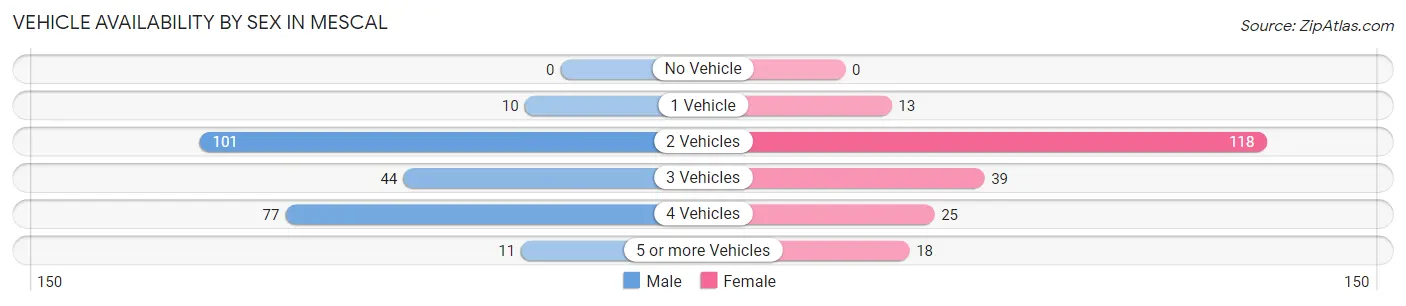
| Vehicles Available | Male | Female |
| No Vehicle | 0 (0.0%) | 0 (0.0%) |
| 1 Vehicle | 10 (4.1%) | 13 (6.1%) |
| 2 Vehicles | 101 (41.6%) | 118 (55.4%) |
| 3 Vehicles | 44 (18.1%) | 39 (18.3%) |
| 4 Vehicles | 77 (31.7%) | 25 (11.7%) |
| 5 or more Vehicles | 11 (4.5%) | 18 (8.5%) |
| Total | 243 (100.0%) | 213 (100.0%) |
Commute Time in Mescal
The most frequently occuring commute durations in Mescal are 45 to 59 minutes (62 commuters, 18.2%), 15 to 19 minutes (45 commuters, 13.2%), and 30 to 34 minutes (45 commuters, 13.2%).
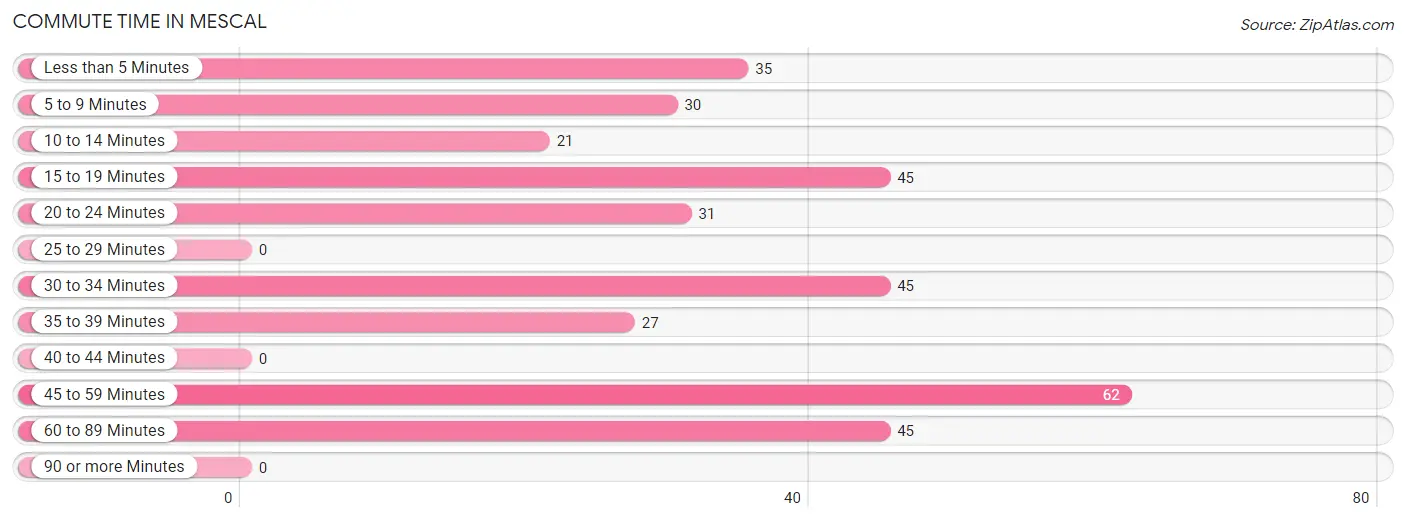
| Commute Time | # Commuters | % Commuters |
| Less than 5 Minutes | 35 | 10.3% |
| 5 to 9 Minutes | 30 | 8.8% |
| 10 to 14 Minutes | 21 | 6.2% |
| 15 to 19 Minutes | 45 | 13.2% |
| 20 to 24 Minutes | 31 | 9.1% |
| 25 to 29 Minutes | 0 | 0.0% |
| 30 to 34 Minutes | 45 | 13.2% |
| 35 to 39 Minutes | 27 | 7.9% |
| 40 to 44 Minutes | 0 | 0.0% |
| 45 to 59 Minutes | 62 | 18.2% |
| 60 to 89 Minutes | 45 | 13.2% |
| 90 or more Minutes | 0 | 0.0% |
Commute Time by Sex in Mescal
The most common commute times in Mescal are 60 to 89 minutes (45 commuters, 23.9%) for males and 30 to 34 minutes (45 commuters, 29.4%) for females.
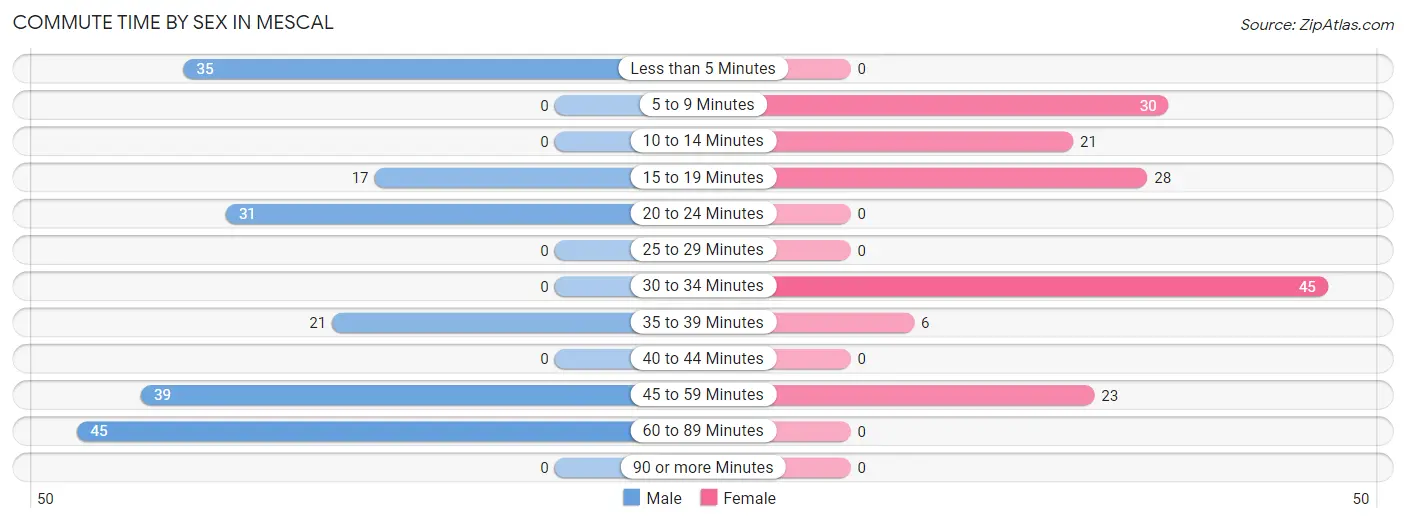
| Commute Time | Male | Female |
| Less than 5 Minutes | 35 (18.6%) | 0 (0.0%) |
| 5 to 9 Minutes | 0 (0.0%) | 30 (19.6%) |
| 10 to 14 Minutes | 0 (0.0%) | 21 (13.7%) |
| 15 to 19 Minutes | 17 (9.0%) | 28 (18.3%) |
| 20 to 24 Minutes | 31 (16.5%) | 0 (0.0%) |
| 25 to 29 Minutes | 0 (0.0%) | 0 (0.0%) |
| 30 to 34 Minutes | 0 (0.0%) | 45 (29.4%) |
| 35 to 39 Minutes | 21 (11.2%) | 6 (3.9%) |
| 40 to 44 Minutes | 0 (0.0%) | 0 (0.0%) |
| 45 to 59 Minutes | 39 (20.7%) | 23 (15.0%) |
| 60 to 89 Minutes | 45 (23.9%) | 0 (0.0%) |
| 90 or more Minutes | 0 (0.0%) | 0 (0.0%) |
Time of Departure to Work by Sex in Mescal
The most frequent times of departure to work in Mescal are 6:00 AM to 6:29 AM (69, 36.7%) for males and 12:00 PM to 3:59 PM (30, 19.6%) for females.
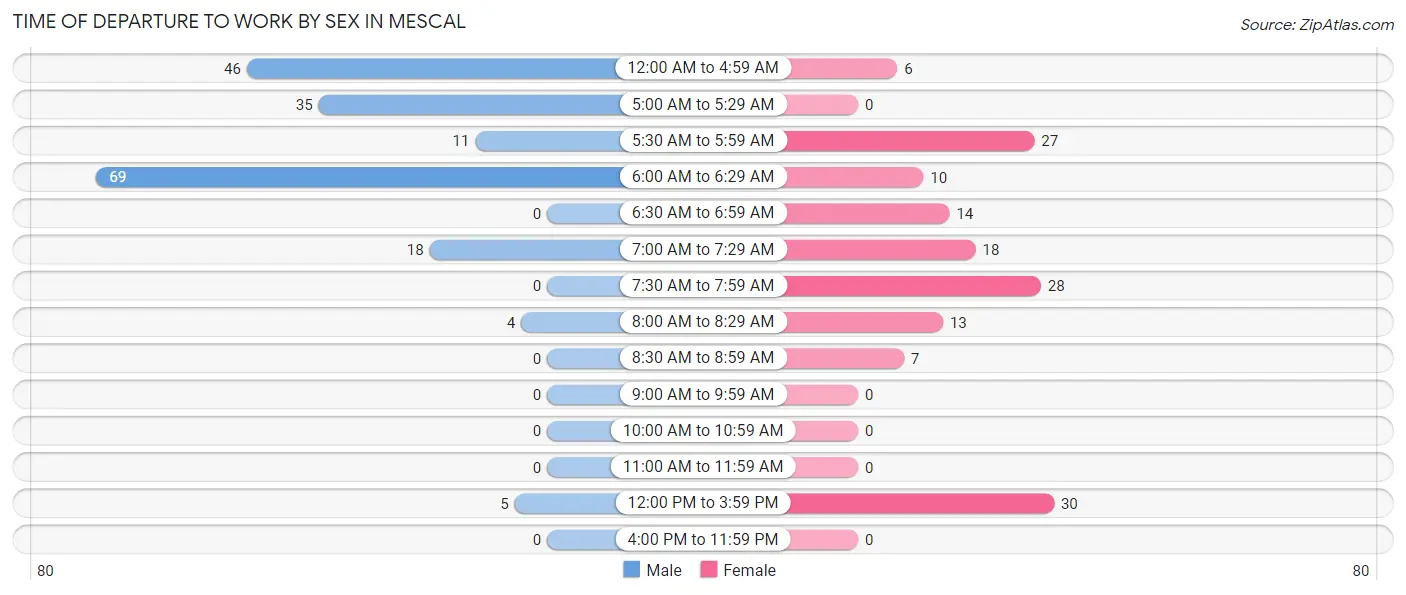
| Time of Departure | Male | Female |
| 12:00 AM to 4:59 AM | 46 (24.5%) | 6 (3.9%) |
| 5:00 AM to 5:29 AM | 35 (18.6%) | 0 (0.0%) |
| 5:30 AM to 5:59 AM | 11 (5.9%) | 27 (17.6%) |
| 6:00 AM to 6:29 AM | 69 (36.7%) | 10 (6.5%) |
| 6:30 AM to 6:59 AM | 0 (0.0%) | 14 (9.1%) |
| 7:00 AM to 7:29 AM | 18 (9.6%) | 18 (11.8%) |
| 7:30 AM to 7:59 AM | 0 (0.0%) | 28 (18.3%) |
| 8:00 AM to 8:29 AM | 4 (2.1%) | 13 (8.5%) |
| 8:30 AM to 8:59 AM | 0 (0.0%) | 7 (4.6%) |
| 9:00 AM to 9:59 AM | 0 (0.0%) | 0 (0.0%) |
| 10:00 AM to 10:59 AM | 0 (0.0%) | 0 (0.0%) |
| 11:00 AM to 11:59 AM | 0 (0.0%) | 0 (0.0%) |
| 12:00 PM to 3:59 PM | 5 (2.7%) | 30 (19.6%) |
| 4:00 PM to 11:59 PM | 0 (0.0%) | 0 (0.0%) |
| Total | 188 (100.0%) | 153 (100.0%) |
Housing Occupancy in Mescal
Occupancy by Ownership in Mescal
Of the total 611 dwellings in Mescal, owner-occupied units account for 543 (88.9%), while renter-occupied units make up 68 (11.1%).
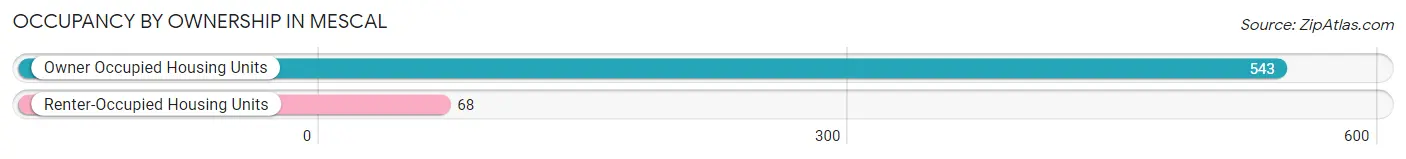
| Occupancy | # Housing Units | % Housing Units |
| Owner Occupied Housing Units | 543 | 88.9% |
| Renter-Occupied Housing Units | 68 | 11.1% |
| Total Occupied Housing Units | 611 | 100.0% |
Occupancy by Household Size in Mescal
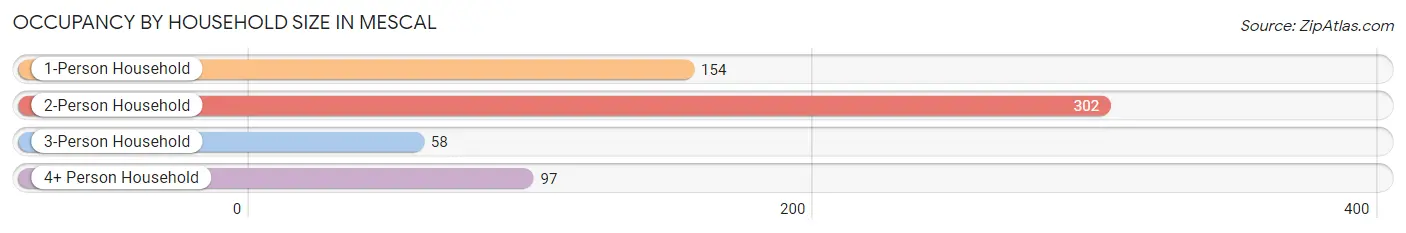
| Household Size | # Housing Units | % Housing Units |
| 1-Person Household | 154 | 25.2% |
| 2-Person Household | 302 | 49.4% |
| 3-Person Household | 58 | 9.5% |
| 4+ Person Household | 97 | 15.9% |
| Total Housing Units | 611 | 100.0% |
Occupancy by Ownership by Household Size in Mescal
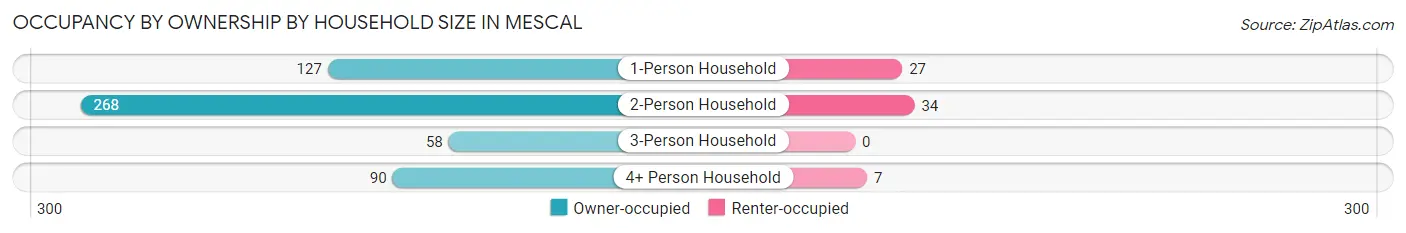
| Household Size | Owner-occupied | Renter-occupied |
| 1-Person Household | 127 (82.5%) | 27 (17.5%) |
| 2-Person Household | 268 (88.7%) | 34 (11.3%) |
| 3-Person Household | 58 (100.0%) | 0 (0.0%) |
| 4+ Person Household | 90 (92.8%) | 7 (7.2%) |
| Total Housing Units | 543 (88.9%) | 68 (11.1%) |
Occupancy by Educational Attainment in Mescal
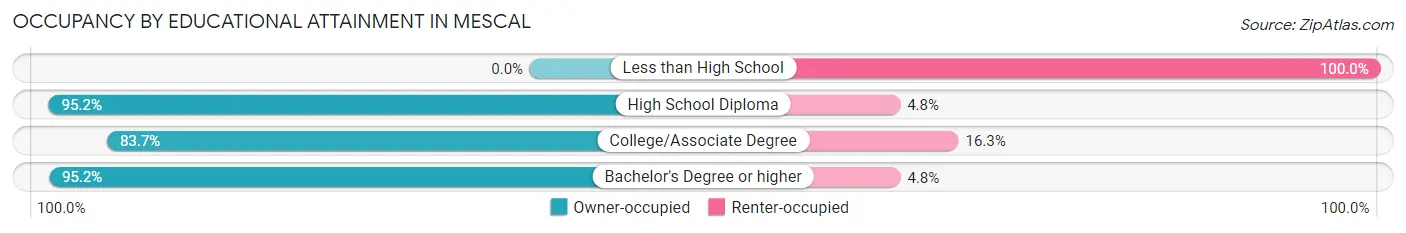
| Household Size | Owner-occupied | Renter-occupied |
| Less than High School | 0 (0.0%) | 11 (100.0%) |
| High School Diploma | 200 (95.2%) | 10 (4.8%) |
| College/Associate Degree | 205 (83.7%) | 40 (16.3%) |
| Bachelor's Degree or higher | 138 (95.2%) | 7 (4.8%) |
Occupancy by Age of Householder in Mescal
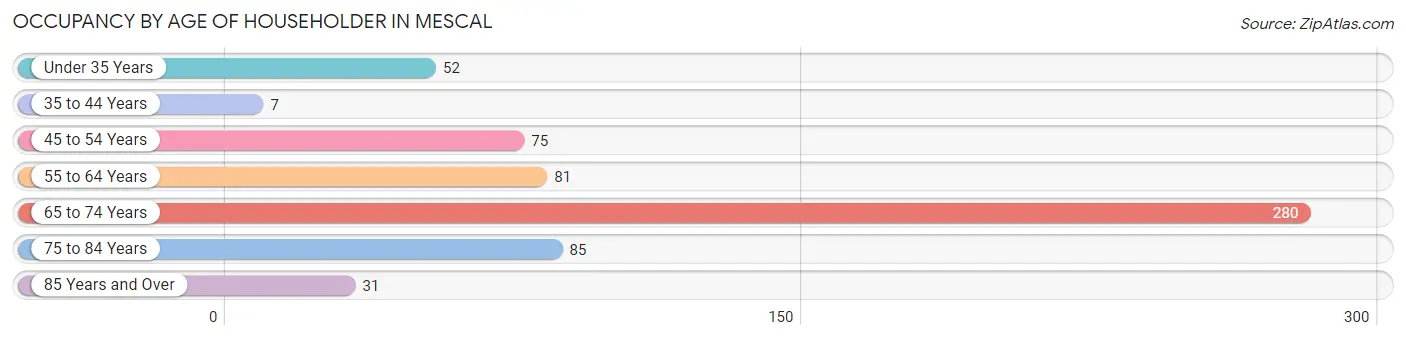
| Age Bracket | # Households | % Households |
| Under 35 Years | 52 | 8.5% |
| 35 to 44 Years | 7 | 1.1% |
| 45 to 54 Years | 75 | 12.3% |
| 55 to 64 Years | 81 | 13.3% |
| 65 to 74 Years | 280 | 45.8% |
| 75 to 84 Years | 85 | 13.9% |
| 85 Years and Over | 31 | 5.1% |
| Total | 611 | 100.0% |
Housing Finances in Mescal
Median Income by Occupancy in Mescal
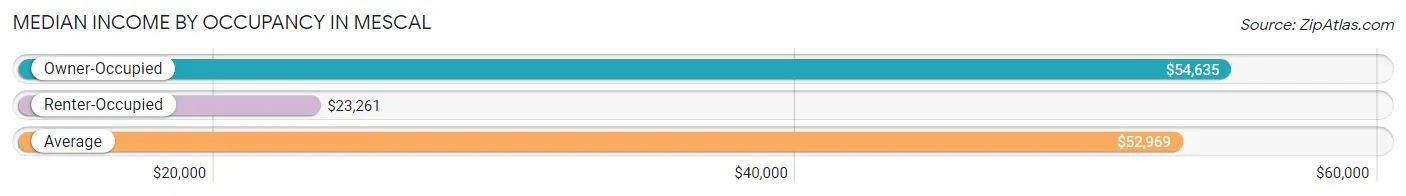
| Occupancy Type | # Households | Median Income |
| Owner-Occupied | 543 (88.9%) | $54,635 |
| Renter-Occupied | 68 (11.1%) | $23,261 |
| Average | 611 (100.0%) | $52,969 |
Occupancy by Householder Income Bracket in Mescal
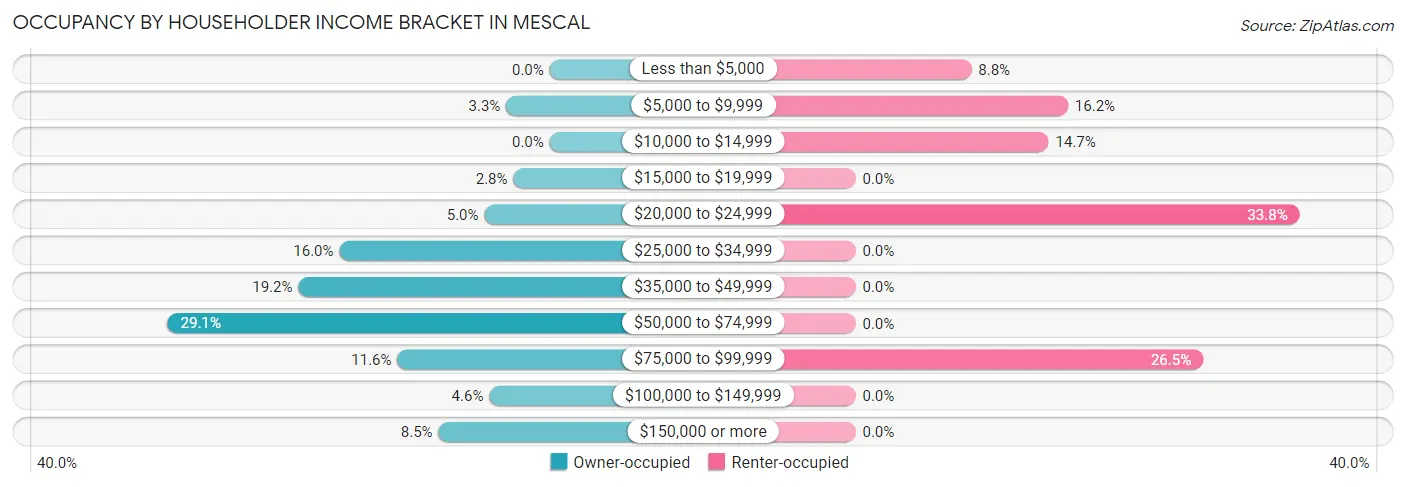
| Income Bracket | Owner-occupied | Renter-occupied |
| Less than $5,000 | 0 (0.0%) | 6 (8.8%) |
| $5,000 to $9,999 | 18 (3.3%) | 11 (16.2%) |
| $10,000 to $14,999 | 0 (0.0%) | 10 (14.7%) |
| $15,000 to $19,999 | 15 (2.8%) | 0 (0.0%) |
| $20,000 to $24,999 | 27 (5.0%) | 23 (33.8%) |
| $25,000 to $34,999 | 87 (16.0%) | 0 (0.0%) |
| $35,000 to $49,999 | 104 (19.2%) | 0 (0.0%) |
| $50,000 to $74,999 | 158 (29.1%) | 0 (0.0%) |
| $75,000 to $99,999 | 63 (11.6%) | 18 (26.5%) |
| $100,000 to $149,999 | 25 (4.6%) | 0 (0.0%) |
| $150,000 or more | 46 (8.5%) | 0 (0.0%) |
| Total | 543 (100.0%) | 68 (100.0%) |
Monthly Housing Cost Tiers in Mescal
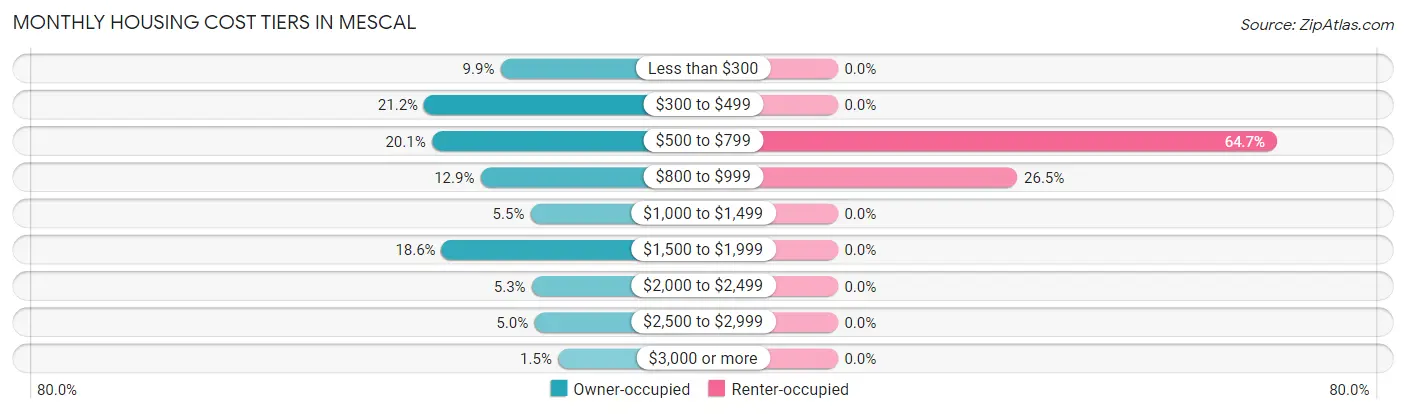
| Monthly Cost | Owner-occupied | Renter-occupied |
| Less than $300 | 54 (9.9%) | 0 (0.0%) |
| $300 to $499 | 115 (21.2%) | 0 (0.0%) |
| $500 to $799 | 109 (20.1%) | 44 (64.7%) |
| $800 to $999 | 70 (12.9%) | 18 (26.5%) |
| $1,000 to $1,499 | 30 (5.5%) | 0 (0.0%) |
| $1,500 to $1,999 | 101 (18.6%) | 0 (0.0%) |
| $2,000 to $2,499 | 29 (5.3%) | 0 (0.0%) |
| $2,500 to $2,999 | 27 (5.0%) | 0 (0.0%) |
| $3,000 or more | 8 (1.5%) | 0 (0.0%) |
| Total | 543 (100.0%) | 68 (100.0%) |
Physical Housing Characteristics in Mescal
Housing Structures in Mescal
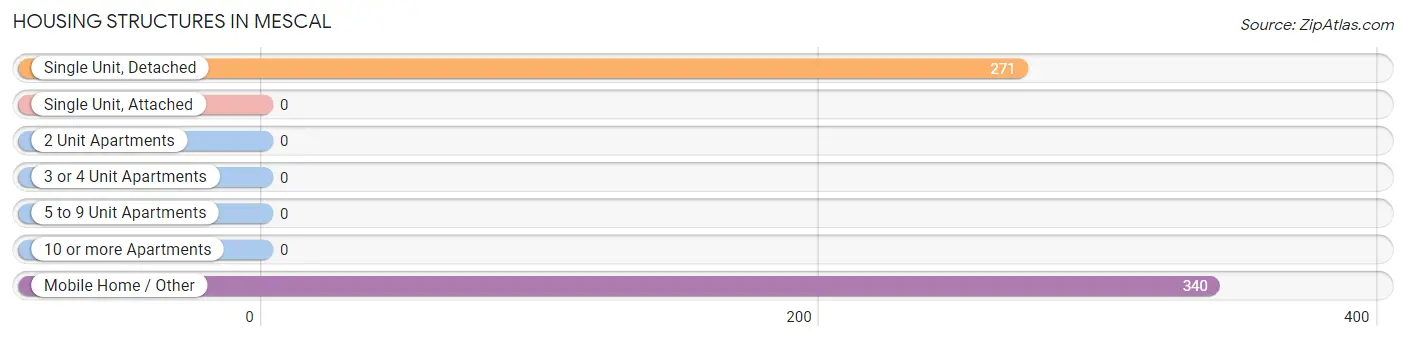
| Structure Type | # Housing Units | % Housing Units |
| Single Unit, Detached | 271 | 44.4% |
| Single Unit, Attached | 0 | 0.0% |
| 2 Unit Apartments | 0 | 0.0% |
| 3 or 4 Unit Apartments | 0 | 0.0% |
| 5 to 9 Unit Apartments | 0 | 0.0% |
| 10 or more Apartments | 0 | 0.0% |
| Mobile Home / Other | 340 | 55.6% |
| Total | 611 | 100.0% |
Housing Structures by Occupancy in Mescal
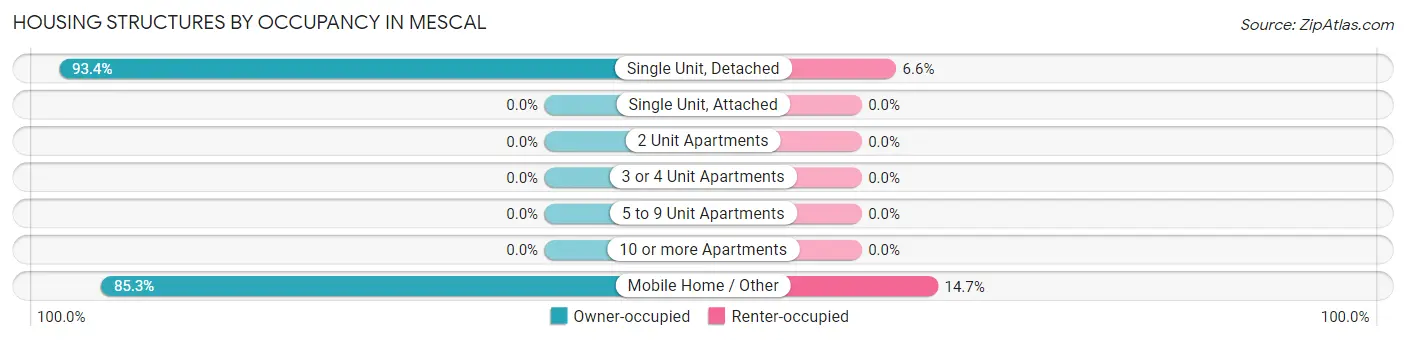
| Structure Type | Owner-occupied | Renter-occupied |
| Single Unit, Detached | 253 (93.4%) | 18 (6.6%) |
| Single Unit, Attached | 0 (0.0%) | 0 (0.0%) |
| 2 Unit Apartments | 0 (0.0%) | 0 (0.0%) |
| 3 or 4 Unit Apartments | 0 (0.0%) | 0 (0.0%) |
| 5 to 9 Unit Apartments | 0 (0.0%) | 0 (0.0%) |
| 10 or more Apartments | 0 (0.0%) | 0 (0.0%) |
| Mobile Home / Other | 290 (85.3%) | 50 (14.7%) |
| Total | 543 (88.9%) | 68 (11.1%) |
Housing Structures by Number of Rooms in Mescal
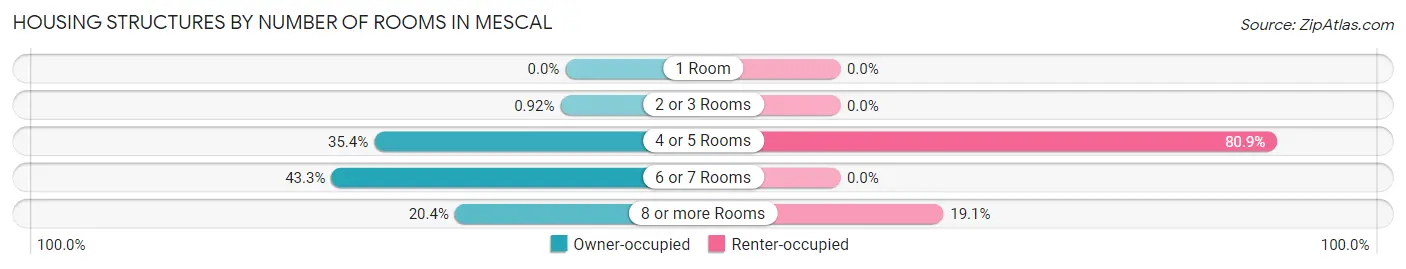
| Number of Rooms | Owner-occupied | Renter-occupied |
| 1 Room | 0 (0.0%) | 0 (0.0%) |
| 2 or 3 Rooms | 5 (0.9%) | 0 (0.0%) |
| 4 or 5 Rooms | 192 (35.4%) | 55 (80.9%) |
| 6 or 7 Rooms | 235 (43.3%) | 0 (0.0%) |
| 8 or more Rooms | 111 (20.4%) | 13 (19.1%) |
| Total | 543 (100.0%) | 68 (100.0%) |
Housing Structure by Heating Type in Mescal
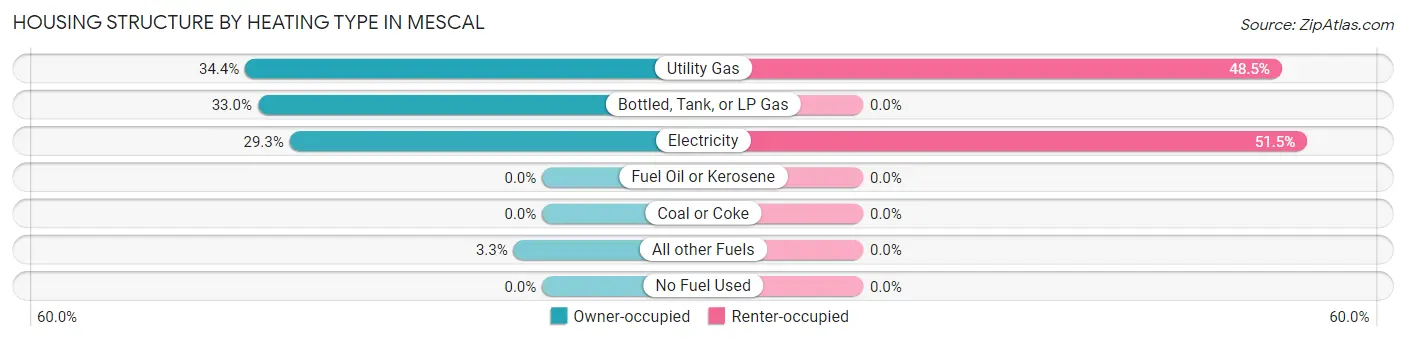
| Heating Type | Owner-occupied | Renter-occupied |
| Utility Gas | 187 (34.4%) | 33 (48.5%) |
| Bottled, Tank, or LP Gas | 179 (33.0%) | 0 (0.0%) |
| Electricity | 159 (29.3%) | 35 (51.5%) |
| Fuel Oil or Kerosene | 0 (0.0%) | 0 (0.0%) |
| Coal or Coke | 0 (0.0%) | 0 (0.0%) |
| All other Fuels | 18 (3.3%) | 0 (0.0%) |
| No Fuel Used | 0 (0.0%) | 0 (0.0%) |
| Total | 543 (100.0%) | 68 (100.0%) |
Household Vehicle Usage in Mescal
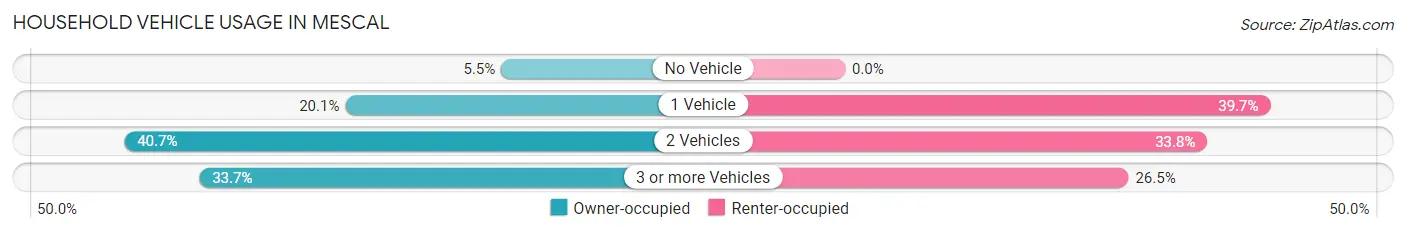
| Vehicles per Household | Owner-occupied | Renter-occupied |
| No Vehicle | 30 (5.5%) | 0 (0.0%) |
| 1 Vehicle | 109 (20.1%) | 27 (39.7%) |
| 2 Vehicles | 221 (40.7%) | 23 (33.8%) |
| 3 or more Vehicles | 183 (33.7%) | 18 (26.5%) |
| Total | 543 (100.0%) | 68 (100.0%) |
Real Estate & Mortgages in Mescal
Real Estate and Mortgage Overview in Mescal
| Characteristic | Without Mortgage | With Mortgage |
| Housing Units | 211 | 332 |
| Median Property Value | $104,700 | $170,400 |
| Median Household Income | $42,240 | $34 |
| Monthly Housing Costs | $340 | $8 |
| Real Estate Taxes | $1,044 | $11 |
Property Value by Mortgage Status in Mescal
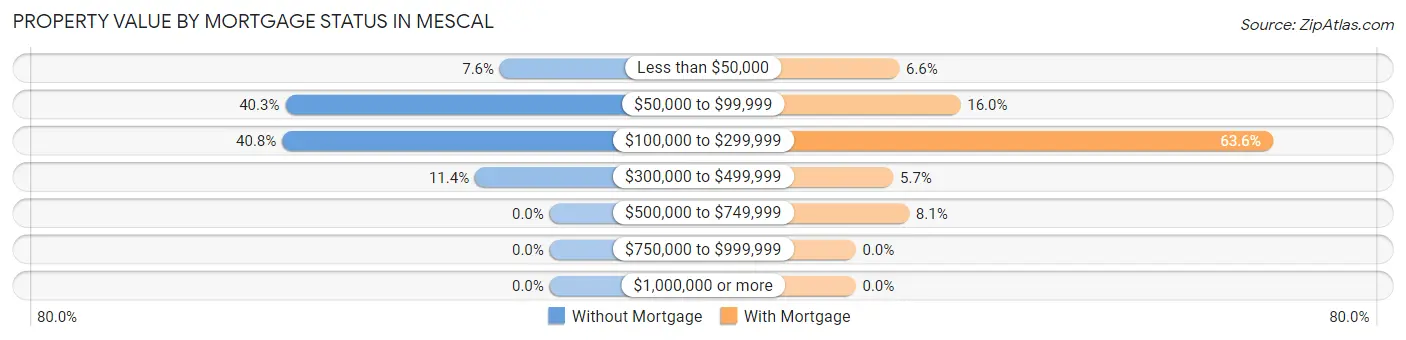
| Property Value | Without Mortgage | With Mortgage |
| Less than $50,000 | 16 (7.6%) | 22 (6.6%) |
| $50,000 to $99,999 | 85 (40.3%) | 53 (16.0%) |
| $100,000 to $299,999 | 86 (40.8%) | 211 (63.5%) |
| $300,000 to $499,999 | 24 (11.4%) | 19 (5.7%) |
| $500,000 to $749,999 | 0 (0.0%) | 27 (8.1%) |
| $750,000 to $999,999 | 0 (0.0%) | 0 (0.0%) |
| $1,000,000 or more | 0 (0.0%) | 0 (0.0%) |
| Total | 211 (100.0%) | 332 (100.0%) |
Household Income by Mortgage Status in Mescal
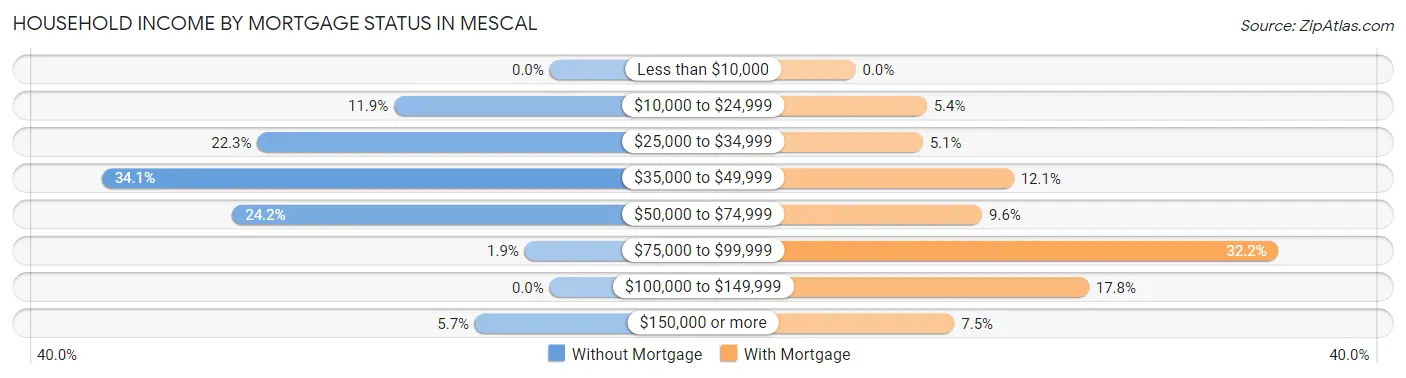
| Household Income | Without Mortgage | With Mortgage |
| Less than $10,000 | 0 (0.0%) | 0 (0.0%) |
| $10,000 to $24,999 | 25 (11.8%) | 18 (5.4%) |
| $25,000 to $34,999 | 47 (22.3%) | 17 (5.1%) |
| $35,000 to $49,999 | 72 (34.1%) | 40 (12.0%) |
| $50,000 to $74,999 | 51 (24.2%) | 32 (9.6%) |
| $75,000 to $99,999 | 4 (1.9%) | 107 (32.2%) |
| $100,000 to $149,999 | 0 (0.0%) | 59 (17.8%) |
| $150,000 or more | 12 (5.7%) | 25 (7.5%) |
| Total | 211 (100.0%) | 332 (100.0%) |
Property Value to Household Income Ratio in Mescal
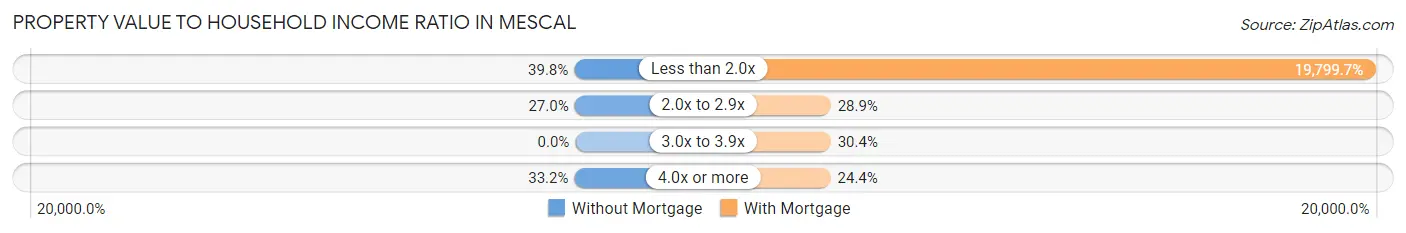
| Value-to-Income Ratio | Without Mortgage | With Mortgage |
| Less than 2.0x | 84 (39.8%) | 65,735 (19,799.7%) |
| 2.0x to 2.9x | 57 (27.0%) | 96 (28.9%) |
| 3.0x to 3.9x | 0 (0.0%) | 101 (30.4%) |
| 4.0x or more | 70 (33.2%) | 81 (24.4%) |
| Total | 211 (100.0%) | 332 (100.0%) |
Real Estate Taxes by Mortgage Status in Mescal
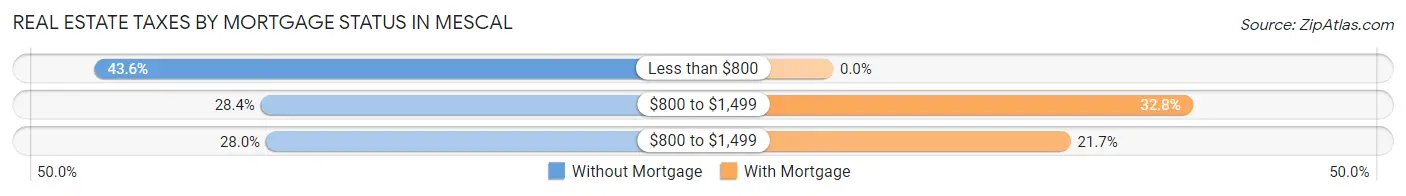
| Property Taxes | Without Mortgage | With Mortgage |
| Less than $800 | 92 (43.6%) | 0 (0.0%) |
| $800 to $1,499 | 60 (28.4%) | 109 (32.8%) |
| $800 to $1,499 | 59 (28.0%) | 72 (21.7%) |
| Total | 211 (100.0%) | 332 (100.0%) |
Health & Disability in Mescal
Health Insurance Coverage by Age in Mescal
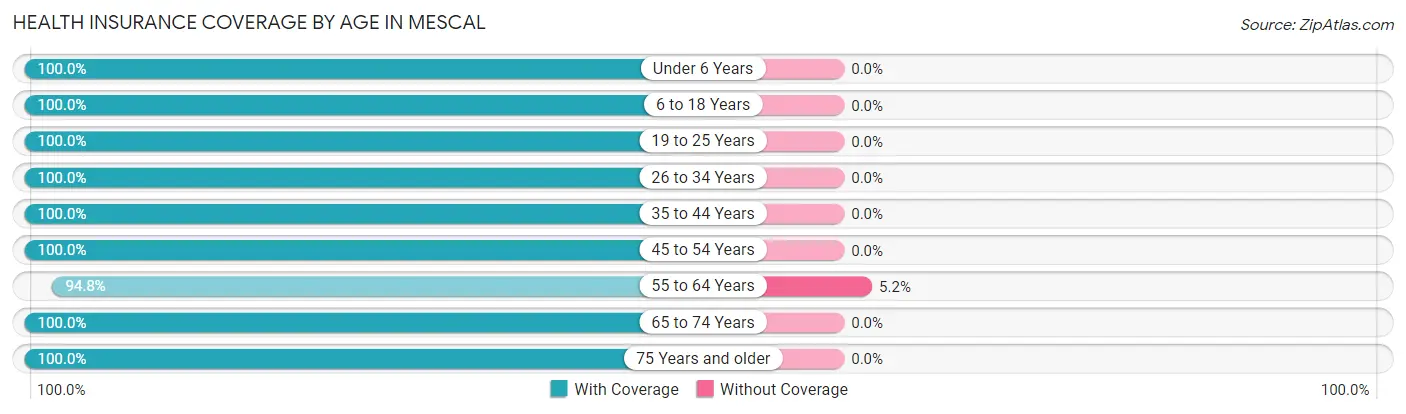
| Age Bracket | With Coverage | Without Coverage |
| Under 6 Years | 82 (100.0%) | 0 (0.0%) |
| 6 to 18 Years | 220 (100.0%) | 0 (0.0%) |
| 19 to 25 Years | 44 (100.0%) | 0 (0.0%) |
| 26 to 34 Years | 144 (100.0%) | 0 (0.0%) |
| 35 to 44 Years | 41 (100.0%) | 0 (0.0%) |
| 45 to 54 Years | 166 (100.0%) | 0 (0.0%) |
| 55 to 64 Years | 164 (94.8%) | 9 (5.2%) |
| 65 to 74 Years | 390 (100.0%) | 0 (0.0%) |
| 75 Years and older | 208 (100.0%) | 0 (0.0%) |
| Total | 1,459 (99.4%) | 9 (0.6%) |
Health Insurance Coverage by Citizenship Status in Mescal
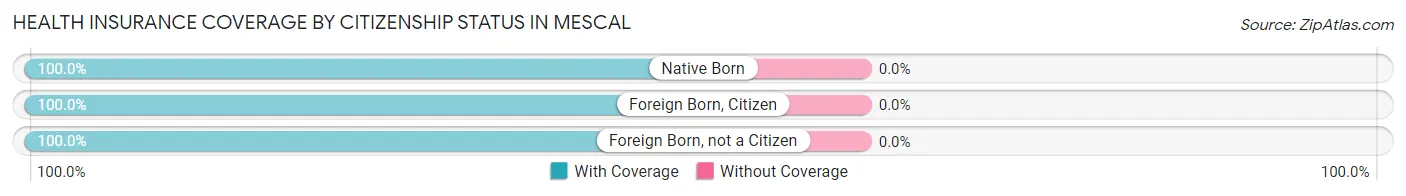
| Citizenship Status | With Coverage | Without Coverage |
| Native Born | 82 (100.0%) | 0 (0.0%) |
| Foreign Born, Citizen | 220 (100.0%) | 0 (0.0%) |
| Foreign Born, not a Citizen | 44 (100.0%) | 0 (0.0%) |
Health Insurance Coverage by Household Income in Mescal
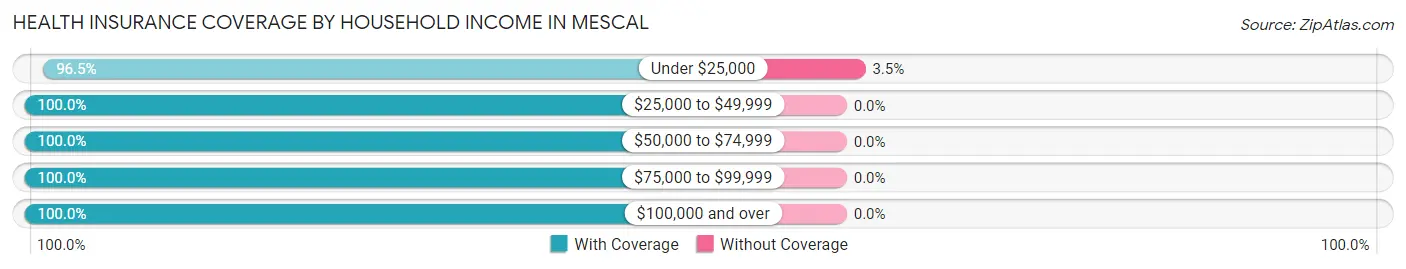
| Household Income | With Coverage | Without Coverage |
| Under $25,000 | 248 (96.5%) | 9 (3.5%) |
| $25,000 to $49,999 | 378 (100.0%) | 0 (0.0%) |
| $50,000 to $74,999 | 343 (100.0%) | 0 (0.0%) |
| $75,000 to $99,999 | 191 (100.0%) | 0 (0.0%) |
| $100,000 and over | 299 (100.0%) | 0 (0.0%) |
Public vs Private Health Insurance Coverage by Age in Mescal
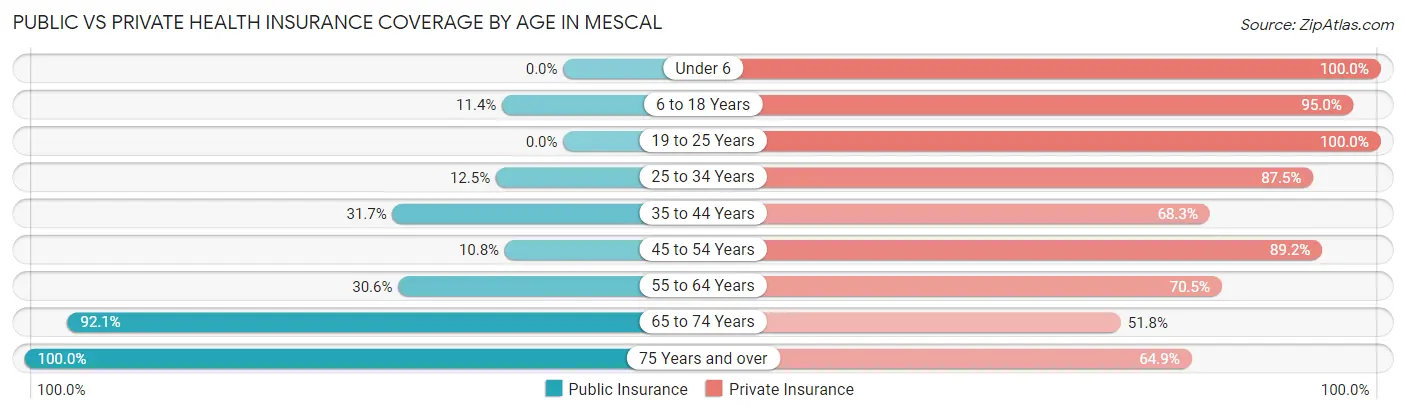
| Age Bracket | Public Insurance | Private Insurance |
| Under 6 | 0 (0.0%) | 82 (100.0%) |
| 6 to 18 Years | 25 (11.4%) | 209 (95.0%) |
| 19 to 25 Years | 0 (0.0%) | 44 (100.0%) |
| 25 to 34 Years | 18 (12.5%) | 126 (87.5%) |
| 35 to 44 Years | 13 (31.7%) | 28 (68.3%) |
| 45 to 54 Years | 18 (10.8%) | 148 (89.2%) |
| 55 to 64 Years | 53 (30.6%) | 122 (70.5%) |
| 65 to 74 Years | 359 (92.0%) | 202 (51.8%) |
| 75 Years and over | 208 (100.0%) | 135 (64.9%) |
| Total | 694 (47.3%) | 1,096 (74.7%) |
Disability Status by Sex by Age in Mescal
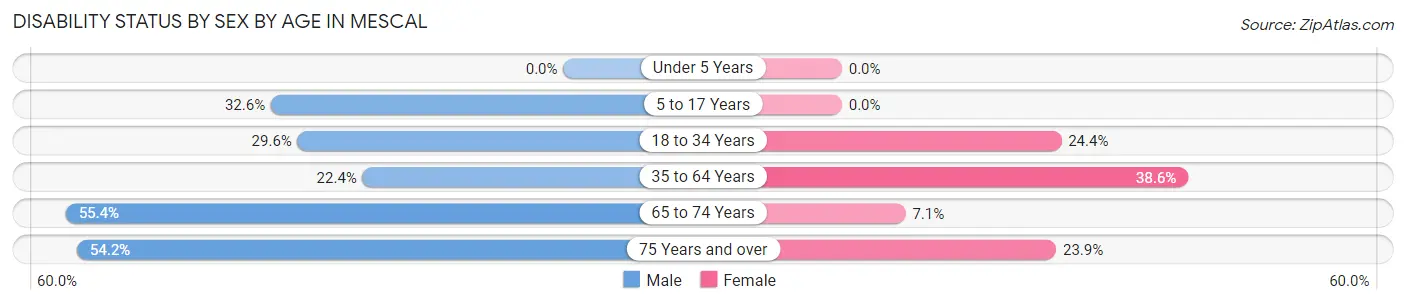
| Age Bracket | Male | Female |
| Under 5 Years | 0 (0.0%) | 0 (0.0%) |
| 5 to 17 Years | 14 (32.6%) | 0 (0.0%) |
| 18 to 34 Years | 29 (29.6%) | 22 (24.4%) |
| 35 to 64 Years | 38 (22.4%) | 81 (38.6%) |
| 65 to 74 Years | 138 (55.4%) | 10 (7.1%) |
| 75 Years and over | 65 (54.2%) | 21 (23.9%) |
Disability Class by Sex by Age in Mescal
Disability Class: Hearing Difficulty
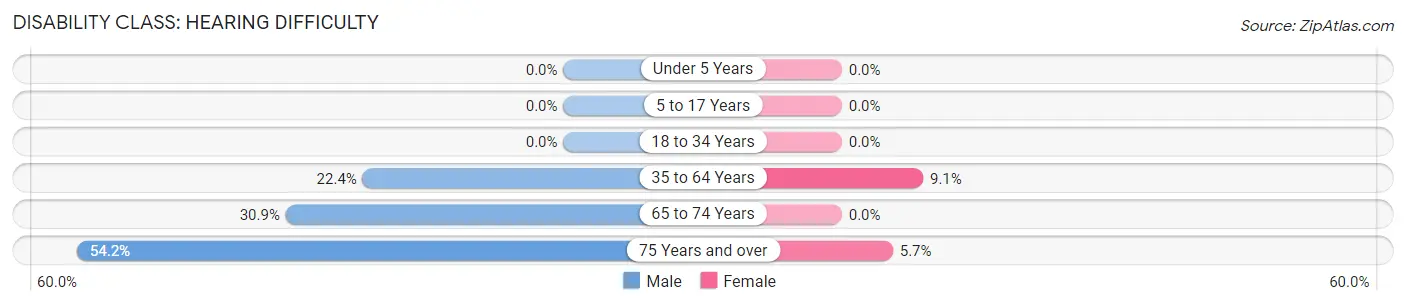
| Age Bracket | Male | Female |
| Under 5 Years | 0 (0.0%) | 0 (0.0%) |
| 5 to 17 Years | 0 (0.0%) | 0 (0.0%) |
| 18 to 34 Years | 0 (0.0%) | 0 (0.0%) |
| 35 to 64 Years | 38 (22.4%) | 19 (9.0%) |
| 65 to 74 Years | 77 (30.9%) | 0 (0.0%) |
| 75 Years and over | 65 (54.2%) | 5 (5.7%) |
Disability Class: Vision Difficulty
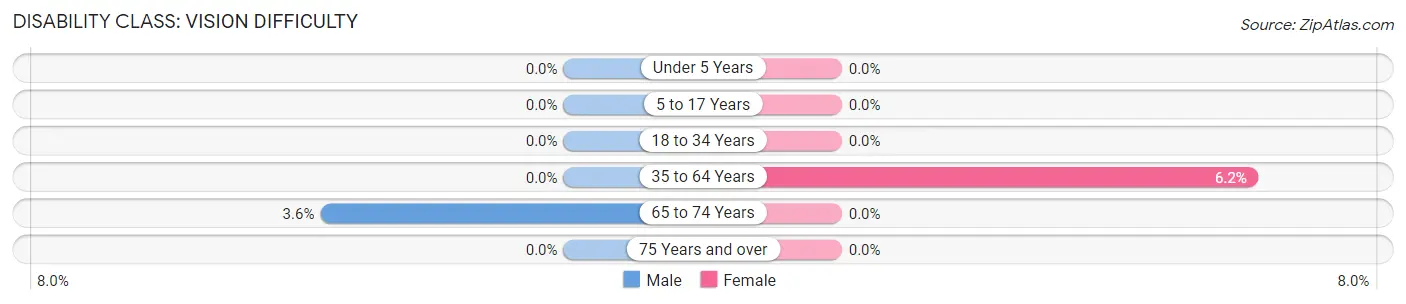
| Age Bracket | Male | Female |
| Under 5 Years | 0 (0.0%) | 0 (0.0%) |
| 5 to 17 Years | 0 (0.0%) | 0 (0.0%) |
| 18 to 34 Years | 0 (0.0%) | 0 (0.0%) |
| 35 to 64 Years | 0 (0.0%) | 13 (6.2%) |
| 65 to 74 Years | 9 (3.6%) | 0 (0.0%) |
| 75 Years and over | 0 (0.0%) | 0 (0.0%) |
Disability Class: Cognitive Difficulty
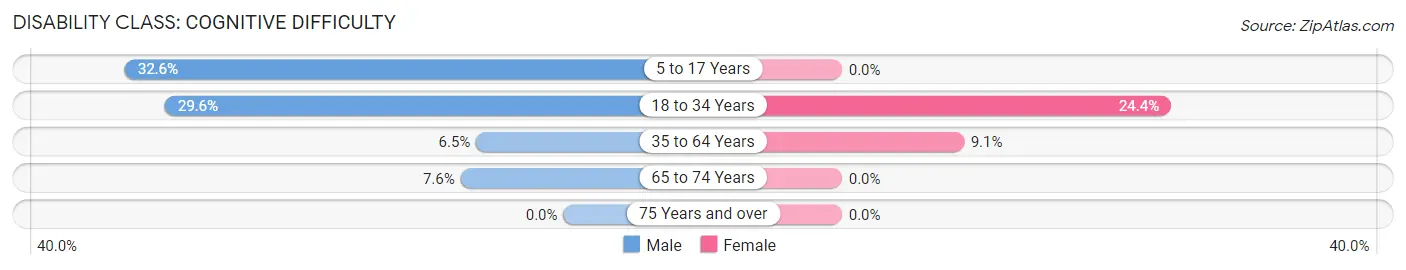
| Age Bracket | Male | Female |
| 5 to 17 Years | 14 (32.6%) | 0 (0.0%) |
| 18 to 34 Years | 29 (29.6%) | 22 (24.4%) |
| 35 to 64 Years | 11 (6.5%) | 19 (9.0%) |
| 65 to 74 Years | 19 (7.6%) | 0 (0.0%) |
| 75 Years and over | 0 (0.0%) | 0 (0.0%) |
Disability Class: Ambulatory Difficulty
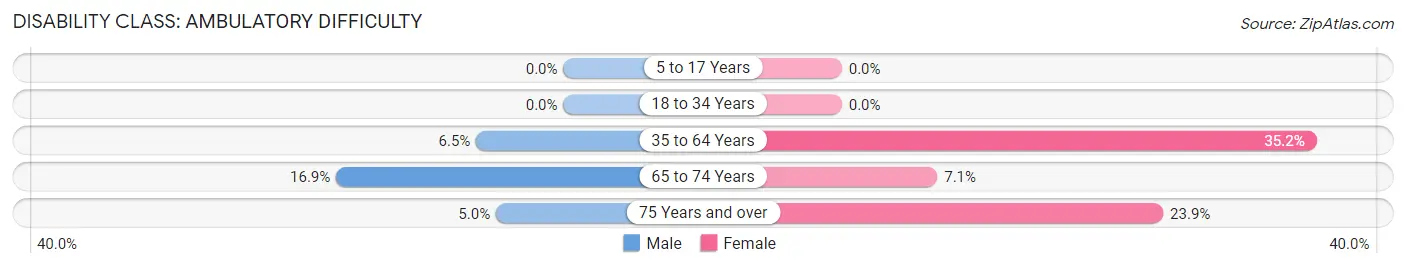
| Age Bracket | Male | Female |
| 5 to 17 Years | 0 (0.0%) | 0 (0.0%) |
| 18 to 34 Years | 0 (0.0%) | 0 (0.0%) |
| 35 to 64 Years | 11 (6.5%) | 74 (35.2%) |
| 65 to 74 Years | 42 (16.9%) | 10 (7.1%) |
| 75 Years and over | 6 (5.0%) | 21 (23.9%) |
Disability Class: Self-Care Difficulty
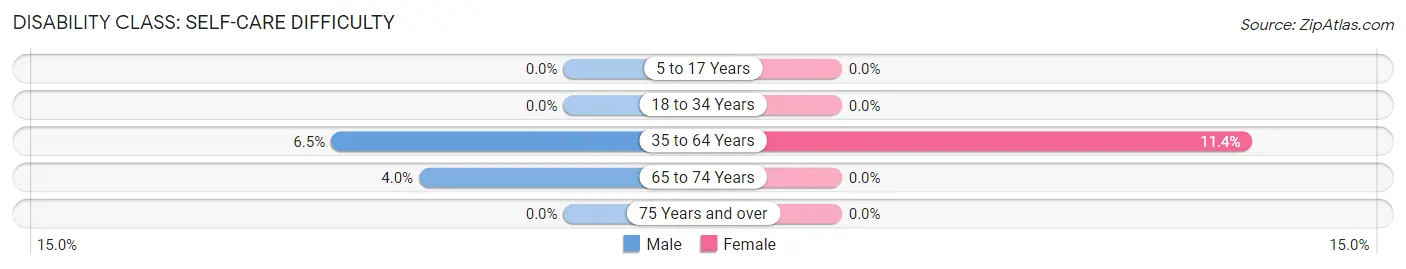
| Age Bracket | Male | Female |
| 5 to 17 Years | 0 (0.0%) | 0 (0.0%) |
| 18 to 34 Years | 0 (0.0%) | 0 (0.0%) |
| 35 to 64 Years | 11 (6.5%) | 24 (11.4%) |
| 65 to 74 Years | 10 (4.0%) | 0 (0.0%) |
| 75 Years and over | 0 (0.0%) | 0 (0.0%) |
Technology Access in Mescal
Computing Device Access in Mescal
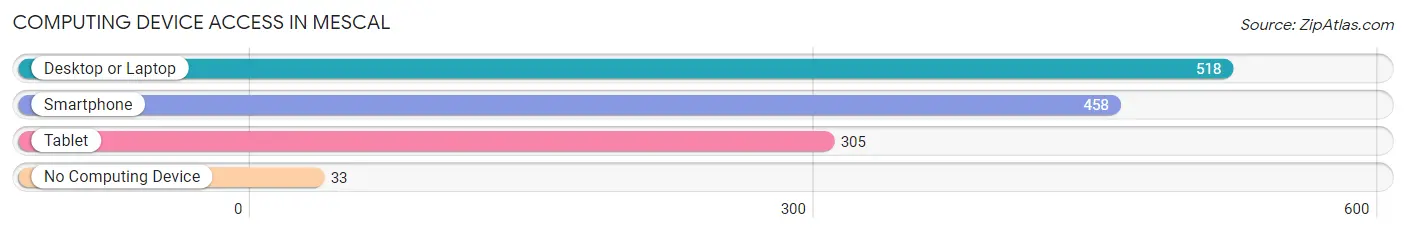
| Device Type | # Households | % Households |
| Desktop or Laptop | 518 | 84.8% |
| Smartphone | 458 | 75.0% |
| Tablet | 305 | 49.9% |
| No Computing Device | 33 | 5.4% |
| Total | 611 | 100.0% |
Internet Access in Mescal
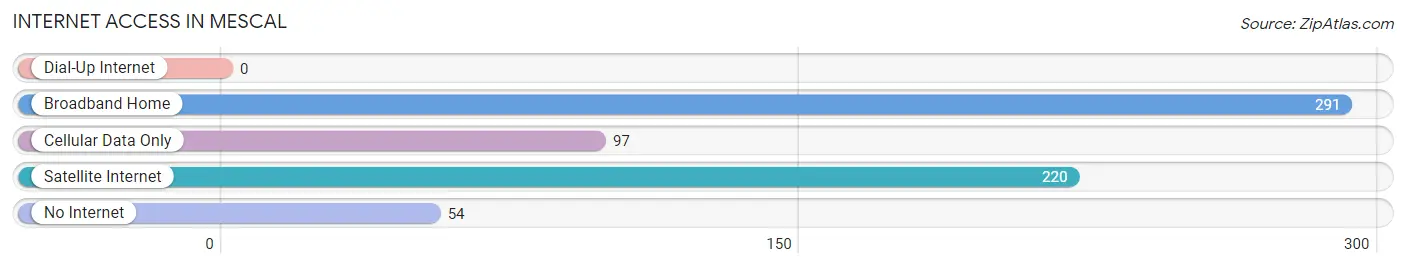
| Internet Type | # Households | % Households |
| Dial-Up Internet | 0 | 0.0% |
| Broadband Home | 291 | 47.6% |
| Cellular Data Only | 97 | 15.9% |
| Satellite Internet | 220 | 36.0% |
| No Internet | 54 | 8.8% |
| Total | 611 | 100.0% |
Mescal Summary
Mescal, Arizona is a small unincorporated community located in Pinal County, Arizona. It is situated in the Sonoran Desert, approximately 40 miles southeast of Phoenix. The town is located on the Gila River Indian Reservation and is home to the Gila River Indian Community. The population of Mescal was estimated to be 1,072 in 2019.
History
Mescal was originally established in the late 1800s as a stagecoach stop along the Gila River. The town was named after the mescal plant, which was used by the local Native American tribes for food and medicine. The town was also home to a number of ranches and farms, which provided food and other goods to the local population.
In the early 1900s, the town began to grow as a result of the construction of the Southern Pacific Railroad. The railroad provided a direct connection to Phoenix, which allowed for the growth of the town.
In the 1950s, the town began to decline as a result of the construction of the Coolidge Dam. The dam caused the Gila River to be diverted, which caused the town to become isolated from the rest of the state.
Geography
Mescal is located in the Sonoran Desert, approximately 40 miles southeast of Phoenix. The town is situated on the Gila River Indian Reservation and is home to the Gila River Indian Community. The town is located at an elevation of 1,890 feet and has a total area of 0.6 square miles.
The climate in Mescal is hot and dry, with temperatures ranging from the mid-90s in the summer to the mid-50s in the winter. The town receives an average of 8 inches of precipitation per year.
Economy
The economy of Mescal is largely based on agriculture and tourism. The town is home to a number of ranches and farms, which provide food and other goods to the local population. The town is also home to a number of tourist attractions, including the Gila River Indian Community Cultural Center and the Gila River Indian Reservation.
Demographics
As of 2019, the population of Mescal was estimated to be 1,072. The town has a population density of 1,788 people per square mile. The median age in Mescal is 33.3 years, and the median household income is $37,917. The town is predominantly Hispanic, with a population that is 97.3% Hispanic or Latino. The town is also home to a number of Native American tribes, including the Gila River Indian Community.
Common Questions
What is Per Capita Income in Mescal?
Per Capita income in Mescal is $26,169.
What is the Median Family Income in Mescal?
Median Family Income in Mescal is $42,727.
What is the Median Household income in Mescal?
Median Household Income in Mescal is $52,969.
What is Inequality or Gini Index in Mescal?
Inequality or Gini Index in Mescal is 0.39.
What is the Total Population of Mescal?
Total Population of Mescal is 1,468.
What is the Total Male Population of Mescal?
Total Male Population of Mescal is 731.
What is the Total Female Population of Mescal?
Total Female Population of Mescal is 737.
What is the Ratio of Males per 100 Females in Mescal?
There are 99.19 Males per 100 Females in Mescal.
What is the Ratio of Females per 100 Males in Mescal?
There are 100.82 Females per 100 Males in Mescal.
What is the Median Population Age in Mescal?
Median Population Age in Mescal is 59.0 Years.
What is the Average Family Size in Mescal
Average Family Size in Mescal is 3.0 People.
What is the Average Household Size in Mescal
Average Household Size in Mescal is 2.4 People.
How Large is the Labor Force in Mescal?
There are 456 People in the Labor Forcein in Mescal.
What is the Percentage of People in the Labor Force in Mescal?
37.6% of People are in the Labor Force in Mescal.