Clark Fork, ID Map & Demographics
Clark Fork Map
Clark Fork Overview
$19,182
PER CAPITA INCOME
$46,016
AVG FAMILY INCOME
$47,411
AVG HOUSEHOLD INCOME
0.30
INEQUALITY / GINI INDEX
963
TOTAL POPULATION
471
MALE POPULATION
492
FEMALE POPULATION
95.73
MALES / 100 FEMALES
104.46
FEMALES / 100 MALES
40.9
MEDIAN AGE
3.0
AVG FAMILY SIZE
2.6
AVG HOUSEHOLD SIZE
495
LABOR FORCE [ PEOPLE ]
61.4%
PERCENT IN LABOR FORCE
12.9%
UNEMPLOYMENT RATE
Clark Fork Zip Codes
Clark Fork Area Codes
Income in Clark Fork
Income Overview in Clark Fork
Per Capita Income in Clark Fork is $19,182, while median incomes of families and households are $46,016 and $47,411 respectively.
| Characteristic | Number | Measure |
| Per Capita Income | 963 | $19,182 |
| Median Family Income | 173 | $46,016 |
| Mean Family Income | 173 | $58,278 |
| Median Household Income | 369 | $47,411 |
| Mean Household Income | 369 | $52,584 |
| Income Deficit | 173 | $0 |
| Wage / Income Gap (%) | 963 | 0.00% |
| Wage / Income Gap ($) | 963 | 100.00¢ per $1 |
| Gini / Inequality Index | 963 | 0.30 |
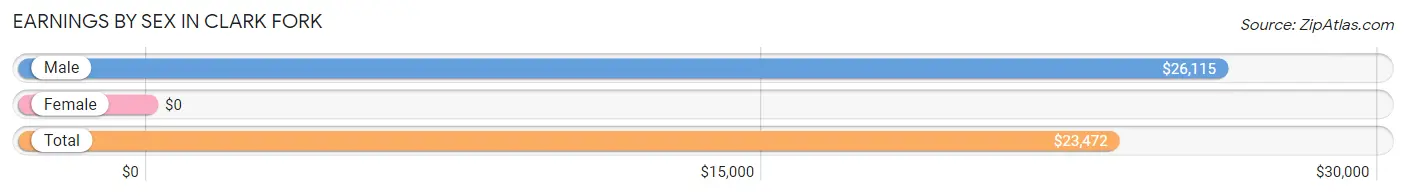
Earnings by Sex in Clark Fork
| Sex | Number | Average Earnings |
| Male | 193 (43.8%) | $26,115 |
| Female | 248 (56.2%) | $0 |
| Total | 441 (100.0%) | $23,472 |
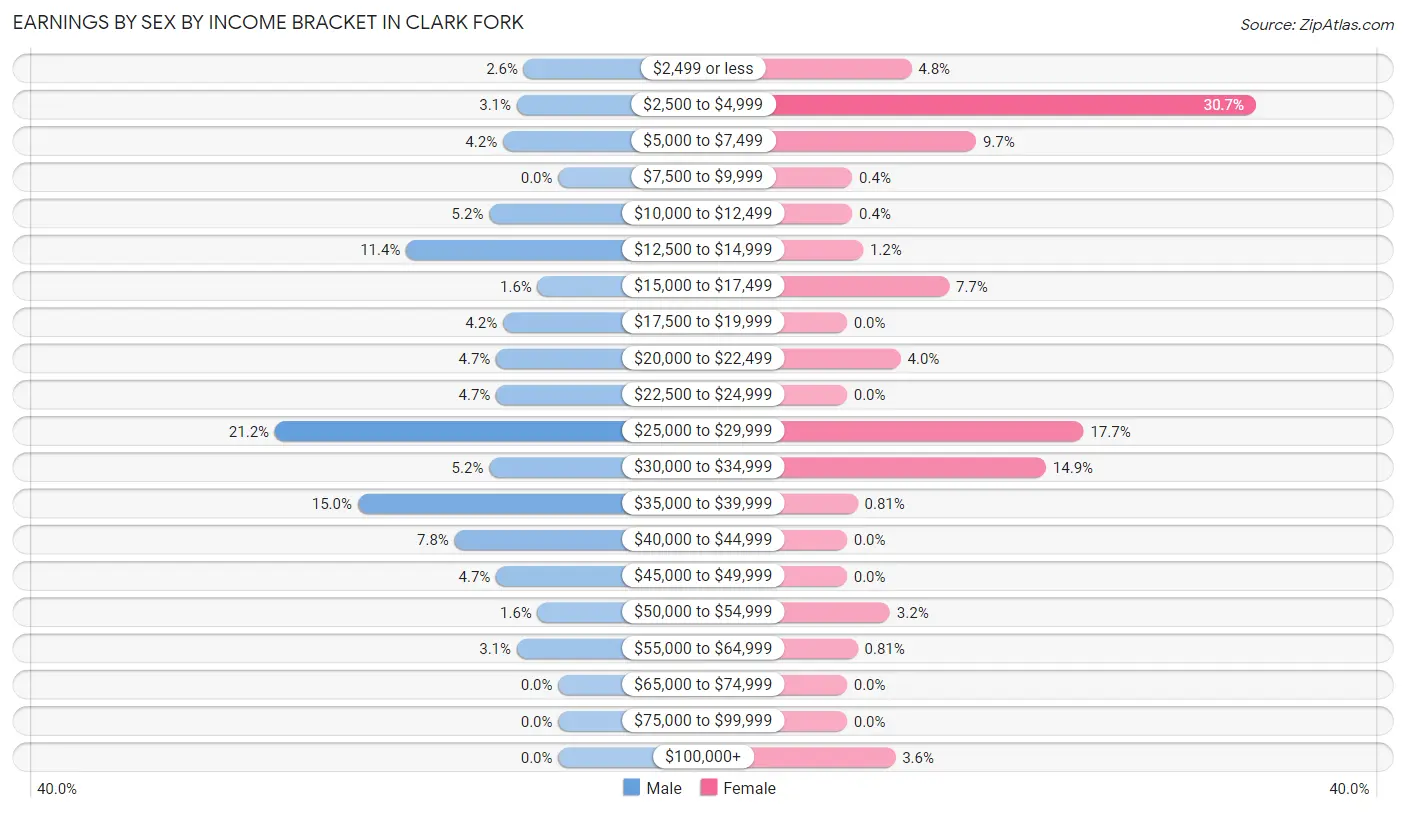
Earnings by Sex by Income Bracket in Clark Fork
The most common earnings brackets in Clark Fork are $25,000 to $29,999 for men (41 | 21.2%) and $2,500 to $4,999 for women (76 | 30.6%).
| Income | Male | Female |
| $2,499 or less | 5 (2.6%) | 12 (4.8%) |
| $2,500 to $4,999 | 6 (3.1%) | 76 (30.6%) |
| $5,000 to $7,499 | 8 (4.2%) | 24 (9.7%) |
| $7,500 to $9,999 | 0 (0.0%) | 1 (0.4%) |
| $10,000 to $12,499 | 10 (5.2%) | 1 (0.4%) |
| $12,500 to $14,999 | 22 (11.4%) | 3 (1.2%) |
| $15,000 to $17,499 | 3 (1.5%) | 19 (7.7%) |
| $17,500 to $19,999 | 8 (4.2%) | 0 (0.0%) |
| $20,000 to $22,499 | 9 (4.7%) | 10 (4.0%) |
| $22,500 to $24,999 | 9 (4.7%) | 0 (0.0%) |
| $25,000 to $29,999 | 41 (21.2%) | 44 (17.7%) |
| $30,000 to $34,999 | 10 (5.2%) | 37 (14.9%) |
| $35,000 to $39,999 | 29 (15.0%) | 2 (0.8%) |
| $40,000 to $44,999 | 15 (7.8%) | 0 (0.0%) |
| $45,000 to $49,999 | 9 (4.7%) | 0 (0.0%) |
| $50,000 to $54,999 | 3 (1.5%) | 8 (3.2%) |
| $55,000 to $64,999 | 6 (3.1%) | 2 (0.8%) |
| $65,000 to $74,999 | 0 (0.0%) | 0 (0.0%) |
| $75,000 to $99,999 | 0 (0.0%) | 0 (0.0%) |
| $100,000+ | 0 (0.0%) | 9 (3.6%) |
| Total | 193 (100.0%) | 248 (100.0%) |
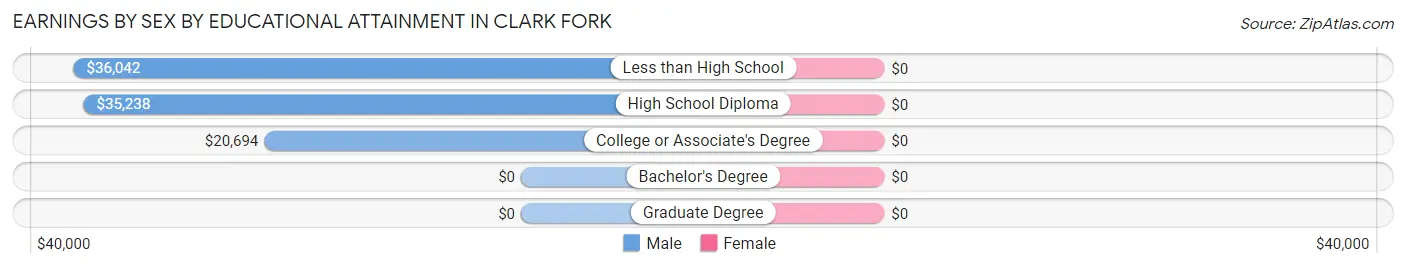
Earnings by Sex by Educational Attainment in Clark Fork
| Educational Attainment | Male Income | Female Income |
| Less than High School | $36,042 | $0 |
| High School Diploma | $35,238 | $0 |
| College or Associate's Degree | $20,694 | $0 |
| Bachelor's Degree | - | - |
| Graduate Degree | - | - |
| Total | $26,111 | $0 |
Family Income in Clark Fork
Family Income Brackets in Clark Fork
According to the Clark Fork family income data, there are 54 families falling into the $35,000 to $49,999 income range, which is the most common income bracket and makes up 31.2% of all families.
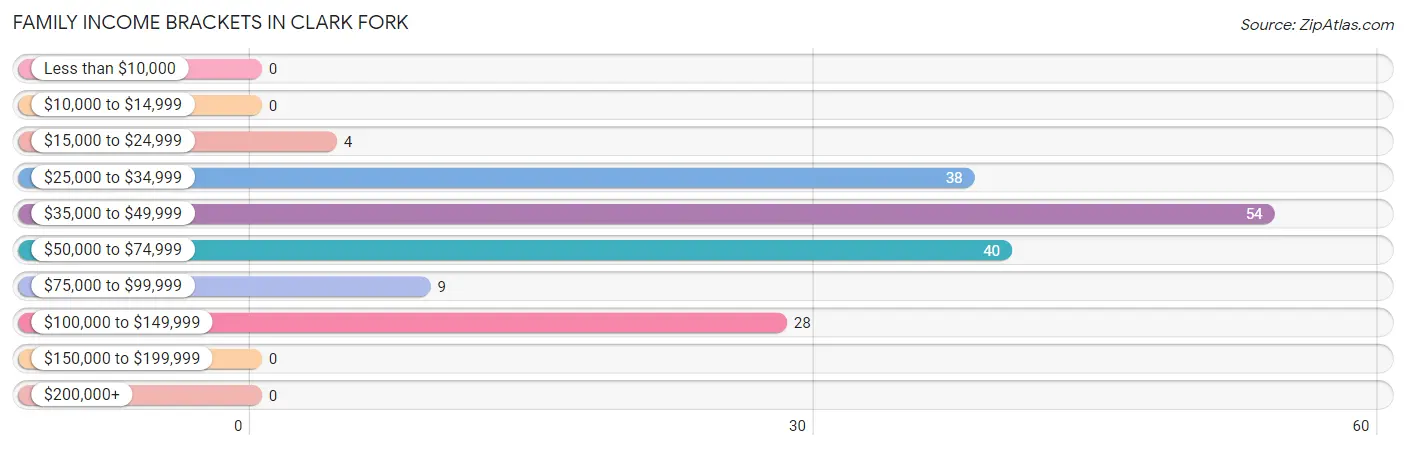
| Income Bracket | # Families | % Families |
| Less than $10,000 | 0 | 0.0% |
| $10,000 to $14,999 | 0 | 0.0% |
| $15,000 to $24,999 | 4 | 2.3% |
| $25,000 to $34,999 | 38 | 22.0% |
| $35,000 to $49,999 | 54 | 31.2% |
| $50,000 to $74,999 | 40 | 23.1% |
| $75,000 to $99,999 | 9 | 5.2% |
| $100,000 to $149,999 | 28 | 16.2% |
| $150,000 to $199,999 | 0 | 0.0% |
| $200,000+ | 0 | 0.0% |
Family Income by Famaliy Size in Clark Fork
4-person families (18 | 10.4%) account for the highest median family income in Clark Fork with $60,833 per family, while 2-person families (137 | 79.2%) have the highest median income of $23,008 per family member.
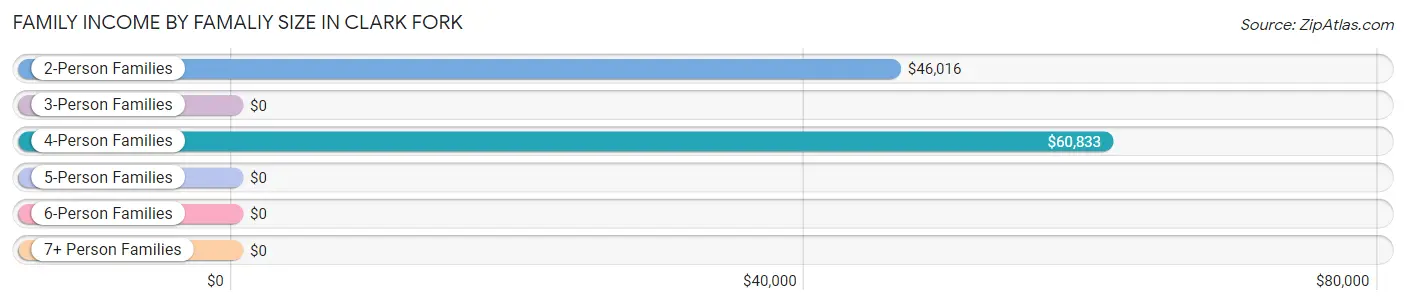
| Income Bracket | # Families | Median Income |
| 2-Person Families | 137 (79.2%) | $46,016 |
| 3-Person Families | 4 (2.3%) | $0 |
| 4-Person Families | 18 (10.4%) | $60,833 |
| 5-Person Families | 14 (8.1%) | $0 |
| 6-Person Families | 0 (0.0%) | $0 |
| 7+ Person Families | 0 (0.0%) | $0 |
| Total | 173 (100.0%) | $46,016 |
Family Income by Number of Earners in Clark Fork
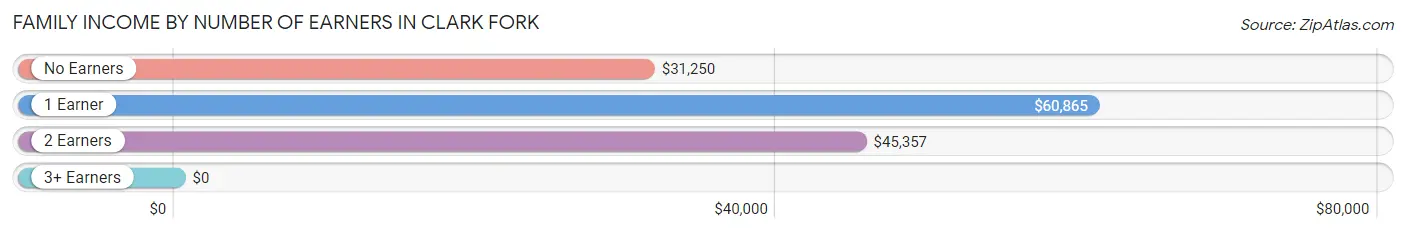
| Number of Earners | # Families | Median Income |
| No Earners | 34 (19.7%) | $31,250 |
| 1 Earner | 39 (22.5%) | $60,865 |
| 2 Earners | 94 (54.3%) | $45,357 |
| 3+ Earners | 6 (3.5%) | $0 |
| Total | 173 (100.0%) | $46,016 |
Household Income in Clark Fork
Household Income Brackets in Clark Fork
With 145 households falling in the category, the $50,000 to $74,999 income range is the most frequent in Clark Fork, accounting for 39.3% of all households.
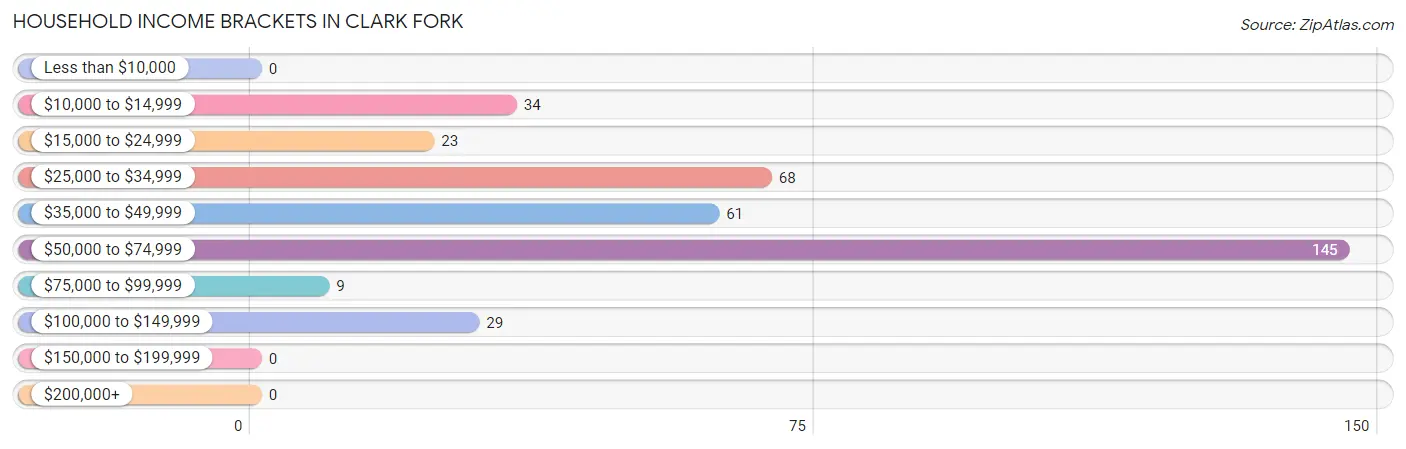
| Income Bracket | # Households | % Households |
| Less than $10,000 | 0 | 0.0% |
| $10,000 to $14,999 | 34 | 9.2% |
| $15,000 to $24,999 | 23 | 6.2% |
| $25,000 to $34,999 | 68 | 18.4% |
| $35,000 to $49,999 | 61 | 16.5% |
| $50,000 to $74,999 | 145 | 39.3% |
| $75,000 to $99,999 | 9 | 2.4% |
| $100,000 to $149,999 | 29 | 7.9% |
| $150,000 to $199,999 | 0 | 0.0% |
| $200,000+ | 0 | 0.0% |
Household Income by Householder Age in Clark Fork
The median household income in Clark Fork is $47,411, with the highest median household income of $68,132 found in the 25 to 44 years age bracket for the primary householder. A total of 133 households (36.0%) fall into this category. Meanwhile, the 15 to 24 years age bracket for the primary householder has the lowest median household income of $0, with 4 households (1.1%) in this group.
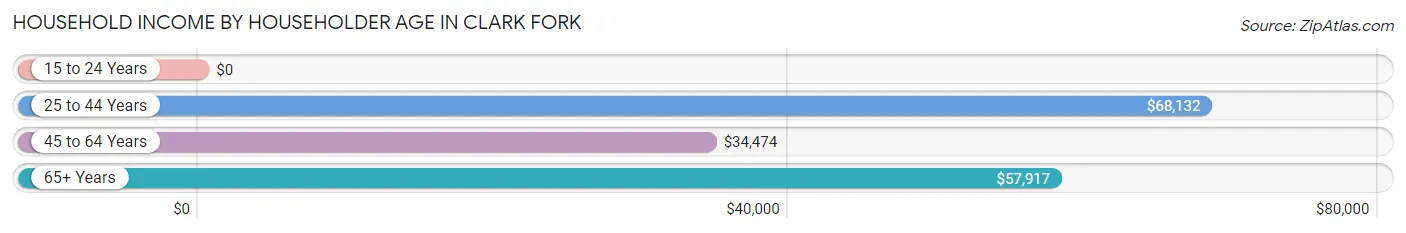
| Income Bracket | # Households | Median Income |
| 15 to 24 Years | 4 (1.1%) | $0 |
| 25 to 44 Years | 133 (36.0%) | $68,132 |
| 45 to 64 Years | 158 (42.8%) | $34,474 |
| 65+ Years | 74 (20.1%) | $57,917 |
| Total | 369 (100.0%) | $47,411 |
Poverty in Clark Fork
Income Below Poverty by Sex and Age in Clark Fork
With 36.9% poverty level for males and 8.5% for females among the residents of Clark Fork, 18 to 24 year old males and 25 to 34 year old females are the most vulnerable to poverty, with 64 males (97.0%) and 12 females (57.1%) in their respective age groups living below the poverty level.
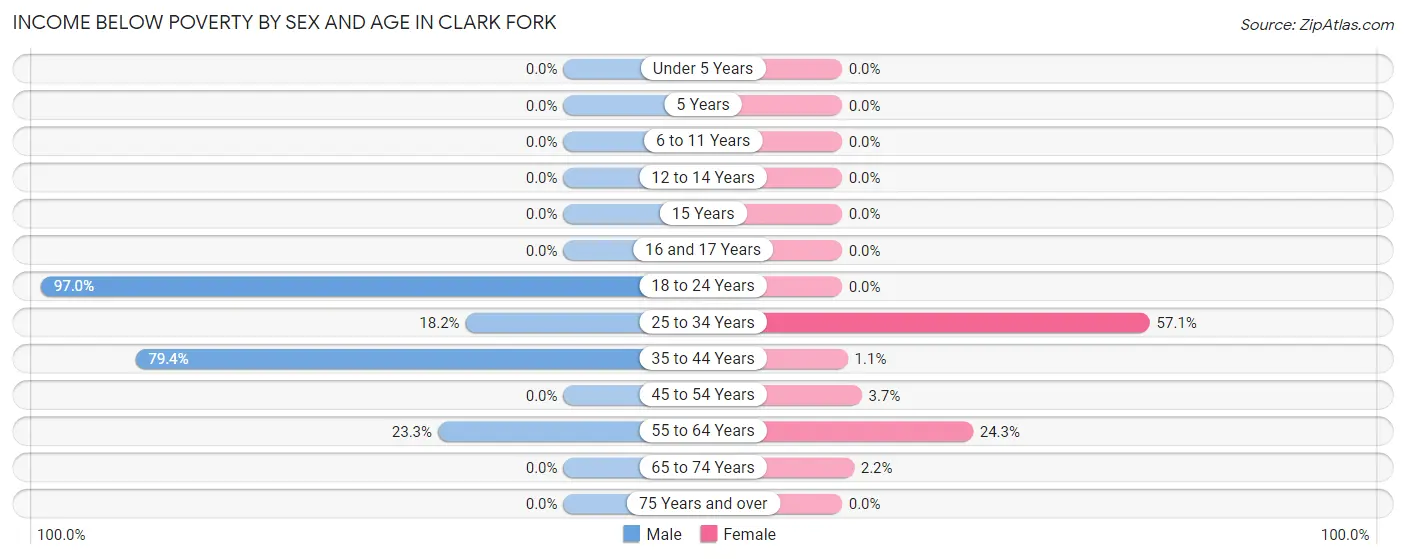
| Age Bracket | Male | Female |
| Under 5 Years | 0 (0.0%) | 0 (0.0%) |
| 5 Years | 0 (0.0%) | 0 (0.0%) |
| 6 to 11 Years | 0 (0.0%) | 0 (0.0%) |
| 12 to 14 Years | 0 (0.0%) | 0 (0.0%) |
| 15 Years | 0 (0.0%) | 0 (0.0%) |
| 16 and 17 Years | 0 (0.0%) | 0 (0.0%) |
| 18 to 24 Years | 64 (97.0%) | 0 (0.0%) |
| 25 to 34 Years | 8 (18.2%) | 12 (57.1%) |
| 35 to 44 Years | 85 (79.4%) | 1 (1.1%) |
| 45 to 54 Years | 0 (0.0%) | 3 (3.7%) |
| 55 to 64 Years | 17 (23.3%) | 18 (24.3%) |
| 65 to 74 Years | 0 (0.0%) | 1 (2.2%) |
| 75 Years and over | 0 (0.0%) | 0 (0.0%) |
| Total | 174 (36.9%) | 35 (8.5%) |
Income Above Poverty by Sex and Age in Clark Fork
According to the poverty statistics in Clark Fork, males aged under 5 years and females aged under 5 years are the age groups that are most secure financially, with 100.0% of males and 100.0% of females in these age groups living above the poverty line.
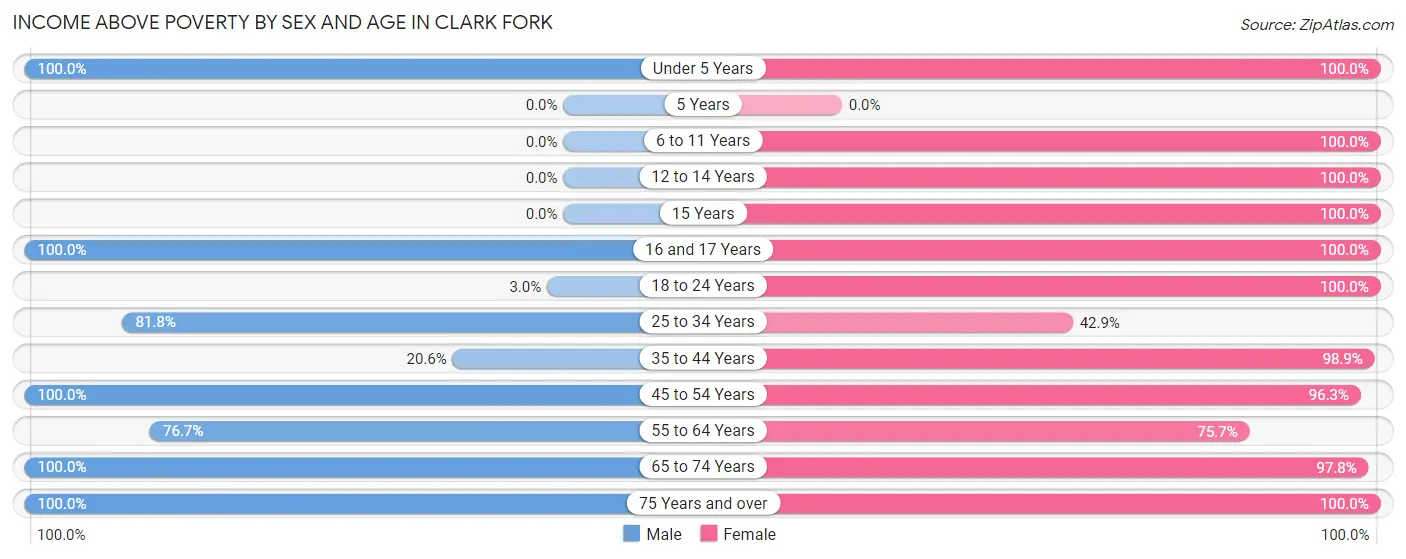
| Age Bracket | Male | Female |
| Under 5 Years | 14 (100.0%) | 21 (100.0%) |
| 5 Years | 0 (0.0%) | 0 (0.0%) |
| 6 to 11 Years | 0 (0.0%) | 27 (100.0%) |
| 12 to 14 Years | 0 (0.0%) | 5 (100.0%) |
| 15 Years | 0 (0.0%) | 9 (100.0%) |
| 16 and 17 Years | 33 (100.0%) | 9 (100.0%) |
| 18 to 24 Years | 2 (3.0%) | 9 (100.0%) |
| 25 to 34 Years | 36 (81.8%) | 9 (42.9%) |
| 35 to 44 Years | 22 (20.6%) | 91 (98.9%) |
| 45 to 54 Years | 48 (100.0%) | 79 (96.3%) |
| 55 to 64 Years | 56 (76.7%) | 56 (75.7%) |
| 65 to 74 Years | 62 (100.0%) | 44 (97.8%) |
| 75 Years and over | 24 (100.0%) | 17 (100.0%) |
| Total | 297 (63.1%) | 376 (91.5%) |
Income Below Poverty Among Married-Couple Families in Clark Fork
The poverty statistics for married-couple families in Clark Fork show that 3.4% or 4 of the total 119 families live below the poverty line. Families with no children have the highest poverty rate of 4.0%, comprising of 4 families. On the other hand, families with 1 or 2 children have the lowest poverty rate of 0.0%, which includes 0 families.
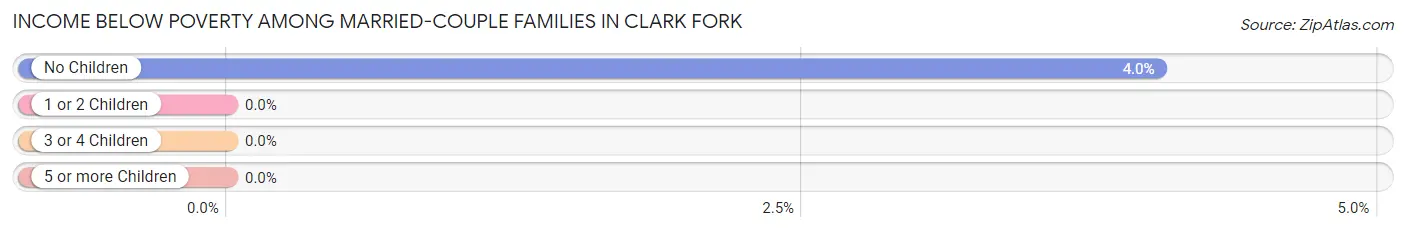
| Children | Above Poverty | Below Poverty |
| No Children | 95 (96.0%) | 4 (4.0%) |
| 1 or 2 Children | 12 (100.0%) | 0 (0.0%) |
| 3 or 4 Children | 8 (100.0%) | 0 (0.0%) |
| 5 or more Children | 0 (0.0%) | 0 (0.0%) |
| Total | 115 (96.6%) | 4 (3.4%) |
Income Below Poverty Among Single-Parent Households in Clark Fork
| Children | Single Father | Single Mother |
| No Children | 0 (0.0%) | 0 (0.0%) |
| 1 or 2 Children | 0 (0.0%) | 0 (0.0%) |
| 3 or 4 Children | 0 (0.0%) | 0 (0.0%) |
| 5 or more Children | 0 (0.0%) | 0 (0.0%) |
| Total | 0 (0.0%) | 0 (0.0%) |
Income Below Poverty Among Married-Couple vs Single-Parent Households in Clark Fork
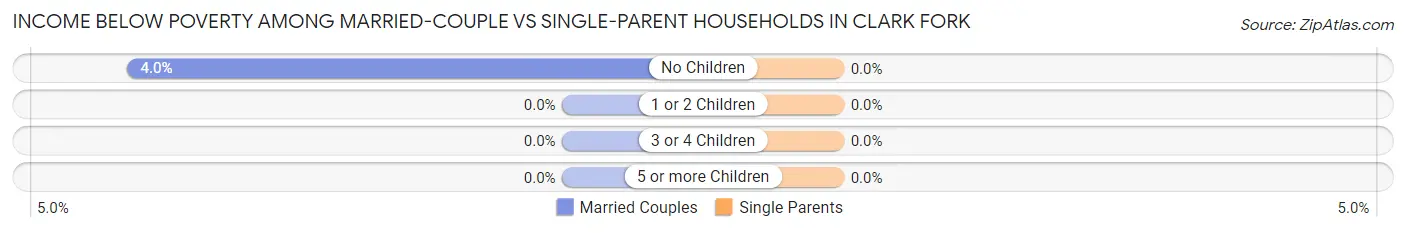
| Children | Married-Couple Families | Single-Parent Households |
| No Children | 4 (4.0%) | 0 (0.0%) |
| 1 or 2 Children | 0 (0.0%) | 0 (0.0%) |
| 3 or 4 Children | 0 (0.0%) | 0 (0.0%) |
| 5 or more Children | 0 (0.0%) | 0 (0.0%) |
| Total | 4 (3.4%) | 0 (0.0%) |
Race in Clark Fork
The most populous races in Clark Fork are White / Caucasian (924 | 96.0%), Two or more Races (34 | 3.5%), and Hispanic or Latino (10 | 1.0%).
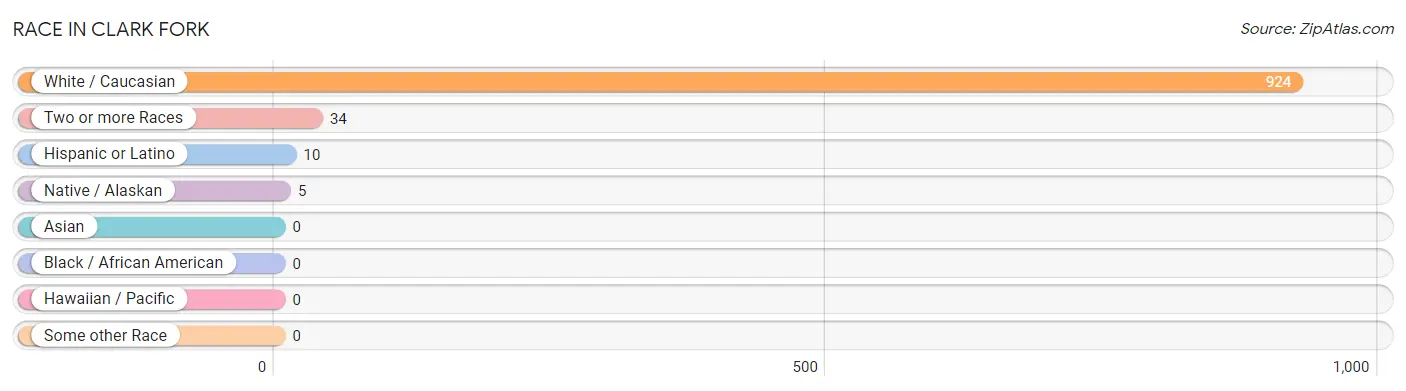
| Race | # Population | % Population |
| Asian | 0 | 0.0% |
| Black / African American | 0 | 0.0% |
| Hawaiian / Pacific | 0 | 0.0% |
| Hispanic or Latino | 10 | 1.0% |
| Native / Alaskan | 5 | 0.5% |
| White / Caucasian | 924 | 96.0% |
| Two or more Races | 34 | 3.5% |
| Some other Race | 0 | 0.0% |
| Total | 963 | 100.0% |
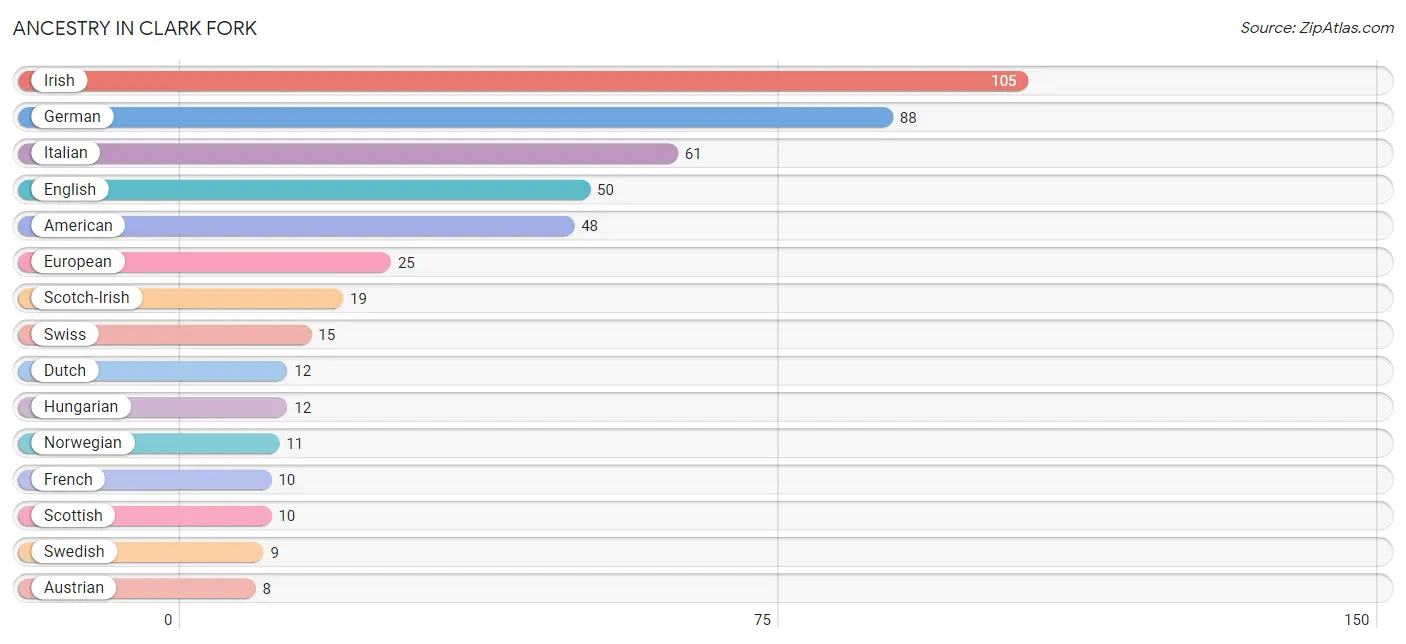
Ancestry in Clark Fork
The most populous ancestries reported in Clark Fork are Irish (105 | 10.9%), German (88 | 9.1%), Italian (61 | 6.3%), English (50 | 5.2%), and American (48 | 5.0%), together accounting for 36.5% of all Clark Fork residents.
| Ancestry | # Population | % Population |
| American | 48 | 5.0% |
| Austrian | 8 | 0.8% |
| Bhutanese | 6 | 0.6% |
| Canadian | 5 | 0.5% |
| Cherokee | 4 | 0.4% |
| Chickasaw | 7 | 0.7% |
| Cree | 1 | 0.1% |
| Danish | 8 | 0.8% |
| Dutch | 12 | 1.3% |
| English | 50 | 5.2% |
| European | 25 | 2.6% |
| French | 10 | 1.0% |
| French American Indian | 1 | 0.1% |
| German | 88 | 9.1% |
| Greek | 7 | 0.7% |
| Hungarian | 12 | 1.3% |
| Irish | 105 | 10.9% |
| Italian | 61 | 6.3% |
| Mexican | 3 | 0.3% |
| Northern European | 7 | 0.7% |
| Norwegian | 11 | 1.1% |
| Polish | 4 | 0.4% |
| Scandinavian | 8 | 0.8% |
| Scotch-Irish | 19 | 2.0% |
| Scottish | 10 | 1.0% |
| Spanish | 7 | 0.7% |
| Swedish | 9 | 0.9% |
| Swiss | 15 | 1.6% |
| Thai | 7 | 0.7% |
| Yakama | 5 | 0.5% | View All 30 Rows |
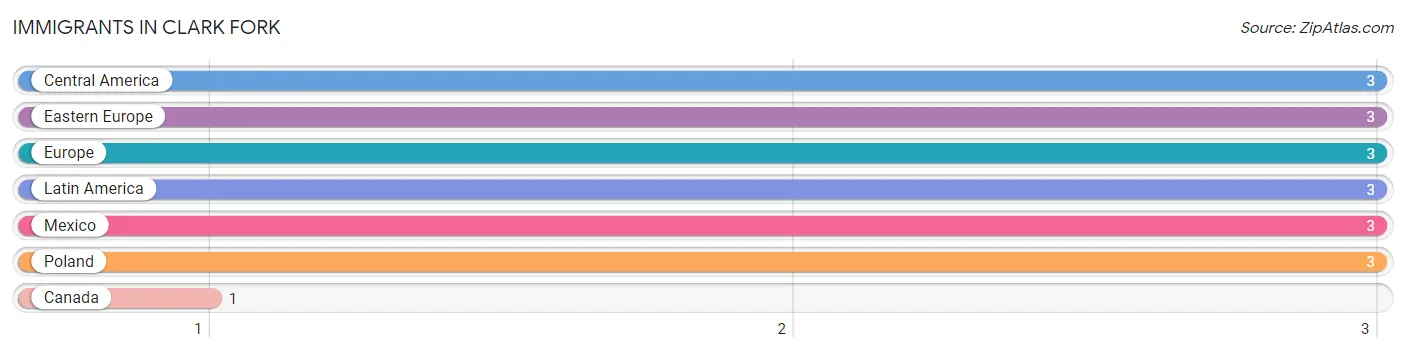
Immigrants in Clark Fork
The most numerous immigrant groups reported in Clark Fork came from Central America (3 | 0.3%), Eastern Europe (3 | 0.3%), Europe (3 | 0.3%), Latin America (3 | 0.3%), and Mexico (3 | 0.3%), together accounting for 1.5% of all Clark Fork residents.
| Immigration Origin | # Population | % Population |
| Canada | 1 | 0.1% |
| Central America | 3 | 0.3% |
| Eastern Europe | 3 | 0.3% |
| Europe | 3 | 0.3% |
| Latin America | 3 | 0.3% |
| Mexico | 3 | 0.3% |
| Poland | 3 | 0.3% | View All 7 Rows |
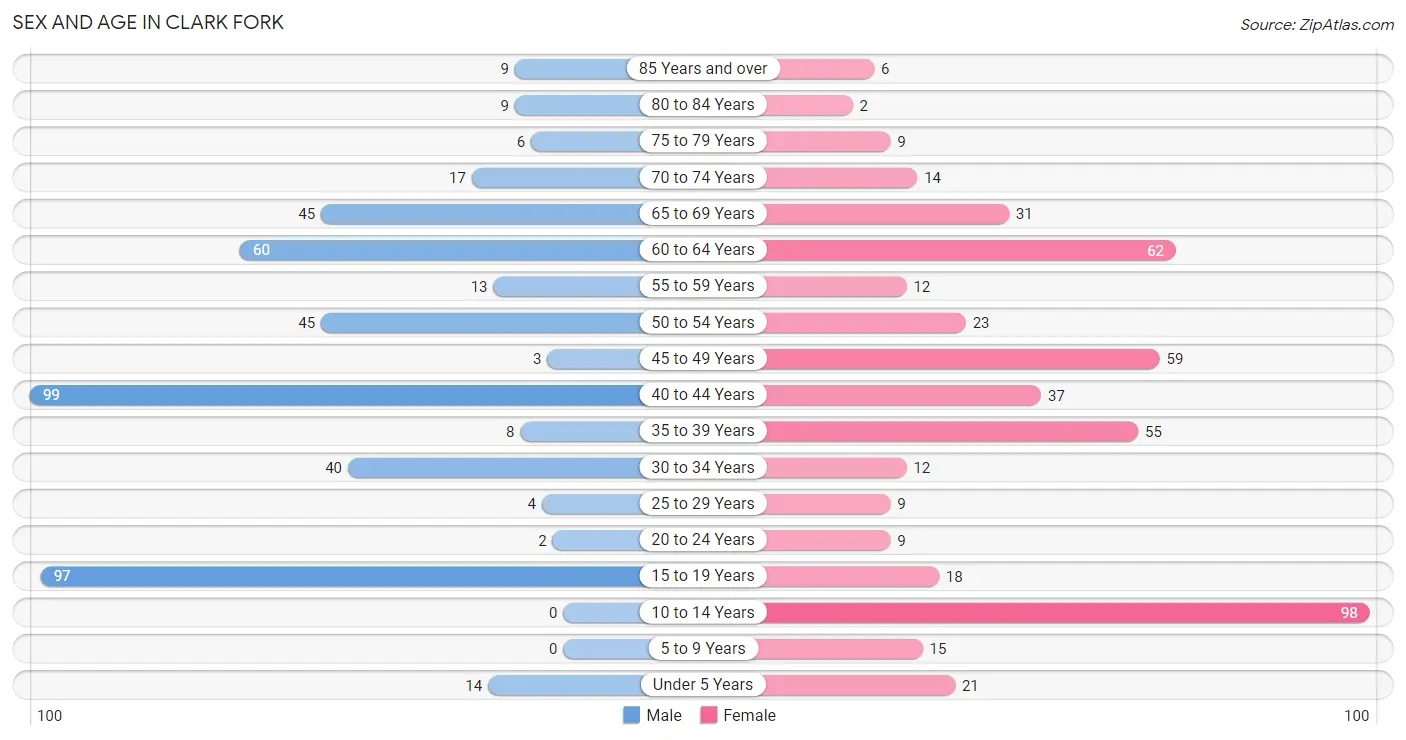
Sex and Age in Clark Fork
Sex and Age in Clark Fork
The most populous age groups in Clark Fork are 40 to 44 Years (99 | 21.0%) for men and 10 to 14 Years (98 | 19.9%) for women.
| Age Bracket | Male | Female |
| Under 5 Years | 14 (3.0%) | 21 (4.3%) |
| 5 to 9 Years | 0 (0.0%) | 15 (3.0%) |
| 10 to 14 Years | 0 (0.0%) | 98 (19.9%) |
| 15 to 19 Years | 97 (20.6%) | 18 (3.7%) |
| 20 to 24 Years | 2 (0.4%) | 9 (1.8%) |
| 25 to 29 Years | 4 (0.9%) | 9 (1.8%) |
| 30 to 34 Years | 40 (8.5%) | 12 (2.4%) |
| 35 to 39 Years | 8 (1.7%) | 55 (11.2%) |
| 40 to 44 Years | 99 (21.0%) | 37 (7.5%) |
| 45 to 49 Years | 3 (0.6%) | 59 (12.0%) |
| 50 to 54 Years | 45 (9.6%) | 23 (4.7%) |
| 55 to 59 Years | 13 (2.8%) | 12 (2.4%) |
| 60 to 64 Years | 60 (12.7%) | 62 (12.6%) |
| 65 to 69 Years | 45 (9.6%) | 31 (6.3%) |
| 70 to 74 Years | 17 (3.6%) | 14 (2.9%) |
| 75 to 79 Years | 6 (1.3%) | 9 (1.8%) |
| 80 to 84 Years | 9 (1.9%) | 2 (0.4%) |
| 85 Years and over | 9 (1.9%) | 6 (1.2%) |
| Total | 471 (100.0%) | 492 (100.0%) |
Families and Households in Clark Fork
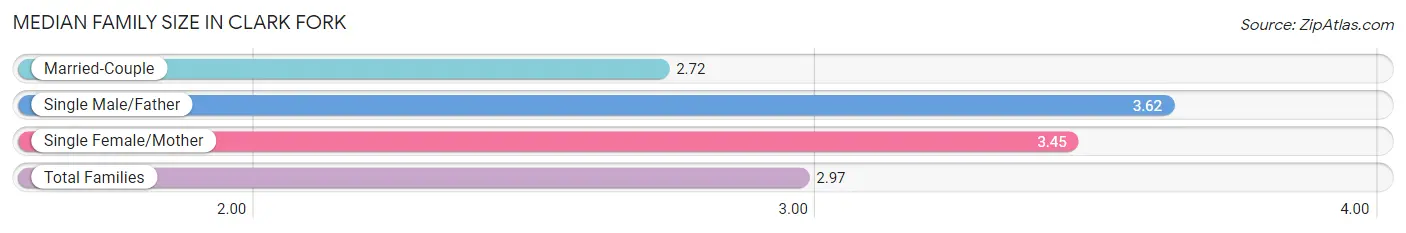
Median Family Size in Clark Fork
The median family size in Clark Fork is 2.97 persons per family, with single male/father families (21 | 12.1%) accounting for the largest median family size of 3.62 persons per family. On the other hand, married-couple families (119 | 68.8%) represent the smallest median family size with 2.72 persons per family.
| Family Type | # Families | Family Size |
| Married-Couple | 119 (68.8%) | 2.72 |
| Single Male/Father | 21 (12.1%) | 3.62 |
| Single Female/Mother | 33 (19.1%) | 3.45 |
| Total Families | 173 (100.0%) | 2.97 |
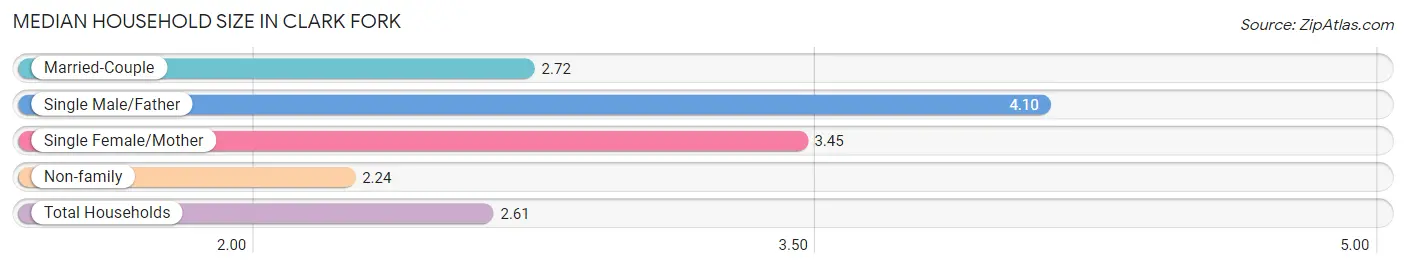
Median Household Size in Clark Fork
The median household size in Clark Fork is 2.61 persons per household, with single male/father households (21 | 5.7%) accounting for the largest median household size of 4.1 persons per household. non-family households (196 | 53.1%) represent the smallest median household size with 2.24 persons per household.
| Household Type | # Households | Household Size |
| Married-Couple | 119 (32.3%) | 2.72 |
| Single Male/Father | 21 (5.7%) | 4.10 |
| Single Female/Mother | 33 (8.9%) | 3.45 |
| Non-family | 196 (53.1%) | 2.24 |
| Total Households | 369 (100.0%) | 2.61 |
Household Size by Marriage Status in Clark Fork
Out of a total of 369 households in Clark Fork, 173 (46.9%) are family households, while 196 (53.1%) are nonfamily households. The most numerous type of family households are 2-person households, comprising 135, and the most common type of nonfamily households are 1-person households, comprising 93.
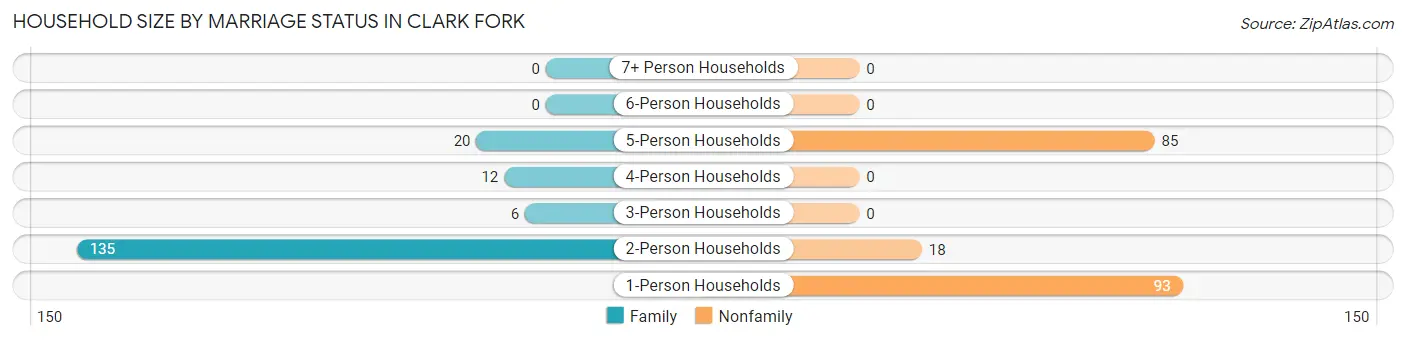
| Household Size | Family Households | Nonfamily Households |
| 1-Person Households | - | 93 (25.2%) |
| 2-Person Households | 135 (36.6%) | 18 (4.9%) |
| 3-Person Households | 6 (1.6%) | 0 (0.0%) |
| 4-Person Households | 12 (3.3%) | 0 (0.0%) |
| 5-Person Households | 20 (5.4%) | 85 (23.0%) |
| 6-Person Households | 0 (0.0%) | 0 (0.0%) |
| 7+ Person Households | 0 (0.0%) | 0 (0.0%) |
| Total | 173 (46.9%) | 196 (53.1%) |
Female Fertility in Clark Fork
Fertility by Age in Clark Fork
| Age Bracket | Women with Births | Births / 1,000 Women |
| 15 to 19 years | 0 (0.0%) | 0.0 |
| 20 to 34 years | 0 (0.0%) | 0.0 |
| 35 to 50 years | 0 (0.0%) | 0.0 |
| Total | 0 (0.0%) | 0.0 |
Fertility by Age by Marriage Status in Clark Fork
| Age Bracket | Married | Unmarried |
| 15 to 19 years | 0 (0.0%) | 0 (0.0%) |
| 20 to 34 years | 0 (0.0%) | 0 (0.0%) |
| 35 to 50 years | 0 (0.0%) | 0 (0.0%) |
| Total | 0 (0.0%) | 0 (0.0%) |
Fertility by Education in Clark Fork
| Educational Attainment | Women with Births | Births / 1,000 Women |
| Less than High School | 0 (0.0%) | 0.0 |
| High School Diploma | 0 (0.0%) | 0.0 |
| College or Associate's Degree | 0 (0.0%) | 0.0 |
| Bachelor's Degree | 0 (0.0%) | 0.0 |
| Graduate Degree | 0 (0.0%) | 0.0 |
| Total | 0 (0.0%) | 0.0 |
Fertility by Education by Marriage Status in Clark Fork
| Educational Attainment | Married | Unmarried |
| Less than High School | 0 (0.0%) | 0 (0.0%) |
| High School Diploma | 0 (0.0%) | 0 (0.0%) |
| College or Associate's Degree | 0 (0.0%) | 0 (0.0%) |
| Bachelor's Degree | 0 (0.0%) | 0 (0.0%) |
| Graduate Degree | 0 (0.0%) | 0 (0.0%) |
| Total | 0 (0.0%) | 0 (0.0%) |
Employment Characteristics in Clark Fork
Employment by Class of Employer in Clark Fork
Among the 426 employed individuals in Clark Fork, private company employees (237 | 55.6%), self-employed (not incorporated) (117 | 27.5%), and local government employees (22 | 5.2%) make up the most common classes of employment.
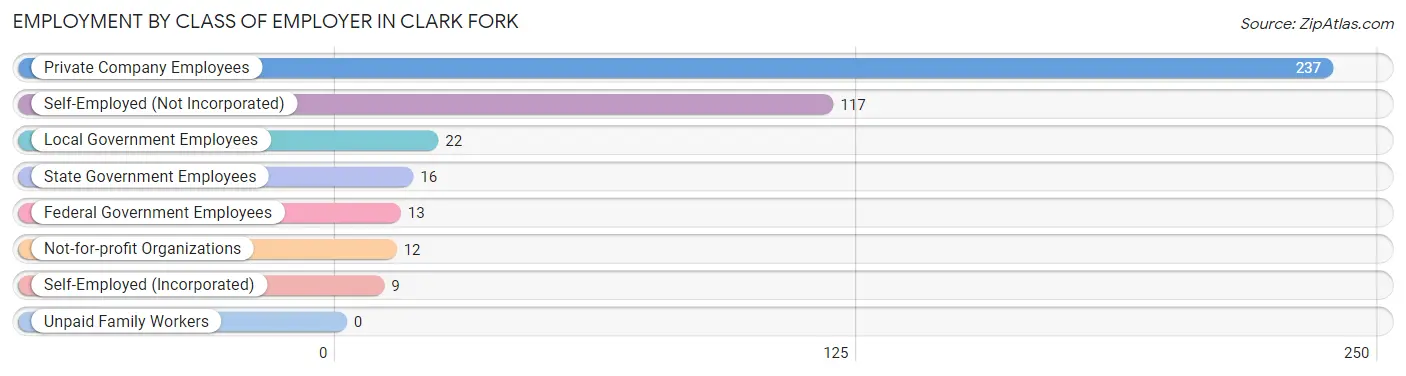
| Employer Class | # Employees | % Employees |
| Private Company Employees | 237 | 55.6% |
| Self-Employed (Incorporated) | 9 | 2.1% |
| Self-Employed (Not Incorporated) | 117 | 27.5% |
| Not-for-profit Organizations | 12 | 2.8% |
| Local Government Employees | 22 | 5.2% |
| State Government Employees | 16 | 3.8% |
| Federal Government Employees | 13 | 3.0% |
| Unpaid Family Workers | 0 | 0.0% |
| Total | 426 | 100.0% |
Employment Status by Age in Clark Fork
According to the labor force statistics for Clark Fork, out of the total population over 16 years of age (806), 61.4% or 495 individuals are in the labor force, with 12.9% or 64 of them unemployed. The age group with the highest labor force participation rate is 20 to 24 years, with 100.0% or 11 individuals in the labor force. Within the labor force, the 16 to 19 years age range has the highest percentage of unemployed individuals, with 66.0% or 64 of them being unemployed.
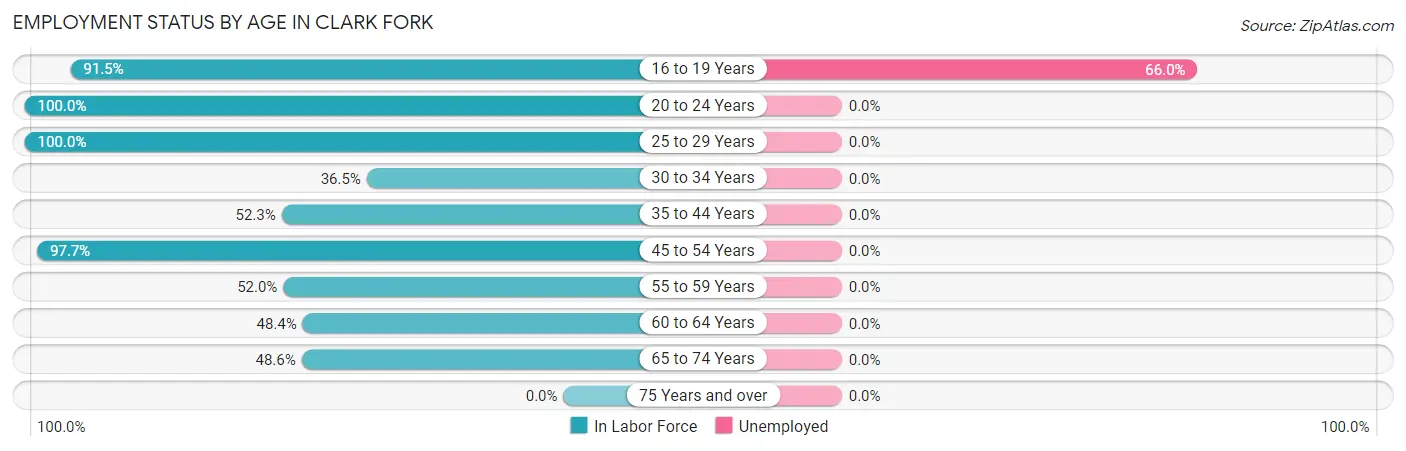
| Age Bracket | In Labor Force | Unemployed |
| 16 to 19 Years | 97 (91.5%) | 64 (66.0%) |
| 20 to 24 Years | 11 (100.0%) | 0 (0.0%) |
| 25 to 29 Years | 13 (100.0%) | 0 (0.0%) |
| 30 to 34 Years | 19 (36.5%) | 0 (0.0%) |
| 35 to 44 Years | 104 (52.3%) | 0 (0.0%) |
| 45 to 54 Years | 127 (97.7%) | 0 (0.0%) |
| 55 to 59 Years | 13 (52.0%) | 0 (0.0%) |
| 60 to 64 Years | 59 (48.4%) | 0 (0.0%) |
| 65 to 74 Years | 52 (48.6%) | 0 (0.0%) |
| 75 Years and over | 0 (0.0%) | 0 (0.0%) |
| Total | 495 (61.4%) | 64 (12.9%) |
Employment Status by Educational Attainment in Clark Fork
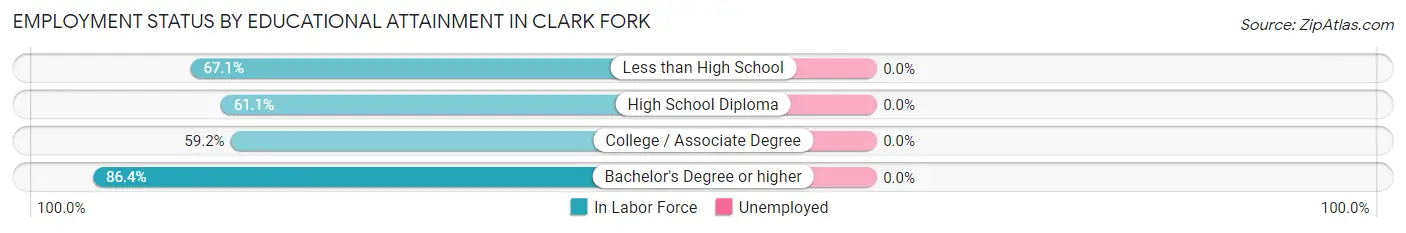
| Educational Attainment | In Labor Force | Unemployed |
| Less than High School | 51 (67.1%) | 0 (0.0%) |
| High School Diploma | 91 (61.1%) | 0 (0.0%) |
| College / Associate Degree | 174 (59.2%) | 0 (0.0%) |
| Bachelor's Degree or higher | 19 (86.4%) | 0 (0.0%) |
| Total | 335 (61.9%) | 0 (0.0%) |
Employment Occupations by Sex in Clark Fork
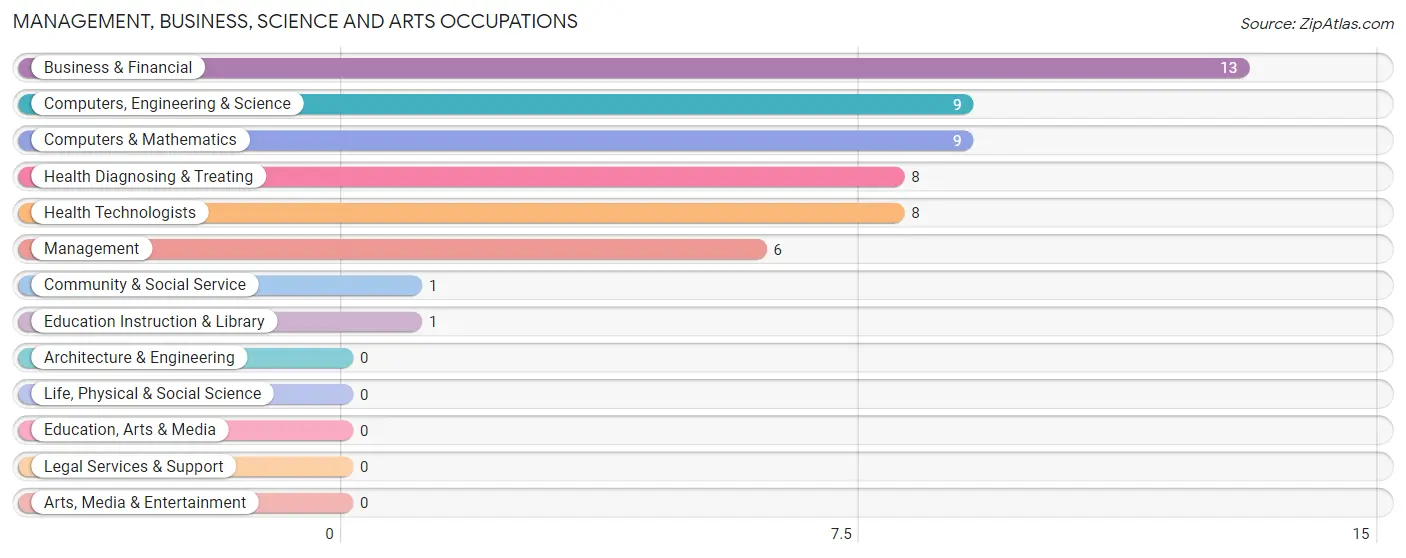
Management, Business, Science and Arts Occupations
The most common Management, Business, Science and Arts occupations in Clark Fork are Business & Financial (13 | 3.0%), Computers, Engineering & Science (9 | 2.1%), Computers & Mathematics (9 | 2.1%), Health Diagnosing & Treating (8 | 1.9%), and Health Technologists (8 | 1.9%).
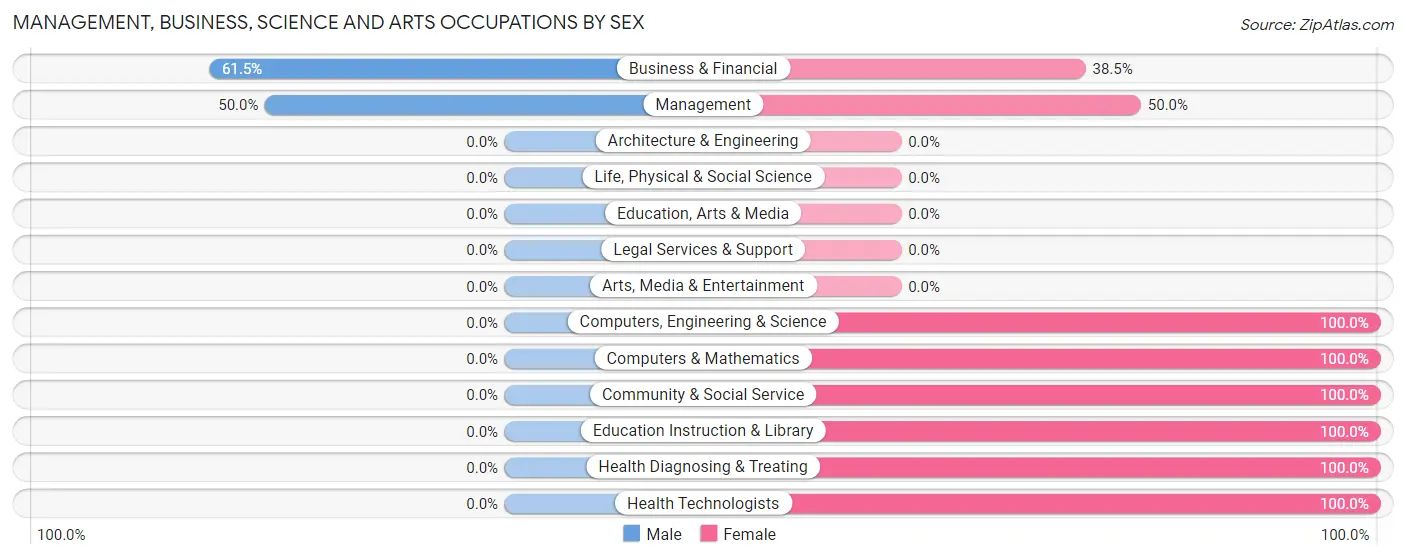
Management, Business, Science and Arts Occupations by Sex
Within the Management, Business, Science and Arts occupations in Clark Fork, the most male-oriented occupations are Business & Financial (61.5%), and Management (50.0%), while the most female-oriented occupations are Computers, Engineering & Science (100.0%), Computers & Mathematics (100.0%), and Community & Social Service (100.0%).
| Occupation | Male | Female |
| Management | 3 (50.0%) | 3 (50.0%) |
| Business & Financial | 8 (61.5%) | 5 (38.5%) |
| Computers, Engineering & Science | 0 (0.0%) | 9 (100.0%) |
| Computers & Mathematics | 0 (0.0%) | 9 (100.0%) |
| Architecture & Engineering | 0 (0.0%) | 0 (0.0%) |
| Life, Physical & Social Science | 0 (0.0%) | 0 (0.0%) |
| Community & Social Service | 0 (0.0%) | 1 (100.0%) |
| Education, Arts & Media | 0 (0.0%) | 0 (0.0%) |
| Legal Services & Support | 0 (0.0%) | 0 (0.0%) |
| Education Instruction & Library | 0 (0.0%) | 1 (100.0%) |
| Arts, Media & Entertainment | 0 (0.0%) | 0 (0.0%) |
| Health Diagnosing & Treating | 0 (0.0%) | 8 (100.0%) |
| Health Technologists | 0 (0.0%) | 8 (100.0%) |
| Total (Category) | 11 (29.7%) | 26 (70.3%) |
| Total (Overall) | 191 (44.3%) | 240 (55.7%) |
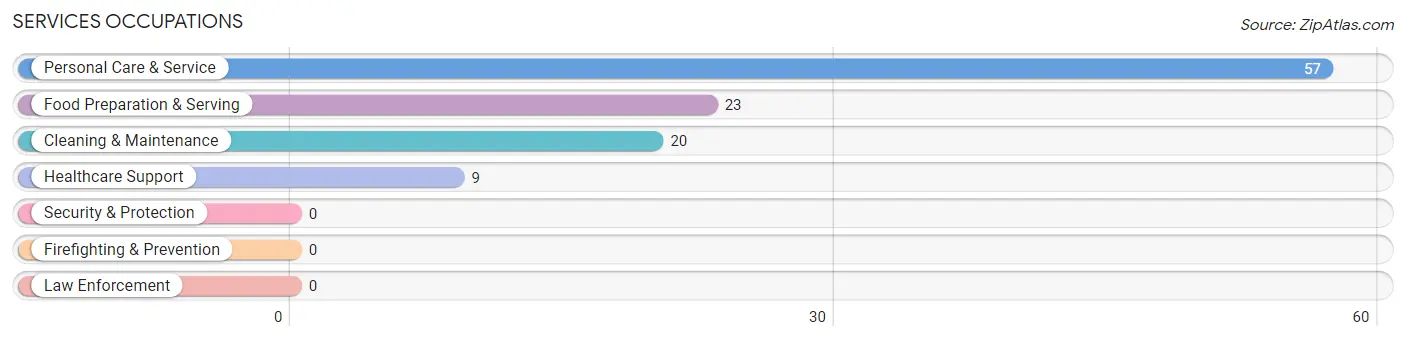
Services Occupations
The most common Services occupations in Clark Fork are Personal Care & Service (57 | 13.2%), Food Preparation & Serving (23 | 5.3%), Cleaning & Maintenance (20 | 4.6%), and Healthcare Support (9 | 2.1%).
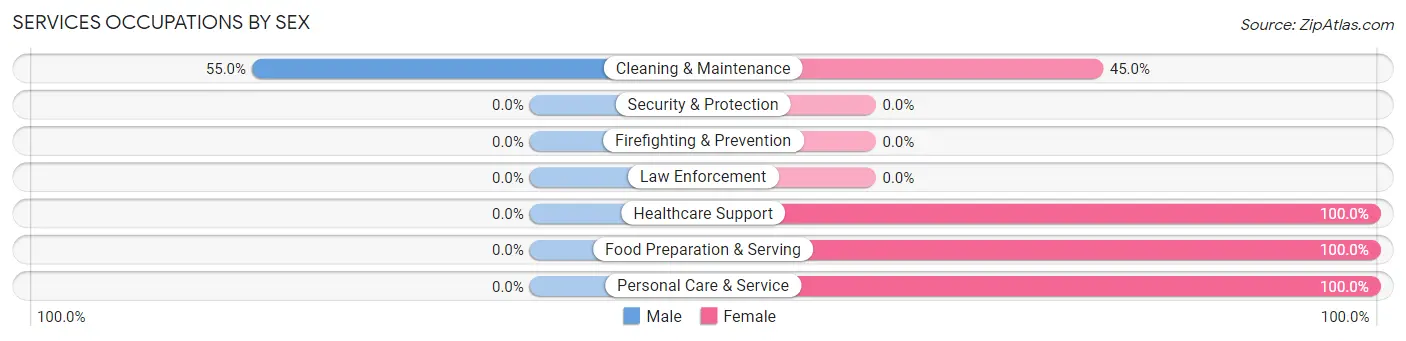
Services Occupations by Sex
| Occupation | Male | Female |
| Healthcare Support | 0 (0.0%) | 9 (100.0%) |
| Security & Protection | 0 (0.0%) | 0 (0.0%) |
| Firefighting & Prevention | 0 (0.0%) | 0 (0.0%) |
| Law Enforcement | 0 (0.0%) | 0 (0.0%) |
| Food Preparation & Serving | 0 (0.0%) | 23 (100.0%) |
| Cleaning & Maintenance | 11 (55.0%) | 9 (45.0%) |
| Personal Care & Service | 0 (0.0%) | 57 (100.0%) |
| Total (Category) | 11 (10.1%) | 98 (89.9%) |
| Total (Overall) | 191 (44.3%) | 240 (55.7%) |
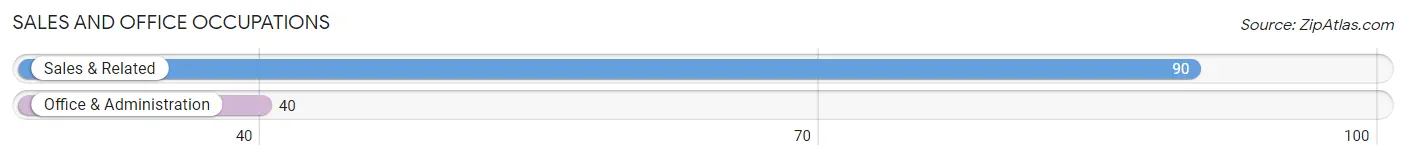
Sales and Office Occupations
The most common Sales and Office occupations in Clark Fork are Sales & Related (90 | 20.9%), and Office & Administration (40 | 9.3%).
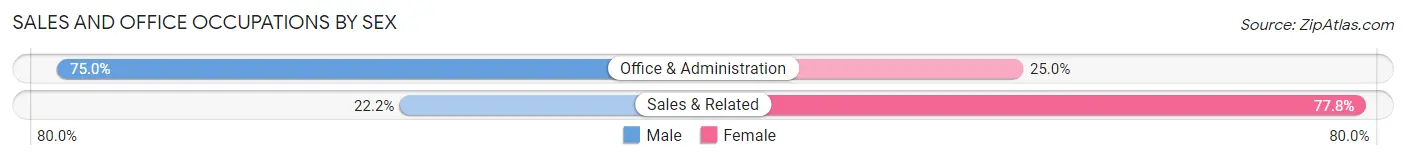
Sales and Office Occupations by Sex
| Occupation | Male | Female |
| Sales & Related | 20 (22.2%) | 70 (77.8%) |
| Office & Administration | 30 (75.0%) | 10 (25.0%) |
| Total (Category) | 50 (38.5%) | 80 (61.5%) |
| Total (Overall) | 191 (44.3%) | 240 (55.7%) |
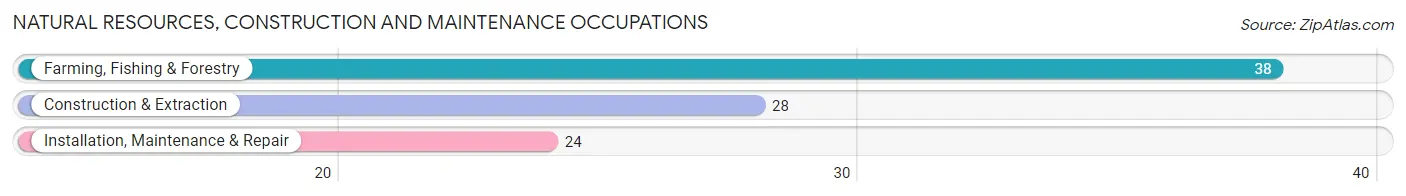
Natural Resources, Construction and Maintenance Occupations
The most common Natural Resources, Construction and Maintenance occupations in Clark Fork are Farming, Fishing & Forestry (38 | 8.8%), Construction & Extraction (28 | 6.5%), and Installation, Maintenance & Repair (24 | 5.6%).
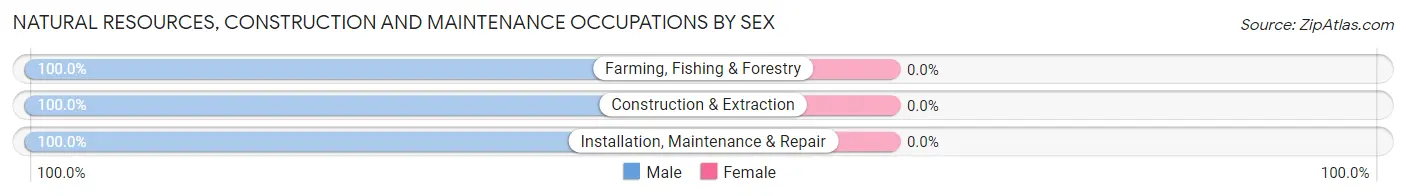
Natural Resources, Construction and Maintenance Occupations by Sex
| Occupation | Male | Female |
| Farming, Fishing & Forestry | 38 (100.0%) | 0 (0.0%) |
| Construction & Extraction | 28 (100.0%) | 0 (0.0%) |
| Installation, Maintenance & Repair | 24 (100.0%) | 0 (0.0%) |
| Total (Category) | 90 (100.0%) | 0 (0.0%) |
| Total (Overall) | 191 (44.3%) | 240 (55.7%) |
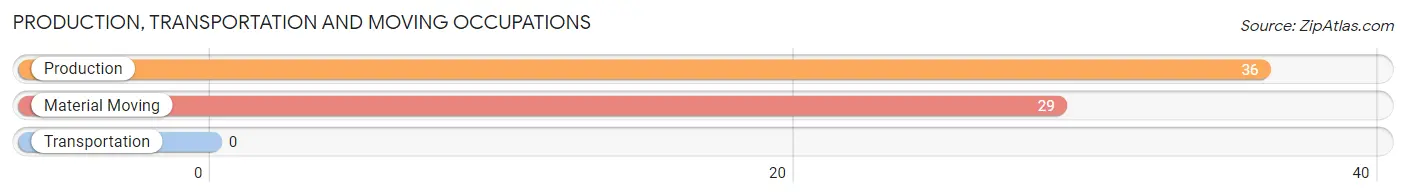
Production, Transportation and Moving Occupations
The most common Production, Transportation and Moving occupations in Clark Fork are Production (36 | 8.4%), and Material Moving (29 | 6.7%).
Production, Transportation and Moving Occupations by Sex
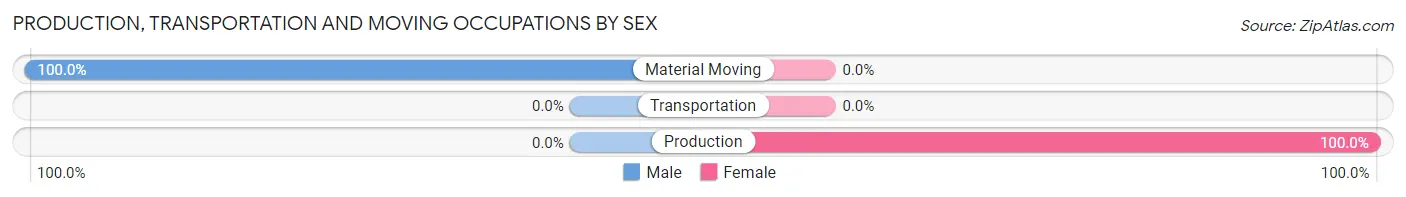
| Occupation | Male | Female |
| Production | 0 (0.0%) | 36 (100.0%) |
| Transportation | 0 (0.0%) | 0 (0.0%) |
| Material Moving | 29 (100.0%) | 0 (0.0%) |
| Total (Category) | 29 (44.6%) | 36 (55.4%) |
| Total (Overall) | 191 (44.3%) | 240 (55.7%) |
Employment Industries by Sex in Clark Fork
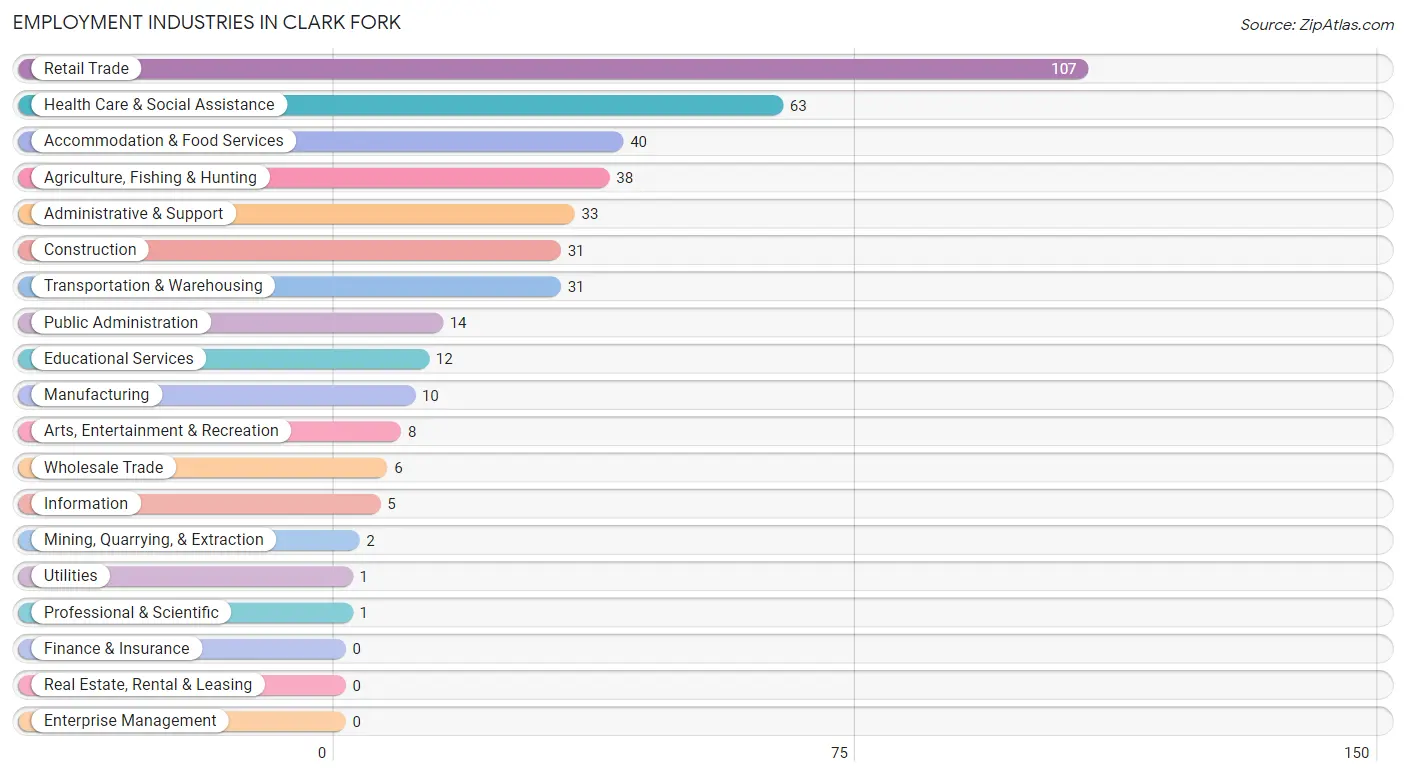
Employment Industries in Clark Fork
The major employment industries in Clark Fork include Retail Trade (107 | 24.8%), Health Care & Social Assistance (63 | 14.6%), Accommodation & Food Services (40 | 9.3%), Agriculture, Fishing & Hunting (38 | 8.8%), and Administrative & Support (33 | 7.7%).
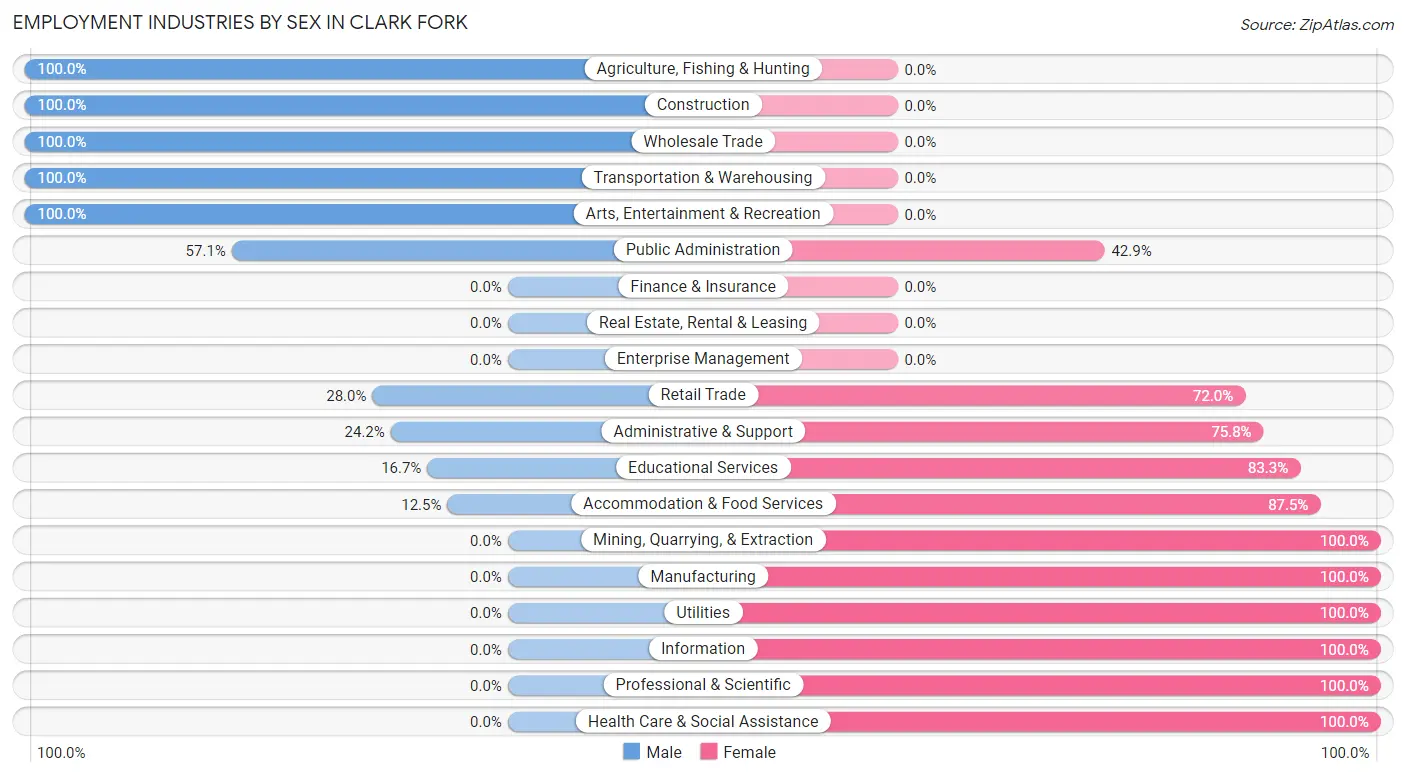
Employment Industries by Sex in Clark Fork
The Clark Fork industries that see more men than women are Agriculture, Fishing & Hunting (100.0%), Construction (100.0%), and Wholesale Trade (100.0%), whereas the industries that tend to have a higher number of women are Mining, Quarrying, & Extraction (100.0%), Manufacturing (100.0%), and Utilities (100.0%).
| Industry | Male | Female |
| Agriculture, Fishing & Hunting | 38 (100.0%) | 0 (0.0%) |
| Mining, Quarrying, & Extraction | 0 (0.0%) | 2 (100.0%) |
| Construction | 31 (100.0%) | 0 (0.0%) |
| Manufacturing | 0 (0.0%) | 10 (100.0%) |
| Wholesale Trade | 6 (100.0%) | 0 (0.0%) |
| Retail Trade | 30 (28.0%) | 77 (72.0%) |
| Transportation & Warehousing | 31 (100.0%) | 0 (0.0%) |
| Utilities | 0 (0.0%) | 1 (100.0%) |
| Information | 0 (0.0%) | 5 (100.0%) |
| Finance & Insurance | 0 (0.0%) | 0 (0.0%) |
| Real Estate, Rental & Leasing | 0 (0.0%) | 0 (0.0%) |
| Professional & Scientific | 0 (0.0%) | 1 (100.0%) |
| Enterprise Management | 0 (0.0%) | 0 (0.0%) |
| Administrative & Support | 8 (24.2%) | 25 (75.8%) |
| Educational Services | 2 (16.7%) | 10 (83.3%) |
| Health Care & Social Assistance | 0 (0.0%) | 63 (100.0%) |
| Arts, Entertainment & Recreation | 8 (100.0%) | 0 (0.0%) |
| Accommodation & Food Services | 5 (12.5%) | 35 (87.5%) |
| Public Administration | 8 (57.1%) | 6 (42.9%) |
| Total | 191 (44.3%) | 240 (55.7%) |
Education in Clark Fork
School Enrollment in Clark Fork
The most common levels of schooling among the 218 students in Clark Fork are high school (87 | 39.9%), middle school (86 | 39.5%), and elementary school (16 | 7.3%).
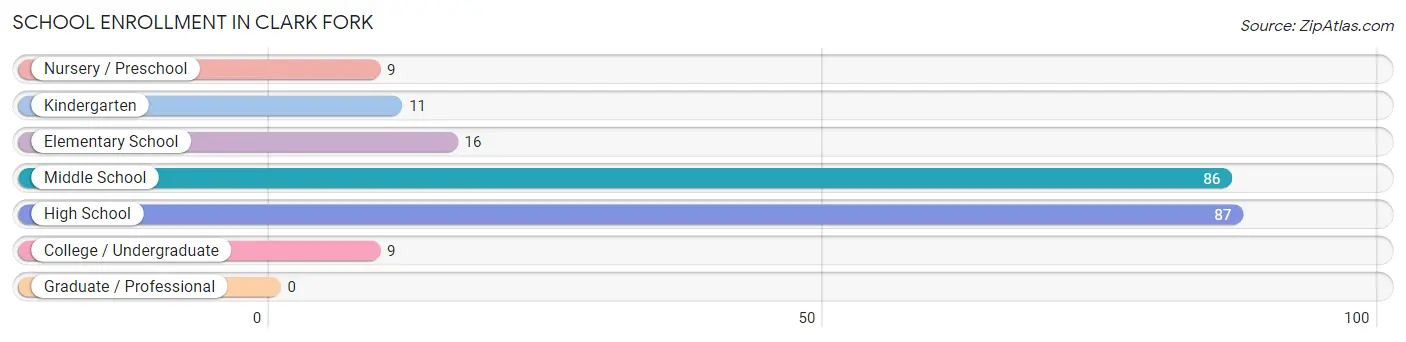
| School Level | # Students | % Students |
| Nursery / Preschool | 9 | 4.1% |
| Kindergarten | 11 | 5.1% |
| Elementary School | 16 | 7.3% |
| Middle School | 86 | 39.5% |
| High School | 87 | 39.9% |
| College / Undergraduate | 9 | 4.1% |
| Graduate / Professional | 0 | 0.0% |
| Total | 218 | 100.0% |
School Enrollment by Age by Funding Source in Clark Fork
Out of a total of 218 students who are enrolled in schools in Clark Fork, 64 (29.4%) attend a private institution, while the remaining 154 (70.6%) are enrolled in public schools. The age group of 18 to 19 year olds has the highest likelihood of being enrolled in private schools, with 64 (100.0% in the age bracket) enrolled. Conversely, the age group of 3 to 4 year olds has the lowest likelihood of being enrolled in a private school, with 9 (100.0% in the age bracket) attending a public institution.
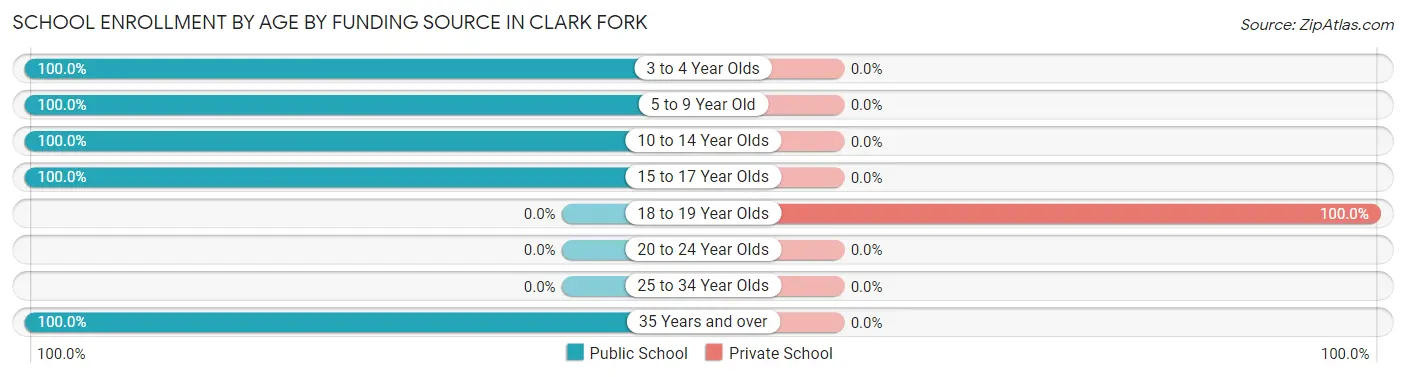
| Age Bracket | Public School | Private School |
| 3 to 4 Year Olds | 9 (100.0%) | 0 (0.0%) |
| 5 to 9 Year Old | 15 (100.0%) | 0 (0.0%) |
| 10 to 14 Year Olds | 98 (100.0%) | 0 (0.0%) |
| 15 to 17 Year Olds | 23 (100.0%) | 0 (0.0%) |
| 18 to 19 Year Olds | 0 (0.0%) | 64 (100.0%) |
| 20 to 24 Year Olds | 0 (0.0%) | 0 (0.0%) |
| 25 to 34 Year Olds | 0 (0.0%) | 0 (0.0%) |
| 35 Years and over | 9 (100.0%) | 0 (0.0%) |
| Total | 154 (70.6%) | 64 (29.4%) |
Educational Attainment by Field of Study in Clark Fork
Education (19 | 30.6%), science & technology (10 | 16.1%), communications (10 | 16.1%), arts & humanities (8 | 12.9%), and social sciences (4 | 6.5%) are the most common fields of study among 62 individuals in Clark Fork who have obtained a bachelor's degree or higher.
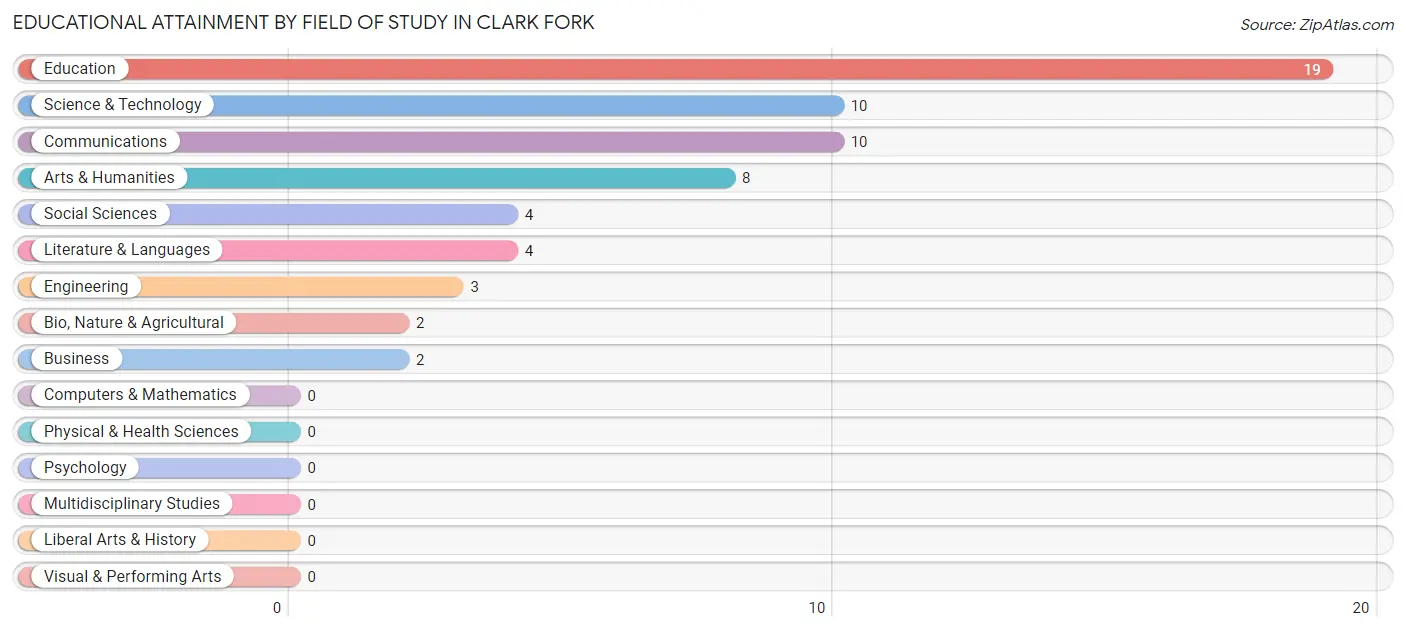
| Field of Study | # Graduates | % Graduates |
| Computers & Mathematics | 0 | 0.0% |
| Bio, Nature & Agricultural | 2 | 3.2% |
| Physical & Health Sciences | 0 | 0.0% |
| Psychology | 0 | 0.0% |
| Social Sciences | 4 | 6.5% |
| Engineering | 3 | 4.8% |
| Multidisciplinary Studies | 0 | 0.0% |
| Science & Technology | 10 | 16.1% |
| Business | 2 | 3.2% |
| Education | 19 | 30.6% |
| Literature & Languages | 4 | 6.5% |
| Liberal Arts & History | 0 | 0.0% |
| Visual & Performing Arts | 0 | 0.0% |
| Communications | 10 | 16.1% |
| Arts & Humanities | 8 | 12.9% |
| Total | 62 | 100.0% |
Transportation & Commute in Clark Fork
Vehicle Availability by Sex in Clark Fork
The most prevalent vehicle ownership categories in Clark Fork are males with 2 vehicles (71, accounting for 38.2%) and females with 2 vehicles (51, making up 29.6%).
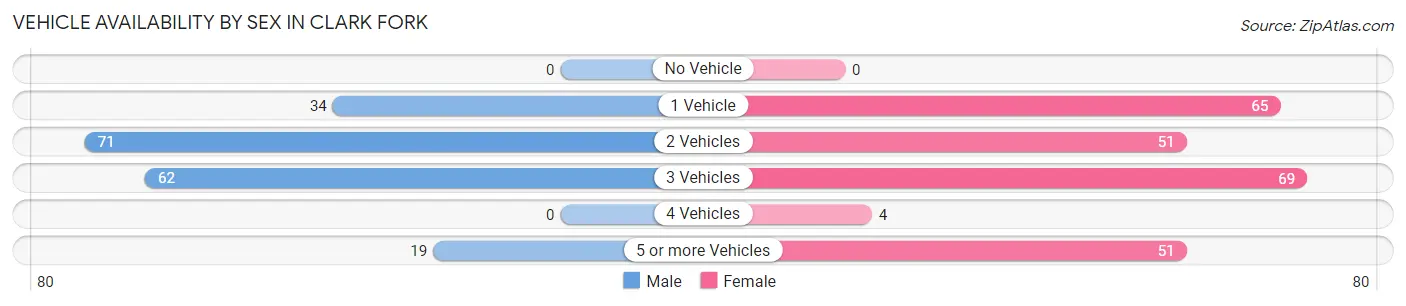
| Vehicles Available | Male | Female |
| No Vehicle | 0 (0.0%) | 0 (0.0%) |
| 1 Vehicle | 34 (18.3%) | 65 (27.1%) |
| 2 Vehicles | 71 (38.2%) | 51 (21.2%) |
| 3 Vehicles | 62 (33.3%) | 69 (28.7%) |
| 4 Vehicles | 0 (0.0%) | 4 (1.7%) |
| 5 or more Vehicles | 19 (10.2%) | 51 (21.2%) |
| Total | 186 (100.0%) | 240 (100.0%) |
Commute Time in Clark Fork
The most frequently occuring commute durations in Clark Fork are 5 to 9 minutes (70 commuters, 19.4%), 10 to 14 minutes (54 commuters, 15.0%), and less than 5 minutes (50 commuters, 13.9%).
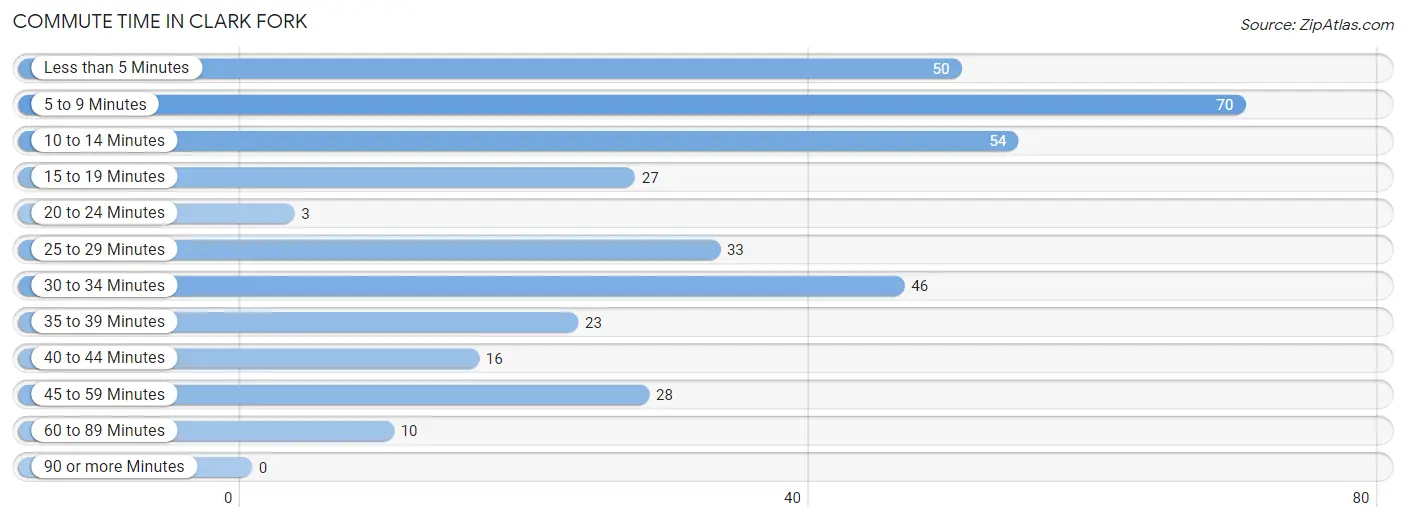
| Commute Time | # Commuters | % Commuters |
| Less than 5 Minutes | 50 | 13.9% |
| 5 to 9 Minutes | 70 | 19.4% |
| 10 to 14 Minutes | 54 | 15.0% |
| 15 to 19 Minutes | 27 | 7.5% |
| 20 to 24 Minutes | 3 | 0.8% |
| 25 to 29 Minutes | 33 | 9.2% |
| 30 to 34 Minutes | 46 | 12.8% |
| 35 to 39 Minutes | 23 | 6.4% |
| 40 to 44 Minutes | 16 | 4.4% |
| 45 to 59 Minutes | 28 | 7.8% |
| 60 to 89 Minutes | 10 | 2.8% |
| 90 or more Minutes | 0 | 0.0% |
Commute Time by Sex in Clark Fork
The most common commute times in Clark Fork are 5 to 9 minutes (40 commuters, 21.5%) for males and 10 to 14 minutes (54 commuters, 31.0%) for females.
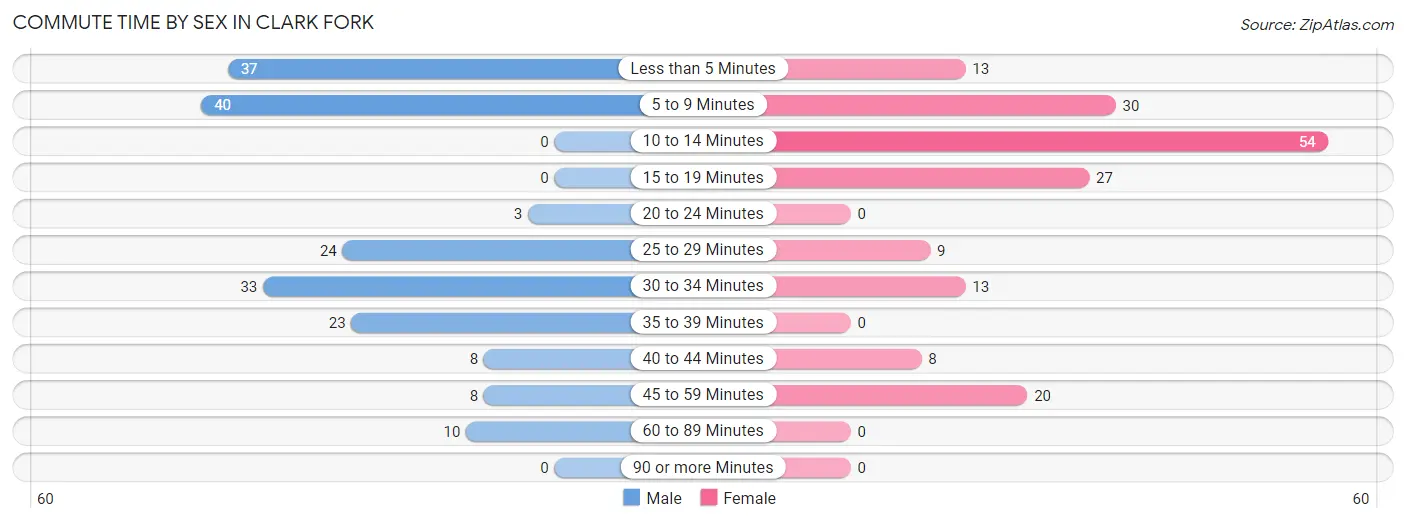
| Commute Time | Male | Female |
| Less than 5 Minutes | 37 (19.9%) | 13 (7.5%) |
| 5 to 9 Minutes | 40 (21.5%) | 30 (17.2%) |
| 10 to 14 Minutes | 0 (0.0%) | 54 (31.0%) |
| 15 to 19 Minutes | 0 (0.0%) | 27 (15.5%) |
| 20 to 24 Minutes | 3 (1.6%) | 0 (0.0%) |
| 25 to 29 Minutes | 24 (12.9%) | 9 (5.2%) |
| 30 to 34 Minutes | 33 (17.7%) | 13 (7.5%) |
| 35 to 39 Minutes | 23 (12.4%) | 0 (0.0%) |
| 40 to 44 Minutes | 8 (4.3%) | 8 (4.6%) |
| 45 to 59 Minutes | 8 (4.3%) | 20 (11.5%) |
| 60 to 89 Minutes | 10 (5.4%) | 0 (0.0%) |
| 90 or more Minutes | 0 (0.0%) | 0 (0.0%) |
Time of Departure to Work by Sex in Clark Fork
The most frequent times of departure to work in Clark Fork are 6:30 AM to 6:59 AM (31, 16.7%) for males and 12:00 PM to 3:59 PM (54, 31.0%) for females.
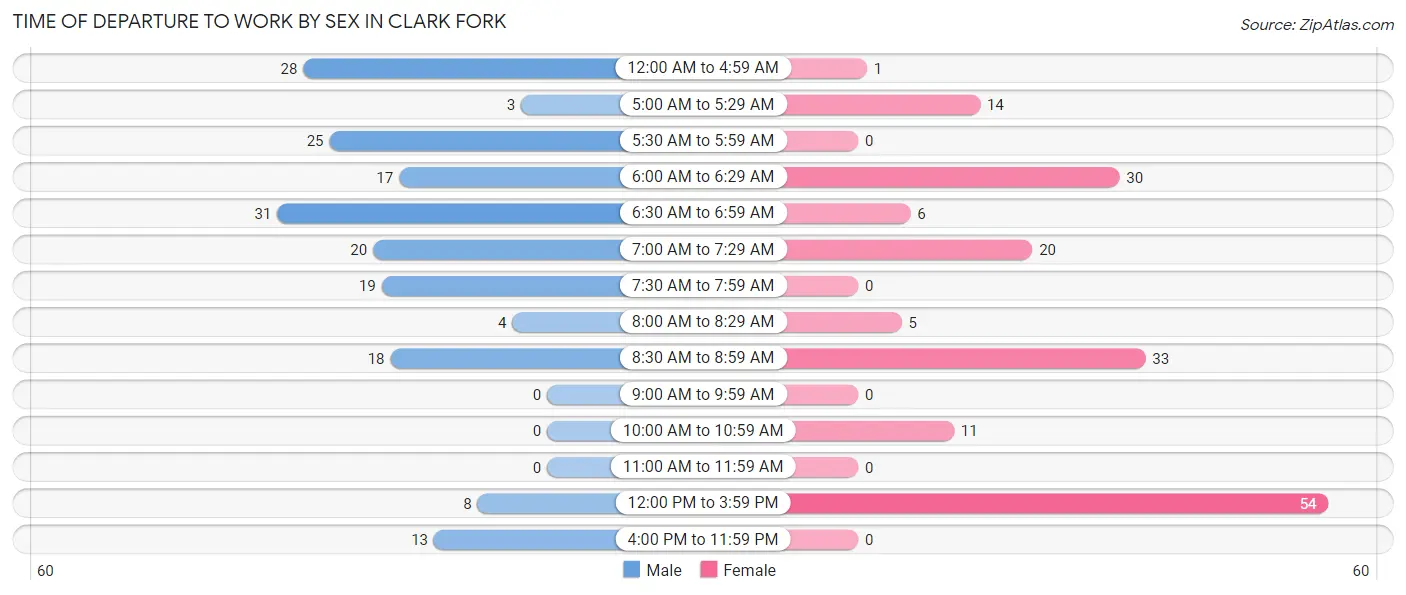
| Time of Departure | Male | Female |
| 12:00 AM to 4:59 AM | 28 (15.0%) | 1 (0.6%) |
| 5:00 AM to 5:29 AM | 3 (1.6%) | 14 (8.1%) |
| 5:30 AM to 5:59 AM | 25 (13.4%) | 0 (0.0%) |
| 6:00 AM to 6:29 AM | 17 (9.1%) | 30 (17.2%) |
| 6:30 AM to 6:59 AM | 31 (16.7%) | 6 (3.5%) |
| 7:00 AM to 7:29 AM | 20 (10.7%) | 20 (11.5%) |
| 7:30 AM to 7:59 AM | 19 (10.2%) | 0 (0.0%) |
| 8:00 AM to 8:29 AM | 4 (2.1%) | 5 (2.9%) |
| 8:30 AM to 8:59 AM | 18 (9.7%) | 33 (19.0%) |
| 9:00 AM to 9:59 AM | 0 (0.0%) | 0 (0.0%) |
| 10:00 AM to 10:59 AM | 0 (0.0%) | 11 (6.3%) |
| 11:00 AM to 11:59 AM | 0 (0.0%) | 0 (0.0%) |
| 12:00 PM to 3:59 PM | 8 (4.3%) | 54 (31.0%) |
| 4:00 PM to 11:59 PM | 13 (7.0%) | 0 (0.0%) |
| Total | 186 (100.0%) | 174 (100.0%) |
Housing Occupancy in Clark Fork
Occupancy by Ownership in Clark Fork
Of the total 369 dwellings in Clark Fork, owner-occupied units account for 215 (58.3%), while renter-occupied units make up 154 (41.7%).
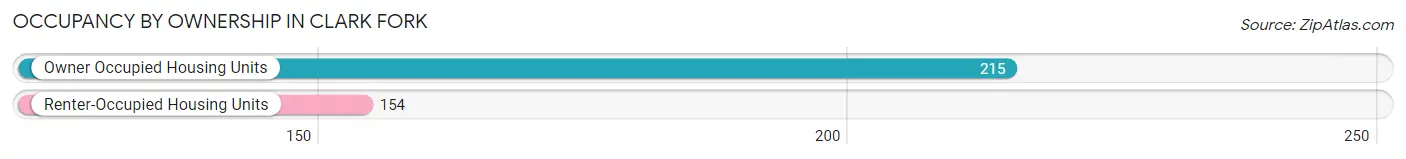
| Occupancy | # Housing Units | % Housing Units |
| Owner Occupied Housing Units | 215 | 58.3% |
| Renter-Occupied Housing Units | 154 | 41.7% |
| Total Occupied Housing Units | 369 | 100.0% |
Occupancy by Household Size in Clark Fork
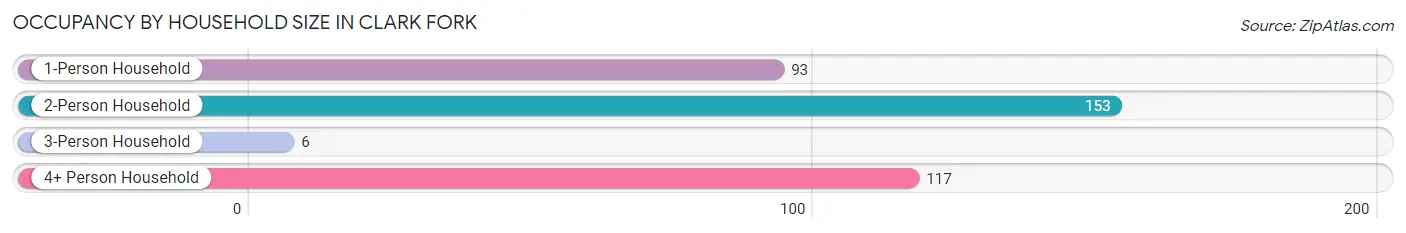
| Household Size | # Housing Units | % Housing Units |
| 1-Person Household | 93 | 25.2% |
| 2-Person Household | 153 | 41.5% |
| 3-Person Household | 6 | 1.6% |
| 4+ Person Household | 117 | 31.7% |
| Total Housing Units | 369 | 100.0% |
Occupancy by Ownership by Household Size in Clark Fork
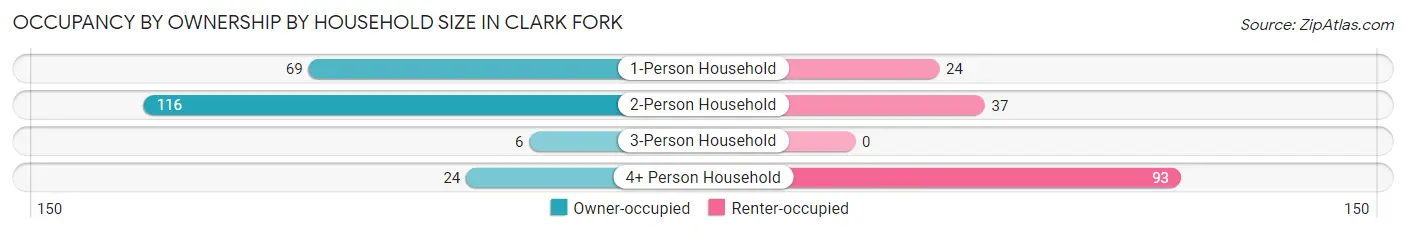
| Household Size | Owner-occupied | Renter-occupied |
| 1-Person Household | 69 (74.2%) | 24 (25.8%) |
| 2-Person Household | 116 (75.8%) | 37 (24.2%) |
| 3-Person Household | 6 (100.0%) | 0 (0.0%) |
| 4+ Person Household | 24 (20.5%) | 93 (79.5%) |
| Total Housing Units | 215 (58.3%) | 154 (41.7%) |
Occupancy by Educational Attainment in Clark Fork
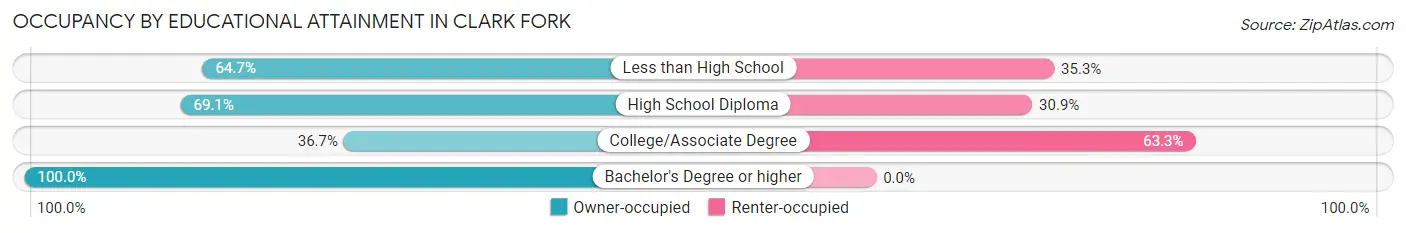
| Household Size | Owner-occupied | Renter-occupied |
| Less than High School | 22 (64.7%) | 12 (35.3%) |
| High School Diploma | 67 (69.1%) | 30 (30.9%) |
| College/Associate Degree | 65 (36.7%) | 112 (63.3%) |
| Bachelor's Degree or higher | 61 (100.0%) | 0 (0.0%) |
Occupancy by Age of Householder in Clark Fork
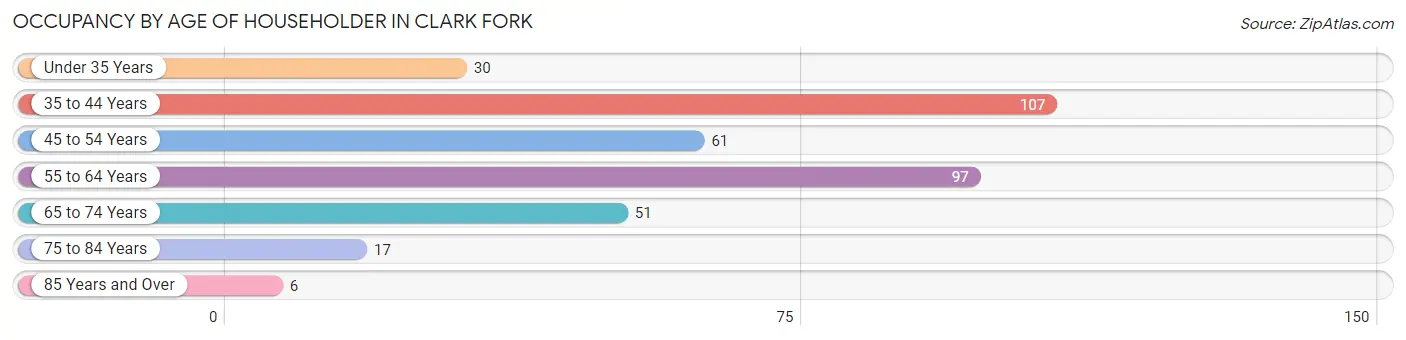
| Age Bracket | # Households | % Households |
| Under 35 Years | 30 | 8.1% |
| 35 to 44 Years | 107 | 29.0% |
| 45 to 54 Years | 61 | 16.5% |
| 55 to 64 Years | 97 | 26.3% |
| 65 to 74 Years | 51 | 13.8% |
| 75 to 84 Years | 17 | 4.6% |
| 85 Years and Over | 6 | 1.6% |
| Total | 369 | 100.0% |
Housing Finances in Clark Fork
Median Income by Occupancy in Clark Fork
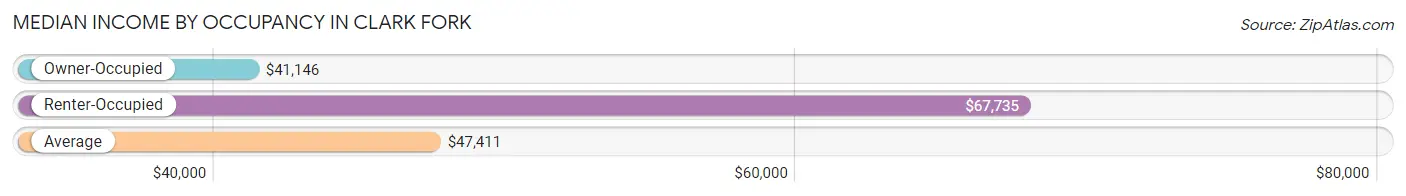
| Occupancy Type | # Households | Median Income |
| Owner-Occupied | 215 (58.3%) | $41,146 |
| Renter-Occupied | 154 (41.7%) | $67,735 |
| Average | 369 (100.0%) | $47,411 |
Occupancy by Householder Income Bracket in Clark Fork
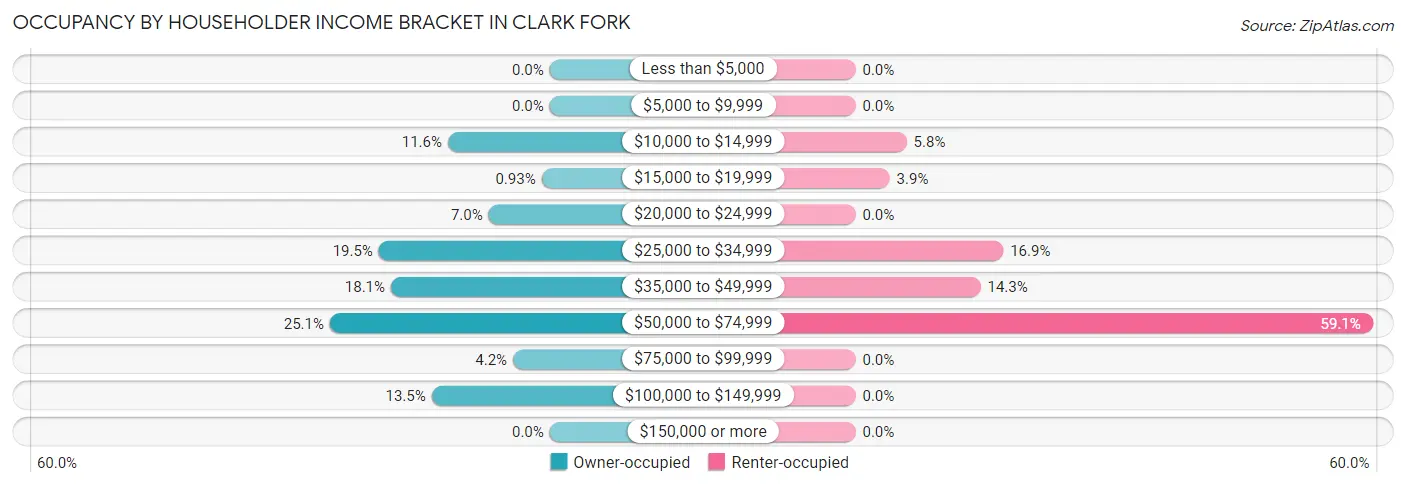
| Income Bracket | Owner-occupied | Renter-occupied |
| Less than $5,000 | 0 (0.0%) | 0 (0.0%) |
| $5,000 to $9,999 | 0 (0.0%) | 0 (0.0%) |
| $10,000 to $14,999 | 25 (11.6%) | 9 (5.8%) |
| $15,000 to $19,999 | 2 (0.9%) | 6 (3.9%) |
| $20,000 to $24,999 | 15 (7.0%) | 0 (0.0%) |
| $25,000 to $34,999 | 42 (19.5%) | 26 (16.9%) |
| $35,000 to $49,999 | 39 (18.1%) | 22 (14.3%) |
| $50,000 to $74,999 | 54 (25.1%) | 91 (59.1%) |
| $75,000 to $99,999 | 9 (4.2%) | 0 (0.0%) |
| $100,000 to $149,999 | 29 (13.5%) | 0 (0.0%) |
| $150,000 or more | 0 (0.0%) | 0 (0.0%) |
| Total | 215 (100.0%) | 154 (100.0%) |
Monthly Housing Cost Tiers in Clark Fork
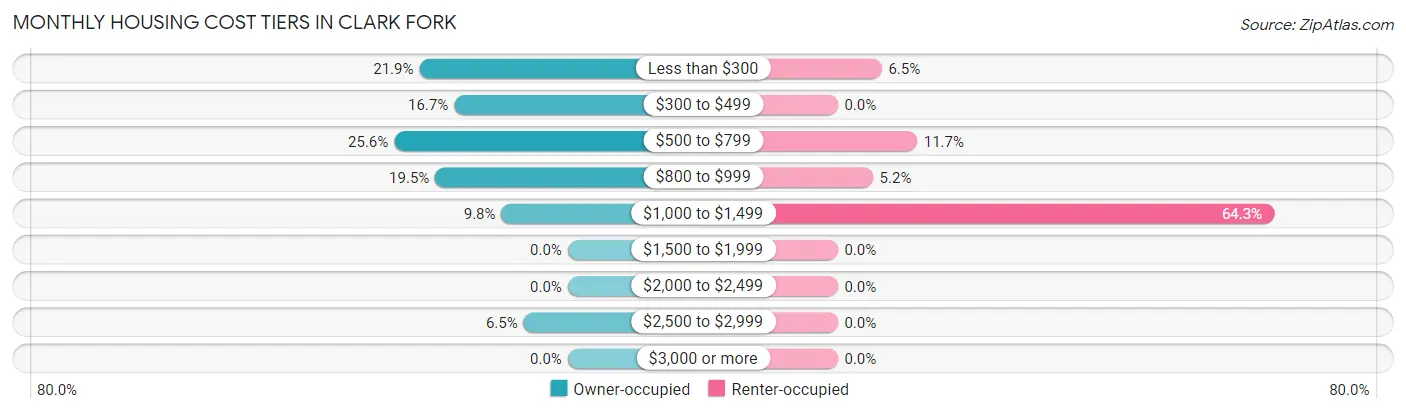
| Monthly Cost | Owner-occupied | Renter-occupied |
| Less than $300 | 47 (21.9%) | 10 (6.5%) |
| $300 to $499 | 36 (16.7%) | 0 (0.0%) |
| $500 to $799 | 55 (25.6%) | 18 (11.7%) |
| $800 to $999 | 42 (19.5%) | 8 (5.2%) |
| $1,000 to $1,499 | 21 (9.8%) | 99 (64.3%) |
| $1,500 to $1,999 | 0 (0.0%) | 0 (0.0%) |
| $2,000 to $2,499 | 0 (0.0%) | 0 (0.0%) |
| $2,500 to $2,999 | 14 (6.5%) | 0 (0.0%) |
| $3,000 or more | 0 (0.0%) | 0 (0.0%) |
| Total | 215 (100.0%) | 154 (100.0%) |
Physical Housing Characteristics in Clark Fork
Housing Structures in Clark Fork
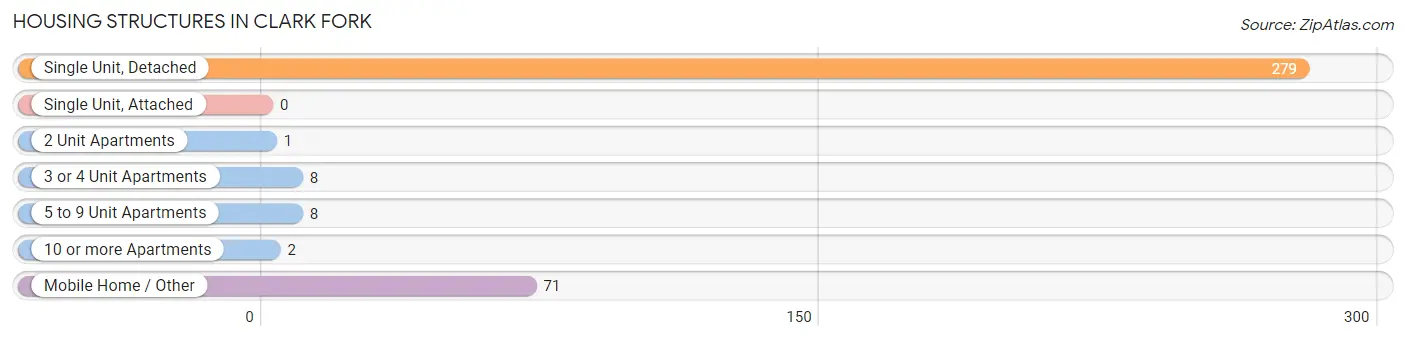
| Structure Type | # Housing Units | % Housing Units |
| Single Unit, Detached | 279 | 75.6% |
| Single Unit, Attached | 0 | 0.0% |
| 2 Unit Apartments | 1 | 0.3% |
| 3 or 4 Unit Apartments | 8 | 2.2% |
| 5 to 9 Unit Apartments | 8 | 2.2% |
| 10 or more Apartments | 2 | 0.5% |
| Mobile Home / Other | 71 | 19.2% |
| Total | 369 | 100.0% |
Housing Structures by Occupancy in Clark Fork
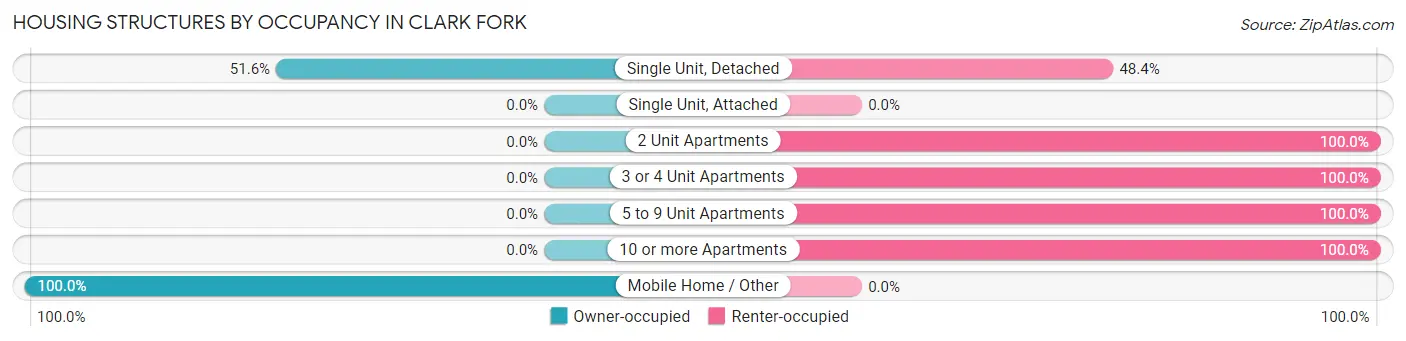
| Structure Type | Owner-occupied | Renter-occupied |
| Single Unit, Detached | 144 (51.6%) | 135 (48.4%) |
| Single Unit, Attached | 0 (0.0%) | 0 (0.0%) |
| 2 Unit Apartments | 0 (0.0%) | 1 (100.0%) |
| 3 or 4 Unit Apartments | 0 (0.0%) | 8 (100.0%) |
| 5 to 9 Unit Apartments | 0 (0.0%) | 8 (100.0%) |
| 10 or more Apartments | 0 (0.0%) | 2 (100.0%) |
| Mobile Home / Other | 71 (100.0%) | 0 (0.0%) |
| Total | 215 (58.3%) | 154 (41.7%) |
Housing Structures by Number of Rooms in Clark Fork
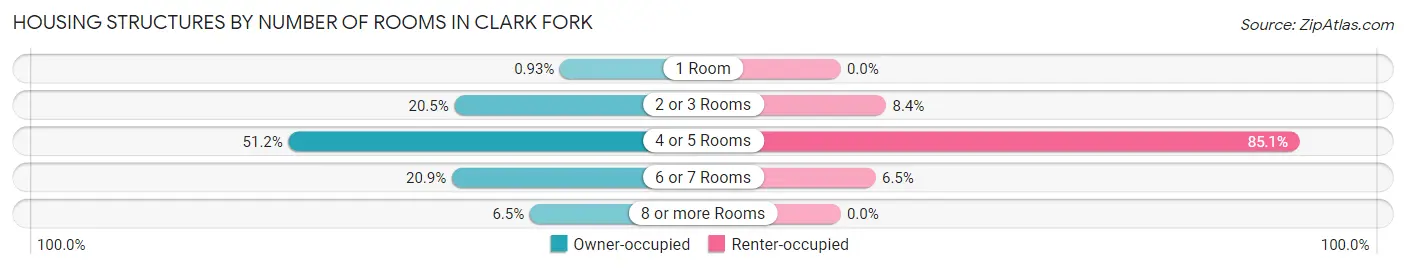
| Number of Rooms | Owner-occupied | Renter-occupied |
| 1 Room | 2 (0.9%) | 0 (0.0%) |
| 2 or 3 Rooms | 44 (20.5%) | 13 (8.4%) |
| 4 or 5 Rooms | 110 (51.2%) | 131 (85.1%) |
| 6 or 7 Rooms | 45 (20.9%) | 10 (6.5%) |
| 8 or more Rooms | 14 (6.5%) | 0 (0.0%) |
| Total | 215 (100.0%) | 154 (100.0%) |
Housing Structure by Heating Type in Clark Fork
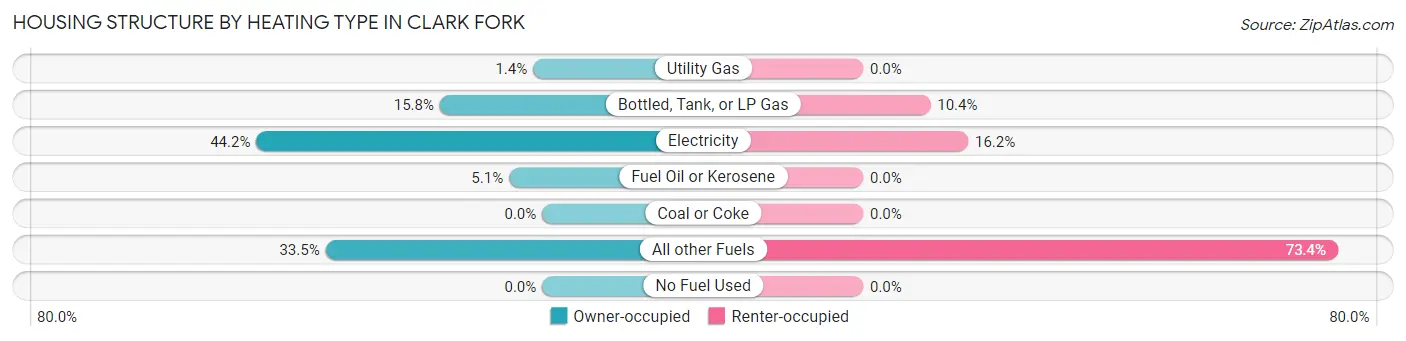
| Heating Type | Owner-occupied | Renter-occupied |
| Utility Gas | 3 (1.4%) | 0 (0.0%) |
| Bottled, Tank, or LP Gas | 34 (15.8%) | 16 (10.4%) |
| Electricity | 95 (44.2%) | 25 (16.2%) |
| Fuel Oil or Kerosene | 11 (5.1%) | 0 (0.0%) |
| Coal or Coke | 0 (0.0%) | 0 (0.0%) |
| All other Fuels | 72 (33.5%) | 113 (73.4%) |
| No Fuel Used | 0 (0.0%) | 0 (0.0%) |
| Total | 215 (100.0%) | 154 (100.0%) |
Household Vehicle Usage in Clark Fork
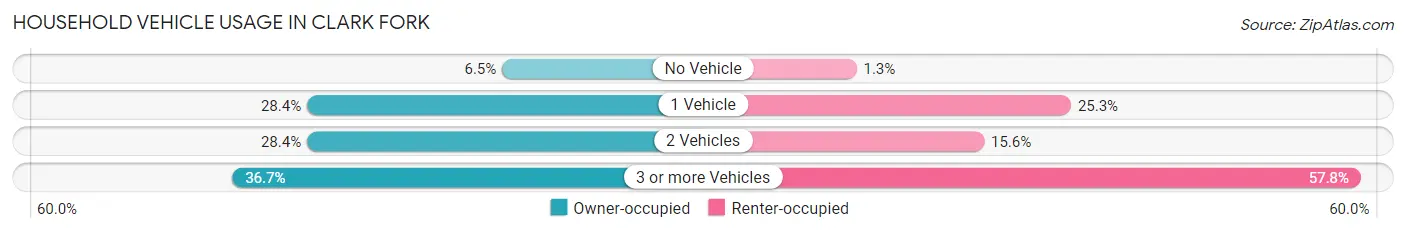
| Vehicles per Household | Owner-occupied | Renter-occupied |
| No Vehicle | 14 (6.5%) | 2 (1.3%) |
| 1 Vehicle | 61 (28.4%) | 39 (25.3%) |
| 2 Vehicles | 61 (28.4%) | 24 (15.6%) |
| 3 or more Vehicles | 79 (36.7%) | 89 (57.8%) |
| Total | 215 (100.0%) | 154 (100.0%) |
Real Estate & Mortgages in Clark Fork
Real Estate and Mortgage Overview in Clark Fork
| Characteristic | Without Mortgage | With Mortgage |
| Housing Units | 131 | 84 |
| Median Property Value | $91,300 | $191,100 |
| Median Household Income | $36,875 | $0 |
| Monthly Housing Costs | $376 | $0 |
| Real Estate Taxes | $645 | $12 |
Property Value by Mortgage Status in Clark Fork
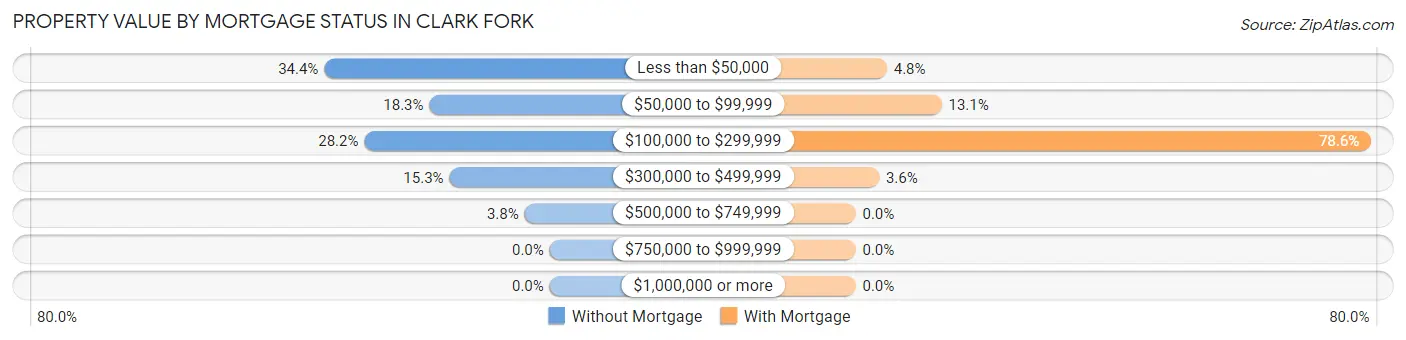
| Property Value | Without Mortgage | With Mortgage |
| Less than $50,000 | 45 (34.4%) | 4 (4.8%) |
| $50,000 to $99,999 | 24 (18.3%) | 11 (13.1%) |
| $100,000 to $299,999 | 37 (28.2%) | 66 (78.6%) |
| $300,000 to $499,999 | 20 (15.3%) | 3 (3.6%) |
| $500,000 to $749,999 | 5 (3.8%) | 0 (0.0%) |
| $750,000 to $999,999 | 0 (0.0%) | 0 (0.0%) |
| $1,000,000 or more | 0 (0.0%) | 0 (0.0%) |
| Total | 131 (100.0%) | 84 (100.0%) |
Household Income by Mortgage Status in Clark Fork
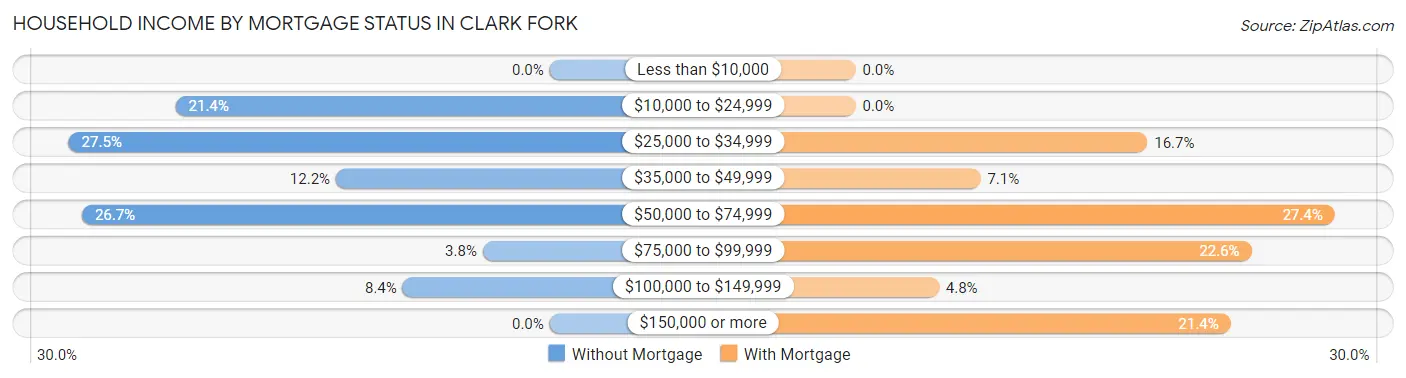
| Household Income | Without Mortgage | With Mortgage |
| Less than $10,000 | 0 (0.0%) | 0 (0.0%) |
| $10,000 to $24,999 | 28 (21.4%) | 0 (0.0%) |
| $25,000 to $34,999 | 36 (27.5%) | 14 (16.7%) |
| $35,000 to $49,999 | 16 (12.2%) | 6 (7.1%) |
| $50,000 to $74,999 | 35 (26.7%) | 23 (27.4%) |
| $75,000 to $99,999 | 5 (3.8%) | 19 (22.6%) |
| $100,000 to $149,999 | 11 (8.4%) | 4 (4.8%) |
| $150,000 or more | 0 (0.0%) | 18 (21.4%) |
| Total | 131 (100.0%) | 84 (100.0%) |
Property Value to Household Income Ratio in Clark Fork
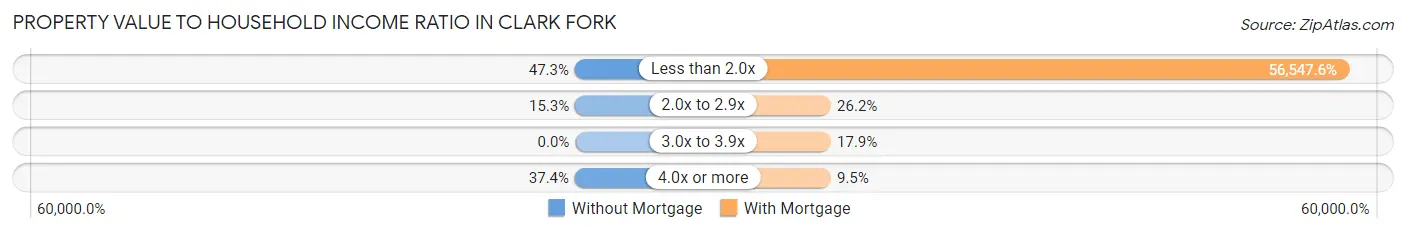
| Value-to-Income Ratio | Without Mortgage | With Mortgage |
| Less than 2.0x | 62 (47.3%) | 47,500 (56,547.6%) |
| 2.0x to 2.9x | 20 (15.3%) | 22 (26.2%) |
| 3.0x to 3.9x | 0 (0.0%) | 15 (17.9%) |
| 4.0x or more | 49 (37.4%) | 8 (9.5%) |
| Total | 131 (100.0%) | 84 (100.0%) |
Real Estate Taxes by Mortgage Status in Clark Fork
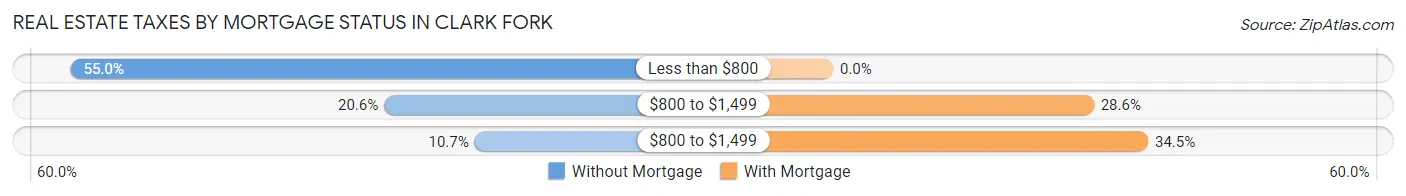
| Property Taxes | Without Mortgage | With Mortgage |
| Less than $800 | 72 (55.0%) | 0 (0.0%) |
| $800 to $1,499 | 27 (20.6%) | 24 (28.6%) |
| $800 to $1,499 | 14 (10.7%) | 29 (34.5%) |
| Total | 131 (100.0%) | 84 (100.0%) |
Health & Disability in Clark Fork
Health Insurance Coverage by Age in Clark Fork
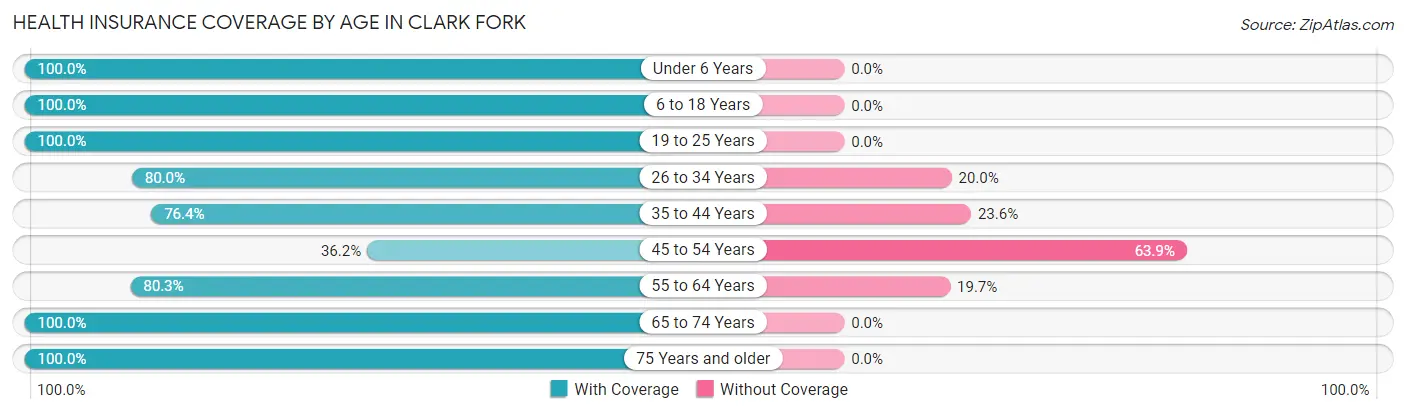
| Age Bracket | With Coverage | Without Coverage |
| Under 6 Years | 35 (100.0%) | 0 (0.0%) |
| 6 to 18 Years | 228 (100.0%) | 0 (0.0%) |
| 19 to 25 Years | 11 (100.0%) | 0 (0.0%) |
| 26 to 34 Years | 52 (80.0%) | 13 (20.0%) |
| 35 to 44 Years | 152 (76.4%) | 47 (23.6%) |
| 45 to 54 Years | 47 (36.1%) | 83 (63.8%) |
| 55 to 64 Years | 118 (80.3%) | 29 (19.7%) |
| 65 to 74 Years | 107 (100.0%) | 0 (0.0%) |
| 75 Years and older | 41 (100.0%) | 0 (0.0%) |
| Total | 791 (82.1%) | 172 (17.9%) |
Health Insurance Coverage by Citizenship Status in Clark Fork
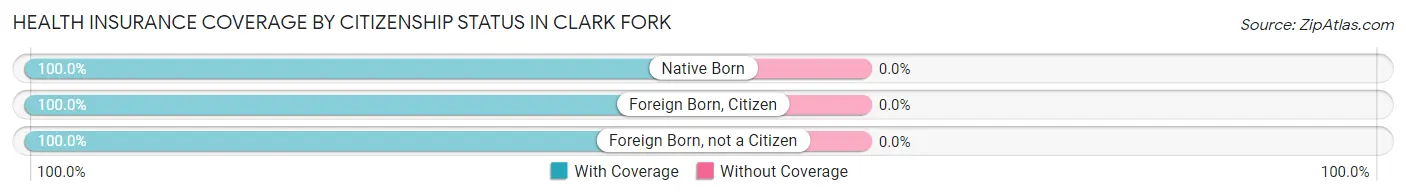
| Citizenship Status | With Coverage | Without Coverage |
| Native Born | 35 (100.0%) | 0 (0.0%) |
| Foreign Born, Citizen | 228 (100.0%) | 0 (0.0%) |
| Foreign Born, not a Citizen | 11 (100.0%) | 0 (0.0%) |
Health Insurance Coverage by Household Income in Clark Fork
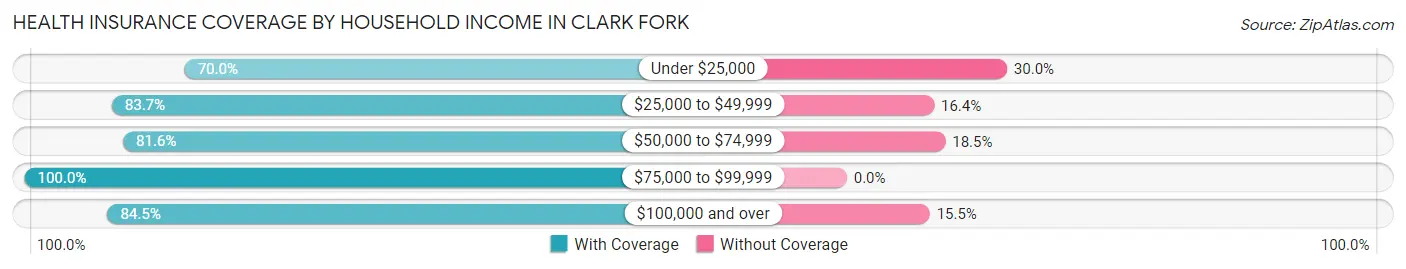
| Household Income | With Coverage | Without Coverage |
| Under $25,000 | 42 (70.0%) | 18 (30.0%) |
| $25,000 to $49,999 | 220 (83.7%) | 43 (16.4%) |
| $50,000 to $74,999 | 420 (81.6%) | 95 (18.4%) |
| $75,000 to $99,999 | 22 (100.0%) | 0 (0.0%) |
| $100,000 and over | 87 (84.5%) | 16 (15.5%) |
Public vs Private Health Insurance Coverage by Age in Clark Fork
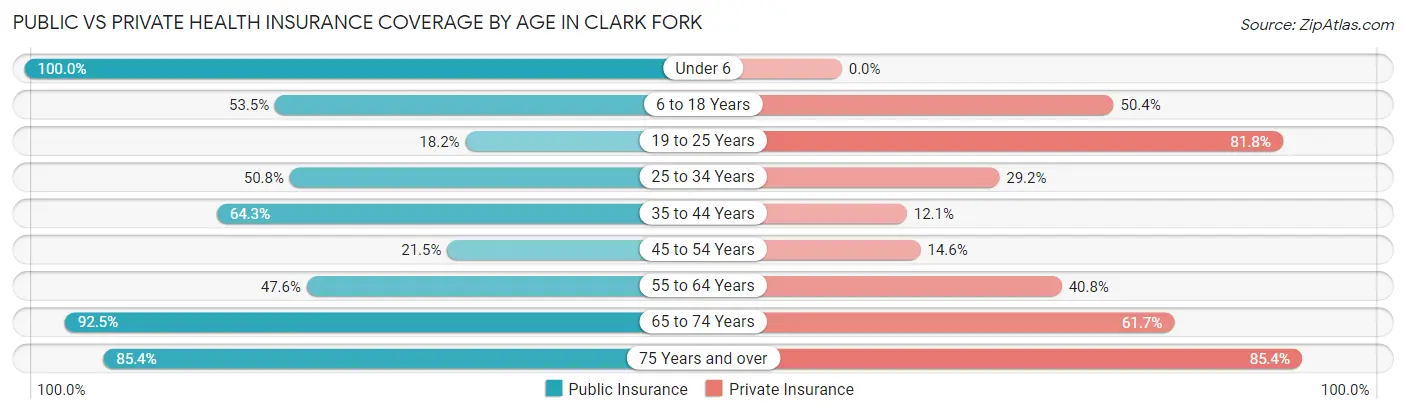
| Age Bracket | Public Insurance | Private Insurance |
| Under 6 | 35 (100.0%) | 0 (0.0%) |
| 6 to 18 Years | 122 (53.5%) | 115 (50.4%) |
| 19 to 25 Years | 2 (18.2%) | 9 (81.8%) |
| 25 to 34 Years | 33 (50.8%) | 19 (29.2%) |
| 35 to 44 Years | 128 (64.3%) | 24 (12.1%) |
| 45 to 54 Years | 28 (21.5%) | 19 (14.6%) |
| 55 to 64 Years | 70 (47.6%) | 60 (40.8%) |
| 65 to 74 Years | 99 (92.5%) | 66 (61.7%) |
| 75 Years and over | 35 (85.4%) | 35 (85.4%) |
| Total | 552 (57.3%) | 347 (36.0%) |
Disability Status by Sex by Age in Clark Fork
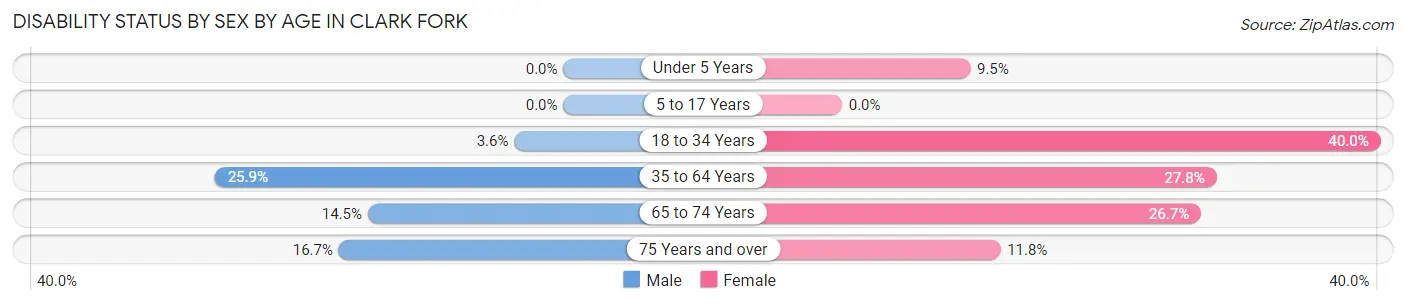
| Age Bracket | Male | Female |
| Under 5 Years | 0 (0.0%) | 2 (9.5%) |
| 5 to 17 Years | 0 (0.0%) | 0 (0.0%) |
| 18 to 34 Years | 4 (3.6%) | 12 (40.0%) |
| 35 to 64 Years | 59 (25.9%) | 69 (27.8%) |
| 65 to 74 Years | 9 (14.5%) | 12 (26.7%) |
| 75 Years and over | 4 (16.7%) | 2 (11.8%) |
Disability Class by Sex by Age in Clark Fork
Disability Class: Hearing Difficulty
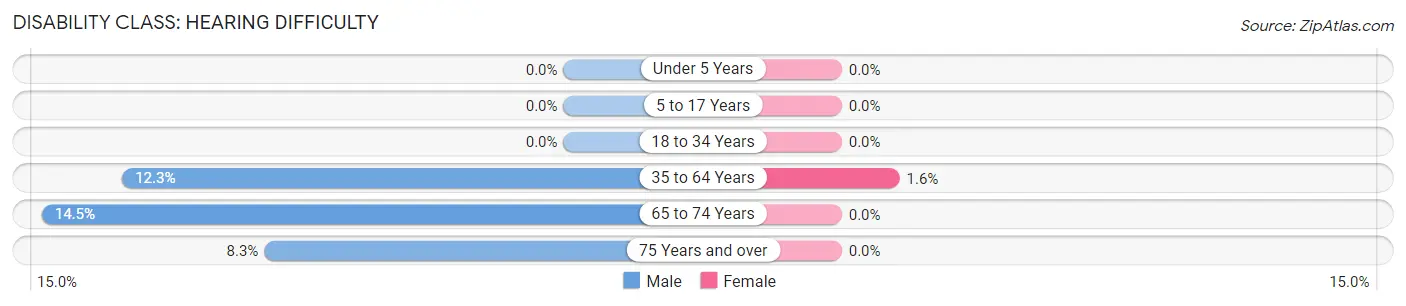
| Age Bracket | Male | Female |
| Under 5 Years | 0 (0.0%) | 0 (0.0%) |
| 5 to 17 Years | 0 (0.0%) | 0 (0.0%) |
| 18 to 34 Years | 0 (0.0%) | 0 (0.0%) |
| 35 to 64 Years | 28 (12.3%) | 4 (1.6%) |
| 65 to 74 Years | 9 (14.5%) | 0 (0.0%) |
| 75 Years and over | 2 (8.3%) | 0 (0.0%) |
Disability Class: Vision Difficulty
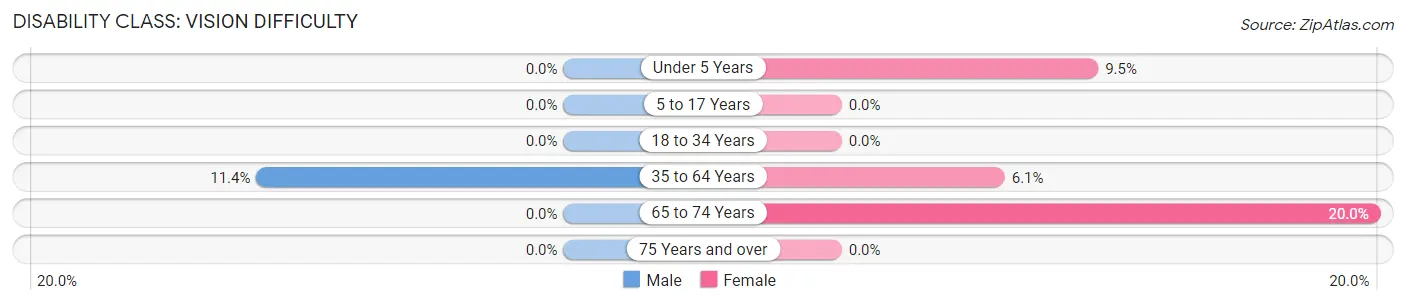
| Age Bracket | Male | Female |
| Under 5 Years | 0 (0.0%) | 2 (9.5%) |
| 5 to 17 Years | 0 (0.0%) | 0 (0.0%) |
| 18 to 34 Years | 0 (0.0%) | 0 (0.0%) |
| 35 to 64 Years | 26 (11.4%) | 15 (6.0%) |
| 65 to 74 Years | 0 (0.0%) | 9 (20.0%) |
| 75 Years and over | 0 (0.0%) | 0 (0.0%) |
Disability Class: Cognitive Difficulty
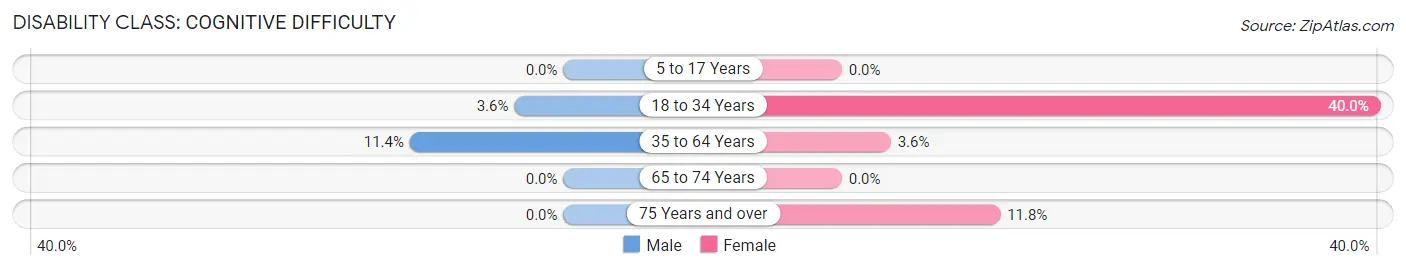
| Age Bracket | Male | Female |
| 5 to 17 Years | 0 (0.0%) | 0 (0.0%) |
| 18 to 34 Years | 4 (3.6%) | 12 (40.0%) |
| 35 to 64 Years | 26 (11.4%) | 9 (3.6%) |
| 65 to 74 Years | 0 (0.0%) | 0 (0.0%) |
| 75 Years and over | 0 (0.0%) | 2 (11.8%) |
Disability Class: Ambulatory Difficulty
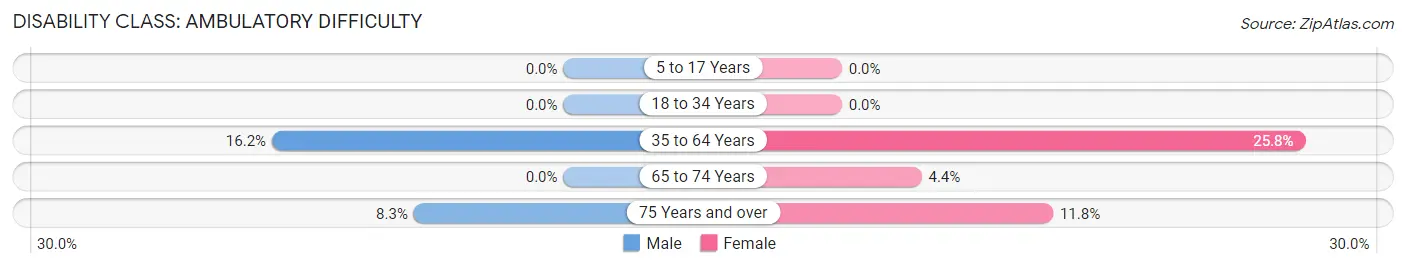
| Age Bracket | Male | Female |
| 5 to 17 Years | 0 (0.0%) | 0 (0.0%) |
| 18 to 34 Years | 0 (0.0%) | 0 (0.0%) |
| 35 to 64 Years | 37 (16.2%) | 64 (25.8%) |
| 65 to 74 Years | 0 (0.0%) | 2 (4.4%) |
| 75 Years and over | 2 (8.3%) | 2 (11.8%) |
Disability Class: Self-Care Difficulty
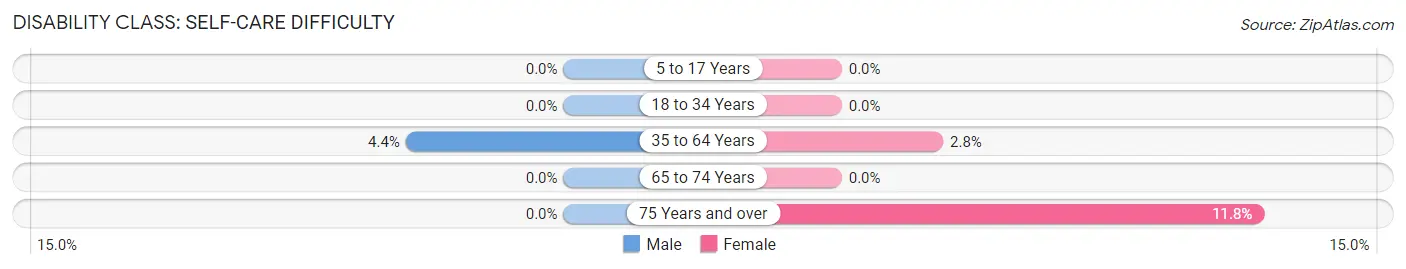
| Age Bracket | Male | Female |
| 5 to 17 Years | 0 (0.0%) | 0 (0.0%) |
| 18 to 34 Years | 0 (0.0%) | 0 (0.0%) |
| 35 to 64 Years | 10 (4.4%) | 7 (2.8%) |
| 65 to 74 Years | 0 (0.0%) | 0 (0.0%) |
| 75 Years and over | 0 (0.0%) | 2 (11.8%) |
Technology Access in Clark Fork
Computing Device Access in Clark Fork
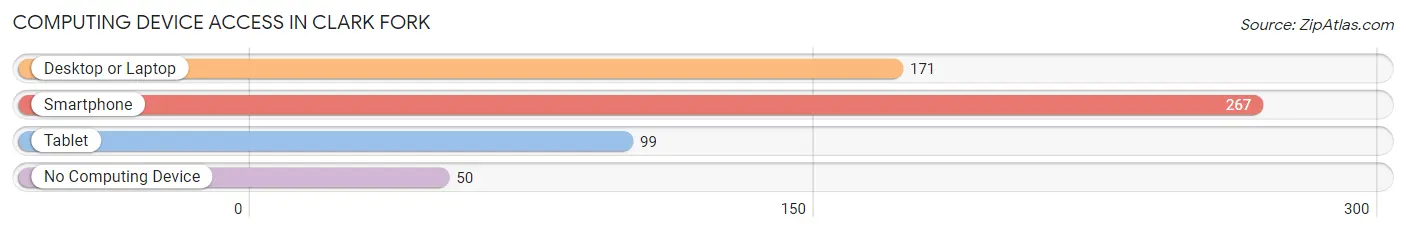
| Device Type | # Households | % Households |
| Desktop or Laptop | 171 | 46.3% |
| Smartphone | 267 | 72.4% |
| Tablet | 99 | 26.8% |
| No Computing Device | 50 | 13.6% |
| Total | 369 | 100.0% |
Internet Access in Clark Fork
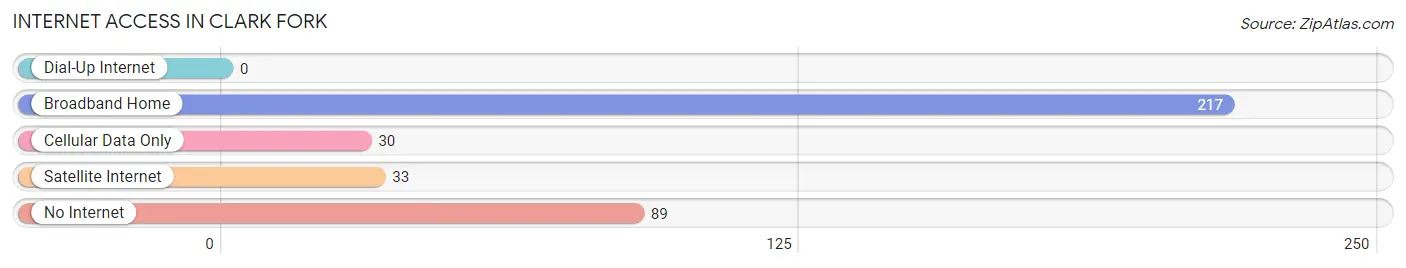
| Internet Type | # Households | % Households |
| Dial-Up Internet | 0 | 0.0% |
| Broadband Home | 217 | 58.8% |
| Cellular Data Only | 30 | 8.1% |
| Satellite Internet | 33 | 8.9% |
| No Internet | 89 | 24.1% |
| Total | 369 | 100.0% |
Clark Fork Summary
History
Clark Fork, Idaho is a small city located in Bonner County, Idaho. It is situated on the Clark Fork River, which is a tributary of the Pend Oreille River. The city was founded in 1883 by a group of miners who were searching for gold in the area. The city was named after the river, which was named after William Clark, an explorer who was part of the Lewis and Clark Expedition.
The city was initially a mining town, and the gold rush brought many people to the area. The city grew rapidly, and by the early 1900s, it had become a bustling community with a population of over 1,000 people. The city was home to several businesses, including a hotel, a bank, a sawmill, and a general store.
The city experienced a decline in the early 20th century, as the gold rush ended and the population began to dwindle. However, the city was revitalized in the 1950s when the nearby Cabinet Mountains were designated as a National Forest. This brought an influx of tourists to the area, and the city began to experience a resurgence.
Today, Clark Fork is a small city with a population of just over 1,000 people. It is a popular tourist destination, and the city is home to several restaurants, shops, and other businesses.
Geography
Clark Fork is located in Bonner County, Idaho. It is situated on the Clark Fork River, which is a tributary of the Pend Oreille River. The city is surrounded by the Cabinet Mountains, which are part of the Rocky Mountains. The city is located at an elevation of 2,400 feet, and the average temperature in the summer is around 70 degrees Fahrenheit.
The city is located in a temperate climate, and the average annual precipitation is around 20 inches. The city is located in a forested area, and the surrounding area is home to a variety of wildlife, including deer, elk, and moose.
Economy
The economy of Clark Fork is largely based on tourism. The city is a popular destination for outdoor enthusiasts, and the nearby Cabinet Mountains are a popular destination for hikers, campers, and other outdoor activities. The city is also home to several restaurants, shops, and other businesses that cater to tourists.
The city is also home to several manufacturing companies, including a sawmill and a woodworking shop. The city is also home to a small airport, which serves the surrounding area.
Demographics
As of the 2010 census, the population of Clark Fork was 1,072. The racial makeup of the city was 95.3% White, 0.7% Native American, 0.3% Asian, 0.2% African American, and 3.5% from other races. The median household income was $37,917, and the median age was 44.7 years.
Conclusion
Clark Fork, Idaho is a small city located in Bonner County, Idaho. It is situated on the Clark Fork River, and it was founded in 1883 by a group of miners who were searching for gold in the area. The city experienced a decline in the early 20th century, but it was revitalized in the 1950s when the nearby Cabinet Mountains were designated as a National Forest. Today, the city is a popular tourist destination, and the economy is largely based on tourism. The population of Clark Fork is just over 1,000 people, and the median household income is $37,917.
Common Questions
What is Per Capita Income in Clark Fork?
Per Capita income in Clark Fork is $19,182.
What is the Median Family Income in Clark Fork?
Median Family Income in Clark Fork is $46,016.
What is the Median Household income in Clark Fork?
Median Household Income in Clark Fork is $47,411.
What is Inequality or Gini Index in Clark Fork?
Inequality or Gini Index in Clark Fork is 0.30.
What is the Total Population of Clark Fork?
Total Population of Clark Fork is 963.
What is the Total Male Population of Clark Fork?
Total Male Population of Clark Fork is 471.
What is the Total Female Population of Clark Fork?
Total Female Population of Clark Fork is 492.
What is the Ratio of Males per 100 Females in Clark Fork?
There are 95.73 Males per 100 Females in Clark Fork.
What is the Ratio of Females per 100 Males in Clark Fork?
There are 104.46 Females per 100 Males in Clark Fork.
What is the Median Population Age in Clark Fork?
Median Population Age in Clark Fork is 40.9 Years.
What is the Average Family Size in Clark Fork
Average Family Size in Clark Fork is 3.0 People.
What is the Average Household Size in Clark Fork
Average Household Size in Clark Fork is 2.6 People.
How Large is the Labor Force in Clark Fork?
There are 495 People in the Labor Forcein in Clark Fork.
What is the Percentage of People in the Labor Force in Clark Fork?
61.4% of People are in the Labor Force in Clark Fork.
What is the Unemployment Rate in Clark Fork?
Unemployment Rate in Clark Fork is 12.9%.