Tesuque Pueblo, NM Map & Demographics
Tesuque Pueblo Map
Tesuque Pueblo Overview
$27,353
PER CAPITA INCOME
$75,000
AVG FAMILY INCOME
$59,375
AVG HOUSEHOLD INCOME
41.9%
WAGE / INCOME GAP [ % ]
58.1¢/ $1
WAGE / INCOME GAP [ $ ]
0.46
INEQUALITY / GINI INDEX
481
TOTAL POPULATION
267
MALE POPULATION
214
FEMALE POPULATION
124.77
MALES / 100 FEMALES
80.15
FEMALES / 100 MALES
34.5
MEDIAN AGE
5.5
AVG FAMILY SIZE
4.6
AVG HOUSEHOLD SIZE
213
LABOR FORCE [ PEOPLE ]
58.2%
PERCENT IN LABOR FORCE
21.6%
UNEMPLOYMENT RATE
Tesuque Pueblo Area Codes
Income in Tesuque Pueblo
Income Overview in Tesuque Pueblo
Per Capita Income in Tesuque Pueblo is $27,353, while median incomes of families and households are $75,000 and $59,375 respectively.
| Characteristic | Number | Measure |
| Per Capita Income | 481 | $27,353 |
| Median Family Income | 84 | $75,000 |
| Mean Family Income | 84 | $91,799 |
| Median Household Income | 104 | $59,375 |
| Mean Household Income | 104 | $76,929 |
| Income Deficit | 84 | $0 |
| Wage / Income Gap (%) | 481 | 41.94% |
| Wage / Income Gap ($) | 481 | 58.06¢ per $1 |
| Gini / Inequality Index | 481 | 0.46 |
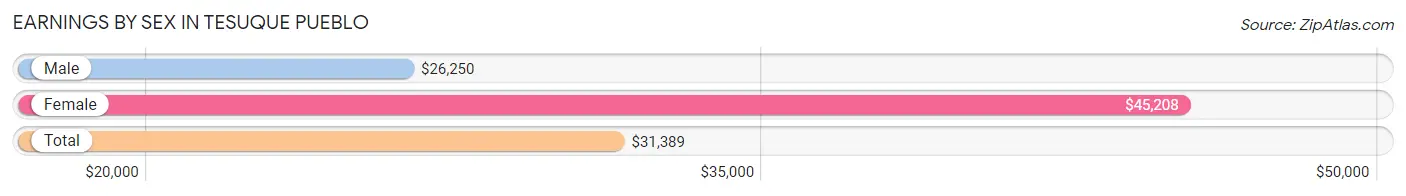
Earnings by Sex in Tesuque Pueblo
Average Earnings in Tesuque Pueblo are $31,389, $26,250 for men and $45,208 for women, a difference of 41.9%.
| Sex | Number | Average Earnings |
| Male | 96 (46.2%) | $26,250 |
| Female | 112 (53.8%) | $45,208 |
| Total | 208 (100.0%) | $31,389 |
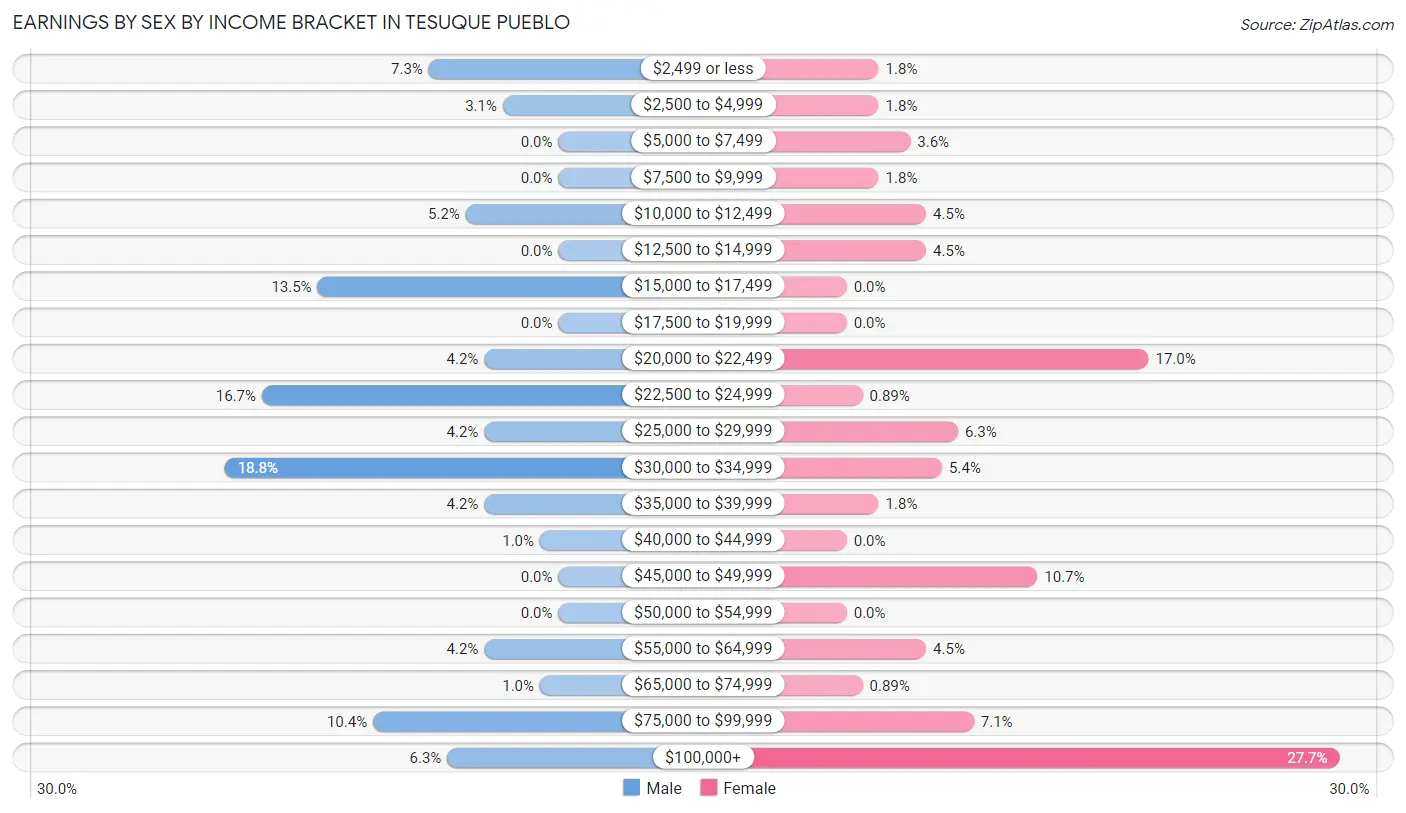
Earnings by Sex by Income Bracket in Tesuque Pueblo
The most common earnings brackets in Tesuque Pueblo are $30,000 to $34,999 for men (18 | 18.8%) and $100,000+ for women (31 | 27.7%).
| Income | Male | Female |
| $2,499 or less | 7 (7.3%) | 2 (1.8%) |
| $2,500 to $4,999 | 3 (3.1%) | 2 (1.8%) |
| $5,000 to $7,499 | 0 (0.0%) | 4 (3.6%) |
| $7,500 to $9,999 | 0 (0.0%) | 2 (1.8%) |
| $10,000 to $12,499 | 5 (5.2%) | 5 (4.5%) |
| $12,500 to $14,999 | 0 (0.0%) | 5 (4.5%) |
| $15,000 to $17,499 | 13 (13.5%) | 0 (0.0%) |
| $17,500 to $19,999 | 0 (0.0%) | 0 (0.0%) |
| $20,000 to $22,499 | 4 (4.2%) | 19 (17.0%) |
| $22,500 to $24,999 | 16 (16.7%) | 1 (0.9%) |
| $25,000 to $29,999 | 4 (4.2%) | 7 (6.2%) |
| $30,000 to $34,999 | 18 (18.8%) | 6 (5.4%) |
| $35,000 to $39,999 | 4 (4.2%) | 2 (1.8%) |
| $40,000 to $44,999 | 1 (1.0%) | 0 (0.0%) |
| $45,000 to $49,999 | 0 (0.0%) | 12 (10.7%) |
| $50,000 to $54,999 | 0 (0.0%) | 0 (0.0%) |
| $55,000 to $64,999 | 4 (4.2%) | 5 (4.5%) |
| $65,000 to $74,999 | 1 (1.0%) | 1 (0.9%) |
| $75,000 to $99,999 | 10 (10.4%) | 8 (7.1%) |
| $100,000+ | 6 (6.2%) | 31 (27.7%) |
| Total | 96 (100.0%) | 112 (100.0%) |
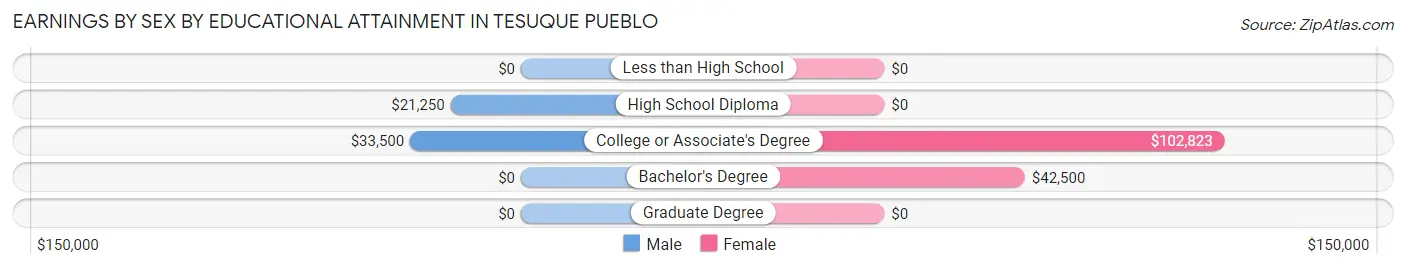
Earnings by Sex by Educational Attainment in Tesuque Pueblo
Average earnings in Tesuque Pueblo are $33,167 for men and $87,813 for women, a difference of 62.2%. Men with an educational attainment of college or associate's degree enjoy the highest average annual earnings of $33,500, while those with high school diploma education earn the least with $21,250. Women with an educational attainment of college or associate's degree earn the most with the average annual earnings of $102,823, while those with bachelor's degree education have the smallest earnings of $42,500.
| Educational Attainment | Male Income | Female Income |
| Less than High School | - | - |
| High School Diploma | $21,250 | $0 |
| College or Associate's Degree | $33,500 | $102,823 |
| Bachelor's Degree | - | - |
| Graduate Degree | - | - |
| Total | $33,167 | $87,813 |
Family Income in Tesuque Pueblo
Family Income Brackets in Tesuque Pueblo
According to the Tesuque Pueblo family income data, there are 22 families falling into the $150,000 to $199,999 income range, which is the most common income bracket and makes up 26.2% of all families.
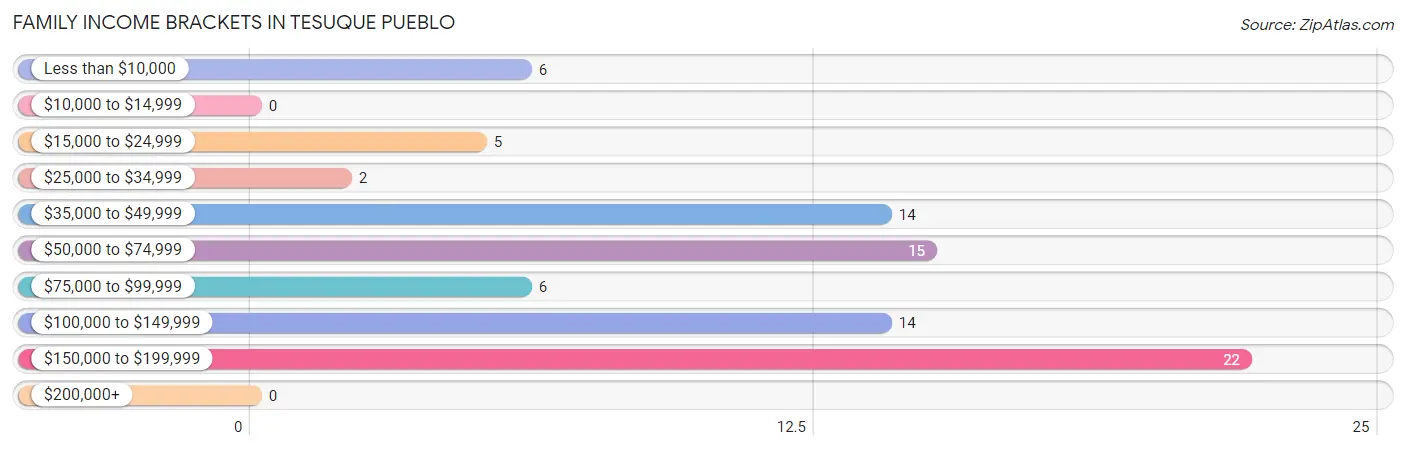
| Income Bracket | # Families | % Families |
| Less than $10,000 | 6 | 7.1% |
| $10,000 to $14,999 | 0 | 0.0% |
| $15,000 to $24,999 | 5 | 6.0% |
| $25,000 to $34,999 | 2 | 2.4% |
| $35,000 to $49,999 | 14 | 16.7% |
| $50,000 to $74,999 | 15 | 17.9% |
| $75,000 to $99,999 | 6 | 7.1% |
| $100,000 to $149,999 | 14 | 16.7% |
| $150,000 to $199,999 | 22 | 26.2% |
| $200,000+ | 0 | 0.0% |
Family Income by Famaliy Size in Tesuque Pueblo
7+ person families (23 | 27.4%) account for the highest median family income in Tesuque Pueblo with $178,083 per family, while 4-person families (13 | 15.5%) have the highest median income of $25,938 per family member.
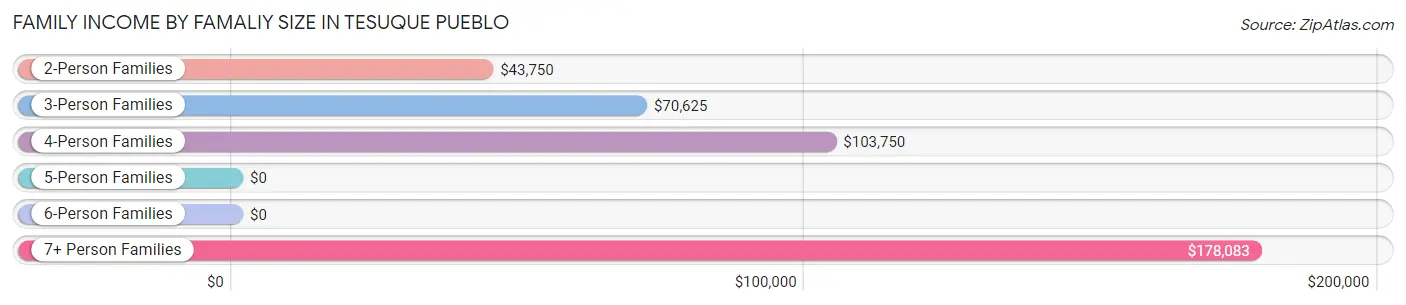
| Income Bracket | # Families | Median Income |
| 2-Person Families | 24 (28.6%) | $43,750 |
| 3-Person Families | 14 (16.7%) | $70,625 |
| 4-Person Families | 13 (15.5%) | $103,750 |
| 5-Person Families | 7 (8.3%) | $0 |
| 6-Person Families | 3 (3.6%) | $0 |
| 7+ Person Families | 23 (27.4%) | $178,083 |
| Total | 84 (100.0%) | $75,000 |
Family Income by Number of Earners in Tesuque Pueblo
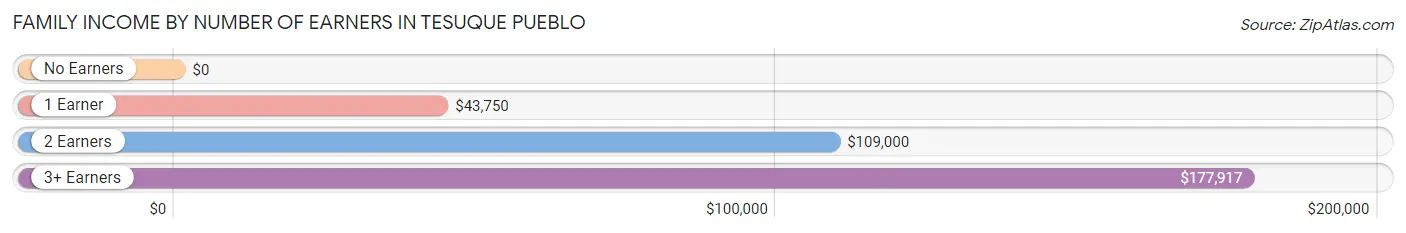
| Number of Earners | # Families | Median Income |
| No Earners | 13 (15.5%) | $0 |
| 1 Earner | 20 (23.8%) | $43,750 |
| 2 Earners | 26 (30.9%) | $109,000 |
| 3+ Earners | 25 (29.8%) | $177,917 |
| Total | 84 (100.0%) | $75,000 |
Household Income in Tesuque Pueblo
Household Income Brackets in Tesuque Pueblo
With 22 households falling in the category, the less than $10,000 income range is the most frequent in Tesuque Pueblo, accounting for 21.1% of all households.
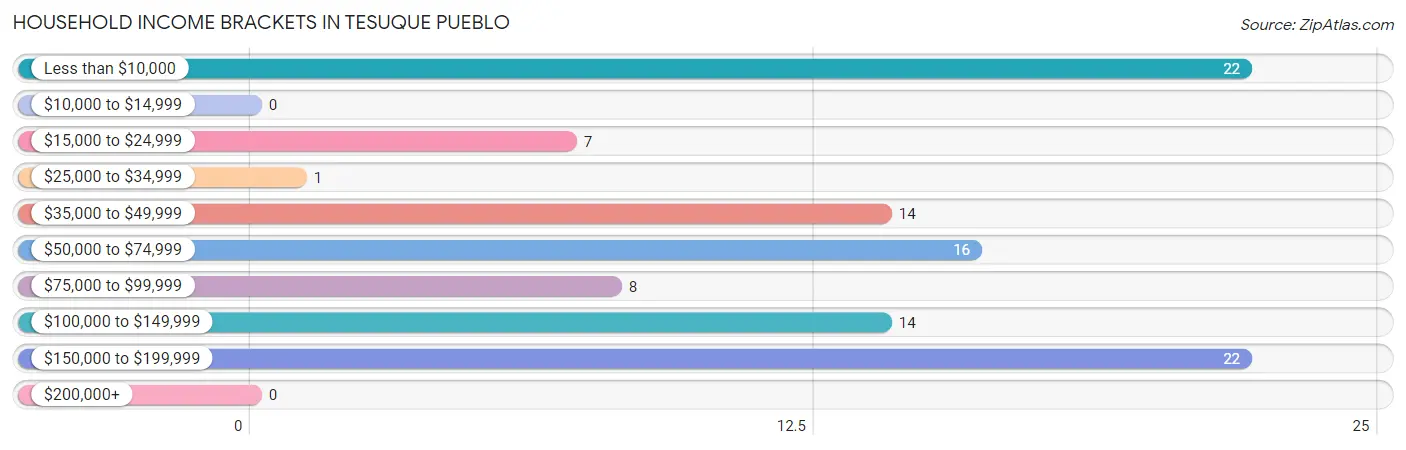
| Income Bracket | # Households | % Households |
| Less than $10,000 | 22 | 21.2% |
| $10,000 to $14,999 | 0 | 0.0% |
| $15,000 to $24,999 | 7 | 6.7% |
| $25,000 to $34,999 | 1 | 1.0% |
| $35,000 to $49,999 | 14 | 13.5% |
| $50,000 to $74,999 | 16 | 15.4% |
| $75,000 to $99,999 | 8 | 7.7% |
| $100,000 to $149,999 | 14 | 13.5% |
| $150,000 to $199,999 | 22 | 21.2% |
| $200,000+ | 0 | 0.0% |
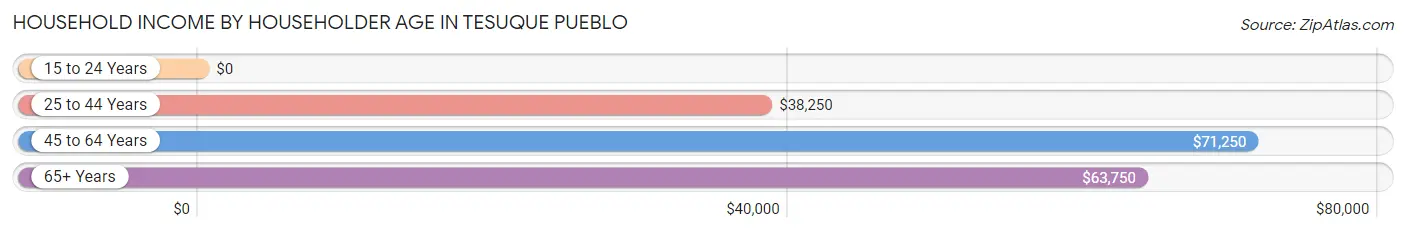
Household Income by Householder Age in Tesuque Pueblo
The median household income in Tesuque Pueblo is $59,375, with the highest median household income of $71,250 found in the 45 to 64 years age bracket for the primary householder. A total of 70 households (67.3%) fall into this category.
| Income Bracket | # Households | Median Income |
| 15 to 24 Years | 0 (0.0%) | $0 |
| 25 to 44 Years | 9 (8.6%) | $38,250 |
| 45 to 64 Years | 70 (67.3%) | $71,250 |
| 65+ Years | 25 (24.0%) | $63,750 |
| Total | 104 (100.0%) | $59,375 |
Poverty in Tesuque Pueblo
Income Below Poverty by Sex and Age in Tesuque Pueblo
With 14.6% poverty level for males and 18.2% for females among the residents of Tesuque Pueblo, 5 year old males and 12 to 14 year old females are the most vulnerable to poverty, with 3 males (100.0%) and 2 females (50.0%) in their respective age groups living below the poverty level.
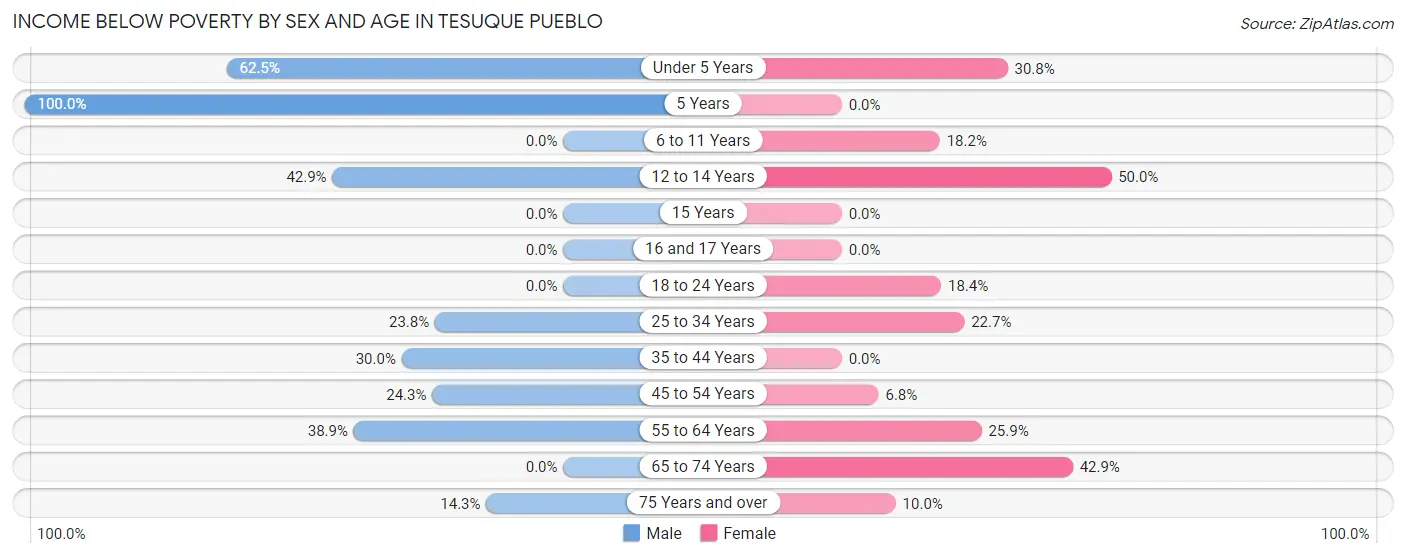
| Age Bracket | Male | Female |
| Under 5 Years | 5 (62.5%) | 4 (30.8%) |
| 5 Years | 3 (100.0%) | 0 (0.0%) |
| 6 to 11 Years | 0 (0.0%) | 4 (18.2%) |
| 12 to 14 Years | 6 (42.9%) | 2 (50.0%) |
| 15 Years | 0 (0.0%) | 0 (0.0%) |
| 16 and 17 Years | 0 (0.0%) | 0 (0.0%) |
| 18 to 24 Years | 0 (0.0%) | 7 (18.4%) |
| 25 to 34 Years | 5 (23.8%) | 5 (22.7%) |
| 35 to 44 Years | 3 (30.0%) | 0 (0.0%) |
| 45 to 54 Years | 9 (24.3%) | 3 (6.8%) |
| 55 to 64 Years | 7 (38.9%) | 7 (25.9%) |
| 65 to 74 Years | 0 (0.0%) | 6 (42.9%) |
| 75 Years and over | 1 (14.3%) | 1 (10.0%) |
| Total | 39 (14.6%) | 39 (18.2%) |
Income Above Poverty by Sex and Age in Tesuque Pueblo
According to the poverty statistics in Tesuque Pueblo, males aged 6 to 11 years and females aged 5 years are the age groups that are most secure financially, with 100.0% of males and 100.0% of females in these age groups living above the poverty line.
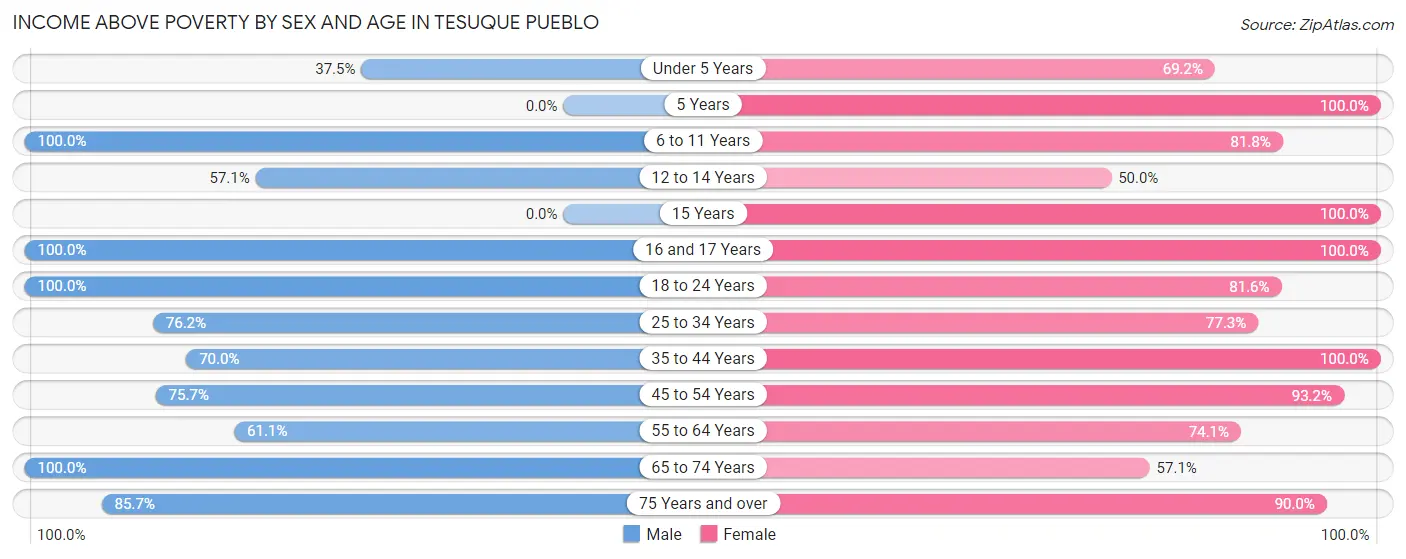
| Age Bracket | Male | Female |
| Under 5 Years | 3 (37.5%) | 9 (69.2%) |
| 5 Years | 0 (0.0%) | 2 (100.0%) |
| 6 to 11 Years | 41 (100.0%) | 18 (81.8%) |
| 12 to 14 Years | 8 (57.1%) | 2 (50.0%) |
| 15 Years | 0 (0.0%) | 8 (100.0%) |
| 16 and 17 Years | 5 (100.0%) | 7 (100.0%) |
| 18 to 24 Years | 34 (100.0%) | 31 (81.6%) |
| 25 to 34 Years | 16 (76.2%) | 17 (77.3%) |
| 35 to 44 Years | 7 (70.0%) | 3 (100.0%) |
| 45 to 54 Years | 28 (75.7%) | 41 (93.2%) |
| 55 to 64 Years | 11 (61.1%) | 20 (74.1%) |
| 65 to 74 Years | 69 (100.0%) | 8 (57.1%) |
| 75 Years and over | 6 (85.7%) | 9 (90.0%) |
| Total | 228 (85.4%) | 175 (81.8%) |
Income Below Poverty Among Married-Couple Families in Tesuque Pueblo
The poverty statistics for married-couple families in Tesuque Pueblo show that 7.5% or 4 of the total 53 families live below the poverty line. Families with 3 or 4 children have the highest poverty rate of 15.4%, comprising of 4 families. On the other hand, families with no children have the lowest poverty rate of 0.0%, which includes 0 families.
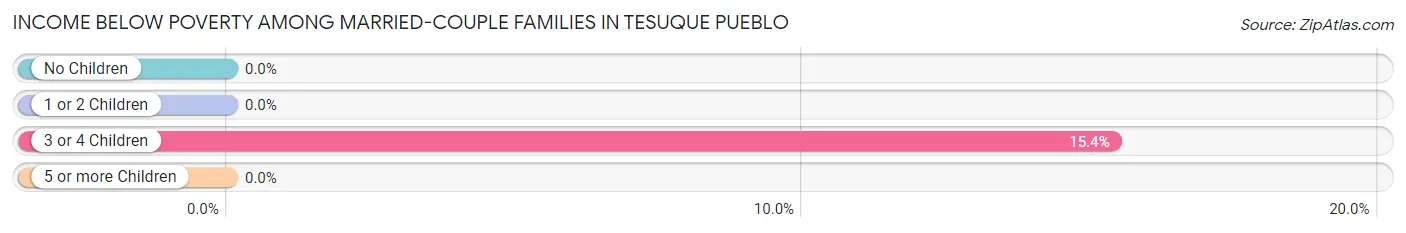
| Children | Above Poverty | Below Poverty |
| No Children | 20 (100.0%) | 0 (0.0%) |
| 1 or 2 Children | 7 (100.0%) | 0 (0.0%) |
| 3 or 4 Children | 22 (84.6%) | 4 (15.4%) |
| 5 or more Children | 0 (0.0%) | 0 (0.0%) |
| Total | 49 (92.4%) | 4 (7.5%) |
Income Below Poverty Among Single-Parent Households in Tesuque Pueblo
According to the poverty data in Tesuque Pueblo, 40.0% or 4 single-father households and 28.6% or 6 single-mother households are living below the poverty line. Among single-father households, those with 1 or 2 children have the highest poverty rate, with 1 households (50.0%) experiencing poverty. Likewise, among single-mother households, those with 3 or 4 children have the highest poverty rate, with 3 households (100.0%) falling below the poverty line.

| Children | Single Father | Single Mother |
| No Children | 3 (37.5%) | 0 (0.0%) |
| 1 or 2 Children | 1 (50.0%) | 3 (37.5%) |
| 3 or 4 Children | 0 (0.0%) | 3 (100.0%) |
| 5 or more Children | 0 (0.0%) | 0 (0.0%) |
| Total | 4 (40.0%) | 6 (28.6%) |
Income Below Poverty Among Married-Couple vs Single-Parent Households in Tesuque Pueblo
The poverty data for Tesuque Pueblo shows that 4 of the married-couple family households (7.5%) and 10 of the single-parent households (32.3%) are living below the poverty level. Within the married-couple family households, those with 3 or 4 children have the highest poverty rate, with 4 households (15.4%) falling below the poverty line. Among the single-parent households, those with 3 or 4 children have the highest poverty rate, with 3 household (100.0%) living below poverty.
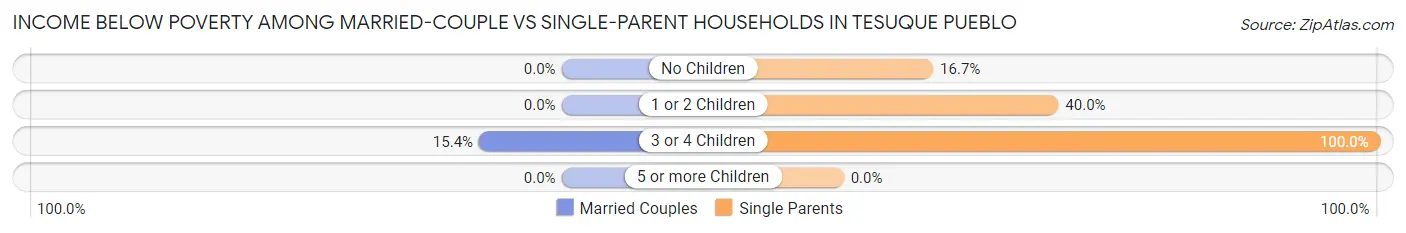
| Children | Married-Couple Families | Single-Parent Households |
| No Children | 0 (0.0%) | 3 (16.7%) |
| 1 or 2 Children | 0 (0.0%) | 4 (40.0%) |
| 3 or 4 Children | 4 (15.4%) | 3 (100.0%) |
| 5 or more Children | 0 (0.0%) | 0 (0.0%) |
| Total | 4 (7.5%) | 10 (32.3%) |
Race in Tesuque Pueblo
The most populous races in Tesuque Pueblo are Native / Alaskan (413 | 85.9%), Hispanic or Latino (77 | 16.0%), and Some other Race (64 | 13.3%).
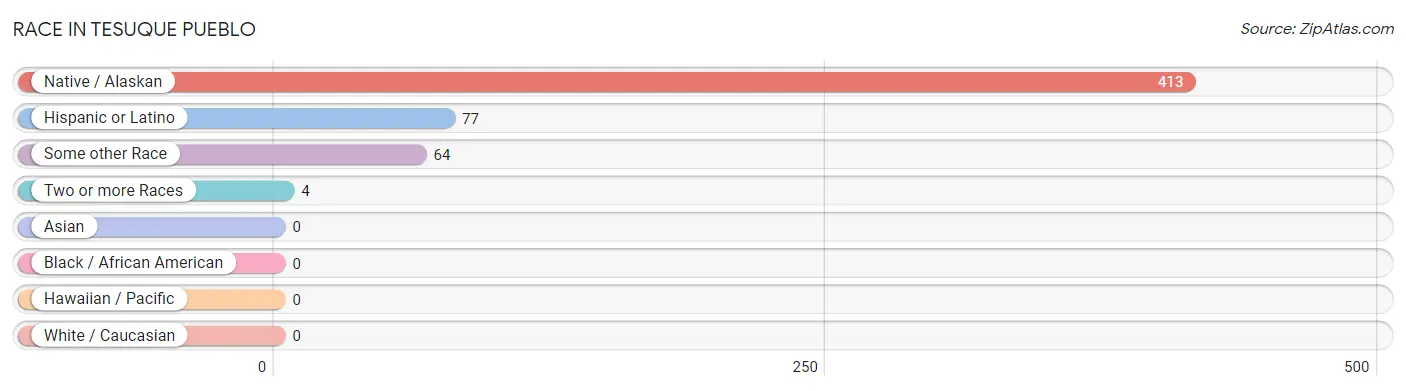
| Race | # Population | % Population |
| Asian | 0 | 0.0% |
| Black / African American | 0 | 0.0% |
| Hawaiian / Pacific | 0 | 0.0% |
| Hispanic or Latino | 77 | 16.0% |
| Native / Alaskan | 413 | 85.9% |
| White / Caucasian | 0 | 0.0% |
| Two or more Races | 4 | 0.8% |
| Some other Race | 64 | 13.3% |
| Total | 481 | 100.0% |
Ancestry in Tesuque Pueblo
The most populous ancestries reported in Tesuque Pueblo are Pueblo (375 | 78.0%), Spaniard (69 | 14.3%), Yakama (5 | 1.0%), Spanish (4 | 0.8%), and English (1 | 0.2%), together accounting for 94.4% of all Tesuque Pueblo residents.
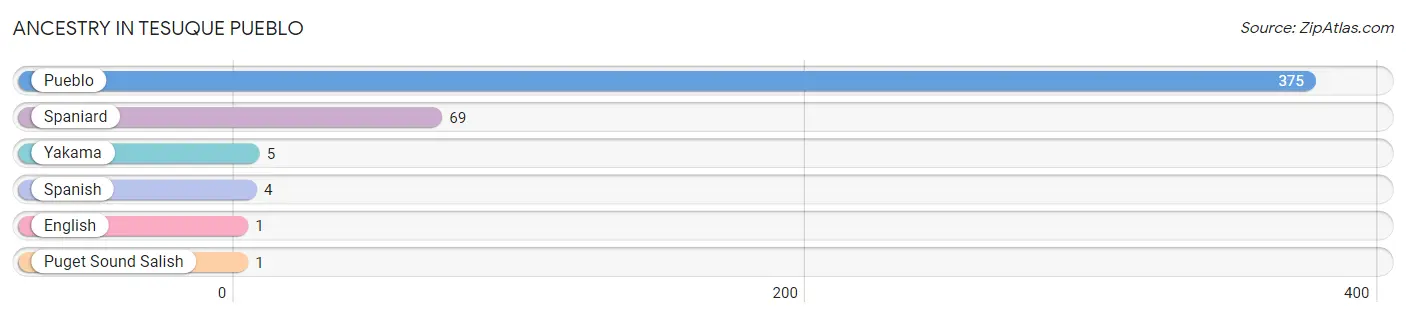
| Ancestry | # Population | % Population |
| English | 1 | 0.2% |
| Pueblo | 375 | 78.0% |
| Puget Sound Salish | 1 | 0.2% |
| Spaniard | 69 | 14.3% |
| Spanish | 4 | 0.8% |
| Yakama | 5 | 1.0% | View All 6 Rows |
Immigrants in Tesuque Pueblo

| Immigration Origin | # Population | % Population | View All 0 Rows |
Sex and Age in Tesuque Pueblo
Sex and Age in Tesuque Pueblo
The most populous age groups in Tesuque Pueblo are 65 to 69 Years (65 | 24.3%) for men and 20 to 24 Years (38 | 17.8%) for women.
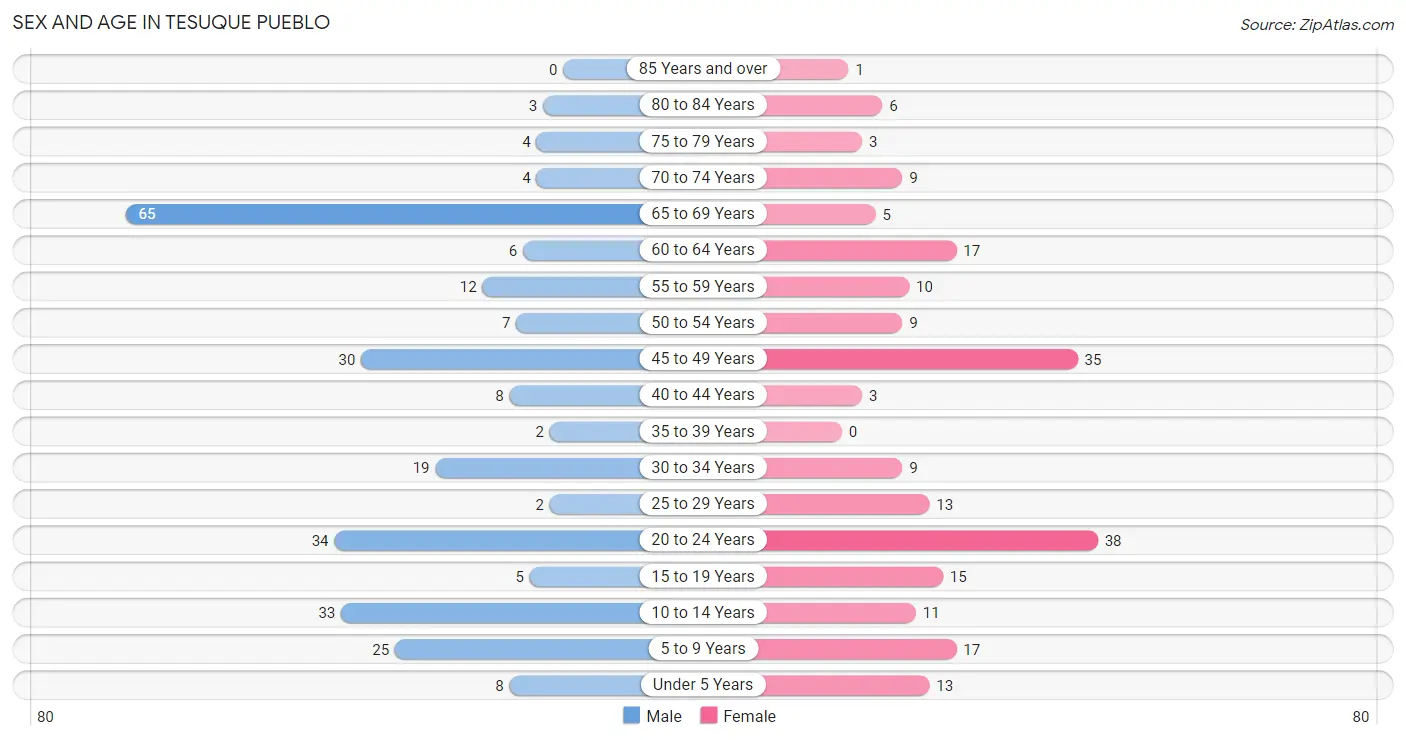
| Age Bracket | Male | Female |
| Under 5 Years | 8 (3.0%) | 13 (6.1%) |
| 5 to 9 Years | 25 (9.4%) | 17 (7.9%) |
| 10 to 14 Years | 33 (12.4%) | 11 (5.1%) |
| 15 to 19 Years | 5 (1.9%) | 15 (7.0%) |
| 20 to 24 Years | 34 (12.7%) | 38 (17.8%) |
| 25 to 29 Years | 2 (0.7%) | 13 (6.1%) |
| 30 to 34 Years | 19 (7.1%) | 9 (4.2%) |
| 35 to 39 Years | 2 (0.7%) | 0 (0.0%) |
| 40 to 44 Years | 8 (3.0%) | 3 (1.4%) |
| 45 to 49 Years | 30 (11.2%) | 35 (16.4%) |
| 50 to 54 Years | 7 (2.6%) | 9 (4.2%) |
| 55 to 59 Years | 12 (4.5%) | 10 (4.7%) |
| 60 to 64 Years | 6 (2.2%) | 17 (7.9%) |
| 65 to 69 Years | 65 (24.3%) | 5 (2.3%) |
| 70 to 74 Years | 4 (1.5%) | 9 (4.2%) |
| 75 to 79 Years | 4 (1.5%) | 3 (1.4%) |
| 80 to 84 Years | 3 (1.1%) | 6 (2.8%) |
| 85 Years and over | 0 (0.0%) | 1 (0.5%) |
| Total | 267 (100.0%) | 214 (100.0%) |
Families and Households in Tesuque Pueblo
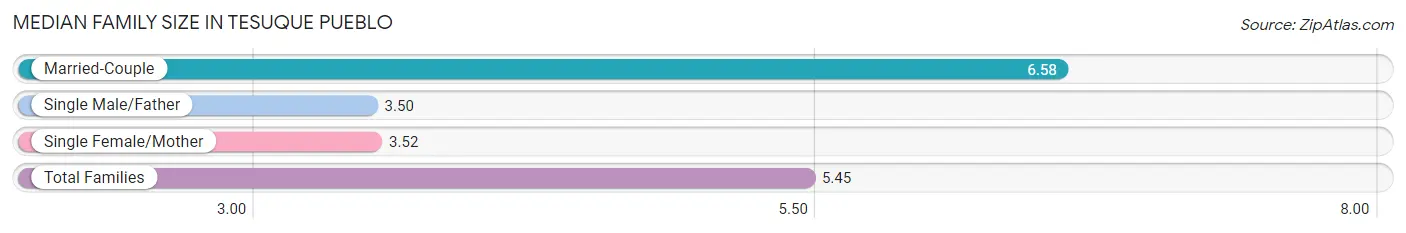
Median Family Size in Tesuque Pueblo
The median family size in Tesuque Pueblo is 5.45 persons per family, with married-couple families (53 | 63.1%) accounting for the largest median family size of 6.58 persons per family. On the other hand, single male/father families (10 | 11.9%) represent the smallest median family size with 3.50 persons per family.
| Family Type | # Families | Family Size |
| Married-Couple | 53 (63.1%) | 6.58 |
| Single Male/Father | 10 (11.9%) | 3.50 |
| Single Female/Mother | 21 (25.0%) | 3.52 |
| Total Families | 84 (100.0%) | 5.45 |
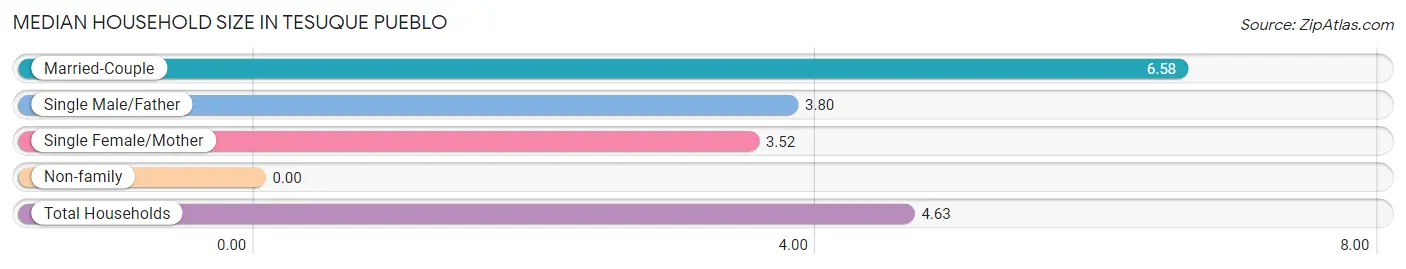
Median Household Size in Tesuque Pueblo
| Household Type | # Households | Household Size |
| Married-Couple | 53 (51.0%) | 6.58 |
| Single Male/Father | 10 (9.6%) | 3.80 |
| Single Female/Mother | 21 (20.2%) | 3.52 |
| Non-family | 20 (19.2%) | - |
| Total Households | 104 (100.0%) | 4.63 |
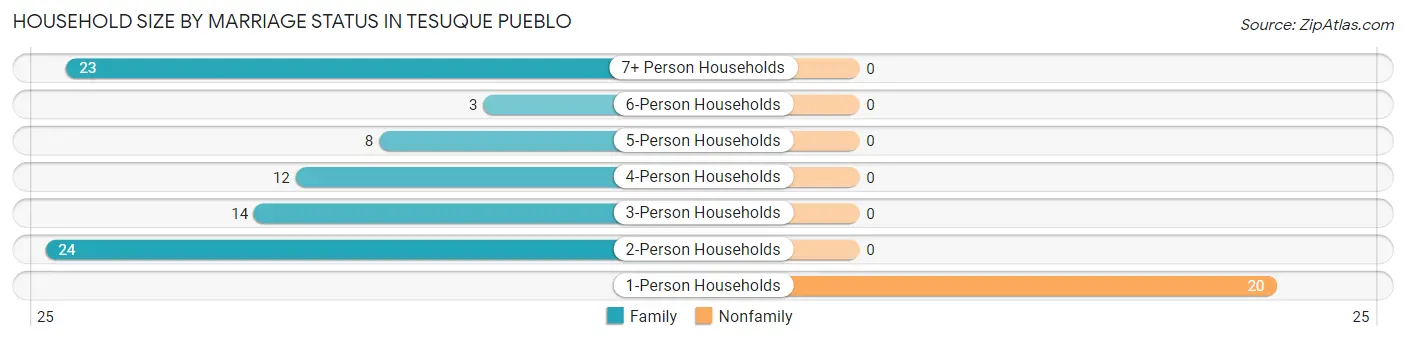
Household Size by Marriage Status in Tesuque Pueblo
Out of a total of 104 households in Tesuque Pueblo, 84 (80.8%) are family households, while 20 (19.2%) are nonfamily households. The most numerous type of family households are 2-person households, comprising 24, and the most common type of nonfamily households are 1-person households, comprising 20.
| Household Size | Family Households | Nonfamily Households |
| 1-Person Households | - | 20 (19.2%) |
| 2-Person Households | 24 (23.1%) | 0 (0.0%) |
| 3-Person Households | 14 (13.5%) | 0 (0.0%) |
| 4-Person Households | 12 (11.5%) | 0 (0.0%) |
| 5-Person Households | 8 (7.7%) | 0 (0.0%) |
| 6-Person Households | 3 (2.9%) | 0 (0.0%) |
| 7+ Person Households | 23 (22.1%) | 0 (0.0%) |
| Total | 84 (80.8%) | 20 (19.2%) |
Female Fertility in Tesuque Pueblo
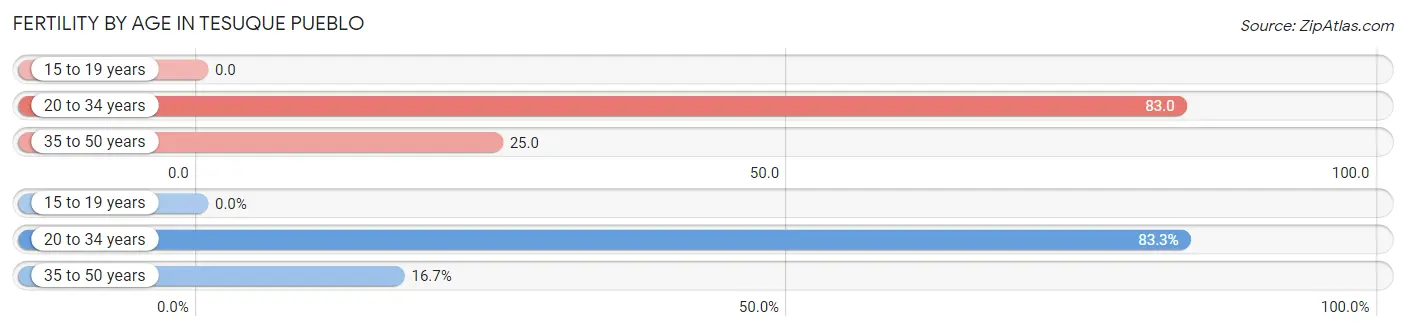
Fertility by Age in Tesuque Pueblo
Average fertility rate in Tesuque Pueblo is 52.0 births per 1,000 women. Women in the age bracket of 20 to 34 years have the highest fertility rate with 83.0 births per 1,000 women. Women in the age bracket of 20 to 34 years acount for 83.3% of all women with births.
| Age Bracket | Women with Births | Births / 1,000 Women |
| 15 to 19 years | 0 (0.0%) | 0.0 |
| 20 to 34 years | 5 (83.3%) | 83.0 |
| 35 to 50 years | 1 (16.7%) | 25.0 |
| Total | 6 (100.0%) | 52.0 |
Fertility by Age by Marriage Status in Tesuque Pueblo
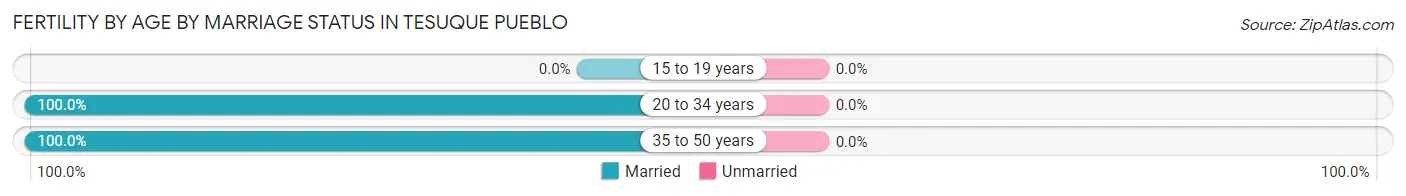
| Age Bracket | Married | Unmarried |
| 15 to 19 years | 0 (0.0%) | 0 (0.0%) |
| 20 to 34 years | 5 (100.0%) | 0 (0.0%) |
| 35 to 50 years | 1 (100.0%) | 0 (0.0%) |
| Total | 6 (100.0%) | 0 (0.0%) |
Fertility by Education in Tesuque Pueblo
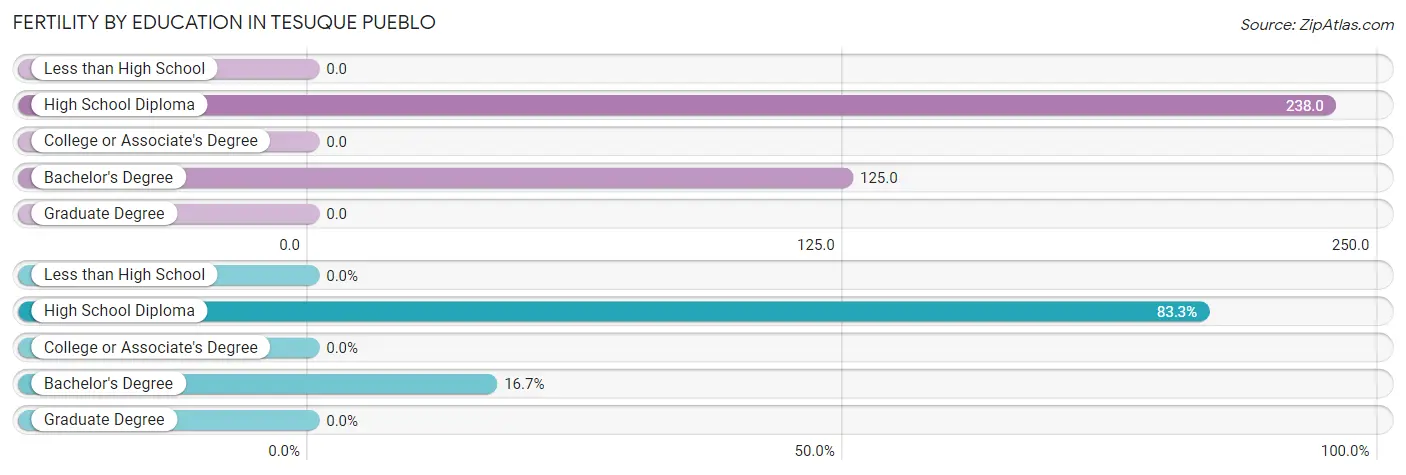
| Educational Attainment | Women with Births | Births / 1,000 Women |
| Less than High School | 0 (0.0%) | 0.0 |
| High School Diploma | 5 (83.3%) | 238.0 |
| College or Associate's Degree | 0 (0.0%) | 0.0 |
| Bachelor's Degree | 1 (16.7%) | 125.0 |
| Graduate Degree | 0 (0.0%) | 0.0 |
| Total | 6 (100.0%) | 52.0 |
Fertility by Education by Marriage Status in Tesuque Pueblo
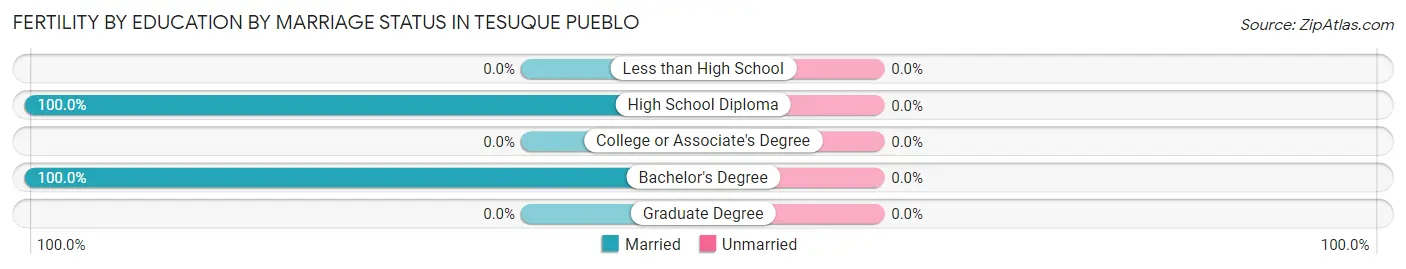
| Educational Attainment | Married | Unmarried |
| Less than High School | 0 (0.0%) | 0 (0.0%) |
| High School Diploma | 5 (100.0%) | 0 (0.0%) |
| College or Associate's Degree | 0 (0.0%) | 0 (0.0%) |
| Bachelor's Degree | 1 (100.0%) | 0 (0.0%) |
| Graduate Degree | 0 (0.0%) | 0 (0.0%) |
| Total | 6 (100.0%) | 0 (0.0%) |
Employment Characteristics in Tesuque Pueblo
Employment by Class of Employer in Tesuque Pueblo
Among the 167 employed individuals in Tesuque Pueblo, private company employees (96 | 57.5%), federal government employees (32 | 19.2%), and local government employees (27 | 16.2%) make up the most common classes of employment.
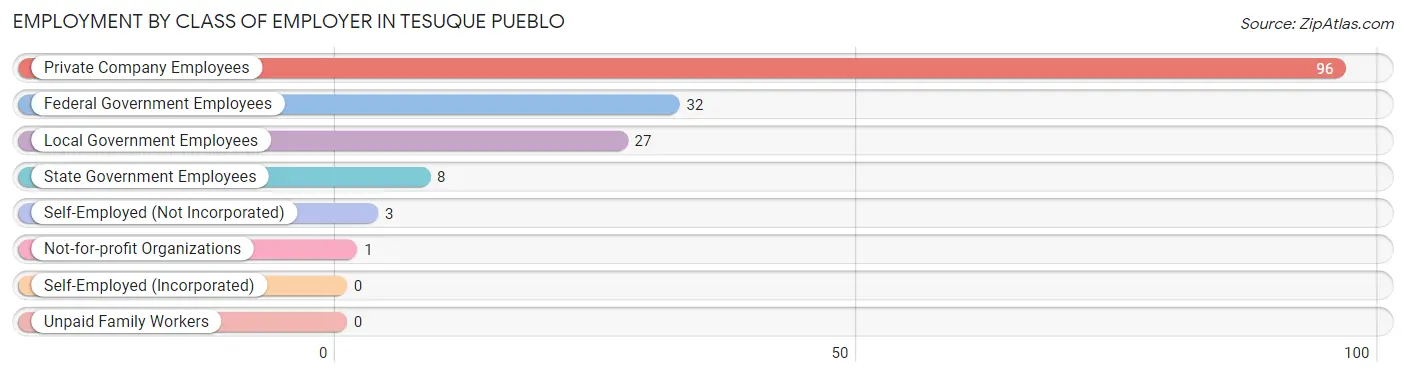
| Employer Class | # Employees | % Employees |
| Private Company Employees | 96 | 57.5% |
| Self-Employed (Incorporated) | 0 | 0.0% |
| Self-Employed (Not Incorporated) | 3 | 1.8% |
| Not-for-profit Organizations | 1 | 0.6% |
| Local Government Employees | 27 | 16.2% |
| State Government Employees | 8 | 4.8% |
| Federal Government Employees | 32 | 19.2% |
| Unpaid Family Workers | 0 | 0.0% |
| Total | 167 | 100.0% |
Employment Status by Age in Tesuque Pueblo
According to the labor force statistics for Tesuque Pueblo, out of the total population over 16 years of age (366), 58.2% or 213 individuals are in the labor force, with 21.6% or 46 of them unemployed. The age group with the highest labor force participation rate is 20 to 24 years, with 100.0% or 72 individuals in the labor force. Within the labor force, the 35 to 44 years age range has the highest percentage of unemployed individuals, with 58.3% or 7 of them being unemployed.
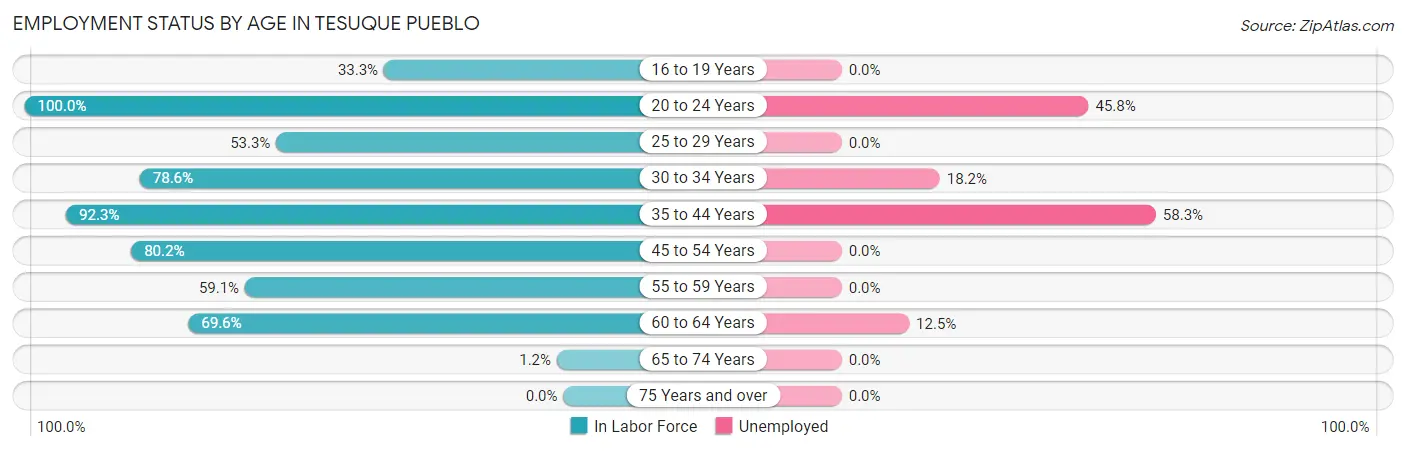
| Age Bracket | In Labor Force | Unemployed |
| 16 to 19 Years | 4 (33.3%) | 0 (0.0%) |
| 20 to 24 Years | 72 (100.0%) | 33 (45.8%) |
| 25 to 29 Years | 8 (53.3%) | 0 (0.0%) |
| 30 to 34 Years | 22 (78.6%) | 4 (18.2%) |
| 35 to 44 Years | 12 (92.3%) | 7 (58.3%) |
| 45 to 54 Years | 65 (80.2%) | 0 (0.0%) |
| 55 to 59 Years | 13 (59.1%) | 0 (0.0%) |
| 60 to 64 Years | 16 (69.6%) | 2 (12.5%) |
| 65 to 74 Years | 1 (1.2%) | 0 (0.0%) |
| 75 Years and over | 0 (0.0%) | 0 (0.0%) |
| Total | 213 (58.2%) | 46 (21.6%) |
Employment Status by Educational Attainment in Tesuque Pueblo
According to labor force statistics for Tesuque Pueblo, 74.7% of individuals (136) out of the total population between 25 and 64 years of age (182) are in the labor force, with 9.6% or 13 of them being unemployed. The group with the highest labor force participation rate are those with the educational attainment of bachelor's degree or higher, with 88.0% or 22 individuals in the labor force. Within the labor force, individuals with bachelor's degree or higher education have the highest percentage of unemployment, with 27.3% or 6 of them being unemployed.
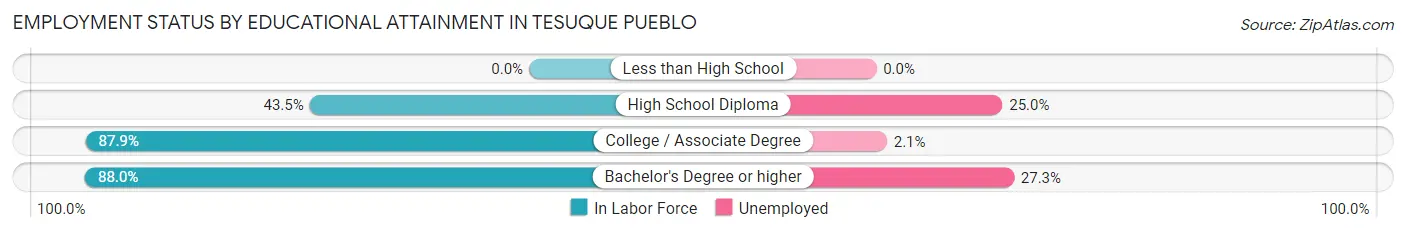
| Educational Attainment | In Labor Force | Unemployed |
| Less than High School | 0 (0.0%) | 0 (0.0%) |
| High School Diploma | 20 (43.5%) | 12 (25.0%) |
| College / Associate Degree | 94 (87.9%) | 2 (2.1%) |
| Bachelor's Degree or higher | 22 (88.0%) | 7 (27.3%) |
| Total | 136 (74.7%) | 17 (9.6%) |
Employment Occupations by Sex in Tesuque Pueblo
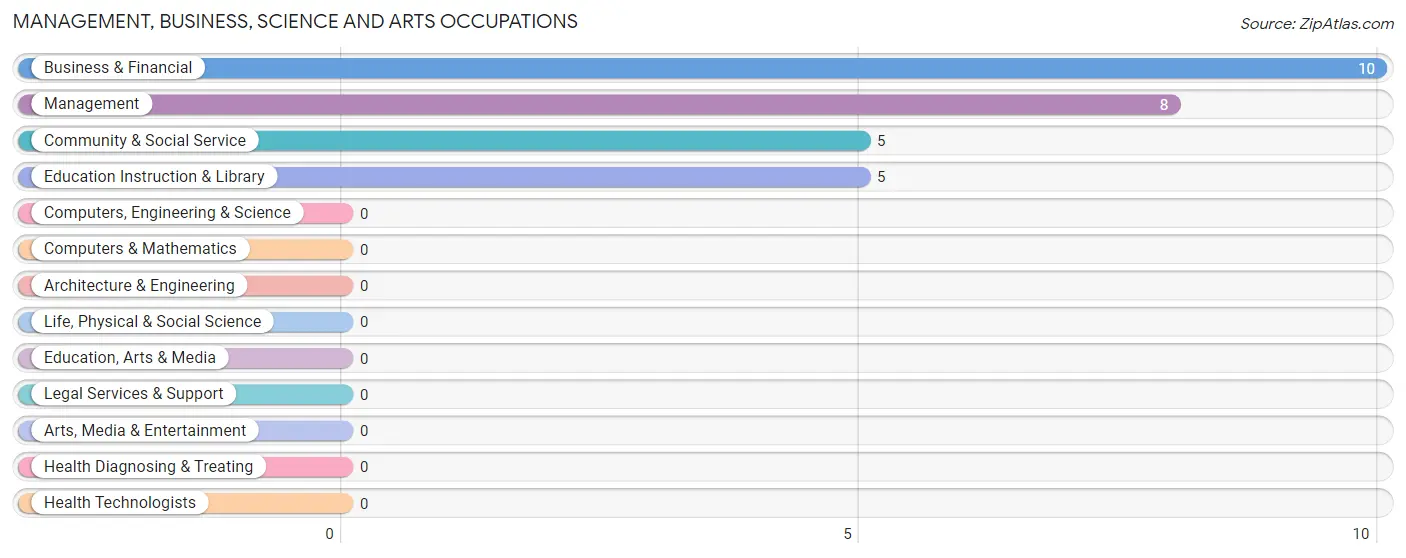
Management, Business, Science and Arts Occupations
The most common Management, Business, Science and Arts occupations in Tesuque Pueblo are Business & Financial (10 | 6.0%), Management (8 | 4.8%), Community & Social Service (5 | 3.0%), and Education Instruction & Library (5 | 3.0%).
Management, Business, Science and Arts Occupations by Sex
Within the Management, Business, Science and Arts occupations in Tesuque Pueblo, the most male-oriented occupations are Business & Financial (40.0%), and Management (37.5%), while the most female-oriented occupations are Community & Social Service (100.0%), Education Instruction & Library (100.0%), and Management (62.5%).
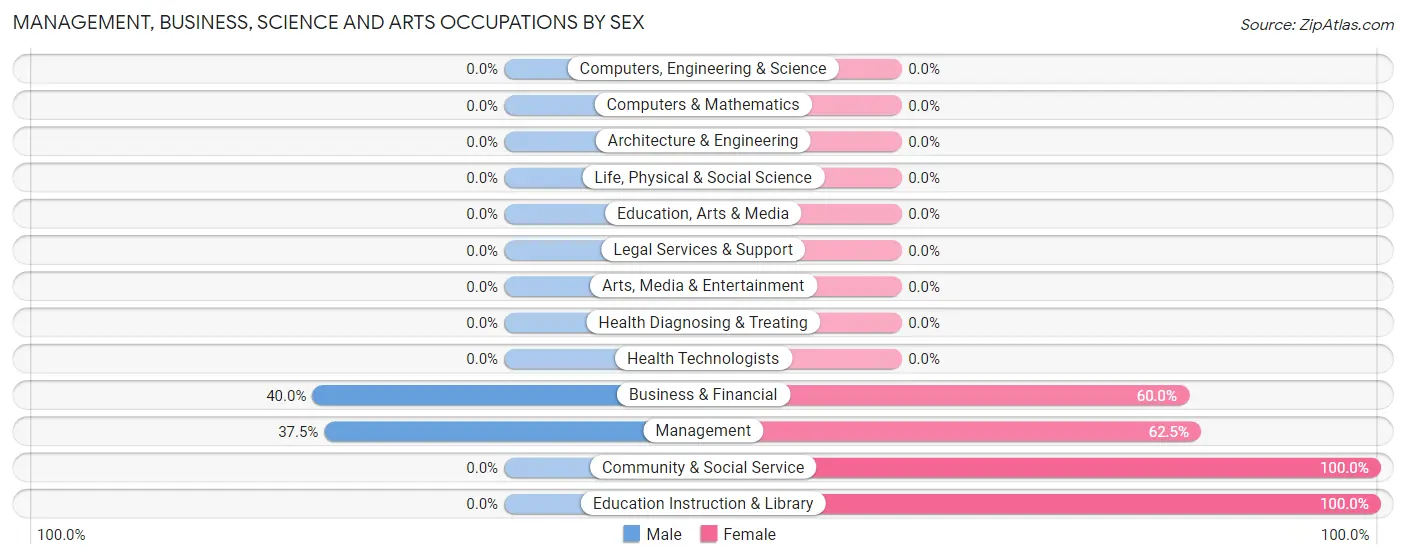
| Occupation | Male | Female |
| Management | 3 (37.5%) | 5 (62.5%) |
| Business & Financial | 4 (40.0%) | 6 (60.0%) |
| Computers, Engineering & Science | 0 (0.0%) | 0 (0.0%) |
| Computers & Mathematics | 0 (0.0%) | 0 (0.0%) |
| Architecture & Engineering | 0 (0.0%) | 0 (0.0%) |
| Life, Physical & Social Science | 0 (0.0%) | 0 (0.0%) |
| Community & Social Service | 0 (0.0%) | 5 (100.0%) |
| Education, Arts & Media | 0 (0.0%) | 0 (0.0%) |
| Legal Services & Support | 0 (0.0%) | 0 (0.0%) |
| Education Instruction & Library | 0 (0.0%) | 5 (100.0%) |
| Arts, Media & Entertainment | 0 (0.0%) | 0 (0.0%) |
| Health Diagnosing & Treating | 0 (0.0%) | 0 (0.0%) |
| Health Technologists | 0 (0.0%) | 0 (0.0%) |
| Total (Category) | 7 (30.4%) | 16 (69.6%) |
| Total (Overall) | 81 (48.5%) | 86 (51.5%) |
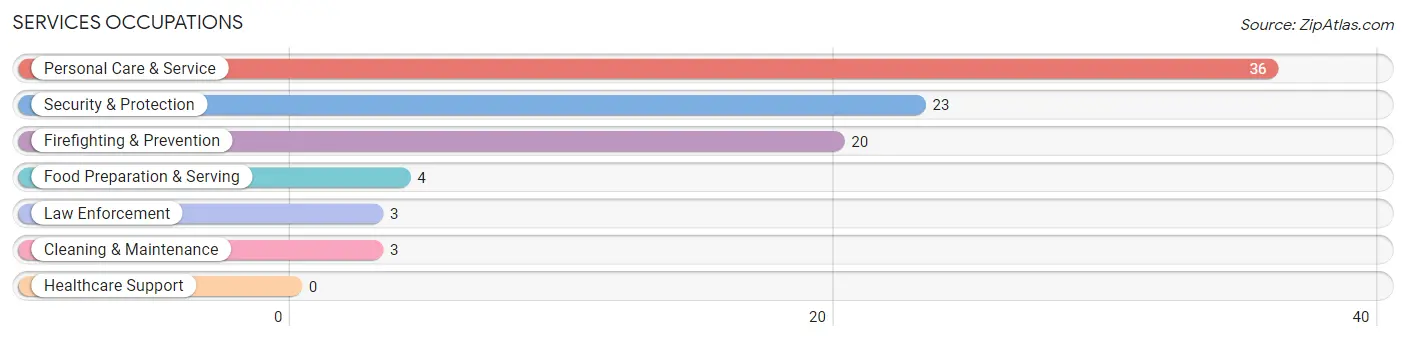
Services Occupations
The most common Services occupations in Tesuque Pueblo are Personal Care & Service (36 | 21.6%), Security & Protection (23 | 13.8%), Firefighting & Prevention (20 | 12.0%), Food Preparation & Serving (4 | 2.4%), and Law Enforcement (3 | 1.8%).
Services Occupations by Sex
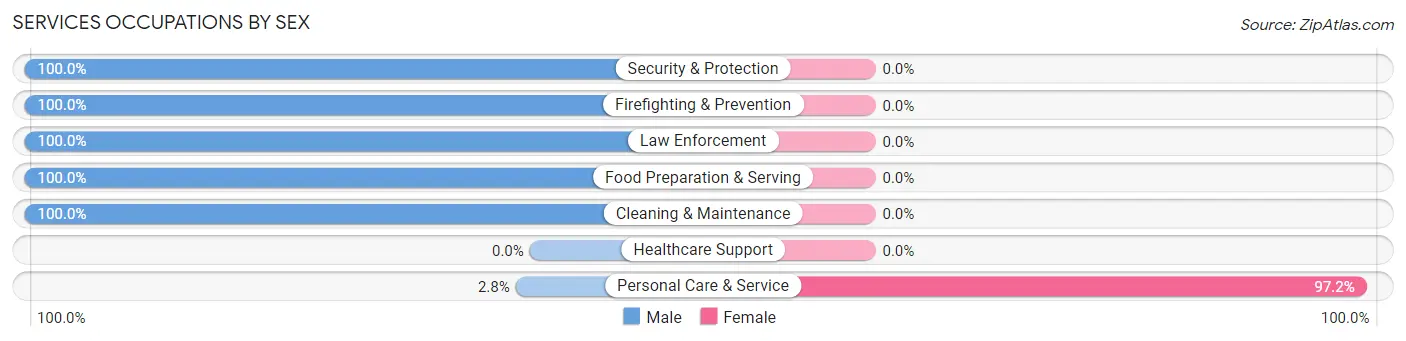
| Occupation | Male | Female |
| Healthcare Support | 0 (0.0%) | 0 (0.0%) |
| Security & Protection | 23 (100.0%) | 0 (0.0%) |
| Firefighting & Prevention | 20 (100.0%) | 0 (0.0%) |
| Law Enforcement | 3 (100.0%) | 0 (0.0%) |
| Food Preparation & Serving | 4 (100.0%) | 0 (0.0%) |
| Cleaning & Maintenance | 3 (100.0%) | 0 (0.0%) |
| Personal Care & Service | 1 (2.8%) | 35 (97.2%) |
| Total (Category) | 31 (47.0%) | 35 (53.0%) |
| Total (Overall) | 81 (48.5%) | 86 (51.5%) |
Sales and Office Occupations
The most common Sales and Office occupations in Tesuque Pueblo are Office & Administration (27 | 16.2%), and Sales & Related (17 | 10.2%).

Sales and Office Occupations by Sex

| Occupation | Male | Female |
| Sales & Related | 6 (35.3%) | 11 (64.7%) |
| Office & Administration | 11 (40.7%) | 16 (59.3%) |
| Total (Category) | 17 (38.6%) | 27 (61.4%) |
| Total (Overall) | 81 (48.5%) | 86 (51.5%) |
Natural Resources, Construction and Maintenance Occupations
The most common Natural Resources, Construction and Maintenance occupations in Tesuque Pueblo are Installation, Maintenance & Repair (11 | 6.6%), and Construction & Extraction (7 | 4.2%).

Natural Resources, Construction and Maintenance Occupations by Sex
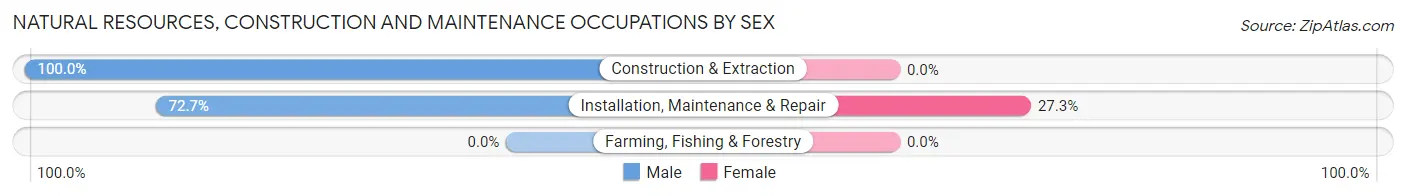
| Occupation | Male | Female |
| Farming, Fishing & Forestry | 0 (0.0%) | 0 (0.0%) |
| Construction & Extraction | 7 (100.0%) | 0 (0.0%) |
| Installation, Maintenance & Repair | 8 (72.7%) | 3 (27.3%) |
| Total (Category) | 15 (83.3%) | 3 (16.7%) |
| Total (Overall) | 81 (48.5%) | 86 (51.5%) |
Production, Transportation and Moving Occupations
The most common Production, Transportation and Moving occupations in Tesuque Pueblo are Material Moving (12 | 7.2%), and Transportation (4 | 2.4%).
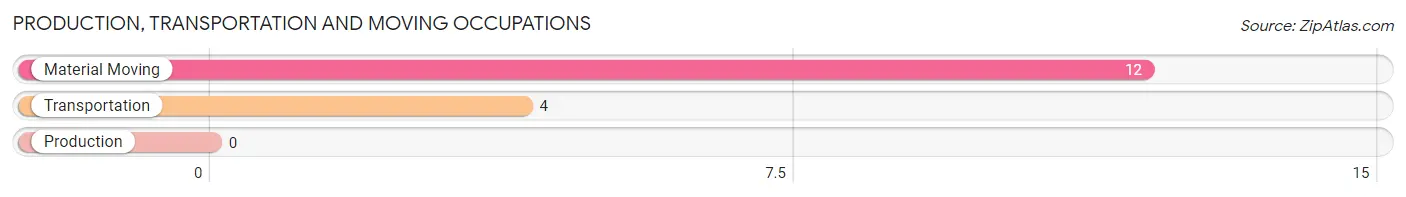
Production, Transportation and Moving Occupations by Sex
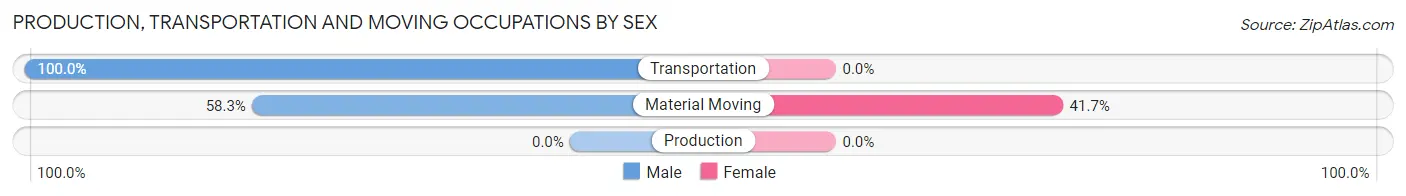
| Occupation | Male | Female |
| Production | 0 (0.0%) | 0 (0.0%) |
| Transportation | 4 (100.0%) | 0 (0.0%) |
| Material Moving | 7 (58.3%) | 5 (41.7%) |
| Total (Category) | 11 (68.8%) | 5 (31.2%) |
| Total (Overall) | 81 (48.5%) | 86 (51.5%) |
Employment Industries by Sex in Tesuque Pueblo
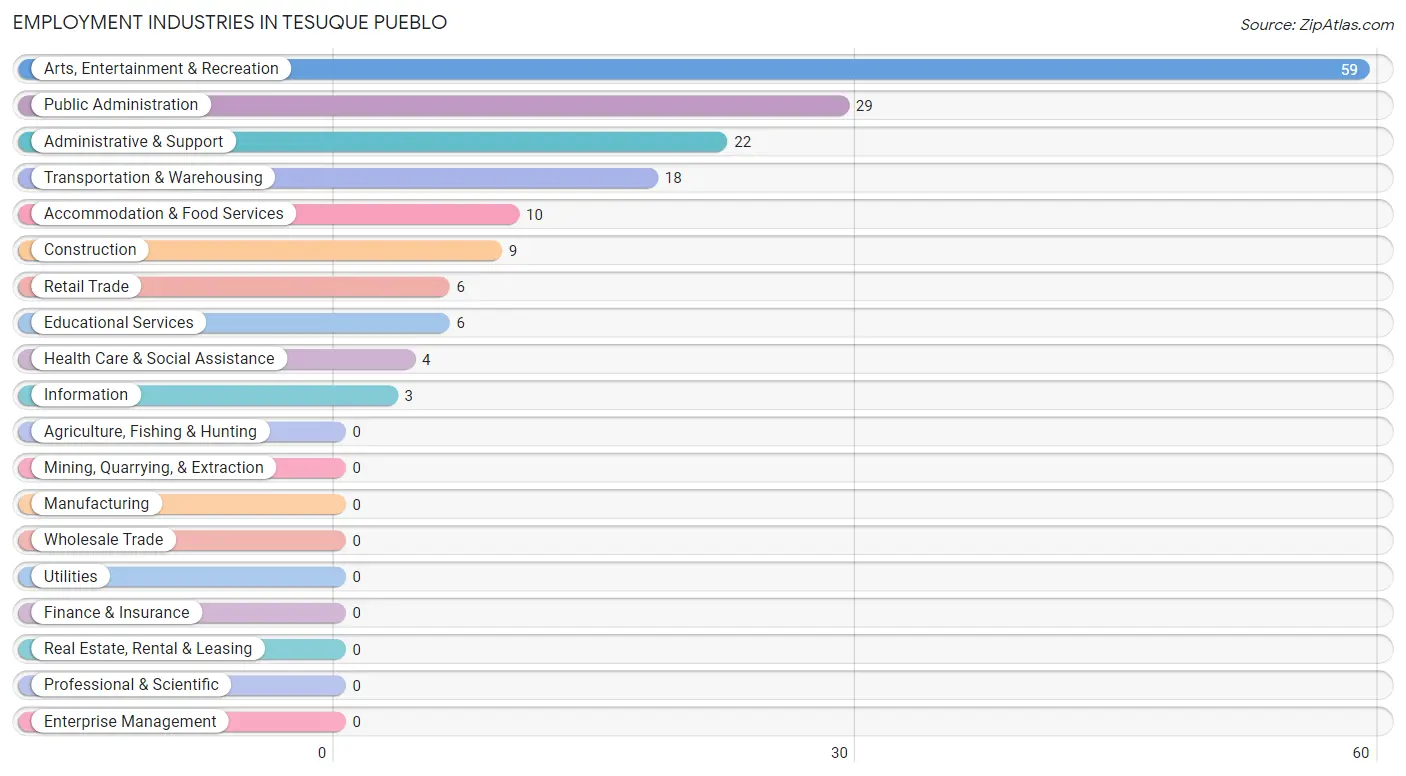
Employment Industries in Tesuque Pueblo
The major employment industries in Tesuque Pueblo include Arts, Entertainment & Recreation (59 | 35.3%), Public Administration (29 | 17.4%), Administrative & Support (22 | 13.2%), Transportation & Warehousing (18 | 10.8%), and Accommodation & Food Services (10 | 6.0%).
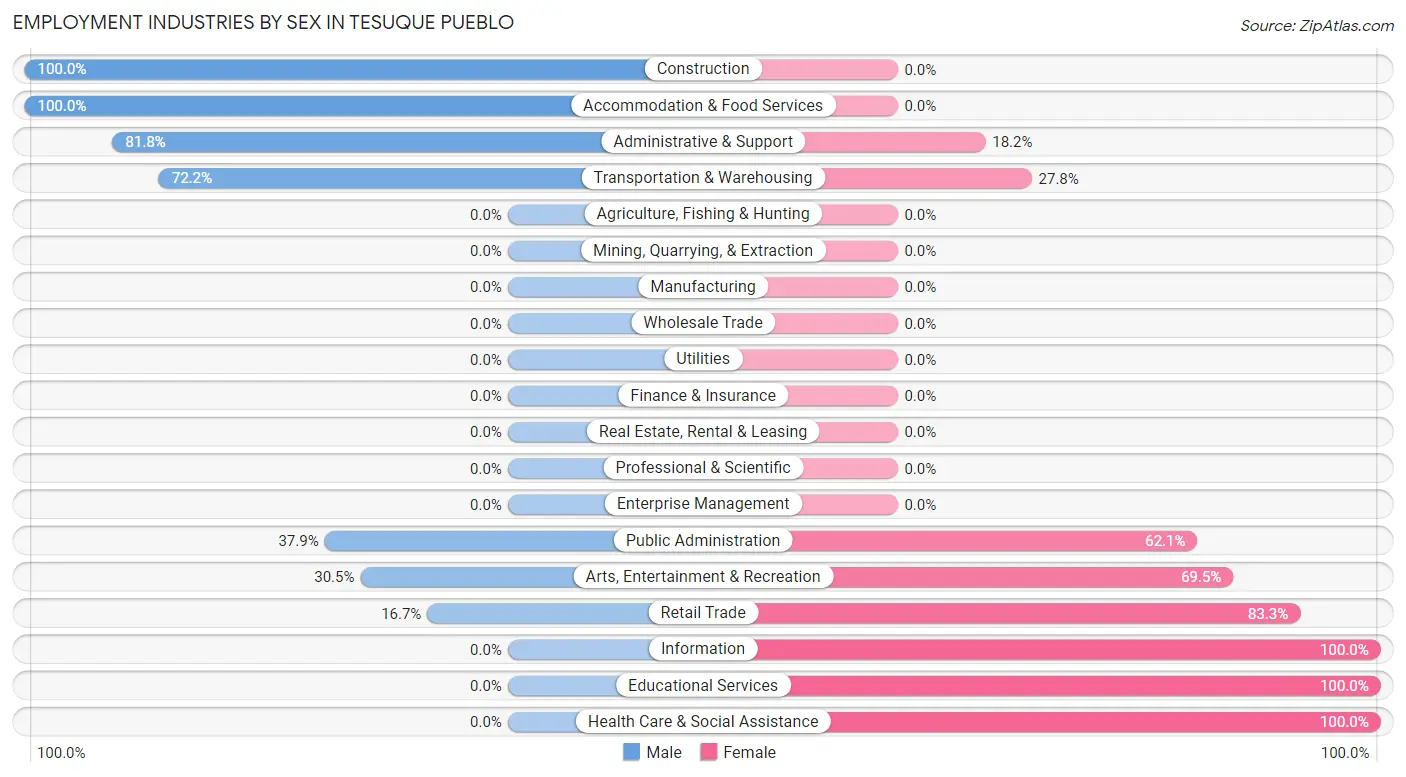
Employment Industries by Sex in Tesuque Pueblo
The Tesuque Pueblo industries that see more men than women are Construction (100.0%), Accommodation & Food Services (100.0%), and Administrative & Support (81.8%), whereas the industries that tend to have a higher number of women are Information (100.0%), Educational Services (100.0%), and Health Care & Social Assistance (100.0%).
| Industry | Male | Female |
| Agriculture, Fishing & Hunting | 0 (0.0%) | 0 (0.0%) |
| Mining, Quarrying, & Extraction | 0 (0.0%) | 0 (0.0%) |
| Construction | 9 (100.0%) | 0 (0.0%) |
| Manufacturing | 0 (0.0%) | 0 (0.0%) |
| Wholesale Trade | 0 (0.0%) | 0 (0.0%) |
| Retail Trade | 1 (16.7%) | 5 (83.3%) |
| Transportation & Warehousing | 13 (72.2%) | 5 (27.8%) |
| Utilities | 0 (0.0%) | 0 (0.0%) |
| Information | 0 (0.0%) | 3 (100.0%) |
| Finance & Insurance | 0 (0.0%) | 0 (0.0%) |
| Real Estate, Rental & Leasing | 0 (0.0%) | 0 (0.0%) |
| Professional & Scientific | 0 (0.0%) | 0 (0.0%) |
| Enterprise Management | 0 (0.0%) | 0 (0.0%) |
| Administrative & Support | 18 (81.8%) | 4 (18.2%) |
| Educational Services | 0 (0.0%) | 6 (100.0%) |
| Health Care & Social Assistance | 0 (0.0%) | 4 (100.0%) |
| Arts, Entertainment & Recreation | 18 (30.5%) | 41 (69.5%) |
| Accommodation & Food Services | 10 (100.0%) | 0 (0.0%) |
| Public Administration | 11 (37.9%) | 18 (62.1%) |
| Total | 81 (48.5%) | 86 (51.5%) |
Education in Tesuque Pueblo
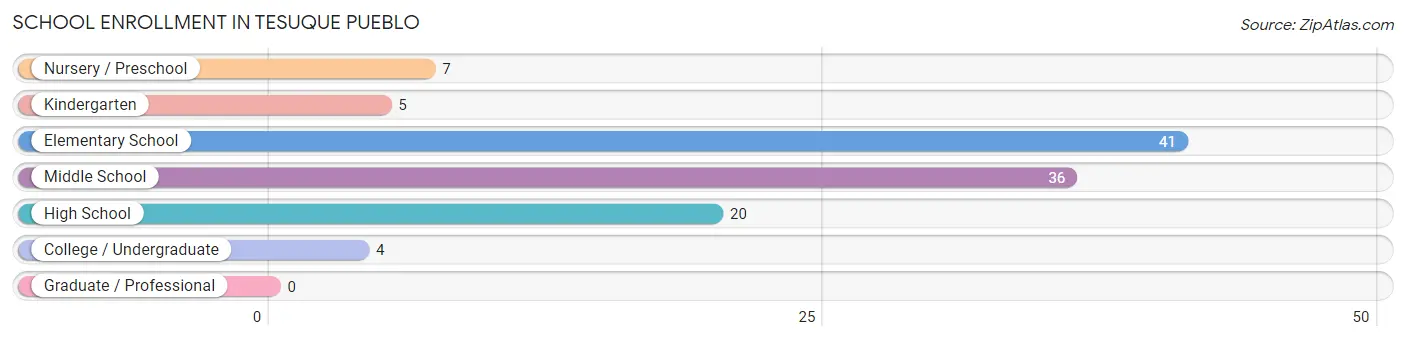
School Enrollment in Tesuque Pueblo
The most common levels of schooling among the 113 students in Tesuque Pueblo are elementary school (41 | 36.3%), middle school (36 | 31.9%), and high school (20 | 17.7%).
| School Level | # Students | % Students |
| Nursery / Preschool | 7 | 6.2% |
| Kindergarten | 5 | 4.4% |
| Elementary School | 41 | 36.3% |
| Middle School | 36 | 31.9% |
| High School | 20 | 17.7% |
| College / Undergraduate | 4 | 3.5% |
| Graduate / Professional | 0 | 0.0% |
| Total | 113 | 100.0% |
School Enrollment by Age by Funding Source in Tesuque Pueblo
Out of a total of 113 students who are enrolled in schools in Tesuque Pueblo, 34 (30.1%) attend a private institution, while the remaining 79 (69.9%) are enrolled in public schools. The age group of 5 to 9 year old has the highest likelihood of being enrolled in private schools, with 17 (40.5% in the age bracket) enrolled. Conversely, the age group of 25 to 34 year olds has the lowest likelihood of being enrolled in a private school, with 1 (100.0% in the age bracket) attending a public institution.
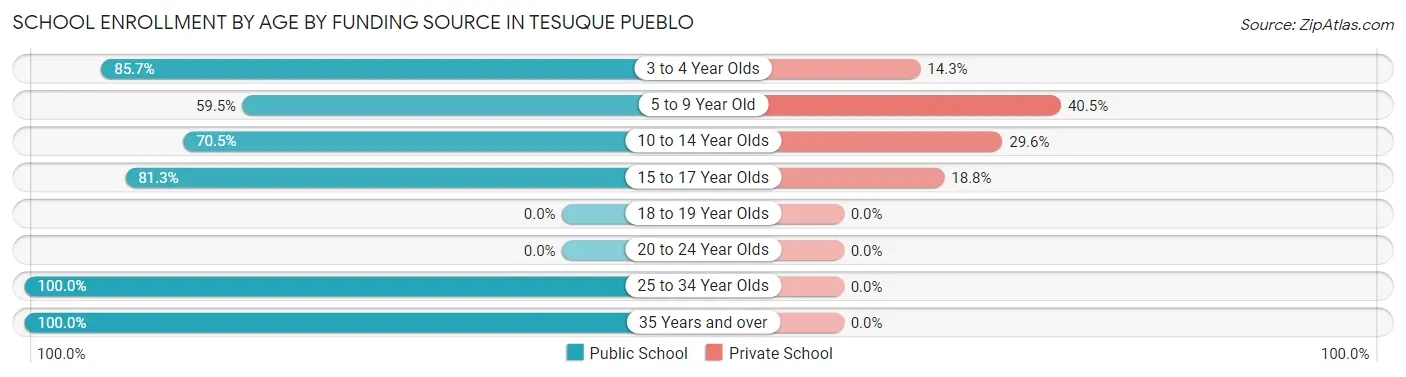
| Age Bracket | Public School | Private School |
| 3 to 4 Year Olds | 6 (85.7%) | 1 (14.3%) |
| 5 to 9 Year Old | 25 (59.5%) | 17 (40.5%) |
| 10 to 14 Year Olds | 31 (70.5%) | 13 (29.5%) |
| 15 to 17 Year Olds | 13 (81.2%) | 3 (18.8%) |
| 18 to 19 Year Olds | 0 (0.0%) | 0 (0.0%) |
| 20 to 24 Year Olds | 0 (0.0%) | 0 (0.0%) |
| 25 to 34 Year Olds | 1 (100.0%) | 0 (0.0%) |
| 35 Years and over | 3 (100.0%) | 0 (0.0%) |
| Total | 79 (69.9%) | 34 (30.1%) |
Educational Attainment by Field of Study in Tesuque Pueblo
Bio, nature & agricultural (8 | 26.7%), business (8 | 26.7%), education (5 | 16.7%), science & technology (3 | 10.0%), and visual & performing arts (3 | 10.0%) are the most common fields of study among 30 individuals in Tesuque Pueblo who have obtained a bachelor's degree or higher.
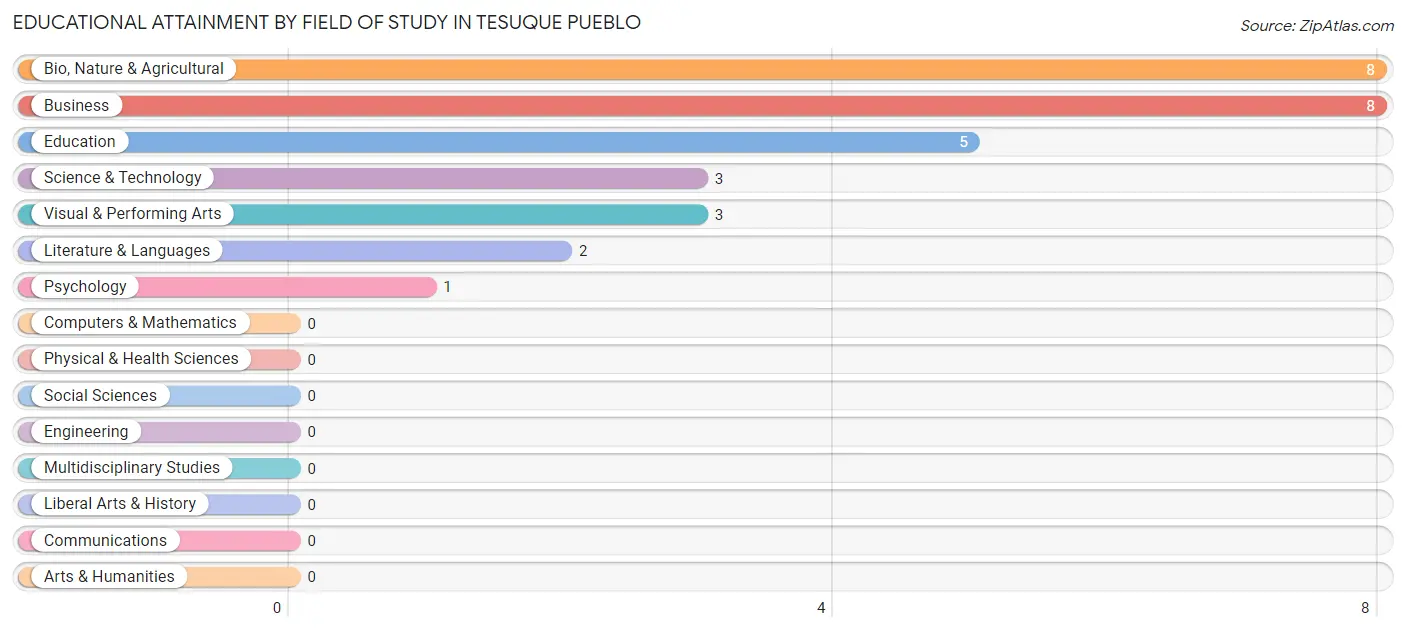
| Field of Study | # Graduates | % Graduates |
| Computers & Mathematics | 0 | 0.0% |
| Bio, Nature & Agricultural | 8 | 26.7% |
| Physical & Health Sciences | 0 | 0.0% |
| Psychology | 1 | 3.3% |
| Social Sciences | 0 | 0.0% |
| Engineering | 0 | 0.0% |
| Multidisciplinary Studies | 0 | 0.0% |
| Science & Technology | 3 | 10.0% |
| Business | 8 | 26.7% |
| Education | 5 | 16.7% |
| Literature & Languages | 2 | 6.7% |
| Liberal Arts & History | 0 | 0.0% |
| Visual & Performing Arts | 3 | 10.0% |
| Communications | 0 | 0.0% |
| Arts & Humanities | 0 | 0.0% |
| Total | 30 | 100.0% |
Transportation & Commute in Tesuque Pueblo
Vehicle Availability by Sex in Tesuque Pueblo
The most prevalent vehicle ownership categories in Tesuque Pueblo are males with 3 vehicles (30, accounting for 37.0%) and females with 3 vehicles (51, making up 34.9%).
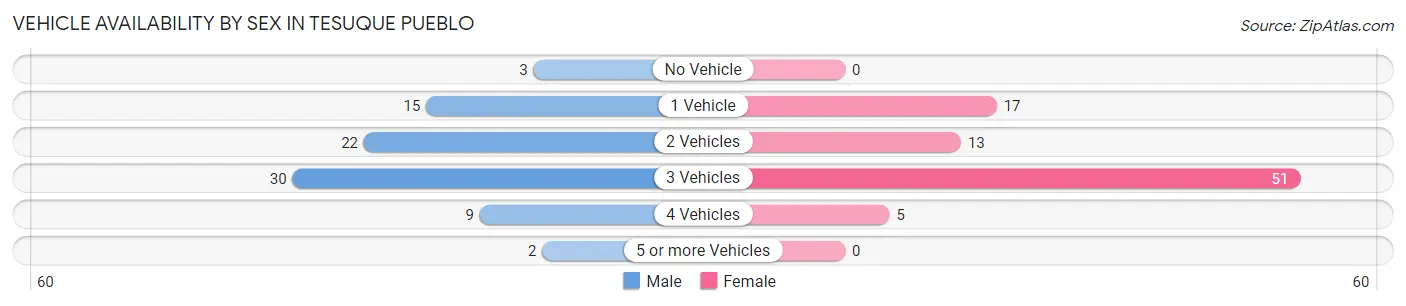
| Vehicles Available | Male | Female |
| No Vehicle | 3 (3.7%) | 0 (0.0%) |
| 1 Vehicle | 15 (18.5%) | 17 (19.8%) |
| 2 Vehicles | 22 (27.2%) | 13 (15.1%) |
| 3 Vehicles | 30 (37.0%) | 51 (59.3%) |
| 4 Vehicles | 9 (11.1%) | 5 (5.8%) |
| 5 or more Vehicles | 2 (2.5%) | 0 (0.0%) |
| Total | 81 (100.0%) | 86 (100.0%) |
Commute Time in Tesuque Pueblo
The most frequently occuring commute durations in Tesuque Pueblo are 5 to 9 minutes (71 commuters, 43.6%), 25 to 29 minutes (21 commuters, 12.9%), and 30 to 34 minutes (19 commuters, 11.7%).
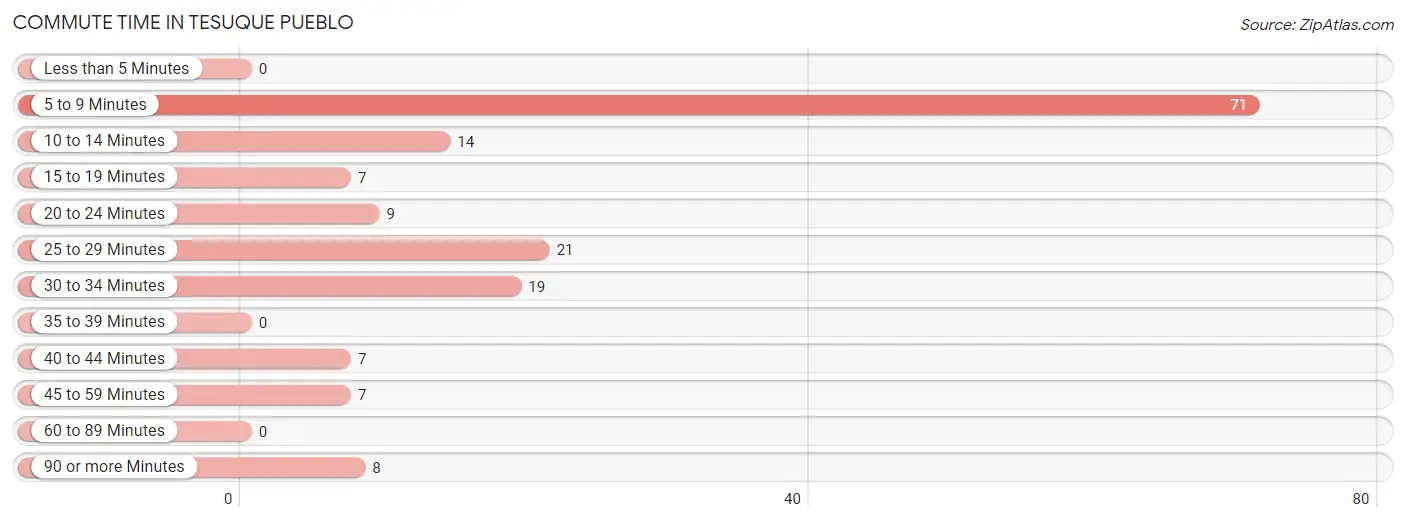
| Commute Time | # Commuters | % Commuters |
| Less than 5 Minutes | 0 | 0.0% |
| 5 to 9 Minutes | 71 | 43.6% |
| 10 to 14 Minutes | 14 | 8.6% |
| 15 to 19 Minutes | 7 | 4.3% |
| 20 to 24 Minutes | 9 | 5.5% |
| 25 to 29 Minutes | 21 | 12.9% |
| 30 to 34 Minutes | 19 | 11.7% |
| 35 to 39 Minutes | 0 | 0.0% |
| 40 to 44 Minutes | 7 | 4.3% |
| 45 to 59 Minutes | 7 | 4.3% |
| 60 to 89 Minutes | 0 | 0.0% |
| 90 or more Minutes | 8 | 4.9% |
Commute Time by Sex in Tesuque Pueblo
The most common commute times in Tesuque Pueblo are 25 to 29 minutes (18 commuters, 22.5%) for males and 5 to 9 minutes (56 commuters, 67.5%) for females.
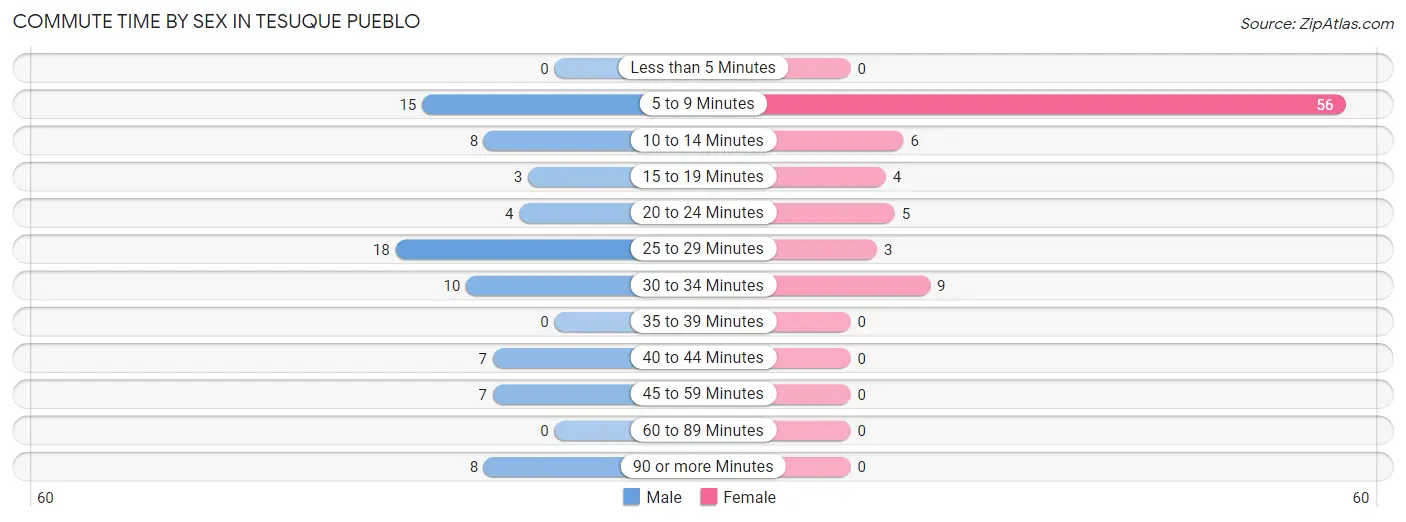
| Commute Time | Male | Female |
| Less than 5 Minutes | 0 (0.0%) | 0 (0.0%) |
| 5 to 9 Minutes | 15 (18.8%) | 56 (67.5%) |
| 10 to 14 Minutes | 8 (10.0%) | 6 (7.2%) |
| 15 to 19 Minutes | 3 (3.7%) | 4 (4.8%) |
| 20 to 24 Minutes | 4 (5.0%) | 5 (6.0%) |
| 25 to 29 Minutes | 18 (22.5%) | 3 (3.6%) |
| 30 to 34 Minutes | 10 (12.5%) | 9 (10.8%) |
| 35 to 39 Minutes | 0 (0.0%) | 0 (0.0%) |
| 40 to 44 Minutes | 7 (8.7%) | 0 (0.0%) |
| 45 to 59 Minutes | 7 (8.7%) | 0 (0.0%) |
| 60 to 89 Minutes | 0 (0.0%) | 0 (0.0%) |
| 90 or more Minutes | 8 (10.0%) | 0 (0.0%) |
Time of Departure to Work by Sex in Tesuque Pueblo
The most frequent times of departure to work in Tesuque Pueblo are 8:00 AM to 8:29 AM (24, 30.0%) for males and 7:30 AM to 7:59 AM (44, 53.0%) for females.
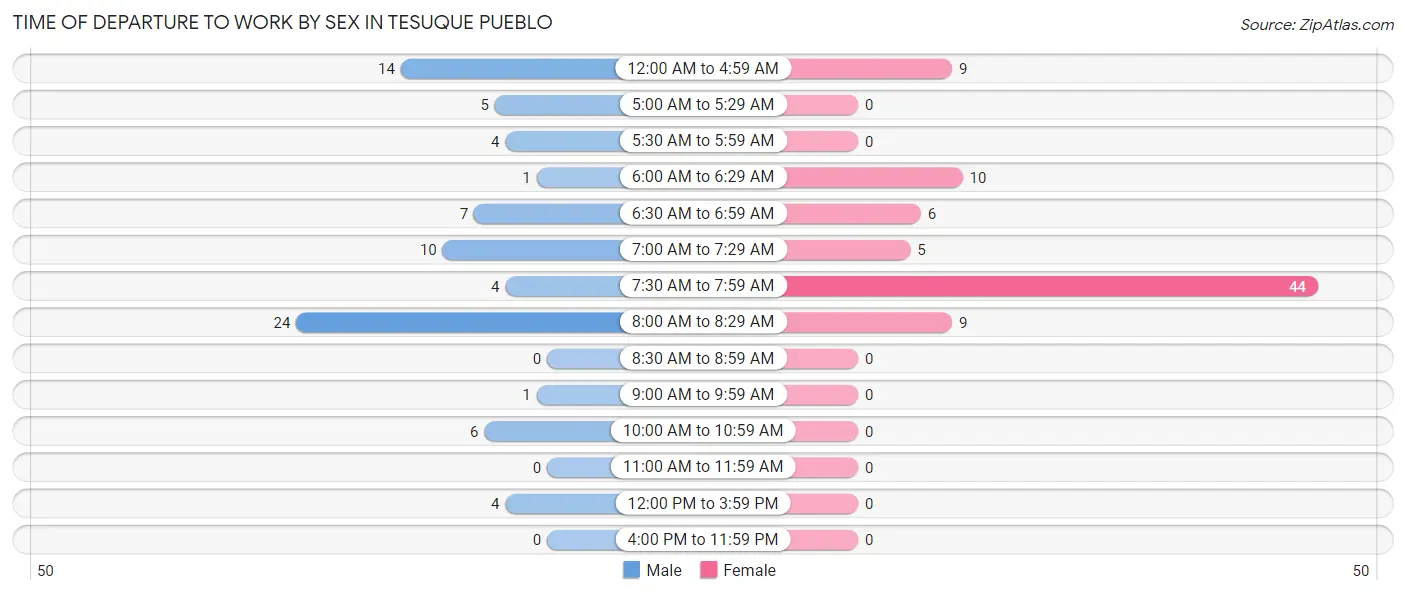
| Time of Departure | Male | Female |
| 12:00 AM to 4:59 AM | 14 (17.5%) | 9 (10.8%) |
| 5:00 AM to 5:29 AM | 5 (6.2%) | 0 (0.0%) |
| 5:30 AM to 5:59 AM | 4 (5.0%) | 0 (0.0%) |
| 6:00 AM to 6:29 AM | 1 (1.3%) | 10 (12.0%) |
| 6:30 AM to 6:59 AM | 7 (8.7%) | 6 (7.2%) |
| 7:00 AM to 7:29 AM | 10 (12.5%) | 5 (6.0%) |
| 7:30 AM to 7:59 AM | 4 (5.0%) | 44 (53.0%) |
| 8:00 AM to 8:29 AM | 24 (30.0%) | 9 (10.8%) |
| 8:30 AM to 8:59 AM | 0 (0.0%) | 0 (0.0%) |
| 9:00 AM to 9:59 AM | 1 (1.3%) | 0 (0.0%) |
| 10:00 AM to 10:59 AM | 6 (7.5%) | 0 (0.0%) |
| 11:00 AM to 11:59 AM | 0 (0.0%) | 0 (0.0%) |
| 12:00 PM to 3:59 PM | 4 (5.0%) | 0 (0.0%) |
| 4:00 PM to 11:59 PM | 0 (0.0%) | 0 (0.0%) |
| Total | 80 (100.0%) | 83 (100.0%) |
Housing Occupancy in Tesuque Pueblo
Occupancy by Ownership in Tesuque Pueblo
Of the total 104 dwellings in Tesuque Pueblo, owner-occupied units account for 97 (93.3%), while renter-occupied units make up 7 (6.7%).
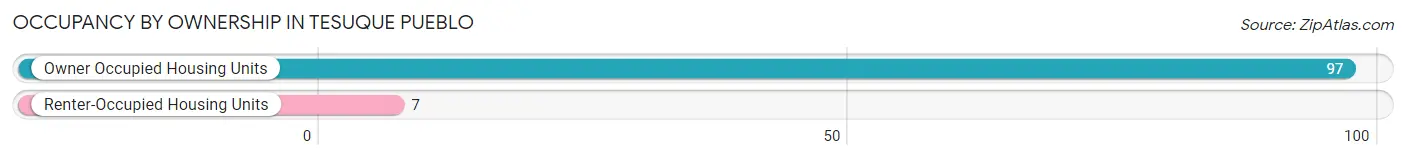
| Occupancy | # Housing Units | % Housing Units |
| Owner Occupied Housing Units | 97 | 93.3% |
| Renter-Occupied Housing Units | 7 | 6.7% |
| Total Occupied Housing Units | 104 | 100.0% |
Occupancy by Household Size in Tesuque Pueblo
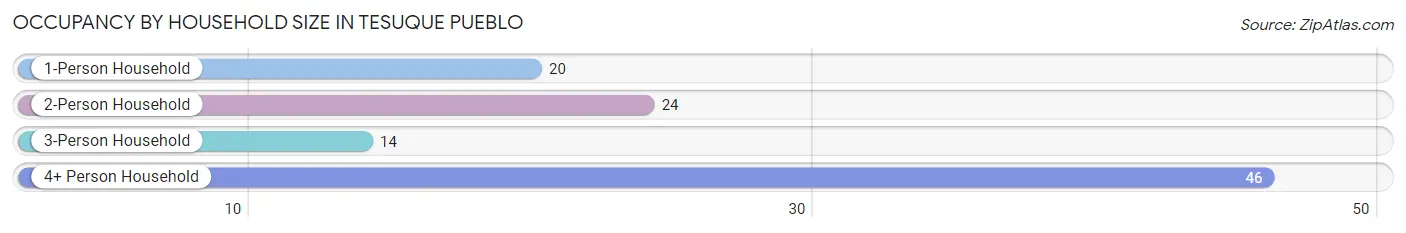
| Household Size | # Housing Units | % Housing Units |
| 1-Person Household | 20 | 19.2% |
| 2-Person Household | 24 | 23.1% |
| 3-Person Household | 14 | 13.5% |
| 4+ Person Household | 46 | 44.2% |
| Total Housing Units | 104 | 100.0% |
Occupancy by Ownership by Household Size in Tesuque Pueblo
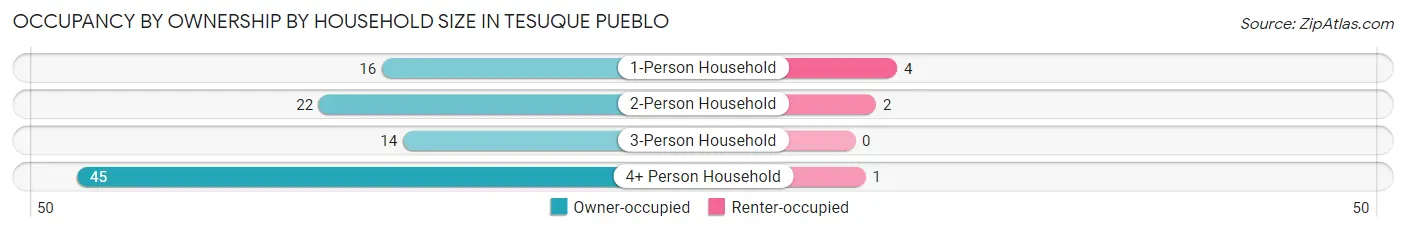
| Household Size | Owner-occupied | Renter-occupied |
| 1-Person Household | 16 (80.0%) | 4 (20.0%) |
| 2-Person Household | 22 (91.7%) | 2 (8.3%) |
| 3-Person Household | 14 (100.0%) | 0 (0.0%) |
| 4+ Person Household | 45 (97.8%) | 1 (2.2%) |
| Total Housing Units | 97 (93.3%) | 7 (6.7%) |
Occupancy by Educational Attainment in Tesuque Pueblo
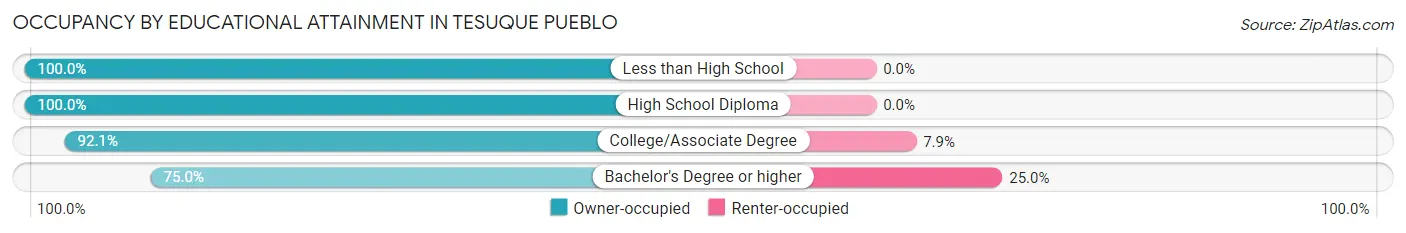
| Household Size | Owner-occupied | Renter-occupied |
| Less than High School | 8 (100.0%) | 0 (0.0%) |
| High School Diploma | 25 (100.0%) | 0 (0.0%) |
| College/Associate Degree | 58 (92.1%) | 5 (7.9%) |
| Bachelor's Degree or higher | 6 (75.0%) | 2 (25.0%) |
Occupancy by Age of Householder in Tesuque Pueblo
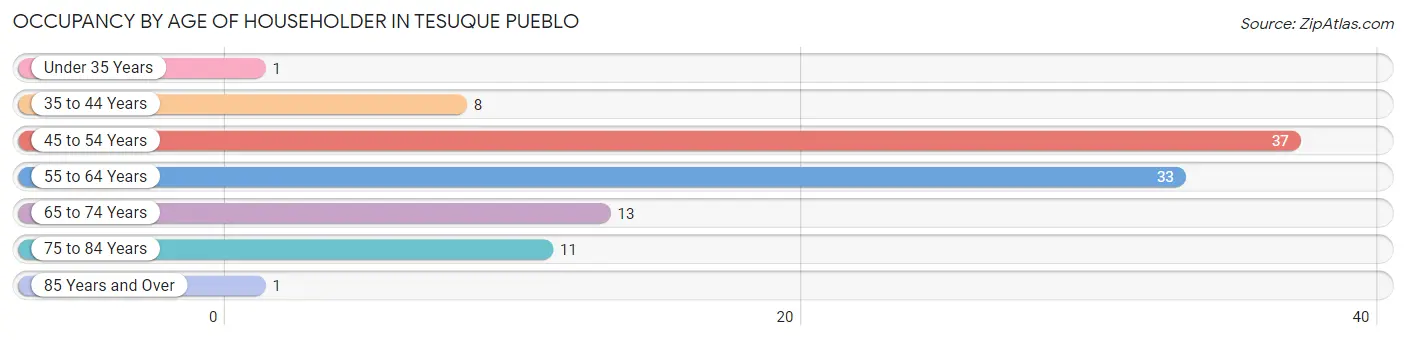
| Age Bracket | # Households | % Households |
| Under 35 Years | 1 | 1.0% |
| 35 to 44 Years | 8 | 7.7% |
| 45 to 54 Years | 37 | 35.6% |
| 55 to 64 Years | 33 | 31.7% |
| 65 to 74 Years | 13 | 12.5% |
| 75 to 84 Years | 11 | 10.6% |
| 85 Years and Over | 1 | 1.0% |
| Total | 104 | 100.0% |
Housing Finances in Tesuque Pueblo
Median Income by Occupancy in Tesuque Pueblo
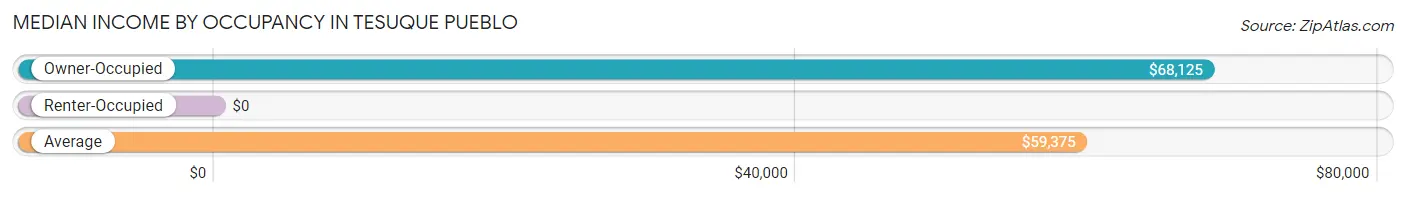
| Occupancy Type | # Households | Median Income |
| Owner-Occupied | 97 (93.3%) | $68,125 |
| Renter-Occupied | 7 (6.7%) | $0 |
| Average | 104 (100.0%) | $59,375 |
Occupancy by Householder Income Bracket in Tesuque Pueblo
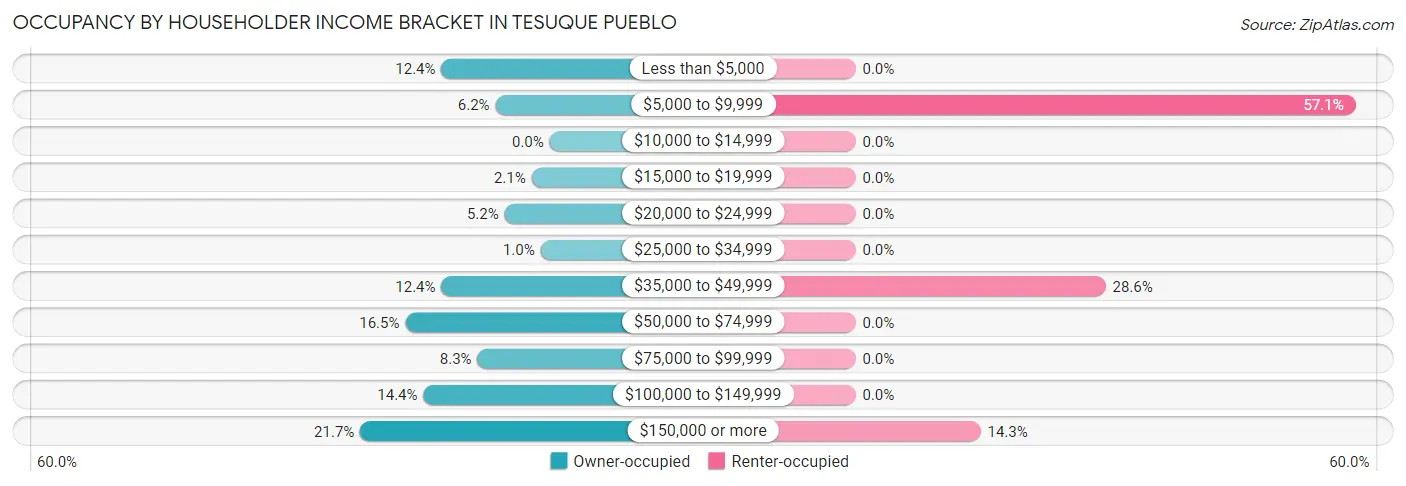
| Income Bracket | Owner-occupied | Renter-occupied |
| Less than $5,000 | 12 (12.4%) | 0 (0.0%) |
| $5,000 to $9,999 | 6 (6.2%) | 4 (57.1%) |
| $10,000 to $14,999 | 0 (0.0%) | 0 (0.0%) |
| $15,000 to $19,999 | 2 (2.1%) | 0 (0.0%) |
| $20,000 to $24,999 | 5 (5.1%) | 0 (0.0%) |
| $25,000 to $34,999 | 1 (1.0%) | 0 (0.0%) |
| $35,000 to $49,999 | 12 (12.4%) | 2 (28.6%) |
| $50,000 to $74,999 | 16 (16.5%) | 0 (0.0%) |
| $75,000 to $99,999 | 8 (8.3%) | 0 (0.0%) |
| $100,000 to $149,999 | 14 (14.4%) | 0 (0.0%) |
| $150,000 or more | 21 (21.6%) | 1 (14.3%) |
| Total | 97 (100.0%) | 7 (100.0%) |
Monthly Housing Cost Tiers in Tesuque Pueblo
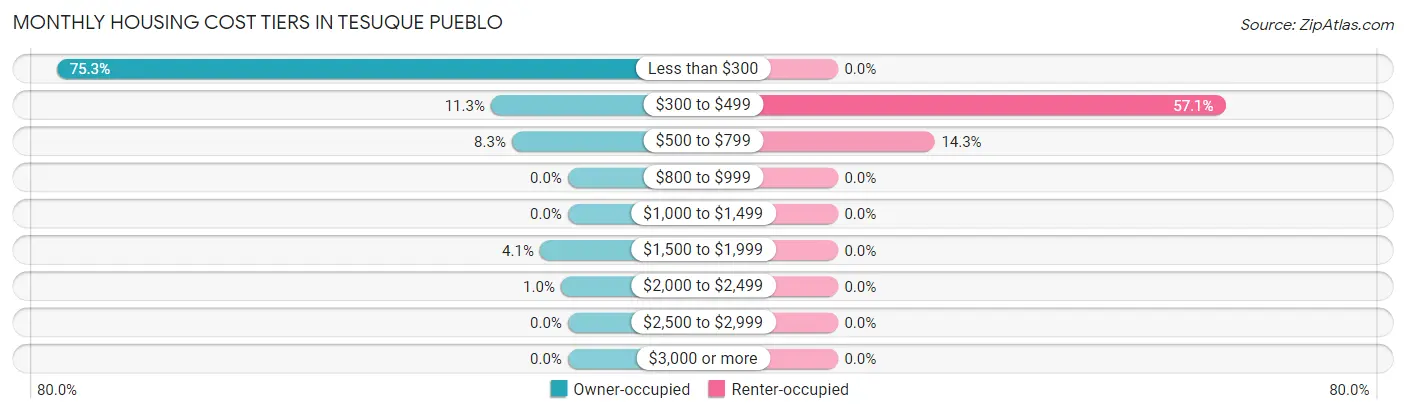
| Monthly Cost | Owner-occupied | Renter-occupied |
| Less than $300 | 73 (75.3%) | 0 (0.0%) |
| $300 to $499 | 11 (11.3%) | 4 (57.1%) |
| $500 to $799 | 8 (8.3%) | 1 (14.3%) |
| $800 to $999 | 0 (0.0%) | 0 (0.0%) |
| $1,000 to $1,499 | 0 (0.0%) | 0 (0.0%) |
| $1,500 to $1,999 | 4 (4.1%) | 0 (0.0%) |
| $2,000 to $2,499 | 1 (1.0%) | 0 (0.0%) |
| $2,500 to $2,999 | 0 (0.0%) | 0 (0.0%) |
| $3,000 or more | 0 (0.0%) | 0 (0.0%) |
| Total | 97 (100.0%) | 7 (100.0%) |
Physical Housing Characteristics in Tesuque Pueblo
Housing Structures in Tesuque Pueblo
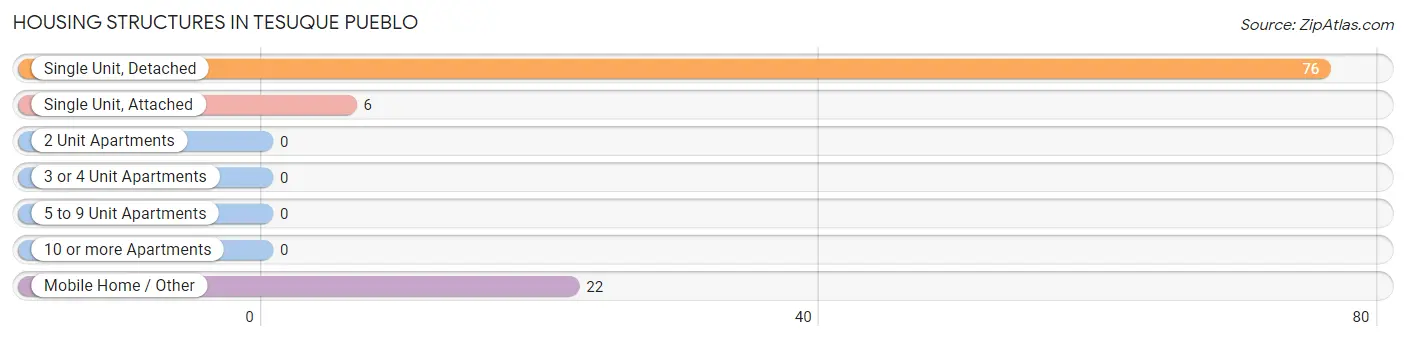
| Structure Type | # Housing Units | % Housing Units |
| Single Unit, Detached | 76 | 73.1% |
| Single Unit, Attached | 6 | 5.8% |
| 2 Unit Apartments | 0 | 0.0% |
| 3 or 4 Unit Apartments | 0 | 0.0% |
| 5 to 9 Unit Apartments | 0 | 0.0% |
| 10 or more Apartments | 0 | 0.0% |
| Mobile Home / Other | 22 | 21.1% |
| Total | 104 | 100.0% |
Housing Structures by Occupancy in Tesuque Pueblo
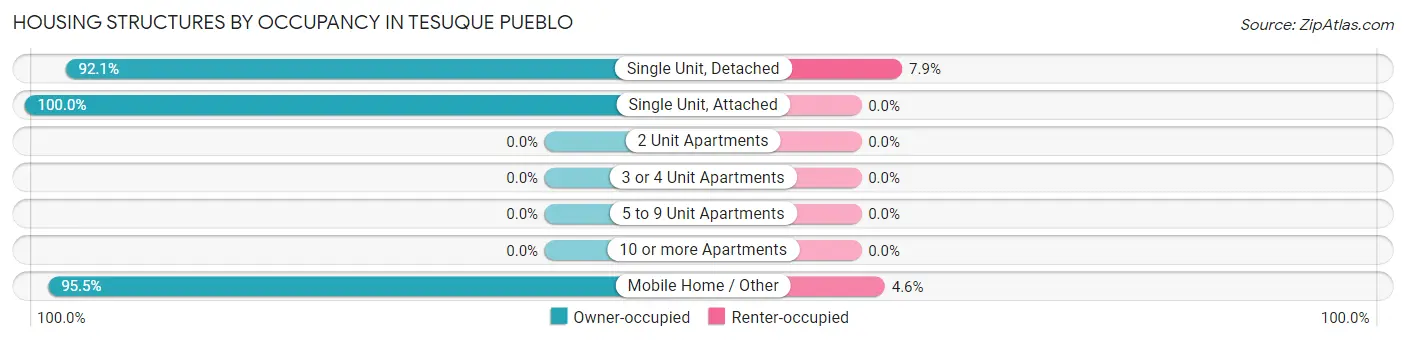
| Structure Type | Owner-occupied | Renter-occupied |
| Single Unit, Detached | 70 (92.1%) | 6 (7.9%) |
| Single Unit, Attached | 6 (100.0%) | 0 (0.0%) |
| 2 Unit Apartments | 0 (0.0%) | 0 (0.0%) |
| 3 or 4 Unit Apartments | 0 (0.0%) | 0 (0.0%) |
| 5 to 9 Unit Apartments | 0 (0.0%) | 0 (0.0%) |
| 10 or more Apartments | 0 (0.0%) | 0 (0.0%) |
| Mobile Home / Other | 21 (95.5%) | 1 (4.5%) |
| Total | 97 (93.3%) | 7 (6.7%) |
Housing Structures by Number of Rooms in Tesuque Pueblo
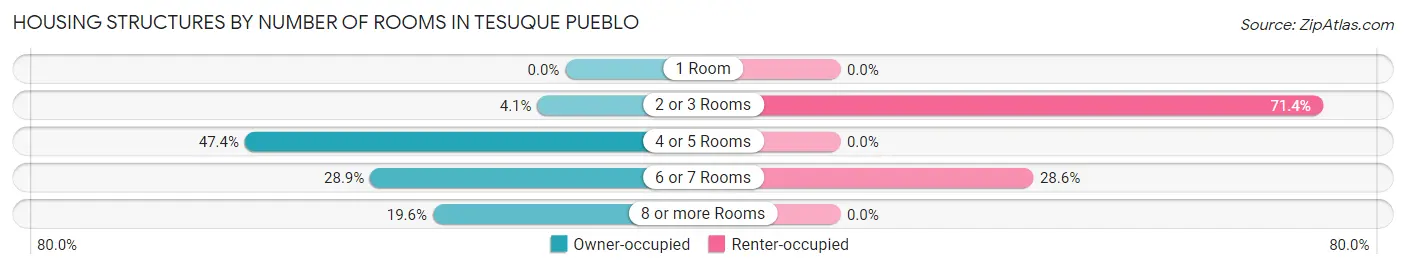
| Number of Rooms | Owner-occupied | Renter-occupied |
| 1 Room | 0 (0.0%) | 0 (0.0%) |
| 2 or 3 Rooms | 4 (4.1%) | 5 (71.4%) |
| 4 or 5 Rooms | 46 (47.4%) | 0 (0.0%) |
| 6 or 7 Rooms | 28 (28.9%) | 2 (28.6%) |
| 8 or more Rooms | 19 (19.6%) | 0 (0.0%) |
| Total | 97 (100.0%) | 7 (100.0%) |
Housing Structure by Heating Type in Tesuque Pueblo
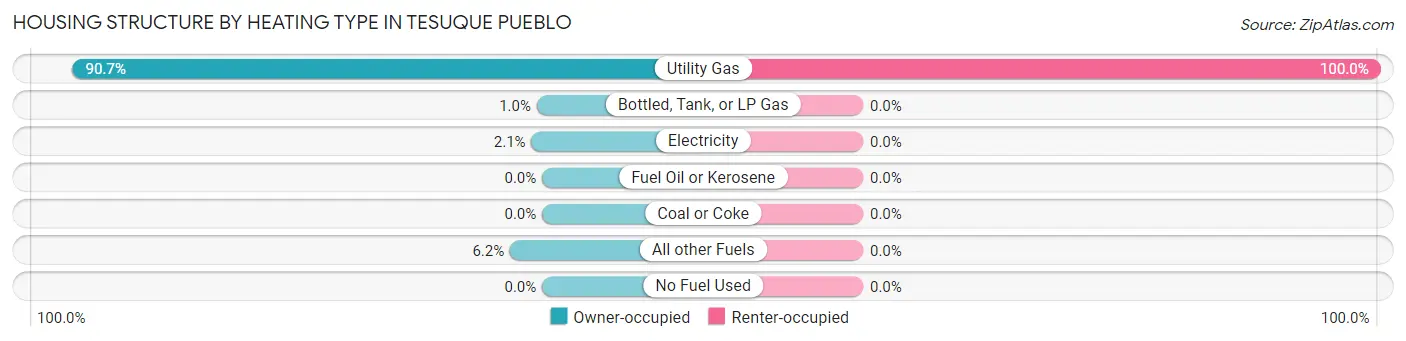
| Heating Type | Owner-occupied | Renter-occupied |
| Utility Gas | 88 (90.7%) | 7 (100.0%) |
| Bottled, Tank, or LP Gas | 1 (1.0%) | 0 (0.0%) |
| Electricity | 2 (2.1%) | 0 (0.0%) |
| Fuel Oil or Kerosene | 0 (0.0%) | 0 (0.0%) |
| Coal or Coke | 0 (0.0%) | 0 (0.0%) |
| All other Fuels | 6 (6.2%) | 0 (0.0%) |
| No Fuel Used | 0 (0.0%) | 0 (0.0%) |
| Total | 97 (100.0%) | 7 (100.0%) |
Household Vehicle Usage in Tesuque Pueblo
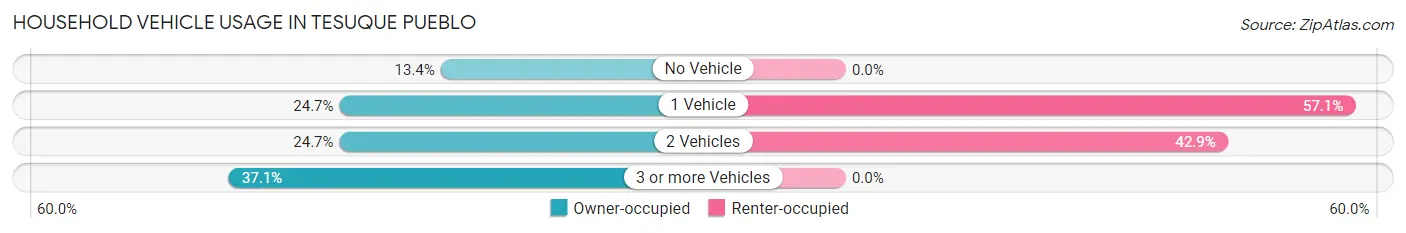
| Vehicles per Household | Owner-occupied | Renter-occupied |
| No Vehicle | 13 (13.4%) | 0 (0.0%) |
| 1 Vehicle | 24 (24.7%) | 4 (57.1%) |
| 2 Vehicles | 24 (24.7%) | 3 (42.9%) |
| 3 or more Vehicles | 36 (37.1%) | 0 (0.0%) |
| Total | 97 (100.0%) | 7 (100.0%) |
Real Estate & Mortgages in Tesuque Pueblo
Real Estate and Mortgage Overview in Tesuque Pueblo
| Characteristic | Without Mortgage | With Mortgage |
| Housing Units | 88 | 9 |
| Median Property Value | $105,000 | $0 |
| Median Household Income | $58,125 | $4 |
| Monthly Housing Costs | $182 | $0 |
| Real Estate Taxes | - | - |
Property Value by Mortgage Status in Tesuque Pueblo
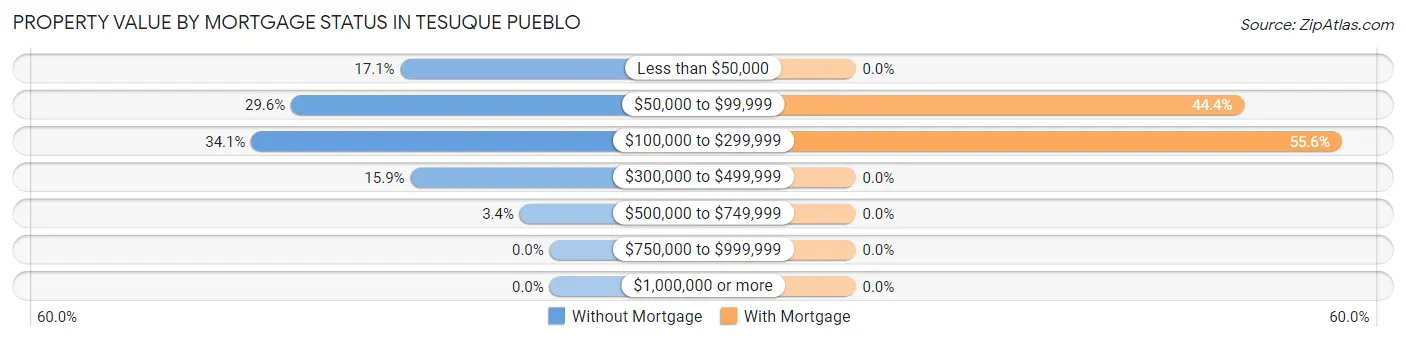
| Property Value | Without Mortgage | With Mortgage |
| Less than $50,000 | 15 (17.1%) | 0 (0.0%) |
| $50,000 to $99,999 | 26 (29.5%) | 4 (44.4%) |
| $100,000 to $299,999 | 30 (34.1%) | 5 (55.6%) |
| $300,000 to $499,999 | 14 (15.9%) | 0 (0.0%) |
| $500,000 to $749,999 | 3 (3.4%) | 0 (0.0%) |
| $750,000 to $999,999 | 0 (0.0%) | 0 (0.0%) |
| $1,000,000 or more | 0 (0.0%) | 0 (0.0%) |
| Total | 88 (100.0%) | 9 (100.0%) |
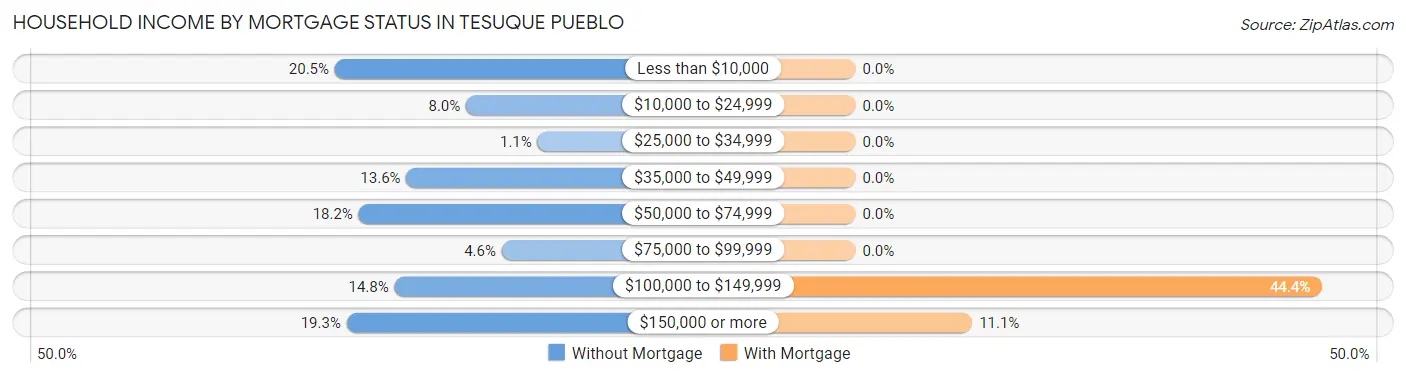
Household Income by Mortgage Status in Tesuque Pueblo
| Household Income | Without Mortgage | With Mortgage |
| Less than $10,000 | 18 (20.4%) | 0 (0.0%) |
| $10,000 to $24,999 | 7 (8.0%) | 0 (0.0%) |
| $25,000 to $34,999 | 1 (1.1%) | 0 (0.0%) |
| $35,000 to $49,999 | 12 (13.6%) | 0 (0.0%) |
| $50,000 to $74,999 | 16 (18.2%) | 0 (0.0%) |
| $75,000 to $99,999 | 4 (4.5%) | 0 (0.0%) |
| $100,000 to $149,999 | 13 (14.8%) | 4 (44.4%) |
| $150,000 or more | 17 (19.3%) | 1 (11.1%) |
| Total | 88 (100.0%) | 9 (100.0%) |
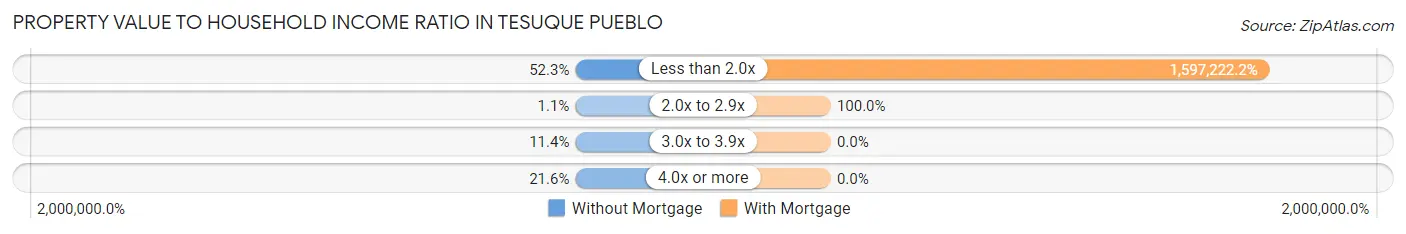
Property Value to Household Income Ratio in Tesuque Pueblo
| Value-to-Income Ratio | Without Mortgage | With Mortgage |
| Less than 2.0x | 46 (52.3%) | 143,750 (1,597,222.2%) |
| 2.0x to 2.9x | 1 (1.1%) | 9 (100.0%) |
| 3.0x to 3.9x | 10 (11.4%) | 0 (0.0%) |
| 4.0x or more | 19 (21.6%) | 0 (0.0%) |
| Total | 88 (100.0%) | 9 (100.0%) |
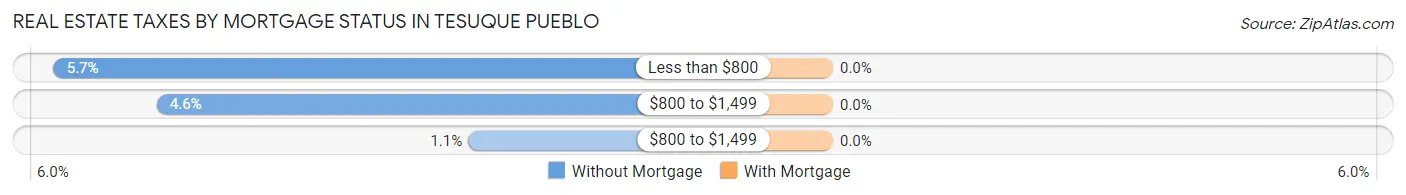
Real Estate Taxes by Mortgage Status in Tesuque Pueblo
| Property Taxes | Without Mortgage | With Mortgage |
| Less than $800 | 5 (5.7%) | 0 (0.0%) |
| $800 to $1,499 | 4 (4.5%) | 0 (0.0%) |
| $800 to $1,499 | 1 (1.1%) | 0 (0.0%) |
| Total | 88 (100.0%) | 9 (100.0%) |
Health & Disability in Tesuque Pueblo
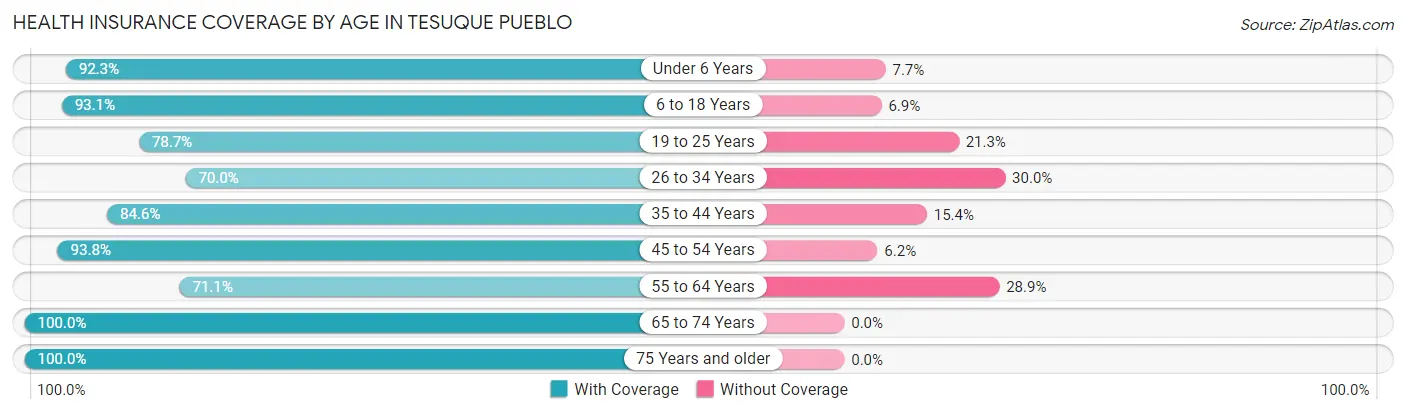
Health Insurance Coverage by Age in Tesuque Pueblo
| Age Bracket | With Coverage | Without Coverage |
| Under 6 Years | 24 (92.3%) | 2 (7.7%) |
| 6 to 18 Years | 94 (93.1%) | 7 (6.9%) |
| 19 to 25 Years | 59 (78.7%) | 16 (21.3%) |
| 26 to 34 Years | 28 (70.0%) | 12 (30.0%) |
| 35 to 44 Years | 11 (84.6%) | 2 (15.4%) |
| 45 to 54 Years | 76 (93.8%) | 5 (6.2%) |
| 55 to 64 Years | 32 (71.1%) | 13 (28.9%) |
| 65 to 74 Years | 83 (100.0%) | 0 (0.0%) |
| 75 Years and older | 17 (100.0%) | 0 (0.0%) |
| Total | 424 (88.1%) | 57 (11.8%) |
Health Insurance Coverage by Citizenship Status in Tesuque Pueblo

| Citizenship Status | With Coverage | Without Coverage |
| Native Born | 24 (92.3%) | 2 (7.7%) |
| Foreign Born, Citizen | 94 (93.1%) | 7 (6.9%) |
| Foreign Born, not a Citizen | 59 (78.7%) | 16 (21.3%) |
Health Insurance Coverage by Household Income in Tesuque Pueblo
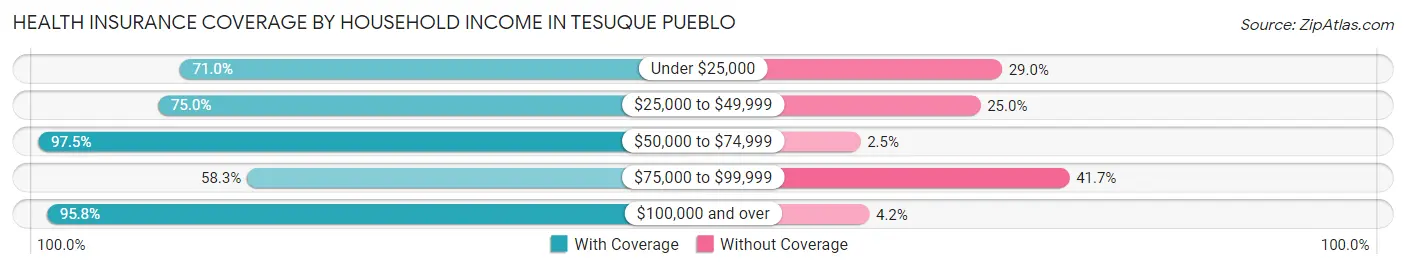
| Household Income | With Coverage | Without Coverage |
| Under $25,000 | 44 (71.0%) | 18 (29.0%) |
| $25,000 to $49,999 | 36 (75.0%) | 12 (25.0%) |
| $50,000 to $74,999 | 116 (97.5%) | 3 (2.5%) |
| $75,000 to $99,999 | 21 (58.3%) | 15 (41.7%) |
| $100,000 and over | 207 (95.8%) | 9 (4.2%) |
Public vs Private Health Insurance Coverage by Age in Tesuque Pueblo
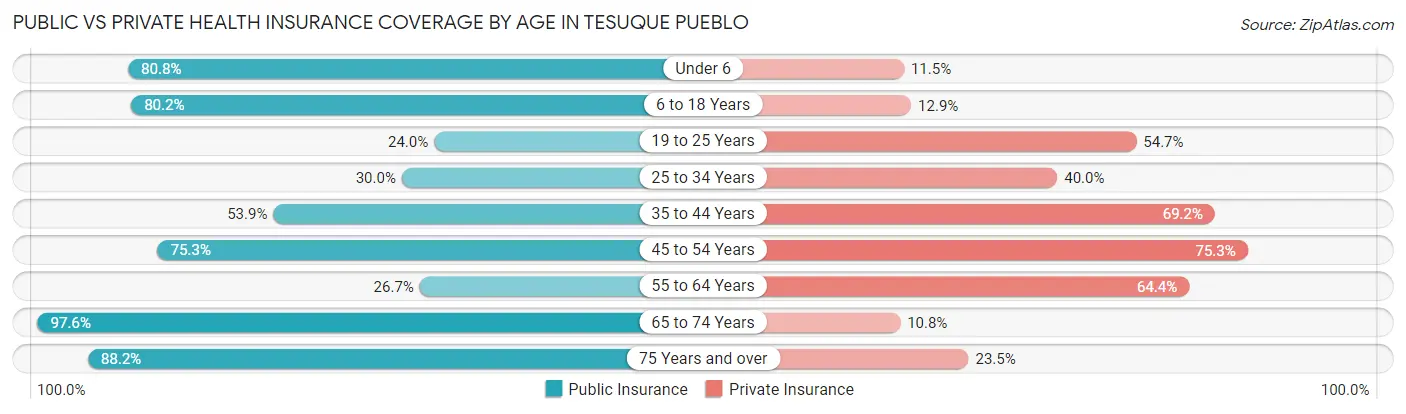
| Age Bracket | Public Insurance | Private Insurance |
| Under 6 | 21 (80.8%) | 3 (11.5%) |
| 6 to 18 Years | 81 (80.2%) | 13 (12.9%) |
| 19 to 25 Years | 18 (24.0%) | 41 (54.7%) |
| 25 to 34 Years | 12 (30.0%) | 16 (40.0%) |
| 35 to 44 Years | 7 (53.8%) | 9 (69.2%) |
| 45 to 54 Years | 61 (75.3%) | 61 (75.3%) |
| 55 to 64 Years | 12 (26.7%) | 29 (64.4%) |
| 65 to 74 Years | 81 (97.6%) | 9 (10.8%) |
| 75 Years and over | 15 (88.2%) | 4 (23.5%) |
| Total | 308 (64.0%) | 185 (38.5%) |
Disability Status by Sex by Age in Tesuque Pueblo
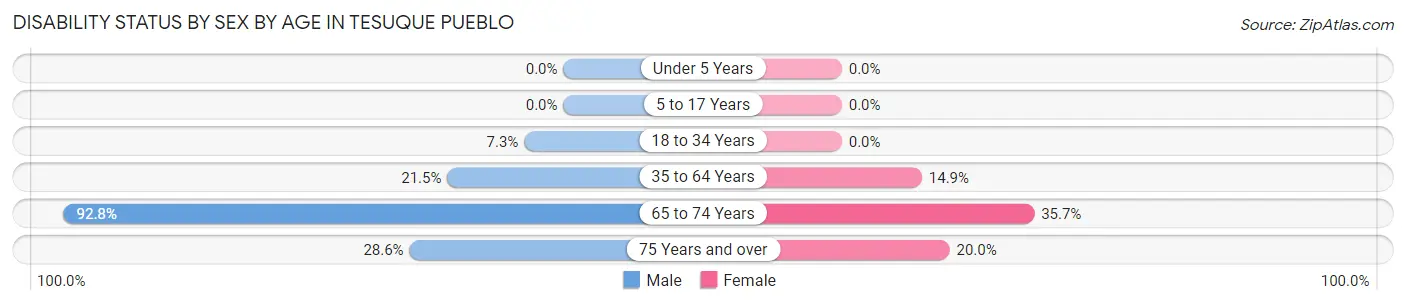
| Age Bracket | Male | Female |
| Under 5 Years | 0 (0.0%) | 0 (0.0%) |
| 5 to 17 Years | 0 (0.0%) | 0 (0.0%) |
| 18 to 34 Years | 4 (7.3%) | 0 (0.0%) |
| 35 to 64 Years | 14 (21.5%) | 11 (14.9%) |
| 65 to 74 Years | 64 (92.7%) | 5 (35.7%) |
| 75 Years and over | 2 (28.6%) | 2 (20.0%) |
Disability Class by Sex by Age in Tesuque Pueblo
Disability Class: Hearing Difficulty
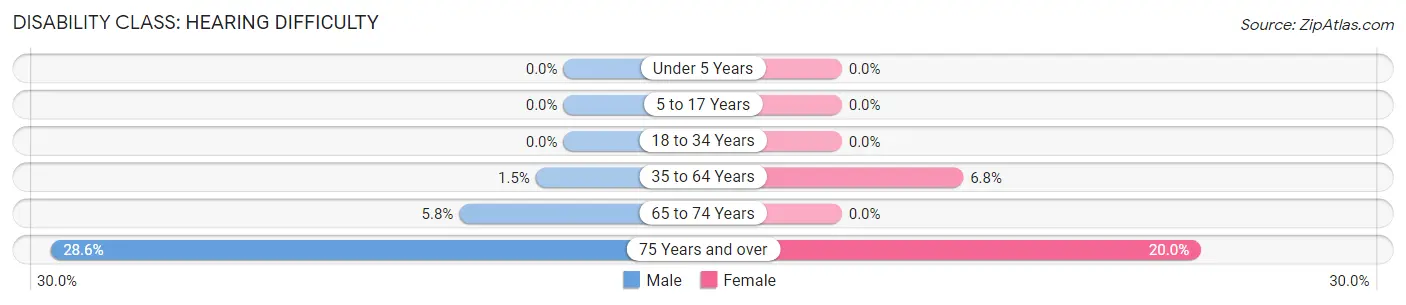
| Age Bracket | Male | Female |
| Under 5 Years | 0 (0.0%) | 0 (0.0%) |
| 5 to 17 Years | 0 (0.0%) | 0 (0.0%) |
| 18 to 34 Years | 0 (0.0%) | 0 (0.0%) |
| 35 to 64 Years | 1 (1.5%) | 5 (6.8%) |
| 65 to 74 Years | 4 (5.8%) | 0 (0.0%) |
| 75 Years and over | 2 (28.6%) | 2 (20.0%) |
Disability Class: Vision Difficulty
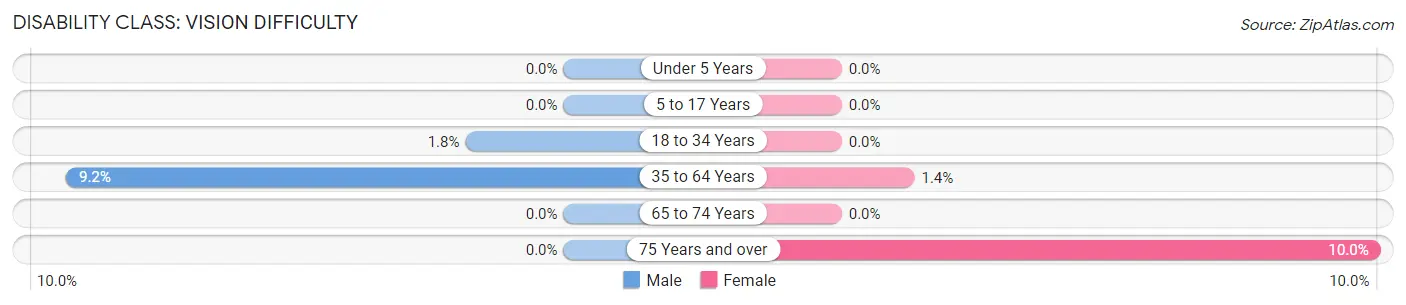
| Age Bracket | Male | Female |
| Under 5 Years | 0 (0.0%) | 0 (0.0%) |
| 5 to 17 Years | 0 (0.0%) | 0 (0.0%) |
| 18 to 34 Years | 1 (1.8%) | 0 (0.0%) |
| 35 to 64 Years | 6 (9.2%) | 1 (1.3%) |
| 65 to 74 Years | 0 (0.0%) | 0 (0.0%) |
| 75 Years and over | 0 (0.0%) | 1 (10.0%) |
Disability Class: Cognitive Difficulty
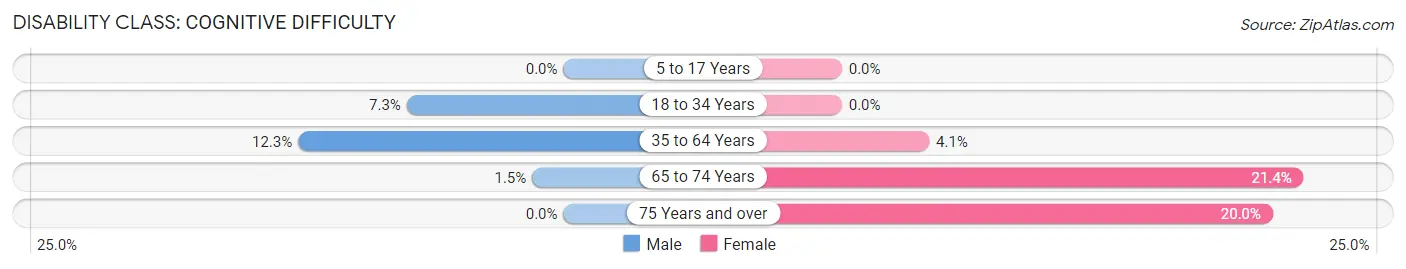
| Age Bracket | Male | Female |
| 5 to 17 Years | 0 (0.0%) | 0 (0.0%) |
| 18 to 34 Years | 4 (7.3%) | 0 (0.0%) |
| 35 to 64 Years | 8 (12.3%) | 3 (4.1%) |
| 65 to 74 Years | 1 (1.5%) | 3 (21.4%) |
| 75 Years and over | 0 (0.0%) | 2 (20.0%) |
Disability Class: Ambulatory Difficulty
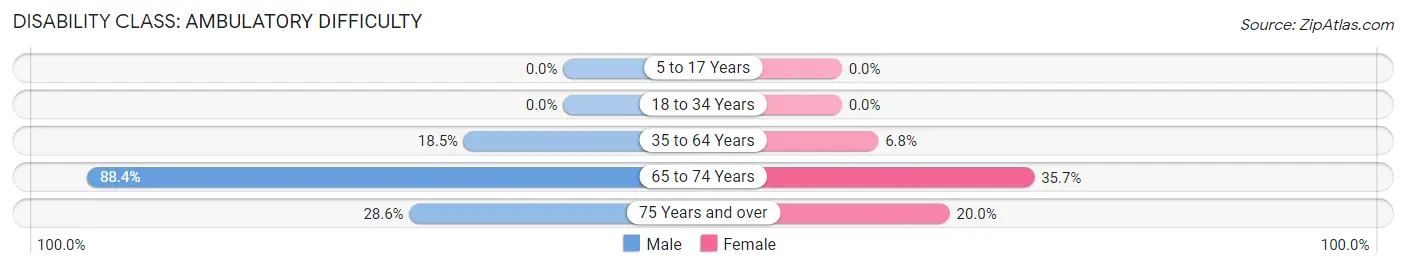
| Age Bracket | Male | Female |
| 5 to 17 Years | 0 (0.0%) | 0 (0.0%) |
| 18 to 34 Years | 0 (0.0%) | 0 (0.0%) |
| 35 to 64 Years | 12 (18.5%) | 5 (6.8%) |
| 65 to 74 Years | 61 (88.4%) | 5 (35.7%) |
| 75 Years and over | 2 (28.6%) | 2 (20.0%) |
Disability Class: Self-Care Difficulty
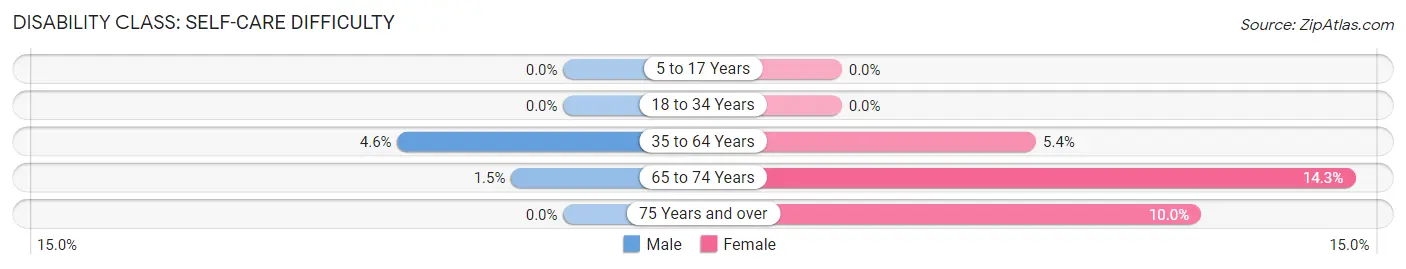
| Age Bracket | Male | Female |
| 5 to 17 Years | 0 (0.0%) | 0 (0.0%) |
| 18 to 34 Years | 0 (0.0%) | 0 (0.0%) |
| 35 to 64 Years | 3 (4.6%) | 4 (5.4%) |
| 65 to 74 Years | 1 (1.5%) | 2 (14.3%) |
| 75 Years and over | 0 (0.0%) | 1 (10.0%) |
Technology Access in Tesuque Pueblo
Computing Device Access in Tesuque Pueblo
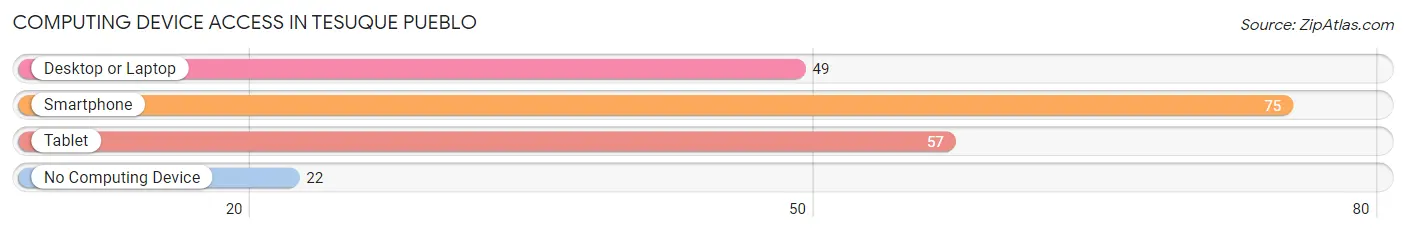
| Device Type | # Households | % Households |
| Desktop or Laptop | 49 | 47.1% |
| Smartphone | 75 | 72.1% |
| Tablet | 57 | 54.8% |
| No Computing Device | 22 | 21.1% |
| Total | 104 | 100.0% |
Internet Access in Tesuque Pueblo
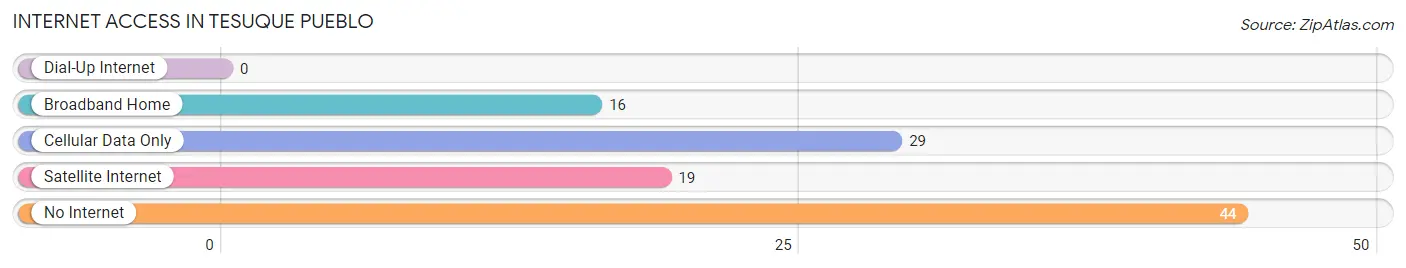
| Internet Type | # Households | % Households |
| Dial-Up Internet | 0 | 0.0% |
| Broadband Home | 16 | 15.4% |
| Cellular Data Only | 29 | 27.9% |
| Satellite Internet | 19 | 18.3% |
| No Internet | 44 | 42.3% |
| Total | 104 | 100.0% |
Tesuque Pueblo Summary
Tesuque Pueblo is a Native American Pueblo located in Santa Fe County, New Mexico. It is one of the 19 Pueblos of New Mexico, and is the only Pueblo located within the city limits of Santa Fe. The Pueblo is home to the Tesuque people, who are members of the Tewa language group. The Pueblo is located on the Tesuque River, and is surrounded by the Sangre de Cristo Mountains.
Geography
Tesuque Pueblo is located in the foothills of the Sangre de Cristo Mountains, approximately 10 miles north of Santa Fe. The Pueblo is situated on the Tesuque River, which is a tributary of the Rio Grande. The Pueblo is located at an elevation of 6,400 feet, and covers an area of approximately 4,000 acres. The climate is semi-arid, with hot summers and cold winters.
History
Tesuque Pueblo has a long and rich history. The Pueblo was first established by the Tewa people in the late 13th century. The Pueblo was part of the Tewa homeland, and was a major center of trade and commerce. The Pueblo was also a major religious center, and was home to many ceremonies and rituals.
In the 16th century, the Spanish arrived in the area and began to colonize the region. The Spanish attempted to convert the Tewa people to Christianity, and forced them to work in the mines and on the ranches. The Tewa people resisted the Spanish, and were able to maintain their culture and traditions.
In the 19th century, the United States acquired the area as part of the Treaty of Guadalupe Hidalgo. The US government recognized the Pueblo as a sovereign nation, and granted it a reservation. The Pueblo was also granted a land grant, which allowed the Pueblo to maintain its traditional way of life.
Economy
The economy of Tesuque Pueblo is based primarily on agriculture and tourism. The Pueblo is home to a number of farms, which produce a variety of crops, including corn, beans, squash, and melons. The Pueblo also has a number of small businesses, including restaurants, gift shops, and art galleries.
Tourism is an important part of the economy of Tesuque Pueblo. The Pueblo is home to a number of cultural attractions, including the Tesuque Pueblo Museum, the Tesuque Pueblo Cultural Center, and the Tesuque Pueblo Powwow. The Pueblo also hosts a number of festivals and events throughout the year, including the Tesuque Pueblo Feast Day and the Tesuque Pueblo Powwow.
Demographics
As of the 2010 census, the population of Tesuque Pueblo was 1,206. The population is primarily Native American, with 97.3% of the population identifying as Native American. The median age of the population is 37.7 years, and the median household income is $30,938.
Conclusion
Tesuque Pueblo is a Native American Pueblo located in Santa Fe County, New Mexico. The Pueblo is home to the Tesuque people, who are members of the Tewa language group. The Pueblo is located on the Tesuque River, and is surrounded by the Sangre de Cristo Mountains. The economy of Tesuque Pueblo is based primarily on agriculture and tourism, and the population is primarily Native American. The Pueblo is home to a number of cultural attractions, and hosts a number of festivals and events throughout the year.
Common Questions
What is Per Capita Income in Tesuque Pueblo?
Per Capita income in Tesuque Pueblo is $27,353.
What is the Median Family Income in Tesuque Pueblo?
Median Family Income in Tesuque Pueblo is $75,000.
What is the Median Household income in Tesuque Pueblo?
Median Household Income in Tesuque Pueblo is $59,375.
What is Income or Wage Gap in Tesuque Pueblo?
Income or Wage Gap in Tesuque Pueblo is 41.9%.
Women in Tesuque Pueblo earn 58.1 cents for every dollar earned by a man.
What is Inequality or Gini Index in Tesuque Pueblo?
Inequality or Gini Index in Tesuque Pueblo is 0.46.
What is the Total Population of Tesuque Pueblo?
Total Population of Tesuque Pueblo is 481.
What is the Total Male Population of Tesuque Pueblo?
Total Male Population of Tesuque Pueblo is 267.
What is the Total Female Population of Tesuque Pueblo?
Total Female Population of Tesuque Pueblo is 214.
What is the Ratio of Males per 100 Females in Tesuque Pueblo?
There are 124.77 Males per 100 Females in Tesuque Pueblo.
What is the Ratio of Females per 100 Males in Tesuque Pueblo?
There are 80.15 Females per 100 Males in Tesuque Pueblo.
What is the Median Population Age in Tesuque Pueblo?
Median Population Age in Tesuque Pueblo is 34.5 Years.
What is the Average Family Size in Tesuque Pueblo
Average Family Size in Tesuque Pueblo is 5.5 People.
What is the Average Household Size in Tesuque Pueblo
Average Household Size in Tesuque Pueblo is 4.6 People.
How Large is the Labor Force in Tesuque Pueblo?
There are 213 People in the Labor Forcein in Tesuque Pueblo.
What is the Percentage of People in the Labor Force in Tesuque Pueblo?
58.2% of People are in the Labor Force in Tesuque Pueblo.
What is the Unemployment Rate in Tesuque Pueblo?
Unemployment Rate in Tesuque Pueblo is 21.6%.