Pendleton, OR Map & Demographics
Pendleton Map
Pendleton Overview
$28,841
PER CAPITA INCOME
$83,052
AVG FAMILY INCOME
$67,931
AVG HOUSEHOLD INCOME
2.9%
WAGE / INCOME GAP [ % ]
97.1¢/ $1
WAGE / INCOME GAP [ $ ]
$11,243
FAMILY INCOME DEFICIT
0.42
INEQUALITY / GINI INDEX
17,005
TOTAL POPULATION
9,578
MALE POPULATION
7,427
FEMALE POPULATION
128.96
MALES / 100 FEMALES
77.54
FEMALES / 100 MALES
37.4
MEDIAN AGE
3.2
AVG FAMILY SIZE
2.6
AVG HOUSEHOLD SIZE
7,385
LABOR FORCE [ PEOPLE ]
55.5%
PERCENT IN LABOR FORCE
7.4%
UNEMPLOYMENT RATE
Pendleton Zip Codes
Pendleton Area Codes
Income in Pendleton
Income Overview in Pendleton
Per Capita Income in Pendleton is $28,841, while median incomes of families and households are $83,052 and $67,931 respectively.
| Characteristic | Number | Measure |
| Per Capita Income | 17,005 | $28,841 |
| Median Family Income | 3,735 | $83,052 |
| Mean Family Income | 3,735 | $93,203 |
| Median Household Income | 5,950 | $67,931 |
| Mean Household Income | 5,950 | $78,363 |
| Income Deficit | 3,735 | $11,243 |
| Wage / Income Gap (%) | 17,005 | 2.93% |
| Wage / Income Gap ($) | 17,005 | 97.07¢ per $1 |
| Gini / Inequality Index | 17,005 | 0.42 |
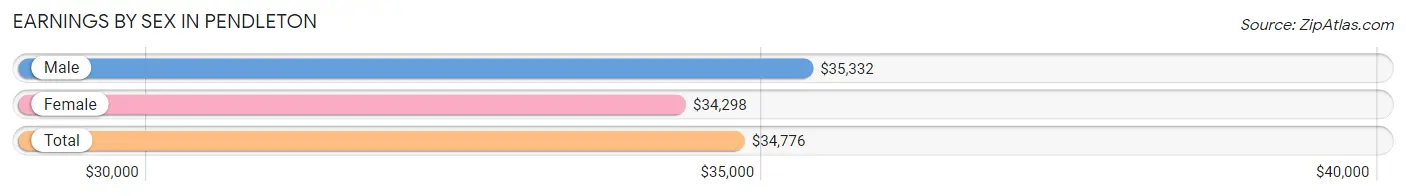
Earnings by Sex in Pendleton
Average Earnings in Pendleton are $34,776, $35,332 for men and $34,298 for women, a difference of 2.9%.
| Sex | Number | Average Earnings |
| Male | 4,527 (55.3%) | $35,332 |
| Female | 3,664 (44.7%) | $34,298 |
| Total | 8,191 (100.0%) | $34,776 |
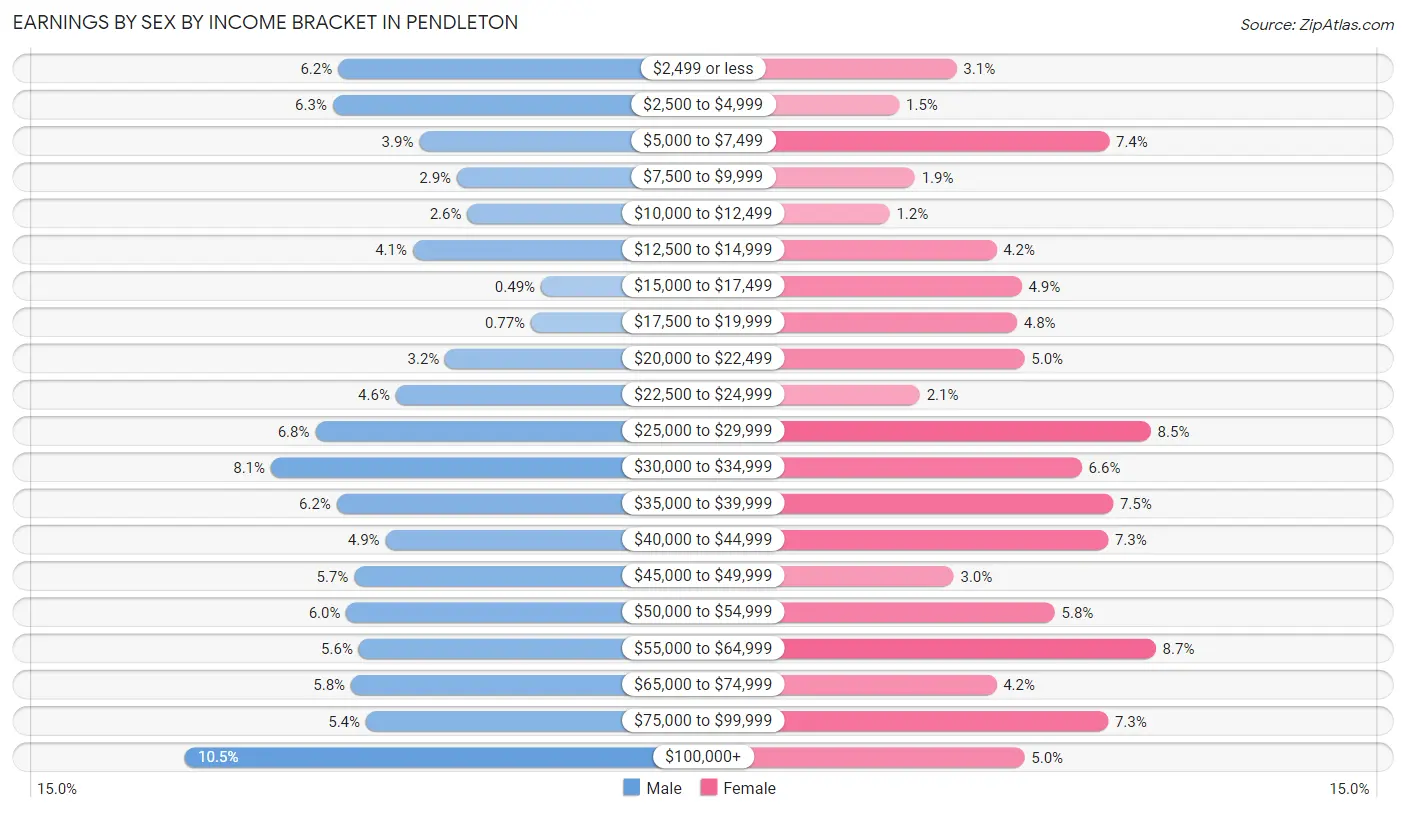
Earnings by Sex by Income Bracket in Pendleton
The most common earnings brackets in Pendleton are $100,000+ for men (475 | 10.5%) and $55,000 to $64,999 for women (318 | 8.7%).
| Income | Male | Female |
| $2,499 or less | 280 (6.2%) | 113 (3.1%) |
| $2,500 to $4,999 | 287 (6.3%) | 54 (1.5%) |
| $5,000 to $7,499 | 177 (3.9%) | 270 (7.4%) |
| $7,500 to $9,999 | 129 (2.9%) | 70 (1.9%) |
| $10,000 to $12,499 | 116 (2.6%) | 44 (1.2%) |
| $12,500 to $14,999 | 185 (4.1%) | 154 (4.2%) |
| $15,000 to $17,499 | 22 (0.5%) | 180 (4.9%) |
| $17,500 to $19,999 | 35 (0.8%) | 175 (4.8%) |
| $20,000 to $22,499 | 144 (3.2%) | 183 (5.0%) |
| $22,500 to $24,999 | 207 (4.6%) | 75 (2.1%) |
| $25,000 to $29,999 | 309 (6.8%) | 313 (8.5%) |
| $30,000 to $34,999 | 366 (8.1%) | 242 (6.6%) |
| $35,000 to $39,999 | 282 (6.2%) | 274 (7.5%) |
| $40,000 to $44,999 | 220 (4.9%) | 269 (7.3%) |
| $45,000 to $49,999 | 260 (5.7%) | 110 (3.0%) |
| $50,000 to $54,999 | 270 (6.0%) | 214 (5.8%) |
| $55,000 to $64,999 | 254 (5.6%) | 318 (8.7%) |
| $65,000 to $74,999 | 264 (5.8%) | 154 (4.2%) |
| $75,000 to $99,999 | 245 (5.4%) | 269 (7.3%) |
| $100,000+ | 475 (10.5%) | 183 (5.0%) |
| Total | 4,527 (100.0%) | 3,664 (100.0%) |
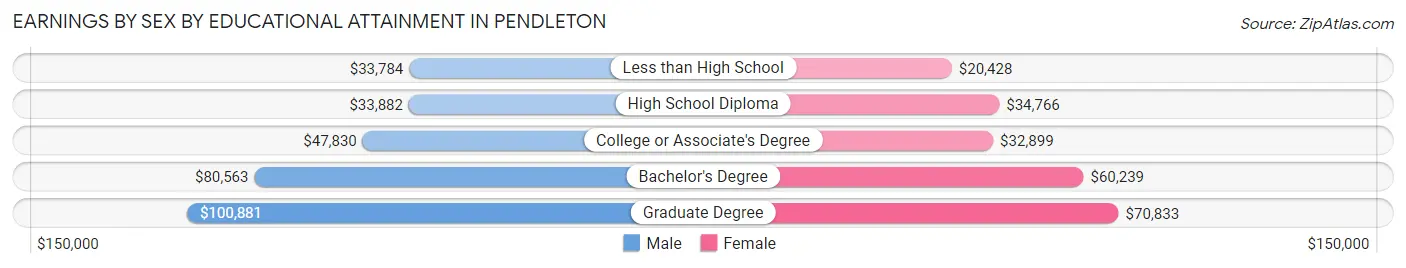
Earnings by Sex by Educational Attainment in Pendleton
Average earnings in Pendleton are $42,436 for men and $36,736 for women, a difference of 13.4%. Men with an educational attainment of graduate degree enjoy the highest average annual earnings of $100,881, while those with less than high school education earn the least with $33,784. Women with an educational attainment of graduate degree earn the most with the average annual earnings of $70,833, while those with less than high school education have the smallest earnings of $20,428.
| Educational Attainment | Male Income | Female Income |
| Less than High School | $33,784 | $20,428 |
| High School Diploma | $33,882 | $34,766 |
| College or Associate's Degree | $47,830 | $32,899 |
| Bachelor's Degree | $80,563 | $60,239 |
| Graduate Degree | $100,881 | $70,833 |
| Total | $42,436 | $36,736 |
Family Income in Pendleton
Family Income Brackets in Pendleton
According to the Pendleton family income data, there are 930 families falling into the $100,000 to $149,999 income range, which is the most common income bracket and makes up 24.9% of all families. Conversely, the $25,000 to $34,999 income bracket is the least frequent group with only 101 families (2.7%) belonging to this category.
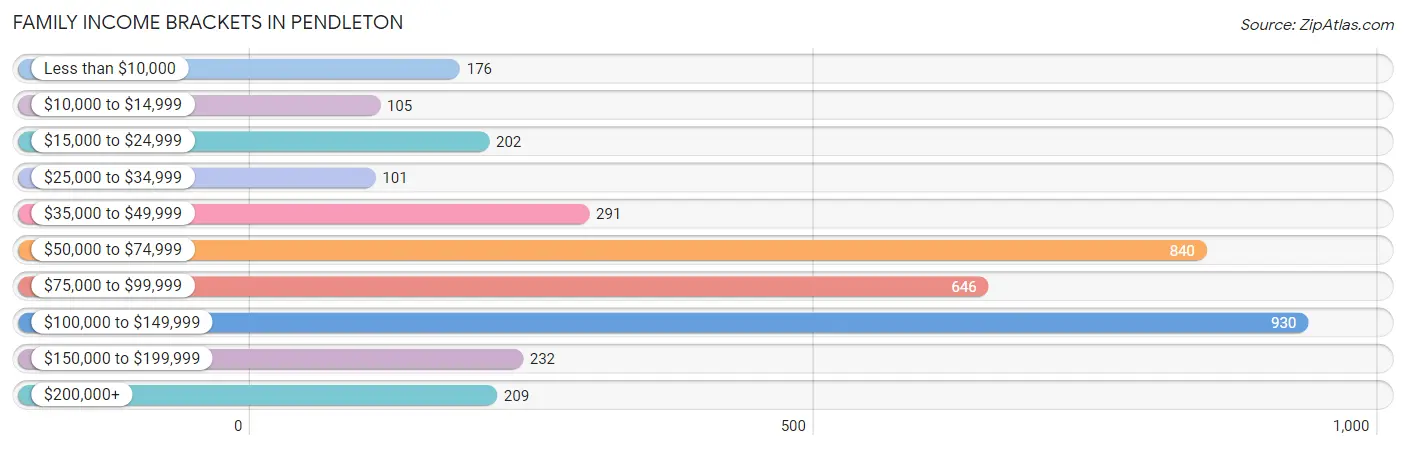
| Income Bracket | # Families | % Families |
| Less than $10,000 | 176 | 4.7% |
| $10,000 to $14,999 | 105 | 2.8% |
| $15,000 to $24,999 | 202 | 5.4% |
| $25,000 to $34,999 | 101 | 2.7% |
| $35,000 to $49,999 | 291 | 7.8% |
| $50,000 to $74,999 | 840 | 22.5% |
| $75,000 to $99,999 | 646 | 17.3% |
| $100,000 to $149,999 | 930 | 24.9% |
| $150,000 to $199,999 | 232 | 6.2% |
| $200,000+ | 209 | 5.6% |
Family Income by Famaliy Size in Pendleton
7+ person families (74 | 2.0%) account for the highest median family income in Pendleton with $119,318 per family, while 2-person families (1,683 | 45.1%) have the highest median income of $36,340 per family member.
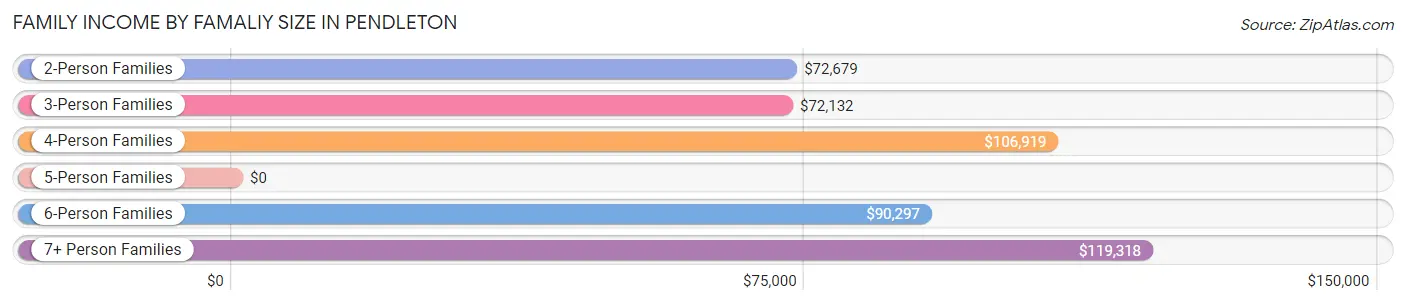
| Income Bracket | # Families | Median Income |
| 2-Person Families | 1,683 (45.1%) | $72,679 |
| 3-Person Families | 724 (19.4%) | $72,132 |
| 4-Person Families | 812 (21.7%) | $106,919 |
| 5-Person Families | 224 (6.0%) | $0 |
| 6-Person Families | 218 (5.8%) | $90,297 |
| 7+ Person Families | 74 (2.0%) | $119,318 |
| Total | 3,735 (100.0%) | $83,052 |
Family Income by Number of Earners in Pendleton
The median family income in Pendleton is $83,052, with families comprising 3+ earners (422) having the highest median family income of $117,344, while families with 1 earner (996) have the lowest median family income of $53,491, accounting for 11.3% and 26.7% of families, respectively.
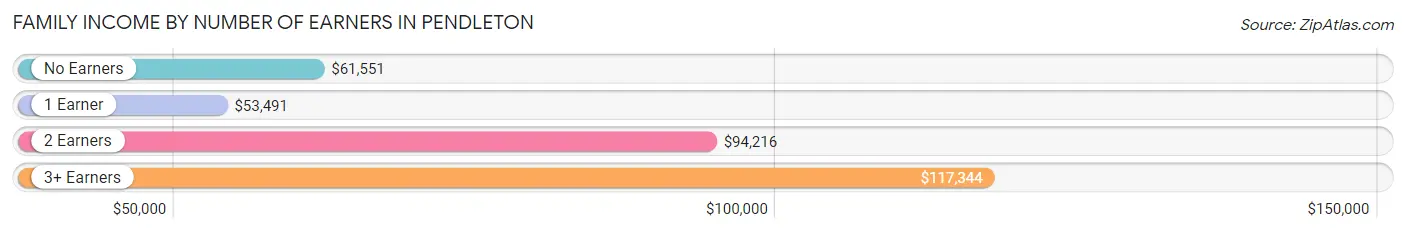
| Number of Earners | # Families | Median Income |
| No Earners | 713 (19.1%) | $61,551 |
| 1 Earner | 996 (26.7%) | $53,491 |
| 2 Earners | 1,604 (42.9%) | $94,216 |
| 3+ Earners | 422 (11.3%) | $117,344 |
| Total | 3,735 (100.0%) | $83,052 |
Household Income in Pendleton
Household Income Brackets in Pendleton
With 1,154 households falling in the category, the $100,000 to $149,999 income range is the most frequent in Pendleton, accounting for 19.4% of all households. In contrast, only 238 households (4.0%) fall into the $200,000+ income bracket, making it the least populous group.
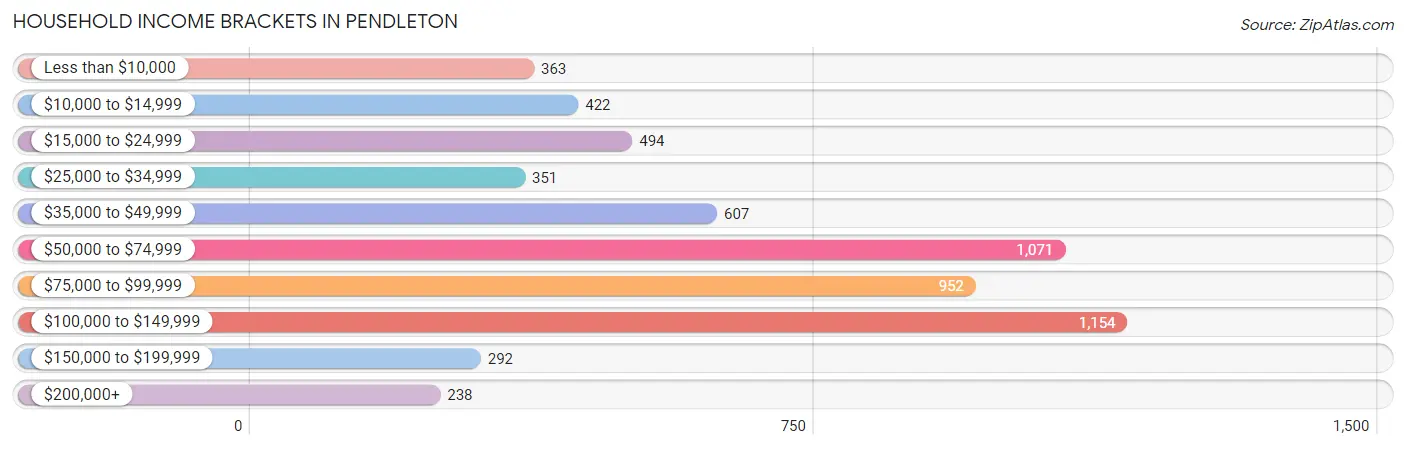
| Income Bracket | # Households | % Households |
| Less than $10,000 | 363 | 6.1% |
| $10,000 to $14,999 | 422 | 7.1% |
| $15,000 to $24,999 | 494 | 8.3% |
| $25,000 to $34,999 | 351 | 5.9% |
| $35,000 to $49,999 | 607 | 10.2% |
| $50,000 to $74,999 | 1,071 | 18.0% |
| $75,000 to $99,999 | 952 | 16.0% |
| $100,000 to $149,999 | 1,154 | 19.4% |
| $150,000 to $199,999 | 292 | 4.9% |
| $200,000+ | 238 | 4.0% |
Household Income by Householder Age in Pendleton
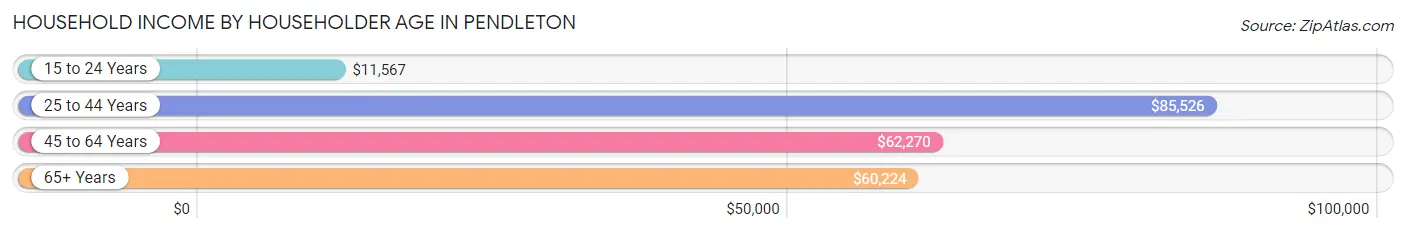
The median household income in Pendleton is $67,931, with the highest median household income of $85,526 found in the 25 to 44 years age bracket for the primary householder. A total of 2,246 households (37.8%) fall into this category. Meanwhile, the 15 to 24 years age bracket for the primary householder has the lowest median household income of $11,567, with 266 households (4.5%) in this group.
| Income Bracket | # Households | Median Income |
| 15 to 24 Years | 266 (4.5%) | $11,567 |
| 25 to 44 Years | 2,246 (37.8%) | $85,526 |
| 45 to 64 Years | 1,750 (29.4%) | $62,270 |
| 65+ Years | 1,688 (28.4%) | $60,224 |
| Total | 5,950 (100.0%) | $67,931 |
Poverty in Pendleton
Income Below Poverty by Sex and Age in Pendleton
With 15.5% poverty level for males and 15.5% for females among the residents of Pendleton, 18 to 24 year old males and 12 to 14 year old females are the most vulnerable to poverty, with 334 males (42.1%) and 120 females (42.1%) in their respective age groups living below the poverty level.
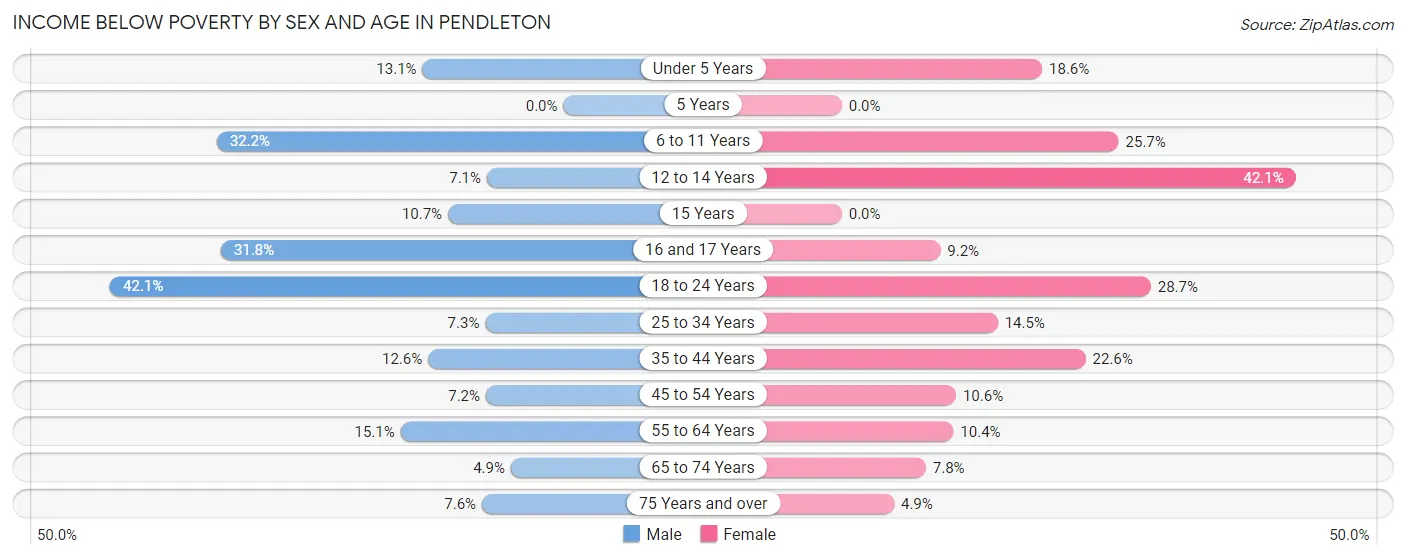
| Age Bracket | Male | Female |
| Under 5 Years | 82 (13.1%) | 116 (18.6%) |
| 5 Years | 0 (0.0%) | 0 (0.0%) |
| 6 to 11 Years | 221 (32.2%) | 121 (25.7%) |
| 12 to 14 Years | 25 (7.1%) | 120 (42.1%) |
| 15 Years | 24 (10.7%) | 0 (0.0%) |
| 16 and 17 Years | 82 (31.8%) | 13 (9.1%) |
| 18 to 24 Years | 334 (42.1%) | 117 (28.7%) |
| 25 to 34 Years | 77 (7.2%) | 138 (14.5%) |
| 35 to 44 Years | 131 (12.6%) | 239 (22.6%) |
| 45 to 54 Years | 48 (7.2%) | 81 (10.6%) |
| 55 to 64 Years | 146 (15.1%) | 92 (10.4%) |
| 65 to 74 Years | 32 (4.9%) | 80 (7.8%) |
| 75 Years and over | 31 (7.6%) | 30 (4.9%) |
| Total | 1,233 (15.5%) | 1,147 (15.5%) |
Income Above Poverty by Sex and Age in Pendleton
According to the poverty statistics in Pendleton, males aged 5 years and females aged 5 years are the age groups that are most secure financially, with 100.0% of males and 100.0% of females in these age groups living above the poverty line.
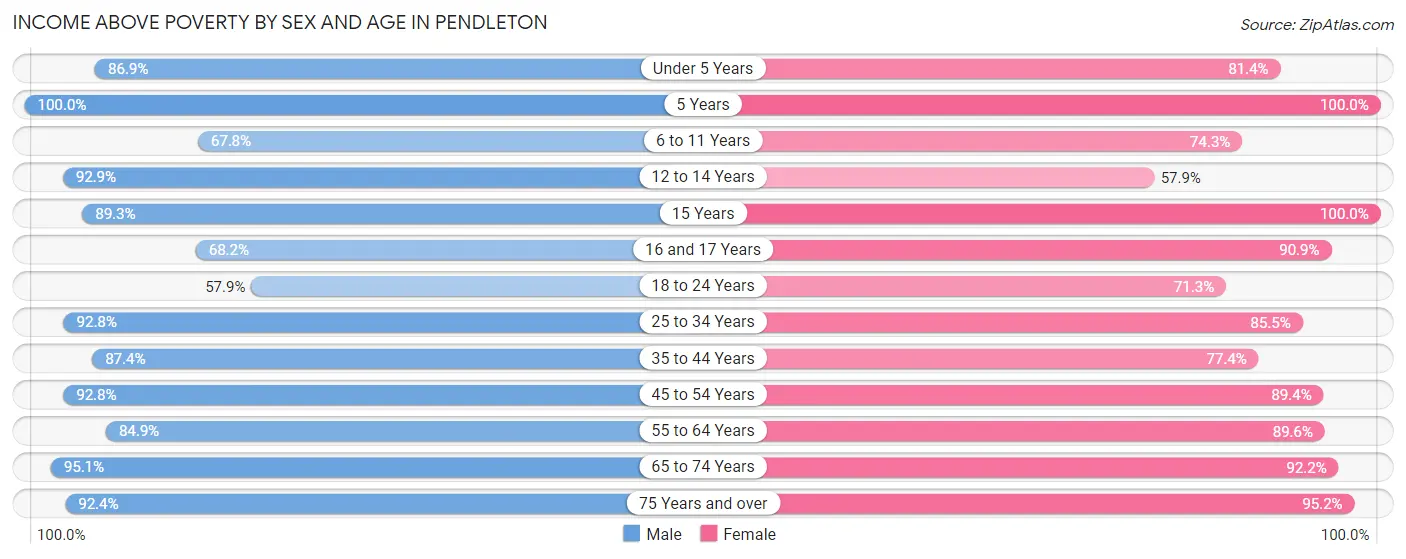
| Age Bracket | Male | Female |
| Under 5 Years | 545 (86.9%) | 508 (81.4%) |
| 5 Years | 224 (100.0%) | 108 (100.0%) |
| 6 to 11 Years | 466 (67.8%) | 350 (74.3%) |
| 12 to 14 Years | 327 (92.9%) | 165 (57.9%) |
| 15 Years | 200 (89.3%) | 32 (100.0%) |
| 16 and 17 Years | 176 (68.2%) | 129 (90.8%) |
| 18 to 24 Years | 460 (57.9%) | 291 (71.3%) |
| 25 to 34 Years | 985 (92.7%) | 816 (85.5%) |
| 35 to 44 Years | 912 (87.4%) | 817 (77.4%) |
| 45 to 54 Years | 620 (92.8%) | 683 (89.4%) |
| 55 to 64 Years | 820 (84.9%) | 796 (89.6%) |
| 65 to 74 Years | 624 (95.1%) | 945 (92.2%) |
| 75 Years and over | 379 (92.4%) | 588 (95.2%) |
| Total | 6,738 (84.5%) | 6,228 (84.5%) |
Income Below Poverty Among Married-Couple Families in Pendleton
The poverty statistics for married-couple families in Pendleton show that 4.2% or 107 of the total 2,560 families live below the poverty line. Families with 3 or 4 children have the highest poverty rate of 22.7%, comprising of 63 families. On the other hand, families with 5 or more children have the lowest poverty rate of 0.0%, which includes 0 families.
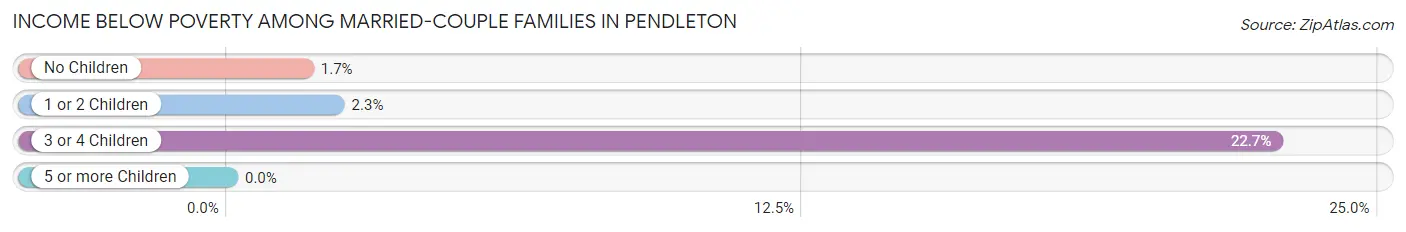
| Children | Above Poverty | Below Poverty |
| No Children | 1,248 (98.4%) | 21 (1.7%) |
| 1 or 2 Children | 970 (97.7%) | 23 (2.3%) |
| 3 or 4 Children | 214 (77.3%) | 63 (22.7%) |
| 5 or more Children | 21 (100.0%) | 0 (0.0%) |
| Total | 2,453 (95.8%) | 107 (4.2%) |
Income Below Poverty Among Single-Parent Households in Pendleton
According to the poverty data in Pendleton, 6.6% or 23 single-father households and 37.4% or 309 single-mother households are living below the poverty line. Among single-father households, those with 3 or 4 children have the highest poverty rate, with 6 households (100.0%) experiencing poverty. Likewise, among single-mother households, those with 3 or 4 children have the highest poverty rate, with 99 households (89.2%) falling below the poverty line.
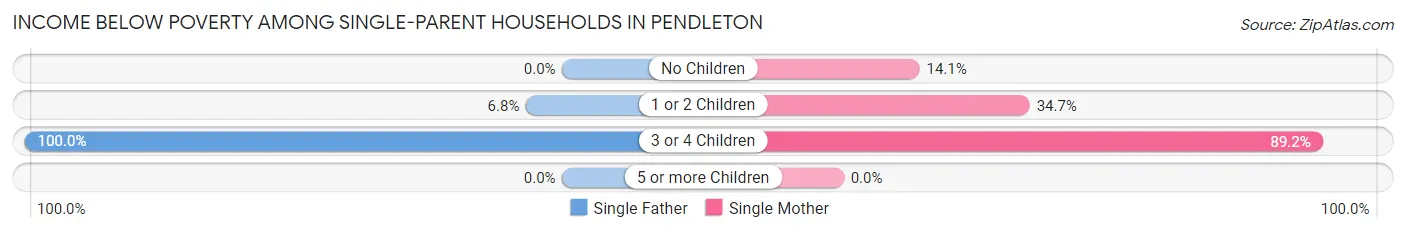
| Children | Single Father | Single Mother |
| No Children | 0 (0.0%) | 26 (14.1%) |
| 1 or 2 Children | 17 (6.8%) | 184 (34.6%) |
| 3 or 4 Children | 6 (100.0%) | 99 (89.2%) |
| 5 or more Children | 0 (0.0%) | 0 (0.0%) |
| Total | 23 (6.6%) | 309 (37.4%) |
Income Below Poverty Among Married-Couple vs Single-Parent Households in Pendleton
The poverty data for Pendleton shows that 107 of the married-couple family households (4.2%) and 332 of the single-parent households (28.3%) are living below the poverty level. Within the married-couple family households, those with 3 or 4 children have the highest poverty rate, with 63 households (22.7%) falling below the poverty line. Among the single-parent households, those with 3 or 4 children have the highest poverty rate, with 105 household (89.7%) living below poverty.
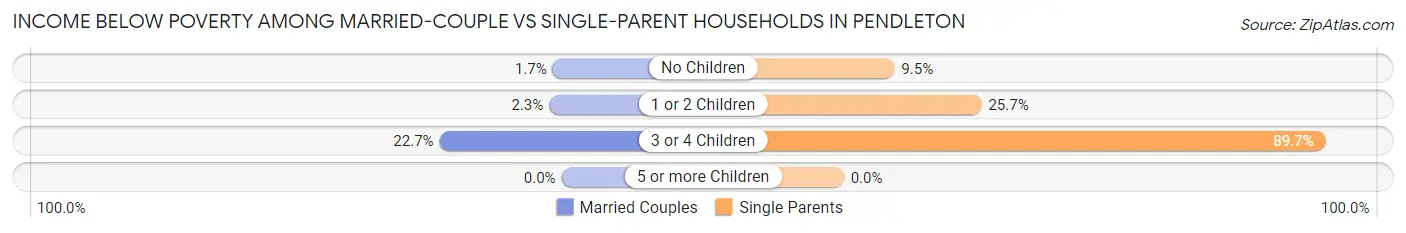
| Children | Married-Couple Families | Single-Parent Households |
| No Children | 21 (1.7%) | 26 (9.5%) |
| 1 or 2 Children | 23 (2.3%) | 201 (25.7%) |
| 3 or 4 Children | 63 (22.7%) | 105 (89.7%) |
| 5 or more Children | 0 (0.0%) | 0 (0.0%) |
| Total | 107 (4.2%) | 332 (28.3%) |
Race in Pendleton
The most populous races in Pendleton are White / Caucasian (14,239 | 83.7%), Hispanic or Latino (2,031 | 11.9%), and Two or more Races (1,377 | 8.1%).
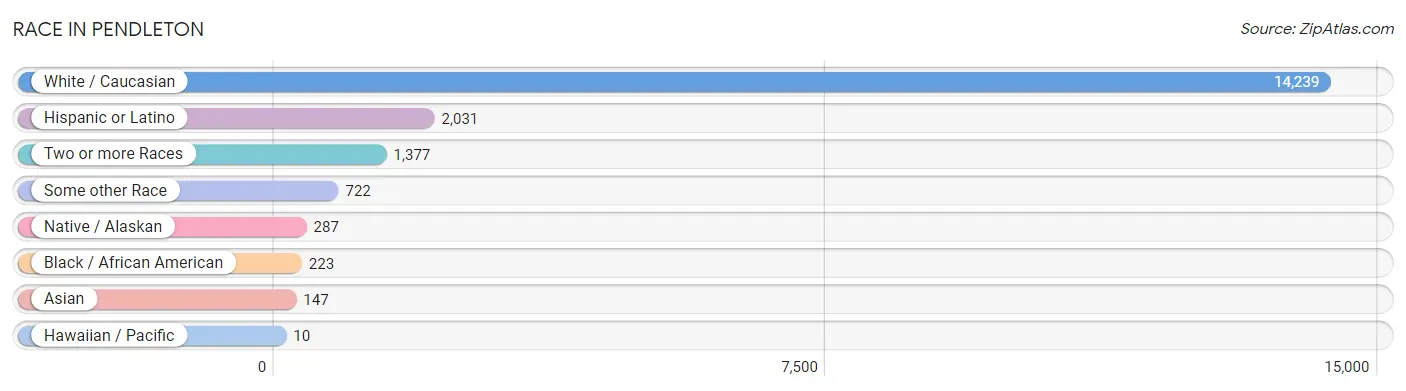
| Race | # Population | % Population |
| Asian | 147 | 0.9% |
| Black / African American | 223 | 1.3% |
| Hawaiian / Pacific | 10 | 0.1% |
| Hispanic or Latino | 2,031 | 11.9% |
| Native / Alaskan | 287 | 1.7% |
| White / Caucasian | 14,239 | 83.7% |
| Two or more Races | 1,377 | 8.1% |
| Some other Race | 722 | 4.3% |
| Total | 17,005 | 100.0% |
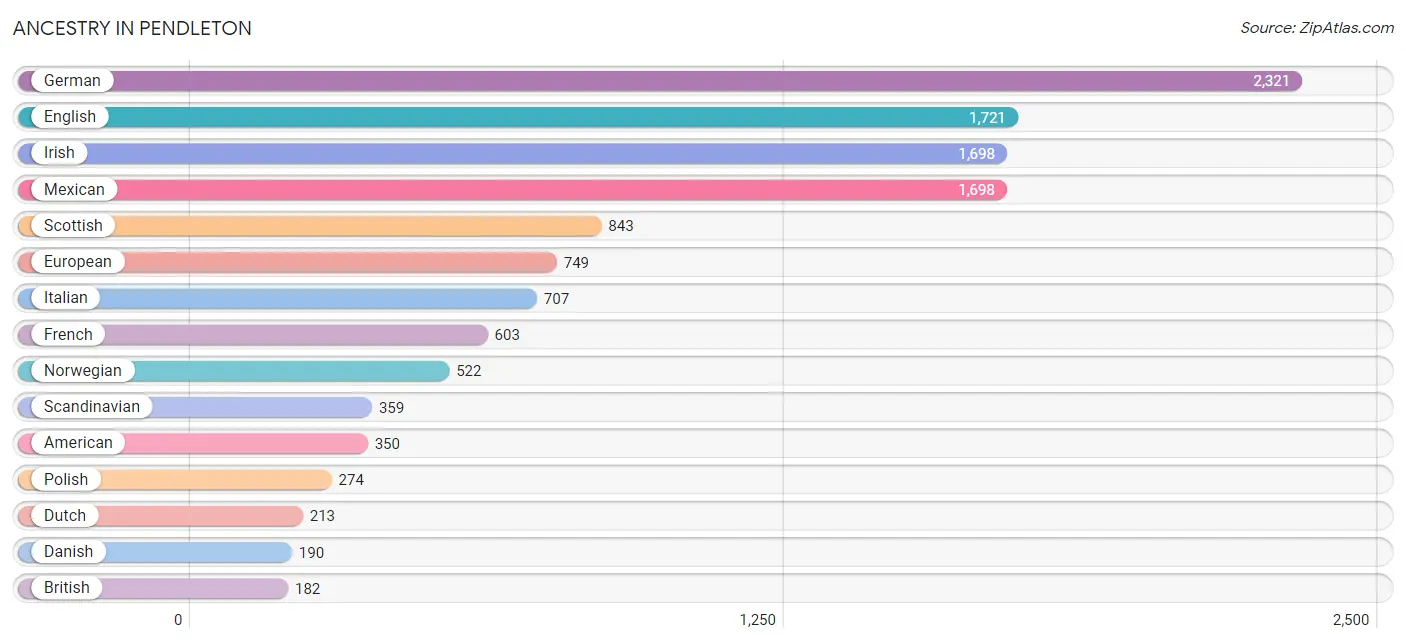
Ancestry in Pendleton
The most populous ancestries reported in Pendleton are German (2,321 | 13.7%), English (1,721 | 10.1%), Irish (1,698 | 10.0%), Mexican (1,698 | 10.0%), and Scottish (843 | 5.0%), together accounting for 48.7% of all Pendleton residents.
| Ancestry | # Population | % Population |
| American | 350 | 2.1% |
| Arab | 7 | 0.0% |
| Arapaho | 5 | 0.0% |
| Armenian | 8 | 0.1% |
| Australian | 8 | 0.1% |
| Austrian | 26 | 0.2% |
| Basque | 47 | 0.3% |
| Bhutanese | 149 | 0.9% |
| Blackfeet | 9 | 0.1% |
| British | 182 | 1.1% |
| Burmese | 3 | 0.0% |
| Canadian | 64 | 0.4% |
| Central American | 30 | 0.2% |
| Central American Indian | 14 | 0.1% |
| Cherokee | 93 | 0.5% |
| Chippewa | 13 | 0.1% |
| Choctaw | 16 | 0.1% |
| Colville | 17 | 0.1% |
| Cuban | 15 | 0.1% |
| Czech | 13 | 0.1% |
| Czechoslovakian | 20 | 0.1% |
| Danish | 190 | 1.1% |
| Dominican | 24 | 0.1% |
| Dutch | 213 | 1.3% |
| Eastern European | 54 | 0.3% |
| Ecuadorian | 42 | 0.3% |
| English | 1,721 | 10.1% |
| European | 749 | 4.4% |
| Finnish | 82 | 0.5% |
| French | 603 | 3.5% |
| French American Indian | 1 | 0.0% |
| French Canadian | 158 | 0.9% |
| German | 2,321 | 13.7% |
| Greek | 11 | 0.1% |
| Guamanian / Chamorro | 5 | 0.0% |
| Honduran | 14 | 0.1% |
| Indian (Asian) | 60 | 0.4% |
| Irish | 1,698 | 10.0% |
| Iroquois | 8 | 0.1% |
| Italian | 707 | 4.2% |
| Korean | 71 | 0.4% |
| Lebanese | 7 | 0.0% |
| Liberian | 14 | 0.1% |
| Lumbee | 11 | 0.1% |
| Luxembourger | 11 | 0.1% |
| Mexican | 1,698 | 10.0% |
| Northern European | 61 | 0.4% |
| Norwegian | 522 | 3.1% |
| Pennsylvania German | 37 | 0.2% |
| Polish | 274 | 1.6% |
| Portuguese | 25 | 0.2% |
| Potawatomi | 5 | 0.0% |
| Russian | 22 | 0.1% |
| Salvadoran | 16 | 0.1% |
| Scandinavian | 359 | 2.1% |
| Scotch-Irish | 134 | 0.8% |
| Scottish | 843 | 5.0% |
| Sioux | 1 | 0.0% |
| Slavic | 7 | 0.0% |
| South American | 42 | 0.3% |
| Spaniard | 50 | 0.3% |
| Spanish | 37 | 0.2% |
| Sri Lankan | 62 | 0.4% |
| Subsaharan African | 14 | 0.1% |
| Swedish | 132 | 0.8% |
| Swiss | 52 | 0.3% |
| Welsh | 51 | 0.3% |
| Yakama | 37 | 0.2% | View All 68 Rows |
Immigrants in Pendleton
The most numerous immigrant groups reported in Pendleton came from Latin America (449 | 2.6%), Central America (417 | 2.5%), Mexico (401 | 2.4%), Asia (46 | 0.3%), and South Eastern Asia (43 | 0.3%), together accounting for 8.0% of all Pendleton residents.
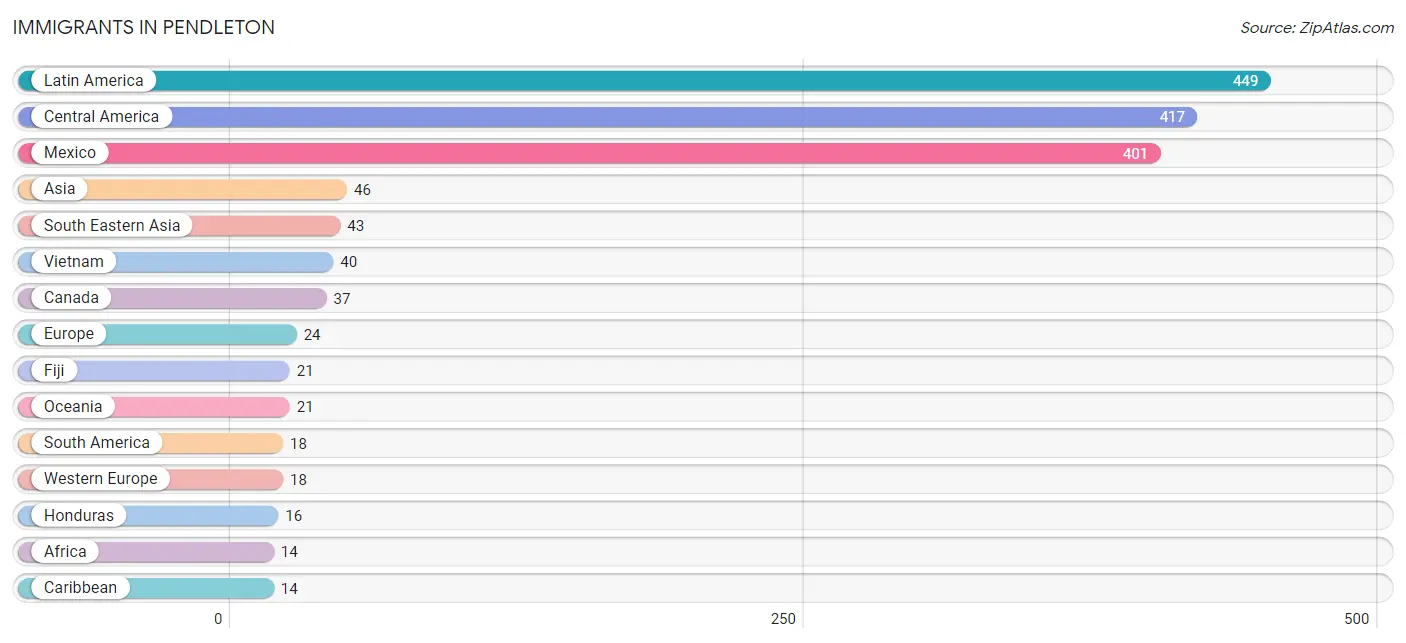
| Immigration Origin | # Population | % Population |
| Africa | 14 | 0.1% |
| Asia | 46 | 0.3% |
| Canada | 37 | 0.2% |
| Caribbean | 14 | 0.1% |
| Central America | 417 | 2.5% |
| Dominican Republic | 14 | 0.1% |
| Eastern Asia | 3 | 0.0% |
| Ecuador | 11 | 0.1% |
| Europe | 24 | 0.1% |
| Fiji | 21 | 0.1% |
| Germany | 11 | 0.1% |
| Greece | 6 | 0.0% |
| Honduras | 16 | 0.1% |
| Korea | 3 | 0.0% |
| Latin America | 449 | 2.6% |
| Liberia | 14 | 0.1% |
| Mexico | 401 | 2.4% |
| Netherlands | 7 | 0.0% |
| Oceania | 21 | 0.1% |
| Peru | 7 | 0.0% |
| Philippines | 3 | 0.0% |
| South America | 18 | 0.1% |
| South Eastern Asia | 43 | 0.3% |
| Southern Europe | 6 | 0.0% |
| Vietnam | 40 | 0.2% |
| Western Africa | 14 | 0.1% |
| Western Europe | 18 | 0.1% | View All 27 Rows |
Sex and Age in Pendleton
Sex and Age in Pendleton
The most populous age groups in Pendleton are 25 to 29 Years (869 | 9.1%) for men and Under 5 Years (626 | 8.4%) for women.
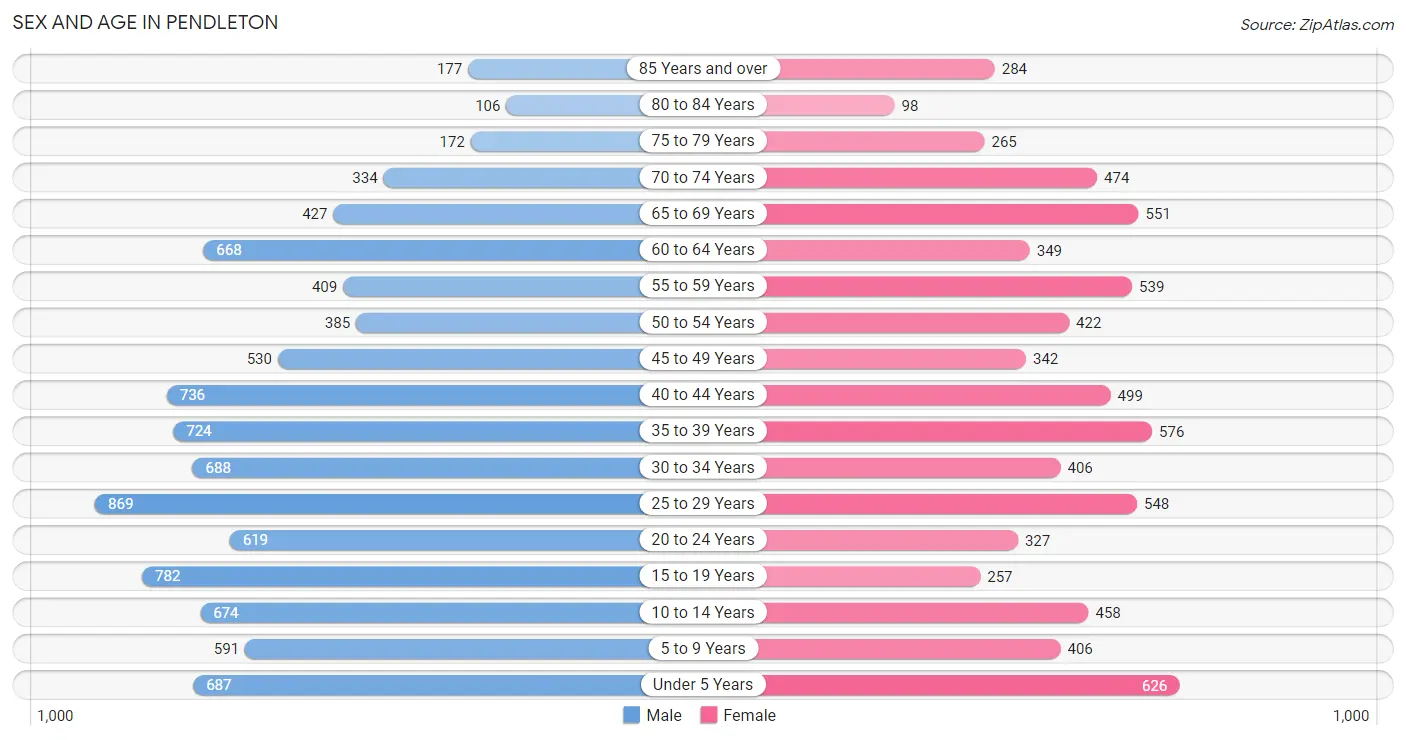
| Age Bracket | Male | Female |
| Under 5 Years | 687 (7.2%) | 626 (8.4%) |
| 5 to 9 Years | 591 (6.2%) | 406 (5.5%) |
| 10 to 14 Years | 674 (7.0%) | 458 (6.2%) |
| 15 to 19 Years | 782 (8.2%) | 257 (3.5%) |
| 20 to 24 Years | 619 (6.5%) | 327 (4.4%) |
| 25 to 29 Years | 869 (9.1%) | 548 (7.4%) |
| 30 to 34 Years | 688 (7.2%) | 406 (5.5%) |
| 35 to 39 Years | 724 (7.6%) | 576 (7.8%) |
| 40 to 44 Years | 736 (7.7%) | 499 (6.7%) |
| 45 to 49 Years | 530 (5.5%) | 342 (4.6%) |
| 50 to 54 Years | 385 (4.0%) | 422 (5.7%) |
| 55 to 59 Years | 409 (4.3%) | 539 (7.3%) |
| 60 to 64 Years | 668 (7.0%) | 349 (4.7%) |
| 65 to 69 Years | 427 (4.5%) | 551 (7.4%) |
| 70 to 74 Years | 334 (3.5%) | 474 (6.4%) |
| 75 to 79 Years | 172 (1.8%) | 265 (3.6%) |
| 80 to 84 Years | 106 (1.1%) | 98 (1.3%) |
| 85 Years and over | 177 (1.8%) | 284 (3.8%) |
| Total | 9,578 (100.0%) | 7,427 (100.0%) |
Families and Households in Pendleton
Median Family Size in Pendleton
The median family size in Pendleton is 3.22 persons per family, with married-couple families (2,560 | 68.5%) accounting for the largest median family size of 3.39 persons per family. On the other hand, single male/father families (349 | 9.3%) represent the smallest median family size with 2.47 persons per family.
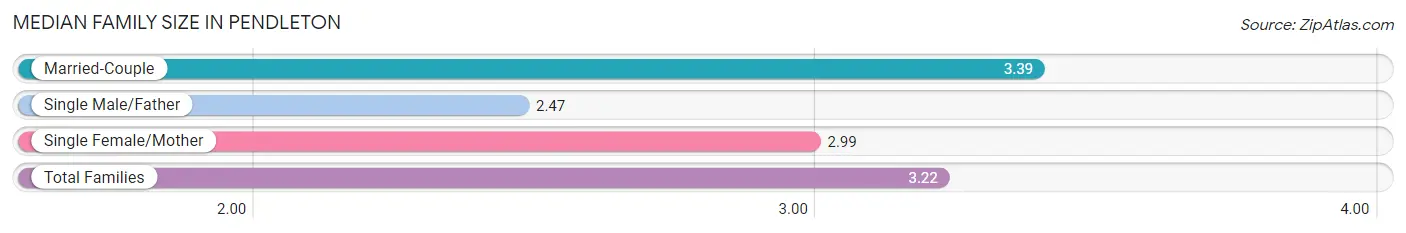
| Family Type | # Families | Family Size |
| Married-Couple | 2,560 (68.5%) | 3.39 |
| Single Male/Father | 349 (9.3%) | 2.47 |
| Single Female/Mother | 826 (22.1%) | 2.99 |
| Total Families | 3,735 (100.0%) | 3.22 |
Median Household Size in Pendleton
The median household size in Pendleton is 2.56 persons per household, with married-couple households (2,560 | 43.0%) accounting for the largest median household size of 3.43 persons per household. non-family households (2,215 | 37.2%) represent the smallest median household size with 1.28 persons per household.
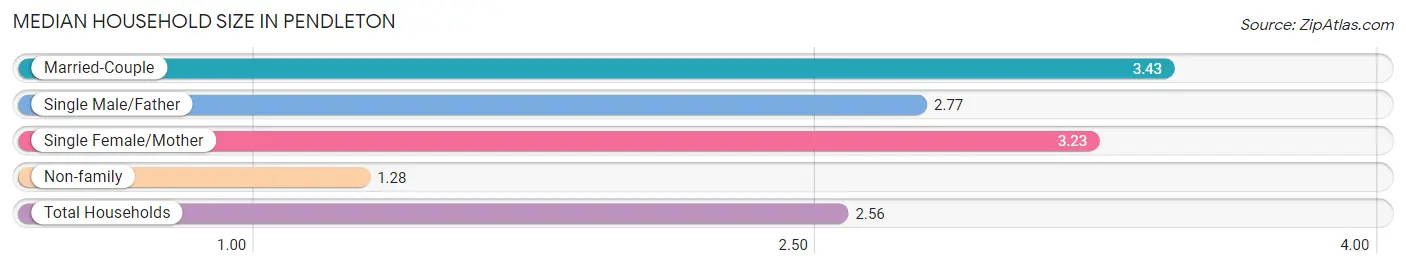
| Household Type | # Households | Household Size |
| Married-Couple | 2,560 (43.0%) | 3.43 |
| Single Male/Father | 349 (5.9%) | 2.77 |
| Single Female/Mother | 826 (13.9%) | 3.23 |
| Non-family | 2,215 (37.2%) | 1.28 |
| Total Households | 5,950 (100.0%) | 2.56 |
Household Size by Marriage Status in Pendleton
Out of a total of 5,950 households in Pendleton, 3,735 (62.8%) are family households, while 2,215 (37.2%) are nonfamily households. The most numerous type of family households are 2-person households, comprising 1,534, and the most common type of nonfamily households are 1-person households, comprising 1,688.
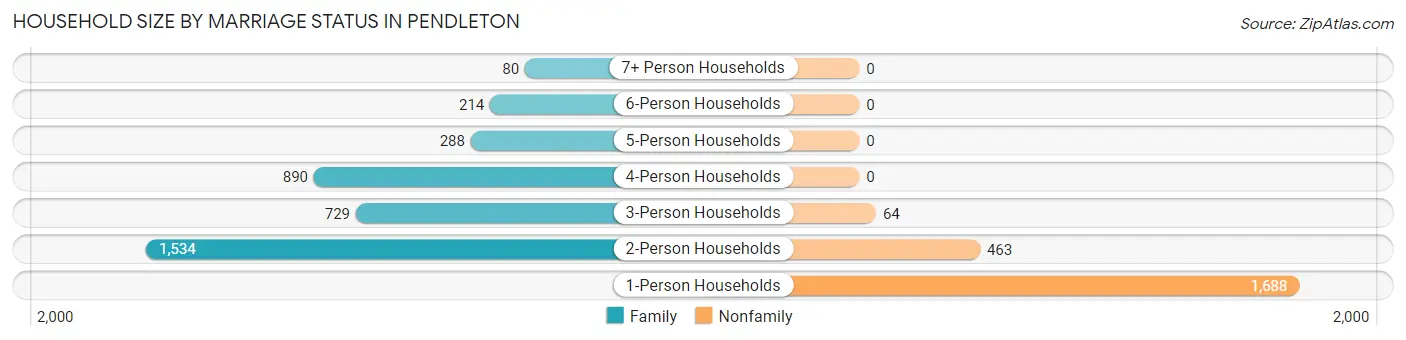
| Household Size | Family Households | Nonfamily Households |
| 1-Person Households | - | 1,688 (28.4%) |
| 2-Person Households | 1,534 (25.8%) | 463 (7.8%) |
| 3-Person Households | 729 (12.2%) | 64 (1.1%) |
| 4-Person Households | 890 (15.0%) | 0 (0.0%) |
| 5-Person Households | 288 (4.8%) | 0 (0.0%) |
| 6-Person Households | 214 (3.6%) | 0 (0.0%) |
| 7+ Person Households | 80 (1.3%) | 0 (0.0%) |
| Total | 3,735 (62.8%) | 2,215 (37.2%) |
Female Fertility in Pendleton
Fertility by Age in Pendleton
Average fertility rate in Pendleton is 96.0 births per 1,000 women. Women in the age bracket of 20 to 34 years have the highest fertility rate with 158.0 births per 1,000 women. Women in the age bracket of 20 to 34 years acount for 71.0% of all women with births.
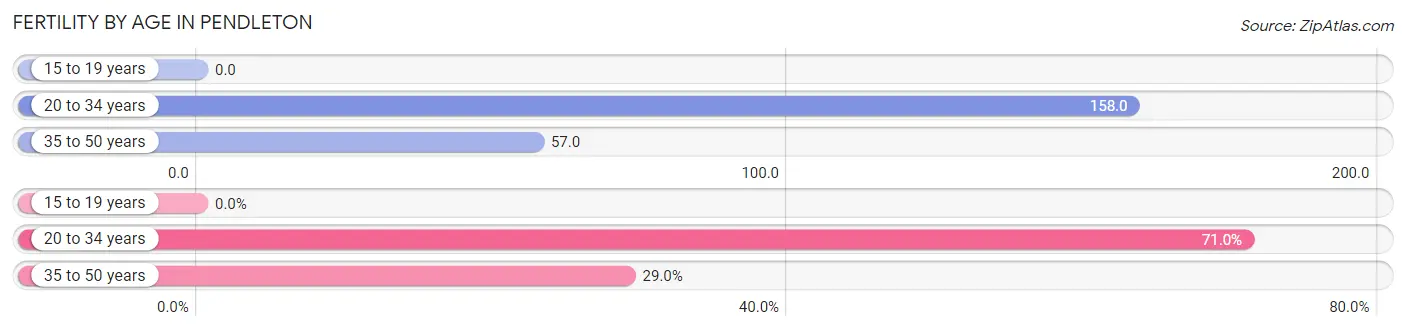
| Age Bracket | Women with Births | Births / 1,000 Women |
| 15 to 19 years | 0 (0.0%) | 0.0 |
| 20 to 34 years | 203 (71.0%) | 158.0 |
| 35 to 50 years | 83 (29.0%) | 57.0 |
| Total | 286 (100.0%) | 96.0 |
Fertility by Age by Marriage Status in Pendleton
68.9% of women with births (286) in Pendleton are married. The highest percentage of unmarried women with births falls into 35 to 50 years age bracket with 51.8% of them unmarried at the time of birth, while the lowest percentage of unmarried women with births belong to 20 to 34 years age bracket with 22.7% of them unmarried.
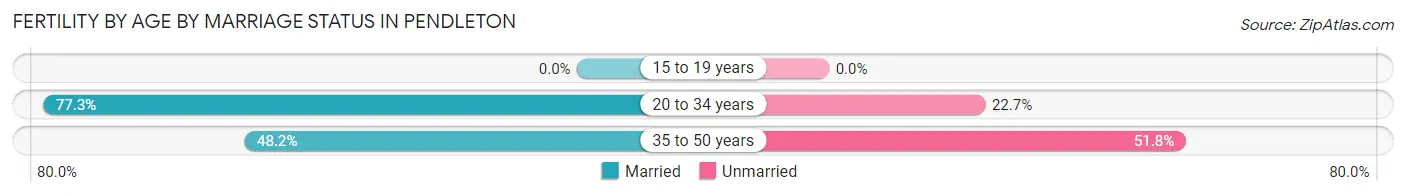
| Age Bracket | Married | Unmarried |
| 15 to 19 years | 0 (0.0%) | 0 (0.0%) |
| 20 to 34 years | 157 (77.3%) | 46 (22.7%) |
| 35 to 50 years | 40 (48.2%) | 43 (51.8%) |
| Total | 197 (68.9%) | 89 (31.1%) |
Fertility by Education in Pendleton
Average fertility rate in Pendleton is 96.0 births per 1,000 women. Women with the education attainment of bachelor's degree have the highest fertility rate of 176.0 births per 1,000 women, while women with the education attainment of high school diploma have the lowest fertility at 56.0 births per 1,000 women. Women with the education attainment of bachelor's degree represent 36.7% of all women with births.
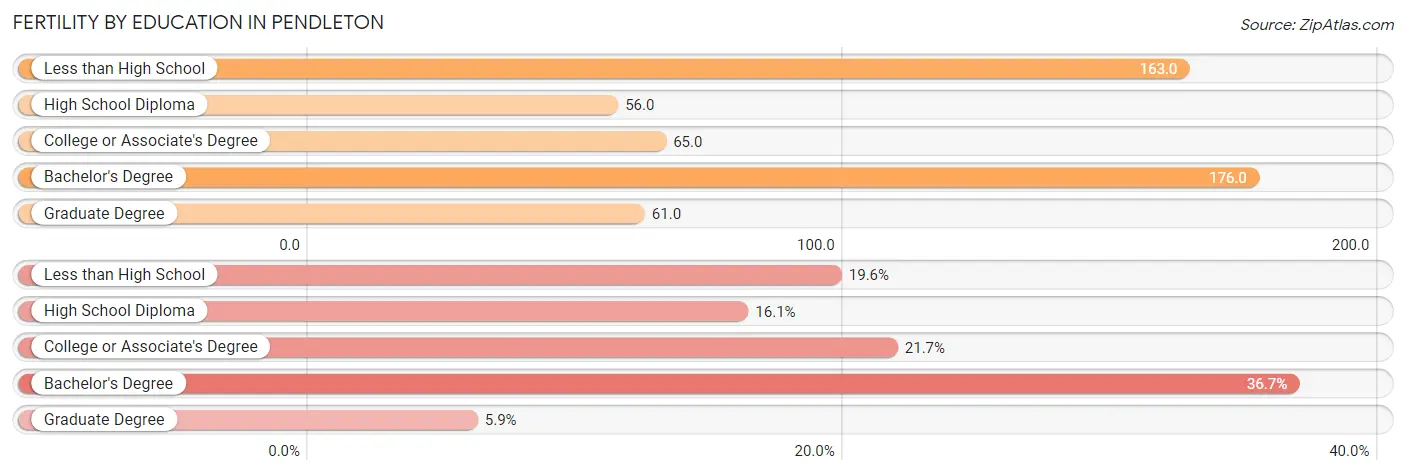
| Educational Attainment | Women with Births | Births / 1,000 Women |
| Less than High School | 56 (19.6%) | 163.0 |
| High School Diploma | 46 (16.1%) | 56.0 |
| College or Associate's Degree | 62 (21.7%) | 65.0 |
| Bachelor's Degree | 105 (36.7%) | 176.0 |
| Graduate Degree | 17 (5.9%) | 61.0 |
| Total | 286 (100.0%) | 96.0 |
Fertility by Education by Marriage Status in Pendleton
31.1% of women with births in Pendleton are unmarried. Women with the educational attainment of less than high school are most likely to be married with 100.0% of them married at childbirth, while women with the educational attainment of high school diploma are least likely to be married with 100.0% of them unmarried at childbirth.
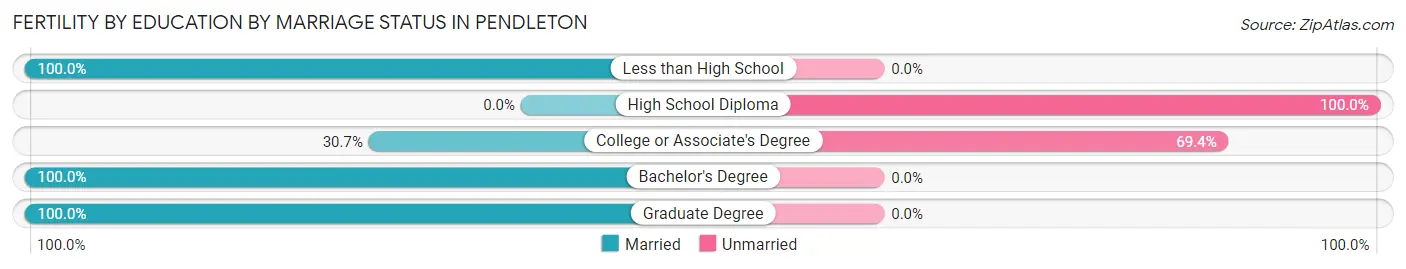
| Educational Attainment | Married | Unmarried |
| Less than High School | 56 (100.0%) | 0 (0.0%) |
| High School Diploma | 0 (0.0%) | 46 (100.0%) |
| College or Associate's Degree | 19 (30.6%) | 43 (69.4%) |
| Bachelor's Degree | 105 (100.0%) | 0 (0.0%) |
| Graduate Degree | 17 (100.0%) | 0 (0.0%) |
| Total | 197 (68.9%) | 89 (31.1%) |
Employment Characteristics in Pendleton
Employment by Class of Employer in Pendleton
Among the 6,758 employed individuals in Pendleton, private company employees (3,958 | 58.6%), not-for-profit organizations (716 | 10.6%), and local government employees (684 | 10.1%) make up the most common classes of employment.
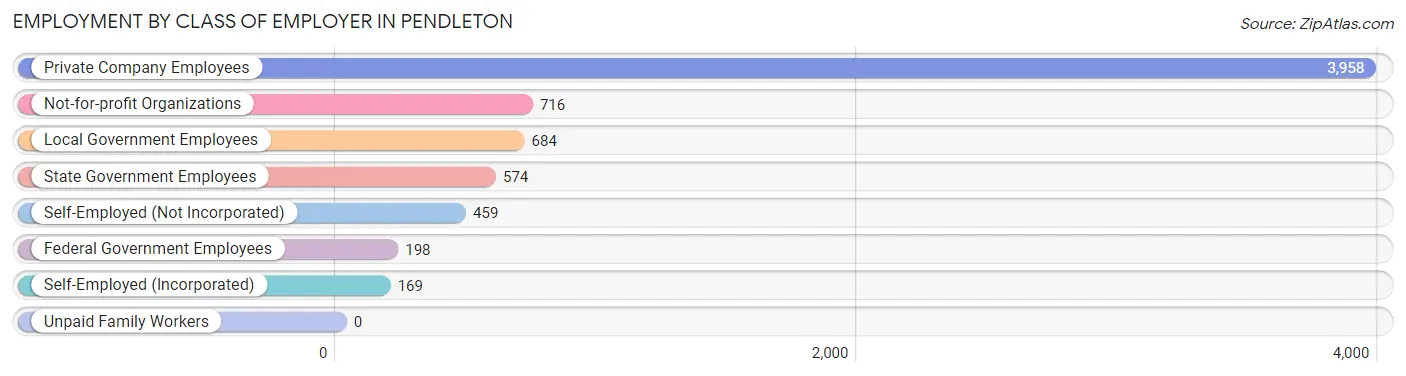
| Employer Class | # Employees | % Employees |
| Private Company Employees | 3,958 | 58.6% |
| Self-Employed (Incorporated) | 169 | 2.5% |
| Self-Employed (Not Incorporated) | 459 | 6.8% |
| Not-for-profit Organizations | 716 | 10.6% |
| Local Government Employees | 684 | 10.1% |
| State Government Employees | 574 | 8.5% |
| Federal Government Employees | 198 | 2.9% |
| Unpaid Family Workers | 0 | 0.0% |
| Total | 6,758 | 100.0% |
Employment Status by Age in Pendleton
According to the labor force statistics for Pendleton, out of the total population over 16 years of age (13,307), 55.5% or 7,385 individuals are in the labor force, with 7.4% or 546 of them unemployed. The age group with the highest labor force participation rate is 45 to 54 years, with 73.6% or 1,236 individuals in the labor force. Within the labor force, the 16 to 19 years age range has the highest percentage of unemployed individuals, with 29.8% or 105 of them being unemployed.
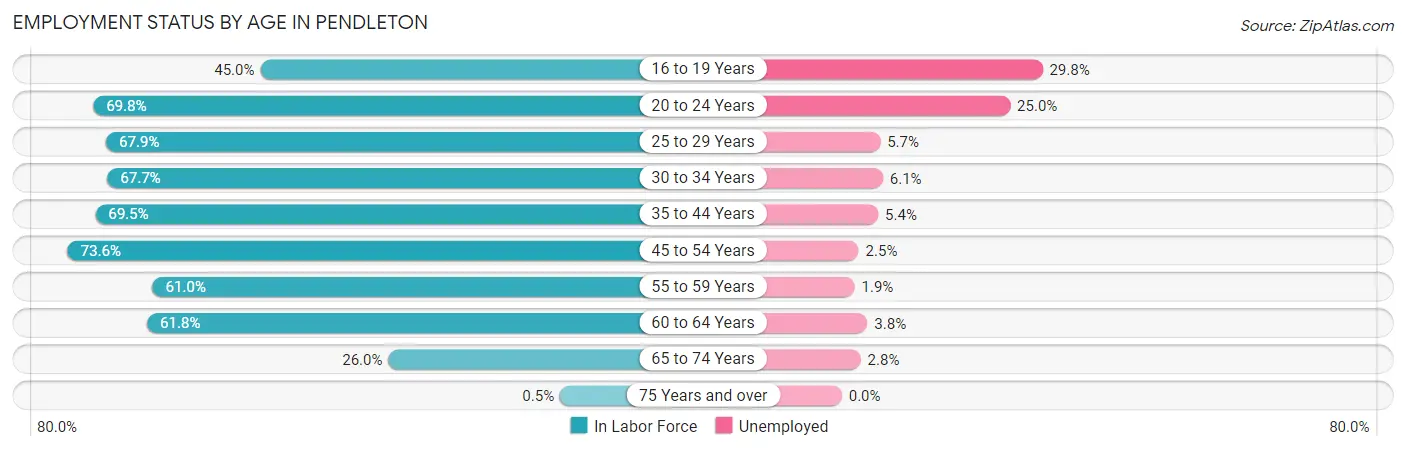
| Age Bracket | In Labor Force | Unemployed |
| 16 to 19 Years | 352 (45.0%) | 105 (29.8%) |
| 20 to 24 Years | 660 (69.8%) | 165 (25.0%) |
| 25 to 29 Years | 962 (67.9%) | 55 (5.7%) |
| 30 to 34 Years | 741 (67.7%) | 45 (6.1%) |
| 35 to 44 Years | 1,762 (69.5%) | 95 (5.4%) |
| 45 to 54 Years | 1,236 (73.6%) | 31 (2.5%) |
| 55 to 59 Years | 578 (61.0%) | 11 (1.9%) |
| 60 to 64 Years | 629 (61.8%) | 24 (3.8%) |
| 65 to 74 Years | 464 (26.0%) | 13 (2.8%) |
| 75 Years and over | 6 (0.5%) | 0 (0.0%) |
| Total | 7,385 (55.5%) | 546 (7.4%) |
Employment Status by Educational Attainment in Pendleton
According to labor force statistics for Pendleton, 68.0% of individuals (5,909) out of the total population between 25 and 64 years of age (8,690) are in the labor force, with 4.4% or 260 of them being unemployed. The group with the highest labor force participation rate are those with the educational attainment of bachelor's degree or higher, with 82.0% or 1,647 individuals in the labor force. Within the labor force, individuals with less than high school education have the highest percentage of unemployment, with 17.0% or 82 of them being unemployed.
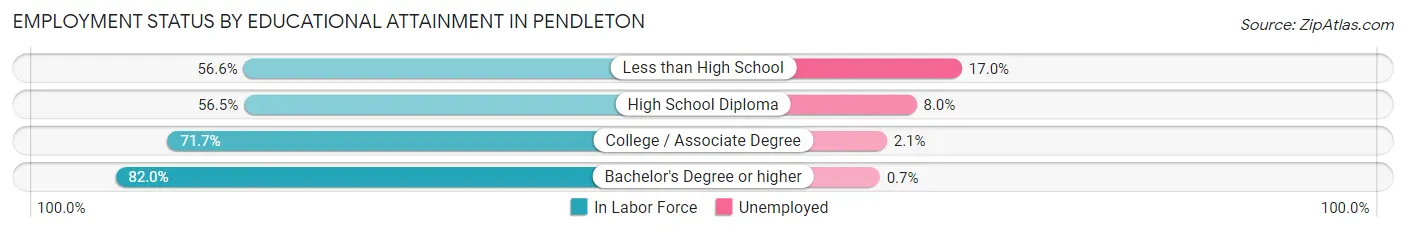
| Educational Attainment | In Labor Force | Unemployed |
| Less than High School | 482 (56.6%) | 145 (17.0%) |
| High School Diploma | 1,489 (56.5%) | 211 (8.0%) |
| College / Associate Degree | 2,289 (71.7%) | 67 (2.1%) |
| Bachelor's Degree or higher | 1,647 (82.0%) | 14 (0.7%) |
| Total | 5,909 (68.0%) | 382 (4.4%) |
Employment Occupations by Sex in Pendleton
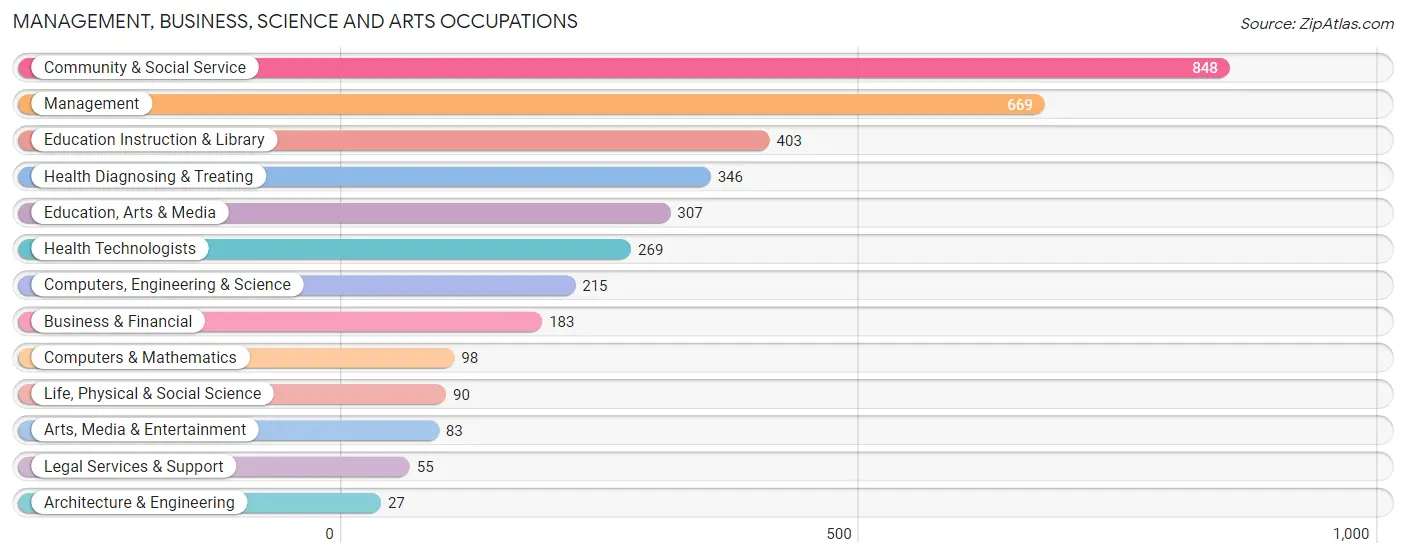
Management, Business, Science and Arts Occupations
The most common Management, Business, Science and Arts occupations in Pendleton are Community & Social Service (848 | 12.4%), Management (669 | 9.8%), Education Instruction & Library (403 | 5.9%), Health Diagnosing & Treating (346 | 5.1%), and Education, Arts & Media (307 | 4.5%).
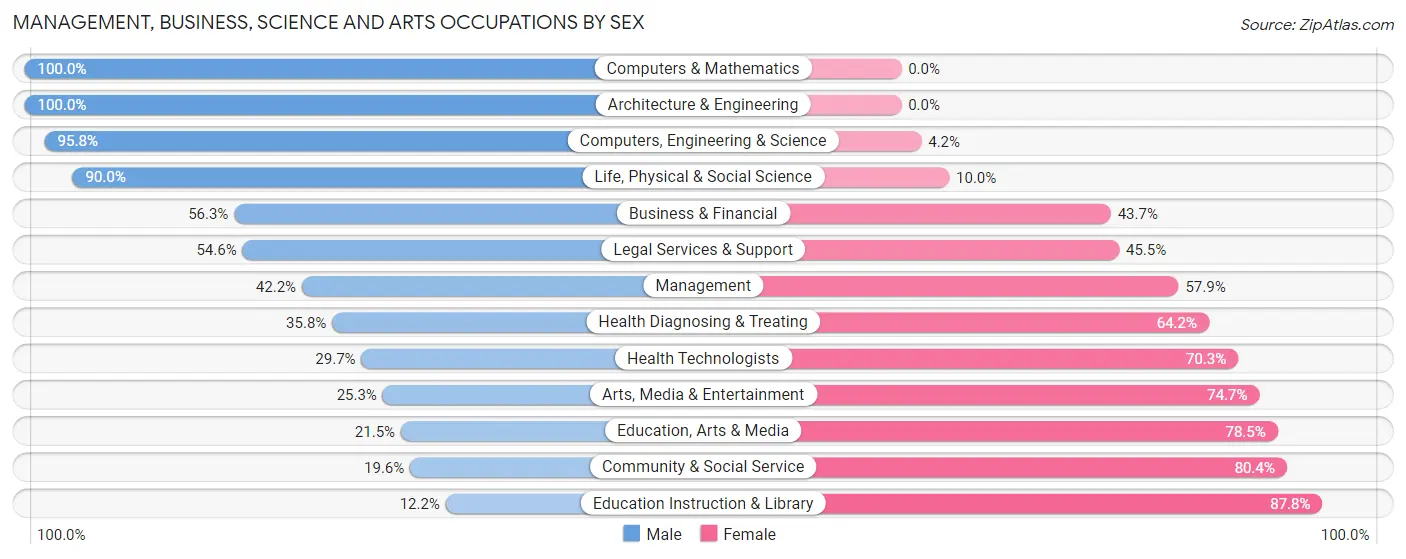
Management, Business, Science and Arts Occupations by Sex
Within the Management, Business, Science and Arts occupations in Pendleton, the most male-oriented occupations are Computers & Mathematics (100.0%), Architecture & Engineering (100.0%), and Computers, Engineering & Science (95.8%), while the most female-oriented occupations are Education Instruction & Library (87.8%), Community & Social Service (80.4%), and Education, Arts & Media (78.5%).
| Occupation | Male | Female |
| Management | 282 (42.1%) | 387 (57.9%) |
| Business & Financial | 103 (56.3%) | 80 (43.7%) |
| Computers, Engineering & Science | 206 (95.8%) | 9 (4.2%) |
| Computers & Mathematics | 98 (100.0%) | 0 (0.0%) |
| Architecture & Engineering | 27 (100.0%) | 0 (0.0%) |
| Life, Physical & Social Science | 81 (90.0%) | 9 (10.0%) |
| Community & Social Service | 166 (19.6%) | 682 (80.4%) |
| Education, Arts & Media | 66 (21.5%) | 241 (78.5%) |
| Legal Services & Support | 30 (54.5%) | 25 (45.5%) |
| Education Instruction & Library | 49 (12.2%) | 354 (87.8%) |
| Arts, Media & Entertainment | 21 (25.3%) | 62 (74.7%) |
| Health Diagnosing & Treating | 124 (35.8%) | 222 (64.2%) |
| Health Technologists | 80 (29.7%) | 189 (70.3%) |
| Total (Category) | 881 (39.0%) | 1,380 (61.0%) |
| Total (Overall) | 3,443 (50.3%) | 3,404 (49.7%) |
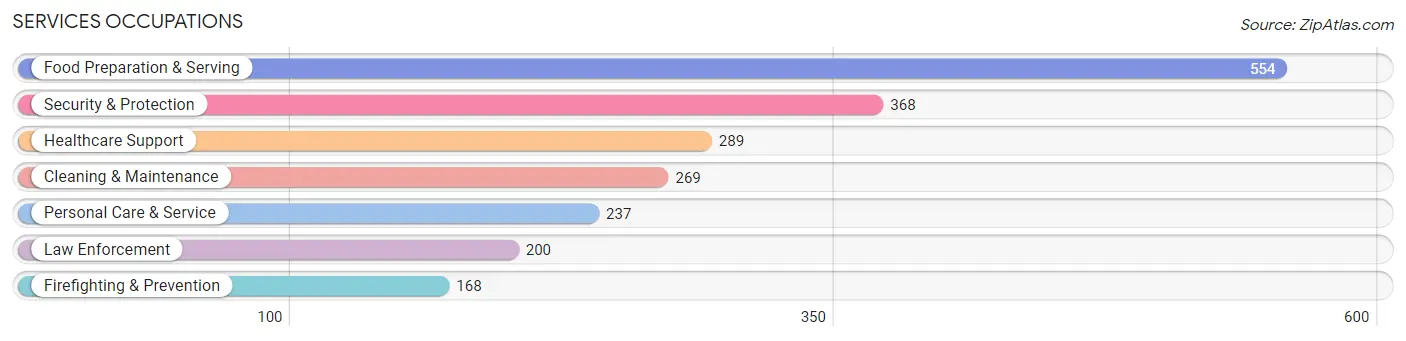
Services Occupations
The most common Services occupations in Pendleton are Food Preparation & Serving (554 | 8.1%), Security & Protection (368 | 5.4%), Healthcare Support (289 | 4.2%), Cleaning & Maintenance (269 | 3.9%), and Personal Care & Service (237 | 3.5%).
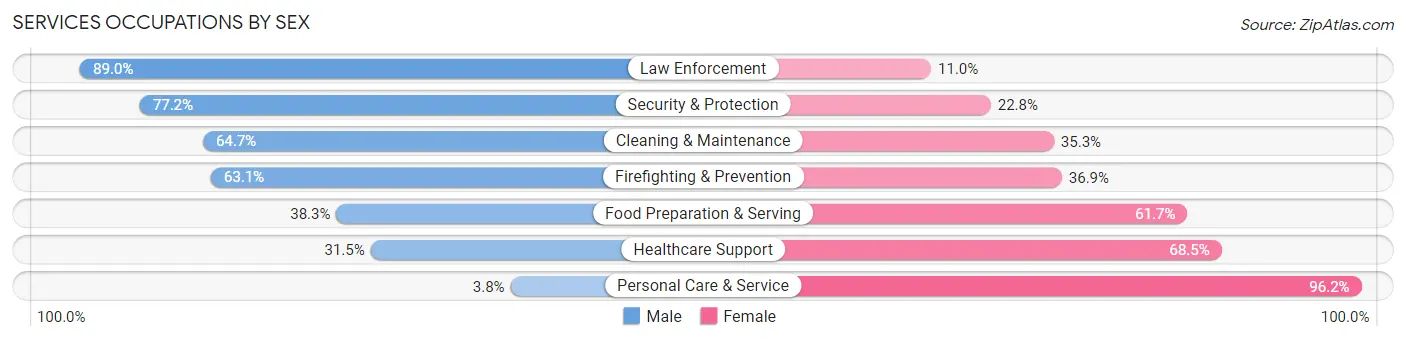
Services Occupations by Sex
Within the Services occupations in Pendleton, the most male-oriented occupations are Law Enforcement (89.0%), Security & Protection (77.2%), and Cleaning & Maintenance (64.7%), while the most female-oriented occupations are Personal Care & Service (96.2%), Healthcare Support (68.5%), and Food Preparation & Serving (61.7%).
| Occupation | Male | Female |
| Healthcare Support | 91 (31.5%) | 198 (68.5%) |
| Security & Protection | 284 (77.2%) | 84 (22.8%) |
| Firefighting & Prevention | 106 (63.1%) | 62 (36.9%) |
| Law Enforcement | 178 (89.0%) | 22 (11.0%) |
| Food Preparation & Serving | 212 (38.3%) | 342 (61.7%) |
| Cleaning & Maintenance | 174 (64.7%) | 95 (35.3%) |
| Personal Care & Service | 9 (3.8%) | 228 (96.2%) |
| Total (Category) | 770 (44.9%) | 947 (55.1%) |
| Total (Overall) | 3,443 (50.3%) | 3,404 (49.7%) |
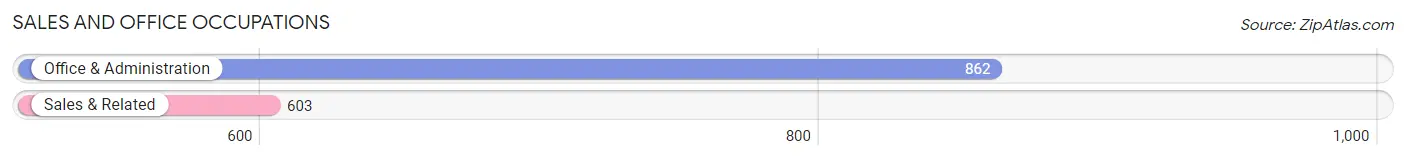
Sales and Office Occupations
The most common Sales and Office occupations in Pendleton are Office & Administration (862 | 12.6%), and Sales & Related (603 | 8.8%).
Sales and Office Occupations by Sex
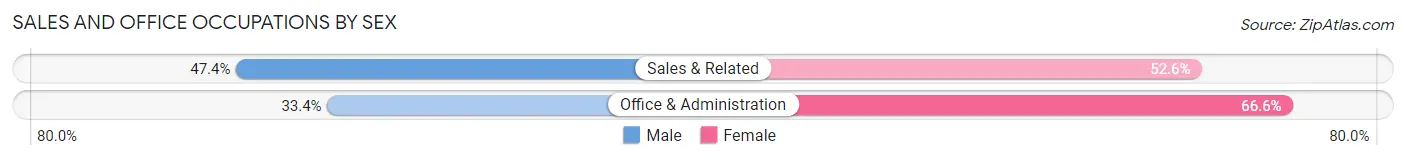
| Occupation | Male | Female |
| Sales & Related | 286 (47.4%) | 317 (52.6%) |
| Office & Administration | 288 (33.4%) | 574 (66.6%) |
| Total (Category) | 574 (39.2%) | 891 (60.8%) |
| Total (Overall) | 3,443 (50.3%) | 3,404 (49.7%) |
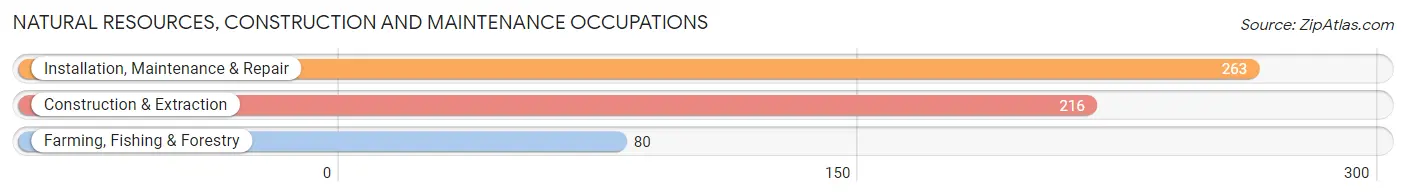
Natural Resources, Construction and Maintenance Occupations
The most common Natural Resources, Construction and Maintenance occupations in Pendleton are Installation, Maintenance & Repair (263 | 3.8%), Construction & Extraction (216 | 3.2%), and Farming, Fishing & Forestry (80 | 1.2%).
Natural Resources, Construction and Maintenance Occupations by Sex
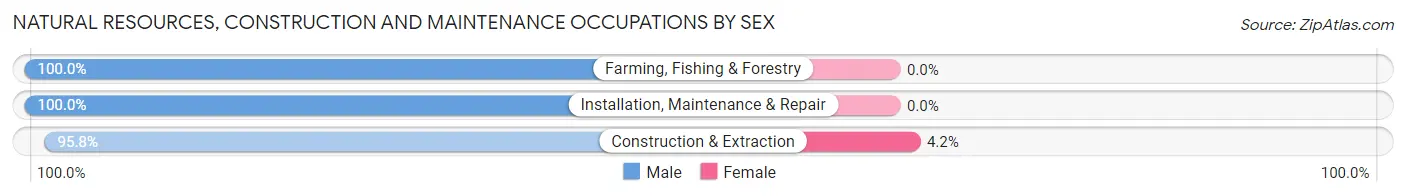
| Occupation | Male | Female |
| Farming, Fishing & Forestry | 80 (100.0%) | 0 (0.0%) |
| Construction & Extraction | 207 (95.8%) | 9 (4.2%) |
| Installation, Maintenance & Repair | 263 (100.0%) | 0 (0.0%) |
| Total (Category) | 550 (98.4%) | 9 (1.6%) |
| Total (Overall) | 3,443 (50.3%) | 3,404 (49.7%) |
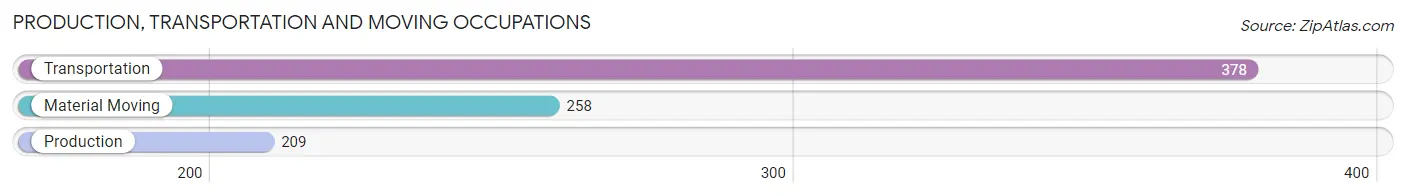
Production, Transportation and Moving Occupations
The most common Production, Transportation and Moving occupations in Pendleton are Transportation (378 | 5.5%), Material Moving (258 | 3.8%), and Production (209 | 3.0%).
Production, Transportation and Moving Occupations by Sex
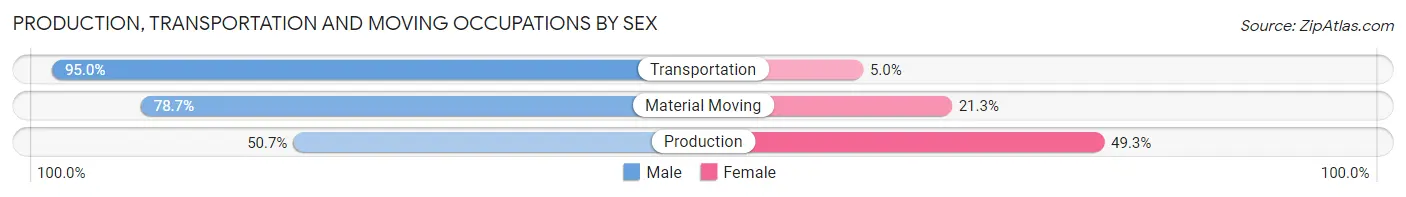
| Occupation | Male | Female |
| Production | 106 (50.7%) | 103 (49.3%) |
| Transportation | 359 (95.0%) | 19 (5.0%) |
| Material Moving | 203 (78.7%) | 55 (21.3%) |
| Total (Category) | 668 (79.0%) | 177 (20.9%) |
| Total (Overall) | 3,443 (50.3%) | 3,404 (49.7%) |
Employment Industries by Sex in Pendleton
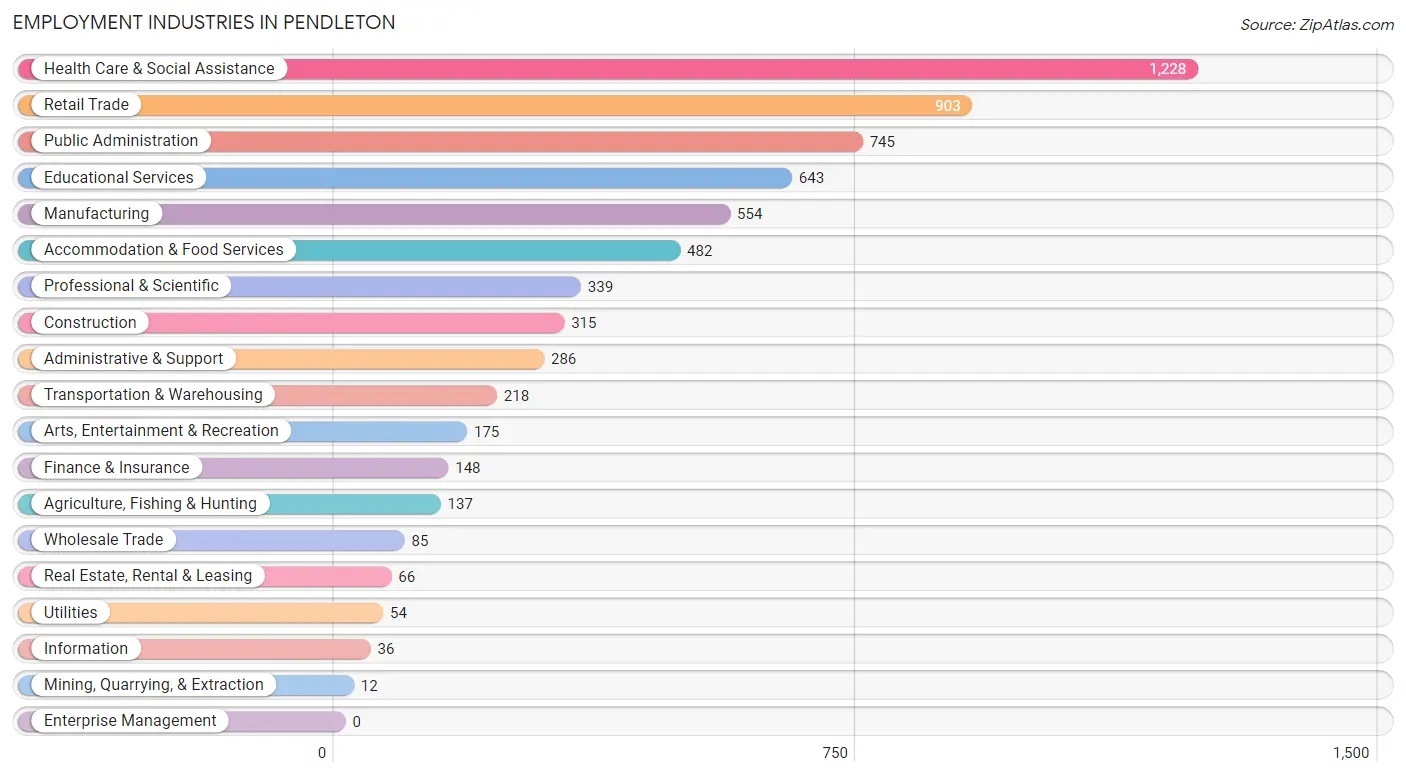
Employment Industries in Pendleton
The major employment industries in Pendleton include Health Care & Social Assistance (1,228 | 17.9%), Retail Trade (903 | 13.2%), Public Administration (745 | 10.9%), Educational Services (643 | 9.4%), and Manufacturing (554 | 8.1%).
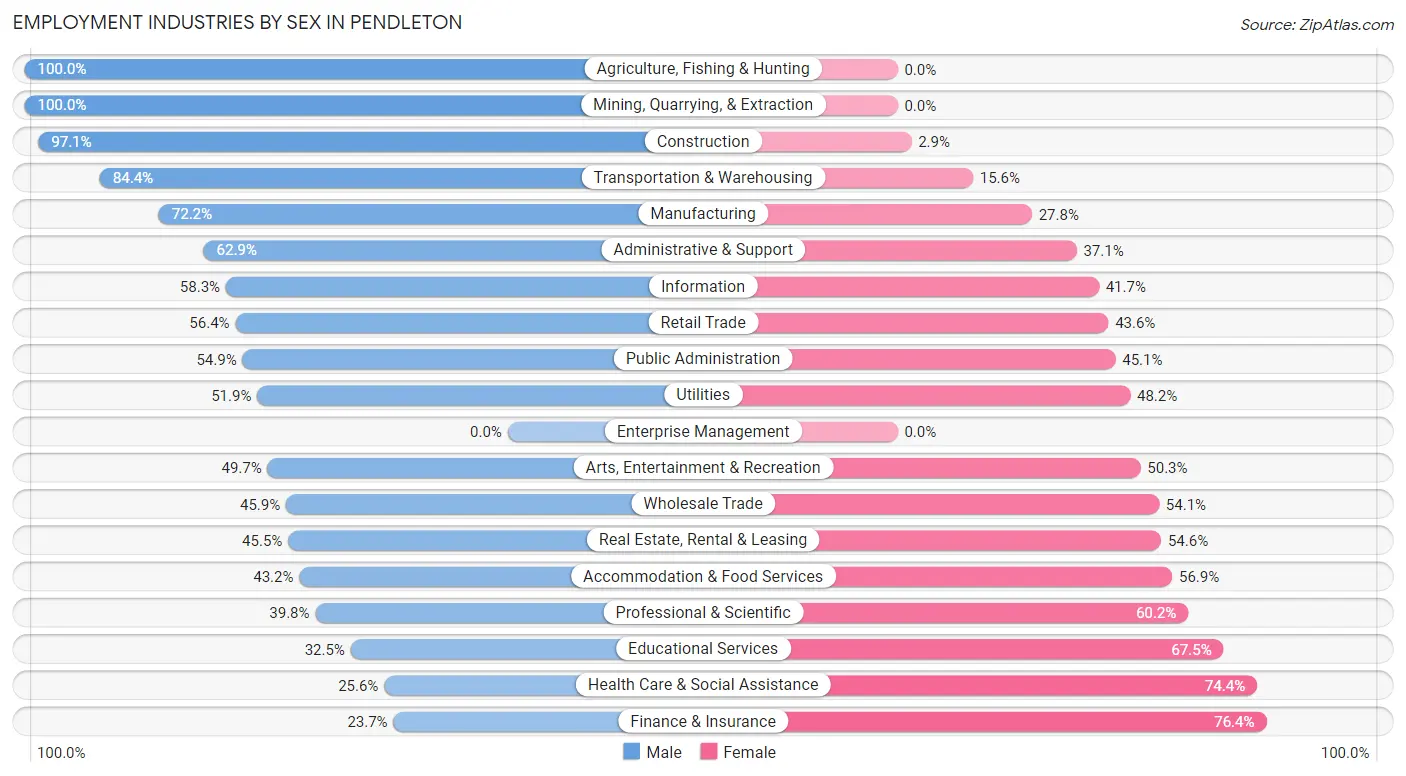
Employment Industries by Sex in Pendleton
The Pendleton industries that see more men than women are Agriculture, Fishing & Hunting (100.0%), Mining, Quarrying, & Extraction (100.0%), and Construction (97.1%), whereas the industries that tend to have a higher number of women are Finance & Insurance (76.3%), Health Care & Social Assistance (74.4%), and Educational Services (67.5%).
| Industry | Male | Female |
| Agriculture, Fishing & Hunting | 137 (100.0%) | 0 (0.0%) |
| Mining, Quarrying, & Extraction | 12 (100.0%) | 0 (0.0%) |
| Construction | 306 (97.1%) | 9 (2.9%) |
| Manufacturing | 400 (72.2%) | 154 (27.8%) |
| Wholesale Trade | 39 (45.9%) | 46 (54.1%) |
| Retail Trade | 509 (56.4%) | 394 (43.6%) |
| Transportation & Warehousing | 184 (84.4%) | 34 (15.6%) |
| Utilities | 28 (51.8%) | 26 (48.1%) |
| Information | 21 (58.3%) | 15 (41.7%) |
| Finance & Insurance | 35 (23.6%) | 113 (76.3%) |
| Real Estate, Rental & Leasing | 30 (45.5%) | 36 (54.5%) |
| Professional & Scientific | 135 (39.8%) | 204 (60.2%) |
| Enterprise Management | 0 (0.0%) | 0 (0.0%) |
| Administrative & Support | 180 (62.9%) | 106 (37.1%) |
| Educational Services | 209 (32.5%) | 434 (67.5%) |
| Health Care & Social Assistance | 314 (25.6%) | 914 (74.4%) |
| Arts, Entertainment & Recreation | 87 (49.7%) | 88 (50.3%) |
| Accommodation & Food Services | 208 (43.1%) | 274 (56.9%) |
| Public Administration | 409 (54.9%) | 336 (45.1%) |
| Total | 3,443 (50.3%) | 3,404 (49.7%) |
Education in Pendleton
School Enrollment in Pendleton
The most common levels of schooling among the 4,144 students in Pendleton are high school (1,023 | 24.7%), middle school (946 | 22.8%), and college / undergraduate (761 | 18.4%).
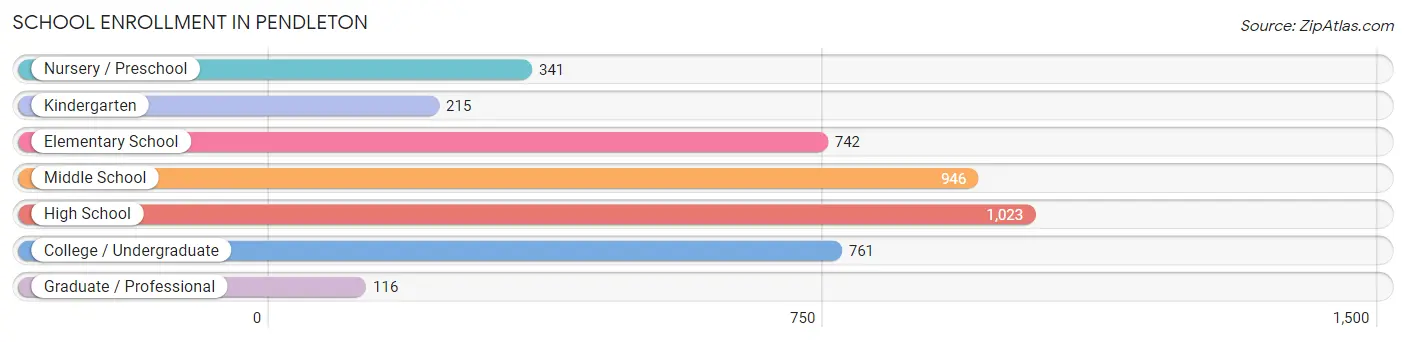
| School Level | # Students | % Students |
| Nursery / Preschool | 341 | 8.2% |
| Kindergarten | 215 | 5.2% |
| Elementary School | 742 | 17.9% |
| Middle School | 946 | 22.8% |
| High School | 1,023 | 24.7% |
| College / Undergraduate | 761 | 18.4% |
| Graduate / Professional | 116 | 2.8% |
| Total | 4,144 | 100.0% |
School Enrollment by Age by Funding Source in Pendleton
Out of a total of 4,144 students who are enrolled in schools in Pendleton, 539 (13.0%) attend a private institution, while the remaining 3,605 (87.0%) are enrolled in public schools. The age group of 3 to 4 year olds has the highest likelihood of being enrolled in private schools, with 138 (75.4% in the age bracket) enrolled. Conversely, the age group of 18 to 19 year olds has the lowest likelihood of being enrolled in a private school, with 335 (97.7% in the age bracket) attending a public institution.
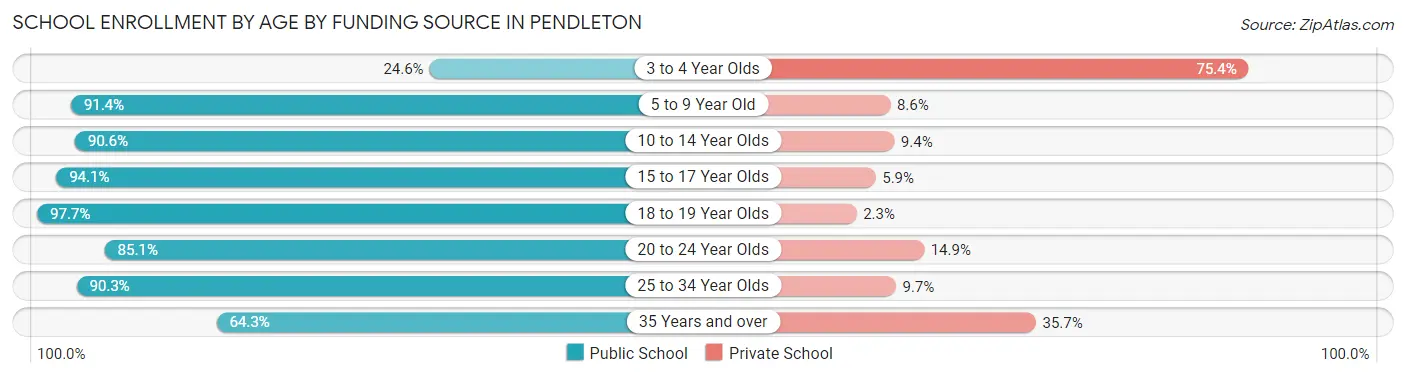
| Age Bracket | Public School | Private School |
| 3 to 4 Year Olds | 45 (24.6%) | 138 (75.4%) |
| 5 to 9 Year Old | 880 (91.4%) | 83 (8.6%) |
| 10 to 14 Year Olds | 1,026 (90.6%) | 106 (9.4%) |
| 15 to 17 Year Olds | 623 (94.1%) | 39 (5.9%) |
| 18 to 19 Year Olds | 335 (97.7%) | 8 (2.3%) |
| 20 to 24 Year Olds | 274 (85.1%) | 48 (14.9%) |
| 25 to 34 Year Olds | 262 (90.3%) | 28 (9.7%) |
| 35 Years and over | 160 (64.3%) | 89 (35.7%) |
| Total | 3,605 (87.0%) | 539 (13.0%) |
Educational Attainment by Field of Study in Pendleton
Business (388 | 12.8%), education (357 | 11.8%), social sciences (355 | 11.7%), science & technology (314 | 10.3%), and liberal arts & history (284 | 9.4%) are the most common fields of study among 3,033 individuals in Pendleton who have obtained a bachelor's degree or higher.
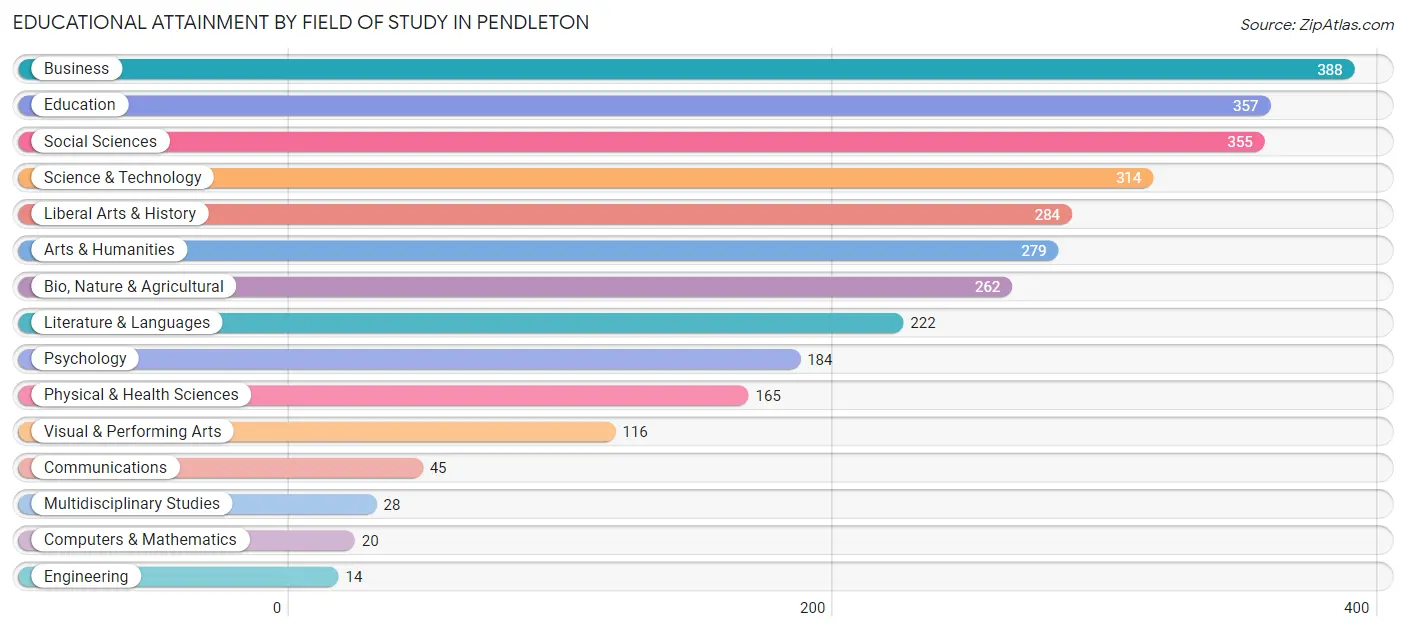
| Field of Study | # Graduates | % Graduates |
| Computers & Mathematics | 20 | 0.7% |
| Bio, Nature & Agricultural | 262 | 8.6% |
| Physical & Health Sciences | 165 | 5.4% |
| Psychology | 184 | 6.1% |
| Social Sciences | 355 | 11.7% |
| Engineering | 14 | 0.5% |
| Multidisciplinary Studies | 28 | 0.9% |
| Science & Technology | 314 | 10.3% |
| Business | 388 | 12.8% |
| Education | 357 | 11.8% |
| Literature & Languages | 222 | 7.3% |
| Liberal Arts & History | 284 | 9.4% |
| Visual & Performing Arts | 116 | 3.8% |
| Communications | 45 | 1.5% |
| Arts & Humanities | 279 | 9.2% |
| Total | 3,033 | 100.0% |
Transportation & Commute in Pendleton
Vehicle Availability by Sex in Pendleton
The most prevalent vehicle ownership categories in Pendleton are males with 2 vehicles (1,302, accounting for 38.4%) and females with 2 vehicles (1,254, making up 38.9%).
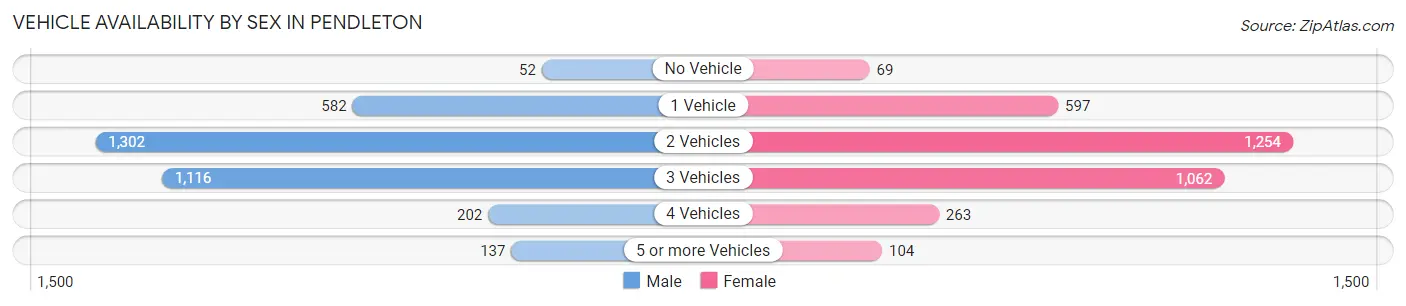
| Vehicles Available | Male | Female |
| No Vehicle | 52 (1.5%) | 69 (2.1%) |
| 1 Vehicle | 582 (17.2%) | 597 (17.8%) |
| 2 Vehicles | 1,302 (38.4%) | 1,254 (37.4%) |
| 3 Vehicles | 1,116 (32.9%) | 1,062 (31.7%) |
| 4 Vehicles | 202 (6.0%) | 263 (7.9%) |
| 5 or more Vehicles | 137 (4.0%) | 104 (3.1%) |
| Total | 3,391 (100.0%) | 3,349 (100.0%) |
Commute Time in Pendleton
The most frequently occuring commute durations in Pendleton are 5 to 9 minutes (2,231 commuters, 34.8%), 10 to 14 minutes (1,810 commuters, 28.2%), and less than 5 minutes (760 commuters, 11.9%).
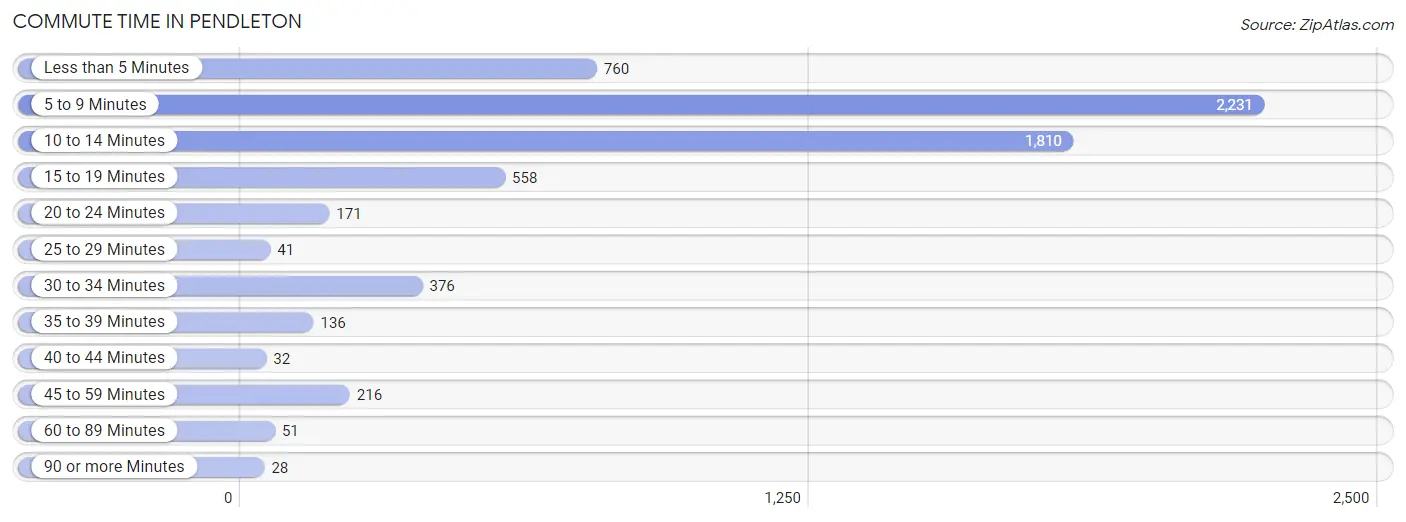
| Commute Time | # Commuters | % Commuters |
| Less than 5 Minutes | 760 | 11.9% |
| 5 to 9 Minutes | 2,231 | 34.8% |
| 10 to 14 Minutes | 1,810 | 28.2% |
| 15 to 19 Minutes | 558 | 8.7% |
| 20 to 24 Minutes | 171 | 2.7% |
| 25 to 29 Minutes | 41 | 0.6% |
| 30 to 34 Minutes | 376 | 5.9% |
| 35 to 39 Minutes | 136 | 2.1% |
| 40 to 44 Minutes | 32 | 0.5% |
| 45 to 59 Minutes | 216 | 3.4% |
| 60 to 89 Minutes | 51 | 0.8% |
| 90 or more Minutes | 28 | 0.4% |
Commute Time by Sex in Pendleton
The most common commute times in Pendleton are 5 to 9 minutes (1,171 commuters, 35.3%) for males and 5 to 9 minutes (1,060 commuters, 34.3%) for females.
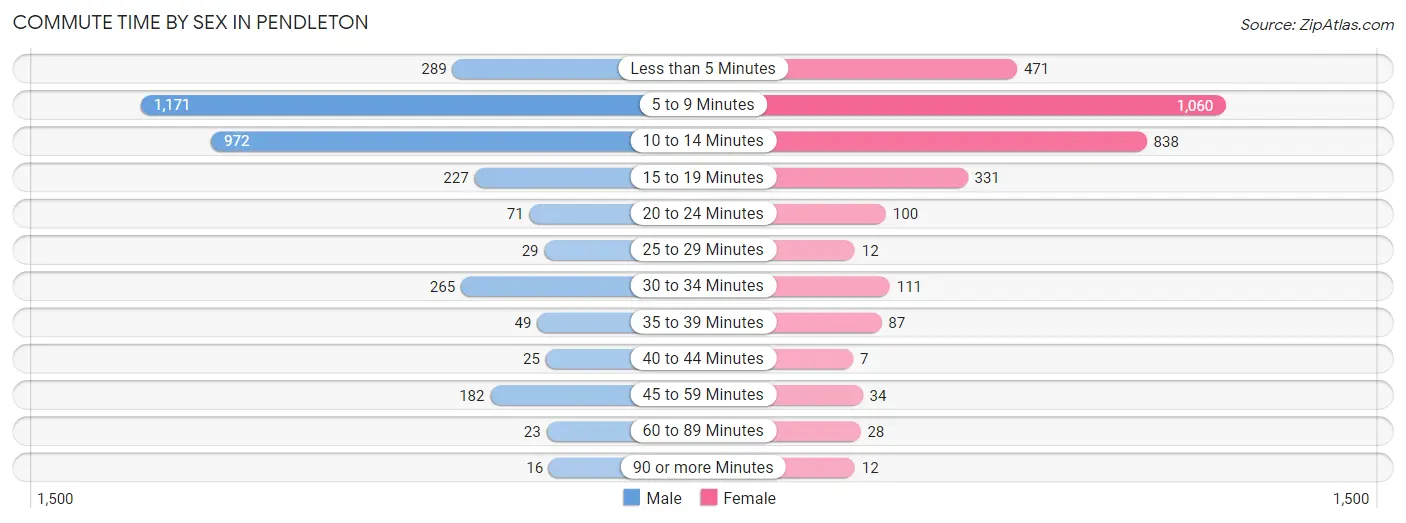
| Commute Time | Male | Female |
| Less than 5 Minutes | 289 (8.7%) | 471 (15.2%) |
| 5 to 9 Minutes | 1,171 (35.3%) | 1,060 (34.3%) |
| 10 to 14 Minutes | 972 (29.3%) | 838 (27.1%) |
| 15 to 19 Minutes | 227 (6.8%) | 331 (10.7%) |
| 20 to 24 Minutes | 71 (2.1%) | 100 (3.2%) |
| 25 to 29 Minutes | 29 (0.9%) | 12 (0.4%) |
| 30 to 34 Minutes | 265 (8.0%) | 111 (3.6%) |
| 35 to 39 Minutes | 49 (1.5%) | 87 (2.8%) |
| 40 to 44 Minutes | 25 (0.7%) | 7 (0.2%) |
| 45 to 59 Minutes | 182 (5.5%) | 34 (1.1%) |
| 60 to 89 Minutes | 23 (0.7%) | 28 (0.9%) |
| 90 or more Minutes | 16 (0.5%) | 12 (0.4%) |
Time of Departure to Work by Sex in Pendleton
The most frequent times of departure to work in Pendleton are 12:00 AM to 4:59 AM (467, 14.1%) for males and 7:30 AM to 7:59 AM (899, 29.1%) for females.
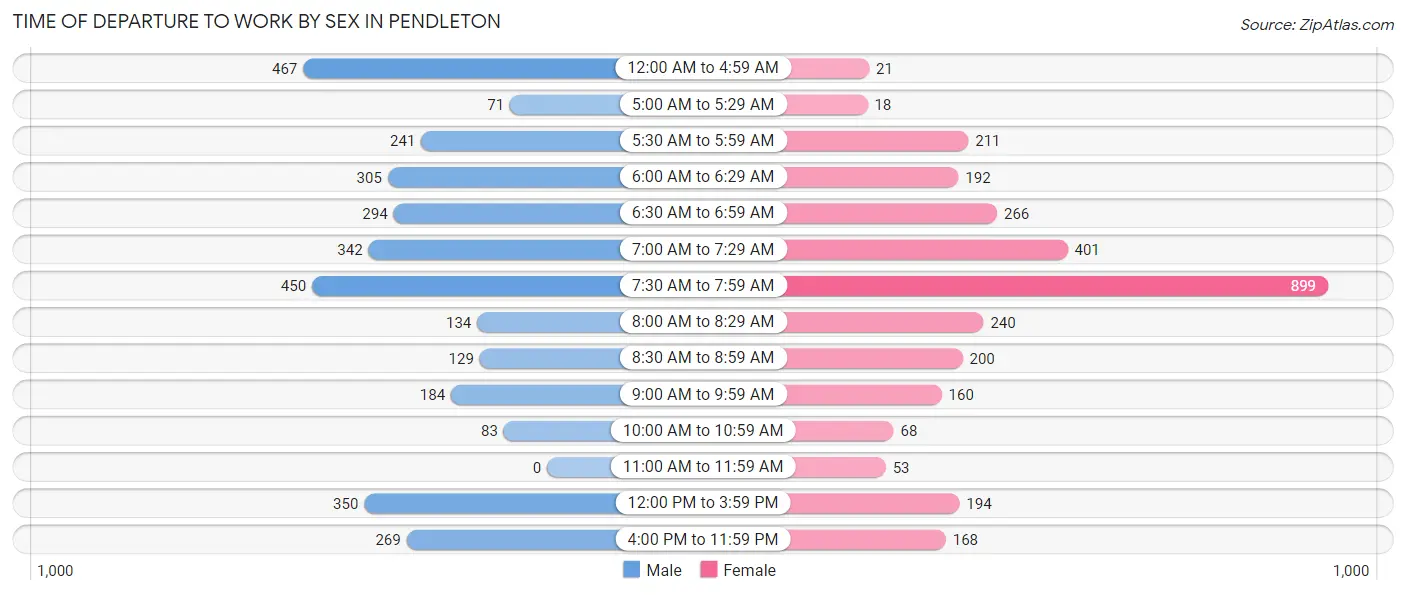
| Time of Departure | Male | Female |
| 12:00 AM to 4:59 AM | 467 (14.1%) | 21 (0.7%) |
| 5:00 AM to 5:29 AM | 71 (2.1%) | 18 (0.6%) |
| 5:30 AM to 5:59 AM | 241 (7.3%) | 211 (6.8%) |
| 6:00 AM to 6:29 AM | 305 (9.2%) | 192 (6.2%) |
| 6:30 AM to 6:59 AM | 294 (8.9%) | 266 (8.6%) |
| 7:00 AM to 7:29 AM | 342 (10.3%) | 401 (13.0%) |
| 7:30 AM to 7:59 AM | 450 (13.6%) | 899 (29.1%) |
| 8:00 AM to 8:29 AM | 134 (4.0%) | 240 (7.8%) |
| 8:30 AM to 8:59 AM | 129 (3.9%) | 200 (6.5%) |
| 9:00 AM to 9:59 AM | 184 (5.5%) | 160 (5.2%) |
| 10:00 AM to 10:59 AM | 83 (2.5%) | 68 (2.2%) |
| 11:00 AM to 11:59 AM | 0 (0.0%) | 53 (1.7%) |
| 12:00 PM to 3:59 PM | 350 (10.5%) | 194 (6.3%) |
| 4:00 PM to 11:59 PM | 269 (8.1%) | 168 (5.4%) |
| Total | 3,319 (100.0%) | 3,091 (100.0%) |
Housing Occupancy in Pendleton
Occupancy by Ownership in Pendleton
Of the total 5,950 dwellings in Pendleton, owner-occupied units account for 3,244 (54.5%), while renter-occupied units make up 2,706 (45.5%).
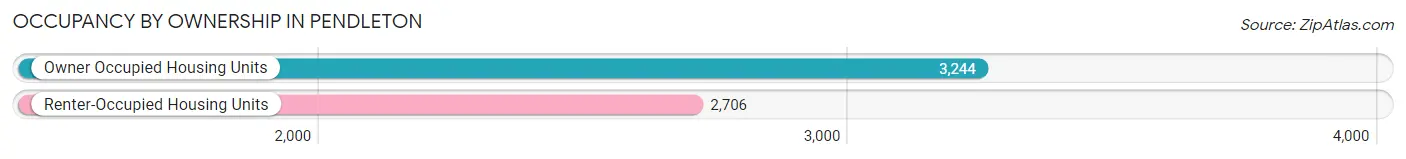
| Occupancy | # Housing Units | % Housing Units |
| Owner Occupied Housing Units | 3,244 | 54.5% |
| Renter-Occupied Housing Units | 2,706 | 45.5% |
| Total Occupied Housing Units | 5,950 | 100.0% |
Occupancy by Household Size in Pendleton
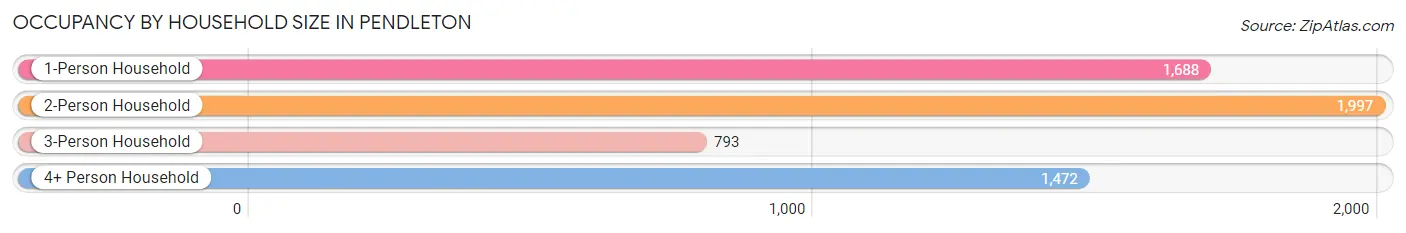
| Household Size | # Housing Units | % Housing Units |
| 1-Person Household | 1,688 | 28.4% |
| 2-Person Household | 1,997 | 33.6% |
| 3-Person Household | 793 | 13.3% |
| 4+ Person Household | 1,472 | 24.7% |
| Total Housing Units | 5,950 | 100.0% |
Occupancy by Ownership by Household Size in Pendleton
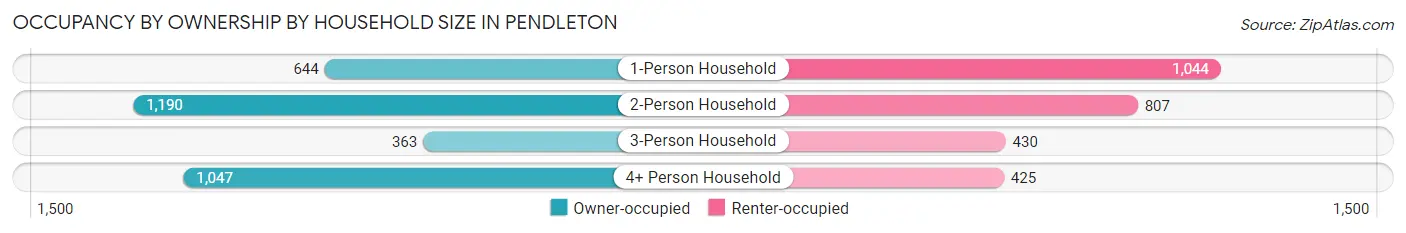
| Household Size | Owner-occupied | Renter-occupied |
| 1-Person Household | 644 (38.2%) | 1,044 (61.9%) |
| 2-Person Household | 1,190 (59.6%) | 807 (40.4%) |
| 3-Person Household | 363 (45.8%) | 430 (54.2%) |
| 4+ Person Household | 1,047 (71.1%) | 425 (28.9%) |
| Total Housing Units | 3,244 (54.5%) | 2,706 (45.5%) |
Occupancy by Educational Attainment in Pendleton
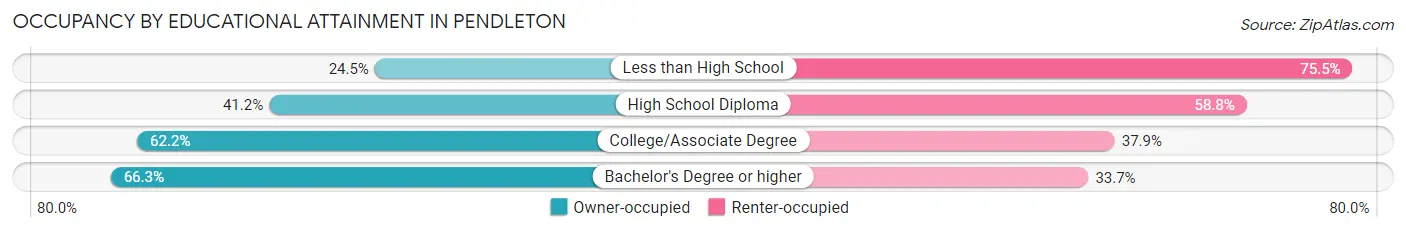
| Household Size | Owner-occupied | Renter-occupied |
| Less than High School | 127 (24.5%) | 392 (75.5%) |
| High School Diploma | 640 (41.2%) | 912 (58.8%) |
| College/Associate Degree | 1,427 (62.2%) | 869 (37.9%) |
| Bachelor's Degree or higher | 1,050 (66.3%) | 533 (33.7%) |
Occupancy by Age of Householder in Pendleton
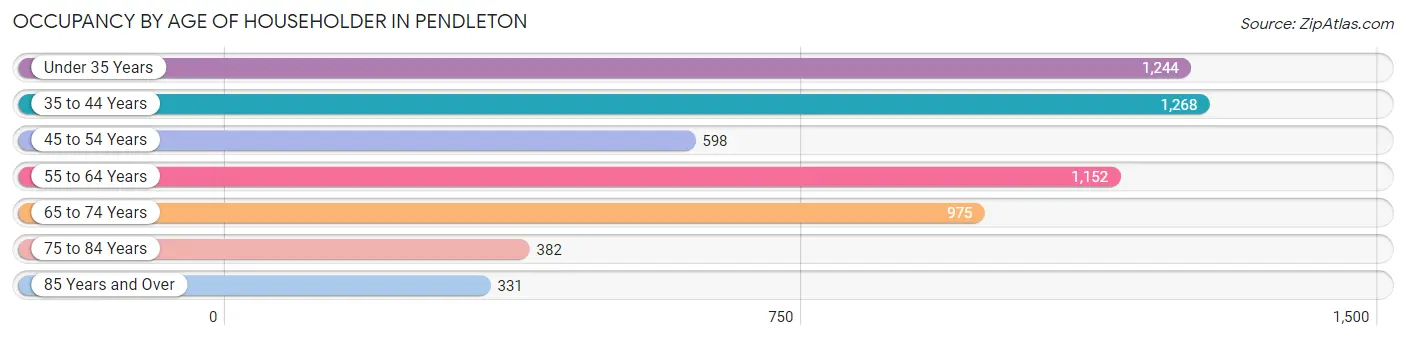
| Age Bracket | # Households | % Households |
| Under 35 Years | 1,244 | 20.9% |
| 35 to 44 Years | 1,268 | 21.3% |
| 45 to 54 Years | 598 | 10.1% |
| 55 to 64 Years | 1,152 | 19.4% |
| 65 to 74 Years | 975 | 16.4% |
| 75 to 84 Years | 382 | 6.4% |
| 85 Years and Over | 331 | 5.6% |
| Total | 5,950 | 100.0% |
Housing Finances in Pendleton
Median Income by Occupancy in Pendleton
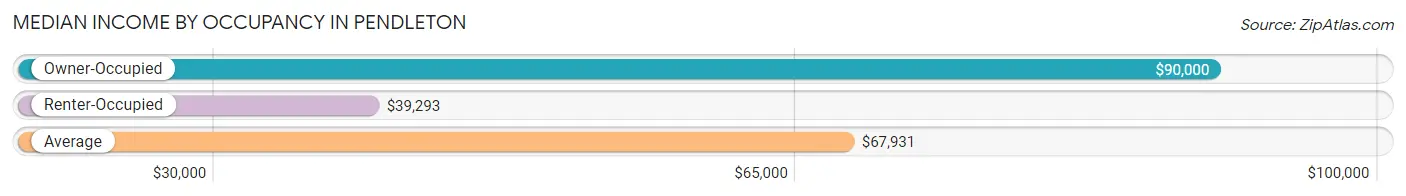
| Occupancy Type | # Households | Median Income |
| Owner-Occupied | 3,244 (54.5%) | $90,000 |
| Renter-Occupied | 2,706 (45.5%) | $39,293 |
| Average | 5,950 (100.0%) | $67,931 |
Occupancy by Householder Income Bracket in Pendleton
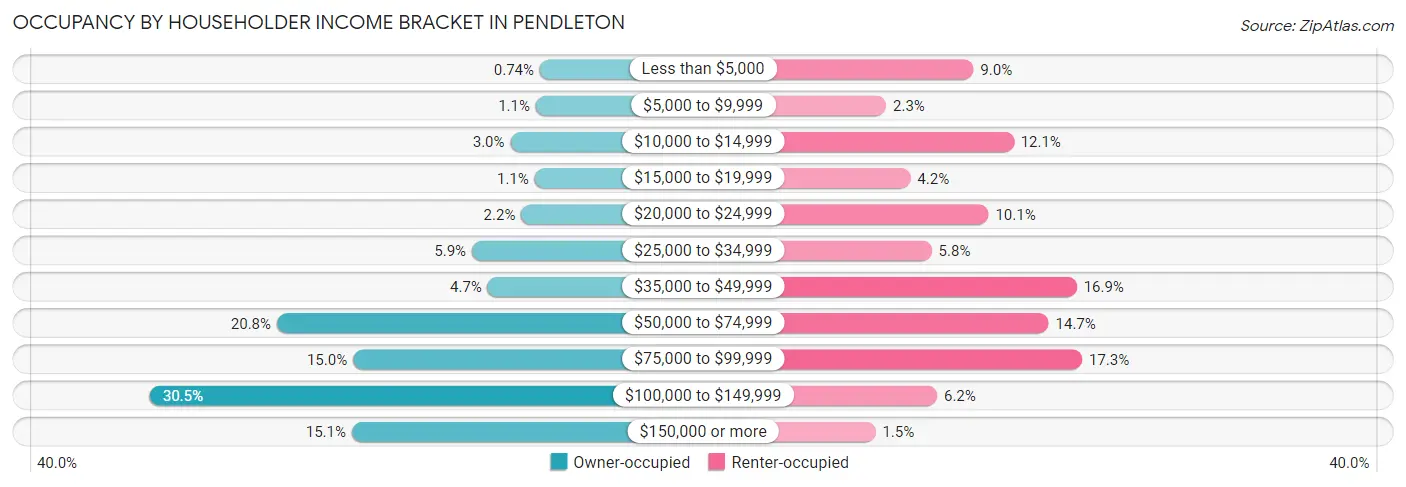
| Income Bracket | Owner-occupied | Renter-occupied |
| Less than $5,000 | 24 (0.7%) | 243 (9.0%) |
| $5,000 to $9,999 | 34 (1.1%) | 63 (2.3%) |
| $10,000 to $14,999 | 97 (3.0%) | 326 (12.0%) |
| $15,000 to $19,999 | 37 (1.1%) | 113 (4.2%) |
| $20,000 to $24,999 | 70 (2.2%) | 274 (10.1%) |
| $25,000 to $34,999 | 192 (5.9%) | 157 (5.8%) |
| $35,000 to $49,999 | 153 (4.7%) | 456 (16.9%) |
| $50,000 to $74,999 | 674 (20.8%) | 398 (14.7%) |
| $75,000 to $99,999 | 486 (15.0%) | 467 (17.3%) |
| $100,000 to $149,999 | 988 (30.5%) | 168 (6.2%) |
| $150,000 or more | 489 (15.1%) | 41 (1.5%) |
| Total | 3,244 (100.0%) | 2,706 (100.0%) |
Monthly Housing Cost Tiers in Pendleton
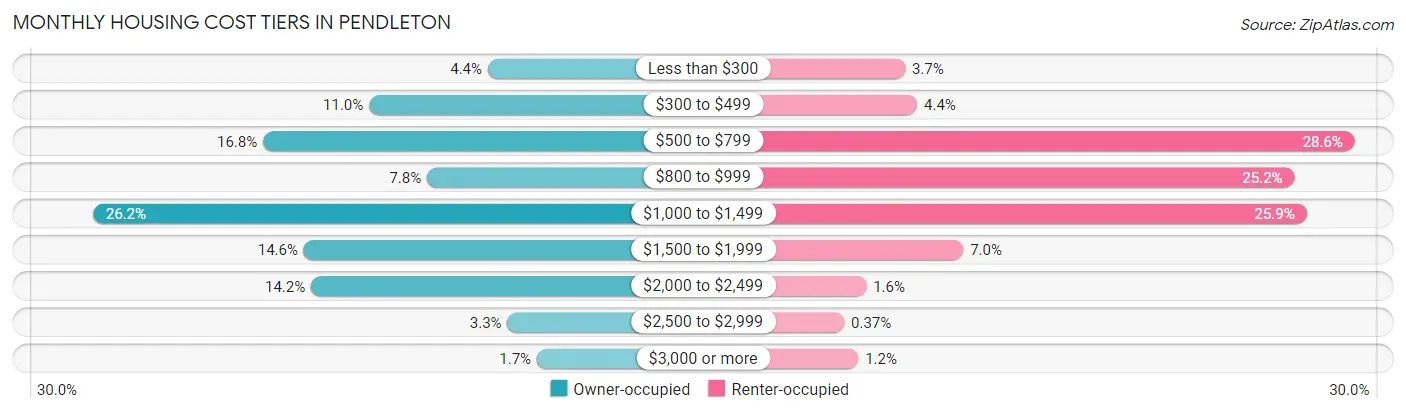
| Monthly Cost | Owner-occupied | Renter-occupied |
| Less than $300 | 143 (4.4%) | 101 (3.7%) |
| $300 to $499 | 356 (11.0%) | 119 (4.4%) |
| $500 to $799 | 546 (16.8%) | 773 (28.6%) |
| $800 to $999 | 252 (7.8%) | 683 (25.2%) |
| $1,000 to $1,499 | 851 (26.2%) | 701 (25.9%) |
| $1,500 to $1,999 | 473 (14.6%) | 188 (7.0%) |
| $2,000 to $2,499 | 460 (14.2%) | 43 (1.6%) |
| $2,500 to $2,999 | 108 (3.3%) | 10 (0.4%) |
| $3,000 or more | 55 (1.7%) | 31 (1.1%) |
| Total | 3,244 (100.0%) | 2,706 (100.0%) |
Physical Housing Characteristics in Pendleton
Housing Structures in Pendleton
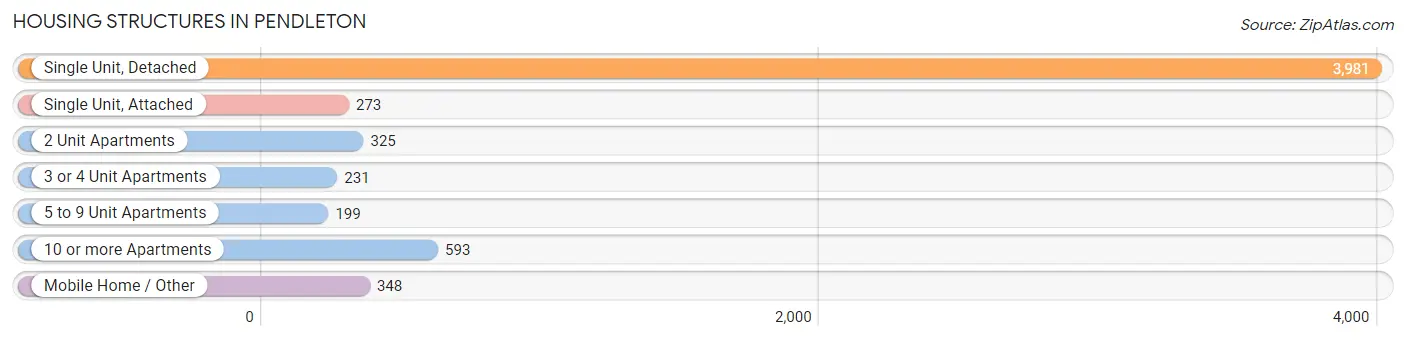
| Structure Type | # Housing Units | % Housing Units |
| Single Unit, Detached | 3,981 | 66.9% |
| Single Unit, Attached | 273 | 4.6% |
| 2 Unit Apartments | 325 | 5.5% |
| 3 or 4 Unit Apartments | 231 | 3.9% |
| 5 to 9 Unit Apartments | 199 | 3.3% |
| 10 or more Apartments | 593 | 10.0% |
| Mobile Home / Other | 348 | 5.9% |
| Total | 5,950 | 100.0% |
Housing Structures by Occupancy in Pendleton
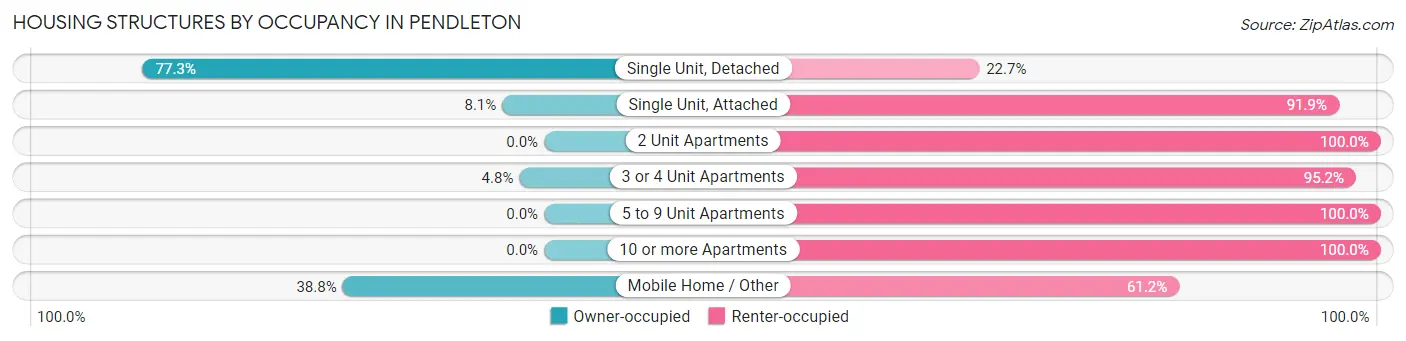
| Structure Type | Owner-occupied | Renter-occupied |
| Single Unit, Detached | 3,076 (77.3%) | 905 (22.7%) |
| Single Unit, Attached | 22 (8.1%) | 251 (91.9%) |
| 2 Unit Apartments | 0 (0.0%) | 325 (100.0%) |
| 3 or 4 Unit Apartments | 11 (4.8%) | 220 (95.2%) |
| 5 to 9 Unit Apartments | 0 (0.0%) | 199 (100.0%) |
| 10 or more Apartments | 0 (0.0%) | 593 (100.0%) |
| Mobile Home / Other | 135 (38.8%) | 213 (61.2%) |
| Total | 3,244 (54.5%) | 2,706 (45.5%) |
Housing Structures by Number of Rooms in Pendleton
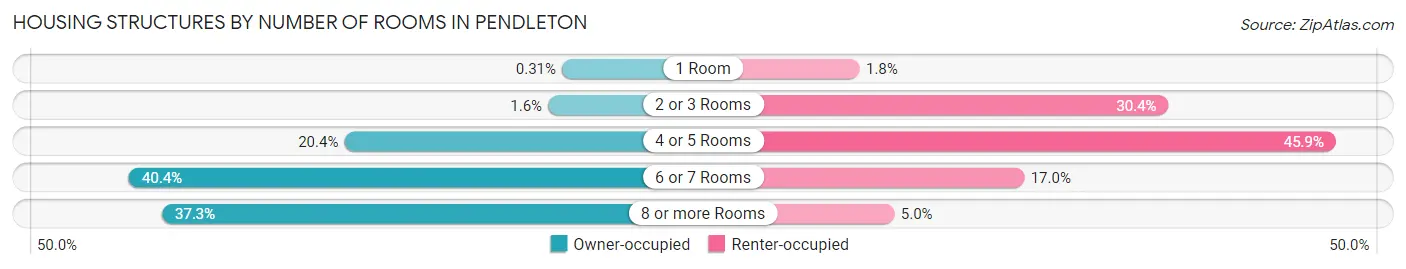
| Number of Rooms | Owner-occupied | Renter-occupied |
| 1 Room | 10 (0.3%) | 48 (1.8%) |
| 2 or 3 Rooms | 52 (1.6%) | 822 (30.4%) |
| 4 or 5 Rooms | 663 (20.4%) | 1,241 (45.9%) |
| 6 or 7 Rooms | 1,309 (40.4%) | 460 (17.0%) |
| 8 or more Rooms | 1,210 (37.3%) | 135 (5.0%) |
| Total | 3,244 (100.0%) | 2,706 (100.0%) |
Housing Structure by Heating Type in Pendleton
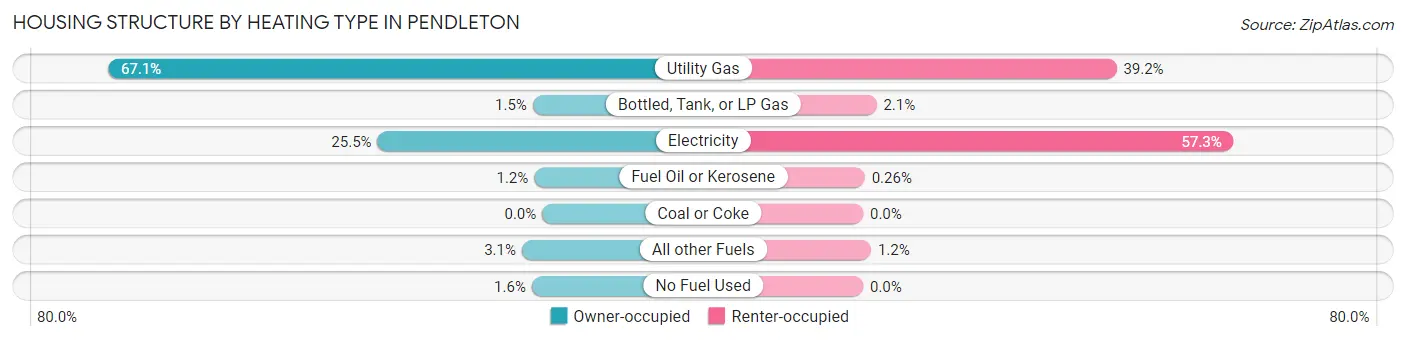
| Heating Type | Owner-occupied | Renter-occupied |
| Utility Gas | 2,177 (67.1%) | 1,060 (39.2%) |
| Bottled, Tank, or LP Gas | 47 (1.5%) | 56 (2.1%) |
| Electricity | 826 (25.5%) | 1,550 (57.3%) |
| Fuel Oil or Kerosene | 40 (1.2%) | 7 (0.3%) |
| Coal or Coke | 0 (0.0%) | 0 (0.0%) |
| All other Fuels | 102 (3.1%) | 33 (1.2%) |
| No Fuel Used | 52 (1.6%) | 0 (0.0%) |
| Total | 3,244 (100.0%) | 2,706 (100.0%) |
Household Vehicle Usage in Pendleton
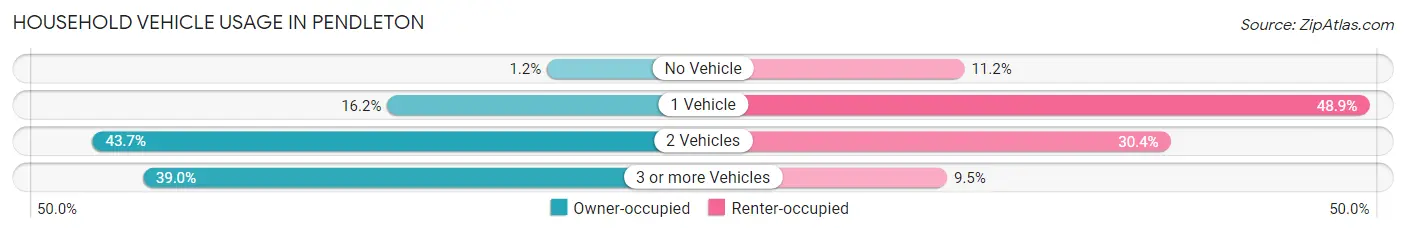
| Vehicles per Household | Owner-occupied | Renter-occupied |
| No Vehicle | 40 (1.2%) | 302 (11.2%) |
| 1 Vehicle | 524 (16.2%) | 1,324 (48.9%) |
| 2 Vehicles | 1,416 (43.6%) | 822 (30.4%) |
| 3 or more Vehicles | 1,264 (39.0%) | 258 (9.5%) |
| Total | 3,244 (100.0%) | 2,706 (100.0%) |
Real Estate & Mortgages in Pendleton
Real Estate and Mortgage Overview in Pendleton
| Characteristic | Without Mortgage | With Mortgage |
| Housing Units | 1,183 | 2,061 |
| Median Property Value | $208,700 | $251,700 |
| Median Household Income | $74,531 | $429 |
| Monthly Housing Costs | $553 | $43 |
| Real Estate Taxes | $2,599 | $5 |
Property Value by Mortgage Status in Pendleton
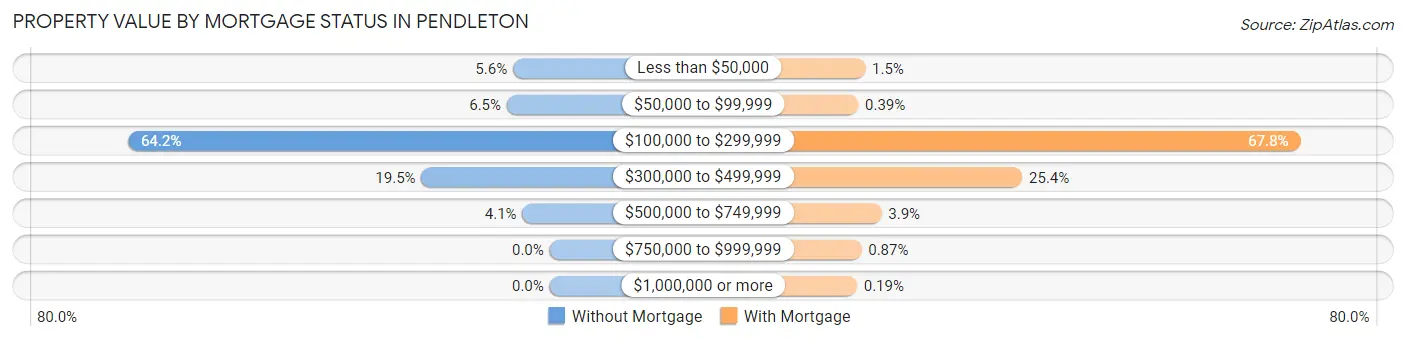
| Property Value | Without Mortgage | With Mortgage |
| Less than $50,000 | 66 (5.6%) | 30 (1.5%) |
| $50,000 to $99,999 | 77 (6.5%) | 8 (0.4%) |
| $100,000 to $299,999 | 760 (64.2%) | 1,397 (67.8%) |
| $300,000 to $499,999 | 231 (19.5%) | 523 (25.4%) |
| $500,000 to $749,999 | 49 (4.1%) | 81 (3.9%) |
| $750,000 to $999,999 | 0 (0.0%) | 18 (0.9%) |
| $1,000,000 or more | 0 (0.0%) | 4 (0.2%) |
| Total | 1,183 (100.0%) | 2,061 (100.0%) |
Household Income by Mortgage Status in Pendleton
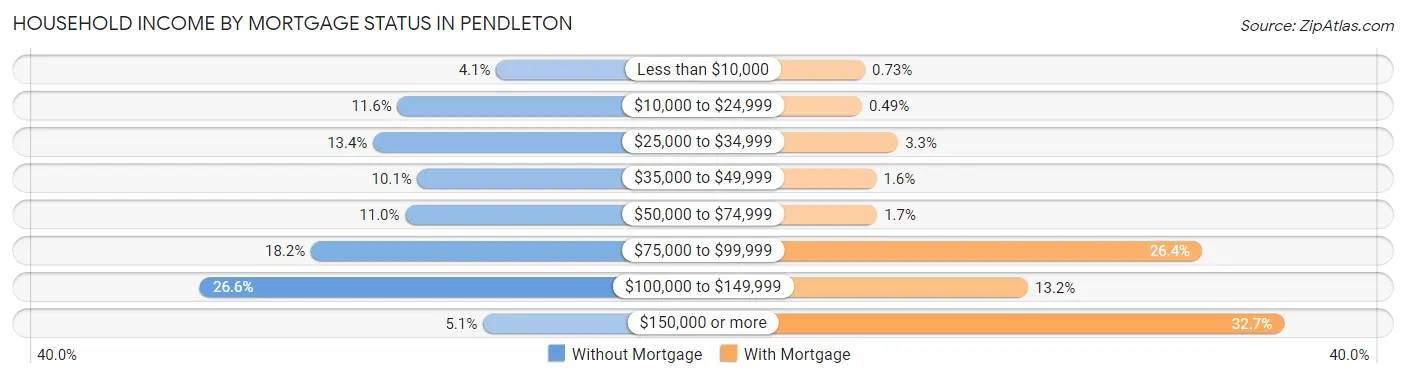
| Household Income | Without Mortgage | With Mortgage |
| Less than $10,000 | 48 (4.1%) | 15 (0.7%) |
| $10,000 to $24,999 | 137 (11.6%) | 10 (0.5%) |
| $25,000 to $34,999 | 159 (13.4%) | 67 (3.3%) |
| $35,000 to $49,999 | 119 (10.1%) | 33 (1.6%) |
| $50,000 to $74,999 | 130 (11.0%) | 34 (1.7%) |
| $75,000 to $99,999 | 215 (18.2%) | 544 (26.4%) |
| $100,000 to $149,999 | 315 (26.6%) | 271 (13.2%) |
| $150,000 or more | 60 (5.1%) | 673 (32.7%) |
| Total | 1,183 (100.0%) | 2,061 (100.0%) |
Property Value to Household Income Ratio in Pendleton
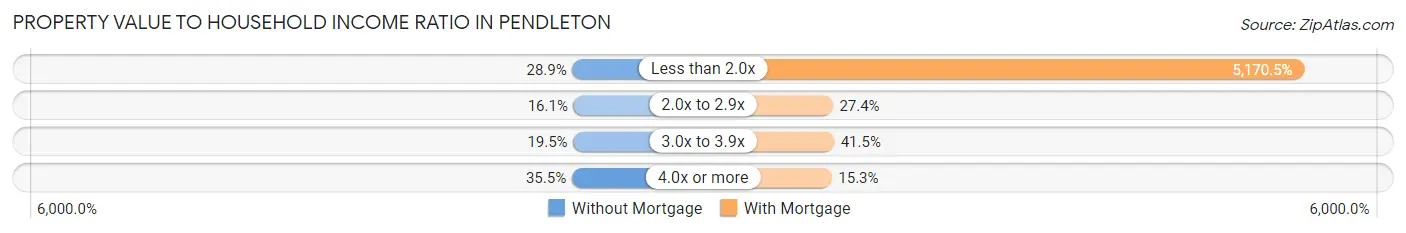
| Value-to-Income Ratio | Without Mortgage | With Mortgage |
| Less than 2.0x | 342 (28.9%) | 106,563 (5,170.5%) |
| 2.0x to 2.9x | 190 (16.1%) | 564 (27.4%) |
| 3.0x to 3.9x | 231 (19.5%) | 856 (41.5%) |
| 4.0x or more | 420 (35.5%) | 316 (15.3%) |
| Total | 1,183 (100.0%) | 2,061 (100.0%) |
Real Estate Taxes by Mortgage Status in Pendleton
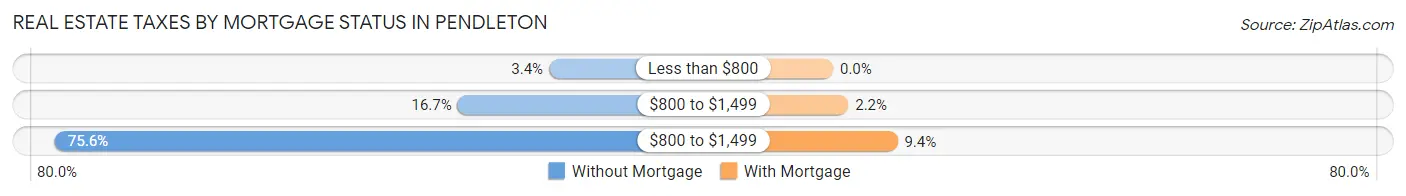
| Property Taxes | Without Mortgage | With Mortgage |
| Less than $800 | 40 (3.4%) | 0 (0.0%) |
| $800 to $1,499 | 198 (16.7%) | 46 (2.2%) |
| $800 to $1,499 | 894 (75.6%) | 194 (9.4%) |
| Total | 1,183 (100.0%) | 2,061 (100.0%) |
Health & Disability in Pendleton
Health Insurance Coverage by Age in Pendleton
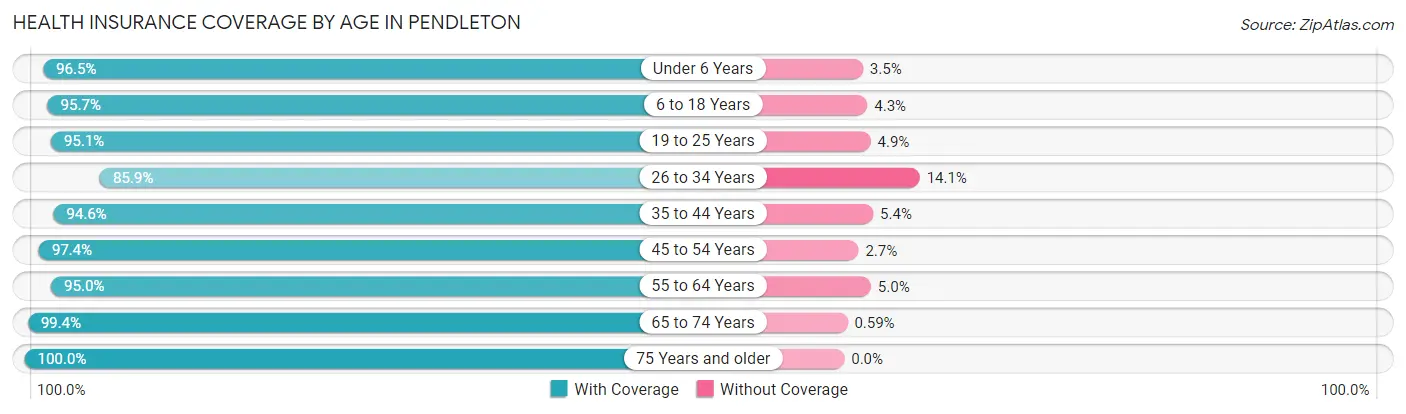
| Age Bracket | With Coverage | Without Coverage |
| Under 6 Years | 1,588 (96.5%) | 57 (3.5%) |
| 6 to 18 Years | 2,557 (95.7%) | 115 (4.3%) |
| 19 to 25 Years | 1,105 (95.1%) | 57 (4.9%) |
| 26 to 34 Years | 1,577 (85.9%) | 258 (14.1%) |
| 35 to 44 Years | 1,986 (94.6%) | 113 (5.4%) |
| 45 to 54 Years | 1,394 (97.4%) | 38 (2.6%) |
| 55 to 64 Years | 1,762 (95.0%) | 92 (5.0%) |
| 65 to 74 Years | 1,671 (99.4%) | 10 (0.6%) |
| 75 Years and older | 1,028 (100.0%) | 0 (0.0%) |
| Total | 14,668 (95.2%) | 740 (4.8%) |
Health Insurance Coverage by Citizenship Status in Pendleton
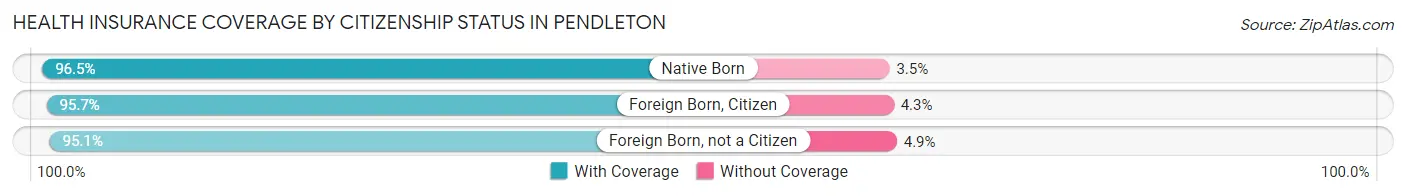
| Citizenship Status | With Coverage | Without Coverage |
| Native Born | 1,588 (96.5%) | 57 (3.5%) |
| Foreign Born, Citizen | 2,557 (95.7%) | 115 (4.3%) |
| Foreign Born, not a Citizen | 1,105 (95.1%) | 57 (4.9%) |
Health Insurance Coverage by Household Income in Pendleton
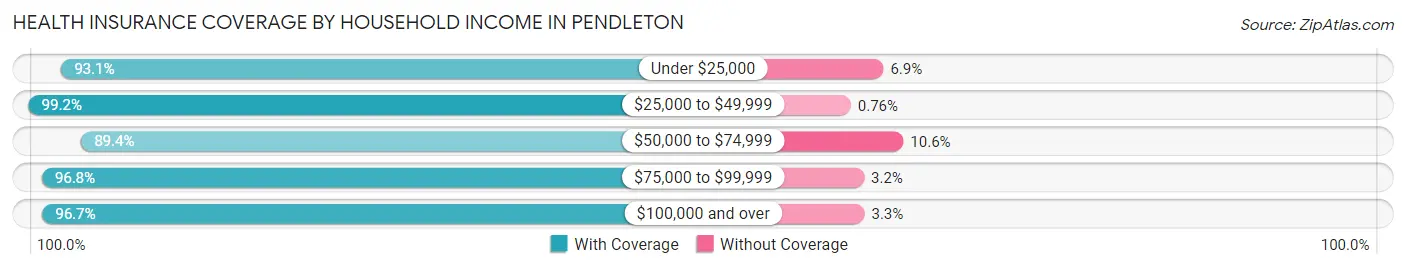
| Household Income | With Coverage | Without Coverage |
| Under $25,000 | 1,951 (93.1%) | 144 (6.9%) |
| $25,000 to $49,999 | 1,960 (99.2%) | 15 (0.8%) |
| $50,000 to $74,999 | 2,528 (89.4%) | 300 (10.6%) |
| $75,000 to $99,999 | 2,416 (96.8%) | 81 (3.2%) |
| $100,000 and over | 5,651 (96.7%) | 194 (3.3%) |
Public vs Private Health Insurance Coverage by Age in Pendleton
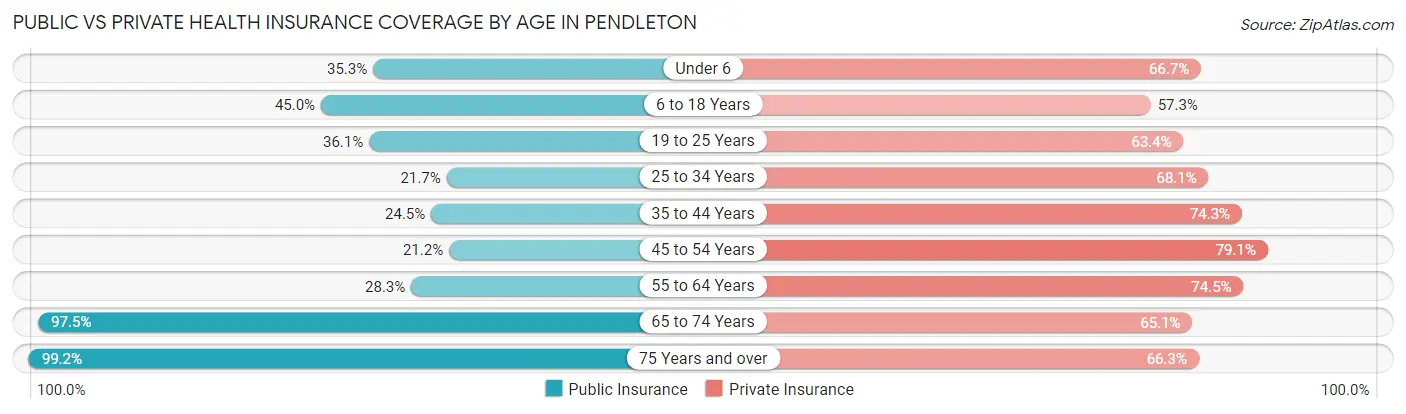
| Age Bracket | Public Insurance | Private Insurance |
| Under 6 | 581 (35.3%) | 1,097 (66.7%) |
| 6 to 18 Years | 1,202 (45.0%) | 1,532 (57.3%) |
| 19 to 25 Years | 419 (36.1%) | 737 (63.4%) |
| 25 to 34 Years | 398 (21.7%) | 1,249 (68.1%) |
| 35 to 44 Years | 515 (24.5%) | 1,559 (74.3%) |
| 45 to 54 Years | 304 (21.2%) | 1,132 (79.0%) |
| 55 to 64 Years | 524 (28.3%) | 1,382 (74.5%) |
| 65 to 74 Years | 1,639 (97.5%) | 1,094 (65.1%) |
| 75 Years and over | 1,020 (99.2%) | 681 (66.2%) |
| Total | 6,602 (42.8%) | 10,463 (67.9%) |
Disability Status by Sex by Age in Pendleton
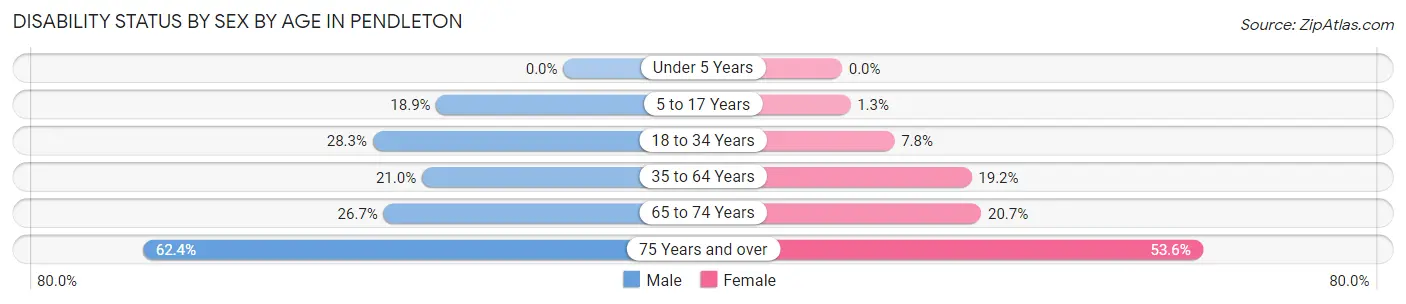
| Age Bracket | Male | Female |
| Under 5 Years | 0 (0.0%) | 0 (0.0%) |
| 5 to 17 Years | 329 (18.9%) | 13 (1.3%) |
| 18 to 34 Years | 525 (28.3%) | 106 (7.8%) |
| 35 to 64 Years | 562 (21.0%) | 521 (19.2%) |
| 65 to 74 Years | 175 (26.7%) | 212 (20.7%) |
| 75 Years and over | 256 (62.4%) | 331 (53.6%) |
Disability Class by Sex by Age in Pendleton
Disability Class: Hearing Difficulty
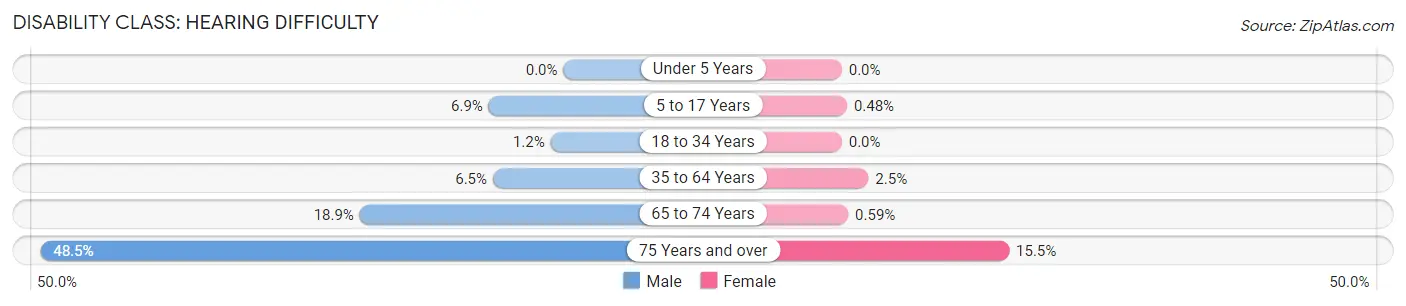
| Age Bracket | Male | Female |
| Under 5 Years | 0 (0.0%) | 0 (0.0%) |
| 5 to 17 Years | 121 (6.9%) | 5 (0.5%) |
| 18 to 34 Years | 22 (1.2%) | 0 (0.0%) |
| 35 to 64 Years | 175 (6.5%) | 67 (2.5%) |
| 65 to 74 Years | 124 (18.9%) | 6 (0.6%) |
| 75 Years and over | 199 (48.5%) | 96 (15.5%) |
Disability Class: Vision Difficulty
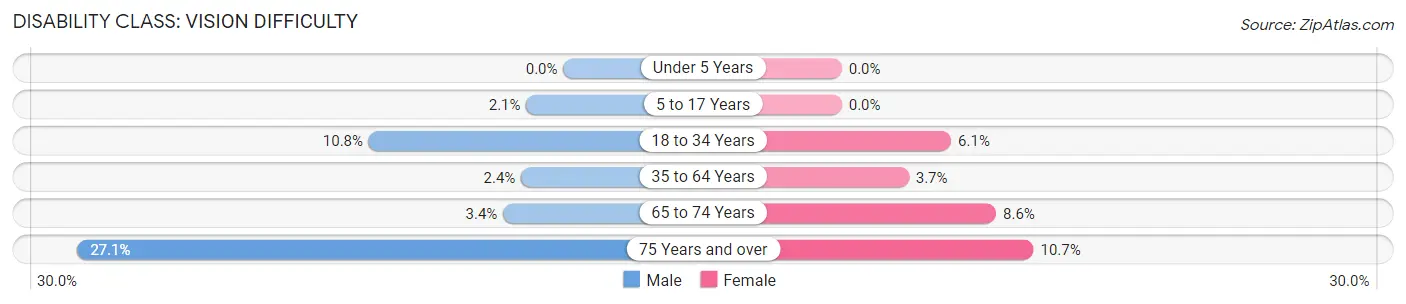
| Age Bracket | Male | Female |
| Under 5 Years | 0 (0.0%) | 0 (0.0%) |
| 5 to 17 Years | 36 (2.1%) | 0 (0.0%) |
| 18 to 34 Years | 201 (10.8%) | 83 (6.1%) |
| 35 to 64 Years | 63 (2.4%) | 101 (3.7%) |
| 65 to 74 Years | 22 (3.4%) | 88 (8.6%) |
| 75 Years and over | 111 (27.1%) | 66 (10.7%) |
Disability Class: Cognitive Difficulty
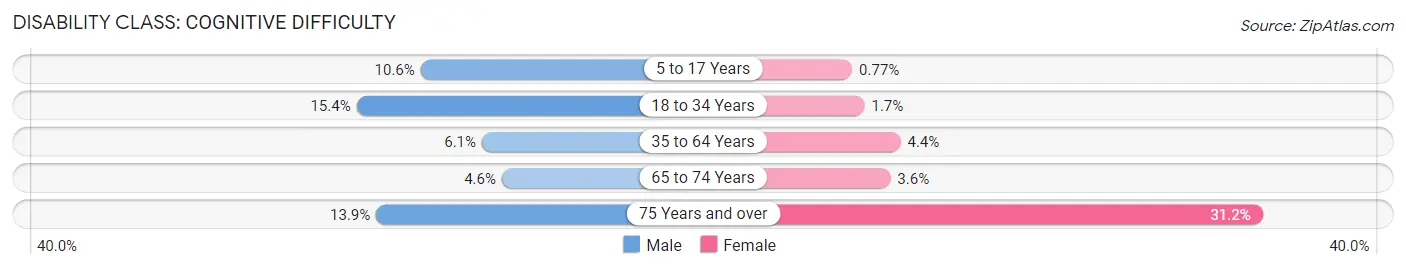
| Age Bracket | Male | Female |
| 5 to 17 Years | 185 (10.6%) | 8 (0.8%) |
| 18 to 34 Years | 285 (15.4%) | 23 (1.7%) |
| 35 to 64 Years | 162 (6.0%) | 118 (4.4%) |
| 65 to 74 Years | 30 (4.6%) | 37 (3.6%) |
| 75 Years and over | 57 (13.9%) | 193 (31.2%) |
Disability Class: Ambulatory Difficulty
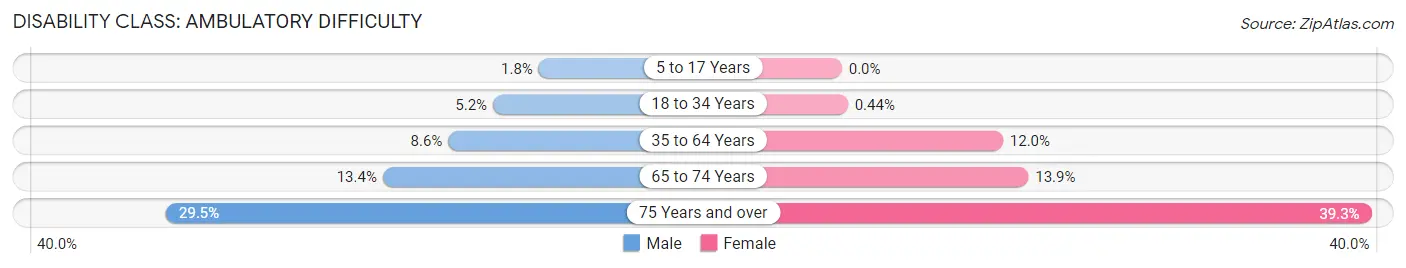
| Age Bracket | Male | Female |
| 5 to 17 Years | 32 (1.8%) | 0 (0.0%) |
| 18 to 34 Years | 97 (5.2%) | 6 (0.4%) |
| 35 to 64 Years | 229 (8.6%) | 324 (12.0%) |
| 65 to 74 Years | 88 (13.4%) | 142 (13.9%) |
| 75 Years and over | 121 (29.5%) | 243 (39.3%) |
Disability Class: Self-Care Difficulty
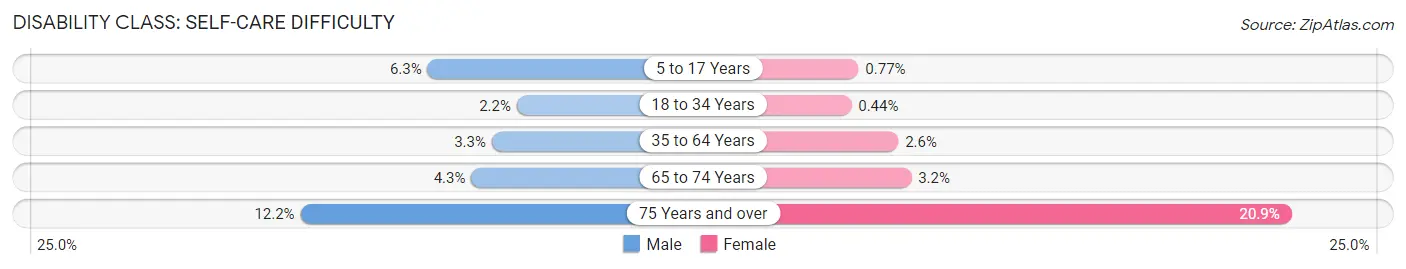
| Age Bracket | Male | Female |
| 5 to 17 Years | 110 (6.3%) | 8 (0.8%) |
| 18 to 34 Years | 40 (2.2%) | 6 (0.4%) |
| 35 to 64 Years | 89 (3.3%) | 71 (2.6%) |
| 65 to 74 Years | 28 (4.3%) | 33 (3.2%) |
| 75 Years and over | 50 (12.2%) | 129 (20.9%) |
Technology Access in Pendleton
Computing Device Access in Pendleton
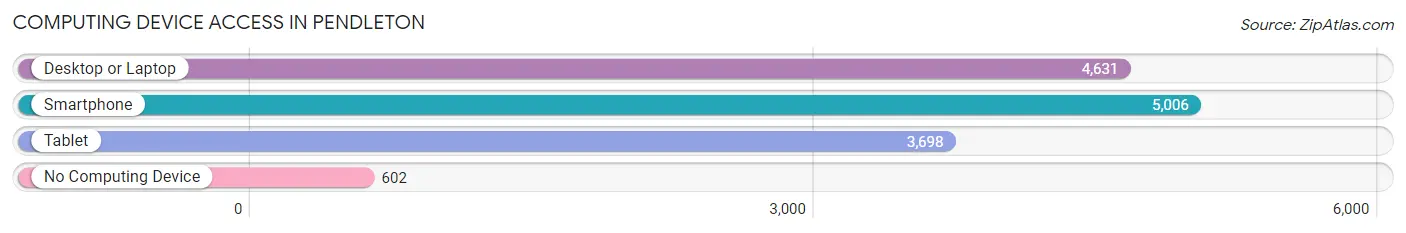
| Device Type | # Households | % Households |
| Desktop or Laptop | 4,631 | 77.8% |
| Smartphone | 5,006 | 84.1% |
| Tablet | 3,698 | 62.2% |
| No Computing Device | 602 | 10.1% |
| Total | 5,950 | 100.0% |
Internet Access in Pendleton
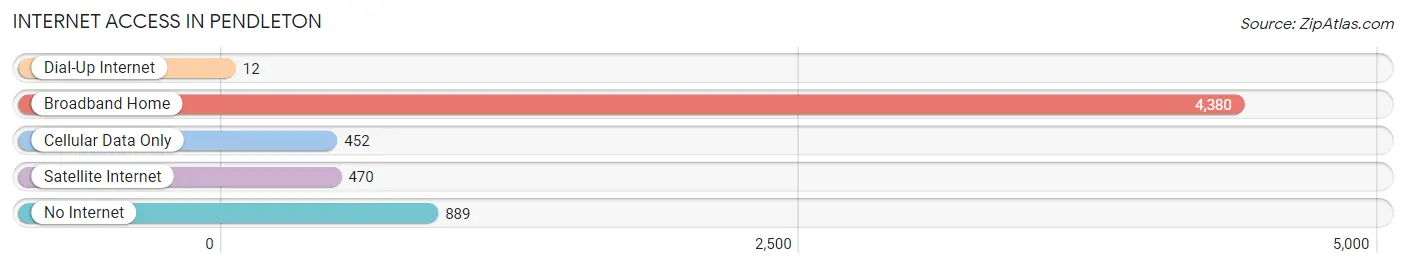
| Internet Type | # Households | % Households |
| Dial-Up Internet | 12 | 0.2% |
| Broadband Home | 4,380 | 73.6% |
| Cellular Data Only | 452 | 7.6% |
| Satellite Internet | 470 | 7.9% |
| No Internet | 889 | 14.9% |
| Total | 5,950 | 100.0% |
Pendleton Summary
Pendleton, Oregon is a small city located in the northeastern corner of the state, in Umatilla County. It is situated at the confluence of the Umatilla and Columbia Rivers, and is the county seat of Umatilla County. The city is known for its rich history, diverse geography, and vibrant economy.
History
Pendleton was founded in 1862 by Dr. William L. Pendleton, a physician and entrepreneur from Virginia. He purchased the land from the Umatilla Indian tribe and established a trading post. The city was incorporated in 1880 and quickly became a hub for the wool industry. The city was also home to the first woolen mill in the Pacific Northwest, which was established in 1868.
The city experienced a period of rapid growth in the late 19th and early 20th centuries, due to the booming wool industry. The city was also home to a number of other industries, including a flour mill, a brewery, and a brickyard.
In the early 20th century, Pendleton was a major stop on the Oregon Trail, and the city was home to a number of famous travelers, including the famous explorer Meriwether Lewis. The city was also home to a number of famous outlaws, including the infamous Butch Cassidy.
Geography
Pendleton is located in the northeastern corner of Oregon, in Umatilla County. The city is situated at the confluence of the Umatilla and Columbia Rivers. The city is surrounded by rolling hills and is located in the foothills of the Blue Mountains. The city is located in a semi-arid climate, with hot summers and cold winters.
The city is home to a number of parks and recreational areas, including the Pendleton Riverfront Park, which offers a variety of outdoor activities, including fishing, boating, and hiking. The city is also home to a number of historic sites, including the Pendleton Woolen Mills, the Pendleton Round-Up, and the Pendleton Underground Tours.
Economy
Pendleton’s economy is largely based on agriculture and tourism. The city is home to a number of agricultural businesses, including a number of wineries, a dairy, and a number of fruit and vegetable farms. The city is also home to a number of manufacturing businesses, including a number of food processing plants.
The city is also home to a number of tourist attractions, including the Pendleton Woolen Mills, the Pendleton Round-Up, and the Pendleton Underground Tours. The city is also home to a number of festivals and events, including the Pendleton Round-Up and the Pendleton Whisky Festival.
Demographics
As of the 2010 census, the population of Pendleton was 16,612. The city has a population density of 1,845 people per square mile. The median age of the population is 36.7 years, and the median household income is $41,945. The city is predominantly white, with a population that is 88.3% white, 5.2% Hispanic or Latino, and 4.2% Native American. The city is also home to a number of other ethnicities, including Asian, African American, and Pacific Islander.
Common Questions
What is Per Capita Income in Pendleton?
Per Capita income in Pendleton is $28,841.
What is the Median Family Income in Pendleton?
Median Family Income in Pendleton is $83,052.
What is the Median Household income in Pendleton?
Median Household Income in Pendleton is $67,931.
What is Income or Wage Gap in Pendleton?
Income or Wage Gap in Pendleton is 2.9%.
Women in Pendleton earn 97.1 cents for every dollar earned by a man.
What is Family Income Deficit in Pendleton?
Family Income Deficit in Pendleton is $11,243.
Families that are below poverty line in Pendleton earn $11,243 less on average than the poverty threshold level.
What is Inequality or Gini Index in Pendleton?
Inequality or Gini Index in Pendleton is 0.42.
What is the Total Population of Pendleton?
Total Population of Pendleton is 17,005.
What is the Total Male Population of Pendleton?
Total Male Population of Pendleton is 9,578.
What is the Total Female Population of Pendleton?
Total Female Population of Pendleton is 7,427.
What is the Ratio of Males per 100 Females in Pendleton?
There are 128.96 Males per 100 Females in Pendleton.
What is the Ratio of Females per 100 Males in Pendleton?
There are 77.54 Females per 100 Males in Pendleton.
What is the Median Population Age in Pendleton?
Median Population Age in Pendleton is 37.4 Years.
What is the Average Family Size in Pendleton
Average Family Size in Pendleton is 3.2 People.
What is the Average Household Size in Pendleton
Average Household Size in Pendleton is 2.6 People.
How Large is the Labor Force in Pendleton?
There are 7,385 People in the Labor Forcein in Pendleton.
What is the Percentage of People in the Labor Force in Pendleton?
55.5% of People are in the Labor Force in Pendleton.
What is the Unemployment Rate in Pendleton?
Unemployment Rate in Pendleton is 7.4%.