First Mesa, AZ Map & Demographics
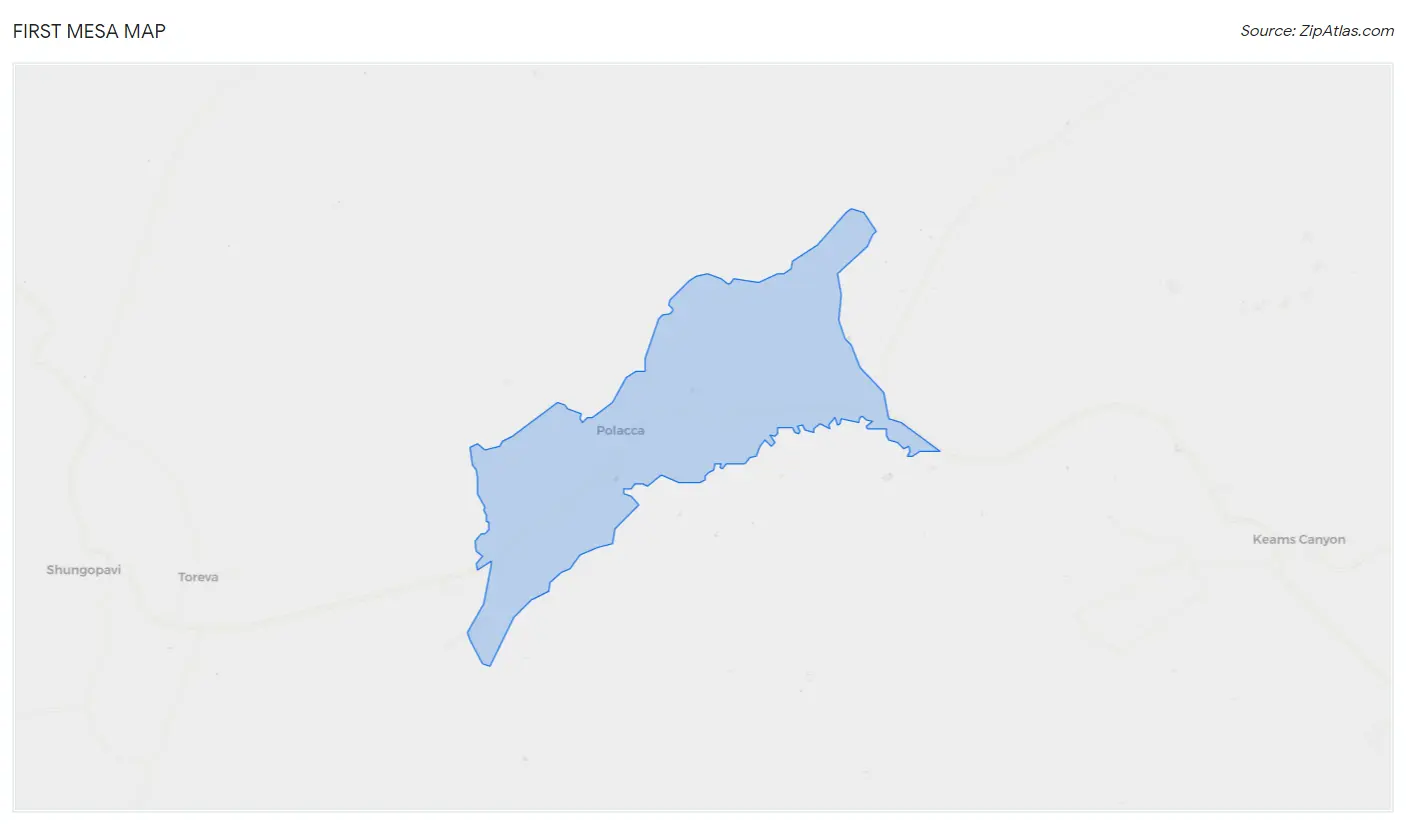
First Mesa Map
First Mesa Overview
$17,054
PER CAPITA INCOME
$52,500
AVG FAMILY INCOME
$53,229
AVG HOUSEHOLD INCOME
11.3%
WAGE / INCOME GAP [ % ]
88.7¢/ $1
WAGE / INCOME GAP [ $ ]
0.47
INEQUALITY / GINI INDEX
1,454
TOTAL POPULATION
717
MALE POPULATION
737
FEMALE POPULATION
97.29
MALES / 100 FEMALES
102.79
FEMALES / 100 MALES
29.6
MEDIAN AGE
3.8
AVG FAMILY SIZE
3.4
AVG HOUSEHOLD SIZE
462
LABOR FORCE [ PEOPLE ]
47.6%
PERCENT IN LABOR FORCE
5.6%
UNEMPLOYMENT RATE
Income in First Mesa
Income Overview in First Mesa
Per Capita Income in First Mesa is $17,054, while median incomes of families and households are $52,500 and $53,229 respectively.
| Characteristic | Number | Measure |
| Per Capita Income | 1,454 | $17,054 |
| Median Family Income | 350 | $52,500 |
| Mean Family Income | 350 | $71,689 |
| Median Household Income | 427 | $53,229 |
| Mean Household Income | 427 | $68,251 |
| Income Deficit | 350 | $0 |
| Wage / Income Gap (%) | 1,454 | 11.26% |
| Wage / Income Gap ($) | 1,454 | 88.74¢ per $1 |
| Gini / Inequality Index | 1,454 | 0.47 |
Earnings by Sex in First Mesa
Average Earnings in First Mesa are $27,054, $29,514 for men and $26,190 for women, a difference of 11.3%.
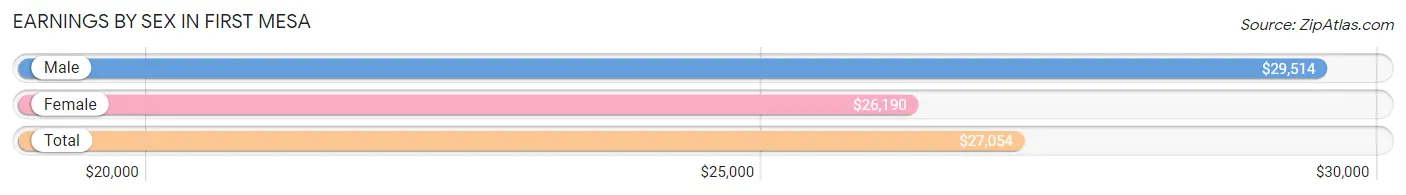
| Sex | Number | Average Earnings |
| Male | 239 (49.1%) | $29,514 |
| Female | 248 (50.9%) | $26,190 |
| Total | 487 (100.0%) | $27,054 |
Earnings by Sex by Income Bracket in First Mesa
The most common earnings brackets in First Mesa are $22,500 to $24,999 for men (38 | 15.9%) and $25,000 to $29,999 for women (78 | 31.5%).
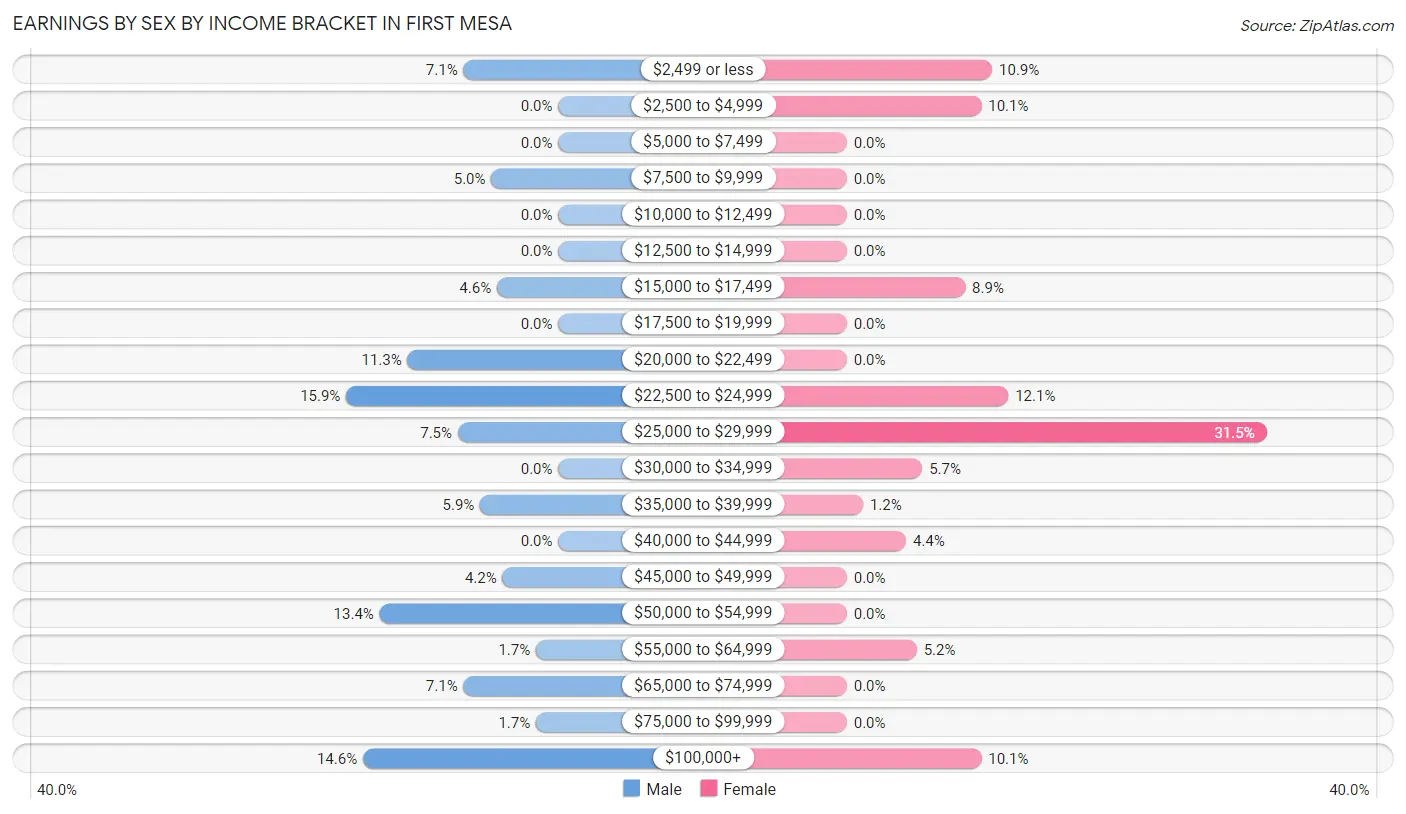
| Income | Male | Female |
| $2,499 or less | 17 (7.1%) | 27 (10.9%) |
| $2,500 to $4,999 | 0 (0.0%) | 25 (10.1%) |
| $5,000 to $7,499 | 0 (0.0%) | 0 (0.0%) |
| $7,500 to $9,999 | 12 (5.0%) | 0 (0.0%) |
| $10,000 to $12,499 | 0 (0.0%) | 0 (0.0%) |
| $12,500 to $14,999 | 0 (0.0%) | 0 (0.0%) |
| $15,000 to $17,499 | 11 (4.6%) | 22 (8.9%) |
| $17,500 to $19,999 | 0 (0.0%) | 0 (0.0%) |
| $20,000 to $22,499 | 27 (11.3%) | 0 (0.0%) |
| $22,500 to $24,999 | 38 (15.9%) | 30 (12.1%) |
| $25,000 to $29,999 | 18 (7.5%) | 78 (31.5%) |
| $30,000 to $34,999 | 0 (0.0%) | 14 (5.7%) |
| $35,000 to $39,999 | 14 (5.9%) | 3 (1.2%) |
| $40,000 to $44,999 | 0 (0.0%) | 11 (4.4%) |
| $45,000 to $49,999 | 10 (4.2%) | 0 (0.0%) |
| $50,000 to $54,999 | 32 (13.4%) | 0 (0.0%) |
| $55,000 to $64,999 | 4 (1.7%) | 13 (5.2%) |
| $65,000 to $74,999 | 17 (7.1%) | 0 (0.0%) |
| $75,000 to $99,999 | 4 (1.7%) | 0 (0.0%) |
| $100,000+ | 35 (14.6%) | 25 (10.1%) |
| Total | 239 (100.0%) | 248 (100.0%) |
Earnings by Sex by Educational Attainment in First Mesa
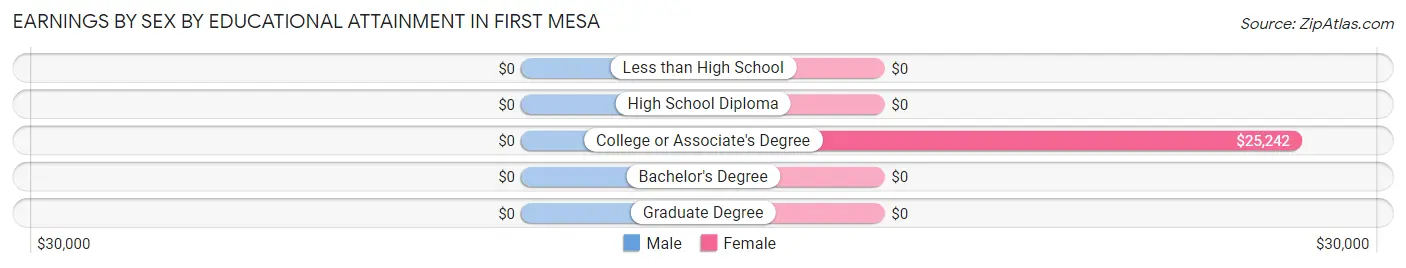
| Educational Attainment | Male Income | Female Income |
| Less than High School | - | - |
| High School Diploma | - | - |
| College or Associate's Degree | - | - |
| Bachelor's Degree | - | - |
| Graduate Degree | - | - |
| Total | $35,893 | $26,190 |
Family Income in First Mesa
Family Income Brackets in First Mesa
According to the First Mesa family income data, there are 81 families falling into the $50,000 to $74,999 income range, which is the most common income bracket and makes up 23.1% of all families.
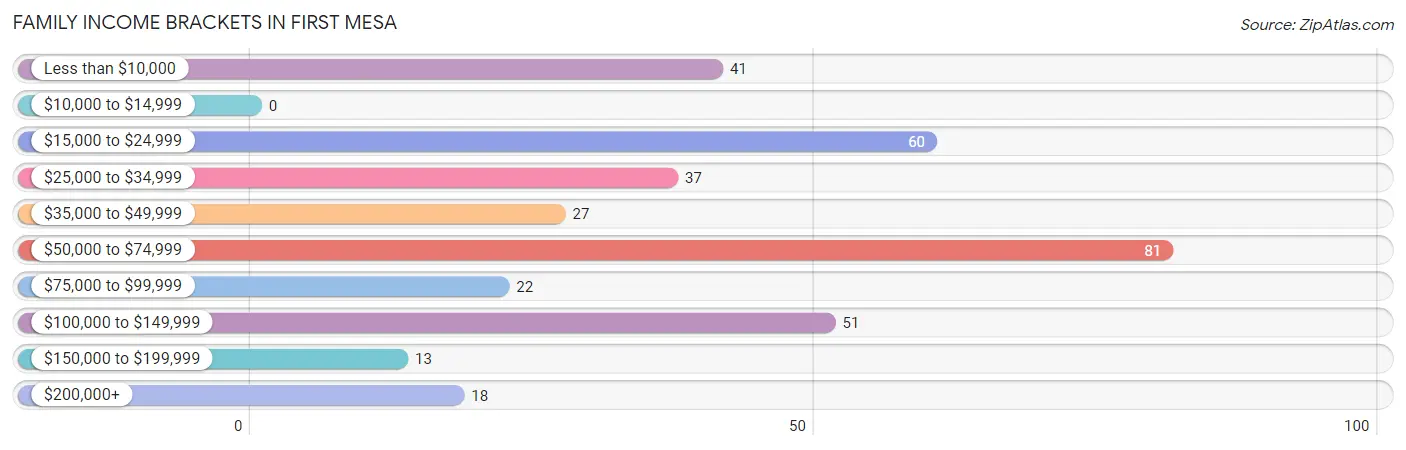
| Income Bracket | # Families | % Families |
| Less than $10,000 | 41 | 11.7% |
| $10,000 to $14,999 | 0 | 0.0% |
| $15,000 to $24,999 | 60 | 17.1% |
| $25,000 to $34,999 | 37 | 10.6% |
| $35,000 to $49,999 | 27 | 7.7% |
| $50,000 to $74,999 | 81 | 23.1% |
| $75,000 to $99,999 | 22 | 6.3% |
| $100,000 to $149,999 | 51 | 14.6% |
| $150,000 to $199,999 | 13 | 3.7% |
| $200,000+ | 18 | 5.1% |
Family Income by Famaliy Size in First Mesa
4-person families (106 | 30.3%) account for the highest median family income in First Mesa with $57,500 per family, while 4-person families (106 | 30.3%) have the highest median income of $14,375 per family member.
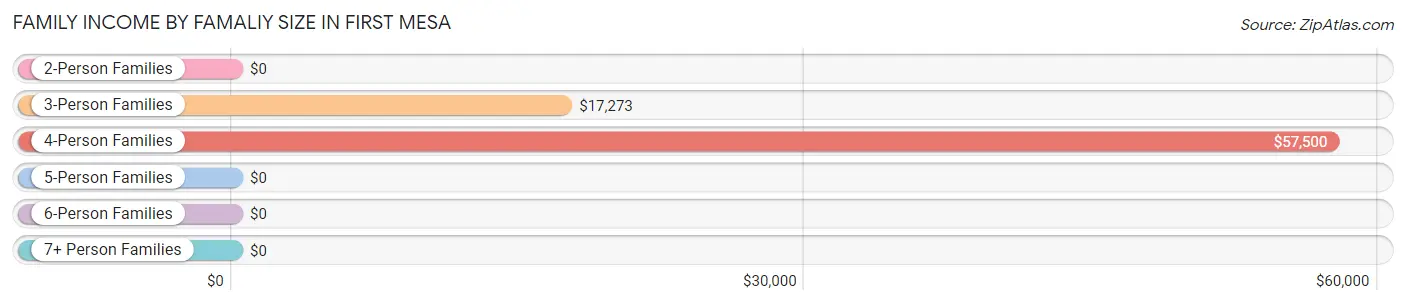
| Income Bracket | # Families | Median Income |
| 2-Person Families | 66 (18.9%) | $0 |
| 3-Person Families | 94 (26.9%) | $17,273 |
| 4-Person Families | 106 (30.3%) | $57,500 |
| 5-Person Families | 11 (3.1%) | $0 |
| 6-Person Families | 25 (7.1%) | $0 |
| 7+ Person Families | 48 (13.7%) | $0 |
| Total | 350 (100.0%) | $52,500 |
Family Income by Number of Earners in First Mesa
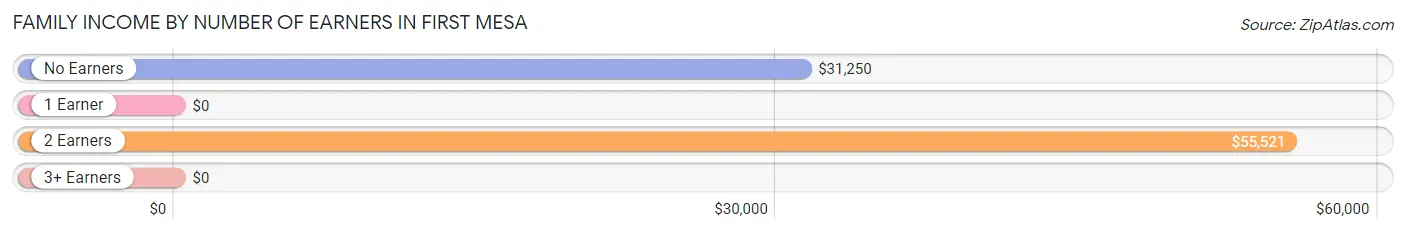
| Number of Earners | # Families | Median Income |
| No Earners | 52 (14.9%) | $31,250 |
| 1 Earner | 170 (48.6%) | $0 |
| 2 Earners | 115 (32.9%) | $55,521 |
| 3+ Earners | 13 (3.7%) | $0 |
| Total | 350 (100.0%) | $52,500 |
Household Income in First Mesa
Household Income Brackets in First Mesa
With 130 households falling in the category, the $50,000 to $74,999 income range is the most frequent in First Mesa, accounting for 30.4% of all households. In contrast, only 13 households (3.0%) fall into the $150,000 to $199,999 income bracket, making it the least populous group.
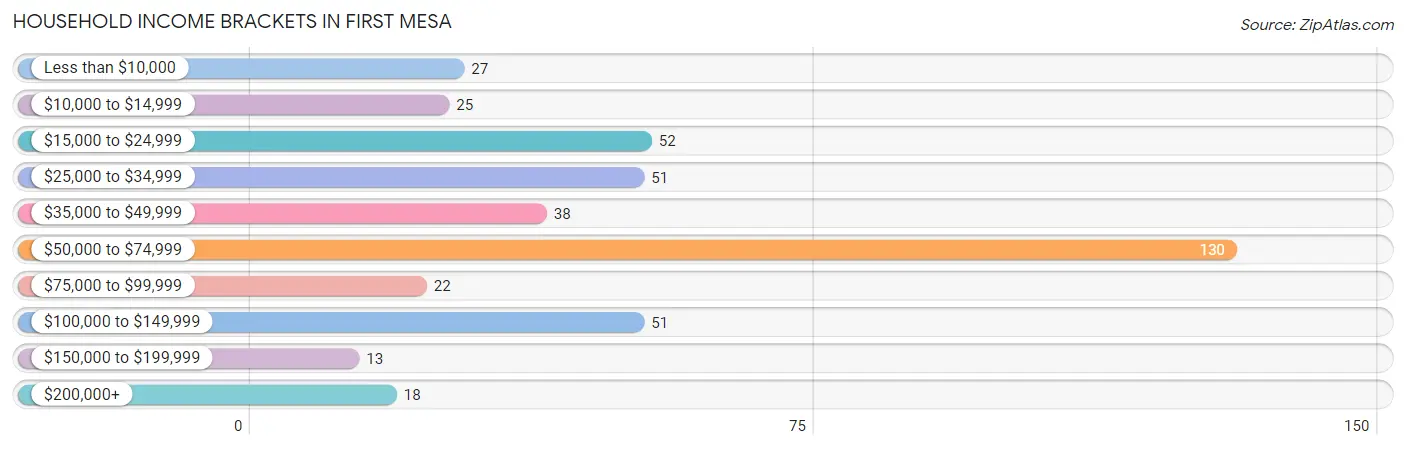
| Income Bracket | # Households | % Households |
| Less than $10,000 | 27 | 6.3% |
| $10,000 to $14,999 | 25 | 5.9% |
| $15,000 to $24,999 | 52 | 12.2% |
| $25,000 to $34,999 | 51 | 11.9% |
| $35,000 to $49,999 | 38 | 8.9% |
| $50,000 to $74,999 | 130 | 30.4% |
| $75,000 to $99,999 | 22 | 5.2% |
| $100,000 to $149,999 | 51 | 11.9% |
| $150,000 to $199,999 | 13 | 3.0% |
| $200,000+ | 18 | 4.2% |
Household Income by Householder Age in First Mesa
The median household income in First Mesa is $53,229, with the highest median household income of $63,194 found in the 65+ years age bracket for the primary householder. A total of 166 households (38.9%) fall into this category. Meanwhile, the 15 to 24 years age bracket for the primary householder has the lowest median household income of $0, with 14 households (3.3%) in this group.
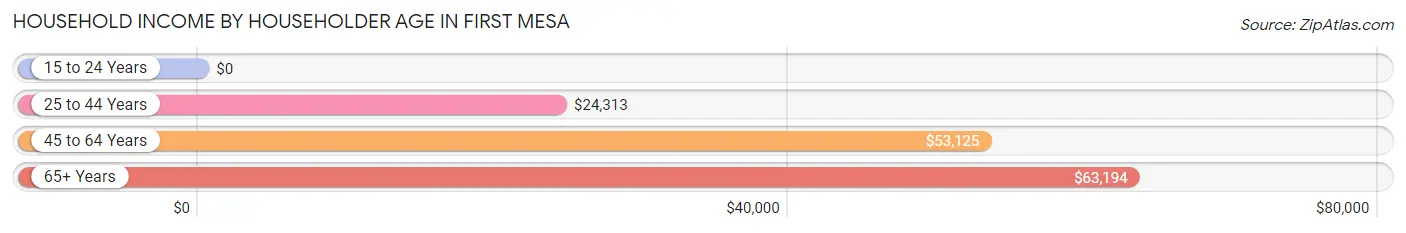
| Income Bracket | # Households | Median Income |
| 15 to 24 Years | 14 (3.3%) | $0 |
| 25 to 44 Years | 101 (23.6%) | $24,313 |
| 45 to 64 Years | 146 (34.2%) | $53,125 |
| 65+ Years | 166 (38.9%) | $63,194 |
| Total | 427 (100.0%) | $53,229 |
Poverty in First Mesa
Income Below Poverty by Sex and Age in First Mesa
With 22.5% poverty level for males and 16.6% for females among the residents of First Mesa, 18 to 24 year old males and 6 to 11 year old females are the most vulnerable to poverty, with 33 males (51.6%) and 46 females (36.2%) in their respective age groups living below the poverty level.
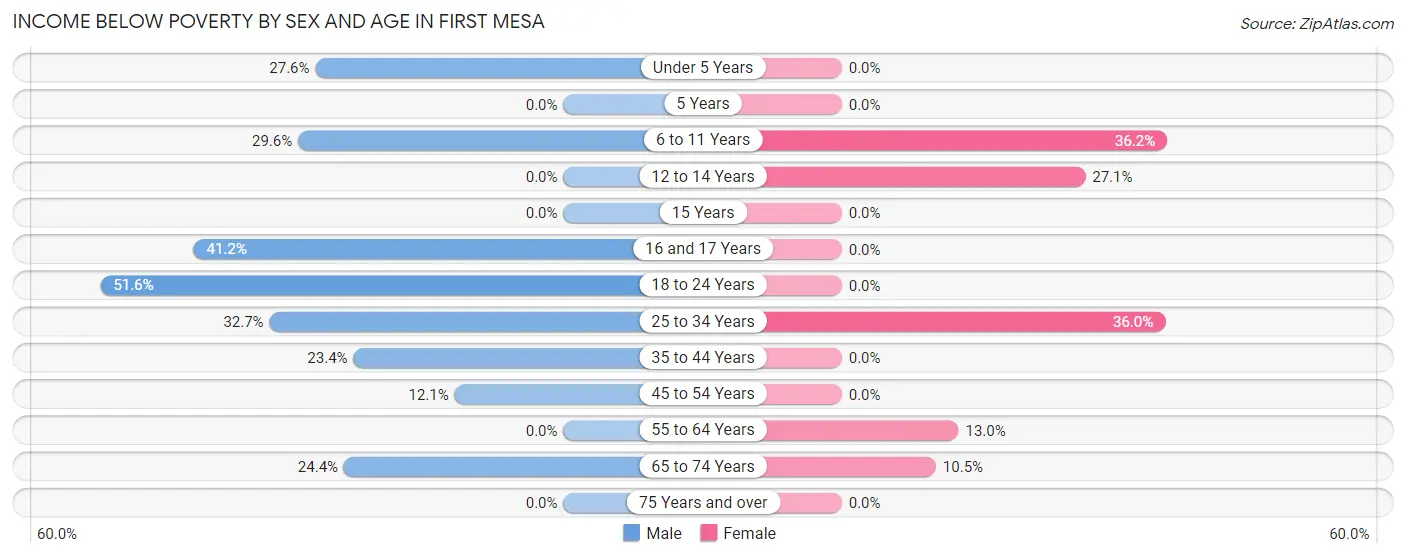
| Age Bracket | Male | Female |
| Under 5 Years | 29 (27.6%) | 0 (0.0%) |
| 5 Years | 0 (0.0%) | 0 (0.0%) |
| 6 to 11 Years | 26 (29.5%) | 46 (36.2%) |
| 12 to 14 Years | 0 (0.0%) | 16 (27.1%) |
| 15 Years | 0 (0.0%) | 0 (0.0%) |
| 16 and 17 Years | 14 (41.2%) | 0 (0.0%) |
| 18 to 24 Years | 33 (51.6%) | 0 (0.0%) |
| 25 to 34 Years | 18 (32.7%) | 36 (36.0%) |
| 35 to 44 Years | 18 (23.4%) | 0 (0.0%) |
| 45 to 54 Years | 12 (12.1%) | 0 (0.0%) |
| 55 to 64 Years | 0 (0.0%) | 13 (13.0%) |
| 65 to 74 Years | 11 (24.4%) | 11 (10.5%) |
| 75 Years and over | 0 (0.0%) | 0 (0.0%) |
| Total | 161 (22.5%) | 122 (16.6%) |
Income Above Poverty by Sex and Age in First Mesa
According to the poverty statistics in First Mesa, males aged 5 years and females aged under 5 years are the age groups that are most secure financially, with 100.0% of males and 100.0% of females in these age groups living above the poverty line.
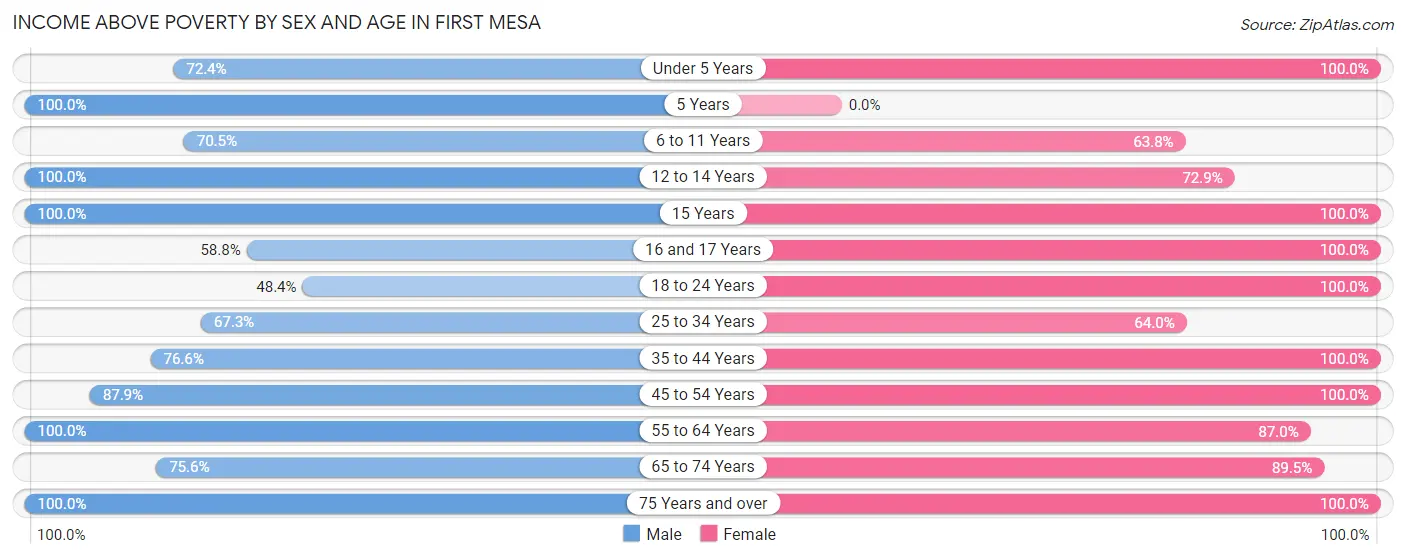
| Age Bracket | Male | Female |
| Under 5 Years | 76 (72.4%) | 27 (100.0%) |
| 5 Years | 12 (100.0%) | 0 (0.0%) |
| 6 to 11 Years | 62 (70.5%) | 81 (63.8%) |
| 12 to 14 Years | 38 (100.0%) | 43 (72.9%) |
| 15 Years | 13 (100.0%) | 15 (100.0%) |
| 16 and 17 Years | 20 (58.8%) | 16 (100.0%) |
| 18 to 24 Years | 31 (48.4%) | 27 (100.0%) |
| 25 to 34 Years | 37 (67.3%) | 64 (64.0%) |
| 35 to 44 Years | 59 (76.6%) | 83 (100.0%) |
| 45 to 54 Years | 87 (87.9%) | 65 (100.0%) |
| 55 to 64 Years | 40 (100.0%) | 87 (87.0%) |
| 65 to 74 Years | 34 (75.6%) | 94 (89.5%) |
| 75 Years and over | 47 (100.0%) | 13 (100.0%) |
| Total | 556 (77.5%) | 615 (83.5%) |
Income Below Poverty Among Married-Couple Families in First Mesa
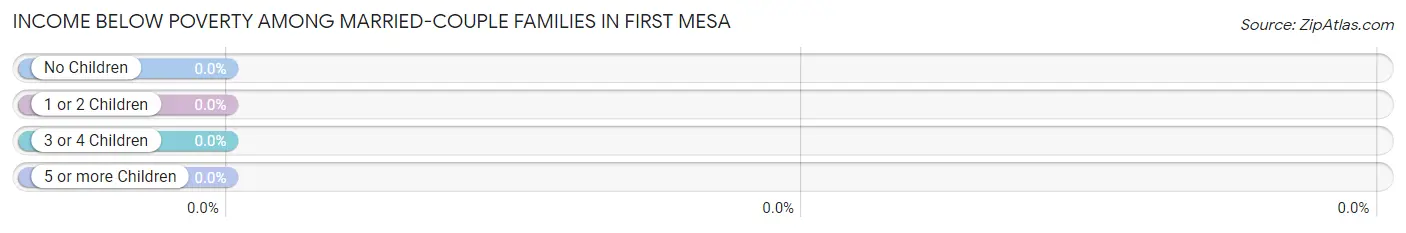
| Children | Above Poverty | Below Poverty |
| No Children | 40 (100.0%) | 0 (0.0%) |
| 1 or 2 Children | 91 (100.0%) | 0 (0.0%) |
| 3 or 4 Children | 0 (0.0%) | 0 (0.0%) |
| 5 or more Children | 0 (0.0%) | 0 (0.0%) |
| Total | 131 (100.0%) | 0 (0.0%) |
Income Below Poverty Among Single-Parent Households in First Mesa
According to the poverty data in First Mesa, 18.4% or 14 single-father households and 34.3% or 49 single-mother households are living below the poverty line. Among single-father households, those with 3 or 4 children have the highest poverty rate, with 14 households (100.0%) experiencing poverty. Likewise, among single-mother households, those with no children have the highest poverty rate, with 13 households (100.0%) falling below the poverty line.
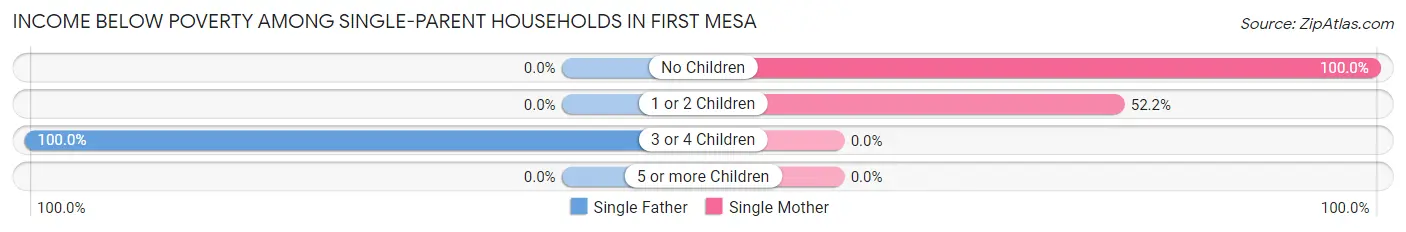
| Children | Single Father | Single Mother |
| No Children | 0 (0.0%) | 13 (100.0%) |
| 1 or 2 Children | 0 (0.0%) | 36 (52.2%) |
| 3 or 4 Children | 14 (100.0%) | 0 (0.0%) |
| 5 or more Children | 0 (0.0%) | 0 (0.0%) |
| Total | 14 (18.4%) | 49 (34.3%) |
Income Below Poverty Among Married-Couple vs Single-Parent Households in First Mesa
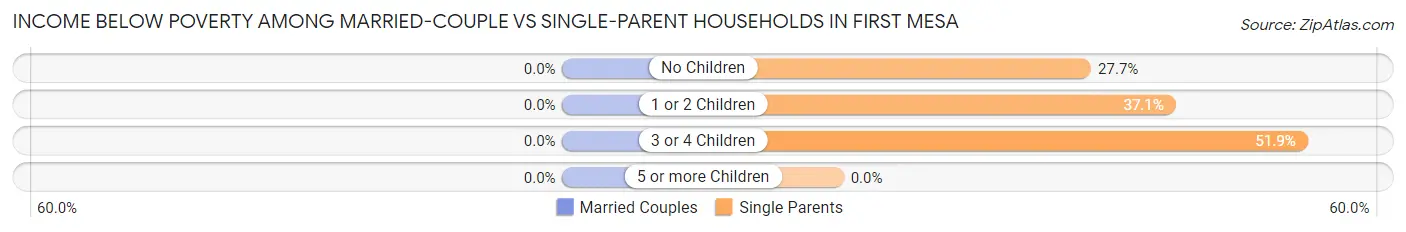
| Children | Married-Couple Families | Single-Parent Households |
| No Children | 0 (0.0%) | 13 (27.7%) |
| 1 or 2 Children | 0 (0.0%) | 36 (37.1%) |
| 3 or 4 Children | 0 (0.0%) | 14 (51.8%) |
| 5 or more Children | 0 (0.0%) | 0 (0.0%) |
| Total | 0 (0.0%) | 63 (28.8%) |
Race in First Mesa
The most populous races in First Mesa are Native / Alaskan (1,445 | 99.4%), Hispanic or Latino (108 | 7.4%), and White / Caucasian (9 | 0.6%).
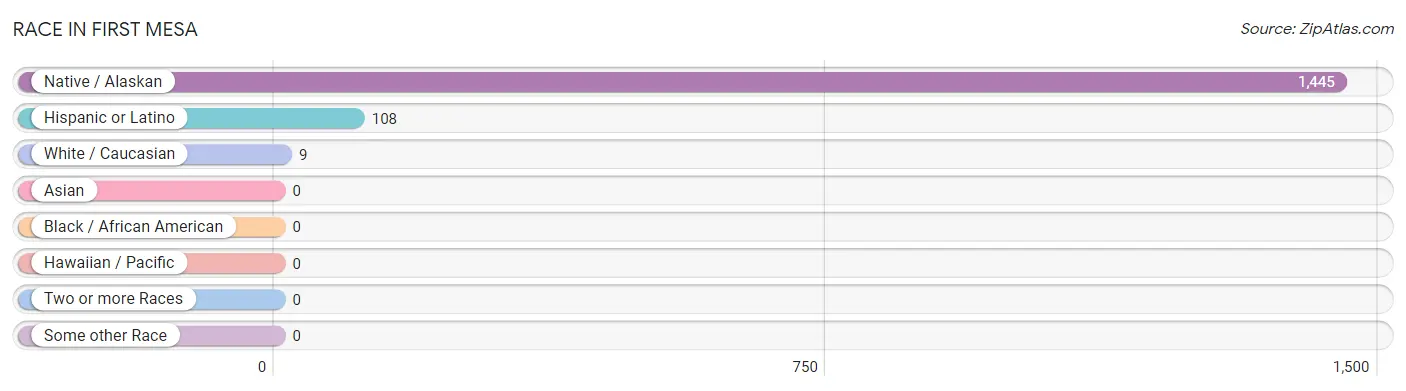
| Race | # Population | % Population |
| Asian | 0 | 0.0% |
| Black / African American | 0 | 0.0% |
| Hawaiian / Pacific | 0 | 0.0% |
| Hispanic or Latino | 108 | 7.4% |
| Native / Alaskan | 1,445 | 99.4% |
| White / Caucasian | 9 | 0.6% |
| Two or more Races | 0 | 0.0% |
| Some other Race | 0 | 0.0% |
| Total | 1,454 | 100.0% |
Ancestry in First Mesa
The most populous ancestries reported in First Mesa are Hopi (1,254 | 86.2%), Pueblo (80 | 5.5%), Sioux (80 | 5.5%), Navajo (63 | 4.3%), and Mexican (44 | 3.0%), together accounting for 104.6% of all First Mesa residents.
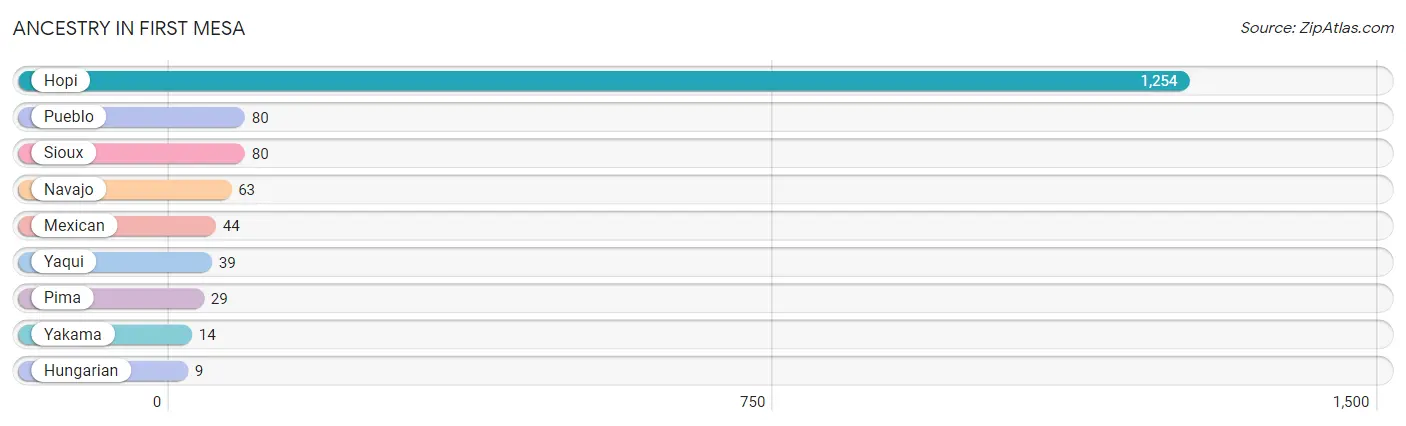
| Ancestry | # Population | % Population |
| Hopi | 1,254 | 86.2% |
| Hungarian | 9 | 0.6% |
| Mexican | 44 | 3.0% |
| Navajo | 63 | 4.3% |
| Pima | 29 | 2.0% |
| Pueblo | 80 | 5.5% |
| Sioux | 80 | 5.5% |
| Yakama | 14 | 1.0% |
| Yaqui | 39 | 2.7% | View All 9 Rows |
Immigrants in First Mesa

| Immigration Origin | # Population | % Population | View All 0 Rows |
Sex and Age in First Mesa
Sex and Age in First Mesa
The most populous age groups in First Mesa are Under 5 Years (105 | 14.6%) for men and 5 to 9 Years (99 | 13.4%) for women.
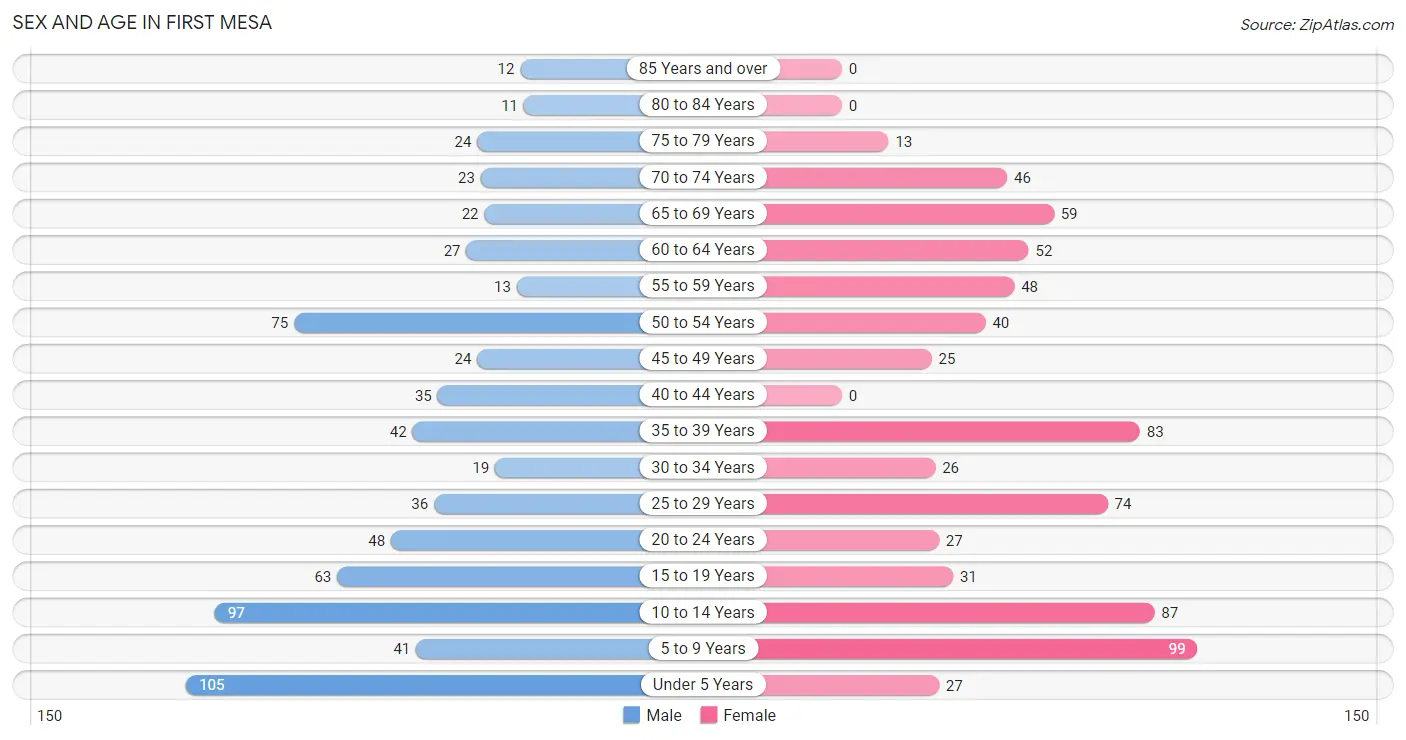
| Age Bracket | Male | Female |
| Under 5 Years | 105 (14.6%) | 27 (3.7%) |
| 5 to 9 Years | 41 (5.7%) | 99 (13.4%) |
| 10 to 14 Years | 97 (13.5%) | 87 (11.8%) |
| 15 to 19 Years | 63 (8.8%) | 31 (4.2%) |
| 20 to 24 Years | 48 (6.7%) | 27 (3.7%) |
| 25 to 29 Years | 36 (5.0%) | 74 (10.0%) |
| 30 to 34 Years | 19 (2.6%) | 26 (3.5%) |
| 35 to 39 Years | 42 (5.9%) | 83 (11.3%) |
| 40 to 44 Years | 35 (4.9%) | 0 (0.0%) |
| 45 to 49 Years | 24 (3.4%) | 25 (3.4%) |
| 50 to 54 Years | 75 (10.5%) | 40 (5.4%) |
| 55 to 59 Years | 13 (1.8%) | 48 (6.5%) |
| 60 to 64 Years | 27 (3.8%) | 52 (7.1%) |
| 65 to 69 Years | 22 (3.1%) | 59 (8.0%) |
| 70 to 74 Years | 23 (3.2%) | 46 (6.2%) |
| 75 to 79 Years | 24 (3.4%) | 13 (1.8%) |
| 80 to 84 Years | 11 (1.5%) | 0 (0.0%) |
| 85 Years and over | 12 (1.7%) | 0 (0.0%) |
| Total | 717 (100.0%) | 737 (100.0%) |
Families and Households in First Mesa
Median Family Size in First Mesa
The median family size in First Mesa is 3.75 persons per family, with married-couple families (131 | 37.4%) accounting for the largest median family size of 4.02 persons per family. On the other hand, single male/father families (76 | 21.7%) represent the smallest median family size with 3.37 persons per family.
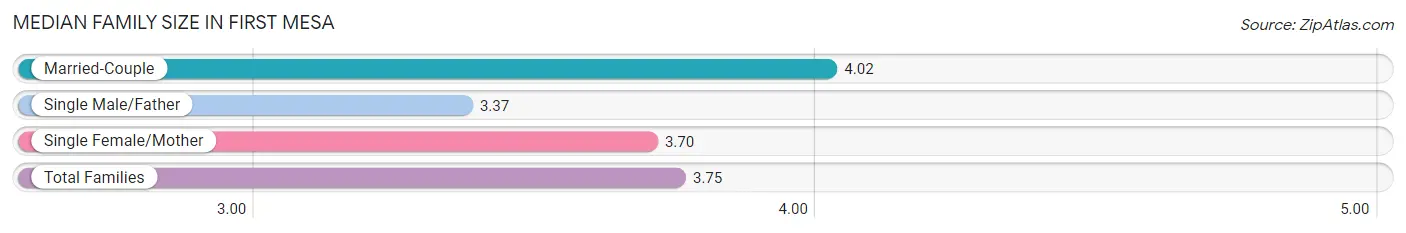
| Family Type | # Families | Family Size |
| Married-Couple | 131 (37.4%) | 4.02 |
| Single Male/Father | 76 (21.7%) | 3.37 |
| Single Female/Mother | 143 (40.9%) | 3.70 |
| Total Families | 350 (100.0%) | 3.75 |
Median Household Size in First Mesa
The median household size in First Mesa is 3.41 persons per household, with married-couple households (131 | 30.7%) accounting for the largest median household size of 4.02 persons per household. non-family households (77 | 18.0%) represent the smallest median household size with 1.29 persons per household.
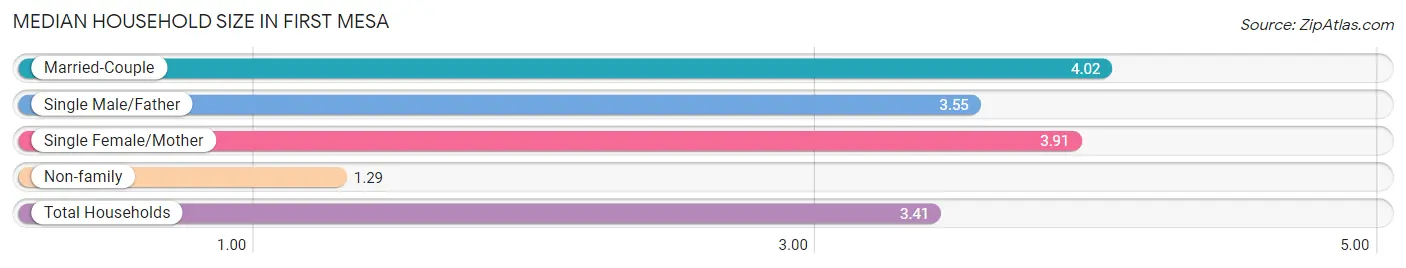
| Household Type | # Households | Household Size |
| Married-Couple | 131 (30.7%) | 4.02 |
| Single Male/Father | 76 (17.8%) | 3.55 |
| Single Female/Mother | 143 (33.5%) | 3.91 |
| Non-family | 77 (18.0%) | 1.29 |
| Total Households | 427 (100.0%) | 3.41 |
Household Size by Marriage Status in First Mesa
Out of a total of 427 households in First Mesa, 350 (82.0%) are family households, while 77 (18.0%) are nonfamily households. The most numerous type of family households are 4-person households, comprising 120, and the most common type of nonfamily households are 1-person households, comprising 52.
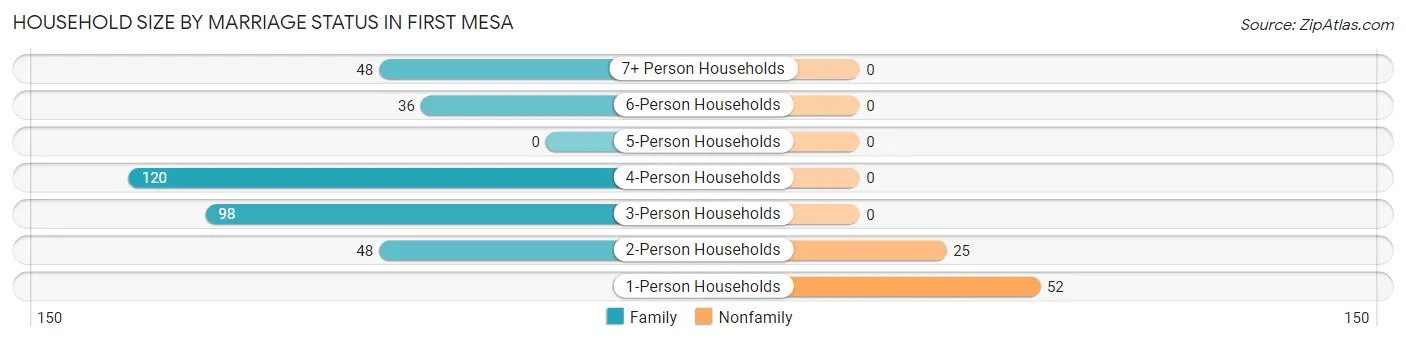
| Household Size | Family Households | Nonfamily Households |
| 1-Person Households | - | 52 (12.2%) |
| 2-Person Households | 48 (11.2%) | 25 (5.9%) |
| 3-Person Households | 98 (23.0%) | 0 (0.0%) |
| 4-Person Households | 120 (28.1%) | 0 (0.0%) |
| 5-Person Households | 0 (0.0%) | 0 (0.0%) |
| 6-Person Households | 36 (8.4%) | 0 (0.0%) |
| 7+ Person Households | 48 (11.2%) | 0 (0.0%) |
| Total | 350 (82.0%) | 77 (18.0%) |
Female Fertility in First Mesa
Fertility by Age in First Mesa
Average fertility rate in First Mesa is 128.0 births per 1,000 women. Women in the age bracket of 35 to 50 years have the highest fertility rate with 167.0 births per 1,000 women. Women in the age bracket of 35 to 50 years acount for 52.9% of all women with births.
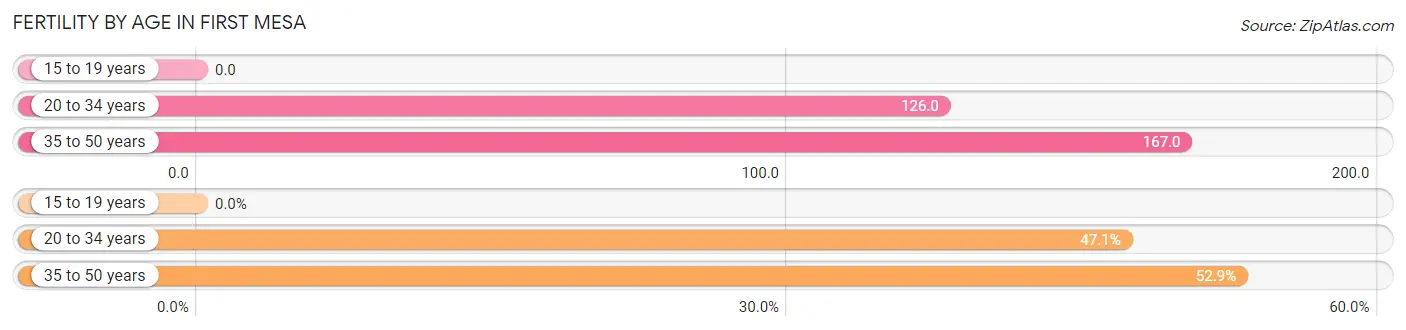
| Age Bracket | Women with Births | Births / 1,000 Women |
| 15 to 19 years | 0 (0.0%) | 0.0 |
| 20 to 34 years | 16 (47.1%) | 126.0 |
| 35 to 50 years | 18 (52.9%) | 167.0 |
| Total | 34 (100.0%) | 128.0 |
Fertility by Age by Marriage Status in First Mesa
52.9% of women with births (34) in First Mesa are married. The highest percentage of unmarried women with births falls into 20 to 34 years age bracket with 100.0% of them unmarried at the time of birth, while the lowest percentage of unmarried women with births belong to 35 to 50 years age bracket with 0.0% of them unmarried.
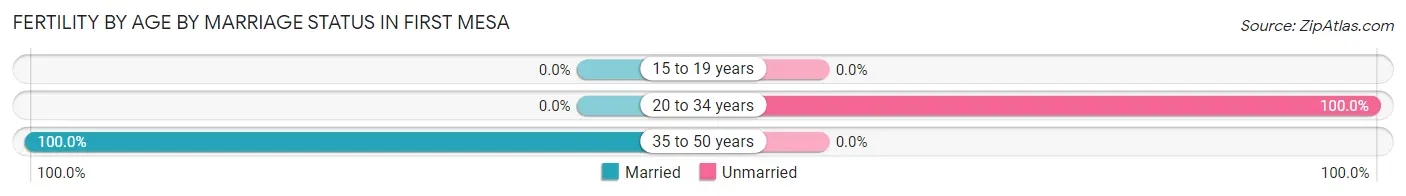
| Age Bracket | Married | Unmarried |
| 15 to 19 years | 0 (0.0%) | 0 (0.0%) |
| 20 to 34 years | 0 (0.0%) | 16 (100.0%) |
| 35 to 50 years | 18 (100.0%) | 0 (0.0%) |
| Total | 18 (52.9%) | 16 (47.1%) |
Fertility by Education in First Mesa
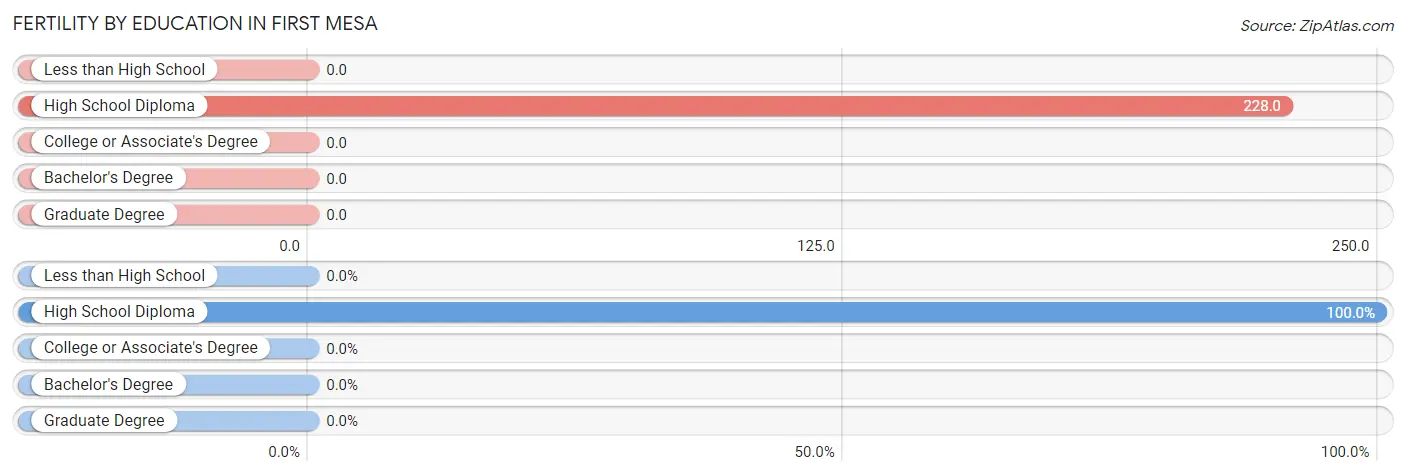
| Educational Attainment | Women with Births | Births / 1,000 Women |
| Less than High School | 0 (0.0%) | 0.0 |
| High School Diploma | 34 (100.0%) | 228.0 |
| College or Associate's Degree | 0 (0.0%) | 0.0 |
| Bachelor's Degree | 0 (0.0%) | 0.0 |
| Graduate Degree | 0 (0.0%) | 0.0 |
| Total | 34 (100.0%) | 128.0 |
Fertility by Education by Marriage Status in First Mesa
47.1% of women with births in First Mesa are unmarried. Women with the educational attainment of high school diploma are most likely to be married with 52.9% of them married at childbirth, while women with the educational attainment of high school diploma are least likely to be married with 47.1% of them unmarried at childbirth.
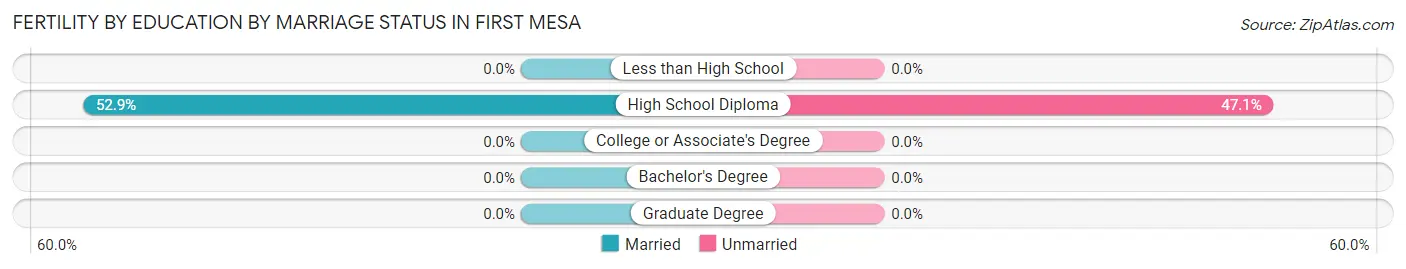
| Educational Attainment | Married | Unmarried |
| Less than High School | 0 (0.0%) | 0 (0.0%) |
| High School Diploma | 18 (52.9%) | 16 (47.1%) |
| College or Associate's Degree | 0 (0.0%) | 0 (0.0%) |
| Bachelor's Degree | 0 (0.0%) | 0 (0.0%) |
| Graduate Degree | 0 (0.0%) | 0 (0.0%) |
| Total | 18 (52.9%) | 16 (47.1%) |
Employment Characteristics in First Mesa
Employment by Class of Employer in First Mesa
Among the 423 employed individuals in First Mesa, local government employees (129 | 30.5%), self-employed (not incorporated) (115 | 27.2%), and private company employees (104 | 24.6%) make up the most common classes of employment.
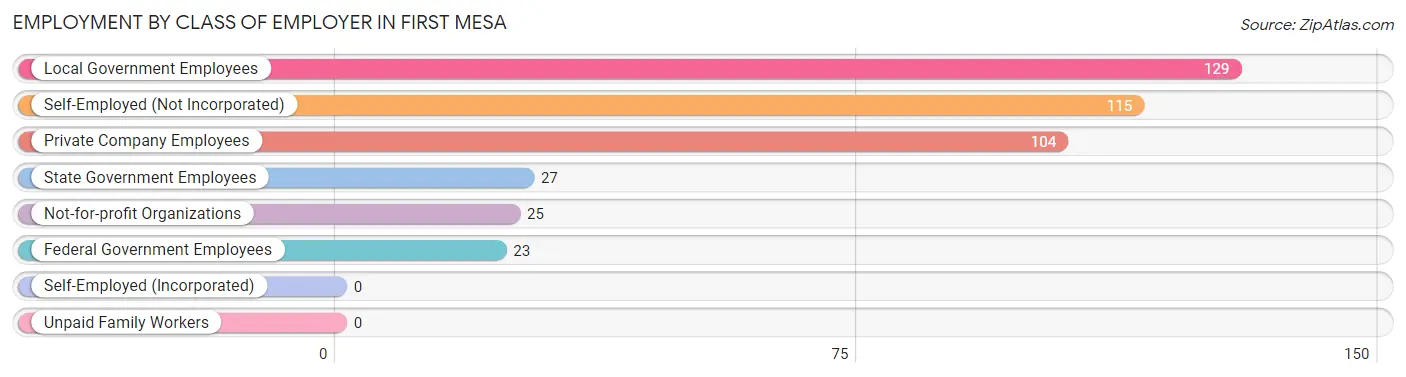
| Employer Class | # Employees | % Employees |
| Private Company Employees | 104 | 24.6% |
| Self-Employed (Incorporated) | 0 | 0.0% |
| Self-Employed (Not Incorporated) | 115 | 27.2% |
| Not-for-profit Organizations | 25 | 5.9% |
| Local Government Employees | 129 | 30.5% |
| State Government Employees | 27 | 6.4% |
| Federal Government Employees | 23 | 5.4% |
| Unpaid Family Workers | 0 | 0.0% |
| Total | 423 | 100.0% |
Employment Status by Age in First Mesa
According to the labor force statistics for First Mesa, out of the total population over 16 years of age (970), 47.6% or 462 individuals are in the labor force, with 5.6% or 26 of them unemployed. The age group with the highest labor force participation rate is 30 to 34 years, with 100.0% or 45 individuals in the labor force. Within the labor force, the 25 to 29 years age range has the highest percentage of unemployed individuals, with 32.1% or 18 of them being unemployed.
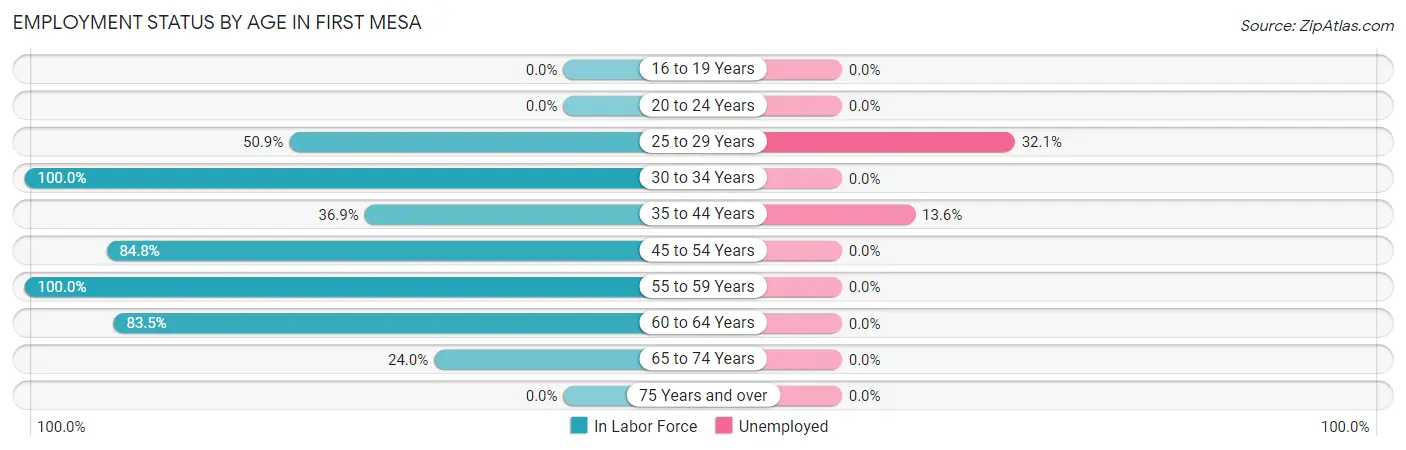
| Age Bracket | In Labor Force | Unemployed |
| 16 to 19 Years | 0 (0.0%) | 0 (0.0%) |
| 20 to 24 Years | 0 (0.0%) | 0 (0.0%) |
| 25 to 29 Years | 56 (50.9%) | 18 (32.1%) |
| 30 to 34 Years | 45 (100.0%) | 0 (0.0%) |
| 35 to 44 Years | 59 (36.9%) | 8 (13.6%) |
| 45 to 54 Years | 139 (84.8%) | 0 (0.0%) |
| 55 to 59 Years | 61 (100.0%) | 0 (0.0%) |
| 60 to 64 Years | 66 (83.5%) | 0 (0.0%) |
| 65 to 74 Years | 36 (24.0%) | 0 (0.0%) |
| 75 Years and over | 0 (0.0%) | 0 (0.0%) |
| Total | 462 (47.6%) | 26 (5.6%) |
Employment Status by Educational Attainment in First Mesa
According to labor force statistics for First Mesa, 68.8% of individuals (426) out of the total population between 25 and 64 years of age (619) are in the labor force, with 6.1% or 26 of them being unemployed. The group with the highest labor force participation rate are those with the educational attainment of bachelor's degree or higher, with 100.0% or 31 individuals in the labor force. Within the labor force, individuals with college / associate degree education have the highest percentage of unemployment, with 8.1% or 18 of them being unemployed.
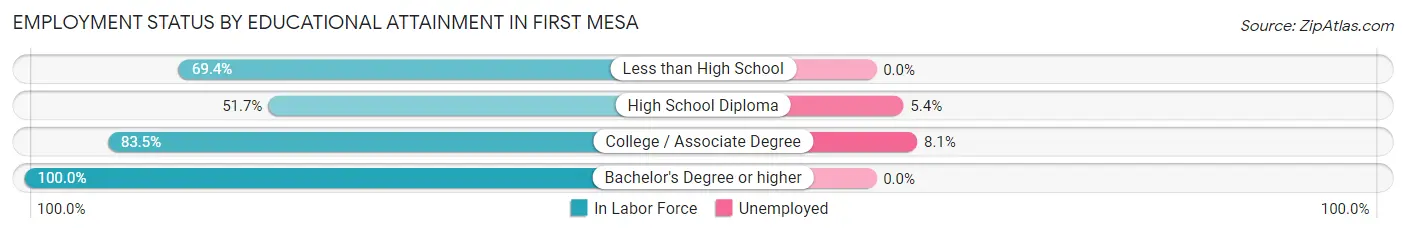
| Educational Attainment | In Labor Force | Unemployed |
| Less than High School | 25 (69.4%) | 0 (0.0%) |
| High School Diploma | 148 (51.7%) | 15 (5.4%) |
| College / Associate Degree | 222 (83.5%) | 22 (8.1%) |
| Bachelor's Degree or higher | 31 (100.0%) | 0 (0.0%) |
| Total | 426 (68.8%) | 38 (6.1%) |
Employment Occupations by Sex in First Mesa
Management, Business, Science and Arts Occupations
The most common Management, Business, Science and Arts occupations in First Mesa are Community & Social Service (112 | 25.7%), Arts, Media & Entertainment (66 | 15.1%), Management (41 | 9.4%), Education, Arts & Media (30 | 6.9%), and Education Instruction & Library (16 | 3.7%).
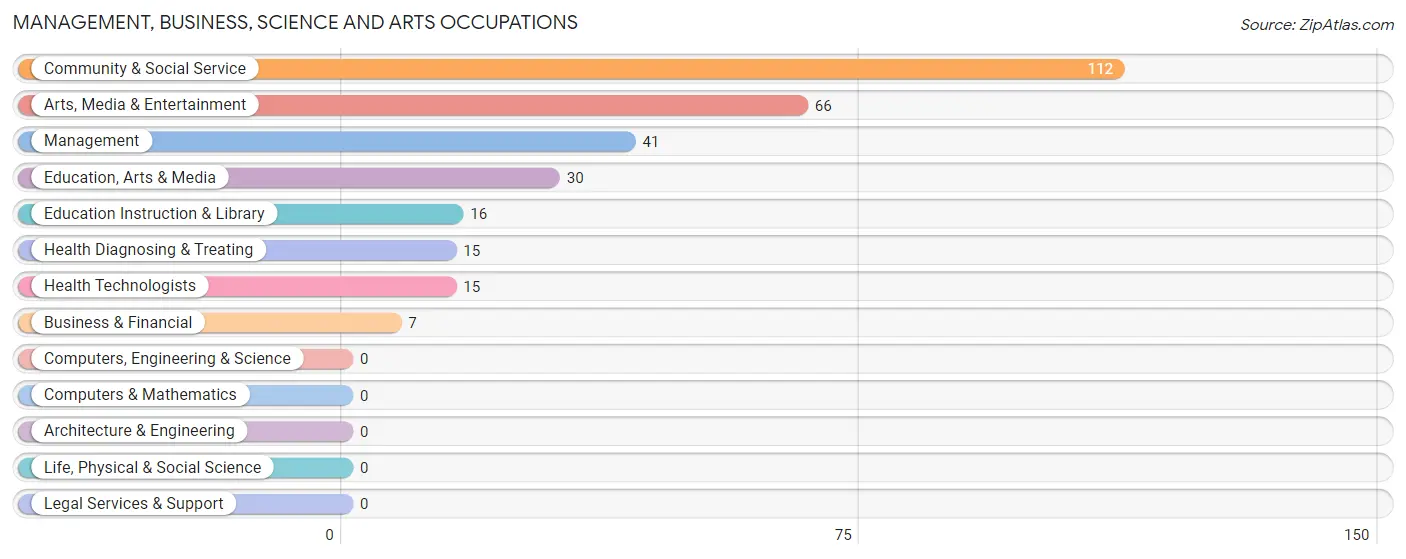
Management, Business, Science and Arts Occupations by Sex
Within the Management, Business, Science and Arts occupations in First Mesa, the most male-oriented occupations are Arts, Media & Entertainment (78.8%), Management (65.8%), and Community & Social Service (46.4%), while the most female-oriented occupations are Business & Financial (100.0%), Education, Arts & Media (100.0%), and Education Instruction & Library (100.0%).
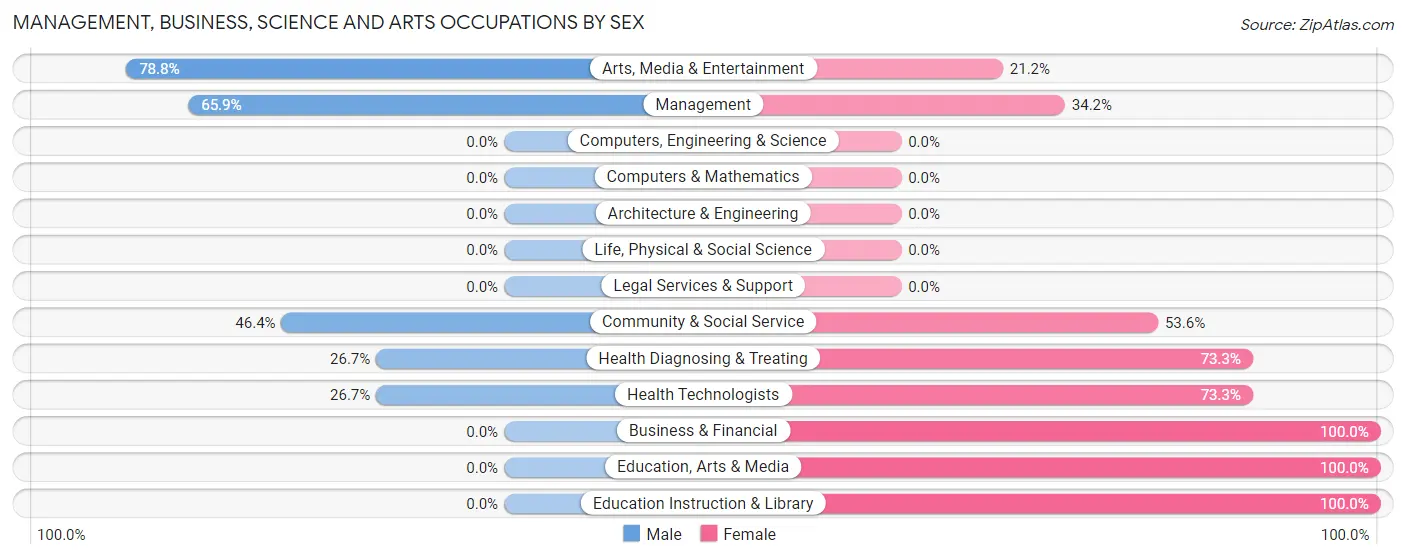
| Occupation | Male | Female |
| Management | 27 (65.8%) | 14 (34.2%) |
| Business & Financial | 0 (0.0%) | 7 (100.0%) |
| Computers, Engineering & Science | 0 (0.0%) | 0 (0.0%) |
| Computers & Mathematics | 0 (0.0%) | 0 (0.0%) |
| Architecture & Engineering | 0 (0.0%) | 0 (0.0%) |
| Life, Physical & Social Science | 0 (0.0%) | 0 (0.0%) |
| Community & Social Service | 52 (46.4%) | 60 (53.6%) |
| Education, Arts & Media | 0 (0.0%) | 30 (100.0%) |
| Legal Services & Support | 0 (0.0%) | 0 (0.0%) |
| Education Instruction & Library | 0 (0.0%) | 16 (100.0%) |
| Arts, Media & Entertainment | 52 (78.8%) | 14 (21.2%) |
| Health Diagnosing & Treating | 4 (26.7%) | 11 (73.3%) |
| Health Technologists | 4 (26.7%) | 11 (73.3%) |
| Total (Category) | 83 (47.4%) | 92 (52.6%) |
| Total (Overall) | 222 (50.9%) | 214 (49.1%) |
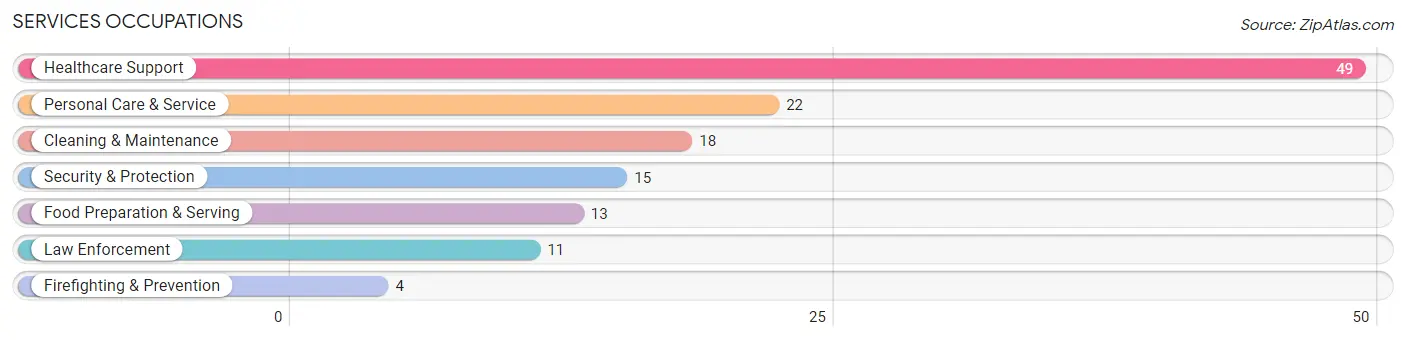
Services Occupations
The most common Services occupations in First Mesa are Healthcare Support (49 | 11.2%), Personal Care & Service (22 | 5.1%), Cleaning & Maintenance (18 | 4.1%), Security & Protection (15 | 3.4%), and Food Preparation & Serving (13 | 3.0%).
Services Occupations by Sex
Within the Services occupations in First Mesa, the most male-oriented occupations are Firefighting & Prevention (100.0%), Cleaning & Maintenance (100.0%), and Security & Protection (26.7%), while the most female-oriented occupations are Law Enforcement (100.0%), Food Preparation & Serving (100.0%), and Personal Care & Service (100.0%).
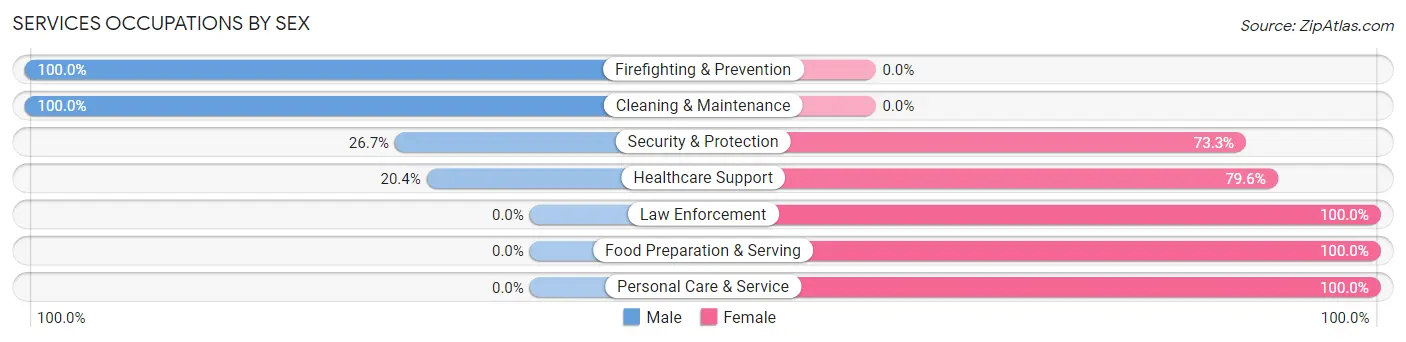
| Occupation | Male | Female |
| Healthcare Support | 10 (20.4%) | 39 (79.6%) |
| Security & Protection | 4 (26.7%) | 11 (73.3%) |
| Firefighting & Prevention | 4 (100.0%) | 0 (0.0%) |
| Law Enforcement | 0 (0.0%) | 11 (100.0%) |
| Food Preparation & Serving | 0 (0.0%) | 13 (100.0%) |
| Cleaning & Maintenance | 18 (100.0%) | 0 (0.0%) |
| Personal Care & Service | 0 (0.0%) | 22 (100.0%) |
| Total (Category) | 32 (27.4%) | 85 (72.7%) |
| Total (Overall) | 222 (50.9%) | 214 (49.1%) |
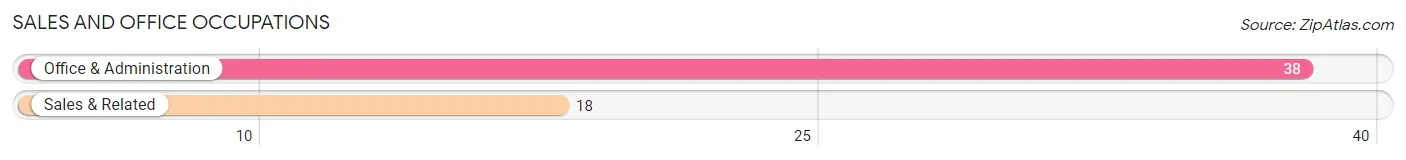
Sales and Office Occupations
The most common Sales and Office occupations in First Mesa are Office & Administration (38 | 8.7%), and Sales & Related (18 | 4.1%).
Sales and Office Occupations by Sex
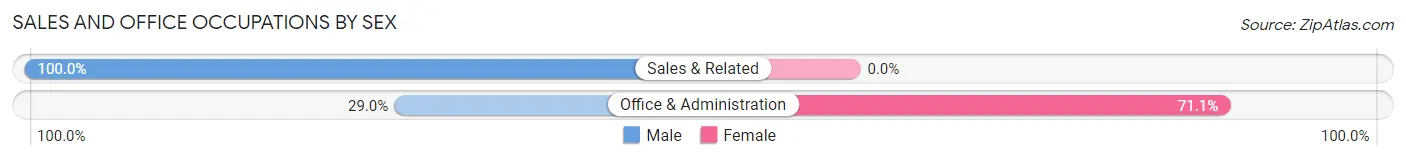
| Occupation | Male | Female |
| Sales & Related | 18 (100.0%) | 0 (0.0%) |
| Office & Administration | 11 (28.9%) | 27 (71.1%) |
| Total (Category) | 29 (51.8%) | 27 (48.2%) |
| Total (Overall) | 222 (50.9%) | 214 (49.1%) |
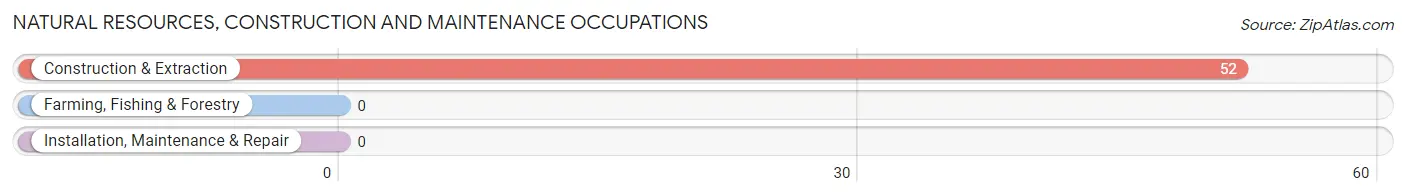
Natural Resources, Construction and Maintenance Occupations
The most common Natural Resources, Construction and Maintenance occupations in First Mesa are , and Construction & Extraction (52 | 11.9%).
Natural Resources, Construction and Maintenance Occupations by Sex
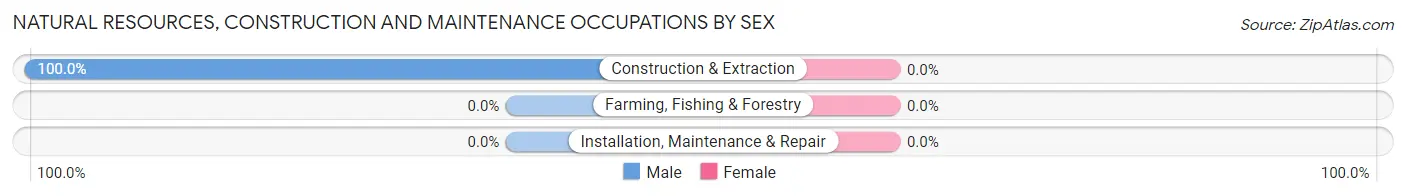
| Occupation | Male | Female |
| Farming, Fishing & Forestry | 0 (0.0%) | 0 (0.0%) |
| Construction & Extraction | 52 (100.0%) | 0 (0.0%) |
| Installation, Maintenance & Repair | 0 (0.0%) | 0 (0.0%) |
| Total (Category) | 52 (100.0%) | 0 (0.0%) |
| Total (Overall) | 222 (50.9%) | 214 (49.1%) |
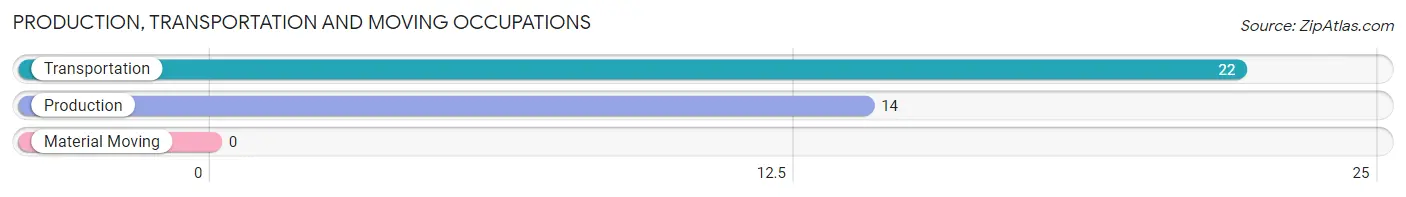
Production, Transportation and Moving Occupations
The most common Production, Transportation and Moving occupations in First Mesa are Transportation (22 | 5.1%), and Production (14 | 3.2%).
Production, Transportation and Moving Occupations by Sex
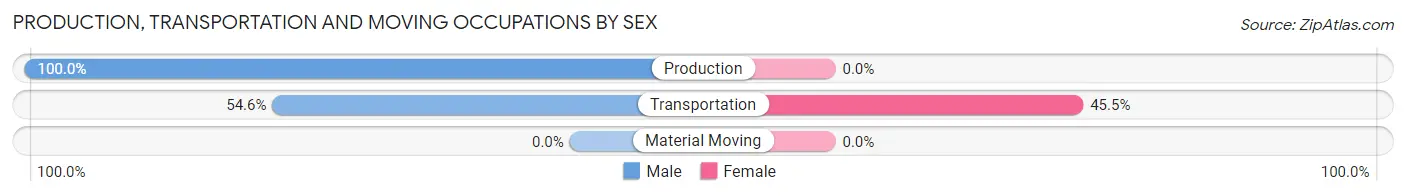
| Occupation | Male | Female |
| Production | 14 (100.0%) | 0 (0.0%) |
| Transportation | 12 (54.5%) | 10 (45.5%) |
| Material Moving | 0 (0.0%) | 0 (0.0%) |
| Total (Category) | 26 (72.2%) | 10 (27.8%) |
| Total (Overall) | 222 (50.9%) | 214 (49.1%) |
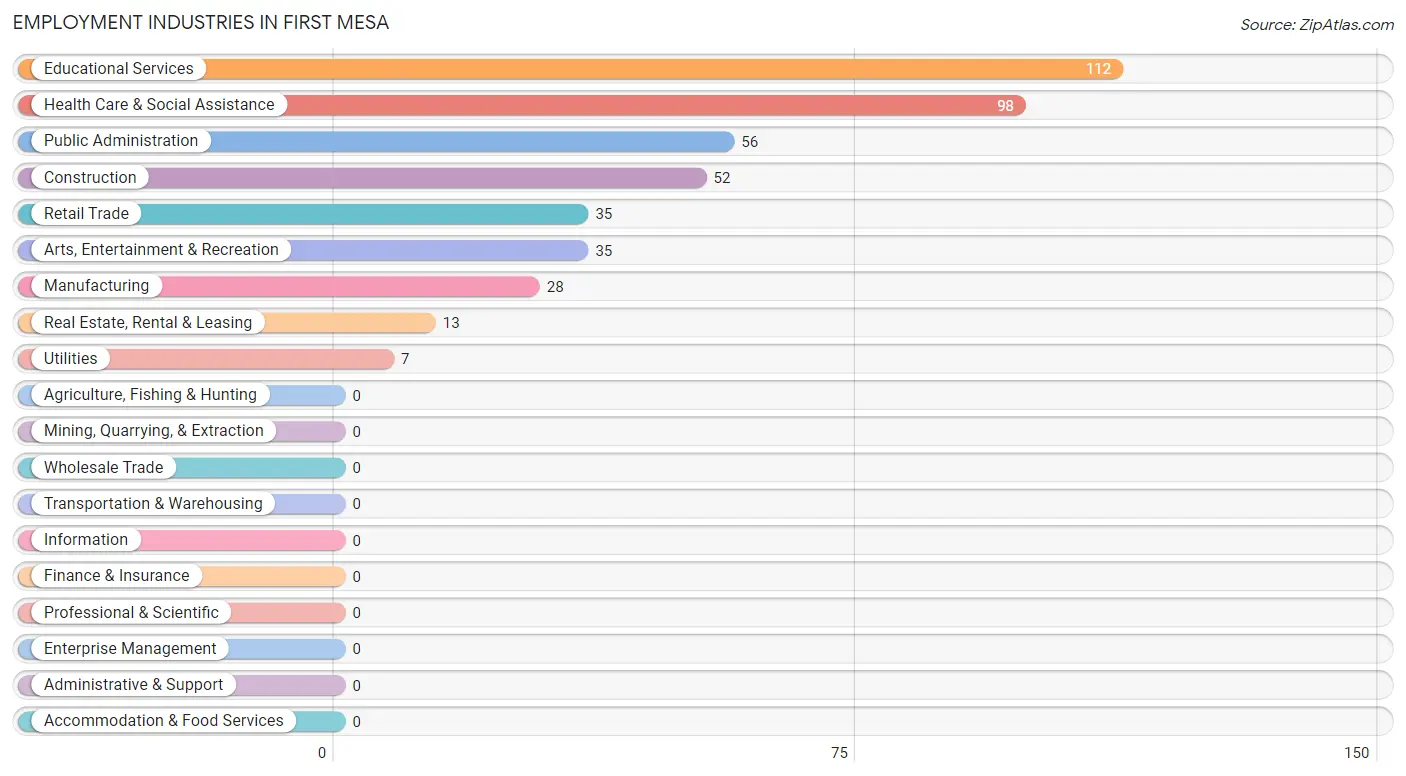
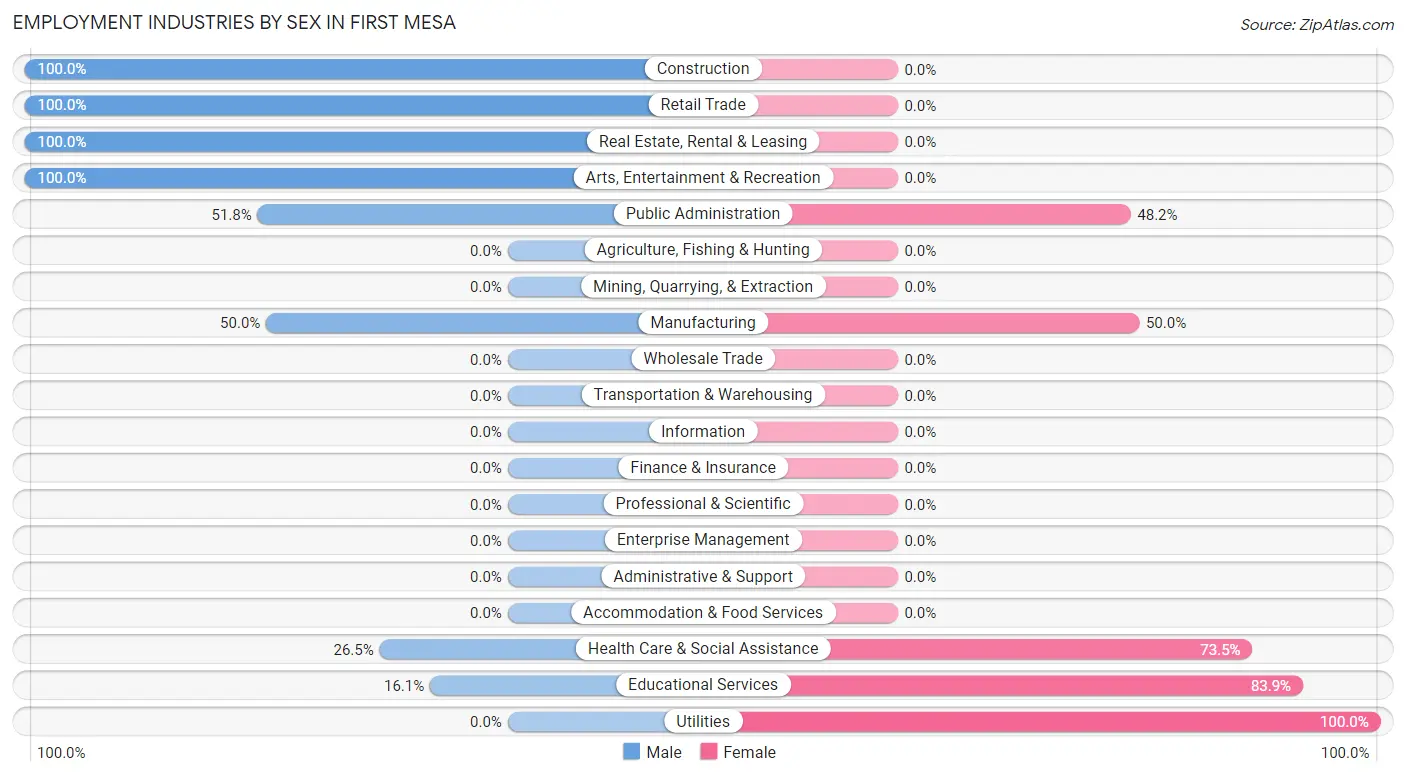
Employment Industries by Sex in First Mesa
Employment Industries in First Mesa
The major employment industries in First Mesa include Educational Services (112 | 25.7%), Health Care & Social Assistance (98 | 22.5%), Public Administration (56 | 12.8%), Construction (52 | 11.9%), and Retail Trade (35 | 8.0%).
Employment Industries by Sex in First Mesa
The First Mesa industries that see more men than women are Construction (100.0%), Retail Trade (100.0%), and Real Estate, Rental & Leasing (100.0%), whereas the industries that tend to have a higher number of women are Utilities (100.0%), Educational Services (83.9%), and Health Care & Social Assistance (73.5%).
| Industry | Male | Female |
| Agriculture, Fishing & Hunting | 0 (0.0%) | 0 (0.0%) |
| Mining, Quarrying, & Extraction | 0 (0.0%) | 0 (0.0%) |
| Construction | 52 (100.0%) | 0 (0.0%) |
| Manufacturing | 14 (50.0%) | 14 (50.0%) |
| Wholesale Trade | 0 (0.0%) | 0 (0.0%) |
| Retail Trade | 35 (100.0%) | 0 (0.0%) |
| Transportation & Warehousing | 0 (0.0%) | 0 (0.0%) |
| Utilities | 0 (0.0%) | 7 (100.0%) |
| Information | 0 (0.0%) | 0 (0.0%) |
| Finance & Insurance | 0 (0.0%) | 0 (0.0%) |
| Real Estate, Rental & Leasing | 13 (100.0%) | 0 (0.0%) |
| Professional & Scientific | 0 (0.0%) | 0 (0.0%) |
| Enterprise Management | 0 (0.0%) | 0 (0.0%) |
| Administrative & Support | 0 (0.0%) | 0 (0.0%) |
| Educational Services | 18 (16.1%) | 94 (83.9%) |
| Health Care & Social Assistance | 26 (26.5%) | 72 (73.5%) |
| Arts, Entertainment & Recreation | 35 (100.0%) | 0 (0.0%) |
| Accommodation & Food Services | 0 (0.0%) | 0 (0.0%) |
| Public Administration | 29 (51.8%) | 27 (48.2%) |
| Total | 222 (50.9%) | 214 (49.1%) |
Education in First Mesa
School Enrollment in First Mesa
The most common levels of schooling among the 404 students in First Mesa are middle school (162 | 40.1%), elementary school (150 | 37.1%), and high school (80 | 19.8%).
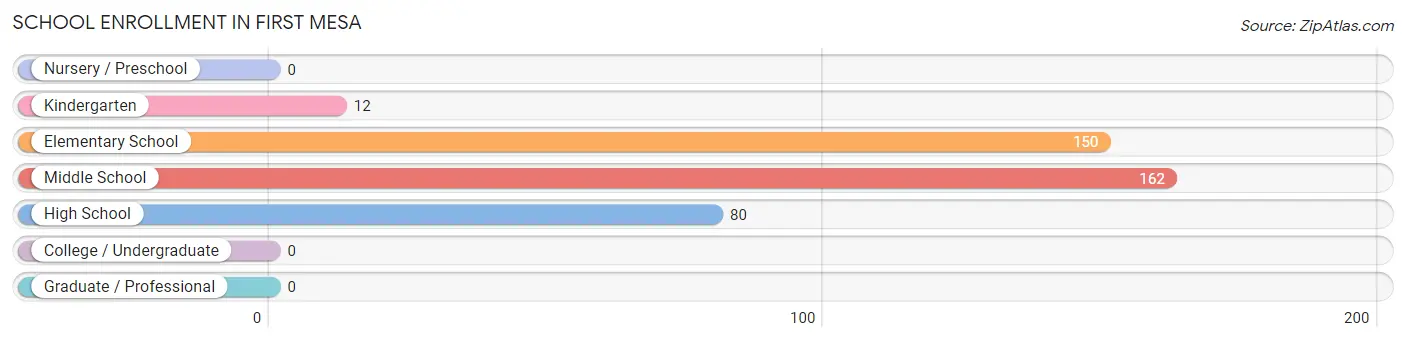
| School Level | # Students | % Students |
| Nursery / Preschool | 0 | 0.0% |
| Kindergarten | 12 | 3.0% |
| Elementary School | 150 | 37.1% |
| Middle School | 162 | 40.1% |
| High School | 80 | 19.8% |
| College / Undergraduate | 0 | 0.0% |
| Graduate / Professional | 0 | 0.0% |
| Total | 404 | 100.0% |
School Enrollment by Age by Funding Source in First Mesa
Out of a total of 404 students who are enrolled in schools in First Mesa, 8 (2.0%) attend a private institution, while the remaining 396 (98.0%) are enrolled in public schools. The age group of 5 to 9 year old has the highest likelihood of being enrolled in private schools, with 8 (5.7% in the age bracket) enrolled. Conversely, the age group of 10 to 14 year olds has the lowest likelihood of being enrolled in a private school, with 184 (100.0% in the age bracket) attending a public institution.
| Age Bracket | Public School | Private School |
| 3 to 4 Year Olds | 0 (0.0%) | 0 (0.0%) |
| 5 to 9 Year Old | 132 (94.3%) | 8 (5.7%) |
| 10 to 14 Year Olds | 184 (100.0%) | 0 (0.0%) |
| 15 to 17 Year Olds | 64 (100.0%) | 0 (0.0%) |
| 18 to 19 Year Olds | 16 (100.0%) | 0 (0.0%) |
| 20 to 24 Year Olds | 0 (0.0%) | 0 (0.0%) |
| 25 to 34 Year Olds | 0 (0.0%) | 0 (0.0%) |
| 35 Years and over | 0 (0.0%) | 0 (0.0%) |
| Total | 396 (98.0%) | 8 (2.0%) |
Educational Attainment by Field of Study in First Mesa
Education (25 | 34.3%), social sciences (23 | 31.5%), arts & humanities (14 | 19.2%), and science & technology (11 | 15.1%) are the most common fields of study among 73 individuals in First Mesa who have obtained a bachelor's degree or higher.
| Field of Study | # Graduates | % Graduates |
| Computers & Mathematics | 0 | 0.0% |
| Bio, Nature & Agricultural | 0 | 0.0% |
| Physical & Health Sciences | 0 | 0.0% |
| Psychology | 0 | 0.0% |
| Social Sciences | 23 | 31.5% |
| Engineering | 0 | 0.0% |
| Multidisciplinary Studies | 0 | 0.0% |
| Science & Technology | 11 | 15.1% |
| Business | 0 | 0.0% |
| Education | 25 | 34.3% |
| Literature & Languages | 0 | 0.0% |
| Liberal Arts & History | 0 | 0.0% |
| Visual & Performing Arts | 0 | 0.0% |
| Communications | 0 | 0.0% |
| Arts & Humanities | 14 | 19.2% |
| Total | 73 | 100.0% |
Transportation & Commute in First Mesa
Vehicle Availability by Sex in First Mesa
The most prevalent vehicle ownership categories in First Mesa are males with no vehicle (78, accounting for 37.3%) and females with no vehicle (28, making up 36.4%).
| Vehicles Available | Male | Female |
| No Vehicle | 78 (37.3%) | 28 (13.1%) |
| 1 Vehicle | 56 (26.8%) | 112 (52.3%) |
| 2 Vehicles | 75 (35.9%) | 74 (34.6%) |
| 3 Vehicles | 0 (0.0%) | 0 (0.0%) |
| 4 Vehicles | 0 (0.0%) | 0 (0.0%) |
| 5 or more Vehicles | 0 (0.0%) | 0 (0.0%) |
| Total | 209 (100.0%) | 214 (100.0%) |
Commute Time in First Mesa
The most frequently occuring commute durations in First Mesa are 30 to 34 minutes (70 commuters, 22.7%), 10 to 14 minutes (56 commuters, 18.1%), and 15 to 19 minutes (55 commuters, 17.8%).
| Commute Time | # Commuters | % Commuters |
| Less than 5 Minutes | 46 | 14.9% |
| 5 to 9 Minutes | 13 | 4.2% |
| 10 to 14 Minutes | 56 | 18.1% |
| 15 to 19 Minutes | 55 | 17.8% |
| 20 to 24 Minutes | 21 | 6.8% |
| 25 to 29 Minutes | 0 | 0.0% |
| 30 to 34 Minutes | 70 | 22.7% |
| 35 to 39 Minutes | 14 | 4.5% |
| 40 to 44 Minutes | 24 | 7.8% |
| 45 to 59 Minutes | 7 | 2.3% |
| 60 to 89 Minutes | 3 | 1.0% |
| 90 or more Minutes | 0 | 0.0% |
Commute Time by Sex in First Mesa
The most common commute times in First Mesa are 30 to 34 minutes (44 commuters, 33.6%) for males and 15 to 19 minutes (37 commuters, 20.8%) for females.
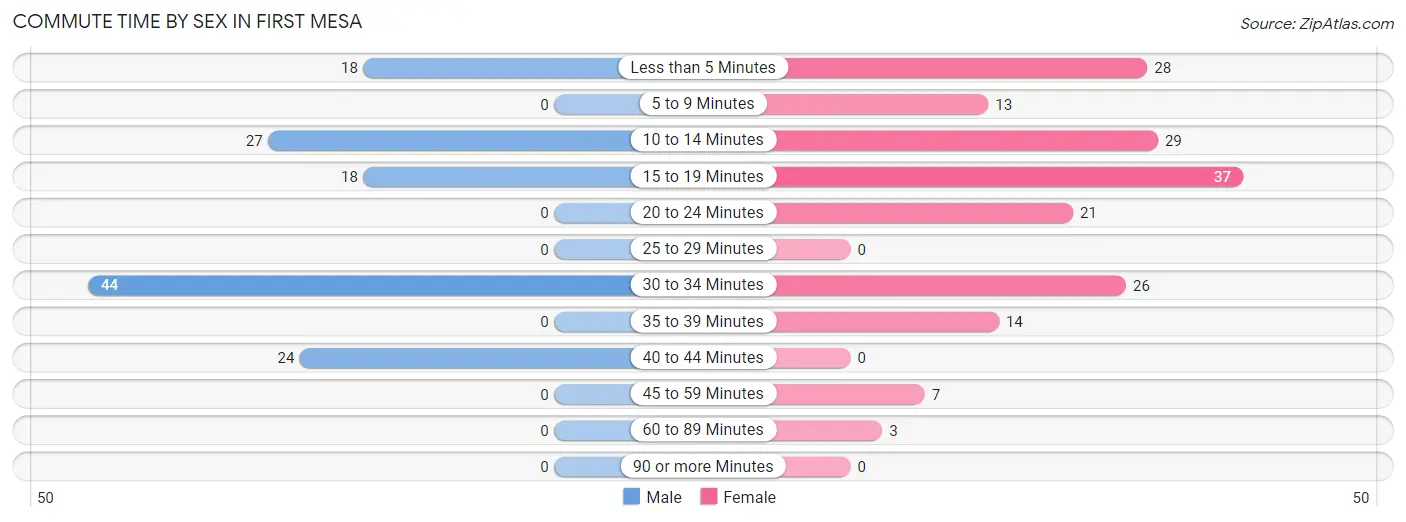
| Commute Time | Male | Female |
| Less than 5 Minutes | 18 (13.7%) | 28 (15.7%) |
| 5 to 9 Minutes | 0 (0.0%) | 13 (7.3%) |
| 10 to 14 Minutes | 27 (20.6%) | 29 (16.3%) |
| 15 to 19 Minutes | 18 (13.7%) | 37 (20.8%) |
| 20 to 24 Minutes | 0 (0.0%) | 21 (11.8%) |
| 25 to 29 Minutes | 0 (0.0%) | 0 (0.0%) |
| 30 to 34 Minutes | 44 (33.6%) | 26 (14.6%) |
| 35 to 39 Minutes | 0 (0.0%) | 14 (7.9%) |
| 40 to 44 Minutes | 24 (18.3%) | 0 (0.0%) |
| 45 to 59 Minutes | 0 (0.0%) | 7 (3.9%) |
| 60 to 89 Minutes | 0 (0.0%) | 3 (1.7%) |
| 90 or more Minutes | 0 (0.0%) | 0 (0.0%) |
Time of Departure to Work by Sex in First Mesa
The most frequent times of departure to work in First Mesa are 7:30 AM to 7:59 AM (46, 35.1%) for males and 7:00 AM to 7:29 AM (76, 42.7%) for females.
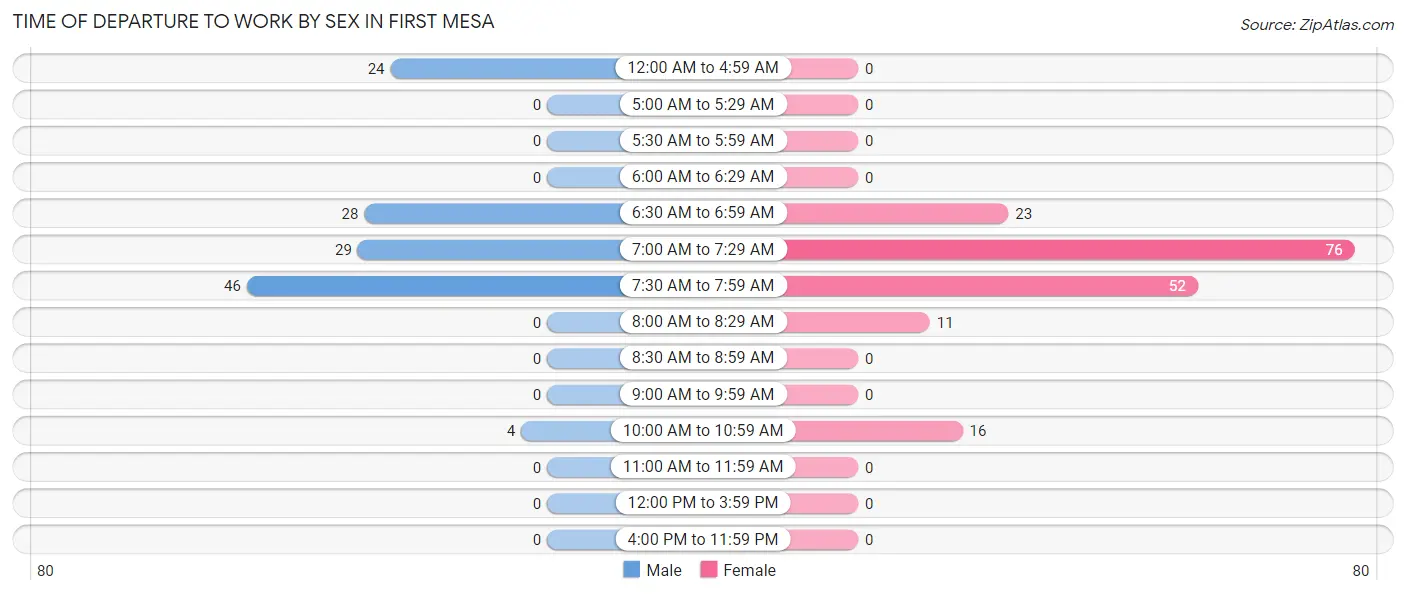
| Time of Departure | Male | Female |
| 12:00 AM to 4:59 AM | 24 (18.3%) | 0 (0.0%) |
| 5:00 AM to 5:29 AM | 0 (0.0%) | 0 (0.0%) |
| 5:30 AM to 5:59 AM | 0 (0.0%) | 0 (0.0%) |
| 6:00 AM to 6:29 AM | 0 (0.0%) | 0 (0.0%) |
| 6:30 AM to 6:59 AM | 28 (21.4%) | 23 (12.9%) |
| 7:00 AM to 7:29 AM | 29 (22.1%) | 76 (42.7%) |
| 7:30 AM to 7:59 AM | 46 (35.1%) | 52 (29.2%) |
| 8:00 AM to 8:29 AM | 0 (0.0%) | 11 (6.2%) |
| 8:30 AM to 8:59 AM | 0 (0.0%) | 0 (0.0%) |
| 9:00 AM to 9:59 AM | 0 (0.0%) | 0 (0.0%) |
| 10:00 AM to 10:59 AM | 4 (3.0%) | 16 (9.0%) |
| 11:00 AM to 11:59 AM | 0 (0.0%) | 0 (0.0%) |
| 12:00 PM to 3:59 PM | 0 (0.0%) | 0 (0.0%) |
| 4:00 PM to 11:59 PM | 0 (0.0%) | 0 (0.0%) |
| Total | 131 (100.0%) | 178 (100.0%) |
Housing Occupancy in First Mesa
Occupancy by Ownership in First Mesa
Of the total 427 dwellings in First Mesa, owner-occupied units account for 275 (64.4%), while renter-occupied units make up 152 (35.6%).
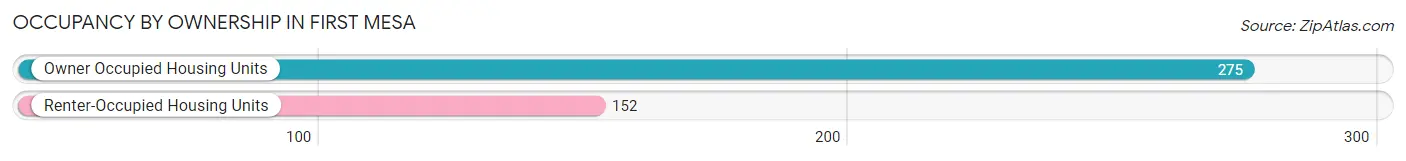
| Occupancy | # Housing Units | % Housing Units |
| Owner Occupied Housing Units | 275 | 64.4% |
| Renter-Occupied Housing Units | 152 | 35.6% |
| Total Occupied Housing Units | 427 | 100.0% |
Occupancy by Household Size in First Mesa
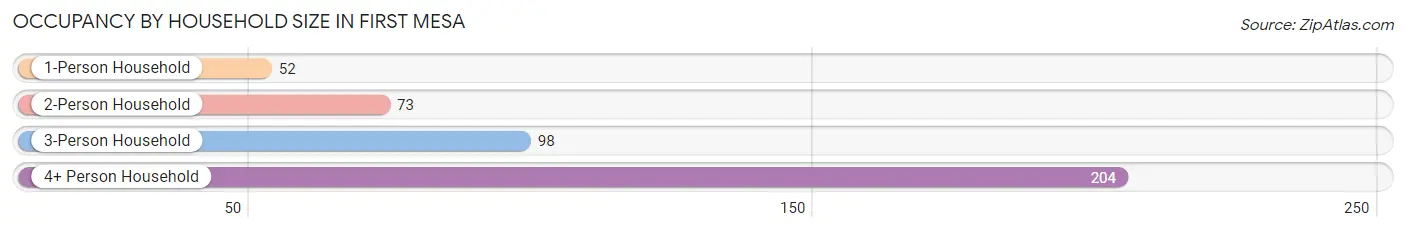
| Household Size | # Housing Units | % Housing Units |
| 1-Person Household | 52 | 12.2% |
| 2-Person Household | 73 | 17.1% |
| 3-Person Household | 98 | 23.0% |
| 4+ Person Household | 204 | 47.8% |
| Total Housing Units | 427 | 100.0% |
Occupancy by Ownership by Household Size in First Mesa
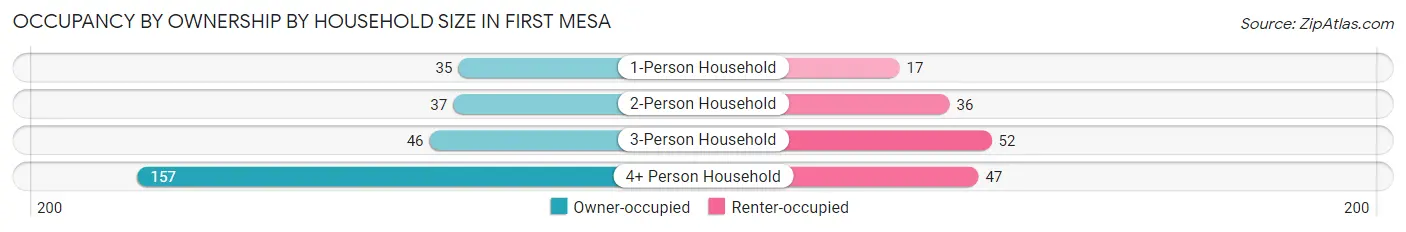
| Household Size | Owner-occupied | Renter-occupied |
| 1-Person Household | 35 (67.3%) | 17 (32.7%) |
| 2-Person Household | 37 (50.7%) | 36 (49.3%) |
| 3-Person Household | 46 (46.9%) | 52 (53.1%) |
| 4+ Person Household | 157 (77.0%) | 47 (23.0%) |
| Total Housing Units | 275 (64.4%) | 152 (35.6%) |
Occupancy by Educational Attainment in First Mesa
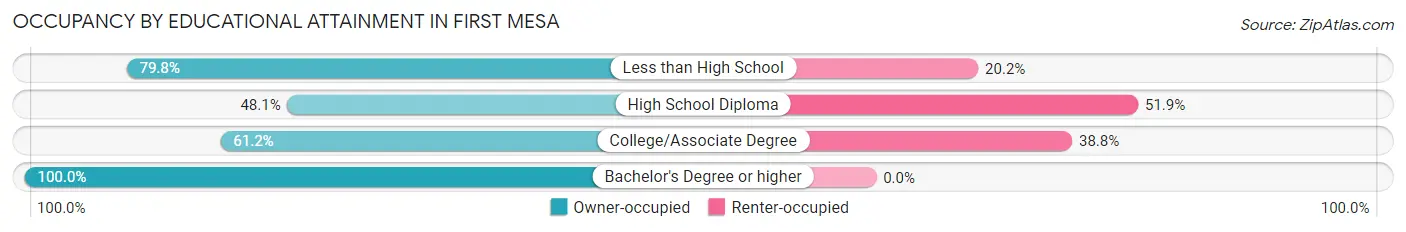
| Household Size | Owner-occupied | Renter-occupied |
| Less than High School | 71 (79.8%) | 18 (20.2%) |
| High School Diploma | 50 (48.1%) | 54 (51.9%) |
| College/Associate Degree | 126 (61.2%) | 80 (38.8%) |
| Bachelor's Degree or higher | 28 (100.0%) | 0 (0.0%) |
Occupancy by Age of Householder in First Mesa
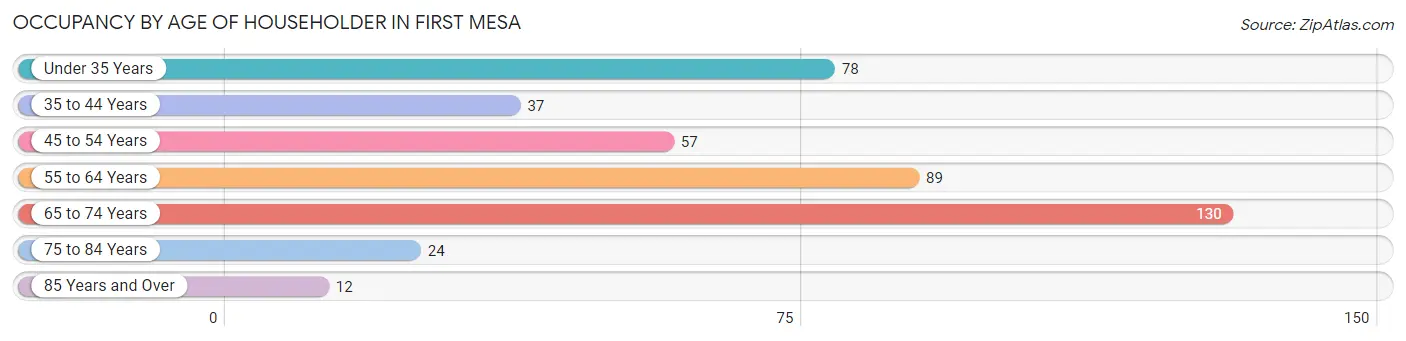
| Age Bracket | # Households | % Households |
| Under 35 Years | 78 | 18.3% |
| 35 to 44 Years | 37 | 8.7% |
| 45 to 54 Years | 57 | 13.4% |
| 55 to 64 Years | 89 | 20.8% |
| 65 to 74 Years | 130 | 30.4% |
| 75 to 84 Years | 24 | 5.6% |
| 85 Years and Over | 12 | 2.8% |
| Total | 427 | 100.0% |
Housing Finances in First Mesa
Median Income by Occupancy in First Mesa
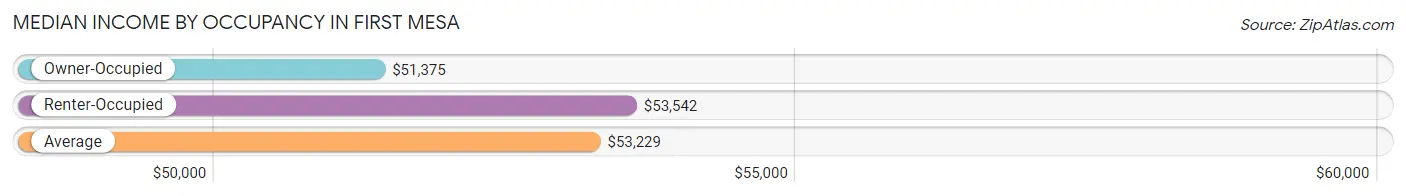
| Occupancy Type | # Households | Median Income |
| Owner-Occupied | 275 (64.4%) | $51,375 |
| Renter-Occupied | 152 (35.6%) | $53,542 |
| Average | 427 (100.0%) | $53,229 |
Occupancy by Householder Income Bracket in First Mesa
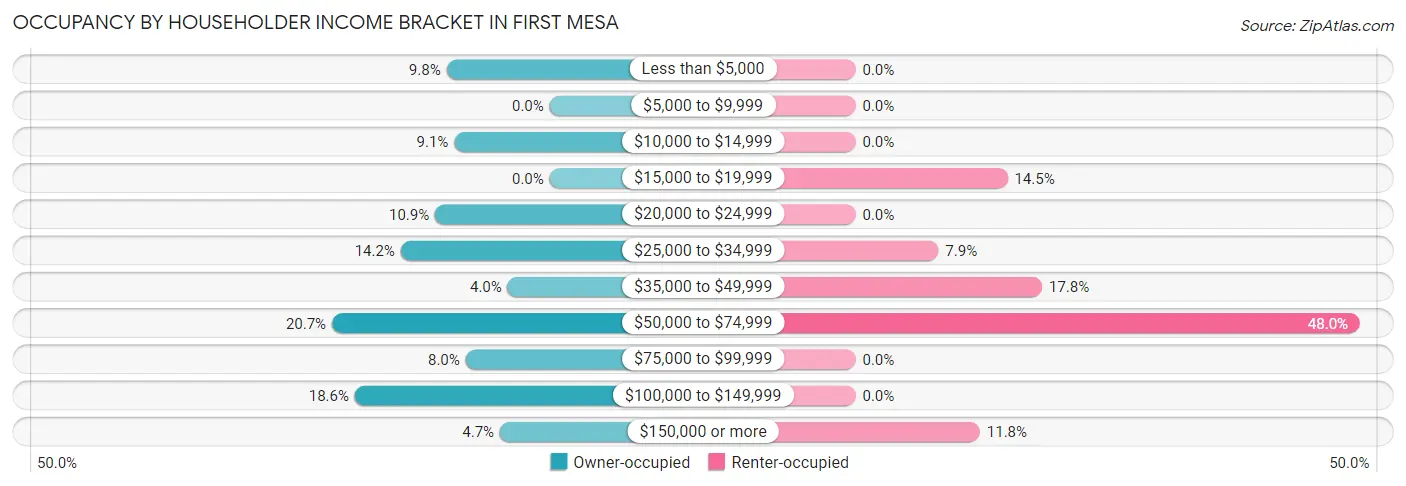
| Income Bracket | Owner-occupied | Renter-occupied |
| Less than $5,000 | 27 (9.8%) | 0 (0.0%) |
| $5,000 to $9,999 | 0 (0.0%) | 0 (0.0%) |
| $10,000 to $14,999 | 25 (9.1%) | 0 (0.0%) |
| $15,000 to $19,999 | 0 (0.0%) | 22 (14.5%) |
| $20,000 to $24,999 | 30 (10.9%) | 0 (0.0%) |
| $25,000 to $34,999 | 39 (14.2%) | 12 (7.9%) |
| $35,000 to $49,999 | 11 (4.0%) | 27 (17.8%) |
| $50,000 to $74,999 | 57 (20.7%) | 73 (48.0%) |
| $75,000 to $99,999 | 22 (8.0%) | 0 (0.0%) |
| $100,000 to $149,999 | 51 (18.5%) | 0 (0.0%) |
| $150,000 or more | 13 (4.7%) | 18 (11.8%) |
| Total | 275 (100.0%) | 152 (100.0%) |
Monthly Housing Cost Tiers in First Mesa
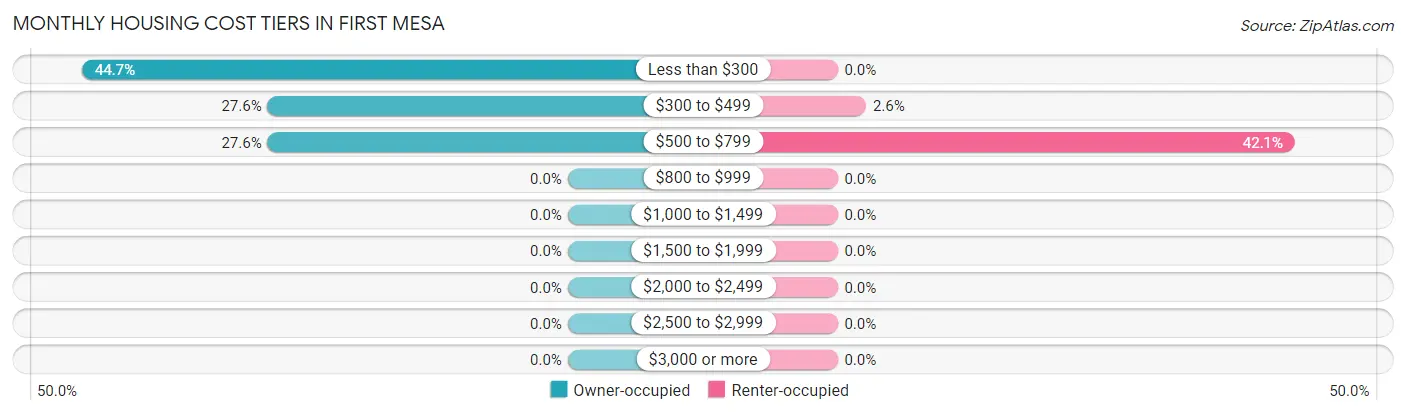
| Monthly Cost | Owner-occupied | Renter-occupied |
| Less than $300 | 123 (44.7%) | 0 (0.0%) |
| $300 to $499 | 76 (27.6%) | 4 (2.6%) |
| $500 to $799 | 76 (27.6%) | 64 (42.1%) |
| $800 to $999 | 0 (0.0%) | 0 (0.0%) |
| $1,000 to $1,499 | 0 (0.0%) | 0 (0.0%) |
| $1,500 to $1,999 | 0 (0.0%) | 0 (0.0%) |
| $2,000 to $2,499 | 0 (0.0%) | 0 (0.0%) |
| $2,500 to $2,999 | 0 (0.0%) | 0 (0.0%) |
| $3,000 or more | 0 (0.0%) | 0 (0.0%) |
| Total | 275 (100.0%) | 152 (100.0%) |
Physical Housing Characteristics in First Mesa
Housing Structures in First Mesa
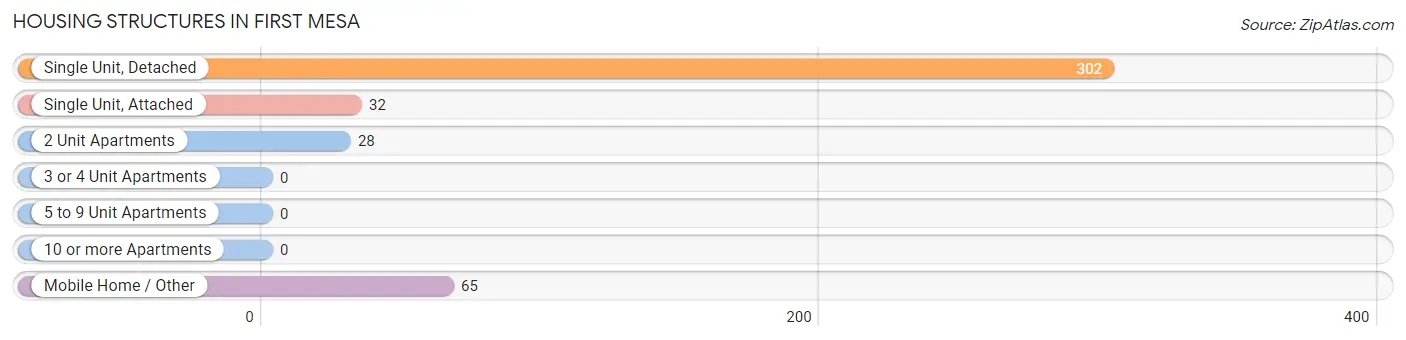
| Structure Type | # Housing Units | % Housing Units |
| Single Unit, Detached | 302 | 70.7% |
| Single Unit, Attached | 32 | 7.5% |
| 2 Unit Apartments | 28 | 6.6% |
| 3 or 4 Unit Apartments | 0 | 0.0% |
| 5 to 9 Unit Apartments | 0 | 0.0% |
| 10 or more Apartments | 0 | 0.0% |
| Mobile Home / Other | 65 | 15.2% |
| Total | 427 | 100.0% |
Housing Structures by Occupancy in First Mesa
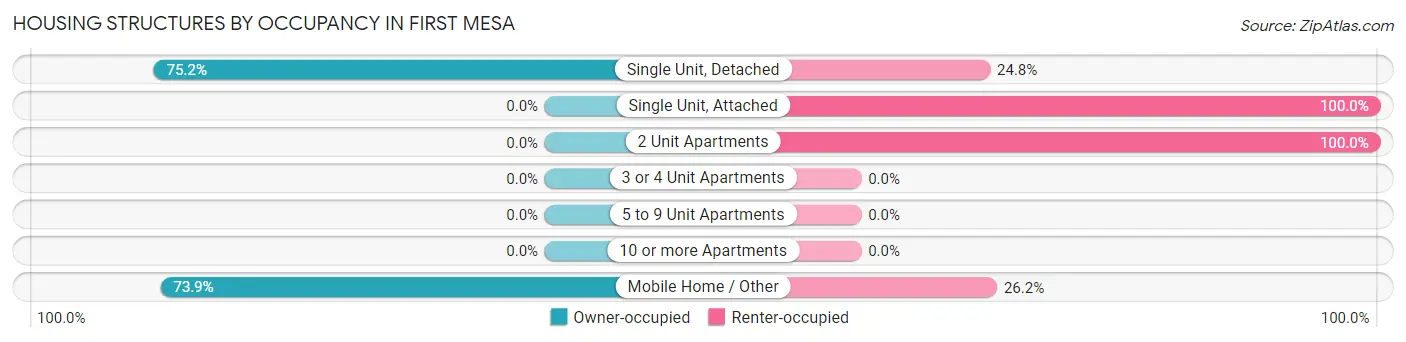
| Structure Type | Owner-occupied | Renter-occupied |
| Single Unit, Detached | 227 (75.2%) | 75 (24.8%) |
| Single Unit, Attached | 0 (0.0%) | 32 (100.0%) |
| 2 Unit Apartments | 0 (0.0%) | 28 (100.0%) |
| 3 or 4 Unit Apartments | 0 (0.0%) | 0 (0.0%) |
| 5 to 9 Unit Apartments | 0 (0.0%) | 0 (0.0%) |
| 10 or more Apartments | 0 (0.0%) | 0 (0.0%) |
| Mobile Home / Other | 48 (73.9%) | 17 (26.2%) |
| Total | 275 (64.4%) | 152 (35.6%) |
Housing Structures by Number of Rooms in First Mesa
| Number of Rooms | Owner-occupied | Renter-occupied |
| 1 Room | 14 (5.1%) | 14 (9.2%) |
| 2 or 3 Rooms | 11 (4.0%) | 35 (23.0%) |
| 4 or 5 Rooms | 181 (65.8%) | 103 (67.8%) |
| 6 or 7 Rooms | 69 (25.1%) | 0 (0.0%) |
| 8 or more Rooms | 0 (0.0%) | 0 (0.0%) |
| Total | 275 (100.0%) | 152 (100.0%) |
Housing Structure by Heating Type in First Mesa
| Heating Type | Owner-occupied | Renter-occupied |
| Utility Gas | 0 (0.0%) | 0 (0.0%) |
| Bottled, Tank, or LP Gas | 28 (10.2%) | 12 (7.9%) |
| Electricity | 20 (7.3%) | 34 (22.4%) |
| Fuel Oil or Kerosene | 0 (0.0%) | 0 (0.0%) |
| Coal or Coke | 0 (0.0%) | 0 (0.0%) |
| All other Fuels | 214 (77.8%) | 106 (69.7%) |
| No Fuel Used | 13 (4.7%) | 0 (0.0%) |
| Total | 275 (100.0%) | 152 (100.0%) |
Household Vehicle Usage in First Mesa
| Vehicles per Household | Owner-occupied | Renter-occupied |
| No Vehicle | 37 (13.5%) | 62 (40.8%) |
| 1 Vehicle | 141 (51.3%) | 72 (47.4%) |
| 2 Vehicles | 84 (30.5%) | 18 (11.8%) |
| 3 or more Vehicles | 13 (4.7%) | 0 (0.0%) |
| Total | 275 (100.0%) | 152 (100.0%) |
Real Estate & Mortgages in First Mesa
Real Estate and Mortgage Overview in First Mesa
| Characteristic | Without Mortgage | With Mortgage |
| Housing Units | 261 | 14 |
| Median Property Value | $58,100 | $0 |
| Median Household Income | $42,159 | $0 |
| Monthly Housing Costs | $308 | $0 |
| Real Estate Taxes | - | - |
Property Value by Mortgage Status in First Mesa
| Property Value | Without Mortgage | With Mortgage |
| Less than $50,000 | 111 (42.5%) | 0 (0.0%) |
| $50,000 to $99,999 | 73 (28.0%) | 0 (0.0%) |
| $100,000 to $299,999 | 77 (29.5%) | 14 (100.0%) |
| $300,000 to $499,999 | 0 (0.0%) | 0 (0.0%) |
| $500,000 to $749,999 | 0 (0.0%) | 0 (0.0%) |
| $750,000 to $999,999 | 0 (0.0%) | 0 (0.0%) |
| $1,000,000 or more | 0 (0.0%) | 0 (0.0%) |
| Total | 261 (100.0%) | 14 (100.0%) |
Household Income by Mortgage Status in First Mesa
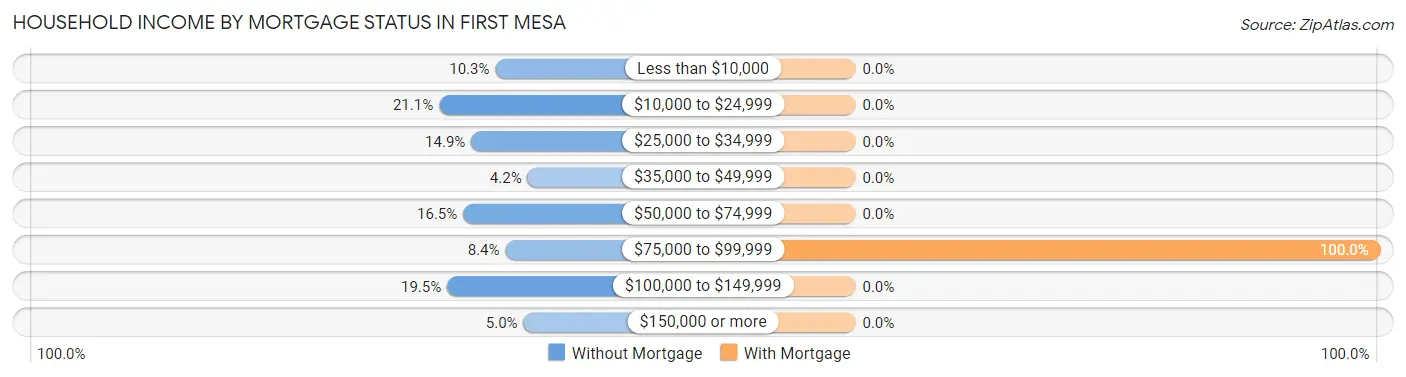
| Household Income | Without Mortgage | With Mortgage |
| Less than $10,000 | 27 (10.3%) | 0 (0.0%) |
| $10,000 to $24,999 | 55 (21.1%) | 0 (0.0%) |
| $25,000 to $34,999 | 39 (14.9%) | 0 (0.0%) |
| $35,000 to $49,999 | 11 (4.2%) | 0 (0.0%) |
| $50,000 to $74,999 | 43 (16.5%) | 0 (0.0%) |
| $75,000 to $99,999 | 22 (8.4%) | 14 (100.0%) |
| $100,000 to $149,999 | 51 (19.5%) | 0 (0.0%) |
| $150,000 or more | 13 (5.0%) | 0 (0.0%) |
| Total | 261 (100.0%) | 14 (100.0%) |
Property Value to Household Income Ratio in First Mesa
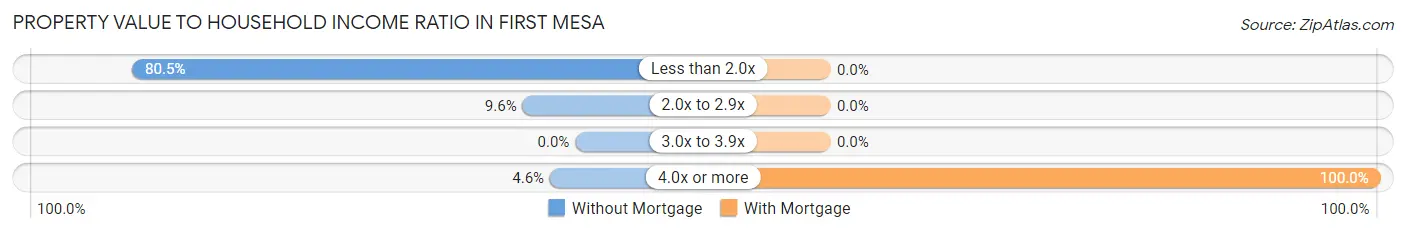
| Value-to-Income Ratio | Without Mortgage | With Mortgage |
| Less than 2.0x | 210 (80.5%) | 0 (0.0%) |
| 2.0x to 2.9x | 25 (9.6%) | 0 (0.0%) |
| 3.0x to 3.9x | 0 (0.0%) | 0 (0.0%) |
| 4.0x or more | 12 (4.6%) | 14 (100.0%) |
| Total | 261 (100.0%) | 14 (100.0%) |
Real Estate Taxes by Mortgage Status in First Mesa
| Property Taxes | Without Mortgage | With Mortgage |
| Less than $800 | 0 (0.0%) | 0 (0.0%) |
| $800 to $1,499 | 0 (0.0%) | 0 (0.0%) |
| $800 to $1,499 | 0 (0.0%) | 0 (0.0%) |
| Total | 261 (100.0%) | 14 (100.0%) |
Health & Disability in First Mesa
Health Insurance Coverage by Age in First Mesa
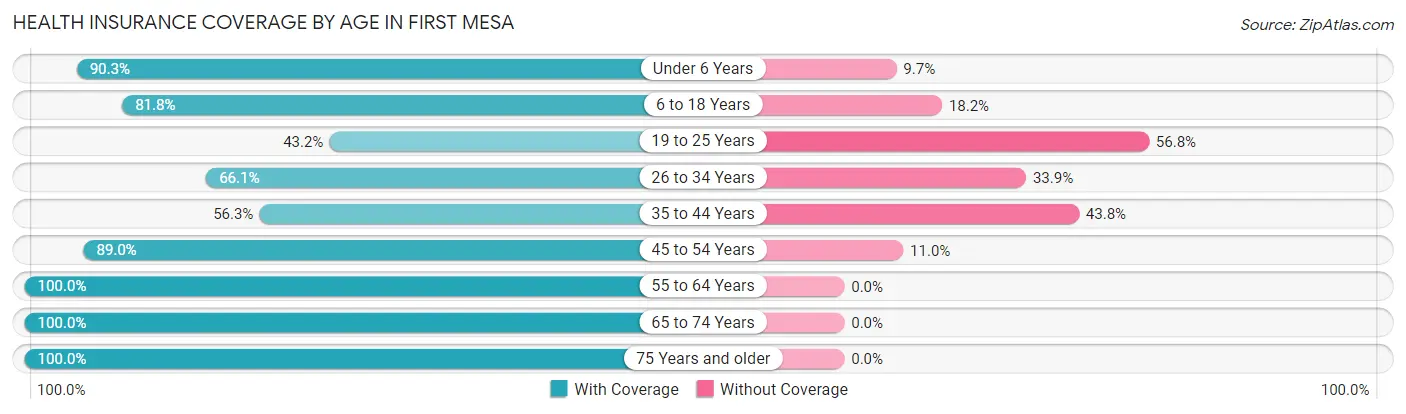
| Age Bracket | With Coverage | Without Coverage |
| Under 6 Years | 130 (90.3%) | 14 (9.7%) |
| 6 to 18 Years | 319 (81.8%) | 71 (18.2%) |
| 19 to 25 Years | 54 (43.2%) | 71 (56.8%) |
| 26 to 34 Years | 80 (66.1%) | 41 (33.9%) |
| 35 to 44 Years | 90 (56.2%) | 70 (43.8%) |
| 45 to 54 Years | 146 (89.0%) | 18 (11.0%) |
| 55 to 64 Years | 140 (100.0%) | 0 (0.0%) |
| 65 to 74 Years | 150 (100.0%) | 0 (0.0%) |
| 75 Years and older | 60 (100.0%) | 0 (0.0%) |
| Total | 1,169 (80.4%) | 285 (19.6%) |
Health Insurance Coverage by Citizenship Status in First Mesa
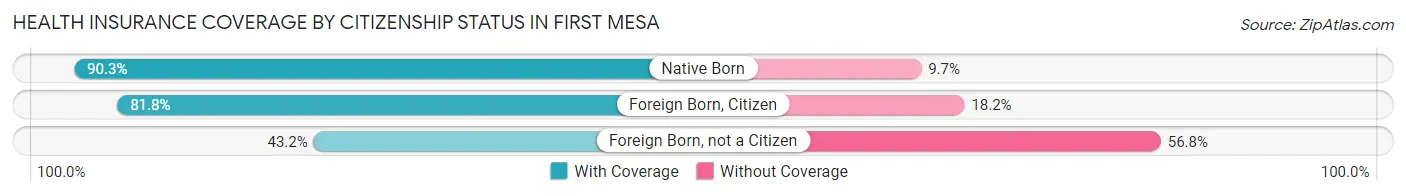
| Citizenship Status | With Coverage | Without Coverage |
| Native Born | 130 (90.3%) | 14 (9.7%) |
| Foreign Born, Citizen | 319 (81.8%) | 71 (18.2%) |
| Foreign Born, not a Citizen | 54 (43.2%) | 71 (56.8%) |
Health Insurance Coverage by Household Income in First Mesa
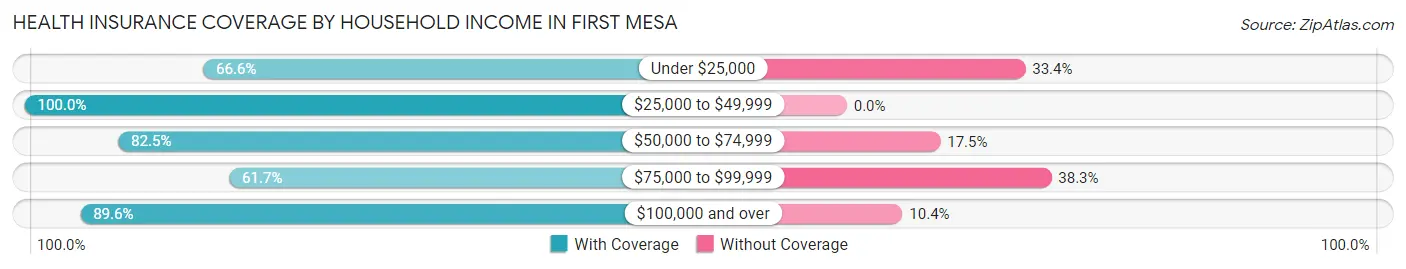
| Household Income | With Coverage | Without Coverage |
| Under $25,000 | 213 (66.6%) | 107 (33.4%) |
| $25,000 to $49,999 | 215 (100.0%) | 0 (0.0%) |
| $50,000 to $74,999 | 372 (82.5%) | 79 (17.5%) |
| $75,000 to $99,999 | 111 (61.7%) | 69 (38.3%) |
| $100,000 and over | 258 (89.6%) | 30 (10.4%) |
Public vs Private Health Insurance Coverage by Age in First Mesa
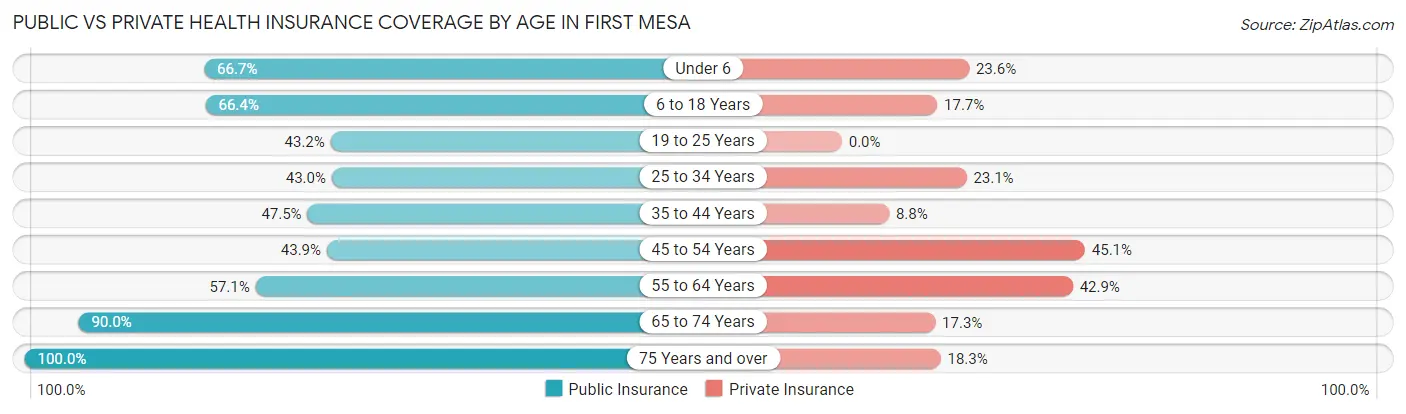
| Age Bracket | Public Insurance | Private Insurance |
| Under 6 | 96 (66.7%) | 34 (23.6%) |
| 6 to 18 Years | 259 (66.4%) | 69 (17.7%) |
| 19 to 25 Years | 54 (43.2%) | 0 (0.0%) |
| 25 to 34 Years | 52 (43.0%) | 28 (23.1%) |
| 35 to 44 Years | 76 (47.5%) | 14 (8.7%) |
| 45 to 54 Years | 72 (43.9%) | 74 (45.1%) |
| 55 to 64 Years | 80 (57.1%) | 60 (42.9%) |
| 65 to 74 Years | 135 (90.0%) | 26 (17.3%) |
| 75 Years and over | 60 (100.0%) | 11 (18.3%) |
| Total | 884 (60.8%) | 316 (21.7%) |
Disability Status by Sex by Age in First Mesa
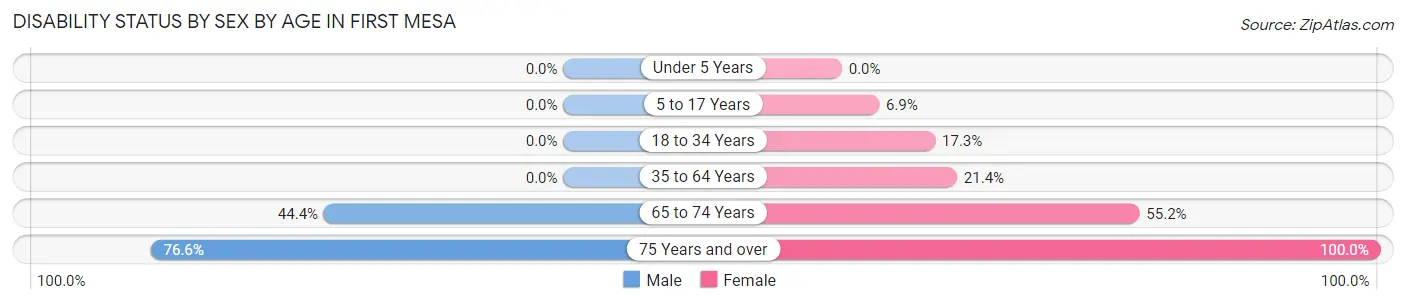
| Age Bracket | Male | Female |
| Under 5 Years | 0 (0.0%) | 0 (0.0%) |
| 5 to 17 Years | 0 (0.0%) | 15 (6.9%) |
| 18 to 34 Years | 0 (0.0%) | 22 (17.3%) |
| 35 to 64 Years | 0 (0.0%) | 53 (21.4%) |
| 65 to 74 Years | 20 (44.4%) | 58 (55.2%) |
| 75 Years and over | 36 (76.6%) | 13 (100.0%) |
Disability Class by Sex by Age in First Mesa
Disability Class: Hearing Difficulty
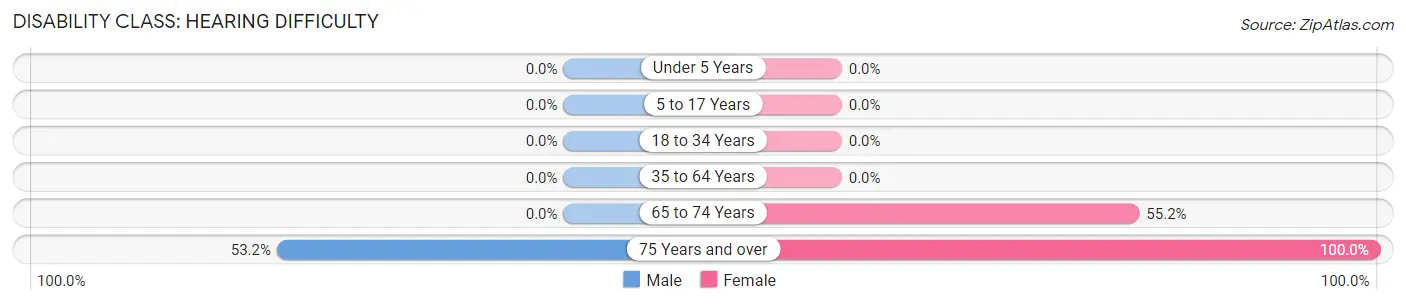
| Age Bracket | Male | Female |
| Under 5 Years | 0 (0.0%) | 0 (0.0%) |
| 5 to 17 Years | 0 (0.0%) | 0 (0.0%) |
| 18 to 34 Years | 0 (0.0%) | 0 (0.0%) |
| 35 to 64 Years | 0 (0.0%) | 0 (0.0%) |
| 65 to 74 Years | 0 (0.0%) | 58 (55.2%) |
| 75 Years and over | 25 (53.2%) | 13 (100.0%) |
Disability Class: Vision Difficulty
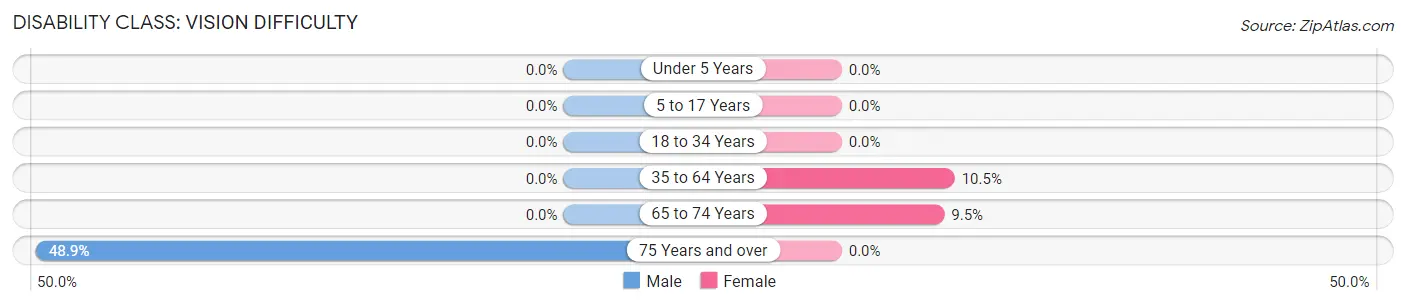
| Age Bracket | Male | Female |
| Under 5 Years | 0 (0.0%) | 0 (0.0%) |
| 5 to 17 Years | 0 (0.0%) | 0 (0.0%) |
| 18 to 34 Years | 0 (0.0%) | 0 (0.0%) |
| 35 to 64 Years | 0 (0.0%) | 26 (10.5%) |
| 65 to 74 Years | 0 (0.0%) | 10 (9.5%) |
| 75 Years and over | 23 (48.9%) | 0 (0.0%) |
Disability Class: Cognitive Difficulty
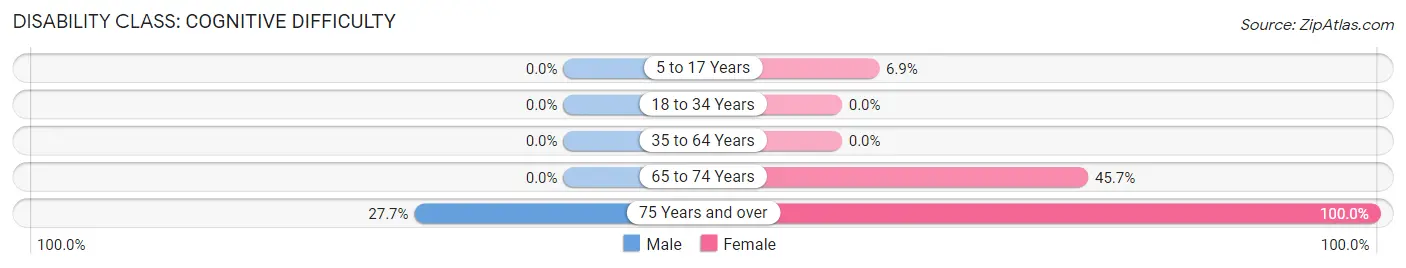
| Age Bracket | Male | Female |
| 5 to 17 Years | 0 (0.0%) | 15 (6.9%) |
| 18 to 34 Years | 0 (0.0%) | 0 (0.0%) |
| 35 to 64 Years | 0 (0.0%) | 0 (0.0%) |
| 65 to 74 Years | 0 (0.0%) | 48 (45.7%) |
| 75 Years and over | 13 (27.7%) | 13 (100.0%) |
Disability Class: Ambulatory Difficulty
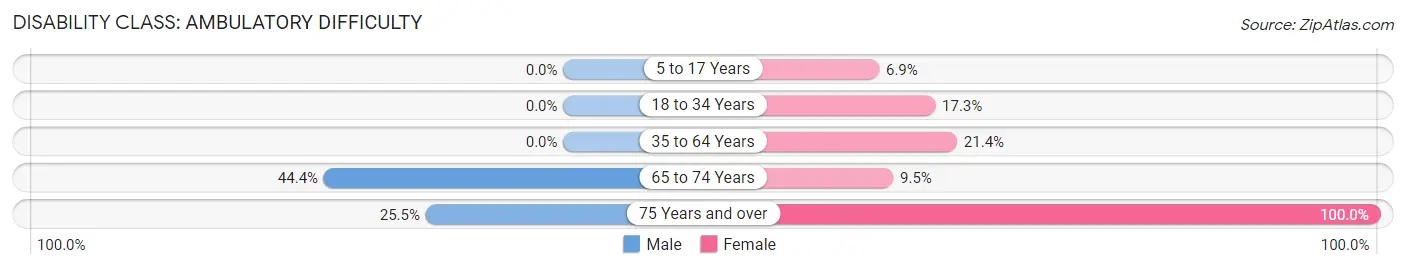
| Age Bracket | Male | Female |
| 5 to 17 Years | 0 (0.0%) | 15 (6.9%) |
| 18 to 34 Years | 0 (0.0%) | 22 (17.3%) |
| 35 to 64 Years | 0 (0.0%) | 53 (21.4%) |
| 65 to 74 Years | 20 (44.4%) | 10 (9.5%) |
| 75 Years and over | 12 (25.5%) | 13 (100.0%) |
Disability Class: Self-Care Difficulty
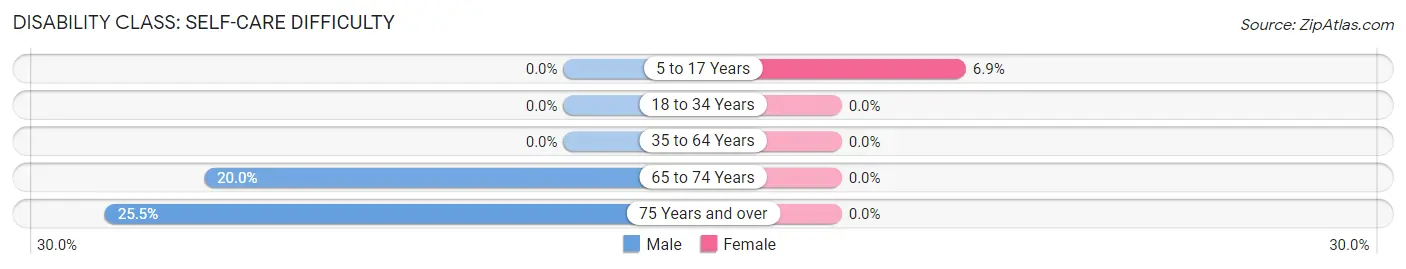
| Age Bracket | Male | Female |
| 5 to 17 Years | 0 (0.0%) | 15 (6.9%) |
| 18 to 34 Years | 0 (0.0%) | 0 (0.0%) |
| 35 to 64 Years | 0 (0.0%) | 0 (0.0%) |
| 65 to 74 Years | 9 (20.0%) | 0 (0.0%) |
| 75 Years and over | 12 (25.5%) | 0 (0.0%) |
Technology Access in First Mesa
Computing Device Access in First Mesa
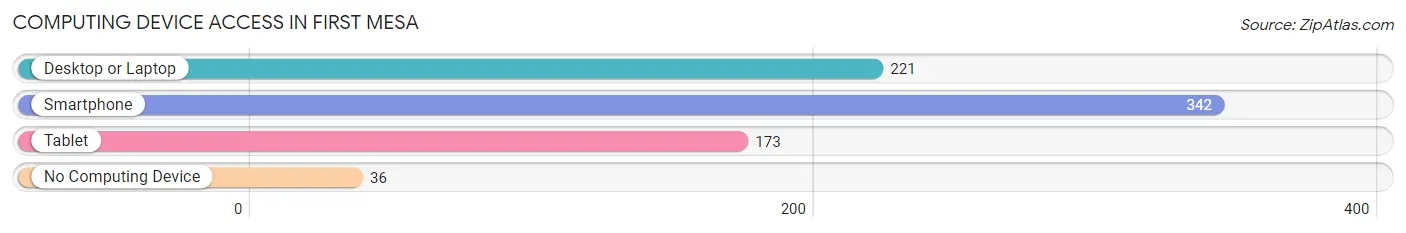
| Device Type | # Households | % Households |
| Desktop or Laptop | 221 | 51.8% |
| Smartphone | 342 | 80.1% |
| Tablet | 173 | 40.5% |
| No Computing Device | 36 | 8.4% |
| Total | 427 | 100.0% |
Internet Access in First Mesa
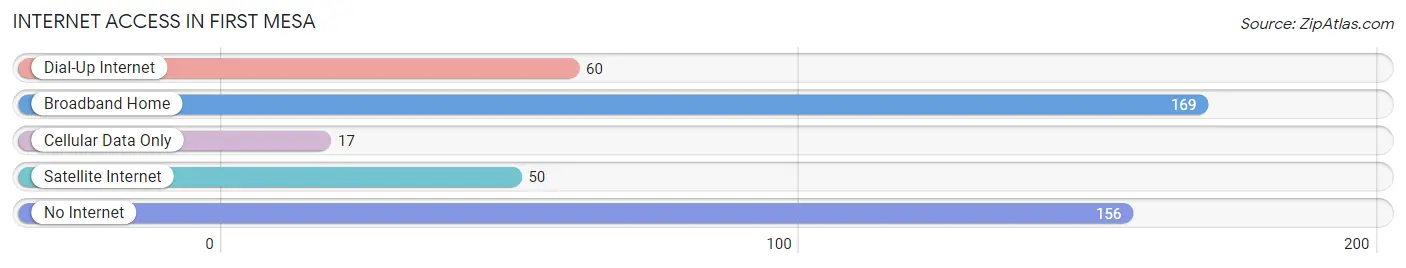
| Internet Type | # Households | % Households |
| Dial-Up Internet | 60 | 14.1% |
| Broadband Home | 169 | 39.6% |
| Cellular Data Only | 17 | 4.0% |
| Satellite Internet | 50 | 11.7% |
| No Internet | 156 | 36.5% |
| Total | 427 | 100.0% |
First Mesa Summary
Mesa, Arizona is a city located in Maricopa County, Arizona, United States. It is the third-largest city in Arizona, behind Phoenix and Tucson, and is the 38th-largest city in the United States. Mesa is located about 20 miles east of Phoenix and is part of the Phoenix metropolitan area. The city is home to a population of over 463,000 people, making it the largest suburb in the Phoenix area.
Geography
Mesa is located in the Sonoran Desert, at an elevation of 1,167 feet. The city is bordered by Tempe to the west, Gilbert to the south, Apache Junction to the east, and the Salt River Pima-Maricopa Indian Community to the north. The city covers an area of 131.3 square miles, with a population density of 3,541 people per square mile.
Climate
Mesa has a hot desert climate, with hot summers and mild winters. The average high temperature in July is 106°F, and the average low temperature in January is 40°F. The city receives an average of 8.5 inches of precipitation per year, with most of it falling in the summer months.
Economy
Mesa's economy is largely based on tourism, manufacturing, and technology. The city is home to several major employers, including Boeing, Intel, and Banner Health. The city also has a large retail sector, with several shopping malls and outlets.
Demographics
As of the 2010 census, Mesa had a population of 439,041. The racial makeup of the city was 73.3% White, 4.2% African American, 1.3% Native American, 2.2% Asian, 0.2% Pacific Islander, 16.2% from other races, and 2.7% from two or more races. Hispanic or Latino of any race were 33.2% of the population.
The median income for a household in Mesa was $50,735, and the median income for a family was $58,906. The per capita income for the city was $24,837. About 11.3% of families and 14.7% of the population were below the poverty line, including 19.2% of those under age 18 and 8.2% of those age 65 or over.
Education
Mesa is served by the Mesa Public Schools district, which includes over 60 elementary, middle, and high schools. The city is also home to several higher education institutions, including Arizona State University Polytechnic Campus, Mesa Community College, and the University of Phoenix.
Conclusion
Mesa, Arizona is a vibrant city located in Maricopa County, Arizona. The city is home to a population of over 463,000 people, making it the largest suburb in the Phoenix area. Mesa has a hot desert climate, with hot summers and mild winters. The city's economy is largely based on tourism, manufacturing, and technology, and it is home to several major employers. The city is served by the Mesa Public Schools district, and is home to several higher education institutions.
Common Questions
What is Per Capita Income in First Mesa?
Per Capita income in First Mesa is $17,054.
What is the Median Family Income in First Mesa?
Median Family Income in First Mesa is $52,500.
What is the Median Household income in First Mesa?
Median Household Income in First Mesa is $53,229.
What is Income or Wage Gap in First Mesa?
Income or Wage Gap in First Mesa is 11.3%.
Women in First Mesa earn 88.7 cents for every dollar earned by a man.
What is Inequality or Gini Index in First Mesa?
Inequality or Gini Index in First Mesa is 0.47.
What is the Total Population of First Mesa?
Total Population of First Mesa is 1,454.
What is the Total Male Population of First Mesa?
Total Male Population of First Mesa is 717.
What is the Total Female Population of First Mesa?
Total Female Population of First Mesa is 737.
What is the Ratio of Males per 100 Females in First Mesa?
There are 97.29 Males per 100 Females in First Mesa.
What is the Ratio of Females per 100 Males in First Mesa?
There are 102.79 Females per 100 Males in First Mesa.
What is the Median Population Age in First Mesa?
Median Population Age in First Mesa is 29.6 Years.
What is the Average Family Size in First Mesa
Average Family Size in First Mesa is 3.8 People.
What is the Average Household Size in First Mesa
Average Household Size in First Mesa is 3.4 People.
How Large is the Labor Force in First Mesa?
There are 462 People in the Labor Forcein in First Mesa.
What is the Percentage of People in the Labor Force in First Mesa?
47.6% of People are in the Labor Force in First Mesa.
What is the Unemployment Rate in First Mesa?
Unemployment Rate in First Mesa is 5.6%.