Kirkpatrick, OR Map & Demographics
Kirkpatrick Map
Kirkpatrick Overview
$57,716
PER CAPITA INCOME
$198,438
AVG FAMILY INCOME
$178,750
AVG HOUSEHOLD INCOME
0.34
INEQUALITY / GINI INDEX
242
TOTAL POPULATION
142
MALE POPULATION
100
FEMALE POPULATION
142.00
MALES / 100 FEMALES
70.42
FEMALES / 100 MALES
26.1
MEDIAN AGE
3.0
AVG FAMILY SIZE
3.6
AVG HOUSEHOLD SIZE
151
LABOR FORCE [ PEOPLE ]
65.9%
PERCENT IN LABOR FORCE
4.6%
UNEMPLOYMENT RATE
Income in Kirkpatrick
Income Overview in Kirkpatrick
Per Capita Income in Kirkpatrick is $57,716, while median incomes of families and households are $198,438 and $178,750 respectively.
| Characteristic | Number | Measure |
| Per Capita Income | 242 | $57,716 |
| Median Family Income | 65 | $198,438 |
| Mean Family Income | 65 | $197,942 |
| Median Household Income | 68 | $178,750 |
| Mean Household Income | 68 | $206,422 |
| Income Deficit | 65 | $0 |
| Wage / Income Gap (%) | 242 | 0.00% |
| Wage / Income Gap ($) | 242 | 100.00¢ per $1 |
| Gini / Inequality Index | 242 | 0.34 |
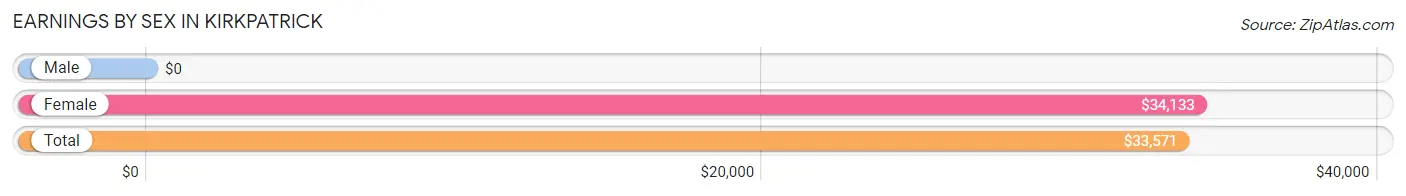
Earnings by Sex in Kirkpatrick
| Sex | Number | Average Earnings |
| Male | 102 (61.5%) | $0 |
| Female | 64 (38.6%) | $34,133 |
| Total | 166 (100.0%) | $33,571 |
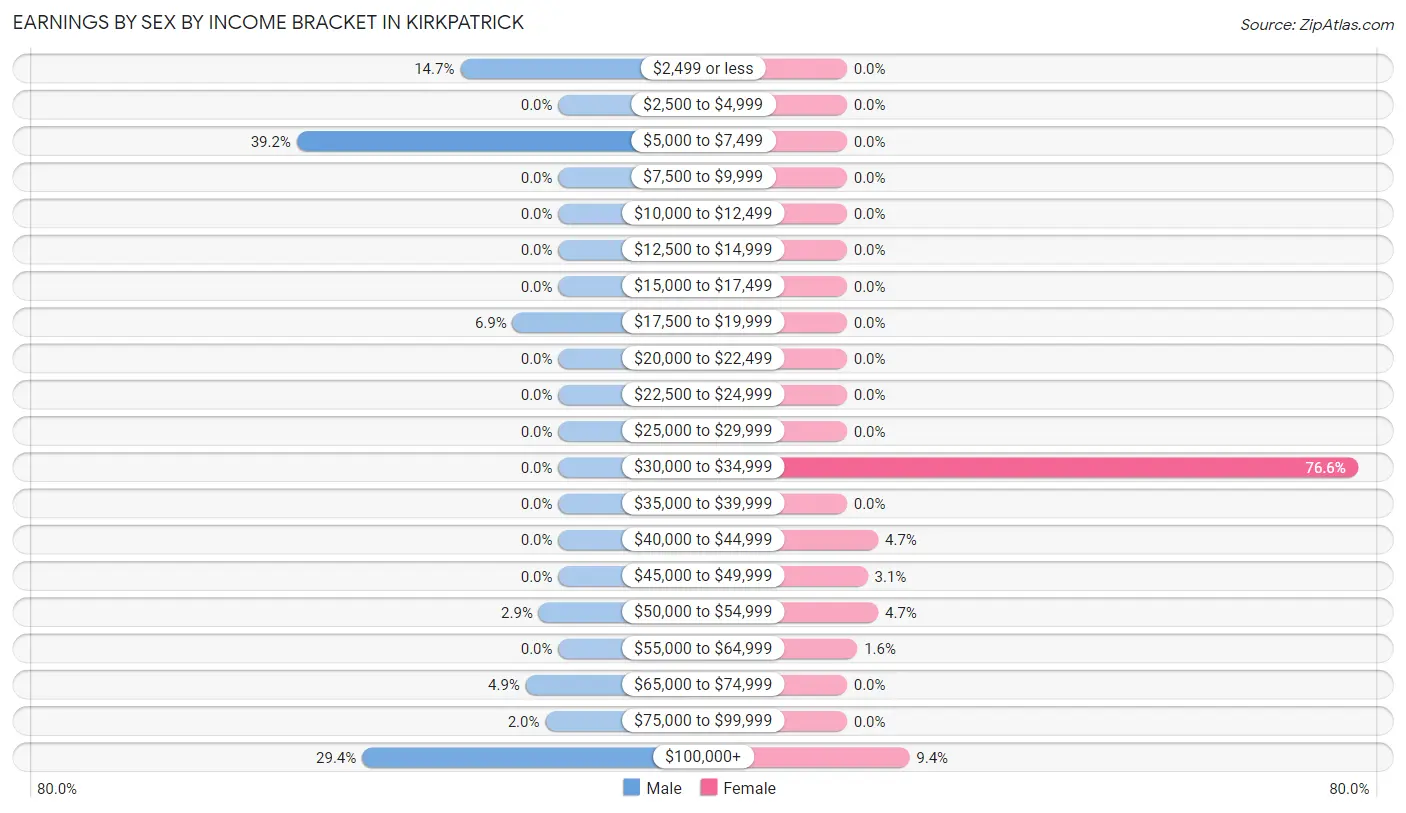
Earnings by Sex by Income Bracket in Kirkpatrick
The most common earnings brackets in Kirkpatrick are $5,000 to $7,499 for men (40 | 39.2%) and $30,000 to $34,999 for women (49 | 76.6%).
| Income | Male | Female |
| $2,499 or less | 15 (14.7%) | 0 (0.0%) |
| $2,500 to $4,999 | 0 (0.0%) | 0 (0.0%) |
| $5,000 to $7,499 | 40 (39.2%) | 0 (0.0%) |
| $7,500 to $9,999 | 0 (0.0%) | 0 (0.0%) |
| $10,000 to $12,499 | 0 (0.0%) | 0 (0.0%) |
| $12,500 to $14,999 | 0 (0.0%) | 0 (0.0%) |
| $15,000 to $17,499 | 0 (0.0%) | 0 (0.0%) |
| $17,500 to $19,999 | 7 (6.9%) | 0 (0.0%) |
| $20,000 to $22,499 | 0 (0.0%) | 0 (0.0%) |
| $22,500 to $24,999 | 0 (0.0%) | 0 (0.0%) |
| $25,000 to $29,999 | 0 (0.0%) | 0 (0.0%) |
| $30,000 to $34,999 | 0 (0.0%) | 49 (76.6%) |
| $35,000 to $39,999 | 0 (0.0%) | 0 (0.0%) |
| $40,000 to $44,999 | 0 (0.0%) | 3 (4.7%) |
| $45,000 to $49,999 | 0 (0.0%) | 2 (3.1%) |
| $50,000 to $54,999 | 3 (2.9%) | 3 (4.7%) |
| $55,000 to $64,999 | 0 (0.0%) | 1 (1.6%) |
| $65,000 to $74,999 | 5 (4.9%) | 0 (0.0%) |
| $75,000 to $99,999 | 2 (2.0%) | 0 (0.0%) |
| $100,000+ | 30 (29.4%) | 6 (9.4%) |
| Total | 102 (100.0%) | 64 (100.0%) |
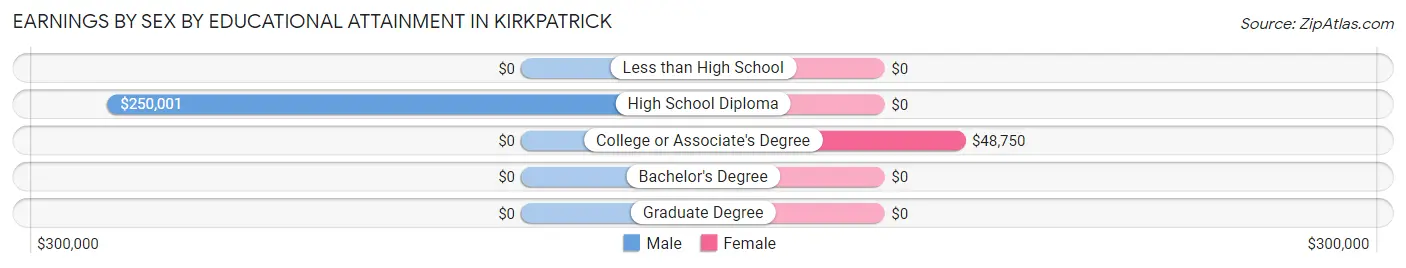
Earnings by Sex by Educational Attainment in Kirkpatrick
Average earnings in Kirkpatrick are $250,001 for men and $49,375 for women, a difference of 80.2%. Men with an educational attainment of high school diploma enjoy the highest average annual earnings of $250,001, while those with high school diploma education earn the least with $250,001. Women with an educational attainment of college or associate's degree earn the most with the average annual earnings of $48,750, while those with college or associate's degree education have the smallest earnings of $48,750.
| Educational Attainment | Male Income | Female Income |
| Less than High School | - | - |
| High School Diploma | $250,001 | $0 |
| College or Associate's Degree | - | - |
| Bachelor's Degree | - | - |
| Graduate Degree | - | - |
| Total | $250,001 | $49,375 |
Family Income in Kirkpatrick
Family Income Brackets in Kirkpatrick
According to the Kirkpatrick family income data, there are 30 families falling into the $200,000+ income range, which is the most common income bracket and makes up 46.2% of all families.
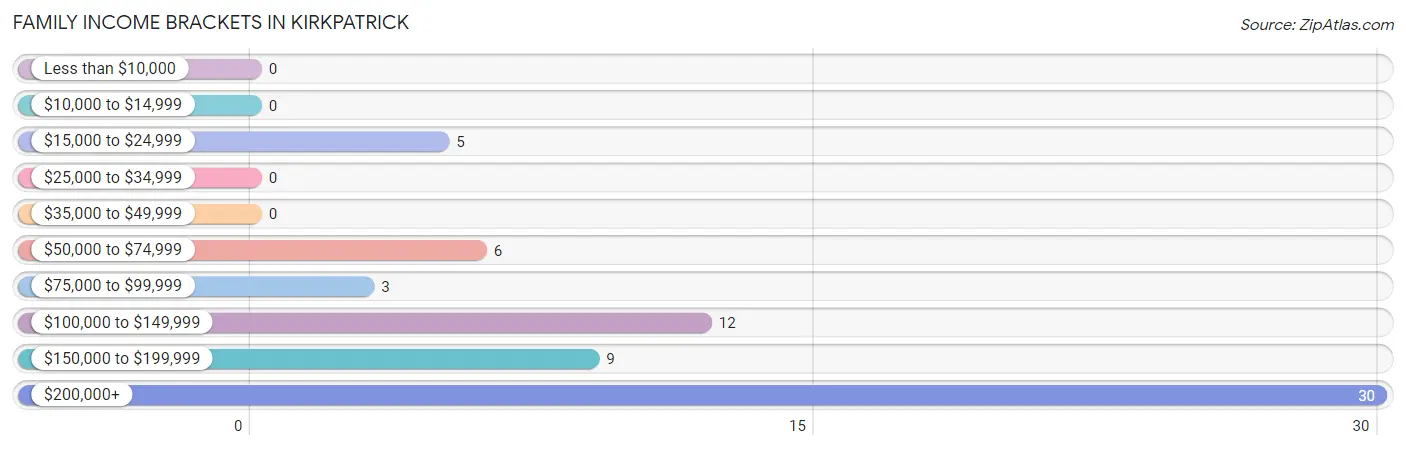
| Income Bracket | # Families | % Families |
| Less than $10,000 | 0 | 0.0% |
| $10,000 to $14,999 | 0 | 0.0% |
| $15,000 to $24,999 | 5 | 7.7% |
| $25,000 to $34,999 | 0 | 0.0% |
| $35,000 to $49,999 | 0 | 0.0% |
| $50,000 to $74,999 | 6 | 9.2% |
| $75,000 to $99,999 | 3 | 4.6% |
| $100,000 to $149,999 | 12 | 18.5% |
| $150,000 to $199,999 | 9 | 13.8% |
| $200,000+ | 30 | 46.2% |
Family Income by Famaliy Size in Kirkpatrick
2-person families (29 | 44.6%) account for the highest median family income in Kirkpatrick with $121,750 per family, while 2-person families (29 | 44.6%) have the highest median income of $60,875 per family member.
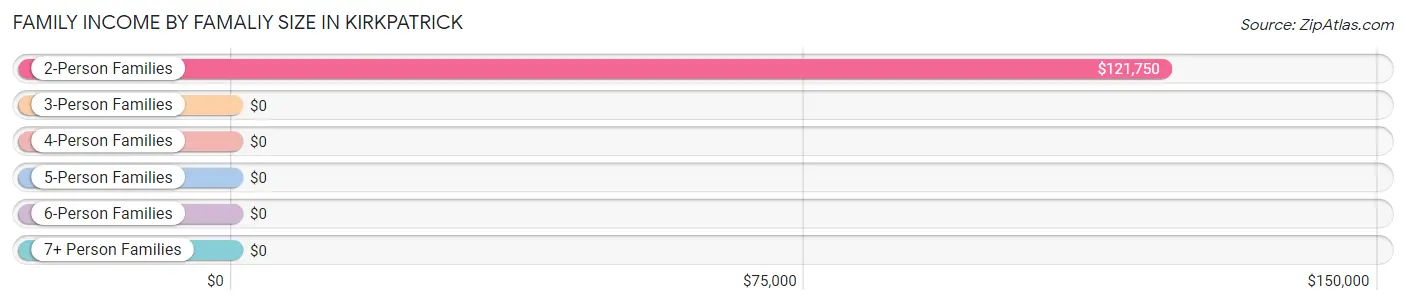
| Income Bracket | # Families | Median Income |
| 2-Person Families | 29 (44.6%) | $121,750 |
| 3-Person Families | 5 (7.7%) | $0 |
| 4-Person Families | 27 (41.5%) | $0 |
| 5-Person Families | 0 (0.0%) | $0 |
| 6-Person Families | 4 (6.1%) | $0 |
| 7+ Person Families | 0 (0.0%) | $0 |
| Total | 65 (100.0%) | $198,438 |
Family Income by Number of Earners in Kirkpatrick
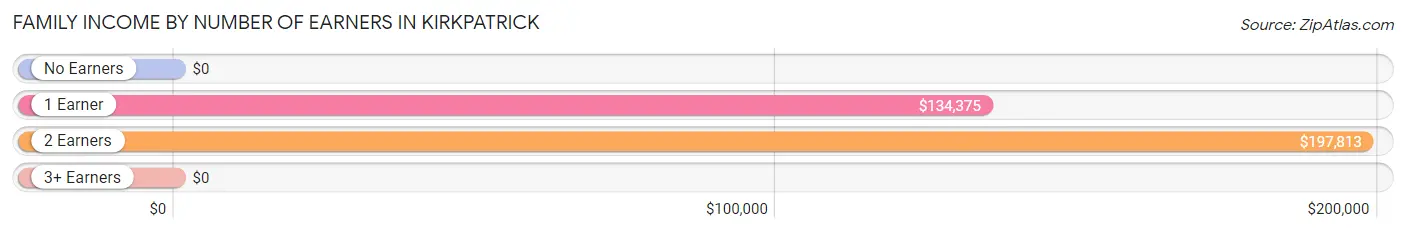
| Number of Earners | # Families | Median Income |
| No Earners | 15 (23.1%) | $0 |
| 1 Earner | 7 (10.8%) | $134,375 |
| 2 Earners | 19 (29.2%) | $197,813 |
| 3+ Earners | 24 (36.9%) | $0 |
| Total | 65 (100.0%) | $198,438 |
Household Income in Kirkpatrick
Household Income Brackets in Kirkpatrick
With 30 households falling in the category, the $200,000+ income range is the most frequent in Kirkpatrick, accounting for 44.1% of all households.
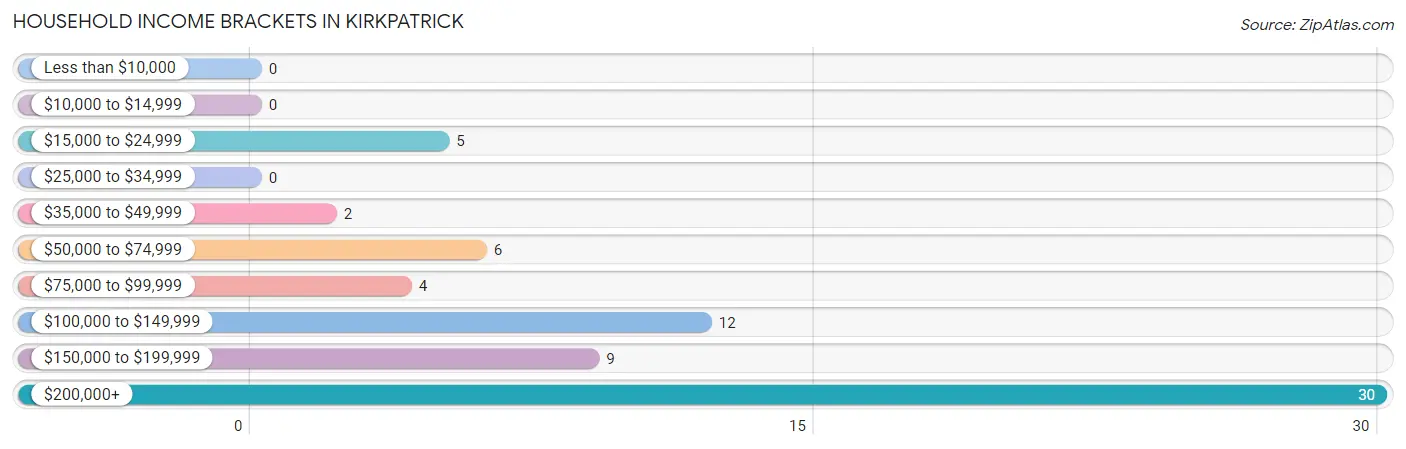
| Income Bracket | # Households | % Households |
| Less than $10,000 | 0 | 0.0% |
| $10,000 to $14,999 | 0 | 0.0% |
| $15,000 to $24,999 | 5 | 7.4% |
| $25,000 to $34,999 | 0 | 0.0% |
| $35,000 to $49,999 | 2 | 2.9% |
| $50,000 to $74,999 | 6 | 8.8% |
| $75,000 to $99,999 | 4 | 5.9% |
| $100,000 to $149,999 | 12 | 17.6% |
| $150,000 to $199,999 | 9 | 13.2% |
| $200,000+ | 30 | 44.1% |
Household Income by Householder Age in Kirkpatrick
The median household income in Kirkpatrick is $178,750, with the highest median household income of $250,001 found in the 45 to 64 years age bracket for the primary householder. A total of 39 households (57.4%) fall into this category.
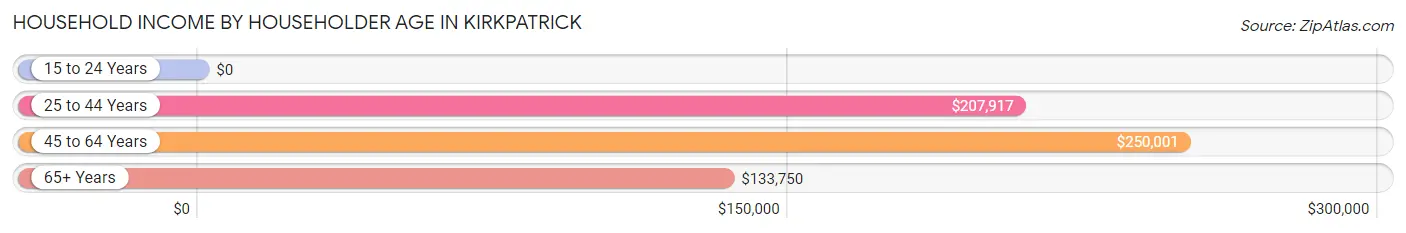
| Income Bracket | # Households | Median Income |
| 15 to 24 Years | 0 (0.0%) | $0 |
| 25 to 44 Years | 11 (16.2%) | $207,917 |
| 45 to 64 Years | 39 (57.4%) | $250,001 |
| 65+ Years | 18 (26.5%) | $133,750 |
| Total | 68 (100.0%) | $178,750 |
Poverty in Kirkpatrick
Income Below Poverty by Sex and Age in Kirkpatrick
With 34.5% poverty level for males and 5.0% for females among the residents of Kirkpatrick, 18 to 24 year old males and 55 to 64 year old females are the most vulnerable to poverty, with 40 males (93.0%) and 5 females (31.2%) in their respective age groups living below the poverty level.
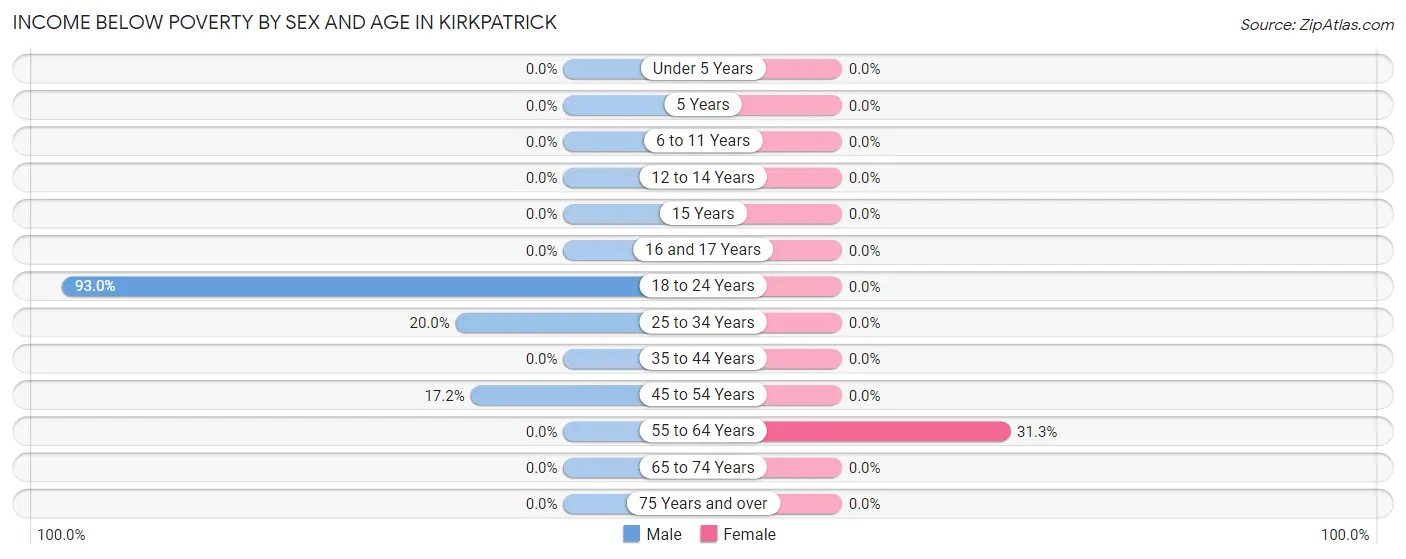
| Age Bracket | Male | Female |
| Under 5 Years | 0 (0.0%) | 0 (0.0%) |
| 5 Years | 0 (0.0%) | 0 (0.0%) |
| 6 to 11 Years | 0 (0.0%) | 0 (0.0%) |
| 12 to 14 Years | 0 (0.0%) | 0 (0.0%) |
| 15 Years | 0 (0.0%) | 0 (0.0%) |
| 16 and 17 Years | 0 (0.0%) | 0 (0.0%) |
| 18 to 24 Years | 40 (93.0%) | 0 (0.0%) |
| 25 to 34 Years | 3 (20.0%) | 0 (0.0%) |
| 35 to 44 Years | 0 (0.0%) | 0 (0.0%) |
| 45 to 54 Years | 5 (17.2%) | 0 (0.0%) |
| 55 to 64 Years | 0 (0.0%) | 5 (31.2%) |
| 65 to 74 Years | 0 (0.0%) | 0 (0.0%) |
| 75 Years and over | 0 (0.0%) | 0 (0.0%) |
| Total | 48 (34.5%) | 5 (5.0%) |
Income Above Poverty by Sex and Age in Kirkpatrick
According to the poverty statistics in Kirkpatrick, males aged under 5 years and females aged 6 to 11 years are the age groups that are most secure financially, with 100.0% of males and 100.0% of females in these age groups living above the poverty line.
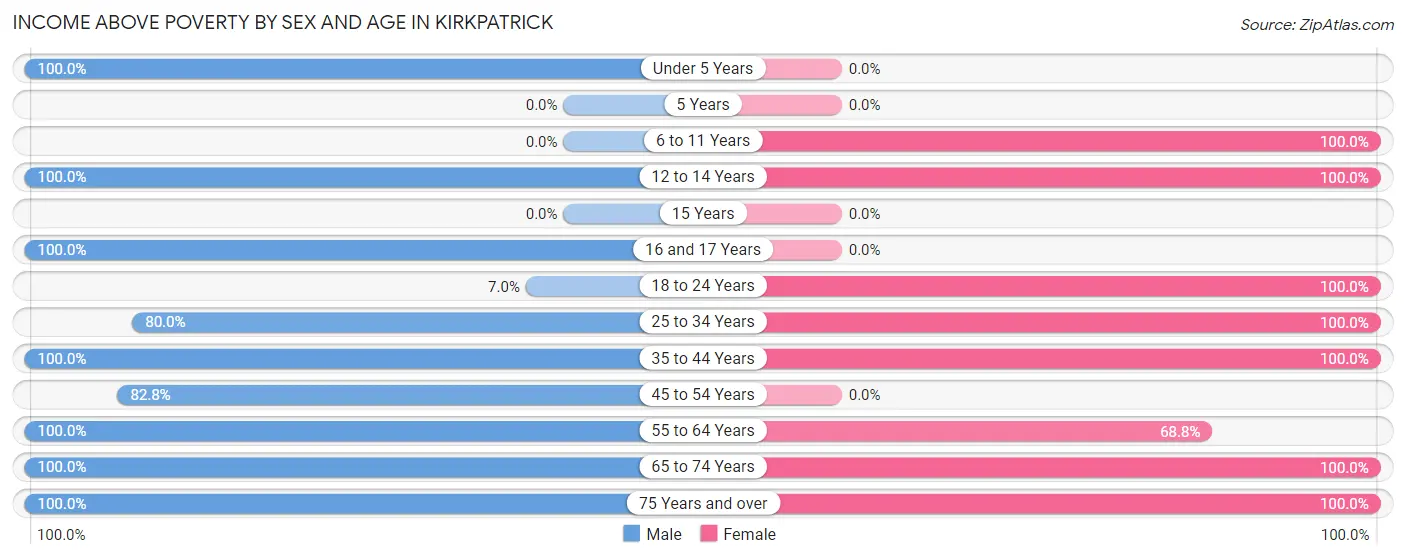
| Age Bracket | Male | Female |
| Under 5 Years | 2 (100.0%) | 0 (0.0%) |
| 5 Years | 0 (0.0%) | 0 (0.0%) |
| 6 to 11 Years | 0 (0.0%) | 2 (100.0%) |
| 12 to 14 Years | 2 (100.0%) | 4 (100.0%) |
| 15 Years | 0 (0.0%) | 0 (0.0%) |
| 16 and 17 Years | 15 (100.0%) | 0 (0.0%) |
| 18 to 24 Years | 3 (7.0%) | 43 (100.0%) |
| 25 to 34 Years | 12 (80.0%) | 11 (100.0%) |
| 35 to 44 Years | 6 (100.0%) | 5 (100.0%) |
| 45 to 54 Years | 24 (82.8%) | 0 (0.0%) |
| 55 to 64 Years | 9 (100.0%) | 11 (68.8%) |
| 65 to 74 Years | 14 (100.0%) | 12 (100.0%) |
| 75 Years and over | 4 (100.0%) | 7 (100.0%) |
| Total | 91 (65.5%) | 95 (95.0%) |
Income Below Poverty Among Married-Couple Families in Kirkpatrick
The poverty statistics for married-couple families in Kirkpatrick show that 12.2% or 5 of the total 41 families live below the poverty line. Families with no children have the highest poverty rate of 14.7%, comprising of 5 families. On the other hand, families with 1 or 2 children have the lowest poverty rate of 0.0%, which includes 0 families.
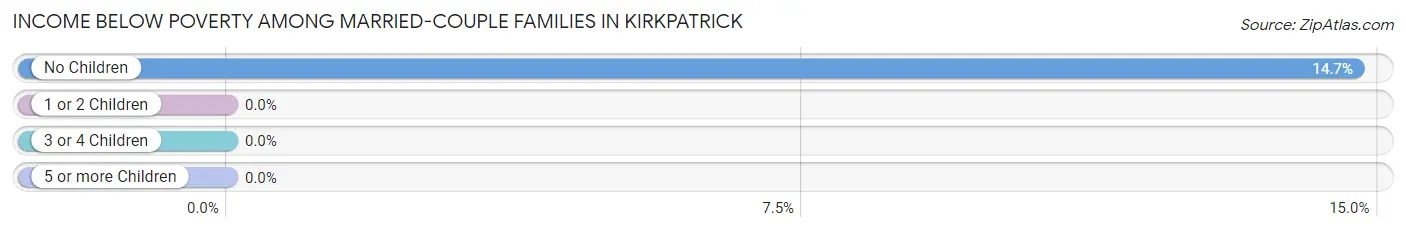
| Children | Above Poverty | Below Poverty |
| No Children | 29 (85.3%) | 5 (14.7%) |
| 1 or 2 Children | 7 (100.0%) | 0 (0.0%) |
| 3 or 4 Children | 0 (0.0%) | 0 (0.0%) |
| 5 or more Children | 0 (0.0%) | 0 (0.0%) |
| Total | 36 (87.8%) | 5 (12.2%) |
Income Below Poverty Among Single-Parent Households in Kirkpatrick
| Children | Single Father | Single Mother |
| No Children | 0 (0.0%) | 0 (0.0%) |
| 1 or 2 Children | 0 (0.0%) | 0 (0.0%) |
| 3 or 4 Children | 0 (0.0%) | 0 (0.0%) |
| 5 or more Children | 0 (0.0%) | 0 (0.0%) |
| Total | 0 (0.0%) | 0 (0.0%) |
Income Below Poverty Among Married-Couple vs Single-Parent Households in Kirkpatrick
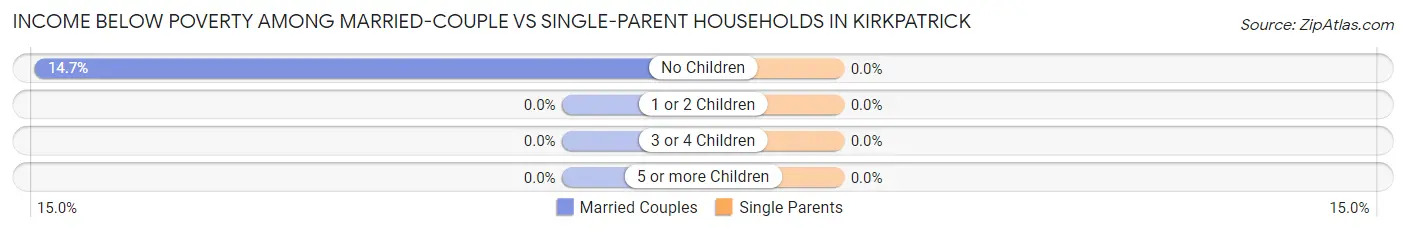
| Children | Married-Couple Families | Single-Parent Households |
| No Children | 5 (14.7%) | 0 (0.0%) |
| 1 or 2 Children | 0 (0.0%) | 0 (0.0%) |
| 3 or 4 Children | 0 (0.0%) | 0 (0.0%) |
| 5 or more Children | 0 (0.0%) | 0 (0.0%) |
| Total | 5 (12.2%) | 0 (0.0%) |
Race in Kirkpatrick
The most populous races in Kirkpatrick are White / Caucasian (182 | 75.2%), Native / Alaskan (54 | 22.3%), and Asian (6 | 2.5%).
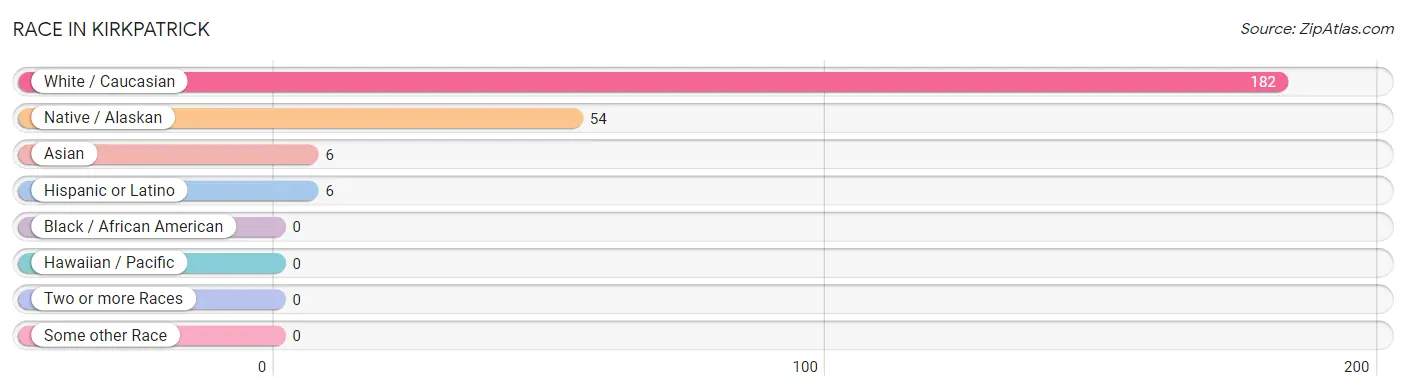
| Race | # Population | % Population |
| Asian | 6 | 2.5% |
| Black / African American | 0 | 0.0% |
| Hawaiian / Pacific | 0 | 0.0% |
| Hispanic or Latino | 6 | 2.5% |
| Native / Alaskan | 54 | 22.3% |
| White / Caucasian | 182 | 75.2% |
| Two or more Races | 0 | 0.0% |
| Some other Race | 0 | 0.0% |
| Total | 242 | 100.0% |
Ancestry in Kirkpatrick
The most populous ancestries reported in Kirkpatrick are German (97 | 40.1%), English (95 | 39.3%), Irish (18 | 7.4%), American (10 | 4.1%), and Yakama (8 | 3.3%), together accounting for 94.2% of all Kirkpatrick residents.
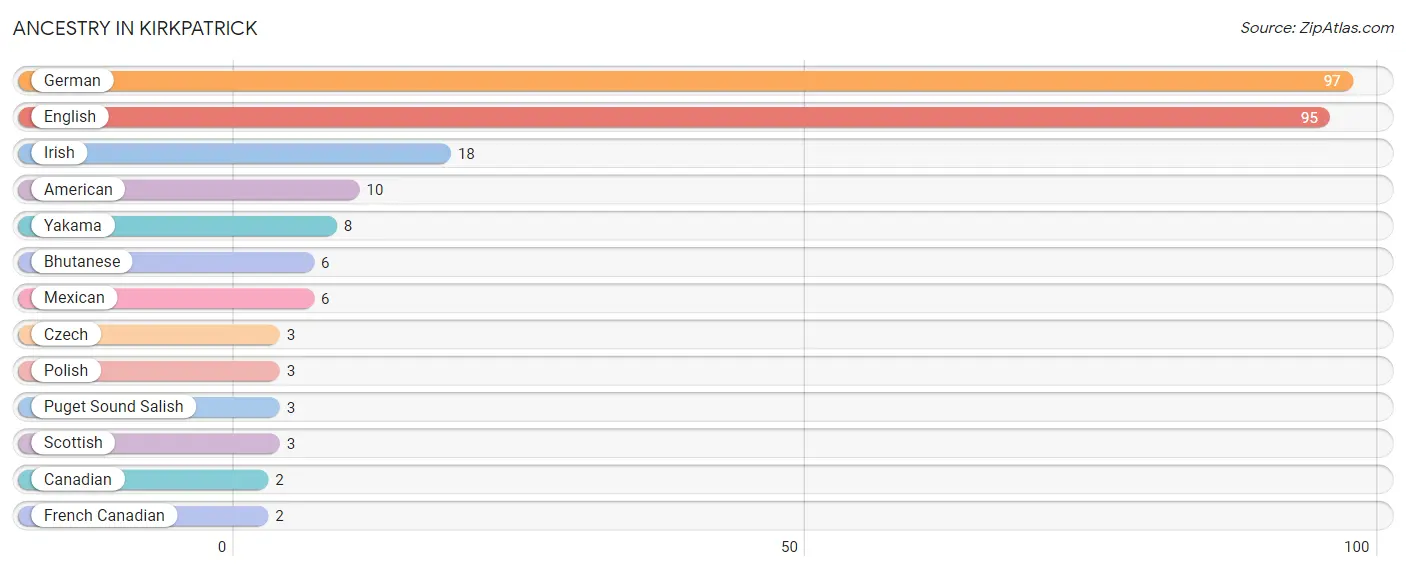
| Ancestry | # Population | % Population |
| American | 10 | 4.1% |
| Bhutanese | 6 | 2.5% |
| Canadian | 2 | 0.8% |
| Czech | 3 | 1.2% |
| English | 95 | 39.3% |
| French Canadian | 2 | 0.8% |
| German | 97 | 40.1% |
| Irish | 18 | 7.4% |
| Mexican | 6 | 2.5% |
| Polish | 3 | 1.2% |
| Puget Sound Salish | 3 | 1.2% |
| Scottish | 3 | 1.2% |
| Yakama | 8 | 3.3% | View All 13 Rows |
Immigrants in Kirkpatrick

| Immigration Origin | # Population | % Population | View All 0 Rows |
Sex and Age in Kirkpatrick
Sex and Age in Kirkpatrick
The most populous age groups in Kirkpatrick are 20 to 24 Years (43 | 30.3%) for men and 20 to 24 Years (43 | 43.0%) for women.
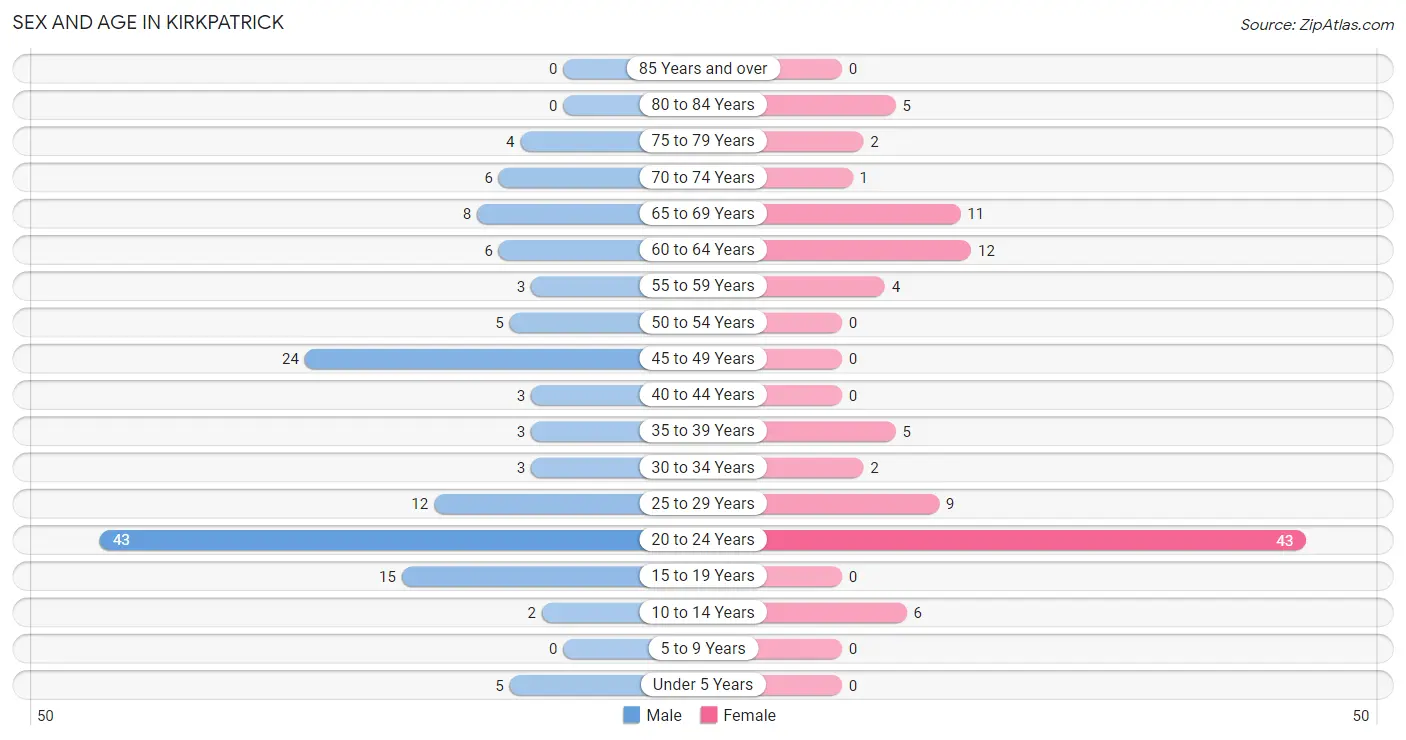
| Age Bracket | Male | Female |
| Under 5 Years | 5 (3.5%) | 0 (0.0%) |
| 5 to 9 Years | 0 (0.0%) | 0 (0.0%) |
| 10 to 14 Years | 2 (1.4%) | 6 (6.0%) |
| 15 to 19 Years | 15 (10.6%) | 0 (0.0%) |
| 20 to 24 Years | 43 (30.3%) | 43 (43.0%) |
| 25 to 29 Years | 12 (8.5%) | 9 (9.0%) |
| 30 to 34 Years | 3 (2.1%) | 2 (2.0%) |
| 35 to 39 Years | 3 (2.1%) | 5 (5.0%) |
| 40 to 44 Years | 3 (2.1%) | 0 (0.0%) |
| 45 to 49 Years | 24 (16.9%) | 0 (0.0%) |
| 50 to 54 Years | 5 (3.5%) | 0 (0.0%) |
| 55 to 59 Years | 3 (2.1%) | 4 (4.0%) |
| 60 to 64 Years | 6 (4.2%) | 12 (12.0%) |
| 65 to 69 Years | 8 (5.6%) | 11 (11.0%) |
| 70 to 74 Years | 6 (4.2%) | 1 (1.0%) |
| 75 to 79 Years | 4 (2.8%) | 2 (2.0%) |
| 80 to 84 Years | 0 (0.0%) | 5 (5.0%) |
| 85 Years and over | 0 (0.0%) | 0 (0.0%) |
| Total | 142 (100.0%) | 100 (100.0%) |
Families and Households in Kirkpatrick
Median Family Size in Kirkpatrick
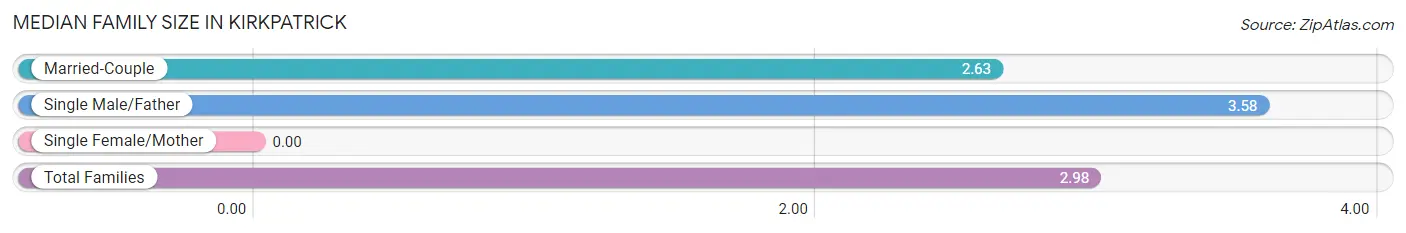
| Family Type | # Families | Family Size |
| Married-Couple | 41 (63.1%) | 2.63 |
| Single Male/Father | 24 (36.9%) | 3.58 |
| Single Female/Mother | 0 (0.0%) | - |
| Total Families | 65 (100.0%) | 2.98 |
Median Household Size in Kirkpatrick
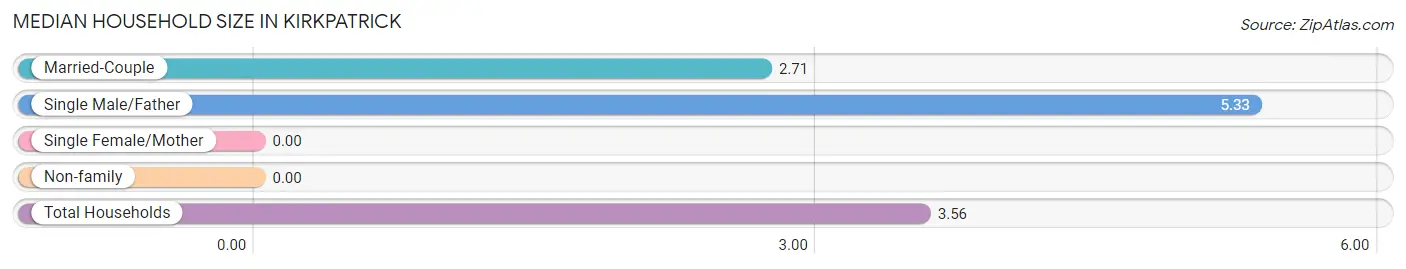
| Household Type | # Households | Household Size |
| Married-Couple | 41 (60.3%) | 2.71 |
| Single Male/Father | 24 (35.3%) | 5.33 |
| Single Female/Mother | 0 (0.0%) | - |
| Non-family | 3 (4.4%) | - |
| Total Households | 68 (100.0%) | 3.56 |
Household Size by Marriage Status in Kirkpatrick
Out of a total of 68 households in Kirkpatrick, 65 (95.6%) are family households, while 3 (4.4%) are nonfamily households. The most numerous type of family households are 2-person households, comprising 29, and the most common type of nonfamily households are 1-person households, comprising 3.
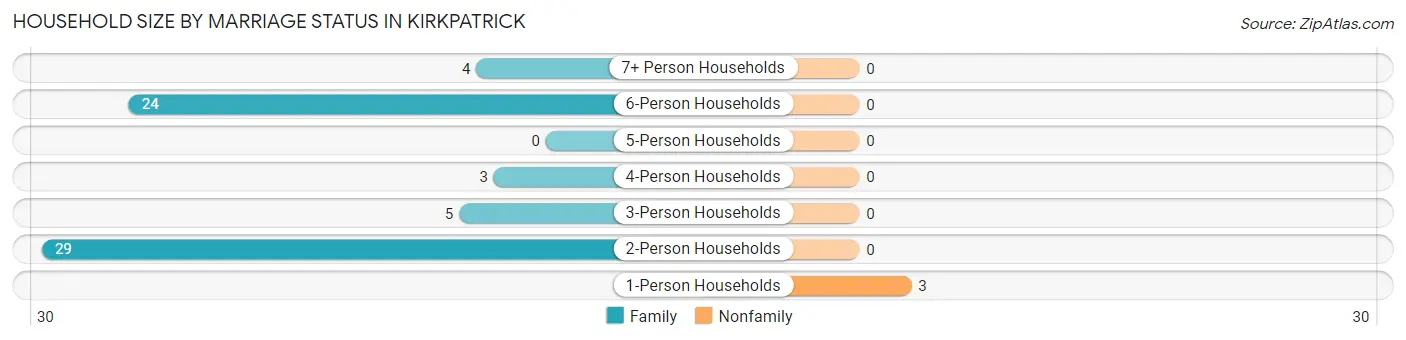
| Household Size | Family Households | Nonfamily Households |
| 1-Person Households | - | 3 (4.4%) |
| 2-Person Households | 29 (42.6%) | 0 (0.0%) |
| 3-Person Households | 5 (7.3%) | 0 (0.0%) |
| 4-Person Households | 3 (4.4%) | 0 (0.0%) |
| 5-Person Households | 0 (0.0%) | 0 (0.0%) |
| 6-Person Households | 24 (35.3%) | 0 (0.0%) |
| 7+ Person Households | 4 (5.9%) | 0 (0.0%) |
| Total | 65 (95.6%) | 3 (4.4%) |
Female Fertility in Kirkpatrick
Fertility by Age in Kirkpatrick
| Age Bracket | Women with Births | Births / 1,000 Women |
| 15 to 19 years | 0 (0.0%) | 0.0 |
| 20 to 34 years | 0 (0.0%) | 0.0 |
| 35 to 50 years | 0 (0.0%) | 0.0 |
| Total | 0 (0.0%) | 0.0 |
Fertility by Age by Marriage Status in Kirkpatrick
| Age Bracket | Married | Unmarried |
| 15 to 19 years | 0 (0.0%) | 0 (0.0%) |
| 20 to 34 years | 0 (0.0%) | 0 (0.0%) |
| 35 to 50 years | 0 (0.0%) | 0 (0.0%) |
| Total | 0 (0.0%) | 0 (0.0%) |
Fertility by Education in Kirkpatrick
| Educational Attainment | Women with Births | Births / 1,000 Women |
| Less than High School | 0 (0.0%) | 0.0 |
| High School Diploma | 0 (0.0%) | 0.0 |
| College or Associate's Degree | 0 (0.0%) | 0.0 |
| Bachelor's Degree | 0 (0.0%) | 0.0 |
| Graduate Degree | 0 (0.0%) | 0.0 |
| Total | 0 (0.0%) | 0.0 |
Fertility by Education by Marriage Status in Kirkpatrick
| Educational Attainment | Married | Unmarried |
| Less than High School | 0 (0.0%) | 0 (0.0%) |
| High School Diploma | 0 (0.0%) | 0 (0.0%) |
| College or Associate's Degree | 0 (0.0%) | 0 (0.0%) |
| Bachelor's Degree | 0 (0.0%) | 0 (0.0%) |
| Graduate Degree | 0 (0.0%) | 0 (0.0%) |
| Total | 0 (0.0%) | 0 (0.0%) |
Employment Characteristics in Kirkpatrick
Employment by Class of Employer in Kirkpatrick
Among the 144 employed individuals in Kirkpatrick, private company employees (108 | 75.0%), self-employed (incorporated) (28 | 19.4%), and state government employees (7 | 4.9%) make up the most common classes of employment.
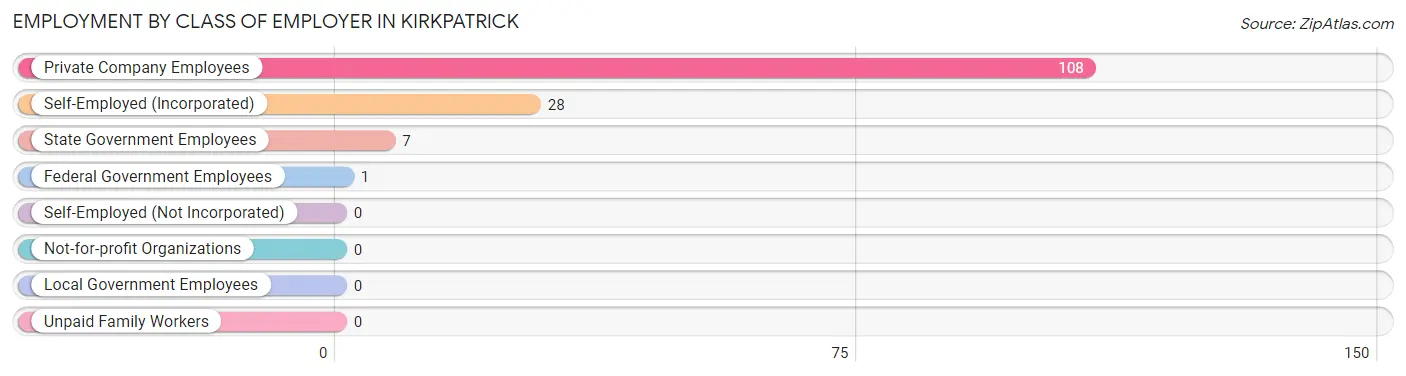
| Employer Class | # Employees | % Employees |
| Private Company Employees | 108 | 75.0% |
| Self-Employed (Incorporated) | 28 | 19.4% |
| Self-Employed (Not Incorporated) | 0 | 0.0% |
| Not-for-profit Organizations | 0 | 0.0% |
| Local Government Employees | 0 | 0.0% |
| State Government Employees | 7 | 4.9% |
| Federal Government Employees | 1 | 0.7% |
| Unpaid Family Workers | 0 | 0.0% |
| Total | 144 | 100.0% |
Employment Status by Age in Kirkpatrick
According to the labor force statistics for Kirkpatrick, out of the total population over 16 years of age (229), 65.9% or 151 individuals are in the labor force, with 4.6% or 7 of them unemployed. The age group with the highest labor force participation rate is 20 to 24 years, with 100.0% or 86 individuals in the labor force. Within the labor force, the 25 to 29 years age range has the highest percentage of unemployed individuals, with 46.7% or 7 of them being unemployed.
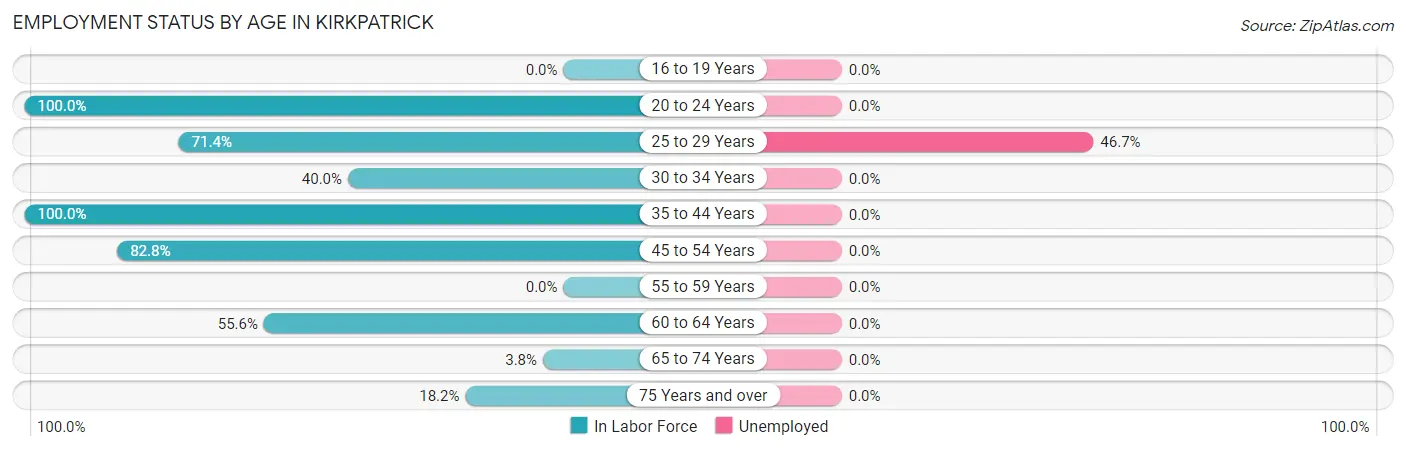
| Age Bracket | In Labor Force | Unemployed |
| 16 to 19 Years | 0 (0.0%) | 0 (0.0%) |
| 20 to 24 Years | 86 (100.0%) | 0 (0.0%) |
| 25 to 29 Years | 15 (71.4%) | 7 (46.7%) |
| 30 to 34 Years | 2 (40.0%) | 0 (0.0%) |
| 35 to 44 Years | 11 (100.0%) | 0 (0.0%) |
| 45 to 54 Years | 24 (82.8%) | 0 (0.0%) |
| 55 to 59 Years | 0 (0.0%) | 0 (0.0%) |
| 60 to 64 Years | 10 (55.6%) | 0 (0.0%) |
| 65 to 74 Years | 1 (3.8%) | 0 (0.0%) |
| 75 Years and over | 2 (18.2%) | 0 (0.0%) |
| Total | 151 (65.9%) | 7 (4.6%) |
Employment Status by Educational Attainment in Kirkpatrick
According to labor force statistics for Kirkpatrick, 68.1% of individuals (62) out of the total population between 25 and 64 years of age (91) are in the labor force, with 11.3% or 7 of them being unemployed. The group with the highest labor force participation rate are those with the educational attainment of bachelor's degree or higher, with 100.0% or 10 individuals in the labor force. Within the labor force, individuals with less than high school education have the highest percentage of unemployment, with 100.0% or 7 of them being unemployed.
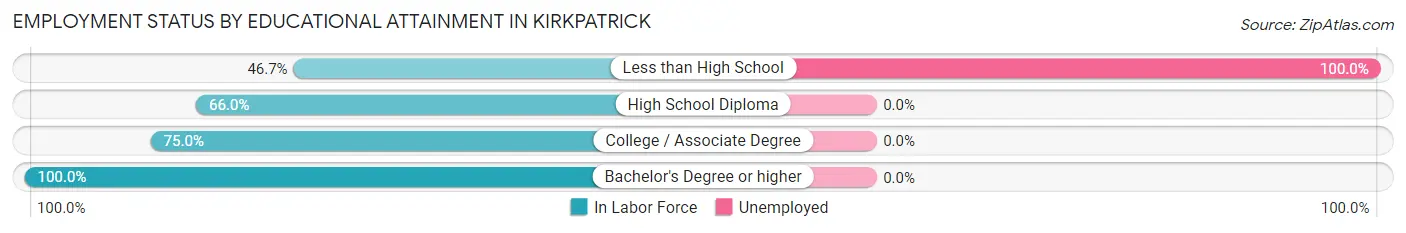
| Educational Attainment | In Labor Force | Unemployed |
| Less than High School | 7 (46.7%) | 15 (100.0%) |
| High School Diploma | 33 (66.0%) | 0 (0.0%) |
| College / Associate Degree | 12 (75.0%) | 0 (0.0%) |
| Bachelor's Degree or higher | 10 (100.0%) | 0 (0.0%) |
| Total | 62 (68.1%) | 10 (11.3%) |
Employment Occupations by Sex in Kirkpatrick
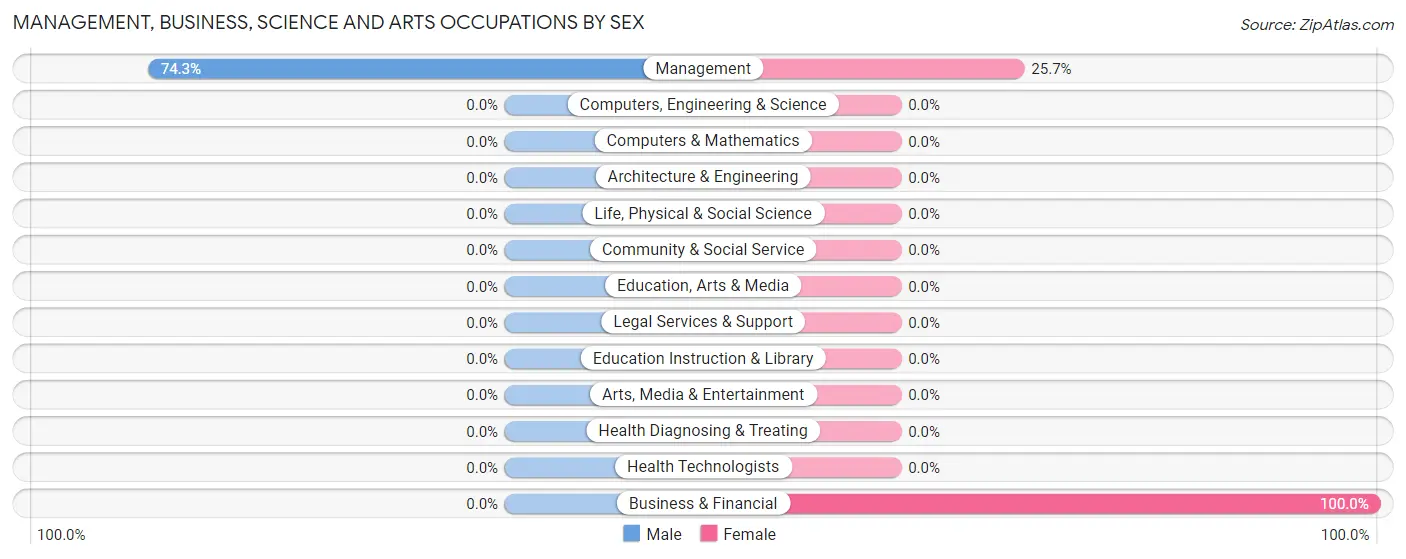
Management, Business, Science and Arts Occupations
The most common Management, Business, Science and Arts occupations in Kirkpatrick are Management (35 | 24.3%), and Business & Financial (6 | 4.2%).
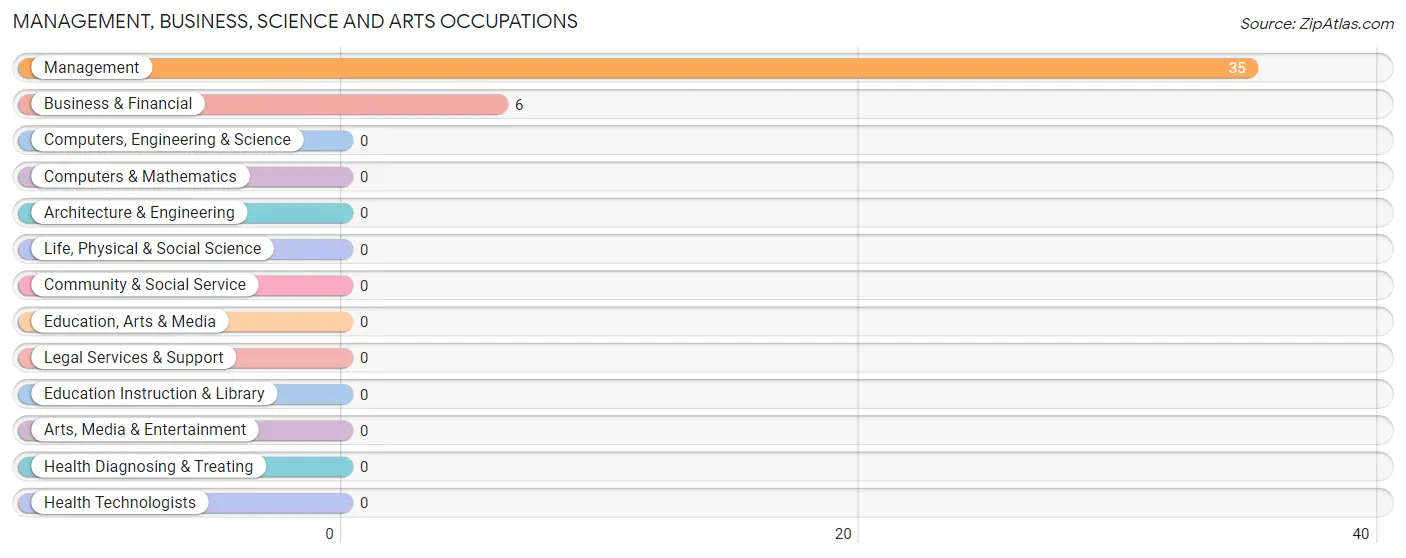
Management, Business, Science and Arts Occupations by Sex
| Occupation | Male | Female |
| Management | 26 (74.3%) | 9 (25.7%) |
| Business & Financial | 0 (0.0%) | 6 (100.0%) |
| Computers, Engineering & Science | 0 (0.0%) | 0 (0.0%) |
| Computers & Mathematics | 0 (0.0%) | 0 (0.0%) |
| Architecture & Engineering | 0 (0.0%) | 0 (0.0%) |
| Life, Physical & Social Science | 0 (0.0%) | 0 (0.0%) |
| Community & Social Service | 0 (0.0%) | 0 (0.0%) |
| Education, Arts & Media | 0 (0.0%) | 0 (0.0%) |
| Legal Services & Support | 0 (0.0%) | 0 (0.0%) |
| Education Instruction & Library | 0 (0.0%) | 0 (0.0%) |
| Arts, Media & Entertainment | 0 (0.0%) | 0 (0.0%) |
| Health Diagnosing & Treating | 0 (0.0%) | 0 (0.0%) |
| Health Technologists | 0 (0.0%) | 0 (0.0%) |
| Total (Category) | 26 (63.4%) | 15 (36.6%) |
| Total (Overall) | 84 (58.3%) | 60 (41.7%) |
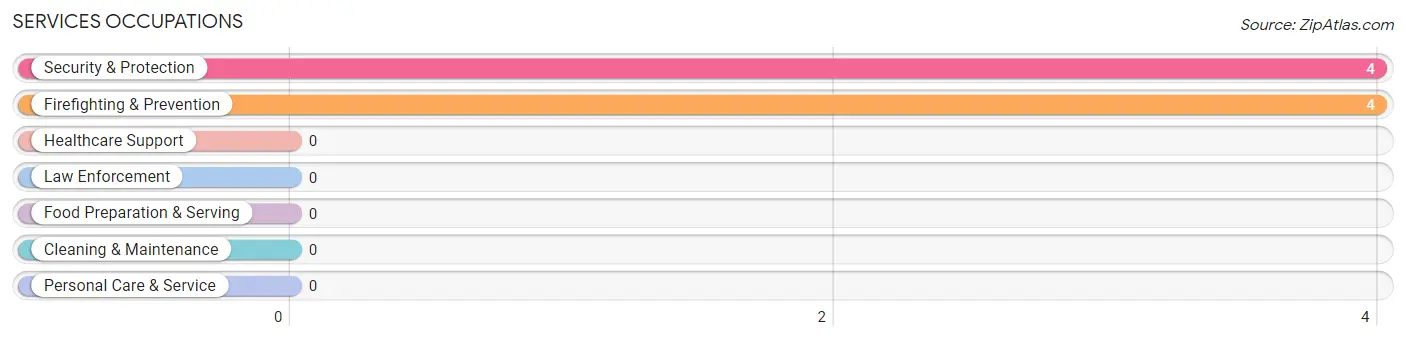
Services Occupations
The most common Services occupations in Kirkpatrick are Security & Protection (4 | 2.8%), and Firefighting & Prevention (4 | 2.8%).
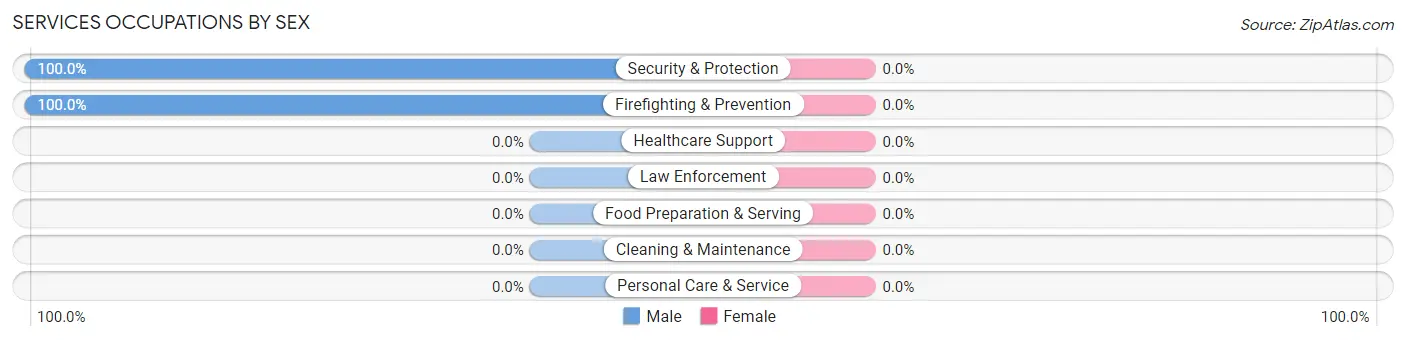
Services Occupations by Sex
| Occupation | Male | Female |
| Healthcare Support | 0 (0.0%) | 0 (0.0%) |
| Security & Protection | 4 (100.0%) | 0 (0.0%) |
| Firefighting & Prevention | 4 (100.0%) | 0 (0.0%) |
| Law Enforcement | 0 (0.0%) | 0 (0.0%) |
| Food Preparation & Serving | 0 (0.0%) | 0 (0.0%) |
| Cleaning & Maintenance | 0 (0.0%) | 0 (0.0%) |
| Personal Care & Service | 0 (0.0%) | 0 (0.0%) |
| Total (Category) | 4 (100.0%) | 0 (0.0%) |
| Total (Overall) | 84 (58.3%) | 60 (41.7%) |
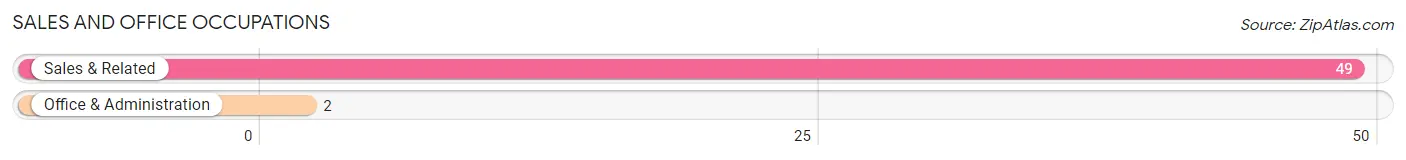
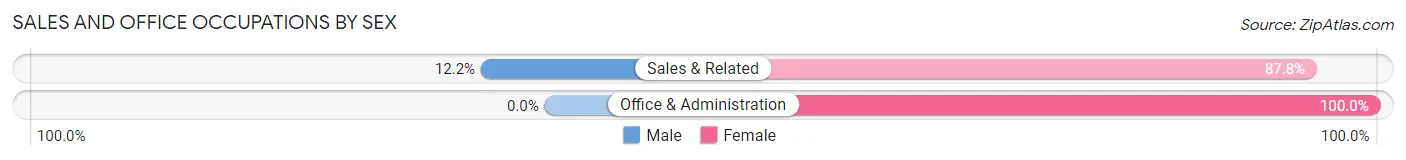
Sales and Office Occupations
The most common Sales and Office occupations in Kirkpatrick are Sales & Related (49 | 34.0%), and Office & Administration (2 | 1.4%).
Sales and Office Occupations by Sex
| Occupation | Male | Female |
| Sales & Related | 6 (12.2%) | 43 (87.8%) |
| Office & Administration | 0 (0.0%) | 2 (100.0%) |
| Total (Category) | 6 (11.8%) | 45 (88.2%) |
| Total (Overall) | 84 (58.3%) | 60 (41.7%) |
Natural Resources, Construction and Maintenance Occupations
The most common Natural Resources, Construction and Maintenance occupations in Kirkpatrick are , and Installation, Maintenance & Repair (5 | 3.5%).
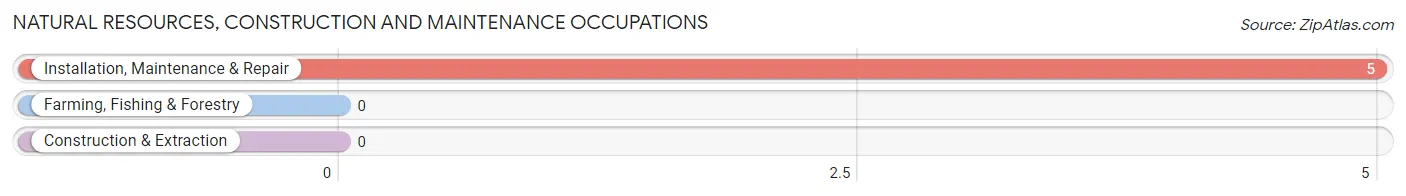
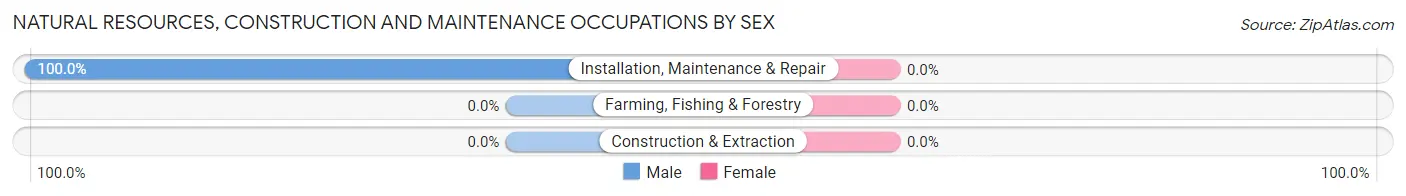
Natural Resources, Construction and Maintenance Occupations by Sex
| Occupation | Male | Female |
| Farming, Fishing & Forestry | 0 (0.0%) | 0 (0.0%) |
| Construction & Extraction | 0 (0.0%) | 0 (0.0%) |
| Installation, Maintenance & Repair | 5 (100.0%) | 0 (0.0%) |
| Total (Category) | 5 (100.0%) | 0 (0.0%) |
| Total (Overall) | 84 (58.3%) | 60 (41.7%) |
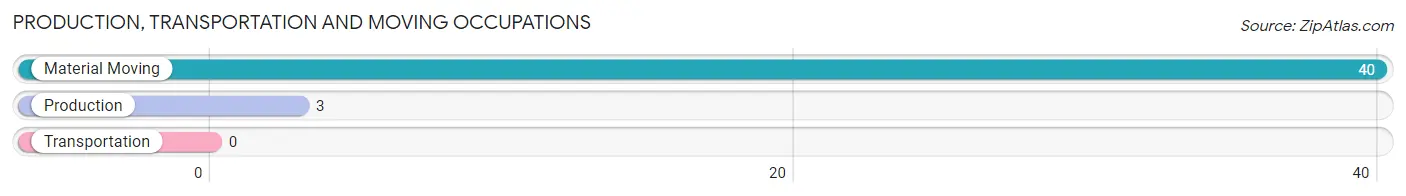
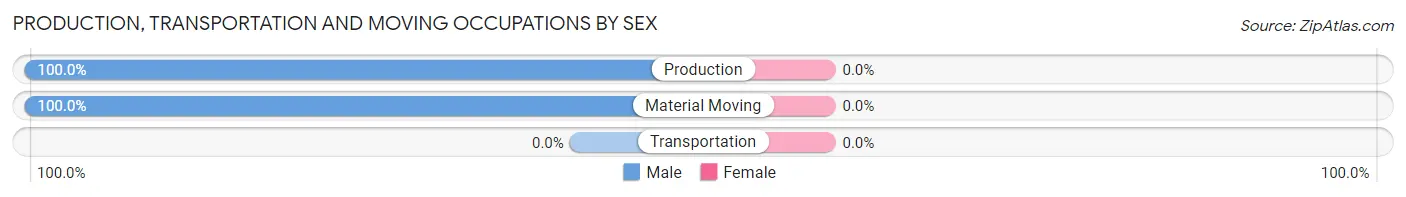
Production, Transportation and Moving Occupations
The most common Production, Transportation and Moving occupations in Kirkpatrick are Material Moving (40 | 27.8%), and Production (3 | 2.1%).
Production, Transportation and Moving Occupations by Sex
| Occupation | Male | Female |
| Production | 3 (100.0%) | 0 (0.0%) |
| Transportation | 0 (0.0%) | 0 (0.0%) |
| Material Moving | 40 (100.0%) | 0 (0.0%) |
| Total (Category) | 43 (100.0%) | 0 (0.0%) |
| Total (Overall) | 84 (58.3%) | 60 (41.7%) |
Employment Industries by Sex in Kirkpatrick
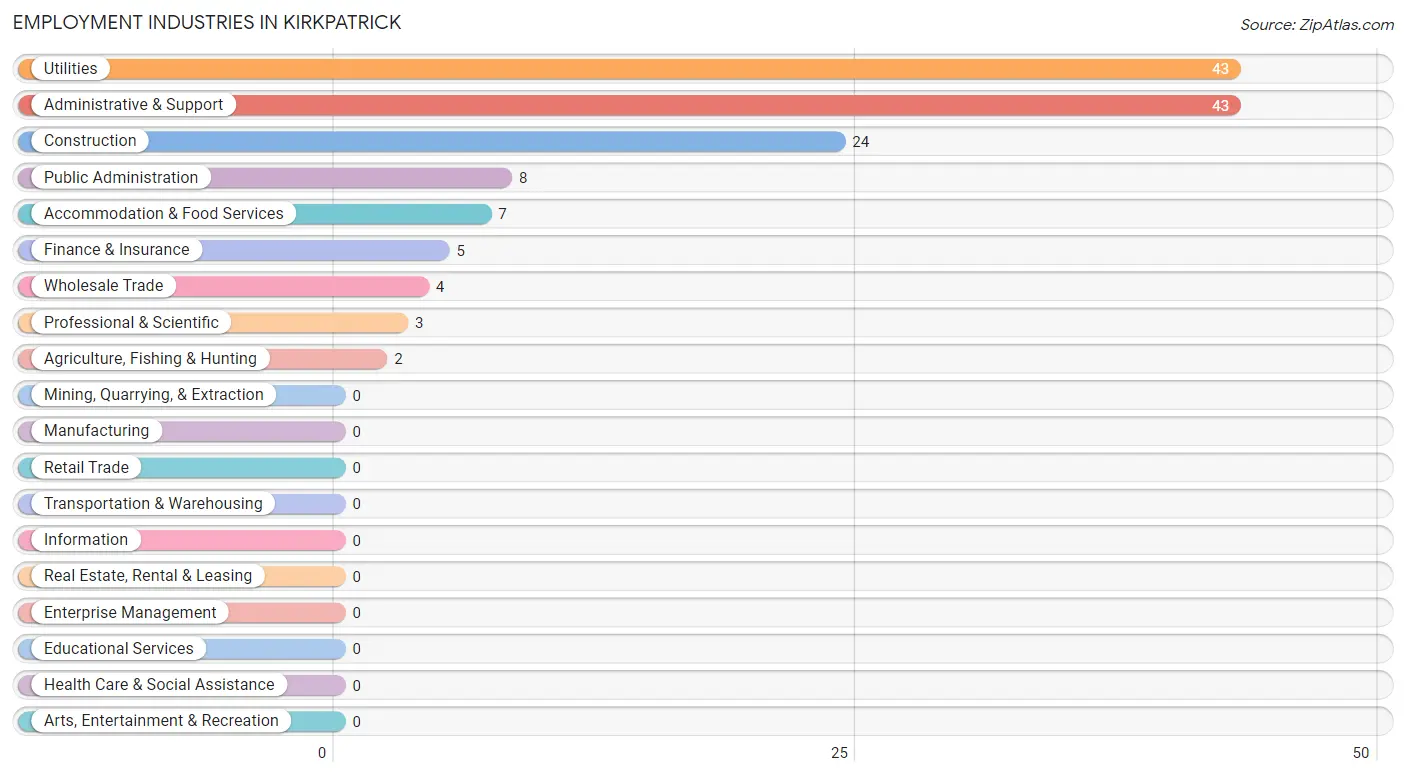
Employment Industries in Kirkpatrick
The major employment industries in Kirkpatrick include Utilities (43 | 29.9%), Administrative & Support (43 | 29.9%), Construction (24 | 16.7%), Public Administration (8 | 5.6%), and Accommodation & Food Services (7 | 4.9%).
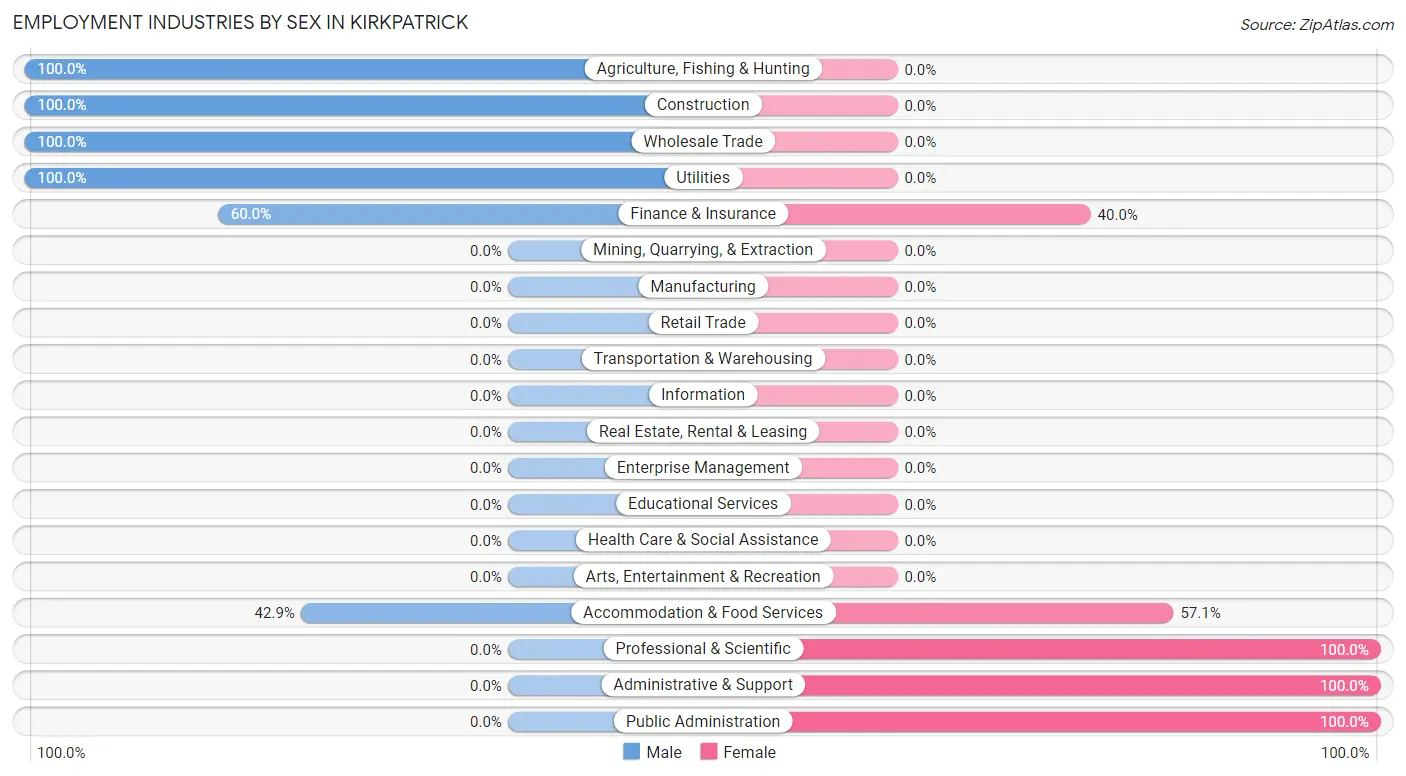
Employment Industries by Sex in Kirkpatrick
The Kirkpatrick industries that see more men than women are Agriculture, Fishing & Hunting (100.0%), Construction (100.0%), and Wholesale Trade (100.0%), whereas the industries that tend to have a higher number of women are Professional & Scientific (100.0%), Administrative & Support (100.0%), and Public Administration (100.0%).
| Industry | Male | Female |
| Agriculture, Fishing & Hunting | 2 (100.0%) | 0 (0.0%) |
| Mining, Quarrying, & Extraction | 0 (0.0%) | 0 (0.0%) |
| Construction | 24 (100.0%) | 0 (0.0%) |
| Manufacturing | 0 (0.0%) | 0 (0.0%) |
| Wholesale Trade | 4 (100.0%) | 0 (0.0%) |
| Retail Trade | 0 (0.0%) | 0 (0.0%) |
| Transportation & Warehousing | 0 (0.0%) | 0 (0.0%) |
| Utilities | 43 (100.0%) | 0 (0.0%) |
| Information | 0 (0.0%) | 0 (0.0%) |
| Finance & Insurance | 3 (60.0%) | 2 (40.0%) |
| Real Estate, Rental & Leasing | 0 (0.0%) | 0 (0.0%) |
| Professional & Scientific | 0 (0.0%) | 3 (100.0%) |
| Enterprise Management | 0 (0.0%) | 0 (0.0%) |
| Administrative & Support | 0 (0.0%) | 43 (100.0%) |
| Educational Services | 0 (0.0%) | 0 (0.0%) |
| Health Care & Social Assistance | 0 (0.0%) | 0 (0.0%) |
| Arts, Entertainment & Recreation | 0 (0.0%) | 0 (0.0%) |
| Accommodation & Food Services | 3 (42.9%) | 4 (57.1%) |
| Public Administration | 0 (0.0%) | 8 (100.0%) |
| Total | 84 (58.3%) | 60 (41.7%) |
Education in Kirkpatrick
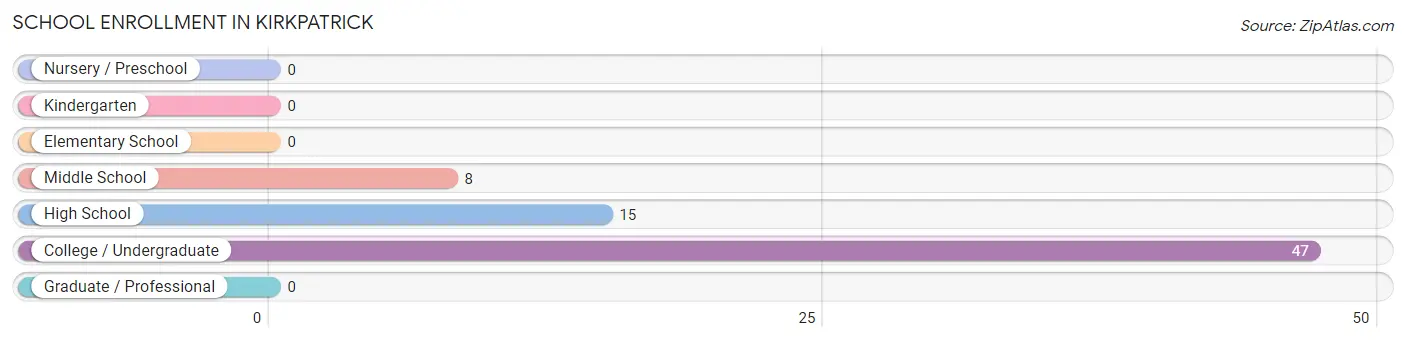
School Enrollment in Kirkpatrick
The most common levels of schooling among the 70 students in Kirkpatrick are college / undergraduate (47 | 67.1%), high school (15 | 21.4%), and middle school (8 | 11.4%).
| School Level | # Students | % Students |
| Nursery / Preschool | 0 | 0.0% |
| Kindergarten | 0 | 0.0% |
| Elementary School | 0 | 0.0% |
| Middle School | 8 | 11.4% |
| High School | 15 | 21.4% |
| College / Undergraduate | 47 | 67.1% |
| Graduate / Professional | 0 | 0.0% |
| Total | 70 | 100.0% |
School Enrollment by Age by Funding Source in Kirkpatrick
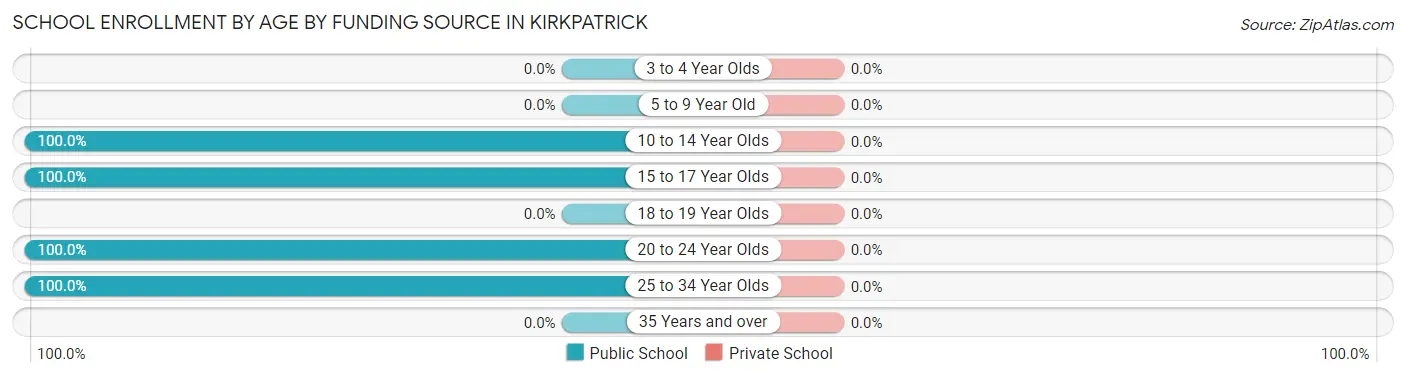
| Age Bracket | Public School | Private School |
| 3 to 4 Year Olds | 0 (0.0%) | 0 (0.0%) |
| 5 to 9 Year Old | 0 (0.0%) | 0 (0.0%) |
| 10 to 14 Year Olds | 8 (100.0%) | 0 (0.0%) |
| 15 to 17 Year Olds | 15 (100.0%) | 0 (0.0%) |
| 18 to 19 Year Olds | 0 (0.0%) | 0 (0.0%) |
| 20 to 24 Year Olds | 40 (100.0%) | 0 (0.0%) |
| 25 to 34 Year Olds | 7 (100.0%) | 0 (0.0%) |
| 35 Years and over | 0 (0.0%) | 0 (0.0%) |
| Total | 70 (100.0%) | 0 (0.0%) |
Educational Attainment by Field of Study in Kirkpatrick
Business (9 | 37.5%), education (8 | 33.3%), and bio, nature & agricultural (7 | 29.2%) are the most common fields of study among 24 individuals in Kirkpatrick who have obtained a bachelor's degree or higher.
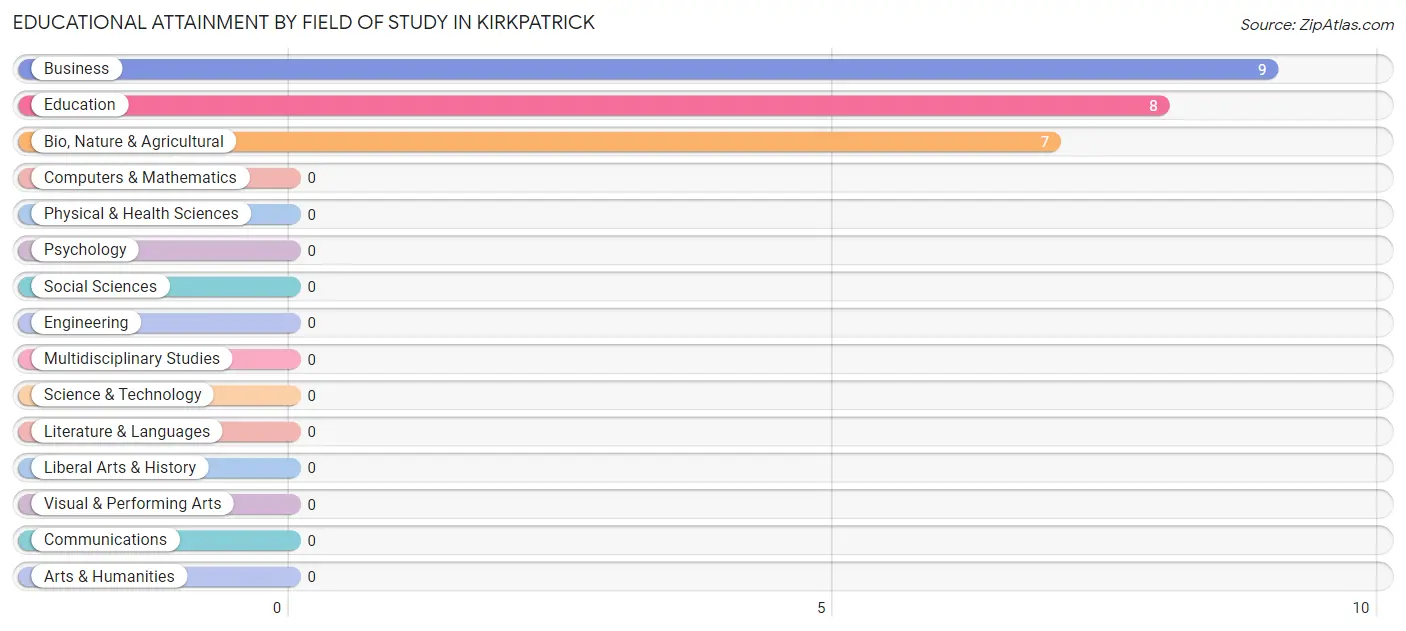
| Field of Study | # Graduates | % Graduates |
| Computers & Mathematics | 0 | 0.0% |
| Bio, Nature & Agricultural | 7 | 29.2% |
| Physical & Health Sciences | 0 | 0.0% |
| Psychology | 0 | 0.0% |
| Social Sciences | 0 | 0.0% |
| Engineering | 0 | 0.0% |
| Multidisciplinary Studies | 0 | 0.0% |
| Science & Technology | 0 | 0.0% |
| Business | 9 | 37.5% |
| Education | 8 | 33.3% |
| Literature & Languages | 0 | 0.0% |
| Liberal Arts & History | 0 | 0.0% |
| Visual & Performing Arts | 0 | 0.0% |
| Communications | 0 | 0.0% |
| Arts & Humanities | 0 | 0.0% |
| Total | 24 | 100.0% |
Transportation & Commute in Kirkpatrick
Vehicle Availability by Sex in Kirkpatrick
The most prevalent vehicle ownership categories in Kirkpatrick are males with 5 or more vehicles (64, accounting for 76.2%) and females with 5 or more vehicles (45, making up 106.7%).
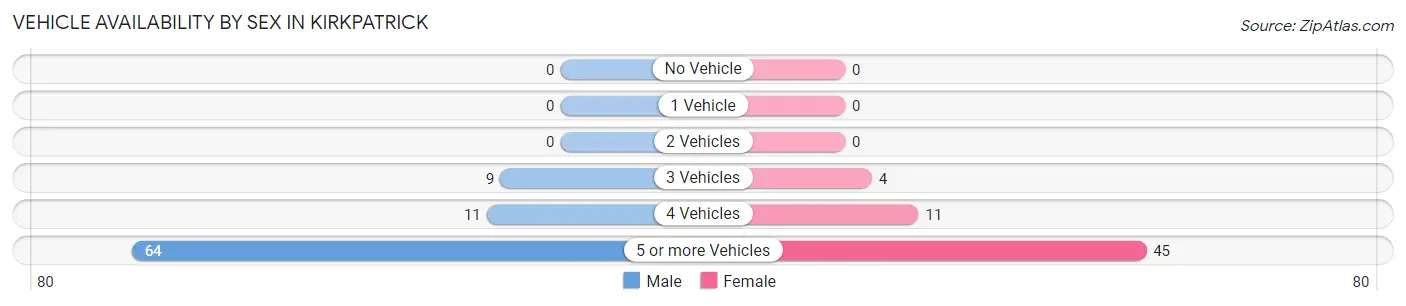
| Vehicles Available | Male | Female |
| No Vehicle | 0 (0.0%) | 0 (0.0%) |
| 1 Vehicle | 0 (0.0%) | 0 (0.0%) |
| 2 Vehicles | 0 (0.0%) | 0 (0.0%) |
| 3 Vehicles | 9 (10.7%) | 4 (6.7%) |
| 4 Vehicles | 11 (13.1%) | 11 (18.3%) |
| 5 or more Vehicles | 64 (76.2%) | 45 (75.0%) |
| Total | 84 (100.0%) | 60 (100.0%) |
Commute Time in Kirkpatrick
The most frequently occuring commute durations in Kirkpatrick are 45 to 59 minutes (109 commuters, 75.7%), 15 to 19 minutes (11 commuters, 7.6%), and 10 to 14 minutes (6 commuters, 4.2%).
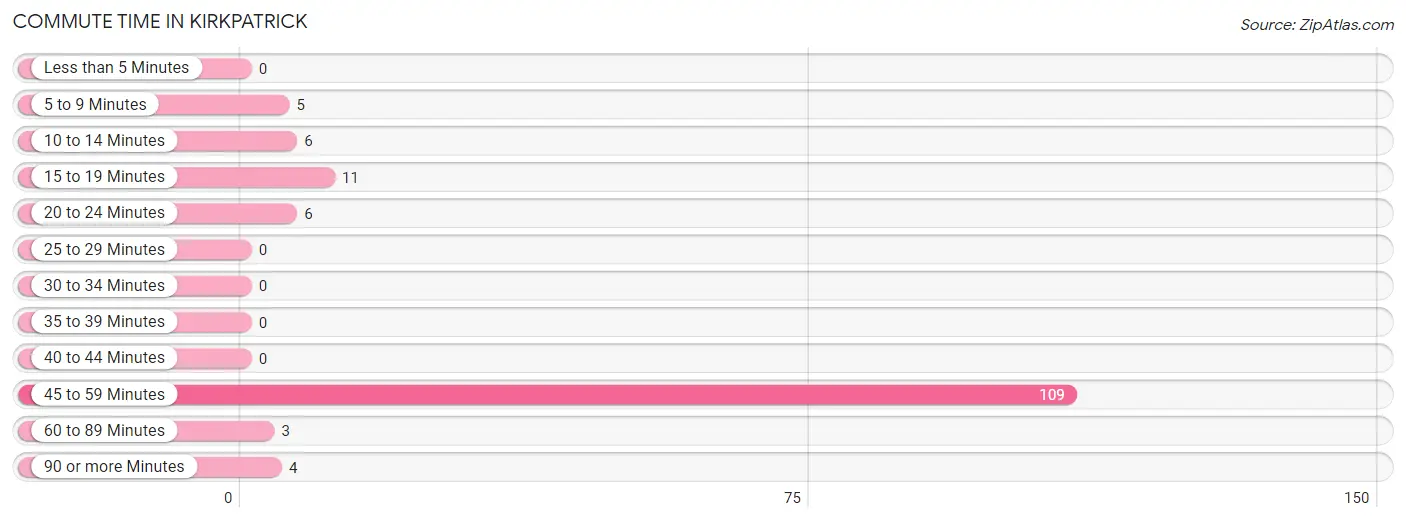
| Commute Time | # Commuters | % Commuters |
| Less than 5 Minutes | 0 | 0.0% |
| 5 to 9 Minutes | 5 | 3.5% |
| 10 to 14 Minutes | 6 | 4.2% |
| 15 to 19 Minutes | 11 | 7.6% |
| 20 to 24 Minutes | 6 | 4.2% |
| 25 to 29 Minutes | 0 | 0.0% |
| 30 to 34 Minutes | 0 | 0.0% |
| 35 to 39 Minutes | 0 | 0.0% |
| 40 to 44 Minutes | 0 | 0.0% |
| 45 to 59 Minutes | 109 | 75.7% |
| 60 to 89 Minutes | 3 | 2.1% |
| 90 or more Minutes | 4 | 2.8% |
Commute Time by Sex in Kirkpatrick
The most common commute times in Kirkpatrick are 45 to 59 minutes (64 commuters, 76.2%) for males and 45 to 59 minutes (45 commuters, 75.0%) for females.
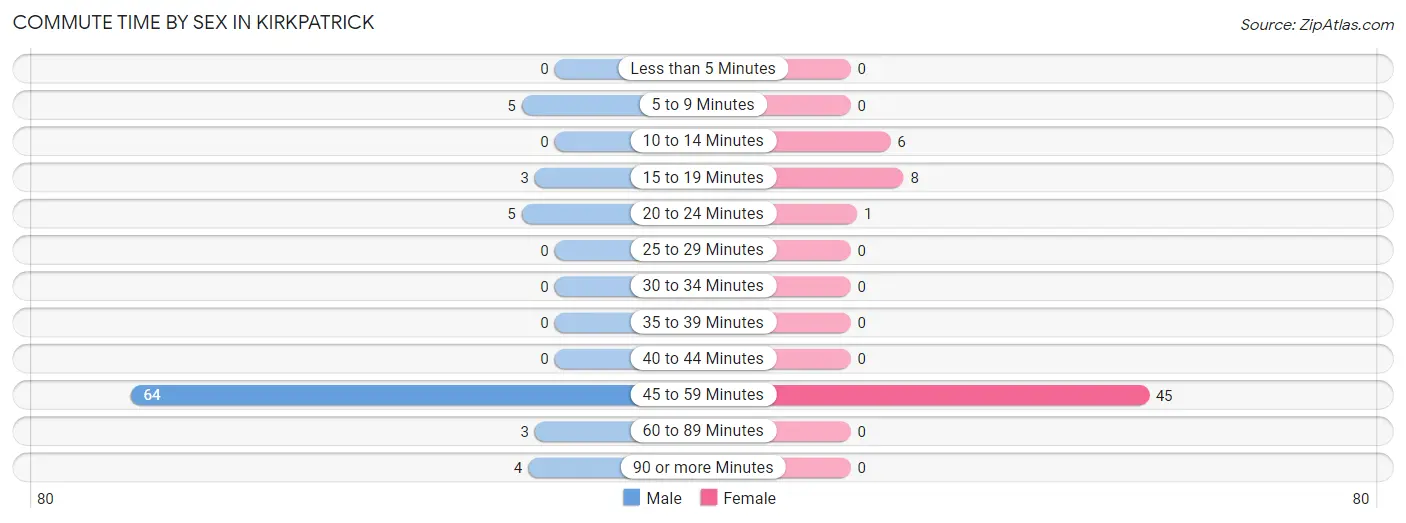
| Commute Time | Male | Female |
| Less than 5 Minutes | 0 (0.0%) | 0 (0.0%) |
| 5 to 9 Minutes | 5 (5.9%) | 0 (0.0%) |
| 10 to 14 Minutes | 0 (0.0%) | 6 (10.0%) |
| 15 to 19 Minutes | 3 (3.6%) | 8 (13.3%) |
| 20 to 24 Minutes | 5 (5.9%) | 1 (1.7%) |
| 25 to 29 Minutes | 0 (0.0%) | 0 (0.0%) |
| 30 to 34 Minutes | 0 (0.0%) | 0 (0.0%) |
| 35 to 39 Minutes | 0 (0.0%) | 0 (0.0%) |
| 40 to 44 Minutes | 0 (0.0%) | 0 (0.0%) |
| 45 to 59 Minutes | 64 (76.2%) | 45 (75.0%) |
| 60 to 89 Minutes | 3 (3.6%) | 0 (0.0%) |
| 90 or more Minutes | 4 (4.8%) | 0 (0.0%) |
Time of Departure to Work by Sex in Kirkpatrick
The most frequent times of departure to work in Kirkpatrick are 8:00 AM to 8:29 AM (68, 80.9%) for males and 7:00 AM to 7:29 AM (50, 83.3%) for females.
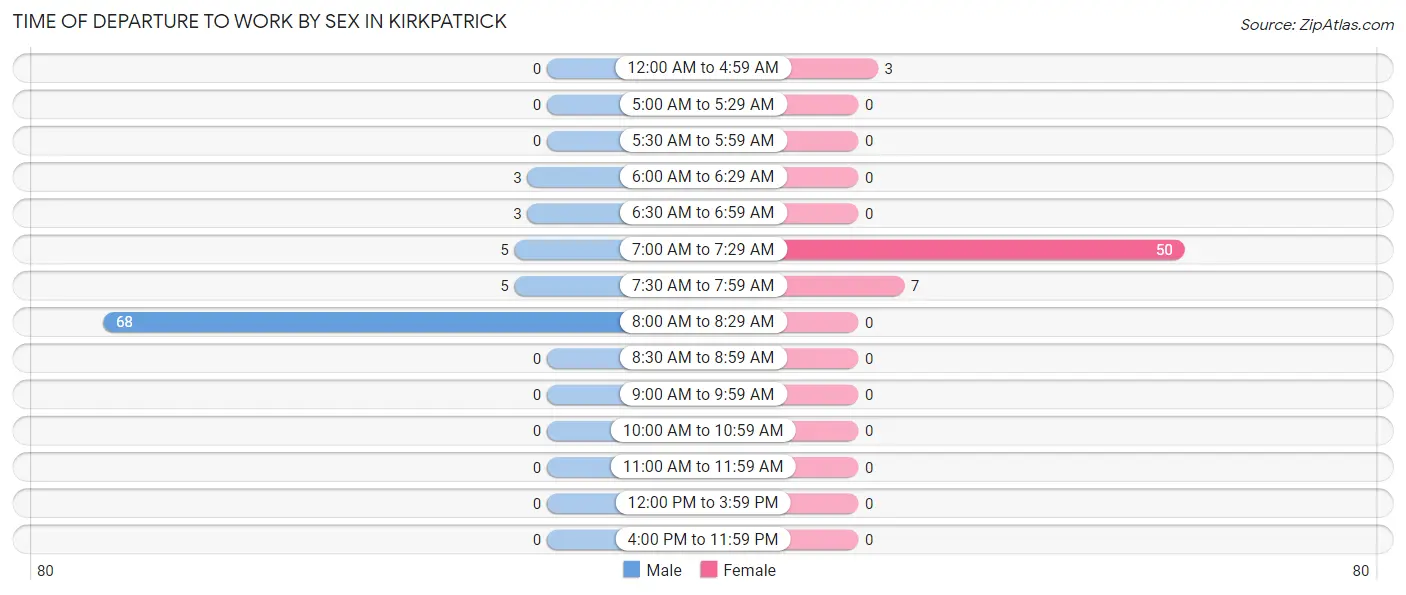
| Time of Departure | Male | Female |
| 12:00 AM to 4:59 AM | 0 (0.0%) | 3 (5.0%) |
| 5:00 AM to 5:29 AM | 0 (0.0%) | 0 (0.0%) |
| 5:30 AM to 5:59 AM | 0 (0.0%) | 0 (0.0%) |
| 6:00 AM to 6:29 AM | 3 (3.6%) | 0 (0.0%) |
| 6:30 AM to 6:59 AM | 3 (3.6%) | 0 (0.0%) |
| 7:00 AM to 7:29 AM | 5 (5.9%) | 50 (83.3%) |
| 7:30 AM to 7:59 AM | 5 (5.9%) | 7 (11.7%) |
| 8:00 AM to 8:29 AM | 68 (80.9%) | 0 (0.0%) |
| 8:30 AM to 8:59 AM | 0 (0.0%) | 0 (0.0%) |
| 9:00 AM to 9:59 AM | 0 (0.0%) | 0 (0.0%) |
| 10:00 AM to 10:59 AM | 0 (0.0%) | 0 (0.0%) |
| 11:00 AM to 11:59 AM | 0 (0.0%) | 0 (0.0%) |
| 12:00 PM to 3:59 PM | 0 (0.0%) | 0 (0.0%) |
| 4:00 PM to 11:59 PM | 0 (0.0%) | 0 (0.0%) |
| Total | 84 (100.0%) | 60 (100.0%) |
Housing Occupancy in Kirkpatrick
Occupancy by Ownership in Kirkpatrick
Of the total 68 dwellings in Kirkpatrick, owner-occupied units account for 67 (98.5%), while renter-occupied units make up 1 (1.5%).
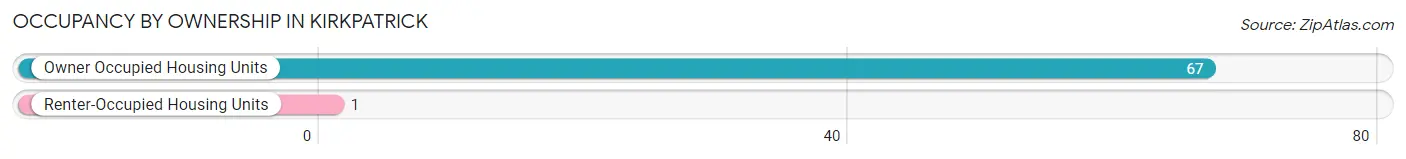
| Occupancy | # Housing Units | % Housing Units |
| Owner Occupied Housing Units | 67 | 98.5% |
| Renter-Occupied Housing Units | 1 | 1.5% |
| Total Occupied Housing Units | 68 | 100.0% |
Occupancy by Household Size in Kirkpatrick
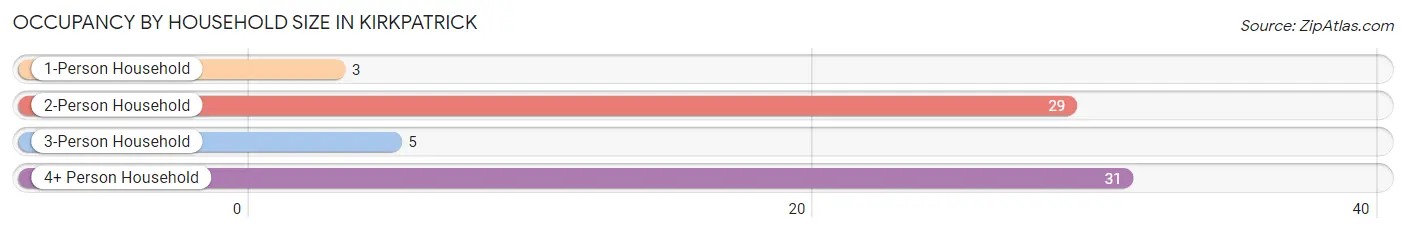
| Household Size | # Housing Units | % Housing Units |
| 1-Person Household | 3 | 4.4% |
| 2-Person Household | 29 | 42.6% |
| 3-Person Household | 5 | 7.3% |
| 4+ Person Household | 31 | 45.6% |
| Total Housing Units | 68 | 100.0% |
Occupancy by Ownership by Household Size in Kirkpatrick
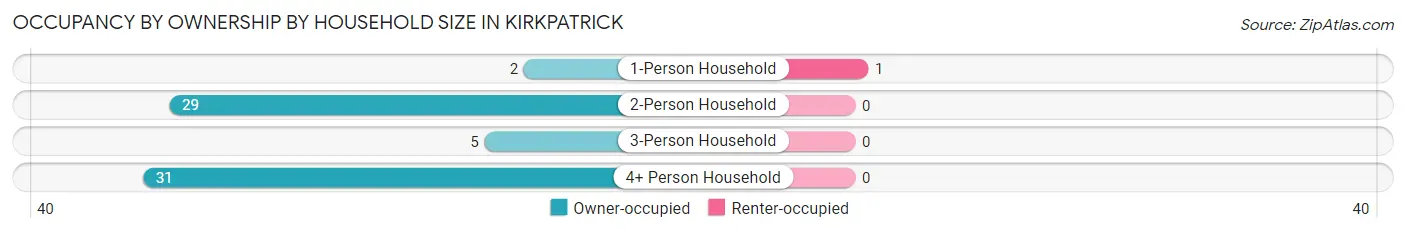
| Household Size | Owner-occupied | Renter-occupied |
| 1-Person Household | 2 (66.7%) | 1 (33.3%) |
| 2-Person Household | 29 (100.0%) | 0 (0.0%) |
| 3-Person Household | 5 (100.0%) | 0 (0.0%) |
| 4+ Person Household | 31 (100.0%) | 0 (0.0%) |
| Total Housing Units | 67 (98.5%) | 1 (1.5%) |
Occupancy by Educational Attainment in Kirkpatrick
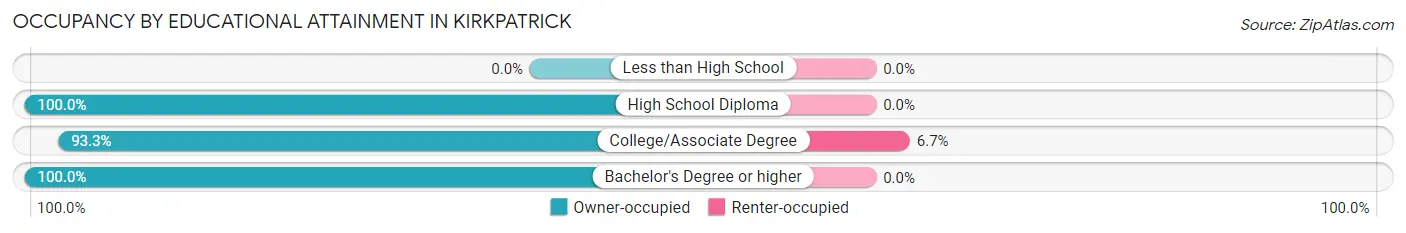
| Household Size | Owner-occupied | Renter-occupied |
| Less than High School | 0 (0.0%) | 0 (0.0%) |
| High School Diploma | 43 (100.0%) | 0 (0.0%) |
| College/Associate Degree | 14 (93.3%) | 1 (6.7%) |
| Bachelor's Degree or higher | 10 (100.0%) | 0 (0.0%) |
Occupancy by Age of Householder in Kirkpatrick
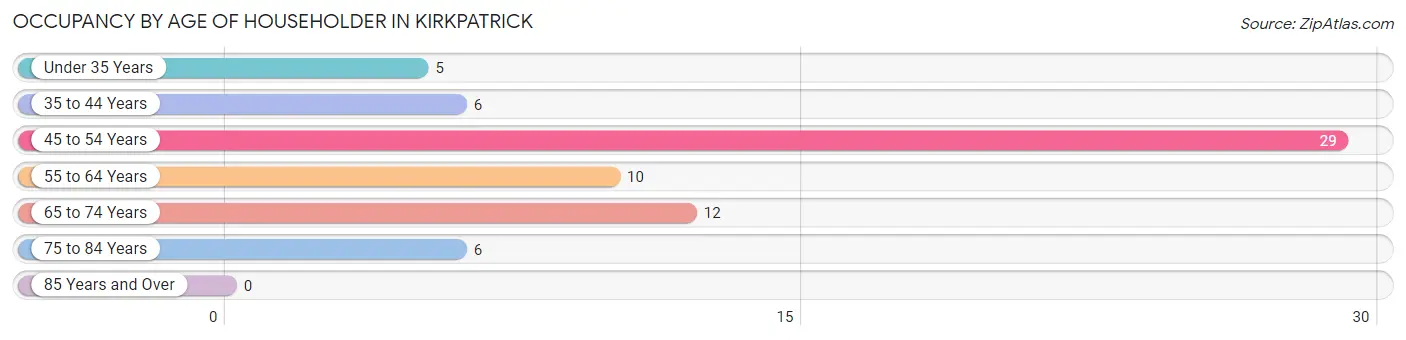
| Age Bracket | # Households | % Households |
| Under 35 Years | 5 | 7.3% |
| 35 to 44 Years | 6 | 8.8% |
| 45 to 54 Years | 29 | 42.6% |
| 55 to 64 Years | 10 | 14.7% |
| 65 to 74 Years | 12 | 17.6% |
| 75 to 84 Years | 6 | 8.8% |
| 85 Years and Over | 0 | 0.0% |
| Total | 68 | 100.0% |
Housing Finances in Kirkpatrick
Median Income by Occupancy in Kirkpatrick
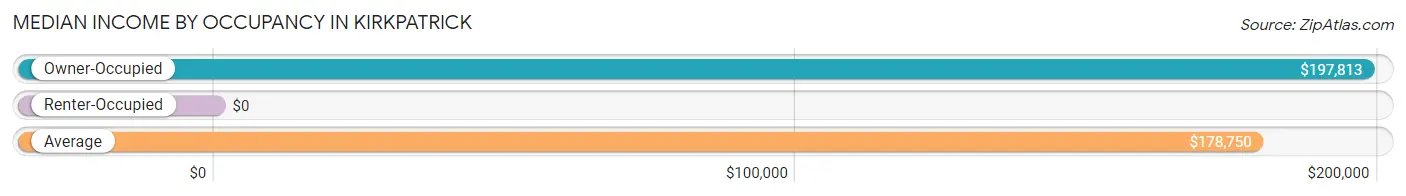
| Occupancy Type | # Households | Median Income |
| Owner-Occupied | 67 (98.5%) | $197,813 |
| Renter-Occupied | 1 (1.5%) | $0 |
| Average | 68 (100.0%) | $178,750 |
Occupancy by Householder Income Bracket in Kirkpatrick
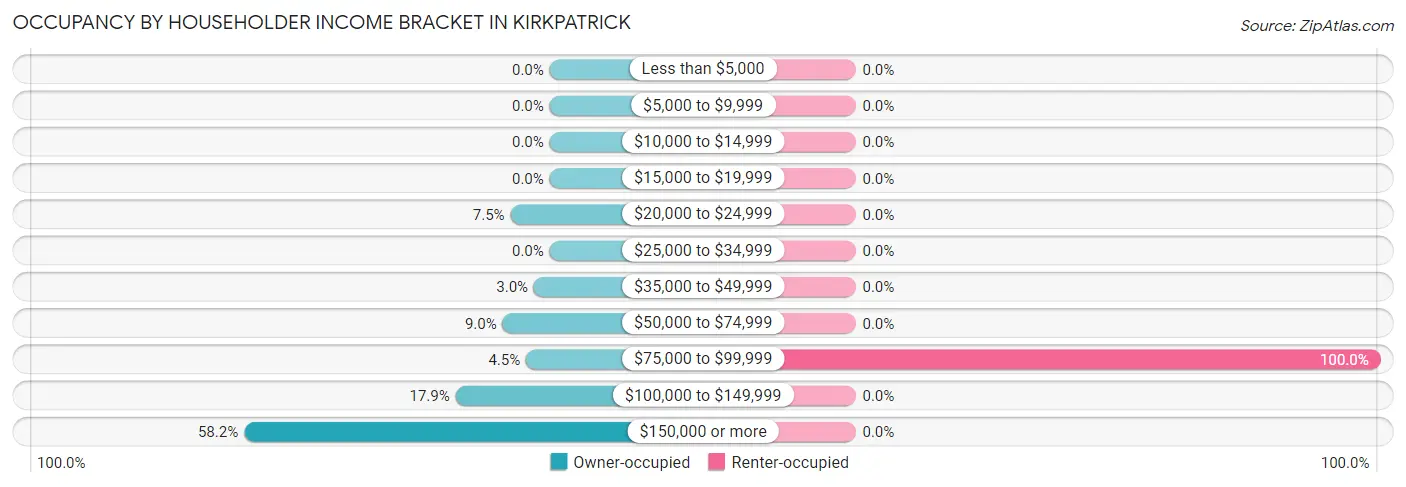
| Income Bracket | Owner-occupied | Renter-occupied |
| Less than $5,000 | 0 (0.0%) | 0 (0.0%) |
| $5,000 to $9,999 | 0 (0.0%) | 0 (0.0%) |
| $10,000 to $14,999 | 0 (0.0%) | 0 (0.0%) |
| $15,000 to $19,999 | 0 (0.0%) | 0 (0.0%) |
| $20,000 to $24,999 | 5 (7.5%) | 0 (0.0%) |
| $25,000 to $34,999 | 0 (0.0%) | 0 (0.0%) |
| $35,000 to $49,999 | 2 (3.0%) | 0 (0.0%) |
| $50,000 to $74,999 | 6 (9.0%) | 0 (0.0%) |
| $75,000 to $99,999 | 3 (4.5%) | 1 (100.0%) |
| $100,000 to $149,999 | 12 (17.9%) | 0 (0.0%) |
| $150,000 or more | 39 (58.2%) | 0 (0.0%) |
| Total | 67 (100.0%) | 1 (100.0%) |
Monthly Housing Cost Tiers in Kirkpatrick
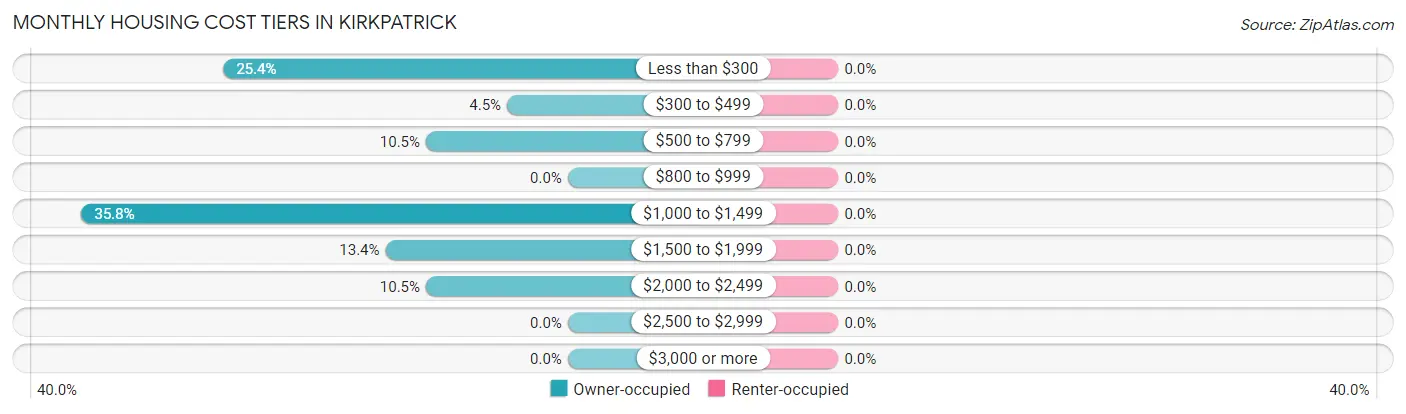
| Monthly Cost | Owner-occupied | Renter-occupied |
| Less than $300 | 17 (25.4%) | 0 (0.0%) |
| $300 to $499 | 3 (4.5%) | 0 (0.0%) |
| $500 to $799 | 7 (10.4%) | 0 (0.0%) |
| $800 to $999 | 0 (0.0%) | 0 (0.0%) |
| $1,000 to $1,499 | 24 (35.8%) | 0 (0.0%) |
| $1,500 to $1,999 | 9 (13.4%) | 0 (0.0%) |
| $2,000 to $2,499 | 7 (10.4%) | 0 (0.0%) |
| $2,500 to $2,999 | 0 (0.0%) | 0 (0.0%) |
| $3,000 or more | 0 (0.0%) | 0 (0.0%) |
| Total | 67 (100.0%) | 1 (100.0%) |
Physical Housing Characteristics in Kirkpatrick
Housing Structures in Kirkpatrick
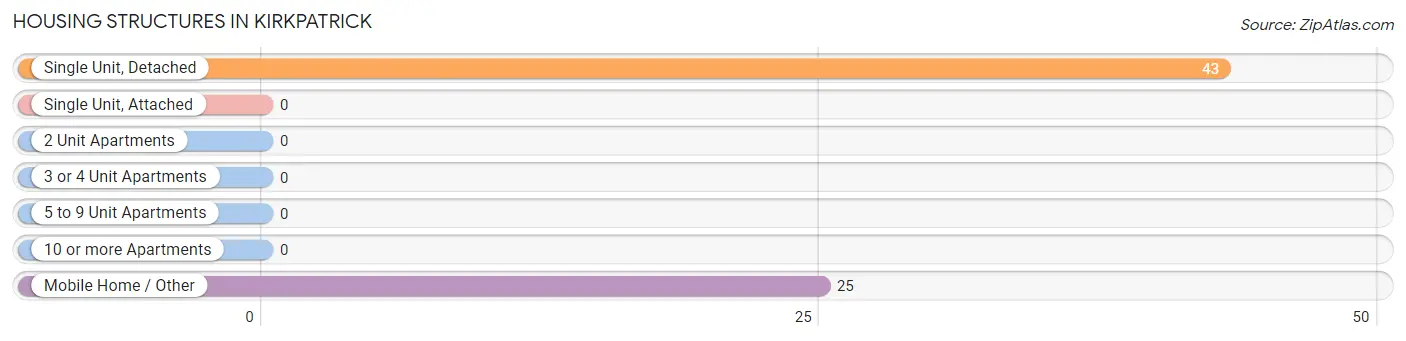
| Structure Type | # Housing Units | % Housing Units |
| Single Unit, Detached | 43 | 63.2% |
| Single Unit, Attached | 0 | 0.0% |
| 2 Unit Apartments | 0 | 0.0% |
| 3 or 4 Unit Apartments | 0 | 0.0% |
| 5 to 9 Unit Apartments | 0 | 0.0% |
| 10 or more Apartments | 0 | 0.0% |
| Mobile Home / Other | 25 | 36.8% |
| Total | 68 | 100.0% |
Housing Structures by Occupancy in Kirkpatrick
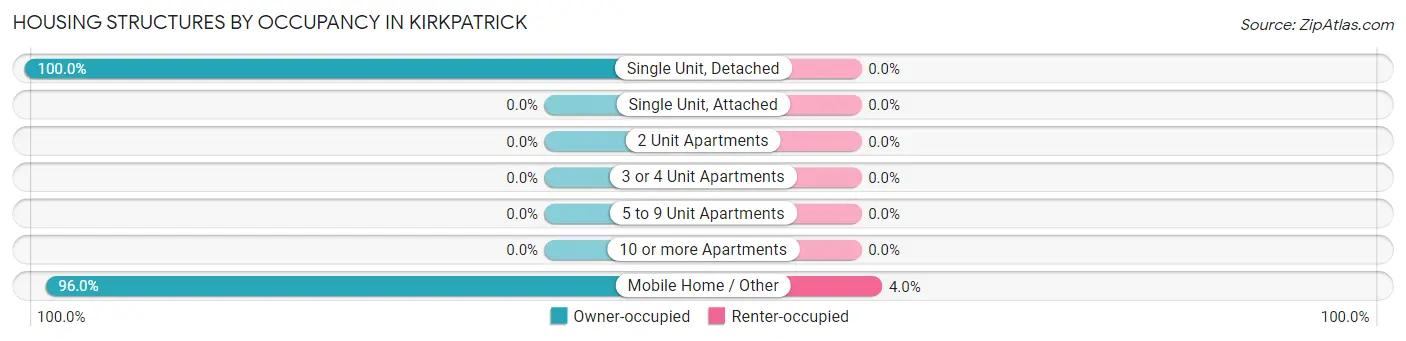
| Structure Type | Owner-occupied | Renter-occupied |
| Single Unit, Detached | 43 (100.0%) | 0 (0.0%) |
| Single Unit, Attached | 0 (0.0%) | 0 (0.0%) |
| 2 Unit Apartments | 0 (0.0%) | 0 (0.0%) |
| 3 or 4 Unit Apartments | 0 (0.0%) | 0 (0.0%) |
| 5 to 9 Unit Apartments | 0 (0.0%) | 0 (0.0%) |
| 10 or more Apartments | 0 (0.0%) | 0 (0.0%) |
| Mobile Home / Other | 24 (96.0%) | 1 (4.0%) |
| Total | 67 (98.5%) | 1 (1.5%) |
Housing Structures by Number of Rooms in Kirkpatrick
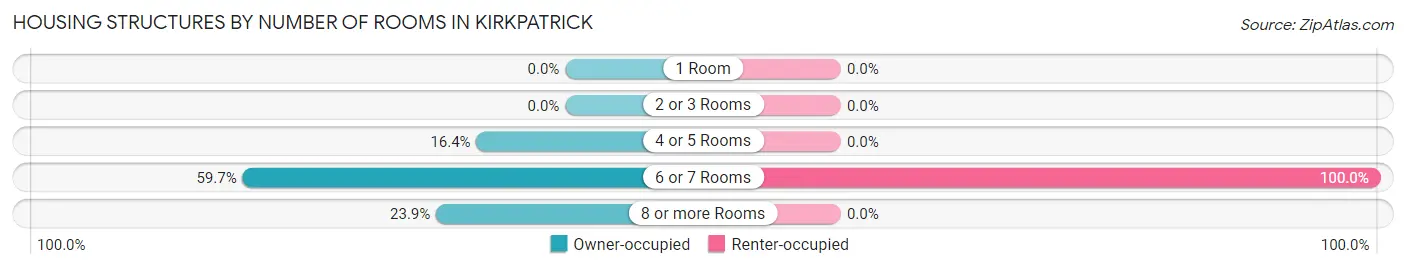
| Number of Rooms | Owner-occupied | Renter-occupied |
| 1 Room | 0 (0.0%) | 0 (0.0%) |
| 2 or 3 Rooms | 0 (0.0%) | 0 (0.0%) |
| 4 or 5 Rooms | 11 (16.4%) | 0 (0.0%) |
| 6 or 7 Rooms | 40 (59.7%) | 1 (100.0%) |
| 8 or more Rooms | 16 (23.9%) | 0 (0.0%) |
| Total | 67 (100.0%) | 1 (100.0%) |
Housing Structure by Heating Type in Kirkpatrick
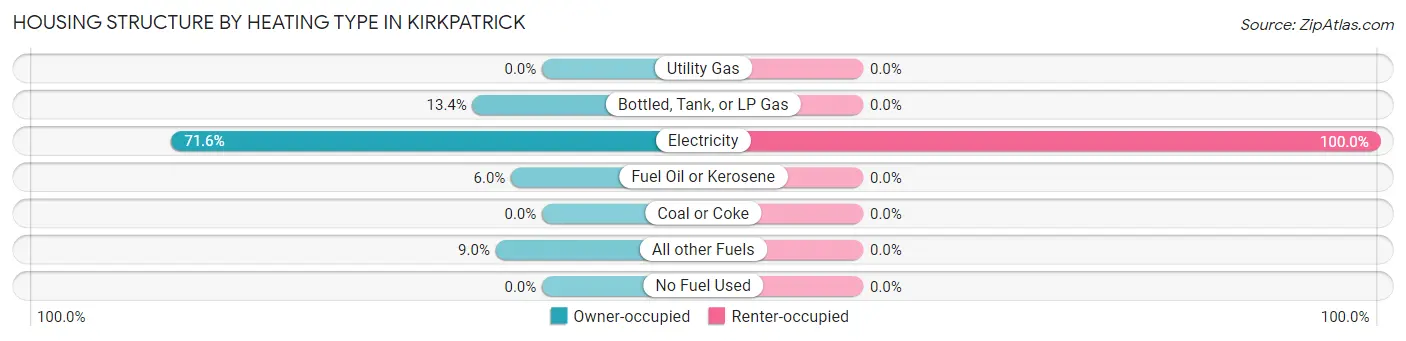
| Heating Type | Owner-occupied | Renter-occupied |
| Utility Gas | 0 (0.0%) | 0 (0.0%) |
| Bottled, Tank, or LP Gas | 9 (13.4%) | 0 (0.0%) |
| Electricity | 48 (71.6%) | 1 (100.0%) |
| Fuel Oil or Kerosene | 4 (6.0%) | 0 (0.0%) |
| Coal or Coke | 0 (0.0%) | 0 (0.0%) |
| All other Fuels | 6 (9.0%) | 0 (0.0%) |
| No Fuel Used | 0 (0.0%) | 0 (0.0%) |
| Total | 67 (100.0%) | 1 (100.0%) |
Household Vehicle Usage in Kirkpatrick
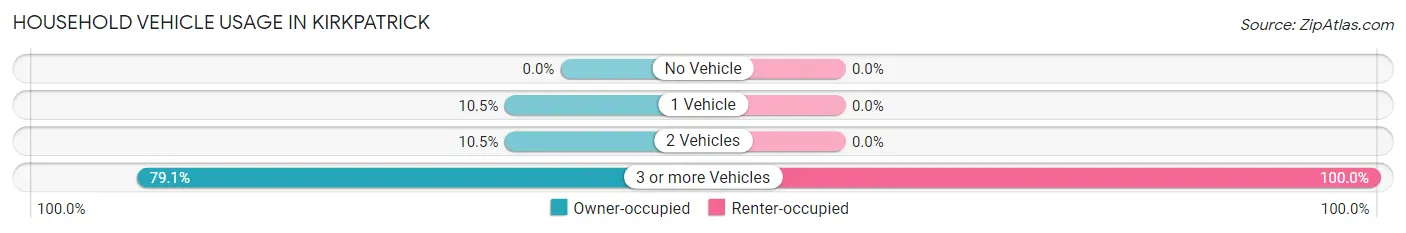
| Vehicles per Household | Owner-occupied | Renter-occupied |
| No Vehicle | 0 (0.0%) | 0 (0.0%) |
| 1 Vehicle | 7 (10.4%) | 0 (0.0%) |
| 2 Vehicles | 7 (10.4%) | 0 (0.0%) |
| 3 or more Vehicles | 53 (79.1%) | 1 (100.0%) |
| Total | 67 (100.0%) | 1 (100.0%) |
Real Estate & Mortgages in Kirkpatrick
Real Estate and Mortgage Overview in Kirkpatrick
| Characteristic | Without Mortgage | With Mortgage |
| Housing Units | 27 | 40 |
| Median Property Value | $231,300 | $291,700 |
| Median Household Income | - | - |
| Monthly Housing Costs | $275 | $0 |
| Real Estate Taxes | $3,600 | $0 |
Property Value by Mortgage Status in Kirkpatrick
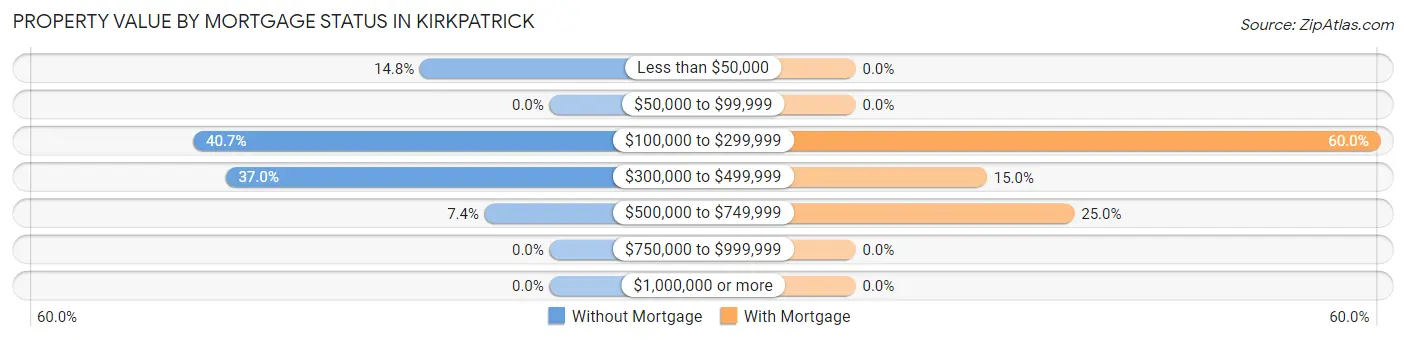
| Property Value | Without Mortgage | With Mortgage |
| Less than $50,000 | 4 (14.8%) | 0 (0.0%) |
| $50,000 to $99,999 | 0 (0.0%) | 0 (0.0%) |
| $100,000 to $299,999 | 11 (40.7%) | 24 (60.0%) |
| $300,000 to $499,999 | 10 (37.0%) | 6 (15.0%) |
| $500,000 to $749,999 | 2 (7.4%) | 10 (25.0%) |
| $750,000 to $999,999 | 0 (0.0%) | 0 (0.0%) |
| $1,000,000 or more | 0 (0.0%) | 0 (0.0%) |
| Total | 27 (100.0%) | 40 (100.0%) |
Household Income by Mortgage Status in Kirkpatrick
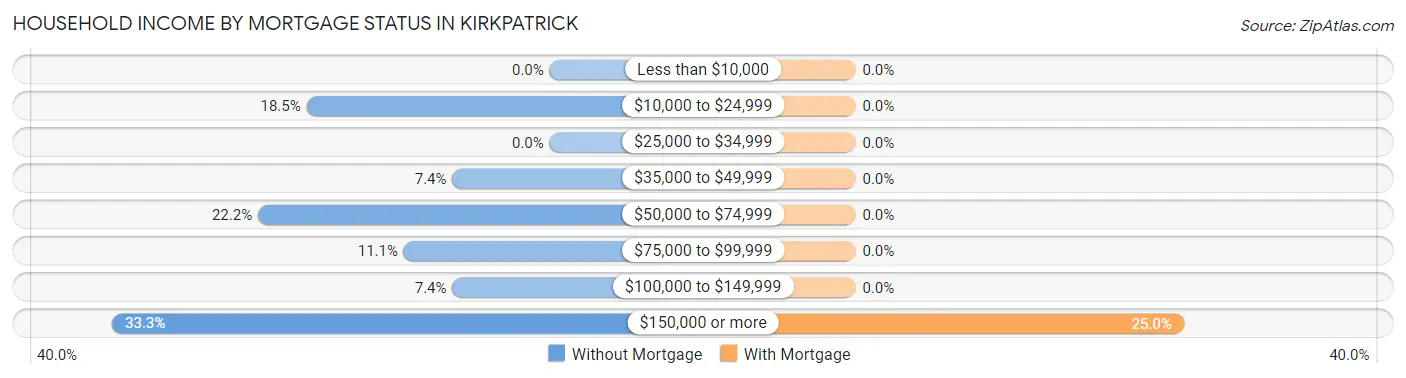
| Household Income | Without Mortgage | With Mortgage |
| Less than $10,000 | 0 (0.0%) | 0 (0.0%) |
| $10,000 to $24,999 | 5 (18.5%) | 0 (0.0%) |
| $25,000 to $34,999 | 0 (0.0%) | 0 (0.0%) |
| $35,000 to $49,999 | 2 (7.4%) | 0 (0.0%) |
| $50,000 to $74,999 | 6 (22.2%) | 0 (0.0%) |
| $75,000 to $99,999 | 3 (11.1%) | 0 (0.0%) |
| $100,000 to $149,999 | 2 (7.4%) | 0 (0.0%) |
| $150,000 or more | 9 (33.3%) | 10 (25.0%) |
| Total | 27 (100.0%) | 40 (100.0%) |
Property Value to Household Income Ratio in Kirkpatrick
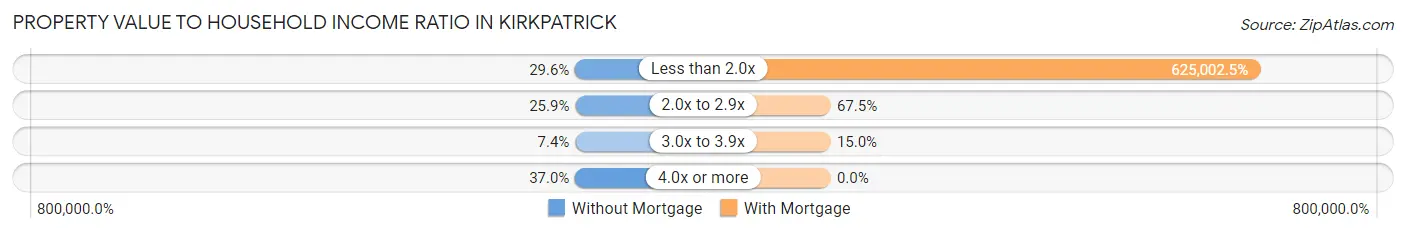
| Value-to-Income Ratio | Without Mortgage | With Mortgage |
| Less than 2.0x | 8 (29.6%) | 250,001 (625,002.5%) |
| 2.0x to 2.9x | 7 (25.9%) | 27 (67.5%) |
| 3.0x to 3.9x | 2 (7.4%) | 6 (15.0%) |
| 4.0x or more | 10 (37.0%) | 0 (0.0%) |
| Total | 27 (100.0%) | 40 (100.0%) |
Real Estate Taxes by Mortgage Status in Kirkpatrick
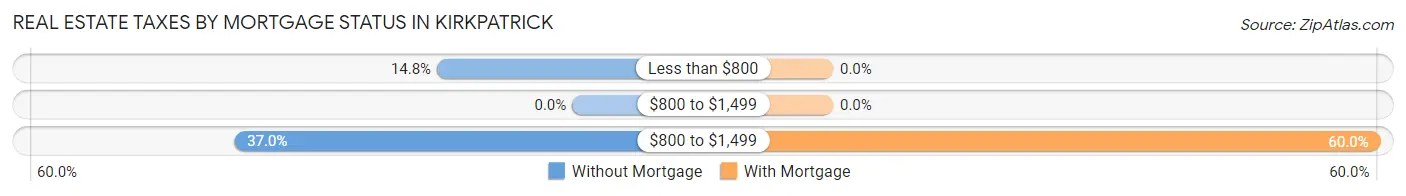
| Property Taxes | Without Mortgage | With Mortgage |
| Less than $800 | 4 (14.8%) | 0 (0.0%) |
| $800 to $1,499 | 0 (0.0%) | 0 (0.0%) |
| $800 to $1,499 | 10 (37.0%) | 24 (60.0%) |
| Total | 27 (100.0%) | 40 (100.0%) |
Health & Disability in Kirkpatrick
Health Insurance Coverage by Age in Kirkpatrick
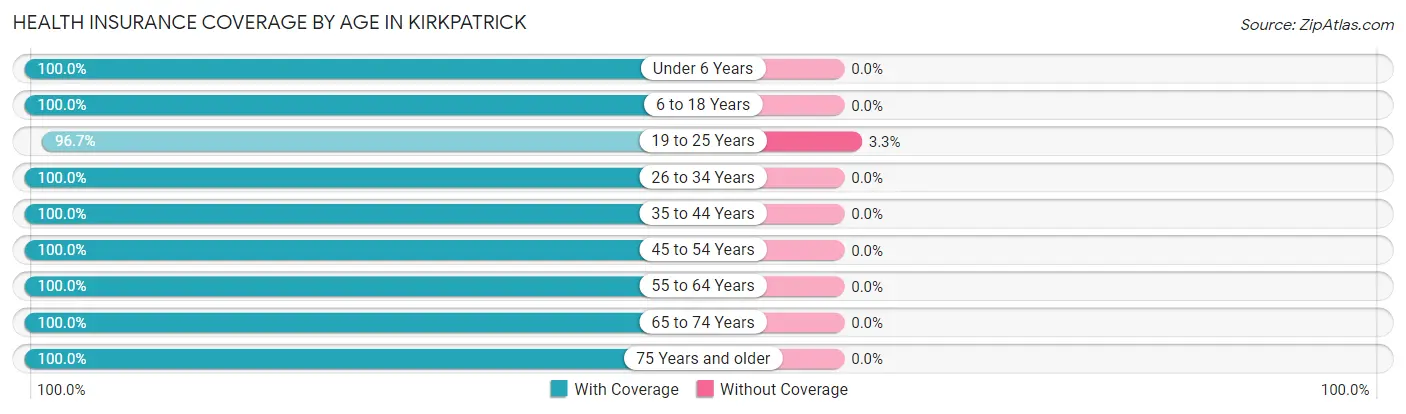
| Age Bracket | With Coverage | Without Coverage |
| Under 6 Years | 5 (100.0%) | 0 (0.0%) |
| 6 to 18 Years | 23 (100.0%) | 0 (0.0%) |
| 19 to 25 Years | 89 (96.7%) | 3 (3.3%) |
| 26 to 34 Years | 20 (100.0%) | 0 (0.0%) |
| 35 to 44 Years | 11 (100.0%) | 0 (0.0%) |
| 45 to 54 Years | 29 (100.0%) | 0 (0.0%) |
| 55 to 64 Years | 25 (100.0%) | 0 (0.0%) |
| 65 to 74 Years | 26 (100.0%) | 0 (0.0%) |
| 75 Years and older | 11 (100.0%) | 0 (0.0%) |
| Total | 239 (98.8%) | 3 (1.2%) |
Health Insurance Coverage by Citizenship Status in Kirkpatrick
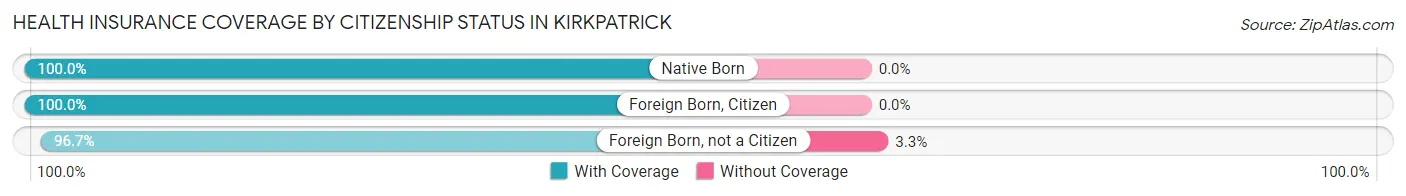
| Citizenship Status | With Coverage | Without Coverage |
| Native Born | 5 (100.0%) | 0 (0.0%) |
| Foreign Born, Citizen | 23 (100.0%) | 0 (0.0%) |
| Foreign Born, not a Citizen | 89 (96.7%) | 3 (3.3%) |
Health Insurance Coverage by Household Income in Kirkpatrick
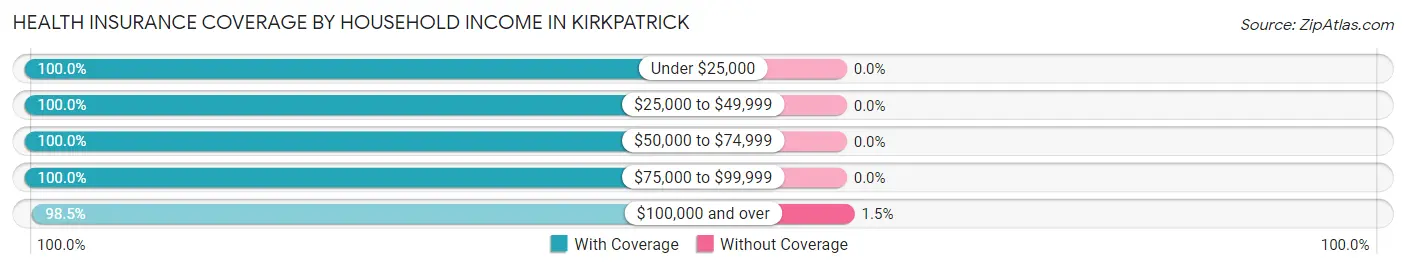
| Household Income | With Coverage | Without Coverage |
| Under $25,000 | 13 (100.0%) | 0 (0.0%) |
| $25,000 to $49,999 | 2 (100.0%) | 0 (0.0%) |
| $50,000 to $74,999 | 13 (100.0%) | 0 (0.0%) |
| $75,000 to $99,999 | 10 (100.0%) | 0 (0.0%) |
| $100,000 and over | 201 (98.5%) | 3 (1.5%) |
Public vs Private Health Insurance Coverage by Age in Kirkpatrick
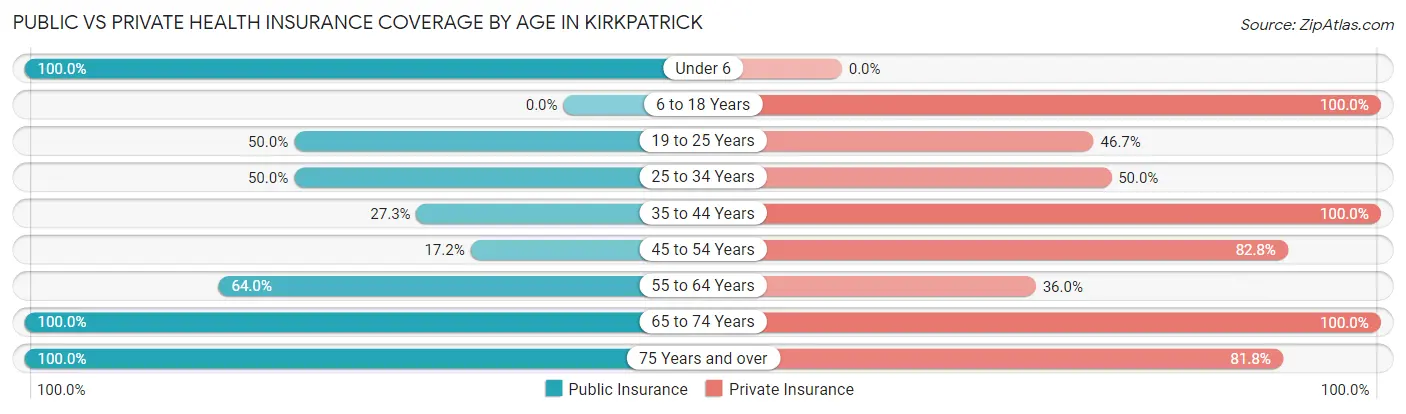
| Age Bracket | Public Insurance | Private Insurance |
| Under 6 | 5 (100.0%) | 0 (0.0%) |
| 6 to 18 Years | 0 (0.0%) | 23 (100.0%) |
| 19 to 25 Years | 46 (50.0%) | 43 (46.7%) |
| 25 to 34 Years | 10 (50.0%) | 10 (50.0%) |
| 35 to 44 Years | 3 (27.3%) | 11 (100.0%) |
| 45 to 54 Years | 5 (17.2%) | 24 (82.8%) |
| 55 to 64 Years | 16 (64.0%) | 9 (36.0%) |
| 65 to 74 Years | 26 (100.0%) | 26 (100.0%) |
| 75 Years and over | 11 (100.0%) | 9 (81.8%) |
| Total | 122 (50.4%) | 155 (64.0%) |
Disability Status by Sex by Age in Kirkpatrick
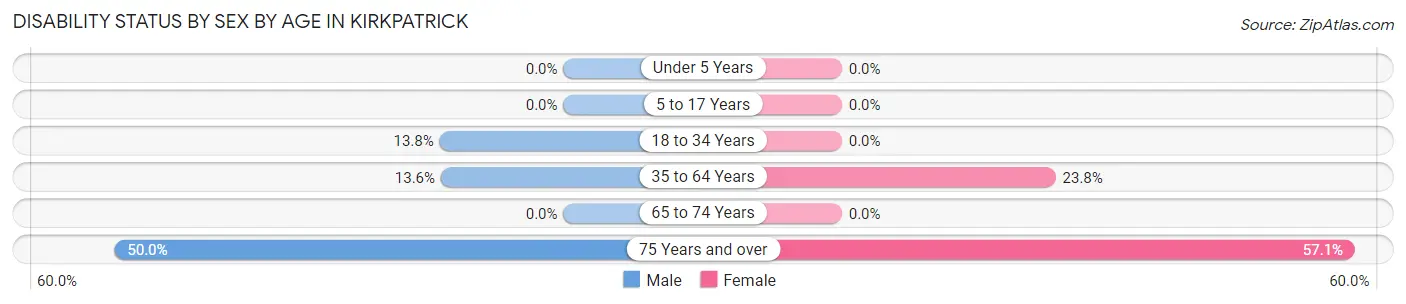
| Age Bracket | Male | Female |
| Under 5 Years | 0 (0.0%) | 0 (0.0%) |
| 5 to 17 Years | 0 (0.0%) | 0 (0.0%) |
| 18 to 34 Years | 8 (13.8%) | 0 (0.0%) |
| 35 to 64 Years | 6 (13.6%) | 5 (23.8%) |
| 65 to 74 Years | 0 (0.0%) | 0 (0.0%) |
| 75 Years and over | 2 (50.0%) | 4 (57.1%) |
Disability Class by Sex by Age in Kirkpatrick
Disability Class: Hearing Difficulty
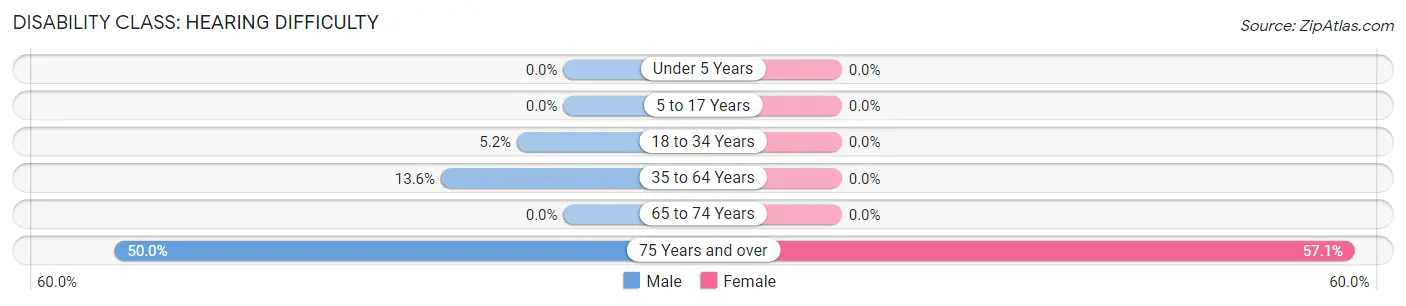
| Age Bracket | Male | Female |
| Under 5 Years | 0 (0.0%) | 0 (0.0%) |
| 5 to 17 Years | 0 (0.0%) | 0 (0.0%) |
| 18 to 34 Years | 3 (5.2%) | 0 (0.0%) |
| 35 to 64 Years | 6 (13.6%) | 0 (0.0%) |
| 65 to 74 Years | 0 (0.0%) | 0 (0.0%) |
| 75 Years and over | 2 (50.0%) | 4 (57.1%) |
Disability Class: Vision Difficulty
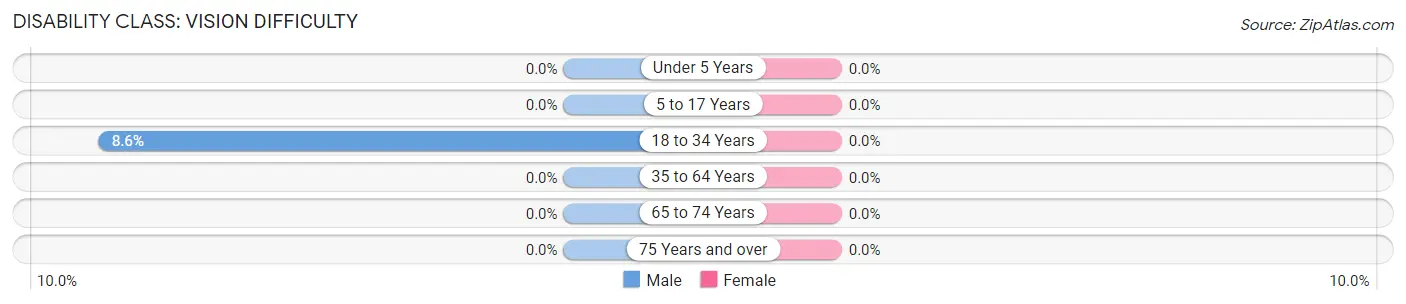
| Age Bracket | Male | Female |
| Under 5 Years | 0 (0.0%) | 0 (0.0%) |
| 5 to 17 Years | 0 (0.0%) | 0 (0.0%) |
| 18 to 34 Years | 5 (8.6%) | 0 (0.0%) |
| 35 to 64 Years | 0 (0.0%) | 0 (0.0%) |
| 65 to 74 Years | 0 (0.0%) | 0 (0.0%) |
| 75 Years and over | 0 (0.0%) | 0 (0.0%) |
Disability Class: Cognitive Difficulty
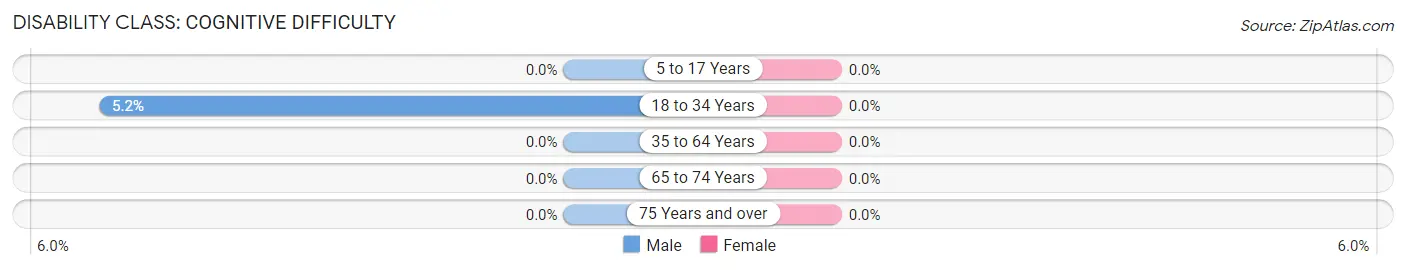
| Age Bracket | Male | Female |
| 5 to 17 Years | 0 (0.0%) | 0 (0.0%) |
| 18 to 34 Years | 3 (5.2%) | 0 (0.0%) |
| 35 to 64 Years | 0 (0.0%) | 0 (0.0%) |
| 65 to 74 Years | 0 (0.0%) | 0 (0.0%) |
| 75 Years and over | 0 (0.0%) | 0 (0.0%) |
Disability Class: Ambulatory Difficulty
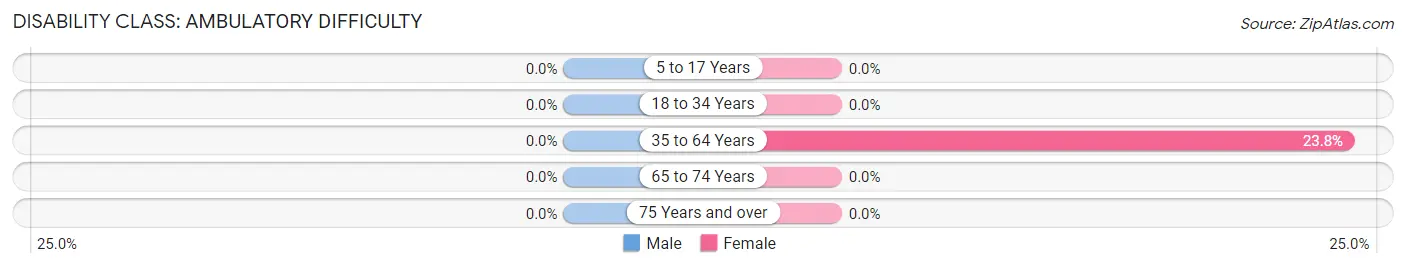
| Age Bracket | Male | Female |
| 5 to 17 Years | 0 (0.0%) | 0 (0.0%) |
| 18 to 34 Years | 0 (0.0%) | 0 (0.0%) |
| 35 to 64 Years | 0 (0.0%) | 5 (23.8%) |
| 65 to 74 Years | 0 (0.0%) | 0 (0.0%) |
| 75 Years and over | 0 (0.0%) | 0 (0.0%) |
Disability Class: Self-Care Difficulty

| Age Bracket | Male | Female |
| 5 to 17 Years | 0 (0.0%) | 0 (0.0%) |
| 18 to 34 Years | 3 (5.2%) | 0 (0.0%) |
| 35 to 64 Years | 0 (0.0%) | 0 (0.0%) |
| 65 to 74 Years | 0 (0.0%) | 0 (0.0%) |
| 75 Years and over | 0 (0.0%) | 0 (0.0%) |
Technology Access in Kirkpatrick
Computing Device Access in Kirkpatrick
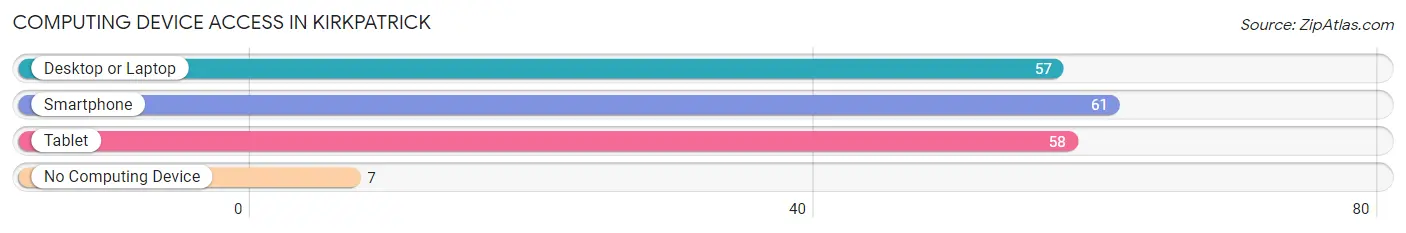
| Device Type | # Households | % Households |
| Desktop or Laptop | 57 | 83.8% |
| Smartphone | 61 | 89.7% |
| Tablet | 58 | 85.3% |
| No Computing Device | 7 | 10.3% |
| Total | 68 | 100.0% |
Internet Access in Kirkpatrick
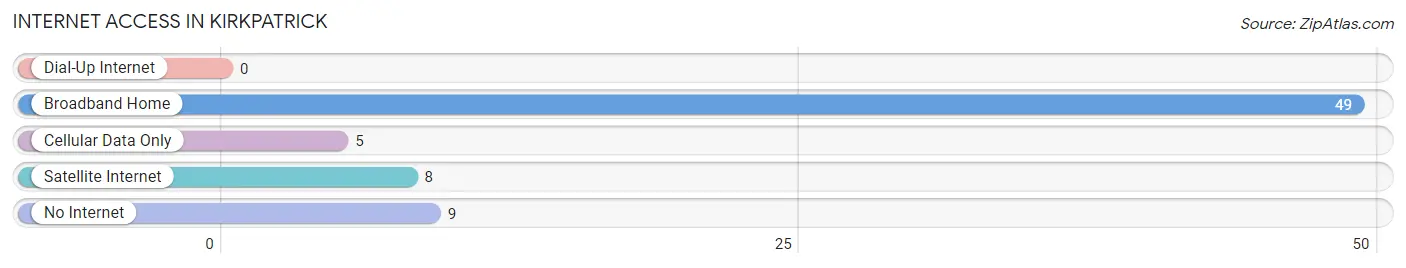
| Internet Type | # Households | % Households |
| Dial-Up Internet | 0 | 0.0% |
| Broadband Home | 49 | 72.1% |
| Cellular Data Only | 5 | 7.3% |
| Satellite Internet | 8 | 11.8% |
| No Internet | 9 | 13.2% |
| Total | 68 | 100.0% |
Kirkpatrick Summary
Kirkpatrick is an unincorporated community located in Marion County, Oregon, United States. It is situated in the foothills of the Cascade Mountains, approximately 20 miles east of Salem, the state capital. The community is named after the Kirkpatrick family, who settled in the area in the late 1800s.
History
The area that is now Kirkpatrick was originally inhabited by the Kalapuya Native American tribe. The first European settlers arrived in the area in the mid-1800s, and the Kirkpatrick family was among the first to settle in the area. The family established a homestead in the area in 1876, and the community was named after them.
In the early 1900s, the community began to grow as more settlers moved to the area. The first post office was established in 1910, and the first school was built in 1912. The community continued to grow throughout the 20th century, and by the 2000s, it had become a popular destination for outdoor recreation.
Geography
Kirkpatrick is located in the foothills of the Cascade Mountains, approximately 20 miles east of Salem. The community is situated at an elevation of 1,000 feet, and the surrounding area is characterized by rolling hills and dense forests. The nearby Cascade Mountains provide a scenic backdrop to the community, and the nearby Santiam River offers opportunities for fishing and other recreational activities.
Economy
Kirkpatrick is an unincorporated community, and as such, it does not have its own economy. The majority of the residents are employed in nearby towns and cities, such as Salem and Stayton. The nearby Cascade Mountains provide opportunities for outdoor recreation, and the nearby Santiam River offers fishing and other recreational activities.
Demographics
As of the 2010 census, the population of Kirkpatrick was 1,092. The racial makeup of the community was 97.2% White, 0.7% Native American, 0.3% Asian, 0.2% African American, and 1.6% from other races. The median household income was $45,000, and the median age was 44.
Kirkpatrick is a small, rural community with a close-knit community. The residents are friendly and welcoming, and the community is known for its strong sense of community and neighborly spirit. The community is also home to a variety of local businesses, including a grocery store, a hardware store, and a post office.
Common Questions
What is Per Capita Income in Kirkpatrick?
Per Capita income in Kirkpatrick is $57,716.
What is the Median Family Income in Kirkpatrick?
Median Family Income in Kirkpatrick is $198,438.
What is the Median Household income in Kirkpatrick?
Median Household Income in Kirkpatrick is $178,750.
What is Inequality or Gini Index in Kirkpatrick?
Inequality or Gini Index in Kirkpatrick is 0.34.
What is the Total Population of Kirkpatrick?
Total Population of Kirkpatrick is 242.
What is the Total Male Population of Kirkpatrick?
Total Male Population of Kirkpatrick is 142.
What is the Total Female Population of Kirkpatrick?
Total Female Population of Kirkpatrick is 100.
What is the Ratio of Males per 100 Females in Kirkpatrick?
There are 142.00 Males per 100 Females in Kirkpatrick.
What is the Ratio of Females per 100 Males in Kirkpatrick?
There are 70.42 Females per 100 Males in Kirkpatrick.
What is the Median Population Age in Kirkpatrick?
Median Population Age in Kirkpatrick is 26.1 Years.
What is the Average Family Size in Kirkpatrick
Average Family Size in Kirkpatrick is 3.0 People.
What is the Average Household Size in Kirkpatrick
Average Household Size in Kirkpatrick is 3.6 People.
How Large is the Labor Force in Kirkpatrick?
There are 151 People in the Labor Forcein in Kirkpatrick.
What is the Percentage of People in the Labor Force in Kirkpatrick?
65.9% of People are in the Labor Force in Kirkpatrick.
What is the Unemployment Rate in Kirkpatrick?
Unemployment Rate in Kirkpatrick is 4.6%.