Oakley, ID Map & Demographics
Oakley Map
Oakley Overview
$26,285
PER CAPITA INCOME
$82,500
AVG FAMILY INCOME
$77,500
AVG HOUSEHOLD INCOME
21.6%
WAGE / INCOME GAP [ % ]
78.4¢/ $1
WAGE / INCOME GAP [ $ ]
0.36
INEQUALITY / GINI INDEX
795
TOTAL POPULATION
396
MALE POPULATION
399
FEMALE POPULATION
99.25
MALES / 100 FEMALES
100.76
FEMALES / 100 MALES
35.2
MEDIAN AGE
3.8
AVG FAMILY SIZE
3.6
AVG HOUSEHOLD SIZE
299
LABOR FORCE [ PEOPLE ]
58.2%
PERCENT IN LABOR FORCE
1.7%
UNEMPLOYMENT RATE
Oakley Zip Codes
Oakley Area Codes
Income in Oakley
Income Overview in Oakley
Per Capita Income in Oakley is $26,285, while median incomes of families and households are $82,500 and $77,500 respectively.
| Characteristic | Number | Measure |
| Per Capita Income | 795 | $26,285 |
| Median Family Income | 200 | $82,500 |
| Mean Family Income | 200 | $100,689 |
| Median Household Income | 222 | $77,500 |
| Mean Household Income | 222 | $95,001 |
| Income Deficit | 200 | $0 |
| Wage / Income Gap (%) | 795 | 21.60% |
| Wage / Income Gap ($) | 795 | 78.40¢ per $1 |
| Gini / Inequality Index | 795 | 0.36 |
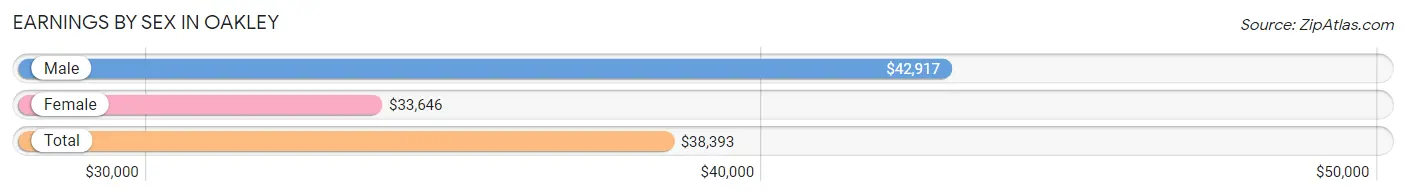
Earnings by Sex in Oakley
Average Earnings in Oakley are $38,393, $42,917 for men and $33,646 for women, a difference of 21.6%.
| Sex | Number | Average Earnings |
| Male | 178 (53.1%) | $42,917 |
| Female | 157 (46.9%) | $33,646 |
| Total | 335 (100.0%) | $38,393 |
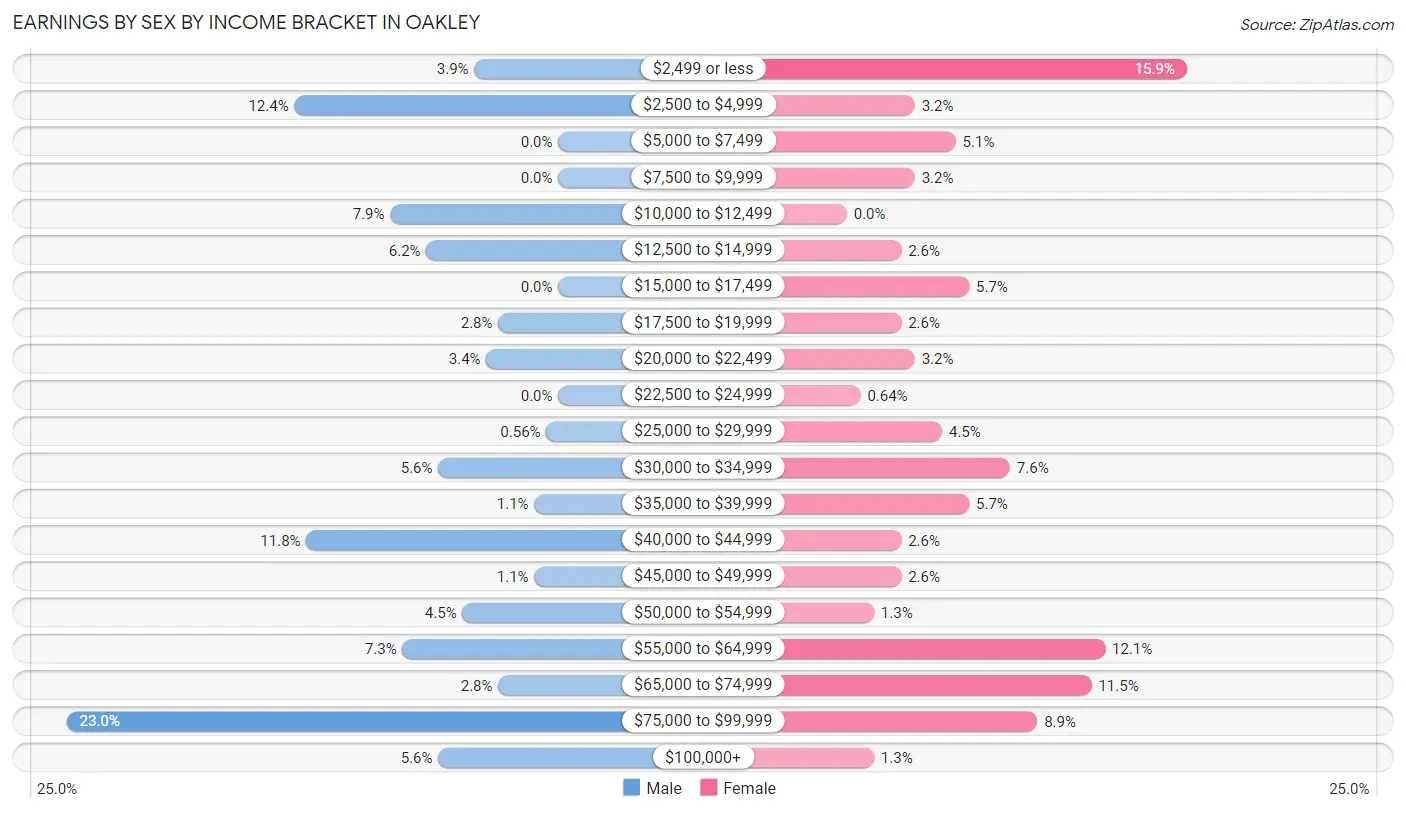
Earnings by Sex by Income Bracket in Oakley
The most common earnings brackets in Oakley are $75,000 to $99,999 for men (41 | 23.0%) and $2,499 or less for women (25 | 15.9%).
| Income | Male | Female |
| $2,499 or less | 7 (3.9%) | 25 (15.9%) |
| $2,500 to $4,999 | 22 (12.4%) | 5 (3.2%) |
| $5,000 to $7,499 | 0 (0.0%) | 8 (5.1%) |
| $7,500 to $9,999 | 0 (0.0%) | 5 (3.2%) |
| $10,000 to $12,499 | 14 (7.9%) | 0 (0.0%) |
| $12,500 to $14,999 | 11 (6.2%) | 4 (2.5%) |
| $15,000 to $17,499 | 0 (0.0%) | 9 (5.7%) |
| $17,500 to $19,999 | 5 (2.8%) | 4 (2.5%) |
| $20,000 to $22,499 | 6 (3.4%) | 5 (3.2%) |
| $22,500 to $24,999 | 0 (0.0%) | 1 (0.6%) |
| $25,000 to $29,999 | 1 (0.6%) | 7 (4.5%) |
| $30,000 to $34,999 | 10 (5.6%) | 12 (7.6%) |
| $35,000 to $39,999 | 2 (1.1%) | 9 (5.7%) |
| $40,000 to $44,999 | 21 (11.8%) | 4 (2.5%) |
| $45,000 to $49,999 | 2 (1.1%) | 4 (2.5%) |
| $50,000 to $54,999 | 8 (4.5%) | 2 (1.3%) |
| $55,000 to $64,999 | 13 (7.3%) | 19 (12.1%) |
| $65,000 to $74,999 | 5 (2.8%) | 18 (11.5%) |
| $75,000 to $99,999 | 41 (23.0%) | 14 (8.9%) |
| $100,000+ | 10 (5.6%) | 2 (1.3%) |
| Total | 178 (100.0%) | 157 (100.0%) |
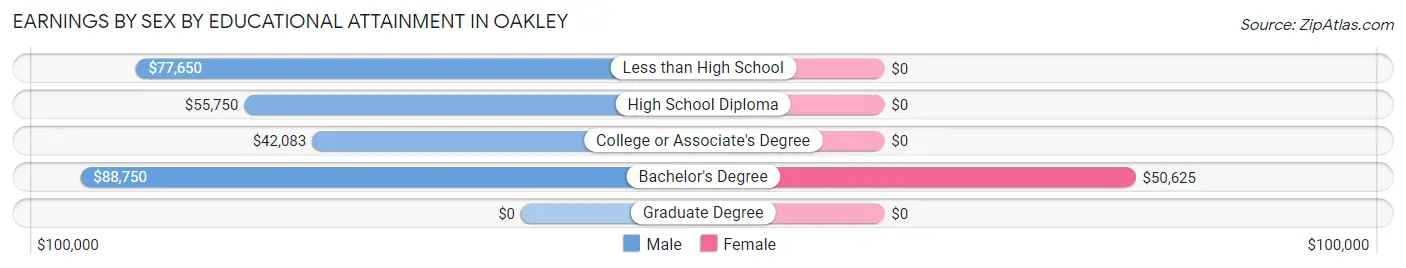
Earnings by Sex by Educational Attainment in Oakley
Average earnings in Oakley are $54,250 for men and $37,083 for women, a difference of 31.6%. Men with an educational attainment of bachelor's degree enjoy the highest average annual earnings of $88,750, while those with college or associate's degree education earn the least with $42,083. Women with an educational attainment of bachelor's degree earn the most with the average annual earnings of $50,625, while those with bachelor's degree education have the smallest earnings of $50,625.
| Educational Attainment | Male Income | Female Income |
| Less than High School | $77,650 | $0 |
| High School Diploma | $55,750 | $0 |
| College or Associate's Degree | $42,083 | $0 |
| Bachelor's Degree | $88,750 | $50,625 |
| Graduate Degree | - | - |
| Total | $54,250 | $37,083 |
Family Income in Oakley
Family Income Brackets in Oakley
According to the Oakley family income data, there are 49 families falling into the $50,000 to $74,999 income range, which is the most common income bracket and makes up 24.5% of all families.
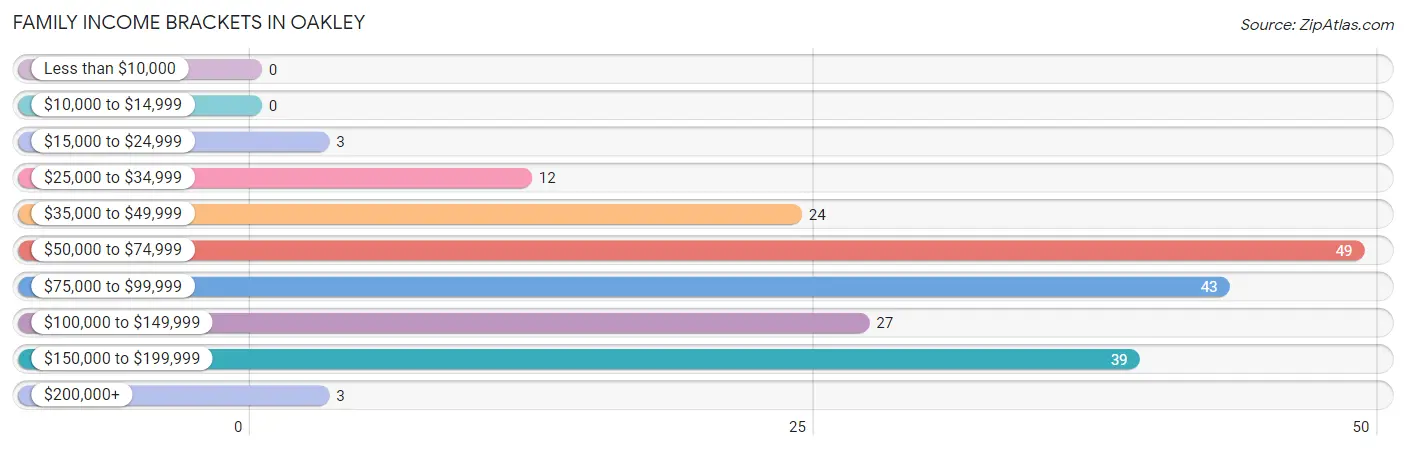
| Income Bracket | # Families | % Families |
| Less than $10,000 | 0 | 0.0% |
| $10,000 to $14,999 | 0 | 0.0% |
| $15,000 to $24,999 | 3 | 1.5% |
| $25,000 to $34,999 | 12 | 6.0% |
| $35,000 to $49,999 | 24 | 12.0% |
| $50,000 to $74,999 | 49 | 24.5% |
| $75,000 to $99,999 | 43 | 21.5% |
| $100,000 to $149,999 | 27 | 13.5% |
| $150,000 to $199,999 | 39 | 19.5% |
| $200,000+ | 3 | 1.5% |
Family Income by Famaliy Size in Oakley
5-person families (52 | 26.0%) account for the highest median family income in Oakley with $157,700 per family, while 3-person families (16 | 8.0%) have the highest median income of $42,083 per family member.
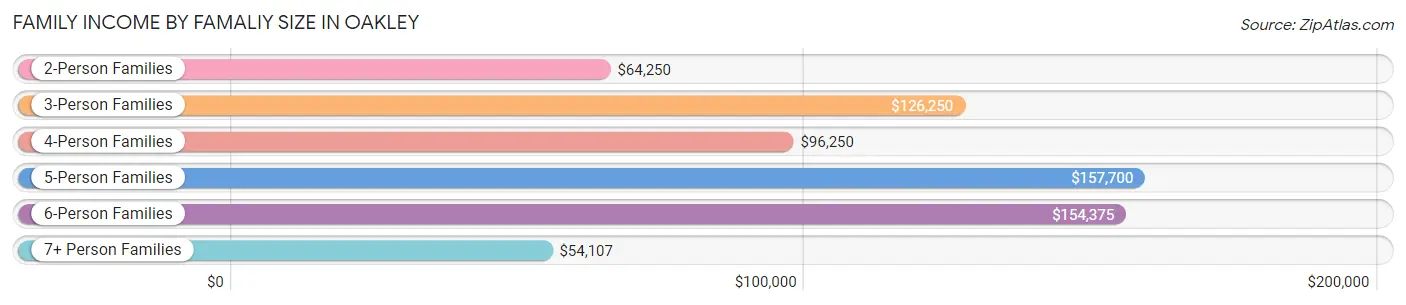
| Income Bracket | # Families | Median Income |
| 2-Person Families | 80 (40.0%) | $64,250 |
| 3-Person Families | 16 (8.0%) | $126,250 |
| 4-Person Families | 23 (11.5%) | $96,250 |
| 5-Person Families | 52 (26.0%) | $157,700 |
| 6-Person Families | 12 (6.0%) | $154,375 |
| 7+ Person Families | 17 (8.5%) | $54,107 |
| Total | 200 (100.0%) | $82,500 |
Family Income by Number of Earners in Oakley
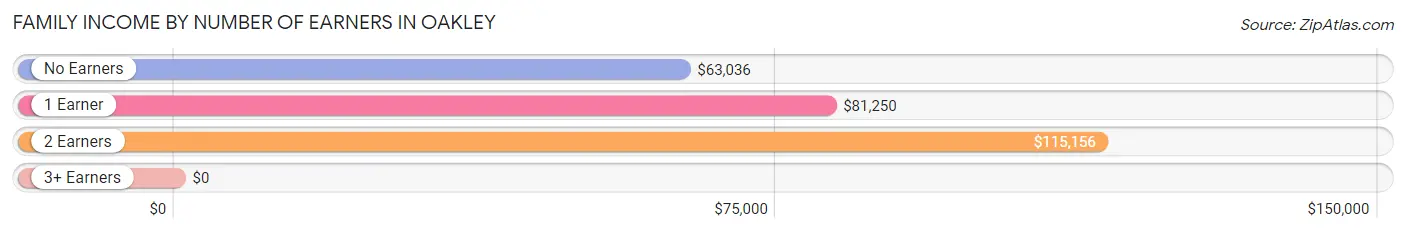
| Number of Earners | # Families | Median Income |
| No Earners | 37 (18.5%) | $63,036 |
| 1 Earner | 44 (22.0%) | $81,250 |
| 2 Earners | 93 (46.5%) | $115,156 |
| 3+ Earners | 26 (13.0%) | $0 |
| Total | 200 (100.0%) | $82,500 |
Household Income in Oakley
Household Income Brackets in Oakley
With 55 households falling in the category, the $50,000 to $74,999 income range is the most frequent in Oakley, accounting for 24.8% of all households.
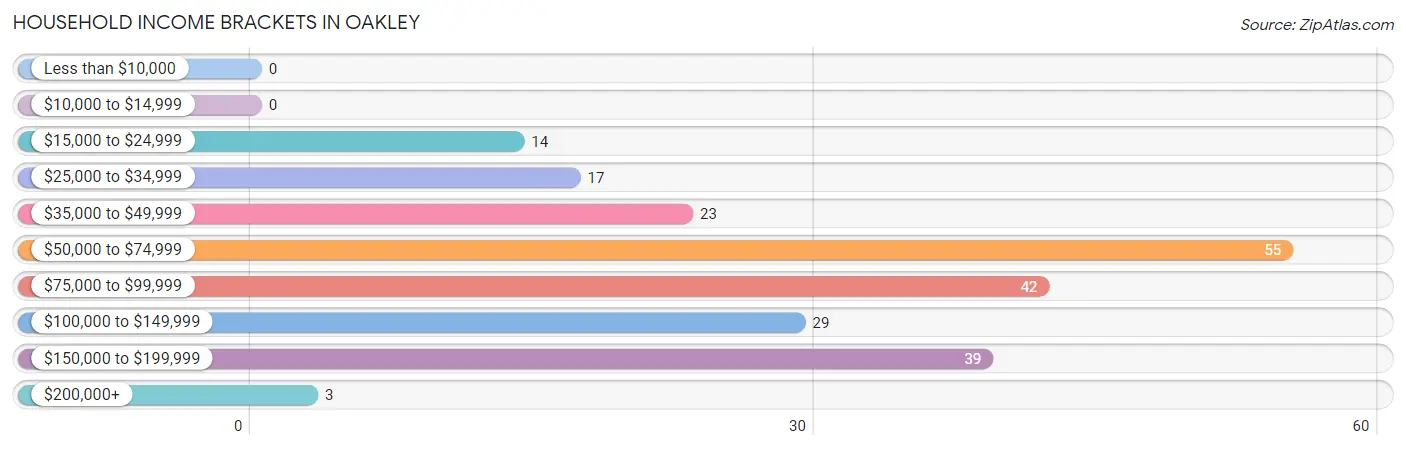
| Income Bracket | # Households | % Households |
| Less than $10,000 | 0 | 0.0% |
| $10,000 to $14,999 | 0 | 0.0% |
| $15,000 to $24,999 | 14 | 6.3% |
| $25,000 to $34,999 | 17 | 7.7% |
| $35,000 to $49,999 | 23 | 10.4% |
| $50,000 to $74,999 | 55 | 24.8% |
| $75,000 to $99,999 | 42 | 18.9% |
| $100,000 to $149,999 | 29 | 13.1% |
| $150,000 to $199,999 | 39 | 17.6% |
| $200,000+ | 3 | 1.4% |
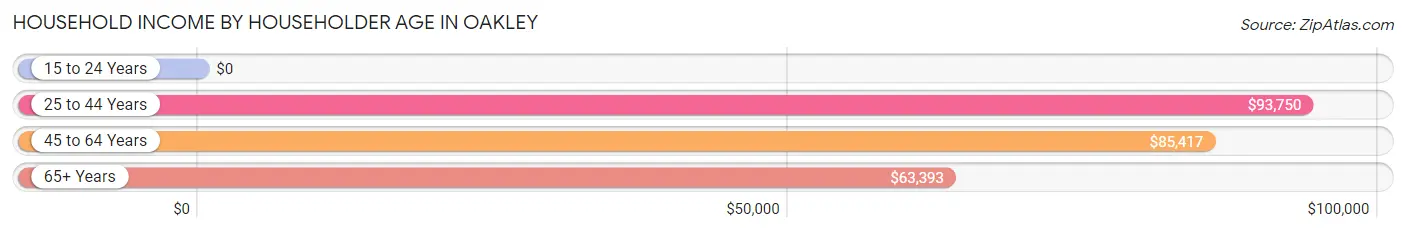
Household Income by Householder Age in Oakley
The median household income in Oakley is $77,500, with the highest median household income of $93,750 found in the 25 to 44 years age bracket for the primary householder. A total of 99 households (44.6%) fall into this category. Meanwhile, the 15 to 24 years age bracket for the primary householder has the lowest median household income of $0, with 3 households (1.3%) in this group.
| Income Bracket | # Households | Median Income |
| 15 to 24 Years | 3 (1.3%) | $0 |
| 25 to 44 Years | 99 (44.6%) | $93,750 |
| 45 to 64 Years | 41 (18.5%) | $85,417 |
| 65+ Years | 79 (35.6%) | $63,393 |
| Total | 222 (100.0%) | $77,500 |
Poverty in Oakley
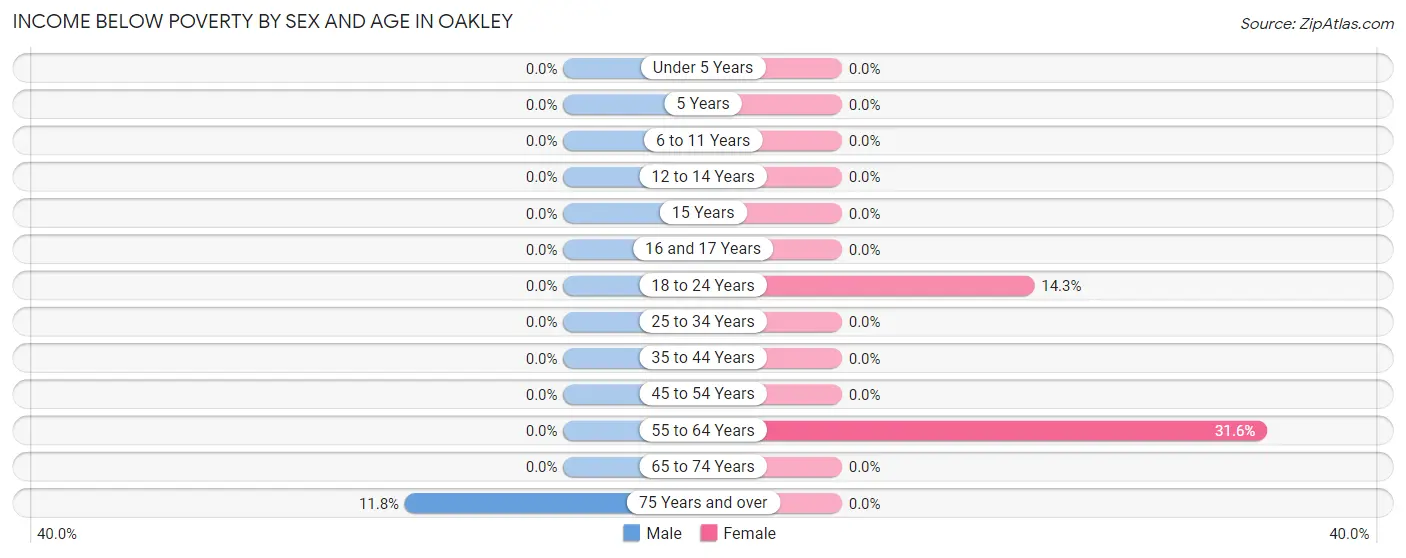
Income Below Poverty by Sex and Age in Oakley
With 1.0% poverty level for males and 2.5% for females among the residents of Oakley, 75 year old and over males and 55 to 64 year old females are the most vulnerable to poverty, with 4 males (11.8%) and 6 females (31.6%) in their respective age groups living below the poverty level.
| Age Bracket | Male | Female |
| Under 5 Years | 0 (0.0%) | 0 (0.0%) |
| 5 Years | 0 (0.0%) | 0 (0.0%) |
| 6 to 11 Years | 0 (0.0%) | 0 (0.0%) |
| 12 to 14 Years | 0 (0.0%) | 0 (0.0%) |
| 15 Years | 0 (0.0%) | 0 (0.0%) |
| 16 and 17 Years | 0 (0.0%) | 0 (0.0%) |
| 18 to 24 Years | 0 (0.0%) | 4 (14.3%) |
| 25 to 34 Years | 0 (0.0%) | 0 (0.0%) |
| 35 to 44 Years | 0 (0.0%) | 0 (0.0%) |
| 45 to 54 Years | 0 (0.0%) | 0 (0.0%) |
| 55 to 64 Years | 0 (0.0%) | 6 (31.6%) |
| 65 to 74 Years | 0 (0.0%) | 0 (0.0%) |
| 75 Years and over | 4 (11.8%) | 0 (0.0%) |
| Total | 4 (1.0%) | 10 (2.5%) |
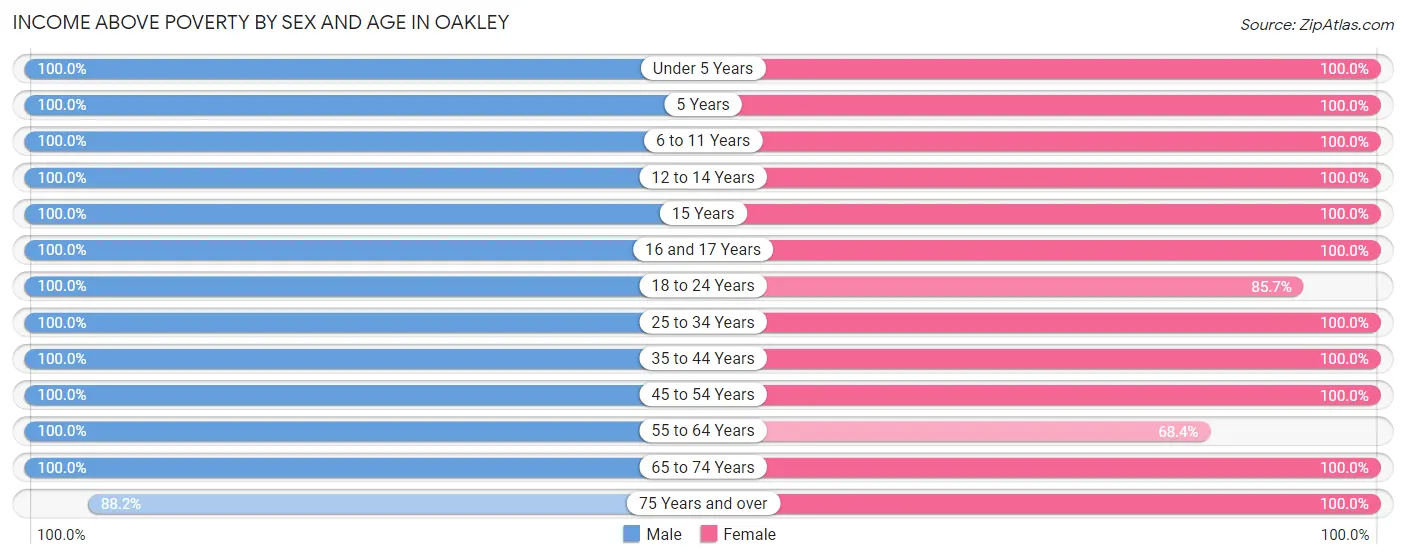
Income Above Poverty by Sex and Age in Oakley
According to the poverty statistics in Oakley, males aged under 5 years and females aged under 5 years are the age groups that are most secure financially, with 100.0% of males and 100.0% of females in these age groups living above the poverty line.
| Age Bracket | Male | Female |
| Under 5 Years | 30 (100.0%) | 14 (100.0%) |
| 5 Years | 23 (100.0%) | 4 (100.0%) |
| 6 to 11 Years | 59 (100.0%) | 79 (100.0%) |
| 12 to 14 Years | 18 (100.0%) | 35 (100.0%) |
| 15 Years | 16 (100.0%) | 3 (100.0%) |
| 16 and 17 Years | 20 (100.0%) | 5 (100.0%) |
| 18 to 24 Years | 18 (100.0%) | 24 (85.7%) |
| 25 to 34 Years | 13 (100.0%) | 28 (100.0%) |
| 35 to 44 Years | 80 (100.0%) | 59 (100.0%) |
| 45 to 54 Years | 23 (100.0%) | 39 (100.0%) |
| 55 to 64 Years | 18 (100.0%) | 13 (68.4%) |
| 65 to 74 Years | 44 (100.0%) | 51 (100.0%) |
| 75 Years and over | 30 (88.2%) | 35 (100.0%) |
| Total | 392 (99.0%) | 389 (97.5%) |
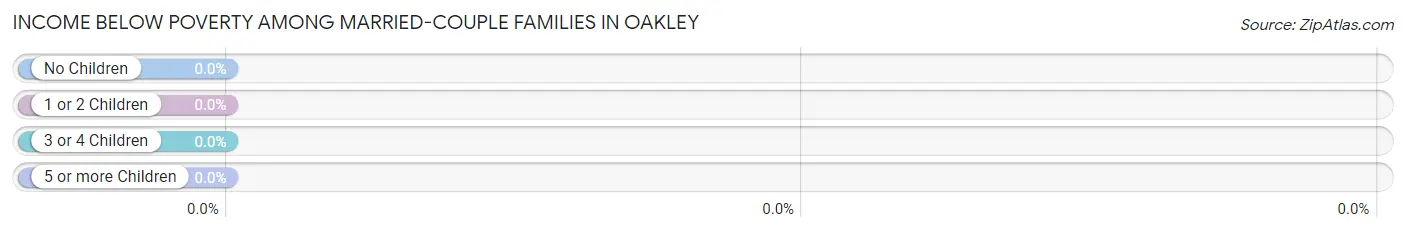
Income Below Poverty Among Married-Couple Families in Oakley
| Children | Above Poverty | Below Poverty |
| No Children | 82 (100.0%) | 0 (0.0%) |
| 1 or 2 Children | 33 (100.0%) | 0 (0.0%) |
| 3 or 4 Children | 48 (100.0%) | 0 (0.0%) |
| 5 or more Children | 13 (100.0%) | 0 (0.0%) |
| Total | 176 (100.0%) | 0 (0.0%) |
Income Below Poverty Among Single-Parent Households in Oakley
| Children | Single Father | Single Mother |
| No Children | 0 (0.0%) | 0 (0.0%) |
| 1 or 2 Children | 0 (0.0%) | 0 (0.0%) |
| 3 or 4 Children | 0 (0.0%) | 0 (0.0%) |
| 5 or more Children | 0 (0.0%) | 0 (0.0%) |
| Total | 0 (0.0%) | 0 (0.0%) |
Income Below Poverty Among Married-Couple vs Single-Parent Households in Oakley
| Children | Married-Couple Families | Single-Parent Households |
| No Children | 0 (0.0%) | 0 (0.0%) |
| 1 or 2 Children | 0 (0.0%) | 0 (0.0%) |
| 3 or 4 Children | 0 (0.0%) | 0 (0.0%) |
| 5 or more Children | 0 (0.0%) | 0 (0.0%) |
| Total | 0 (0.0%) | 0 (0.0%) |
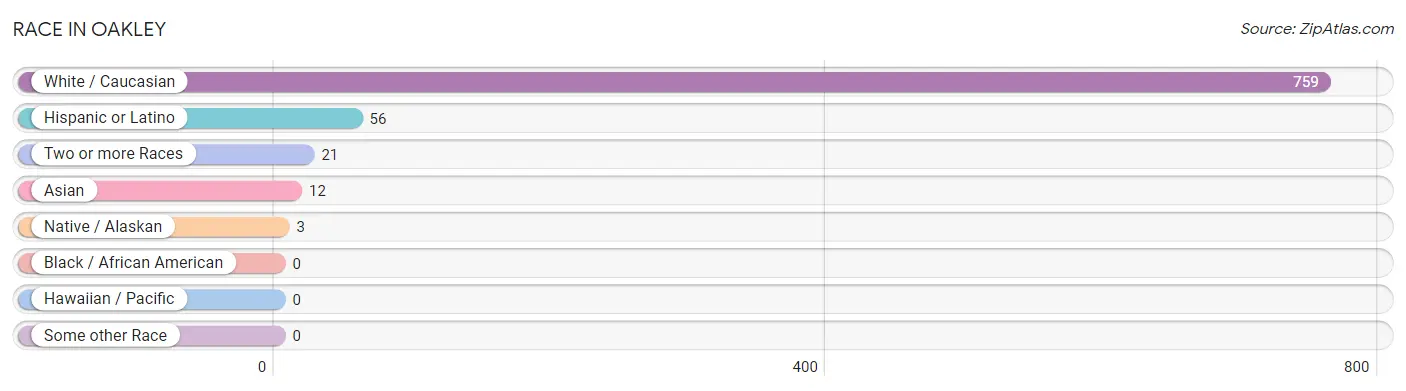
Race in Oakley
The most populous races in Oakley are White / Caucasian (759 | 95.5%), Hispanic or Latino (56 | 7.0%), and Two or more Races (21 | 2.6%).
| Race | # Population | % Population |
| Asian | 12 | 1.5% |
| Black / African American | 0 | 0.0% |
| Hawaiian / Pacific | 0 | 0.0% |
| Hispanic or Latino | 56 | 7.0% |
| Native / Alaskan | 3 | 0.4% |
| White / Caucasian | 759 | 95.5% |
| Two or more Races | 21 | 2.6% |
| Some other Race | 0 | 0.0% |
| Total | 795 | 100.0% |
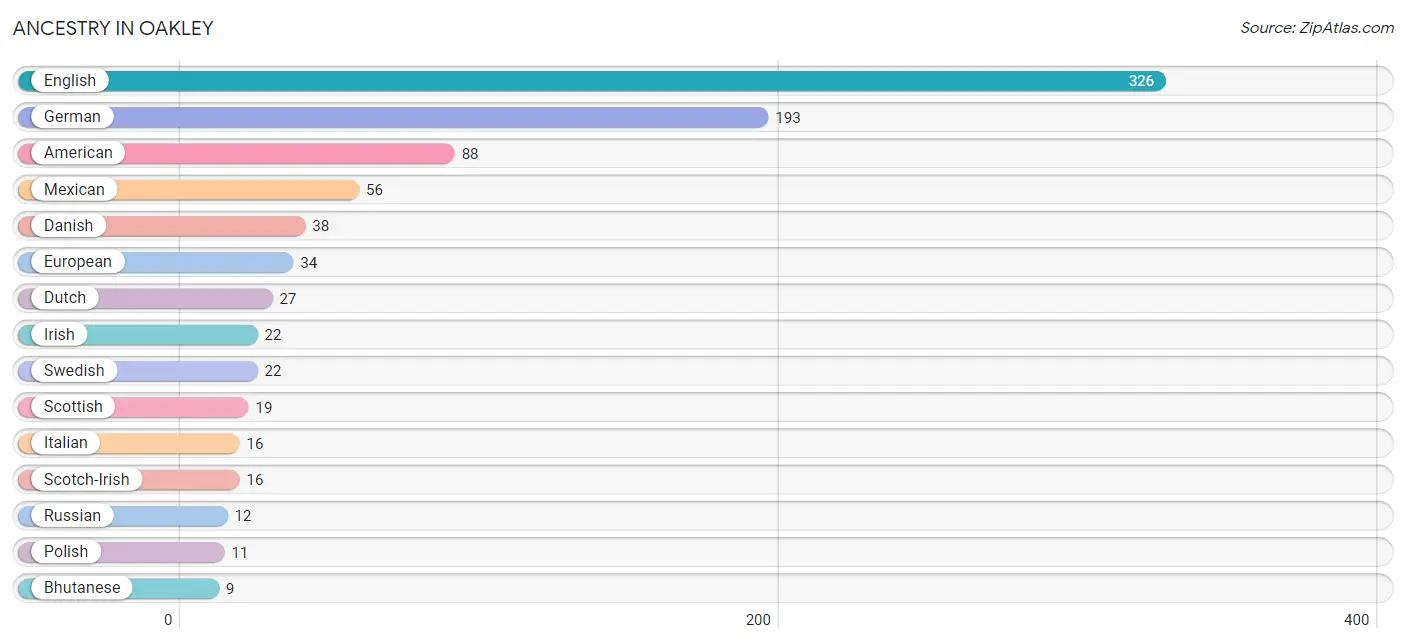
Ancestry in Oakley
The most populous ancestries reported in Oakley are English (326 | 41.0%), German (193 | 24.3%), American (88 | 11.1%), Mexican (56 | 7.0%), and Danish (38 | 4.8%), together accounting for 88.2% of all Oakley residents.
| Ancestry | # Population | % Population |
| American | 88 | 11.1% |
| Arapaho | 1 | 0.1% |
| Bhutanese | 9 | 1.1% |
| Danish | 38 | 4.8% |
| Dutch | 27 | 3.4% |
| English | 326 | 41.0% |
| European | 34 | 4.3% |
| German | 193 | 24.3% |
| Irish | 22 | 2.8% |
| Italian | 16 | 2.0% |
| Korean | 3 | 0.4% |
| Mexican | 56 | 7.0% |
| Norwegian | 9 | 1.1% |
| Polish | 11 | 1.4% |
| Russian | 12 | 1.5% |
| Scandinavian | 1 | 0.1% |
| Scotch-Irish | 16 | 2.0% |
| Scottish | 19 | 2.4% |
| Swedish | 22 | 2.8% |
| Swiss | 9 | 1.1% |
| Welsh | 9 | 1.1% |
| Yakama | 1 | 0.1% | View All 22 Rows |
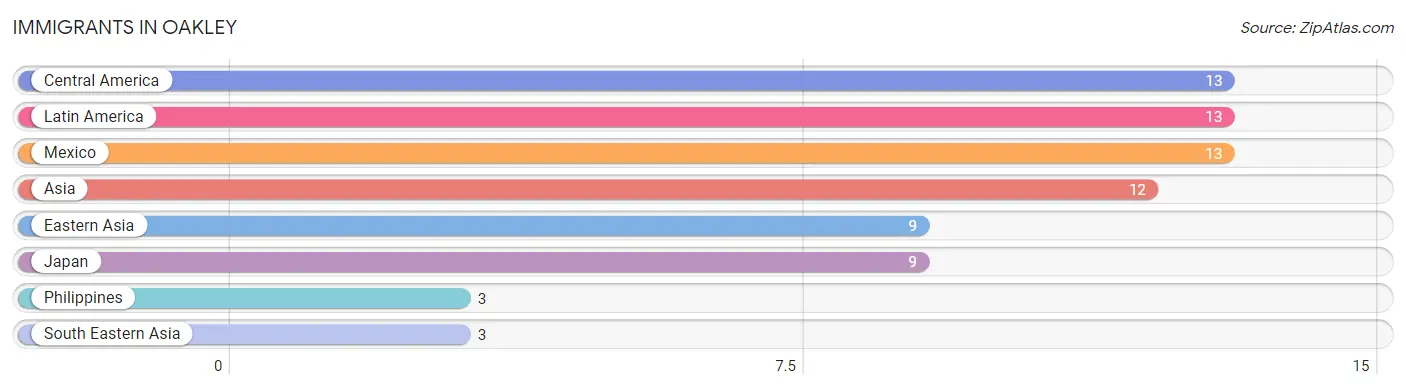
Immigrants in Oakley
The most numerous immigrant groups reported in Oakley came from Central America (13 | 1.6%), Latin America (13 | 1.6%), Mexico (13 | 1.6%), Asia (12 | 1.5%), and Eastern Asia (9 | 1.1%), together accounting for 7.6% of all Oakley residents.
| Immigration Origin | # Population | % Population |
| Asia | 12 | 1.5% |
| Central America | 13 | 1.6% |
| Eastern Asia | 9 | 1.1% |
| Japan | 9 | 1.1% |
| Latin America | 13 | 1.6% |
| Mexico | 13 | 1.6% |
| Philippines | 3 | 0.4% |
| South Eastern Asia | 3 | 0.4% | View All 8 Rows |
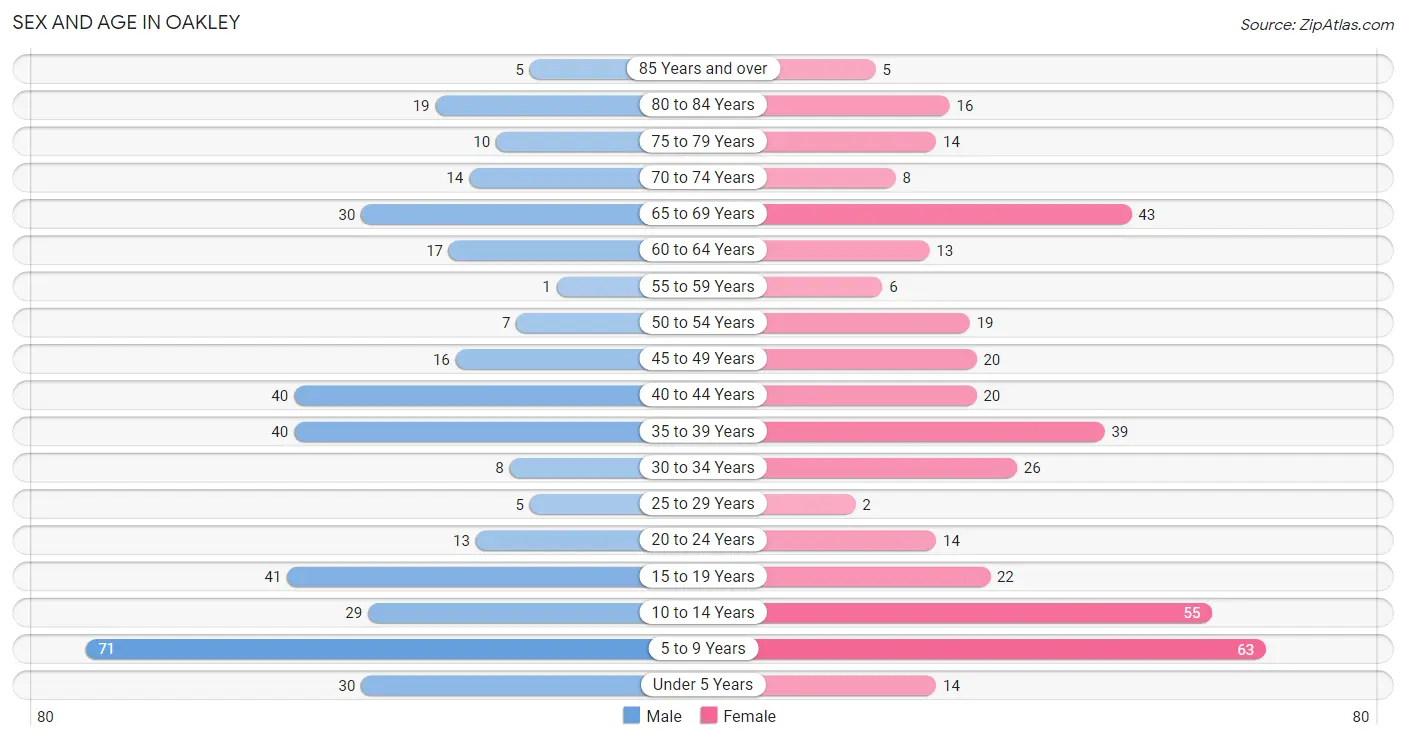
Sex and Age in Oakley
Sex and Age in Oakley
The most populous age groups in Oakley are 5 to 9 Years (71 | 17.9%) for men and 5 to 9 Years (63 | 15.8%) for women.
| Age Bracket | Male | Female |
| Under 5 Years | 30 (7.6%) | 14 (3.5%) |
| 5 to 9 Years | 71 (17.9%) | 63 (15.8%) |
| 10 to 14 Years | 29 (7.3%) | 55 (13.8%) |
| 15 to 19 Years | 41 (10.3%) | 22 (5.5%) |
| 20 to 24 Years | 13 (3.3%) | 14 (3.5%) |
| 25 to 29 Years | 5 (1.3%) | 2 (0.5%) |
| 30 to 34 Years | 8 (2.0%) | 26 (6.5%) |
| 35 to 39 Years | 40 (10.1%) | 39 (9.8%) |
| 40 to 44 Years | 40 (10.1%) | 20 (5.0%) |
| 45 to 49 Years | 16 (4.0%) | 20 (5.0%) |
| 50 to 54 Years | 7 (1.8%) | 19 (4.8%) |
| 55 to 59 Years | 1 (0.3%) | 6 (1.5%) |
| 60 to 64 Years | 17 (4.3%) | 13 (3.3%) |
| 65 to 69 Years | 30 (7.6%) | 43 (10.8%) |
| 70 to 74 Years | 14 (3.5%) | 8 (2.0%) |
| 75 to 79 Years | 10 (2.5%) | 14 (3.5%) |
| 80 to 84 Years | 19 (4.8%) | 16 (4.0%) |
| 85 Years and over | 5 (1.3%) | 5 (1.3%) |
| Total | 396 (100.0%) | 399 (100.0%) |
Families and Households in Oakley
Median Family Size in Oakley
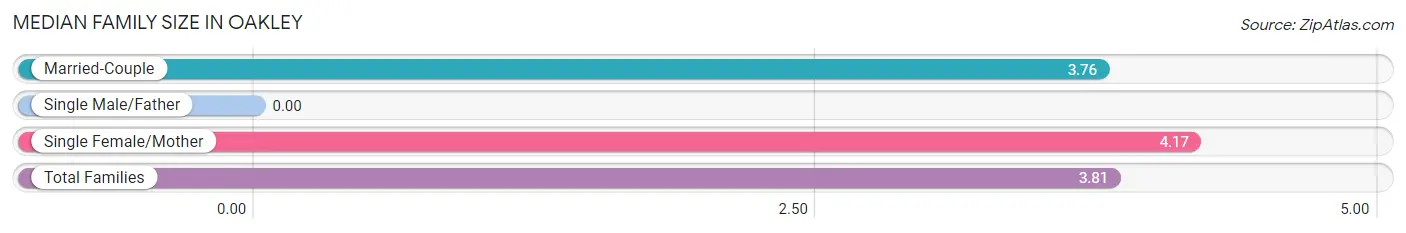
| Family Type | # Families | Family Size |
| Married-Couple | 176 (88.0%) | 3.76 |
| Single Male/Father | 0 (0.0%) | - |
| Single Female/Mother | 24 (12.0%) | 4.17 |
| Total Families | 200 (100.0%) | 3.81 |
Median Household Size in Oakley
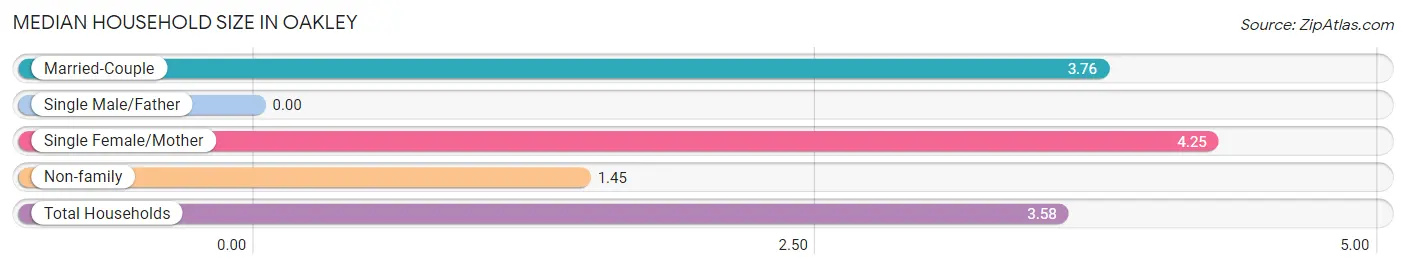
| Household Type | # Households | Household Size |
| Married-Couple | 176 (79.3%) | 3.76 |
| Single Male/Father | 0 (0.0%) | - |
| Single Female/Mother | 24 (10.8%) | 4.25 |
| Non-family | 22 (9.9%) | 1.45 |
| Total Households | 222 (100.0%) | 3.58 |
Household Size by Marriage Status in Oakley
Out of a total of 222 households in Oakley, 200 (90.1%) are family households, while 22 (9.9%) are nonfamily households. The most numerous type of family households are 2-person households, comprising 77, and the most common type of nonfamily households are 1-person households, comprising 15.
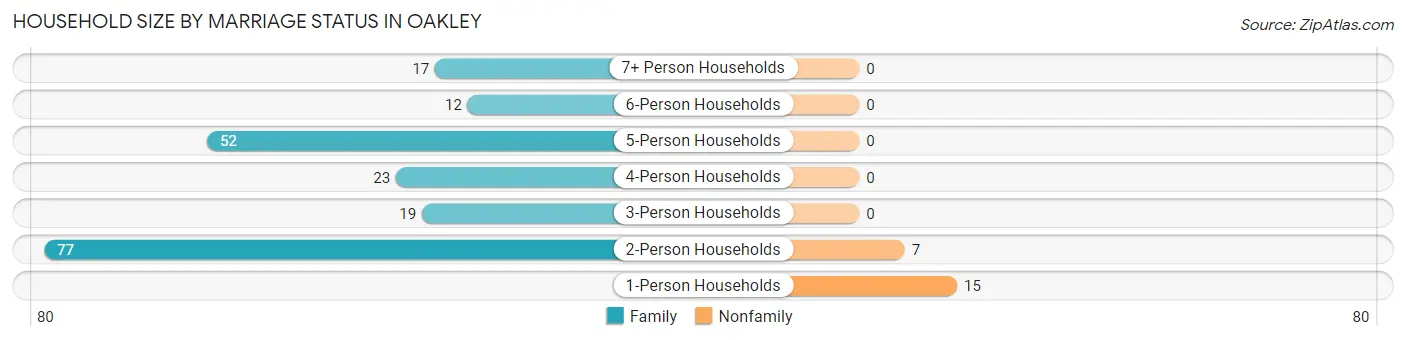
| Household Size | Family Households | Nonfamily Households |
| 1-Person Households | - | 15 (6.8%) |
| 2-Person Households | 77 (34.7%) | 7 (3.2%) |
| 3-Person Households | 19 (8.6%) | 0 (0.0%) |
| 4-Person Households | 23 (10.4%) | 0 (0.0%) |
| 5-Person Households | 52 (23.4%) | 0 (0.0%) |
| 6-Person Households | 12 (5.4%) | 0 (0.0%) |
| 7+ Person Households | 17 (7.7%) | 0 (0.0%) |
| Total | 200 (90.1%) | 22 (9.9%) |
Female Fertility in Oakley
Fertility by Age in Oakley
Average fertility rate in Oakley is 71.0 births per 1,000 women. Women in the age bracket of 15 to 19 years have the highest fertility rate with 182.0 births per 1,000 women. Women in the age bracket of 35 to 50 years acount for 45.5% of all women with births.
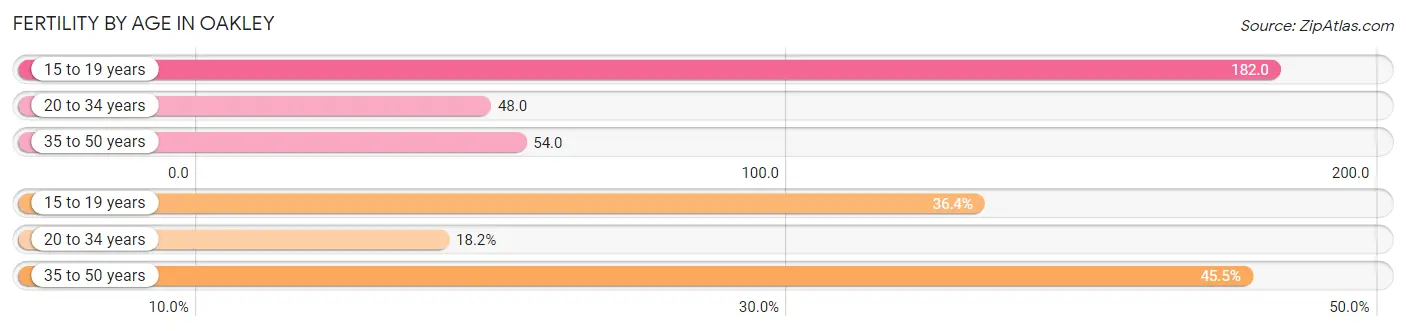
| Age Bracket | Women with Births | Births / 1,000 Women |
| 15 to 19 years | 4 (36.4%) | 182.0 |
| 20 to 34 years | 2 (18.2%) | 48.0 |
| 35 to 50 years | 5 (45.5%) | 54.0 |
| Total | 11 (100.0%) | 71.0 |
Fertility by Age by Marriage Status in Oakley
63.6% of women with births (11) in Oakley are married. The highest percentage of unmarried women with births falls into 15 to 19 years age bracket with 100.0% of them unmarried at the time of birth, while the lowest percentage of unmarried women with births belong to 20 to 34 years age bracket with 0.0% of them unmarried.
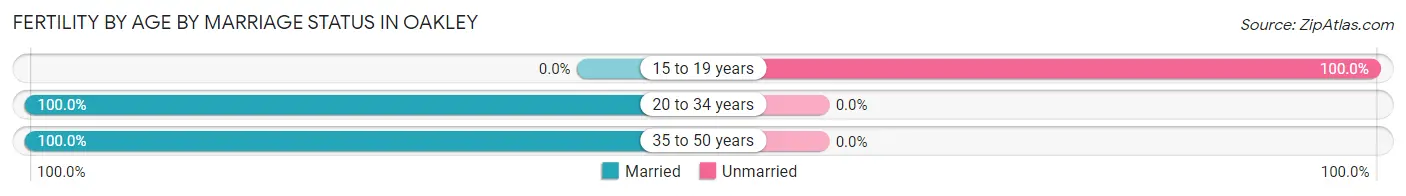
| Age Bracket | Married | Unmarried |
| 15 to 19 years | 0 (0.0%) | 4 (100.0%) |
| 20 to 34 years | 2 (100.0%) | 0 (0.0%) |
| 35 to 50 years | 5 (100.0%) | 0 (0.0%) |
| Total | 7 (63.6%) | 4 (36.4%) |
Fertility by Education in Oakley
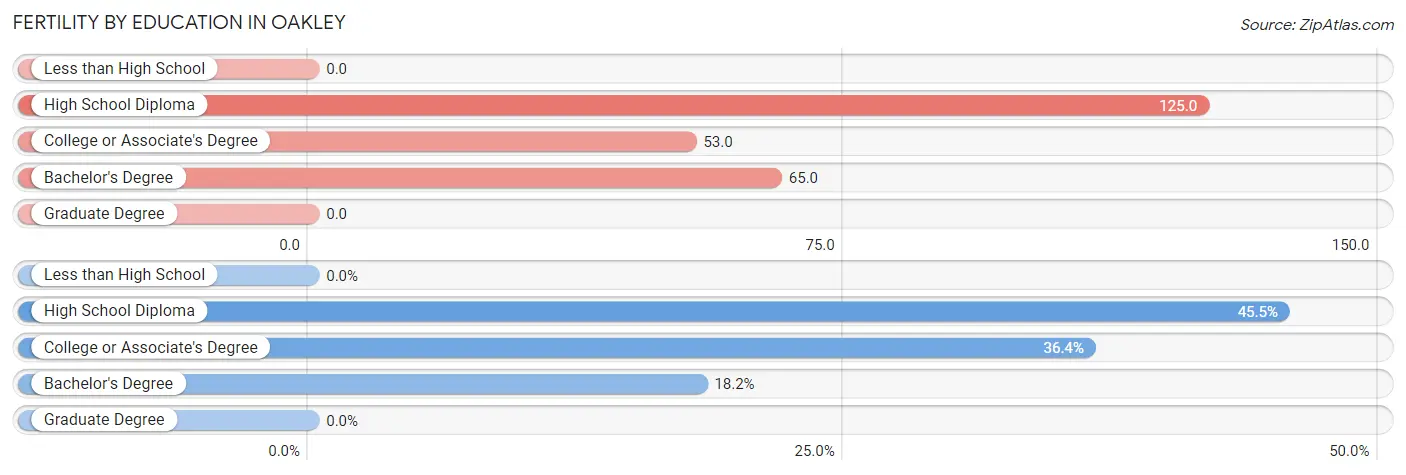
| Educational Attainment | Women with Births | Births / 1,000 Women |
| Less than High School | 0 (0.0%) | 0.0 |
| High School Diploma | 5 (45.5%) | 125.0 |
| College or Associate's Degree | 4 (36.4%) | 53.0 |
| Bachelor's Degree | 2 (18.2%) | 65.0 |
| Graduate Degree | 0 (0.0%) | 0.0 |
| Total | 11 (100.0%) | 71.0 |
Fertility by Education by Marriage Status in Oakley
36.4% of women with births in Oakley are unmarried. Women with the educational attainment of high school diploma are most likely to be married with 100.0% of them married at childbirth, while women with the educational attainment of college or associate's degree are least likely to be married with 100.0% of them unmarried at childbirth.
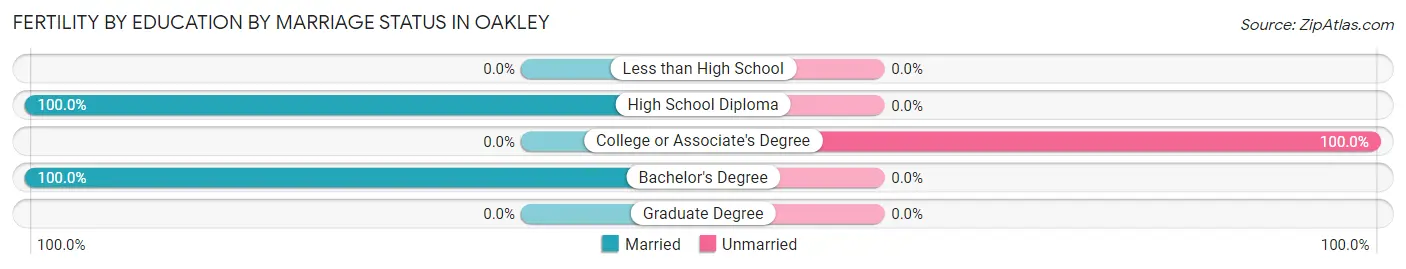
| Educational Attainment | Married | Unmarried |
| Less than High School | 0 (0.0%) | 0 (0.0%) |
| High School Diploma | 5 (100.0%) | 0 (0.0%) |
| College or Associate's Degree | 0 (0.0%) | 4 (100.0%) |
| Bachelor's Degree | 2 (100.0%) | 0 (0.0%) |
| Graduate Degree | 0 (0.0%) | 0 (0.0%) |
| Total | 7 (63.6%) | 4 (36.4%) |
Employment Characteristics in Oakley
Employment by Class of Employer in Oakley
Among the 294 employed individuals in Oakley, private company employees (161 | 54.8%), self-employed (not incorporated) (38 | 12.9%), and local government employees (38 | 12.9%) make up the most common classes of employment.
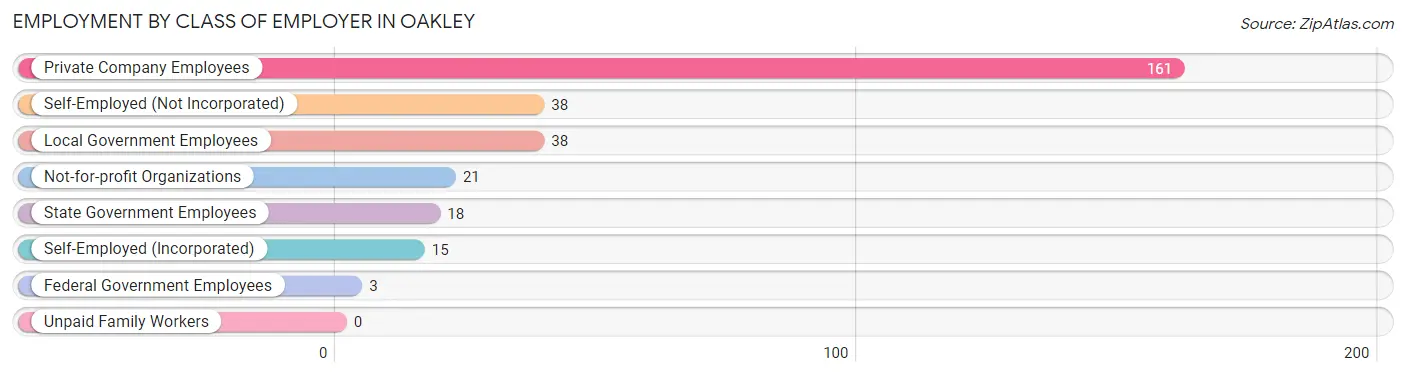
| Employer Class | # Employees | % Employees |
| Private Company Employees | 161 | 54.8% |
| Self-Employed (Incorporated) | 15 | 5.1% |
| Self-Employed (Not Incorporated) | 38 | 12.9% |
| Not-for-profit Organizations | 21 | 7.1% |
| Local Government Employees | 38 | 12.9% |
| State Government Employees | 18 | 6.1% |
| Federal Government Employees | 3 | 1.0% |
| Unpaid Family Workers | 0 | 0.0% |
| Total | 294 | 100.0% |
Employment Status by Age in Oakley
According to the labor force statistics for Oakley, out of the total population over 16 years of age (514), 58.2% or 299 individuals are in the labor force, with 1.7% or 5 of them unemployed. The age group with the highest labor force participation rate is 25 to 29 years, with 100.0% or 7 individuals in the labor force. Within the labor force, the 20 to 24 years age range has the highest percentage of unemployed individuals, with 13.6% or 3 of them being unemployed.
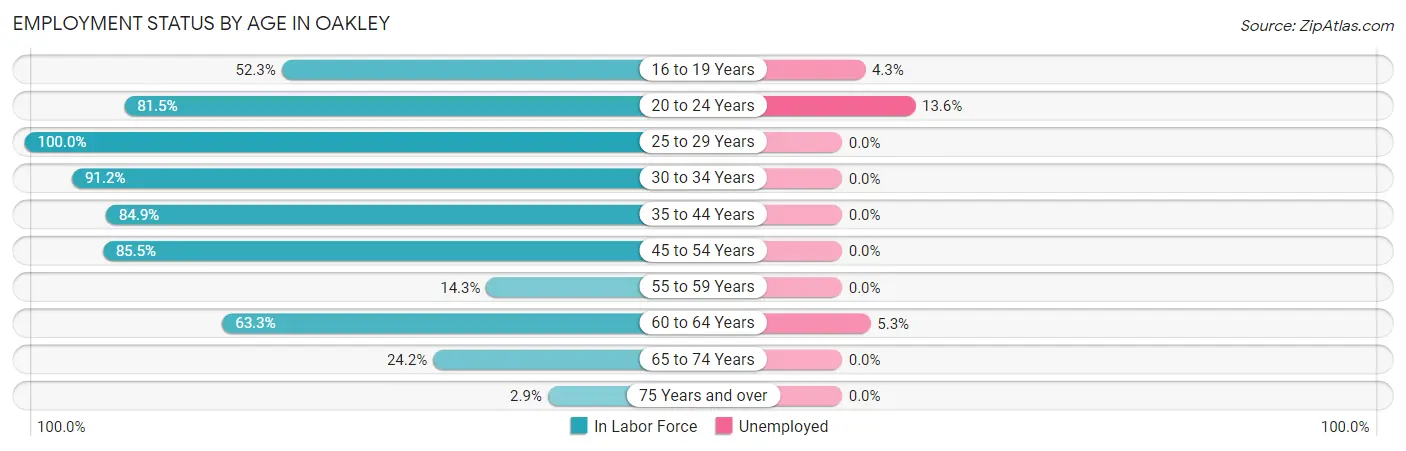
| Age Bracket | In Labor Force | Unemployed |
| 16 to 19 Years | 23 (52.3%) | 1 (4.3%) |
| 20 to 24 Years | 22 (81.5%) | 3 (13.6%) |
| 25 to 29 Years | 7 (100.0%) | 0 (0.0%) |
| 30 to 34 Years | 31 (91.2%) | 0 (0.0%) |
| 35 to 44 Years | 118 (84.9%) | 0 (0.0%) |
| 45 to 54 Years | 53 (85.5%) | 0 (0.0%) |
| 55 to 59 Years | 1 (14.3%) | 0 (0.0%) |
| 60 to 64 Years | 19 (63.3%) | 1 (5.3%) |
| 65 to 74 Years | 23 (24.2%) | 0 (0.0%) |
| 75 Years and over | 2 (2.9%) | 0 (0.0%) |
| Total | 299 (58.2%) | 5 (1.7%) |
Employment Status by Educational Attainment in Oakley
According to labor force statistics for Oakley, 82.1% of individuals (229) out of the total population between 25 and 64 years of age (279) are in the labor force, with 0.4% or 1 of them being unemployed. The group with the highest labor force participation rate are those with the educational attainment of less than high school, with 88.7% or 47 individuals in the labor force. Within the labor force, individuals with college / associate degree education have the highest percentage of unemployment, with 1.1% or 1 of them being unemployed.
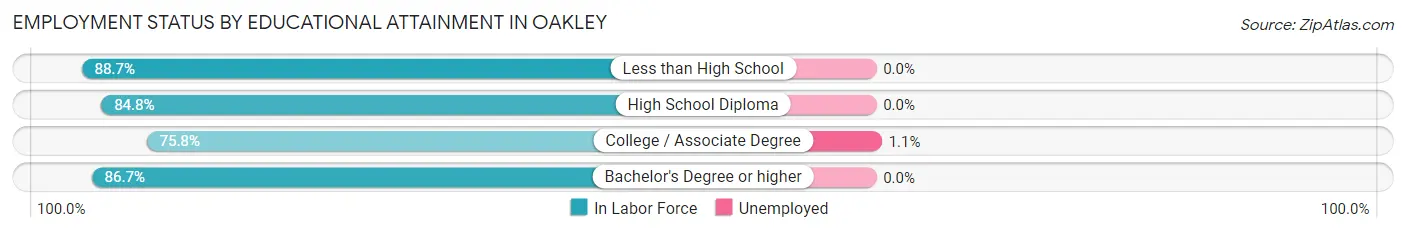
| Educational Attainment | In Labor Force | Unemployed |
| Less than High School | 47 (88.7%) | 0 (0.0%) |
| High School Diploma | 39 (84.8%) | 0 (0.0%) |
| College / Associate Degree | 91 (75.8%) | 1 (1.1%) |
| Bachelor's Degree or higher | 52 (86.7%) | 0 (0.0%) |
| Total | 229 (82.1%) | 1 (0.4%) |
Employment Occupations by Sex in Oakley
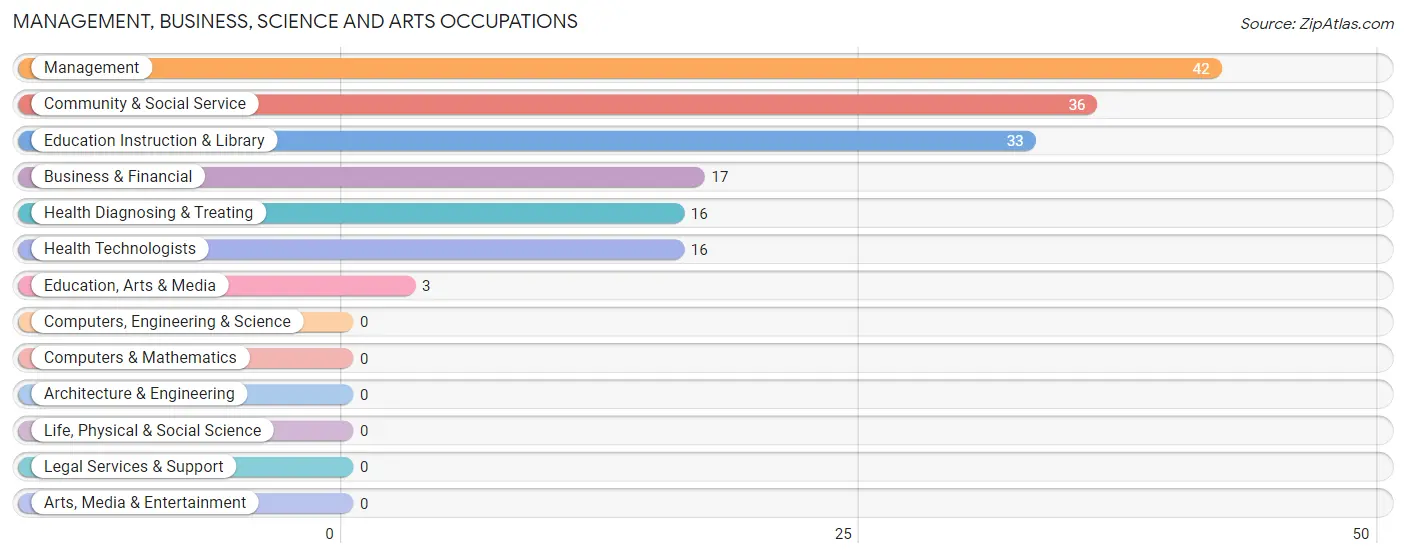
Management, Business, Science and Arts Occupations
The most common Management, Business, Science and Arts occupations in Oakley are Management (42 | 14.3%), Community & Social Service (36 | 12.2%), Education Instruction & Library (33 | 11.2%), Business & Financial (17 | 5.8%), and Health Diagnosing & Treating (16 | 5.4%).
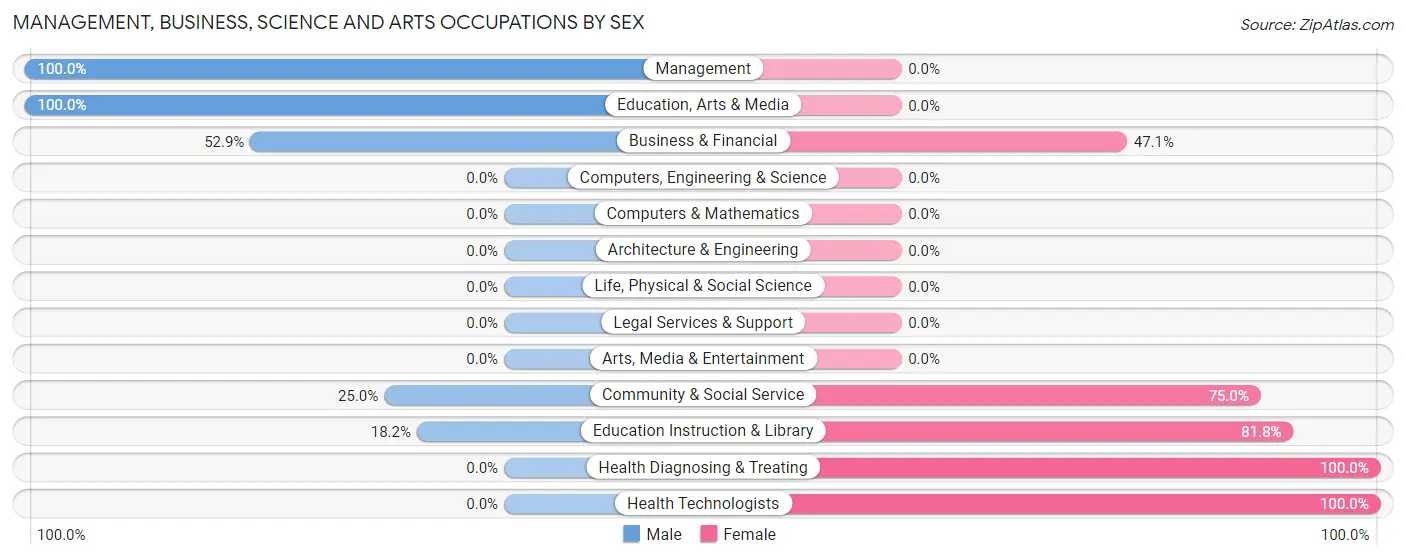
Management, Business, Science and Arts Occupations by Sex
Within the Management, Business, Science and Arts occupations in Oakley, the most male-oriented occupations are Management (100.0%), Education, Arts & Media (100.0%), and Business & Financial (52.9%), while the most female-oriented occupations are Health Diagnosing & Treating (100.0%), Health Technologists (100.0%), and Education Instruction & Library (81.8%).
| Occupation | Male | Female |
| Management | 42 (100.0%) | 0 (0.0%) |
| Business & Financial | 9 (52.9%) | 8 (47.1%) |
| Computers, Engineering & Science | 0 (0.0%) | 0 (0.0%) |
| Computers & Mathematics | 0 (0.0%) | 0 (0.0%) |
| Architecture & Engineering | 0 (0.0%) | 0 (0.0%) |
| Life, Physical & Social Science | 0 (0.0%) | 0 (0.0%) |
| Community & Social Service | 9 (25.0%) | 27 (75.0%) |
| Education, Arts & Media | 3 (100.0%) | 0 (0.0%) |
| Legal Services & Support | 0 (0.0%) | 0 (0.0%) |
| Education Instruction & Library | 6 (18.2%) | 27 (81.8%) |
| Arts, Media & Entertainment | 0 (0.0%) | 0 (0.0%) |
| Health Diagnosing & Treating | 0 (0.0%) | 16 (100.0%) |
| Health Technologists | 0 (0.0%) | 16 (100.0%) |
| Total (Category) | 60 (54.0%) | 51 (46.0%) |
| Total (Overall) | 163 (55.4%) | 131 (44.6%) |
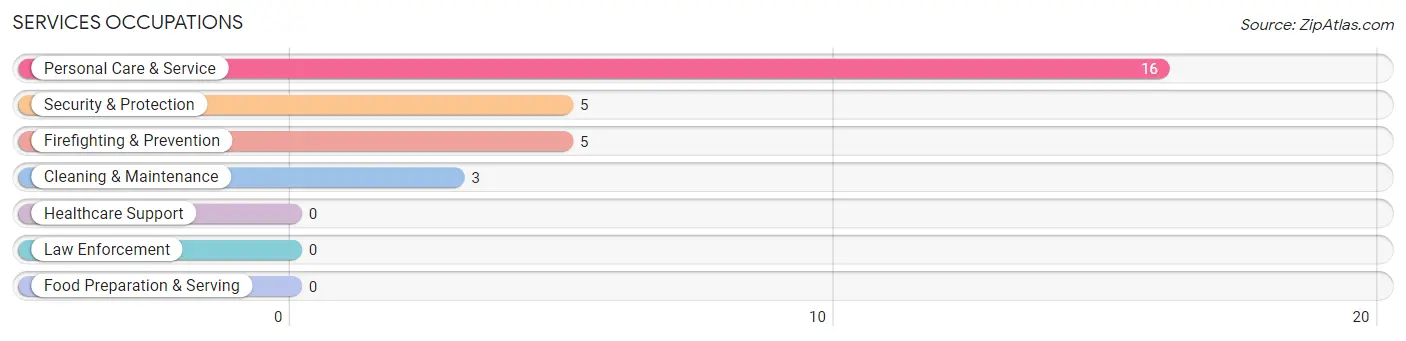
Services Occupations
The most common Services occupations in Oakley are Personal Care & Service (16 | 5.4%), Security & Protection (5 | 1.7%), Firefighting & Prevention (5 | 1.7%), and Cleaning & Maintenance (3 | 1.0%).
Services Occupations by Sex
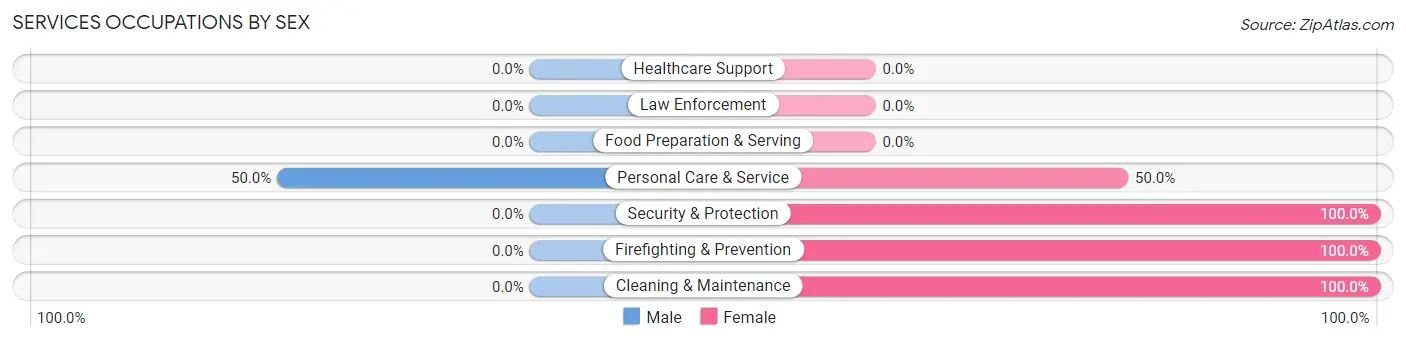
| Occupation | Male | Female |
| Healthcare Support | 0 (0.0%) | 0 (0.0%) |
| Security & Protection | 0 (0.0%) | 5 (100.0%) |
| Firefighting & Prevention | 0 (0.0%) | 5 (100.0%) |
| Law Enforcement | 0 (0.0%) | 0 (0.0%) |
| Food Preparation & Serving | 0 (0.0%) | 0 (0.0%) |
| Cleaning & Maintenance | 0 (0.0%) | 3 (100.0%) |
| Personal Care & Service | 8 (50.0%) | 8 (50.0%) |
| Total (Category) | 8 (33.3%) | 16 (66.7%) |
| Total (Overall) | 163 (55.4%) | 131 (44.6%) |
Sales and Office Occupations
The most common Sales and Office occupations in Oakley are Office & Administration (42 | 14.3%), and Sales & Related (9 | 3.1%).
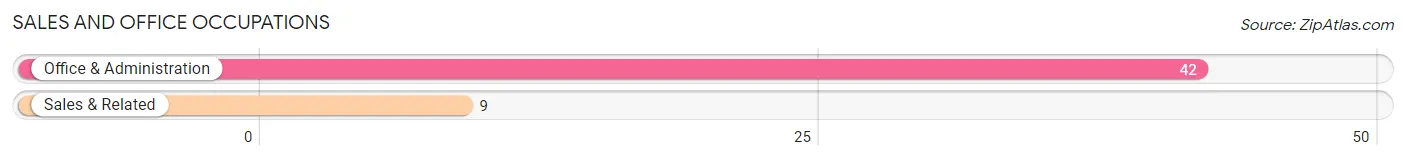
Sales and Office Occupations by Sex
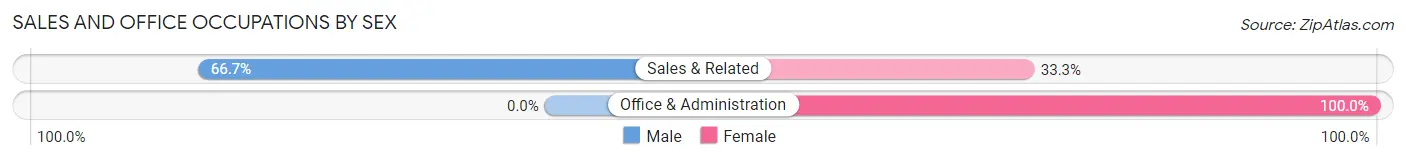
| Occupation | Male | Female |
| Sales & Related | 6 (66.7%) | 3 (33.3%) |
| Office & Administration | 0 (0.0%) | 42 (100.0%) |
| Total (Category) | 6 (11.8%) | 45 (88.2%) |
| Total (Overall) | 163 (55.4%) | 131 (44.6%) |
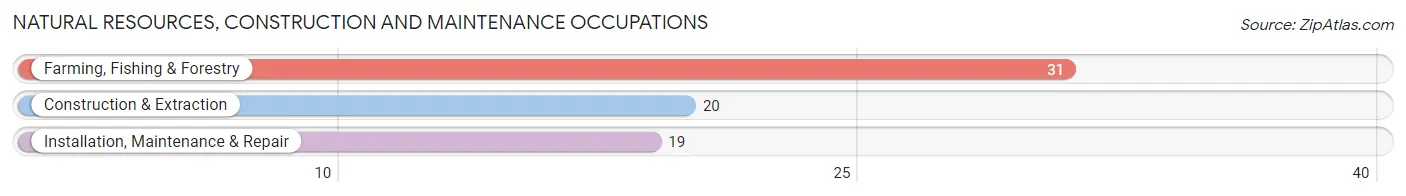
Natural Resources, Construction and Maintenance Occupations
The most common Natural Resources, Construction and Maintenance occupations in Oakley are Farming, Fishing & Forestry (31 | 10.5%), Construction & Extraction (20 | 6.8%), and Installation, Maintenance & Repair (19 | 6.5%).
Natural Resources, Construction and Maintenance Occupations by Sex
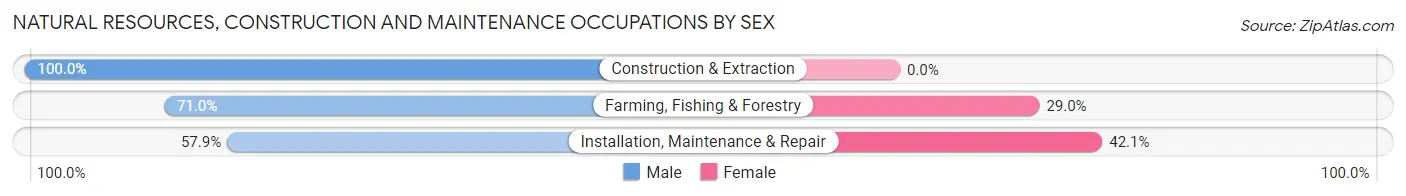
| Occupation | Male | Female |
| Farming, Fishing & Forestry | 22 (71.0%) | 9 (29.0%) |
| Construction & Extraction | 20 (100.0%) | 0 (0.0%) |
| Installation, Maintenance & Repair | 11 (57.9%) | 8 (42.1%) |
| Total (Category) | 53 (75.7%) | 17 (24.3%) |
| Total (Overall) | 163 (55.4%) | 131 (44.6%) |
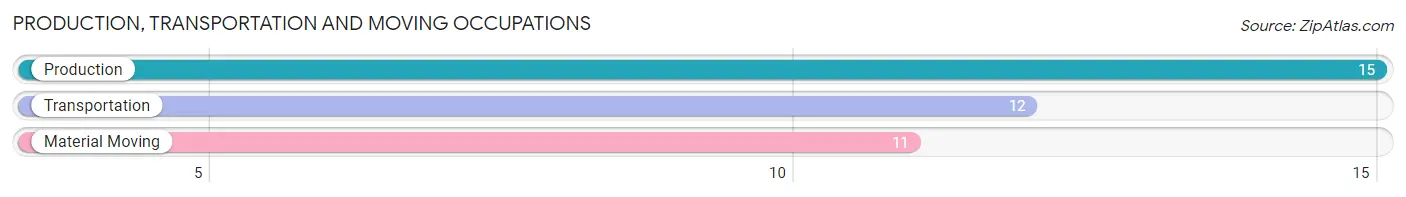
Production, Transportation and Moving Occupations
The most common Production, Transportation and Moving occupations in Oakley are Production (15 | 5.1%), Transportation (12 | 4.1%), and Material Moving (11 | 3.7%).
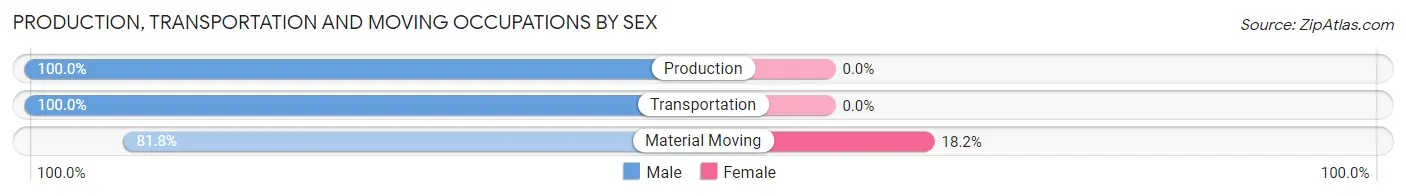
Production, Transportation and Moving Occupations by Sex
| Occupation | Male | Female |
| Production | 15 (100.0%) | 0 (0.0%) |
| Transportation | 12 (100.0%) | 0 (0.0%) |
| Material Moving | 9 (81.8%) | 2 (18.2%) |
| Total (Category) | 36 (94.7%) | 2 (5.3%) |
| Total (Overall) | 163 (55.4%) | 131 (44.6%) |
Employment Industries by Sex in Oakley
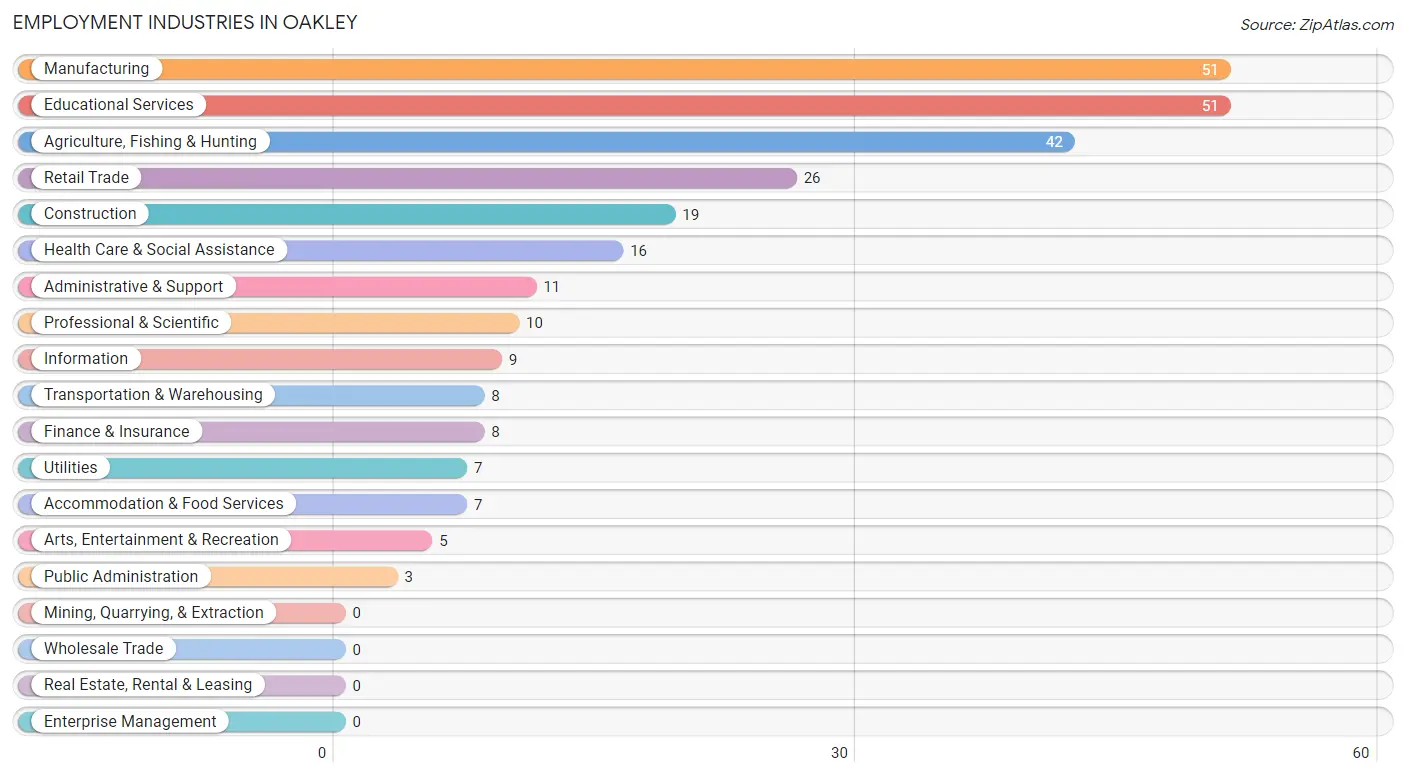
Employment Industries in Oakley
The major employment industries in Oakley include Manufacturing (51 | 17.3%), Educational Services (51 | 17.3%), Agriculture, Fishing & Hunting (42 | 14.3%), Retail Trade (26 | 8.8%), and Construction (19 | 6.5%).
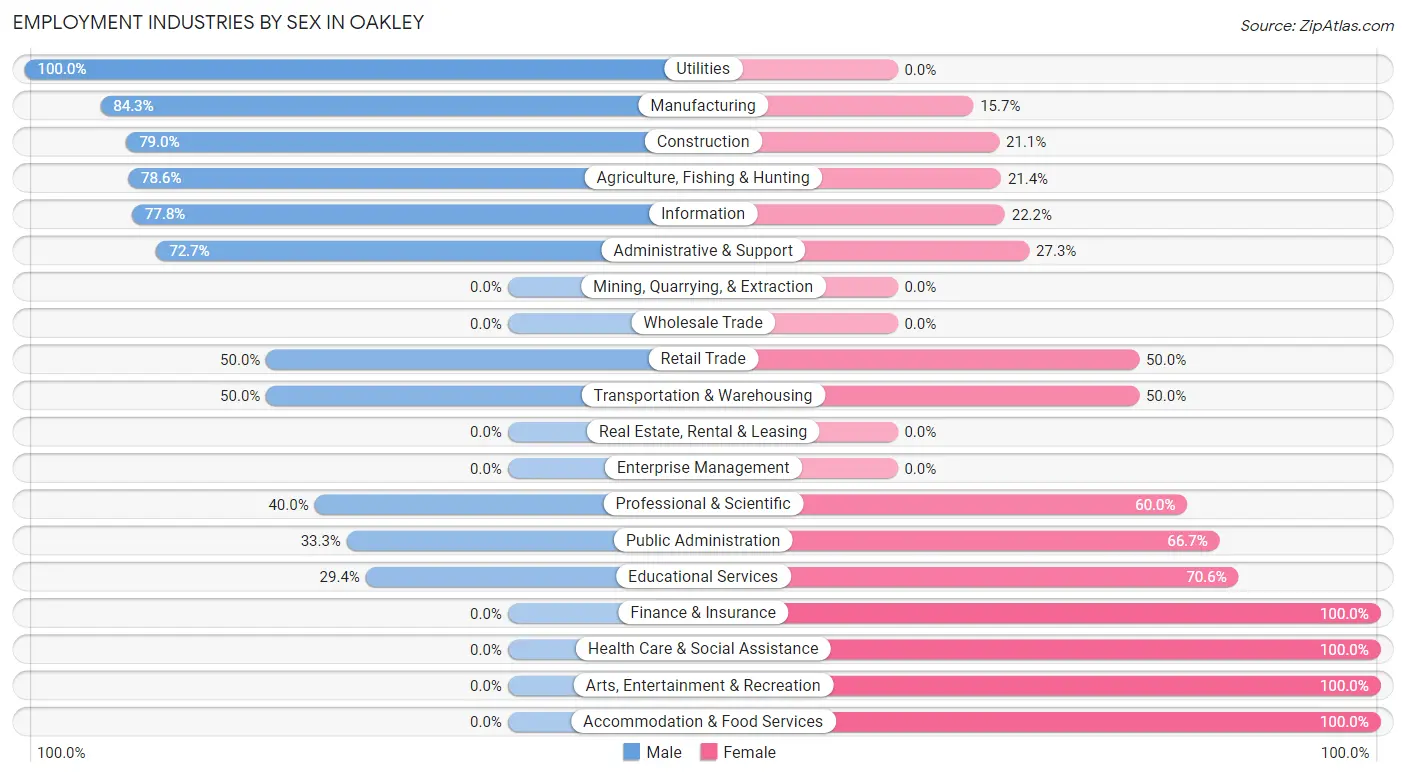
Employment Industries by Sex in Oakley
The Oakley industries that see more men than women are Utilities (100.0%), Manufacturing (84.3%), and Construction (78.9%), whereas the industries that tend to have a higher number of women are Finance & Insurance (100.0%), Health Care & Social Assistance (100.0%), and Arts, Entertainment & Recreation (100.0%).
| Industry | Male | Female |
| Agriculture, Fishing & Hunting | 33 (78.6%) | 9 (21.4%) |
| Mining, Quarrying, & Extraction | 0 (0.0%) | 0 (0.0%) |
| Construction | 15 (78.9%) | 4 (21.0%) |
| Manufacturing | 43 (84.3%) | 8 (15.7%) |
| Wholesale Trade | 0 (0.0%) | 0 (0.0%) |
| Retail Trade | 13 (50.0%) | 13 (50.0%) |
| Transportation & Warehousing | 4 (50.0%) | 4 (50.0%) |
| Utilities | 7 (100.0%) | 0 (0.0%) |
| Information | 7 (77.8%) | 2 (22.2%) |
| Finance & Insurance | 0 (0.0%) | 8 (100.0%) |
| Real Estate, Rental & Leasing | 0 (0.0%) | 0 (0.0%) |
| Professional & Scientific | 4 (40.0%) | 6 (60.0%) |
| Enterprise Management | 0 (0.0%) | 0 (0.0%) |
| Administrative & Support | 8 (72.7%) | 3 (27.3%) |
| Educational Services | 15 (29.4%) | 36 (70.6%) |
| Health Care & Social Assistance | 0 (0.0%) | 16 (100.0%) |
| Arts, Entertainment & Recreation | 0 (0.0%) | 5 (100.0%) |
| Accommodation & Food Services | 0 (0.0%) | 7 (100.0%) |
| Public Administration | 1 (33.3%) | 2 (66.7%) |
| Total | 163 (55.4%) | 131 (44.6%) |
Education in Oakley
School Enrollment in Oakley
The most common levels of schooling among the 274 students in Oakley are elementary school (90 | 32.9%), middle school (69 | 25.2%), and high school (50 | 18.2%).
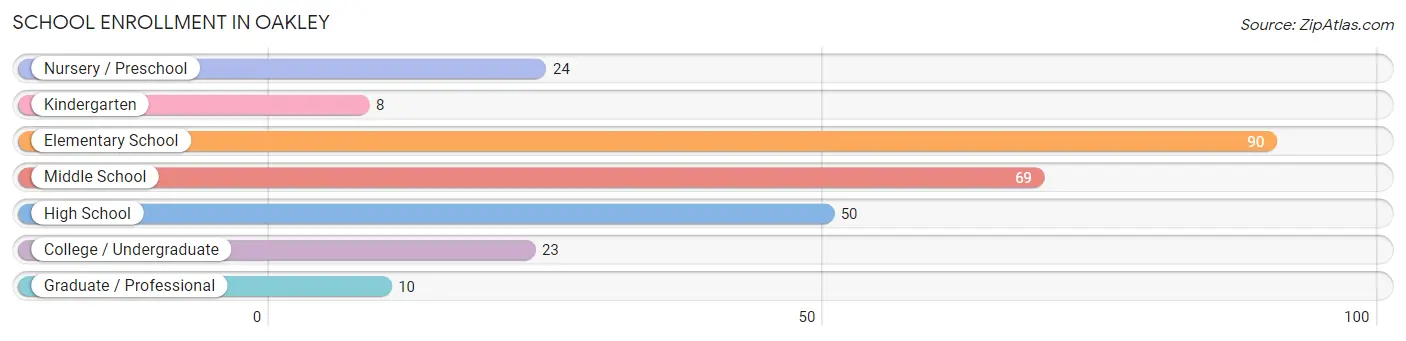
| School Level | # Students | % Students |
| Nursery / Preschool | 24 | 8.8% |
| Kindergarten | 8 | 2.9% |
| Elementary School | 90 | 32.9% |
| Middle School | 69 | 25.2% |
| High School | 50 | 18.2% |
| College / Undergraduate | 23 | 8.4% |
| Graduate / Professional | 10 | 3.6% |
| Total | 274 | 100.0% |
School Enrollment by Age by Funding Source in Oakley
Out of a total of 274 students who are enrolled in schools in Oakley, 12 (4.4%) attend a private institution, while the remaining 262 (95.6%) are enrolled in public schools. The age group of 35 years and over has the highest likelihood of being enrolled in private schools, with 4 (23.5% in the age bracket) enrolled. Conversely, the age group of 3 to 4 year olds has the lowest likelihood of being enrolled in a private school, with 5 (100.0% in the age bracket) attending a public institution.
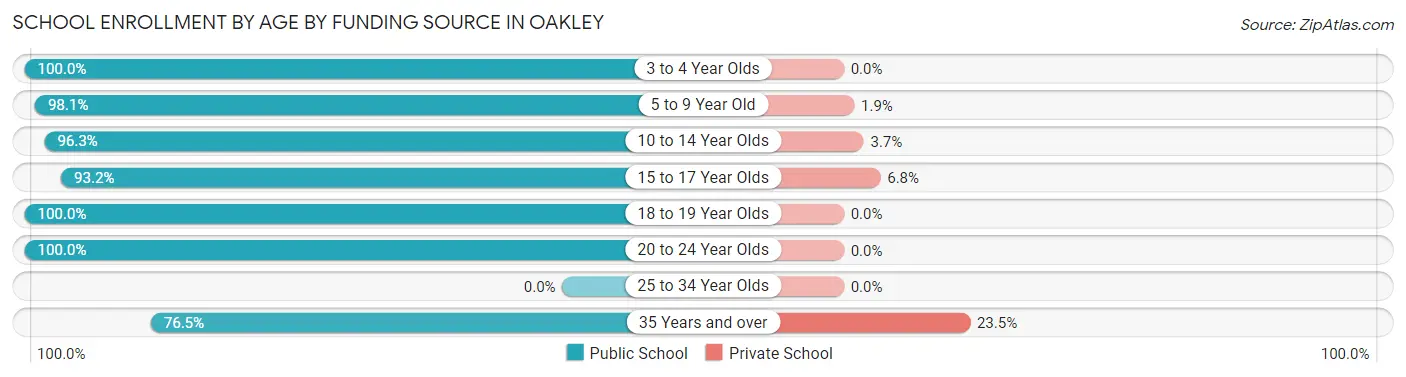
| Age Bracket | Public School | Private School |
| 3 to 4 Year Olds | 5 (100.0%) | 0 (0.0%) |
| 5 to 9 Year Old | 101 (98.1%) | 2 (1.9%) |
| 10 to 14 Year Olds | 78 (96.3%) | 3 (3.7%) |
| 15 to 17 Year Olds | 41 (93.2%) | 3 (6.8%) |
| 18 to 19 Year Olds | 12 (100.0%) | 0 (0.0%) |
| 20 to 24 Year Olds | 12 (100.0%) | 0 (0.0%) |
| 25 to 34 Year Olds | 0 (0.0%) | 0 (0.0%) |
| 35 Years and over | 13 (76.5%) | 4 (23.5%) |
| Total | 262 (95.6%) | 12 (4.4%) |
Educational Attainment by Field of Study in Oakley
Education (34 | 39.5%), bio, nature & agricultural (11 | 12.8%), engineering (10 | 11.6%), business (10 | 11.6%), and science & technology (9 | 10.5%) are the most common fields of study among 86 individuals in Oakley who have obtained a bachelor's degree or higher.
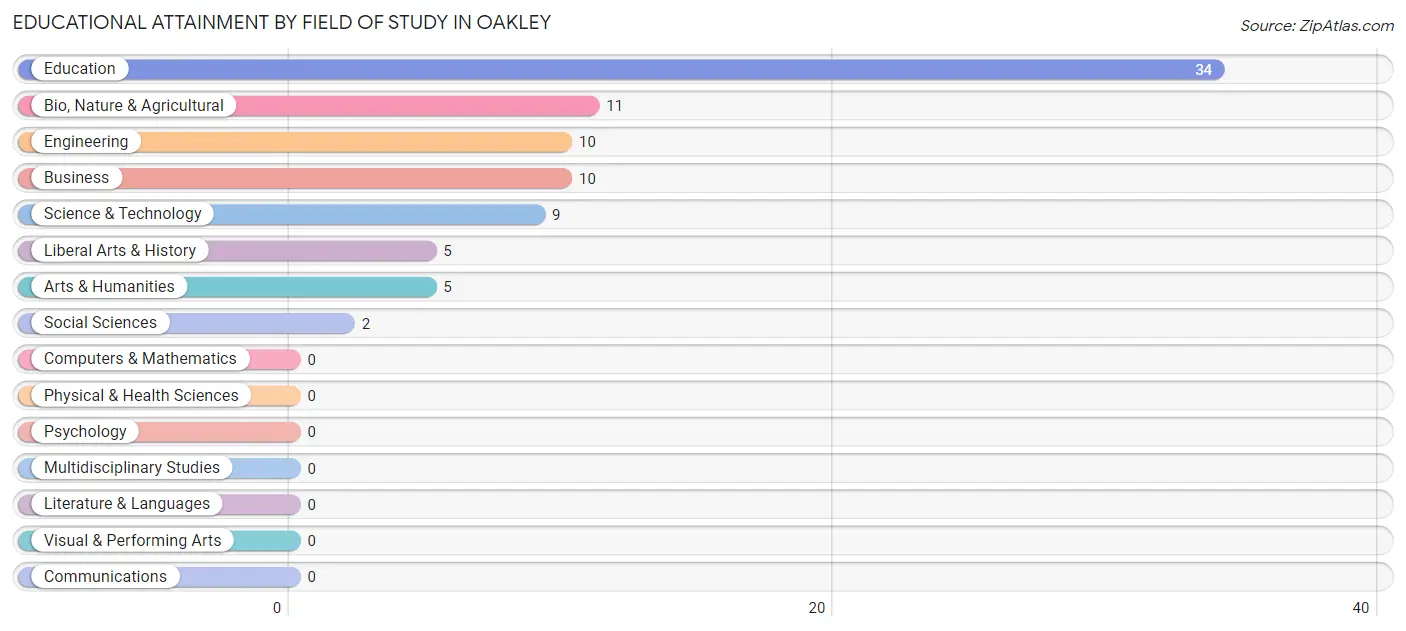
| Field of Study | # Graduates | % Graduates |
| Computers & Mathematics | 0 | 0.0% |
| Bio, Nature & Agricultural | 11 | 12.8% |
| Physical & Health Sciences | 0 | 0.0% |
| Psychology | 0 | 0.0% |
| Social Sciences | 2 | 2.3% |
| Engineering | 10 | 11.6% |
| Multidisciplinary Studies | 0 | 0.0% |
| Science & Technology | 9 | 10.5% |
| Business | 10 | 11.6% |
| Education | 34 | 39.5% |
| Literature & Languages | 0 | 0.0% |
| Liberal Arts & History | 5 | 5.8% |
| Visual & Performing Arts | 0 | 0.0% |
| Communications | 0 | 0.0% |
| Arts & Humanities | 5 | 5.8% |
| Total | 86 | 100.0% |
Transportation & Commute in Oakley
Vehicle Availability by Sex in Oakley
The most prevalent vehicle ownership categories in Oakley are males with 5 or more vehicles (56, accounting for 34.4%) and females with 5 or more vehicles (32, making up 42.7%).
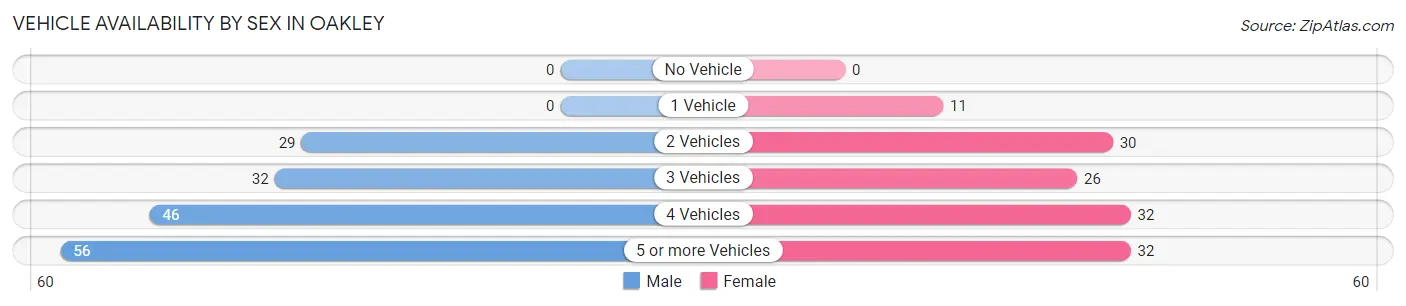
| Vehicles Available | Male | Female |
| No Vehicle | 0 (0.0%) | 0 (0.0%) |
| 1 Vehicle | 0 (0.0%) | 11 (8.4%) |
| 2 Vehicles | 29 (17.8%) | 30 (22.9%) |
| 3 Vehicles | 32 (19.6%) | 26 (19.9%) |
| 4 Vehicles | 46 (28.2%) | 32 (24.4%) |
| 5 or more Vehicles | 56 (34.4%) | 32 (24.4%) |
| Total | 163 (100.0%) | 131 (100.0%) |
Commute Time in Oakley
The most frequently occuring commute durations in Oakley are 30 to 34 minutes (61 commuters, 22.7%), 25 to 29 minutes (52 commuters, 19.3%), and 5 to 9 minutes (43 commuters, 16.0%).
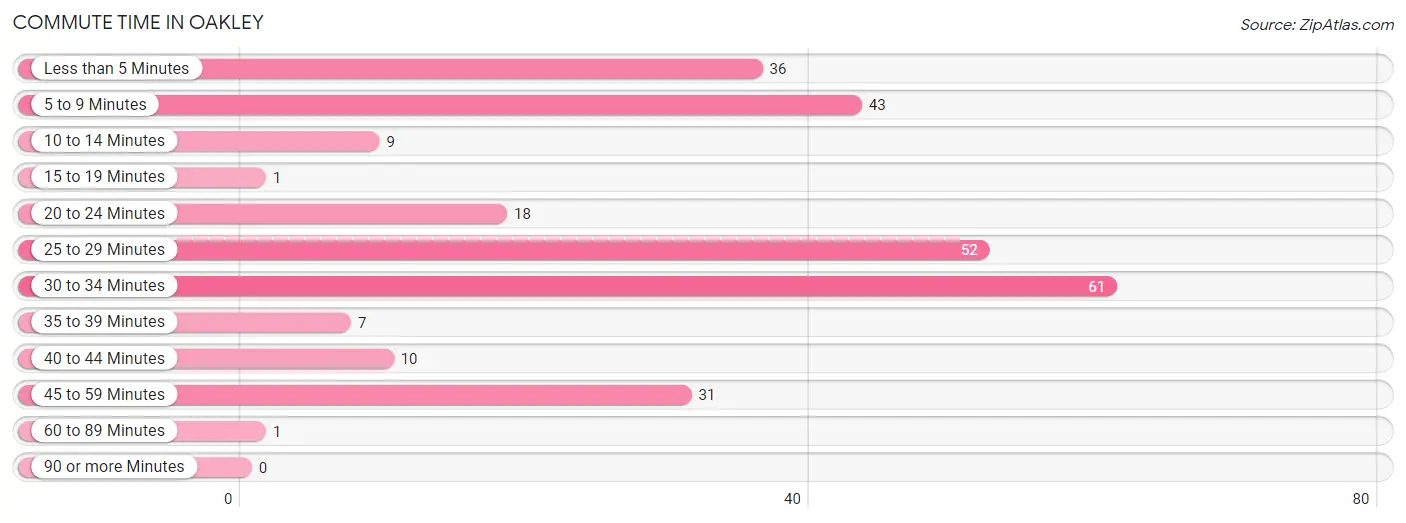
| Commute Time | # Commuters | % Commuters |
| Less than 5 Minutes | 36 | 13.4% |
| 5 to 9 Minutes | 43 | 16.0% |
| 10 to 14 Minutes | 9 | 3.4% |
| 15 to 19 Minutes | 1 | 0.4% |
| 20 to 24 Minutes | 18 | 6.7% |
| 25 to 29 Minutes | 52 | 19.3% |
| 30 to 34 Minutes | 61 | 22.7% |
| 35 to 39 Minutes | 7 | 2.6% |
| 40 to 44 Minutes | 10 | 3.7% |
| 45 to 59 Minutes | 31 | 11.5% |
| 60 to 89 Minutes | 1 | 0.4% |
| 90 or more Minutes | 0 | 0.0% |
Commute Time by Sex in Oakley
The most common commute times in Oakley are 25 to 29 minutes (36 commuters, 23.8%) for males and 5 to 9 minutes (26 commuters, 22.0%) for females.
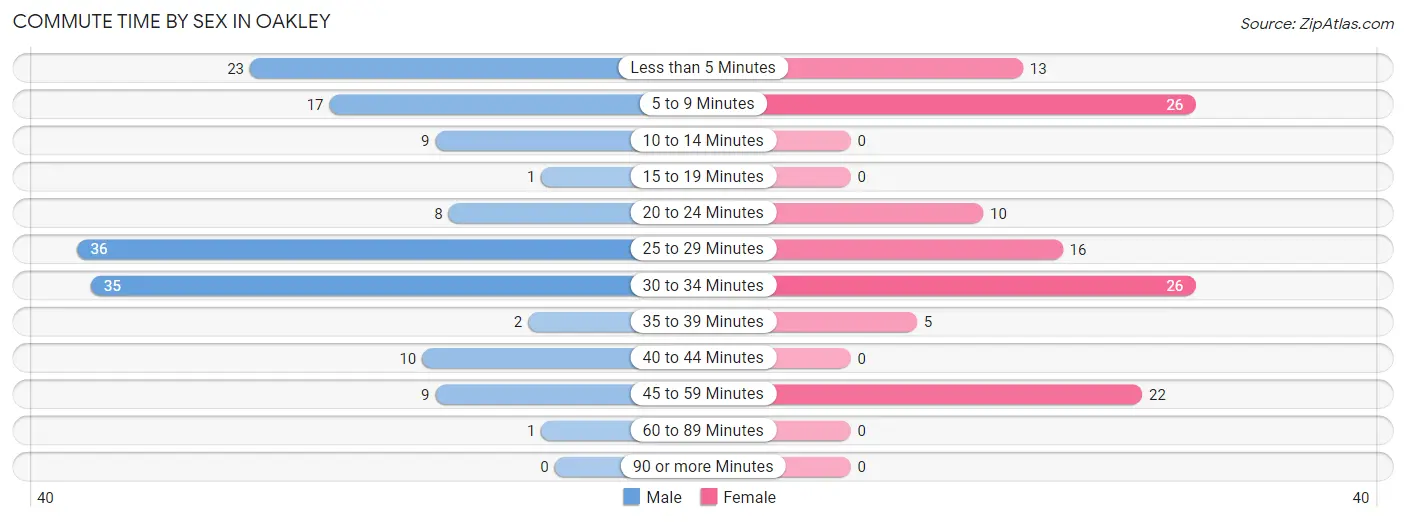
| Commute Time | Male | Female |
| Less than 5 Minutes | 23 (15.2%) | 13 (11.0%) |
| 5 to 9 Minutes | 17 (11.3%) | 26 (22.0%) |
| 10 to 14 Minutes | 9 (6.0%) | 0 (0.0%) |
| 15 to 19 Minutes | 1 (0.7%) | 0 (0.0%) |
| 20 to 24 Minutes | 8 (5.3%) | 10 (8.5%) |
| 25 to 29 Minutes | 36 (23.8%) | 16 (13.6%) |
| 30 to 34 Minutes | 35 (23.2%) | 26 (22.0%) |
| 35 to 39 Minutes | 2 (1.3%) | 5 (4.2%) |
| 40 to 44 Minutes | 10 (6.6%) | 0 (0.0%) |
| 45 to 59 Minutes | 9 (6.0%) | 22 (18.6%) |
| 60 to 89 Minutes | 1 (0.7%) | 0 (0.0%) |
| 90 or more Minutes | 0 (0.0%) | 0 (0.0%) |
Time of Departure to Work by Sex in Oakley
The most frequent times of departure to work in Oakley are 12:00 AM to 4:59 AM (32, 21.2%) for males and 4:00 PM to 11:59 PM (33, 28.0%) for females.
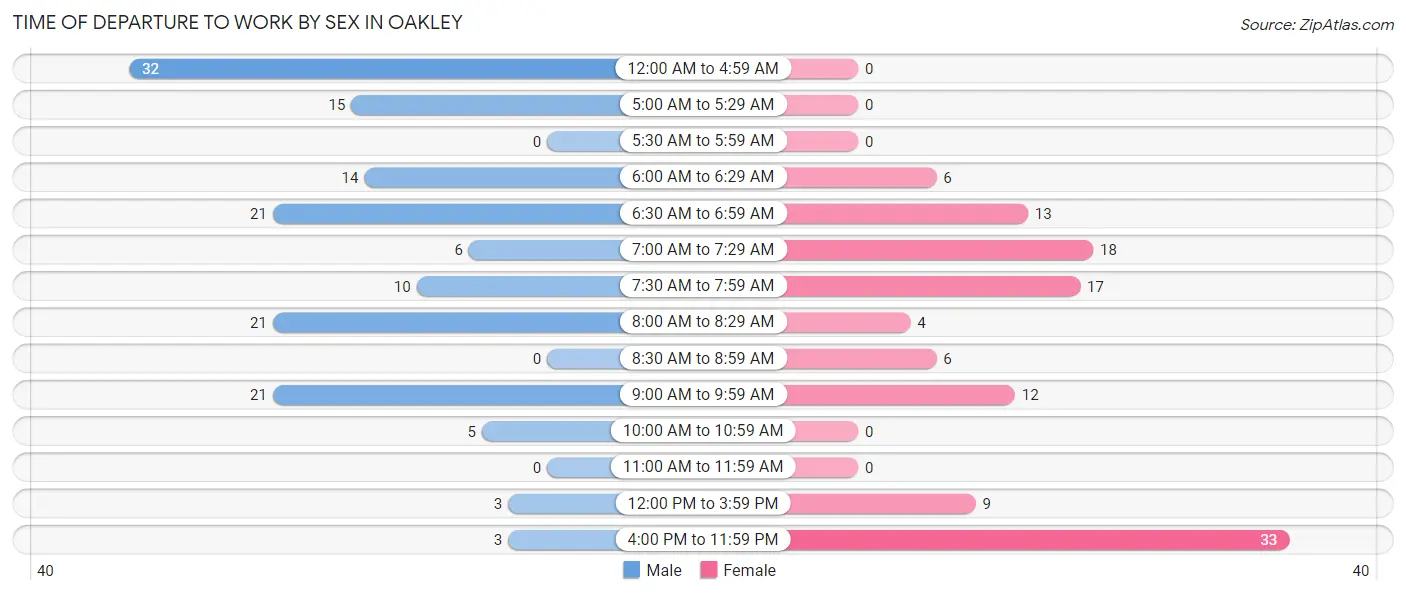
| Time of Departure | Male | Female |
| 12:00 AM to 4:59 AM | 32 (21.2%) | 0 (0.0%) |
| 5:00 AM to 5:29 AM | 15 (9.9%) | 0 (0.0%) |
| 5:30 AM to 5:59 AM | 0 (0.0%) | 0 (0.0%) |
| 6:00 AM to 6:29 AM | 14 (9.3%) | 6 (5.1%) |
| 6:30 AM to 6:59 AM | 21 (13.9%) | 13 (11.0%) |
| 7:00 AM to 7:29 AM | 6 (4.0%) | 18 (15.2%) |
| 7:30 AM to 7:59 AM | 10 (6.6%) | 17 (14.4%) |
| 8:00 AM to 8:29 AM | 21 (13.9%) | 4 (3.4%) |
| 8:30 AM to 8:59 AM | 0 (0.0%) | 6 (5.1%) |
| 9:00 AM to 9:59 AM | 21 (13.9%) | 12 (10.2%) |
| 10:00 AM to 10:59 AM | 5 (3.3%) | 0 (0.0%) |
| 11:00 AM to 11:59 AM | 0 (0.0%) | 0 (0.0%) |
| 12:00 PM to 3:59 PM | 3 (2.0%) | 9 (7.6%) |
| 4:00 PM to 11:59 PM | 3 (2.0%) | 33 (28.0%) |
| Total | 151 (100.0%) | 118 (100.0%) |
Housing Occupancy in Oakley
Occupancy by Ownership in Oakley
Of the total 222 dwellings in Oakley, owner-occupied units account for 205 (92.3%), while renter-occupied units make up 17 (7.7%).
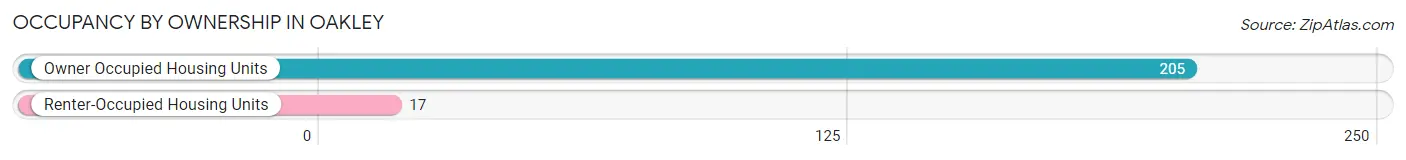
| Occupancy | # Housing Units | % Housing Units |
| Owner Occupied Housing Units | 205 | 92.3% |
| Renter-Occupied Housing Units | 17 | 7.7% |
| Total Occupied Housing Units | 222 | 100.0% |
Occupancy by Household Size in Oakley
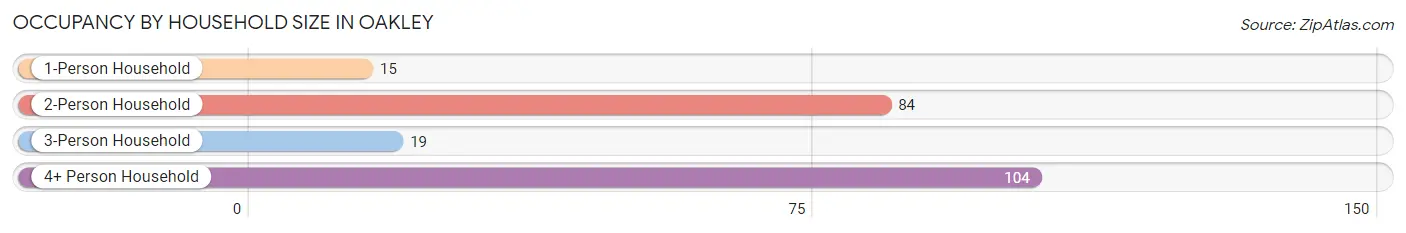
| Household Size | # Housing Units | % Housing Units |
| 1-Person Household | 15 | 6.8% |
| 2-Person Household | 84 | 37.8% |
| 3-Person Household | 19 | 8.6% |
| 4+ Person Household | 104 | 46.9% |
| Total Housing Units | 222 | 100.0% |
Occupancy by Ownership by Household Size in Oakley
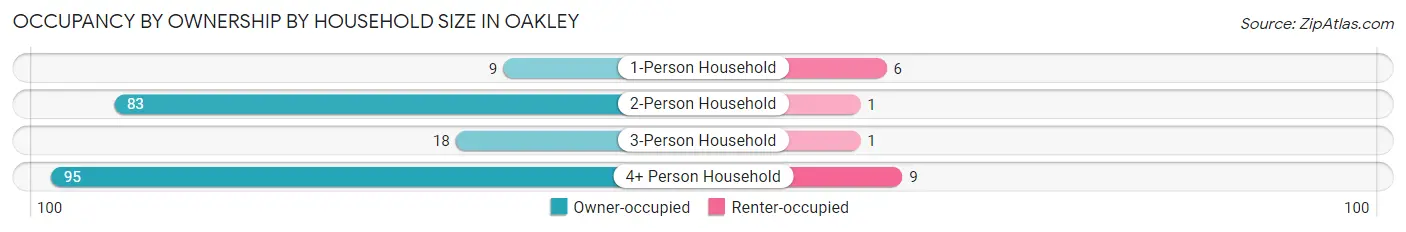
| Household Size | Owner-occupied | Renter-occupied |
| 1-Person Household | 9 (60.0%) | 6 (40.0%) |
| 2-Person Household | 83 (98.8%) | 1 (1.2%) |
| 3-Person Household | 18 (94.7%) | 1 (5.3%) |
| 4+ Person Household | 95 (91.3%) | 9 (8.6%) |
| Total Housing Units | 205 (92.3%) | 17 (7.7%) |
Occupancy by Educational Attainment in Oakley
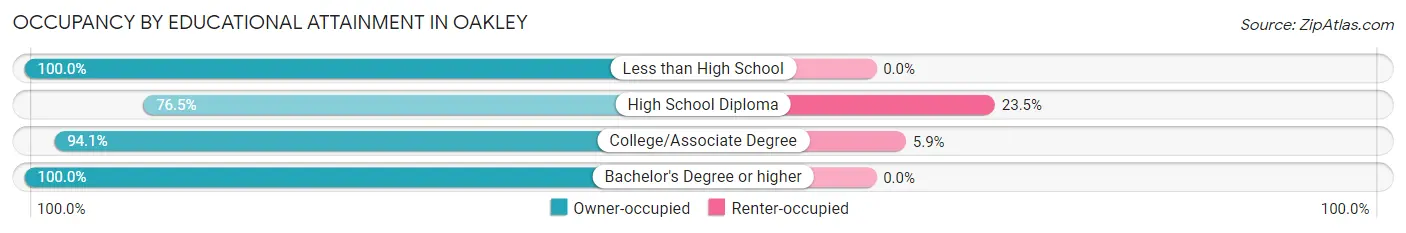
| Household Size | Owner-occupied | Renter-occupied |
| Less than High School | 43 (100.0%) | 0 (0.0%) |
| High School Diploma | 39 (76.5%) | 12 (23.5%) |
| College/Associate Degree | 80 (94.1%) | 5 (5.9%) |
| Bachelor's Degree or higher | 43 (100.0%) | 0 (0.0%) |
Occupancy by Age of Householder in Oakley
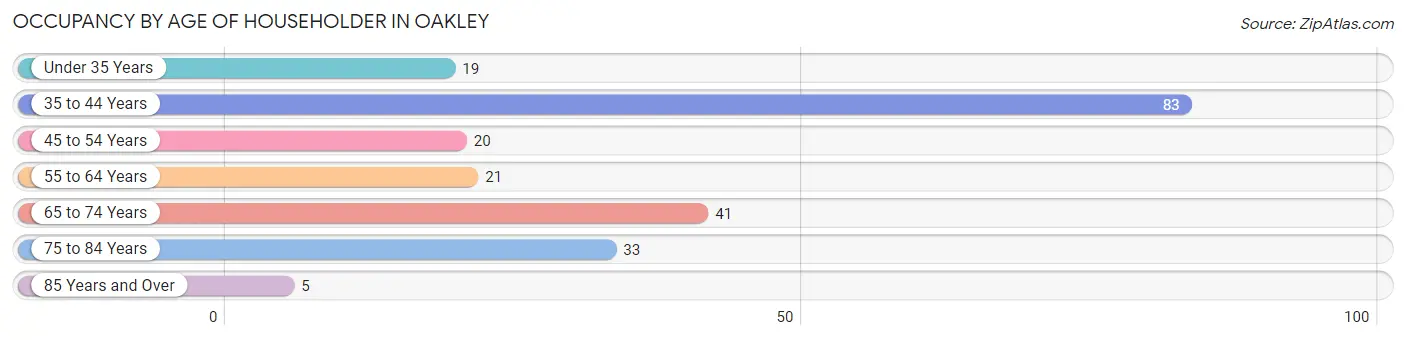
| Age Bracket | # Households | % Households |
| Under 35 Years | 19 | 8.6% |
| 35 to 44 Years | 83 | 37.4% |
| 45 to 54 Years | 20 | 9.0% |
| 55 to 64 Years | 21 | 9.5% |
| 65 to 74 Years | 41 | 18.5% |
| 75 to 84 Years | 33 | 14.9% |
| 85 Years and Over | 5 | 2.2% |
| Total | 222 | 100.0% |
Housing Finances in Oakley
Median Income by Occupancy in Oakley
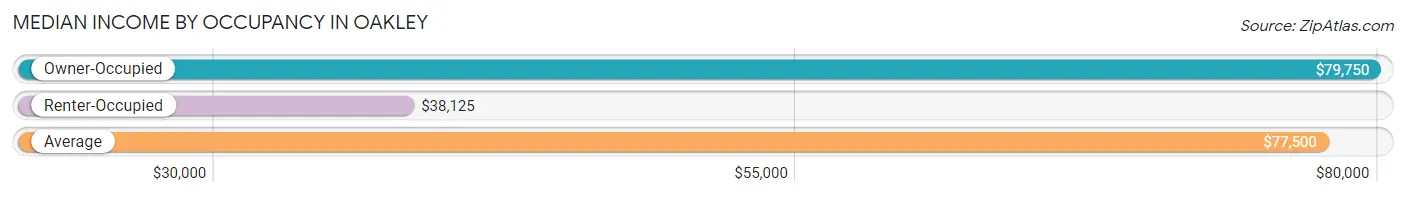
| Occupancy Type | # Households | Median Income |
| Owner-Occupied | 205 (92.3%) | $79,750 |
| Renter-Occupied | 17 (7.7%) | $38,125 |
| Average | 222 (100.0%) | $77,500 |
Occupancy by Householder Income Bracket in Oakley
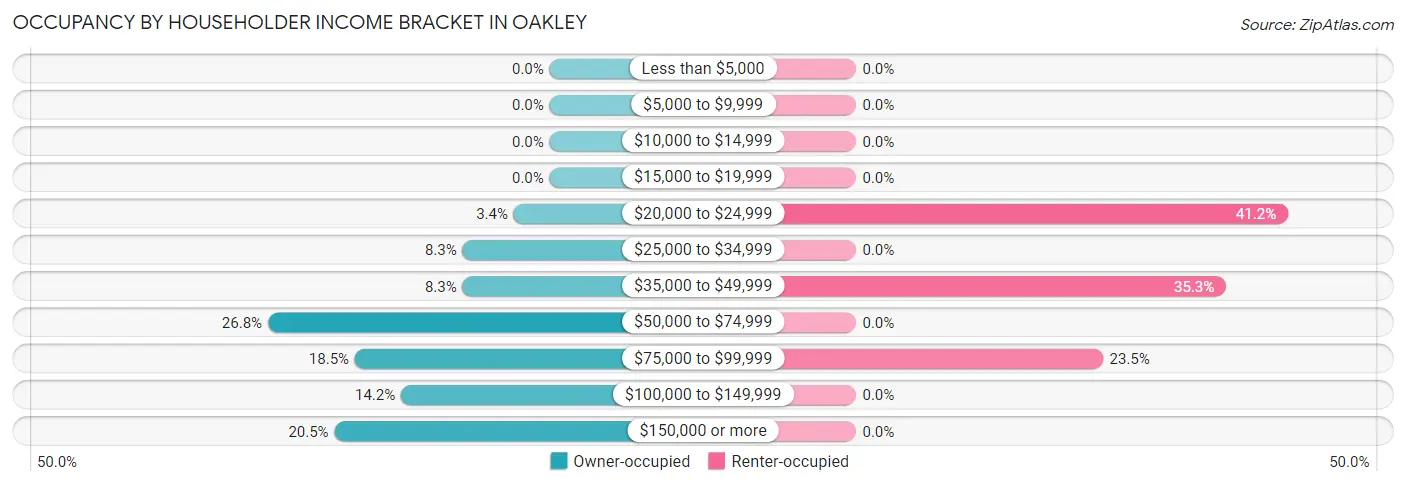
| Income Bracket | Owner-occupied | Renter-occupied |
| Less than $5,000 | 0 (0.0%) | 0 (0.0%) |
| $5,000 to $9,999 | 0 (0.0%) | 0 (0.0%) |
| $10,000 to $14,999 | 0 (0.0%) | 0 (0.0%) |
| $15,000 to $19,999 | 0 (0.0%) | 0 (0.0%) |
| $20,000 to $24,999 | 7 (3.4%) | 7 (41.2%) |
| $25,000 to $34,999 | 17 (8.3%) | 0 (0.0%) |
| $35,000 to $49,999 | 17 (8.3%) | 6 (35.3%) |
| $50,000 to $74,999 | 55 (26.8%) | 0 (0.0%) |
| $75,000 to $99,999 | 38 (18.5%) | 4 (23.5%) |
| $100,000 to $149,999 | 29 (14.1%) | 0 (0.0%) |
| $150,000 or more | 42 (20.5%) | 0 (0.0%) |
| Total | 205 (100.0%) | 17 (100.0%) |
Monthly Housing Cost Tiers in Oakley
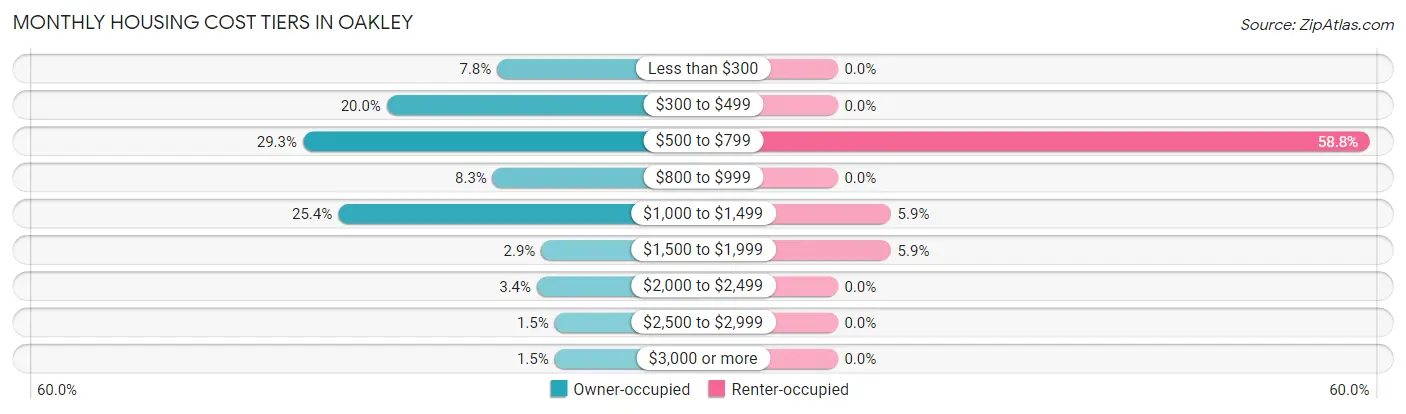
| Monthly Cost | Owner-occupied | Renter-occupied |
| Less than $300 | 16 (7.8%) | 0 (0.0%) |
| $300 to $499 | 41 (20.0%) | 0 (0.0%) |
| $500 to $799 | 60 (29.3%) | 10 (58.8%) |
| $800 to $999 | 17 (8.3%) | 0 (0.0%) |
| $1,000 to $1,499 | 52 (25.4%) | 1 (5.9%) |
| $1,500 to $1,999 | 6 (2.9%) | 1 (5.9%) |
| $2,000 to $2,499 | 7 (3.4%) | 0 (0.0%) |
| $2,500 to $2,999 | 3 (1.5%) | 0 (0.0%) |
| $3,000 or more | 3 (1.5%) | 0 (0.0%) |
| Total | 205 (100.0%) | 17 (100.0%) |
Physical Housing Characteristics in Oakley
Housing Structures in Oakley
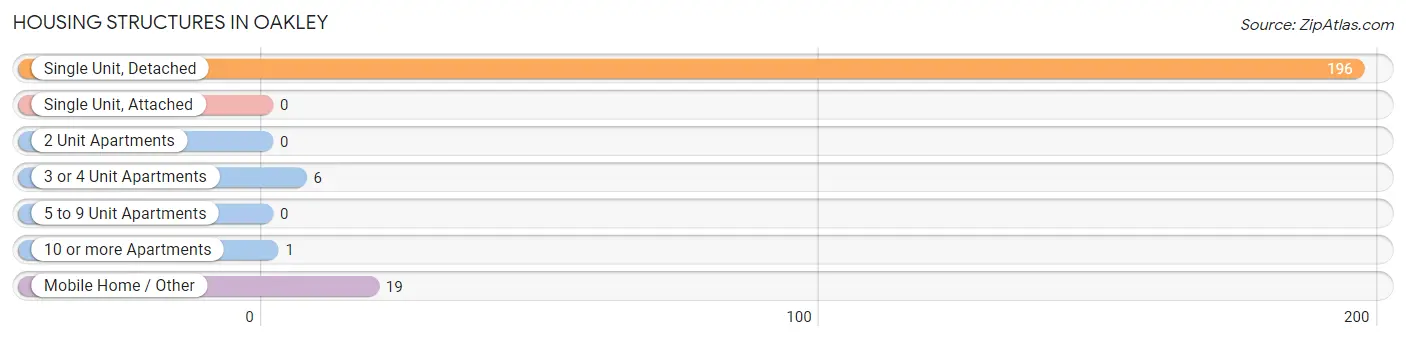
| Structure Type | # Housing Units | % Housing Units |
| Single Unit, Detached | 196 | 88.3% |
| Single Unit, Attached | 0 | 0.0% |
| 2 Unit Apartments | 0 | 0.0% |
| 3 or 4 Unit Apartments | 6 | 2.7% |
| 5 to 9 Unit Apartments | 0 | 0.0% |
| 10 or more Apartments | 1 | 0.4% |
| Mobile Home / Other | 19 | 8.6% |
| Total | 222 | 100.0% |
Housing Structures by Occupancy in Oakley
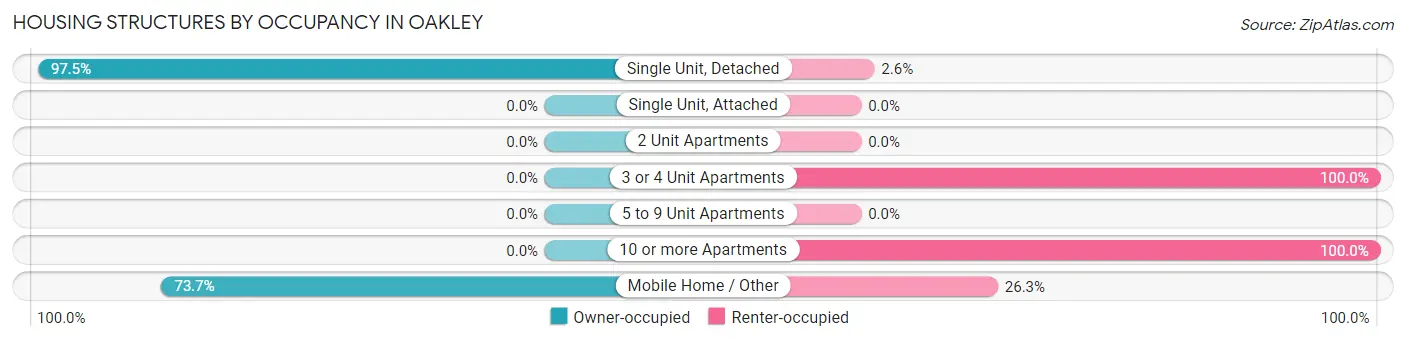
| Structure Type | Owner-occupied | Renter-occupied |
| Single Unit, Detached | 191 (97.5%) | 5 (2.5%) |
| Single Unit, Attached | 0 (0.0%) | 0 (0.0%) |
| 2 Unit Apartments | 0 (0.0%) | 0 (0.0%) |
| 3 or 4 Unit Apartments | 0 (0.0%) | 6 (100.0%) |
| 5 to 9 Unit Apartments | 0 (0.0%) | 0 (0.0%) |
| 10 or more Apartments | 0 (0.0%) | 1 (100.0%) |
| Mobile Home / Other | 14 (73.7%) | 5 (26.3%) |
| Total | 205 (92.3%) | 17 (7.7%) |
Housing Structures by Number of Rooms in Oakley
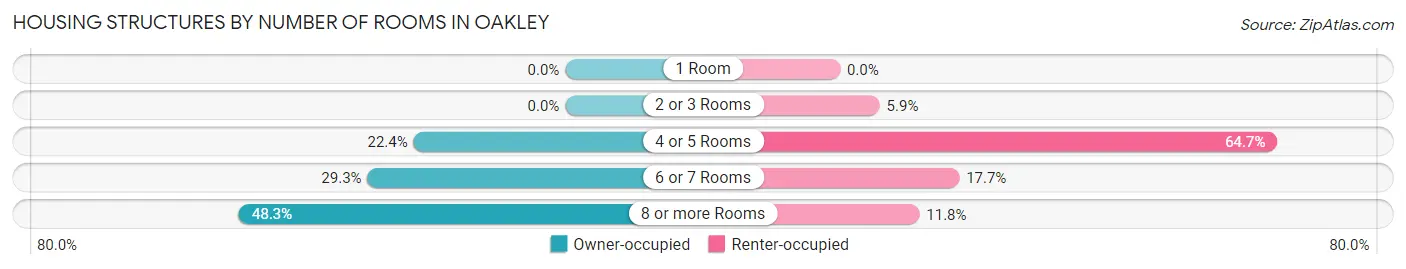
| Number of Rooms | Owner-occupied | Renter-occupied |
| 1 Room | 0 (0.0%) | 0 (0.0%) |
| 2 or 3 Rooms | 0 (0.0%) | 1 (5.9%) |
| 4 or 5 Rooms | 46 (22.4%) | 11 (64.7%) |
| 6 or 7 Rooms | 60 (29.3%) | 3 (17.6%) |
| 8 or more Rooms | 99 (48.3%) | 2 (11.8%) |
| Total | 205 (100.0%) | 17 (100.0%) |
Housing Structure by Heating Type in Oakley
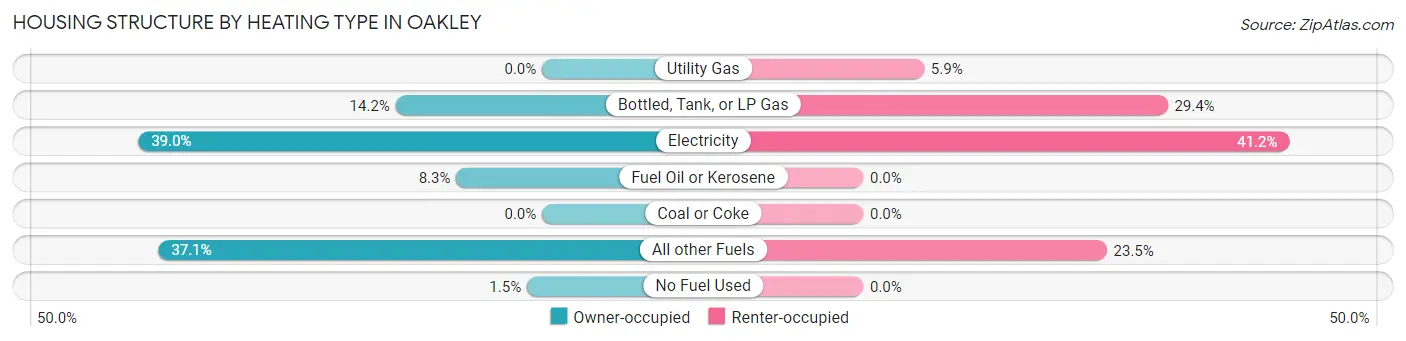
| Heating Type | Owner-occupied | Renter-occupied |
| Utility Gas | 0 (0.0%) | 1 (5.9%) |
| Bottled, Tank, or LP Gas | 29 (14.1%) | 5 (29.4%) |
| Electricity | 80 (39.0%) | 7 (41.2%) |
| Fuel Oil or Kerosene | 17 (8.3%) | 0 (0.0%) |
| Coal or Coke | 0 (0.0%) | 0 (0.0%) |
| All other Fuels | 76 (37.1%) | 4 (23.5%) |
| No Fuel Used | 3 (1.5%) | 0 (0.0%) |
| Total | 205 (100.0%) | 17 (100.0%) |
Household Vehicle Usage in Oakley
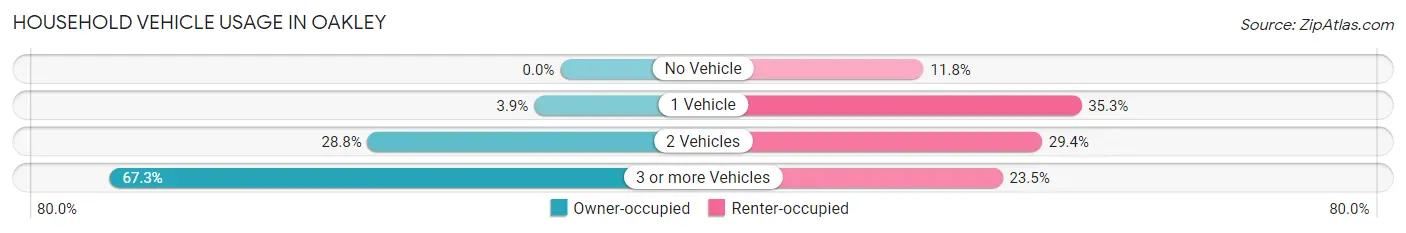
| Vehicles per Household | Owner-occupied | Renter-occupied |
| No Vehicle | 0 (0.0%) | 2 (11.8%) |
| 1 Vehicle | 8 (3.9%) | 6 (35.3%) |
| 2 Vehicles | 59 (28.8%) | 5 (29.4%) |
| 3 or more Vehicles | 138 (67.3%) | 4 (23.5%) |
| Total | 205 (100.0%) | 17 (100.0%) |
Real Estate & Mortgages in Oakley
Real Estate and Mortgage Overview in Oakley
| Characteristic | Without Mortgage | With Mortgage |
| Housing Units | 70 | 135 |
| Median Property Value | $210,000 | $194,300 |
| Median Household Income | $54,615 | $42 |
| Monthly Housing Costs | $341 | $3 |
| Real Estate Taxes | $733 | $0 |
Property Value by Mortgage Status in Oakley
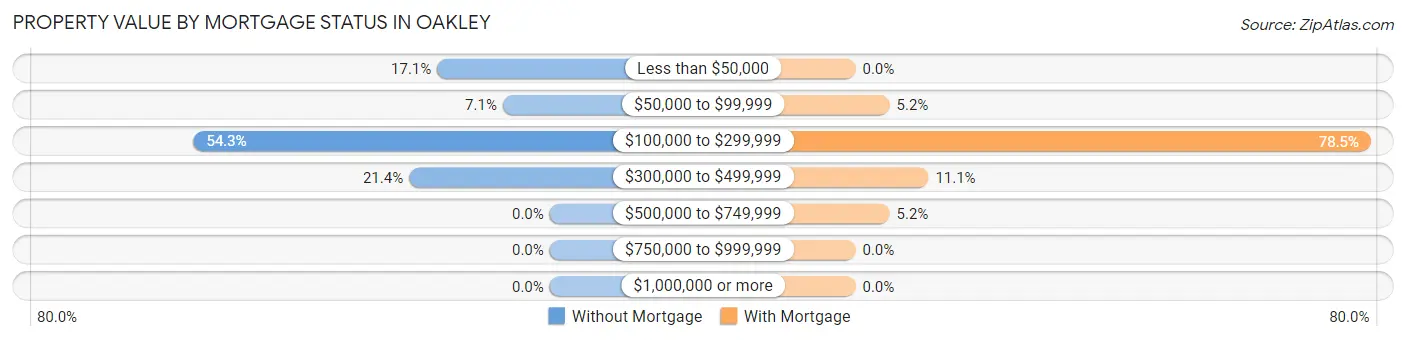
| Property Value | Without Mortgage | With Mortgage |
| Less than $50,000 | 12 (17.1%) | 0 (0.0%) |
| $50,000 to $99,999 | 5 (7.1%) | 7 (5.2%) |
| $100,000 to $299,999 | 38 (54.3%) | 106 (78.5%) |
| $300,000 to $499,999 | 15 (21.4%) | 15 (11.1%) |
| $500,000 to $749,999 | 0 (0.0%) | 7 (5.2%) |
| $750,000 to $999,999 | 0 (0.0%) | 0 (0.0%) |
| $1,000,000 or more | 0 (0.0%) | 0 (0.0%) |
| Total | 70 (100.0%) | 135 (100.0%) |
Household Income by Mortgage Status in Oakley
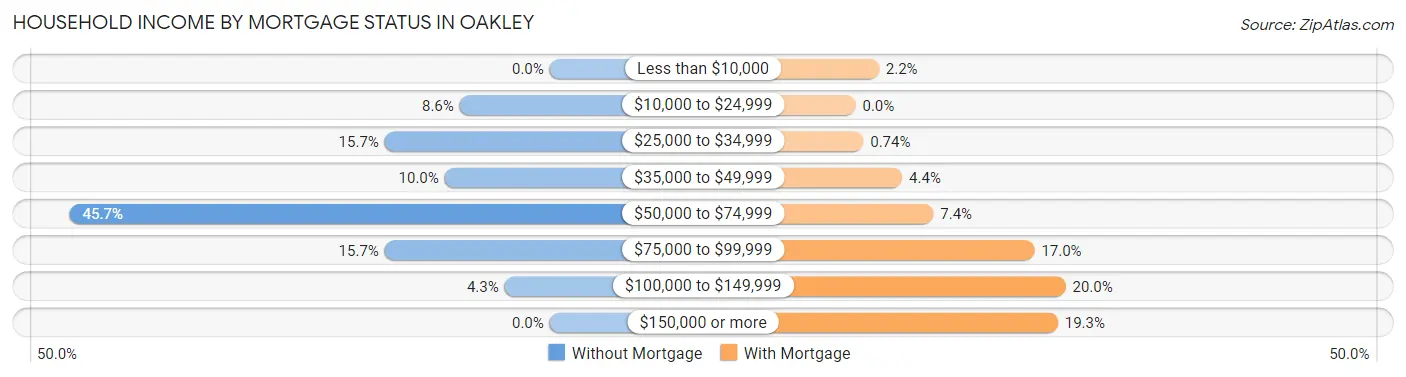
| Household Income | Without Mortgage | With Mortgage |
| Less than $10,000 | 0 (0.0%) | 3 (2.2%) |
| $10,000 to $24,999 | 6 (8.6%) | 0 (0.0%) |
| $25,000 to $34,999 | 11 (15.7%) | 1 (0.7%) |
| $35,000 to $49,999 | 7 (10.0%) | 6 (4.4%) |
| $50,000 to $74,999 | 32 (45.7%) | 10 (7.4%) |
| $75,000 to $99,999 | 11 (15.7%) | 23 (17.0%) |
| $100,000 to $149,999 | 3 (4.3%) | 27 (20.0%) |
| $150,000 or more | 0 (0.0%) | 26 (19.3%) |
| Total | 70 (100.0%) | 135 (100.0%) |
Property Value to Household Income Ratio in Oakley
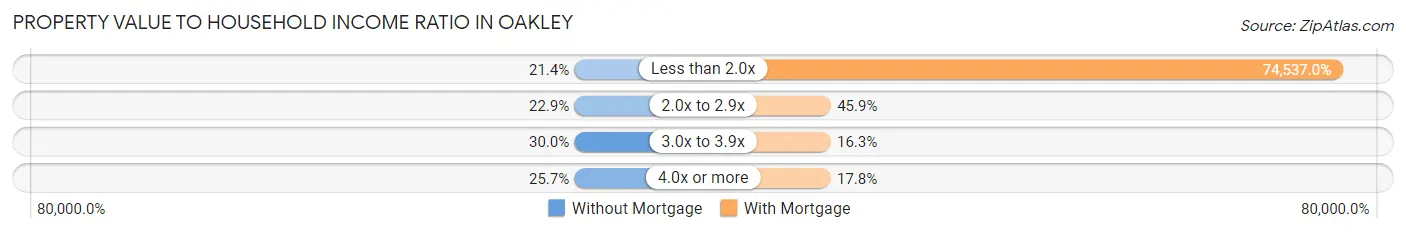
| Value-to-Income Ratio | Without Mortgage | With Mortgage |
| Less than 2.0x | 15 (21.4%) | 100,625 (74,537.0%) |
| 2.0x to 2.9x | 16 (22.9%) | 62 (45.9%) |
| 3.0x to 3.9x | 21 (30.0%) | 22 (16.3%) |
| 4.0x or more | 18 (25.7%) | 24 (17.8%) |
| Total | 70 (100.0%) | 135 (100.0%) |
Real Estate Taxes by Mortgage Status in Oakley
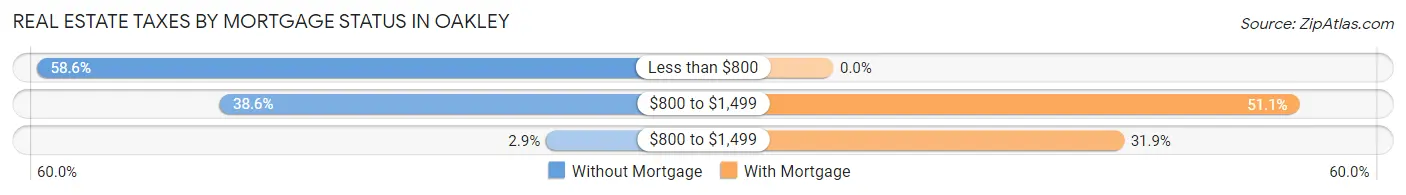
| Property Taxes | Without Mortgage | With Mortgage |
| Less than $800 | 41 (58.6%) | 0 (0.0%) |
| $800 to $1,499 | 27 (38.6%) | 69 (51.1%) |
| $800 to $1,499 | 2 (2.9%) | 43 (31.9%) |
| Total | 70 (100.0%) | 135 (100.0%) |
Health & Disability in Oakley
Health Insurance Coverage by Age in Oakley
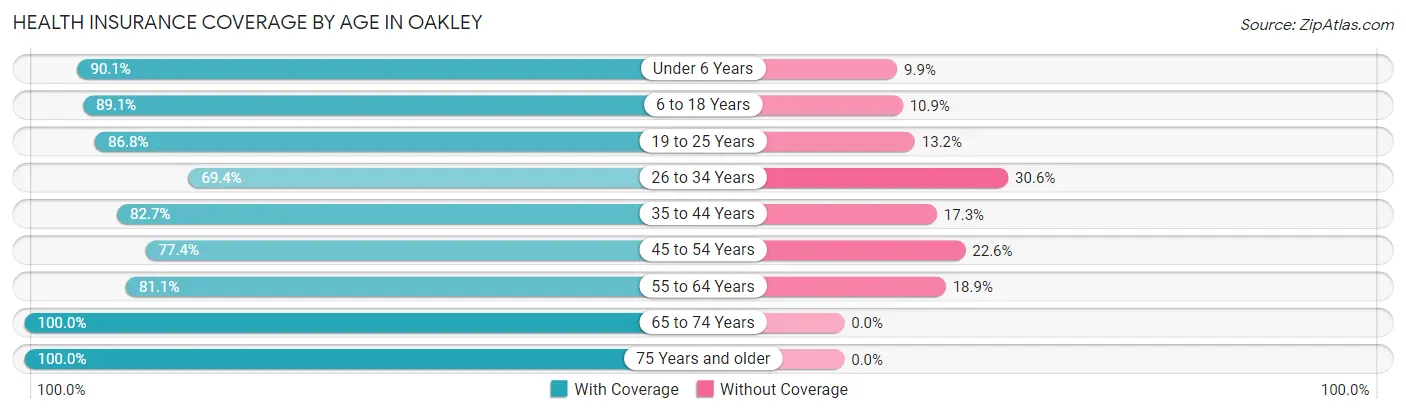
| Age Bracket | With Coverage | Without Coverage |
| Under 6 Years | 64 (90.1%) | 7 (9.9%) |
| 6 to 18 Years | 221 (89.1%) | 27 (10.9%) |
| 19 to 25 Years | 33 (86.8%) | 5 (13.2%) |
| 26 to 34 Years | 25 (69.4%) | 11 (30.6%) |
| 35 to 44 Years | 115 (82.7%) | 24 (17.3%) |
| 45 to 54 Years | 48 (77.4%) | 14 (22.6%) |
| 55 to 64 Years | 30 (81.1%) | 7 (18.9%) |
| 65 to 74 Years | 95 (100.0%) | 0 (0.0%) |
| 75 Years and older | 69 (100.0%) | 0 (0.0%) |
| Total | 700 (88.0%) | 95 (11.9%) |
Health Insurance Coverage by Citizenship Status in Oakley
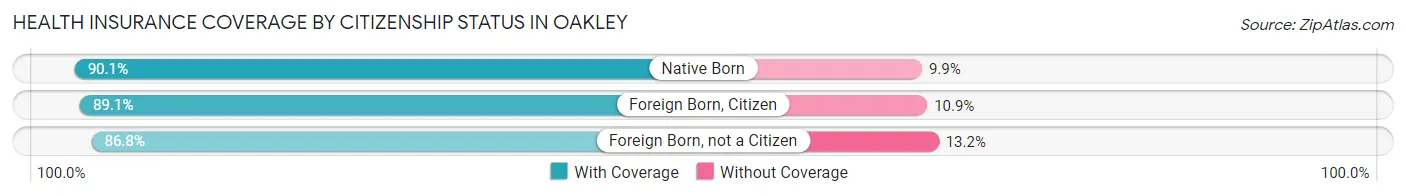
| Citizenship Status | With Coverage | Without Coverage |
| Native Born | 64 (90.1%) | 7 (9.9%) |
| Foreign Born, Citizen | 221 (89.1%) | 27 (10.9%) |
| Foreign Born, not a Citizen | 33 (86.8%) | 5 (13.2%) |
Health Insurance Coverage by Household Income in Oakley
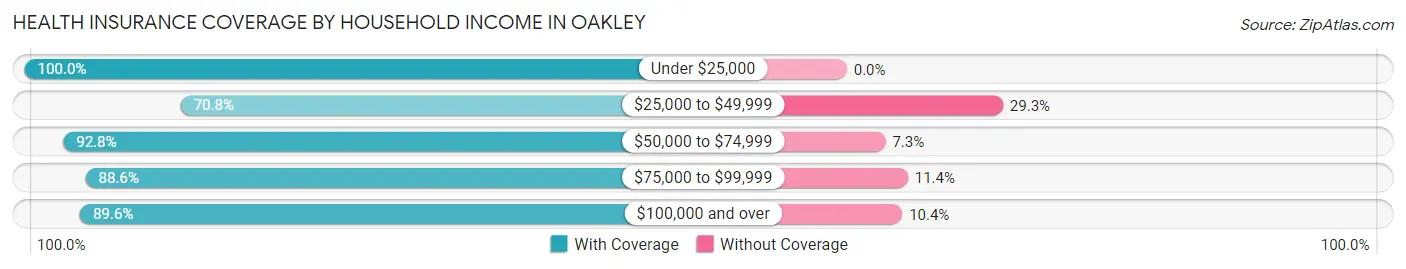
| Household Income | With Coverage | Without Coverage |
| Under $25,000 | 24 (100.0%) | 0 (0.0%) |
| $25,000 to $49,999 | 75 (70.8%) | 31 (29.2%) |
| $50,000 to $74,999 | 192 (92.7%) | 15 (7.2%) |
| $75,000 to $99,999 | 124 (88.6%) | 16 (11.4%) |
| $100,000 and over | 285 (89.6%) | 33 (10.4%) |
Public vs Private Health Insurance Coverage by Age in Oakley
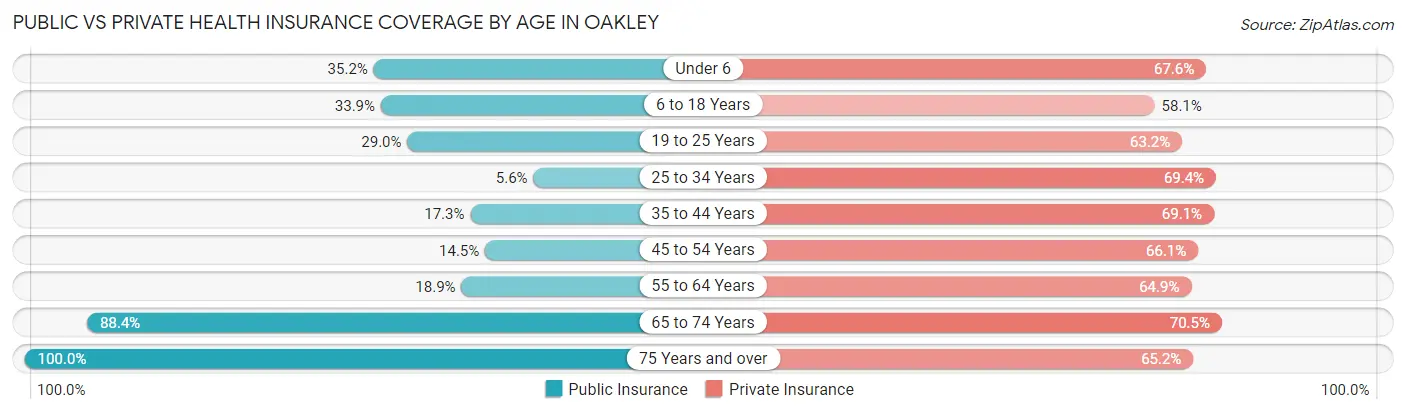
| Age Bracket | Public Insurance | Private Insurance |
| Under 6 | 25 (35.2%) | 48 (67.6%) |
| 6 to 18 Years | 84 (33.9%) | 144 (58.1%) |
| 19 to 25 Years | 11 (28.9%) | 24 (63.2%) |
| 25 to 34 Years | 2 (5.6%) | 25 (69.4%) |
| 35 to 44 Years | 24 (17.3%) | 96 (69.1%) |
| 45 to 54 Years | 9 (14.5%) | 41 (66.1%) |
| 55 to 64 Years | 7 (18.9%) | 24 (64.9%) |
| 65 to 74 Years | 84 (88.4%) | 67 (70.5%) |
| 75 Years and over | 69 (100.0%) | 45 (65.2%) |
| Total | 315 (39.6%) | 514 (64.6%) |
Disability Status by Sex by Age in Oakley
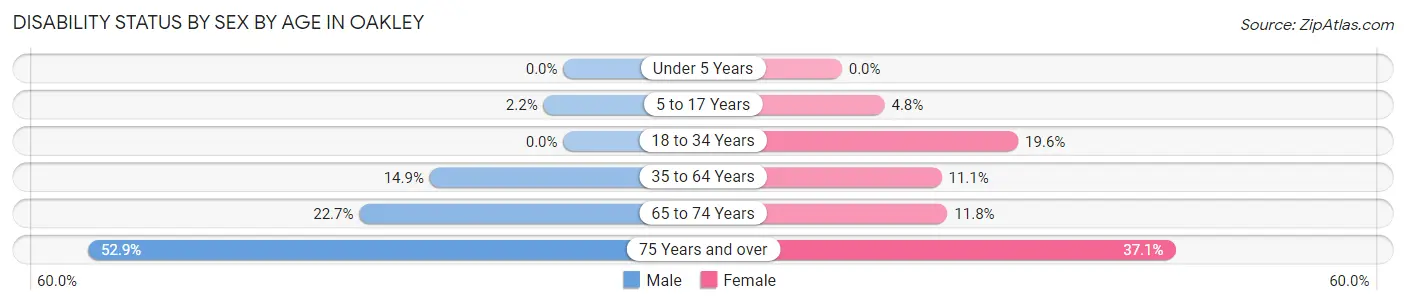
| Age Bracket | Male | Female |
| Under 5 Years | 0 (0.0%) | 0 (0.0%) |
| 5 to 17 Years | 3 (2.2%) | 6 (4.8%) |
| 18 to 34 Years | 0 (0.0%) | 11 (19.6%) |
| 35 to 64 Years | 18 (14.9%) | 13 (11.1%) |
| 65 to 74 Years | 10 (22.7%) | 6 (11.8%) |
| 75 Years and over | 18 (52.9%) | 13 (37.1%) |
Disability Class by Sex by Age in Oakley
Disability Class: Hearing Difficulty
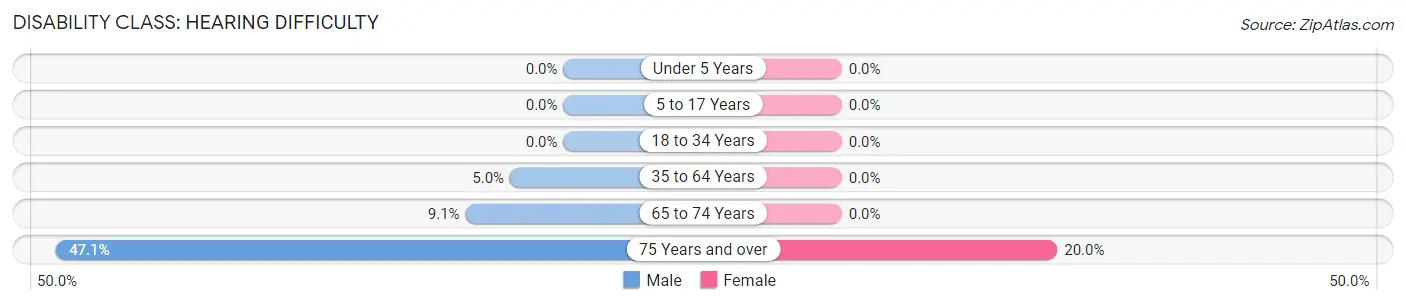
| Age Bracket | Male | Female |
| Under 5 Years | 0 (0.0%) | 0 (0.0%) |
| 5 to 17 Years | 0 (0.0%) | 0 (0.0%) |
| 18 to 34 Years | 0 (0.0%) | 0 (0.0%) |
| 35 to 64 Years | 6 (5.0%) | 0 (0.0%) |
| 65 to 74 Years | 4 (9.1%) | 0 (0.0%) |
| 75 Years and over | 16 (47.1%) | 7 (20.0%) |
Disability Class: Vision Difficulty
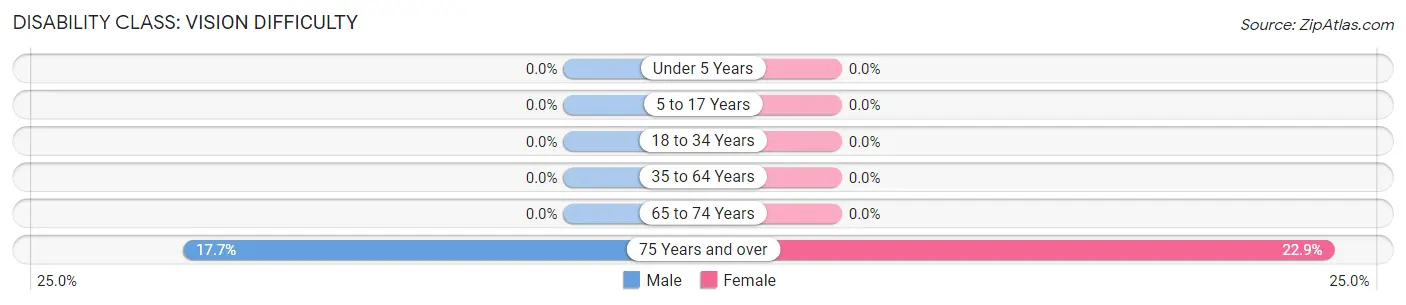
| Age Bracket | Male | Female |
| Under 5 Years | 0 (0.0%) | 0 (0.0%) |
| 5 to 17 Years | 0 (0.0%) | 0 (0.0%) |
| 18 to 34 Years | 0 (0.0%) | 0 (0.0%) |
| 35 to 64 Years | 0 (0.0%) | 0 (0.0%) |
| 65 to 74 Years | 0 (0.0%) | 0 (0.0%) |
| 75 Years and over | 6 (17.6%) | 8 (22.9%) |
Disability Class: Cognitive Difficulty
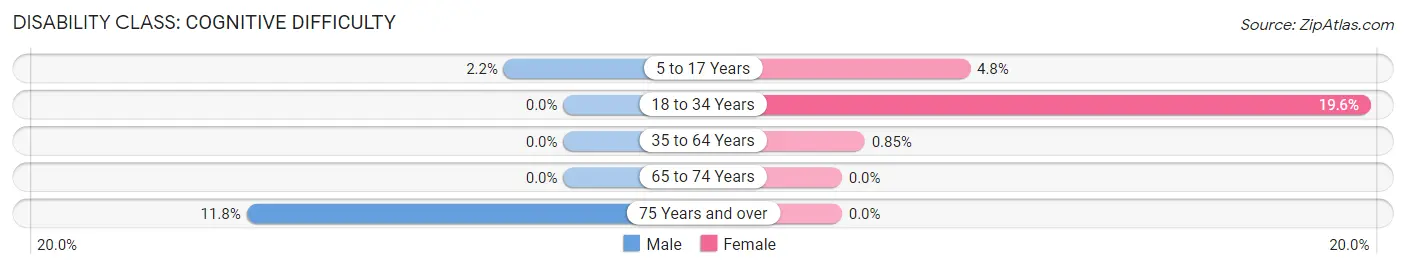
| Age Bracket | Male | Female |
| 5 to 17 Years | 3 (2.2%) | 6 (4.8%) |
| 18 to 34 Years | 0 (0.0%) | 11 (19.6%) |
| 35 to 64 Years | 0 (0.0%) | 1 (0.9%) |
| 65 to 74 Years | 0 (0.0%) | 0 (0.0%) |
| 75 Years and over | 4 (11.8%) | 0 (0.0%) |
Disability Class: Ambulatory Difficulty
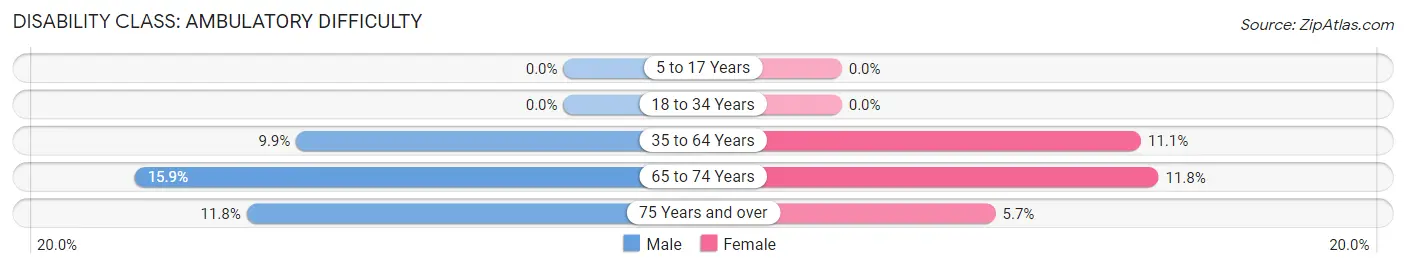
| Age Bracket | Male | Female |
| 5 to 17 Years | 0 (0.0%) | 0 (0.0%) |
| 18 to 34 Years | 0 (0.0%) | 0 (0.0%) |
| 35 to 64 Years | 12 (9.9%) | 13 (11.1%) |
| 65 to 74 Years | 7 (15.9%) | 6 (11.8%) |
| 75 Years and over | 4 (11.8%) | 2 (5.7%) |
Disability Class: Self-Care Difficulty
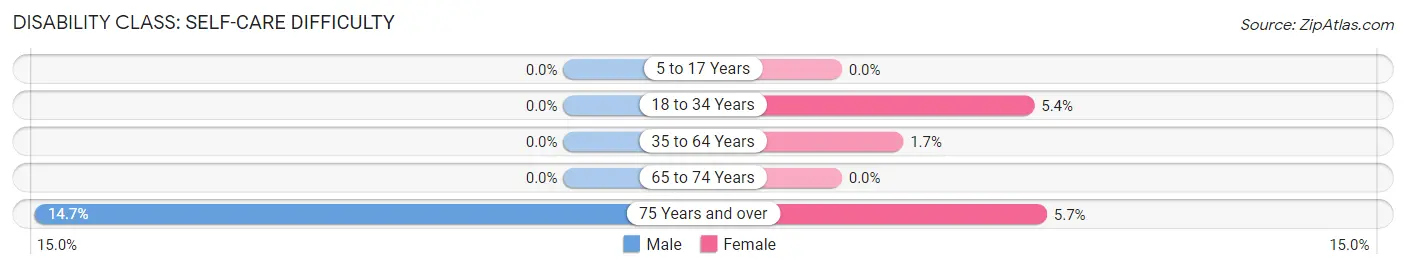
| Age Bracket | Male | Female |
| 5 to 17 Years | 0 (0.0%) | 0 (0.0%) |
| 18 to 34 Years | 0 (0.0%) | 3 (5.4%) |
| 35 to 64 Years | 0 (0.0%) | 2 (1.7%) |
| 65 to 74 Years | 0 (0.0%) | 0 (0.0%) |
| 75 Years and over | 5 (14.7%) | 2 (5.7%) |
Technology Access in Oakley
Computing Device Access in Oakley
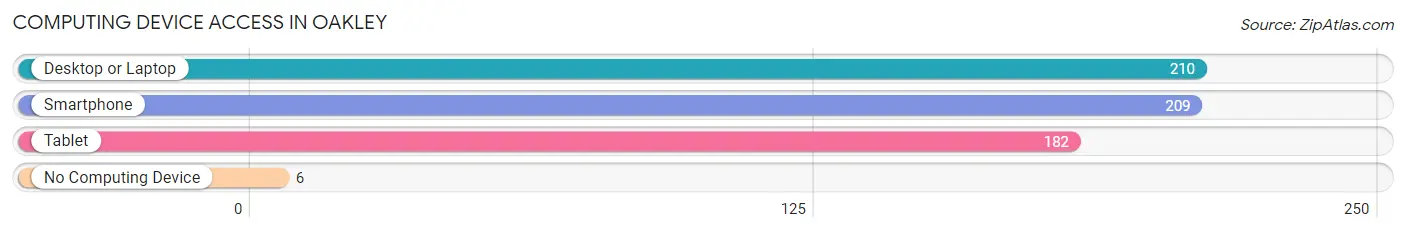
| Device Type | # Households | % Households |
| Desktop or Laptop | 210 | 94.6% |
| Smartphone | 209 | 94.1% |
| Tablet | 182 | 82.0% |
| No Computing Device | 6 | 2.7% |
| Total | 222 | 100.0% |
Internet Access in Oakley
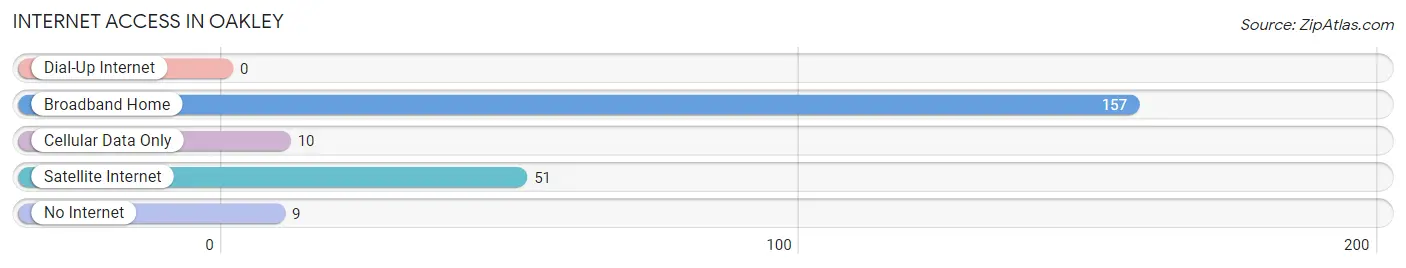
| Internet Type | # Households | % Households |
| Dial-Up Internet | 0 | 0.0% |
| Broadband Home | 157 | 70.7% |
| Cellular Data Only | 10 | 4.5% |
| Satellite Internet | 51 | 23.0% |
| No Internet | 9 | 4.1% |
| Total | 222 | 100.0% |
Oakley Summary
Oakley, Idaho is a small town located in Cassia County in the southeastern part of the state. It is situated in the Snake River Valley, about 25 miles south of Burley and about 50 miles north of Twin Falls. The population of Oakley was estimated to be 1,072 in 2019.
History
Oakley was founded in 1883 by a group of Mormon settlers led by William Oakley. The town was originally called Oakleyville, but the name was changed to Oakley in 1885. The town was incorporated in 1891.
Oakley was an important stop on the Oregon Short Line Railroad, which ran from Ogden, Utah to Huntington, Oregon. The railroad brought in new settlers and businesses, and the town grew rapidly. By the early 1900s, Oakley had a population of over 1,000 people and was home to several businesses, including a bank, a hotel, a newspaper, and a flour mill.
Geography
Oakley is located in the Snake River Valley, at an elevation of 4,717 feet. The town is surrounded by rolling hills and farmland, and is situated near the Snake River. The nearby mountains provide a beautiful backdrop to the town.
The climate in Oakley is semi-arid, with hot summers and cold winters. The average annual temperature is about 50 degrees Fahrenheit, and the average annual precipitation is about 11 inches.
Economy
Oakley’s economy is largely based on agriculture. The town is home to several farms and ranches, and the surrounding area is known for its production of potatoes, wheat, and other crops.
Oakley also has a small manufacturing sector, with several small businesses producing a variety of products, including furniture, clothing, and food products. The town also has a few retail stores, restaurants, and other services.
Demographics
Oakley’s population is predominantly white, with about 95% of the population identifying as white. The remaining 5% of the population is made up of Hispanic, African American, and Native American residents.
The median household income in Oakley is about $41,000, and the median home value is about $130,000. The town has a poverty rate of about 15%, which is slightly higher than the national average.
Oakley is a small, rural town with a rich history and a strong sense of community. The town is home to a diverse population, and its economy is largely based on agriculture. The town is surrounded by beautiful scenery, and its residents enjoy a peaceful, rural lifestyle.
Common Questions
What is Per Capita Income in Oakley?
Per Capita income in Oakley is $26,285.
What is the Median Family Income in Oakley?
Median Family Income in Oakley is $82,500.
What is the Median Household income in Oakley?
Median Household Income in Oakley is $77,500.
What is Income or Wage Gap in Oakley?
Income or Wage Gap in Oakley is 21.6%.
Women in Oakley earn 78.4 cents for every dollar earned by a man.
What is Inequality or Gini Index in Oakley?
Inequality or Gini Index in Oakley is 0.36.
What is the Total Population of Oakley?
Total Population of Oakley is 795.
What is the Total Male Population of Oakley?
Total Male Population of Oakley is 396.
What is the Total Female Population of Oakley?
Total Female Population of Oakley is 399.
What is the Ratio of Males per 100 Females in Oakley?
There are 99.25 Males per 100 Females in Oakley.
What is the Ratio of Females per 100 Males in Oakley?
There are 100.76 Females per 100 Males in Oakley.
What is the Median Population Age in Oakley?
Median Population Age in Oakley is 35.2 Years.
What is the Average Family Size in Oakley
Average Family Size in Oakley is 3.8 People.
What is the Average Household Size in Oakley
Average Household Size in Oakley is 3.6 People.
How Large is the Labor Force in Oakley?
There are 299 People in the Labor Forcein in Oakley.
What is the Percentage of People in the Labor Force in Oakley?
58.2% of People are in the Labor Force in Oakley.
What is the Unemployment Rate in Oakley?
Unemployment Rate in Oakley is 1.7%.