Vinton, TX Map & Demographics
Vinton Map
Vinton Overview
$18,643
PER CAPITA INCOME
$61,705
AVG FAMILY INCOME
$61,023
AVG HOUSEHOLD INCOME
13.0%
WAGE / INCOME GAP [ % ]
87.0¢/ $1
WAGE / INCOME GAP [ $ ]
$4,893
FAMILY INCOME DEFICIT
0.44
INEQUALITY / GINI INDEX
2,692
TOTAL POPULATION
1,837
MALE POPULATION
855
FEMALE POPULATION
214.85
MALES / 100 FEMALES
46.54
FEMALES / 100 MALES
42.7
MEDIAN AGE
3.6
AVG FAMILY SIZE
3.5
AVG HOUSEHOLD SIZE
763
LABOR FORCE [ PEOPLE ]
31.7%
PERCENT IN LABOR FORCE
6.4%
UNEMPLOYMENT RATE
Vinton Area Codes
Income in Vinton
Income Overview in Vinton
Per Capita Income in Vinton is $18,643, while median incomes of families and households are $61,705 and $61,023 respectively.
| Characteristic | Number | Measure |
| Per Capita Income | 2,692 | $18,643 |
| Median Family Income | 444 | $61,705 |
| Mean Family Income | 444 | $75,829 |
| Median Household Income | 498 | $61,023 |
| Mean Household Income | 498 | $71,653 |
| Income Deficit | 444 | $4,893 |
| Wage / Income Gap (%) | 2,692 | 13.04% |
| Wage / Income Gap ($) | 2,692 | 86.96¢ per $1 |
| Gini / Inequality Index | 2,692 | 0.44 |
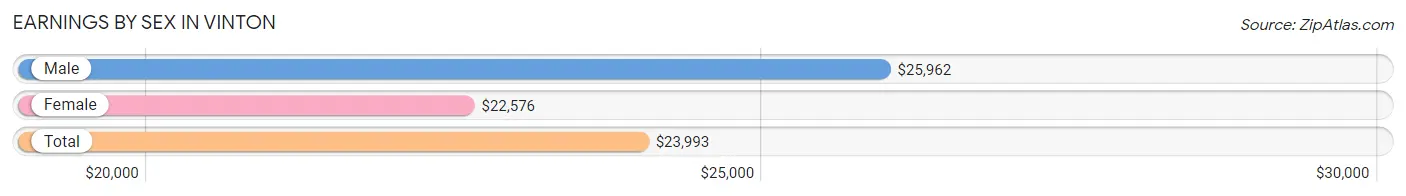
Earnings by Sex in Vinton
Average Earnings in Vinton are $23,993, $25,962 for men and $22,576 for women, a difference of 13.0%.
| Sex | Number | Average Earnings |
| Male | 800 (69.8%) | $25,962 |
| Female | 346 (30.2%) | $22,576 |
| Total | 1,146 (100.0%) | $23,993 |
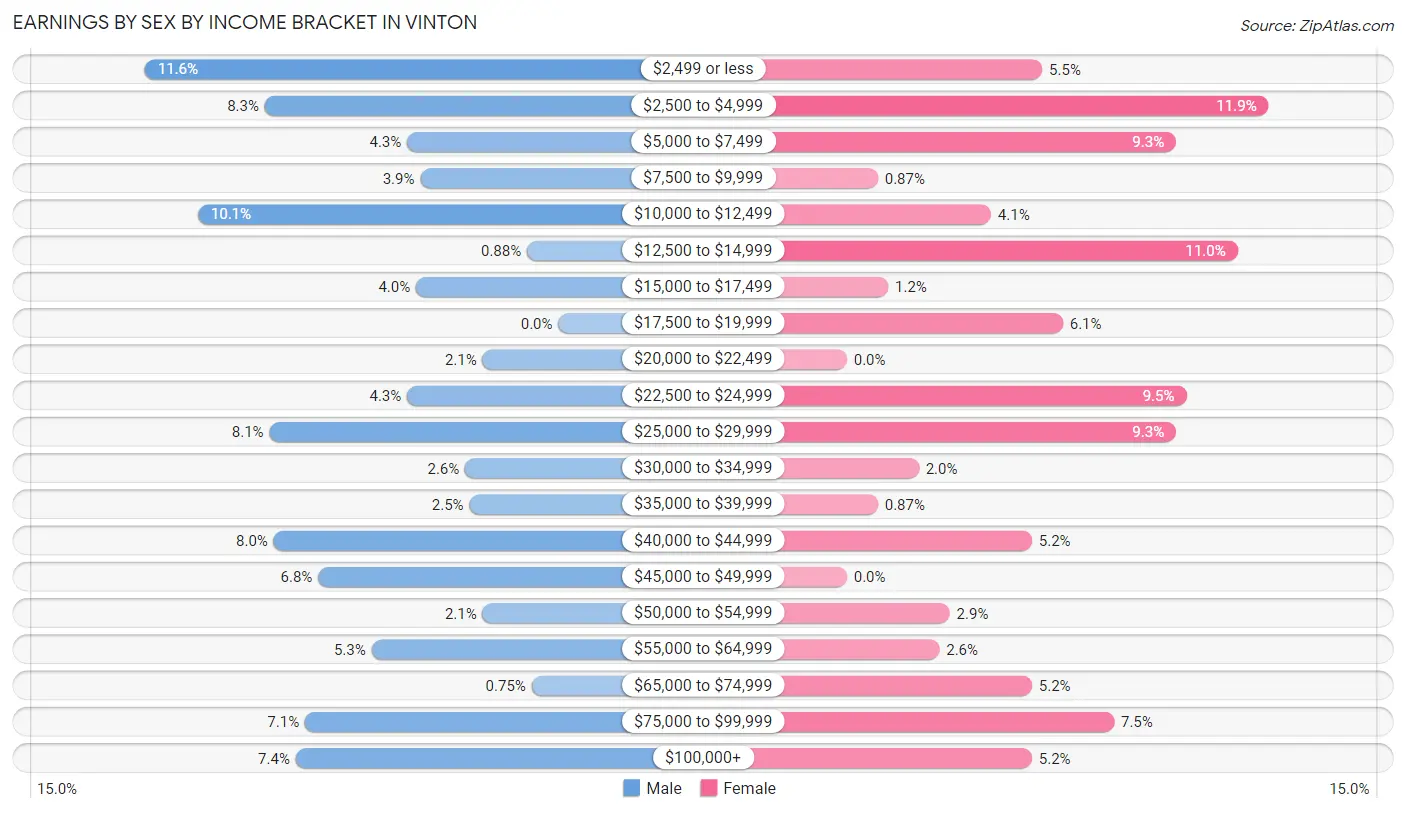
Earnings by Sex by Income Bracket in Vinton
The most common earnings brackets in Vinton are $2,499 or less for men (93 | 11.6%) and $2,500 to $4,999 for women (41 | 11.8%).
| Income | Male | Female |
| $2,499 or less | 93 (11.6%) | 19 (5.5%) |
| $2,500 to $4,999 | 66 (8.3%) | 41 (11.8%) |
| $5,000 to $7,499 | 34 (4.3%) | 32 (9.2%) |
| $7,500 to $9,999 | 31 (3.9%) | 3 (0.9%) |
| $10,000 to $12,499 | 81 (10.1%) | 14 (4.1%) |
| $12,500 to $14,999 | 7 (0.9%) | 38 (11.0%) |
| $15,000 to $17,499 | 32 (4.0%) | 4 (1.2%) |
| $17,500 to $19,999 | 0 (0.0%) | 21 (6.1%) |
| $20,000 to $22,499 | 17 (2.1%) | 0 (0.0%) |
| $22,500 to $24,999 | 34 (4.3%) | 33 (9.5%) |
| $25,000 to $29,999 | 65 (8.1%) | 32 (9.2%) |
| $30,000 to $34,999 | 21 (2.6%) | 7 (2.0%) |
| $35,000 to $39,999 | 20 (2.5%) | 3 (0.9%) |
| $40,000 to $44,999 | 64 (8.0%) | 18 (5.2%) |
| $45,000 to $49,999 | 54 (6.8%) | 0 (0.0%) |
| $50,000 to $54,999 | 17 (2.1%) | 10 (2.9%) |
| $55,000 to $64,999 | 42 (5.2%) | 9 (2.6%) |
| $65,000 to $74,999 | 6 (0.7%) | 18 (5.2%) |
| $75,000 to $99,999 | 57 (7.1%) | 26 (7.5%) |
| $100,000+ | 59 (7.4%) | 18 (5.2%) |
| Total | 800 (100.0%) | 346 (100.0%) |
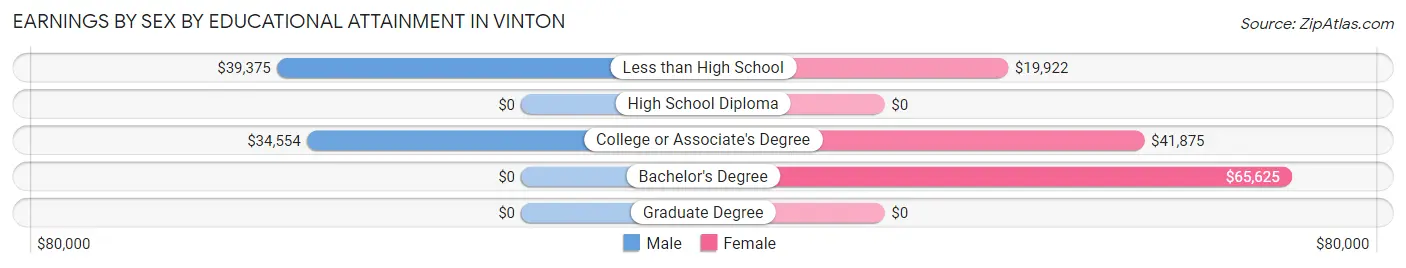
Earnings by Sex by Educational Attainment in Vinton
Average earnings in Vinton are $29,014 for men and $27,500 for women, a difference of 5.2%. Men with an educational attainment of less than high school enjoy the highest average annual earnings of $39,375, while those with college or associate's degree education earn the least with $34,554. Women with an educational attainment of bachelor's degree earn the most with the average annual earnings of $65,625, while those with less than high school education have the smallest earnings of $19,922.
| Educational Attainment | Male Income | Female Income |
| Less than High School | $39,375 | $19,922 |
| High School Diploma | - | - |
| College or Associate's Degree | $34,554 | $41,875 |
| Bachelor's Degree | - | - |
| Graduate Degree | - | - |
| Total | $29,014 | $27,500 |
Family Income in Vinton
Family Income Brackets in Vinton
According to the Vinton family income data, there are 99 families falling into the $50,000 to $74,999 income range, which is the most common income bracket and makes up 22.3% of all families. Conversely, the less than $10,000 income bracket is the least frequent group with only 7 families (1.6%) belonging to this category.
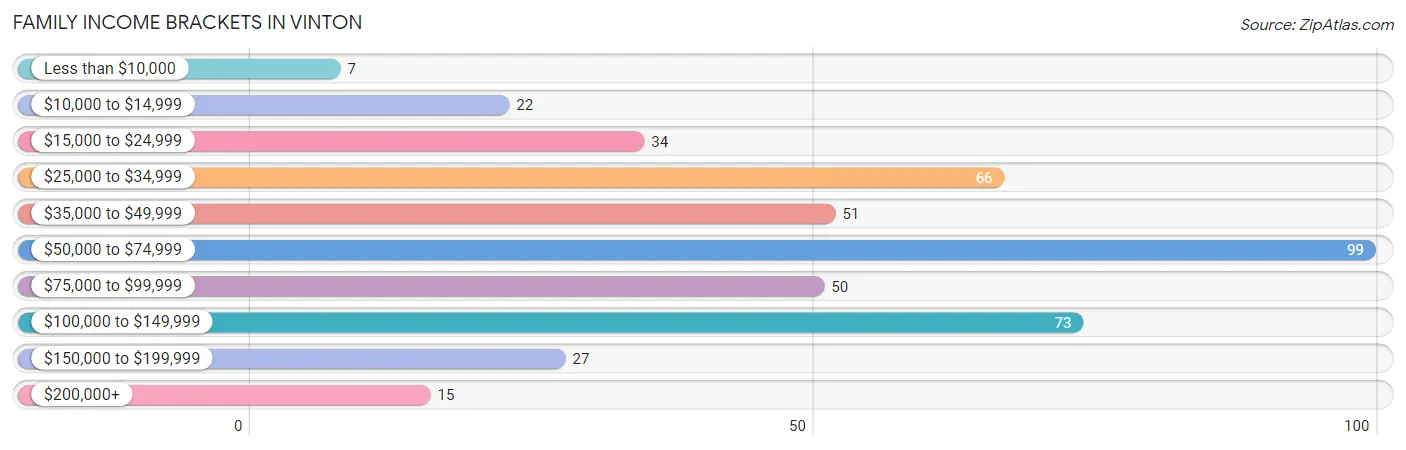
| Income Bracket | # Families | % Families |
| Less than $10,000 | 7 | 1.6% |
| $10,000 to $14,999 | 22 | 5.0% |
| $15,000 to $24,999 | 34 | 7.7% |
| $25,000 to $34,999 | 66 | 14.9% |
| $35,000 to $49,999 | 51 | 11.5% |
| $50,000 to $74,999 | 99 | 22.3% |
| $75,000 to $99,999 | 50 | 11.3% |
| $100,000 to $149,999 | 73 | 16.4% |
| $150,000 to $199,999 | 27 | 6.1% |
| $200,000+ | 15 | 3.4% |
Family Income by Famaliy Size in Vinton
6-person families (24 | 5.4%) account for the highest median family income in Vinton with $71,818 per family, while 2-person families (141 | 31.8%) have the highest median income of $30,529 per family member.
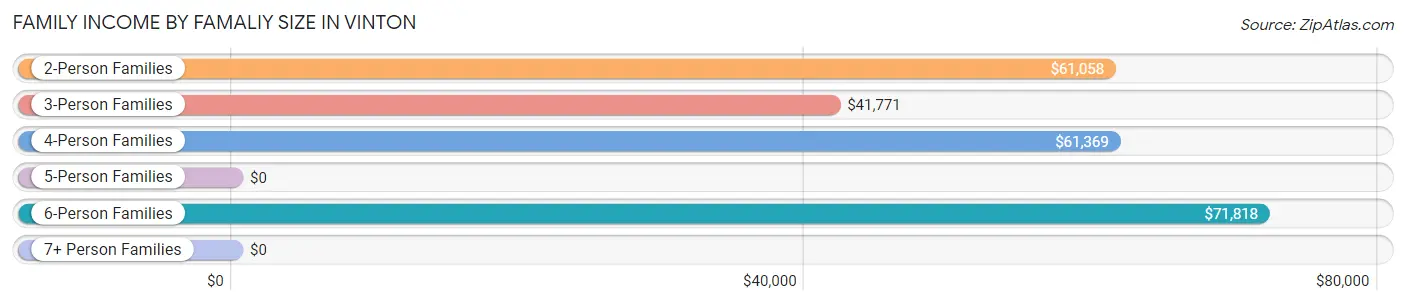
| Income Bracket | # Families | Median Income |
| 2-Person Families | 141 (31.8%) | $61,058 |
| 3-Person Families | 115 (25.9%) | $41,771 |
| 4-Person Families | 107 (24.1%) | $61,369 |
| 5-Person Families | 51 (11.5%) | $0 |
| 6-Person Families | 24 (5.4%) | $71,818 |
| 7+ Person Families | 6 (1.3%) | $0 |
| Total | 444 (100.0%) | $61,705 |
Family Income by Number of Earners in Vinton
The median family income in Vinton is $61,705, with families comprising 3+ earners (65) having the highest median family income of $91,719, while families with no earners (84) have the lowest median family income of $22,105, accounting for 14.6% and 18.9% of families, respectively.
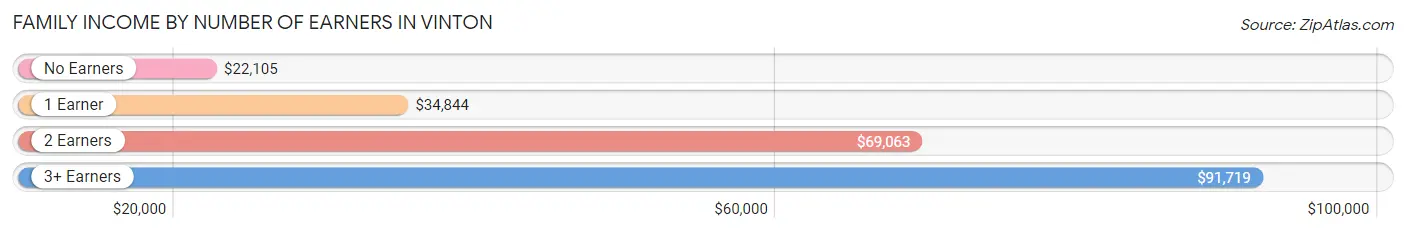
| Number of Earners | # Families | Median Income |
| No Earners | 84 (18.9%) | $22,105 |
| 1 Earner | 138 (31.1%) | $34,844 |
| 2 Earners | 157 (35.4%) | $69,063 |
| 3+ Earners | 65 (14.6%) | $91,719 |
| Total | 444 (100.0%) | $61,705 |
Household Income in Vinton
Household Income Brackets in Vinton
With 80 households falling in the category, the $50,000 to $74,999 income range is the most frequent in Vinton, accounting for 16.1% of all households. In contrast, only 15 households (3.0%) fall into the $200,000+ income bracket, making it the least populous group.
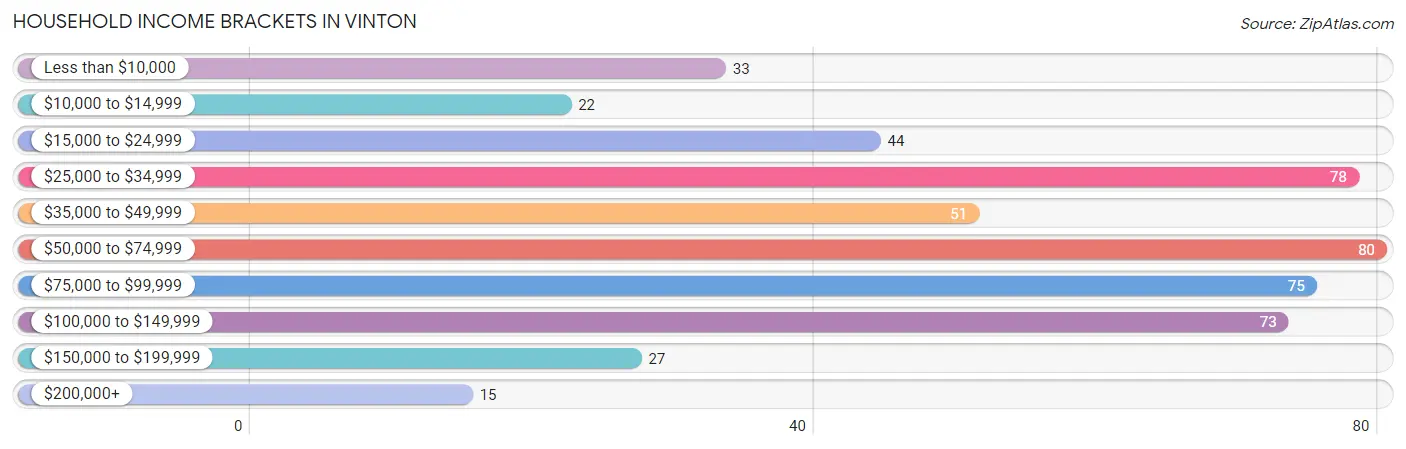
| Income Bracket | # Households | % Households |
| Less than $10,000 | 33 | 6.6% |
| $10,000 to $14,999 | 22 | 4.4% |
| $15,000 to $24,999 | 44 | 8.8% |
| $25,000 to $34,999 | 78 | 15.7% |
| $35,000 to $49,999 | 51 | 10.2% |
| $50,000 to $74,999 | 80 | 16.1% |
| $75,000 to $99,999 | 75 | 15.1% |
| $100,000 to $149,999 | 73 | 14.7% |
| $150,000 to $199,999 | 27 | 5.4% |
| $200,000+ | 15 | 3.0% |
Household Income by Householder Age in Vinton
The median household income in Vinton is $61,023, with the highest median household income of $97,813 found in the 25 to 44 years age bracket for the primary householder. A total of 59 households (11.8%) fall into this category. Meanwhile, the 15 to 24 years age bracket for the primary householder has the lowest median household income of $0, with 7 households (1.4%) in this group.
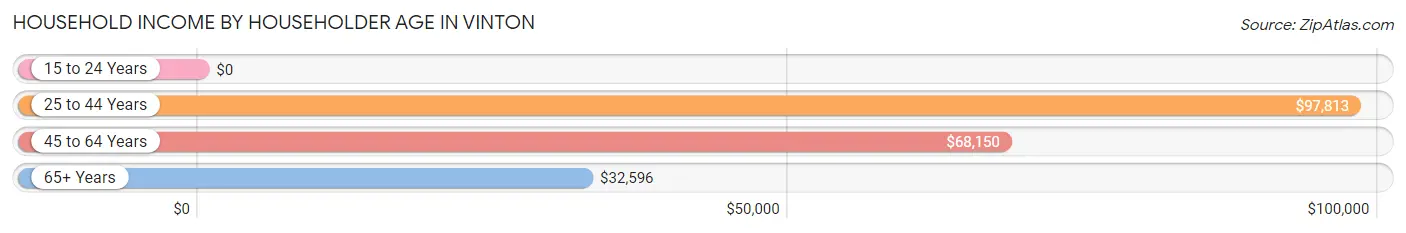
| Income Bracket | # Households | Median Income |
| 15 to 24 Years | 7 (1.4%) | $0 |
| 25 to 44 Years | 59 (11.8%) | $97,813 |
| 45 to 64 Years | 299 (60.0%) | $68,150 |
| 65+ Years | 133 (26.7%) | $32,596 |
| Total | 498 (100.0%) | $61,023 |
Poverty in Vinton
Income Below Poverty by Sex and Age in Vinton
With 14.9% poverty level for males and 19.2% for females among the residents of Vinton, 65 to 74 year old males and 15 year old females are the most vulnerable to poverty, with 32 males (60.4%) and 5 females (55.6%) in their respective age groups living below the poverty level.
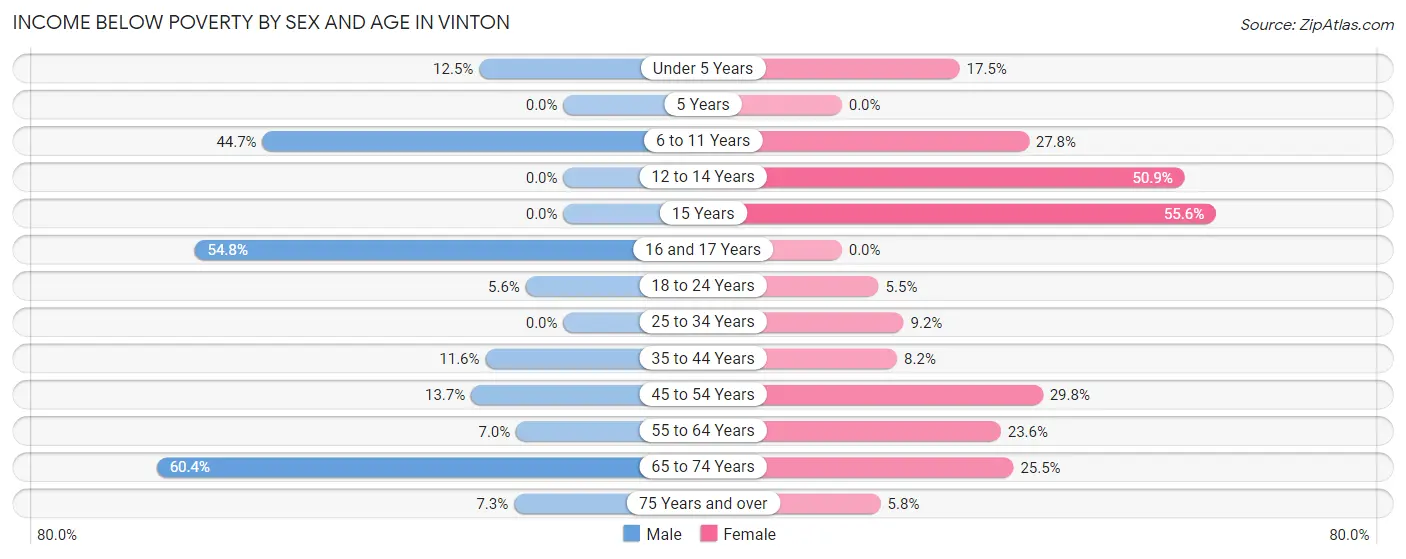
| Age Bracket | Male | Female |
| Under 5 Years | 4 (12.5%) | 7 (17.5%) |
| 5 Years | 0 (0.0%) | 0 (0.0%) |
| 6 to 11 Years | 21 (44.7%) | 15 (27.8%) |
| 12 to 14 Years | 0 (0.0%) | 28 (50.9%) |
| 15 Years | 0 (0.0%) | 5 (55.6%) |
| 16 and 17 Years | 23 (54.8%) | 0 (0.0%) |
| 18 to 24 Years | 7 (5.6%) | 7 (5.5%) |
| 25 to 34 Years | 0 (0.0%) | 9 (9.2%) |
| 35 to 44 Years | 11 (11.6%) | 6 (8.2%) |
| 45 to 54 Years | 17 (13.7%) | 37 (29.8%) |
| 55 to 64 Years | 11 (7.0%) | 34 (23.6%) |
| 65 to 74 Years | 32 (60.4%) | 13 (25.5%) |
| 75 Years and over | 3 (7.3%) | 3 (5.8%) |
| Total | 129 (14.9%) | 164 (19.2%) |
Income Above Poverty by Sex and Age in Vinton
According to the poverty statistics in Vinton, males aged 5 years and females aged 16 and 17 years are the age groups that are most secure financially, with 100.0% of males and 100.0% of females in these age groups living above the poverty line.
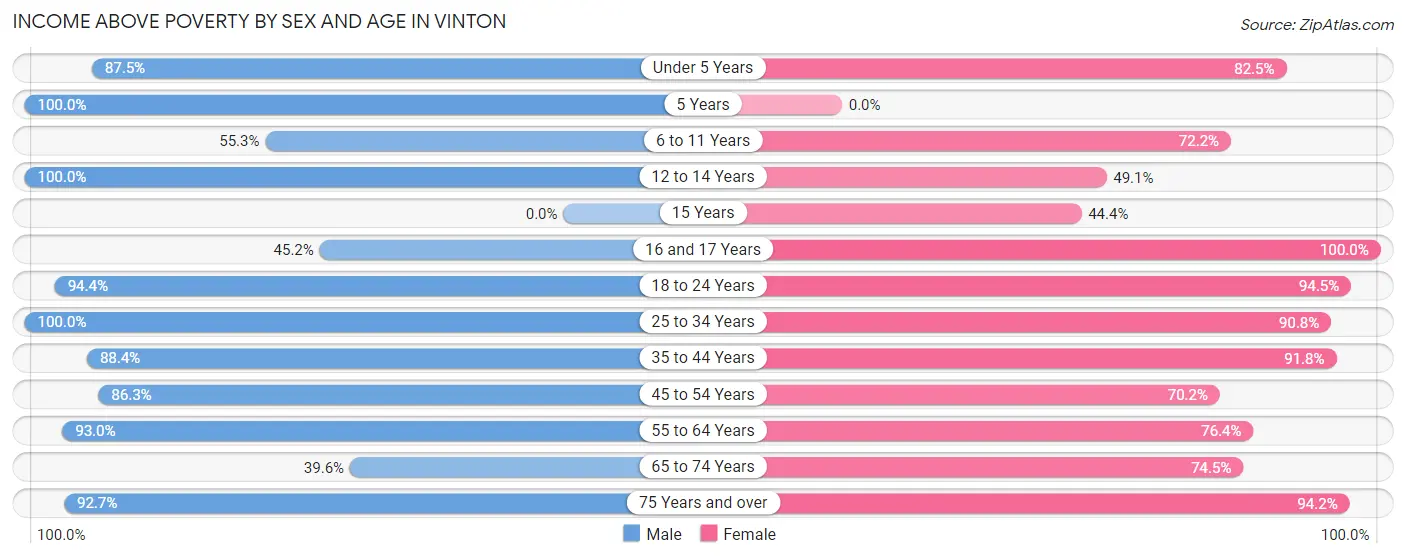
| Age Bracket | Male | Female |
| Under 5 Years | 28 (87.5%) | 33 (82.5%) |
| 5 Years | 16 (100.0%) | 0 (0.0%) |
| 6 to 11 Years | 26 (55.3%) | 39 (72.2%) |
| 12 to 14 Years | 33 (100.0%) | 27 (49.1%) |
| 15 Years | 0 (0.0%) | 4 (44.4%) |
| 16 and 17 Years | 19 (45.2%) | 27 (100.0%) |
| 18 to 24 Years | 118 (94.4%) | 121 (94.5%) |
| 25 to 34 Years | 98 (100.0%) | 89 (90.8%) |
| 35 to 44 Years | 84 (88.4%) | 67 (91.8%) |
| 45 to 54 Years | 107 (86.3%) | 87 (70.2%) |
| 55 to 64 Years | 146 (93.0%) | 110 (76.4%) |
| 65 to 74 Years | 21 (39.6%) | 38 (74.5%) |
| 75 Years and over | 38 (92.7%) | 49 (94.2%) |
| Total | 734 (85.1%) | 691 (80.8%) |
Income Below Poverty Among Married-Couple Families in Vinton
The poverty statistics for married-couple families in Vinton show that 16.6% or 55 of the total 332 families live below the poverty line. Families with 1 or 2 children have the highest poverty rate of 29.8%, comprising of 42 families. On the other hand, families with 3 or 4 children have the lowest poverty rate of 0.0%, which includes 0 families.
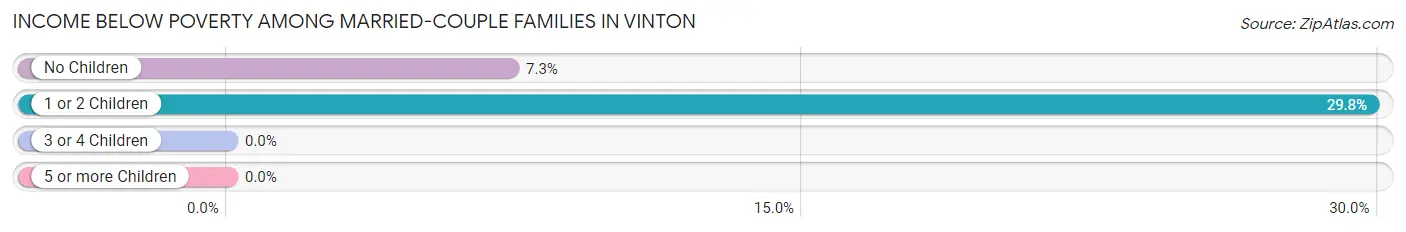
| Children | Above Poverty | Below Poverty |
| No Children | 164 (92.7%) | 13 (7.3%) |
| 1 or 2 Children | 99 (70.2%) | 42 (29.8%) |
| 3 or 4 Children | 14 (100.0%) | 0 (0.0%) |
| 5 or more Children | 0 (0.0%) | 0 (0.0%) |
| Total | 277 (83.4%) | 55 (16.6%) |
Income Below Poverty Among Single-Parent Households in Vinton
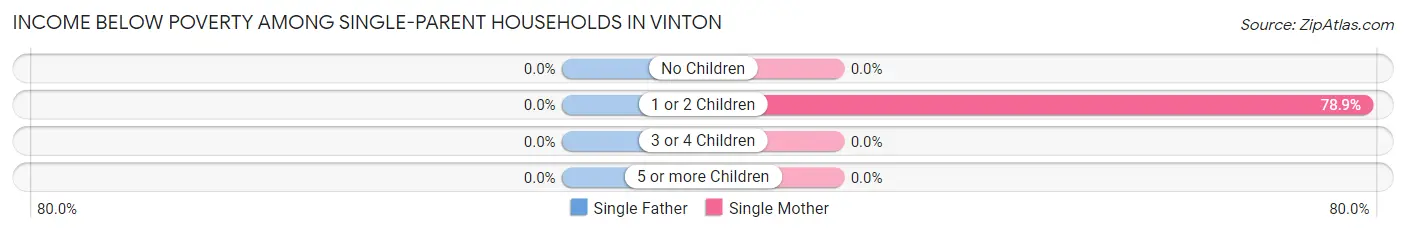
| Children | Single Father | Single Mother |
| No Children | 0 (0.0%) | 0 (0.0%) |
| 1 or 2 Children | 0 (0.0%) | 41 (78.8%) |
| 3 or 4 Children | 0 (0.0%) | 0 (0.0%) |
| 5 or more Children | 0 (0.0%) | 0 (0.0%) |
| Total | 0 (0.0%) | 41 (47.7%) |
Income Below Poverty Among Married-Couple vs Single-Parent Households in Vinton
The poverty data for Vinton shows that 55 of the married-couple family households (16.6%) and 41 of the single-parent households (36.6%) are living below the poverty level. Within the married-couple family households, those with 1 or 2 children have the highest poverty rate, with 42 households (29.8%) falling below the poverty line. Among the single-parent households, those with 1 or 2 children have the highest poverty rate, with 41 household (61.2%) living below poverty.
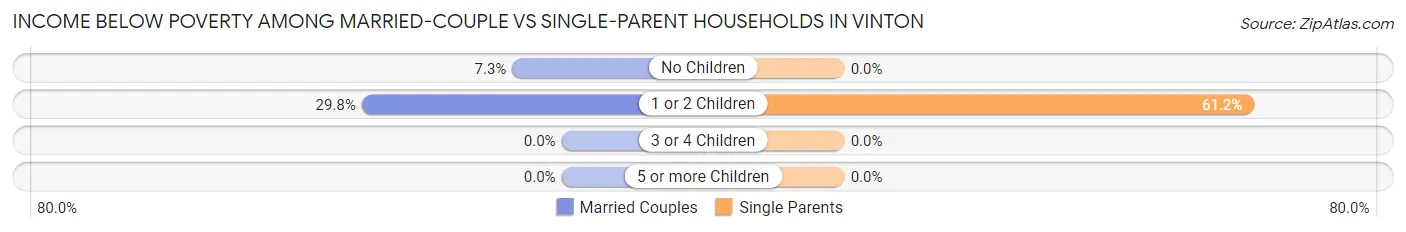
| Children | Married-Couple Families | Single-Parent Households |
| No Children | 13 (7.3%) | 0 (0.0%) |
| 1 or 2 Children | 42 (29.8%) | 41 (61.2%) |
| 3 or 4 Children | 0 (0.0%) | 0 (0.0%) |
| 5 or more Children | 0 (0.0%) | 0 (0.0%) |
| Total | 55 (16.6%) | 41 (36.6%) |
Race in Vinton
The most populous races in Vinton are Hispanic or Latino (2,157 | 80.1%), White / Caucasian (1,310 | 48.7%), and Some other Race (866 | 32.2%).
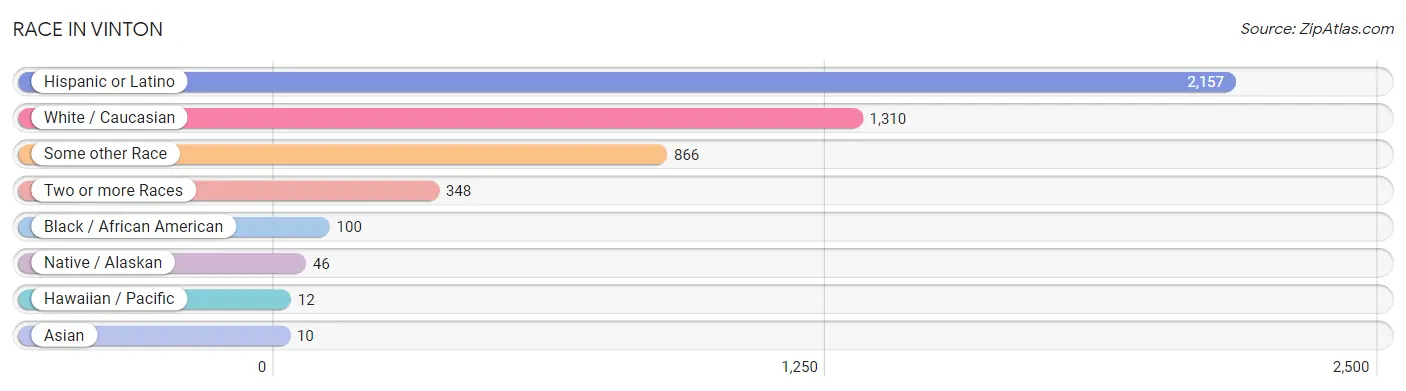
| Race | # Population | % Population |
| Asian | 10 | 0.4% |
| Black / African American | 100 | 3.7% |
| Hawaiian / Pacific | 12 | 0.4% |
| Hispanic or Latino | 2,157 | 80.1% |
| Native / Alaskan | 46 | 1.7% |
| White / Caucasian | 1,310 | 48.7% |
| Two or more Races | 348 | 12.9% |
| Some other Race | 866 | 32.2% |
| Total | 2,692 | 100.0% |
Ancestry in Vinton
The most populous ancestries reported in Vinton are Mexican (1,824 | 67.8%), German (89 | 3.3%), Irish (47 | 1.8%), English (40 | 1.5%), and European (15 | 0.6%), together accounting for 74.9% of all Vinton residents.
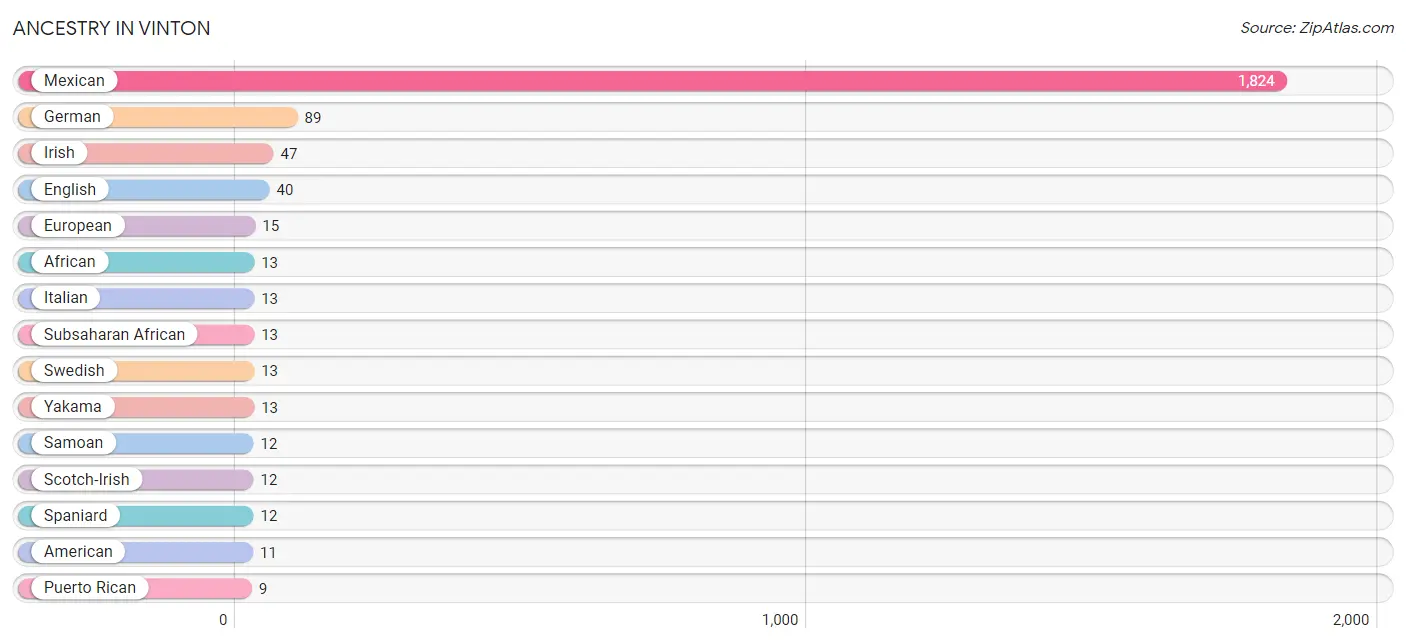
| Ancestry | # Population | % Population |
| African | 13 | 0.5% |
| American | 11 | 0.4% |
| Central American | 3 | 0.1% |
| Dutch | 6 | 0.2% |
| Ecuadorian | 8 | 0.3% |
| English | 40 | 1.5% |
| European | 15 | 0.6% |
| German | 89 | 3.3% |
| Guamanian / Chamorro | 7 | 0.3% |
| Irish | 47 | 1.8% |
| Italian | 13 | 0.5% |
| Mexican | 1,824 | 67.8% |
| Puerto Rican | 9 | 0.3% |
| Russian | 3 | 0.1% |
| Salvadoran | 3 | 0.1% |
| Samoan | 12 | 0.4% |
| Scotch-Irish | 12 | 0.4% |
| South American | 8 | 0.3% |
| Spaniard | 12 | 0.4% |
| Subsaharan African | 13 | 0.5% |
| Swedish | 13 | 0.5% |
| Yakama | 13 | 0.5% | View All 22 Rows |
Immigrants in Vinton
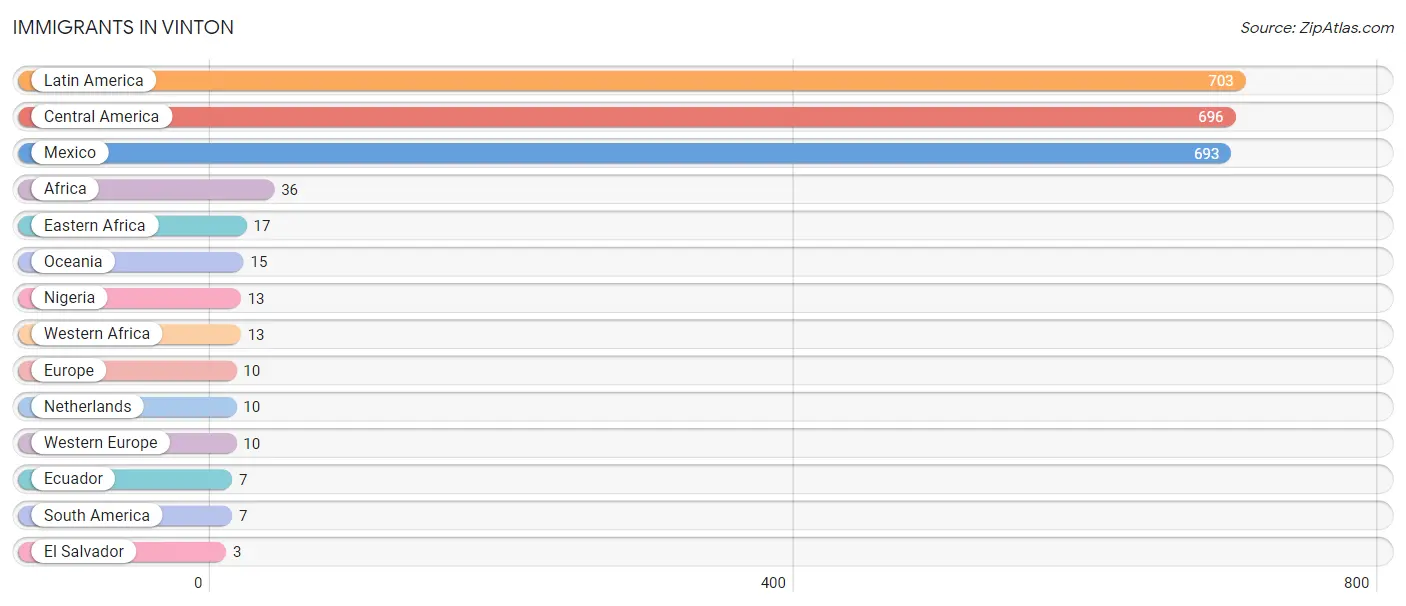
The most numerous immigrant groups reported in Vinton came from Latin America (703 | 26.1%), Central America (696 | 25.9%), Mexico (693 | 25.7%), Africa (36 | 1.3%), and Eastern Africa (17 | 0.6%), together accounting for 79.7% of all Vinton residents.
| Immigration Origin | # Population | % Population |
| Africa | 36 | 1.3% |
| Central America | 696 | 25.9% |
| Eastern Africa | 17 | 0.6% |
| Ecuador | 7 | 0.3% |
| El Salvador | 3 | 0.1% |
| Europe | 10 | 0.4% |
| Latin America | 703 | 26.1% |
| Mexico | 693 | 25.7% |
| Netherlands | 10 | 0.4% |
| Nigeria | 13 | 0.5% |
| Oceania | 15 | 0.6% |
| South America | 7 | 0.3% |
| Western Africa | 13 | 0.5% |
| Western Europe | 10 | 0.4% | View All 14 Rows |
Sex and Age in Vinton
Sex and Age in Vinton
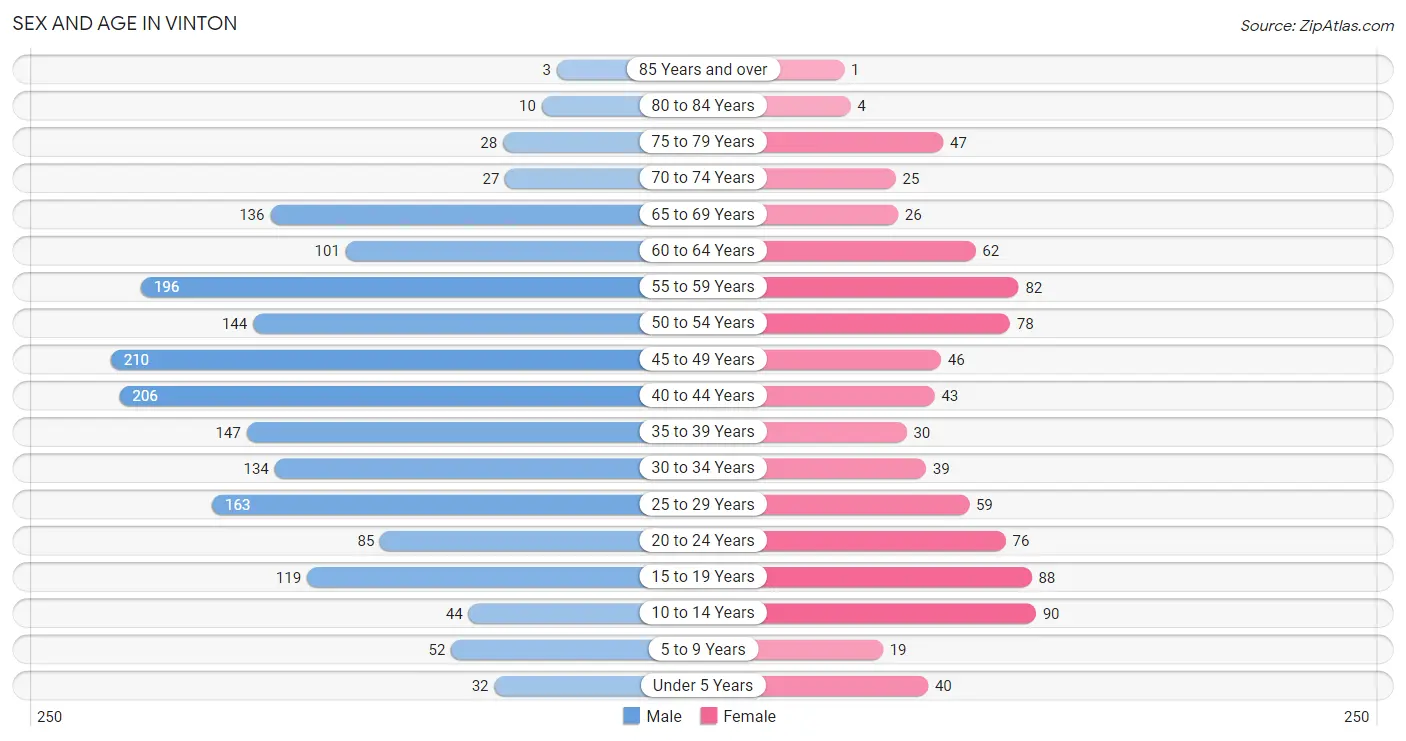
The most populous age groups in Vinton are 45 to 49 Years (210 | 11.4%) for men and 10 to 14 Years (90 | 10.5%) for women.
| Age Bracket | Male | Female |
| Under 5 Years | 32 (1.7%) | 40 (4.7%) |
| 5 to 9 Years | 52 (2.8%) | 19 (2.2%) |
| 10 to 14 Years | 44 (2.4%) | 90 (10.5%) |
| 15 to 19 Years | 119 (6.5%) | 88 (10.3%) |
| 20 to 24 Years | 85 (4.6%) | 76 (8.9%) |
| 25 to 29 Years | 163 (8.9%) | 59 (6.9%) |
| 30 to 34 Years | 134 (7.3%) | 39 (4.6%) |
| 35 to 39 Years | 147 (8.0%) | 30 (3.5%) |
| 40 to 44 Years | 206 (11.2%) | 43 (5.0%) |
| 45 to 49 Years | 210 (11.4%) | 46 (5.4%) |
| 50 to 54 Years | 144 (7.8%) | 78 (9.1%) |
| 55 to 59 Years | 196 (10.7%) | 82 (9.6%) |
| 60 to 64 Years | 101 (5.5%) | 62 (7.2%) |
| 65 to 69 Years | 136 (7.4%) | 26 (3.0%) |
| 70 to 74 Years | 27 (1.5%) | 25 (2.9%) |
| 75 to 79 Years | 28 (1.5%) | 47 (5.5%) |
| 80 to 84 Years | 10 (0.5%) | 4 (0.5%) |
| 85 Years and over | 3 (0.2%) | 1 (0.1%) |
| Total | 1,837 (100.0%) | 855 (100.0%) |
Families and Households in Vinton
Median Family Size in Vinton
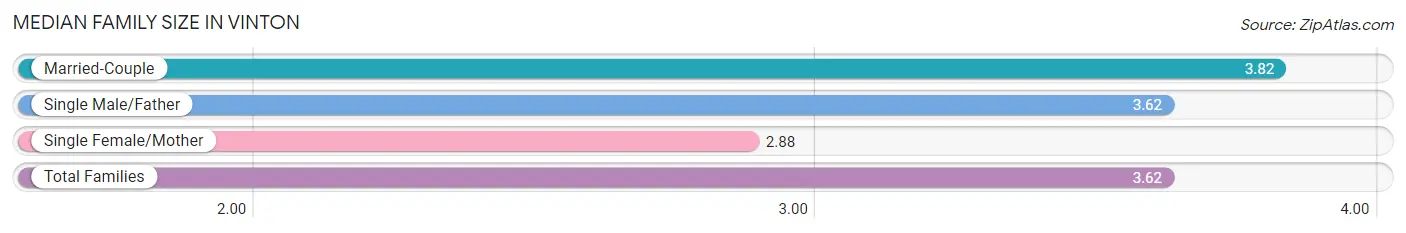
The median family size in Vinton is 3.62 persons per family, with married-couple families (332 | 74.8%) accounting for the largest median family size of 3.82 persons per family. On the other hand, single female/mother families (86 | 19.4%) represent the smallest median family size with 2.88 persons per family.
| Family Type | # Families | Family Size |
| Married-Couple | 332 (74.8%) | 3.82 |
| Single Male/Father | 26 (5.9%) | 3.62 |
| Single Female/Mother | 86 (19.4%) | 2.88 |
| Total Families | 444 (100.0%) | 3.62 |
Median Household Size in Vinton
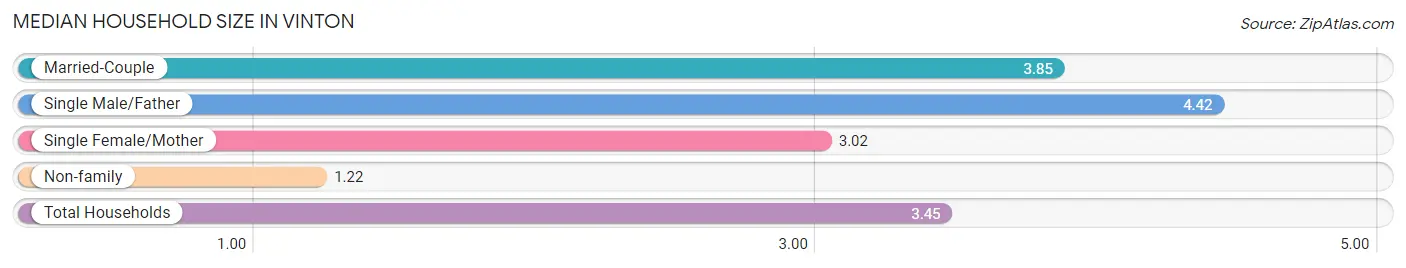
The median household size in Vinton is 3.45 persons per household, with single male/father households (26 | 5.2%) accounting for the largest median household size of 4.42 persons per household. non-family households (54 | 10.8%) represent the smallest median household size with 1.22 persons per household.
| Household Type | # Households | Household Size |
| Married-Couple | 332 (66.7%) | 3.85 |
| Single Male/Father | 26 (5.2%) | 4.42 |
| Single Female/Mother | 86 (17.3%) | 3.02 |
| Non-family | 54 (10.8%) | 1.22 |
| Total Households | 498 (100.0%) | 3.45 |
Household Size by Marriage Status in Vinton
Out of a total of 498 households in Vinton, 444 (89.2%) are family households, while 54 (10.8%) are nonfamily households. The most numerous type of family households are 2-person households, comprising 128, and the most common type of nonfamily households are 1-person households, comprising 42.
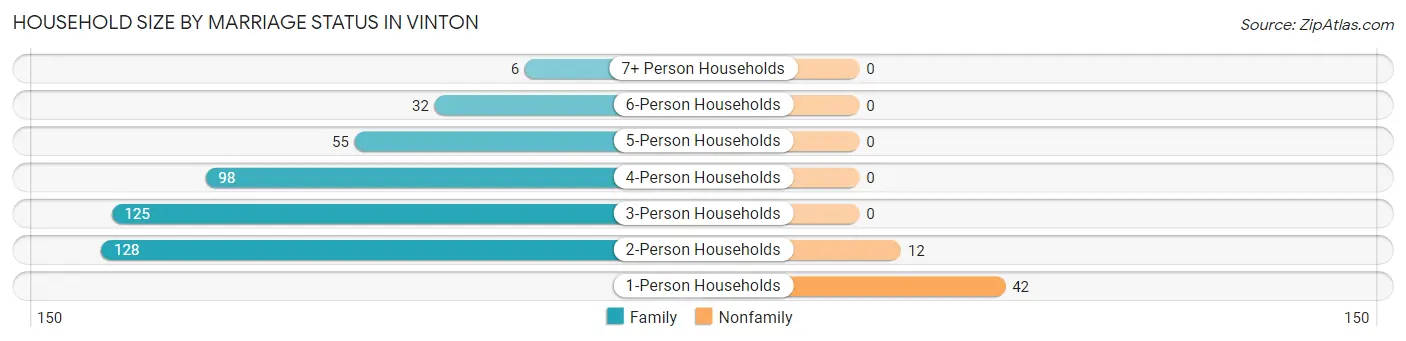
| Household Size | Family Households | Nonfamily Households |
| 1-Person Households | - | 42 (8.4%) |
| 2-Person Households | 128 (25.7%) | 12 (2.4%) |
| 3-Person Households | 125 (25.1%) | 0 (0.0%) |
| 4-Person Households | 98 (19.7%) | 0 (0.0%) |
| 5-Person Households | 55 (11.0%) | 0 (0.0%) |
| 6-Person Households | 32 (6.4%) | 0 (0.0%) |
| 7+ Person Households | 6 (1.2%) | 0 (0.0%) |
| Total | 444 (89.2%) | 54 (10.8%) |
Female Fertility in Vinton
Fertility by Age in Vinton
Average fertility rate in Vinton is 71.0 births per 1,000 women. Women in the age bracket of 20 to 34 years have the highest fertility rate with 167.0 births per 1,000 women. Women in the age bracket of 20 to 34 years acount for 100.0% of all women with births.
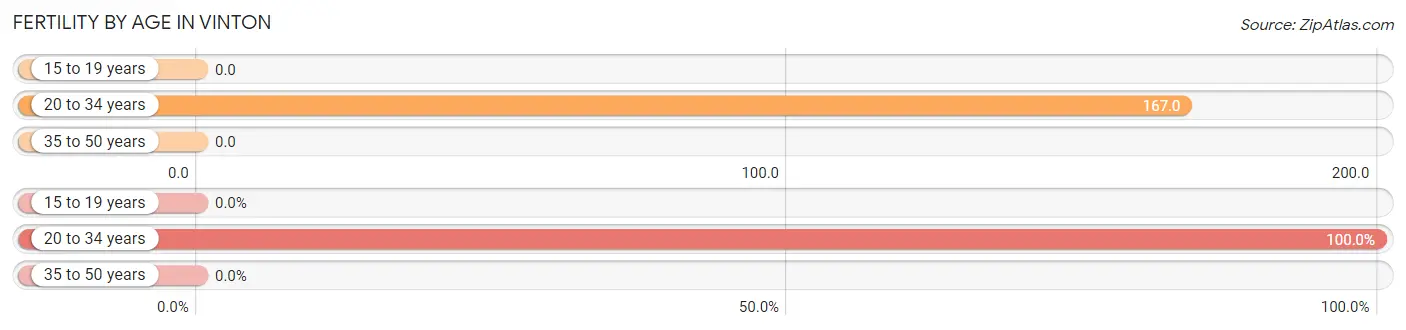
| Age Bracket | Women with Births | Births / 1,000 Women |
| 15 to 19 years | 0 (0.0%) | 0.0 |
| 20 to 34 years | 29 (100.0%) | 167.0 |
| 35 to 50 years | 0 (0.0%) | 0.0 |
| Total | 29 (100.0%) | 71.0 |
Fertility by Age by Marriage Status in Vinton
75.9% of women with births (29) in Vinton are married. The highest percentage of unmarried women with births falls into 20 to 34 years age bracket with 24.1% of them unmarried at the time of birth, while the lowest percentage of unmarried women with births belong to 20 to 34 years age bracket with 24.1% of them unmarried.
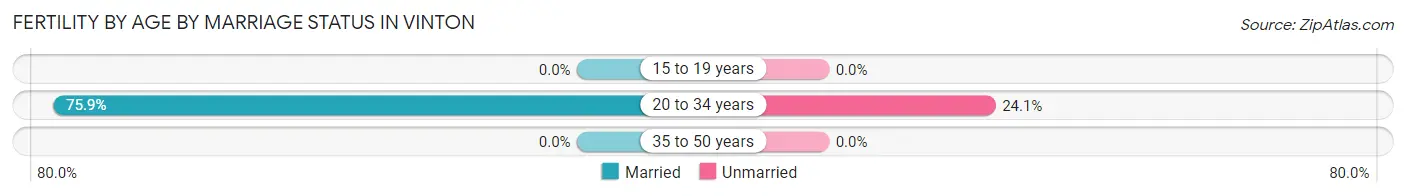
| Age Bracket | Married | Unmarried |
| 15 to 19 years | 0 (0.0%) | 0 (0.0%) |
| 20 to 34 years | 22 (75.9%) | 7 (24.1%) |
| 35 to 50 years | 0 (0.0%) | 0 (0.0%) |
| Total | 22 (75.9%) | 7 (24.1%) |
Fertility by Education in Vinton
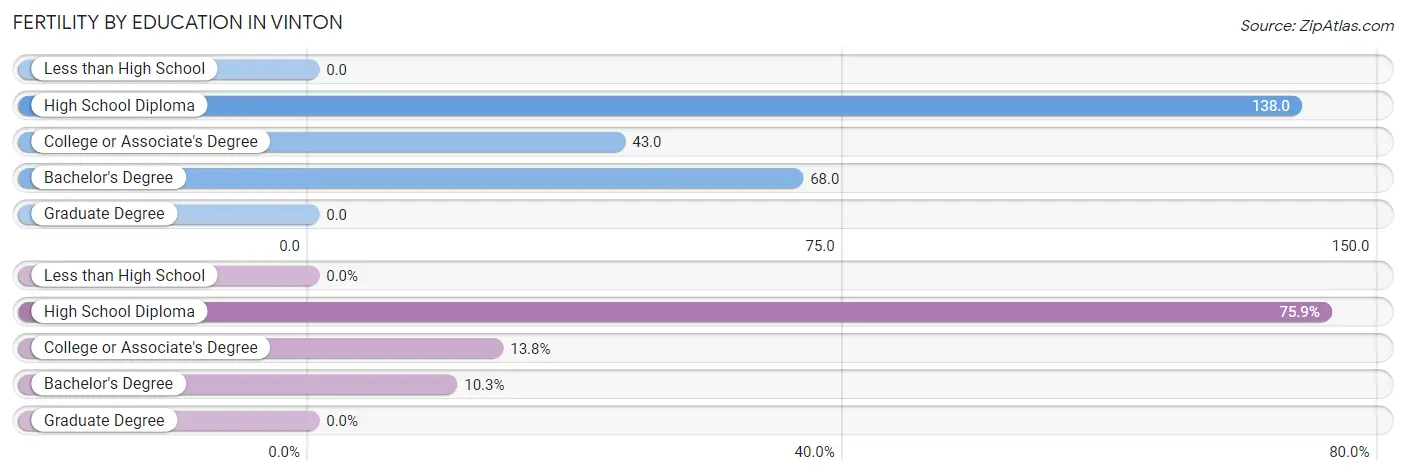
| Educational Attainment | Women with Births | Births / 1,000 Women |
| Less than High School | 0 (0.0%) | 0.0 |
| High School Diploma | 22 (75.9%) | 138.0 |
| College or Associate's Degree | 4 (13.8%) | 43.0 |
| Bachelor's Degree | 3 (10.3%) | 68.0 |
| Graduate Degree | 0 (0.0%) | 0.0 |
| Total | 29 (100.0%) | 71.0 |
Fertility by Education by Marriage Status in Vinton
24.1% of women with births in Vinton are unmarried. Women with the educational attainment of bachelor's degree are most likely to be married with 100.0% of them married at childbirth, while women with the educational attainment of college or associate's degree are least likely to be married with 100.0% of them unmarried at childbirth.
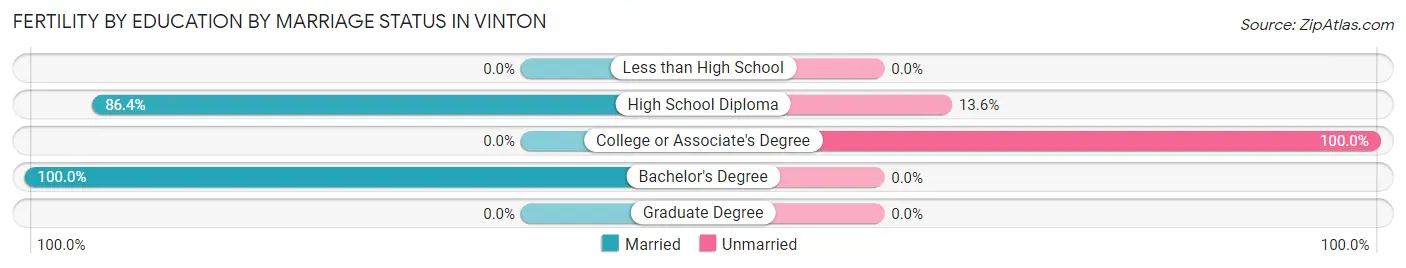
| Educational Attainment | Married | Unmarried |
| Less than High School | 0 (0.0%) | 0 (0.0%) |
| High School Diploma | 19 (86.4%) | 3 (13.6%) |
| College or Associate's Degree | 0 (0.0%) | 4 (100.0%) |
| Bachelor's Degree | 3 (100.0%) | 0 (0.0%) |
| Graduate Degree | 0 (0.0%) | 0 (0.0%) |
| Total | 22 (75.9%) | 7 (24.1%) |
Employment Characteristics in Vinton
Employment by Class of Employer in Vinton
Among the 708 employed individuals in Vinton, private company employees (525 | 74.2%), local government employees (77 | 10.9%), and not-for-profit organizations (28 | 4.0%) make up the most common classes of employment.
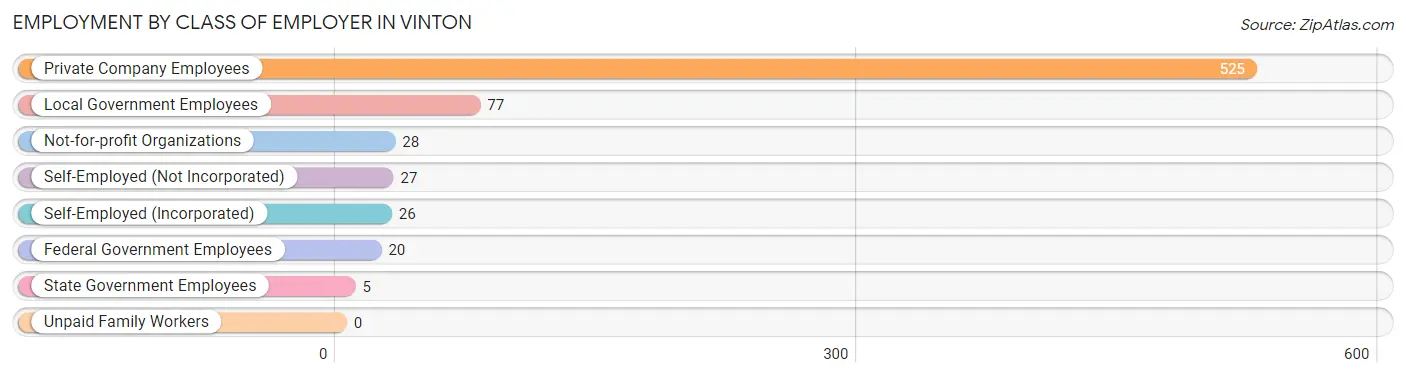
| Employer Class | # Employees | % Employees |
| Private Company Employees | 525 | 74.2% |
| Self-Employed (Incorporated) | 26 | 3.7% |
| Self-Employed (Not Incorporated) | 27 | 3.8% |
| Not-for-profit Organizations | 28 | 4.0% |
| Local Government Employees | 77 | 10.9% |
| State Government Employees | 5 | 0.7% |
| Federal Government Employees | 20 | 2.8% |
| Unpaid Family Workers | 0 | 0.0% |
| Total | 708 | 100.0% |
Employment Status by Age in Vinton
According to the labor force statistics for Vinton, out of the total population over 16 years of age (2,406), 31.7% or 763 individuals are in the labor force, with 6.4% or 49 of them unemployed. The age group with the highest labor force participation rate is 20 to 24 years, with 41.0% or 66 individuals in the labor force. Within the labor force, the 20 to 24 years age range has the highest percentage of unemployed individuals, with 42.4% or 28 of them being unemployed.
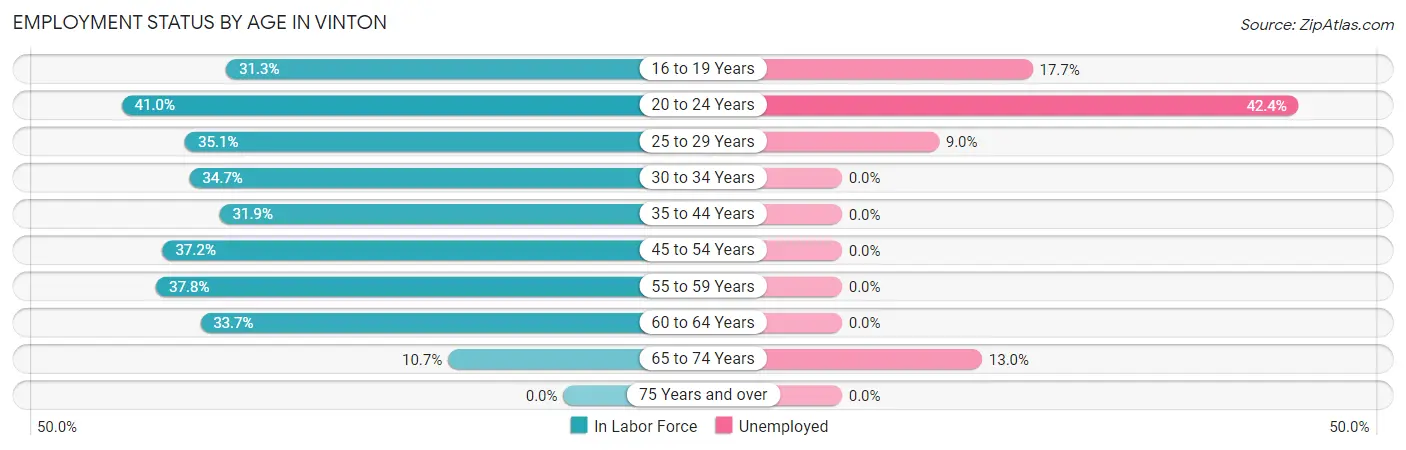
| Age Bracket | In Labor Force | Unemployed |
| 16 to 19 Years | 62 (31.3%) | 11 (17.7%) |
| 20 to 24 Years | 66 (41.0%) | 28 (42.4%) |
| 25 to 29 Years | 78 (35.1%) | 7 (9.0%) |
| 30 to 34 Years | 60 (34.7%) | 0 (0.0%) |
| 35 to 44 Years | 136 (31.9%) | 0 (0.0%) |
| 45 to 54 Years | 178 (37.2%) | 0 (0.0%) |
| 55 to 59 Years | 105 (37.8%) | 0 (0.0%) |
| 60 to 64 Years | 55 (33.7%) | 0 (0.0%) |
| 65 to 74 Years | 23 (10.7%) | 3 (13.0%) |
| 75 Years and over | 0 (0.0%) | 0 (0.0%) |
| Total | 763 (31.7%) | 49 (6.4%) |
Employment Status by Educational Attainment in Vinton
According to labor force statistics for Vinton, 35.2% of individuals (612) out of the total population between 25 and 64 years of age (1,740) are in the labor force, with 1.1% or 7 of them being unemployed. The group with the highest labor force participation rate are those with the educational attainment of bachelor's degree or higher, with 55.1% or 92 individuals in the labor force. Within the labor force, individuals with bachelor's degree or higher education have the highest percentage of unemployment, with 3.3% or 3 of them being unemployed.
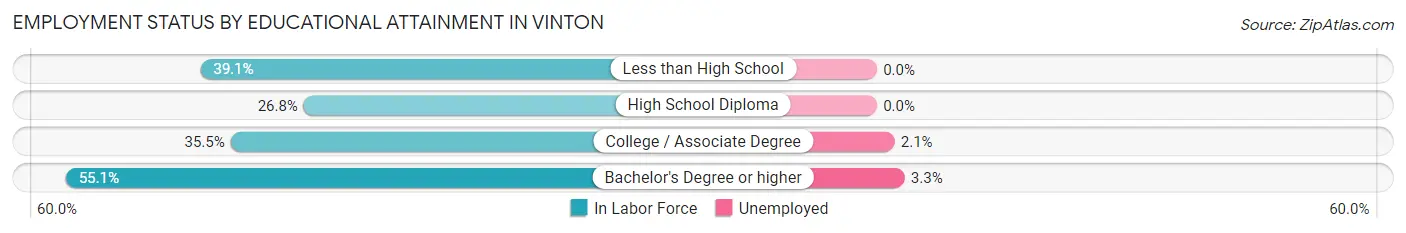
| Educational Attainment | In Labor Force | Unemployed |
| Less than High School | 161 (39.1%) | 0 (0.0%) |
| High School Diploma | 164 (26.8%) | 0 (0.0%) |
| College / Associate Degree | 195 (35.5%) | 12 (2.1%) |
| Bachelor's Degree or higher | 92 (55.1%) | 6 (3.3%) |
| Total | 612 (35.2%) | 19 (1.1%) |
Employment Occupations by Sex in Vinton
Management, Business, Science and Arts Occupations
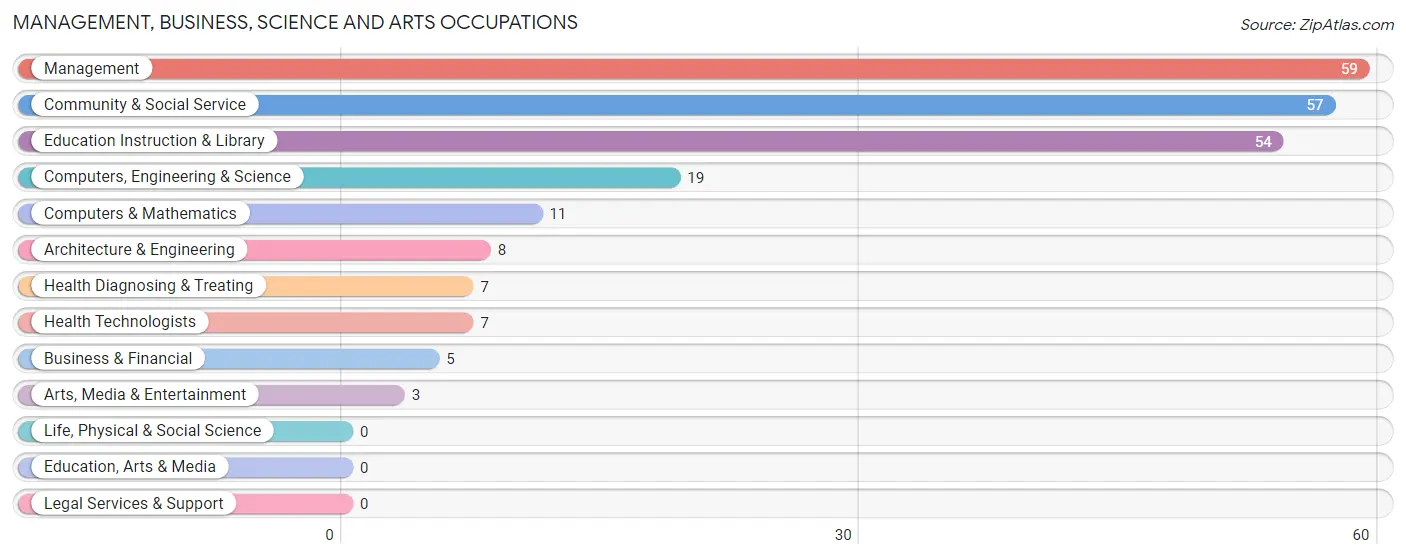
The most common Management, Business, Science and Arts occupations in Vinton are Management (59 | 8.3%), Community & Social Service (57 | 8.0%), Education Instruction & Library (54 | 7.6%), Computers, Engineering & Science (19 | 2.7%), and Computers & Mathematics (11 | 1.5%).
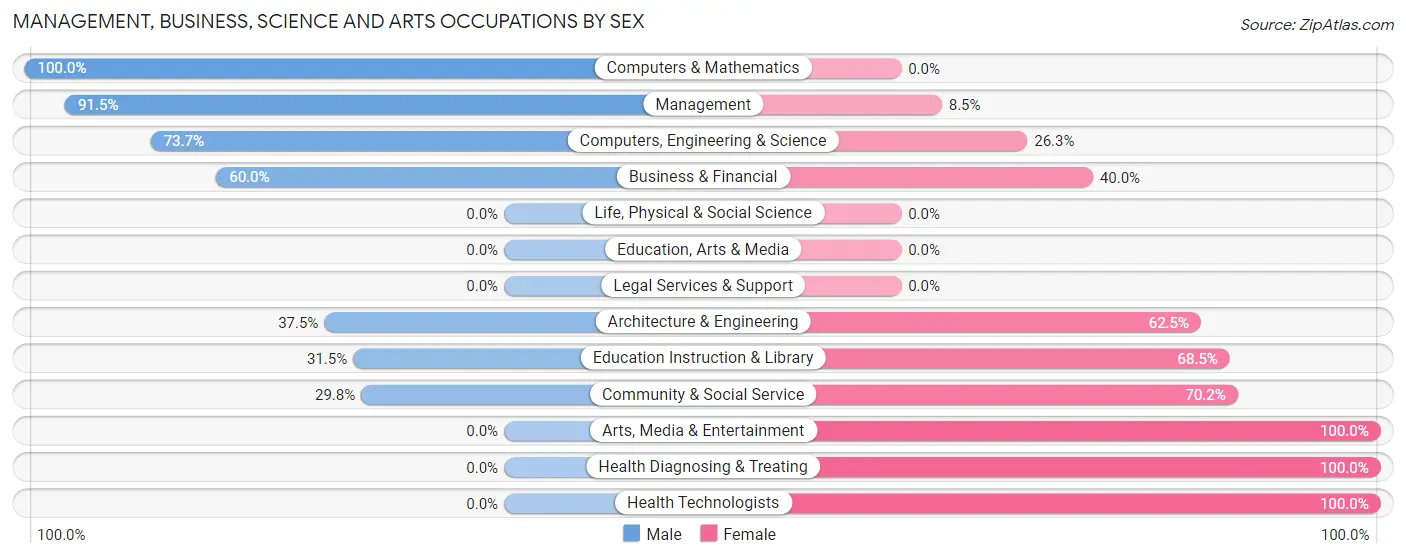
Management, Business, Science and Arts Occupations by Sex
Within the Management, Business, Science and Arts occupations in Vinton, the most male-oriented occupations are Computers & Mathematics (100.0%), Management (91.5%), and Computers, Engineering & Science (73.7%), while the most female-oriented occupations are Arts, Media & Entertainment (100.0%), Health Diagnosing & Treating (100.0%), and Health Technologists (100.0%).
| Occupation | Male | Female |
| Management | 54 (91.5%) | 5 (8.5%) |
| Business & Financial | 3 (60.0%) | 2 (40.0%) |
| Computers, Engineering & Science | 14 (73.7%) | 5 (26.3%) |
| Computers & Mathematics | 11 (100.0%) | 0 (0.0%) |
| Architecture & Engineering | 3 (37.5%) | 5 (62.5%) |
| Life, Physical & Social Science | 0 (0.0%) | 0 (0.0%) |
| Community & Social Service | 17 (29.8%) | 40 (70.2%) |
| Education, Arts & Media | 0 (0.0%) | 0 (0.0%) |
| Legal Services & Support | 0 (0.0%) | 0 (0.0%) |
| Education Instruction & Library | 17 (31.5%) | 37 (68.5%) |
| Arts, Media & Entertainment | 0 (0.0%) | 3 (100.0%) |
| Health Diagnosing & Treating | 0 (0.0%) | 7 (100.0%) |
| Health Technologists | 0 (0.0%) | 7 (100.0%) |
| Total (Category) | 88 (59.9%) | 59 (40.1%) |
| Total (Overall) | 424 (59.4%) | 290 (40.6%) |
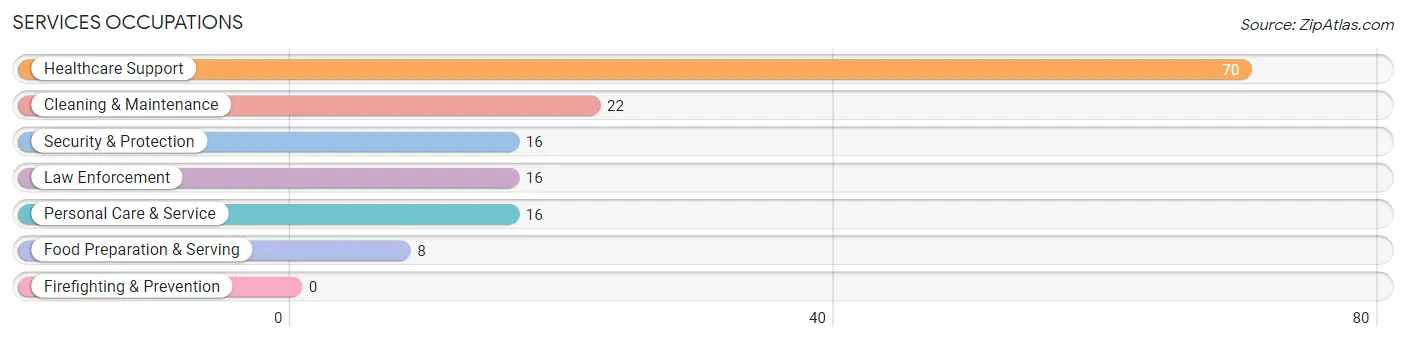
Services Occupations
The most common Services occupations in Vinton are Healthcare Support (70 | 9.8%), Cleaning & Maintenance (22 | 3.1%), Security & Protection (16 | 2.2%), Law Enforcement (16 | 2.2%), and Personal Care & Service (16 | 2.2%).
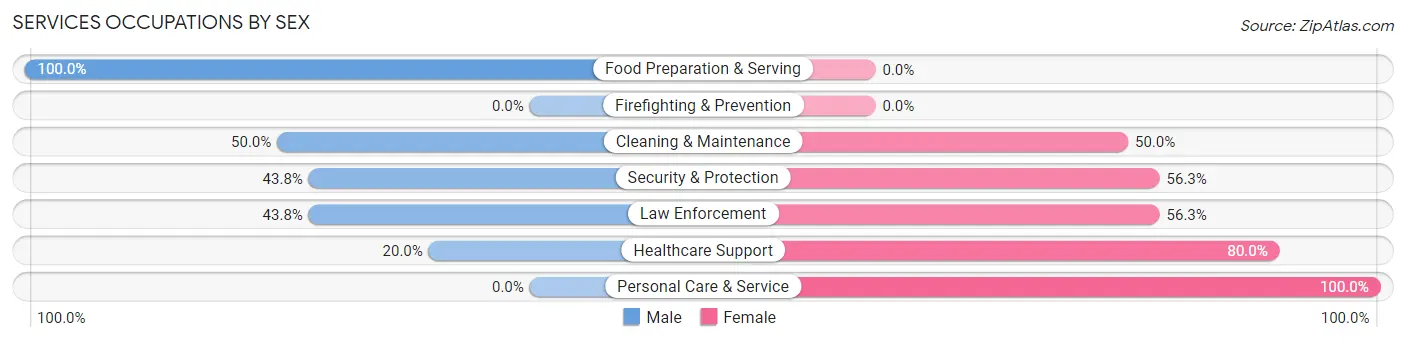
Services Occupations by Sex
Within the Services occupations in Vinton, the most male-oriented occupations are Food Preparation & Serving (100.0%), Cleaning & Maintenance (50.0%), and Security & Protection (43.8%), while the most female-oriented occupations are Personal Care & Service (100.0%), Healthcare Support (80.0%), and Security & Protection (56.2%).
| Occupation | Male | Female |
| Healthcare Support | 14 (20.0%) | 56 (80.0%) |
| Security & Protection | 7 (43.8%) | 9 (56.2%) |
| Firefighting & Prevention | 0 (0.0%) | 0 (0.0%) |
| Law Enforcement | 7 (43.8%) | 9 (56.2%) |
| Food Preparation & Serving | 8 (100.0%) | 0 (0.0%) |
| Cleaning & Maintenance | 11 (50.0%) | 11 (50.0%) |
| Personal Care & Service | 0 (0.0%) | 16 (100.0%) |
| Total (Category) | 40 (30.3%) | 92 (69.7%) |
| Total (Overall) | 424 (59.4%) | 290 (40.6%) |
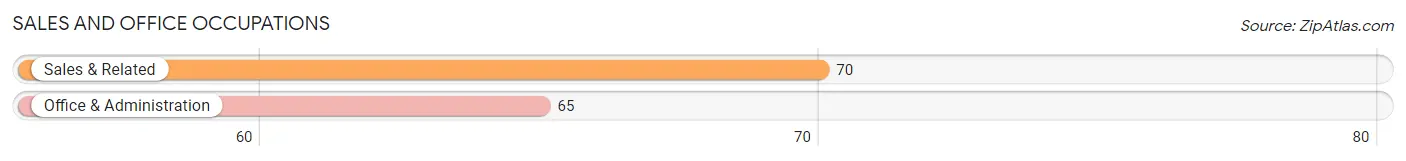
Sales and Office Occupations
The most common Sales and Office occupations in Vinton are Sales & Related (70 | 9.8%), and Office & Administration (65 | 9.1%).
Sales and Office Occupations by Sex
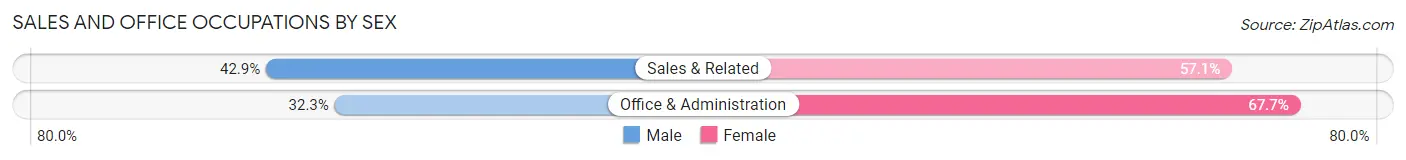
| Occupation | Male | Female |
| Sales & Related | 30 (42.9%) | 40 (57.1%) |
| Office & Administration | 21 (32.3%) | 44 (67.7%) |
| Total (Category) | 51 (37.8%) | 84 (62.2%) |
| Total (Overall) | 424 (59.4%) | 290 (40.6%) |
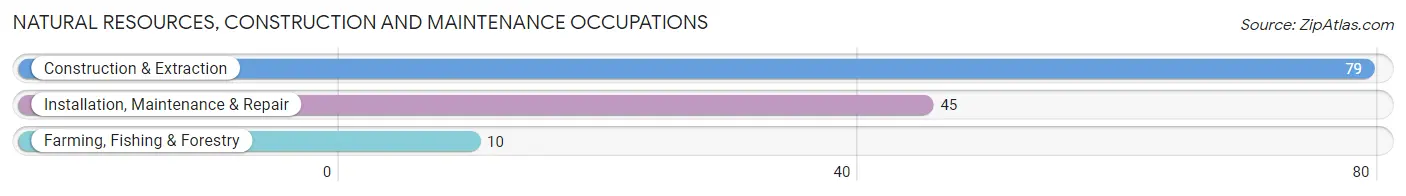
Natural Resources, Construction and Maintenance Occupations
The most common Natural Resources, Construction and Maintenance occupations in Vinton are Construction & Extraction (79 | 11.1%), Installation, Maintenance & Repair (45 | 6.3%), and Farming, Fishing & Forestry (10 | 1.4%).
Natural Resources, Construction and Maintenance Occupations by Sex
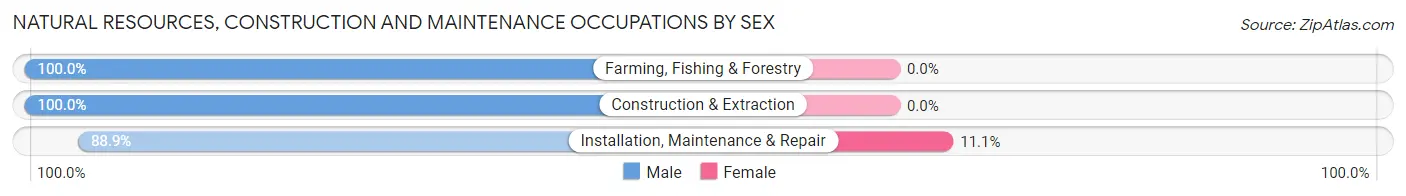
| Occupation | Male | Female |
| Farming, Fishing & Forestry | 10 (100.0%) | 0 (0.0%) |
| Construction & Extraction | 79 (100.0%) | 0 (0.0%) |
| Installation, Maintenance & Repair | 40 (88.9%) | 5 (11.1%) |
| Total (Category) | 129 (96.3%) | 5 (3.7%) |
| Total (Overall) | 424 (59.4%) | 290 (40.6%) |
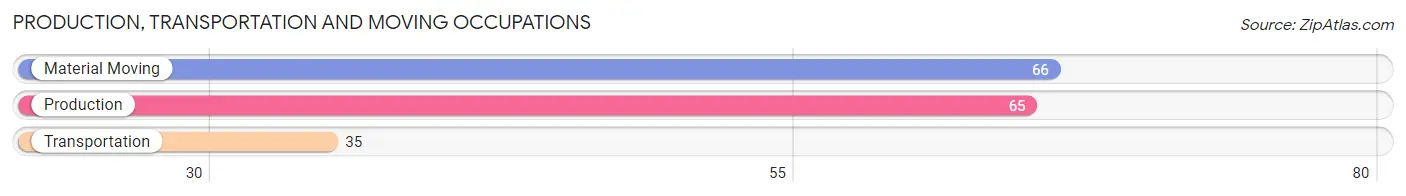
Production, Transportation and Moving Occupations
The most common Production, Transportation and Moving occupations in Vinton are Material Moving (66 | 9.2%), Production (65 | 9.1%), and Transportation (35 | 4.9%).
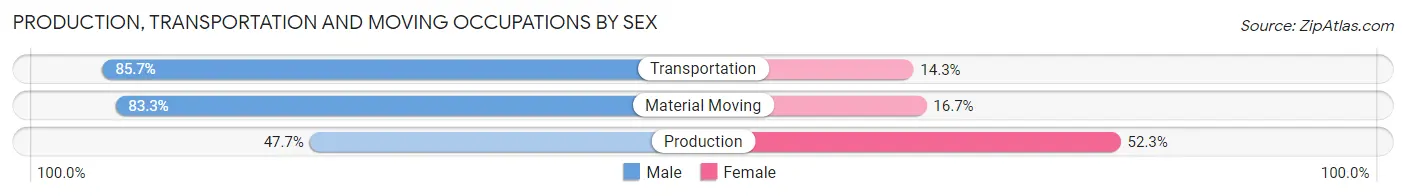
Production, Transportation and Moving Occupations by Sex
| Occupation | Male | Female |
| Production | 31 (47.7%) | 34 (52.3%) |
| Transportation | 30 (85.7%) | 5 (14.3%) |
| Material Moving | 55 (83.3%) | 11 (16.7%) |
| Total (Category) | 116 (69.9%) | 50 (30.1%) |
| Total (Overall) | 424 (59.4%) | 290 (40.6%) |
Employment Industries by Sex in Vinton
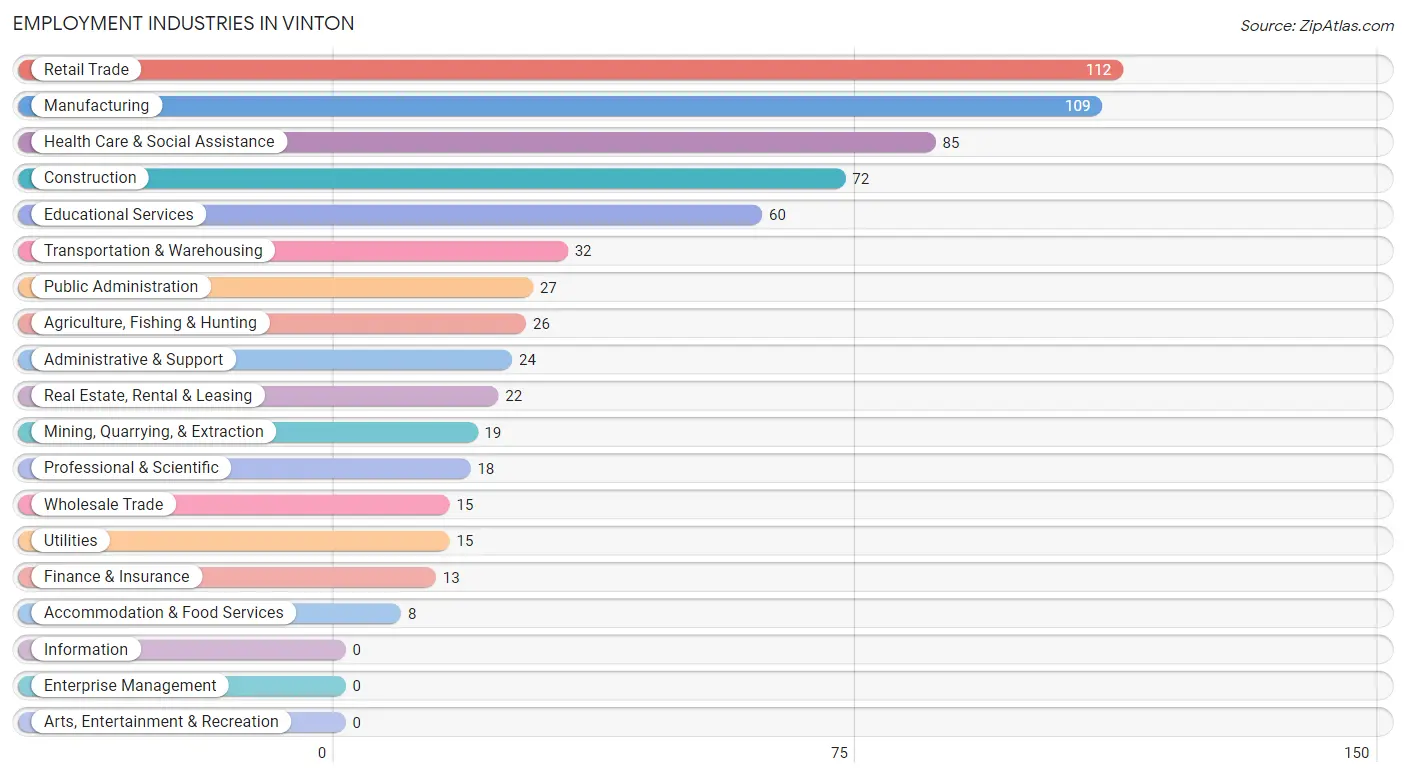
Employment Industries in Vinton
The major employment industries in Vinton include Retail Trade (112 | 15.7%), Manufacturing (109 | 15.3%), Health Care & Social Assistance (85 | 11.9%), Construction (72 | 10.1%), and Educational Services (60 | 8.4%).
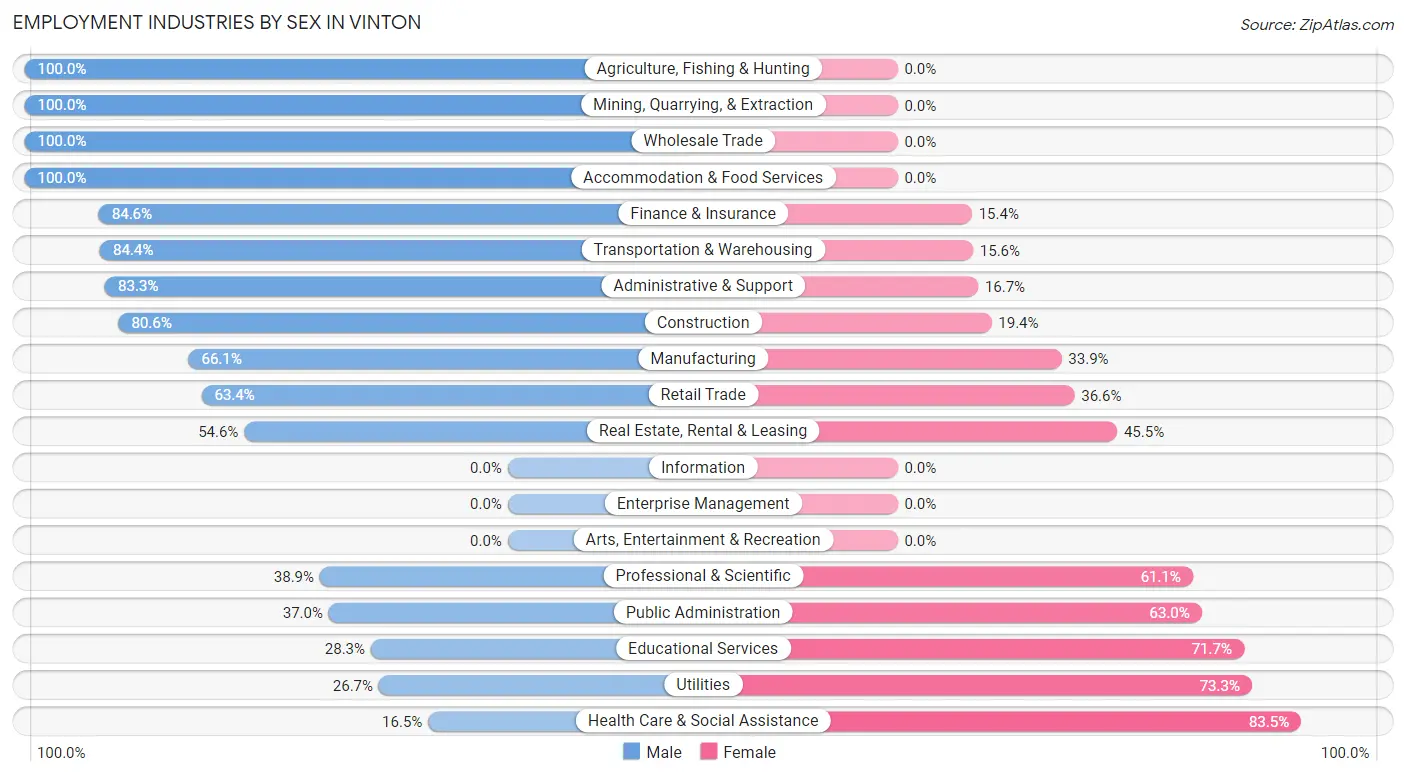
Employment Industries by Sex in Vinton
The Vinton industries that see more men than women are Agriculture, Fishing & Hunting (100.0%), Mining, Quarrying, & Extraction (100.0%), and Wholesale Trade (100.0%), whereas the industries that tend to have a higher number of women are Health Care & Social Assistance (83.5%), Utilities (73.3%), and Educational Services (71.7%).
| Industry | Male | Female |
| Agriculture, Fishing & Hunting | 26 (100.0%) | 0 (0.0%) |
| Mining, Quarrying, & Extraction | 19 (100.0%) | 0 (0.0%) |
| Construction | 58 (80.6%) | 14 (19.4%) |
| Manufacturing | 72 (66.1%) | 37 (33.9%) |
| Wholesale Trade | 15 (100.0%) | 0 (0.0%) |
| Retail Trade | 71 (63.4%) | 41 (36.6%) |
| Transportation & Warehousing | 27 (84.4%) | 5 (15.6%) |
| Utilities | 4 (26.7%) | 11 (73.3%) |
| Information | 0 (0.0%) | 0 (0.0%) |
| Finance & Insurance | 11 (84.6%) | 2 (15.4%) |
| Real Estate, Rental & Leasing | 12 (54.5%) | 10 (45.5%) |
| Professional & Scientific | 7 (38.9%) | 11 (61.1%) |
| Enterprise Management | 0 (0.0%) | 0 (0.0%) |
| Administrative & Support | 20 (83.3%) | 4 (16.7%) |
| Educational Services | 17 (28.3%) | 43 (71.7%) |
| Health Care & Social Assistance | 14 (16.5%) | 71 (83.5%) |
| Arts, Entertainment & Recreation | 0 (0.0%) | 0 (0.0%) |
| Accommodation & Food Services | 8 (100.0%) | 0 (0.0%) |
| Public Administration | 10 (37.0%) | 17 (63.0%) |
| Total | 424 (59.4%) | 290 (40.6%) |
Education in Vinton
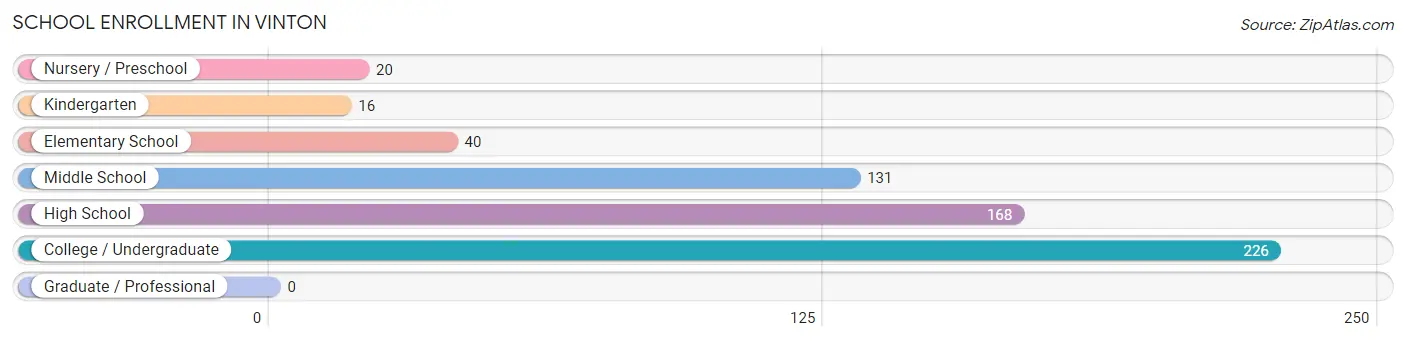
School Enrollment in Vinton
The most common levels of schooling among the 601 students in Vinton are college / undergraduate (226 | 37.6%), high school (168 | 28.0%), and middle school (131 | 21.8%).
| School Level | # Students | % Students |
| Nursery / Preschool | 20 | 3.3% |
| Kindergarten | 16 | 2.7% |
| Elementary School | 40 | 6.7% |
| Middle School | 131 | 21.8% |
| High School | 168 | 28.0% |
| College / Undergraduate | 226 | 37.6% |
| Graduate / Professional | 0 | 0.0% |
| Total | 601 | 100.0% |
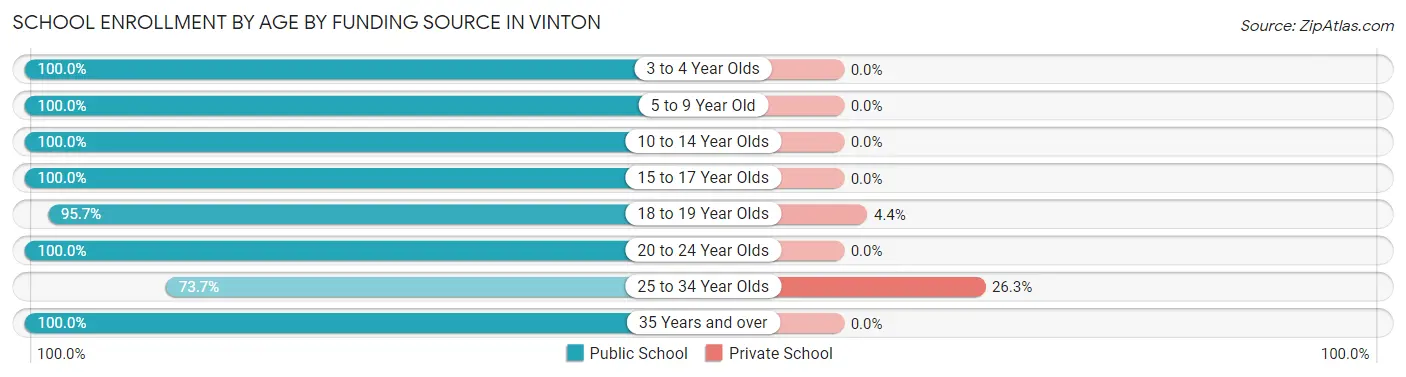
School Enrollment by Age by Funding Source in Vinton
Out of a total of 601 students who are enrolled in schools in Vinton, 14 (2.3%) attend a private institution, while the remaining 587 (97.7%) are enrolled in public schools. The age group of 25 to 34 year olds has the highest likelihood of being enrolled in private schools, with 10 (26.3% in the age bracket) enrolled. Conversely, the age group of 3 to 4 year olds has the lowest likelihood of being enrolled in a private school, with 20 (100.0% in the age bracket) attending a public institution.
| Age Bracket | Public School | Private School |
| 3 to 4 Year Olds | 20 (100.0%) | 0 (0.0%) |
| 5 to 9 Year Old | 68 (100.0%) | 0 (0.0%) |
| 10 to 14 Year Olds | 134 (100.0%) | 0 (0.0%) |
| 15 to 17 Year Olds | 75 (100.0%) | 0 (0.0%) |
| 18 to 19 Year Olds | 88 (95.7%) | 4 (4.3%) |
| 20 to 24 Year Olds | 74 (100.0%) | 0 (0.0%) |
| 25 to 34 Year Olds | 28 (73.7%) | 10 (26.3%) |
| 35 Years and over | 100 (100.0%) | 0 (0.0%) |
| Total | 587 (97.7%) | 14 (2.3%) |
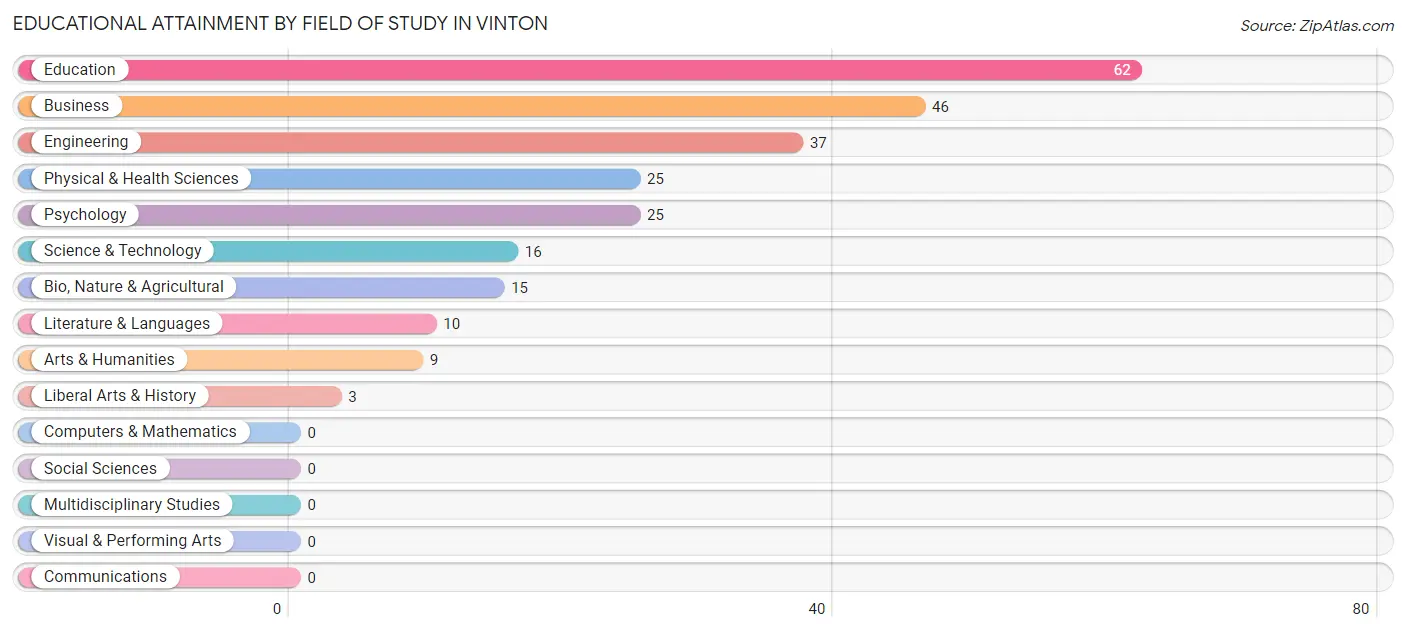
Educational Attainment by Field of Study in Vinton
Education (62 | 25.0%), business (46 | 18.5%), engineering (37 | 14.9%), physical & health sciences (25 | 10.1%), and psychology (25 | 10.1%) are the most common fields of study among 248 individuals in Vinton who have obtained a bachelor's degree or higher.
| Field of Study | # Graduates | % Graduates |
| Computers & Mathematics | 0 | 0.0% |
| Bio, Nature & Agricultural | 15 | 6.0% |
| Physical & Health Sciences | 25 | 10.1% |
| Psychology | 25 | 10.1% |
| Social Sciences | 0 | 0.0% |
| Engineering | 37 | 14.9% |
| Multidisciplinary Studies | 0 | 0.0% |
| Science & Technology | 16 | 6.5% |
| Business | 46 | 18.5% |
| Education | 62 | 25.0% |
| Literature & Languages | 10 | 4.0% |
| Liberal Arts & History | 3 | 1.2% |
| Visual & Performing Arts | 0 | 0.0% |
| Communications | 0 | 0.0% |
| Arts & Humanities | 9 | 3.6% |
| Total | 248 | 100.0% |
Transportation & Commute in Vinton
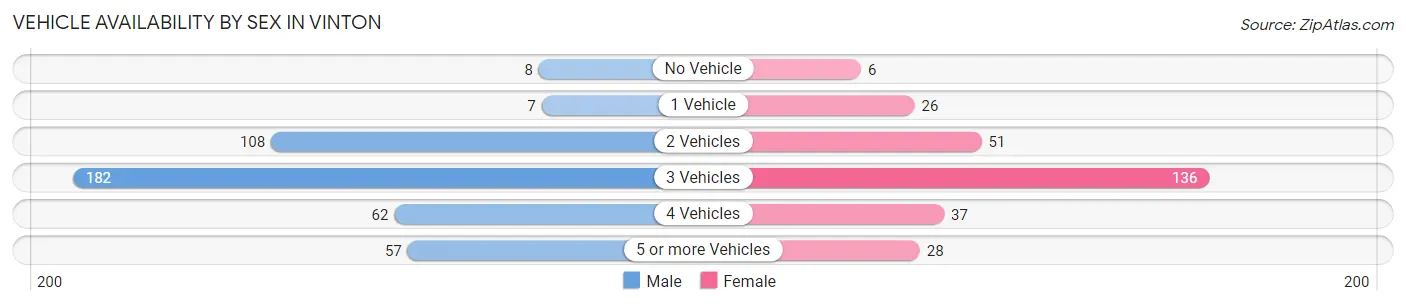
Vehicle Availability by Sex in Vinton
The most prevalent vehicle ownership categories in Vinton are males with 3 vehicles (182, accounting for 42.9%) and females with 3 vehicles (136, making up 64.1%).
| Vehicles Available | Male | Female |
| No Vehicle | 8 (1.9%) | 6 (2.1%) |
| 1 Vehicle | 7 (1.7%) | 26 (9.1%) |
| 2 Vehicles | 108 (25.5%) | 51 (18.0%) |
| 3 Vehicles | 182 (42.9%) | 136 (47.9%) |
| 4 Vehicles | 62 (14.6%) | 37 (13.0%) |
| 5 or more Vehicles | 57 (13.4%) | 28 (9.9%) |
| Total | 424 (100.0%) | 284 (100.0%) |
Commute Time in Vinton
The most frequently occuring commute durations in Vinton are 15 to 19 minutes (133 commuters, 19.4%), 10 to 14 minutes (130 commuters, 18.9%), and 20 to 24 minutes (95 commuters, 13.8%).
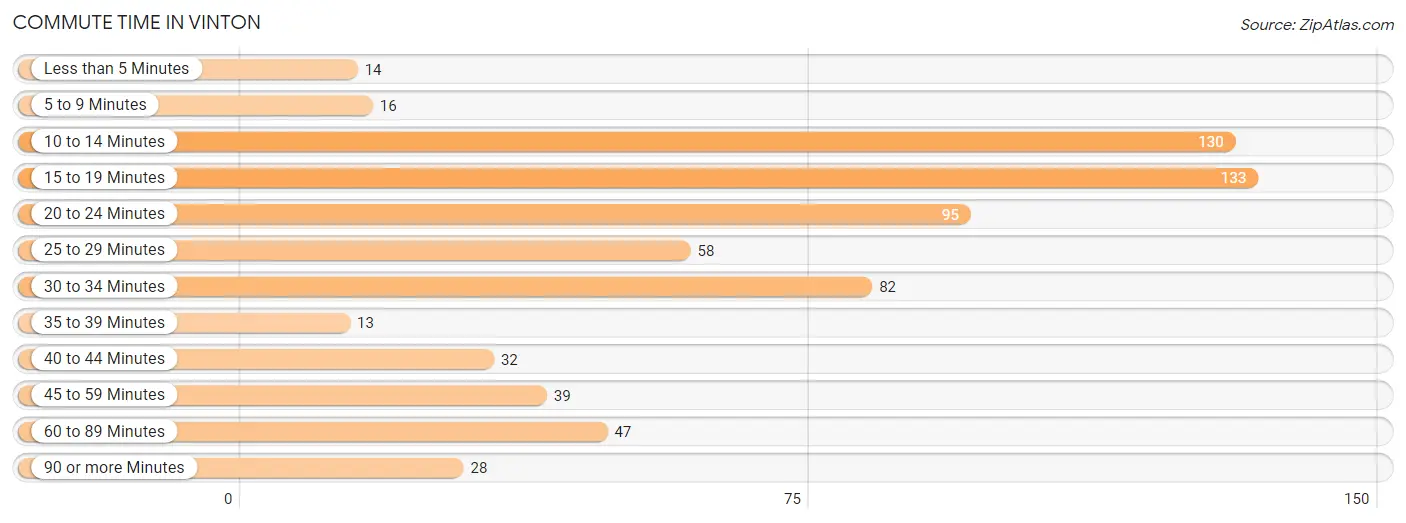
| Commute Time | # Commuters | % Commuters |
| Less than 5 Minutes | 14 | 2.0% |
| 5 to 9 Minutes | 16 | 2.3% |
| 10 to 14 Minutes | 130 | 18.9% |
| 15 to 19 Minutes | 133 | 19.4% |
| 20 to 24 Minutes | 95 | 13.8% |
| 25 to 29 Minutes | 58 | 8.4% |
| 30 to 34 Minutes | 82 | 11.9% |
| 35 to 39 Minutes | 13 | 1.9% |
| 40 to 44 Minutes | 32 | 4.7% |
| 45 to 59 Minutes | 39 | 5.7% |
| 60 to 89 Minutes | 47 | 6.8% |
| 90 or more Minutes | 28 | 4.1% |
Commute Time by Sex in Vinton
The most common commute times in Vinton are 15 to 19 minutes (72 commuters, 17.5%) for males and 10 to 14 minutes (80 commuters, 29.1%) for females.
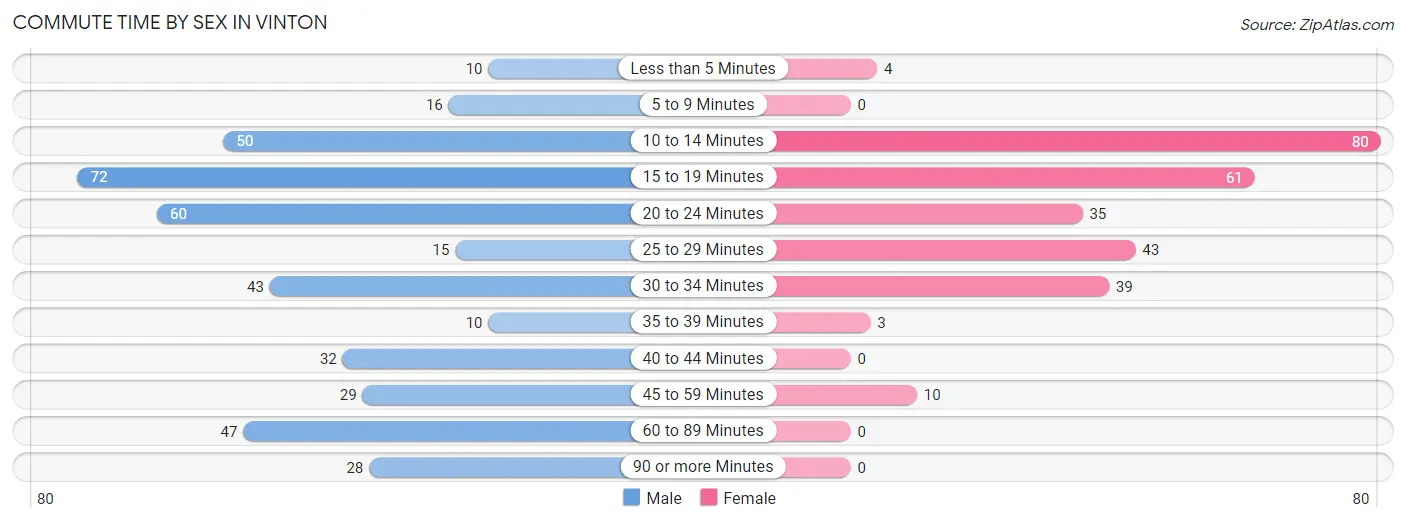
| Commute Time | Male | Female |
| Less than 5 Minutes | 10 (2.4%) | 4 (1.5%) |
| 5 to 9 Minutes | 16 (3.9%) | 0 (0.0%) |
| 10 to 14 Minutes | 50 (12.1%) | 80 (29.1%) |
| 15 to 19 Minutes | 72 (17.5%) | 61 (22.2%) |
| 20 to 24 Minutes | 60 (14.6%) | 35 (12.7%) |
| 25 to 29 Minutes | 15 (3.6%) | 43 (15.6%) |
| 30 to 34 Minutes | 43 (10.4%) | 39 (14.2%) |
| 35 to 39 Minutes | 10 (2.4%) | 3 (1.1%) |
| 40 to 44 Minutes | 32 (7.8%) | 0 (0.0%) |
| 45 to 59 Minutes | 29 (7.0%) | 10 (3.6%) |
| 60 to 89 Minutes | 47 (11.4%) | 0 (0.0%) |
| 90 or more Minutes | 28 (6.8%) | 0 (0.0%) |
Time of Departure to Work by Sex in Vinton
The most frequent times of departure to work in Vinton are 7:00 AM to 7:29 AM (98, 23.8%) for males and 9:00 AM to 9:59 AM (46, 16.7%) for females.
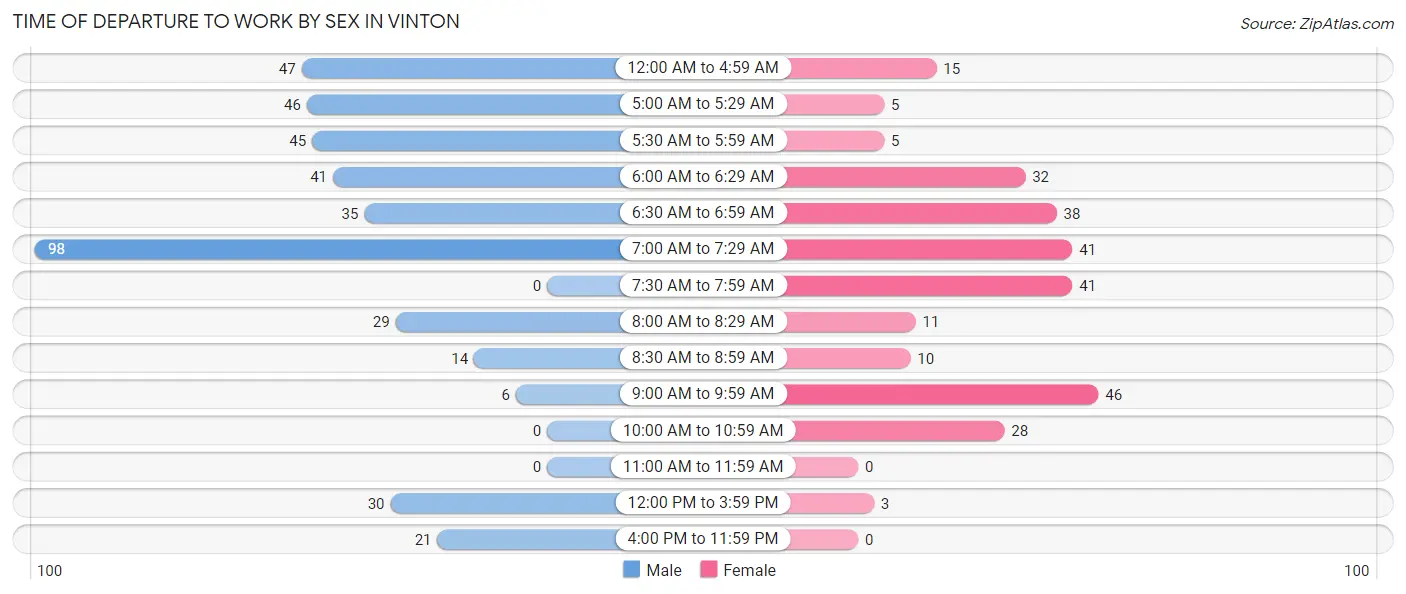
| Time of Departure | Male | Female |
| 12:00 AM to 4:59 AM | 47 (11.4%) | 15 (5.4%) |
| 5:00 AM to 5:29 AM | 46 (11.2%) | 5 (1.8%) |
| 5:30 AM to 5:59 AM | 45 (10.9%) | 5 (1.8%) |
| 6:00 AM to 6:29 AM | 41 (10.0%) | 32 (11.6%) |
| 6:30 AM to 6:59 AM | 35 (8.5%) | 38 (13.8%) |
| 7:00 AM to 7:29 AM | 98 (23.8%) | 41 (14.9%) |
| 7:30 AM to 7:59 AM | 0 (0.0%) | 41 (14.9%) |
| 8:00 AM to 8:29 AM | 29 (7.0%) | 11 (4.0%) |
| 8:30 AM to 8:59 AM | 14 (3.4%) | 10 (3.6%) |
| 9:00 AM to 9:59 AM | 6 (1.5%) | 46 (16.7%) |
| 10:00 AM to 10:59 AM | 0 (0.0%) | 28 (10.2%) |
| 11:00 AM to 11:59 AM | 0 (0.0%) | 0 (0.0%) |
| 12:00 PM to 3:59 PM | 30 (7.3%) | 3 (1.1%) |
| 4:00 PM to 11:59 PM | 21 (5.1%) | 0 (0.0%) |
| Total | 412 (100.0%) | 275 (100.0%) |
Housing Occupancy in Vinton
Occupancy by Ownership in Vinton
Of the total 498 dwellings in Vinton, owner-occupied units account for 428 (85.9%), while renter-occupied units make up 70 (14.1%).
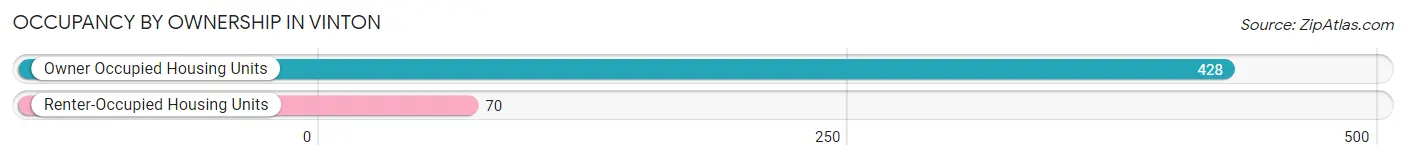
| Occupancy | # Housing Units | % Housing Units |
| Owner Occupied Housing Units | 428 | 85.9% |
| Renter-Occupied Housing Units | 70 | 14.1% |
| Total Occupied Housing Units | 498 | 100.0% |
Occupancy by Household Size in Vinton
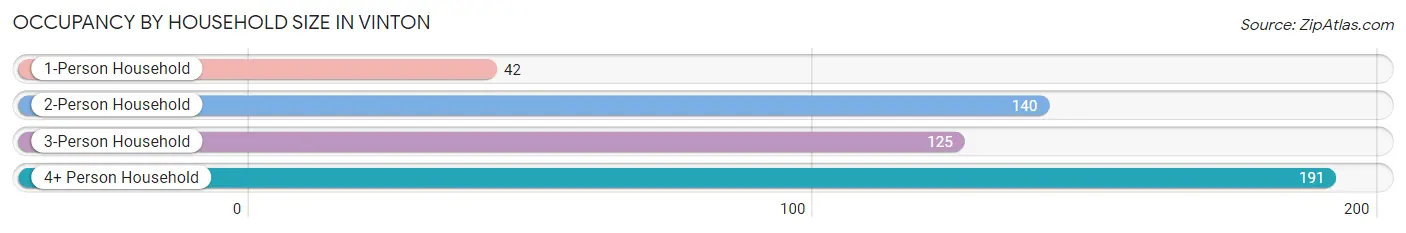
| Household Size | # Housing Units | % Housing Units |
| 1-Person Household | 42 | 8.4% |
| 2-Person Household | 140 | 28.1% |
| 3-Person Household | 125 | 25.1% |
| 4+ Person Household | 191 | 38.4% |
| Total Housing Units | 498 | 100.0% |
Occupancy by Ownership by Household Size in Vinton
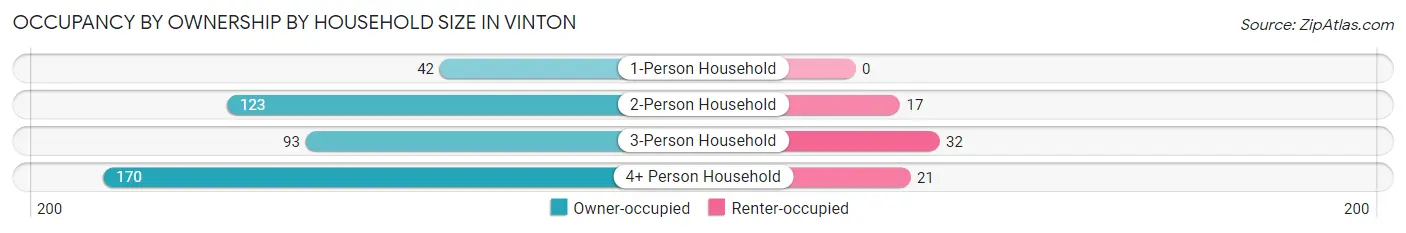
| Household Size | Owner-occupied | Renter-occupied |
| 1-Person Household | 42 (100.0%) | 0 (0.0%) |
| 2-Person Household | 123 (87.9%) | 17 (12.1%) |
| 3-Person Household | 93 (74.4%) | 32 (25.6%) |
| 4+ Person Household | 170 (89.0%) | 21 (11.0%) |
| Total Housing Units | 428 (85.9%) | 70 (14.1%) |
Occupancy by Educational Attainment in Vinton
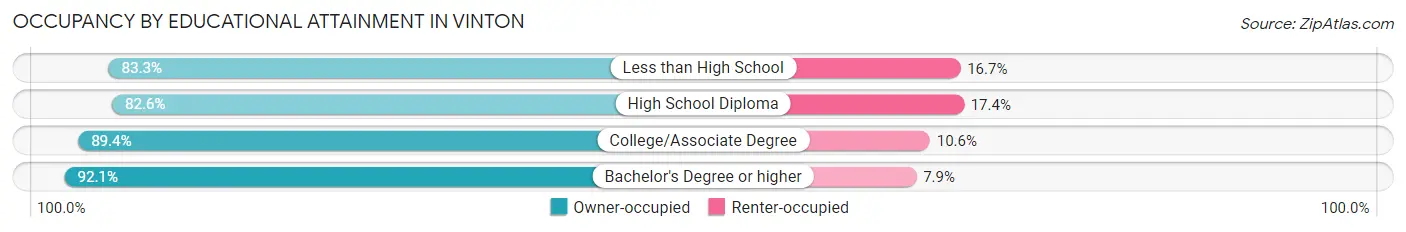
| Household Size | Owner-occupied | Renter-occupied |
| Less than High School | 125 (83.3%) | 25 (16.7%) |
| High School Diploma | 119 (82.6%) | 25 (17.4%) |
| College/Associate Degree | 126 (89.4%) | 15 (10.6%) |
| Bachelor's Degree or higher | 58 (92.1%) | 5 (7.9%) |
Occupancy by Age of Householder in Vinton
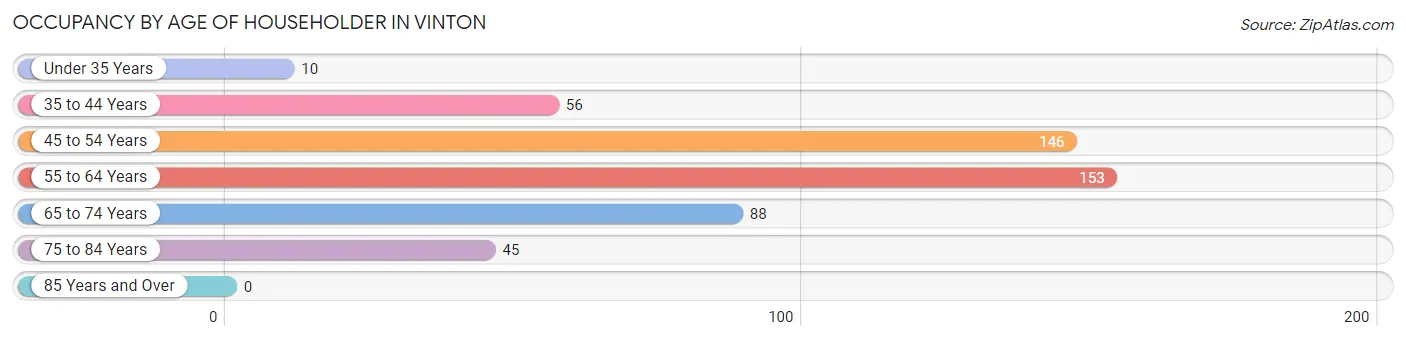
| Age Bracket | # Households | % Households |
| Under 35 Years | 10 | 2.0% |
| 35 to 44 Years | 56 | 11.2% |
| 45 to 54 Years | 146 | 29.3% |
| 55 to 64 Years | 153 | 30.7% |
| 65 to 74 Years | 88 | 17.7% |
| 75 to 84 Years | 45 | 9.0% |
| 85 Years and Over | 0 | 0.0% |
| Total | 498 | 100.0% |
Housing Finances in Vinton
Median Income by Occupancy in Vinton
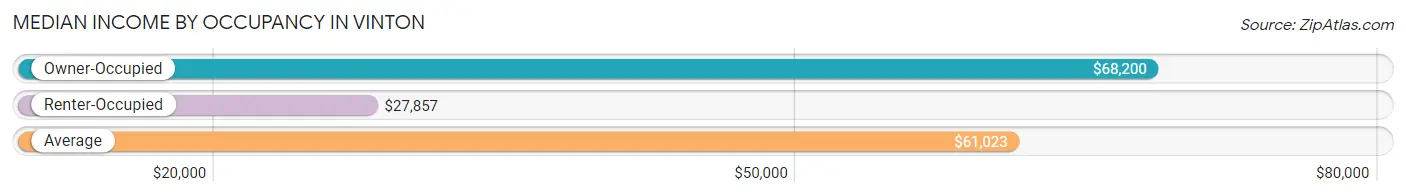
| Occupancy Type | # Households | Median Income |
| Owner-Occupied | 428 (85.9%) | $68,200 |
| Renter-Occupied | 70 (14.1%) | $27,857 |
| Average | 498 (100.0%) | $61,023 |
Occupancy by Householder Income Bracket in Vinton
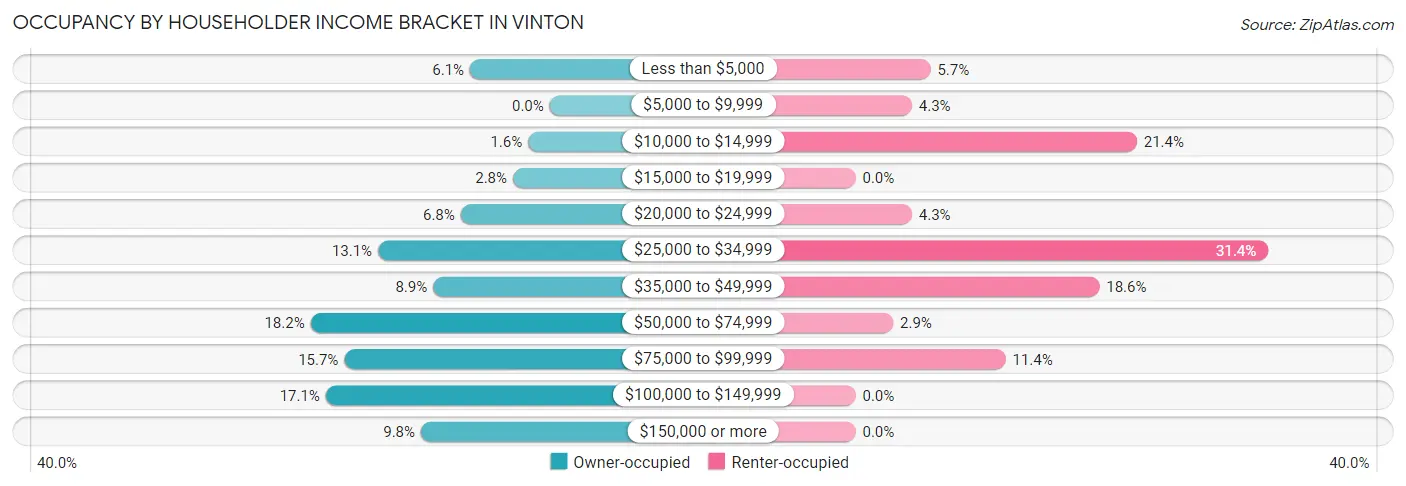
| Income Bracket | Owner-occupied | Renter-occupied |
| Less than $5,000 | 26 (6.1%) | 4 (5.7%) |
| $5,000 to $9,999 | 0 (0.0%) | 3 (4.3%) |
| $10,000 to $14,999 | 7 (1.6%) | 15 (21.4%) |
| $15,000 to $19,999 | 12 (2.8%) | 0 (0.0%) |
| $20,000 to $24,999 | 29 (6.8%) | 3 (4.3%) |
| $25,000 to $34,999 | 56 (13.1%) | 22 (31.4%) |
| $35,000 to $49,999 | 38 (8.9%) | 13 (18.6%) |
| $50,000 to $74,999 | 78 (18.2%) | 2 (2.9%) |
| $75,000 to $99,999 | 67 (15.7%) | 8 (11.4%) |
| $100,000 to $149,999 | 73 (17.1%) | 0 (0.0%) |
| $150,000 or more | 42 (9.8%) | 0 (0.0%) |
| Total | 428 (100.0%) | 70 (100.0%) |
Monthly Housing Cost Tiers in Vinton
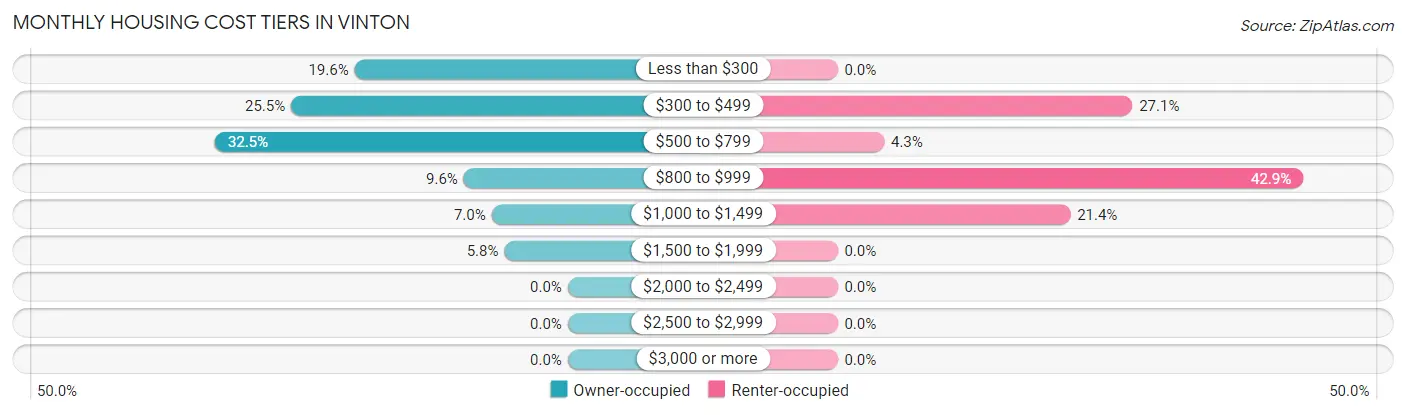
| Monthly Cost | Owner-occupied | Renter-occupied |
| Less than $300 | 84 (19.6%) | 0 (0.0%) |
| $300 to $499 | 109 (25.5%) | 19 (27.1%) |
| $500 to $799 | 139 (32.5%) | 3 (4.3%) |
| $800 to $999 | 41 (9.6%) | 30 (42.9%) |
| $1,000 to $1,499 | 30 (7.0%) | 15 (21.4%) |
| $1,500 to $1,999 | 25 (5.8%) | 0 (0.0%) |
| $2,000 to $2,499 | 0 (0.0%) | 0 (0.0%) |
| $2,500 to $2,999 | 0 (0.0%) | 0 (0.0%) |
| $3,000 or more | 0 (0.0%) | 0 (0.0%) |
| Total | 428 (100.0%) | 70 (100.0%) |
Physical Housing Characteristics in Vinton
Housing Structures in Vinton
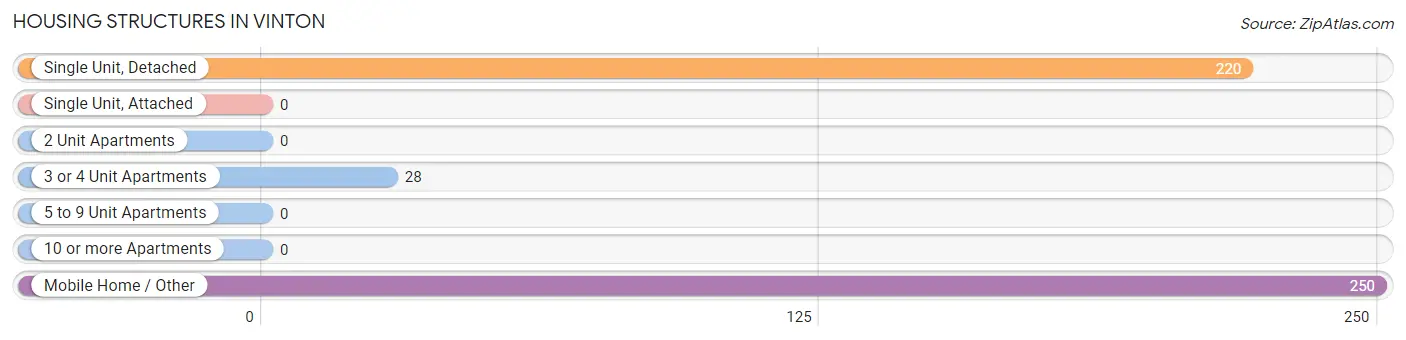
| Structure Type | # Housing Units | % Housing Units |
| Single Unit, Detached | 220 | 44.2% |
| Single Unit, Attached | 0 | 0.0% |
| 2 Unit Apartments | 0 | 0.0% |
| 3 or 4 Unit Apartments | 28 | 5.6% |
| 5 to 9 Unit Apartments | 0 | 0.0% |
| 10 or more Apartments | 0 | 0.0% |
| Mobile Home / Other | 250 | 50.2% |
| Total | 498 | 100.0% |
Housing Structures by Occupancy in Vinton
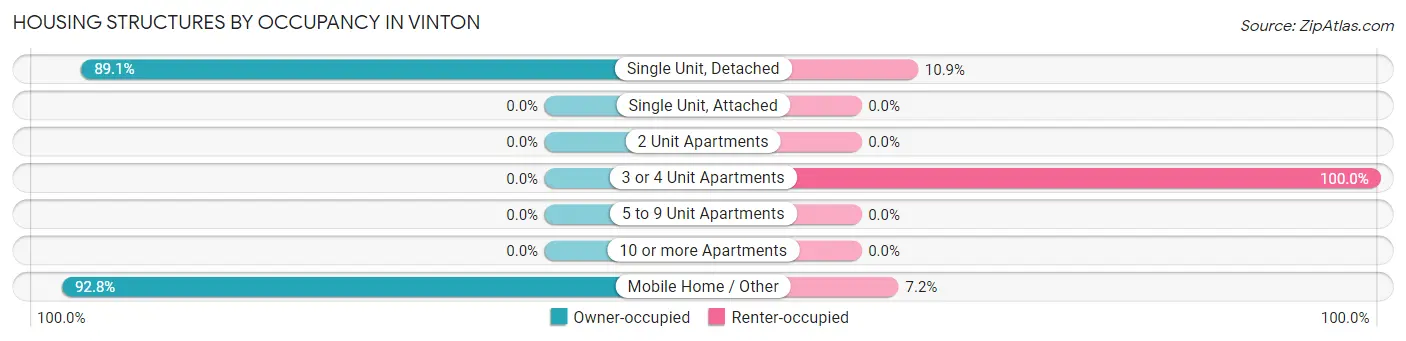
| Structure Type | Owner-occupied | Renter-occupied |
| Single Unit, Detached | 196 (89.1%) | 24 (10.9%) |
| Single Unit, Attached | 0 (0.0%) | 0 (0.0%) |
| 2 Unit Apartments | 0 (0.0%) | 0 (0.0%) |
| 3 or 4 Unit Apartments | 0 (0.0%) | 28 (100.0%) |
| 5 to 9 Unit Apartments | 0 (0.0%) | 0 (0.0%) |
| 10 or more Apartments | 0 (0.0%) | 0 (0.0%) |
| Mobile Home / Other | 232 (92.8%) | 18 (7.2%) |
| Total | 428 (85.9%) | 70 (14.1%) |
Housing Structures by Number of Rooms in Vinton
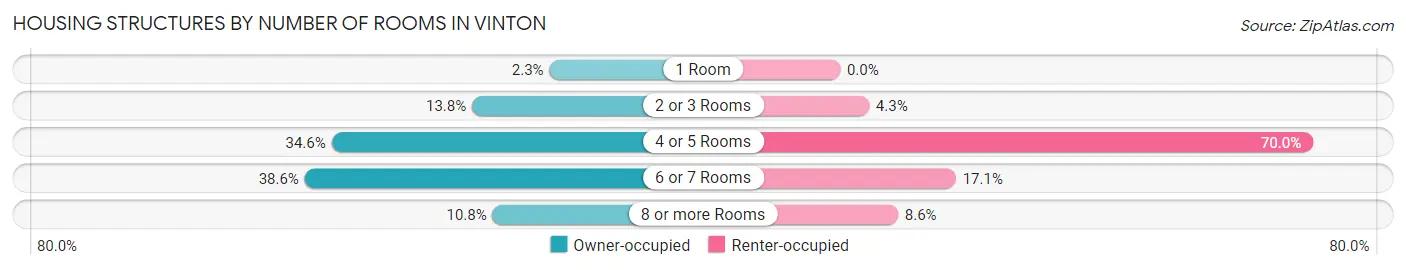
| Number of Rooms | Owner-occupied | Renter-occupied |
| 1 Room | 10 (2.3%) | 0 (0.0%) |
| 2 or 3 Rooms | 59 (13.8%) | 3 (4.3%) |
| 4 or 5 Rooms | 148 (34.6%) | 49 (70.0%) |
| 6 or 7 Rooms | 165 (38.6%) | 12 (17.1%) |
| 8 or more Rooms | 46 (10.7%) | 6 (8.6%) |
| Total | 428 (100.0%) | 70 (100.0%) |
Housing Structure by Heating Type in Vinton
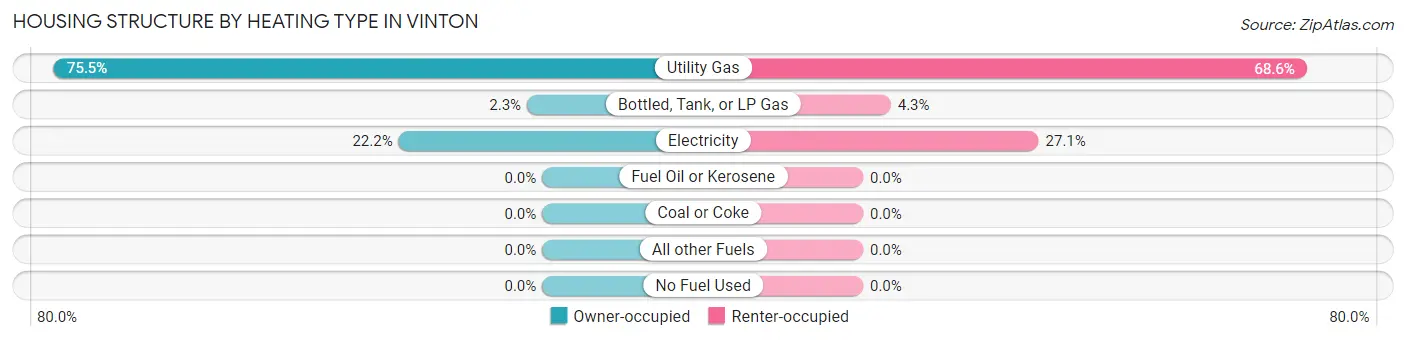
| Heating Type | Owner-occupied | Renter-occupied |
| Utility Gas | 323 (75.5%) | 48 (68.6%) |
| Bottled, Tank, or LP Gas | 10 (2.3%) | 3 (4.3%) |
| Electricity | 95 (22.2%) | 19 (27.1%) |
| Fuel Oil or Kerosene | 0 (0.0%) | 0 (0.0%) |
| Coal or Coke | 0 (0.0%) | 0 (0.0%) |
| All other Fuels | 0 (0.0%) | 0 (0.0%) |
| No Fuel Used | 0 (0.0%) | 0 (0.0%) |
| Total | 428 (100.0%) | 70 (100.0%) |
Household Vehicle Usage in Vinton
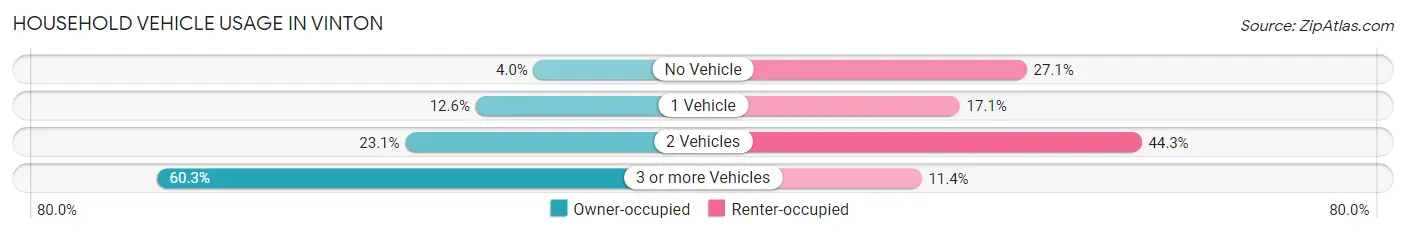
| Vehicles per Household | Owner-occupied | Renter-occupied |
| No Vehicle | 17 (4.0%) | 19 (27.1%) |
| 1 Vehicle | 54 (12.6%) | 12 (17.1%) |
| 2 Vehicles | 99 (23.1%) | 31 (44.3%) |
| 3 or more Vehicles | 258 (60.3%) | 8 (11.4%) |
| Total | 428 (100.0%) | 70 (100.0%) |
Real Estate & Mortgages in Vinton
Real Estate and Mortgage Overview in Vinton
| Characteristic | Without Mortgage | With Mortgage |
| Housing Units | 330 | 98 |
| Median Property Value | $93,600 | $124,200 |
| Median Household Income | $60,577 | $31 |
| Monthly Housing Costs | $447 | $0 |
| Real Estate Taxes | $1,637 | $0 |
Property Value by Mortgage Status in Vinton
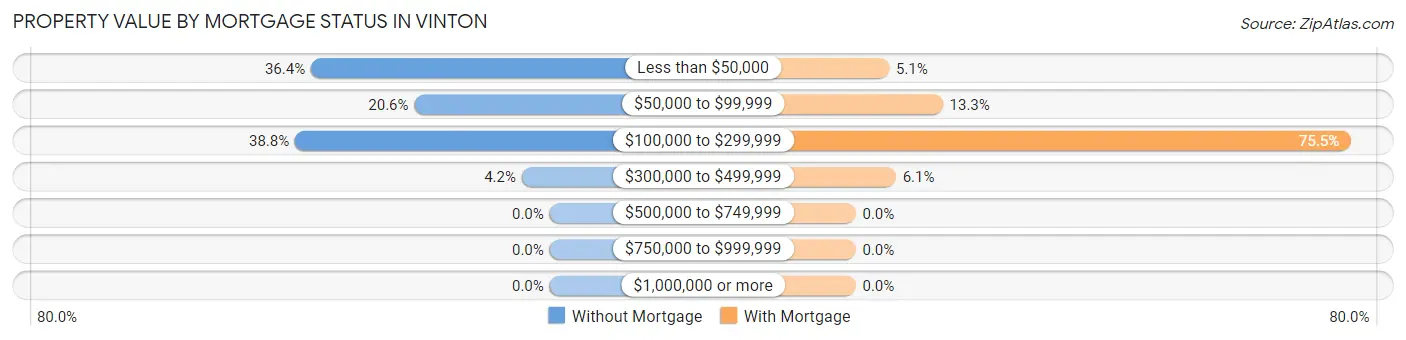
| Property Value | Without Mortgage | With Mortgage |
| Less than $50,000 | 120 (36.4%) | 5 (5.1%) |
| $50,000 to $99,999 | 68 (20.6%) | 13 (13.3%) |
| $100,000 to $299,999 | 128 (38.8%) | 74 (75.5%) |
| $300,000 to $499,999 | 14 (4.2%) | 6 (6.1%) |
| $500,000 to $749,999 | 0 (0.0%) | 0 (0.0%) |
| $750,000 to $999,999 | 0 (0.0%) | 0 (0.0%) |
| $1,000,000 or more | 0 (0.0%) | 0 (0.0%) |
| Total | 330 (100.0%) | 98 (100.0%) |
Household Income by Mortgage Status in Vinton
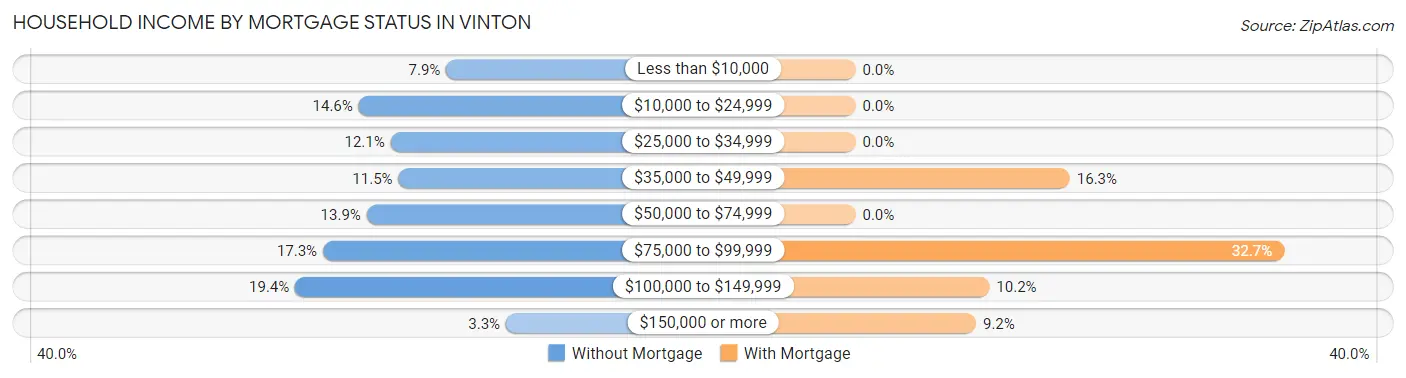
| Household Income | Without Mortgage | With Mortgage |
| Less than $10,000 | 26 (7.9%) | 0 (0.0%) |
| $10,000 to $24,999 | 48 (14.5%) | 0 (0.0%) |
| $25,000 to $34,999 | 40 (12.1%) | 0 (0.0%) |
| $35,000 to $49,999 | 38 (11.5%) | 16 (16.3%) |
| $50,000 to $74,999 | 46 (13.9%) | 0 (0.0%) |
| $75,000 to $99,999 | 57 (17.3%) | 32 (32.7%) |
| $100,000 to $149,999 | 64 (19.4%) | 10 (10.2%) |
| $150,000 or more | 11 (3.3%) | 9 (9.2%) |
| Total | 330 (100.0%) | 98 (100.0%) |
Property Value to Household Income Ratio in Vinton
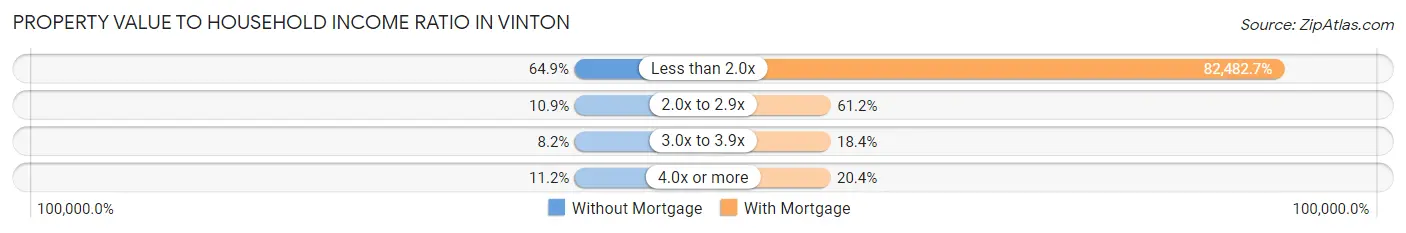
| Value-to-Income Ratio | Without Mortgage | With Mortgage |
| Less than 2.0x | 214 (64.8%) | 80,833 (82,482.7%) |
| 2.0x to 2.9x | 36 (10.9%) | 60 (61.2%) |
| 3.0x to 3.9x | 27 (8.2%) | 18 (18.4%) |
| 4.0x or more | 37 (11.2%) | 20 (20.4%) |
| Total | 330 (100.0%) | 98 (100.0%) |
Real Estate Taxes by Mortgage Status in Vinton
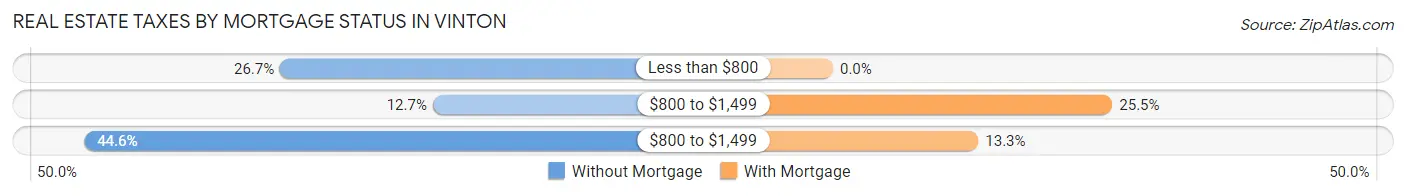
| Property Taxes | Without Mortgage | With Mortgage |
| Less than $800 | 88 (26.7%) | 0 (0.0%) |
| $800 to $1,499 | 42 (12.7%) | 25 (25.5%) |
| $800 to $1,499 | 147 (44.6%) | 13 (13.3%) |
| Total | 330 (100.0%) | 98 (100.0%) |
Health & Disability in Vinton
Health Insurance Coverage by Age in Vinton
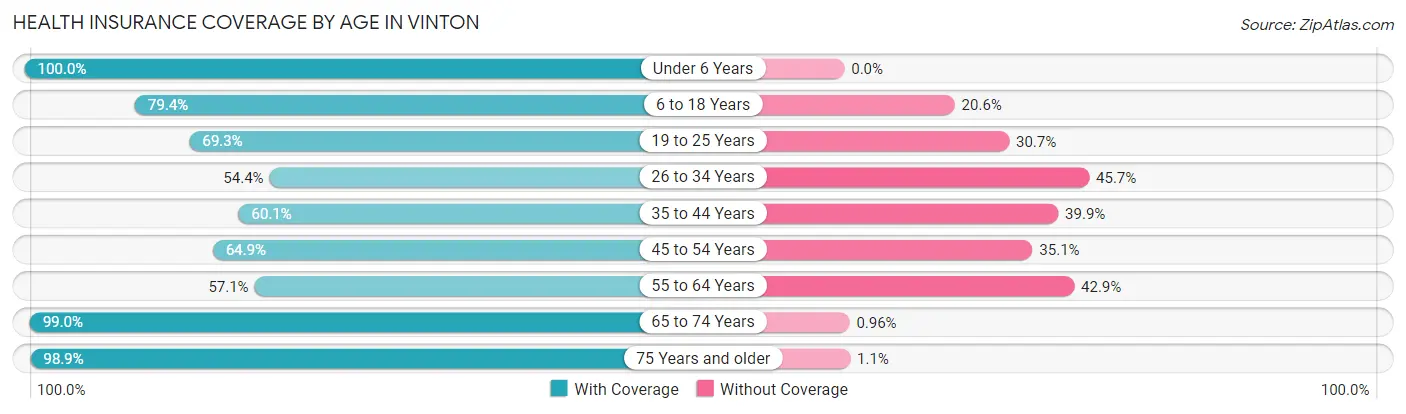
| Age Bracket | With Coverage | Without Coverage |
| Under 6 Years | 88 (100.0%) | 0 (0.0%) |
| 6 to 18 Years | 301 (79.4%) | 78 (20.6%) |
| 19 to 25 Years | 106 (69.3%) | 47 (30.7%) |
| 26 to 34 Years | 100 (54.3%) | 84 (45.7%) |
| 35 to 44 Years | 101 (60.1%) | 67 (39.9%) |
| 45 to 54 Years | 161 (64.9%) | 87 (35.1%) |
| 55 to 64 Years | 172 (57.1%) | 129 (42.9%) |
| 65 to 74 Years | 103 (99.0%) | 1 (1.0%) |
| 75 Years and older | 92 (98.9%) | 1 (1.1%) |
| Total | 1,224 (71.3%) | 494 (28.7%) |
Health Insurance Coverage by Citizenship Status in Vinton
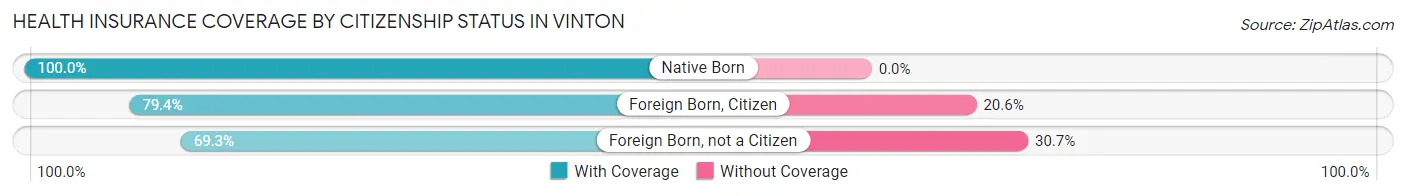
| Citizenship Status | With Coverage | Without Coverage |
| Native Born | 88 (100.0%) | 0 (0.0%) |
| Foreign Born, Citizen | 301 (79.4%) | 78 (20.6%) |
| Foreign Born, not a Citizen | 106 (69.3%) | 47 (30.7%) |
Health Insurance Coverage by Household Income in Vinton
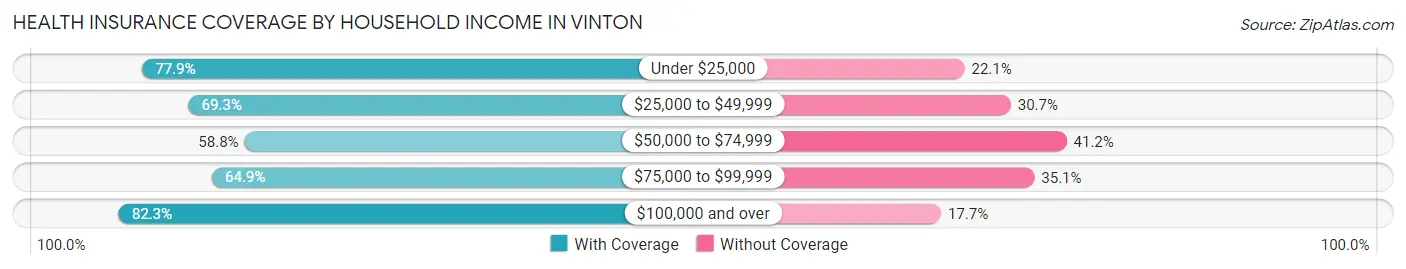
| Household Income | With Coverage | Without Coverage |
| Under $25,000 | 159 (77.9%) | 45 (22.1%) |
| $25,000 to $49,999 | 257 (69.3%) | 114 (30.7%) |
| $50,000 to $74,999 | 180 (58.8%) | 126 (41.2%) |
| $75,000 to $99,999 | 227 (64.9%) | 123 (35.1%) |
| $100,000 and over | 401 (82.3%) | 86 (17.7%) |
Public vs Private Health Insurance Coverage by Age in Vinton
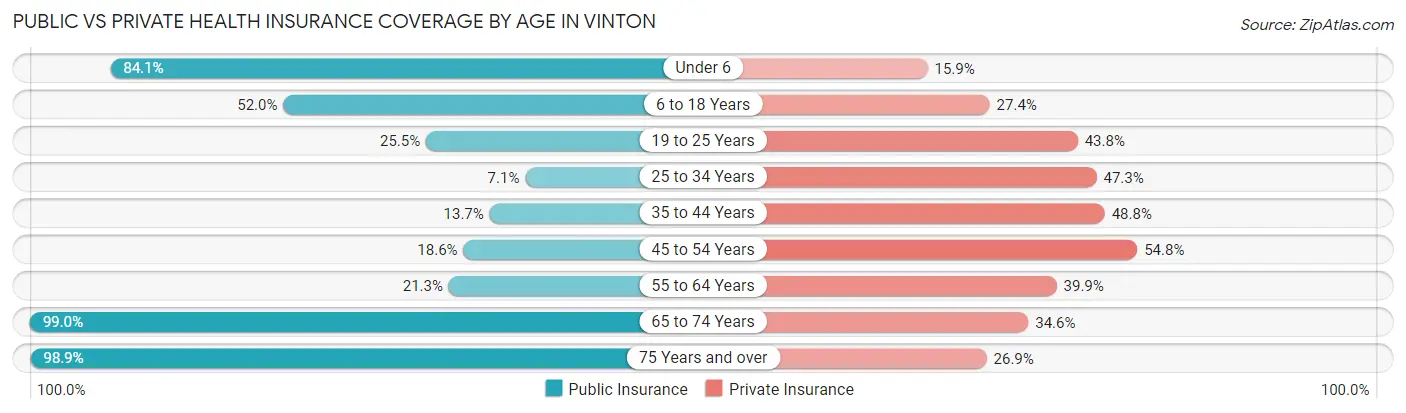
| Age Bracket | Public Insurance | Private Insurance |
| Under 6 | 74 (84.1%) | 14 (15.9%) |
| 6 to 18 Years | 197 (52.0%) | 104 (27.4%) |
| 19 to 25 Years | 39 (25.5%) | 67 (43.8%) |
| 25 to 34 Years | 13 (7.1%) | 87 (47.3%) |
| 35 to 44 Years | 23 (13.7%) | 82 (48.8%) |
| 45 to 54 Years | 46 (18.5%) | 136 (54.8%) |
| 55 to 64 Years | 64 (21.3%) | 120 (39.9%) |
| 65 to 74 Years | 103 (99.0%) | 36 (34.6%) |
| 75 Years and over | 92 (98.9%) | 25 (26.9%) |
| Total | 651 (37.9%) | 671 (39.1%) |
Disability Status by Sex by Age in Vinton
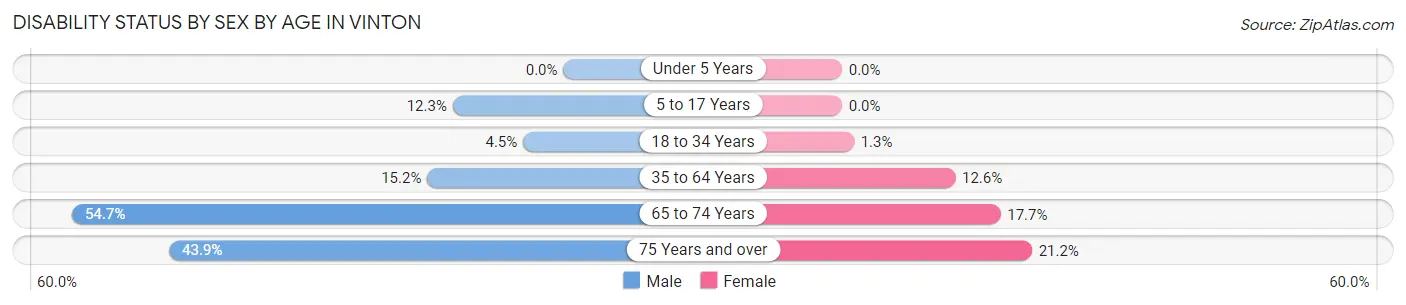
| Age Bracket | Male | Female |
| Under 5 Years | 0 (0.0%) | 0 (0.0%) |
| 5 to 17 Years | 17 (12.3%) | 0 (0.0%) |
| 18 to 34 Years | 10 (4.5%) | 3 (1.3%) |
| 35 to 64 Years | 57 (15.2%) | 43 (12.6%) |
| 65 to 74 Years | 29 (54.7%) | 9 (17.6%) |
| 75 Years and over | 18 (43.9%) | 11 (21.1%) |
Disability Class by Sex by Age in Vinton
Disability Class: Hearing Difficulty
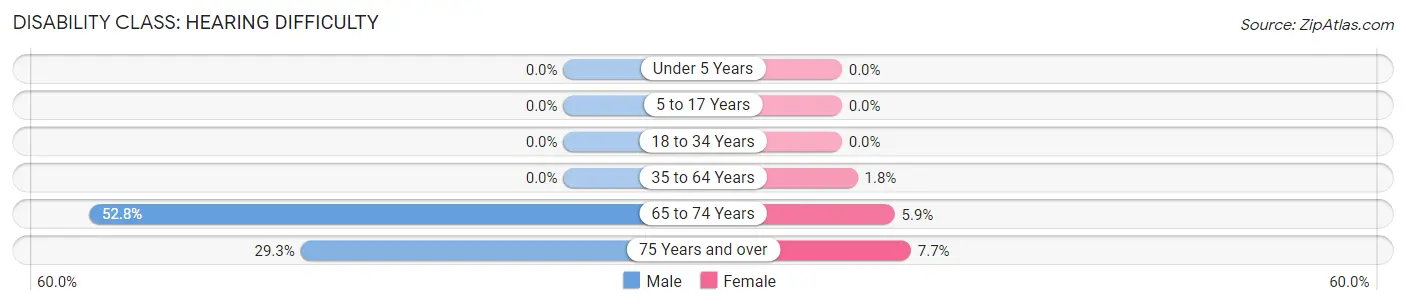
| Age Bracket | Male | Female |
| Under 5 Years | 0 (0.0%) | 0 (0.0%) |
| 5 to 17 Years | 0 (0.0%) | 0 (0.0%) |
| 18 to 34 Years | 0 (0.0%) | 0 (0.0%) |
| 35 to 64 Years | 0 (0.0%) | 6 (1.8%) |
| 65 to 74 Years | 28 (52.8%) | 3 (5.9%) |
| 75 Years and over | 12 (29.3%) | 4 (7.7%) |
Disability Class: Vision Difficulty
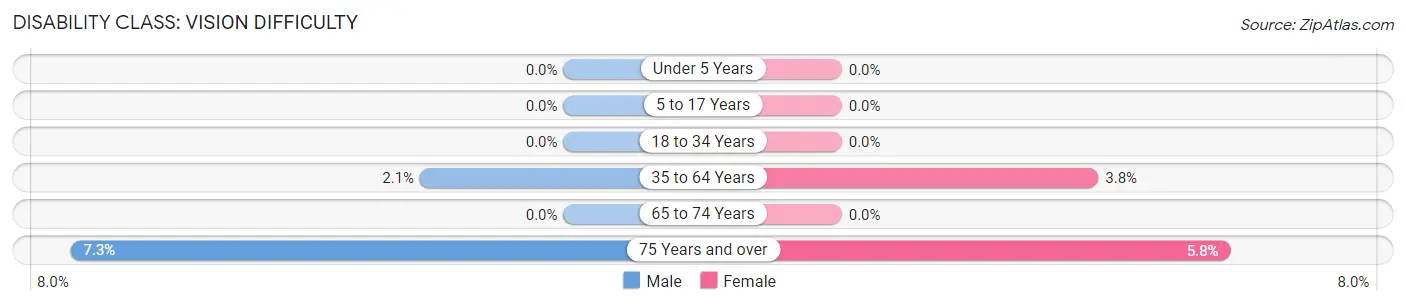
| Age Bracket | Male | Female |
| Under 5 Years | 0 (0.0%) | 0 (0.0%) |
| 5 to 17 Years | 0 (0.0%) | 0 (0.0%) |
| 18 to 34 Years | 0 (0.0%) | 0 (0.0%) |
| 35 to 64 Years | 8 (2.1%) | 13 (3.8%) |
| 65 to 74 Years | 0 (0.0%) | 0 (0.0%) |
| 75 Years and over | 3 (7.3%) | 3 (5.8%) |
Disability Class: Cognitive Difficulty
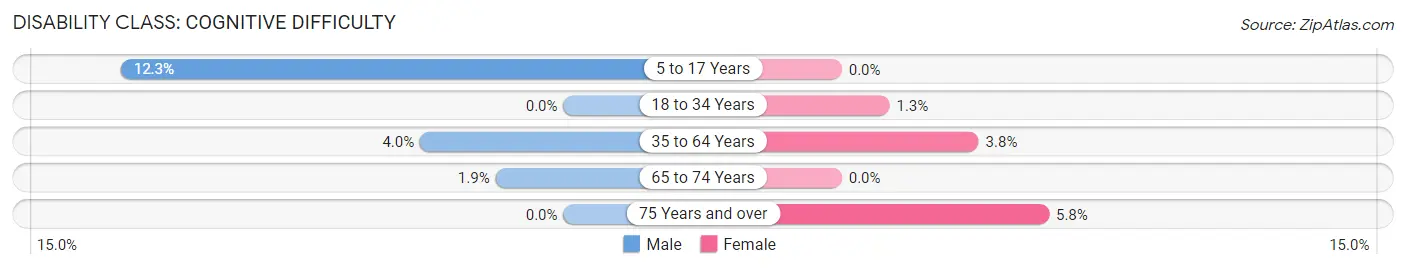
| Age Bracket | Male | Female |
| 5 to 17 Years | 17 (12.3%) | 0 (0.0%) |
| 18 to 34 Years | 0 (0.0%) | 3 (1.3%) |
| 35 to 64 Years | 15 (4.0%) | 13 (3.8%) |
| 65 to 74 Years | 1 (1.9%) | 0 (0.0%) |
| 75 Years and over | 0 (0.0%) | 3 (5.8%) |
Disability Class: Ambulatory Difficulty
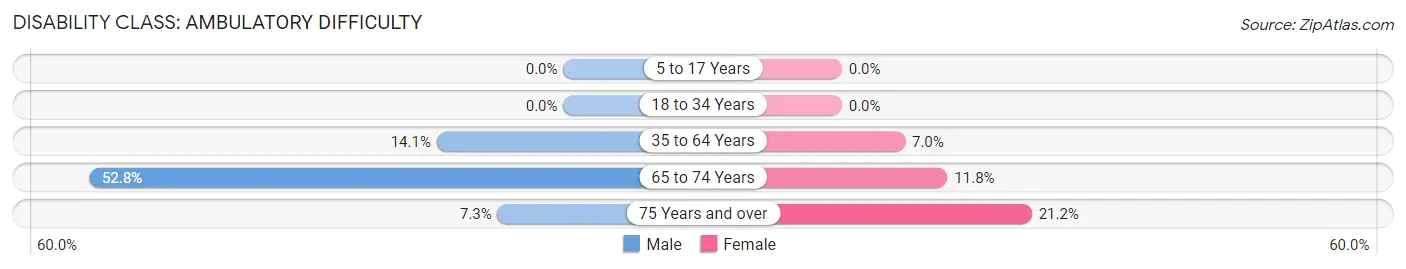
| Age Bracket | Male | Female |
| 5 to 17 Years | 0 (0.0%) | 0 (0.0%) |
| 18 to 34 Years | 0 (0.0%) | 0 (0.0%) |
| 35 to 64 Years | 53 (14.1%) | 24 (7.0%) |
| 65 to 74 Years | 28 (52.8%) | 6 (11.8%) |
| 75 Years and over | 3 (7.3%) | 11 (21.1%) |
Disability Class: Self-Care Difficulty
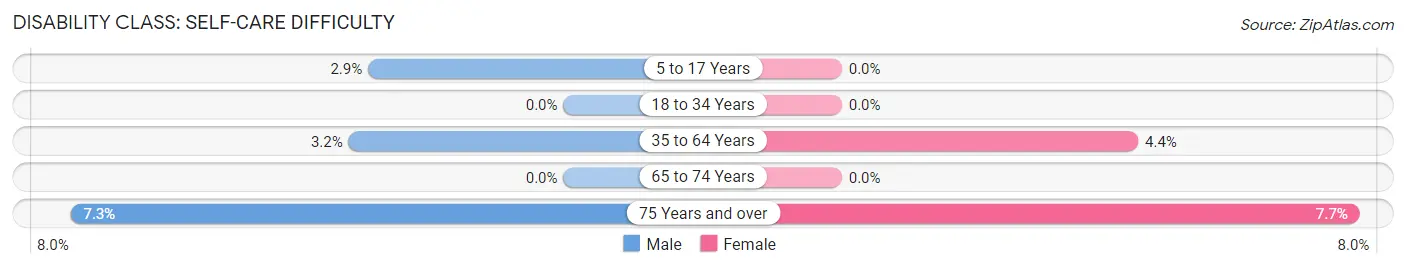
| Age Bracket | Male | Female |
| 5 to 17 Years | 4 (2.9%) | 0 (0.0%) |
| 18 to 34 Years | 0 (0.0%) | 0 (0.0%) |
| 35 to 64 Years | 12 (3.2%) | 15 (4.4%) |
| 65 to 74 Years | 0 (0.0%) | 0 (0.0%) |
| 75 Years and over | 3 (7.3%) | 4 (7.7%) |
Technology Access in Vinton
Computing Device Access in Vinton
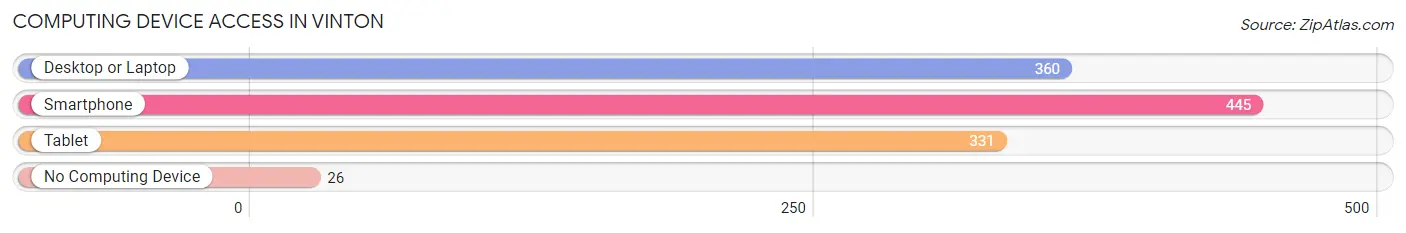
| Device Type | # Households | % Households |
| Desktop or Laptop | 360 | 72.3% |
| Smartphone | 445 | 89.4% |
| Tablet | 331 | 66.5% |
| No Computing Device | 26 | 5.2% |
| Total | 498 | 100.0% |
Internet Access in Vinton
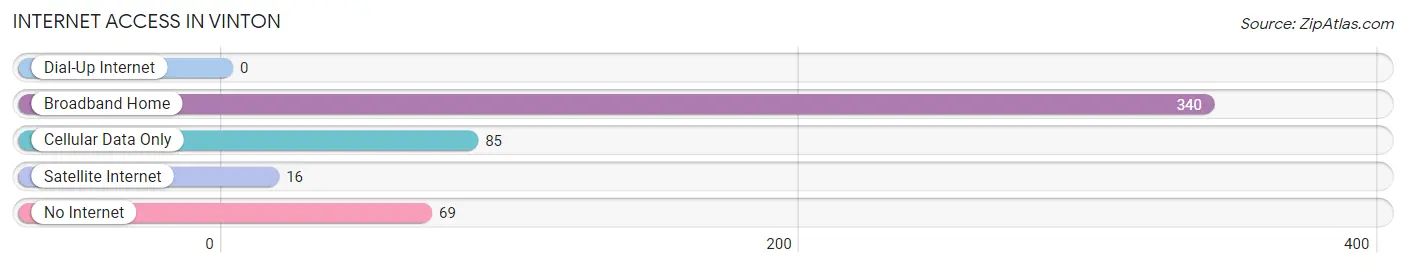
| Internet Type | # Households | % Households |
| Dial-Up Internet | 0 | 0.0% |
| Broadband Home | 340 | 68.3% |
| Cellular Data Only | 85 | 17.1% |
| Satellite Internet | 16 | 3.2% |
| No Internet | 69 | 13.9% |
| Total | 498 | 100.0% |
Vinton Summary
Vinton, Texas is a small town located in El Paso County, Texas. It is situated on the western edge of the state, just south of the New Mexico border. The town was founded in 1881 and has a population of approximately 1,500 people.
History
Vinton was founded in 1881 by a group of settlers from the nearby town of El Paso. The settlers were looking for a place to settle and start a new life. The town was named after the Vinton family, who had been living in the area since the late 1800s. The town was officially incorporated in 1883.
In the early 1900s, Vinton was a thriving agricultural community. The town was known for its cotton, corn, and wheat production. The town also had a thriving dairy industry. In the 1920s, the town began to experience a decline in its agricultural production due to the Great Depression.
In the 1940s, the town began to experience a resurgence in its economy. This was due to the influx of military personnel and their families who were stationed at nearby Fort Bliss. The town also experienced a population boom during this time.
Geography
Vinton is located in El Paso County, Texas. It is situated on the western edge of the state, just south of the New Mexico border. The town is located in the Chihuahuan Desert and is surrounded by mountains. The town is located at an elevation of 3,845 feet above sea level.
The town is located near the Rio Grande River, which serves as the border between the United States and Mexico. The town is also located near the Franklin Mountains, which are part of the Chihuahuan Desert.
Economy
The economy of Vinton is largely based on agriculture and tourism. The town is known for its cotton, corn, and wheat production. The town also has a thriving dairy industry.
The town is also home to several businesses, including restaurants, retail stores, and a few small manufacturing companies. The town is also home to a few small oil and gas companies.
The town is also home to a few tourist attractions, including the Franklin Mountains State Park and the El Paso Zoo. The town is also home to a few museums, including the El Paso Museum of Art and the El Paso Museum of History.
Demographics
As of the 2010 census, the population of Vinton was 1,500. The town is predominantly Hispanic, with a population that is approximately 90% Hispanic. The town also has a small population of African Americans, Native Americans, and Asians.
The median household income in Vinton is $30,000. The median home value is $90,000. The town has a poverty rate of 22%.
Conclusion
Vinton, Texas is a small town located in El Paso County, Texas. It is situated on the western edge of the state, just south of the New Mexico border. The town was founded in 1881 and has a population of approximately 1,500 people. The town is known for its agricultural production and its tourism industry. The town is predominantly Hispanic, with a population that is approximately 90% Hispanic. The town has a median household income of $30,000 and a median home value of $90,000. The town has a poverty rate of 22%.
Common Questions
What is Per Capita Income in Vinton?
Per Capita income in Vinton is $18,643.
What is the Median Family Income in Vinton?
Median Family Income in Vinton is $61,705.
What is the Median Household income in Vinton?
Median Household Income in Vinton is $61,023.
What is Income or Wage Gap in Vinton?
Income or Wage Gap in Vinton is 13.0%.
Women in Vinton earn 87.0 cents for every dollar earned by a man.
What is Family Income Deficit in Vinton?
Family Income Deficit in Vinton is $4,893.
Families that are below poverty line in Vinton earn $4,893 less on average than the poverty threshold level.
What is Inequality or Gini Index in Vinton?
Inequality or Gini Index in Vinton is 0.44.
What is the Total Population of Vinton?
Total Population of Vinton is 2,692.
What is the Total Male Population of Vinton?
Total Male Population of Vinton is 1,837.
What is the Total Female Population of Vinton?
Total Female Population of Vinton is 855.
What is the Ratio of Males per 100 Females in Vinton?
There are 214.85 Males per 100 Females in Vinton.
What is the Ratio of Females per 100 Males in Vinton?
There are 46.54 Females per 100 Males in Vinton.
What is the Median Population Age in Vinton?
Median Population Age in Vinton is 42.7 Years.
What is the Average Family Size in Vinton
Average Family Size in Vinton is 3.6 People.
What is the Average Household Size in Vinton
Average Household Size in Vinton is 3.5 People.
How Large is the Labor Force in Vinton?
There are 763 People in the Labor Forcein in Vinton.
What is the Percentage of People in the Labor Force in Vinton?
31.7% of People are in the Labor Force in Vinton.
What is the Unemployment Rate in Vinton?
Unemployment Rate in Vinton is 6.4%.