Tutuilla, OR Map & Demographics
Tutuilla Map
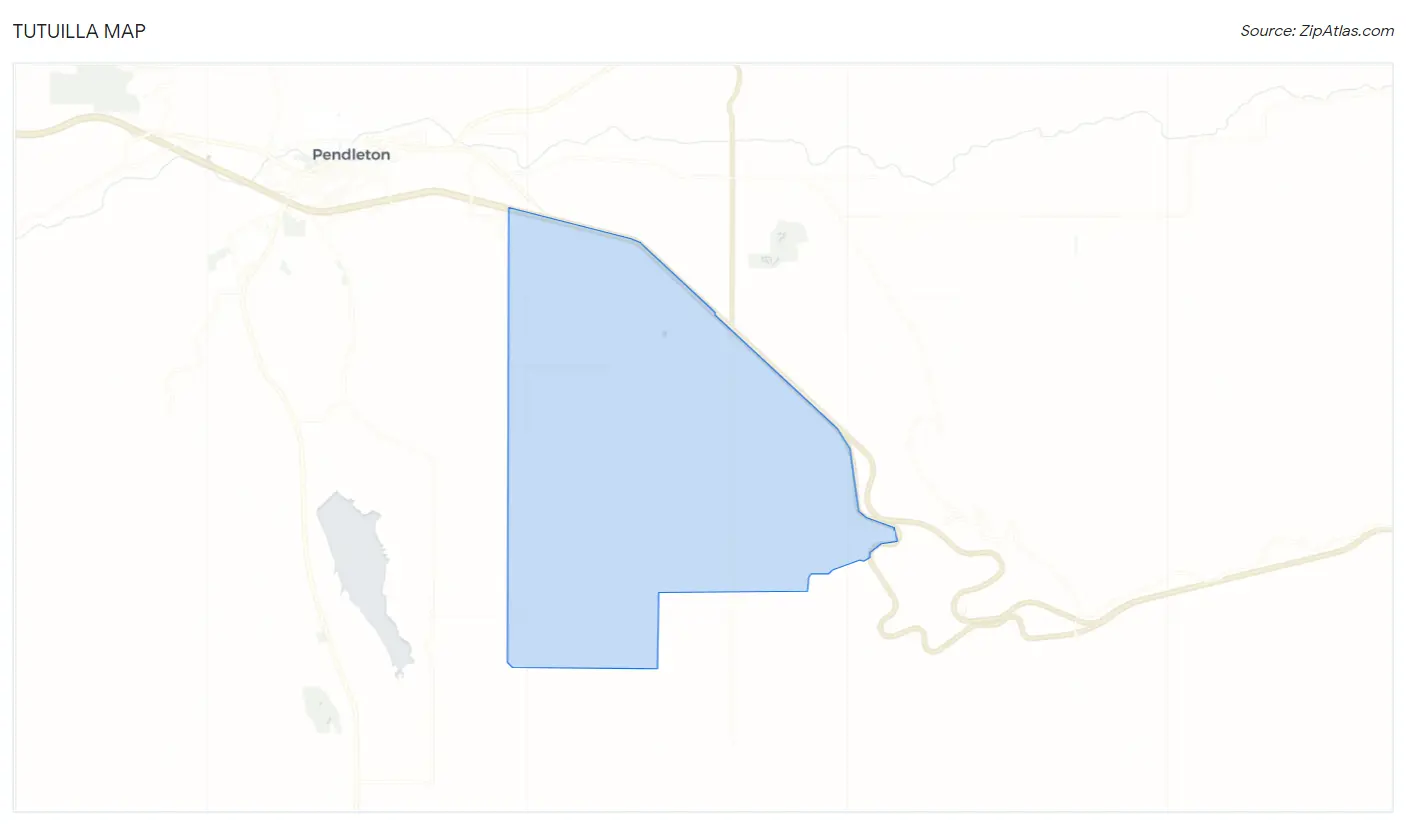
Tutuilla Overview
$36,850
PER CAPITA INCOME
$76,607
AVG FAMILY INCOME
$76,786
AVG HOUSEHOLD INCOME
30.2%
WAGE / INCOME GAP [ % ]
69.8¢/ $1
WAGE / INCOME GAP [ $ ]
0.35
INEQUALITY / GINI INDEX
395
TOTAL POPULATION
165
MALE POPULATION
230
FEMALE POPULATION
71.74
MALES / 100 FEMALES
139.39
FEMALES / 100 MALES
53.2
MEDIAN AGE
2.7
AVG FAMILY SIZE
2.4
AVG HOUSEHOLD SIZE
204
LABOR FORCE [ PEOPLE ]
57.5%
PERCENT IN LABOR FORCE
3.4%
UNEMPLOYMENT RATE
Income in Tutuilla
Income Overview in Tutuilla
Per Capita Income in Tutuilla is $36,850, while median incomes of families and households are $76,607 and $76,786 respectively.
| Characteristic | Number | Measure |
| Per Capita Income | 395 | $36,850 |
| Median Family Income | 115 | $76,607 |
| Mean Family Income | 115 | $82,386 |
| Median Household Income | 166 | $76,786 |
| Mean Household Income | 166 | $78,703 |
| Income Deficit | 115 | $0 |
| Wage / Income Gap (%) | 395 | 30.23% |
| Wage / Income Gap ($) | 395 | 69.77¢ per $1 |
| Gini / Inequality Index | 395 | 0.35 |
Earnings by Sex in Tutuilla
Average Earnings in Tutuilla are $40,536, $53,750 for men and $37,500 for women, a difference of 30.2%.
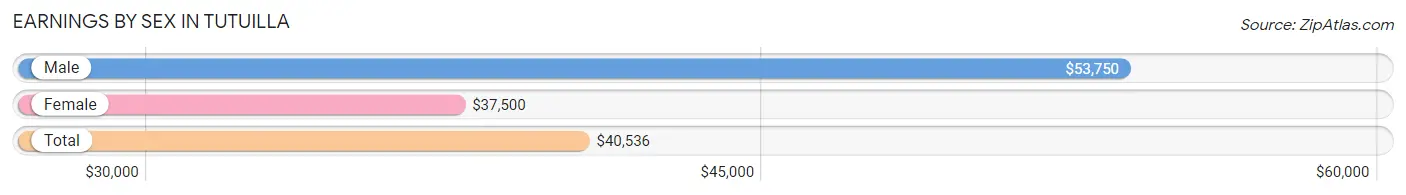
| Sex | Number | Average Earnings |
| Male | 81 (38.8%) | $53,750 |
| Female | 128 (61.2%) | $37,500 |
| Total | 209 (100.0%) | $40,536 |
Earnings by Sex by Income Bracket in Tutuilla
The most common earnings brackets in Tutuilla are $75,000 to $99,999 for men (14 | 17.3%) and $30,000 to $34,999 for women (21 | 16.4%).
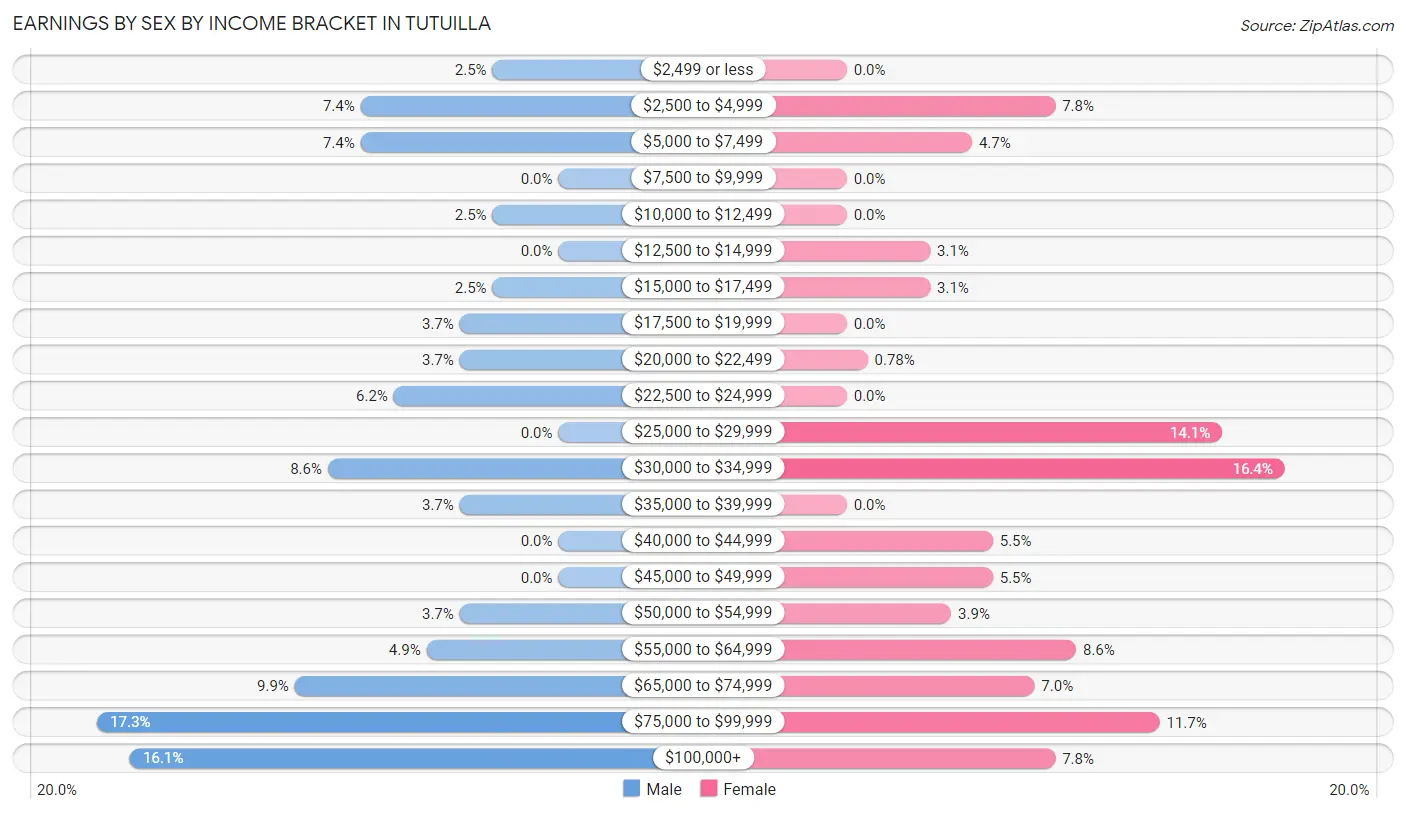
| Income | Male | Female |
| $2,499 or less | 2 (2.5%) | 0 (0.0%) |
| $2,500 to $4,999 | 6 (7.4%) | 10 (7.8%) |
| $5,000 to $7,499 | 6 (7.4%) | 6 (4.7%) |
| $7,500 to $9,999 | 0 (0.0%) | 0 (0.0%) |
| $10,000 to $12,499 | 2 (2.5%) | 0 (0.0%) |
| $12,500 to $14,999 | 0 (0.0%) | 4 (3.1%) |
| $15,000 to $17,499 | 2 (2.5%) | 4 (3.1%) |
| $17,500 to $19,999 | 3 (3.7%) | 0 (0.0%) |
| $20,000 to $22,499 | 3 (3.7%) | 1 (0.8%) |
| $22,500 to $24,999 | 5 (6.2%) | 0 (0.0%) |
| $25,000 to $29,999 | 0 (0.0%) | 18 (14.1%) |
| $30,000 to $34,999 | 7 (8.6%) | 21 (16.4%) |
| $35,000 to $39,999 | 3 (3.7%) | 0 (0.0%) |
| $40,000 to $44,999 | 0 (0.0%) | 7 (5.5%) |
| $45,000 to $49,999 | 0 (0.0%) | 7 (5.5%) |
| $50,000 to $54,999 | 3 (3.7%) | 5 (3.9%) |
| $55,000 to $64,999 | 4 (4.9%) | 11 (8.6%) |
| $65,000 to $74,999 | 8 (9.9%) | 9 (7.0%) |
| $75,000 to $99,999 | 14 (17.3%) | 15 (11.7%) |
| $100,000+ | 13 (16.1%) | 10 (7.8%) |
| Total | 81 (100.0%) | 128 (100.0%) |
Earnings by Sex by Educational Attainment in Tutuilla
Average earnings in Tutuilla are $65,000 for men and $41,964 for women, a difference of 35.4%. Men with an educational attainment of bachelor's degree enjoy the highest average annual earnings of $85,000, while those with less than high school education earn the least with $46,250. Women with an educational attainment of high school diploma earn the most with the average annual earnings of $40,536, while those with college or associate's degree education have the smallest earnings of $34,531.
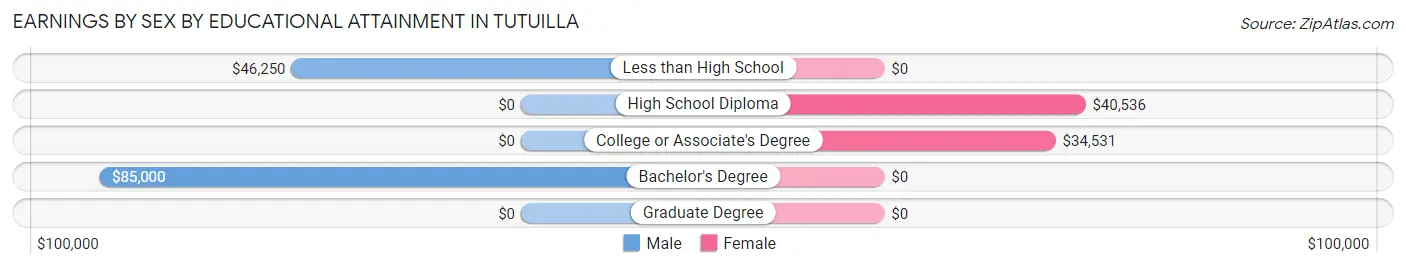
| Educational Attainment | Male Income | Female Income |
| Less than High School | $46,250 | $0 |
| High School Diploma | - | - |
| College or Associate's Degree | - | - |
| Bachelor's Degree | $85,000 | $0 |
| Graduate Degree | - | - |
| Total | $65,000 | $41,964 |
Family Income in Tutuilla
Family Income Brackets in Tutuilla
According to the Tutuilla family income data, there are 30 families falling into the $75,000 to $99,999 income range, which is the most common income bracket and makes up 26.1% of all families.
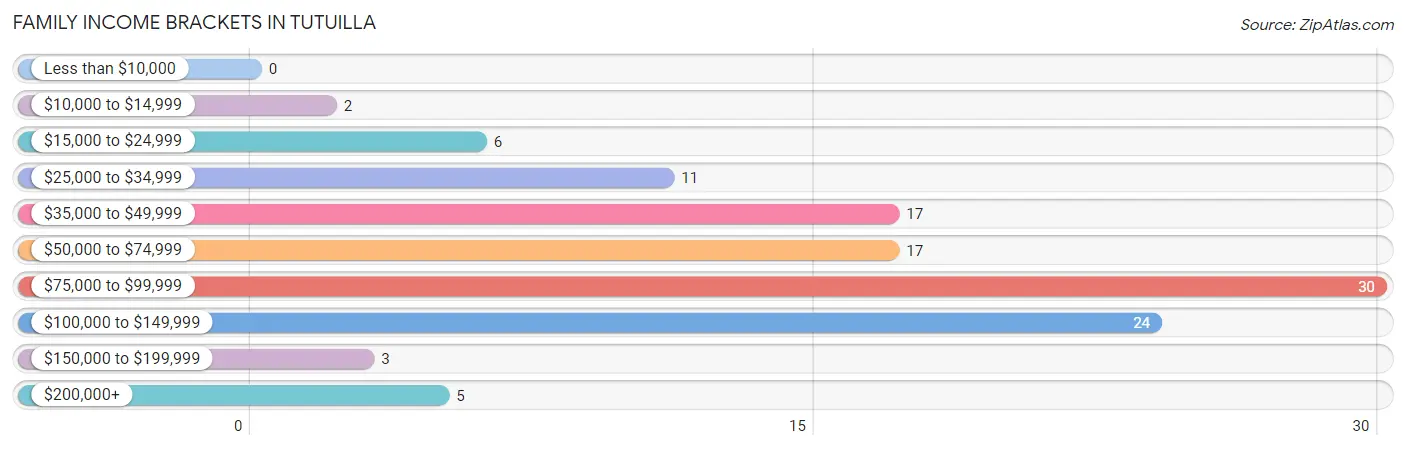
| Income Bracket | # Families | % Families |
| Less than $10,000 | 0 | 0.0% |
| $10,000 to $14,999 | 2 | 1.7% |
| $15,000 to $24,999 | 6 | 5.2% |
| $25,000 to $34,999 | 11 | 9.6% |
| $35,000 to $49,999 | 17 | 14.8% |
| $50,000 to $74,999 | 17 | 14.8% |
| $75,000 to $99,999 | 30 | 26.1% |
| $100,000 to $149,999 | 24 | 20.9% |
| $150,000 to $199,999 | 3 | 2.6% |
| $200,000+ | 5 | 4.3% |
Family Income by Famaliy Size in Tutuilla
3-person families (22 | 19.1%) account for the highest median family income in Tutuilla with $83,750 per family, while 2-person families (75 | 65.2%) have the highest median income of $37,946 per family member.
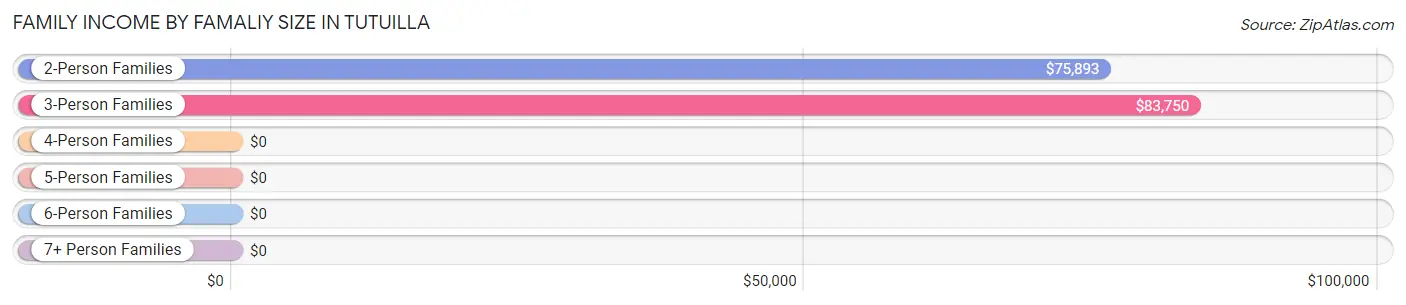
| Income Bracket | # Families | Median Income |
| 2-Person Families | 75 (65.2%) | $75,893 |
| 3-Person Families | 22 (19.1%) | $83,750 |
| 4-Person Families | 15 (13.0%) | $0 |
| 5-Person Families | 3 (2.6%) | $0 |
| 6-Person Families | 0 (0.0%) | $0 |
| 7+ Person Families | 0 (0.0%) | $0 |
| Total | 115 (100.0%) | $76,607 |
Family Income by Number of Earners in Tutuilla
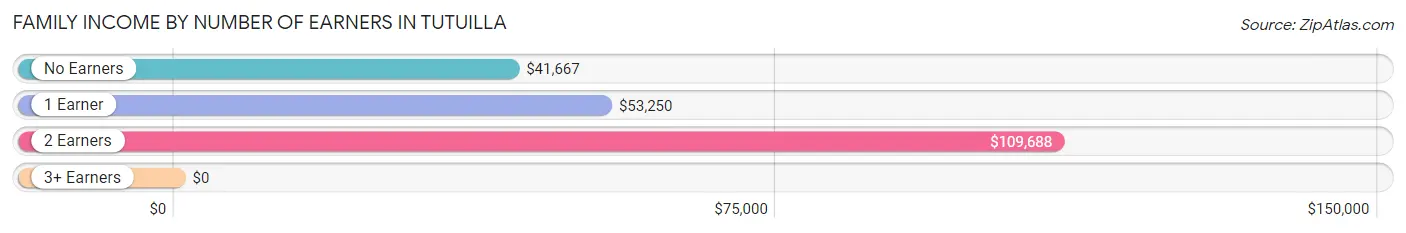
| Number of Earners | # Families | Median Income |
| No Earners | 26 (22.6%) | $41,667 |
| 1 Earner | 41 (35.6%) | $53,250 |
| 2 Earners | 43 (37.4%) | $109,688 |
| 3+ Earners | 5 (4.3%) | $0 |
| Total | 115 (100.0%) | $76,607 |
Household Income in Tutuilla
Household Income Brackets in Tutuilla
With 39 households falling in the category, the $75,000 to $99,999 income range is the most frequent in Tutuilla, accounting for 23.5% of all households.
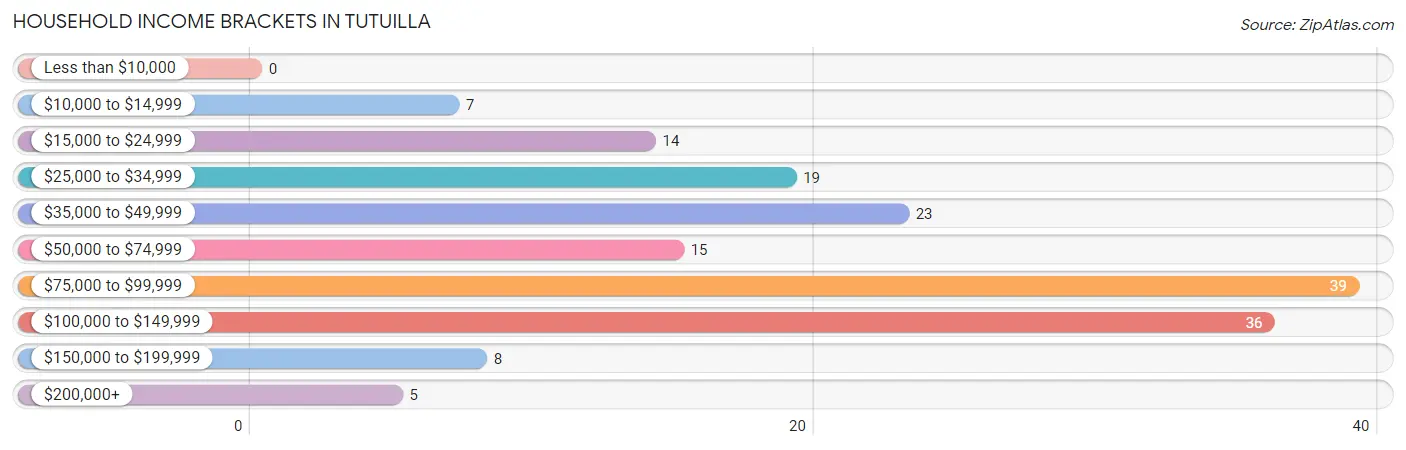
| Income Bracket | # Households | % Households |
| Less than $10,000 | 0 | 0.0% |
| $10,000 to $14,999 | 7 | 4.2% |
| $15,000 to $24,999 | 14 | 8.4% |
| $25,000 to $34,999 | 19 | 11.4% |
| $35,000 to $49,999 | 23 | 13.9% |
| $50,000 to $74,999 | 15 | 9.0% |
| $75,000 to $99,999 | 39 | 23.5% |
| $100,000 to $149,999 | 36 | 21.7% |
| $150,000 to $199,999 | 8 | 4.8% |
| $200,000+ | 5 | 3.0% |
Household Income by Householder Age in Tutuilla
The median household income in Tutuilla is $76,786, with the highest median household income of $125,833 found in the 25 to 44 years age bracket for the primary householder. A total of 10 households (6.0%) fall into this category.
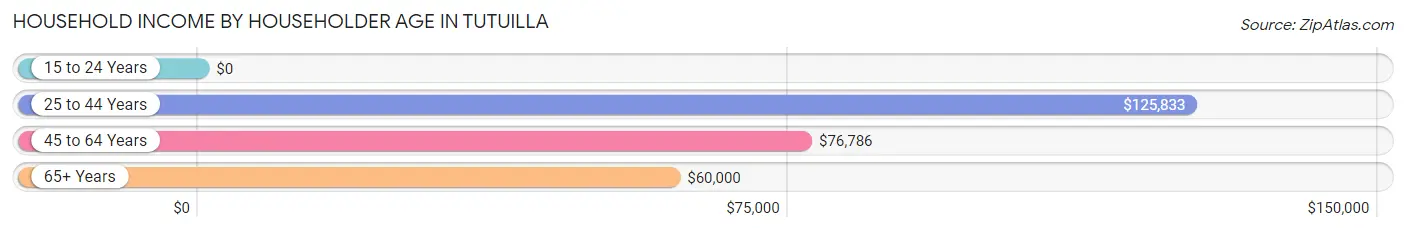
| Income Bracket | # Households | Median Income |
| 15 to 24 Years | 0 (0.0%) | $0 |
| 25 to 44 Years | 10 (6.0%) | $125,833 |
| 45 to 64 Years | 82 (49.4%) | $76,786 |
| 65+ Years | 74 (44.6%) | $60,000 |
| Total | 166 (100.0%) | $76,786 |
Poverty in Tutuilla
Income Below Poverty by Sex and Age in Tutuilla
With 6.2% poverty level for males and 10.4% for females among the residents of Tutuilla, 45 to 54 year old males and 65 to 74 year old females are the most vulnerable to poverty, with 6 males (27.3%) and 13 females (30.9%) in their respective age groups living below the poverty level.
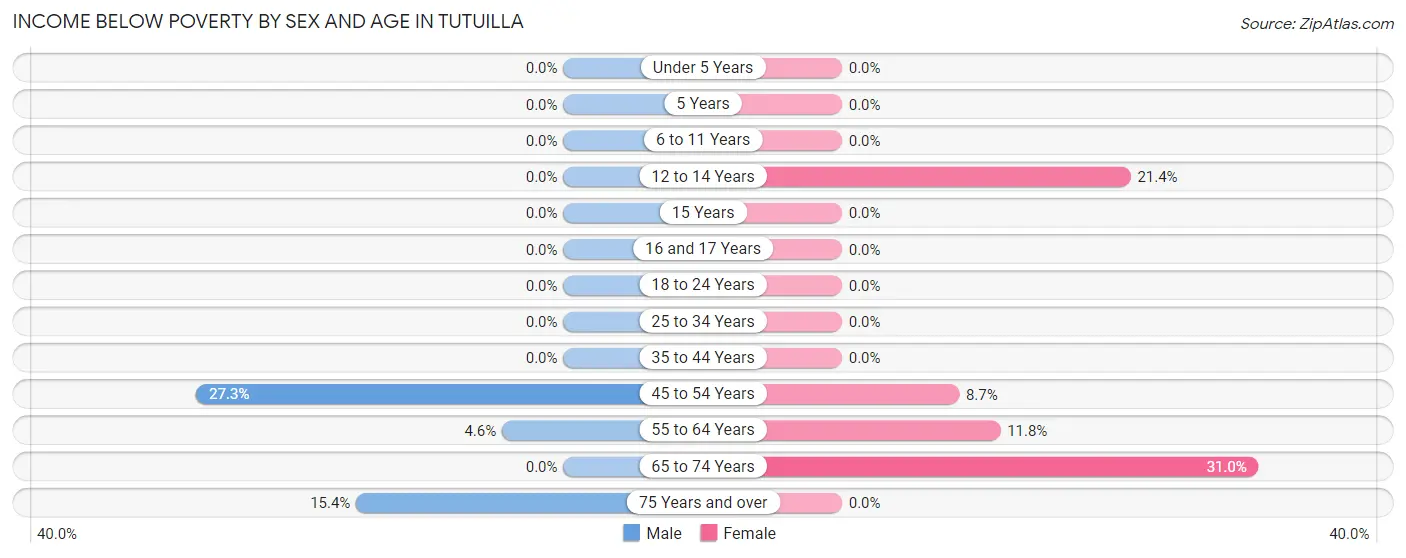
| Age Bracket | Male | Female |
| Under 5 Years | 0 (0.0%) | 0 (0.0%) |
| 5 Years | 0 (0.0%) | 0 (0.0%) |
| 6 to 11 Years | 0 (0.0%) | 0 (0.0%) |
| 12 to 14 Years | 0 (0.0%) | 3 (21.4%) |
| 15 Years | 0 (0.0%) | 0 (0.0%) |
| 16 and 17 Years | 0 (0.0%) | 0 (0.0%) |
| 18 to 24 Years | 0 (0.0%) | 0 (0.0%) |
| 25 to 34 Years | 0 (0.0%) | 0 (0.0%) |
| 35 to 44 Years | 0 (0.0%) | 0 (0.0%) |
| 45 to 54 Years | 6 (27.3%) | 4 (8.7%) |
| 55 to 64 Years | 2 (4.5%) | 4 (11.8%) |
| 65 to 74 Years | 0 (0.0%) | 13 (30.9%) |
| 75 Years and over | 2 (15.4%) | 0 (0.0%) |
| Total | 10 (6.2%) | 24 (10.4%) |
Income Above Poverty by Sex and Age in Tutuilla
According to the poverty statistics in Tutuilla, males aged 6 to 11 years and females aged 5 years are the age groups that are most secure financially, with 100.0% of males and 100.0% of females in these age groups living above the poverty line.
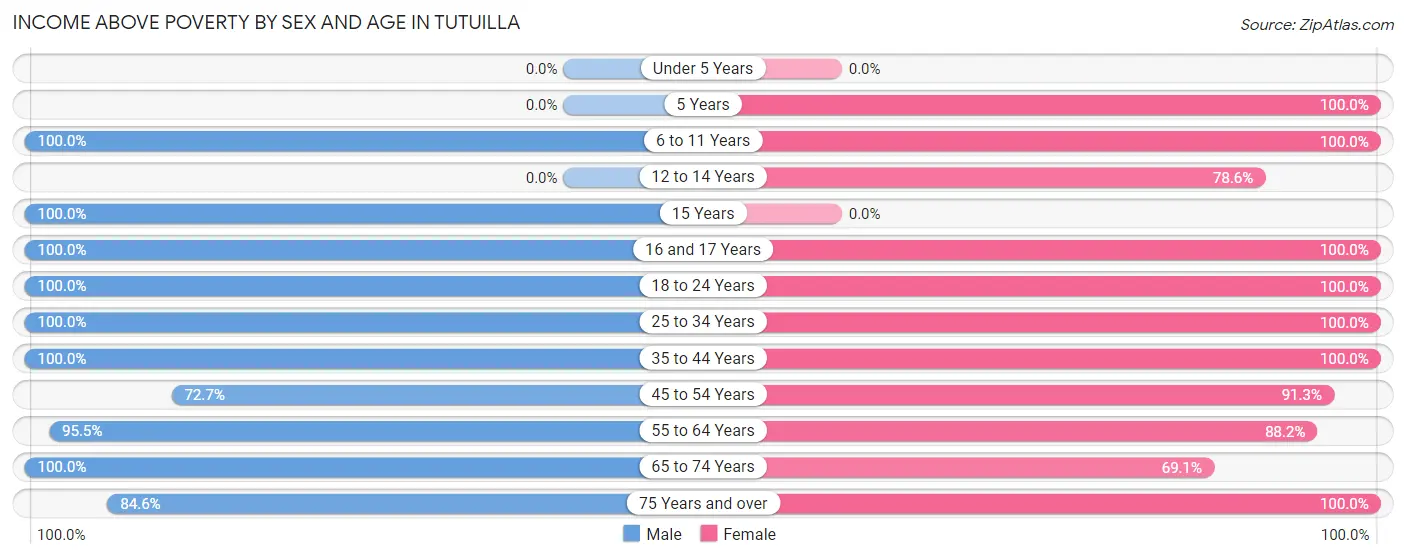
| Age Bracket | Male | Female |
| Under 5 Years | 0 (0.0%) | 0 (0.0%) |
| 5 Years | 0 (0.0%) | 2 (100.0%) |
| 6 to 11 Years | 5 (100.0%) | 5 (100.0%) |
| 12 to 14 Years | 0 (0.0%) | 11 (78.6%) |
| 15 Years | 11 (100.0%) | 0 (0.0%) |
| 16 and 17 Years | 7 (100.0%) | 9 (100.0%) |
| 18 to 24 Years | 11 (100.0%) | 11 (100.0%) |
| 25 to 34 Years | 13 (100.0%) | 28 (100.0%) |
| 35 to 44 Years | 5 (100.0%) | 17 (100.0%) |
| 45 to 54 Years | 16 (72.7%) | 42 (91.3%) |
| 55 to 64 Years | 42 (95.5%) | 30 (88.2%) |
| 65 to 74 Years | 31 (100.0%) | 29 (69.1%) |
| 75 Years and over | 11 (84.6%) | 22 (100.0%) |
| Total | 152 (93.8%) | 206 (89.6%) |
Income Below Poverty Among Married-Couple Families in Tutuilla
The poverty statistics for married-couple families in Tutuilla show that 7.7% or 5 of the total 65 families live below the poverty line. Families with 1 or 2 children have the highest poverty rate of 100.0%, comprising of 3 families. On the other hand, families with 3 or 4 children have the lowest poverty rate of 0.0%, which includes 0 families.
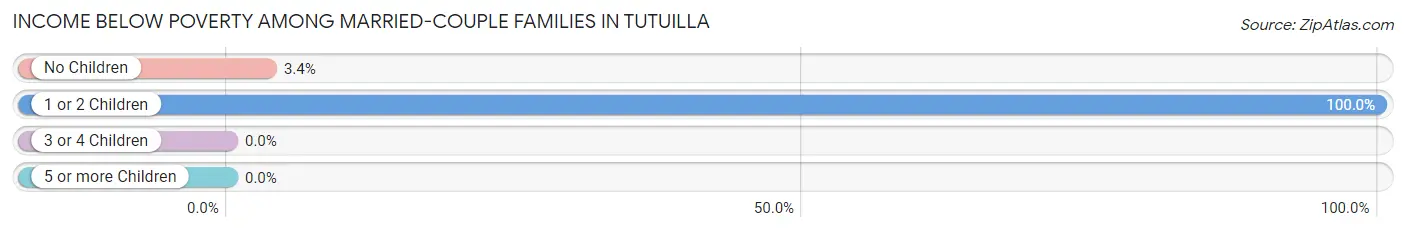
| Children | Above Poverty | Below Poverty |
| No Children | 57 (96.6%) | 2 (3.4%) |
| 1 or 2 Children | 0 (0.0%) | 3 (100.0%) |
| 3 or 4 Children | 3 (100.0%) | 0 (0.0%) |
| 5 or more Children | 0 (0.0%) | 0 (0.0%) |
| Total | 60 (92.3%) | 5 (7.7%) |
Income Below Poverty Among Single-Parent Households in Tutuilla
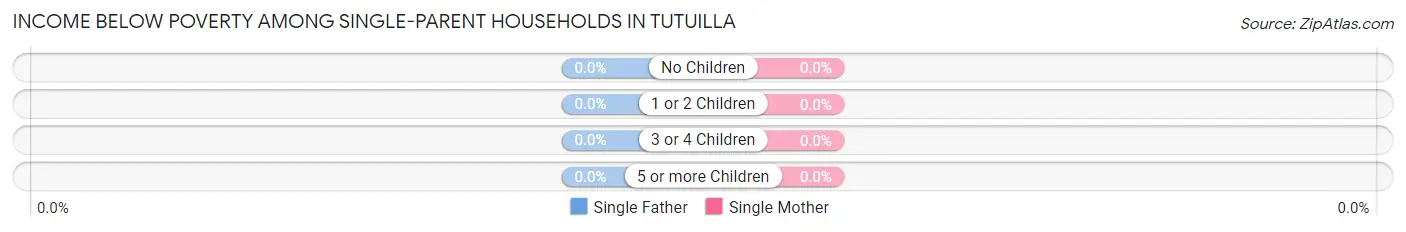
| Children | Single Father | Single Mother |
| No Children | 0 (0.0%) | 0 (0.0%) |
| 1 or 2 Children | 0 (0.0%) | 0 (0.0%) |
| 3 or 4 Children | 0 (0.0%) | 0 (0.0%) |
| 5 or more Children | 0 (0.0%) | 0 (0.0%) |
| Total | 0 (0.0%) | 0 (0.0%) |
Income Below Poverty Among Married-Couple vs Single-Parent Households in Tutuilla
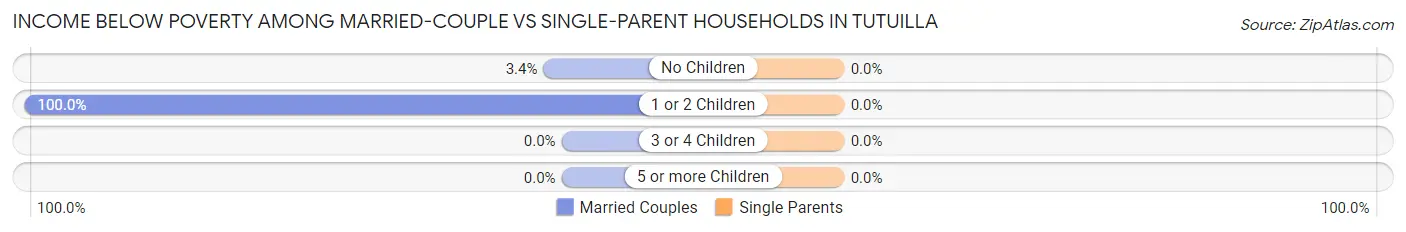
| Children | Married-Couple Families | Single-Parent Households |
| No Children | 2 (3.4%) | 0 (0.0%) |
| 1 or 2 Children | 3 (100.0%) | 0 (0.0%) |
| 3 or 4 Children | 0 (0.0%) | 0 (0.0%) |
| 5 or more Children | 0 (0.0%) | 0 (0.0%) |
| Total | 5 (7.7%) | 0 (0.0%) |
Race in Tutuilla
The most populous races in Tutuilla are White / Caucasian (224 | 56.7%), Native / Alaskan (119 | 30.1%), and Two or more Races (33 | 8.4%).
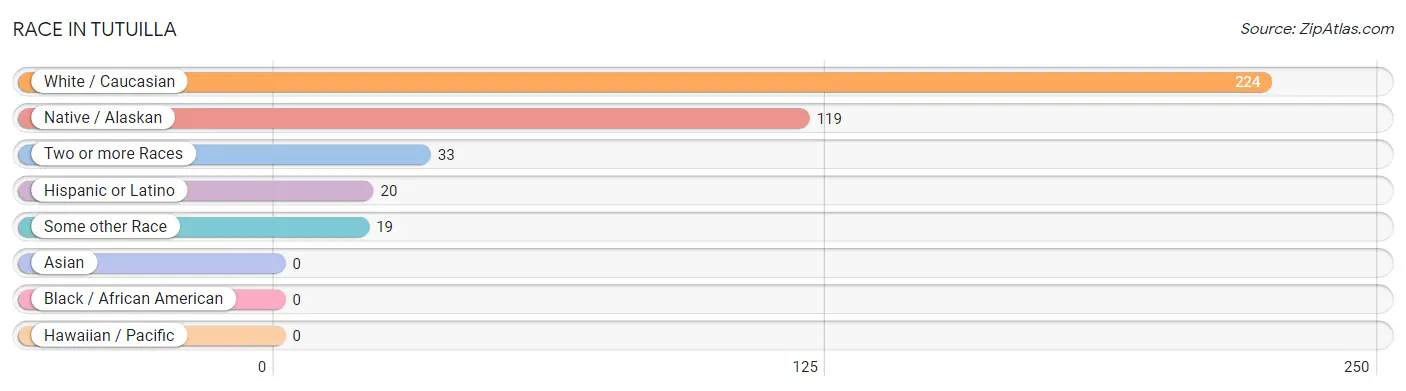
| Race | # Population | % Population |
| Asian | 0 | 0.0% |
| Black / African American | 0 | 0.0% |
| Hawaiian / Pacific | 0 | 0.0% |
| Hispanic or Latino | 20 | 5.1% |
| Native / Alaskan | 119 | 30.1% |
| White / Caucasian | 224 | 56.7% |
| Two or more Races | 33 | 8.4% |
| Some other Race | 19 | 4.8% |
| Total | 395 | 100.0% |
Ancestry in Tutuilla
The most populous ancestries reported in Tutuilla are German (56 | 14.2%), American (26 | 6.6%), English (23 | 5.8%), Italian (23 | 5.8%), and Bhutanese (12 | 3.0%), together accounting for 35.4% of all Tutuilla residents.
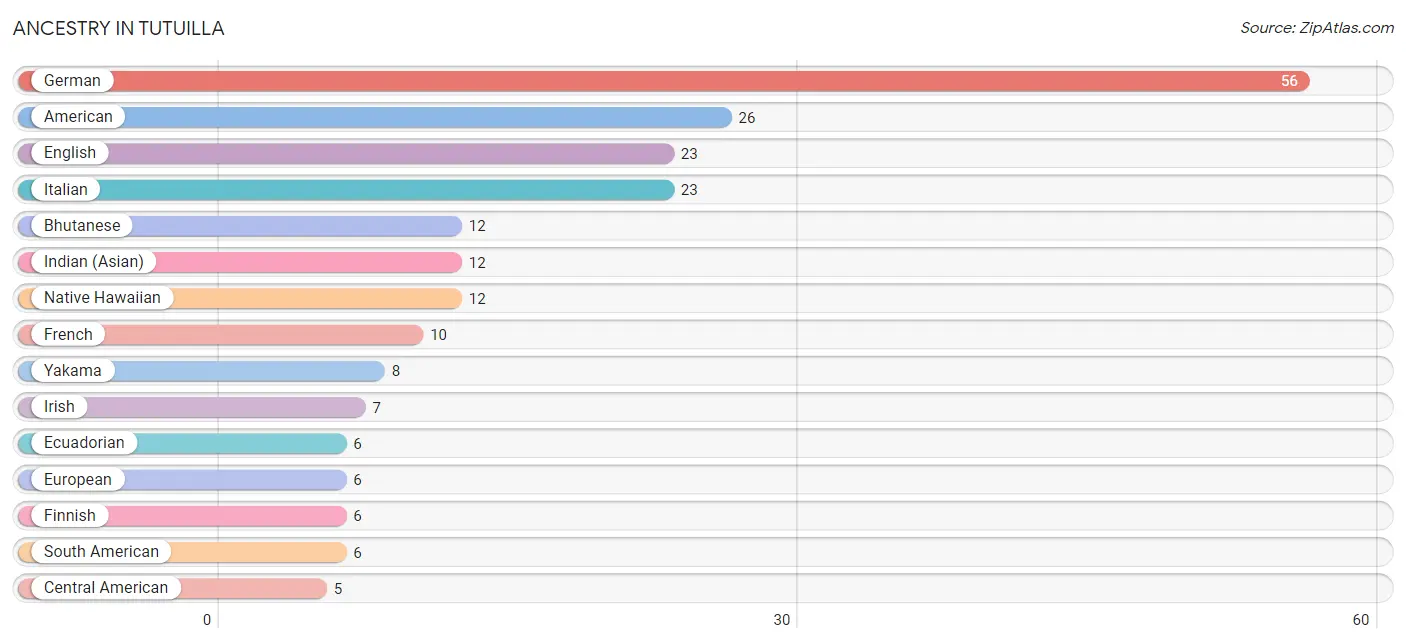
| Ancestry | # Population | % Population |
| American | 26 | 6.6% |
| Armenian | 1 | 0.3% |
| Belgian | 3 | 0.8% |
| Bhutanese | 12 | 3.0% |
| Blackfeet | 2 | 0.5% |
| Central American | 5 | 1.3% |
| Cherokee | 4 | 1.0% |
| Danish | 3 | 0.8% |
| Dutch | 3 | 0.8% |
| Ecuadorian | 6 | 1.5% |
| English | 23 | 5.8% |
| European | 6 | 1.5% |
| Finnish | 6 | 1.5% |
| French | 10 | 2.5% |
| French American Indian | 3 | 0.8% |
| German | 56 | 14.2% |
| Indian (Asian) | 12 | 3.0% |
| Irish | 7 | 1.8% |
| Iroquois | 2 | 0.5% |
| Italian | 23 | 5.8% |
| Mexican | 4 | 1.0% |
| Native Hawaiian | 12 | 3.0% |
| Navajo | 5 | 1.3% |
| Northern European | 2 | 0.5% |
| Norwegian | 4 | 1.0% |
| Polish | 4 | 1.0% |
| Pueblo | 2 | 0.5% |
| Romanian | 2 | 0.5% |
| Salvadoran | 5 | 1.3% |
| Scottish | 3 | 0.8% |
| South American | 6 | 1.5% |
| Spaniard | 2 | 0.5% |
| Swedish | 2 | 0.5% |
| Swiss | 1 | 0.3% |
| Yakama | 8 | 2.0% | View All 35 Rows |
Immigrants in Tutuilla
The most numerous immigrant groups reported in Tutuilla came from Europe (5 | 1.3%), Southern Europe (2 | 0.5%), and Spain (2 | 0.5%), together accounting for 2.3% of all Tutuilla residents.
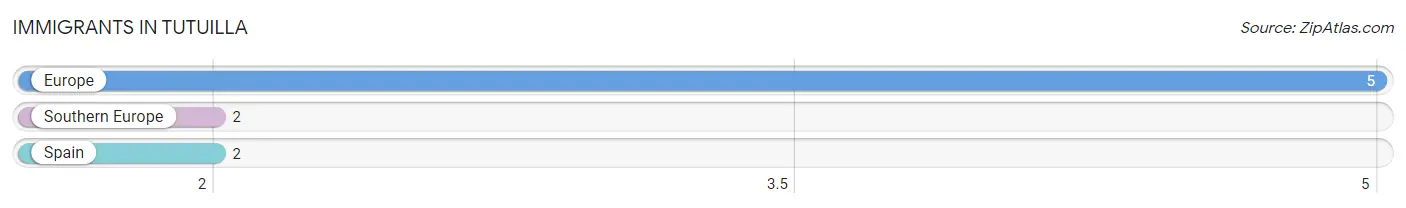
| Immigration Origin | # Population | % Population |
| Europe | 5 | 1.3% |
| Southern Europe | 2 | 0.5% |
| Spain | 2 | 0.5% | View All 3 Rows |
Sex and Age in Tutuilla
Sex and Age in Tutuilla
The most populous age groups in Tutuilla are 60 to 64 Years (25 | 15.1%) for men and 50 to 54 Years (35 | 15.2%) for women.
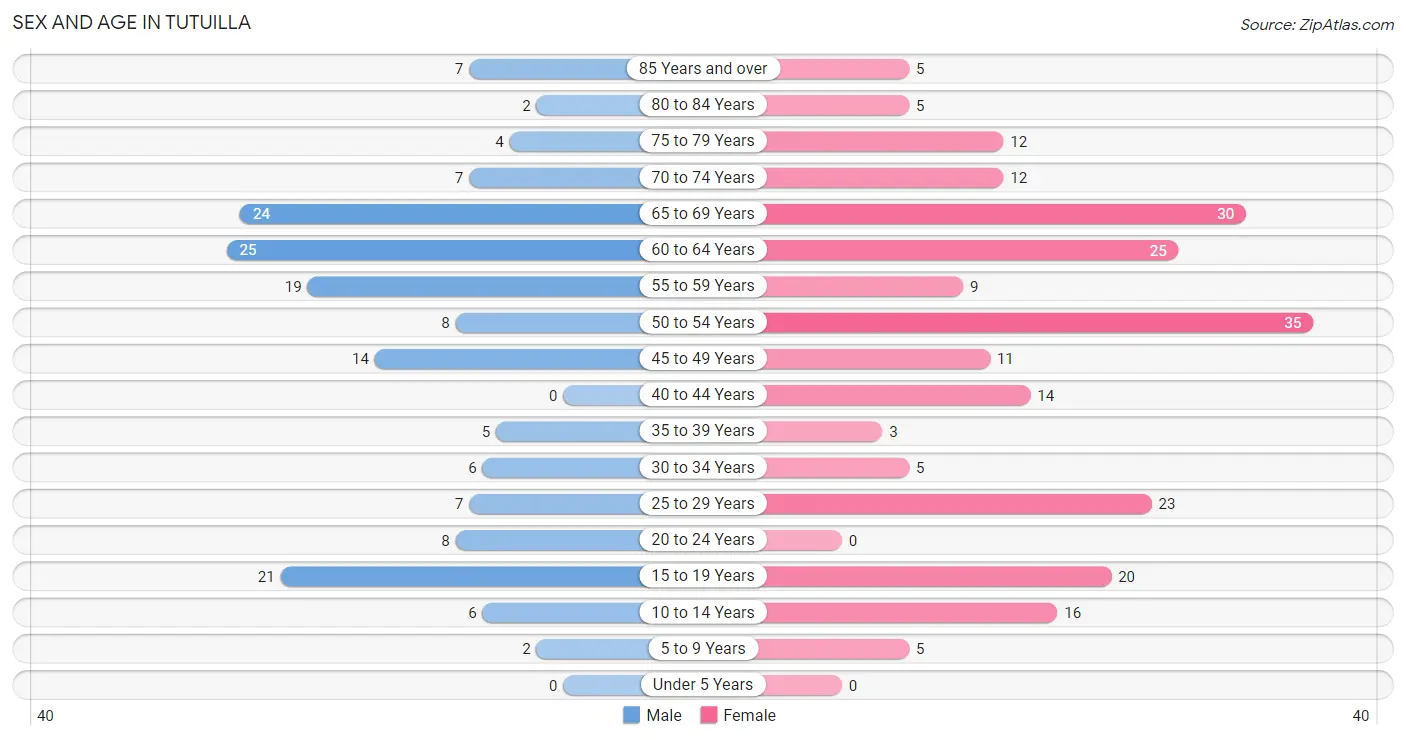
| Age Bracket | Male | Female |
| Under 5 Years | 0 (0.0%) | 0 (0.0%) |
| 5 to 9 Years | 2 (1.2%) | 5 (2.2%) |
| 10 to 14 Years | 6 (3.6%) | 16 (7.0%) |
| 15 to 19 Years | 21 (12.7%) | 20 (8.7%) |
| 20 to 24 Years | 8 (4.9%) | 0 (0.0%) |
| 25 to 29 Years | 7 (4.2%) | 23 (10.0%) |
| 30 to 34 Years | 6 (3.6%) | 5 (2.2%) |
| 35 to 39 Years | 5 (3.0%) | 3 (1.3%) |
| 40 to 44 Years | 0 (0.0%) | 14 (6.1%) |
| 45 to 49 Years | 14 (8.5%) | 11 (4.8%) |
| 50 to 54 Years | 8 (4.9%) | 35 (15.2%) |
| 55 to 59 Years | 19 (11.5%) | 9 (3.9%) |
| 60 to 64 Years | 25 (15.1%) | 25 (10.9%) |
| 65 to 69 Years | 24 (14.5%) | 30 (13.0%) |
| 70 to 74 Years | 7 (4.2%) | 12 (5.2%) |
| 75 to 79 Years | 4 (2.4%) | 12 (5.2%) |
| 80 to 84 Years | 2 (1.2%) | 5 (2.2%) |
| 85 Years and over | 7 (4.2%) | 5 (2.2%) |
| Total | 165 (100.0%) | 230 (100.0%) |
Families and Households in Tutuilla
Median Family Size in Tutuilla
The median family size in Tutuilla is 2.67 persons per family, with single male/father families (8 | 7.0%) accounting for the largest median family size of 3.5 persons per family. On the other hand, single female/mother families (42 | 36.5%) represent the smallest median family size with 2.52 persons per family.
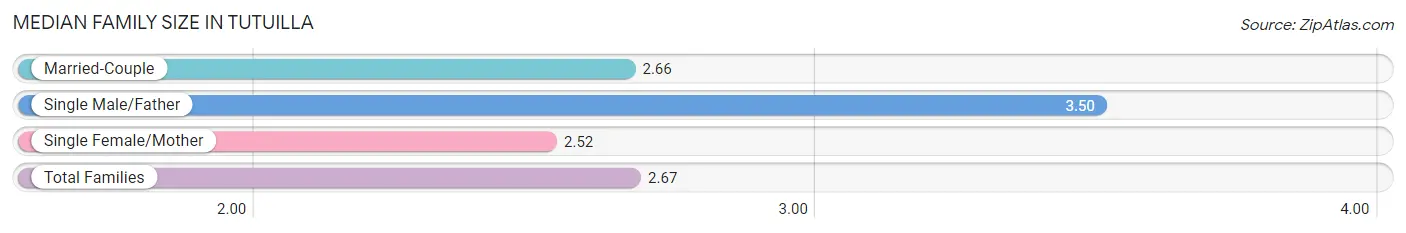
| Family Type | # Families | Family Size |
| Married-Couple | 65 (56.5%) | 2.66 |
| Single Male/Father | 8 (7.0%) | 3.50 |
| Single Female/Mother | 42 (36.5%) | 2.52 |
| Total Families | 115 (100.0%) | 2.67 |
Median Household Size in Tutuilla
The median household size in Tutuilla is 2.38 persons per household, with single male/father households (8 | 4.8%) accounting for the largest median household size of 4 persons per household. non-family households (51 | 30.7%) represent the smallest median household size with 1.25 persons per household.
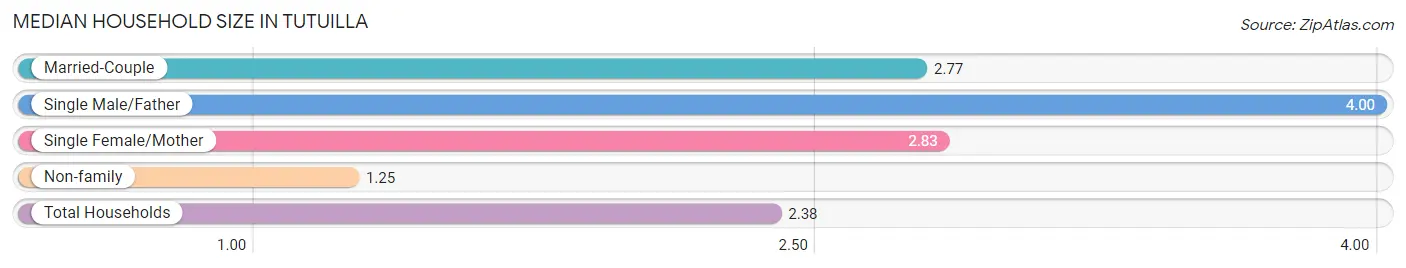
| Household Type | # Households | Household Size |
| Married-Couple | 65 (39.2%) | 2.77 |
| Single Male/Father | 8 (4.8%) | 4.00 |
| Single Female/Mother | 42 (25.3%) | 2.83 |
| Non-family | 51 (30.7%) | 1.25 |
| Total Households | 166 (100.0%) | 2.38 |
Household Size by Marriage Status in Tutuilla
Out of a total of 166 households in Tutuilla, 115 (69.3%) are family households, while 51 (30.7%) are nonfamily households. The most numerous type of family households are 2-person households, comprising 66, and the most common type of nonfamily households are 1-person households, comprising 40.
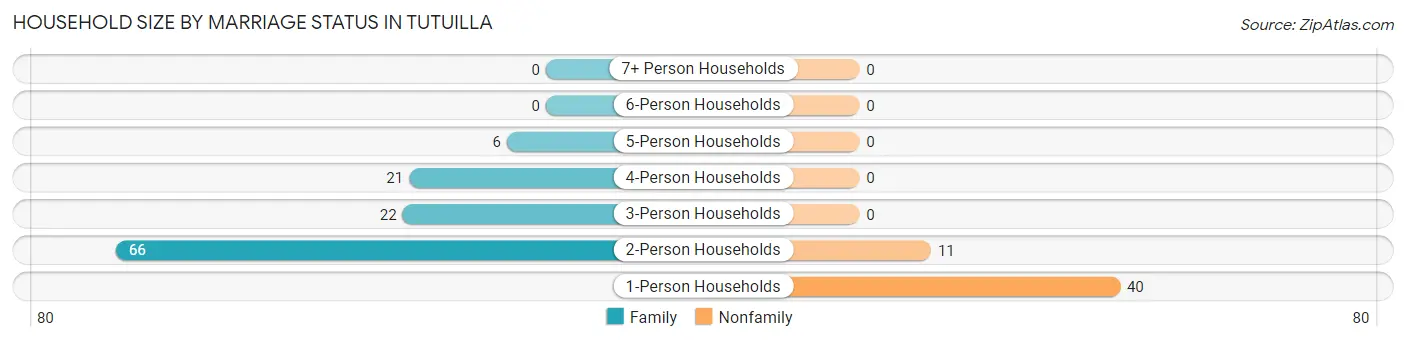
| Household Size | Family Households | Nonfamily Households |
| 1-Person Households | - | 40 (24.1%) |
| 2-Person Households | 66 (39.8%) | 11 (6.6%) |
| 3-Person Households | 22 (13.3%) | 0 (0.0%) |
| 4-Person Households | 21 (12.7%) | 0 (0.0%) |
| 5-Person Households | 6 (3.6%) | 0 (0.0%) |
| 6-Person Households | 0 (0.0%) | 0 (0.0%) |
| 7+ Person Households | 0 (0.0%) | 0 (0.0%) |
| Total | 115 (69.3%) | 51 (30.7%) |
Female Fertility in Tutuilla
Fertility by Age in Tutuilla
| Age Bracket | Women with Births | Births / 1,000 Women |
| 15 to 19 years | 0 (0.0%) | 0.0 |
| 20 to 34 years | 0 (0.0%) | 0.0 |
| 35 to 50 years | 0 (0.0%) | 0.0 |
| Total | 0 (0.0%) | 0.0 |
Fertility by Age by Marriage Status in Tutuilla
| Age Bracket | Married | Unmarried |
| 15 to 19 years | 0 (0.0%) | 0 (0.0%) |
| 20 to 34 years | 0 (0.0%) | 0 (0.0%) |
| 35 to 50 years | 0 (0.0%) | 0 (0.0%) |
| Total | 0 (0.0%) | 0 (0.0%) |
Fertility by Education in Tutuilla
| Educational Attainment | Women with Births | Births / 1,000 Women |
| Less than High School | 0 (0.0%) | 0.0 |
| High School Diploma | 0 (0.0%) | 0.0 |
| College or Associate's Degree | 0 (0.0%) | 0.0 |
| Bachelor's Degree | 0 (0.0%) | 0.0 |
| Graduate Degree | 0 (0.0%) | 0.0 |
| Total | 0 (0.0%) | 0.0 |
Fertility by Education by Marriage Status in Tutuilla
| Educational Attainment | Married | Unmarried |
| Less than High School | 0 (0.0%) | 0 (0.0%) |
| High School Diploma | 0 (0.0%) | 0 (0.0%) |
| College or Associate's Degree | 0 (0.0%) | 0 (0.0%) |
| Bachelor's Degree | 0 (0.0%) | 0 (0.0%) |
| Graduate Degree | 0 (0.0%) | 0 (0.0%) |
| Total | 0 (0.0%) | 0 (0.0%) |
Employment Characteristics in Tutuilla
Employment by Class of Employer in Tutuilla
Among the 189 employed individuals in Tutuilla, private company employees (105 | 55.6%), federal government employees (33 | 17.5%), and local government employees (22 | 11.6%) make up the most common classes of employment.
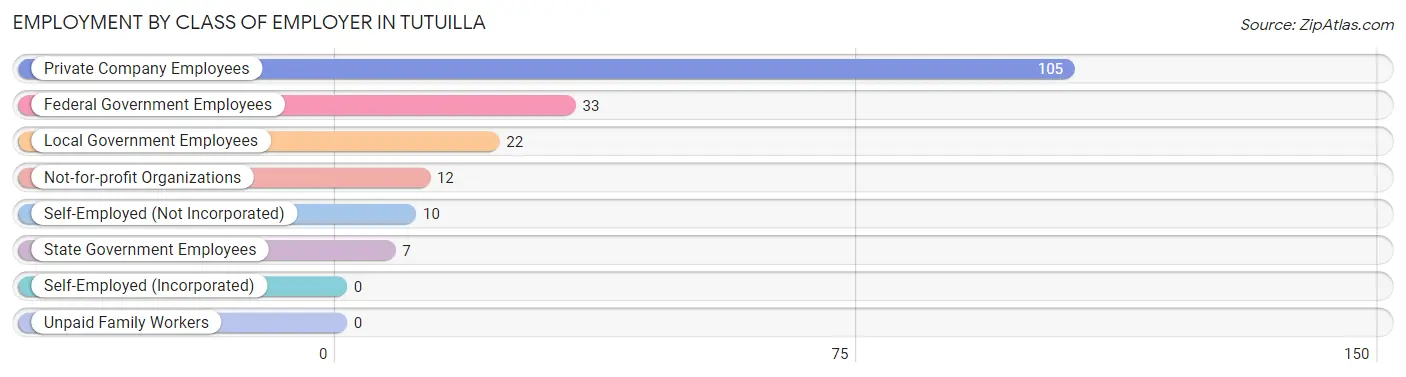
| Employer Class | # Employees | % Employees |
| Private Company Employees | 105 | 55.6% |
| Self-Employed (Incorporated) | 0 | 0.0% |
| Self-Employed (Not Incorporated) | 10 | 5.3% |
| Not-for-profit Organizations | 12 | 6.4% |
| Local Government Employees | 22 | 11.6% |
| State Government Employees | 7 | 3.7% |
| Federal Government Employees | 33 | 17.5% |
| Unpaid Family Workers | 0 | 0.0% |
| Total | 189 | 100.0% |
Employment Status by Age in Tutuilla
According to the labor force statistics for Tutuilla, out of the total population over 16 years of age (355), 57.5% or 204 individuals are in the labor force, with 3.4% or 7 of them unemployed. The age group with the highest labor force participation rate is 20 to 24 years, with 100.0% or 8 individuals in the labor force. Within the labor force, the 25 to 29 years age range has the highest percentage of unemployed individuals, with 23.3% or 7 of them being unemployed.
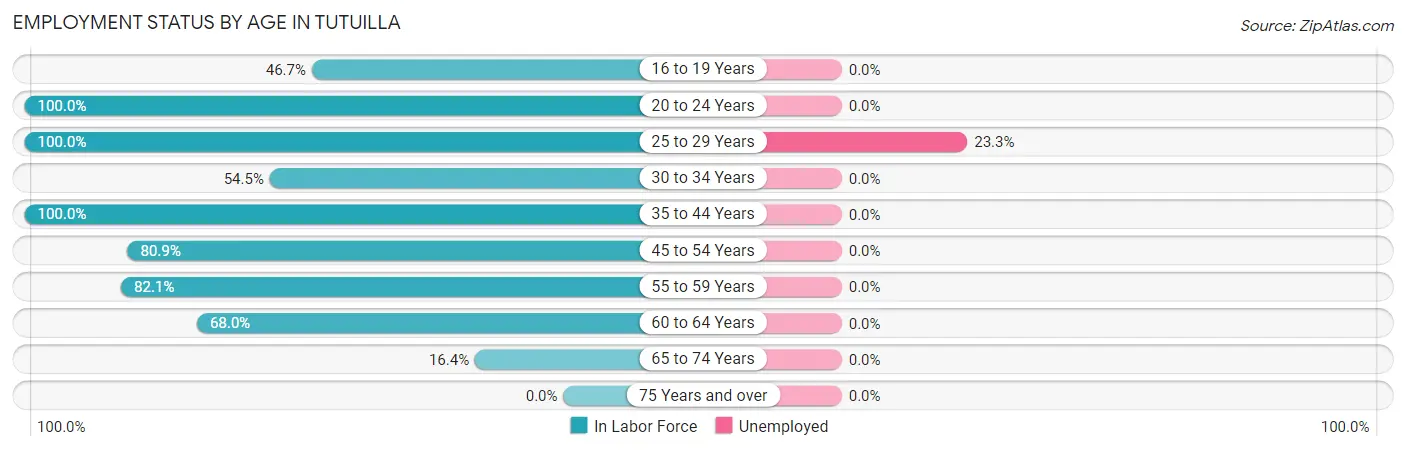
| Age Bracket | In Labor Force | Unemployed |
| 16 to 19 Years | 14 (46.7%) | 0 (0.0%) |
| 20 to 24 Years | 8 (100.0%) | 0 (0.0%) |
| 25 to 29 Years | 30 (100.0%) | 7 (23.3%) |
| 30 to 34 Years | 6 (54.5%) | 0 (0.0%) |
| 35 to 44 Years | 22 (100.0%) | 0 (0.0%) |
| 45 to 54 Years | 55 (80.9%) | 0 (0.0%) |
| 55 to 59 Years | 23 (82.1%) | 0 (0.0%) |
| 60 to 64 Years | 34 (68.0%) | 0 (0.0%) |
| 65 to 74 Years | 12 (16.4%) | 0 (0.0%) |
| 75 Years and over | 0 (0.0%) | 0 (0.0%) |
| Total | 204 (57.5%) | 7 (3.4%) |
Employment Status by Educational Attainment in Tutuilla
According to labor force statistics for Tutuilla, 81.3% of individuals (170) out of the total population between 25 and 64 years of age (209) are in the labor force, with 4.1% or 7 of them being unemployed. The group with the highest labor force participation rate are those with the educational attainment of less than high school, with 100.0% or 12 individuals in the labor force. Within the labor force, individuals with high school diploma education have the highest percentage of unemployment, with 11.5% or 7 of them being unemployed.
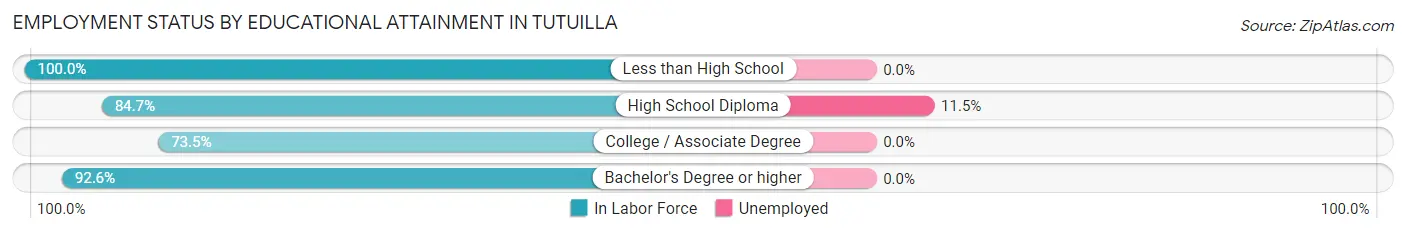
| Educational Attainment | In Labor Force | Unemployed |
| Less than High School | 12 (100.0%) | 0 (0.0%) |
| High School Diploma | 61 (84.7%) | 8 (11.5%) |
| College / Associate Degree | 72 (73.5%) | 0 (0.0%) |
| Bachelor's Degree or higher | 25 (92.6%) | 0 (0.0%) |
| Total | 170 (81.3%) | 9 (4.1%) |
Employment Occupations by Sex in Tutuilla
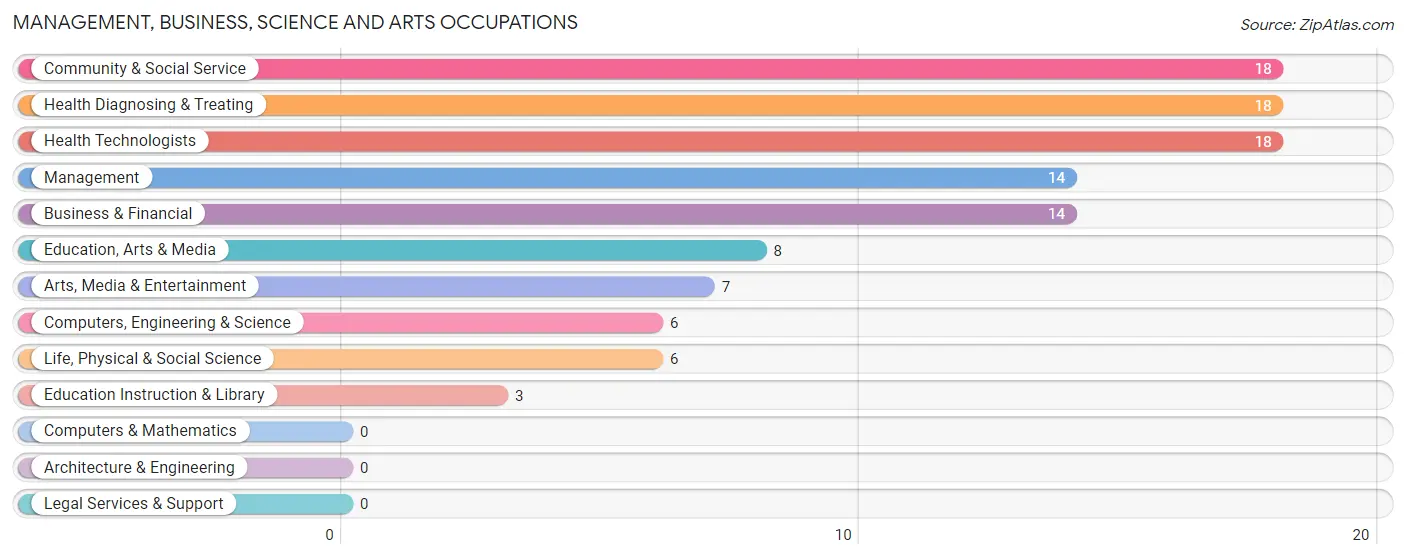
Management, Business, Science and Arts Occupations
The most common Management, Business, Science and Arts occupations in Tutuilla are Community & Social Service (18 | 9.1%), Health Diagnosing & Treating (18 | 9.1%), Health Technologists (18 | 9.1%), Management (14 | 7.1%), and Business & Financial (14 | 7.1%).
Management, Business, Science and Arts Occupations by Sex
Within the Management, Business, Science and Arts occupations in Tutuilla, the most male-oriented occupations are Computers, Engineering & Science (100.0%), Life, Physical & Social Science (100.0%), and Management (78.6%), while the most female-oriented occupations are Community & Social Service (100.0%), Education, Arts & Media (100.0%), and Education Instruction & Library (100.0%).
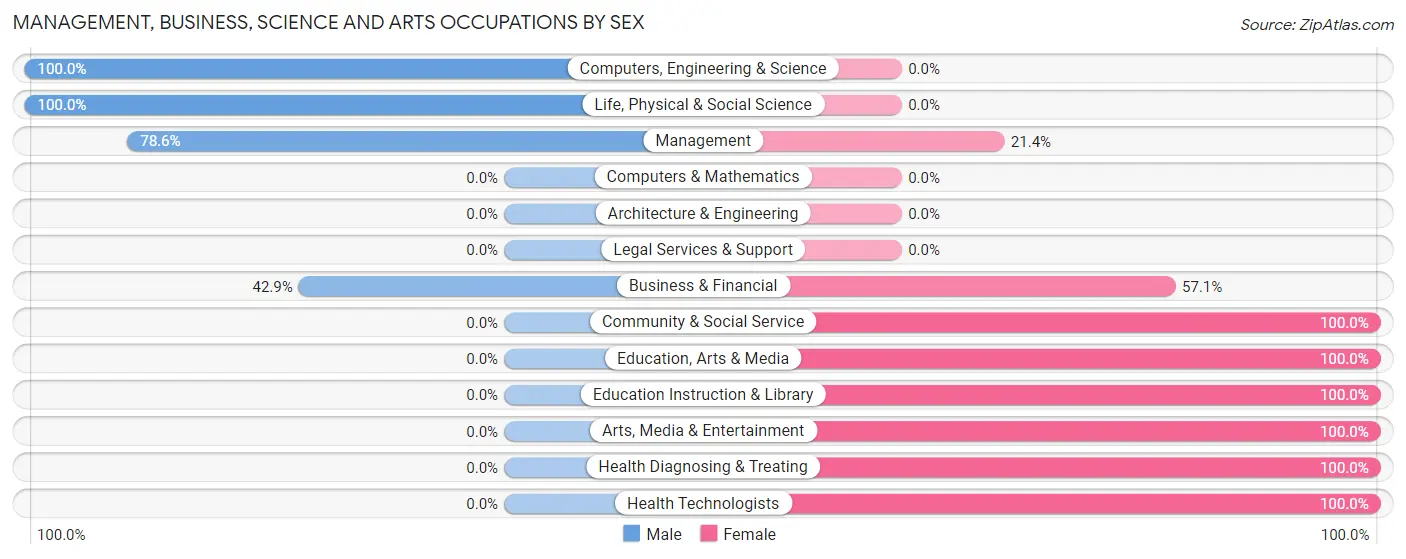
| Occupation | Male | Female |
| Management | 11 (78.6%) | 3 (21.4%) |
| Business & Financial | 6 (42.9%) | 8 (57.1%) |
| Computers, Engineering & Science | 6 (100.0%) | 0 (0.0%) |
| Computers & Mathematics | 0 (0.0%) | 0 (0.0%) |
| Architecture & Engineering | 0 (0.0%) | 0 (0.0%) |
| Life, Physical & Social Science | 6 (100.0%) | 0 (0.0%) |
| Community & Social Service | 0 (0.0%) | 18 (100.0%) |
| Education, Arts & Media | 0 (0.0%) | 8 (100.0%) |
| Legal Services & Support | 0 (0.0%) | 0 (0.0%) |
| Education Instruction & Library | 0 (0.0%) | 3 (100.0%) |
| Arts, Media & Entertainment | 0 (0.0%) | 7 (100.0%) |
| Health Diagnosing & Treating | 0 (0.0%) | 18 (100.0%) |
| Health Technologists | 0 (0.0%) | 18 (100.0%) |
| Total (Category) | 23 (32.9%) | 47 (67.1%) |
| Total (Overall) | 77 (39.1%) | 120 (60.9%) |
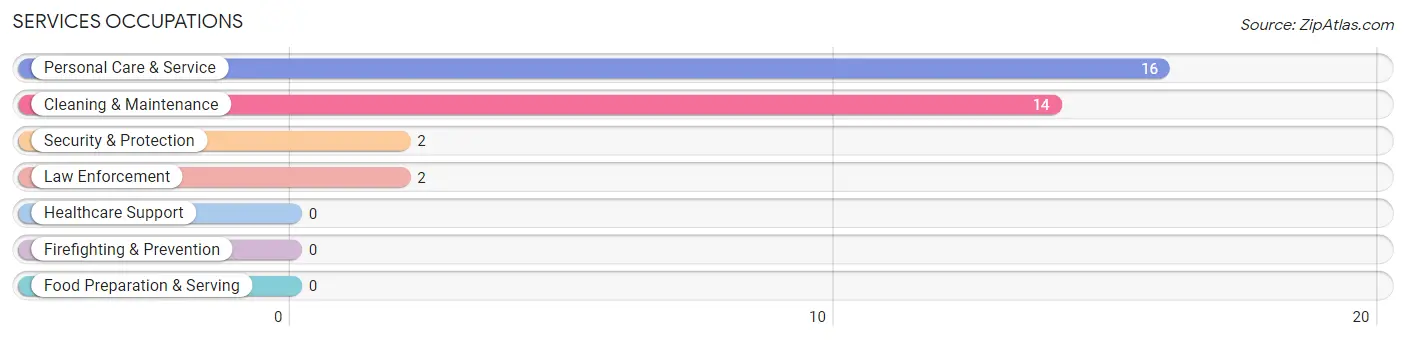
Services Occupations
The most common Services occupations in Tutuilla are Personal Care & Service (16 | 8.1%), Cleaning & Maintenance (14 | 7.1%), Security & Protection (2 | 1.0%), and Law Enforcement (2 | 1.0%).
Services Occupations by Sex
Within the Services occupations in Tutuilla, the most male-oriented occupations are Security & Protection (100.0%), Law Enforcement (100.0%), and Cleaning & Maintenance (64.3%), while the most female-oriented occupations are Personal Care & Service (100.0%), and Cleaning & Maintenance (35.7%).
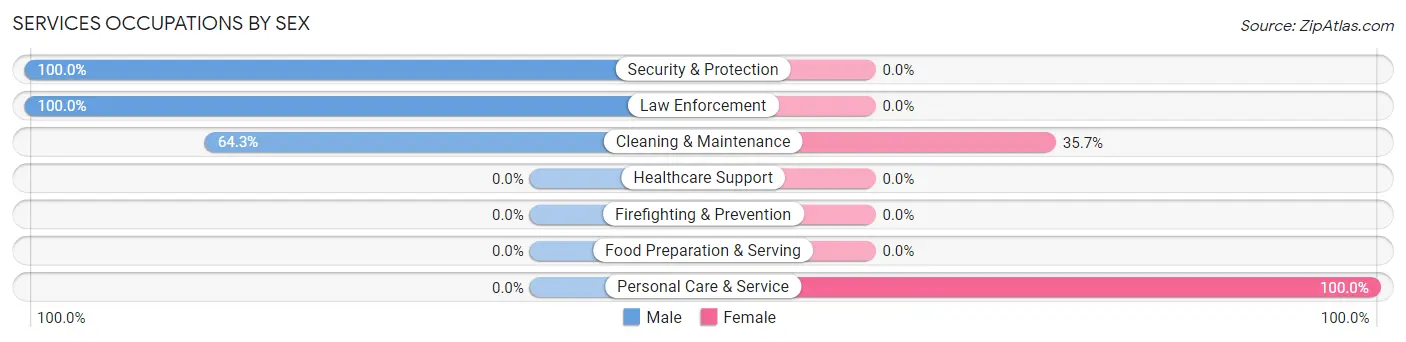
| Occupation | Male | Female |
| Healthcare Support | 0 (0.0%) | 0 (0.0%) |
| Security & Protection | 2 (100.0%) | 0 (0.0%) |
| Firefighting & Prevention | 0 (0.0%) | 0 (0.0%) |
| Law Enforcement | 2 (100.0%) | 0 (0.0%) |
| Food Preparation & Serving | 0 (0.0%) | 0 (0.0%) |
| Cleaning & Maintenance | 9 (64.3%) | 5 (35.7%) |
| Personal Care & Service | 0 (0.0%) | 16 (100.0%) |
| Total (Category) | 11 (34.4%) | 21 (65.6%) |
| Total (Overall) | 77 (39.1%) | 120 (60.9%) |
Sales and Office Occupations
The most common Sales and Office occupations in Tutuilla are Office & Administration (33 | 16.8%), and Sales & Related (18 | 9.1%).

Sales and Office Occupations by Sex

| Occupation | Male | Female |
| Sales & Related | 6 (33.3%) | 12 (66.7%) |
| Office & Administration | 6 (18.2%) | 27 (81.8%) |
| Total (Category) | 12 (23.5%) | 39 (76.5%) |
| Total (Overall) | 77 (39.1%) | 120 (60.9%) |
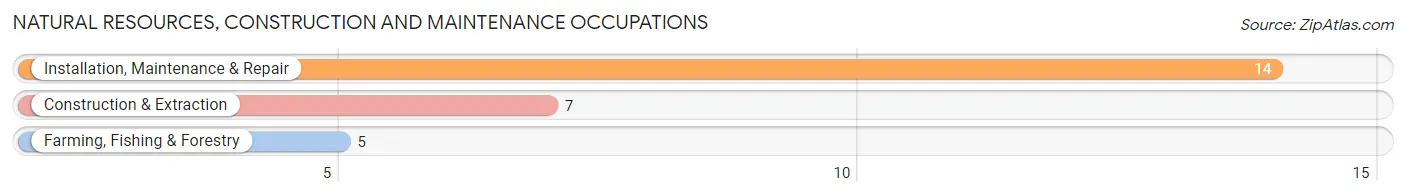
Natural Resources, Construction and Maintenance Occupations
The most common Natural Resources, Construction and Maintenance occupations in Tutuilla are Installation, Maintenance & Repair (14 | 7.1%), Construction & Extraction (7 | 3.5%), and Farming, Fishing & Forestry (5 | 2.5%).
Natural Resources, Construction and Maintenance Occupations by Sex
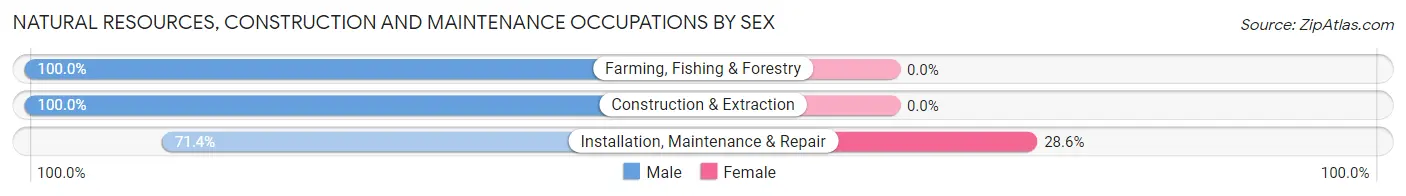
| Occupation | Male | Female |
| Farming, Fishing & Forestry | 5 (100.0%) | 0 (0.0%) |
| Construction & Extraction | 7 (100.0%) | 0 (0.0%) |
| Installation, Maintenance & Repair | 10 (71.4%) | 4 (28.6%) |
| Total (Category) | 22 (84.6%) | 4 (15.4%) |
| Total (Overall) | 77 (39.1%) | 120 (60.9%) |
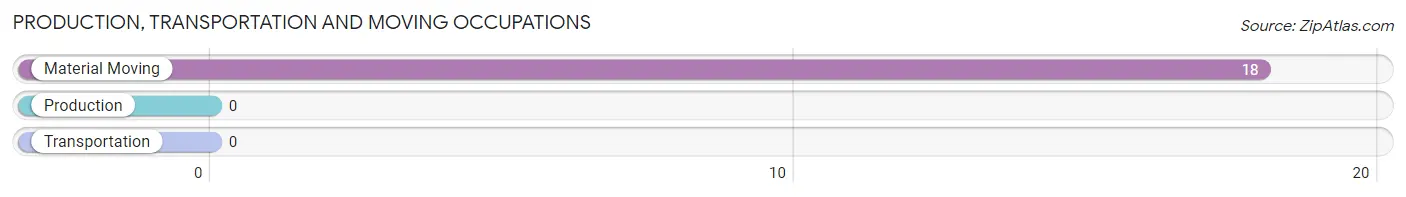
Production, Transportation and Moving Occupations
The most common Production, Transportation and Moving occupations in Tutuilla are , and Material Moving (18 | 9.1%).
Production, Transportation and Moving Occupations by Sex
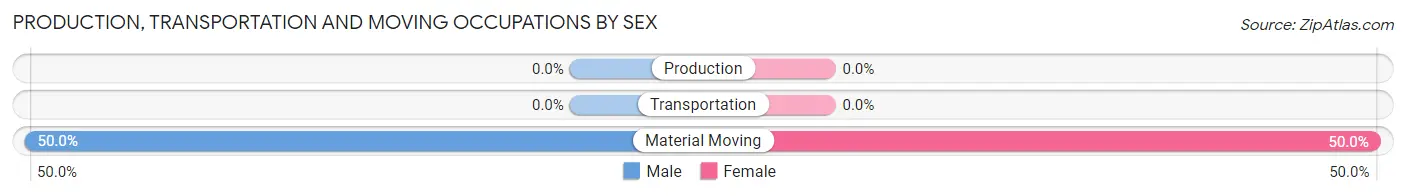
| Occupation | Male | Female |
| Production | 0 (0.0%) | 0 (0.0%) |
| Transportation | 0 (0.0%) | 0 (0.0%) |
| Material Moving | 9 (50.0%) | 9 (50.0%) |
| Total (Category) | 9 (50.0%) | 9 (50.0%) |
| Total (Overall) | 77 (39.1%) | 120 (60.9%) |
Employment Industries by Sex in Tutuilla
Employment Industries in Tutuilla
The major employment industries in Tutuilla include Public Administration (50 | 25.4%), Arts, Entertainment & Recreation (19 | 9.6%), Accommodation & Food Services (19 | 9.6%), Health Care & Social Assistance (16 | 8.1%), and Construction (14 | 7.1%).
Employment Industries by Sex in Tutuilla
The Tutuilla industries that see more men than women are Agriculture, Fishing & Hunting (100.0%), Construction (100.0%), and Professional & Scientific (100.0%), whereas the industries that tend to have a higher number of women are Educational Services (100.0%), Retail Trade (84.6%), and Health Care & Social Assistance (81.2%).
| Industry | Male | Female |
| Agriculture, Fishing & Hunting | 8 (100.0%) | 0 (0.0%) |
| Mining, Quarrying, & Extraction | 0 (0.0%) | 0 (0.0%) |
| Construction | 14 (100.0%) | 0 (0.0%) |
| Manufacturing | 5 (45.5%) | 6 (54.5%) |
| Wholesale Trade | 0 (0.0%) | 0 (0.0%) |
| Retail Trade | 2 (15.4%) | 11 (84.6%) |
| Transportation & Warehousing | 4 (30.8%) | 9 (69.2%) |
| Utilities | 0 (0.0%) | 0 (0.0%) |
| Information | 0 (0.0%) | 0 (0.0%) |
| Finance & Insurance | 2 (28.6%) | 5 (71.4%) |
| Real Estate, Rental & Leasing | 0 (0.0%) | 0 (0.0%) |
| Professional & Scientific | 3 (100.0%) | 0 (0.0%) |
| Enterprise Management | 0 (0.0%) | 0 (0.0%) |
| Administrative & Support | 3 (100.0%) | 0 (0.0%) |
| Educational Services | 0 (0.0%) | 10 (100.0%) |
| Health Care & Social Assistance | 3 (18.8%) | 13 (81.2%) |
| Arts, Entertainment & Recreation | 5 (26.3%) | 14 (73.7%) |
| Accommodation & Food Services | 10 (52.6%) | 9 (47.4%) |
| Public Administration | 11 (22.0%) | 39 (78.0%) |
| Total | 77 (39.1%) | 120 (60.9%) |
Education in Tutuilla
School Enrollment in Tutuilla
The most common levels of schooling among the 83 students in Tutuilla are high school (33 | 39.8%), college / undergraduate (20 | 24.1%), and middle school (19 | 22.9%).
| School Level | # Students | % Students |
| Nursery / Preschool | 0 | 0.0% |
| Kindergarten | 0 | 0.0% |
| Elementary School | 8 | 9.6% |
| Middle School | 19 | 22.9% |
| High School | 33 | 39.8% |
| College / Undergraduate | 20 | 24.1% |
| Graduate / Professional | 3 | 3.6% |
| Total | 83 | 100.0% |
School Enrollment by Age by Funding Source in Tutuilla
Out of a total of 83 students who are enrolled in schools in Tutuilla, 7 (8.4%) attend a private institution, while the remaining 76 (91.6%) are enrolled in public schools. The age group of 35 years and over has the highest likelihood of being enrolled in private schools, with 7 (46.7% in the age bracket) enrolled. Conversely, the age group of 5 to 9 year old has the lowest likelihood of being enrolled in a private school, with 5 (100.0% in the age bracket) attending a public institution.
| Age Bracket | Public School | Private School |
| 3 to 4 Year Olds | 0 (0.0%) | 0 (0.0%) |
| 5 to 9 Year Old | 5 (100.0%) | 0 (0.0%) |
| 10 to 14 Year Olds | 22 (100.0%) | 0 (0.0%) |
| 15 to 17 Year Olds | 27 (100.0%) | 0 (0.0%) |
| 18 to 19 Year Olds | 14 (100.0%) | 0 (0.0%) |
| 20 to 24 Year Olds | 0 (0.0%) | 0 (0.0%) |
| 25 to 34 Year Olds | 0 (0.0%) | 0 (0.0%) |
| 35 Years and over | 8 (53.3%) | 7 (46.7%) |
| Total | 76 (91.6%) | 7 (8.4%) |
Educational Attainment by Field of Study in Tutuilla
Physical & health sciences (12 | 26.7%), education (10 | 22.2%), business (6 | 13.3%), bio, nature & agricultural (5 | 11.1%), and psychology (5 | 11.1%) are the most common fields of study among 45 individuals in Tutuilla who have obtained a bachelor's degree or higher.
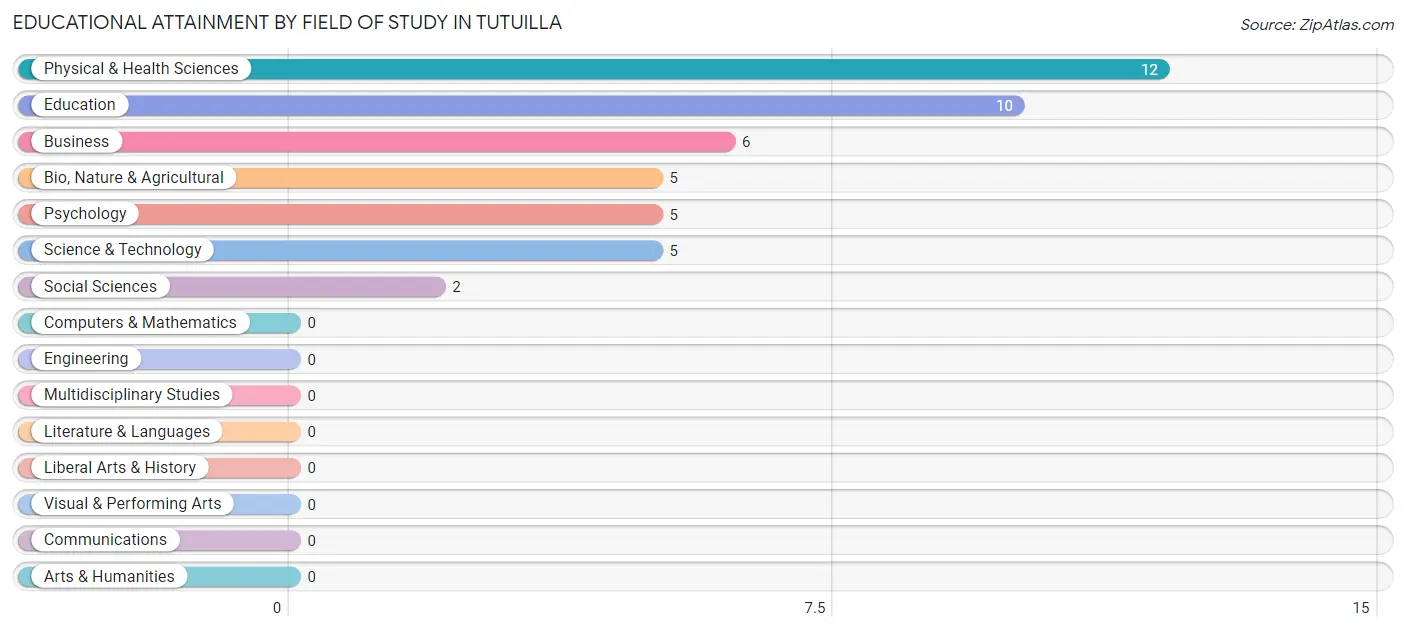
| Field of Study | # Graduates | % Graduates |
| Computers & Mathematics | 0 | 0.0% |
| Bio, Nature & Agricultural | 5 | 11.1% |
| Physical & Health Sciences | 12 | 26.7% |
| Psychology | 5 | 11.1% |
| Social Sciences | 2 | 4.4% |
| Engineering | 0 | 0.0% |
| Multidisciplinary Studies | 0 | 0.0% |
| Science & Technology | 5 | 11.1% |
| Business | 6 | 13.3% |
| Education | 10 | 22.2% |
| Literature & Languages | 0 | 0.0% |
| Liberal Arts & History | 0 | 0.0% |
| Visual & Performing Arts | 0 | 0.0% |
| Communications | 0 | 0.0% |
| Arts & Humanities | 0 | 0.0% |
| Total | 45 | 100.0% |
Transportation & Commute in Tutuilla
Vehicle Availability by Sex in Tutuilla
The most prevalent vehicle ownership categories in Tutuilla are males with 3 vehicles (35, accounting for 47.9%) and females with 3 vehicles (34, making up 30.2%).
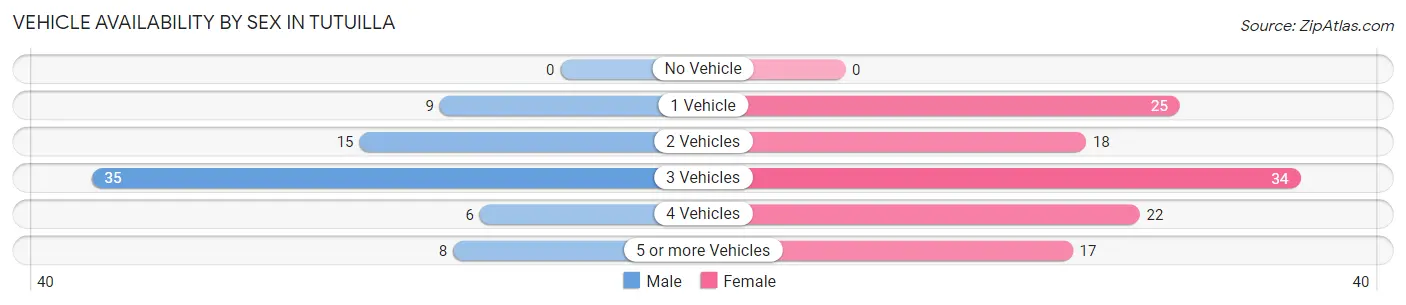
| Vehicles Available | Male | Female |
| No Vehicle | 0 (0.0%) | 0 (0.0%) |
| 1 Vehicle | 9 (12.3%) | 25 (21.5%) |
| 2 Vehicles | 15 (20.5%) | 18 (15.5%) |
| 3 Vehicles | 35 (47.9%) | 34 (29.3%) |
| 4 Vehicles | 6 (8.2%) | 22 (19.0%) |
| 5 or more Vehicles | 8 (11.0%) | 17 (14.7%) |
| Total | 73 (100.0%) | 116 (100.0%) |
Commute Time in Tutuilla
The most frequently occuring commute durations in Tutuilla are 5 to 9 minutes (64 commuters, 33.9%), 20 to 24 minutes (47 commuters, 24.9%), and 15 to 19 minutes (43 commuters, 22.8%).
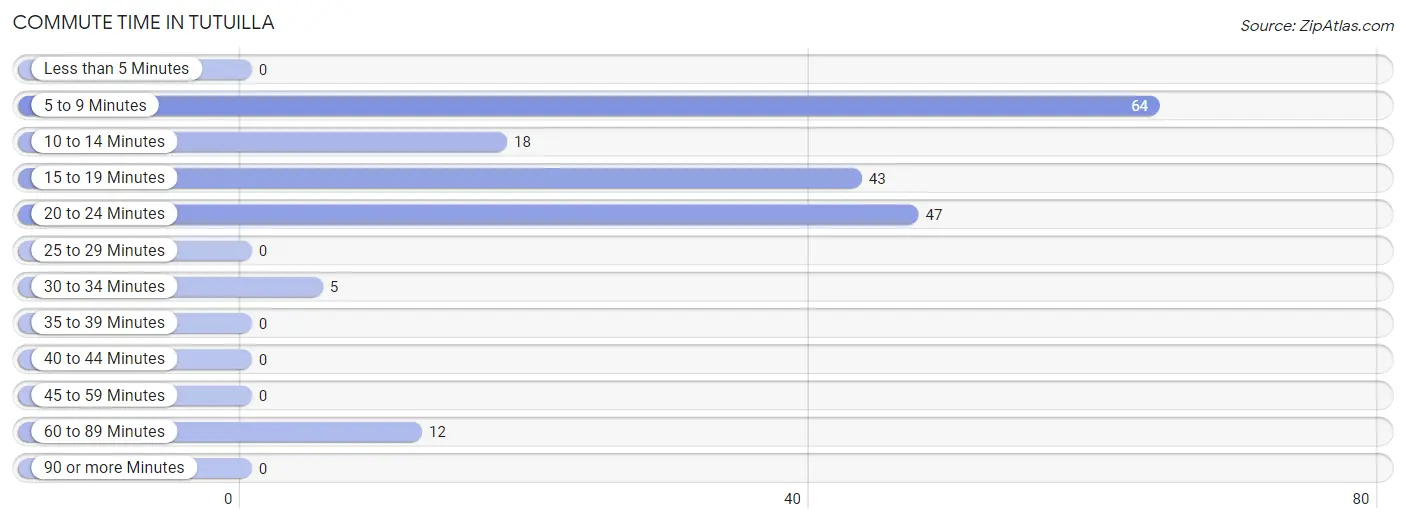
| Commute Time | # Commuters | % Commuters |
| Less than 5 Minutes | 0 | 0.0% |
| 5 to 9 Minutes | 64 | 33.9% |
| 10 to 14 Minutes | 18 | 9.5% |
| 15 to 19 Minutes | 43 | 22.8% |
| 20 to 24 Minutes | 47 | 24.9% |
| 25 to 29 Minutes | 0 | 0.0% |
| 30 to 34 Minutes | 5 | 2.6% |
| 35 to 39 Minutes | 0 | 0.0% |
| 40 to 44 Minutes | 0 | 0.0% |
| 45 to 59 Minutes | 0 | 0.0% |
| 60 to 89 Minutes | 12 | 6.4% |
| 90 or more Minutes | 0 | 0.0% |
Commute Time by Sex in Tutuilla
The most common commute times in Tutuilla are 5 to 9 minutes (30 commuters, 41.1%) for males and 15 to 19 minutes (35 commuters, 30.2%) for females.
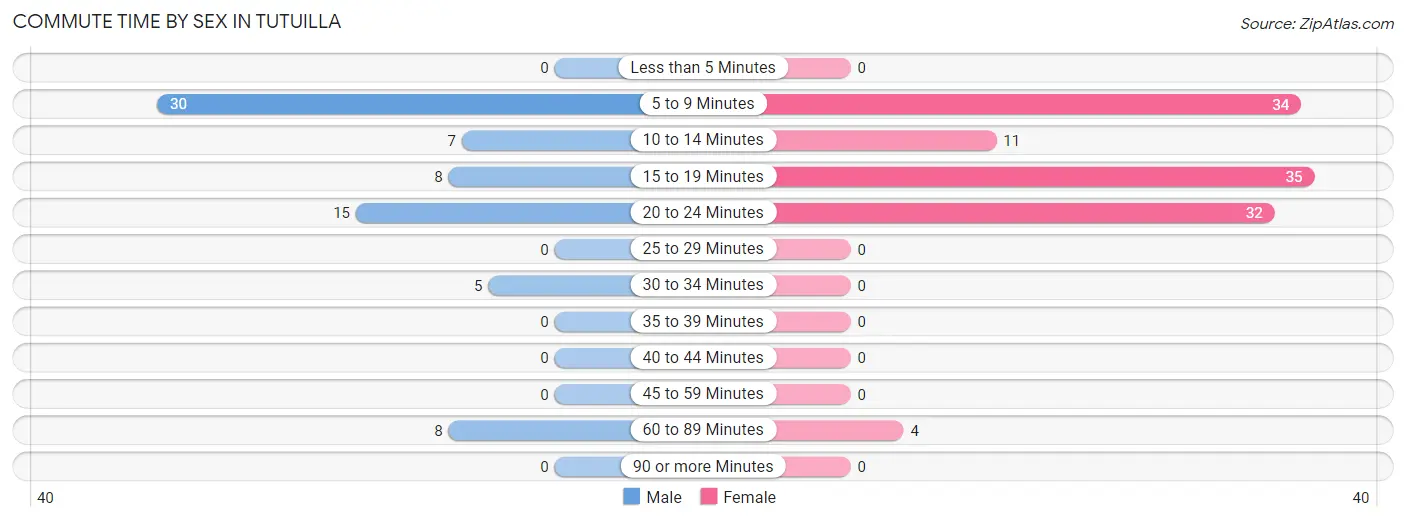
| Commute Time | Male | Female |
| Less than 5 Minutes | 0 (0.0%) | 0 (0.0%) |
| 5 to 9 Minutes | 30 (41.1%) | 34 (29.3%) |
| 10 to 14 Minutes | 7 (9.6%) | 11 (9.5%) |
| 15 to 19 Minutes | 8 (11.0%) | 35 (30.2%) |
| 20 to 24 Minutes | 15 (20.5%) | 32 (27.6%) |
| 25 to 29 Minutes | 0 (0.0%) | 0 (0.0%) |
| 30 to 34 Minutes | 5 (6.9%) | 0 (0.0%) |
| 35 to 39 Minutes | 0 (0.0%) | 0 (0.0%) |
| 40 to 44 Minutes | 0 (0.0%) | 0 (0.0%) |
| 45 to 59 Minutes | 0 (0.0%) | 0 (0.0%) |
| 60 to 89 Minutes | 8 (11.0%) | 4 (3.5%) |
| 90 or more Minutes | 0 (0.0%) | 0 (0.0%) |
Time of Departure to Work by Sex in Tutuilla
The most frequent times of departure to work in Tutuilla are 5:00 AM to 5:29 AM (15, 20.5%) for males and 7:00 AM to 7:29 AM (49, 42.2%) for females.
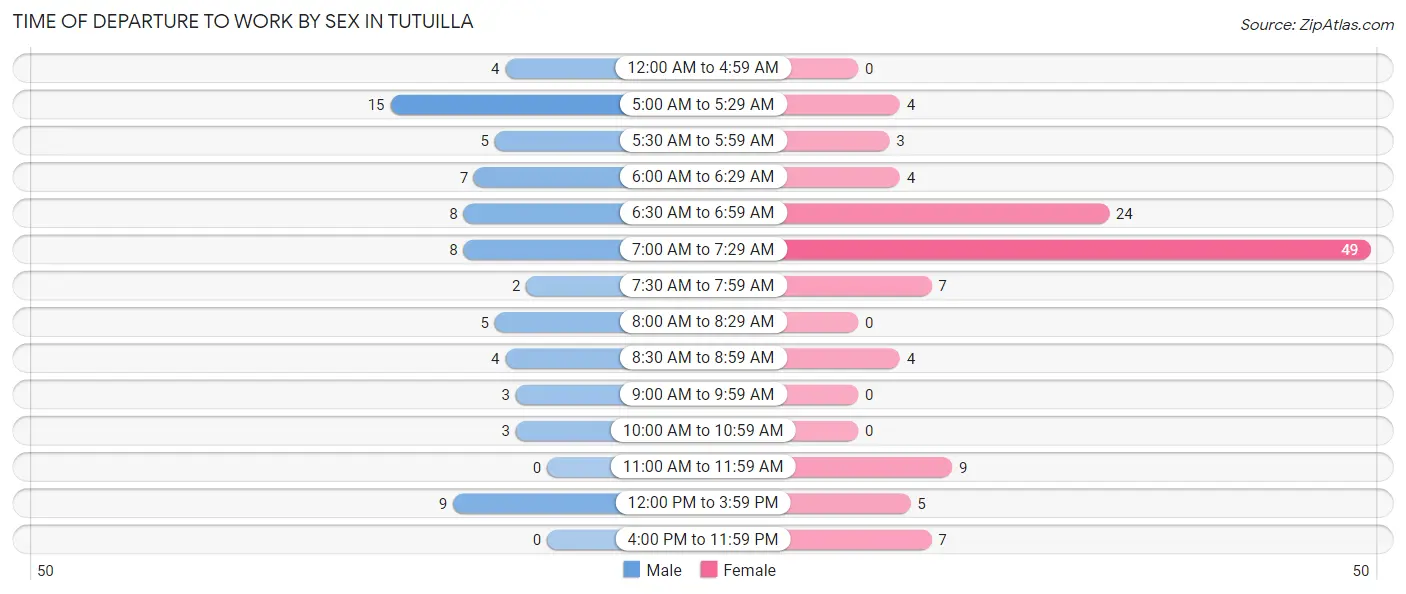
| Time of Departure | Male | Female |
| 12:00 AM to 4:59 AM | 4 (5.5%) | 0 (0.0%) |
| 5:00 AM to 5:29 AM | 15 (20.5%) | 4 (3.5%) |
| 5:30 AM to 5:59 AM | 5 (6.9%) | 3 (2.6%) |
| 6:00 AM to 6:29 AM | 7 (9.6%) | 4 (3.5%) |
| 6:30 AM to 6:59 AM | 8 (11.0%) | 24 (20.7%) |
| 7:00 AM to 7:29 AM | 8 (11.0%) | 49 (42.2%) |
| 7:30 AM to 7:59 AM | 2 (2.7%) | 7 (6.0%) |
| 8:00 AM to 8:29 AM | 5 (6.9%) | 0 (0.0%) |
| 8:30 AM to 8:59 AM | 4 (5.5%) | 4 (3.5%) |
| 9:00 AM to 9:59 AM | 3 (4.1%) | 0 (0.0%) |
| 10:00 AM to 10:59 AM | 3 (4.1%) | 0 (0.0%) |
| 11:00 AM to 11:59 AM | 0 (0.0%) | 9 (7.8%) |
| 12:00 PM to 3:59 PM | 9 (12.3%) | 5 (4.3%) |
| 4:00 PM to 11:59 PM | 0 (0.0%) | 7 (6.0%) |
| Total | 73 (100.0%) | 116 (100.0%) |
Housing Occupancy in Tutuilla
Occupancy by Ownership in Tutuilla
Of the total 166 dwellings in Tutuilla, owner-occupied units account for 156 (94.0%), while renter-occupied units make up 10 (6.0%).
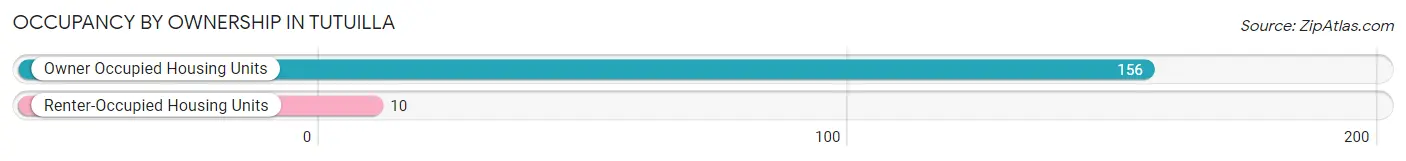
| Occupancy | # Housing Units | % Housing Units |
| Owner Occupied Housing Units | 156 | 94.0% |
| Renter-Occupied Housing Units | 10 | 6.0% |
| Total Occupied Housing Units | 166 | 100.0% |
Occupancy by Household Size in Tutuilla
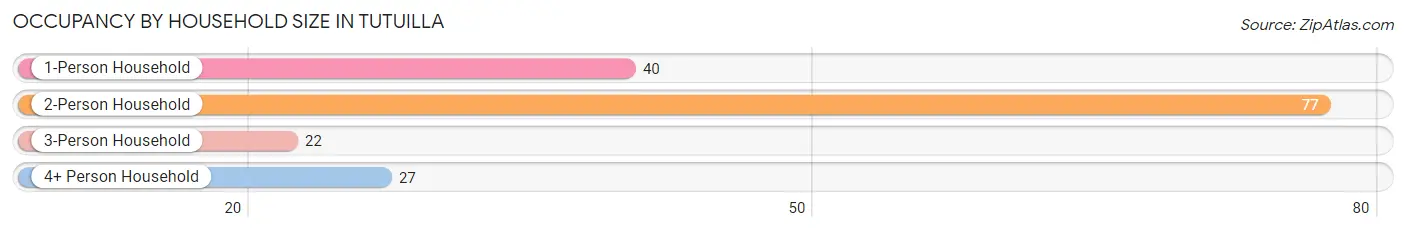
| Household Size | # Housing Units | % Housing Units |
| 1-Person Household | 40 | 24.1% |
| 2-Person Household | 77 | 46.4% |
| 3-Person Household | 22 | 13.3% |
| 4+ Person Household | 27 | 16.3% |
| Total Housing Units | 166 | 100.0% |
Occupancy by Ownership by Household Size in Tutuilla
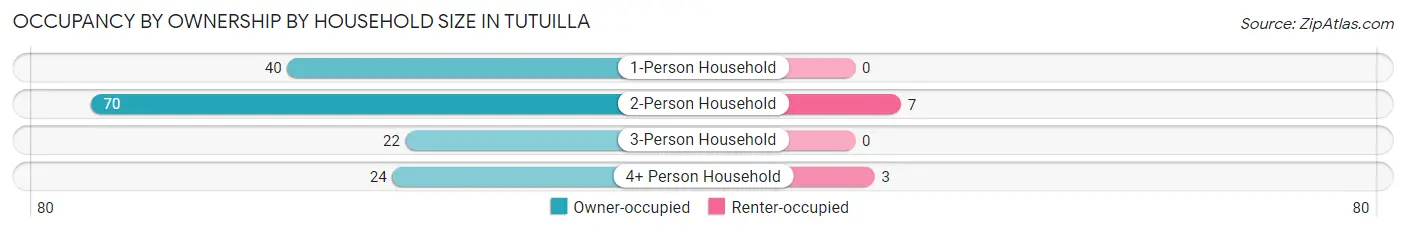
| Household Size | Owner-occupied | Renter-occupied |
| 1-Person Household | 40 (100.0%) | 0 (0.0%) |
| 2-Person Household | 70 (90.9%) | 7 (9.1%) |
| 3-Person Household | 22 (100.0%) | 0 (0.0%) |
| 4+ Person Household | 24 (88.9%) | 3 (11.1%) |
| Total Housing Units | 156 (94.0%) | 10 (6.0%) |
Occupancy by Educational Attainment in Tutuilla
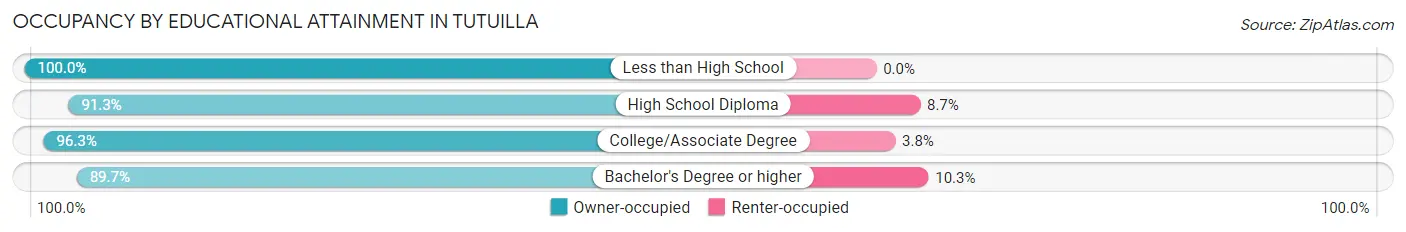
| Household Size | Owner-occupied | Renter-occupied |
| Less than High School | 11 (100.0%) | 0 (0.0%) |
| High School Diploma | 42 (91.3%) | 4 (8.7%) |
| College/Associate Degree | 77 (96.3%) | 3 (3.7%) |
| Bachelor's Degree or higher | 26 (89.7%) | 3 (10.3%) |
Occupancy by Age of Householder in Tutuilla
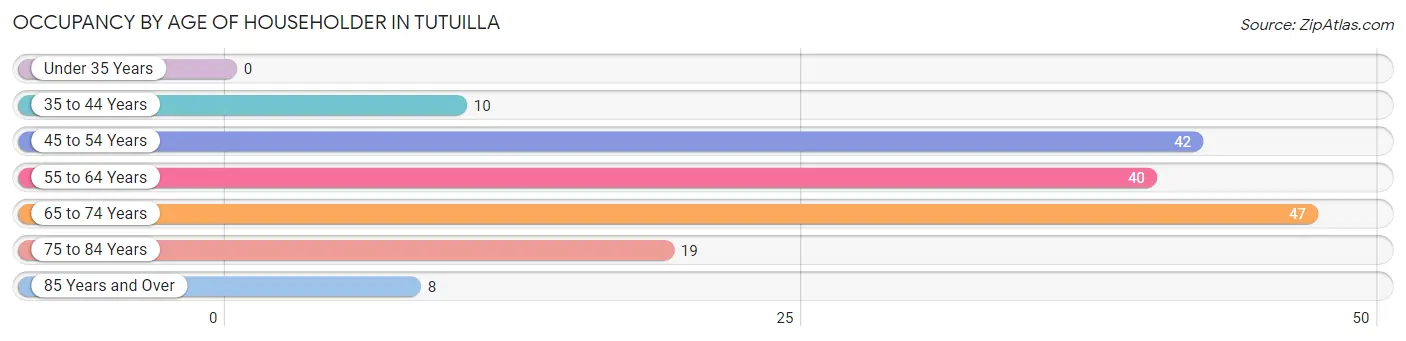
| Age Bracket | # Households | % Households |
| Under 35 Years | 0 | 0.0% |
| 35 to 44 Years | 10 | 6.0% |
| 45 to 54 Years | 42 | 25.3% |
| 55 to 64 Years | 40 | 24.1% |
| 65 to 74 Years | 47 | 28.3% |
| 75 to 84 Years | 19 | 11.5% |
| 85 Years and Over | 8 | 4.8% |
| Total | 166 | 100.0% |
Housing Finances in Tutuilla
Median Income by Occupancy in Tutuilla
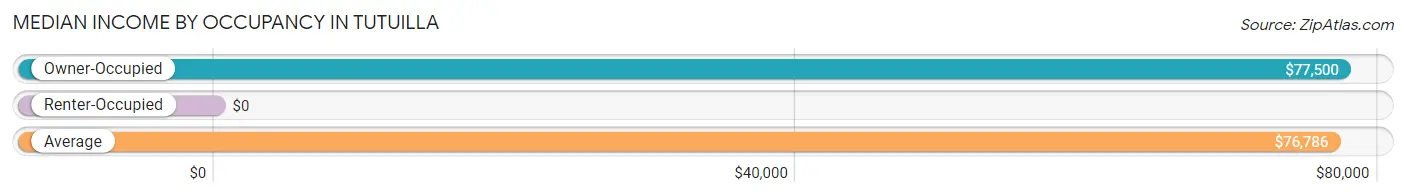
| Occupancy Type | # Households | Median Income |
| Owner-Occupied | 156 (94.0%) | $77,500 |
| Renter-Occupied | 10 (6.0%) | $0 |
| Average | 166 (100.0%) | $76,786 |
Occupancy by Householder Income Bracket in Tutuilla
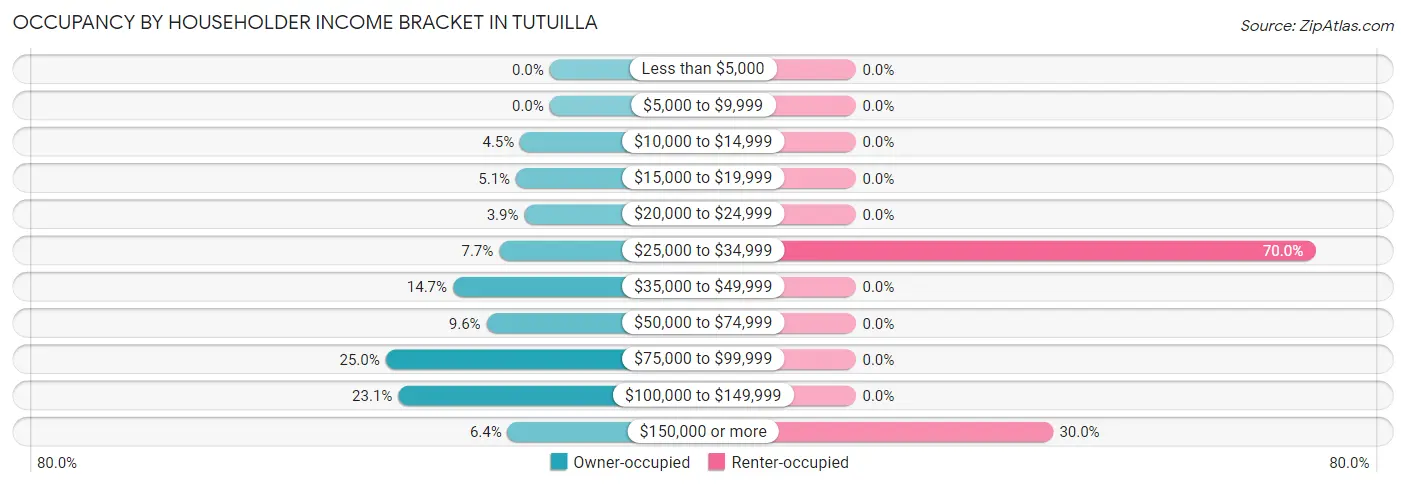
| Income Bracket | Owner-occupied | Renter-occupied |
| Less than $5,000 | 0 (0.0%) | 0 (0.0%) |
| $5,000 to $9,999 | 0 (0.0%) | 0 (0.0%) |
| $10,000 to $14,999 | 7 (4.5%) | 0 (0.0%) |
| $15,000 to $19,999 | 8 (5.1%) | 0 (0.0%) |
| $20,000 to $24,999 | 6 (3.8%) | 0 (0.0%) |
| $25,000 to $34,999 | 12 (7.7%) | 7 (70.0%) |
| $35,000 to $49,999 | 23 (14.7%) | 0 (0.0%) |
| $50,000 to $74,999 | 15 (9.6%) | 0 (0.0%) |
| $75,000 to $99,999 | 39 (25.0%) | 0 (0.0%) |
| $100,000 to $149,999 | 36 (23.1%) | 0 (0.0%) |
| $150,000 or more | 10 (6.4%) | 3 (30.0%) |
| Total | 156 (100.0%) | 10 (100.0%) |
Monthly Housing Cost Tiers in Tutuilla
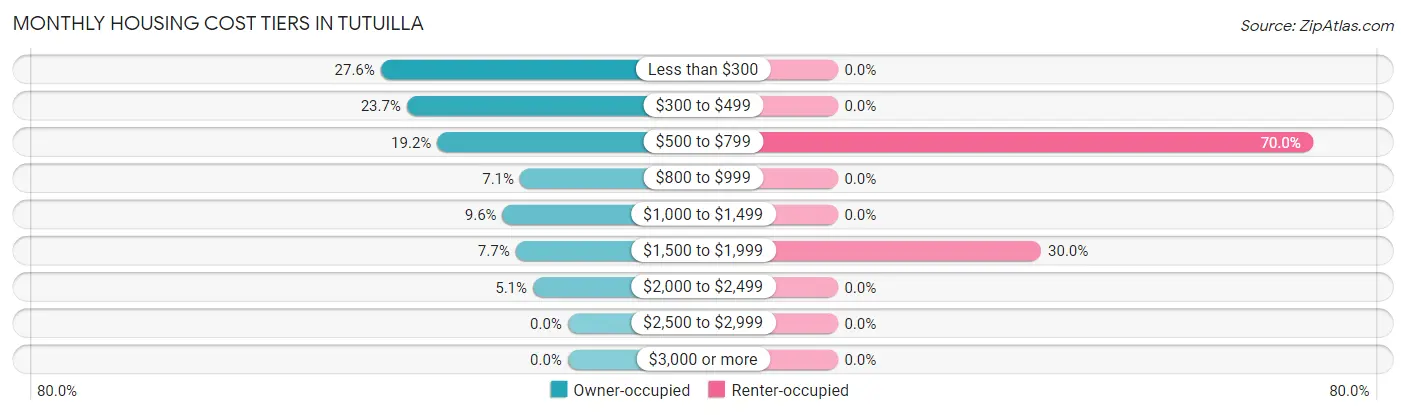
| Monthly Cost | Owner-occupied | Renter-occupied |
| Less than $300 | 43 (27.6%) | 0 (0.0%) |
| $300 to $499 | 37 (23.7%) | 0 (0.0%) |
| $500 to $799 | 30 (19.2%) | 7 (70.0%) |
| $800 to $999 | 11 (7.0%) | 0 (0.0%) |
| $1,000 to $1,499 | 15 (9.6%) | 0 (0.0%) |
| $1,500 to $1,999 | 12 (7.7%) | 3 (30.0%) |
| $2,000 to $2,499 | 8 (5.1%) | 0 (0.0%) |
| $2,500 to $2,999 | 0 (0.0%) | 0 (0.0%) |
| $3,000 or more | 0 (0.0%) | 0 (0.0%) |
| Total | 156 (100.0%) | 10 (100.0%) |
Physical Housing Characteristics in Tutuilla
Housing Structures in Tutuilla
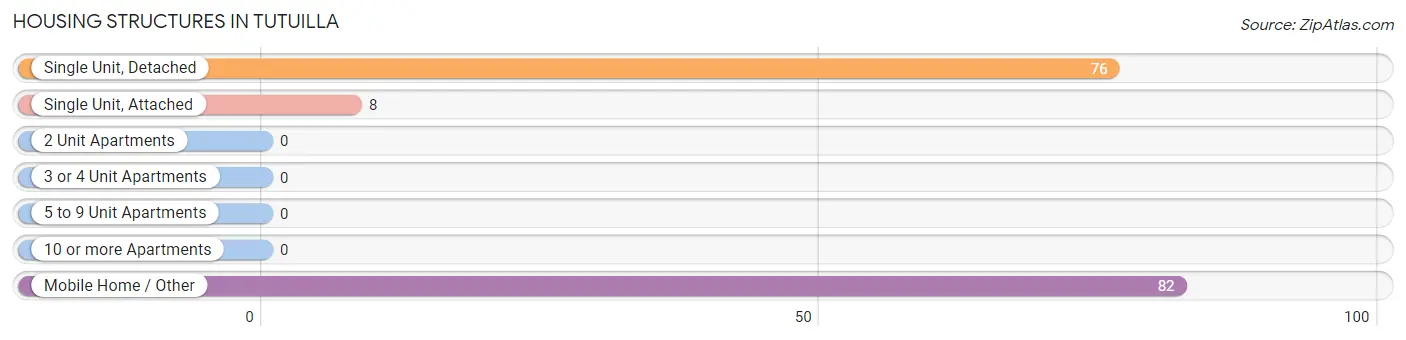
| Structure Type | # Housing Units | % Housing Units |
| Single Unit, Detached | 76 | 45.8% |
| Single Unit, Attached | 8 | 4.8% |
| 2 Unit Apartments | 0 | 0.0% |
| 3 or 4 Unit Apartments | 0 | 0.0% |
| 5 to 9 Unit Apartments | 0 | 0.0% |
| 10 or more Apartments | 0 | 0.0% |
| Mobile Home / Other | 82 | 49.4% |
| Total | 166 | 100.0% |
Housing Structures by Occupancy in Tutuilla
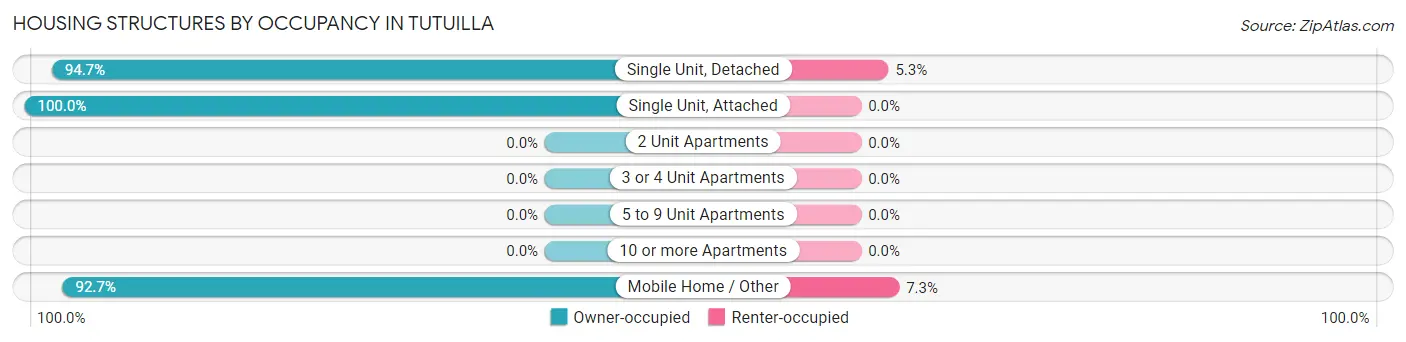
| Structure Type | Owner-occupied | Renter-occupied |
| Single Unit, Detached | 72 (94.7%) | 4 (5.3%) |
| Single Unit, Attached | 8 (100.0%) | 0 (0.0%) |
| 2 Unit Apartments | 0 (0.0%) | 0 (0.0%) |
| 3 or 4 Unit Apartments | 0 (0.0%) | 0 (0.0%) |
| 5 to 9 Unit Apartments | 0 (0.0%) | 0 (0.0%) |
| 10 or more Apartments | 0 (0.0%) | 0 (0.0%) |
| Mobile Home / Other | 76 (92.7%) | 6 (7.3%) |
| Total | 156 (94.0%) | 10 (6.0%) |
Housing Structures by Number of Rooms in Tutuilla
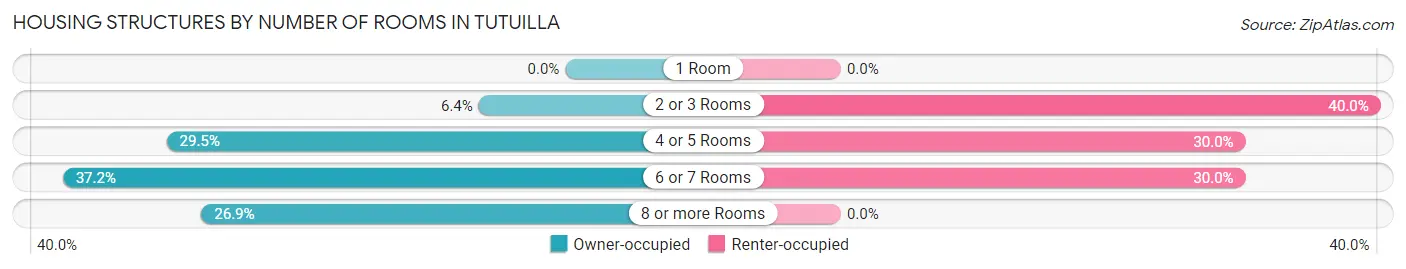
| Number of Rooms | Owner-occupied | Renter-occupied |
| 1 Room | 0 (0.0%) | 0 (0.0%) |
| 2 or 3 Rooms | 10 (6.4%) | 4 (40.0%) |
| 4 or 5 Rooms | 46 (29.5%) | 3 (30.0%) |
| 6 or 7 Rooms | 58 (37.2%) | 3 (30.0%) |
| 8 or more Rooms | 42 (26.9%) | 0 (0.0%) |
| Total | 156 (100.0%) | 10 (100.0%) |
Housing Structure by Heating Type in Tutuilla
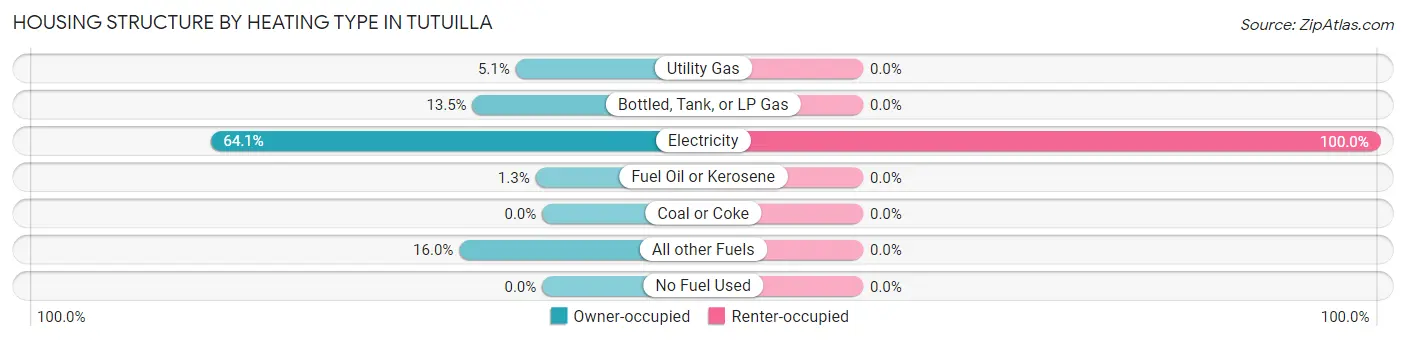
| Heating Type | Owner-occupied | Renter-occupied |
| Utility Gas | 8 (5.1%) | 0 (0.0%) |
| Bottled, Tank, or LP Gas | 21 (13.5%) | 0 (0.0%) |
| Electricity | 100 (64.1%) | 10 (100.0%) |
| Fuel Oil or Kerosene | 2 (1.3%) | 0 (0.0%) |
| Coal or Coke | 0 (0.0%) | 0 (0.0%) |
| All other Fuels | 25 (16.0%) | 0 (0.0%) |
| No Fuel Used | 0 (0.0%) | 0 (0.0%) |
| Total | 156 (100.0%) | 10 (100.0%) |
Household Vehicle Usage in Tutuilla
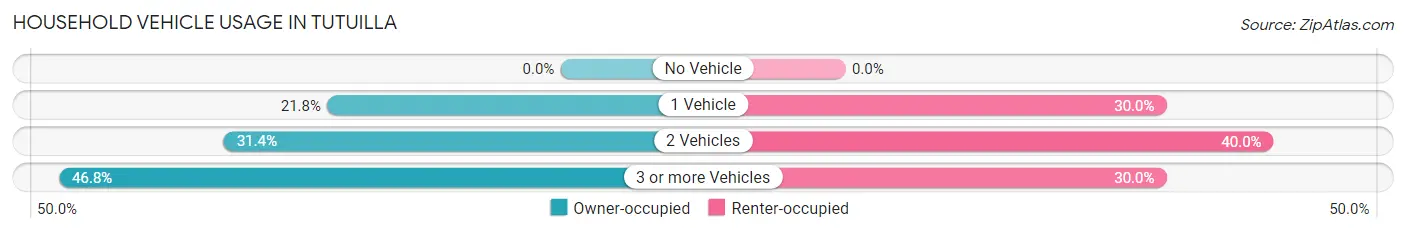
| Vehicles per Household | Owner-occupied | Renter-occupied |
| No Vehicle | 0 (0.0%) | 0 (0.0%) |
| 1 Vehicle | 34 (21.8%) | 3 (30.0%) |
| 2 Vehicles | 49 (31.4%) | 4 (40.0%) |
| 3 or more Vehicles | 73 (46.8%) | 3 (30.0%) |
| Total | 156 (100.0%) | 10 (100.0%) |
Real Estate & Mortgages in Tutuilla
Real Estate and Mortgage Overview in Tutuilla
| Characteristic | Without Mortgage | With Mortgage |
| Housing Units | 111 | 45 |
| Median Property Value | $201,300 | $316,700 |
| Median Household Income | $61,250 | $3 |
| Monthly Housing Costs | $370 | $0 |
| Real Estate Taxes | $1,676 | $12 |
Property Value by Mortgage Status in Tutuilla
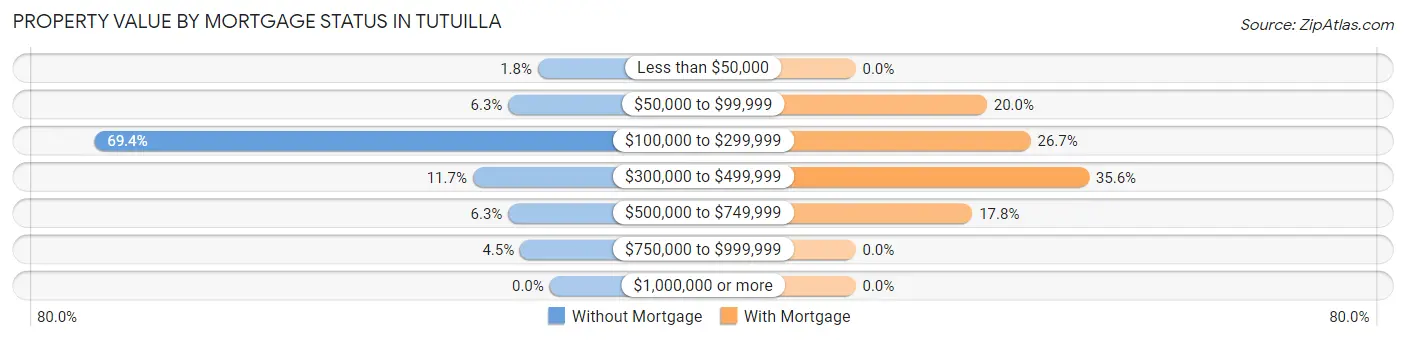
| Property Value | Without Mortgage | With Mortgage |
| Less than $50,000 | 2 (1.8%) | 0 (0.0%) |
| $50,000 to $99,999 | 7 (6.3%) | 9 (20.0%) |
| $100,000 to $299,999 | 77 (69.4%) | 12 (26.7%) |
| $300,000 to $499,999 | 13 (11.7%) | 16 (35.6%) |
| $500,000 to $749,999 | 7 (6.3%) | 8 (17.8%) |
| $750,000 to $999,999 | 5 (4.5%) | 0 (0.0%) |
| $1,000,000 or more | 0 (0.0%) | 0 (0.0%) |
| Total | 111 (100.0%) | 45 (100.0%) |
Household Income by Mortgage Status in Tutuilla
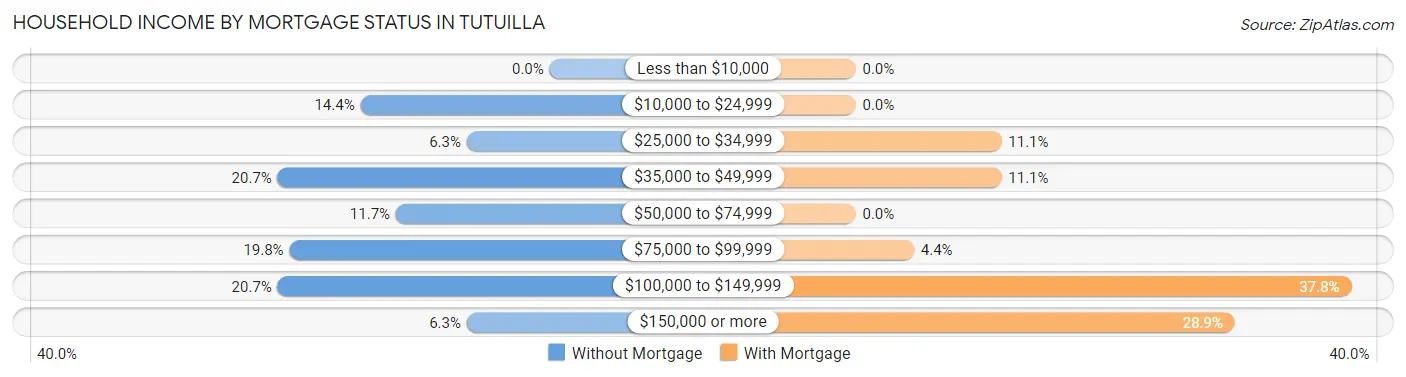
| Household Income | Without Mortgage | With Mortgage |
| Less than $10,000 | 0 (0.0%) | 0 (0.0%) |
| $10,000 to $24,999 | 16 (14.4%) | 0 (0.0%) |
| $25,000 to $34,999 | 7 (6.3%) | 5 (11.1%) |
| $35,000 to $49,999 | 23 (20.7%) | 5 (11.1%) |
| $50,000 to $74,999 | 13 (11.7%) | 0 (0.0%) |
| $75,000 to $99,999 | 22 (19.8%) | 2 (4.4%) |
| $100,000 to $149,999 | 23 (20.7%) | 17 (37.8%) |
| $150,000 or more | 7 (6.3%) | 13 (28.9%) |
| Total | 111 (100.0%) | 45 (100.0%) |
Property Value to Household Income Ratio in Tutuilla
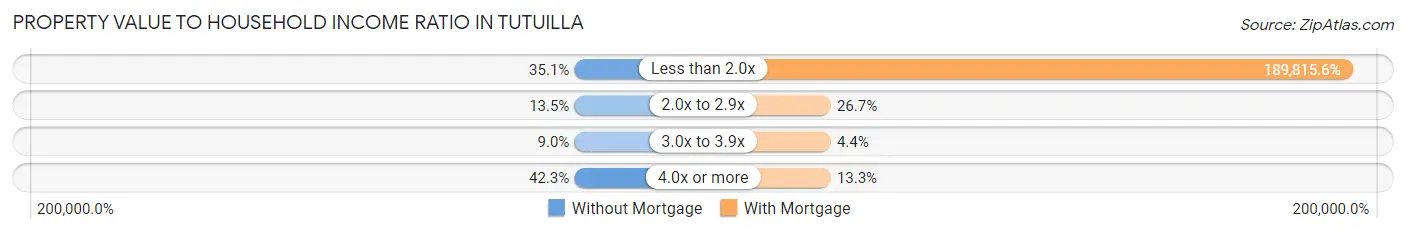
| Value-to-Income Ratio | Without Mortgage | With Mortgage |
| Less than 2.0x | 39 (35.1%) | 85,417 (189,815.6%) |
| 2.0x to 2.9x | 15 (13.5%) | 12 (26.7%) |
| 3.0x to 3.9x | 10 (9.0%) | 2 (4.4%) |
| 4.0x or more | 47 (42.3%) | 6 (13.3%) |
| Total | 111 (100.0%) | 45 (100.0%) |
Real Estate Taxes by Mortgage Status in Tutuilla
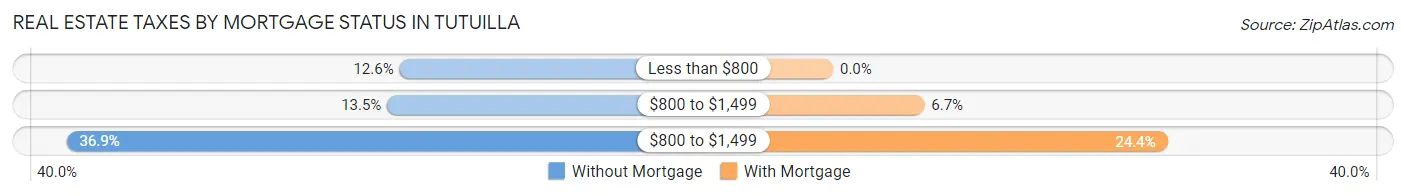
| Property Taxes | Without Mortgage | With Mortgage |
| Less than $800 | 14 (12.6%) | 0 (0.0%) |
| $800 to $1,499 | 15 (13.5%) | 3 (6.7%) |
| $800 to $1,499 | 41 (36.9%) | 11 (24.4%) |
| Total | 111 (100.0%) | 45 (100.0%) |
Health & Disability in Tutuilla
Health Insurance Coverage by Age in Tutuilla
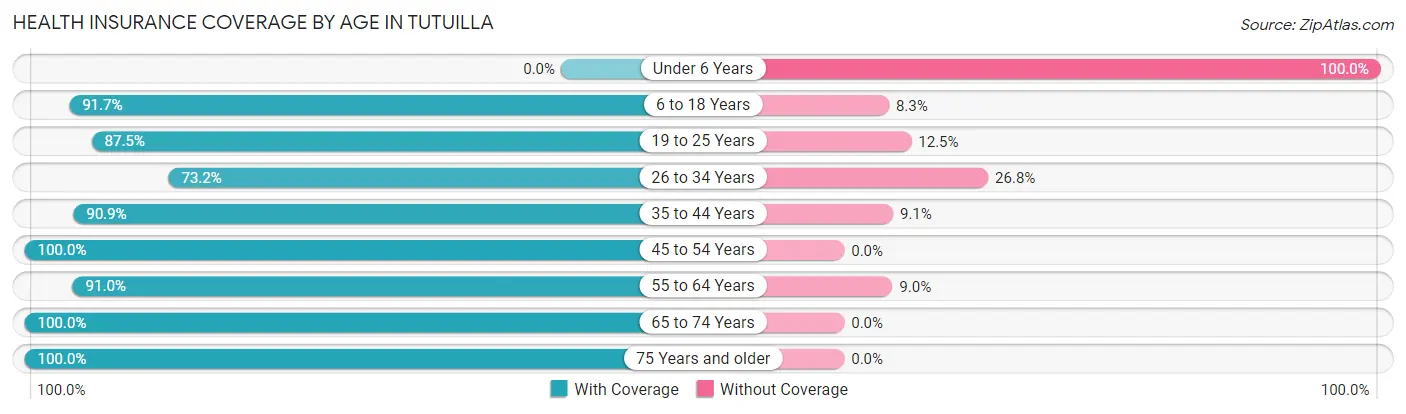
| Age Bracket | With Coverage | Without Coverage |
| Under 6 Years | 0 (0.0%) | 2 (100.0%) |
| 6 to 18 Years | 55 (91.7%) | 5 (8.3%) |
| 19 to 25 Years | 14 (87.5%) | 2 (12.5%) |
| 26 to 34 Years | 30 (73.2%) | 11 (26.8%) |
| 35 to 44 Years | 20 (90.9%) | 2 (9.1%) |
| 45 to 54 Years | 68 (100.0%) | 0 (0.0%) |
| 55 to 64 Years | 71 (91.0%) | 7 (9.0%) |
| 65 to 74 Years | 73 (100.0%) | 0 (0.0%) |
| 75 Years and older | 35 (100.0%) | 0 (0.0%) |
| Total | 366 (92.7%) | 29 (7.3%) |
Health Insurance Coverage by Citizenship Status in Tutuilla
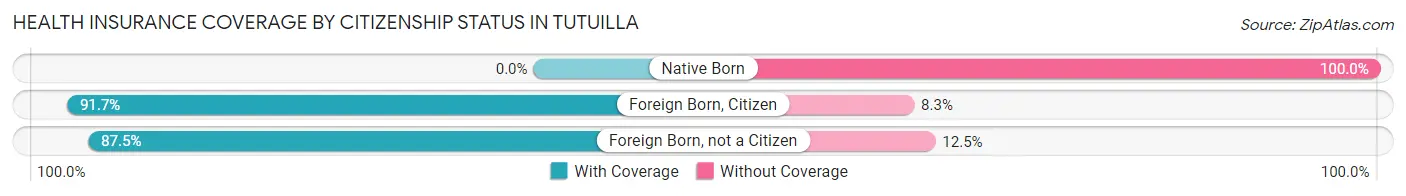
| Citizenship Status | With Coverage | Without Coverage |
| Native Born | 0 (0.0%) | 2 (100.0%) |
| Foreign Born, Citizen | 55 (91.7%) | 5 (8.3%) |
| Foreign Born, not a Citizen | 14 (87.5%) | 2 (12.5%) |
Health Insurance Coverage by Household Income in Tutuilla
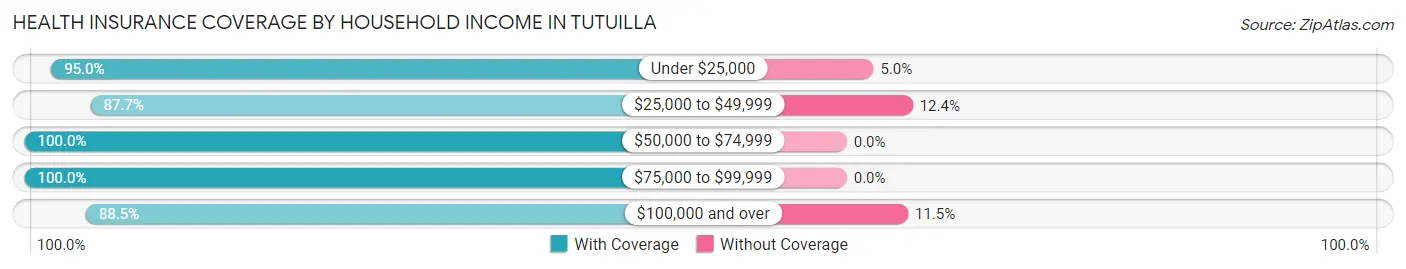
| Household Income | With Coverage | Without Coverage |
| Under $25,000 | 38 (95.0%) | 2 (5.0%) |
| $25,000 to $49,999 | 71 (87.6%) | 10 (12.3%) |
| $50,000 to $74,999 | 30 (100.0%) | 0 (0.0%) |
| $75,000 to $99,999 | 96 (100.0%) | 0 (0.0%) |
| $100,000 and over | 131 (88.5%) | 17 (11.5%) |
Public vs Private Health Insurance Coverage by Age in Tutuilla
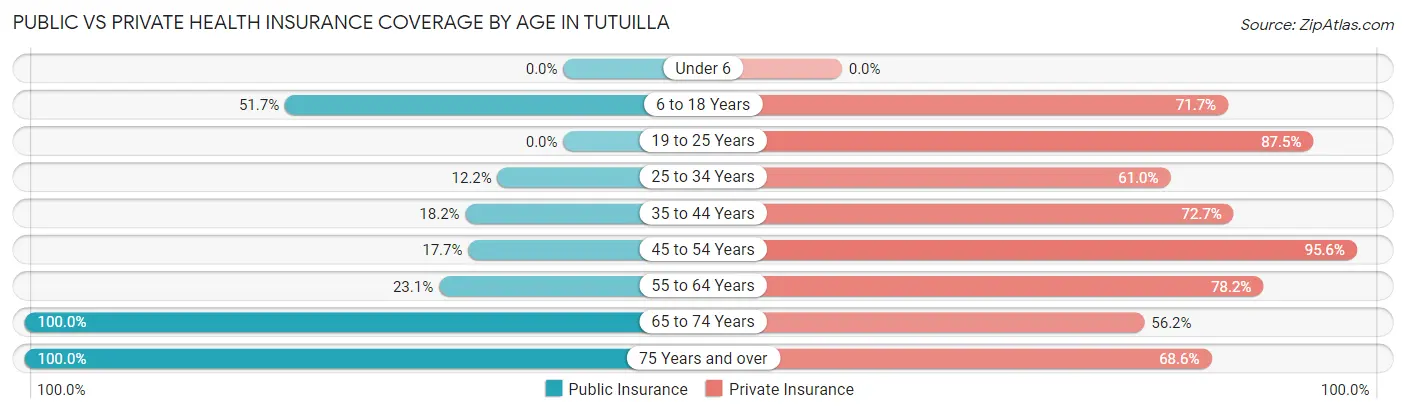
| Age Bracket | Public Insurance | Private Insurance |
| Under 6 | 0 (0.0%) | 0 (0.0%) |
| 6 to 18 Years | 31 (51.7%) | 43 (71.7%) |
| 19 to 25 Years | 0 (0.0%) | 14 (87.5%) |
| 25 to 34 Years | 5 (12.2%) | 25 (61.0%) |
| 35 to 44 Years | 4 (18.2%) | 16 (72.7%) |
| 45 to 54 Years | 12 (17.6%) | 65 (95.6%) |
| 55 to 64 Years | 18 (23.1%) | 61 (78.2%) |
| 65 to 74 Years | 73 (100.0%) | 41 (56.2%) |
| 75 Years and over | 35 (100.0%) | 24 (68.6%) |
| Total | 178 (45.1%) | 289 (73.2%) |
Disability Status by Sex by Age in Tutuilla
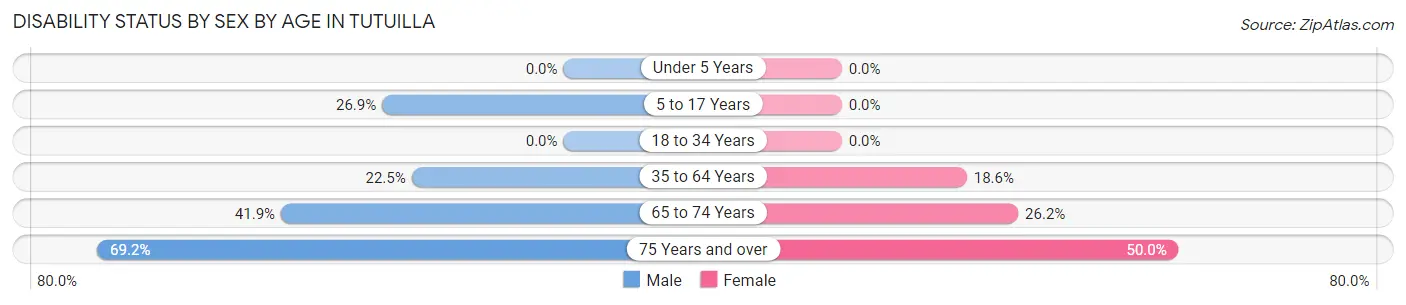
| Age Bracket | Male | Female |
| Under 5 Years | 0 (0.0%) | 0 (0.0%) |
| 5 to 17 Years | 7 (26.9%) | 0 (0.0%) |
| 18 to 34 Years | 0 (0.0%) | 0 (0.0%) |
| 35 to 64 Years | 16 (22.5%) | 18 (18.6%) |
| 65 to 74 Years | 13 (41.9%) | 11 (26.2%) |
| 75 Years and over | 9 (69.2%) | 11 (50.0%) |
Disability Class by Sex by Age in Tutuilla
Disability Class: Hearing Difficulty
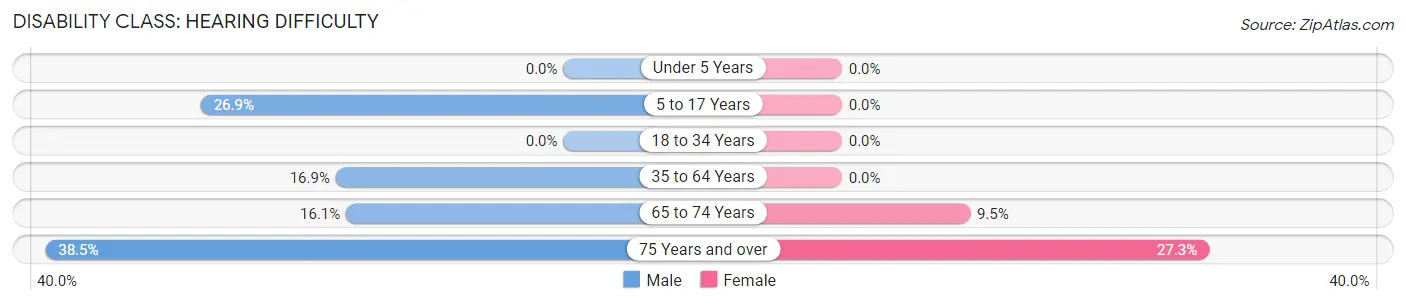
| Age Bracket | Male | Female |
| Under 5 Years | 0 (0.0%) | 0 (0.0%) |
| 5 to 17 Years | 7 (26.9%) | 0 (0.0%) |
| 18 to 34 Years | 0 (0.0%) | 0 (0.0%) |
| 35 to 64 Years | 12 (16.9%) | 0 (0.0%) |
| 65 to 74 Years | 5 (16.1%) | 4 (9.5%) |
| 75 Years and over | 5 (38.5%) | 6 (27.3%) |
Disability Class: Vision Difficulty
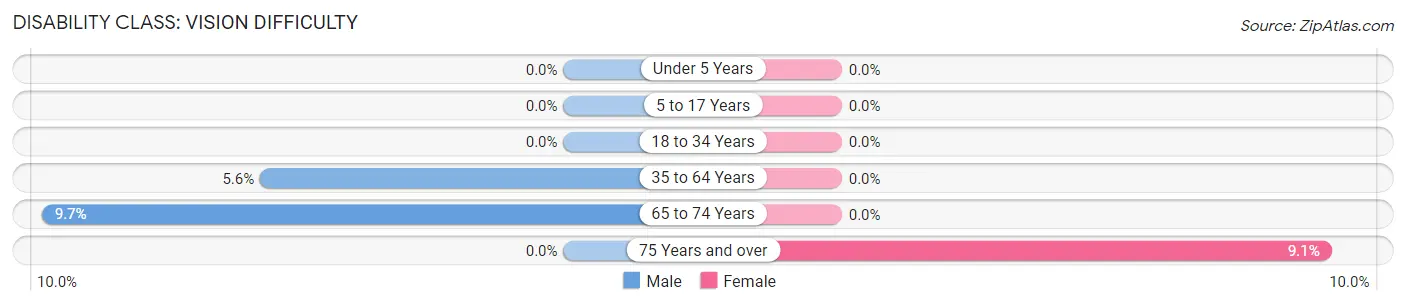
| Age Bracket | Male | Female |
| Under 5 Years | 0 (0.0%) | 0 (0.0%) |
| 5 to 17 Years | 0 (0.0%) | 0 (0.0%) |
| 18 to 34 Years | 0 (0.0%) | 0 (0.0%) |
| 35 to 64 Years | 4 (5.6%) | 0 (0.0%) |
| 65 to 74 Years | 3 (9.7%) | 0 (0.0%) |
| 75 Years and over | 0 (0.0%) | 2 (9.1%) |
Disability Class: Cognitive Difficulty
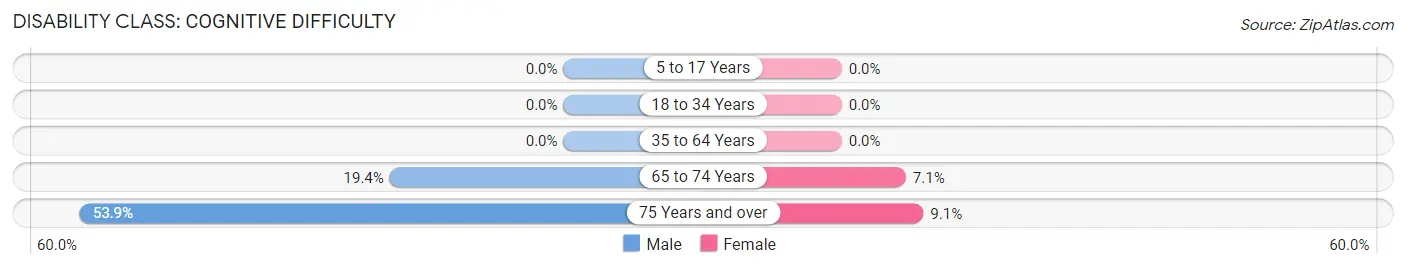
| Age Bracket | Male | Female |
| 5 to 17 Years | 0 (0.0%) | 0 (0.0%) |
| 18 to 34 Years | 0 (0.0%) | 0 (0.0%) |
| 35 to 64 Years | 0 (0.0%) | 0 (0.0%) |
| 65 to 74 Years | 6 (19.4%) | 3 (7.1%) |
| 75 Years and over | 7 (53.8%) | 2 (9.1%) |
Disability Class: Ambulatory Difficulty
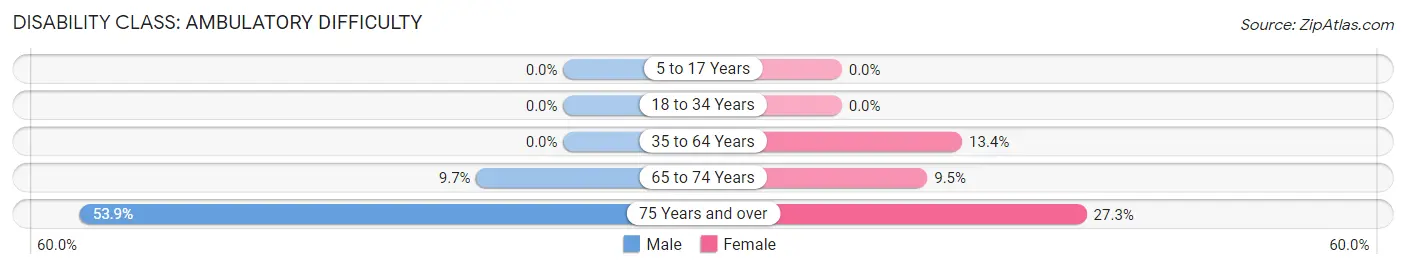
| Age Bracket | Male | Female |
| 5 to 17 Years | 0 (0.0%) | 0 (0.0%) |
| 18 to 34 Years | 0 (0.0%) | 0 (0.0%) |
| 35 to 64 Years | 0 (0.0%) | 13 (13.4%) |
| 65 to 74 Years | 3 (9.7%) | 4 (9.5%) |
| 75 Years and over | 7 (53.8%) | 6 (27.3%) |
Disability Class: Self-Care Difficulty
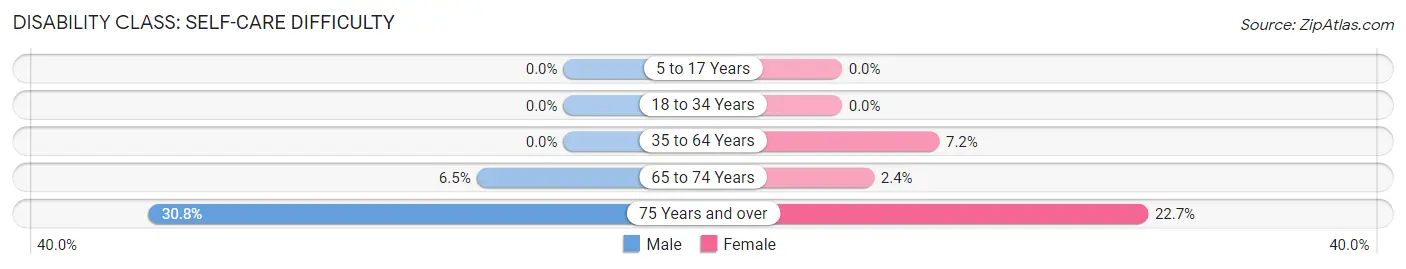
| Age Bracket | Male | Female |
| 5 to 17 Years | 0 (0.0%) | 0 (0.0%) |
| 18 to 34 Years | 0 (0.0%) | 0 (0.0%) |
| 35 to 64 Years | 0 (0.0%) | 7 (7.2%) |
| 65 to 74 Years | 2 (6.5%) | 1 (2.4%) |
| 75 Years and over | 4 (30.8%) | 5 (22.7%) |
Technology Access in Tutuilla
Computing Device Access in Tutuilla
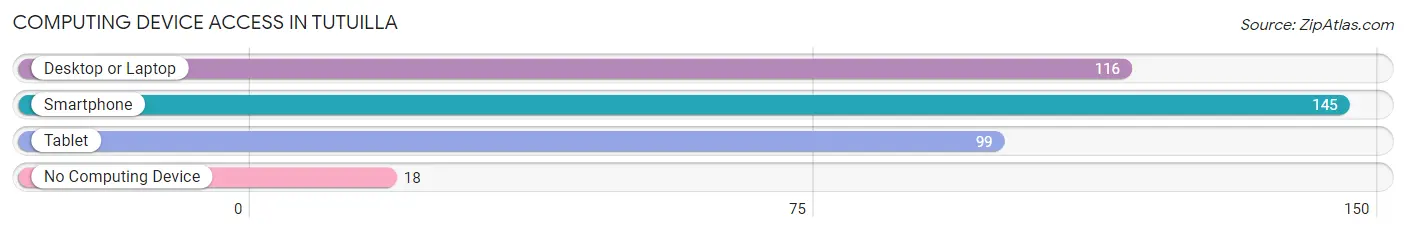
| Device Type | # Households | % Households |
| Desktop or Laptop | 116 | 69.9% |
| Smartphone | 145 | 87.4% |
| Tablet | 99 | 59.6% |
| No Computing Device | 18 | 10.8% |
| Total | 166 | 100.0% |
Internet Access in Tutuilla
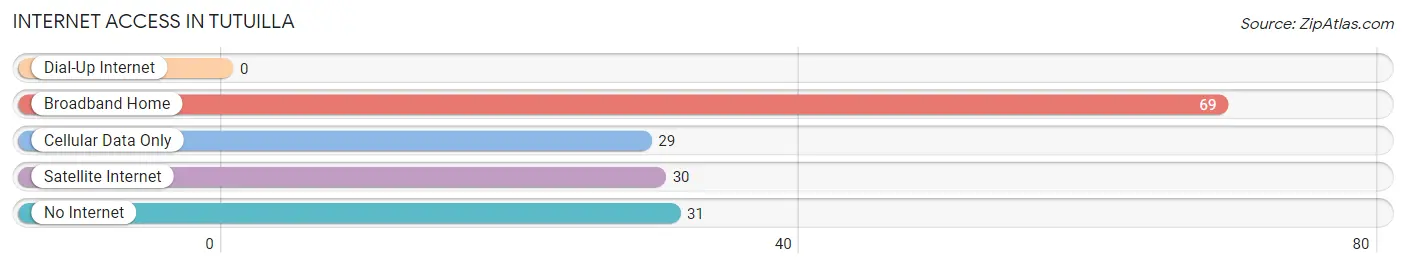
| Internet Type | # Households | % Households |
| Dial-Up Internet | 0 | 0.0% |
| Broadband Home | 69 | 41.6% |
| Cellular Data Only | 29 | 17.5% |
| Satellite Internet | 30 | 18.1% |
| No Internet | 31 | 18.7% |
| Total | 166 | 100.0% |
Tutuilla Summary
Tutuilla is a small unincorporated community located in the Umatilla County of Oregon. It is situated on the Umatilla River, approximately 8 miles east of Pendleton. The population of Tutuilla was estimated to be around 200 in the year 2000.
History
Tutuilla was first settled in the late 1800s by a group of Native Americans from the Umatilla Tribe. The name Tutuilla is derived from the Umatilla word for “meeting place”. The area was used as a gathering place for the tribe and was also used for hunting and fishing.
In the early 1900s, the area was settled by homesteaders and ranchers. The first post office was established in Tutuilla in 1906. The town was incorporated in 1910 and the first school was built in 1911.
In the 1920s, Tutuilla was a thriving community with a population of over 500 people. The town had a general store, a hotel, a bank, a blacksmith shop, and a livery stable.
In the 1930s, the Great Depression hit Tutuilla hard and the population began to decline. The town’s economy was further hurt by the construction of the McNary Dam in the 1950s, which flooded much of the surrounding land.
Geography
Tutuilla is located in the Umatilla Valley, which is part of the Columbia Plateau. The area is characterized by rolling hills and wide open spaces. The Umatilla River runs through the town and is a popular spot for fishing and boating.
The climate in Tutuilla is semi-arid, with hot summers and cold winters. The average annual precipitation is around 12 inches.
Economy
The economy of Tutuilla is largely based on agriculture. The area is known for its wheat, barley, and hay production. Other crops grown in the area include potatoes, onions, and corn.
The town also has a small manufacturing sector, which produces wood products, metal products, and food products.
Demographics
As of the 2000 census, the population of Tutuilla was estimated to be around 200 people. The racial makeup of the town was 95.5% White, 0.5% African American, 0.5% Native American, 0.5% Asian, and 3% from other races.
The median household income in Tutuilla was $30,000, and the median family income was $35,000. The per capita income was $14,000.
Conclusion
Tutuilla is a small unincorporated community located in the Umatilla County of Oregon. It has a rich history and a unique geography. The economy of Tutuilla is largely based on agriculture, and the town has a population of around 200 people.
Common Questions
What is Per Capita Income in Tutuilla?
Per Capita income in Tutuilla is $36,850.
What is the Median Family Income in Tutuilla?
Median Family Income in Tutuilla is $76,607.
What is the Median Household income in Tutuilla?
Median Household Income in Tutuilla is $76,786.
What is Income or Wage Gap in Tutuilla?
Income or Wage Gap in Tutuilla is 30.2%.
Women in Tutuilla earn 69.8 cents for every dollar earned by a man.
What is Inequality or Gini Index in Tutuilla?
Inequality or Gini Index in Tutuilla is 0.35.
What is the Total Population of Tutuilla?
Total Population of Tutuilla is 395.
What is the Total Male Population of Tutuilla?
Total Male Population of Tutuilla is 165.
What is the Total Female Population of Tutuilla?
Total Female Population of Tutuilla is 230.
What is the Ratio of Males per 100 Females in Tutuilla?
There are 71.74 Males per 100 Females in Tutuilla.
What is the Ratio of Females per 100 Males in Tutuilla?
There are 139.39 Females per 100 Males in Tutuilla.
What is the Median Population Age in Tutuilla?
Median Population Age in Tutuilla is 53.2 Years.
What is the Average Family Size in Tutuilla
Average Family Size in Tutuilla is 2.7 People.
What is the Average Household Size in Tutuilla
Average Household Size in Tutuilla is 2.4 People.
How Large is the Labor Force in Tutuilla?
There are 204 People in the Labor Forcein in Tutuilla.
What is the Percentage of People in the Labor Force in Tutuilla?
57.5% of People are in the Labor Force in Tutuilla.
What is the Unemployment Rate in Tutuilla?
Unemployment Rate in Tutuilla is 3.4%.