Springfield, OR Map & Demographics
Springfield Map
Springfield Overview
$29,284
PER CAPITA INCOME
$67,580
AVG FAMILY INCOME
$60,982
AVG HOUSEHOLD INCOME
26.6%
WAGE / INCOME GAP [ % ]
73.4¢/ $1
WAGE / INCOME GAP [ $ ]
$10,435
FAMILY INCOME DEFICIT
0.40
INEQUALITY / GINI INDEX
61,740
TOTAL POPULATION
31,351
MALE POPULATION
30,389
FEMALE POPULATION
103.17
MALES / 100 FEMALES
96.93
FEMALES / 100 MALES
37.3
MEDIAN AGE
2.9
AVG FAMILY SIZE
2.4
AVG HOUSEHOLD SIZE
33,115
LABOR FORCE [ PEOPLE ]
65.9%
PERCENT IN LABOR FORCE
6.1%
UNEMPLOYMENT RATE
Springfield Area Codes
Income in Springfield
Income Overview in Springfield
Per Capita Income in Springfield is $29,284, while median incomes of families and households are $67,580 and $60,982 respectively.
| Characteristic | Number | Measure |
| Per Capita Income | 61,740 | $29,284 |
| Median Family Income | 16,005 | $67,580 |
| Mean Family Income | 16,005 | $79,536 |
| Median Household Income | 25,039 | $60,982 |
| Mean Household Income | 25,039 | $70,926 |
| Income Deficit | 16,005 | $10,435 |
| Wage / Income Gap (%) | 61,740 | 26.61% |
| Wage / Income Gap ($) | 61,740 | 73.39¢ per $1 |
| Gini / Inequality Index | 61,740 | 0.40 |
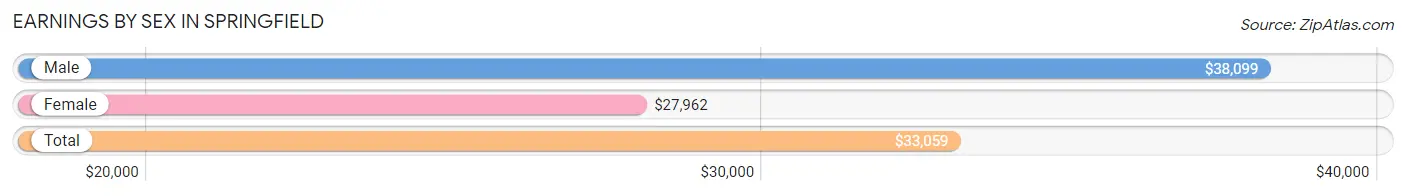
Earnings by Sex in Springfield
Average Earnings in Springfield are $33,059, $38,099 for men and $27,962 for women, a difference of 26.6%.
| Sex | Number | Average Earnings |
| Male | 18,169 (52.6%) | $38,099 |
| Female | 16,401 (47.4%) | $27,962 |
| Total | 34,570 (100.0%) | $33,059 |
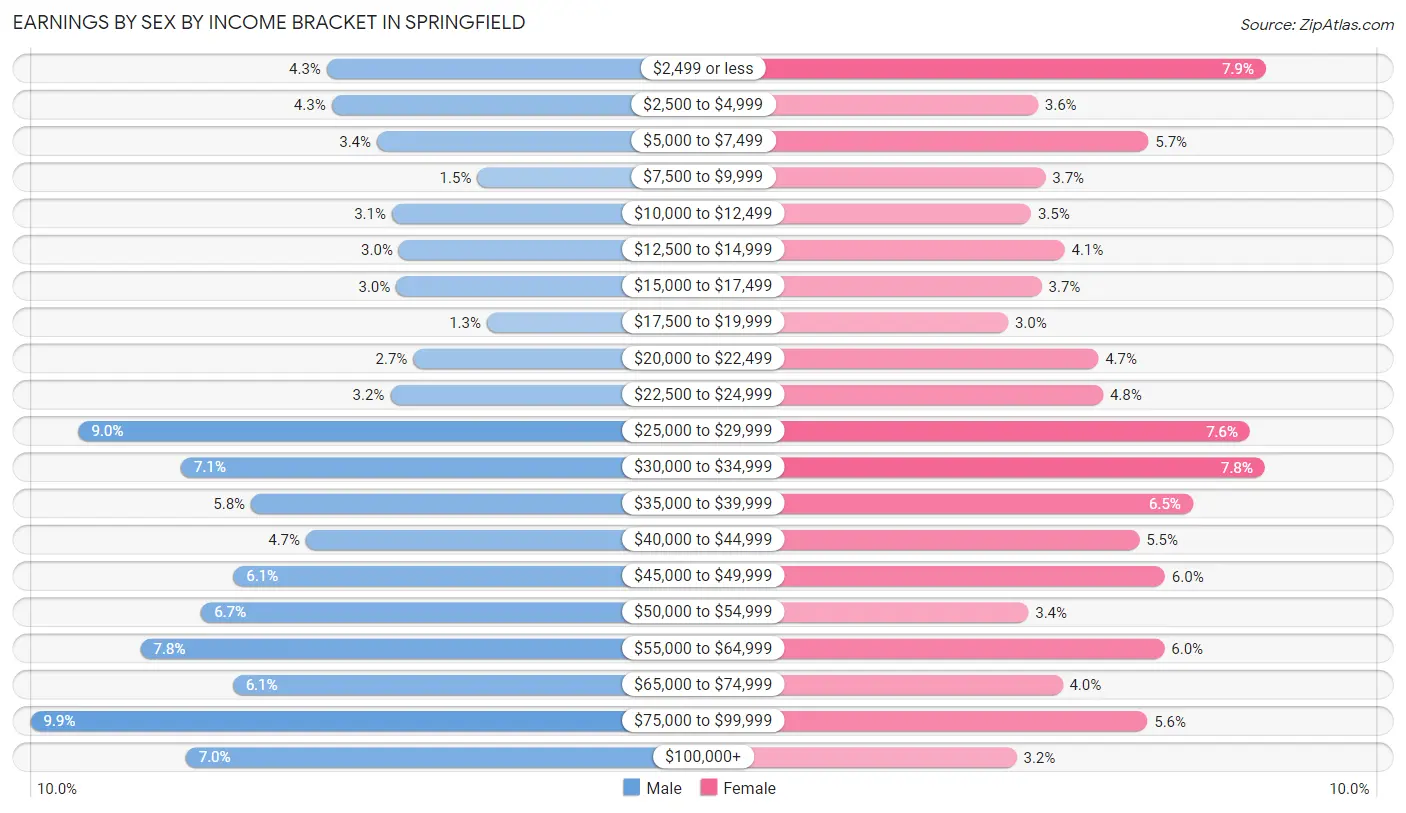
Earnings by Sex by Income Bracket in Springfield
The most common earnings brackets in Springfield are $75,000 to $99,999 for men (1,797 | 9.9%) and $2,499 or less for women (1,287 | 7.9%).
| Income | Male | Female |
| $2,499 or less | 789 (4.3%) | 1,287 (7.9%) |
| $2,500 to $4,999 | 773 (4.3%) | 587 (3.6%) |
| $5,000 to $7,499 | 617 (3.4%) | 926 (5.7%) |
| $7,500 to $9,999 | 276 (1.5%) | 610 (3.7%) |
| $10,000 to $12,499 | 567 (3.1%) | 566 (3.5%) |
| $12,500 to $14,999 | 544 (3.0%) | 669 (4.1%) |
| $15,000 to $17,499 | 552 (3.0%) | 599 (3.6%) |
| $17,500 to $19,999 | 243 (1.3%) | 496 (3.0%) |
| $20,000 to $22,499 | 494 (2.7%) | 773 (4.7%) |
| $22,500 to $24,999 | 573 (3.2%) | 787 (4.8%) |
| $25,000 to $29,999 | 1,633 (9.0%) | 1,238 (7.5%) |
| $30,000 to $34,999 | 1,284 (7.1%) | 1,284 (7.8%) |
| $35,000 to $39,999 | 1,046 (5.8%) | 1,063 (6.5%) |
| $40,000 to $44,999 | 860 (4.7%) | 898 (5.5%) |
| $45,000 to $49,999 | 1,107 (6.1%) | 978 (6.0%) |
| $50,000 to $54,999 | 1,216 (6.7%) | 558 (3.4%) |
| $55,000 to $64,999 | 1,422 (7.8%) | 976 (5.9%) |
| $65,000 to $74,999 | 1,108 (6.1%) | 662 (4.0%) |
| $75,000 to $99,999 | 1,797 (9.9%) | 923 (5.6%) |
| $100,000+ | 1,268 (7.0%) | 521 (3.2%) |
| Total | 18,169 (100.0%) | 16,401 (100.0%) |
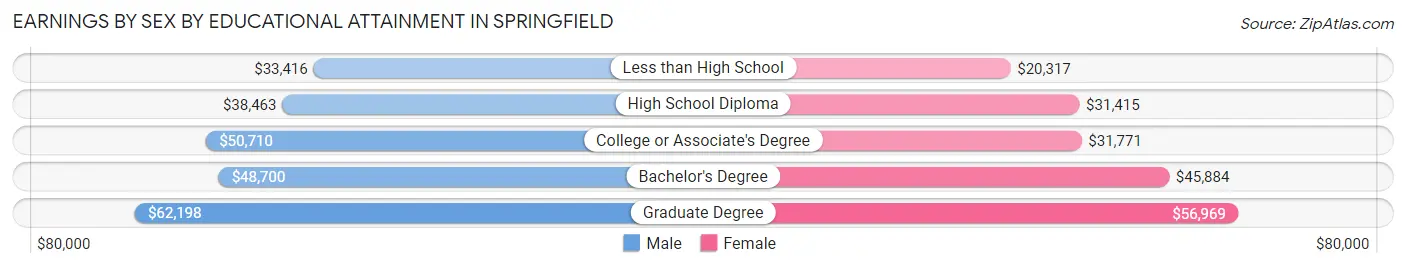
Earnings by Sex by Educational Attainment in Springfield
Average earnings in Springfield are $45,941 for men and $32,754 for women, a difference of 28.7%. Men with an educational attainment of graduate degree enjoy the highest average annual earnings of $62,198, while those with less than high school education earn the least with $33,416. Women with an educational attainment of graduate degree earn the most with the average annual earnings of $56,969, while those with less than high school education have the smallest earnings of $20,317.
| Educational Attainment | Male Income | Female Income |
| Less than High School | $33,416 | $20,317 |
| High School Diploma | $38,463 | $31,415 |
| College or Associate's Degree | $50,710 | $31,771 |
| Bachelor's Degree | $48,700 | $45,884 |
| Graduate Degree | $62,198 | $56,969 |
| Total | $45,941 | $32,754 |
Family Income in Springfield
Family Income Brackets in Springfield
According to the Springfield family income data, there are 3,185 families falling into the $50,000 to $74,999 income range, which is the most common income bracket and makes up 19.9% of all families. Conversely, the $10,000 to $14,999 income bracket is the least frequent group with only 336 families (2.1%) belonging to this category.
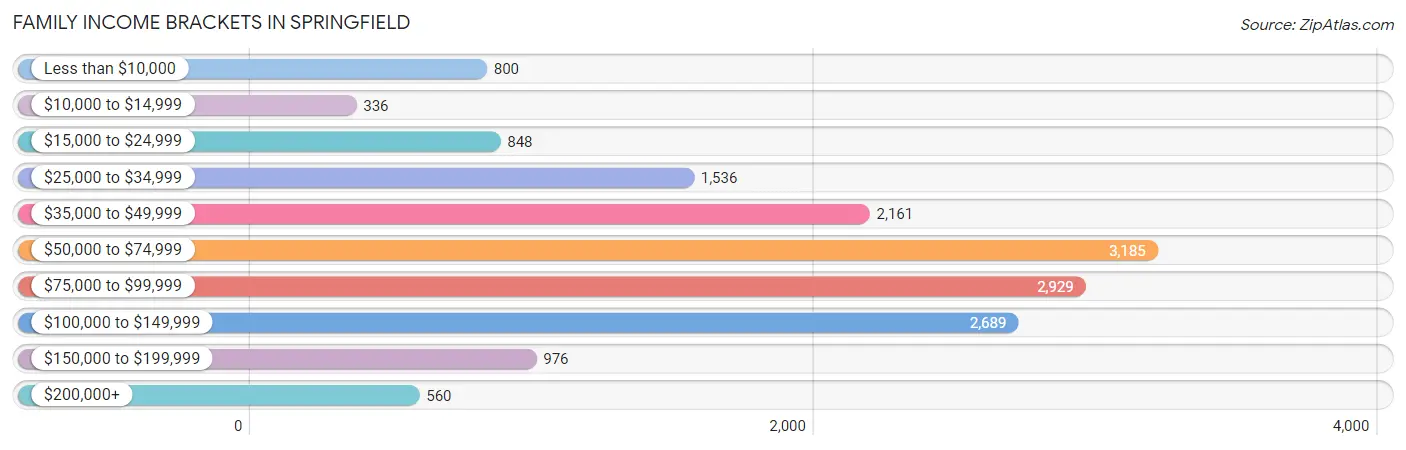
| Income Bracket | # Families | % Families |
| Less than $10,000 | 800 | 5.0% |
| $10,000 to $14,999 | 336 | 2.1% |
| $15,000 to $24,999 | 848 | 5.3% |
| $25,000 to $34,999 | 1,536 | 9.6% |
| $35,000 to $49,999 | 2,161 | 13.5% |
| $50,000 to $74,999 | 3,185 | 19.9% |
| $75,000 to $99,999 | 2,929 | 18.3% |
| $100,000 to $149,999 | 2,689 | 16.8% |
| $150,000 to $199,999 | 976 | 6.1% |
| $200,000+ | 560 | 3.5% |
Family Income by Famaliy Size in Springfield
7+ person families (138 | 0.9%) account for the highest median family income in Springfield with $173,214 per family, while 2-person families (7,986 | 49.9%) have the highest median income of $30,571 per family member.
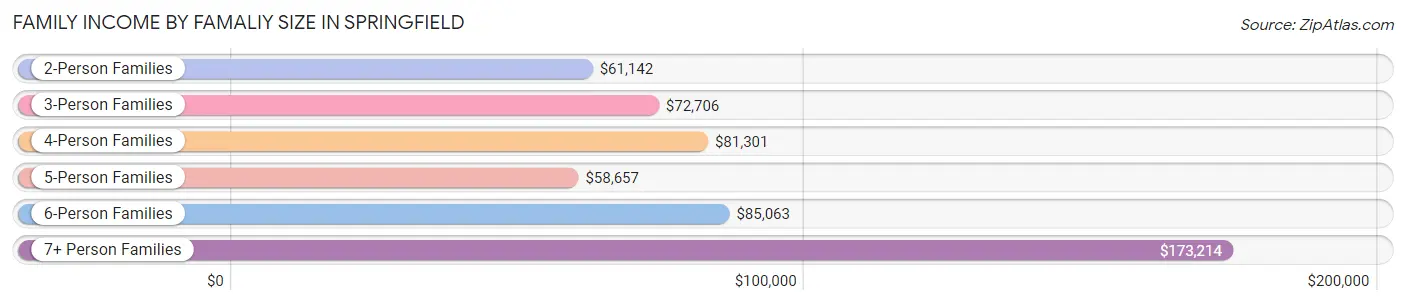
| Income Bracket | # Families | Median Income |
| 2-Person Families | 7,986 (49.9%) | $61,142 |
| 3-Person Families | 4,255 (26.6%) | $72,706 |
| 4-Person Families | 2,245 (14.0%) | $81,301 |
| 5-Person Families | 1,077 (6.7%) | $58,657 |
| 6-Person Families | 304 (1.9%) | $85,063 |
| 7+ Person Families | 138 (0.9%) | $173,214 |
| Total | 16,005 (100.0%) | $67,580 |
Family Income by Number of Earners in Springfield
The median family income in Springfield is $67,580, with families comprising 3+ earners (1,580) having the highest median family income of $122,340, while families with 1 earner (5,771) have the lowest median family income of $46,182, accounting for 9.9% and 36.1% of families, respectively.
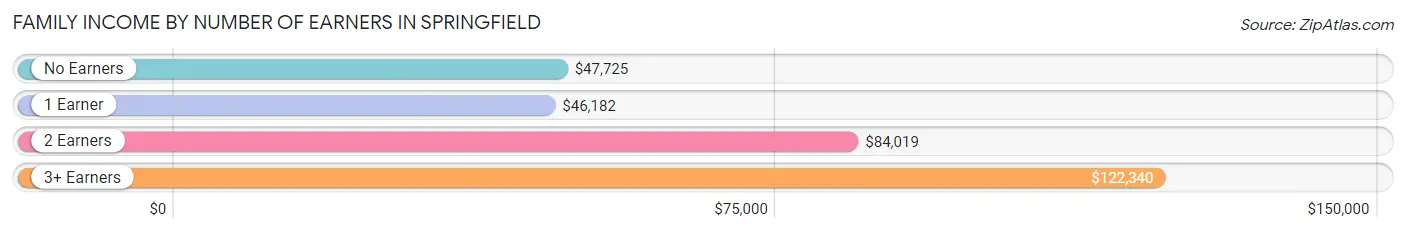
| Number of Earners | # Families | Median Income |
| No Earners | 2,142 (13.4%) | $47,725 |
| 1 Earner | 5,771 (36.1%) | $46,182 |
| 2 Earners | 6,512 (40.7%) | $84,019 |
| 3+ Earners | 1,580 (9.9%) | $122,340 |
| Total | 16,005 (100.0%) | $67,580 |
Household Income in Springfield
Household Income Brackets in Springfield
With 5,333 households falling in the category, the $50,000 to $74,999 income range is the most frequent in Springfield, accounting for 21.3% of all households. In contrast, only 651 households (2.6%) fall into the $200,000+ income bracket, making it the least populous group.
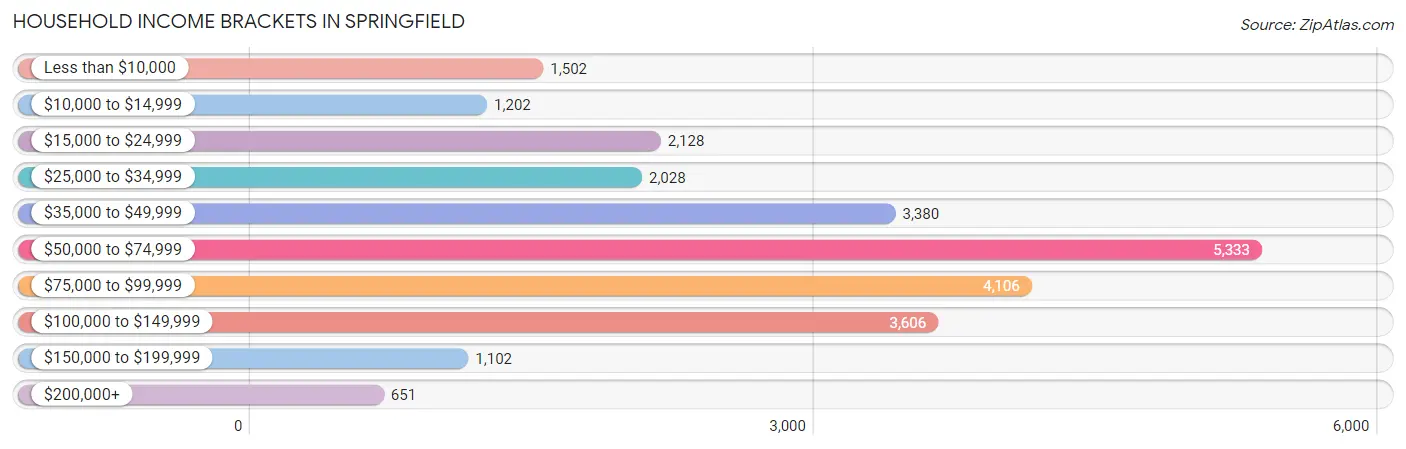
| Income Bracket | # Households | % Households |
| Less than $10,000 | 1,502 | 6.0% |
| $10,000 to $14,999 | 1,202 | 4.8% |
| $15,000 to $24,999 | 2,128 | 8.5% |
| $25,000 to $34,999 | 2,028 | 8.1% |
| $35,000 to $49,999 | 3,380 | 13.5% |
| $50,000 to $74,999 | 5,333 | 21.3% |
| $75,000 to $99,999 | 4,106 | 16.4% |
| $100,000 to $149,999 | 3,606 | 14.4% |
| $150,000 to $199,999 | 1,102 | 4.4% |
| $200,000+ | 651 | 2.6% |
Household Income by Householder Age in Springfield
The median household income in Springfield is $60,982, with the highest median household income of $71,883 found in the 25 to 44 years age bracket for the primary householder. A total of 8,672 households (34.6%) fall into this category. Meanwhile, the 65+ years age bracket for the primary householder has the lowest median household income of $45,843, with 6,077 households (24.3%) in this group.
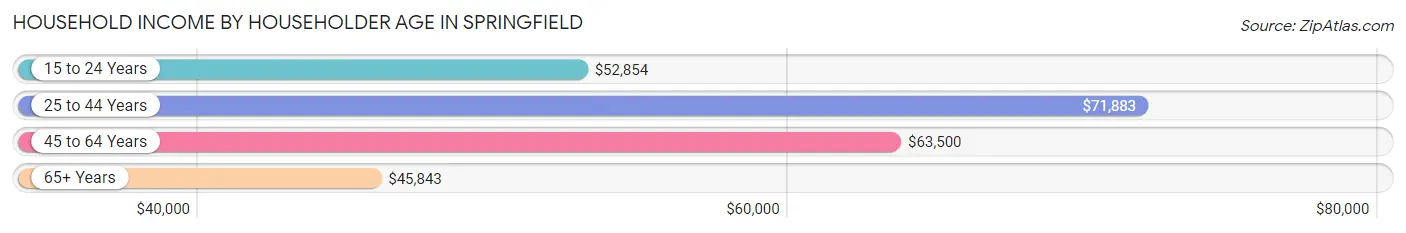
| Income Bracket | # Households | Median Income |
| 15 to 24 Years | 1,438 (5.7%) | $52,854 |
| 25 to 44 Years | 8,672 (34.6%) | $71,883 |
| 45 to 64 Years | 8,852 (35.3%) | $63,500 |
| 65+ Years | 6,077 (24.3%) | $45,843 |
| Total | 25,039 (100.0%) | $60,982 |
Poverty in Springfield
Income Below Poverty by Sex and Age in Springfield
With 14.9% poverty level for males and 18.0% for females among the residents of Springfield, 5 year old males and 16 and 17 year old females are the most vulnerable to poverty, with 84 males (20.5%) and 181 females (31.6%) in their respective age groups living below the poverty level.
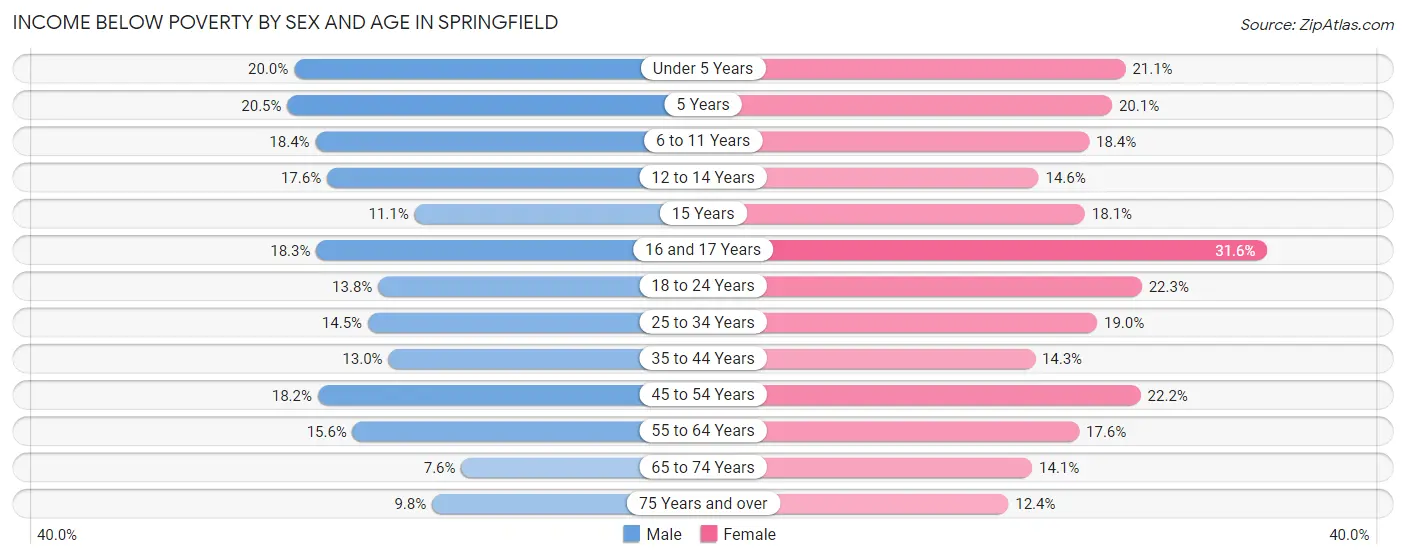
| Age Bracket | Male | Female |
| Under 5 Years | 378 (20.0%) | 302 (21.1%) |
| 5 Years | 84 (20.5%) | 62 (20.1%) |
| 6 to 11 Years | 407 (18.4%) | 310 (18.4%) |
| 12 to 14 Years | 218 (17.5%) | 181 (14.6%) |
| 15 Years | 42 (11.1%) | 48 (18.0%) |
| 16 and 17 Years | 184 (18.3%) | 181 (31.6%) |
| 18 to 24 Years | 495 (13.8%) | 614 (22.3%) |
| 25 to 34 Years | 632 (14.5%) | 879 (19.0%) |
| 35 to 44 Years | 525 (13.0%) | 602 (14.3%) |
| 45 to 54 Years | 732 (18.2%) | 824 (22.2%) |
| 55 to 64 Years | 557 (15.6%) | 704 (17.6%) |
| 65 to 74 Years | 217 (7.6%) | 431 (14.1%) |
| 75 Years and over | 135 (9.8%) | 279 (12.4%) |
| Total | 4,606 (14.9%) | 5,417 (18.0%) |
Income Above Poverty by Sex and Age in Springfield
According to the poverty statistics in Springfield, males aged 65 to 74 years and females aged 75 years and over are the age groups that are most secure financially, with 92.4% of males and 87.6% of females in these age groups living above the poverty line.
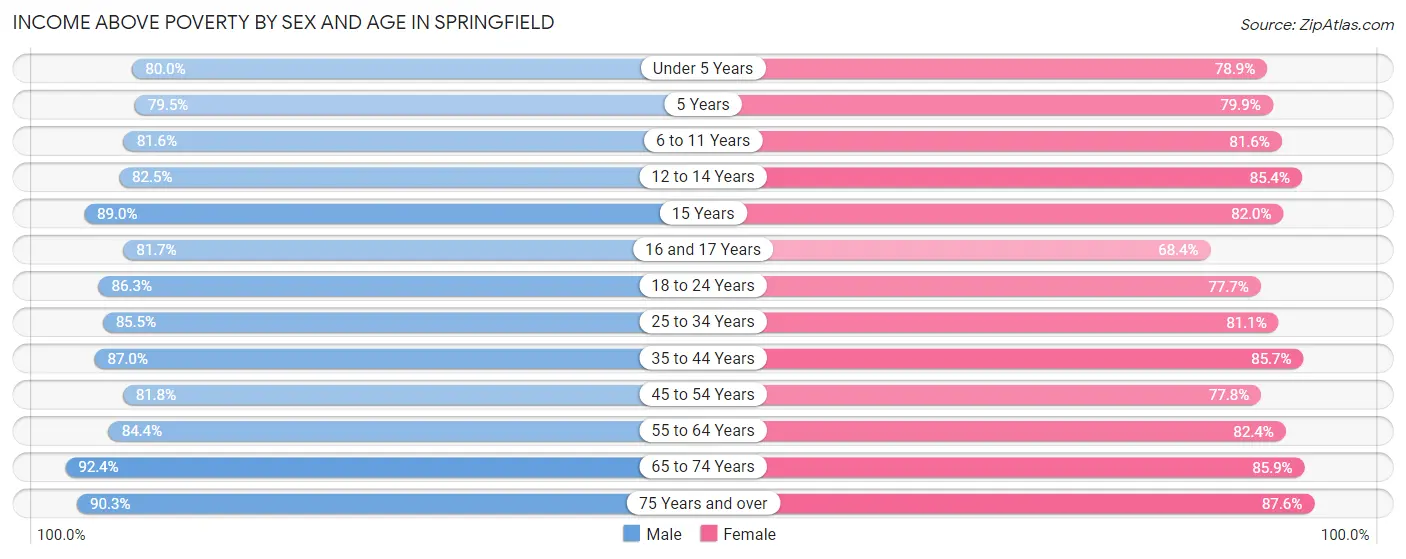
| Age Bracket | Male | Female |
| Under 5 Years | 1,513 (80.0%) | 1,132 (78.9%) |
| 5 Years | 326 (79.5%) | 247 (79.9%) |
| 6 to 11 Years | 1,804 (81.6%) | 1,378 (81.6%) |
| 12 to 14 Years | 1,024 (82.5%) | 1,058 (85.4%) |
| 15 Years | 338 (88.9%) | 218 (82.0%) |
| 16 and 17 Years | 819 (81.7%) | 392 (68.4%) |
| 18 to 24 Years | 3,106 (86.3%) | 2,143 (77.7%) |
| 25 to 34 Years | 3,724 (85.5%) | 3,760 (81.0%) |
| 35 to 44 Years | 3,516 (87.0%) | 3,595 (85.7%) |
| 45 to 54 Years | 3,284 (81.8%) | 2,890 (77.8%) |
| 55 to 64 Years | 3,004 (84.4%) | 3,292 (82.4%) |
| 65 to 74 Years | 2,651 (92.4%) | 2,620 (85.9%) |
| 75 Years and over | 1,249 (90.2%) | 1,979 (87.6%) |
| Total | 26,358 (85.1%) | 24,704 (82.0%) |
Income Below Poverty Among Married-Couple Families in Springfield
The poverty statistics for married-couple families in Springfield show that 7.2% or 758 of the total 10,499 families live below the poverty line. Families with 5 or more children have the highest poverty rate of 58.6%, comprising of 17 families. On the other hand, families with no children have the lowest poverty rate of 5.9%, which includes 373 families.
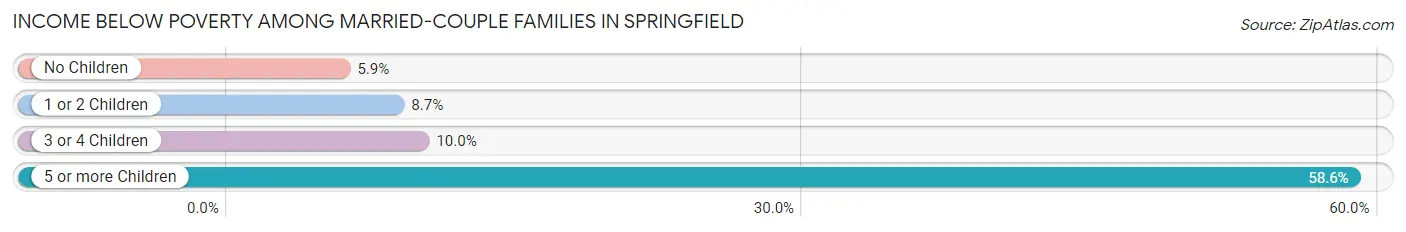
| Children | Above Poverty | Below Poverty |
| No Children | 5,978 (94.1%) | 373 (5.9%) |
| 1 or 2 Children | 3,049 (91.3%) | 290 (8.7%) |
| 3 or 4 Children | 702 (90.0%) | 78 (10.0%) |
| 5 or more Children | 12 (41.4%) | 17 (58.6%) |
| Total | 9,741 (92.8%) | 758 (7.2%) |
Income Below Poverty Among Single-Parent Households in Springfield
According to the poverty data in Springfield, 9.1% or 157 single-father households and 25.8% or 974 single-mother households are living below the poverty line. Among single-father households, those with 3 or 4 children have the highest poverty rate, with 7 households (12.7%) experiencing poverty. Likewise, among single-mother households, those with 3 or 4 children have the highest poverty rate, with 112 households (36.1%) falling below the poverty line.
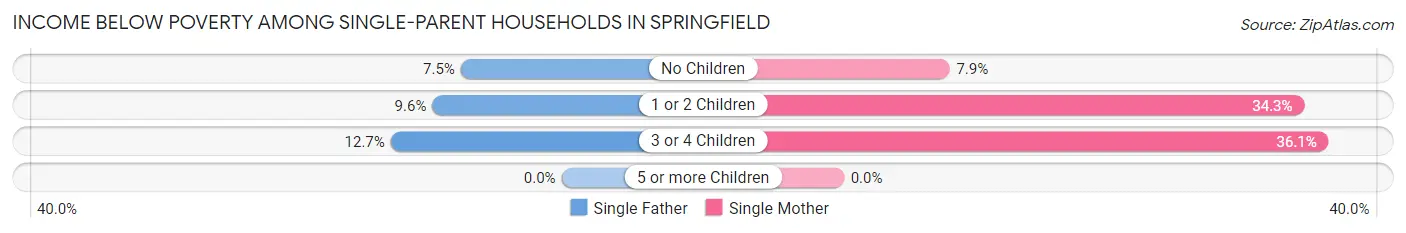
| Children | Single Father | Single Mother |
| No Children | 39 (7.5%) | 98 (7.9%) |
| 1 or 2 Children | 111 (9.6%) | 764 (34.3%) |
| 3 or 4 Children | 7 (12.7%) | 112 (36.1%) |
| 5 or more Children | 0 (0.0%) | 0 (0.0%) |
| Total | 157 (9.1%) | 974 (25.8%) |
Income Below Poverty Among Married-Couple vs Single-Parent Households in Springfield
The poverty data for Springfield shows that 758 of the married-couple family households (7.2%) and 1,131 of the single-parent households (20.5%) are living below the poverty level. Within the married-couple family households, those with 5 or more children have the highest poverty rate, with 17 households (58.6%) falling below the poverty line. Among the single-parent households, those with 3 or 4 children have the highest poverty rate, with 119 household (32.6%) living below poverty.
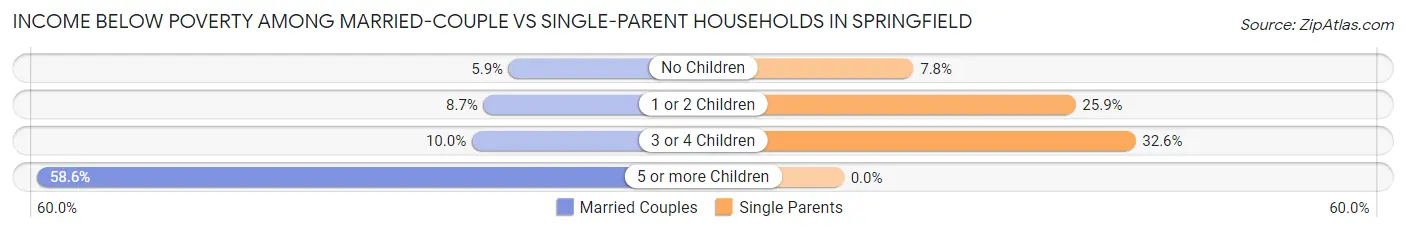
| Children | Married-Couple Families | Single-Parent Households |
| No Children | 373 (5.9%) | 137 (7.8%) |
| 1 or 2 Children | 290 (8.7%) | 875 (25.9%) |
| 3 or 4 Children | 78 (10.0%) | 119 (32.6%) |
| 5 or more Children | 17 (58.6%) | 0 (0.0%) |
| Total | 758 (7.2%) | 1,131 (20.5%) |
Race in Springfield
The most populous races in Springfield are White / Caucasian (49,368 | 80.0%), Hispanic or Latino (8,416 | 13.6%), and Two or more Races (5,799 | 9.4%).
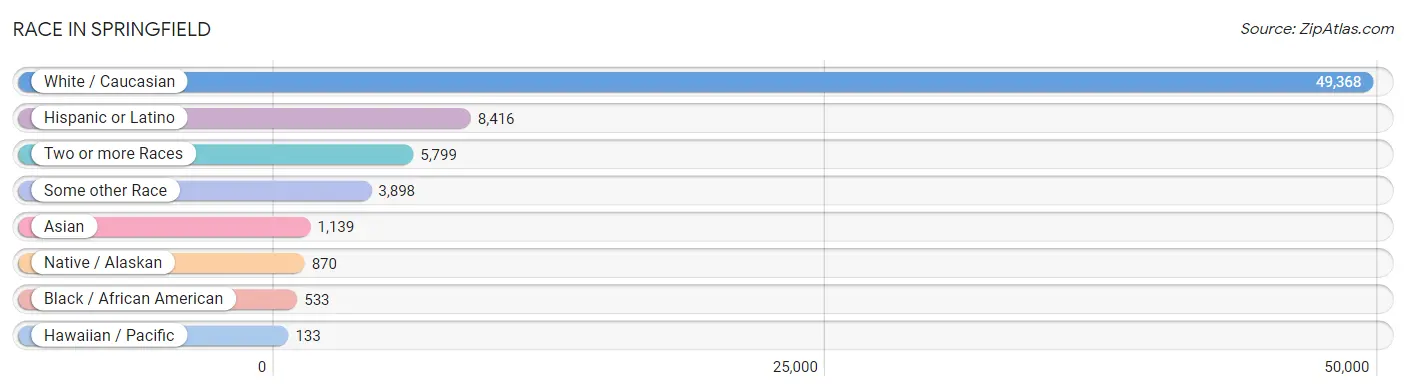
| Race | # Population | % Population |
| Asian | 1,139 | 1.8% |
| Black / African American | 533 | 0.9% |
| Hawaiian / Pacific | 133 | 0.2% |
| Hispanic or Latino | 8,416 | 13.6% |
| Native / Alaskan | 870 | 1.4% |
| White / Caucasian | 49,368 | 80.0% |
| Two or more Races | 5,799 | 9.4% |
| Some other Race | 3,898 | 6.3% |
| Total | 61,740 | 100.0% |
Ancestry in Springfield
The most populous ancestries reported in Springfield are German (10,855 | 17.6%), Irish (8,468 | 13.7%), English (7,640 | 12.4%), Mexican (6,460 | 10.5%), and French (2,399 | 3.9%), together accounting for 58.0% of all Springfield residents.
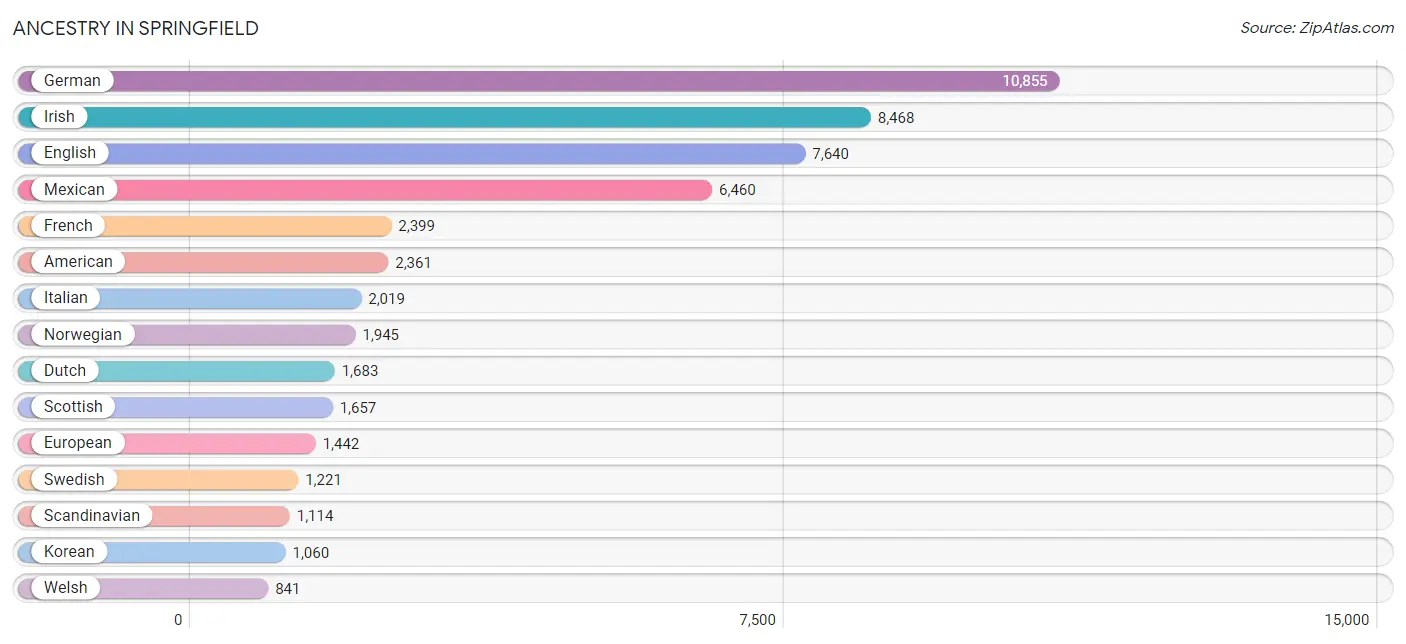
| Ancestry | # Population | % Population |
| African | 152 | 0.3% |
| Albanian | 19 | 0.0% |
| Alsatian | 7 | 0.0% |
| American | 2,361 | 3.8% |
| Apache | 37 | 0.1% |
| Arab | 238 | 0.4% |
| Argentinean | 30 | 0.1% |
| Armenian | 17 | 0.0% |
| Australian | 77 | 0.1% |
| Austrian | 77 | 0.1% |
| Bahamian | 7 | 0.0% |
| Bangladeshi | 24 | 0.0% |
| Basque | 9 | 0.0% |
| Belgian | 71 | 0.1% |
| Bhutanese | 408 | 0.7% |
| Blackfeet | 92 | 0.2% |
| Brazilian | 22 | 0.0% |
| British | 660 | 1.1% |
| Burmese | 84 | 0.1% |
| Cajun | 3 | 0.0% |
| Canadian | 257 | 0.4% |
| Cape Verdean | 18 | 0.0% |
| Celtic | 77 | 0.1% |
| Central American | 386 | 0.6% |
| Central American Indian | 125 | 0.2% |
| Cherokee | 623 | 1.0% |
| Chickasaw | 123 | 0.2% |
| Chilean | 49 | 0.1% |
| Chippewa | 108 | 0.2% |
| Choctaw | 54 | 0.1% |
| Colombian | 20 | 0.0% |
| Colville | 139 | 0.2% |
| Comanche | 17 | 0.0% |
| Cree | 123 | 0.2% |
| Croatian | 53 | 0.1% |
| Cuban | 118 | 0.2% |
| Czech | 323 | 0.5% |
| Czechoslovakian | 33 | 0.1% |
| Danish | 686 | 1.1% |
| Dutch | 1,683 | 2.7% |
| Eastern European | 277 | 0.4% |
| Ecuadorian | 7 | 0.0% |
| Egyptian | 75 | 0.1% |
| English | 7,640 | 12.4% |
| European | 1,442 | 2.3% |
| Finnish | 248 | 0.4% |
| French | 2,399 | 3.9% |
| French American Indian | 12 | 0.0% |
| French Canadian | 515 | 0.8% |
| German | 10,855 | 17.6% |
| Greek | 208 | 0.3% |
| Guatemalan | 225 | 0.4% |
| Haitian | 8 | 0.0% |
| Hopi | 7 | 0.0% |
| Hungarian | 156 | 0.3% |
| Icelander | 11 | 0.0% |
| Indian (Asian) | 291 | 0.5% |
| Inupiat | 2 | 0.0% |
| Iranian | 61 | 0.1% |
| Irish | 8,468 | 13.7% |
| Iroquois | 14 | 0.0% |
| Italian | 2,019 | 3.3% |
| Kiowa | 48 | 0.1% |
| Korean | 1,060 | 1.7% |
| Laotian | 34 | 0.1% |
| Latvian | 6 | 0.0% |
| Lebanese | 87 | 0.1% |
| Lithuanian | 39 | 0.1% |
| Lumbee | 33 | 0.1% |
| Malaysian | 122 | 0.2% |
| Mexican | 6,460 | 10.5% |
| Mexican American Indian | 11 | 0.0% |
| Native Hawaiian | 157 | 0.3% |
| Navajo | 228 | 0.4% |
| New Zealander | 9 | 0.0% |
| Nigerian | 22 | 0.0% |
| Northern European | 122 | 0.2% |
| Norwegian | 1,945 | 3.2% |
| Paiute | 86 | 0.1% |
| Pakistani | 40 | 0.1% |
| Panamanian | 25 | 0.0% |
| Pennsylvania German | 48 | 0.1% |
| Peruvian | 158 | 0.3% |
| Polish | 622 | 1.0% |
| Portuguese | 399 | 0.6% |
| Potawatomi | 7 | 0.0% |
| Pueblo | 29 | 0.1% |
| Puerto Rican | 410 | 0.7% |
| Romanian | 12 | 0.0% |
| Russian | 215 | 0.4% |
| Salvadoran | 129 | 0.2% |
| Samoan | 49 | 0.1% |
| Scandinavian | 1,114 | 1.8% |
| Scotch-Irish | 576 | 0.9% |
| Scottish | 1,657 | 2.7% |
| Seminole | 37 | 0.1% |
| Shoshone | 12 | 0.0% |
| Sioux | 184 | 0.3% |
| Slovak | 20 | 0.0% |
| South American | 330 | 0.5% |
| South American Indian | 6 | 0.0% |
| Spaniard | 159 | 0.3% |
| Spanish | 366 | 0.6% |
| Sri Lankan | 74 | 0.1% |
| Subsaharan African | 192 | 0.3% |
| Swedish | 1,221 | 2.0% |
| Swiss | 457 | 0.7% |
| Syrian | 69 | 0.1% |
| Thai | 303 | 0.5% |
| Tlingit-Haida | 43 | 0.1% |
| Ukrainian | 52 | 0.1% |
| Uruguayan | 66 | 0.1% |
| Welsh | 841 | 1.4% |
| Yakama | 63 | 0.1% |
| Yaqui | 47 | 0.1% |
| Yugoslavian | 17 | 0.0% | View All 116 Rows |
Immigrants in Springfield
The most numerous immigrant groups reported in Springfield came from Latin America (2,289 | 3.7%), Central America (2,115 | 3.4%), Mexico (1,985 | 3.2%), Asia (615 | 1.0%), and Europe (446 | 0.7%), together accounting for 12.1% of all Springfield residents.
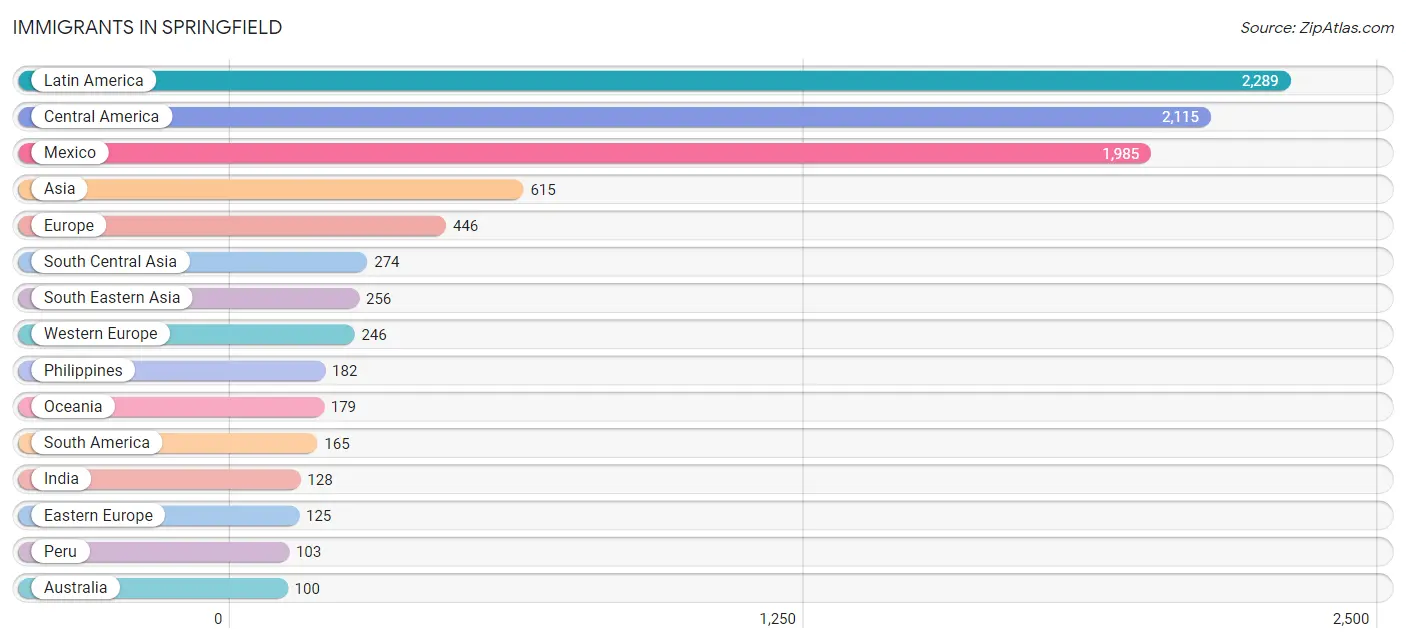
| Immigration Origin | # Population | % Population |
| Africa | 38 | 0.1% |
| Albania | 19 | 0.0% |
| Argentina | 6 | 0.0% |
| Asia | 615 | 1.0% |
| Australia | 100 | 0.2% |
| Austria | 24 | 0.0% |
| Belgium | 6 | 0.0% |
| Brazil | 6 | 0.0% |
| Canada | 87 | 0.1% |
| Caribbean | 9 | 0.0% |
| Central America | 2,115 | 3.4% |
| China | 24 | 0.0% |
| Cuba | 9 | 0.0% |
| Eastern Asia | 76 | 0.1% |
| Eastern Europe | 125 | 0.2% |
| Ecuador | 4 | 0.0% |
| Egypt | 27 | 0.0% |
| El Salvador | 45 | 0.1% |
| Europe | 446 | 0.7% |
| Fiji | 25 | 0.0% |
| France | 60 | 0.1% |
| Germany | 94 | 0.2% |
| Greece | 14 | 0.0% |
| Guatemala | 85 | 0.1% |
| India | 128 | 0.2% |
| Indonesia | 12 | 0.0% |
| Iran | 82 | 0.1% |
| Israel | 9 | 0.0% |
| Japan | 28 | 0.1% |
| Korea | 24 | 0.0% |
| Laos | 18 | 0.0% |
| Latin America | 2,289 | 3.7% |
| Latvia | 6 | 0.0% |
| Malaysia | 13 | 0.0% |
| Mexico | 1,985 | 3.2% |
| Micronesia | 43 | 0.1% |
| Netherlands | 62 | 0.1% |
| Nigeria | 11 | 0.0% |
| Northern Africa | 27 | 0.0% |
| Northern Europe | 43 | 0.1% |
| Oceania | 179 | 0.3% |
| Pakistan | 64 | 0.1% |
| Peru | 103 | 0.2% |
| Philippines | 182 | 0.3% |
| Portugal | 11 | 0.0% |
| Russia | 28 | 0.1% |
| Singapore | 17 | 0.0% |
| South America | 165 | 0.3% |
| South Central Asia | 274 | 0.4% |
| South Eastern Asia | 256 | 0.4% |
| Southern Europe | 25 | 0.0% |
| Ukraine | 72 | 0.1% |
| Uruguay | 46 | 0.1% |
| Vietnam | 14 | 0.0% |
| Western Africa | 11 | 0.0% |
| Western Asia | 9 | 0.0% |
| Western Europe | 246 | 0.4% | View All 57 Rows |
Sex and Age in Springfield
Sex and Age in Springfield
The most populous age groups in Springfield are 20 to 24 Years (2,805 | 8.9%) for men and 30 to 34 Years (2,579 | 8.5%) for women.
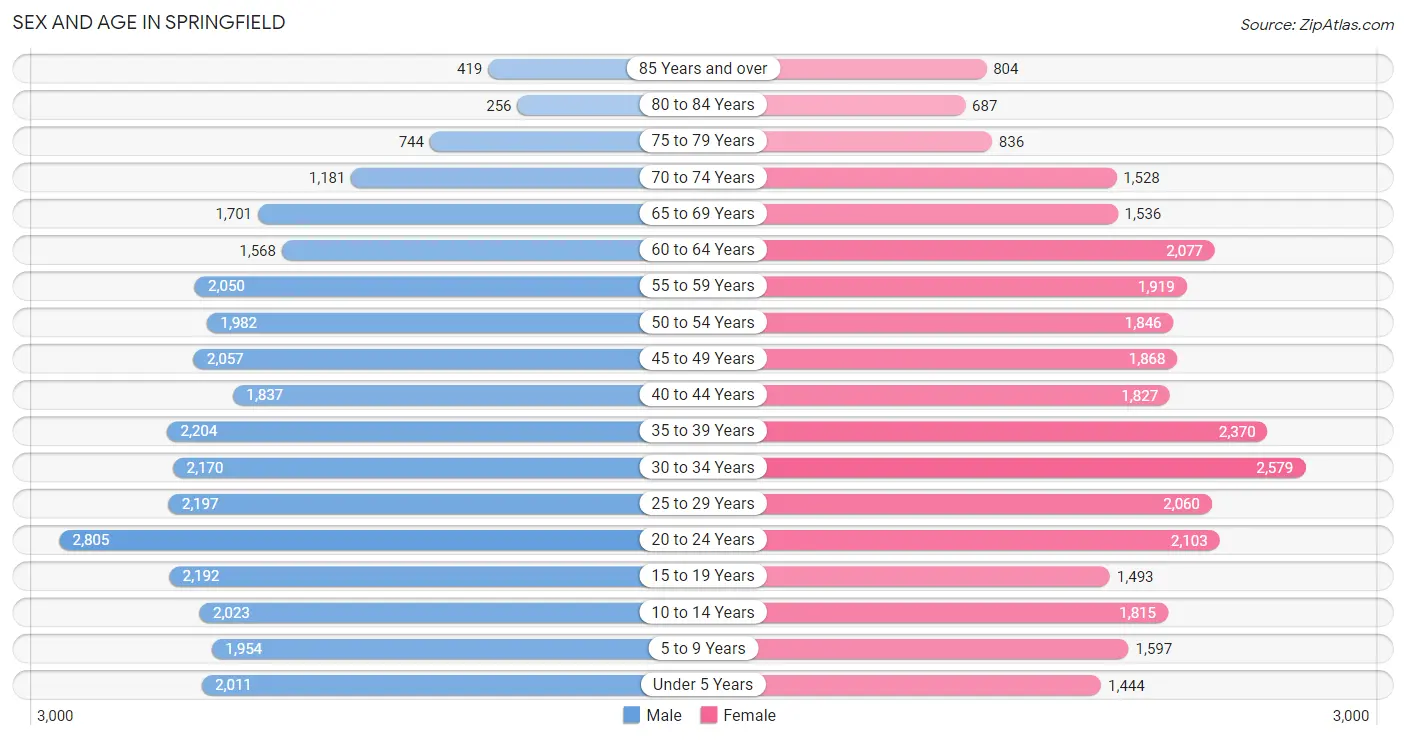
| Age Bracket | Male | Female |
| Under 5 Years | 2,011 (6.4%) | 1,444 (4.8%) |
| 5 to 9 Years | 1,954 (6.2%) | 1,597 (5.3%) |
| 10 to 14 Years | 2,023 (6.5%) | 1,815 (6.0%) |
| 15 to 19 Years | 2,192 (7.0%) | 1,493 (4.9%) |
| 20 to 24 Years | 2,805 (8.9%) | 2,103 (6.9%) |
| 25 to 29 Years | 2,197 (7.0%) | 2,060 (6.8%) |
| 30 to 34 Years | 2,170 (6.9%) | 2,579 (8.5%) |
| 35 to 39 Years | 2,204 (7.0%) | 2,370 (7.8%) |
| 40 to 44 Years | 1,837 (5.9%) | 1,827 (6.0%) |
| 45 to 49 Years | 2,057 (6.6%) | 1,868 (6.1%) |
| 50 to 54 Years | 1,982 (6.3%) | 1,846 (6.1%) |
| 55 to 59 Years | 2,050 (6.5%) | 1,919 (6.3%) |
| 60 to 64 Years | 1,568 (5.0%) | 2,077 (6.8%) |
| 65 to 69 Years | 1,701 (5.4%) | 1,536 (5.1%) |
| 70 to 74 Years | 1,181 (3.8%) | 1,528 (5.0%) |
| 75 to 79 Years | 744 (2.4%) | 836 (2.8%) |
| 80 to 84 Years | 256 (0.8%) | 687 (2.3%) |
| 85 Years and over | 419 (1.3%) | 804 (2.6%) |
| Total | 31,351 (100.0%) | 30,389 (100.0%) |
Families and Households in Springfield
Median Family Size in Springfield
The median family size in Springfield is 2.88 persons per family, with married-couple families (10,499 | 65.6%) accounting for the largest median family size of 3.02 persons per family. On the other hand, single male/father families (1,727 | 10.8%) represent the smallest median family size with 2.26 persons per family.
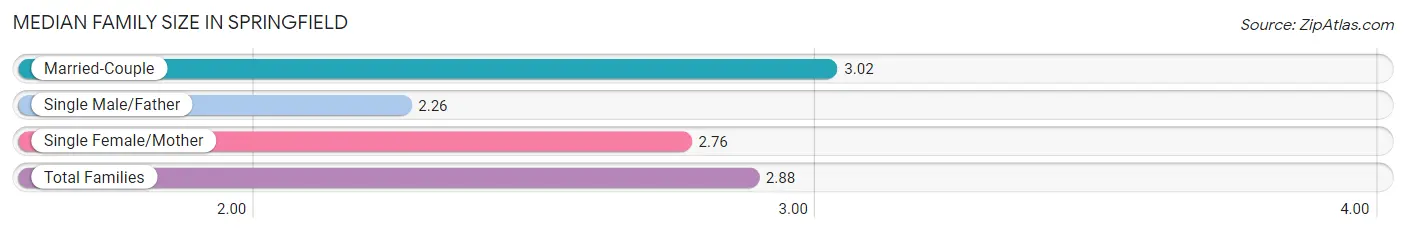
| Family Type | # Families | Family Size |
| Married-Couple | 10,499 (65.6%) | 3.02 |
| Single Male/Father | 1,727 (10.8%) | 2.26 |
| Single Female/Mother | 3,779 (23.6%) | 2.76 |
| Total Families | 16,005 (100.0%) | 2.88 |
Median Household Size in Springfield
The median household size in Springfield is 2.44 persons per household, with single female/mother households (3,779 | 15.1%) accounting for the largest median household size of 3.22 persons per household. non-family households (9,034 | 36.1%) represent the smallest median household size with 1.32 persons per household.
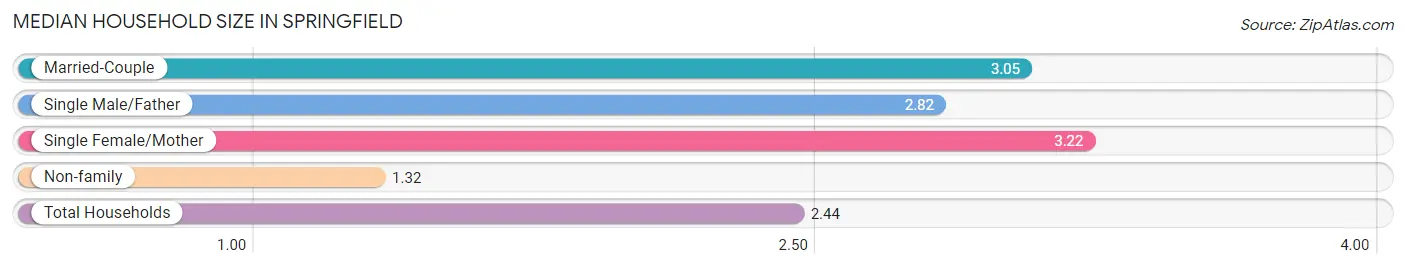
| Household Type | # Households | Household Size |
| Married-Couple | 10,499 (41.9%) | 3.05 |
| Single Male/Father | 1,727 (6.9%) | 2.82 |
| Single Female/Mother | 3,779 (15.1%) | 3.22 |
| Non-family | 9,034 (36.1%) | 1.32 |
| Total Households | 25,039 (100.0%) | 2.44 |
Household Size by Marriage Status in Springfield
Out of a total of 25,039 households in Springfield, 16,005 (63.9%) are family households, while 9,034 (36.1%) are nonfamily households. The most numerous type of family households are 2-person households, comprising 6,998, and the most common type of nonfamily households are 1-person households, comprising 6,678.
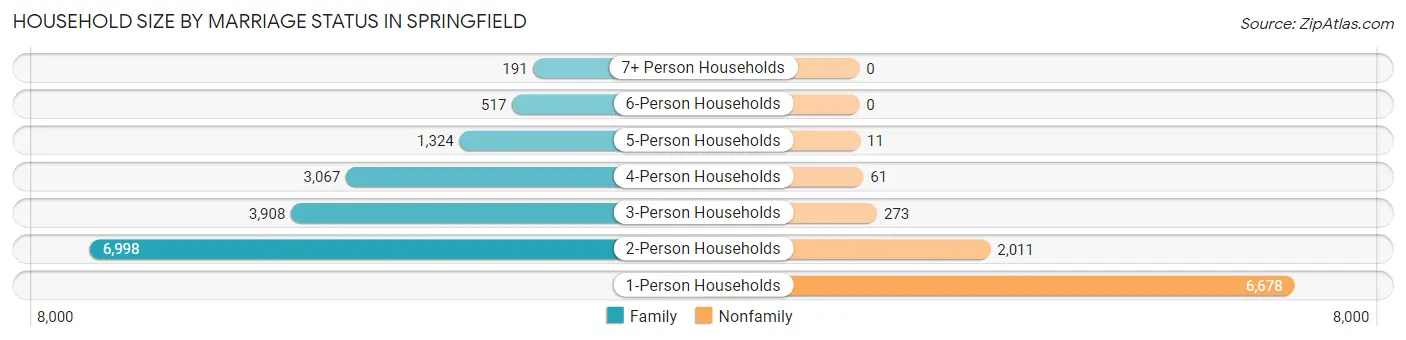
| Household Size | Family Households | Nonfamily Households |
| 1-Person Households | - | 6,678 (26.7%) |
| 2-Person Households | 6,998 (28.0%) | 2,011 (8.0%) |
| 3-Person Households | 3,908 (15.6%) | 273 (1.1%) |
| 4-Person Households | 3,067 (12.2%) | 61 (0.2%) |
| 5-Person Households | 1,324 (5.3%) | 11 (0.0%) |
| 6-Person Households | 517 (2.1%) | 0 (0.0%) |
| 7+ Person Households | 191 (0.8%) | 0 (0.0%) |
| Total | 16,005 (63.9%) | 9,034 (36.1%) |
Female Fertility in Springfield
Fertility by Age in Springfield
Average fertility rate in Springfield is 39.0 births per 1,000 women. Women in the age bracket of 20 to 34 years have the highest fertility rate with 59.0 births per 1,000 women. Women in the age bracket of 20 to 34 years acount for 69.7% of all women with births.
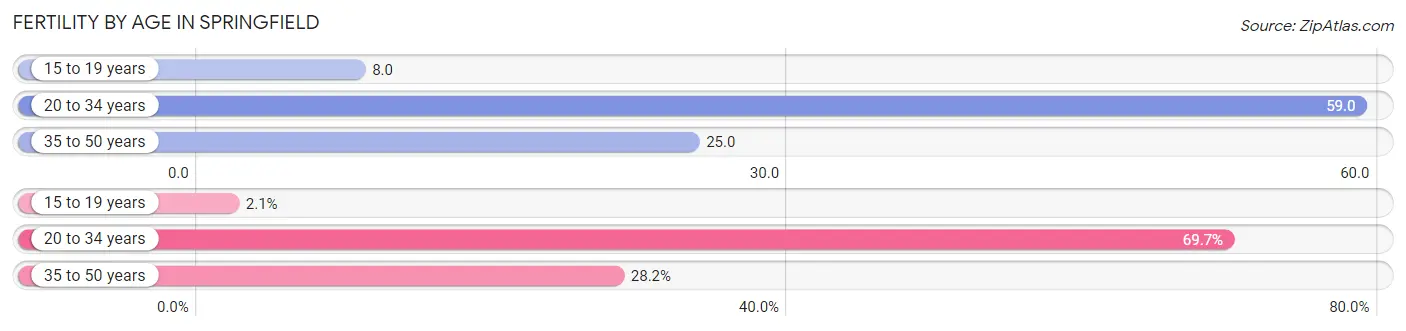
| Age Bracket | Women with Births | Births / 1,000 Women |
| 15 to 19 years | 12 (2.1%) | 8.0 |
| 20 to 34 years | 400 (69.7%) | 59.0 |
| 35 to 50 years | 162 (28.2%) | 25.0 |
| Total | 574 (100.0%) | 39.0 |
Fertility by Age by Marriage Status in Springfield
66.9% of women with births (574) in Springfield are married. The highest percentage of unmarried women with births falls into 15 to 19 years age bracket with 100.0% of them unmarried at the time of birth, while the lowest percentage of unmarried women with births belong to 20 to 34 years age bracket with 31.0% of them unmarried.
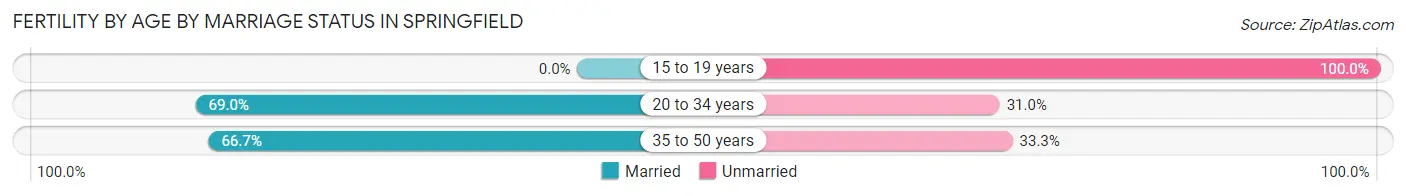
| Age Bracket | Married | Unmarried |
| 15 to 19 years | 0 (0.0%) | 12 (100.0%) |
| 20 to 34 years | 276 (69.0%) | 124 (31.0%) |
| 35 to 50 years | 108 (66.7%) | 54 (33.3%) |
| Total | 384 (66.9%) | 190 (33.1%) |
Fertility by Education in Springfield
Average fertility rate in Springfield is 39.0 births per 1,000 women. Women with the education attainment of graduate degree have the highest fertility rate of 61.0 births per 1,000 women, while women with the education attainment of less than high school have the lowest fertility at 11.0 births per 1,000 women. Women with the education attainment of college or associate's degree represent 34.5% of all women with births.
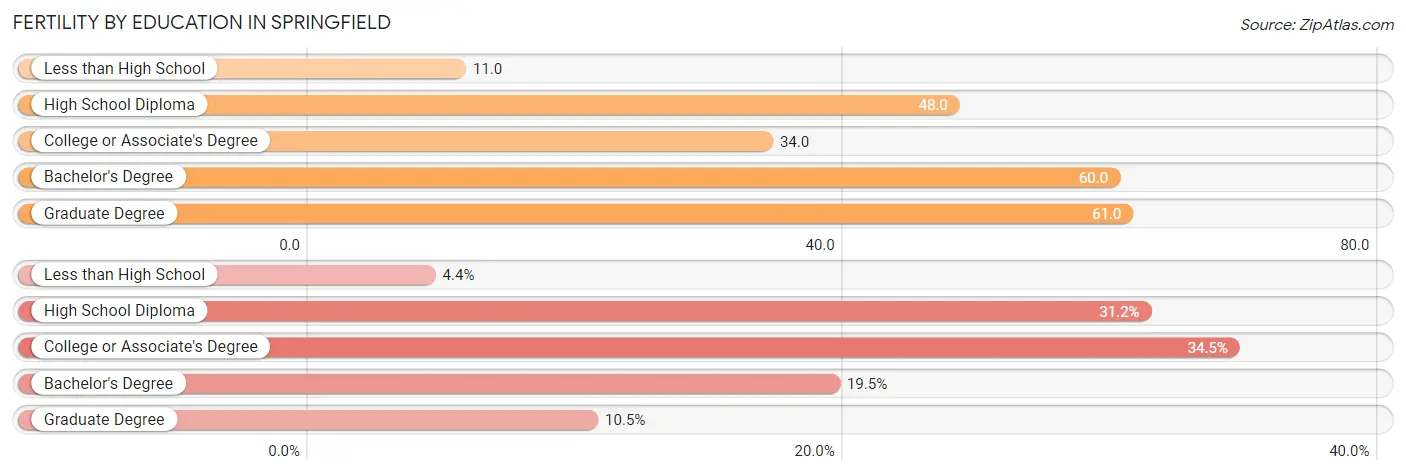
| Educational Attainment | Women with Births | Births / 1,000 Women |
| Less than High School | 25 (4.4%) | 11.0 |
| High School Diploma | 179 (31.2%) | 48.0 |
| College or Associate's Degree | 198 (34.5%) | 34.0 |
| Bachelor's Degree | 112 (19.5%) | 60.0 |
| Graduate Degree | 60 (10.4%) | 61.0 |
| Total | 574 (100.0%) | 39.0 |
Fertility by Education by Marriage Status in Springfield
33.1% of women with births in Springfield are unmarried. Women with the educational attainment of bachelor's degree are most likely to be married with 87.5% of them married at childbirth, while women with the educational attainment of less than high school are least likely to be married with 84.0% of them unmarried at childbirth.
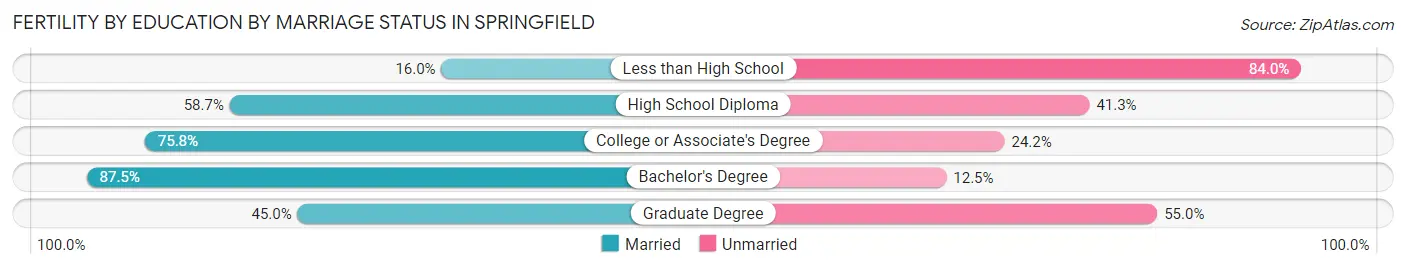
| Educational Attainment | Married | Unmarried |
| Less than High School | 4 (16.0%) | 21 (84.0%) |
| High School Diploma | 105 (58.7%) | 74 (41.3%) |
| College or Associate's Degree | 150 (75.8%) | 48 (24.2%) |
| Bachelor's Degree | 98 (87.5%) | 14 (12.5%) |
| Graduate Degree | 27 (45.0%) | 33 (55.0%) |
| Total | 384 (66.9%) | 190 (33.1%) |
Employment Characteristics in Springfield
Employment by Class of Employer in Springfield
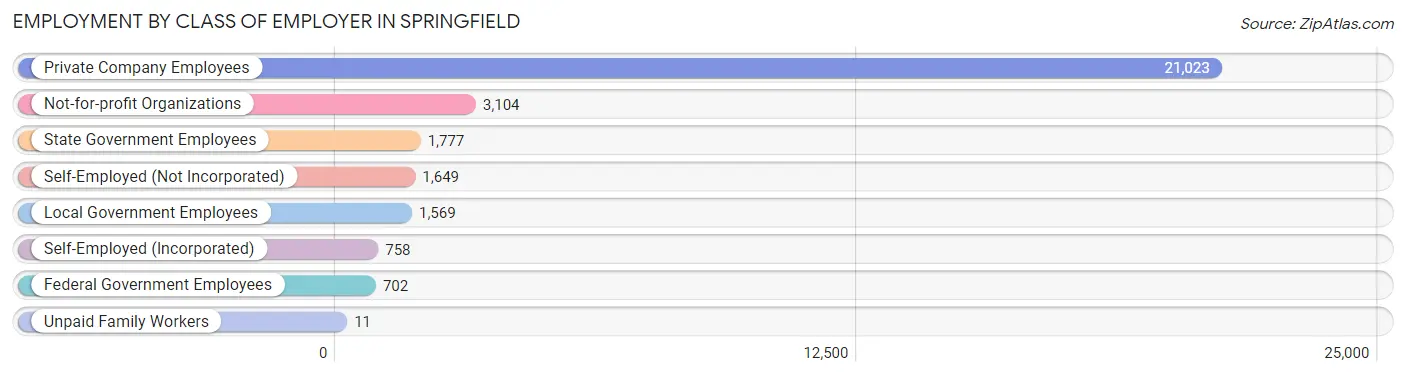
Among the 30,593 employed individuals in Springfield, private company employees (21,023 | 68.7%), not-for-profit organizations (3,104 | 10.2%), and state government employees (1,777 | 5.8%) make up the most common classes of employment.
| Employer Class | # Employees | % Employees |
| Private Company Employees | 21,023 | 68.7% |
| Self-Employed (Incorporated) | 758 | 2.5% |
| Self-Employed (Not Incorporated) | 1,649 | 5.4% |
| Not-for-profit Organizations | 3,104 | 10.2% |
| Local Government Employees | 1,569 | 5.1% |
| State Government Employees | 1,777 | 5.8% |
| Federal Government Employees | 702 | 2.3% |
| Unpaid Family Workers | 11 | 0.0% |
| Total | 30,593 | 100.0% |
Employment Status by Age in Springfield
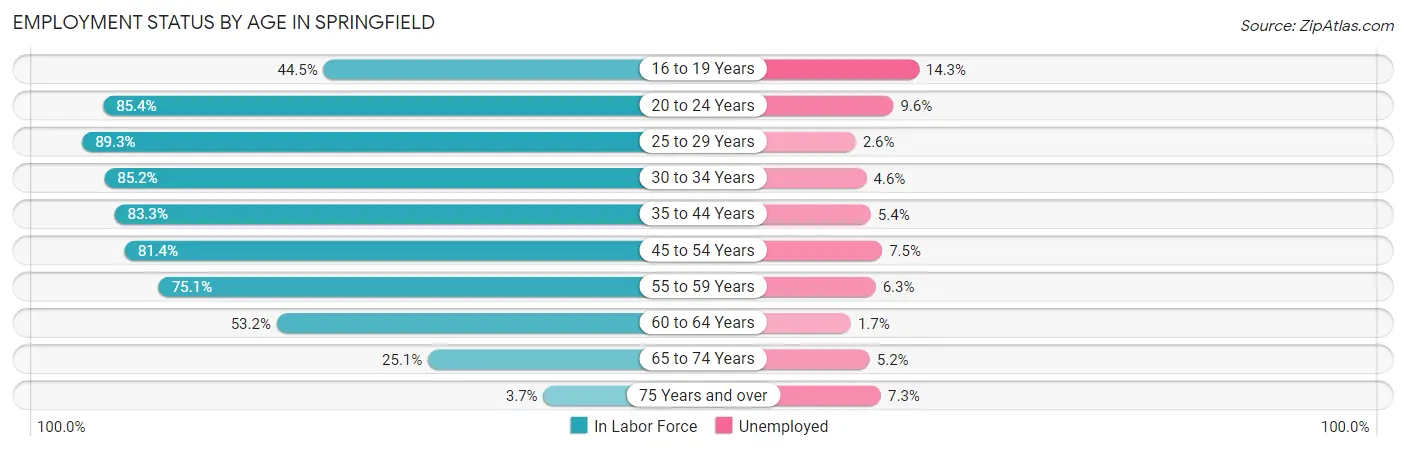
According to the labor force statistics for Springfield, out of the total population over 16 years of age (50,250), 65.9% or 33,115 individuals are in the labor force, with 6.1% or 2,020 of them unemployed. The age group with the highest labor force participation rate is 25 to 29 years, with 89.3% or 3,802 individuals in the labor force. Within the labor force, the 16 to 19 years age range has the highest percentage of unemployed individuals, with 14.3% or 193 of them being unemployed.
| Age Bracket | In Labor Force | Unemployed |
| 16 to 19 Years | 1,352 (44.5%) | 193 (14.3%) |
| 20 to 24 Years | 4,191 (85.4%) | 402 (9.6%) |
| 25 to 29 Years | 3,802 (89.3%) | 99 (2.6%) |
| 30 to 34 Years | 4,046 (85.2%) | 186 (4.6%) |
| 35 to 44 Years | 6,862 (83.3%) | 371 (5.4%) |
| 45 to 54 Years | 6,311 (81.4%) | 473 (7.5%) |
| 55 to 59 Years | 2,981 (75.1%) | 188 (6.3%) |
| 60 to 64 Years | 1,939 (53.2%) | 33 (1.7%) |
| 65 to 74 Years | 1,492 (25.1%) | 78 (5.2%) |
| 75 Years and over | 139 (3.7%) | 10 (7.3%) |
| Total | 33,115 (65.9%) | 2,020 (6.1%) |
Employment Status by Educational Attainment in Springfield
According to labor force statistics for Springfield, 79.5% of individuals (25,926) out of the total population between 25 and 64 years of age (32,611) are in the labor force, with 5.2% or 1,348 of them being unemployed. The group with the highest labor force participation rate are those with the educational attainment of bachelor's degree or higher, with 89.0% or 5,827 individuals in the labor force. Within the labor force, individuals with less than high school education have the highest percentage of unemployment, with 13.5% or 365 of them being unemployed.
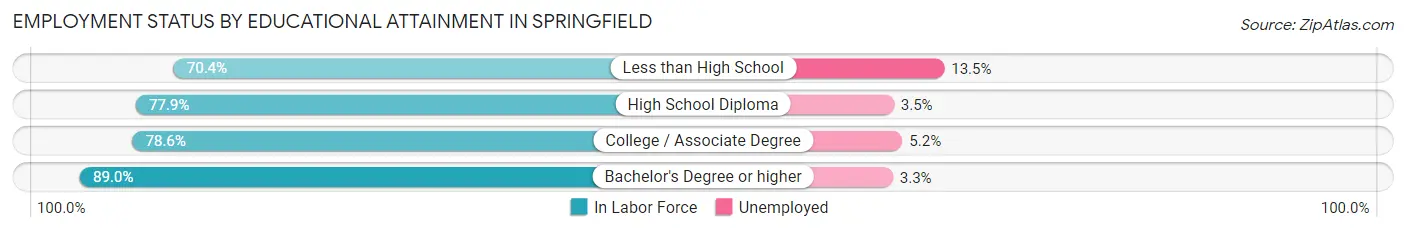
| Educational Attainment | In Labor Force | Unemployed |
| Less than High School | 2,705 (70.4%) | 519 (13.5%) |
| High School Diploma | 7,214 (77.9%) | 324 (3.5%) |
| College / Associate Degree | 10,187 (78.6%) | 674 (5.2%) |
| Bachelor's Degree or higher | 5,827 (89.0%) | 216 (3.3%) |
| Total | 25,926 (79.5%) | 1,696 (5.2%) |
Employment Occupations by Sex in Springfield
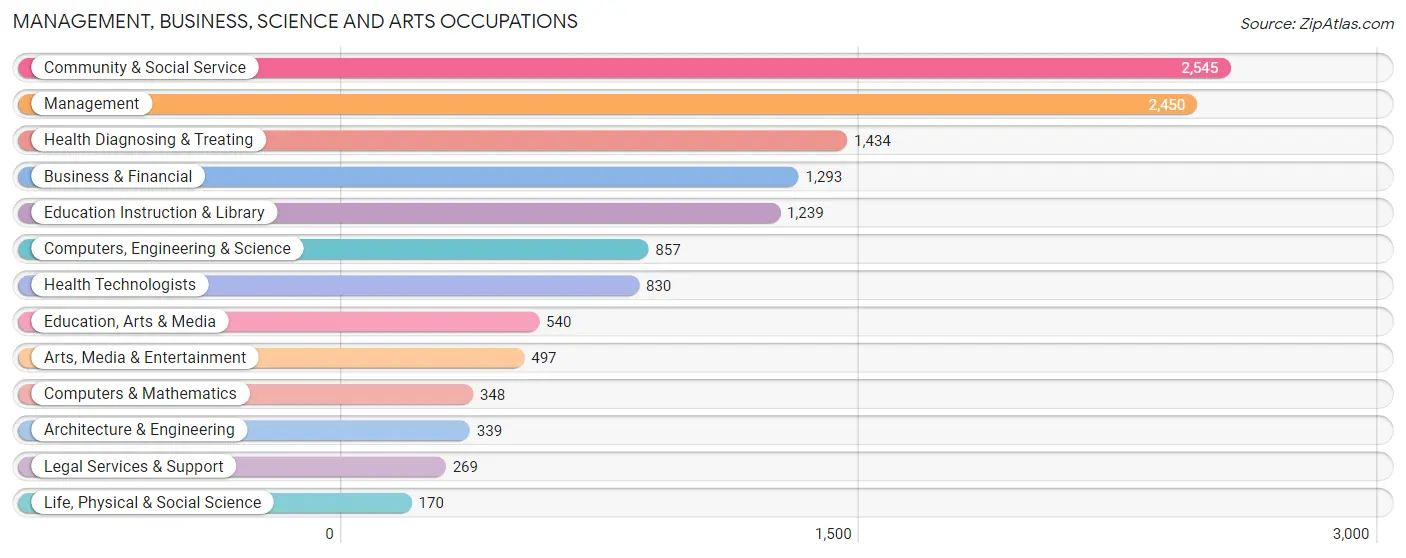
Management, Business, Science and Arts Occupations
The most common Management, Business, Science and Arts occupations in Springfield are Community & Social Service (2,545 | 8.2%), Management (2,450 | 7.9%), Health Diagnosing & Treating (1,434 | 4.6%), Business & Financial (1,293 | 4.2%), and Education Instruction & Library (1,239 | 4.0%).
Management, Business, Science and Arts Occupations by Sex
Within the Management, Business, Science and Arts occupations in Springfield, the most male-oriented occupations are Architecture & Engineering (85.0%), Computers, Engineering & Science (71.8%), and Life, Physical & Social Science (67.6%), while the most female-oriented occupations are Health Technologists (88.3%), Health Diagnosing & Treating (83.8%), and Education Instruction & Library (76.4%).
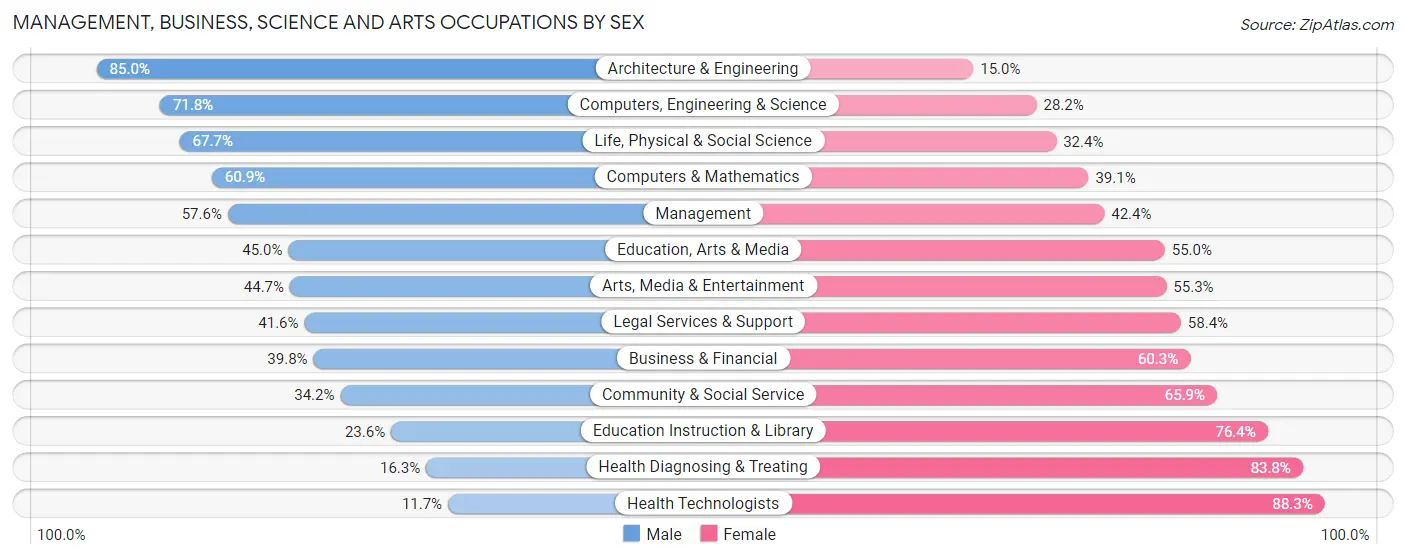
| Occupation | Male | Female |
| Management | 1,412 (57.6%) | 1,038 (42.4%) |
| Business & Financial | 514 (39.8%) | 779 (60.3%) |
| Computers, Engineering & Science | 615 (71.8%) | 242 (28.2%) |
| Computers & Mathematics | 212 (60.9%) | 136 (39.1%) |
| Architecture & Engineering | 288 (85.0%) | 51 (15.0%) |
| Life, Physical & Social Science | 115 (67.6%) | 55 (32.4%) |
| Community & Social Service | 869 (34.2%) | 1,676 (65.8%) |
| Education, Arts & Media | 243 (45.0%) | 297 (55.0%) |
| Legal Services & Support | 112 (41.6%) | 157 (58.4%) |
| Education Instruction & Library | 292 (23.6%) | 947 (76.4%) |
| Arts, Media & Entertainment | 222 (44.7%) | 275 (55.3%) |
| Health Diagnosing & Treating | 233 (16.3%) | 1,201 (83.8%) |
| Health Technologists | 97 (11.7%) | 733 (88.3%) |
| Total (Category) | 3,643 (42.5%) | 4,936 (57.5%) |
| Total (Overall) | 16,467 (53.1%) | 14,527 (46.9%) |
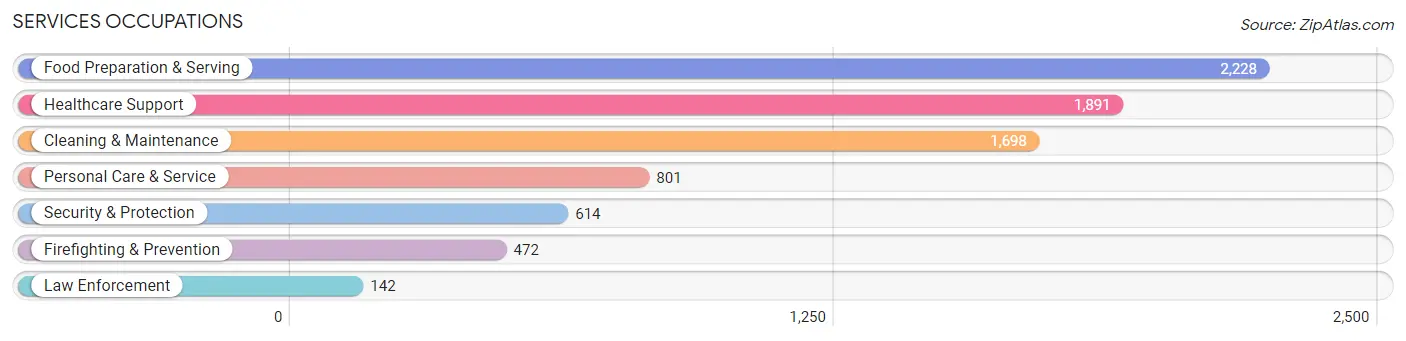
Services Occupations
The most common Services occupations in Springfield are Food Preparation & Serving (2,228 | 7.2%), Healthcare Support (1,891 | 6.1%), Cleaning & Maintenance (1,698 | 5.5%), Personal Care & Service (801 | 2.6%), and Security & Protection (614 | 2.0%).
Services Occupations by Sex
Within the Services occupations in Springfield, the most male-oriented occupations are Law Enforcement (88.7%), Security & Protection (80.5%), and Firefighting & Prevention (78.0%), while the most female-oriented occupations are Personal Care & Service (87.9%), Healthcare Support (74.9%), and Food Preparation & Serving (61.0%).
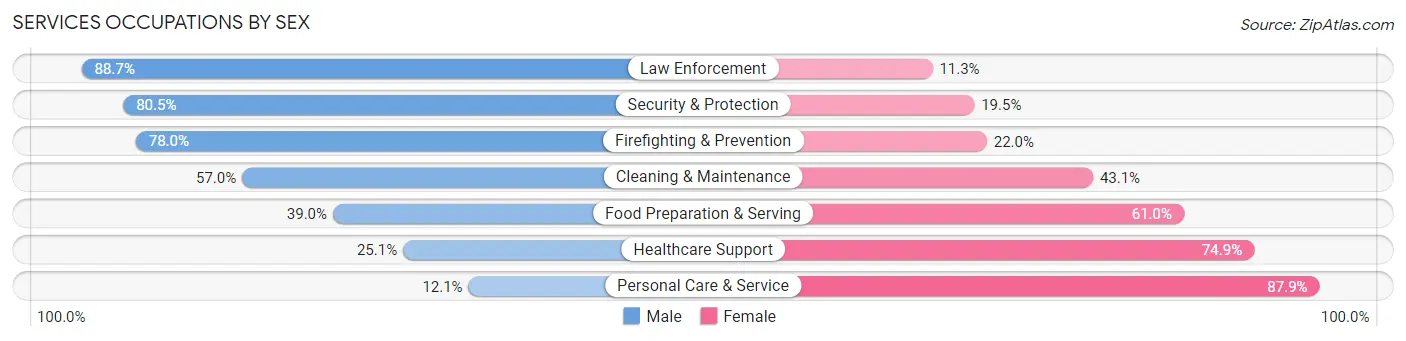
| Occupation | Male | Female |
| Healthcare Support | 474 (25.1%) | 1,417 (74.9%) |
| Security & Protection | 494 (80.5%) | 120 (19.5%) |
| Firefighting & Prevention | 368 (78.0%) | 104 (22.0%) |
| Law Enforcement | 126 (88.7%) | 16 (11.3%) |
| Food Preparation & Serving | 868 (39.0%) | 1,360 (61.0%) |
| Cleaning & Maintenance | 967 (57.0%) | 731 (43.0%) |
| Personal Care & Service | 97 (12.1%) | 704 (87.9%) |
| Total (Category) | 2,900 (40.1%) | 4,332 (59.9%) |
| Total (Overall) | 16,467 (53.1%) | 14,527 (46.9%) |
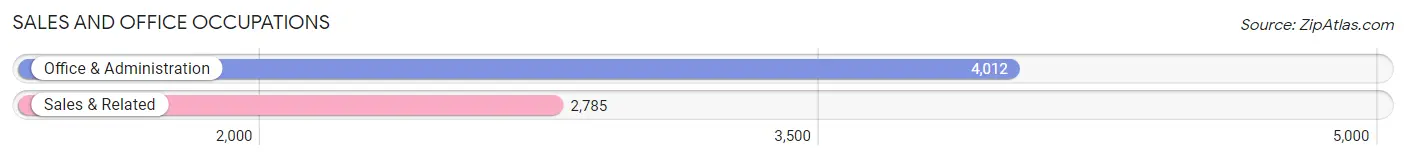
Sales and Office Occupations
The most common Sales and Office occupations in Springfield are Office & Administration (4,012 | 12.9%), and Sales & Related (2,785 | 9.0%).
Sales and Office Occupations by Sex
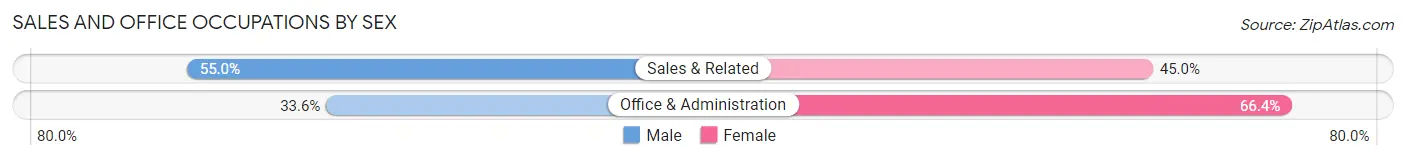
| Occupation | Male | Female |
| Sales & Related | 1,533 (55.0%) | 1,252 (45.0%) |
| Office & Administration | 1,348 (33.6%) | 2,664 (66.4%) |
| Total (Category) | 2,881 (42.4%) | 3,916 (57.6%) |
| Total (Overall) | 16,467 (53.1%) | 14,527 (46.9%) |
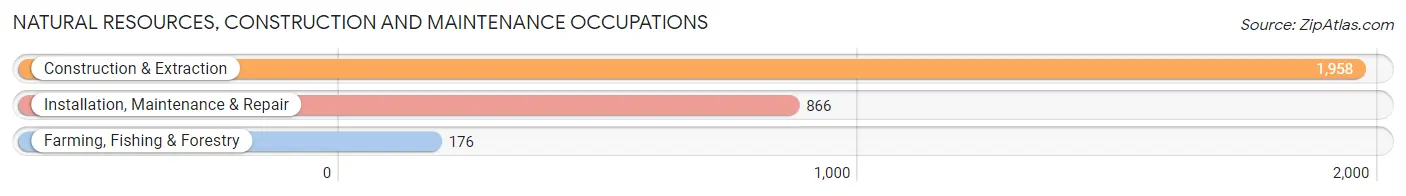
Natural Resources, Construction and Maintenance Occupations
The most common Natural Resources, Construction and Maintenance occupations in Springfield are Construction & Extraction (1,958 | 6.3%), Installation, Maintenance & Repair (866 | 2.8%), and Farming, Fishing & Forestry (176 | 0.6%).
Natural Resources, Construction and Maintenance Occupations by Sex
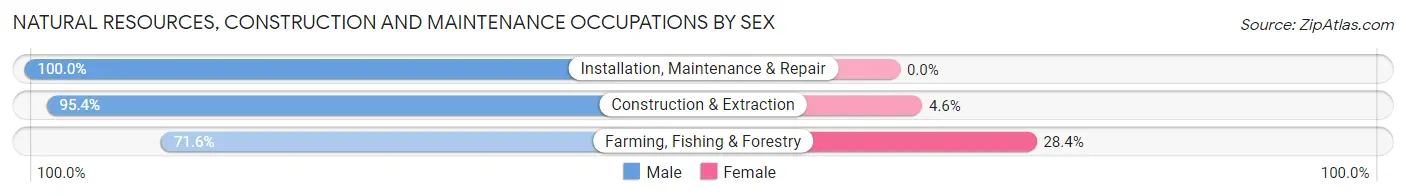
| Occupation | Male | Female |
| Farming, Fishing & Forestry | 126 (71.6%) | 50 (28.4%) |
| Construction & Extraction | 1,868 (95.4%) | 90 (4.6%) |
| Installation, Maintenance & Repair | 866 (100.0%) | 0 (0.0%) |
| Total (Category) | 2,860 (95.3%) | 140 (4.7%) |
| Total (Overall) | 16,467 (53.1%) | 14,527 (46.9%) |
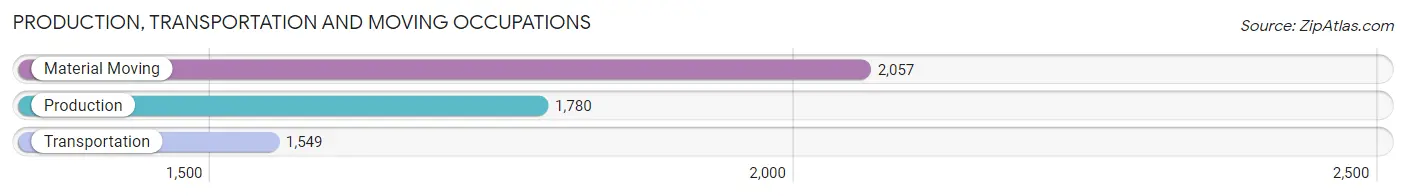
Production, Transportation and Moving Occupations
The most common Production, Transportation and Moving occupations in Springfield are Material Moving (2,057 | 6.6%), Production (1,780 | 5.7%), and Transportation (1,549 | 5.0%).
Production, Transportation and Moving Occupations by Sex
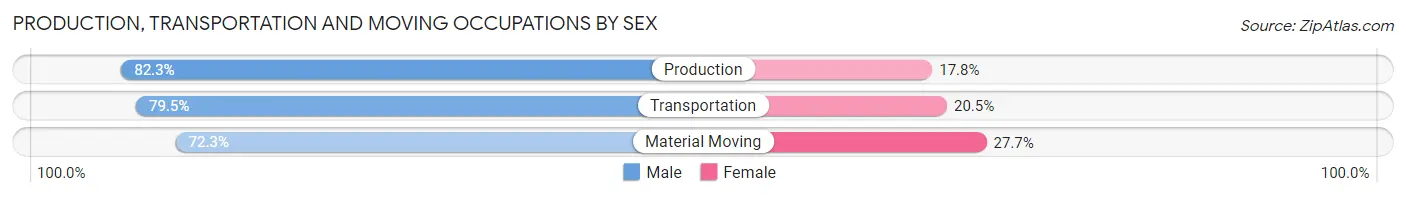
| Occupation | Male | Female |
| Production | 1,464 (82.3%) | 316 (17.7%) |
| Transportation | 1,232 (79.5%) | 317 (20.5%) |
| Material Moving | 1,487 (72.3%) | 570 (27.7%) |
| Total (Category) | 4,183 (77.7%) | 1,203 (22.3%) |
| Total (Overall) | 16,467 (53.1%) | 14,527 (46.9%) |
Employment Industries by Sex in Springfield
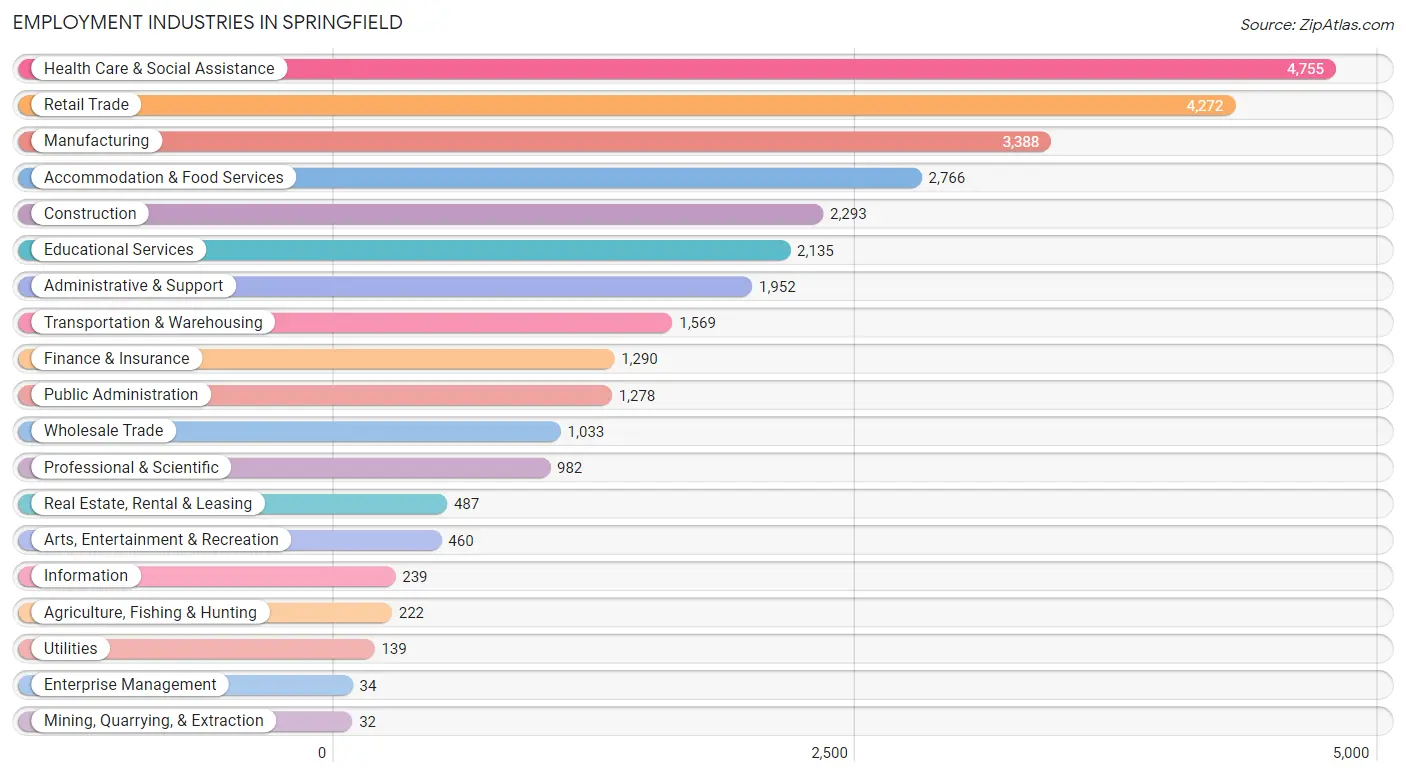
Employment Industries in Springfield
The major employment industries in Springfield include Health Care & Social Assistance (4,755 | 15.3%), Retail Trade (4,272 | 13.8%), Manufacturing (3,388 | 10.9%), Accommodation & Food Services (2,766 | 8.9%), and Construction (2,293 | 7.4%).
Employment Industries by Sex in Springfield
The Springfield industries that see more men than women are Construction (91.1%), Manufacturing (84.4%), and Utilities (79.9%), whereas the industries that tend to have a higher number of women are Health Care & Social Assistance (81.1%), Mining, Quarrying, & Extraction (68.8%), and Educational Services (66.6%).
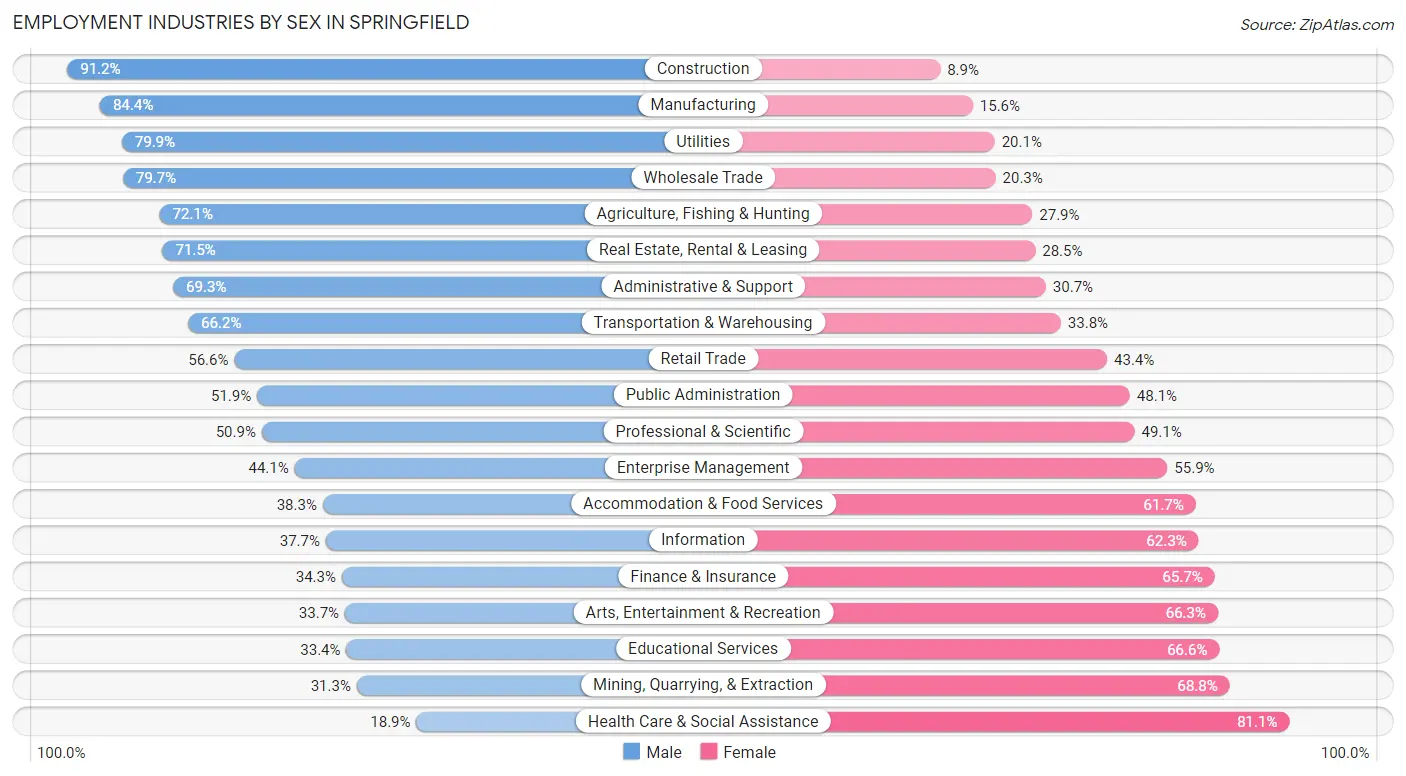
| Industry | Male | Female |
| Agriculture, Fishing & Hunting | 160 (72.1%) | 62 (27.9%) |
| Mining, Quarrying, & Extraction | 10 (31.2%) | 22 (68.8%) |
| Construction | 2,090 (91.1%) | 203 (8.8%) |
| Manufacturing | 2,859 (84.4%) | 529 (15.6%) |
| Wholesale Trade | 823 (79.7%) | 210 (20.3%) |
| Retail Trade | 2,418 (56.6%) | 1,854 (43.4%) |
| Transportation & Warehousing | 1,038 (66.2%) | 531 (33.8%) |
| Utilities | 111 (79.9%) | 28 (20.1%) |
| Information | 90 (37.7%) | 149 (62.3%) |
| Finance & Insurance | 443 (34.3%) | 847 (65.7%) |
| Real Estate, Rental & Leasing | 348 (71.5%) | 139 (28.5%) |
| Professional & Scientific | 500 (50.9%) | 482 (49.1%) |
| Enterprise Management | 15 (44.1%) | 19 (55.9%) |
| Administrative & Support | 1,352 (69.3%) | 600 (30.7%) |
| Educational Services | 713 (33.4%) | 1,422 (66.6%) |
| Health Care & Social Assistance | 899 (18.9%) | 3,856 (81.1%) |
| Arts, Entertainment & Recreation | 155 (33.7%) | 305 (66.3%) |
| Accommodation & Food Services | 1,059 (38.3%) | 1,707 (61.7%) |
| Public Administration | 663 (51.9%) | 615 (48.1%) |
| Total | 16,467 (53.1%) | 14,527 (46.9%) |
Education in Springfield
School Enrollment in Springfield
The most common levels of schooling among the 12,703 students in Springfield are middle school (3,168 | 24.9%), high school (2,787 | 21.9%), and elementary school (2,647 | 20.8%).
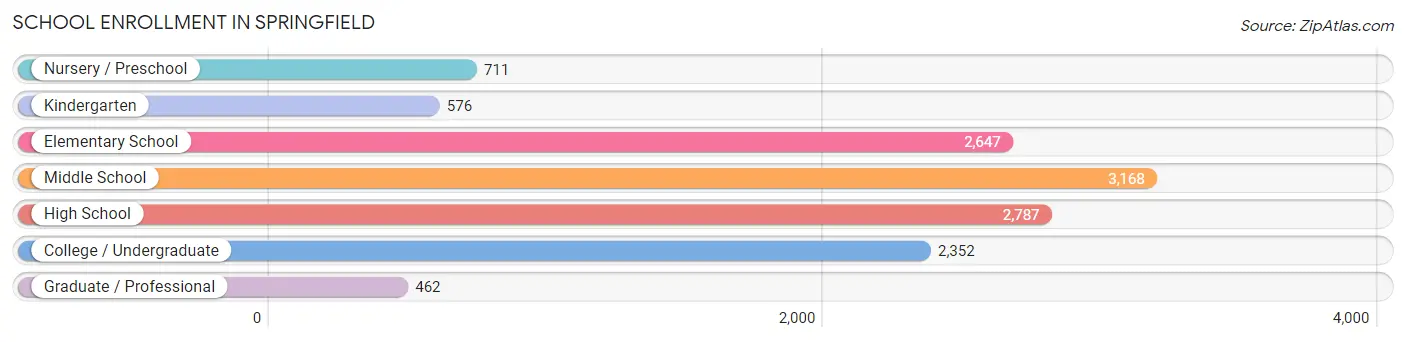
| School Level | # Students | % Students |
| Nursery / Preschool | 711 | 5.6% |
| Kindergarten | 576 | 4.5% |
| Elementary School | 2,647 | 20.8% |
| Middle School | 3,168 | 24.9% |
| High School | 2,787 | 21.9% |
| College / Undergraduate | 2,352 | 18.5% |
| Graduate / Professional | 462 | 3.6% |
| Total | 12,703 | 100.0% |
School Enrollment by Age by Funding Source in Springfield
Out of a total of 12,703 students who are enrolled in schools in Springfield, 1,829 (14.4%) attend a private institution, while the remaining 10,874 (85.6%) are enrolled in public schools. The age group of 35 years and over has the highest likelihood of being enrolled in private schools, with 240 (39.9% in the age bracket) enrolled. Conversely, the age group of 10 to 14 year olds has the lowest likelihood of being enrolled in a private school, with 3,454 (91.8% in the age bracket) attending a public institution.
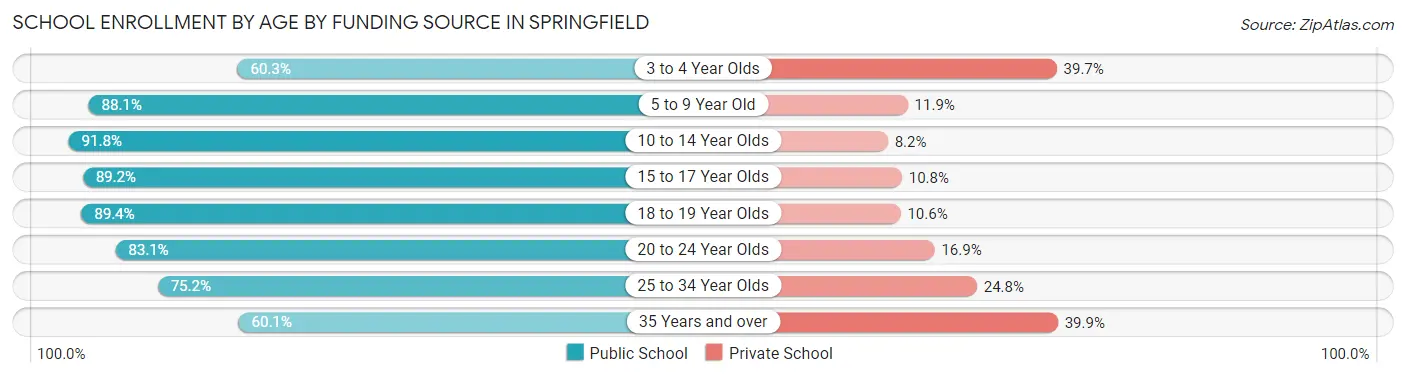
| Age Bracket | Public School | Private School |
| 3 to 4 Year Olds | 350 (60.3%) | 230 (39.7%) |
| 5 to 9 Year Old | 2,667 (88.1%) | 361 (11.9%) |
| 10 to 14 Year Olds | 3,454 (91.8%) | 309 (8.2%) |
| 15 to 17 Year Olds | 1,845 (89.2%) | 224 (10.8%) |
| 18 to 19 Year Olds | 803 (89.4%) | 95 (10.6%) |
| 20 to 24 Year Olds | 751 (83.1%) | 153 (16.9%) |
| 25 to 34 Year Olds | 646 (75.2%) | 213 (24.8%) |
| 35 Years and over | 362 (60.1%) | 240 (39.9%) |
| Total | 10,874 (85.6%) | 1,829 (14.4%) |
Educational Attainment by Field of Study in Springfield
Business (1,440 | 14.3%), education (1,179 | 11.7%), social sciences (1,070 | 10.6%), psychology (898 | 8.9%), and science & technology (810 | 8.1%) are the most common fields of study among 10,043 individuals in Springfield who have obtained a bachelor's degree or higher.
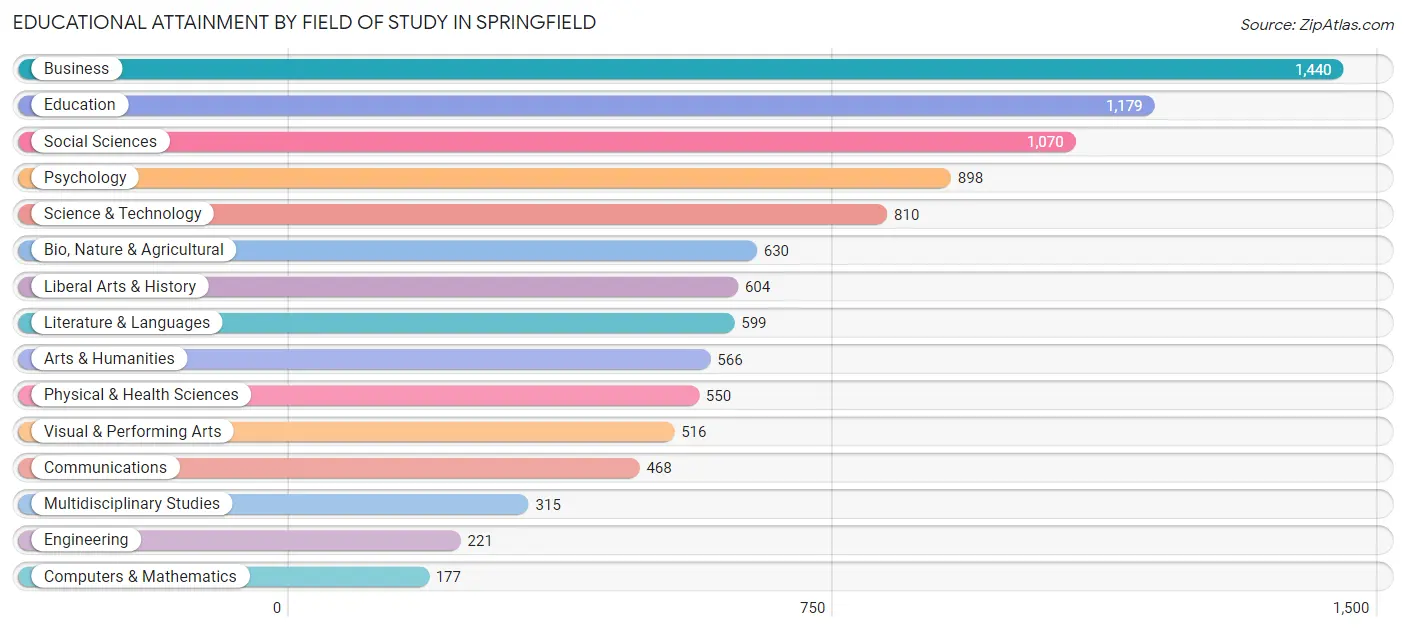
| Field of Study | # Graduates | % Graduates |
| Computers & Mathematics | 177 | 1.8% |
| Bio, Nature & Agricultural | 630 | 6.3% |
| Physical & Health Sciences | 550 | 5.5% |
| Psychology | 898 | 8.9% |
| Social Sciences | 1,070 | 10.6% |
| Engineering | 221 | 2.2% |
| Multidisciplinary Studies | 315 | 3.1% |
| Science & Technology | 810 | 8.1% |
| Business | 1,440 | 14.3% |
| Education | 1,179 | 11.7% |
| Literature & Languages | 599 | 6.0% |
| Liberal Arts & History | 604 | 6.0% |
| Visual & Performing Arts | 516 | 5.1% |
| Communications | 468 | 4.7% |
| Arts & Humanities | 566 | 5.6% |
| Total | 10,043 | 100.0% |
Transportation & Commute in Springfield
Vehicle Availability by Sex in Springfield
The most prevalent vehicle ownership categories in Springfield are males with 2 vehicles (7,061, accounting for 43.4%) and females with 2 vehicles (5,622, making up 49.7%).
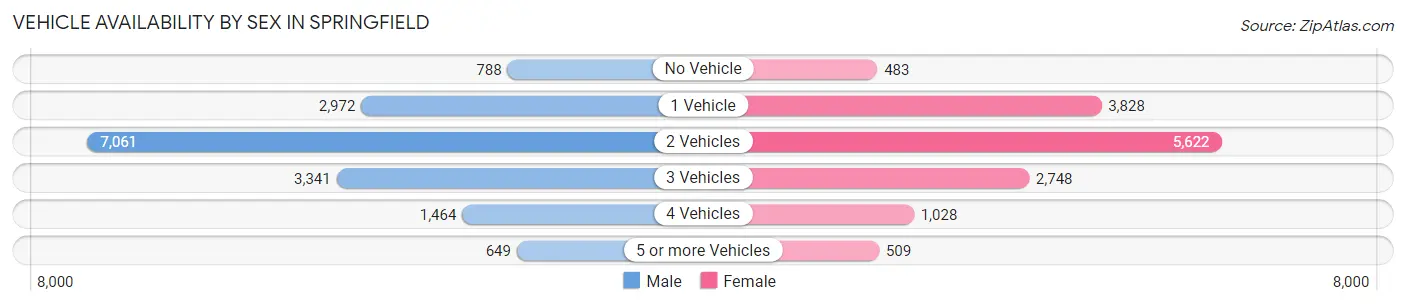
| Vehicles Available | Male | Female |
| No Vehicle | 788 (4.8%) | 483 (3.4%) |
| 1 Vehicle | 2,972 (18.3%) | 3,828 (26.9%) |
| 2 Vehicles | 7,061 (43.4%) | 5,622 (39.5%) |
| 3 Vehicles | 3,341 (20.5%) | 2,748 (19.3%) |
| 4 Vehicles | 1,464 (9.0%) | 1,028 (7.2%) |
| 5 or more Vehicles | 649 (4.0%) | 509 (3.6%) |
| Total | 16,275 (100.0%) | 14,218 (100.0%) |
Commute Time in Springfield
The most frequently occuring commute durations in Springfield are 15 to 19 minutes (6,711 commuters, 23.8%), 10 to 14 minutes (6,569 commuters, 23.3%), and 20 to 24 minutes (4,703 commuters, 16.7%).
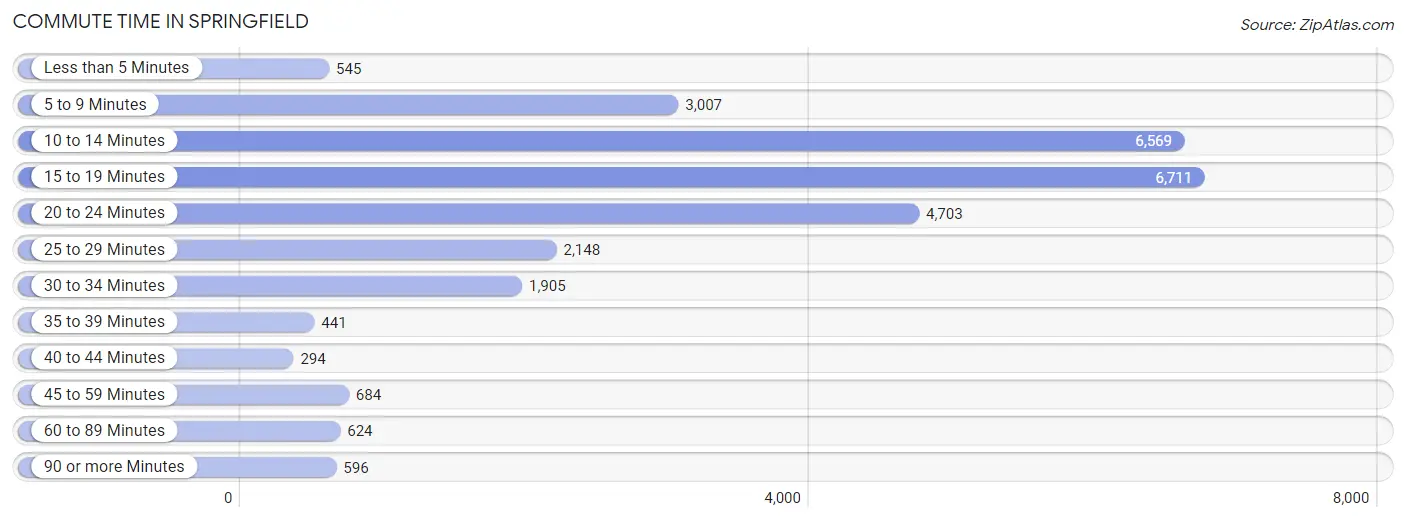
| Commute Time | # Commuters | % Commuters |
| Less than 5 Minutes | 545 | 1.9% |
| 5 to 9 Minutes | 3,007 | 10.6% |
| 10 to 14 Minutes | 6,569 | 23.3% |
| 15 to 19 Minutes | 6,711 | 23.8% |
| 20 to 24 Minutes | 4,703 | 16.7% |
| 25 to 29 Minutes | 2,148 | 7.6% |
| 30 to 34 Minutes | 1,905 | 6.8% |
| 35 to 39 Minutes | 441 | 1.6% |
| 40 to 44 Minutes | 294 | 1.0% |
| 45 to 59 Minutes | 684 | 2.4% |
| 60 to 89 Minutes | 624 | 2.2% |
| 90 or more Minutes | 596 | 2.1% |
Commute Time by Sex in Springfield
The most common commute times in Springfield are 15 to 19 minutes (3,703 commuters, 23.9%) for males and 10 to 14 minutes (3,041 commuters, 23.9%) for females.
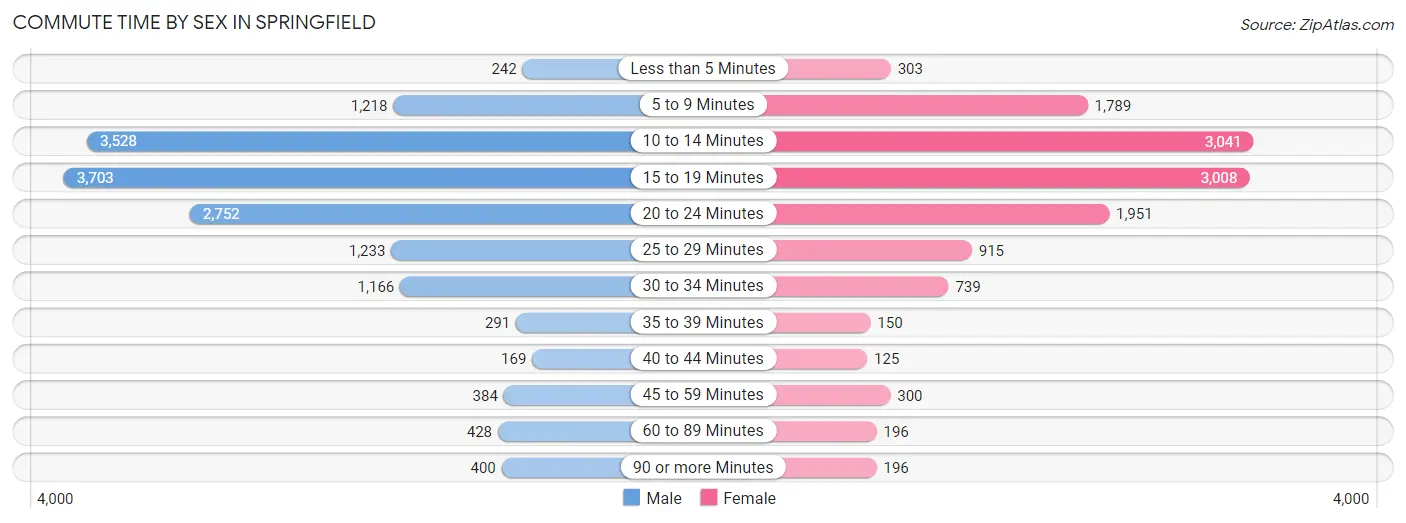
| Commute Time | Male | Female |
| Less than 5 Minutes | 242 (1.6%) | 303 (2.4%) |
| 5 to 9 Minutes | 1,218 (7.9%) | 1,789 (14.1%) |
| 10 to 14 Minutes | 3,528 (22.7%) | 3,041 (23.9%) |
| 15 to 19 Minutes | 3,703 (23.9%) | 3,008 (23.7%) |
| 20 to 24 Minutes | 2,752 (17.7%) | 1,951 (15.3%) |
| 25 to 29 Minutes | 1,233 (8.0%) | 915 (7.2%) |
| 30 to 34 Minutes | 1,166 (7.5%) | 739 (5.8%) |
| 35 to 39 Minutes | 291 (1.9%) | 150 (1.2%) |
| 40 to 44 Minutes | 169 (1.1%) | 125 (1.0%) |
| 45 to 59 Minutes | 384 (2.5%) | 300 (2.4%) |
| 60 to 89 Minutes | 428 (2.8%) | 196 (1.5%) |
| 90 or more Minutes | 400 (2.6%) | 196 (1.5%) |
Time of Departure to Work by Sex in Springfield
The most frequent times of departure to work in Springfield are 7:30 AM to 7:59 AM (1,749, 11.3%) for males and 7:30 AM to 7:59 AM (1,961, 15.4%) for females.
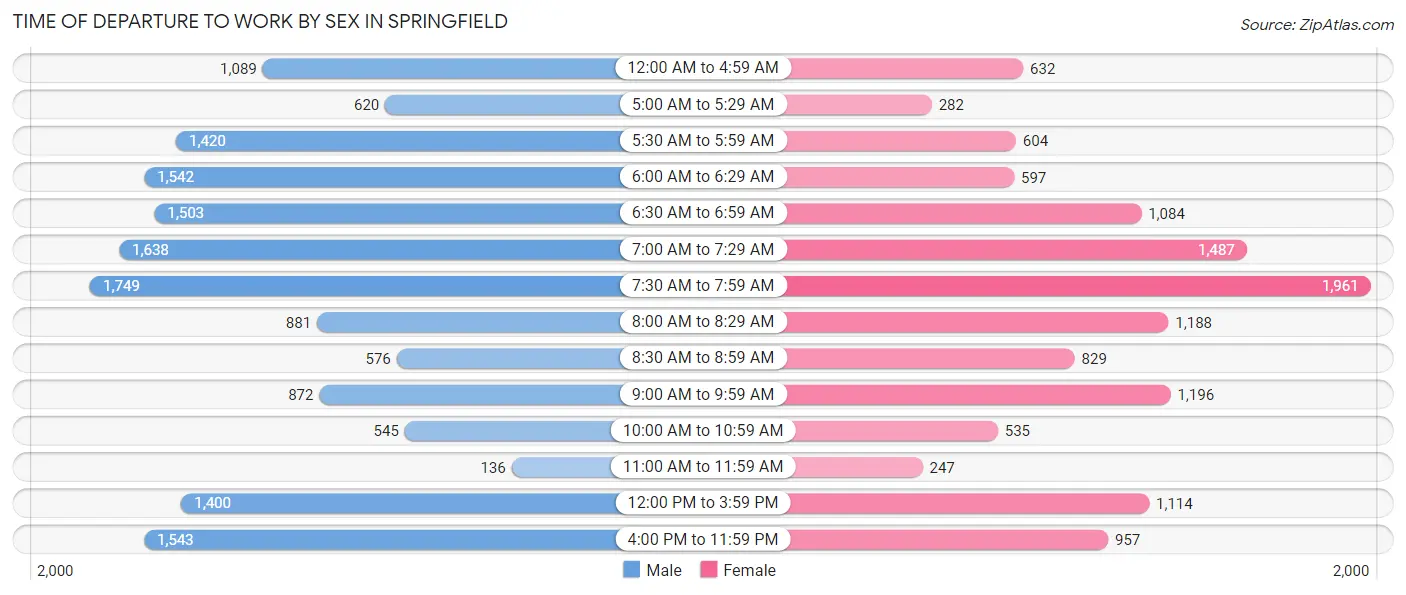
| Time of Departure | Male | Female |
| 12:00 AM to 4:59 AM | 1,089 (7.0%) | 632 (5.0%) |
| 5:00 AM to 5:29 AM | 620 (4.0%) | 282 (2.2%) |
| 5:30 AM to 5:59 AM | 1,420 (9.1%) | 604 (4.8%) |
| 6:00 AM to 6:29 AM | 1,542 (9.9%) | 597 (4.7%) |
| 6:30 AM to 6:59 AM | 1,503 (9.7%) | 1,084 (8.5%) |
| 7:00 AM to 7:29 AM | 1,638 (10.6%) | 1,487 (11.7%) |
| 7:30 AM to 7:59 AM | 1,749 (11.3%) | 1,961 (15.4%) |
| 8:00 AM to 8:29 AM | 881 (5.7%) | 1,188 (9.3%) |
| 8:30 AM to 8:59 AM | 576 (3.7%) | 829 (6.5%) |
| 9:00 AM to 9:59 AM | 872 (5.6%) | 1,196 (9.4%) |
| 10:00 AM to 10:59 AM | 545 (3.5%) | 535 (4.2%) |
| 11:00 AM to 11:59 AM | 136 (0.9%) | 247 (1.9%) |
| 12:00 PM to 3:59 PM | 1,400 (9.0%) | 1,114 (8.8%) |
| 4:00 PM to 11:59 PM | 1,543 (10.0%) | 957 (7.5%) |
| Total | 15,514 (100.0%) | 12,713 (100.0%) |
Housing Occupancy in Springfield
Occupancy by Ownership in Springfield
Of the total 25,039 dwellings in Springfield, owner-occupied units account for 13,509 (53.9%), while renter-occupied units make up 11,530 (46.1%).
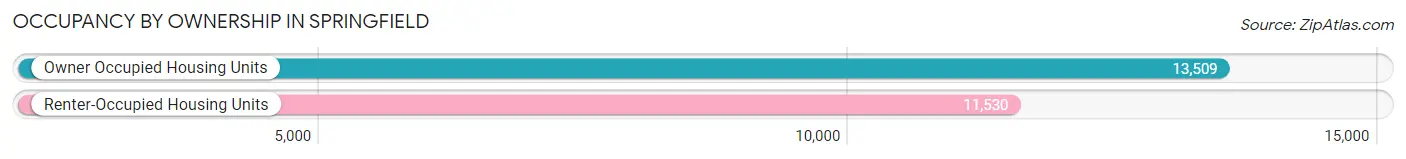
| Occupancy | # Housing Units | % Housing Units |
| Owner Occupied Housing Units | 13,509 | 53.9% |
| Renter-Occupied Housing Units | 11,530 | 46.1% |
| Total Occupied Housing Units | 25,039 | 100.0% |
Occupancy by Household Size in Springfield
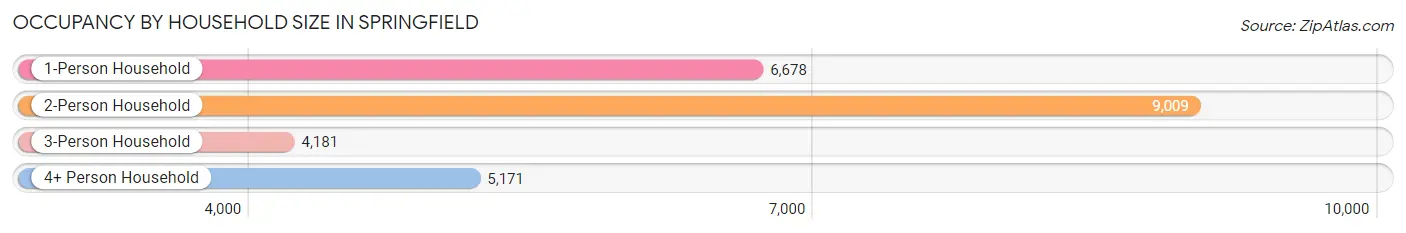
| Household Size | # Housing Units | % Housing Units |
| 1-Person Household | 6,678 | 26.7% |
| 2-Person Household | 9,009 | 36.0% |
| 3-Person Household | 4,181 | 16.7% |
| 4+ Person Household | 5,171 | 20.6% |
| Total Housing Units | 25,039 | 100.0% |
Occupancy by Ownership by Household Size in Springfield
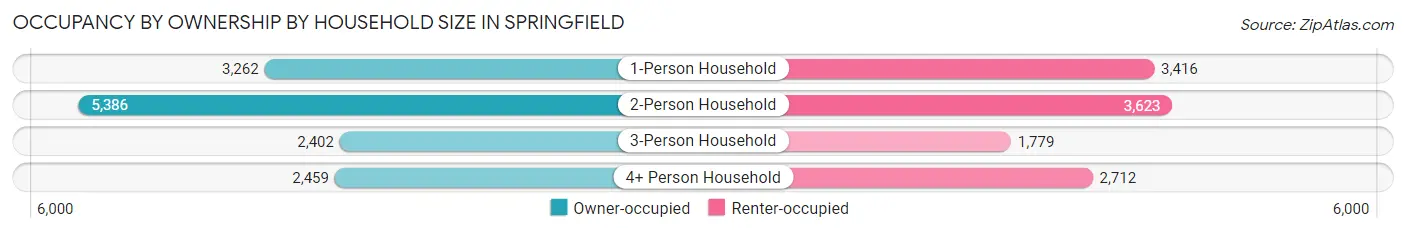
| Household Size | Owner-occupied | Renter-occupied |
| 1-Person Household | 3,262 (48.8%) | 3,416 (51.1%) |
| 2-Person Household | 5,386 (59.8%) | 3,623 (40.2%) |
| 3-Person Household | 2,402 (57.5%) | 1,779 (42.5%) |
| 4+ Person Household | 2,459 (47.5%) | 2,712 (52.4%) |
| Total Housing Units | 13,509 (53.9%) | 11,530 (46.1%) |
Occupancy by Educational Attainment in Springfield
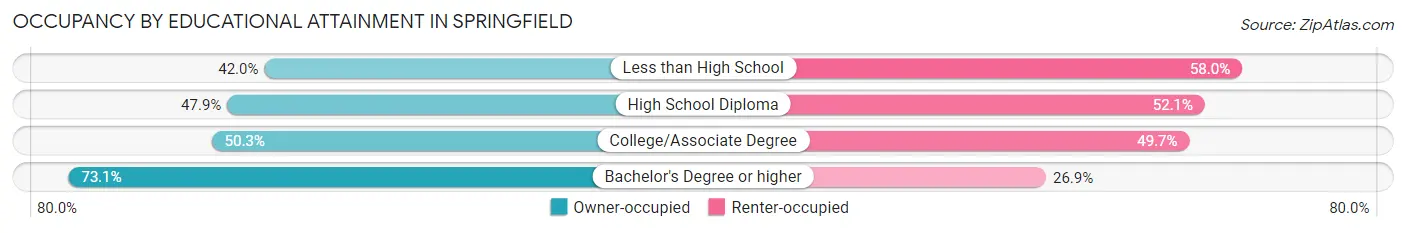
| Household Size | Owner-occupied | Renter-occupied |
| Less than High School | 887 (42.0%) | 1,226 (58.0%) |
| High School Diploma | 3,120 (47.9%) | 3,397 (52.1%) |
| College/Associate Degree | 5,507 (50.3%) | 5,434 (49.7%) |
| Bachelor's Degree or higher | 3,995 (73.1%) | 1,473 (26.9%) |
Occupancy by Age of Householder in Springfield
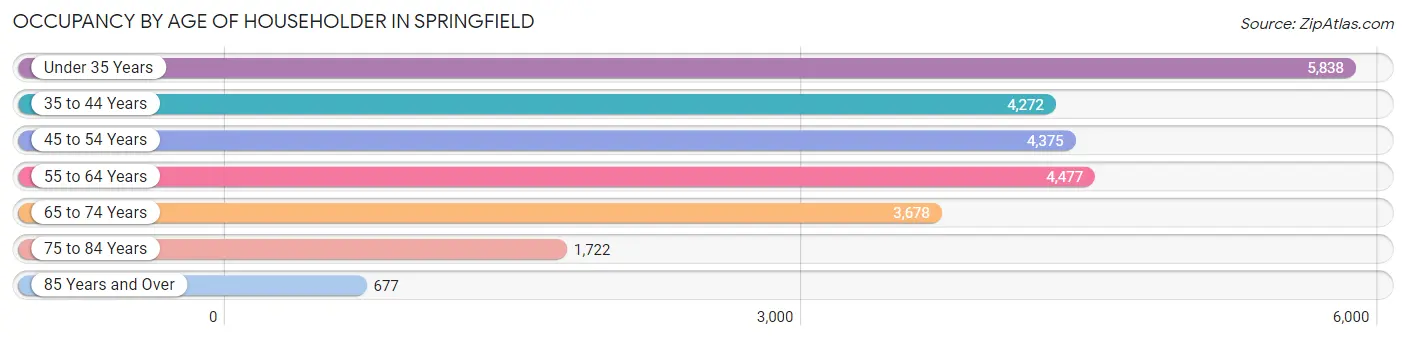
| Age Bracket | # Households | % Households |
| Under 35 Years | 5,838 | 23.3% |
| 35 to 44 Years | 4,272 | 17.1% |
| 45 to 54 Years | 4,375 | 17.5% |
| 55 to 64 Years | 4,477 | 17.9% |
| 65 to 74 Years | 3,678 | 14.7% |
| 75 to 84 Years | 1,722 | 6.9% |
| 85 Years and Over | 677 | 2.7% |
| Total | 25,039 | 100.0% |
Housing Finances in Springfield
Median Income by Occupancy in Springfield
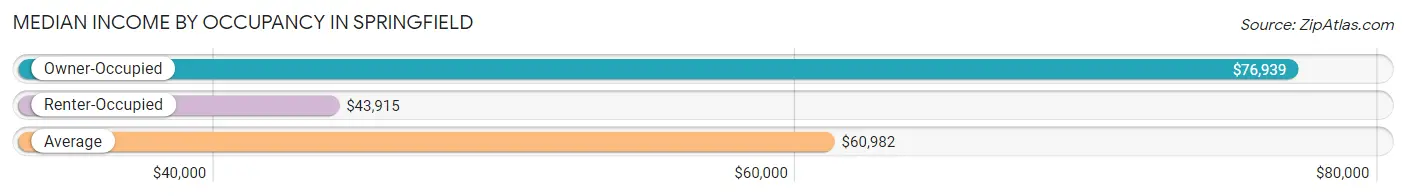
| Occupancy Type | # Households | Median Income |
| Owner-Occupied | 13,509 (53.9%) | $76,939 |
| Renter-Occupied | 11,530 (46.1%) | $43,915 |
| Average | 25,039 (100.0%) | $60,982 |
Occupancy by Householder Income Bracket in Springfield
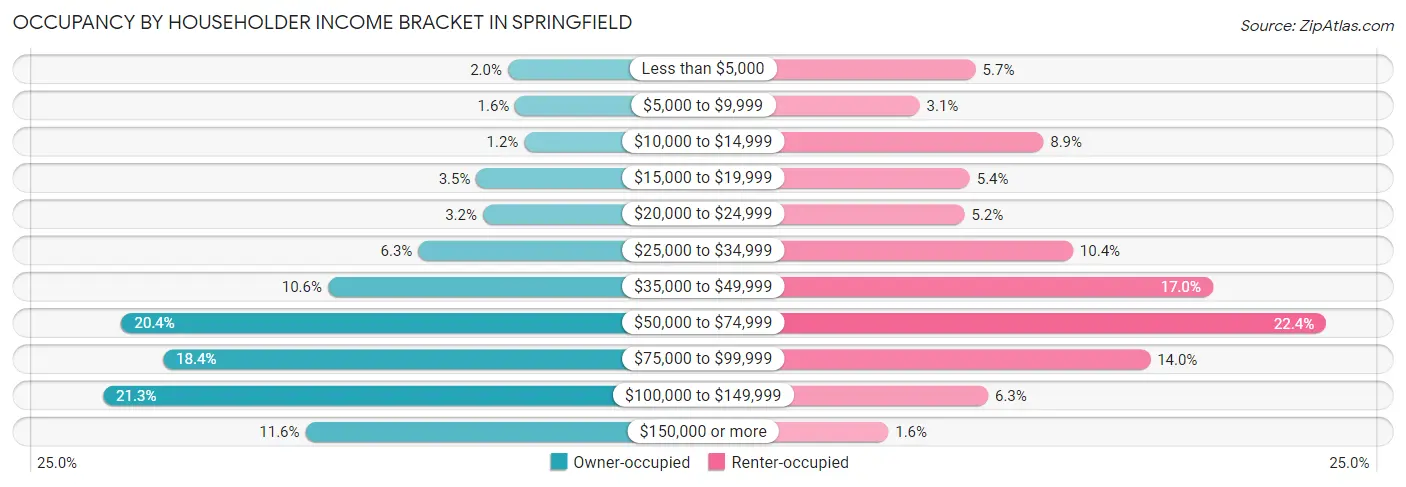
| Income Bracket | Owner-occupied | Renter-occupied |
| Less than $5,000 | 269 (2.0%) | 660 (5.7%) |
| $5,000 to $9,999 | 221 (1.6%) | 352 (3.0%) |
| $10,000 to $14,999 | 163 (1.2%) | 1,031 (8.9%) |
| $15,000 to $19,999 | 472 (3.5%) | 627 (5.4%) |
| $20,000 to $24,999 | 430 (3.2%) | 598 (5.2%) |
| $25,000 to $34,999 | 845 (6.3%) | 1,193 (10.3%) |
| $35,000 to $49,999 | 1,426 (10.6%) | 1,961 (17.0%) |
| $50,000 to $74,999 | 2,754 (20.4%) | 2,583 (22.4%) |
| $75,000 to $99,999 | 2,486 (18.4%) | 1,618 (14.0%) |
| $100,000 to $149,999 | 2,872 (21.3%) | 727 (6.3%) |
| $150,000 or more | 1,571 (11.6%) | 180 (1.6%) |
| Total | 13,509 (100.0%) | 11,530 (100.0%) |
Monthly Housing Cost Tiers in Springfield
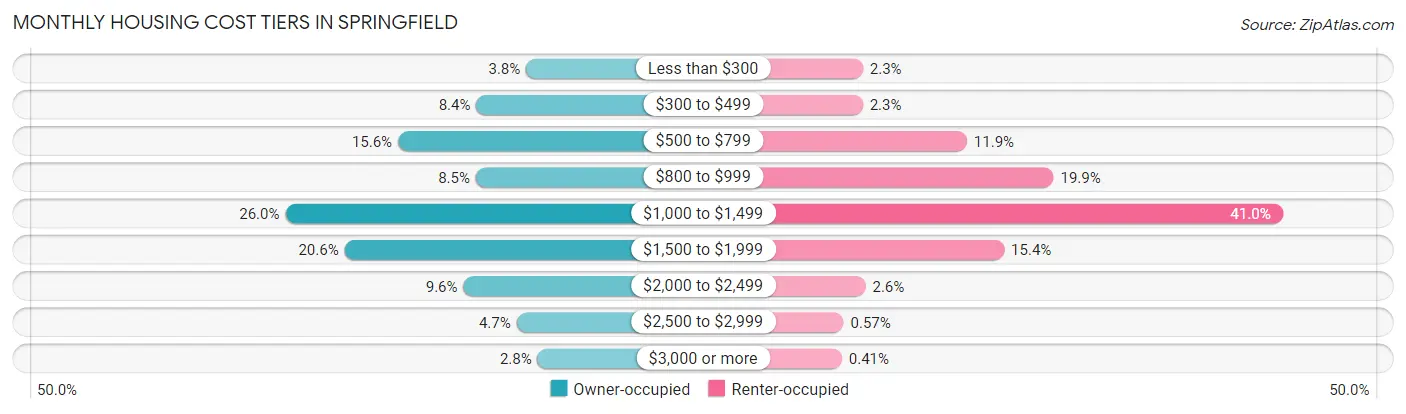
| Monthly Cost | Owner-occupied | Renter-occupied |
| Less than $300 | 518 (3.8%) | 270 (2.3%) |
| $300 to $499 | 1,137 (8.4%) | 269 (2.3%) |
| $500 to $799 | 2,112 (15.6%) | 1,374 (11.9%) |
| $800 to $999 | 1,143 (8.5%) | 2,295 (19.9%) |
| $1,000 to $1,499 | 3,513 (26.0%) | 4,725 (41.0%) |
| $1,500 to $1,999 | 2,776 (20.5%) | 1,770 (15.3%) |
| $2,000 to $2,499 | 1,298 (9.6%) | 299 (2.6%) |
| $2,500 to $2,999 | 636 (4.7%) | 66 (0.6%) |
| $3,000 or more | 376 (2.8%) | 47 (0.4%) |
| Total | 13,509 (100.0%) | 11,530 (100.0%) |
Physical Housing Characteristics in Springfield
Housing Structures in Springfield
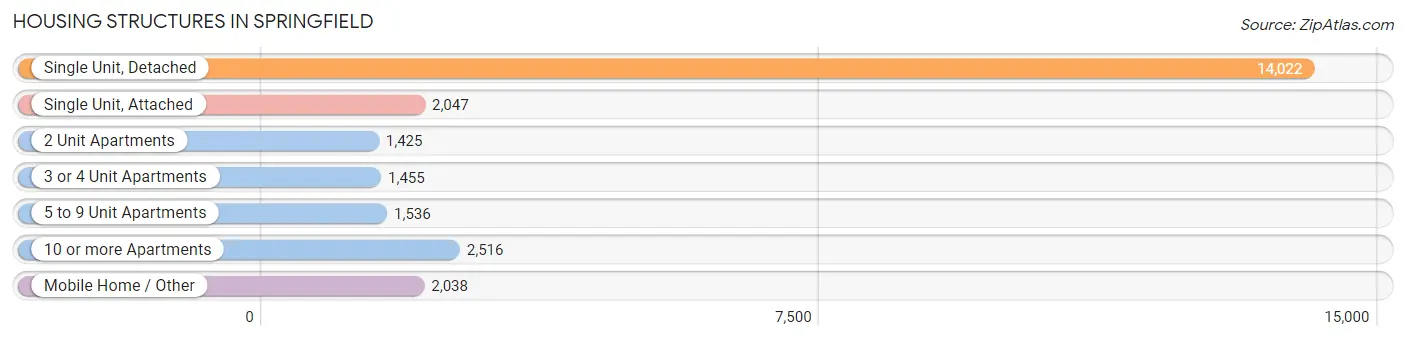
| Structure Type | # Housing Units | % Housing Units |
| Single Unit, Detached | 14,022 | 56.0% |
| Single Unit, Attached | 2,047 | 8.2% |
| 2 Unit Apartments | 1,425 | 5.7% |
| 3 or 4 Unit Apartments | 1,455 | 5.8% |
| 5 to 9 Unit Apartments | 1,536 | 6.1% |
| 10 or more Apartments | 2,516 | 10.1% |
| Mobile Home / Other | 2,038 | 8.1% |
| Total | 25,039 | 100.0% |
Housing Structures by Occupancy in Springfield
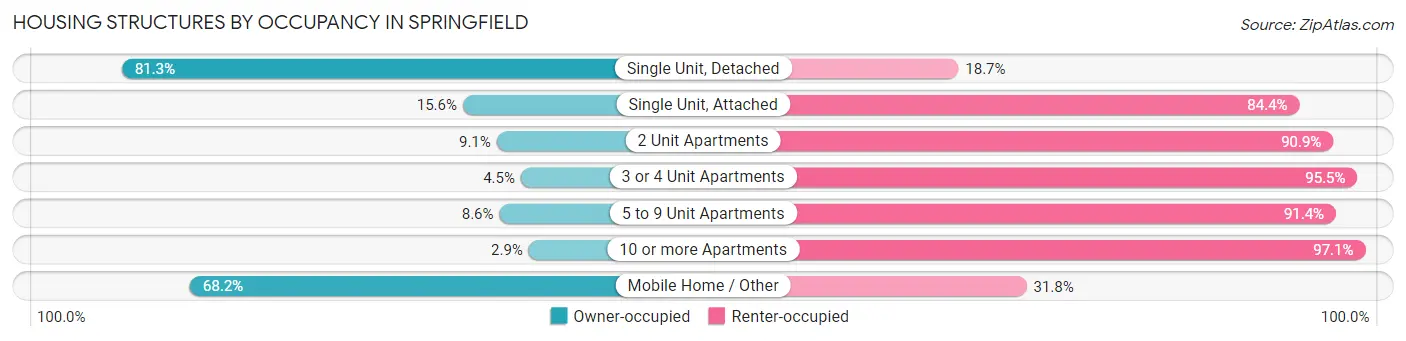
| Structure Type | Owner-occupied | Renter-occupied |
| Single Unit, Detached | 11,399 (81.3%) | 2,623 (18.7%) |
| Single Unit, Attached | 320 (15.6%) | 1,727 (84.4%) |
| 2 Unit Apartments | 130 (9.1%) | 1,295 (90.9%) |
| 3 or 4 Unit Apartments | 65 (4.5%) | 1,390 (95.5%) |
| 5 to 9 Unit Apartments | 132 (8.6%) | 1,404 (91.4%) |
| 10 or more Apartments | 74 (2.9%) | 2,442 (97.1%) |
| Mobile Home / Other | 1,389 (68.2%) | 649 (31.8%) |
| Total | 13,509 (53.9%) | 11,530 (46.1%) |
Housing Structures by Number of Rooms in Springfield
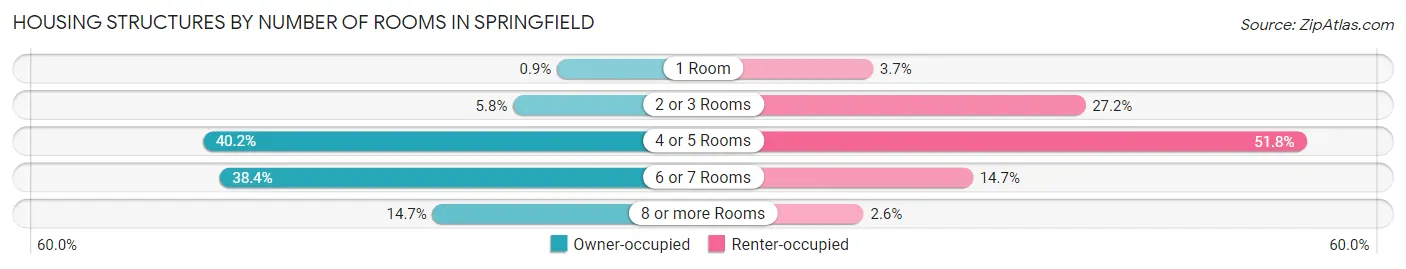
| Number of Rooms | Owner-occupied | Renter-occupied |
| 1 Room | 122 (0.9%) | 422 (3.7%) |
| 2 or 3 Rooms | 779 (5.8%) | 3,138 (27.2%) |
| 4 or 5 Rooms | 5,434 (40.2%) | 5,968 (51.8%) |
| 6 or 7 Rooms | 5,185 (38.4%) | 1,700 (14.7%) |
| 8 or more Rooms | 1,989 (14.7%) | 302 (2.6%) |
| Total | 13,509 (100.0%) | 11,530 (100.0%) |
Housing Structure by Heating Type in Springfield
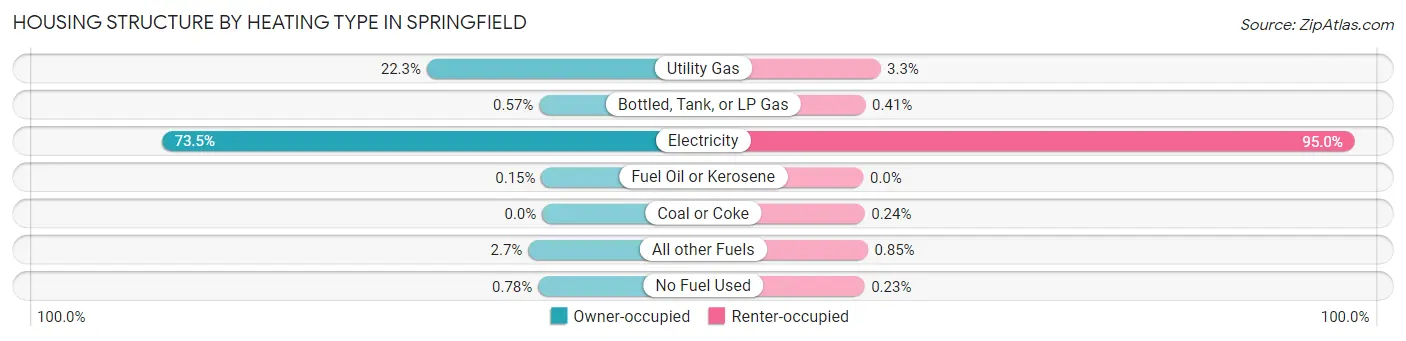
| Heating Type | Owner-occupied | Renter-occupied |
| Utility Gas | 3,010 (22.3%) | 379 (3.3%) |
| Bottled, Tank, or LP Gas | 77 (0.6%) | 47 (0.4%) |
| Electricity | 9,933 (73.5%) | 10,952 (95.0%) |
| Fuel Oil or Kerosene | 20 (0.2%) | 0 (0.0%) |
| Coal or Coke | 0 (0.0%) | 28 (0.2%) |
| All other Fuels | 363 (2.7%) | 98 (0.9%) |
| No Fuel Used | 106 (0.8%) | 26 (0.2%) |
| Total | 13,509 (100.0%) | 11,530 (100.0%) |
Household Vehicle Usage in Springfield
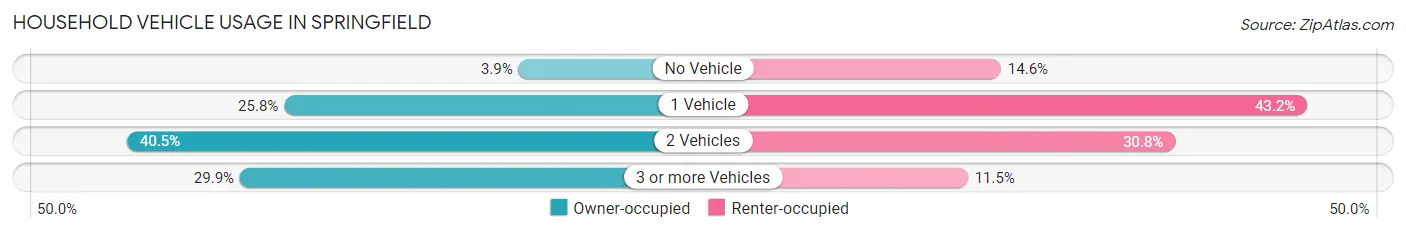
| Vehicles per Household | Owner-occupied | Renter-occupied |
| No Vehicle | 525 (3.9%) | 1,679 (14.6%) |
| 1 Vehicle | 3,481 (25.8%) | 4,975 (43.1%) |
| 2 Vehicles | 5,464 (40.5%) | 3,555 (30.8%) |
| 3 or more Vehicles | 4,039 (29.9%) | 1,321 (11.5%) |
| Total | 13,509 (100.0%) | 11,530 (100.0%) |
Real Estate & Mortgages in Springfield
Real Estate and Mortgage Overview in Springfield
| Characteristic | Without Mortgage | With Mortgage |
| Housing Units | 4,115 | 9,394 |
| Median Property Value | $252,900 | $312,100 |
| Median Household Income | $54,466 | $1,327 |
| Monthly Housing Costs | $565 | $370 |
| Real Estate Taxes | $2,924 | $246 |
Property Value by Mortgage Status in Springfield
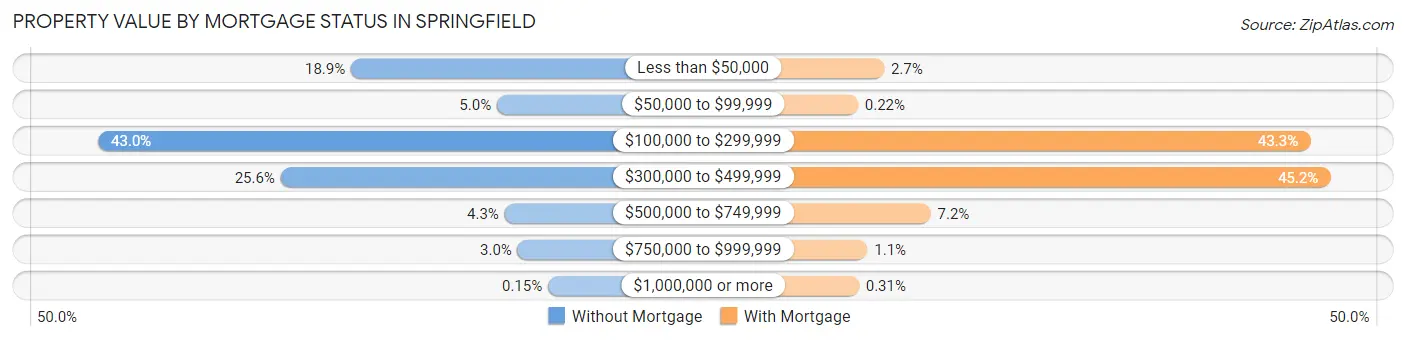
| Property Value | Without Mortgage | With Mortgage |
| Less than $50,000 | 778 (18.9%) | 255 (2.7%) |
| $50,000 to $99,999 | 206 (5.0%) | 21 (0.2%) |
| $100,000 to $299,999 | 1,770 (43.0%) | 4,066 (43.3%) |
| $300,000 to $499,999 | 1,054 (25.6%) | 4,246 (45.2%) |
| $500,000 to $749,999 | 176 (4.3%) | 672 (7.1%) |
| $750,000 to $999,999 | 125 (3.0%) | 105 (1.1%) |
| $1,000,000 or more | 6 (0.2%) | 29 (0.3%) |
| Total | 4,115 (100.0%) | 9,394 (100.0%) |
Household Income by Mortgage Status in Springfield
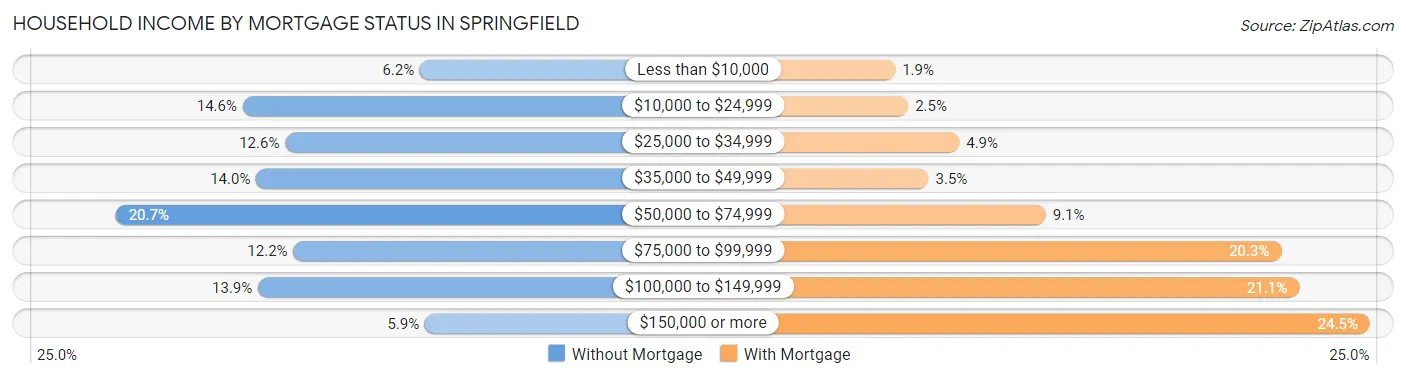
| Household Income | Without Mortgage | With Mortgage |
| Less than $10,000 | 254 (6.2%) | 178 (1.9%) |
| $10,000 to $24,999 | 601 (14.6%) | 236 (2.5%) |
| $25,000 to $34,999 | 518 (12.6%) | 464 (4.9%) |
| $35,000 to $49,999 | 575 (14.0%) | 327 (3.5%) |
| $50,000 to $74,999 | 850 (20.7%) | 851 (9.1%) |
| $75,000 to $99,999 | 502 (12.2%) | 1,904 (20.3%) |
| $100,000 to $149,999 | 571 (13.9%) | 1,984 (21.1%) |
| $150,000 or more | 244 (5.9%) | 2,301 (24.5%) |
| Total | 4,115 (100.0%) | 9,394 (100.0%) |
Property Value to Household Income Ratio in Springfield
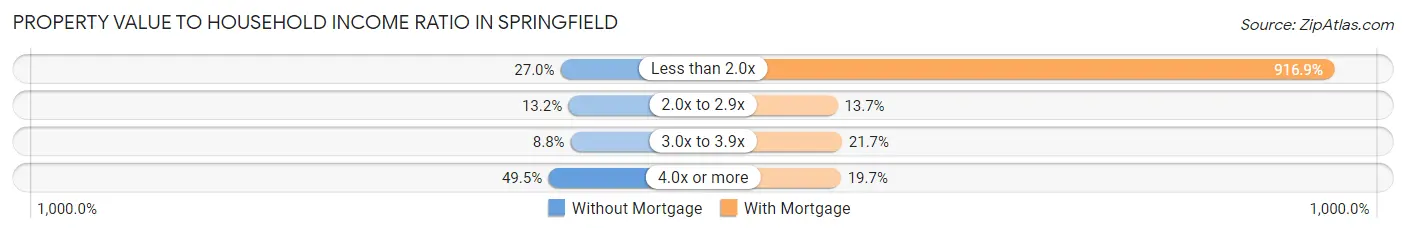
| Value-to-Income Ratio | Without Mortgage | With Mortgage |
| Less than 2.0x | 1,111 (27.0%) | 86,134 (916.9%) |
| 2.0x to 2.9x | 542 (13.2%) | 1,284 (13.7%) |
| 3.0x to 3.9x | 360 (8.7%) | 2,036 (21.7%) |
| 4.0x or more | 2,037 (49.5%) | 1,848 (19.7%) |
| Total | 4,115 (100.0%) | 9,394 (100.0%) |
Real Estate Taxes by Mortgage Status in Springfield
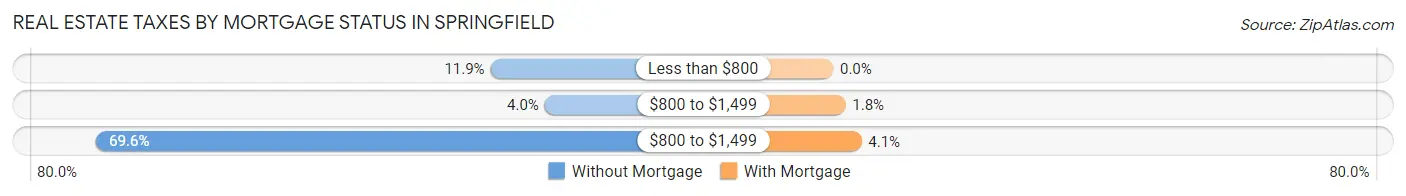
| Property Taxes | Without Mortgage | With Mortgage |
| Less than $800 | 491 (11.9%) | 0 (0.0%) |
| $800 to $1,499 | 165 (4.0%) | 169 (1.8%) |
| $800 to $1,499 | 2,862 (69.6%) | 389 (4.1%) |
| Total | 4,115 (100.0%) | 9,394 (100.0%) |
Health & Disability in Springfield
Health Insurance Coverage by Age in Springfield
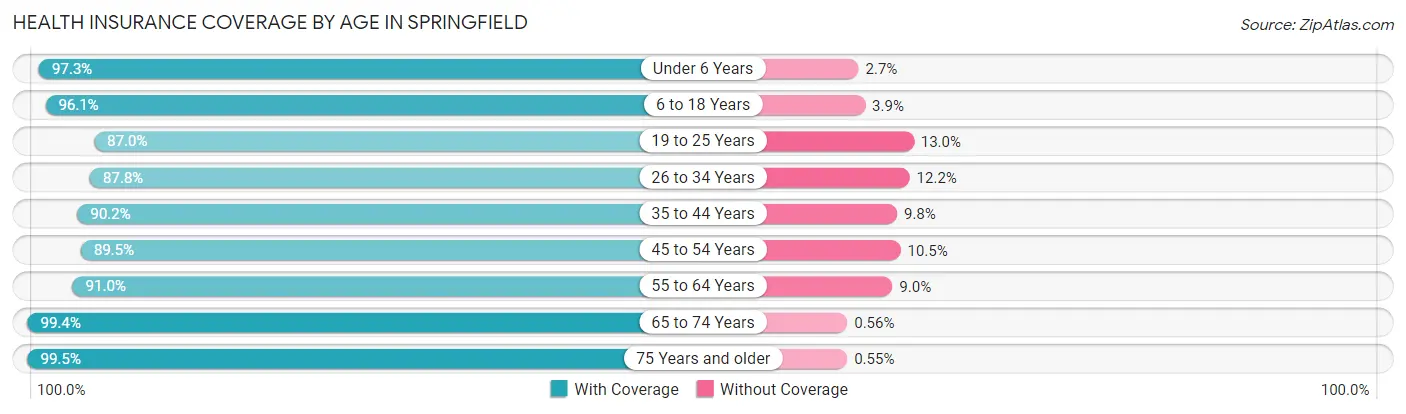
| Age Bracket | With Coverage | Without Coverage |
| Under 6 Years | 4,086 (97.3%) | 112 (2.7%) |
| 6 to 18 Years | 9,227 (96.1%) | 373 (3.9%) |
| 19 to 25 Years | 5,688 (87.0%) | 847 (13.0%) |
| 26 to 34 Years | 7,043 (87.8%) | 978 (12.2%) |
| 35 to 44 Years | 7,405 (90.2%) | 808 (9.8%) |
| 45 to 54 Years | 6,919 (89.5%) | 811 (10.5%) |
| 55 to 64 Years | 6,879 (91.0%) | 678 (9.0%) |
| 65 to 74 Years | 5,886 (99.4%) | 33 (0.6%) |
| 75 Years and older | 3,622 (99.5%) | 20 (0.5%) |
| Total | 56,755 (92.4%) | 4,660 (7.6%) |
Health Insurance Coverage by Citizenship Status in Springfield
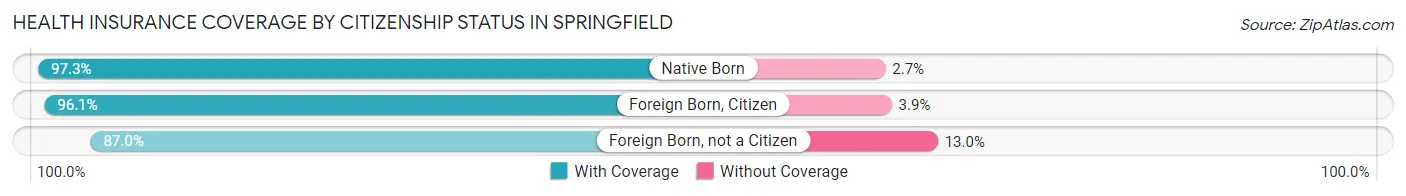
| Citizenship Status | With Coverage | Without Coverage |
| Native Born | 4,086 (97.3%) | 112 (2.7%) |
| Foreign Born, Citizen | 9,227 (96.1%) | 373 (3.9%) |
| Foreign Born, not a Citizen | 5,688 (87.0%) | 847 (13.0%) |
Health Insurance Coverage by Household Income in Springfield
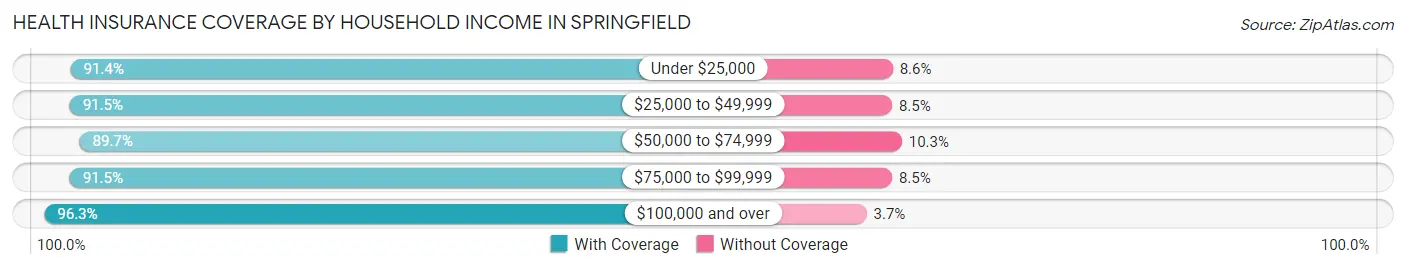
| Household Income | With Coverage | Without Coverage |
| Under $25,000 | 7,233 (91.4%) | 681 (8.6%) |
| $25,000 to $49,999 | 10,706 (91.5%) | 990 (8.5%) |
| $50,000 to $74,999 | 12,639 (89.7%) | 1,453 (10.3%) |
| $75,000 to $99,999 | 10,099 (91.5%) | 935 (8.5%) |
| $100,000 and over | 15,578 (96.3%) | 601 (3.7%) |
Public vs Private Health Insurance Coverage by Age in Springfield
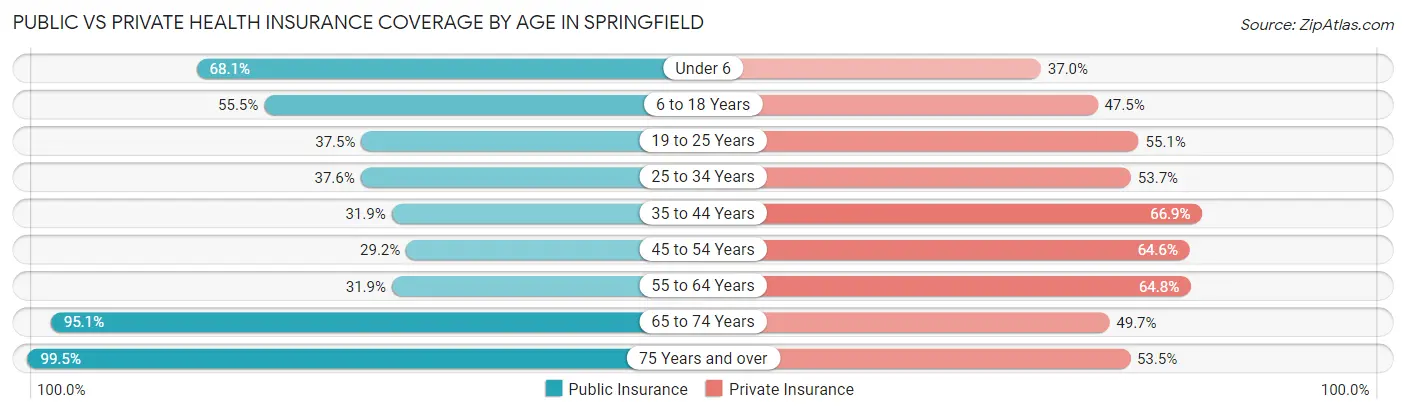
| Age Bracket | Public Insurance | Private Insurance |
| Under 6 | 2,857 (68.1%) | 1,551 (36.9%) |
| 6 to 18 Years | 5,332 (55.5%) | 4,556 (47.5%) |
| 19 to 25 Years | 2,451 (37.5%) | 3,600 (55.1%) |
| 25 to 34 Years | 3,019 (37.6%) | 4,304 (53.7%) |
| 35 to 44 Years | 2,620 (31.9%) | 5,496 (66.9%) |
| 45 to 54 Years | 2,256 (29.2%) | 4,992 (64.6%) |
| 55 to 64 Years | 2,407 (31.9%) | 4,898 (64.8%) |
| 65 to 74 Years | 5,631 (95.1%) | 2,940 (49.7%) |
| 75 Years and over | 3,622 (99.5%) | 1,948 (53.5%) |
| Total | 30,195 (49.2%) | 34,285 (55.8%) |
Disability Status by Sex by Age in Springfield
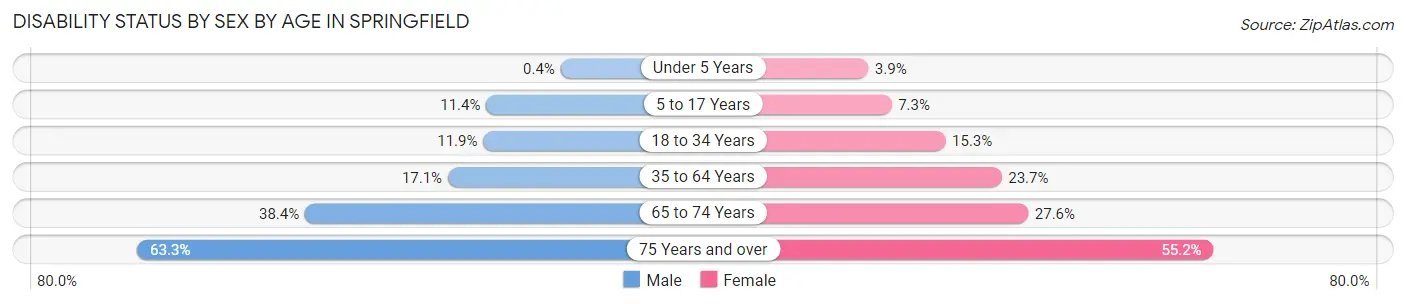
| Age Bracket | Male | Female |
| Under 5 Years | 8 (0.4%) | 56 (3.9%) |
| 5 to 17 Years | 613 (11.4%) | 312 (7.3%) |
| 18 to 34 Years | 944 (11.9%) | 1,127 (15.3%) |
| 35 to 64 Years | 1,987 (17.1%) | 2,819 (23.7%) |
| 65 to 74 Years | 1,100 (38.4%) | 843 (27.6%) |
| 75 Years and over | 876 (63.3%) | 1,246 (55.2%) |
Disability Class by Sex by Age in Springfield
Disability Class: Hearing Difficulty
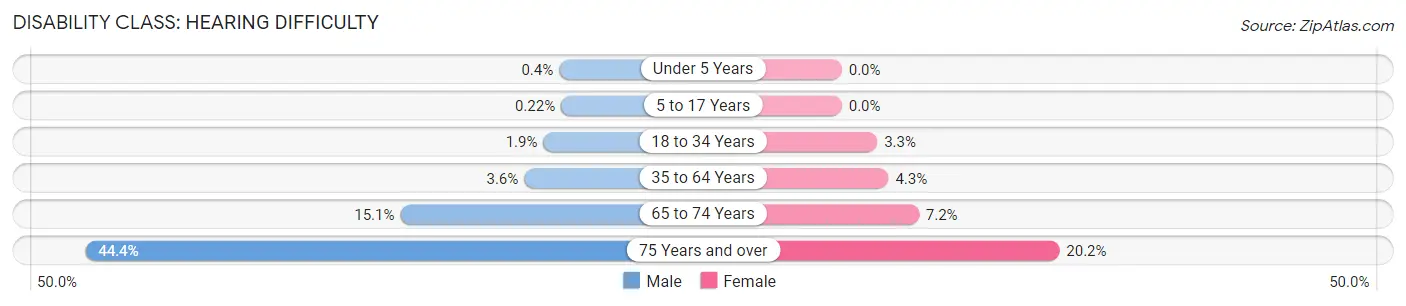
| Age Bracket | Male | Female |
| Under 5 Years | 8 (0.4%) | 0 (0.0%) |
| 5 to 17 Years | 12 (0.2%) | 0 (0.0%) |
| 18 to 34 Years | 148 (1.9%) | 242 (3.3%) |
| 35 to 64 Years | 422 (3.6%) | 515 (4.3%) |
| 65 to 74 Years | 434 (15.1%) | 218 (7.1%) |
| 75 Years and over | 614 (44.4%) | 456 (20.2%) |
Disability Class: Vision Difficulty
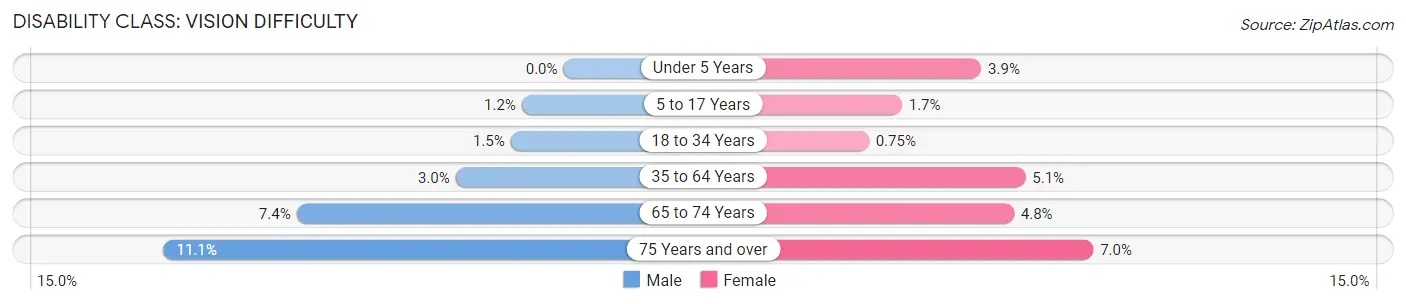
| Age Bracket | Male | Female |
| Under 5 Years | 0 (0.0%) | 56 (3.9%) |
| 5 to 17 Years | 62 (1.2%) | 71 (1.7%) |
| 18 to 34 Years | 117 (1.5%) | 55 (0.7%) |
| 35 to 64 Years | 348 (3.0%) | 609 (5.1%) |
| 65 to 74 Years | 213 (7.4%) | 146 (4.8%) |
| 75 Years and over | 154 (11.1%) | 158 (7.0%) |
Disability Class: Cognitive Difficulty
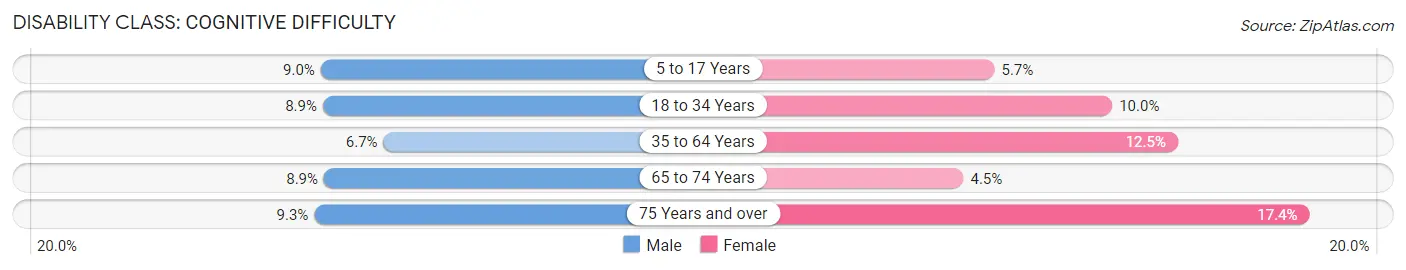
| Age Bracket | Male | Female |
| 5 to 17 Years | 483 (9.0%) | 241 (5.7%) |
| 18 to 34 Years | 709 (8.9%) | 738 (10.0%) |
| 35 to 64 Years | 774 (6.7%) | 1,485 (12.5%) |
| 65 to 74 Years | 255 (8.9%) | 138 (4.5%) |
| 75 Years and over | 128 (9.2%) | 392 (17.4%) |
Disability Class: Ambulatory Difficulty
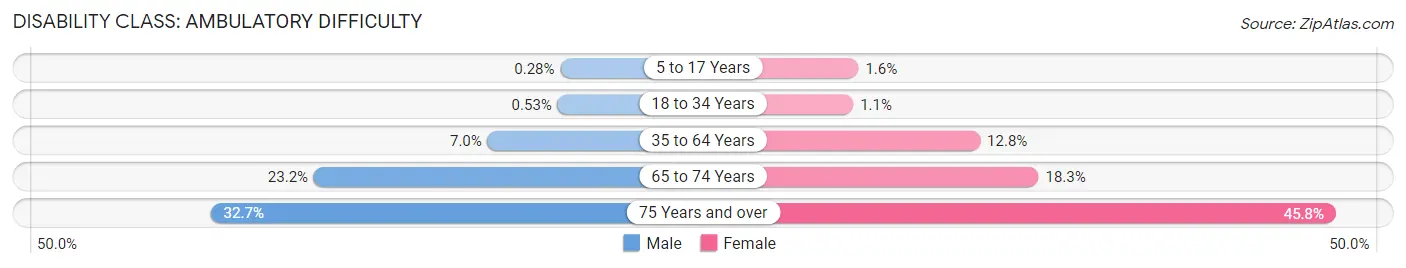
| Age Bracket | Male | Female |
| 5 to 17 Years | 15 (0.3%) | 66 (1.5%) |
| 18 to 34 Years | 42 (0.5%) | 78 (1.1%) |
| 35 to 64 Years | 815 (7.0%) | 1,529 (12.8%) |
| 65 to 74 Years | 664 (23.2%) | 557 (18.3%) |
| 75 Years and over | 453 (32.7%) | 1,035 (45.8%) |
Disability Class: Self-Care Difficulty
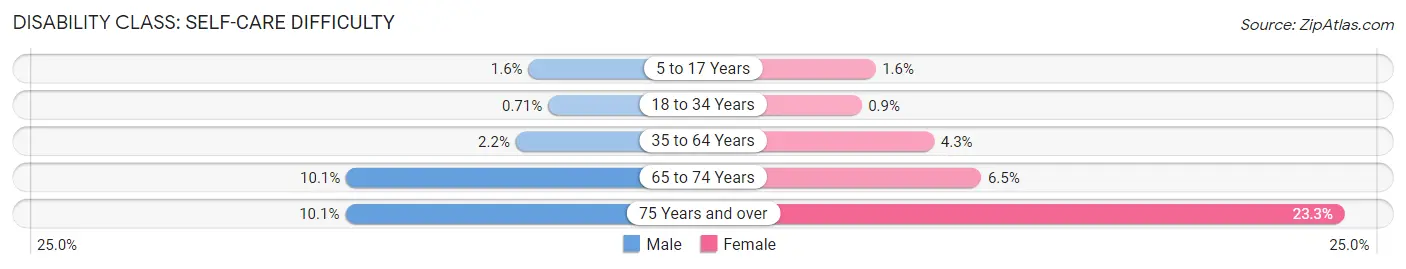
| Age Bracket | Male | Female |
| 5 to 17 Years | 87 (1.6%) | 66 (1.5%) |
| 18 to 34 Years | 56 (0.7%) | 66 (0.9%) |
| 35 to 64 Years | 256 (2.2%) | 509 (4.3%) |
| 65 to 74 Years | 289 (10.1%) | 197 (6.5%) |
| 75 Years and over | 140 (10.1%) | 527 (23.3%) |
Technology Access in Springfield
Computing Device Access in Springfield
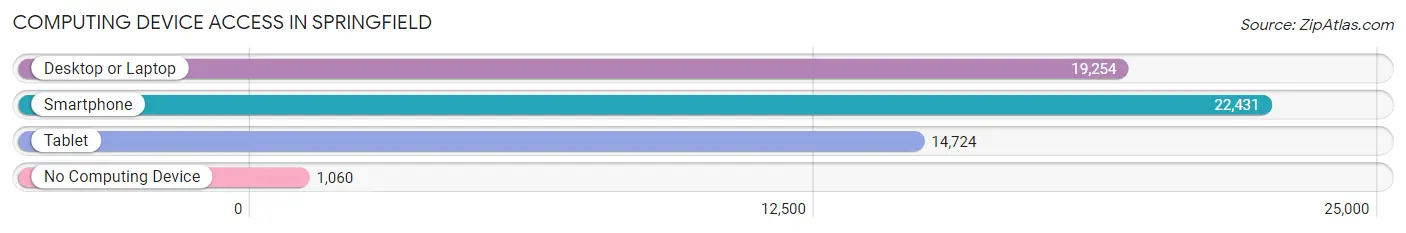
| Device Type | # Households | % Households |
| Desktop or Laptop | 19,254 | 76.9% |
| Smartphone | 22,431 | 89.6% |
| Tablet | 14,724 | 58.8% |
| No Computing Device | 1,060 | 4.2% |
| Total | 25,039 | 100.0% |
Internet Access in Springfield
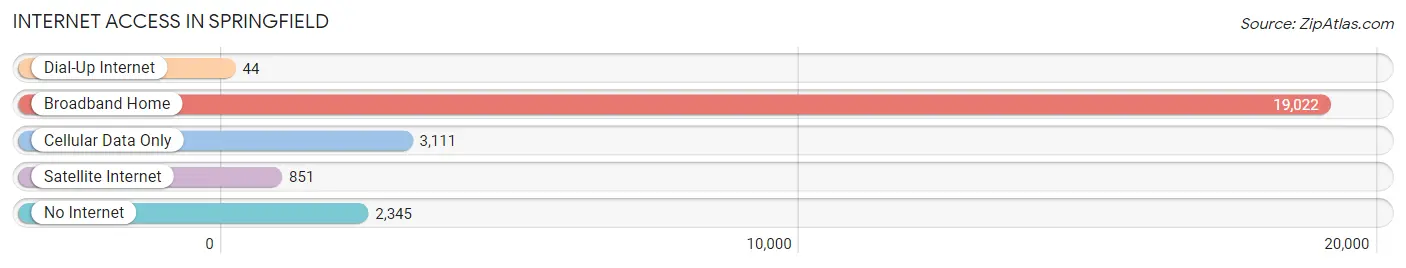
| Internet Type | # Households | % Households |
| Dial-Up Internet | 44 | 0.2% |
| Broadband Home | 19,022 | 76.0% |
| Cellular Data Only | 3,111 | 12.4% |
| Satellite Internet | 851 | 3.4% |
| No Internet | 2,345 | 9.4% |
| Total | 25,039 | 100.0% |
Springfield Summary
Springfield, Oregon is a city located in Lane County, Oregon, United States. It is located in the Willamette Valley, just east of Eugene, Oregon. The city is the second-largest in the county, with a population of 59,403 as of the 2010 census. Springfield is known for its vibrant economy, diverse population, and strong sense of community.
History
The area that is now Springfield was originally inhabited by the Kalapuya Native American tribe. The first European settlers arrived in the area in the early 1800s, and the city was officially incorporated in 1885. The city was named after a nearby spring, and the name was chosen by the first postmaster, John Polk Campbell.
In the early 1900s, Springfield experienced a period of rapid growth, due in part to the construction of the Oregon Pacific Railroad. The railroad connected Springfield to Eugene and other nearby cities, and it helped to spur economic growth in the area.
In the 1950s, Springfield experienced a period of rapid population growth, as people moved to the area to take advantage of the city's growing economy. This growth continued into the 1960s and 1970s, and by the 1980s, Springfield had become a major economic center in the region.
Geography
Springfield is located in the Willamette Valley, just east of Eugene, Oregon. The city is situated on the banks of the Willamette River, and it is surrounded by rolling hills and lush forests. The city has a total area of 16.3 square miles, and it is located at an elevation of 441 feet above sea level.
The climate in Springfield is mild and temperate, with warm summers and cool winters. The average annual temperature is around 50 degrees Fahrenheit, and the average annual precipitation is around 40 inches.
Economy
Springfield has a vibrant and diverse economy, with a variety of industries represented in the city. The largest employers in the city are the University of Oregon, PeaceHealth, and the Springfield School District. Other major employers include the City of Springfield, Springfield Utility Board, and the Springfield Public Library.
The city is also home to a number of small businesses, including restaurants, retail stores, and professional services. The city is also home to a number of manufacturing companies, including Cascade Steel Rolling Mills and Oregon Freeze Dry.
Demographics
As of the 2010 census, the population of Springfield was 59,403. The racial makeup of the city was 79.2% White, 8.2% Hispanic or Latino, 6.2% Asian, 4.2% African American, and 2.2% Native American.
The median household income in Springfield was $45,837, and the median family income was $54,837. The per capita income in the city was $22,837. The poverty rate in the city was 13.2%.
Conclusion
Springfield, Oregon is a vibrant and diverse city located in the Willamette Valley. The city has a strong economy, diverse population, and a strong sense of community. The city is home to a number of major employers, as well as a variety of small businesses. The city has a mild climate and a median household income of $45,837.
Common Questions
What is Per Capita Income in Springfield?
Per Capita income in Springfield is $29,284.
What is the Median Family Income in Springfield?
Median Family Income in Springfield is $67,580.
What is the Median Household income in Springfield?
Median Household Income in Springfield is $60,982.
What is Income or Wage Gap in Springfield?
Income or Wage Gap in Springfield is 26.6%.
Women in Springfield earn 73.4 cents for every dollar earned by a man.
What is Family Income Deficit in Springfield?
Family Income Deficit in Springfield is $10,435.
Families that are below poverty line in Springfield earn $10,435 less on average than the poverty threshold level.
What is Inequality or Gini Index in Springfield?
Inequality or Gini Index in Springfield is 0.40.
What is the Total Population of Springfield?
Total Population of Springfield is 61,740.
What is the Total Male Population of Springfield?
Total Male Population of Springfield is 31,351.
What is the Total Female Population of Springfield?
Total Female Population of Springfield is 30,389.
What is the Ratio of Males per 100 Females in Springfield?
There are 103.17 Males per 100 Females in Springfield.
What is the Ratio of Females per 100 Males in Springfield?
There are 96.93 Females per 100 Males in Springfield.
What is the Median Population Age in Springfield?
Median Population Age in Springfield is 37.3 Years.
What is the Average Family Size in Springfield
Average Family Size in Springfield is 2.9 People.
What is the Average Household Size in Springfield
Average Household Size in Springfield is 2.4 People.
How Large is the Labor Force in Springfield?
There are 33,115 People in the Labor Forcein in Springfield.
What is the Percentage of People in the Labor Force in Springfield?
65.9% of People are in the Labor Force in Springfield.
What is the Unemployment Rate in Springfield?
Unemployment Rate in Springfield is 6.1%.