Moscow, ID Map & Demographics
Moscow Map
Moscow Overview
$28,805
PER CAPITA INCOME
$79,916
AVG FAMILY INCOME
$53,679
AVG HOUSEHOLD INCOME
31.0%
WAGE / INCOME GAP [ % ]
69.0¢/ $1
WAGE / INCOME GAP [ $ ]
$8,416
FAMILY INCOME DEFICIT
0.47
INEQUALITY / GINI INDEX
25,616
TOTAL POPULATION
13,235
MALE POPULATION
12,381
FEMALE POPULATION
106.90
MALES / 100 FEMALES
93.55
FEMALES / 100 MALES
24.8
MEDIAN AGE
2.7
AVG FAMILY SIZE
2.0
AVG HOUSEHOLD SIZE
14,041
LABOR FORCE [ PEOPLE ]
63.4%
PERCENT IN LABOR FORCE
6.4%
UNEMPLOYMENT RATE
Moscow Area Codes
Income in Moscow
Income Overview in Moscow
Per Capita Income in Moscow is $28,805, while median incomes of families and households are $79,916 and $53,679 respectively.
| Characteristic | Number | Measure |
| Per Capita Income | 25,616 | $28,805 |
| Median Family Income | 4,603 | $79,916 |
| Mean Family Income | 4,603 | $103,863 |
| Median Household Income | 9,751 | $53,679 |
| Mean Household Income | 9,751 | $73,256 |
| Income Deficit | 4,603 | $8,416 |
| Wage / Income Gap (%) | 25,616 | 30.99% |
| Wage / Income Gap ($) | 25,616 | 69.01¢ per $1 |
| Gini / Inequality Index | 25,616 | 0.47 |
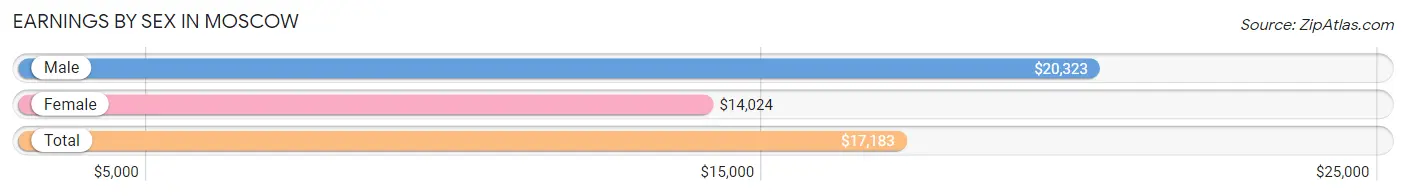
Earnings by Sex in Moscow
Average Earnings in Moscow are $17,183, $20,323 for men and $14,024 for women, a difference of 31.0%.
| Sex | Number | Average Earnings |
| Male | 9,593 (54.2%) | $20,323 |
| Female | 8,099 (45.8%) | $14,024 |
| Total | 17,692 (100.0%) | $17,183 |
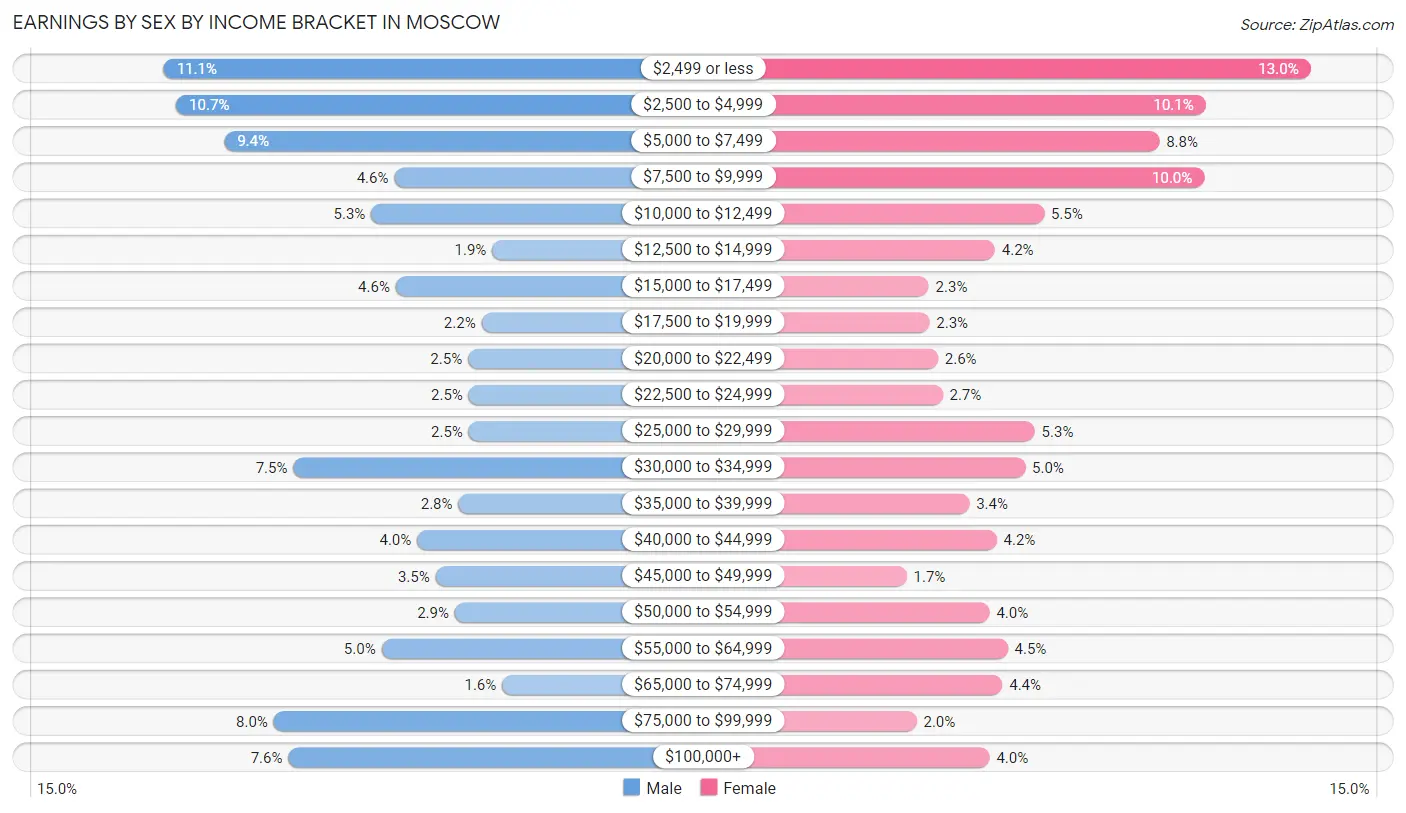
Earnings by Sex by Income Bracket in Moscow
The most common earnings brackets in Moscow are $2,499 or less for men (1,064 | 11.1%) and $2,499 or less for women (1,055 | 13.0%).
| Income | Male | Female |
| $2,499 or less | 1,064 (11.1%) | 1,055 (13.0%) |
| $2,500 to $4,999 | 1,030 (10.7%) | 816 (10.1%) |
| $5,000 to $7,499 | 901 (9.4%) | 711 (8.8%) |
| $7,500 to $9,999 | 442 (4.6%) | 813 (10.0%) |
| $10,000 to $12,499 | 505 (5.3%) | 449 (5.5%) |
| $12,500 to $14,999 | 178 (1.9%) | 337 (4.2%) |
| $15,000 to $17,499 | 438 (4.6%) | 186 (2.3%) |
| $17,500 to $19,999 | 207 (2.2%) | 188 (2.3%) |
| $20,000 to $22,499 | 244 (2.5%) | 207 (2.6%) |
| $22,500 to $24,999 | 242 (2.5%) | 218 (2.7%) |
| $25,000 to $29,999 | 242 (2.5%) | 428 (5.3%) |
| $30,000 to $34,999 | 715 (7.4%) | 406 (5.0%) |
| $35,000 to $39,999 | 270 (2.8%) | 279 (3.4%) |
| $40,000 to $44,999 | 381 (4.0%) | 341 (4.2%) |
| $45,000 to $49,999 | 331 (3.5%) | 136 (1.7%) |
| $50,000 to $54,999 | 279 (2.9%) | 325 (4.0%) |
| $55,000 to $64,999 | 477 (5.0%) | 366 (4.5%) |
| $65,000 to $74,999 | 152 (1.6%) | 354 (4.4%) |
| $75,000 to $99,999 | 767 (8.0%) | 159 (2.0%) |
| $100,000+ | 728 (7.6%) | 325 (4.0%) |
| Total | 9,593 (100.0%) | 8,099 (100.0%) |
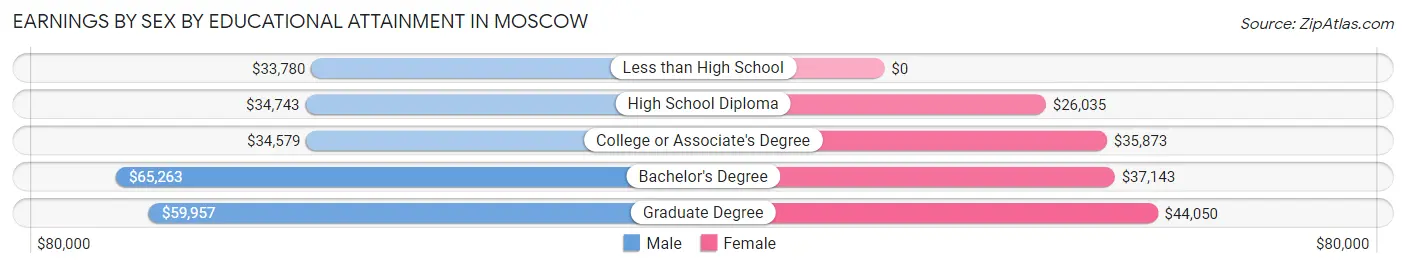
Earnings by Sex by Educational Attainment in Moscow
Average earnings in Moscow are $45,747 for men and $36,036 for women, a difference of 21.2%. Men with an educational attainment of bachelor's degree enjoy the highest average annual earnings of $65,263, while those with less than high school education earn the least with $33,780. Women with an educational attainment of graduate degree earn the most with the average annual earnings of $44,050, while those with high school diploma education have the smallest earnings of $26,035.
| Educational Attainment | Male Income | Female Income |
| Less than High School | $33,780 | $0 |
| High School Diploma | $34,743 | $26,035 |
| College or Associate's Degree | $34,579 | $35,873 |
| Bachelor's Degree | $65,263 | $37,143 |
| Graduate Degree | $59,957 | $44,050 |
| Total | $45,747 | $36,036 |
Family Income in Moscow
Family Income Brackets in Moscow
According to the Moscow family income data, there are 893 families falling into the $50,000 to $74,999 income range, which is the most common income bracket and makes up 19.4% of all families. Conversely, the less than $10,000 income bracket is the least frequent group with only 92 families (2.0%) belonging to this category.
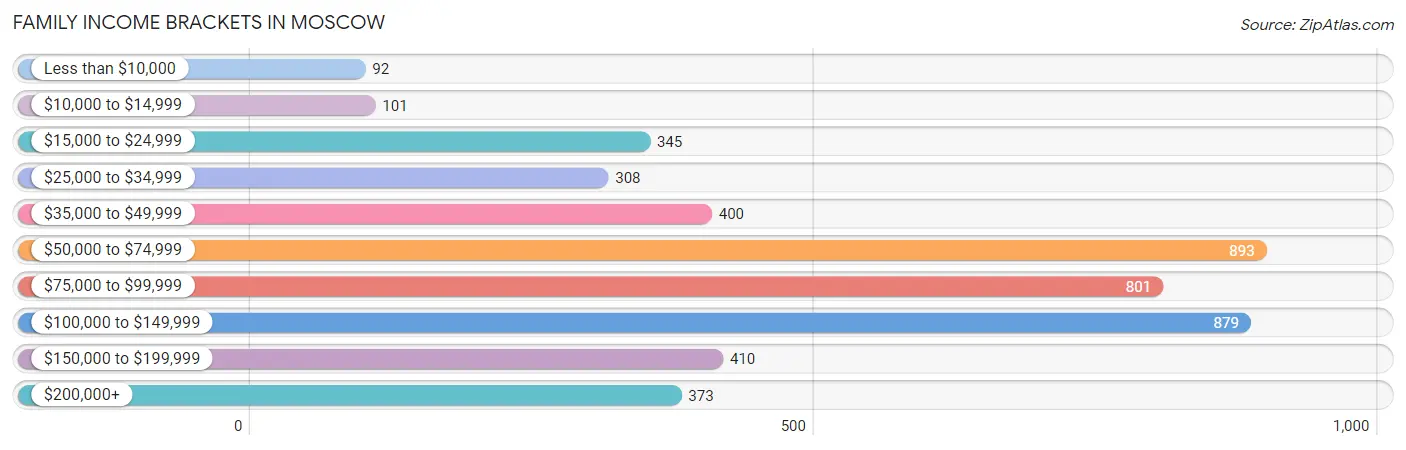
| Income Bracket | # Families | % Families |
| Less than $10,000 | 92 | 2.0% |
| $10,000 to $14,999 | 101 | 2.2% |
| $15,000 to $24,999 | 345 | 7.5% |
| $25,000 to $34,999 | 308 | 6.7% |
| $35,000 to $49,999 | 400 | 8.7% |
| $50,000 to $74,999 | 893 | 19.4% |
| $75,000 to $99,999 | 801 | 17.4% |
| $100,000 to $149,999 | 879 | 19.1% |
| $150,000 to $199,999 | 410 | 8.9% |
| $200,000+ | 373 | 8.1% |
Family Income by Famaliy Size in Moscow
5-person families (480 | 10.4%) account for the highest median family income in Moscow with $95,216 per family, while 2-person families (2,067 | 44.9%) have the highest median income of $34,458 per family member.
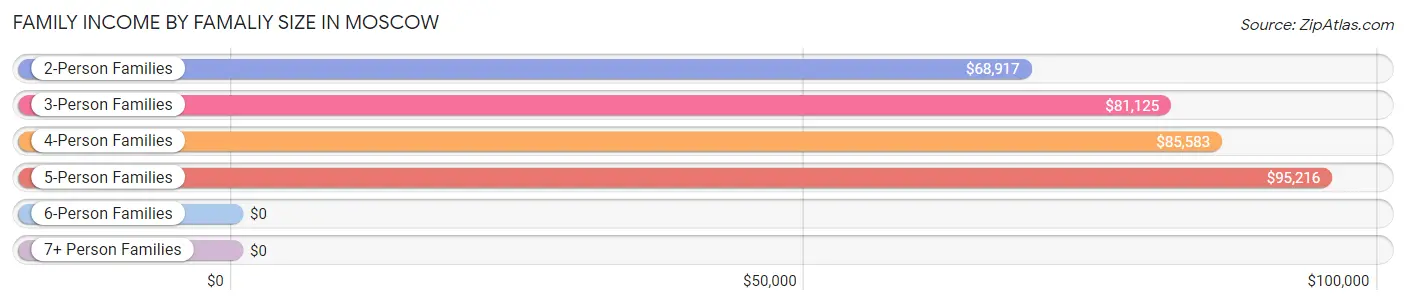
| Income Bracket | # Families | Median Income |
| 2-Person Families | 2,067 (44.9%) | $68,917 |
| 3-Person Families | 1,342 (29.1%) | $81,125 |
| 4-Person Families | 639 (13.9%) | $85,583 |
| 5-Person Families | 480 (10.4%) | $95,216 |
| 6-Person Families | 44 (1.0%) | $0 |
| 7+ Person Families | 31 (0.7%) | $0 |
| Total | 4,603 (100.0%) | $79,916 |
Family Income by Number of Earners in Moscow
The median family income in Moscow is $79,916, with families comprising 3+ earners (357) having the highest median family income of $156,449, while families with 1 earner (1,371) have the lowest median family income of $48,073, accounting for 7.8% and 29.8% of families, respectively.
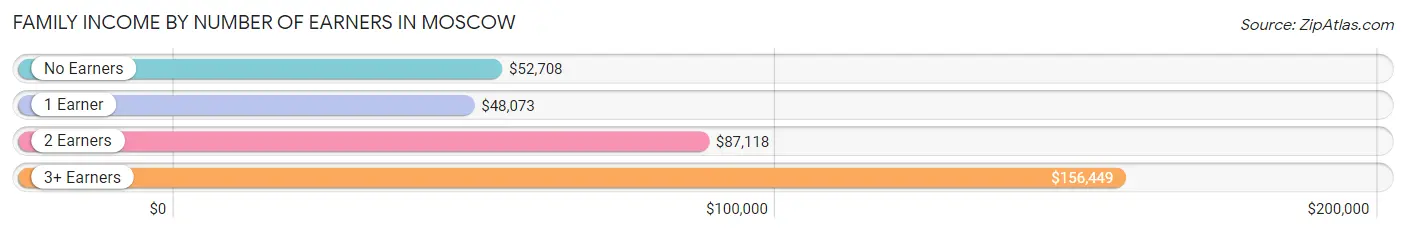
| Number of Earners | # Families | Median Income |
| No Earners | 475 (10.3%) | $52,708 |
| 1 Earner | 1,371 (29.8%) | $48,073 |
| 2 Earners | 2,400 (52.1%) | $87,118 |
| 3+ Earners | 357 (7.8%) | $156,449 |
| Total | 4,603 (100.0%) | $79,916 |
Household Income in Moscow
Household Income Brackets in Moscow
With 2,018 households falling in the category, the $50,000 to $74,999 income range is the most frequent in Moscow, accounting for 20.7% of all households. In contrast, only 312 households (3.2%) fall into the $10,000 to $14,999 income bracket, making it the least populous group.
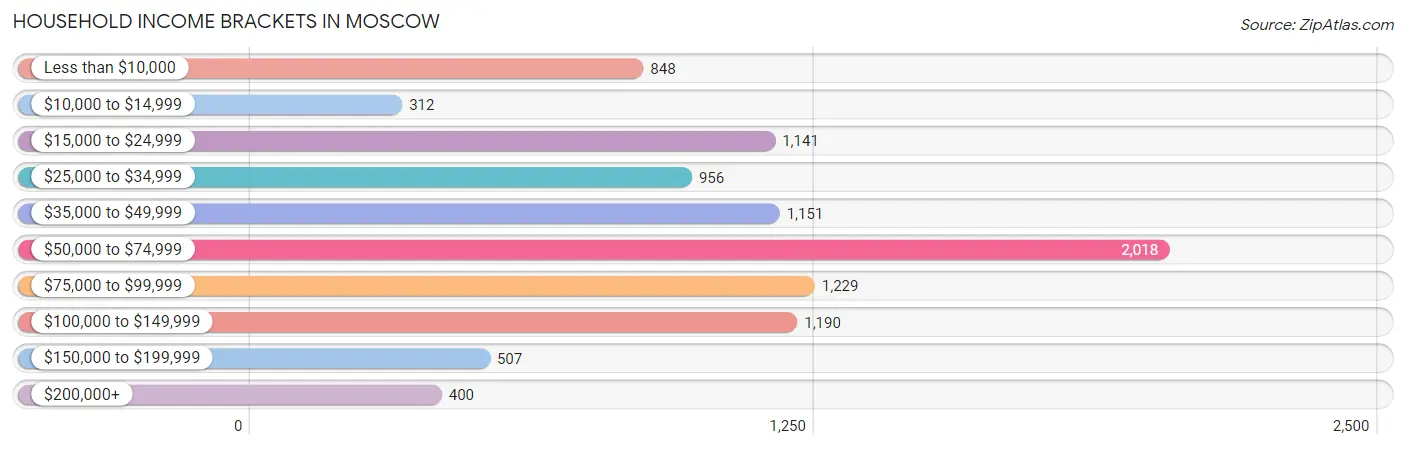
| Income Bracket | # Households | % Households |
| Less than $10,000 | 848 | 8.7% |
| $10,000 to $14,999 | 312 | 3.2% |
| $15,000 to $24,999 | 1,141 | 11.7% |
| $25,000 to $34,999 | 956 | 9.8% |
| $35,000 to $49,999 | 1,151 | 11.8% |
| $50,000 to $74,999 | 2,018 | 20.7% |
| $75,000 to $99,999 | 1,229 | 12.6% |
| $100,000 to $149,999 | 1,190 | 12.2% |
| $150,000 to $199,999 | 507 | 5.2% |
| $200,000+ | 400 | 4.1% |
Household Income by Householder Age in Moscow
The median household income in Moscow is $53,679, with the highest median household income of $66,733 found in the 45 to 64 years age bracket for the primary householder. A total of 2,069 households (21.2%) fall into this category. Meanwhile, the 15 to 24 years age bracket for the primary householder has the lowest median household income of $23,853, with 2,130 households (21.8%) in this group.
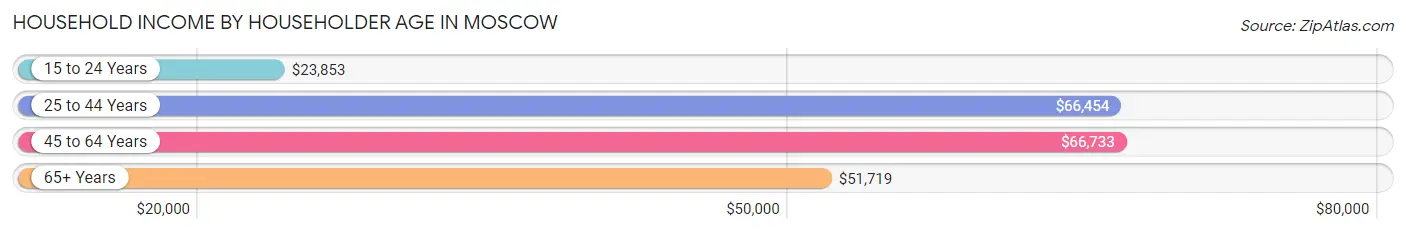
| Income Bracket | # Households | Median Income |
| 15 to 24 Years | 2,130 (21.8%) | $23,853 |
| 25 to 44 Years | 3,983 (40.8%) | $66,454 |
| 45 to 64 Years | 2,069 (21.2%) | $66,733 |
| 65+ Years | 1,569 (16.1%) | $51,719 |
| Total | 9,751 (100.0%) | $53,679 |
Poverty in Moscow
Income Below Poverty by Sex and Age in Moscow
With 17.9% poverty level for males and 21.1% for females among the residents of Moscow, 18 to 24 year old males and 18 to 24 year old females are the most vulnerable to poverty, with 990 males (48.8%) and 1,018 females (61.2%) in their respective age groups living below the poverty level.
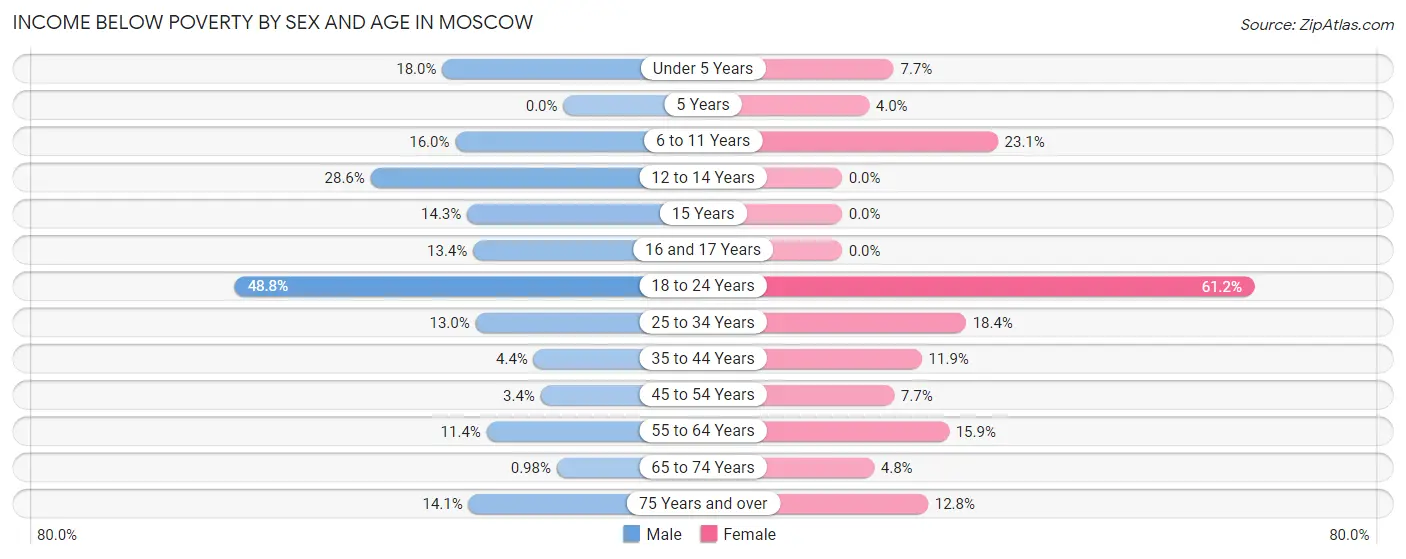
| Age Bracket | Male | Female |
| Under 5 Years | 66 (18.0%) | 41 (7.7%) |
| 5 Years | 0 (0.0%) | 9 (4.0%) |
| 6 to 11 Years | 116 (16.0%) | 162 (23.1%) |
| 12 to 14 Years | 83 (28.6%) | 0 (0.0%) |
| 15 Years | 18 (14.3%) | 0 (0.0%) |
| 16 and 17 Years | 39 (13.4%) | 0 (0.0%) |
| 18 to 24 Years | 990 (48.8%) | 1,018 (61.2%) |
| 25 to 34 Years | 292 (13.0%) | 335 (18.4%) |
| 35 to 44 Years | 69 (4.4%) | 151 (11.9%) |
| 45 to 54 Years | 29 (3.4%) | 53 (7.7%) |
| 55 to 64 Years | 94 (11.4%) | 135 (15.9%) |
| 65 to 74 Years | 6 (1.0%) | 32 (4.8%) |
| 75 Years and over | 58 (14.1%) | 71 (12.8%) |
| Total | 1,860 (17.9%) | 2,007 (21.1%) |
Income Above Poverty by Sex and Age in Moscow
According to the poverty statistics in Moscow, males aged 5 years and females aged 12 to 14 years are the age groups that are most secure financially, with 100.0% of males and 100.0% of females in these age groups living above the poverty line.
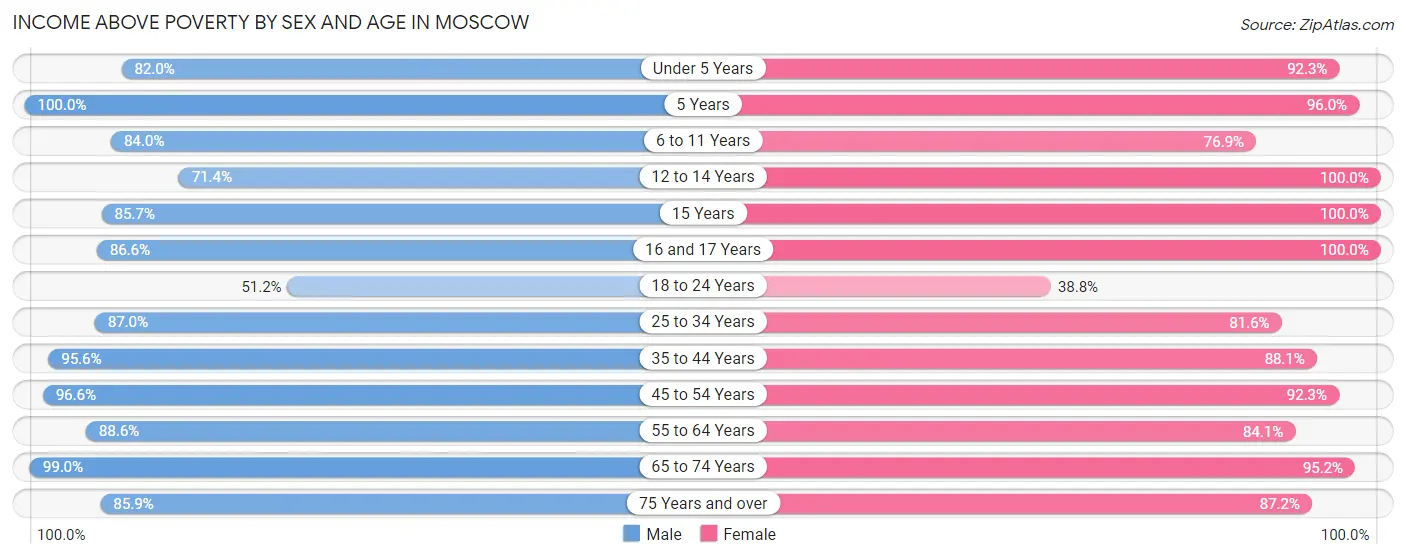
| Age Bracket | Male | Female |
| Under 5 Years | 301 (82.0%) | 493 (92.3%) |
| 5 Years | 19 (100.0%) | 215 (96.0%) |
| 6 to 11 Years | 607 (84.0%) | 538 (76.9%) |
| 12 to 14 Years | 207 (71.4%) | 252 (100.0%) |
| 15 Years | 108 (85.7%) | 138 (100.0%) |
| 16 and 17 Years | 252 (86.6%) | 125 (100.0%) |
| 18 to 24 Years | 1,039 (51.2%) | 646 (38.8%) |
| 25 to 34 Years | 1,948 (87.0%) | 1,486 (81.6%) |
| 35 to 44 Years | 1,500 (95.6%) | 1,122 (88.1%) |
| 45 to 54 Years | 831 (96.6%) | 632 (92.3%) |
| 55 to 64 Years | 731 (88.6%) | 715 (84.1%) |
| 65 to 74 Years | 608 (99.0%) | 640 (95.2%) |
| 75 Years and over | 354 (85.9%) | 485 (87.2%) |
| Total | 8,505 (82.1%) | 7,487 (78.9%) |
Income Below Poverty Among Married-Couple Families in Moscow
The poverty statistics for married-couple families in Moscow show that 5.0% or 180 of the total 3,638 families live below the poverty line. Families with 1 or 2 children have the highest poverty rate of 9.9%, comprising of 117 families. On the other hand, families with 5 or more children have the lowest poverty rate of 0.0%, which includes 0 families.
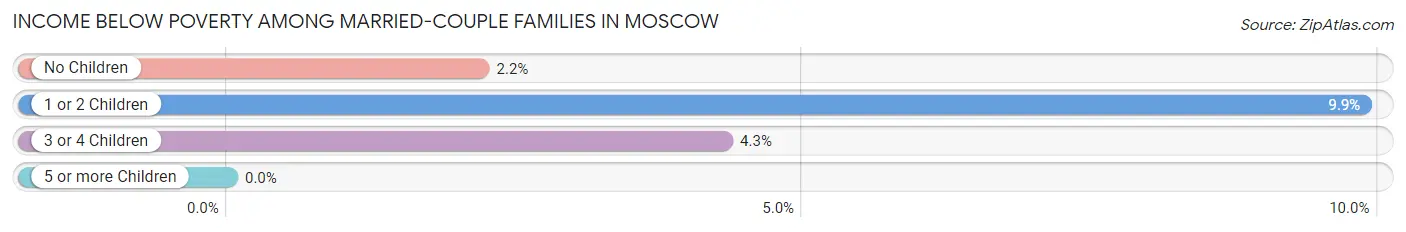
| Children | Above Poverty | Below Poverty |
| No Children | 1,923 (97.8%) | 43 (2.2%) |
| 1 or 2 Children | 1,068 (90.1%) | 117 (9.9%) |
| 3 or 4 Children | 444 (95.7%) | 20 (4.3%) |
| 5 or more Children | 23 (100.0%) | 0 (0.0%) |
| Total | 3,458 (95.1%) | 180 (5.0%) |
Income Below Poverty Among Single-Parent Households in Moscow
According to the poverty data in Moscow, 23.1% or 70 single-father households and 30.7% or 203 single-mother households are living below the poverty line. Among single-father households, those with 1 or 2 children have the highest poverty rate, with 26 households (28.6%) experiencing poverty. Likewise, among single-mother households, those with 3 or 4 children have the highest poverty rate, with 60 households (100.0%) falling below the poverty line.
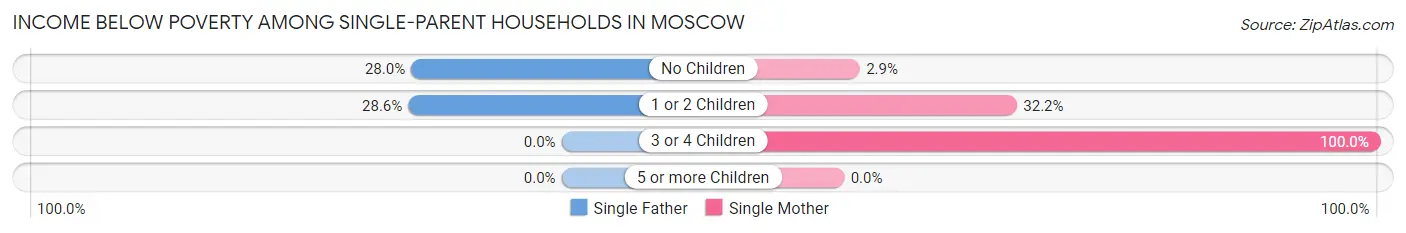
| Children | Single Father | Single Mother |
| No Children | 44 (28.0%) | 5 (2.9%) |
| 1 or 2 Children | 26 (28.6%) | 138 (32.2%) |
| 3 or 4 Children | 0 (0.0%) | 60 (100.0%) |
| 5 or more Children | 0 (0.0%) | 0 (0.0%) |
| Total | 70 (23.1%) | 203 (30.7%) |
Income Below Poverty Among Married-Couple vs Single-Parent Households in Moscow
The poverty data for Moscow shows that 180 of the married-couple family households (5.0%) and 273 of the single-parent households (28.3%) are living below the poverty level. Within the married-couple family households, those with 1 or 2 children have the highest poverty rate, with 117 households (9.9%) falling below the poverty line. Among the single-parent households, those with 3 or 4 children have the highest poverty rate, with 60 household (52.2%) living below poverty.
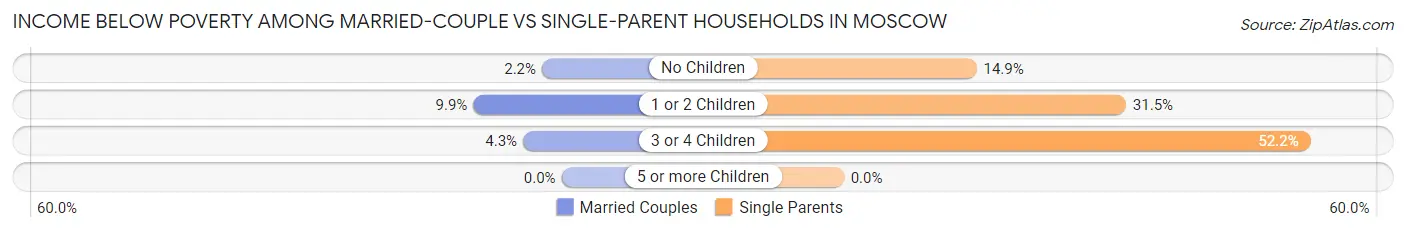
| Children | Married-Couple Families | Single-Parent Households |
| No Children | 43 (2.2%) | 49 (14.8%) |
| 1 or 2 Children | 117 (9.9%) | 164 (31.5%) |
| 3 or 4 Children | 20 (4.3%) | 60 (52.2%) |
| 5 or more Children | 0 (0.0%) | 0 (0.0%) |
| Total | 180 (5.0%) | 273 (28.3%) |
Race in Moscow
The most populous races in Moscow are White / Caucasian (22,326 | 87.2%), Two or more Races (1,488 | 5.8%), and Hispanic or Latino (1,290 | 5.0%).
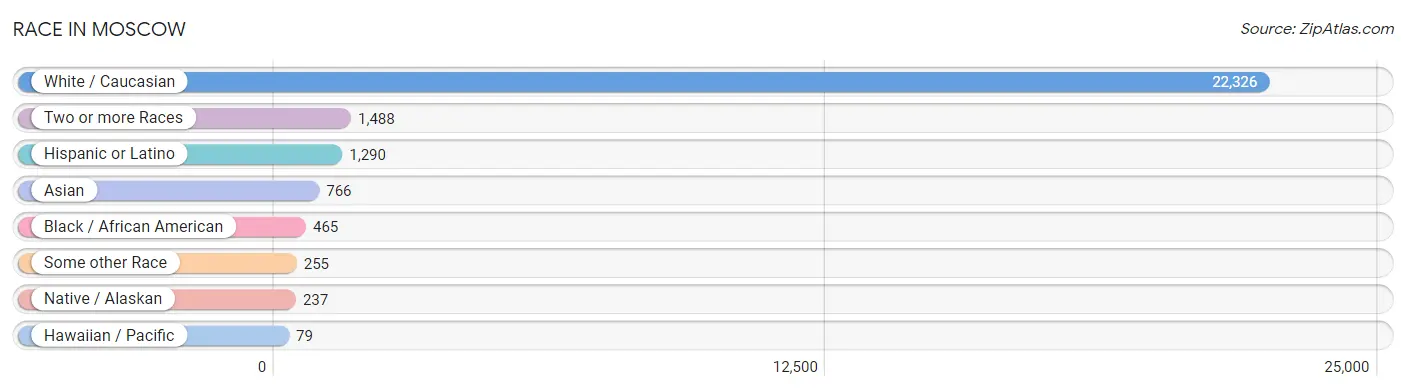
| Race | # Population | % Population |
| Asian | 766 | 3.0% |
| Black / African American | 465 | 1.8% |
| Hawaiian / Pacific | 79 | 0.3% |
| Hispanic or Latino | 1,290 | 5.0% |
| Native / Alaskan | 237 | 0.9% |
| White / Caucasian | 22,326 | 87.2% |
| Two or more Races | 1,488 | 5.8% |
| Some other Race | 255 | 1.0% |
| Total | 25,616 | 100.0% |
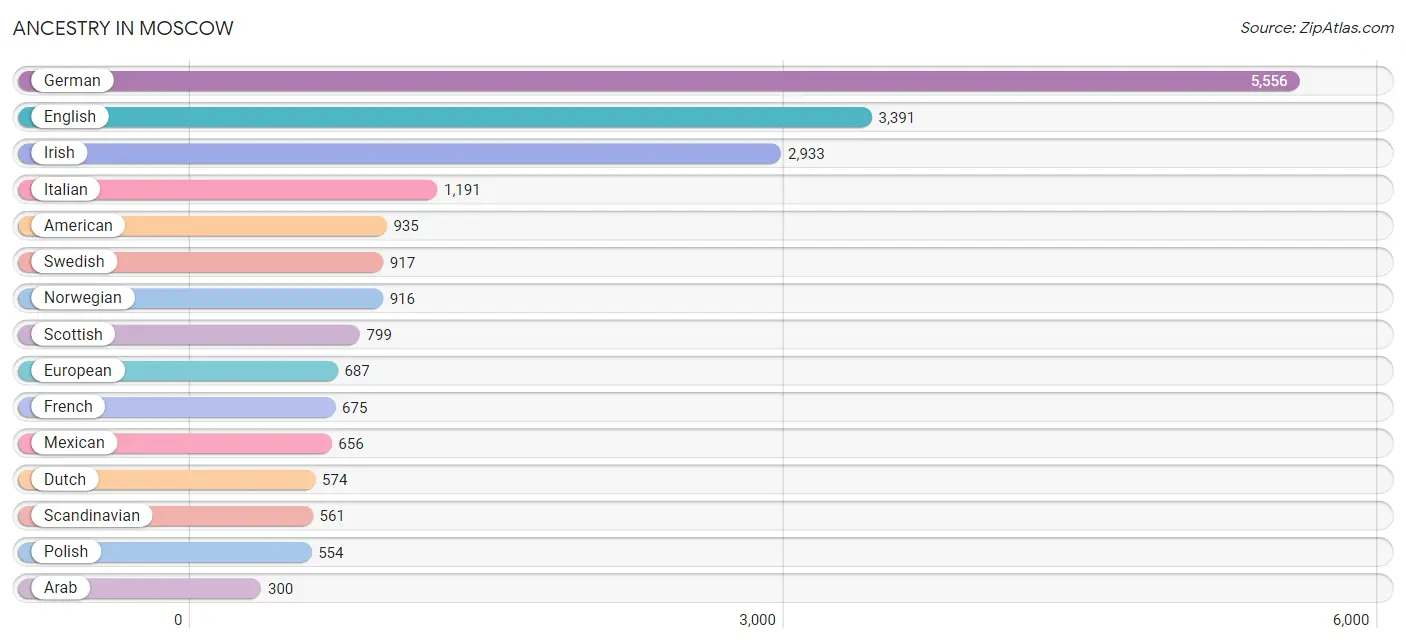
Ancestry in Moscow
The most populous ancestries reported in Moscow are German (5,556 | 21.7%), English (3,391 | 13.2%), Irish (2,933 | 11.5%), Italian (1,191 | 4.6%), and American (935 | 3.6%), together accounting for 54.7% of all Moscow residents.
| Ancestry | # Population | % Population |
| African | 57 | 0.2% |
| Aleut | 16 | 0.1% |
| American | 935 | 3.6% |
| Arab | 300 | 1.2% |
| Austrian | 76 | 0.3% |
| Basque | 24 | 0.1% |
| Belgian | 73 | 0.3% |
| Bhutanese | 120 | 0.5% |
| Blackfeet | 88 | 0.3% |
| Brazilian | 8 | 0.0% |
| British | 238 | 0.9% |
| Burmese | 201 | 0.8% |
| Canadian | 246 | 1.0% |
| Central American | 126 | 0.5% |
| Cherokee | 77 | 0.3% |
| Choctaw | 46 | 0.2% |
| Croatian | 118 | 0.5% |
| Cuban | 38 | 0.2% |
| Czech | 33 | 0.1% |
| Czechoslovakian | 37 | 0.1% |
| Danish | 202 | 0.8% |
| Dutch | 574 | 2.2% |
| Eastern European | 54 | 0.2% |
| Ecuadorian | 58 | 0.2% |
| Egyptian | 83 | 0.3% |
| English | 3,391 | 13.2% |
| Ethiopian | 39 | 0.2% |
| European | 687 | 2.7% |
| Filipino | 16 | 0.1% |
| Finnish | 31 | 0.1% |
| French | 675 | 2.6% |
| French Canadian | 86 | 0.3% |
| German | 5,556 | 21.7% |
| Greek | 15 | 0.1% |
| Guamanian / Chamorro | 4 | 0.0% |
| Guatemalan | 15 | 0.1% |
| Haitian | 14 | 0.1% |
| Honduran | 42 | 0.2% |
| Hungarian | 36 | 0.1% |
| Icelander | 14 | 0.1% |
| Indian (Asian) | 255 | 1.0% |
| Inupiat | 89 | 0.4% |
| Iranian | 19 | 0.1% |
| Irish | 2,933 | 11.5% |
| Italian | 1,191 | 4.6% |
| Jordanian | 9 | 0.0% |
| Korean | 207 | 0.8% |
| Latvian | 33 | 0.1% |
| Lebanese | 64 | 0.3% |
| Lithuanian | 14 | 0.1% |
| Malaysian | 63 | 0.3% |
| Menominee | 2 | 0.0% |
| Mexican | 656 | 2.6% |
| Mongolian | 17 | 0.1% |
| Native Hawaiian | 74 | 0.3% |
| Northern European | 57 | 0.2% |
| Norwegian | 916 | 3.6% |
| Pakistani | 106 | 0.4% |
| Panamanian | 61 | 0.2% |
| Peruvian | 37 | 0.1% |
| Polish | 554 | 2.2% |
| Portuguese | 93 | 0.4% |
| Puerto Rican | 29 | 0.1% |
| Puget Sound Salish | 12 | 0.1% |
| Romanian | 6 | 0.0% |
| Russian | 198 | 0.8% |
| Salvadoran | 8 | 0.0% |
| Samoan | 54 | 0.2% |
| Scandinavian | 561 | 2.2% |
| Scotch-Irish | 275 | 1.1% |
| Scottish | 799 | 3.1% |
| Shoshone | 30 | 0.1% |
| Slavic | 15 | 0.1% |
| Slovene | 47 | 0.2% |
| South American | 101 | 0.4% |
| Spaniard | 266 | 1.0% |
| Spanish | 12 | 0.1% |
| Sri Lankan | 121 | 0.5% |
| Subsaharan African | 167 | 0.6% |
| Sudanese | 45 | 0.2% |
| Swedish | 917 | 3.6% |
| Swiss | 211 | 0.8% |
| Thai | 165 | 0.6% |
| Turkish | 39 | 0.2% |
| Ukrainian | 80 | 0.3% |
| Uruguayan | 6 | 0.0% |
| Welsh | 154 | 0.6% |
| Yakama | 39 | 0.2% |
| Yugoslavian | 13 | 0.1% | View All 89 Rows |
Immigrants in Moscow
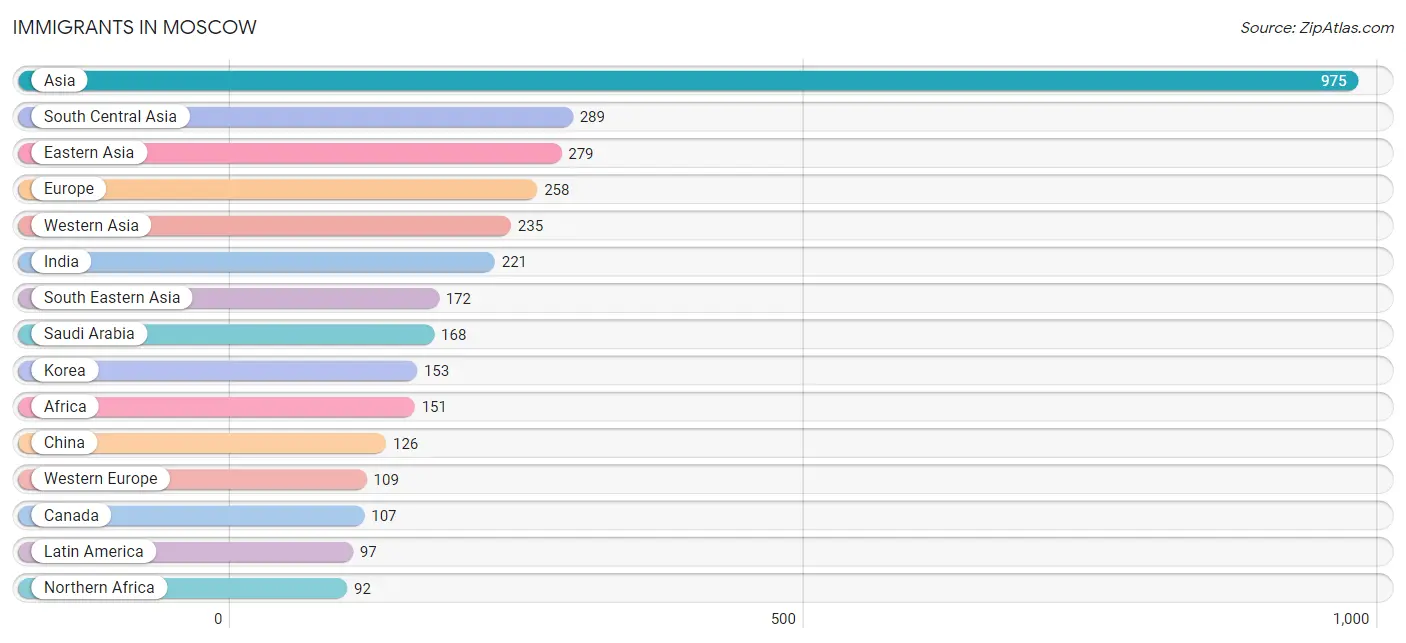
The most numerous immigrant groups reported in Moscow came from Asia (975 | 3.8%), South Central Asia (289 | 1.1%), Eastern Asia (279 | 1.1%), Europe (258 | 1.0%), and Western Asia (235 | 0.9%), together accounting for 8.0% of all Moscow residents.
| Immigration Origin | # Population | % Population |
| Africa | 151 | 0.6% |
| Asia | 975 | 3.8% |
| Austria | 11 | 0.0% |
| Brazil | 37 | 0.1% |
| Canada | 107 | 0.4% |
| Central America | 60 | 0.2% |
| China | 126 | 0.5% |
| Congo | 15 | 0.1% |
| Eastern Africa | 44 | 0.2% |
| Eastern Asia | 279 | 1.1% |
| Eastern Europe | 61 | 0.2% |
| Egypt | 47 | 0.2% |
| England | 72 | 0.3% |
| Europe | 258 | 1.0% |
| France | 14 | 0.1% |
| Germany | 82 | 0.3% |
| Honduras | 18 | 0.1% |
| India | 221 | 0.9% |
| Iran | 19 | 0.1% |
| Italy | 16 | 0.1% |
| Jordan | 9 | 0.0% |
| Korea | 153 | 0.6% |
| Kuwait | 58 | 0.2% |
| Latin America | 97 | 0.4% |
| Mexico | 35 | 0.1% |
| Middle Africa | 15 | 0.1% |
| Nepal | 49 | 0.2% |
| Netherlands | 2 | 0.0% |
| Northern Africa | 92 | 0.4% |
| Northern Europe | 72 | 0.3% |
| Panama | 7 | 0.0% |
| Philippines | 27 | 0.1% |
| Romania | 6 | 0.0% |
| Russia | 55 | 0.2% |
| Saudi Arabia | 168 | 0.7% |
| South America | 37 | 0.1% |
| South Central Asia | 289 | 1.1% |
| South Eastern Asia | 172 | 0.7% |
| Southern Europe | 16 | 0.1% |
| Sudan | 45 | 0.2% |
| Taiwan | 16 | 0.1% |
| Thailand | 88 | 0.3% |
| Vietnam | 57 | 0.2% |
| Western Asia | 235 | 0.9% |
| Western Europe | 109 | 0.4% | View All 45 Rows |
Sex and Age in Moscow
Sex and Age in Moscow
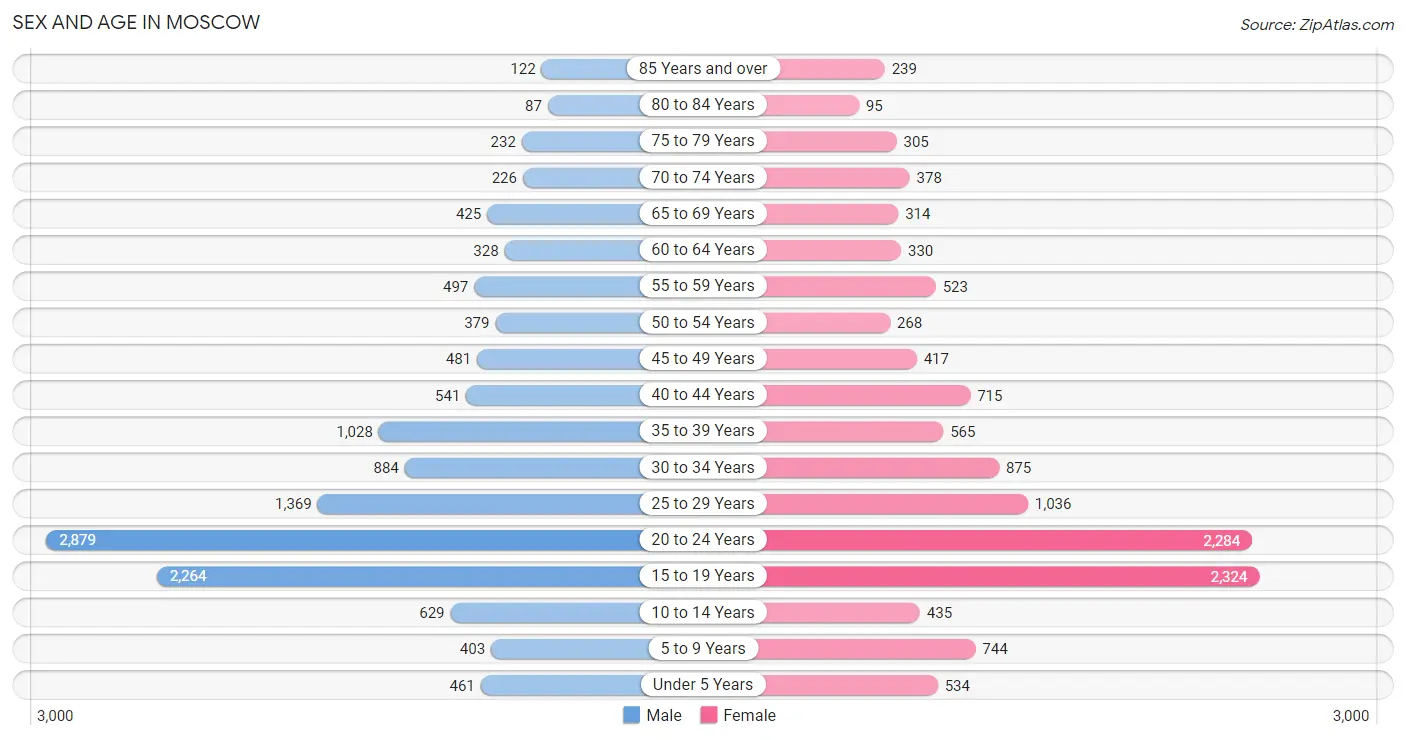
The most populous age groups in Moscow are 20 to 24 Years (2,879 | 21.7%) for men and 15 to 19 Years (2,324 | 18.8%) for women.
| Age Bracket | Male | Female |
| Under 5 Years | 461 (3.5%) | 534 (4.3%) |
| 5 to 9 Years | 403 (3.0%) | 744 (6.0%) |
| 10 to 14 Years | 629 (4.8%) | 435 (3.5%) |
| 15 to 19 Years | 2,264 (17.1%) | 2,324 (18.8%) |
| 20 to 24 Years | 2,879 (21.7%) | 2,284 (18.4%) |
| 25 to 29 Years | 1,369 (10.3%) | 1,036 (8.4%) |
| 30 to 34 Years | 884 (6.7%) | 875 (7.1%) |
| 35 to 39 Years | 1,028 (7.8%) | 565 (4.6%) |
| 40 to 44 Years | 541 (4.1%) | 715 (5.8%) |
| 45 to 49 Years | 481 (3.6%) | 417 (3.4%) |
| 50 to 54 Years | 379 (2.9%) | 268 (2.2%) |
| 55 to 59 Years | 497 (3.8%) | 523 (4.2%) |
| 60 to 64 Years | 328 (2.5%) | 330 (2.7%) |
| 65 to 69 Years | 425 (3.2%) | 314 (2.5%) |
| 70 to 74 Years | 226 (1.7%) | 378 (3.0%) |
| 75 to 79 Years | 232 (1.8%) | 305 (2.5%) |
| 80 to 84 Years | 87 (0.7%) | 95 (0.8%) |
| 85 Years and over | 122 (0.9%) | 239 (1.9%) |
| Total | 13,235 (100.0%) | 12,381 (100.0%) |
Families and Households in Moscow
Median Family Size in Moscow
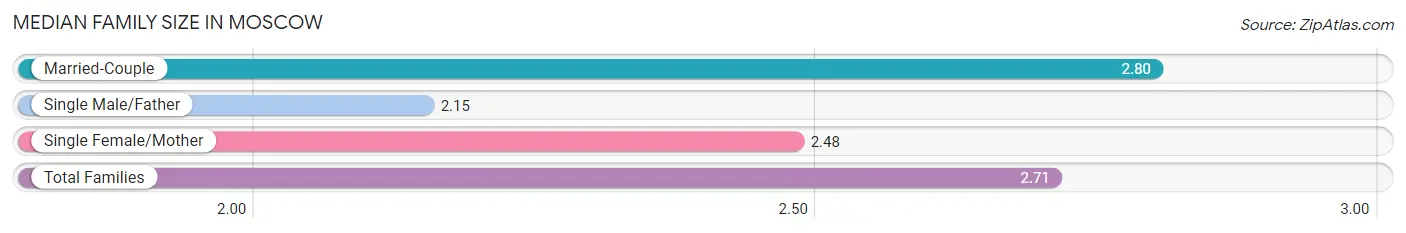
The median family size in Moscow is 2.71 persons per family, with married-couple families (3,638 | 79.0%) accounting for the largest median family size of 2.8 persons per family. On the other hand, single male/father families (303 | 6.6%) represent the smallest median family size with 2.15 persons per family.
| Family Type | # Families | Family Size |
| Married-Couple | 3,638 (79.0%) | 2.80 |
| Single Male/Father | 303 (6.6%) | 2.15 |
| Single Female/Mother | 662 (14.4%) | 2.48 |
| Total Families | 4,603 (100.0%) | 2.71 |
Median Household Size in Moscow
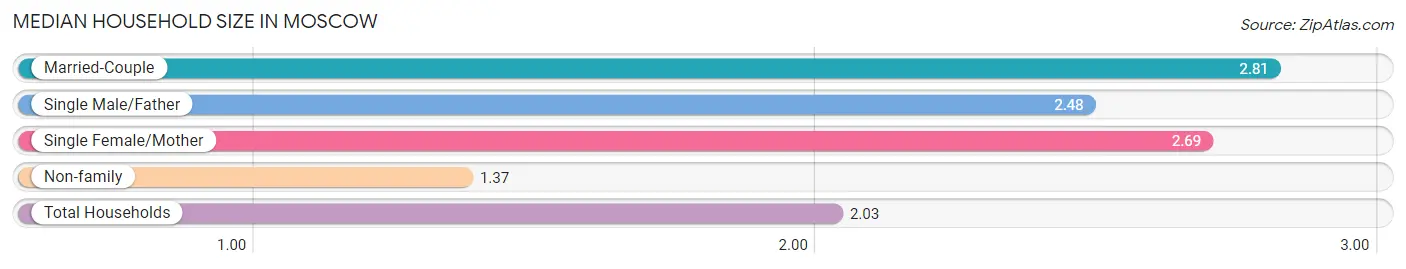
The median household size in Moscow is 2.03 persons per household, with married-couple households (3,638 | 37.3%) accounting for the largest median household size of 2.81 persons per household. non-family households (5,148 | 52.8%) represent the smallest median household size with 1.37 persons per household.
| Household Type | # Households | Household Size |
| Married-Couple | 3,638 (37.3%) | 2.81 |
| Single Male/Father | 303 (3.1%) | 2.48 |
| Single Female/Mother | 662 (6.8%) | 2.69 |
| Non-family | 5,148 (52.8%) | 1.37 |
| Total Households | 9,751 (100.0%) | 2.03 |
Household Size by Marriage Status in Moscow
Out of a total of 9,751 households in Moscow, 4,603 (47.2%) are family households, while 5,148 (52.8%) are nonfamily households. The most numerous type of family households are 2-person households, comprising 1,979, and the most common type of nonfamily households are 1-person households, comprising 3,073.
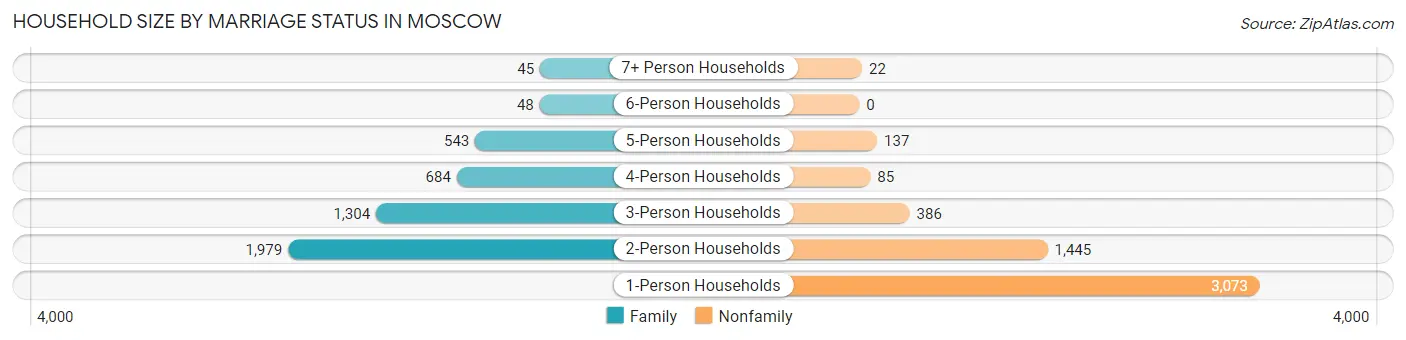
| Household Size | Family Households | Nonfamily Households |
| 1-Person Households | - | 3,073 (31.5%) |
| 2-Person Households | 1,979 (20.3%) | 1,445 (14.8%) |
| 3-Person Households | 1,304 (13.4%) | 386 (4.0%) |
| 4-Person Households | 684 (7.0%) | 85 (0.9%) |
| 5-Person Households | 543 (5.6%) | 137 (1.4%) |
| 6-Person Households | 48 (0.5%) | 0 (0.0%) |
| 7+ Person Households | 45 (0.5%) | 22 (0.2%) |
| Total | 4,603 (47.2%) | 5,148 (52.8%) |
Female Fertility in Moscow
Fertility by Age in Moscow
Average fertility rate in Moscow is 31.0 births per 1,000 women. Women in the age bracket of 20 to 34 years have the highest fertility rate with 56.0 births per 1,000 women. Women in the age bracket of 20 to 34 years acount for 92.9% of all women with births.
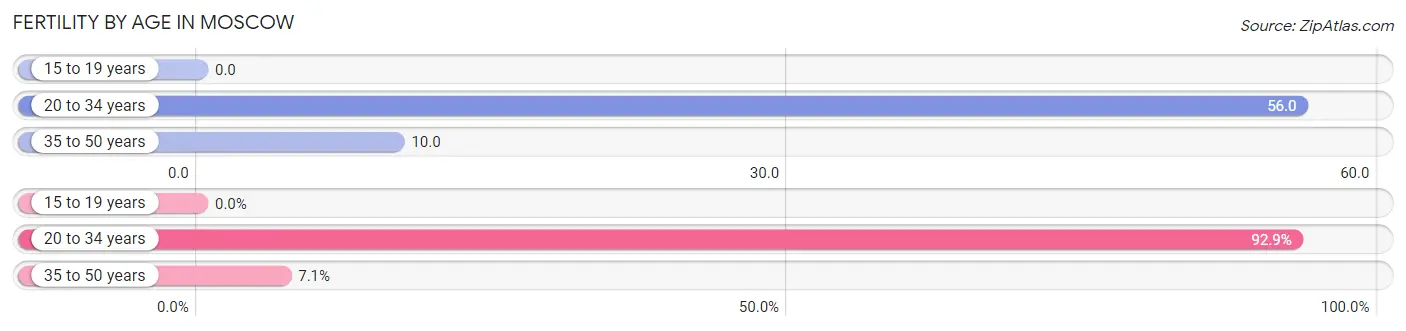
| Age Bracket | Women with Births | Births / 1,000 Women |
| 15 to 19 years | 0 (0.0%) | 0.0 |
| 20 to 34 years | 237 (92.9%) | 56.0 |
| 35 to 50 years | 18 (7.1%) | 10.0 |
| Total | 255 (100.0%) | 31.0 |
Fertility by Age by Marriage Status in Moscow
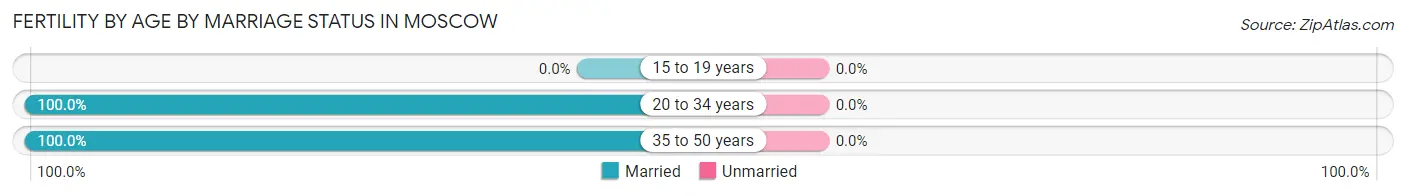
| Age Bracket | Married | Unmarried |
| 15 to 19 years | 0 (0.0%) | 0 (0.0%) |
| 20 to 34 years | 237 (100.0%) | 0 (0.0%) |
| 35 to 50 years | 18 (100.0%) | 0 (0.0%) |
| Total | 255 (100.0%) | 0 (0.0%) |
Fertility by Education in Moscow
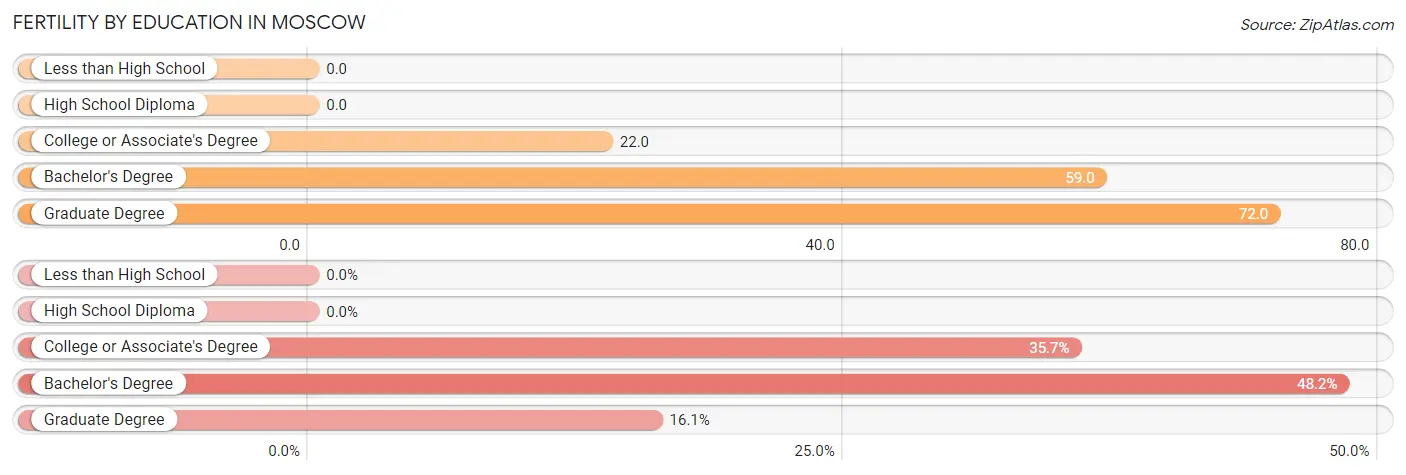
| Educational Attainment | Women with Births | Births / 1,000 Women |
| Less than High School | 0 (0.0%) | 0.0 |
| High School Diploma | 0 (0.0%) | 0.0 |
| College or Associate's Degree | 91 (35.7%) | 22.0 |
| Bachelor's Degree | 123 (48.2%) | 59.0 |
| Graduate Degree | 41 (16.1%) | 72.0 |
| Total | 255 (100.0%) | 31.0 |
Fertility by Education by Marriage Status in Moscow
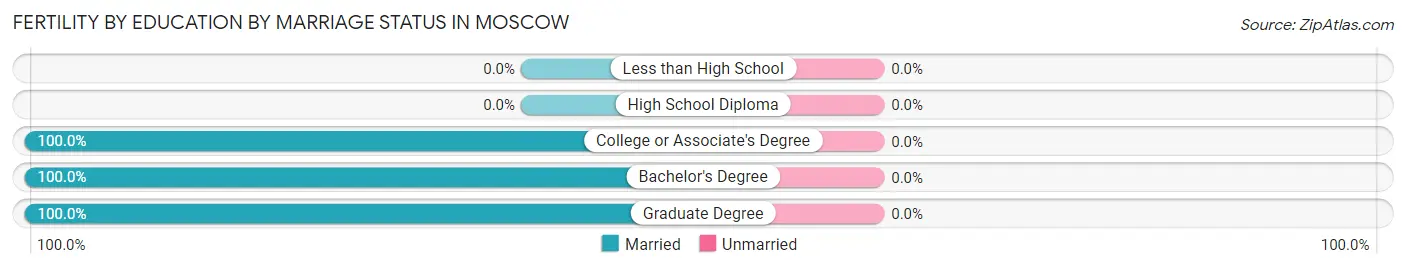
| Educational Attainment | Married | Unmarried |
| Less than High School | 0 (0.0%) | 0 (0.0%) |
| High School Diploma | 0 (0.0%) | 0 (0.0%) |
| College or Associate's Degree | 91 (100.0%) | 0 (0.0%) |
| Bachelor's Degree | 123 (100.0%) | 0 (0.0%) |
| Graduate Degree | 41 (100.0%) | 0 (0.0%) |
| Total | 255 (100.0%) | 0 (0.0%) |
Employment Characteristics in Moscow
Employment by Class of Employer in Moscow
Among the 12,797 employed individuals in Moscow, private company employees (7,330 | 57.3%), state government employees (2,797 | 21.9%), and not-for-profit organizations (895 | 7.0%) make up the most common classes of employment.
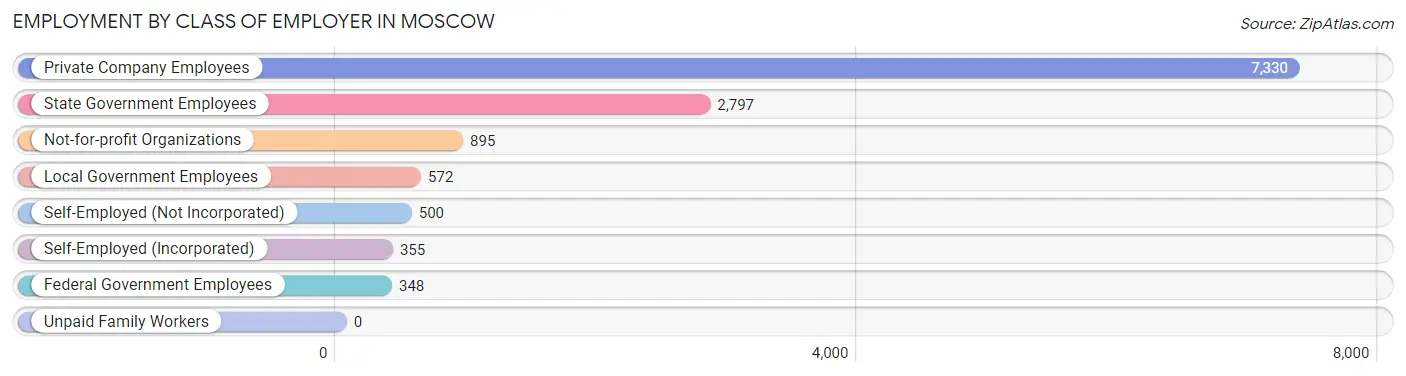
| Employer Class | # Employees | % Employees |
| Private Company Employees | 7,330 | 57.3% |
| Self-Employed (Incorporated) | 355 | 2.8% |
| Self-Employed (Not Incorporated) | 500 | 3.9% |
| Not-for-profit Organizations | 895 | 7.0% |
| Local Government Employees | 572 | 4.5% |
| State Government Employees | 2,797 | 21.9% |
| Federal Government Employees | 348 | 2.7% |
| Unpaid Family Workers | 0 | 0.0% |
| Total | 12,797 | 100.0% |
Employment Status by Age in Moscow
According to the labor force statistics for Moscow, out of the total population over 16 years of age (22,146), 63.4% or 14,041 individuals are in the labor force, with 6.4% or 899 of them unemployed. The age group with the highest labor force participation rate is 35 to 44 years, with 93.6% or 2,667 individuals in the labor force. Within the labor force, the 75 years and over age range has the highest percentage of unemployed individuals, with 35.4% or 23 of them being unemployed.
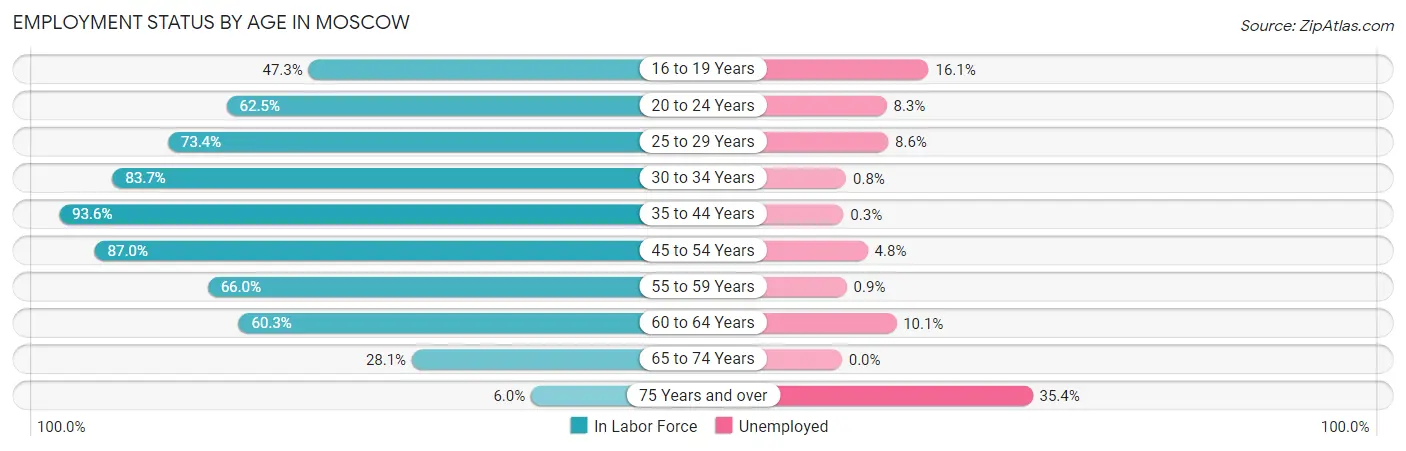
| Age Bracket | In Labor Force | Unemployed |
| 16 to 19 Years | 2,045 (47.3%) | 329 (16.1%) |
| 20 to 24 Years | 3,227 (62.5%) | 268 (8.3%) |
| 25 to 29 Years | 1,765 (73.4%) | 152 (8.6%) |
| 30 to 34 Years | 1,472 (83.7%) | 12 (0.8%) |
| 35 to 44 Years | 2,667 (93.6%) | 8 (0.3%) |
| 45 to 54 Years | 1,344 (87.0%) | 65 (4.8%) |
| 55 to 59 Years | 673 (66.0%) | 6 (0.9%) |
| 60 to 64 Years | 397 (60.3%) | 40 (10.1%) |
| 65 to 74 Years | 377 (28.1%) | 0 (0.0%) |
| 75 Years and over | 65 (6.0%) | 23 (35.4%) |
| Total | 14,041 (63.4%) | 899 (6.4%) |
Employment Status by Educational Attainment in Moscow
According to labor force statistics for Moscow, 81.3% of individuals (8,322) out of the total population between 25 and 64 years of age (10,236) are in the labor force, with 3.4% or 283 of them being unemployed. The group with the highest labor force participation rate are those with the educational attainment of bachelor's degree or higher, with 82.2% or 4,490 individuals in the labor force. Within the labor force, individuals with college / associate degree education have the highest percentage of unemployment, with 8.4% or 209 of them being unemployed.
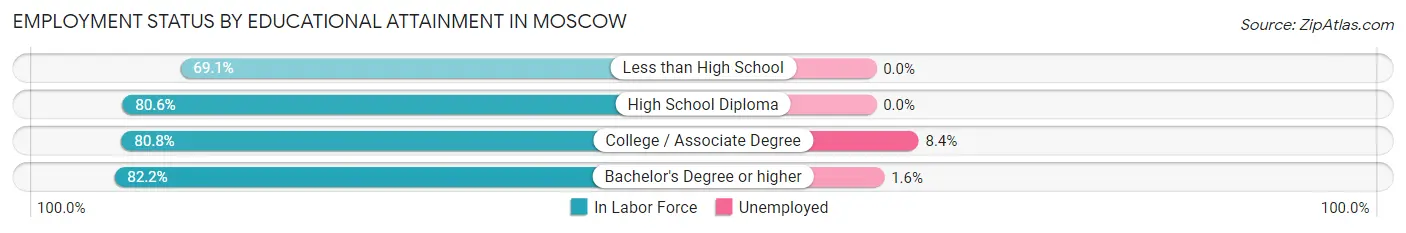
| Educational Attainment | In Labor Force | Unemployed |
| Less than High School | 150 (69.1%) | 0 (0.0%) |
| High School Diploma | 1,186 (80.6%) | 0 (0.0%) |
| College / Associate Degree | 2,493 (80.8%) | 259 (8.4%) |
| Bachelor's Degree or higher | 4,490 (82.2%) | 87 (1.6%) |
| Total | 8,322 (81.3%) | 348 (3.4%) |
Employment Occupations by Sex in Moscow
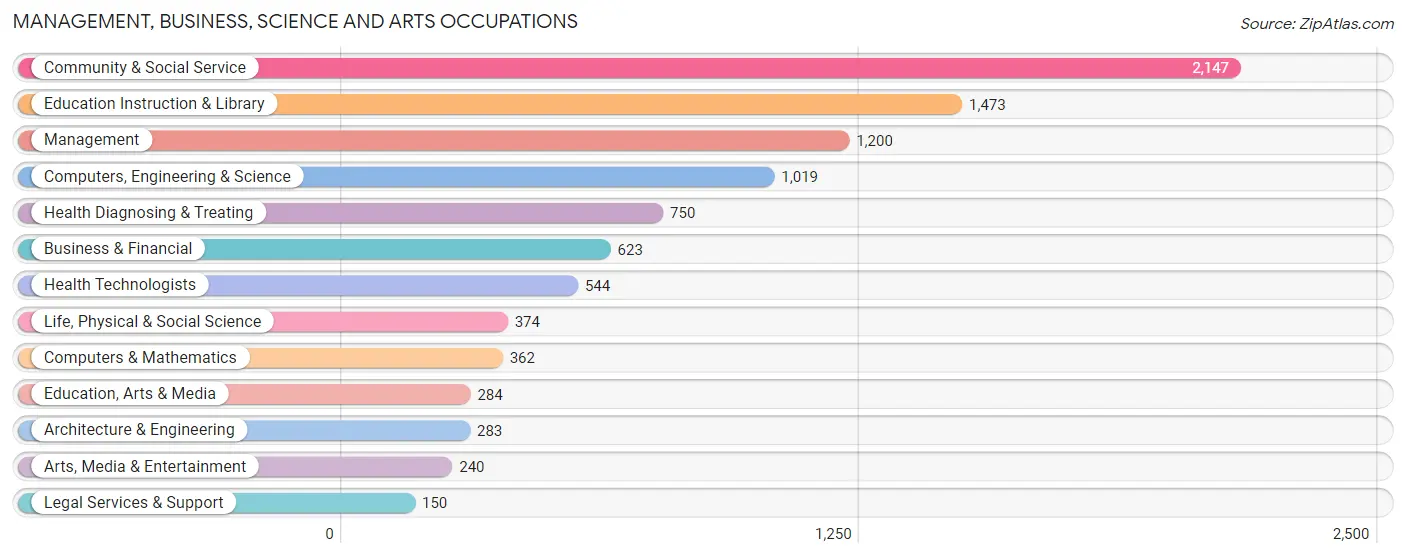
Management, Business, Science and Arts Occupations
The most common Management, Business, Science and Arts occupations in Moscow are Community & Social Service (2,147 | 16.4%), Education Instruction & Library (1,473 | 11.3%), Management (1,200 | 9.2%), Computers, Engineering & Science (1,019 | 7.8%), and Health Diagnosing & Treating (750 | 5.7%).
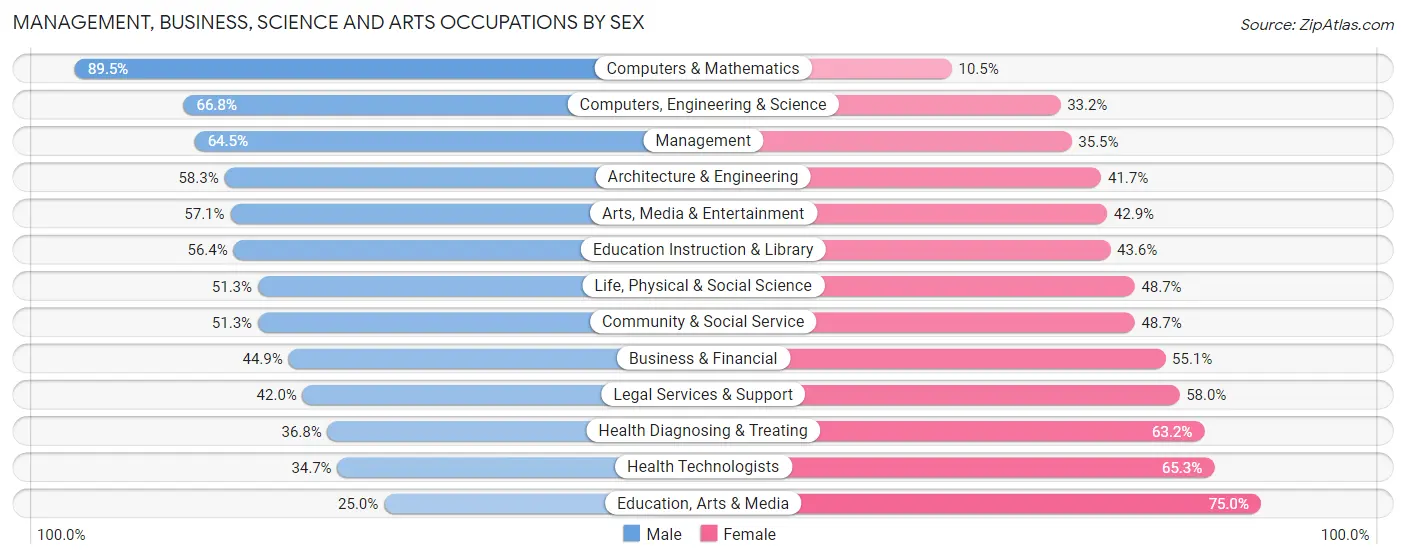
Management, Business, Science and Arts Occupations by Sex
Within the Management, Business, Science and Arts occupations in Moscow, the most male-oriented occupations are Computers & Mathematics (89.5%), Computers, Engineering & Science (66.8%), and Management (64.5%), while the most female-oriented occupations are Education, Arts & Media (75.0%), Health Technologists (65.3%), and Health Diagnosing & Treating (63.2%).
| Occupation | Male | Female |
| Management | 774 (64.5%) | 426 (35.5%) |
| Business & Financial | 280 (44.9%) | 343 (55.1%) |
| Computers, Engineering & Science | 681 (66.8%) | 338 (33.2%) |
| Computers & Mathematics | 324 (89.5%) | 38 (10.5%) |
| Architecture & Engineering | 165 (58.3%) | 118 (41.7%) |
| Life, Physical & Social Science | 192 (51.3%) | 182 (48.7%) |
| Community & Social Service | 1,102 (51.3%) | 1,045 (48.7%) |
| Education, Arts & Media | 71 (25.0%) | 213 (75.0%) |
| Legal Services & Support | 63 (42.0%) | 87 (58.0%) |
| Education Instruction & Library | 831 (56.4%) | 642 (43.6%) |
| Arts, Media & Entertainment | 137 (57.1%) | 103 (42.9%) |
| Health Diagnosing & Treating | 276 (36.8%) | 474 (63.2%) |
| Health Technologists | 189 (34.7%) | 355 (65.3%) |
| Total (Category) | 3,113 (54.2%) | 2,626 (45.8%) |
| Total (Overall) | 6,840 (52.2%) | 6,257 (47.8%) |
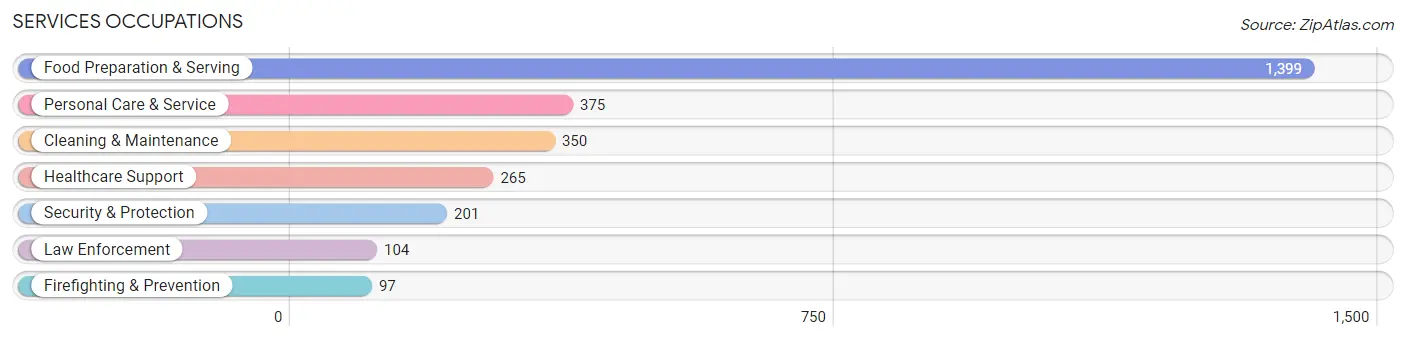
Services Occupations
The most common Services occupations in Moscow are Food Preparation & Serving (1,399 | 10.7%), Personal Care & Service (375 | 2.9%), Cleaning & Maintenance (350 | 2.7%), Healthcare Support (265 | 2.0%), and Security & Protection (201 | 1.5%).
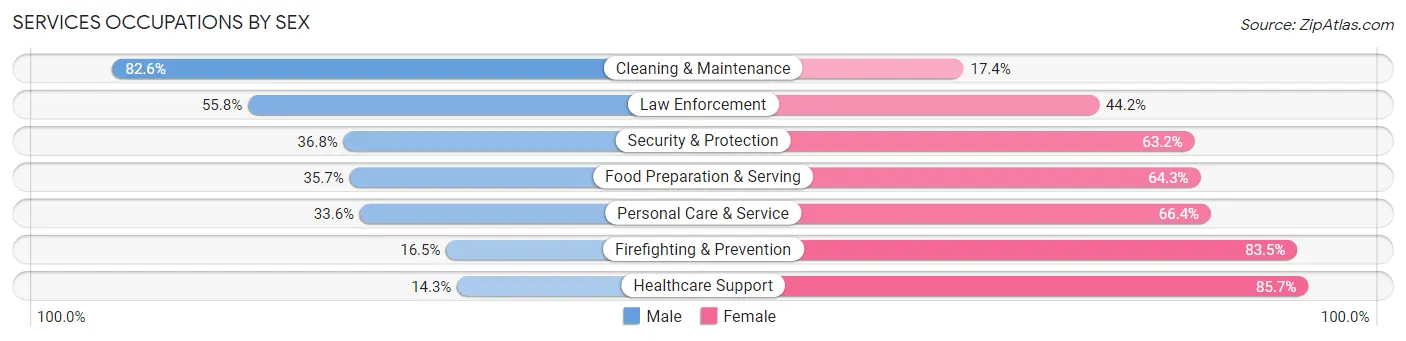
Services Occupations by Sex
Within the Services occupations in Moscow, the most male-oriented occupations are Cleaning & Maintenance (82.6%), Law Enforcement (55.8%), and Security & Protection (36.8%), while the most female-oriented occupations are Healthcare Support (85.7%), Firefighting & Prevention (83.5%), and Personal Care & Service (66.4%).
| Occupation | Male | Female |
| Healthcare Support | 38 (14.3%) | 227 (85.7%) |
| Security & Protection | 74 (36.8%) | 127 (63.2%) |
| Firefighting & Prevention | 16 (16.5%) | 81 (83.5%) |
| Law Enforcement | 58 (55.8%) | 46 (44.2%) |
| Food Preparation & Serving | 499 (35.7%) | 900 (64.3%) |
| Cleaning & Maintenance | 289 (82.6%) | 61 (17.4%) |
| Personal Care & Service | 126 (33.6%) | 249 (66.4%) |
| Total (Category) | 1,026 (39.6%) | 1,564 (60.4%) |
| Total (Overall) | 6,840 (52.2%) | 6,257 (47.8%) |
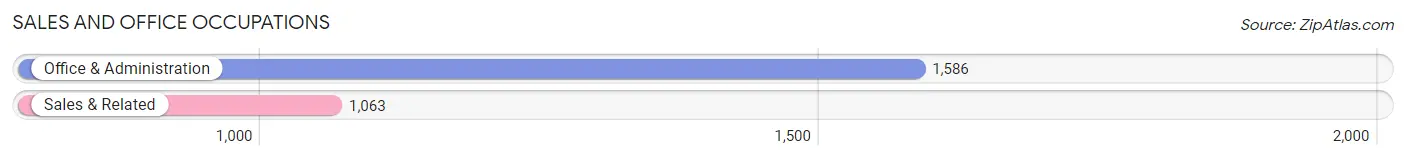
Sales and Office Occupations
The most common Sales and Office occupations in Moscow are Office & Administration (1,586 | 12.1%), and Sales & Related (1,063 | 8.1%).
Sales and Office Occupations by Sex
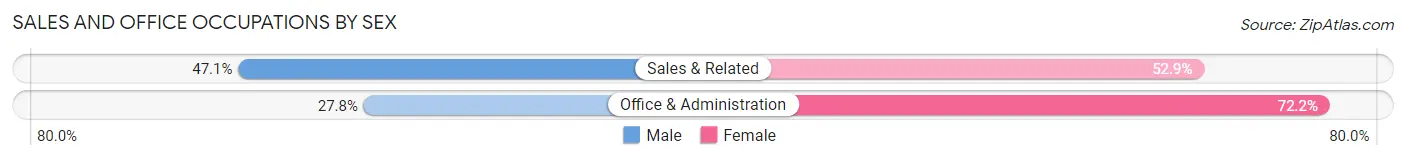
| Occupation | Male | Female |
| Sales & Related | 501 (47.1%) | 562 (52.9%) |
| Office & Administration | 441 (27.8%) | 1,145 (72.2%) |
| Total (Category) | 942 (35.6%) | 1,707 (64.4%) |
| Total (Overall) | 6,840 (52.2%) | 6,257 (47.8%) |
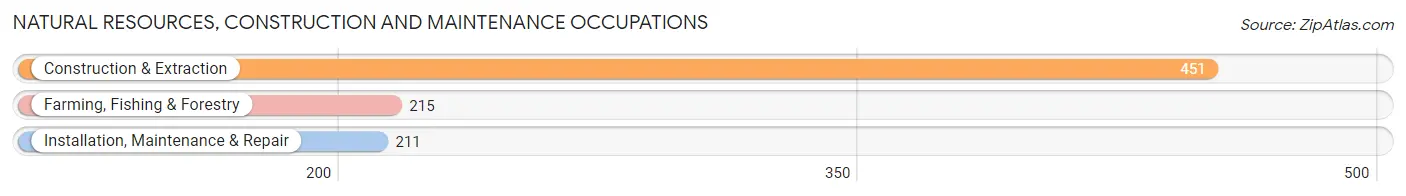
Natural Resources, Construction and Maintenance Occupations
The most common Natural Resources, Construction and Maintenance occupations in Moscow are Construction & Extraction (451 | 3.4%), Farming, Fishing & Forestry (215 | 1.6%), and Installation, Maintenance & Repair (211 | 1.6%).
Natural Resources, Construction and Maintenance Occupations by Sex
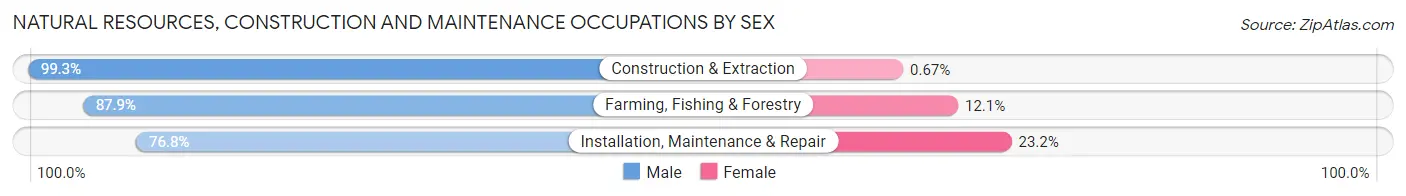
| Occupation | Male | Female |
| Farming, Fishing & Forestry | 189 (87.9%) | 26 (12.1%) |
| Construction & Extraction | 448 (99.3%) | 3 (0.7%) |
| Installation, Maintenance & Repair | 162 (76.8%) | 49 (23.2%) |
| Total (Category) | 799 (91.1%) | 78 (8.9%) |
| Total (Overall) | 6,840 (52.2%) | 6,257 (47.8%) |
Production, Transportation and Moving Occupations
The most common Production, Transportation and Moving occupations in Moscow are Material Moving (540 | 4.1%), Production (536 | 4.1%), and Transportation (166 | 1.3%).
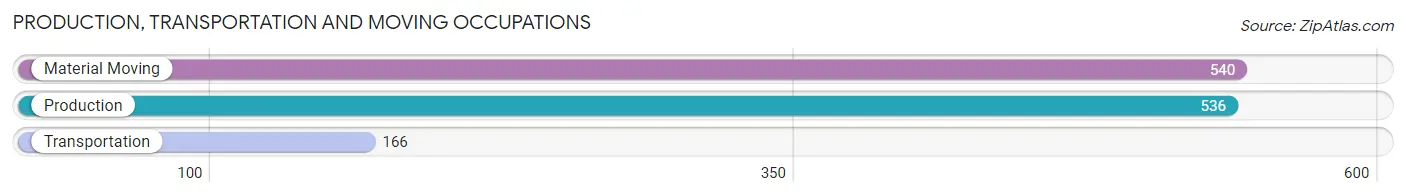
Production, Transportation and Moving Occupations by Sex
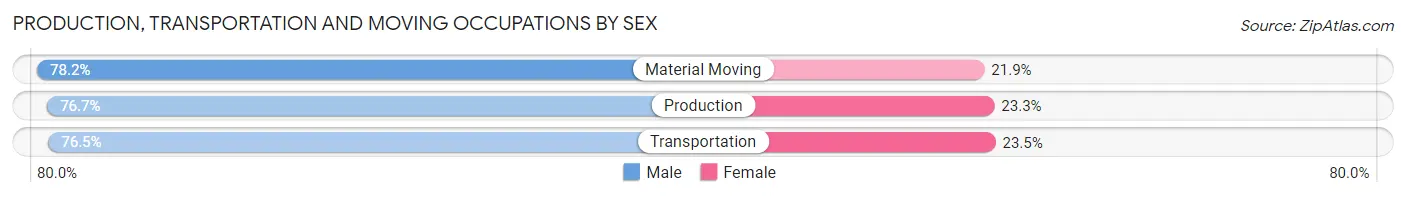
| Occupation | Male | Female |
| Production | 411 (76.7%) | 125 (23.3%) |
| Transportation | 127 (76.5%) | 39 (23.5%) |
| Material Moving | 422 (78.1%) | 118 (21.8%) |
| Total (Category) | 960 (77.3%) | 282 (22.7%) |
| Total (Overall) | 6,840 (52.2%) | 6,257 (47.8%) |
Employment Industries by Sex in Moscow
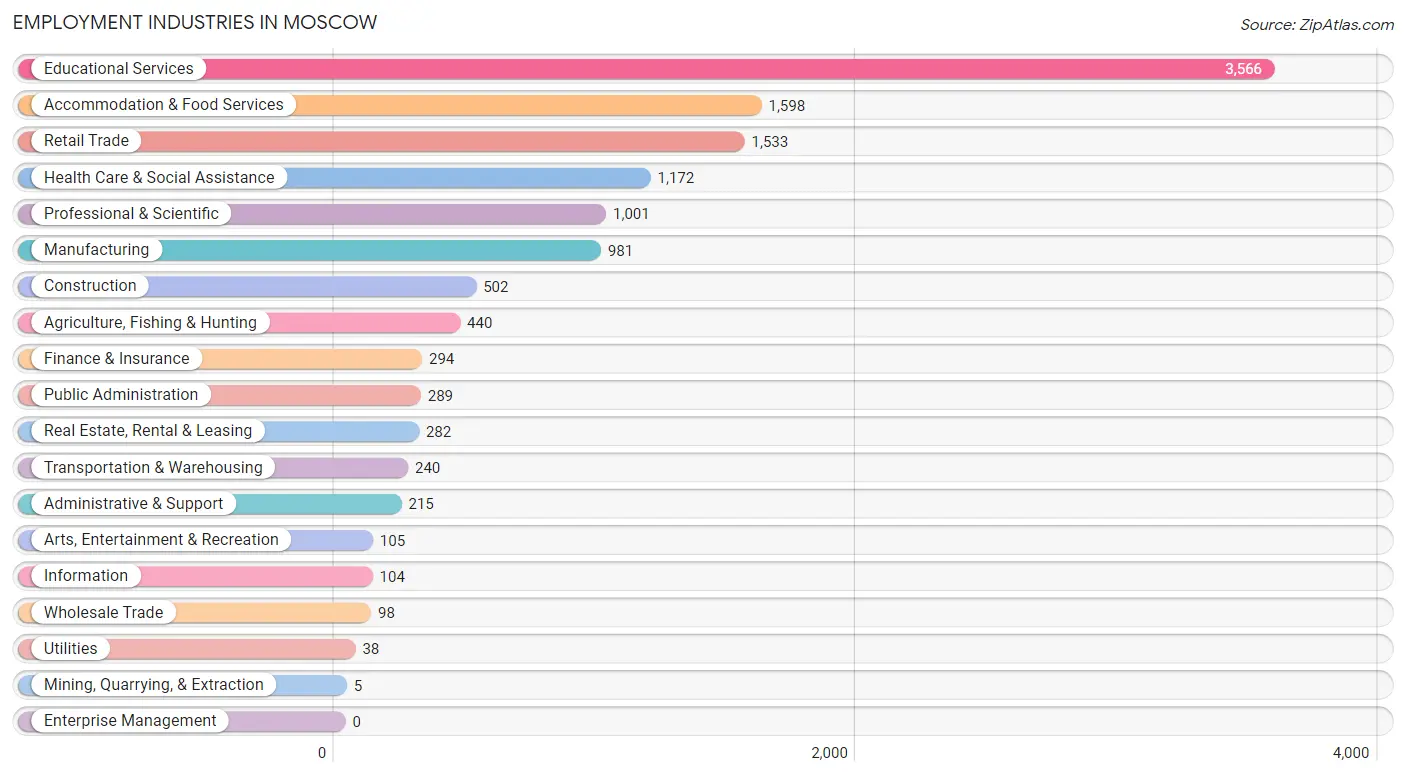
Employment Industries in Moscow
The major employment industries in Moscow include Educational Services (3,566 | 27.2%), Accommodation & Food Services (1,598 | 12.2%), Retail Trade (1,533 | 11.7%), Health Care & Social Assistance (1,172 | 8.9%), and Professional & Scientific (1,001 | 7.6%).
Employment Industries by Sex in Moscow
The Moscow industries that see more men than women are Utilities (100.0%), Construction (88.6%), and Wholesale Trade (87.8%), whereas the industries that tend to have a higher number of women are Mining, Quarrying, & Extraction (100.0%), Arts, Entertainment & Recreation (74.3%), and Health Care & Social Assistance (72.9%).
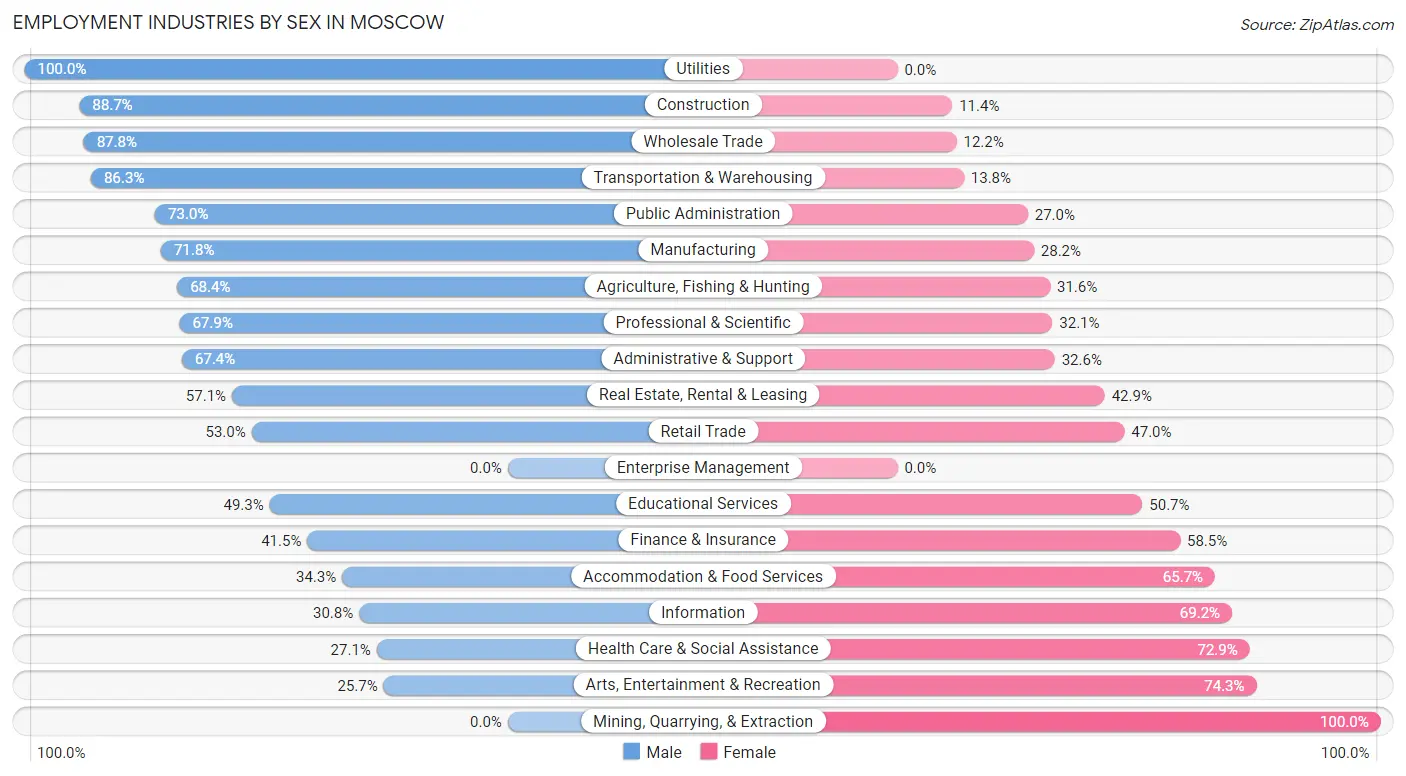
| Industry | Male | Female |
| Agriculture, Fishing & Hunting | 301 (68.4%) | 139 (31.6%) |
| Mining, Quarrying, & Extraction | 0 (0.0%) | 5 (100.0%) |
| Construction | 445 (88.6%) | 57 (11.4%) |
| Manufacturing | 704 (71.8%) | 277 (28.2%) |
| Wholesale Trade | 86 (87.8%) | 12 (12.2%) |
| Retail Trade | 813 (53.0%) | 720 (47.0%) |
| Transportation & Warehousing | 207 (86.3%) | 33 (13.8%) |
| Utilities | 38 (100.0%) | 0 (0.0%) |
| Information | 32 (30.8%) | 72 (69.2%) |
| Finance & Insurance | 122 (41.5%) | 172 (58.5%) |
| Real Estate, Rental & Leasing | 161 (57.1%) | 121 (42.9%) |
| Professional & Scientific | 680 (67.9%) | 321 (32.1%) |
| Enterprise Management | 0 (0.0%) | 0 (0.0%) |
| Administrative & Support | 145 (67.4%) | 70 (32.6%) |
| Educational Services | 1,758 (49.3%) | 1,808 (50.7%) |
| Health Care & Social Assistance | 318 (27.1%) | 854 (72.9%) |
| Arts, Entertainment & Recreation | 27 (25.7%) | 78 (74.3%) |
| Accommodation & Food Services | 548 (34.3%) | 1,050 (65.7%) |
| Public Administration | 211 (73.0%) | 78 (27.0%) |
| Total | 6,840 (52.2%) | 6,257 (47.8%) |
Education in Moscow
School Enrollment in Moscow
The most common levels of schooling among the 12,814 students in Moscow are college / undergraduate (8,469 | 66.1%), graduate / professional (1,200 | 9.4%), and elementary school (990 | 7.7%).
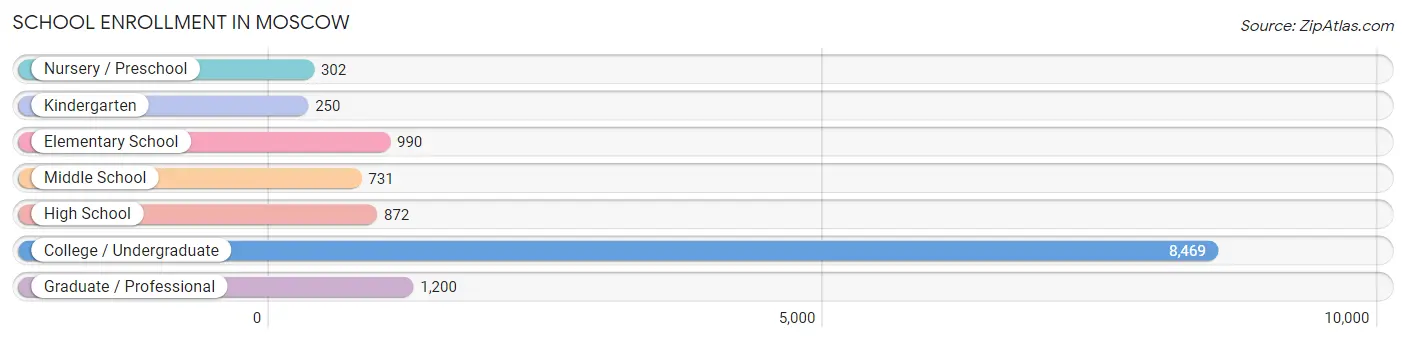
| School Level | # Students | % Students |
| Nursery / Preschool | 302 | 2.4% |
| Kindergarten | 250 | 1.9% |
| Elementary School | 990 | 7.7% |
| Middle School | 731 | 5.7% |
| High School | 872 | 6.8% |
| College / Undergraduate | 8,469 | 66.1% |
| Graduate / Professional | 1,200 | 9.4% |
| Total | 12,814 | 100.0% |
School Enrollment by Age by Funding Source in Moscow
Out of a total of 12,814 students who are enrolled in schools in Moscow, 692 (5.4%) attend a private institution, while the remaining 12,122 (94.6%) are enrolled in public schools. The age group of 3 to 4 year olds has the highest likelihood of being enrolled in private schools, with 159 (61.6% in the age bracket) enrolled. Conversely, the age group of 18 to 19 year olds has the lowest likelihood of being enrolled in a private school, with 3,588 (98.7% in the age bracket) attending a public institution.
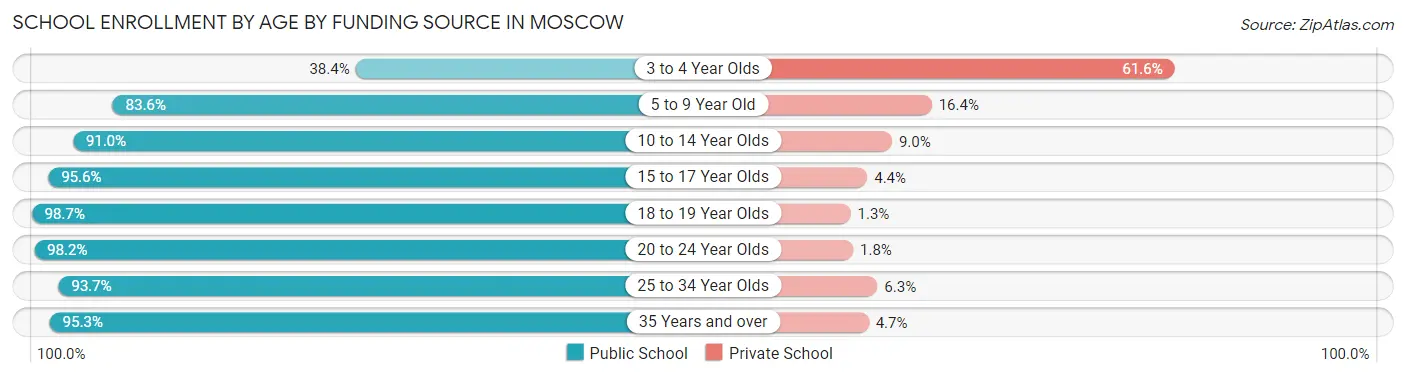
| Age Bracket | Public School | Private School |
| 3 to 4 Year Olds | 99 (38.4%) | 159 (61.6%) |
| 5 to 9 Year Old | 943 (83.6%) | 185 (16.4%) |
| 10 to 14 Year Olds | 952 (91.0%) | 94 (9.0%) |
| 15 to 17 Year Olds | 738 (95.6%) | 34 (4.4%) |
| 18 to 19 Year Olds | 3,588 (98.7%) | 47 (1.3%) |
| 20 to 24 Year Olds | 4,287 (98.2%) | 77 (1.8%) |
| 25 to 34 Year Olds | 1,269 (93.7%) | 85 (6.3%) |
| 35 Years and over | 245 (95.3%) | 12 (4.7%) |
| Total | 12,122 (94.6%) | 692 (5.4%) |
Educational Attainment by Field of Study in Moscow
Bio, nature & agricultural (1,207 | 16.1%), business (954 | 12.7%), education (788 | 10.5%), social sciences (584 | 7.8%), and science & technology (467 | 6.2%) are the most common fields of study among 7,491 individuals in Moscow who have obtained a bachelor's degree or higher.
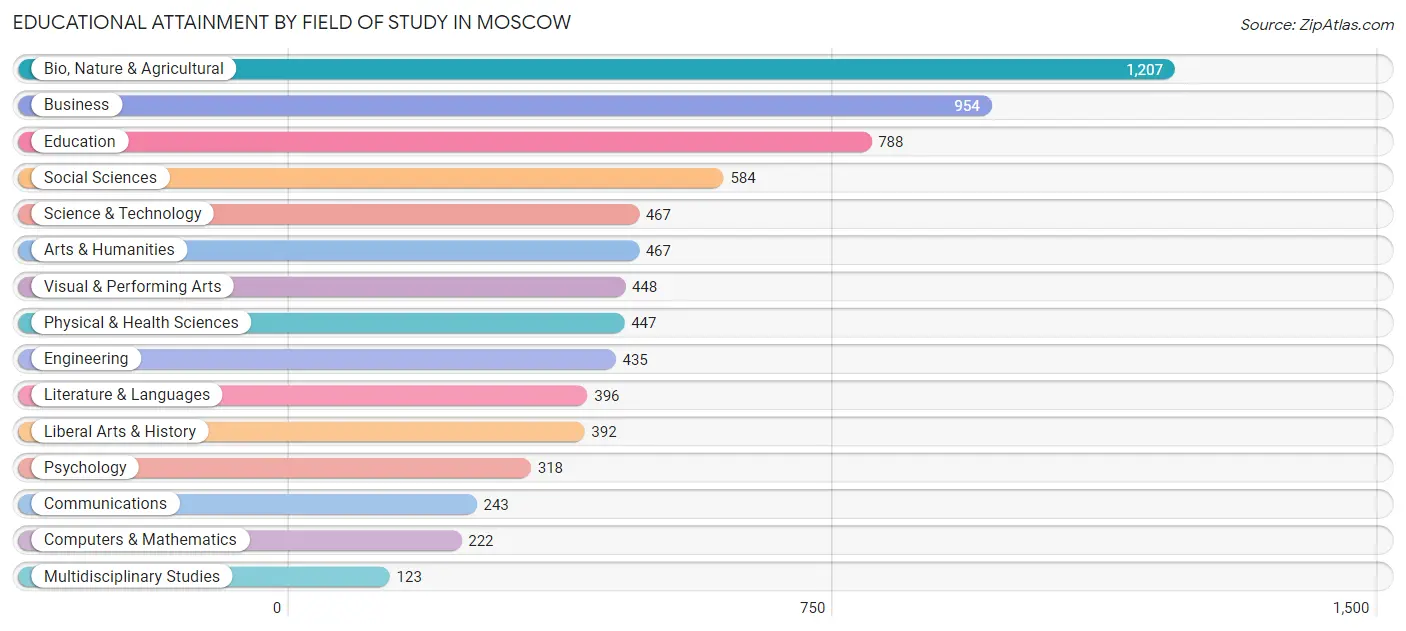
| Field of Study | # Graduates | % Graduates |
| Computers & Mathematics | 222 | 3.0% |
| Bio, Nature & Agricultural | 1,207 | 16.1% |
| Physical & Health Sciences | 447 | 6.0% |
| Psychology | 318 | 4.3% |
| Social Sciences | 584 | 7.8% |
| Engineering | 435 | 5.8% |
| Multidisciplinary Studies | 123 | 1.6% |
| Science & Technology | 467 | 6.2% |
| Business | 954 | 12.7% |
| Education | 788 | 10.5% |
| Literature & Languages | 396 | 5.3% |
| Liberal Arts & History | 392 | 5.2% |
| Visual & Performing Arts | 448 | 6.0% |
| Communications | 243 | 3.2% |
| Arts & Humanities | 467 | 6.2% |
| Total | 7,491 | 100.0% |
Transportation & Commute in Moscow
Vehicle Availability by Sex in Moscow
The most prevalent vehicle ownership categories in Moscow are males with 2 vehicles (2,201, accounting for 36.2%) and females with 2 vehicles (1,966, making up 46.4%).
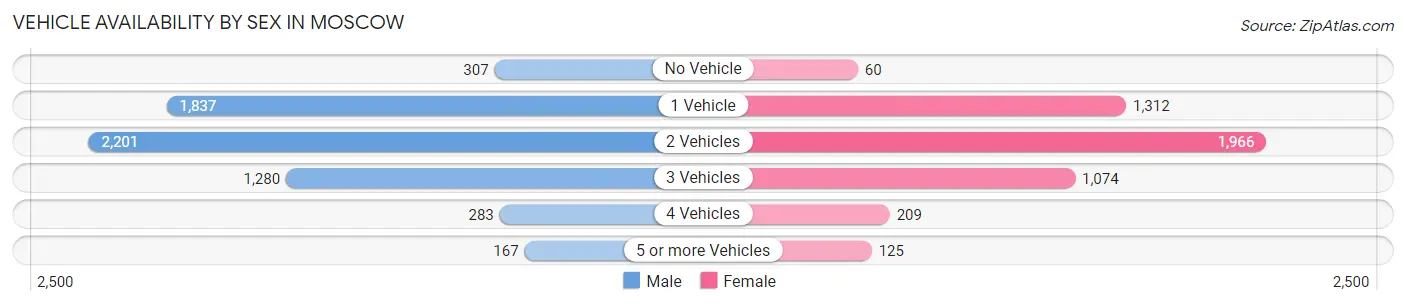
| Vehicles Available | Male | Female |
| No Vehicle | 307 (5.1%) | 60 (1.3%) |
| 1 Vehicle | 1,837 (30.2%) | 1,312 (27.6%) |
| 2 Vehicles | 2,201 (36.2%) | 1,966 (41.4%) |
| 3 Vehicles | 1,280 (21.1%) | 1,074 (22.6%) |
| 4 Vehicles | 283 (4.7%) | 209 (4.4%) |
| 5 or more Vehicles | 167 (2.8%) | 125 (2.6%) |
| Total | 6,075 (100.0%) | 4,746 (100.0%) |
Commute Time in Moscow
The most frequently occuring commute durations in Moscow are 5 to 9 minutes (3,902 commuters, 33.6%), 10 to 14 minutes (2,344 commuters, 20.2%), and 15 to 19 minutes (1,340 commuters, 11.5%).
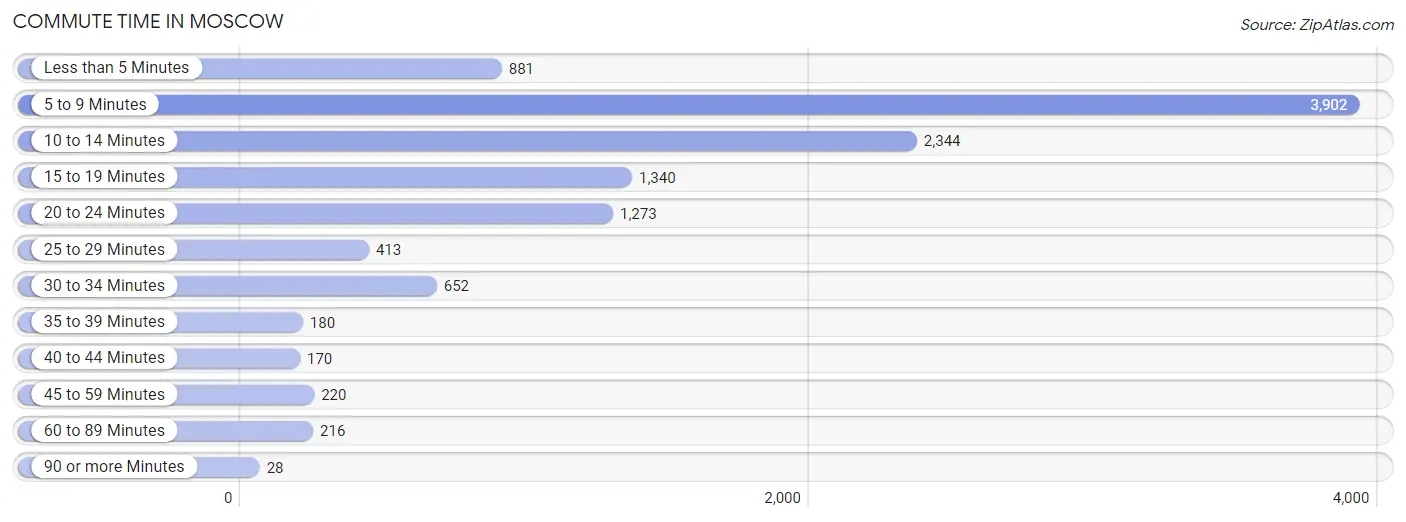
| Commute Time | # Commuters | % Commuters |
| Less than 5 Minutes | 881 | 7.6% |
| 5 to 9 Minutes | 3,902 | 33.6% |
| 10 to 14 Minutes | 2,344 | 20.2% |
| 15 to 19 Minutes | 1,340 | 11.5% |
| 20 to 24 Minutes | 1,273 | 11.0% |
| 25 to 29 Minutes | 413 | 3.5% |
| 30 to 34 Minutes | 652 | 5.6% |
| 35 to 39 Minutes | 180 | 1.5% |
| 40 to 44 Minutes | 170 | 1.5% |
| 45 to 59 Minutes | 220 | 1.9% |
| 60 to 89 Minutes | 216 | 1.9% |
| 90 or more Minutes | 28 | 0.2% |
Commute Time by Sex in Moscow
The most common commute times in Moscow are 5 to 9 minutes (1,814 commuters, 29.4%) for males and 5 to 9 minutes (2,088 commuters, 38.4%) for females.
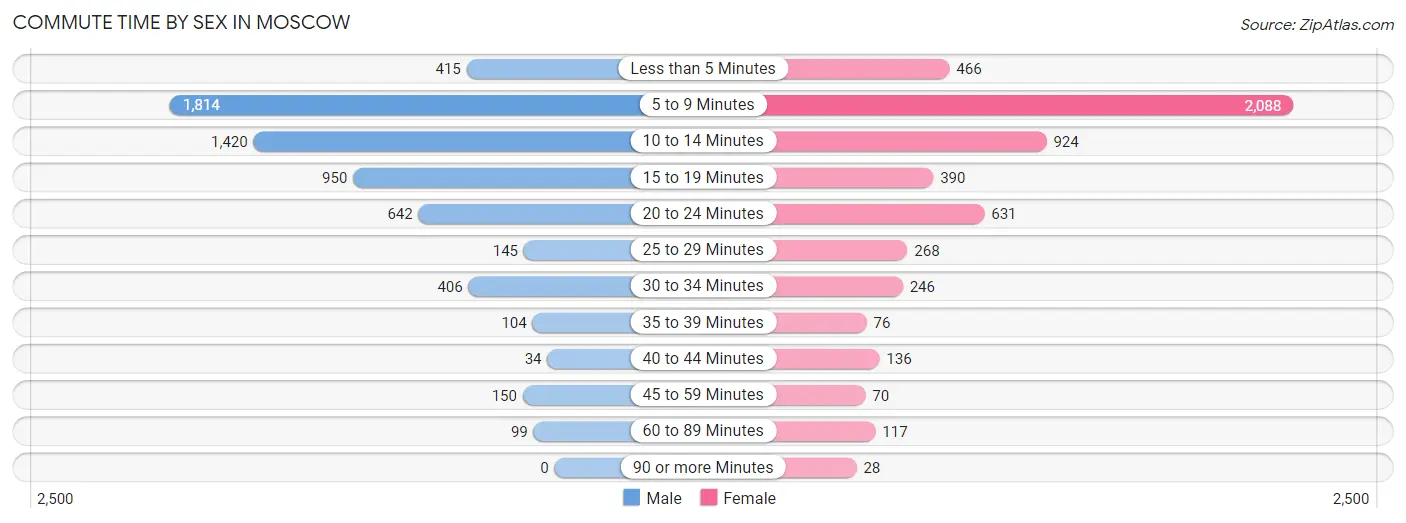
| Commute Time | Male | Female |
| Less than 5 Minutes | 415 (6.7%) | 466 (8.6%) |
| 5 to 9 Minutes | 1,814 (29.4%) | 2,088 (38.4%) |
| 10 to 14 Minutes | 1,420 (23.0%) | 924 (17.0%) |
| 15 to 19 Minutes | 950 (15.4%) | 390 (7.2%) |
| 20 to 24 Minutes | 642 (10.4%) | 631 (11.6%) |
| 25 to 29 Minutes | 145 (2.4%) | 268 (4.9%) |
| 30 to 34 Minutes | 406 (6.6%) | 246 (4.5%) |
| 35 to 39 Minutes | 104 (1.7%) | 76 (1.4%) |
| 40 to 44 Minutes | 34 (0.5%) | 136 (2.5%) |
| 45 to 59 Minutes | 150 (2.4%) | 70 (1.3%) |
| 60 to 89 Minutes | 99 (1.6%) | 117 (2.1%) |
| 90 or more Minutes | 0 (0.0%) | 28 (0.5%) |
Time of Departure to Work by Sex in Moscow
The most frequent times of departure to work in Moscow are 8:00 AM to 8:29 AM (903, 14.6%) for males and 12:00 PM to 3:59 PM (856, 15.7%) for females.
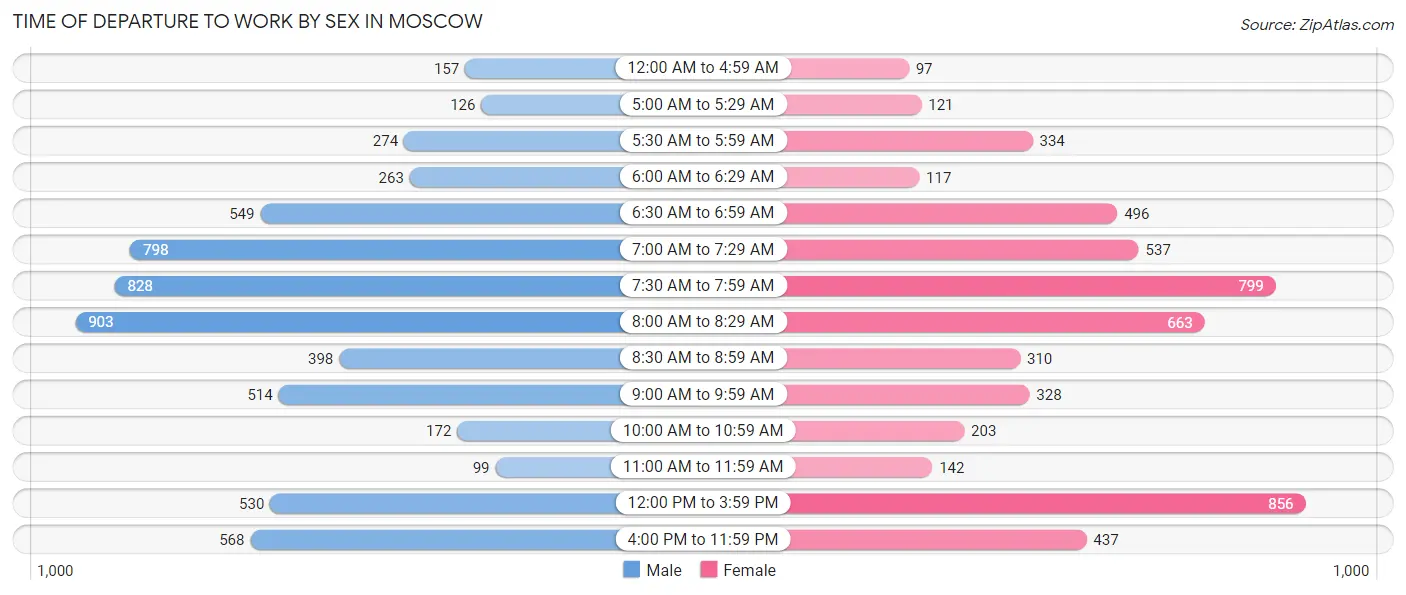
| Time of Departure | Male | Female |
| 12:00 AM to 4:59 AM | 157 (2.5%) | 97 (1.8%) |
| 5:00 AM to 5:29 AM | 126 (2.0%) | 121 (2.2%) |
| 5:30 AM to 5:59 AM | 274 (4.4%) | 334 (6.1%) |
| 6:00 AM to 6:29 AM | 263 (4.3%) | 117 (2.1%) |
| 6:30 AM to 6:59 AM | 549 (8.9%) | 496 (9.1%) |
| 7:00 AM to 7:29 AM | 798 (12.9%) | 537 (9.9%) |
| 7:30 AM to 7:59 AM | 828 (13.4%) | 799 (14.7%) |
| 8:00 AM to 8:29 AM | 903 (14.6%) | 663 (12.2%) |
| 8:30 AM to 8:59 AM | 398 (6.4%) | 310 (5.7%) |
| 9:00 AM to 9:59 AM | 514 (8.3%) | 328 (6.0%) |
| 10:00 AM to 10:59 AM | 172 (2.8%) | 203 (3.7%) |
| 11:00 AM to 11:59 AM | 99 (1.6%) | 142 (2.6%) |
| 12:00 PM to 3:59 PM | 530 (8.6%) | 856 (15.7%) |
| 4:00 PM to 11:59 PM | 568 (9.2%) | 437 (8.0%) |
| Total | 6,179 (100.0%) | 5,440 (100.0%) |
Housing Occupancy in Moscow
Occupancy by Ownership in Moscow
Of the total 9,751 dwellings in Moscow, owner-occupied units account for 4,036 (41.4%), while renter-occupied units make up 5,715 (58.6%).
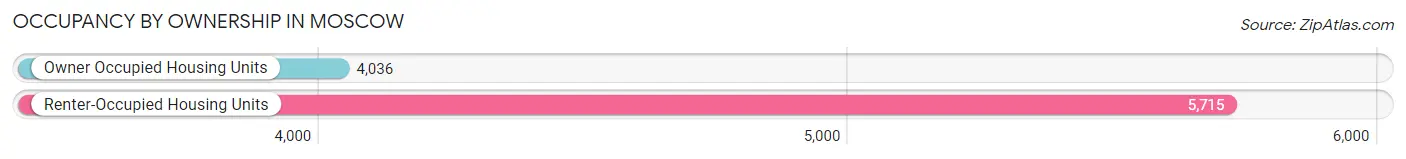
| Occupancy | # Housing Units | % Housing Units |
| Owner Occupied Housing Units | 4,036 | 41.4% |
| Renter-Occupied Housing Units | 5,715 | 58.6% |
| Total Occupied Housing Units | 9,751 | 100.0% |
Occupancy by Household Size in Moscow
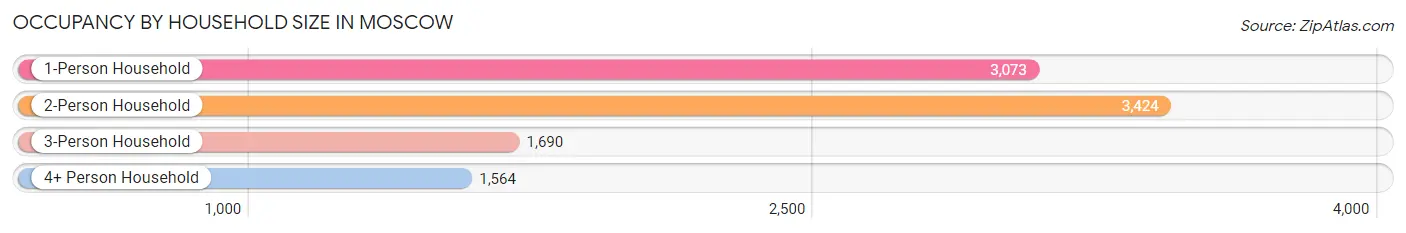
| Household Size | # Housing Units | % Housing Units |
| 1-Person Household | 3,073 | 31.5% |
| 2-Person Household | 3,424 | 35.1% |
| 3-Person Household | 1,690 | 17.3% |
| 4+ Person Household | 1,564 | 16.0% |
| Total Housing Units | 9,751 | 100.0% |
Occupancy by Ownership by Household Size in Moscow
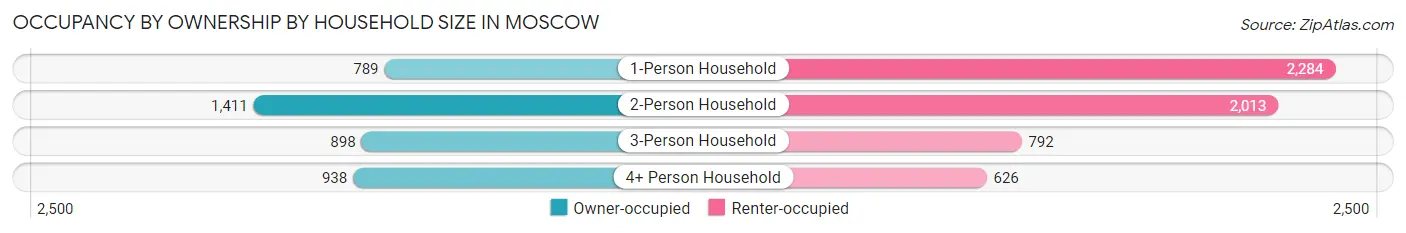
| Household Size | Owner-occupied | Renter-occupied |
| 1-Person Household | 789 (25.7%) | 2,284 (74.3%) |
| 2-Person Household | 1,411 (41.2%) | 2,013 (58.8%) |
| 3-Person Household | 898 (53.1%) | 792 (46.9%) |
| 4+ Person Household | 938 (60.0%) | 626 (40.0%) |
| Total Housing Units | 4,036 (41.4%) | 5,715 (58.6%) |
Occupancy by Educational Attainment in Moscow
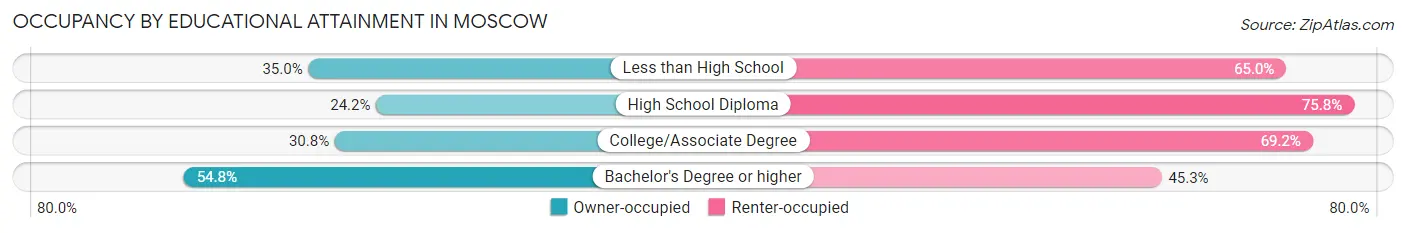
| Household Size | Owner-occupied | Renter-occupied |
| Less than High School | 50 (35.0%) | 93 (65.0%) |
| High School Diploma | 373 (24.2%) | 1,167 (75.8%) |
| College/Associate Degree | 1,032 (30.8%) | 2,322 (69.2%) |
| Bachelor's Degree or higher | 2,581 (54.7%) | 2,133 (45.3%) |
Occupancy by Age of Householder in Moscow
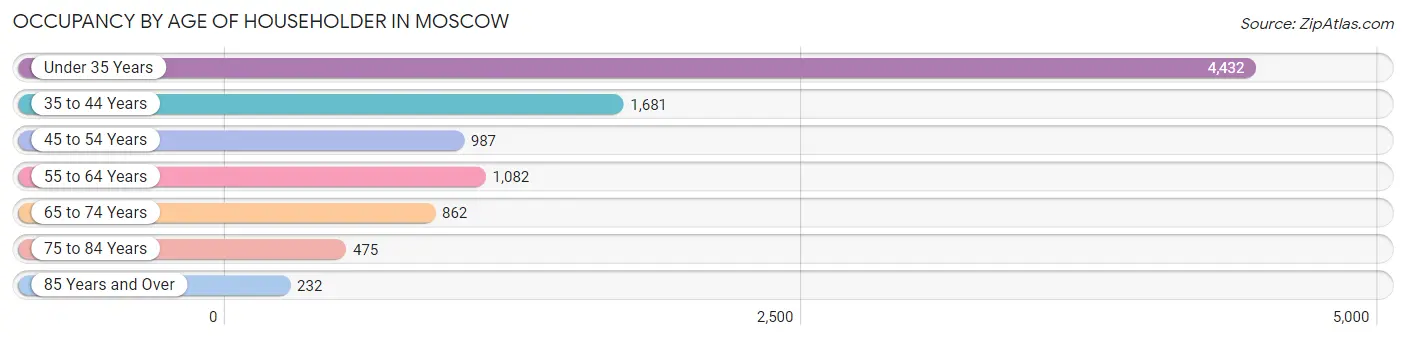
| Age Bracket | # Households | % Households |
| Under 35 Years | 4,432 | 45.5% |
| 35 to 44 Years | 1,681 | 17.2% |
| 45 to 54 Years | 987 | 10.1% |
| 55 to 64 Years | 1,082 | 11.1% |
| 65 to 74 Years | 862 | 8.8% |
| 75 to 84 Years | 475 | 4.9% |
| 85 Years and Over | 232 | 2.4% |
| Total | 9,751 | 100.0% |
Housing Finances in Moscow
Median Income by Occupancy in Moscow
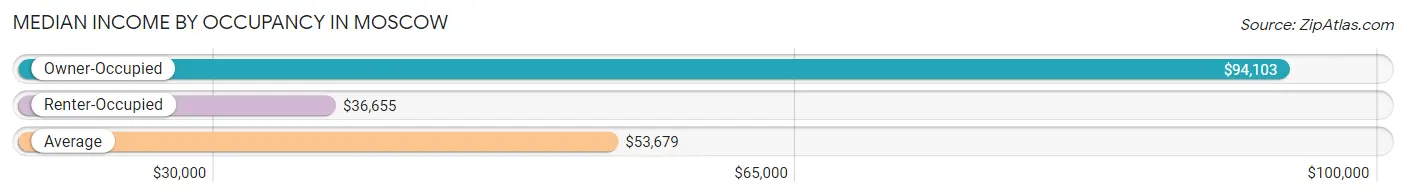
| Occupancy Type | # Households | Median Income |
| Owner-Occupied | 4,036 (41.4%) | $94,103 |
| Renter-Occupied | 5,715 (58.6%) | $36,655 |
| Average | 9,751 (100.0%) | $53,679 |
Occupancy by Householder Income Bracket in Moscow
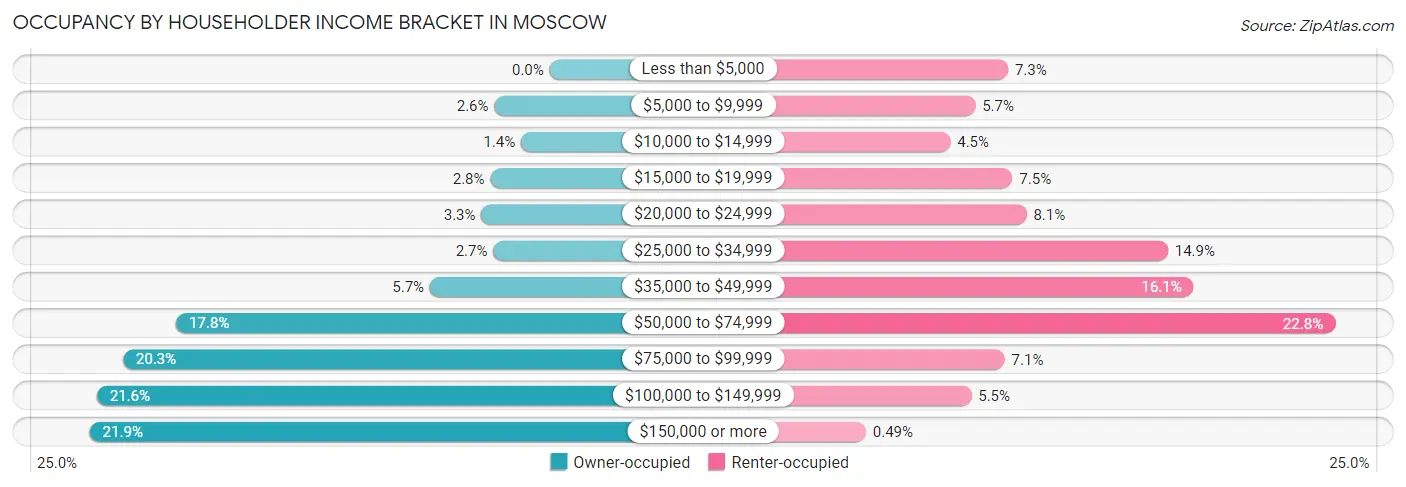
| Income Bracket | Owner-occupied | Renter-occupied |
| Less than $5,000 | 0 (0.0%) | 415 (7.3%) |
| $5,000 to $9,999 | 106 (2.6%) | 326 (5.7%) |
| $10,000 to $14,999 | 55 (1.4%) | 258 (4.5%) |
| $15,000 to $19,999 | 114 (2.8%) | 427 (7.5%) |
| $20,000 to $24,999 | 131 (3.3%) | 465 (8.1%) |
| $25,000 to $34,999 | 108 (2.7%) | 850 (14.9%) |
| $35,000 to $49,999 | 230 (5.7%) | 920 (16.1%) |
| $50,000 to $74,999 | 718 (17.8%) | 1,305 (22.8%) |
| $75,000 to $99,999 | 820 (20.3%) | 406 (7.1%) |
| $100,000 to $149,999 | 870 (21.6%) | 315 (5.5%) |
| $150,000 or more | 884 (21.9%) | 28 (0.5%) |
| Total | 4,036 (100.0%) | 5,715 (100.0%) |
Monthly Housing Cost Tiers in Moscow
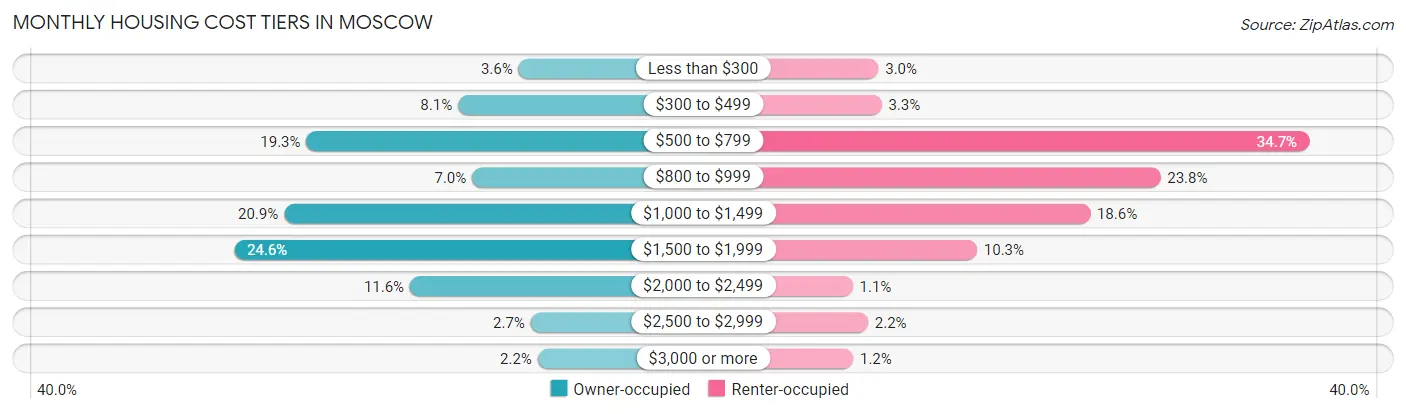
| Monthly Cost | Owner-occupied | Renter-occupied |
| Less than $300 | 146 (3.6%) | 172 (3.0%) |
| $300 to $499 | 326 (8.1%) | 186 (3.3%) |
| $500 to $799 | 777 (19.3%) | 1,984 (34.7%) |
| $800 to $999 | 284 (7.0%) | 1,359 (23.8%) |
| $1,000 to $1,499 | 843 (20.9%) | 1,063 (18.6%) |
| $1,500 to $1,999 | 992 (24.6%) | 587 (10.3%) |
| $2,000 to $2,499 | 469 (11.6%) | 64 (1.1%) |
| $2,500 to $2,999 | 110 (2.7%) | 128 (2.2%) |
| $3,000 or more | 89 (2.2%) | 66 (1.1%) |
| Total | 4,036 (100.0%) | 5,715 (100.0%) |
Physical Housing Characteristics in Moscow
Housing Structures in Moscow
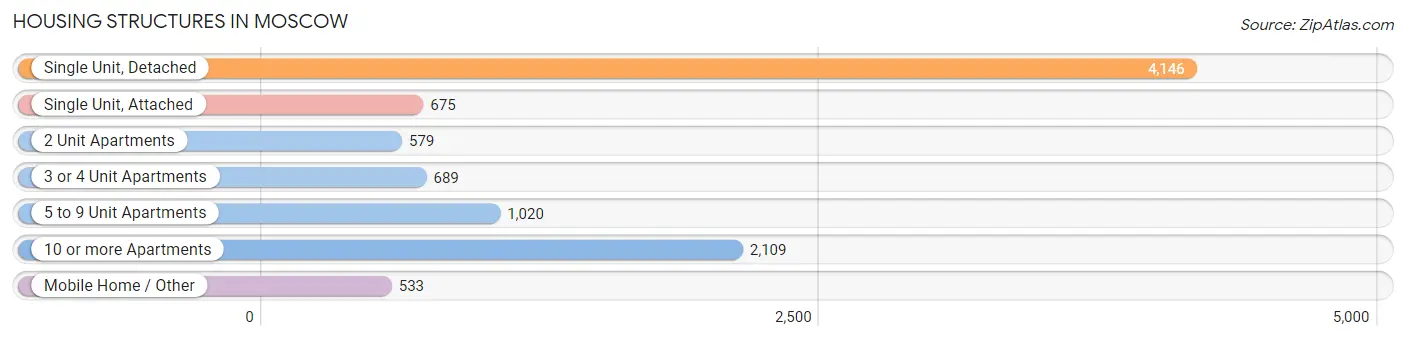
| Structure Type | # Housing Units | % Housing Units |
| Single Unit, Detached | 4,146 | 42.5% |
| Single Unit, Attached | 675 | 6.9% |
| 2 Unit Apartments | 579 | 5.9% |
| 3 or 4 Unit Apartments | 689 | 7.1% |
| 5 to 9 Unit Apartments | 1,020 | 10.5% |
| 10 or more Apartments | 2,109 | 21.6% |
| Mobile Home / Other | 533 | 5.5% |
| Total | 9,751 | 100.0% |
Housing Structures by Occupancy in Moscow
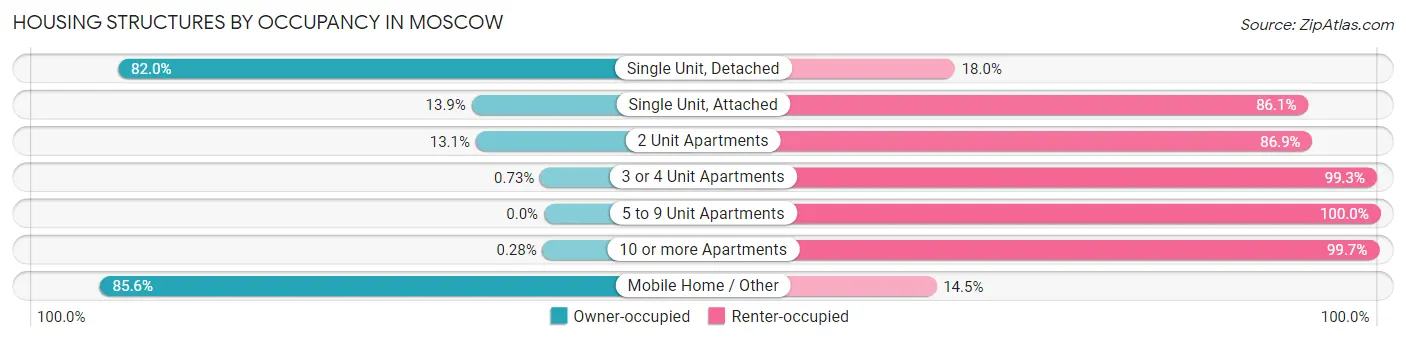
| Structure Type | Owner-occupied | Renter-occupied |
| Single Unit, Detached | 3,399 (82.0%) | 747 (18.0%) |
| Single Unit, Attached | 94 (13.9%) | 581 (86.1%) |
| 2 Unit Apartments | 76 (13.1%) | 503 (86.9%) |
| 3 or 4 Unit Apartments | 5 (0.7%) | 684 (99.3%) |
| 5 to 9 Unit Apartments | 0 (0.0%) | 1,020 (100.0%) |
| 10 or more Apartments | 6 (0.3%) | 2,103 (99.7%) |
| Mobile Home / Other | 456 (85.6%) | 77 (14.4%) |
| Total | 4,036 (41.4%) | 5,715 (58.6%) |
Housing Structures by Number of Rooms in Moscow
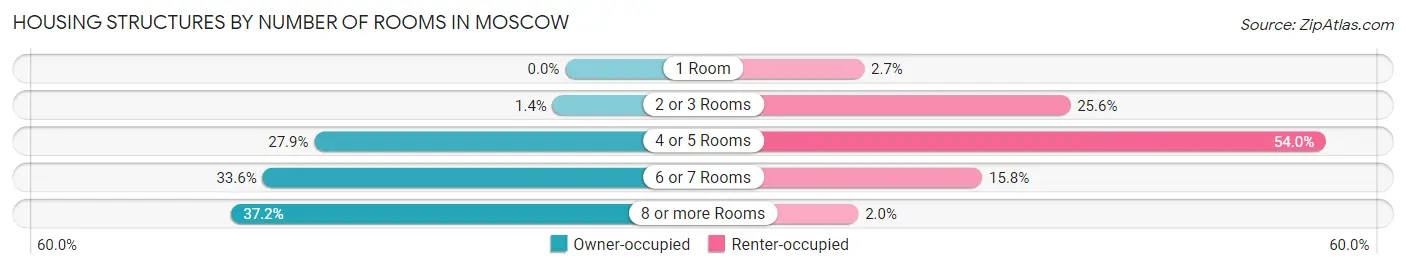
| Number of Rooms | Owner-occupied | Renter-occupied |
| 1 Room | 0 (0.0%) | 153 (2.7%) |
| 2 or 3 Rooms | 56 (1.4%) | 1,461 (25.6%) |
| 4 or 5 Rooms | 1,124 (27.9%) | 3,083 (53.9%) |
| 6 or 7 Rooms | 1,356 (33.6%) | 902 (15.8%) |
| 8 or more Rooms | 1,500 (37.2%) | 116 (2.0%) |
| Total | 4,036 (100.0%) | 5,715 (100.0%) |
Housing Structure by Heating Type in Moscow
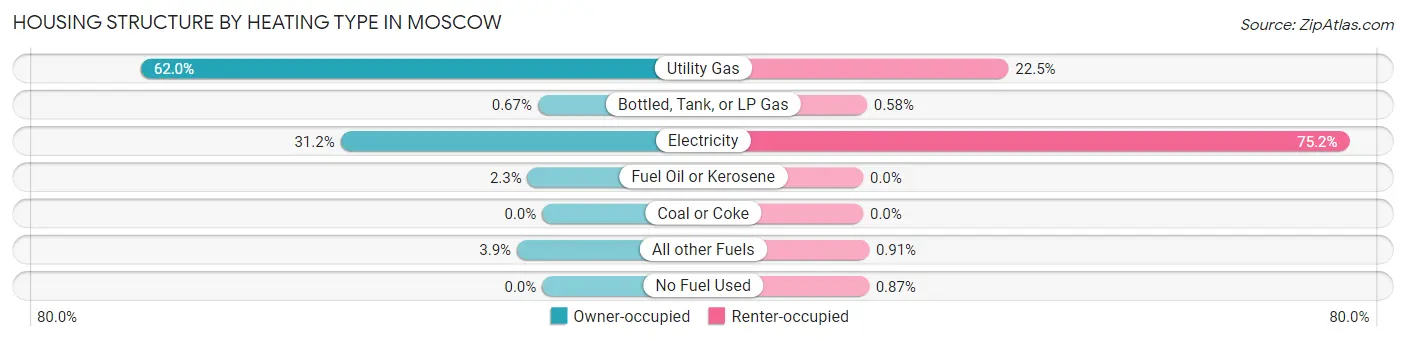
| Heating Type | Owner-occupied | Renter-occupied |
| Utility Gas | 2,503 (62.0%) | 1,284 (22.5%) |
| Bottled, Tank, or LP Gas | 27 (0.7%) | 33 (0.6%) |
| Electricity | 1,258 (31.2%) | 4,296 (75.2%) |
| Fuel Oil or Kerosene | 91 (2.2%) | 0 (0.0%) |
| Coal or Coke | 0 (0.0%) | 0 (0.0%) |
| All other Fuels | 157 (3.9%) | 52 (0.9%) |
| No Fuel Used | 0 (0.0%) | 50 (0.9%) |
| Total | 4,036 (100.0%) | 5,715 (100.0%) |
Household Vehicle Usage in Moscow
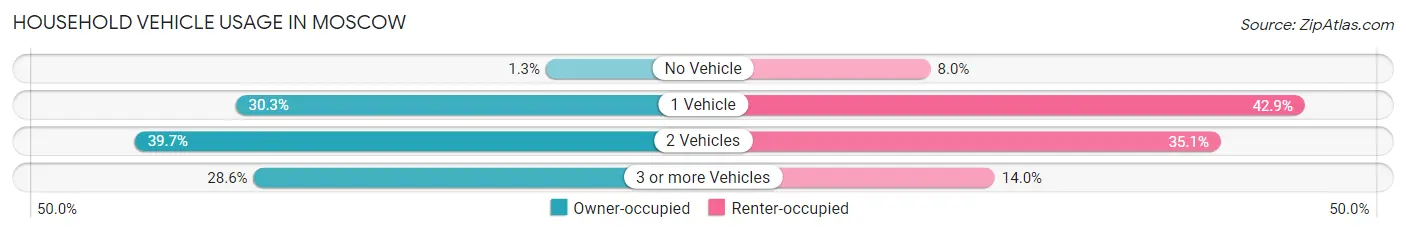
| Vehicles per Household | Owner-occupied | Renter-occupied |
| No Vehicle | 54 (1.3%) | 457 (8.0%) |
| 1 Vehicle | 1,223 (30.3%) | 2,453 (42.9%) |
| 2 Vehicles | 1,603 (39.7%) | 2,005 (35.1%) |
| 3 or more Vehicles | 1,156 (28.6%) | 800 (14.0%) |
| Total | 4,036 (100.0%) | 5,715 (100.0%) |
Real Estate & Mortgages in Moscow
Real Estate and Mortgage Overview in Moscow
| Characteristic | Without Mortgage | With Mortgage |
| Housing Units | 1,372 | 2,664 |
| Median Property Value | $278,000 | $328,100 |
| Median Household Income | $64,333 | $657 |
| Monthly Housing Costs | $556 | $89 |
| Real Estate Taxes | $2,264 | $20 |
Property Value by Mortgage Status in Moscow
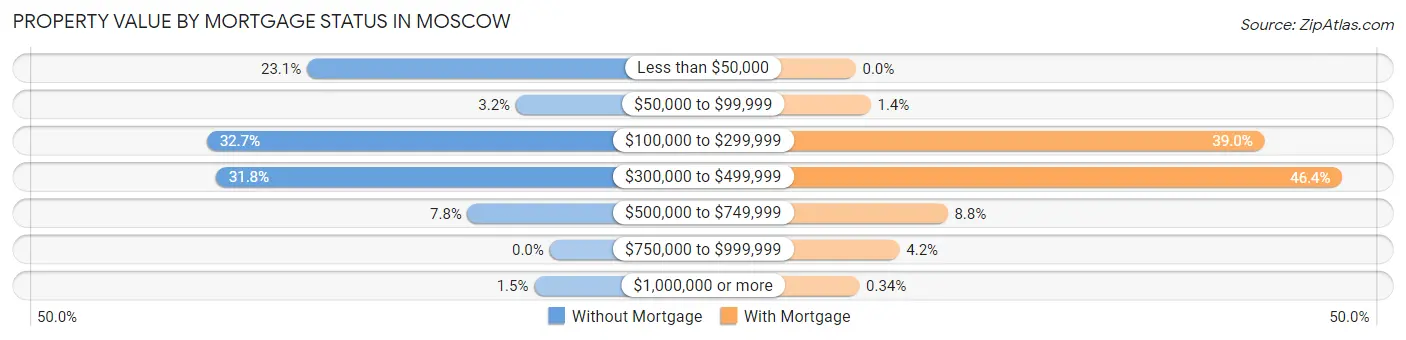
| Property Value | Without Mortgage | With Mortgage |
| Less than $50,000 | 317 (23.1%) | 0 (0.0%) |
| $50,000 to $99,999 | 44 (3.2%) | 38 (1.4%) |
| $100,000 to $299,999 | 448 (32.7%) | 1,038 (39.0%) |
| $300,000 to $499,999 | 436 (31.8%) | 1,235 (46.4%) |
| $500,000 to $749,999 | 107 (7.8%) | 233 (8.7%) |
| $750,000 to $999,999 | 0 (0.0%) | 111 (4.2%) |
| $1,000,000 or more | 20 (1.5%) | 9 (0.3%) |
| Total | 1,372 (100.0%) | 2,664 (100.0%) |
Household Income by Mortgage Status in Moscow
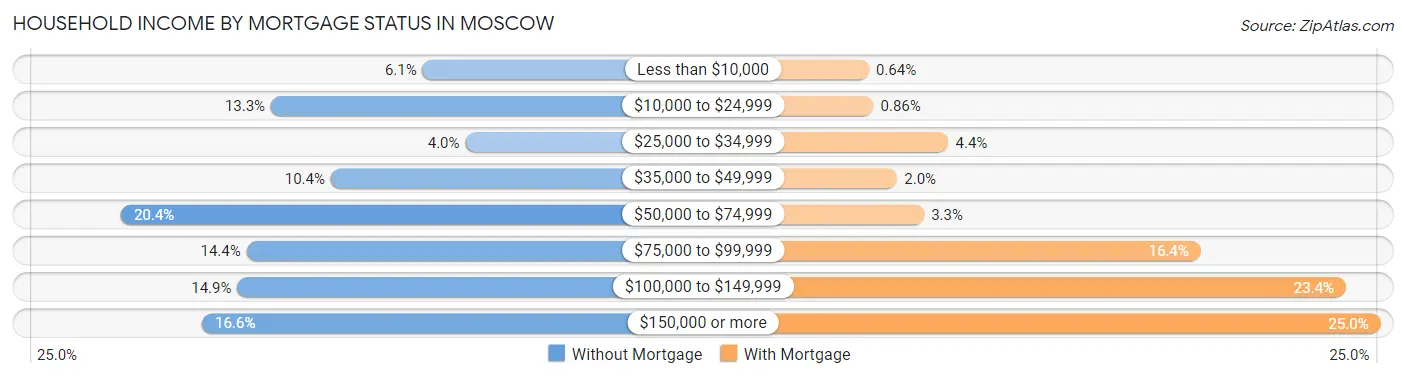
| Household Income | Without Mortgage | With Mortgage |
| Less than $10,000 | 83 (6.0%) | 17 (0.6%) |
| $10,000 to $24,999 | 182 (13.3%) | 23 (0.9%) |
| $25,000 to $34,999 | 55 (4.0%) | 118 (4.4%) |
| $35,000 to $49,999 | 143 (10.4%) | 53 (2.0%) |
| $50,000 to $74,999 | 280 (20.4%) | 87 (3.3%) |
| $75,000 to $99,999 | 198 (14.4%) | 438 (16.4%) |
| $100,000 to $149,999 | 204 (14.9%) | 622 (23.4%) |
| $150,000 or more | 227 (16.6%) | 666 (25.0%) |
| Total | 1,372 (100.0%) | 2,664 (100.0%) |
Property Value to Household Income Ratio in Moscow
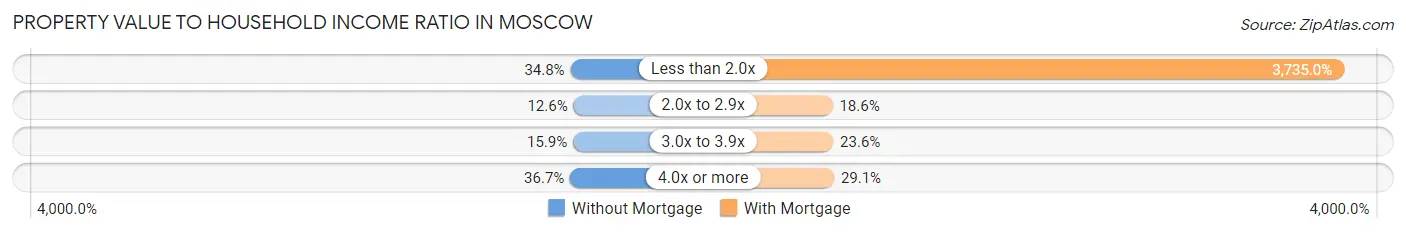
| Value-to-Income Ratio | Without Mortgage | With Mortgage |
| Less than 2.0x | 478 (34.8%) | 99,500 (3,735.0%) |
| 2.0x to 2.9x | 173 (12.6%) | 496 (18.6%) |
| 3.0x to 3.9x | 218 (15.9%) | 628 (23.6%) |
| 4.0x or more | 503 (36.7%) | 776 (29.1%) |
| Total | 1,372 (100.0%) | 2,664 (100.0%) |
Real Estate Taxes by Mortgage Status in Moscow
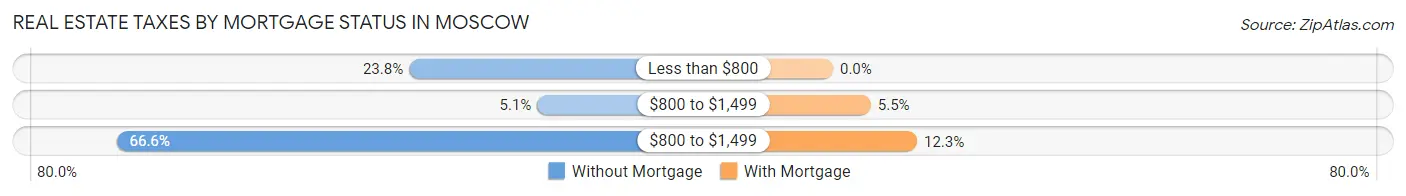
| Property Taxes | Without Mortgage | With Mortgage |
| Less than $800 | 327 (23.8%) | 0 (0.0%) |
| $800 to $1,499 | 70 (5.1%) | 147 (5.5%) |
| $800 to $1,499 | 913 (66.5%) | 327 (12.3%) |
| Total | 1,372 (100.0%) | 2,664 (100.0%) |
Health & Disability in Moscow
Health Insurance Coverage by Age in Moscow
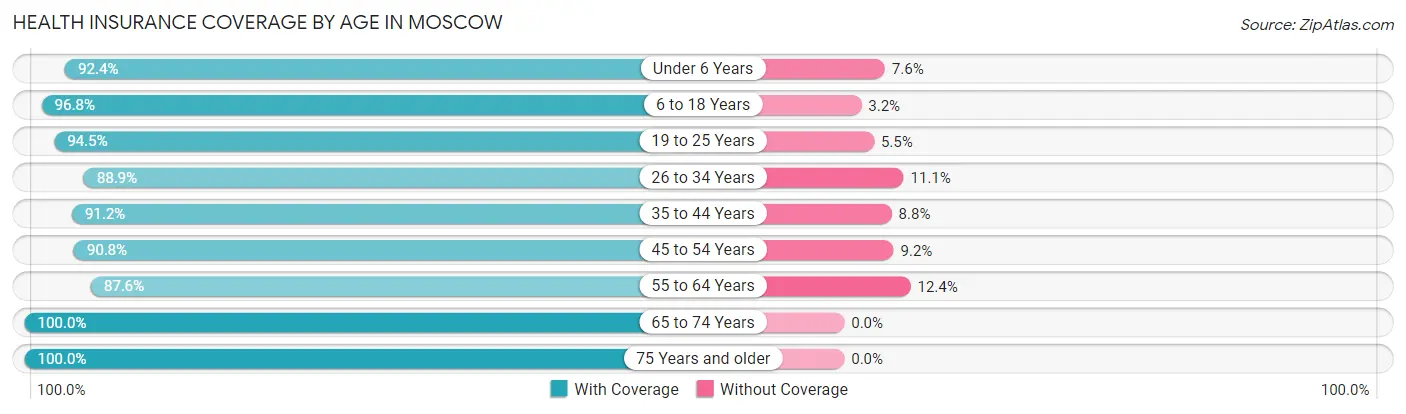
| Age Bracket | With Coverage | Without Coverage |
| Under 6 Years | 1,147 (92.4%) | 94 (7.6%) |
| 6 to 18 Years | 4,358 (96.8%) | 143 (3.2%) |
| 19 to 25 Years | 7,376 (94.5%) | 432 (5.5%) |
| 26 to 34 Years | 3,128 (88.9%) | 389 (11.1%) |
| 35 to 44 Years | 2,591 (91.2%) | 251 (8.8%) |
| 45 to 54 Years | 1,403 (90.8%) | 142 (9.2%) |
| 55 to 64 Years | 1,468 (87.6%) | 207 (12.4%) |
| 65 to 74 Years | 1,286 (100.0%) | 0 (0.0%) |
| 75 Years and older | 968 (100.0%) | 0 (0.0%) |
| Total | 23,725 (93.5%) | 1,658 (6.5%) |
Health Insurance Coverage by Citizenship Status in Moscow
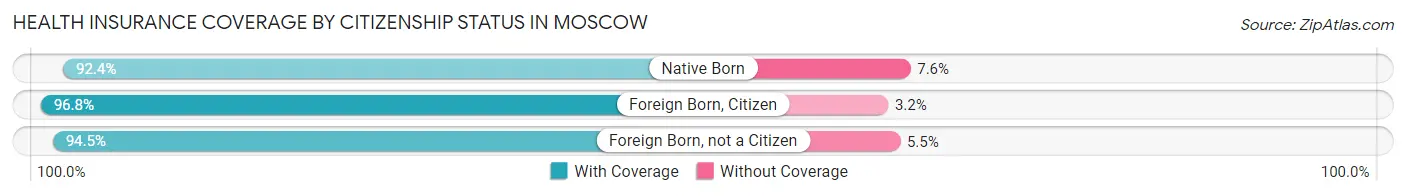
| Citizenship Status | With Coverage | Without Coverage |
| Native Born | 1,147 (92.4%) | 94 (7.6%) |
| Foreign Born, Citizen | 4,358 (96.8%) | 143 (3.2%) |
| Foreign Born, not a Citizen | 7,376 (94.5%) | 432 (5.5%) |
Health Insurance Coverage by Household Income in Moscow
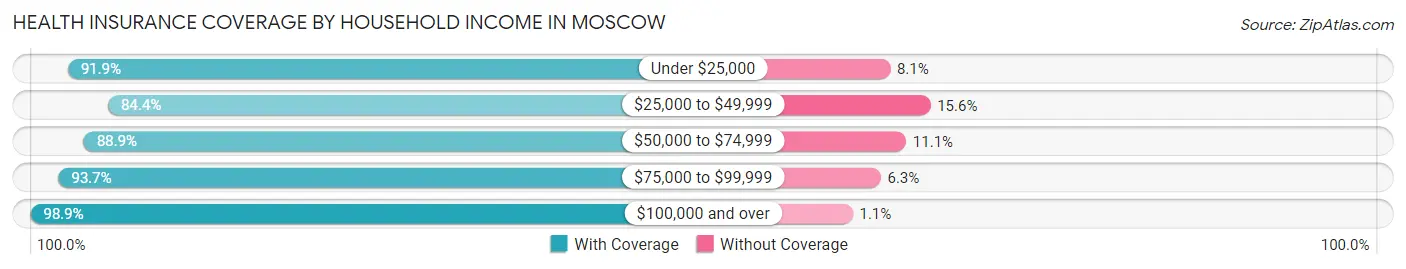
| Household Income | With Coverage | Without Coverage |
| Under $25,000 | 3,159 (91.9%) | 278 (8.1%) |
| $25,000 to $49,999 | 2,969 (84.4%) | 550 (15.6%) |
| $50,000 to $74,999 | 3,899 (88.9%) | 486 (11.1%) |
| $75,000 to $99,999 | 2,935 (93.7%) | 198 (6.3%) |
| $100,000 and over | 5,284 (98.9%) | 57 (1.1%) |
Public vs Private Health Insurance Coverage by Age in Moscow
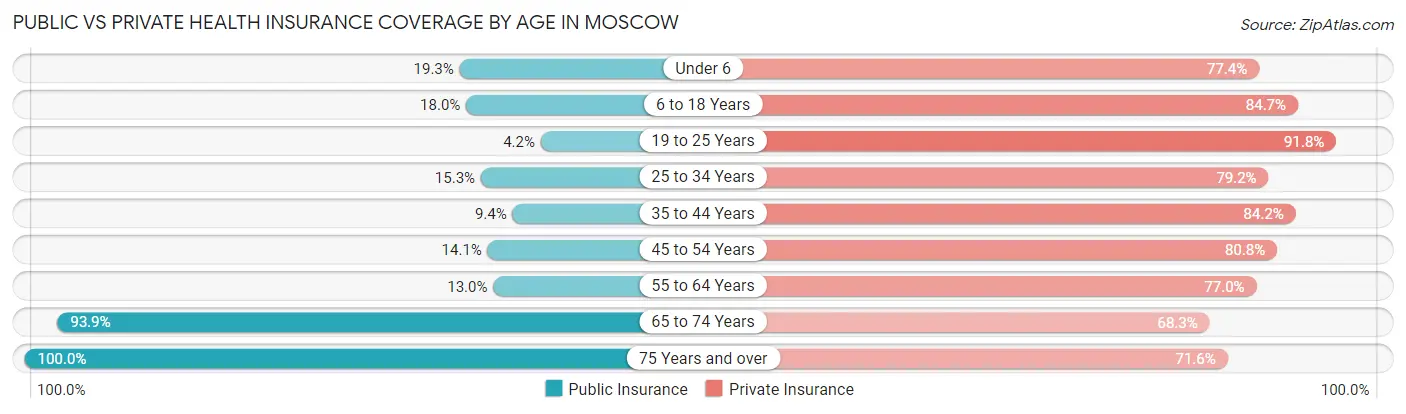
| Age Bracket | Public Insurance | Private Insurance |
| Under 6 | 239 (19.3%) | 961 (77.4%) |
| 6 to 18 Years | 812 (18.0%) | 3,810 (84.7%) |
| 19 to 25 Years | 327 (4.2%) | 7,164 (91.7%) |
| 25 to 34 Years | 538 (15.3%) | 2,785 (79.2%) |
| 35 to 44 Years | 268 (9.4%) | 2,394 (84.2%) |
| 45 to 54 Years | 217 (14.1%) | 1,248 (80.8%) |
| 55 to 64 Years | 218 (13.0%) | 1,289 (77.0%) |
| 65 to 74 Years | 1,208 (93.9%) | 878 (68.3%) |
| 75 Years and over | 968 (100.0%) | 693 (71.6%) |
| Total | 4,795 (18.9%) | 21,222 (83.6%) |
Disability Status by Sex by Age in Moscow
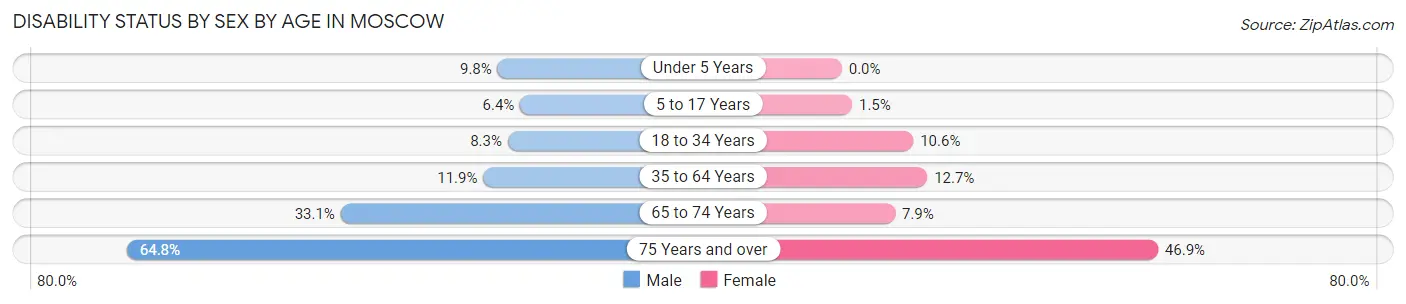
| Age Bracket | Male | Female |
| Under 5 Years | 45 (9.8%) | 0 (0.0%) |
| 5 to 17 Years | 97 (6.4%) | 23 (1.5%) |
| 18 to 34 Years | 567 (8.3%) | 656 (10.6%) |
| 35 to 64 Years | 387 (11.9%) | 356 (12.7%) |
| 65 to 74 Years | 203 (33.1%) | 53 (7.9%) |
| 75 Years and over | 267 (64.8%) | 261 (46.9%) |
Disability Class by Sex by Age in Moscow
Disability Class: Hearing Difficulty
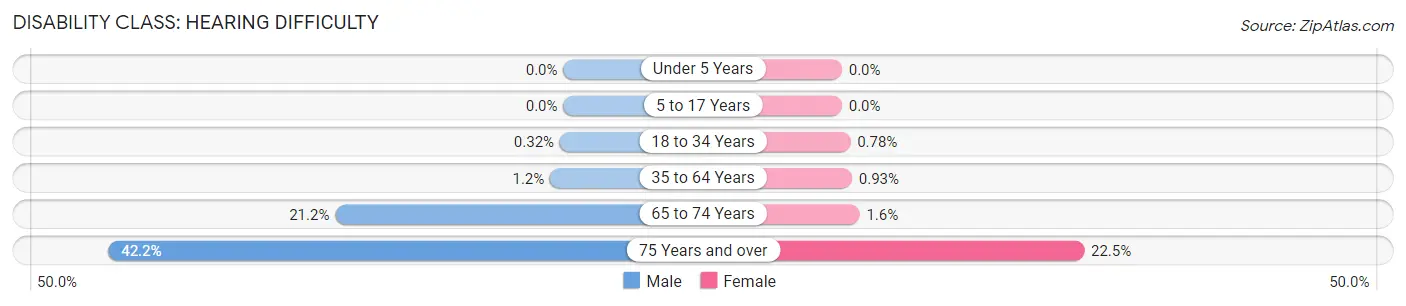
| Age Bracket | Male | Female |
| Under 5 Years | 0 (0.0%) | 0 (0.0%) |
| 5 to 17 Years | 0 (0.0%) | 0 (0.0%) |
| 18 to 34 Years | 22 (0.3%) | 48 (0.8%) |
| 35 to 64 Years | 40 (1.2%) | 26 (0.9%) |
| 65 to 74 Years | 130 (21.2%) | 11 (1.6%) |
| 75 Years and over | 174 (42.2%) | 125 (22.5%) |
Disability Class: Vision Difficulty
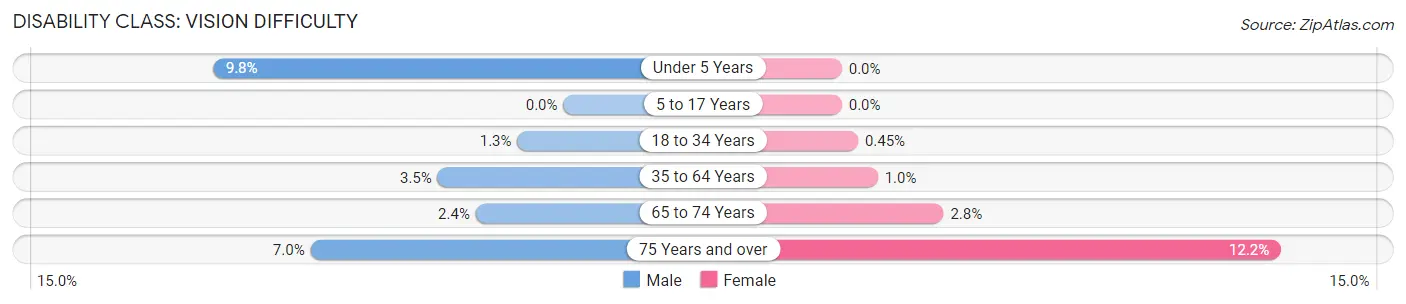
| Age Bracket | Male | Female |
| Under 5 Years | 45 (9.8%) | 0 (0.0%) |
| 5 to 17 Years | 0 (0.0%) | 0 (0.0%) |
| 18 to 34 Years | 88 (1.3%) | 28 (0.4%) |
| 35 to 64 Years | 114 (3.5%) | 28 (1.0%) |
| 65 to 74 Years | 15 (2.4%) | 19 (2.8%) |
| 75 Years and over | 29 (7.0%) | 68 (12.2%) |
Disability Class: Cognitive Difficulty
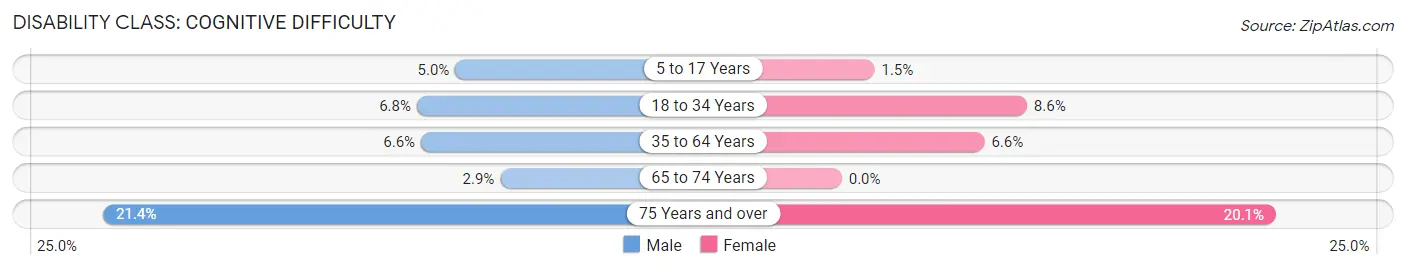
| Age Bracket | Male | Female |
| 5 to 17 Years | 76 (5.0%) | 23 (1.5%) |
| 18 to 34 Years | 467 (6.8%) | 531 (8.6%) |
| 35 to 64 Years | 215 (6.6%) | 186 (6.6%) |
| 65 to 74 Years | 18 (2.9%) | 0 (0.0%) |
| 75 Years and over | 88 (21.4%) | 112 (20.1%) |
Disability Class: Ambulatory Difficulty
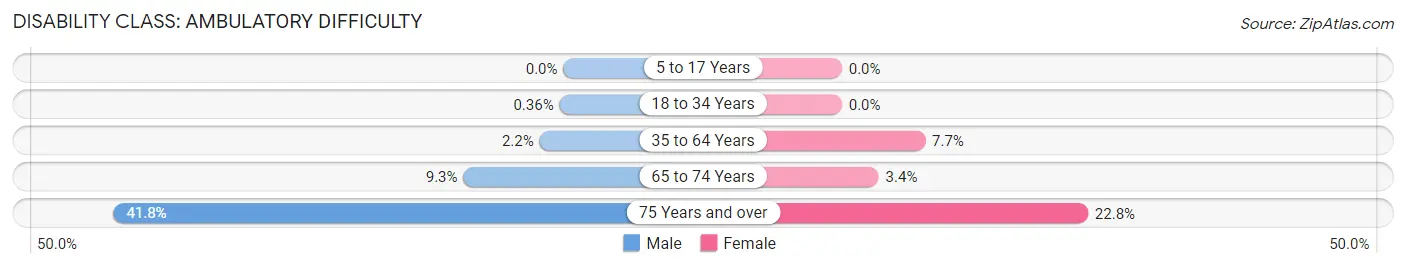
| Age Bracket | Male | Female |
| 5 to 17 Years | 0 (0.0%) | 0 (0.0%) |
| 18 to 34 Years | 25 (0.4%) | 0 (0.0%) |
| 35 to 64 Years | 72 (2.2%) | 217 (7.7%) |
| 65 to 74 Years | 57 (9.3%) | 23 (3.4%) |
| 75 Years and over | 172 (41.7%) | 127 (22.8%) |
Disability Class: Self-Care Difficulty
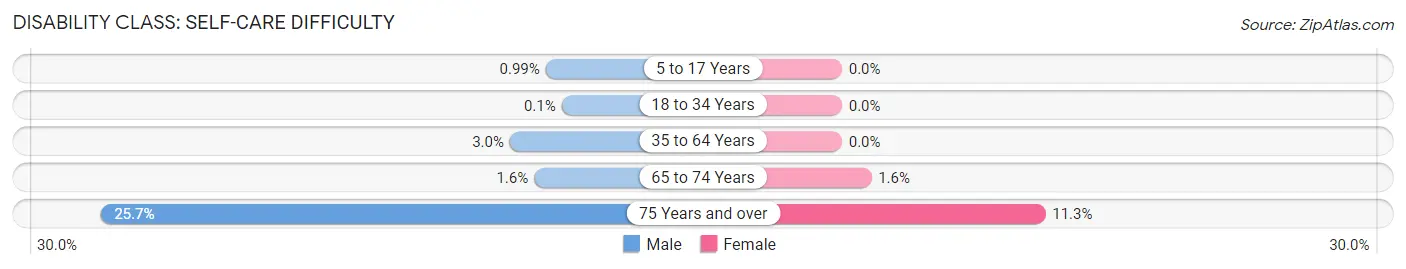
| Age Bracket | Male | Female |
| 5 to 17 Years | 15 (1.0%) | 0 (0.0%) |
| 18 to 34 Years | 7 (0.1%) | 0 (0.0%) |
| 35 to 64 Years | 97 (3.0%) | 0 (0.0%) |
| 65 to 74 Years | 10 (1.6%) | 11 (1.6%) |
| 75 Years and over | 106 (25.7%) | 63 (11.3%) |
Technology Access in Moscow
Computing Device Access in Moscow
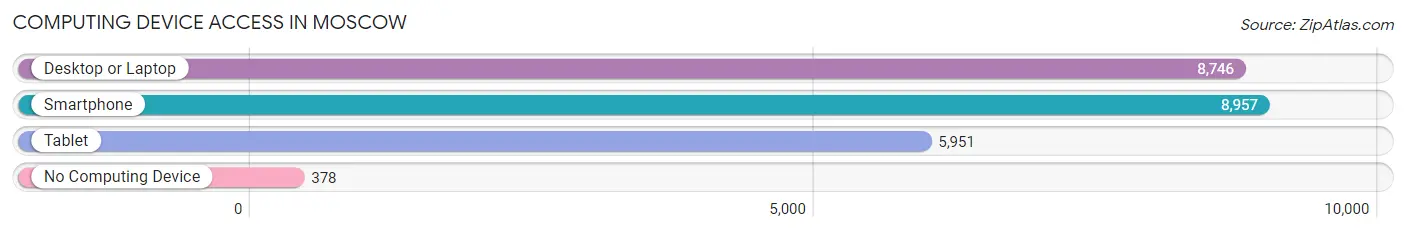
| Device Type | # Households | % Households |
| Desktop or Laptop | 8,746 | 89.7% |
| Smartphone | 8,957 | 91.9% |
| Tablet | 5,951 | 61.0% |
| No Computing Device | 378 | 3.9% |
| Total | 9,751 | 100.0% |
Internet Access in Moscow
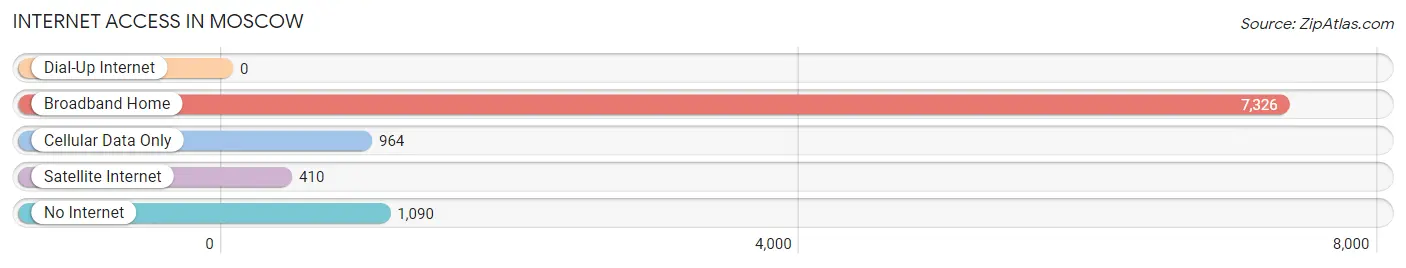
| Internet Type | # Households | % Households |
| Dial-Up Internet | 0 | 0.0% |
| Broadband Home | 7,326 | 75.1% |
| Cellular Data Only | 964 | 9.9% |
| Satellite Internet | 410 | 4.2% |
| No Internet | 1,090 | 11.2% |
| Total | 9,751 | 100.0% |
Moscow Summary
Moscow, Idaho is a city located in the northern part of the state of Idaho, in the United States. It is the county seat of Latah County and the largest city in the Palouse region of the Pacific Northwest. The city is situated on the banks of the Palouse River, a tributary of the Snake River, and is located about 30 miles south of the Washington-Idaho border. The population of Moscow was estimated to be 24,744 in 2019, making it the second-largest city in Idaho after Boise.
History
The area around Moscow has been inhabited for thousands of years by various Native American tribes, including the Nez Perce, Coeur d'Alene, and Palouse. The first European settlers arrived in the area in the early 1800s, and the city of Moscow was officially founded in 1871. The city was named after the Russian city of Moscow, and the name was chosen by a local settler who had recently returned from a trip to Russia.
The city quickly grew in the late 19th century, and by the early 20th century, it had become a major agricultural center in the region. The University of Idaho was established in Moscow in 1889, and the city has since become a major educational and cultural center in the region.
Geography
Moscow is located in the northern part of Idaho, in the Palouse region of the Pacific Northwest. The city is situated on the banks of the Palouse River, a tributary of the Snake River, and is located about 30 miles south of the Washington-Idaho border. The city is surrounded by rolling hills and is located in a valley between the Bitterroot Mountains to the east and the Clearwater Mountains to the west.
The climate in Moscow is generally mild, with cold winters and hot summers. The average annual temperature is around 45°F, and the average annual precipitation is around 17 inches.
Economy
Moscow's economy is largely based on agriculture, education, and government services. The city is home to the University of Idaho, which is the state's flagship university and the largest employer in the city. Other major employers in the city include the Latah County government, the Moscow School District, and the Moscow Medical Center.
Agriculture is also an important part of the city's economy, with wheat, barley, and other grains being the main crops grown in the area. The city is also home to several food processing plants, including a potato processing plant and a canning plant.
Demographics
As of 2019, the population of Moscow was estimated to be 24,744. The city has a diverse population, with the largest ethnic groups being White (83.3%), Hispanic or Latino (7.2%), and Native American (2.2%). The median household income in the city is $41,945, and the median home value is $182,400.
The city is served by the Moscow School District, which includes four elementary schools, one middle school, and one high school. The University of Idaho is also located in the city, and it is the state's flagship university.
Conclusion
Moscow, Idaho is a city located in the northern part of the state of Idaho, in the United States. It is the county seat of Latah County and the largest city in the Palouse region of the Pacific Northwest. The city is situated on the banks of the Palouse River, a tributary of the Snake River, and is located about 30 miles south of the Washington-Idaho border. The population of Moscow was estimated to be 24,744 in 2019, making it the second-largest city in Idaho after Boise. The city's economy is largely based on agriculture, education, and government services, and it is home to the University of Idaho, which is the state's flagship university. The city has a diverse population, with the largest ethnic groups being White (83.3%), Hispanic or Latino (7.2%), and Native American (2.2%).
Common Questions
What is Per Capita Income in Moscow?
Per Capita income in Moscow is $28,805.
What is the Median Family Income in Moscow?
Median Family Income in Moscow is $79,916.
What is the Median Household income in Moscow?
Median Household Income in Moscow is $53,679.
What is Income or Wage Gap in Moscow?
Income or Wage Gap in Moscow is 31.0%.
Women in Moscow earn 69.0 cents for every dollar earned by a man.
What is Family Income Deficit in Moscow?
Family Income Deficit in Moscow is $8,416.
Families that are below poverty line in Moscow earn $8,416 less on average than the poverty threshold level.
What is Inequality or Gini Index in Moscow?
Inequality or Gini Index in Moscow is 0.47.
What is the Total Population of Moscow?
Total Population of Moscow is 25,616.
What is the Total Male Population of Moscow?
Total Male Population of Moscow is 13,235.
What is the Total Female Population of Moscow?
Total Female Population of Moscow is 12,381.
What is the Ratio of Males per 100 Females in Moscow?
There are 106.90 Males per 100 Females in Moscow.
What is the Ratio of Females per 100 Males in Moscow?
There are 93.55 Females per 100 Males in Moscow.
What is the Median Population Age in Moscow?
Median Population Age in Moscow is 24.8 Years.
What is the Average Family Size in Moscow
Average Family Size in Moscow is 2.7 People.
What is the Average Household Size in Moscow
Average Household Size in Moscow is 2.0 People.
How Large is the Labor Force in Moscow?
There are 14,041 People in the Labor Forcein in Moscow.
What is the Percentage of People in the Labor Force in Moscow?
63.4% of People are in the Labor Force in Moscow.
What is the Unemployment Rate in Moscow?
Unemployment Rate in Moscow is 6.4%.