Naukati Bay, AK Map & Demographics
Naukati Bay Map
Naukati Bay Overview
$18,933
PER CAPITA INCOME
0.41
INEQUALITY / GINI INDEX
120
TOTAL POPULATION
77
MALE POPULATION
43
FEMALE POPULATION
179.07
MALES / 100 FEMALES
55.84
FEMALES / 100 MALES
58.3
MEDIAN AGE
2.2
AVG FAMILY SIZE
2.3
AVG HOUSEHOLD SIZE
77
LABOR FORCE [ PEOPLE ]
70.6%
PERCENT IN LABOR FORCE
Naukati Bay Area Codes
Income in Naukati Bay
Income Overview in Naukati Bay
| Characteristic | Number | Measure |
| Per Capita Income | 120 | $18,933 |
| Median Family Income | 46 | $0 |
| Mean Family Income | 46 | $39,883 |
| Median Household Income | 52 | $0 |
| Mean Household Income | 52 | $41,146 |
| Income Deficit | 46 | $0 |
| Wage / Income Gap (%) | 120 | 0.00% |
| Wage / Income Gap ($) | 120 | 100.00¢ per $1 |
| Gini / Inequality Index | 120 | 0.41 |
Earnings by Sex in Naukati Bay
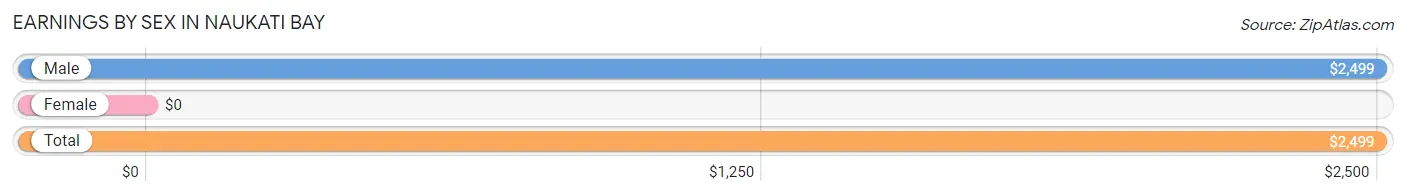
| Sex | Number | Average Earnings |
| Male | 50 (58.8%) | $2,499 |
| Female | 35 (41.2%) | $0 |
| Total | 85 (100.0%) | $2,499 |
Earnings by Sex by Income Bracket in Naukati Bay
The most common earnings brackets in Naukati Bay are $2,499 or less for men (27 | 54.0%) and $2,499 or less for women (16 | 45.7%).
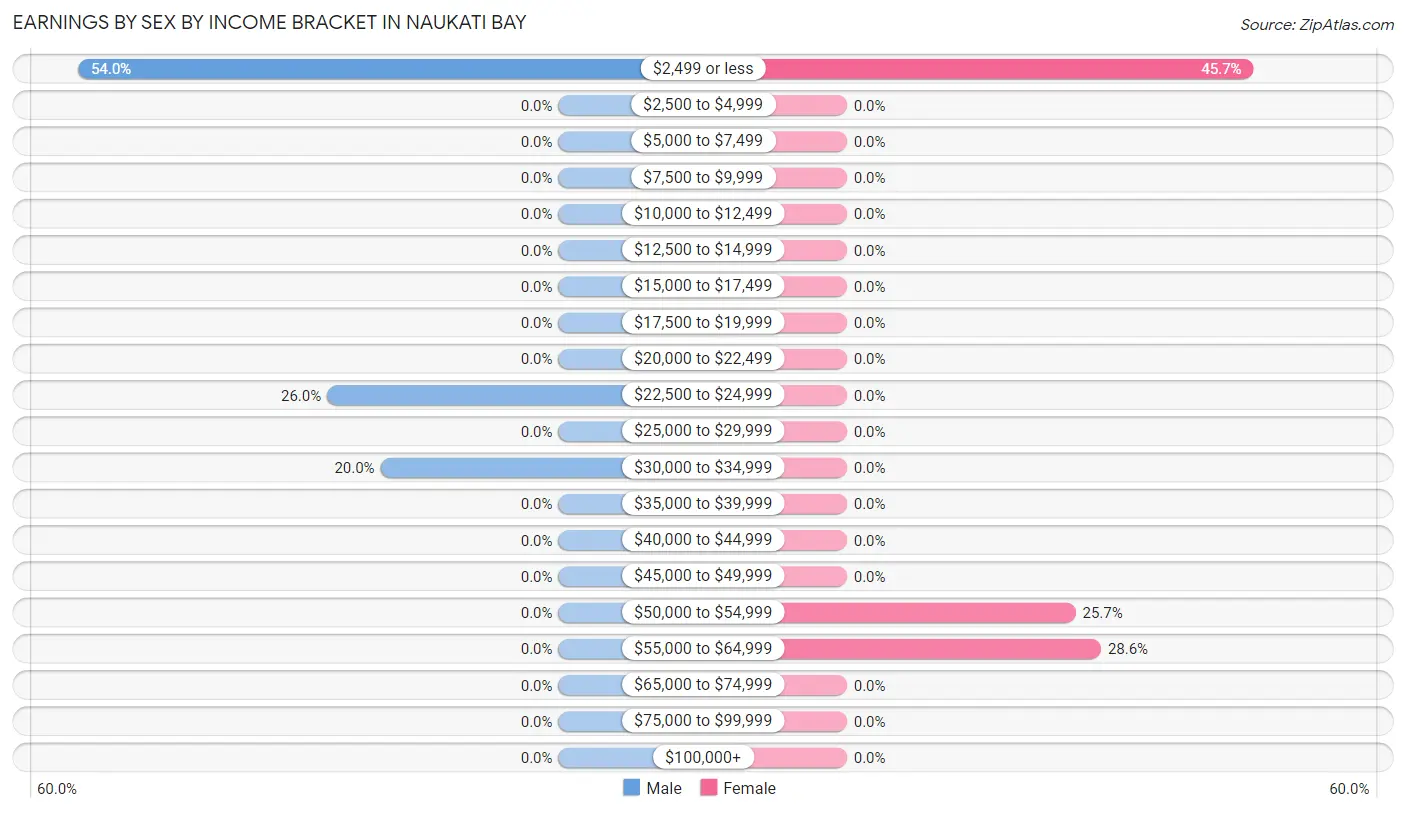
| Income | Male | Female |
| $2,499 or less | 27 (54.0%) | 16 (45.7%) |
| $2,500 to $4,999 | 0 (0.0%) | 0 (0.0%) |
| $5,000 to $7,499 | 0 (0.0%) | 0 (0.0%) |
| $7,500 to $9,999 | 0 (0.0%) | 0 (0.0%) |
| $10,000 to $12,499 | 0 (0.0%) | 0 (0.0%) |
| $12,500 to $14,999 | 0 (0.0%) | 0 (0.0%) |
| $15,000 to $17,499 | 0 (0.0%) | 0 (0.0%) |
| $17,500 to $19,999 | 0 (0.0%) | 0 (0.0%) |
| $20,000 to $22,499 | 0 (0.0%) | 0 (0.0%) |
| $22,500 to $24,999 | 13 (26.0%) | 0 (0.0%) |
| $25,000 to $29,999 | 0 (0.0%) | 0 (0.0%) |
| $30,000 to $34,999 | 10 (20.0%) | 0 (0.0%) |
| $35,000 to $39,999 | 0 (0.0%) | 0 (0.0%) |
| $40,000 to $44,999 | 0 (0.0%) | 0 (0.0%) |
| $45,000 to $49,999 | 0 (0.0%) | 0 (0.0%) |
| $50,000 to $54,999 | 0 (0.0%) | 9 (25.7%) |
| $55,000 to $64,999 | 0 (0.0%) | 10 (28.6%) |
| $65,000 to $74,999 | 0 (0.0%) | 0 (0.0%) |
| $75,000 to $99,999 | 0 (0.0%) | 0 (0.0%) |
| $100,000+ | 0 (0.0%) | 0 (0.0%) |
| Total | 50 (100.0%) | 35 (100.0%) |
Earnings by Sex by Educational Attainment in Naukati Bay
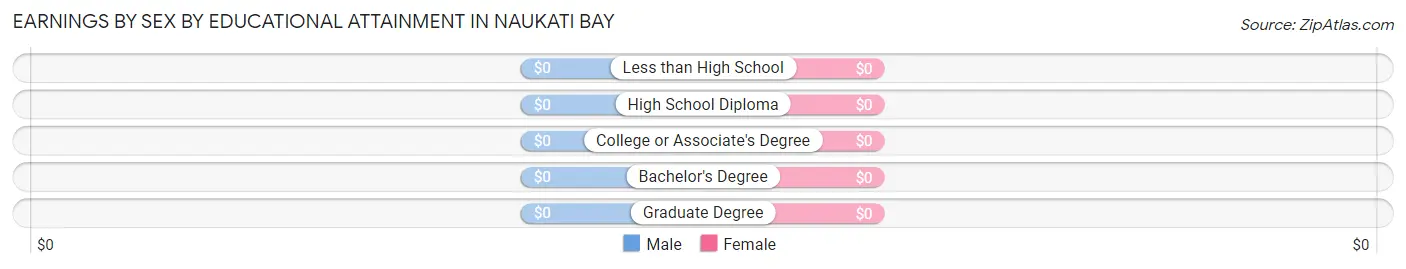
| Educational Attainment | Male Income | Female Income |
| Less than High School | - | - |
| High School Diploma | - | - |
| College or Associate's Degree | - | - |
| Bachelor's Degree | - | - |
| Graduate Degree | - | - |
| Total | $2,499 | $0 |
Family Income in Naukati Bay
Family Income Brackets in Naukati Bay
According to the Naukati Bay family income data, there are 27 families falling into the $50,000 to $74,999 income range, which is the most common income bracket and makes up 58.7% of all families.
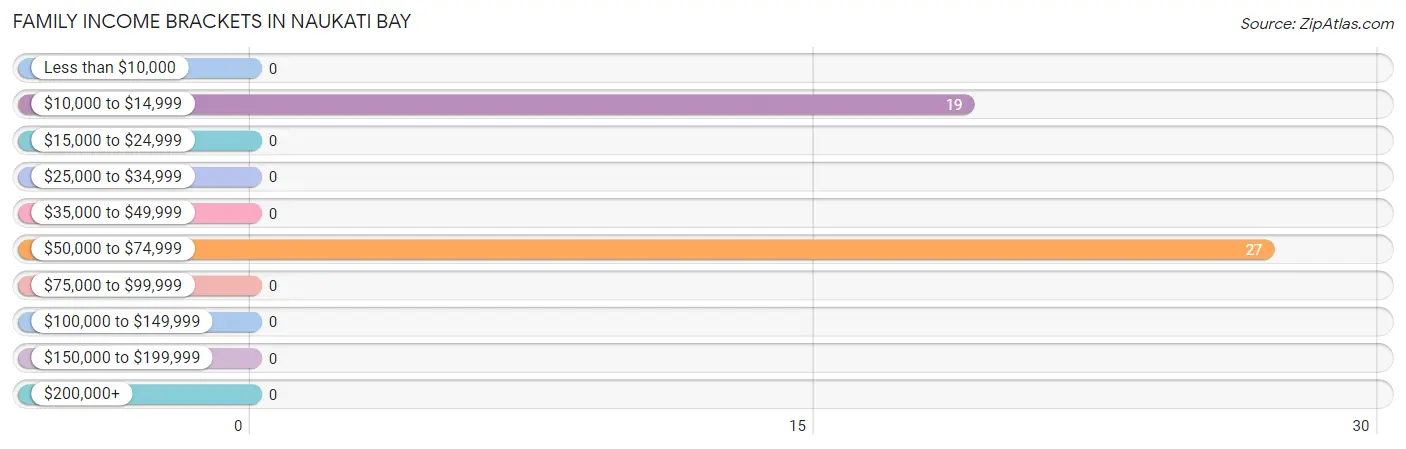
| Income Bracket | # Families | % Families |
| Less than $10,000 | 0 | 0.0% |
| $10,000 to $14,999 | 19 | 41.3% |
| $15,000 to $24,999 | 0 | 0.0% |
| $25,000 to $34,999 | 0 | 0.0% |
| $35,000 to $49,999 | 0 | 0.0% |
| $50,000 to $74,999 | 27 | 58.7% |
| $75,000 to $99,999 | 0 | 0.0% |
| $100,000 to $149,999 | 0 | 0.0% |
| $150,000 to $199,999 | 0 | 0.0% |
| $200,000+ | 0 | 0.0% |
Family Income by Famaliy Size in Naukati Bay
| Income Bracket | # Families | Median Income |
| 2-Person Families | 38 (82.6%) | $0 |
| 3-Person Families | 8 (17.4%) | $0 |
| 4-Person Families | 0 (0.0%) | $0 |
| 5-Person Families | 0 (0.0%) | $0 |
| 6-Person Families | 0 (0.0%) | $0 |
| 7+ Person Families | 0 (0.0%) | $0 |
| Total | 46 (100.0%) | $0 |
Family Income by Number of Earners in Naukati Bay
| Number of Earners | # Families | Median Income |
| No Earners | 0 (0.0%) | $0 |
| 1 Earner | 19 (41.3%) | $0 |
| 2 Earners | 27 (58.7%) | $0 |
| 3+ Earners | 0 (0.0%) | $0 |
| Total | 46 (100.0%) | $0 |
Household Income in Naukati Bay
Household Income Brackets in Naukati Bay
With 19 households falling in the category, the $10,000 to $14,999 income range is the most frequent in Naukati Bay, accounting for 36.5% of all households.
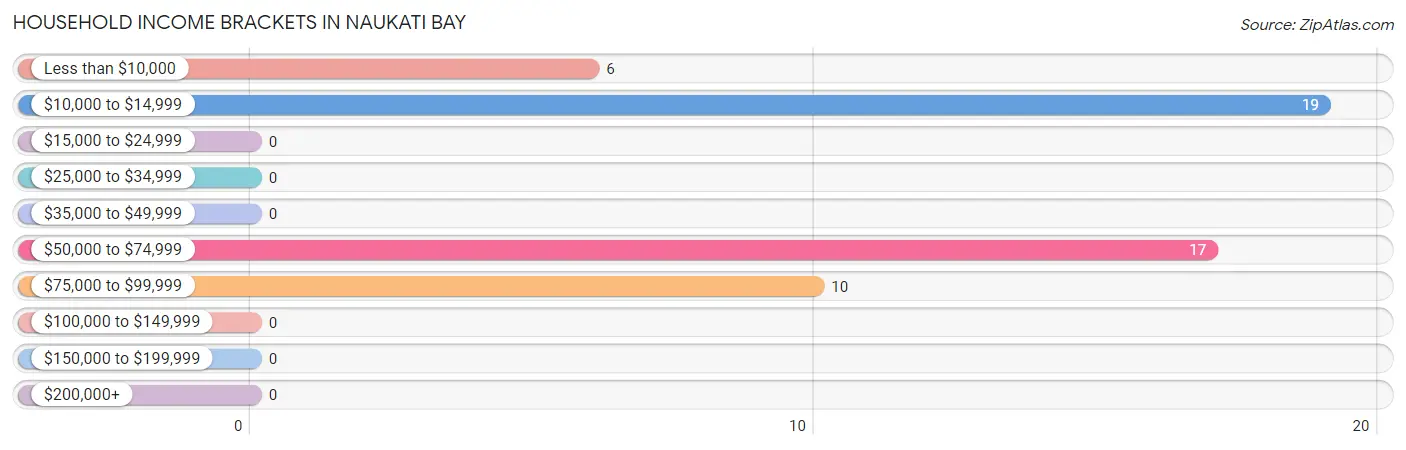
| Income Bracket | # Households | % Households |
| Less than $10,000 | 6 | 11.5% |
| $10,000 to $14,999 | 19 | 36.5% |
| $15,000 to $24,999 | 0 | 0.0% |
| $25,000 to $34,999 | 0 | 0.0% |
| $35,000 to $49,999 | 0 | 0.0% |
| $50,000 to $74,999 | 17 | 32.7% |
| $75,000 to $99,999 | 10 | 19.2% |
| $100,000 to $149,999 | 0 | 0.0% |
| $150,000 to $199,999 | 0 | 0.0% |
| $200,000+ | 0 | 0.0% |
Household Income by Householder Age in Naukati Bay
| Income Bracket | # Households | Median Income |
| 15 to 24 Years | 0 (0.0%) | $0 |
| 25 to 44 Years | 16 (30.8%) | $0 |
| 45 to 64 Years | 36 (69.2%) | $0 |
| 65+ Years | 0 (0.0%) | $0 |
| Total | 52 (100.0%) | $0 |
Poverty in Naukati Bay
Income Below Poverty by Sex and Age in Naukati Bay
With 32.5% poverty level for males and 37.2% for females among the residents of Naukati Bay, 25 to 34 year old males and 55 to 64 year old females are the most vulnerable to poverty, with 6 males (100.0%) and 16 females (48.5%) in their respective age groups living below the poverty level.
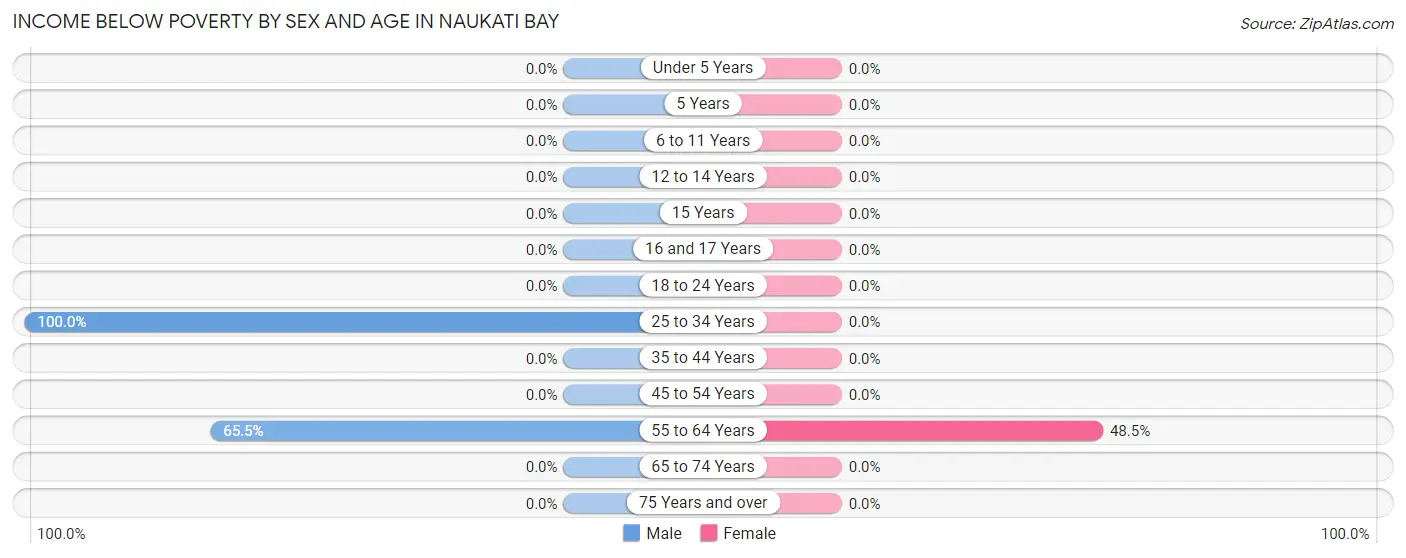
| Age Bracket | Male | Female |
| Under 5 Years | 0 (0.0%) | 0 (0.0%) |
| 5 Years | 0 (0.0%) | 0 (0.0%) |
| 6 to 11 Years | 0 (0.0%) | 0 (0.0%) |
| 12 to 14 Years | 0 (0.0%) | 0 (0.0%) |
| 15 Years | 0 (0.0%) | 0 (0.0%) |
| 16 and 17 Years | 0 (0.0%) | 0 (0.0%) |
| 18 to 24 Years | 0 (0.0%) | 0 (0.0%) |
| 25 to 34 Years | 6 (100.0%) | 0 (0.0%) |
| 35 to 44 Years | 0 (0.0%) | 0 (0.0%) |
| 45 to 54 Years | 0 (0.0%) | 0 (0.0%) |
| 55 to 64 Years | 19 (65.5%) | 16 (48.5%) |
| 65 to 74 Years | 0 (0.0%) | 0 (0.0%) |
| 75 Years and over | 0 (0.0%) | 0 (0.0%) |
| Total | 25 (32.5%) | 16 (37.2%) |
Income Above Poverty by Sex and Age in Naukati Bay
According to the poverty statistics in Naukati Bay, males aged 6 to 11 years and females aged 25 to 34 years are the age groups that are most secure financially, with 100.0% of males and 100.0% of females in these age groups living above the poverty line.
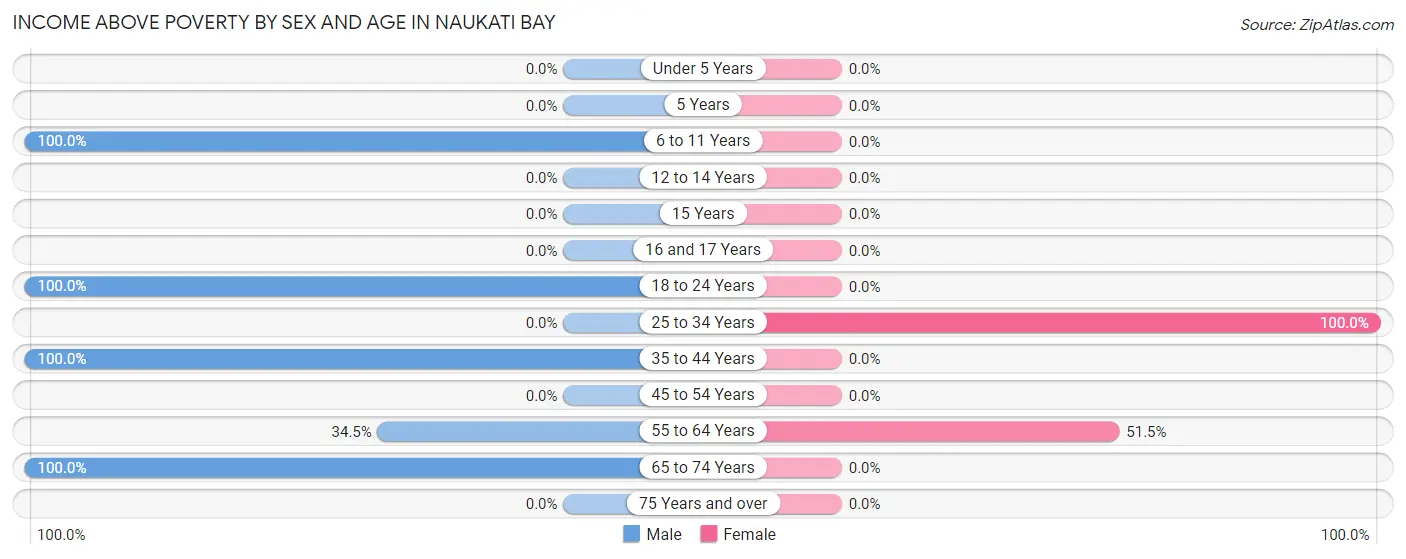
| Age Bracket | Male | Female |
| Under 5 Years | 0 (0.0%) | 0 (0.0%) |
| 5 Years | 0 (0.0%) | 0 (0.0%) |
| 6 to 11 Years | 11 (100.0%) | 0 (0.0%) |
| 12 to 14 Years | 0 (0.0%) | 0 (0.0%) |
| 15 Years | 0 (0.0%) | 0 (0.0%) |
| 16 and 17 Years | 0 (0.0%) | 0 (0.0%) |
| 18 to 24 Years | 10 (100.0%) | 0 (0.0%) |
| 25 to 34 Years | 0 (0.0%) | 10 (100.0%) |
| 35 to 44 Years | 13 (100.0%) | 0 (0.0%) |
| 45 to 54 Years | 0 (0.0%) | 0 (0.0%) |
| 55 to 64 Years | 10 (34.5%) | 17 (51.5%) |
| 65 to 74 Years | 8 (100.0%) | 0 (0.0%) |
| 75 Years and over | 0 (0.0%) | 0 (0.0%) |
| Total | 52 (67.5%) | 27 (62.8%) |
Income Below Poverty Among Married-Couple Families in Naukati Bay
The poverty statistics for married-couple families in Naukati Bay show that 52.8% or 19 of the total 36 families live below the poverty line. Families with no children have the highest poverty rate of 52.8%, comprising of 19 families. On the other hand, families with no children have the lowest poverty rate of 52.8%, which includes 19 families.
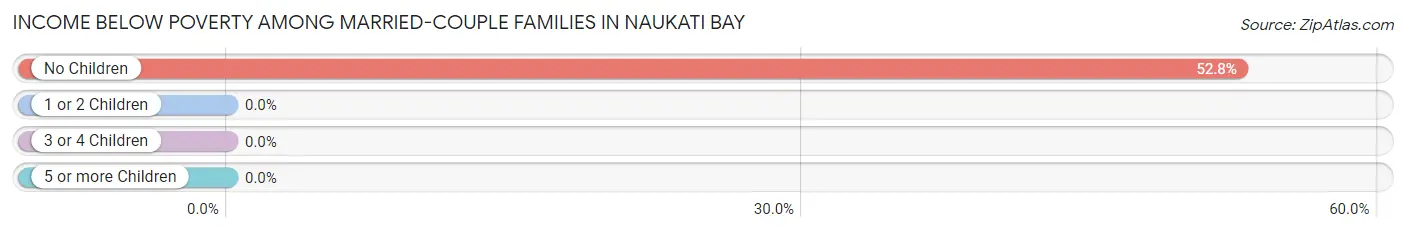
| Children | Above Poverty | Below Poverty |
| No Children | 17 (47.2%) | 19 (52.8%) |
| 1 or 2 Children | 0 (0.0%) | 0 (0.0%) |
| 3 or 4 Children | 0 (0.0%) | 0 (0.0%) |
| 5 or more Children | 0 (0.0%) | 0 (0.0%) |
| Total | 17 (47.2%) | 19 (52.8%) |
Income Below Poverty Among Single-Parent Households in Naukati Bay
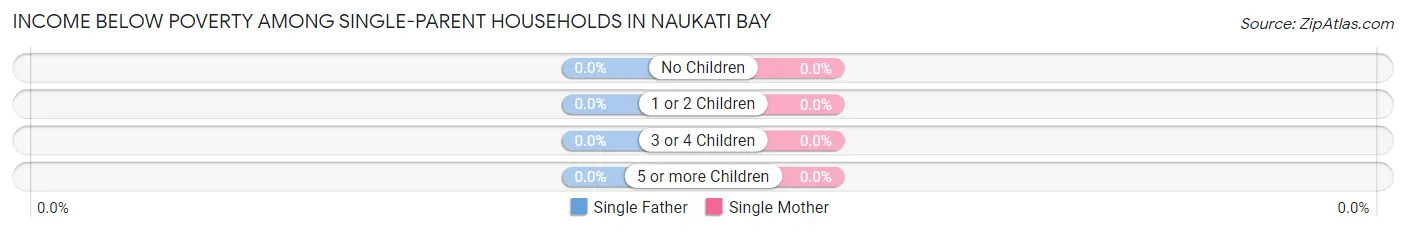
| Children | Single Father | Single Mother |
| No Children | 0 (0.0%) | 0 (0.0%) |
| 1 or 2 Children | 0 (0.0%) | 0 (0.0%) |
| 3 or 4 Children | 0 (0.0%) | 0 (0.0%) |
| 5 or more Children | 0 (0.0%) | 0 (0.0%) |
| Total | 0 (0.0%) | 0 (0.0%) |
Income Below Poverty Among Married-Couple vs Single-Parent Households in Naukati Bay
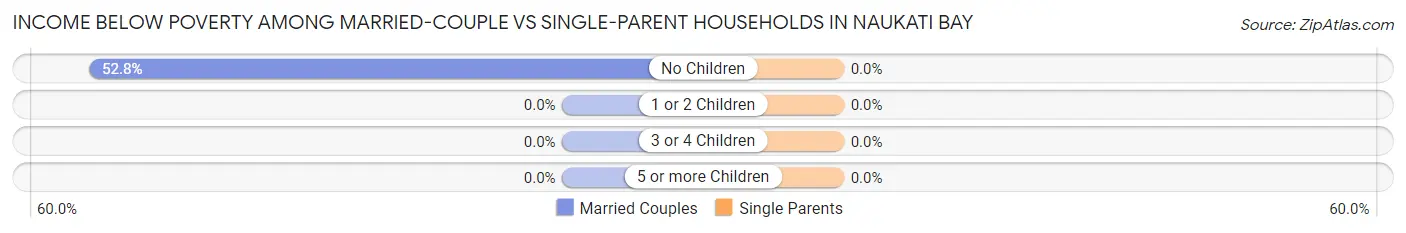
| Children | Married-Couple Families | Single-Parent Households |
| No Children | 19 (52.8%) | 0 (0.0%) |
| 1 or 2 Children | 0 (0.0%) | 0 (0.0%) |
| 3 or 4 Children | 0 (0.0%) | 0 (0.0%) |
| 5 or more Children | 0 (0.0%) | 0 (0.0%) |
| Total | 19 (52.8%) | 0 (0.0%) |
Race in Naukati Bay
The most populous races in Naukati Bay are White / Caucasian (93 | 77.5%), and Two or more Races (27 | 22.5%).
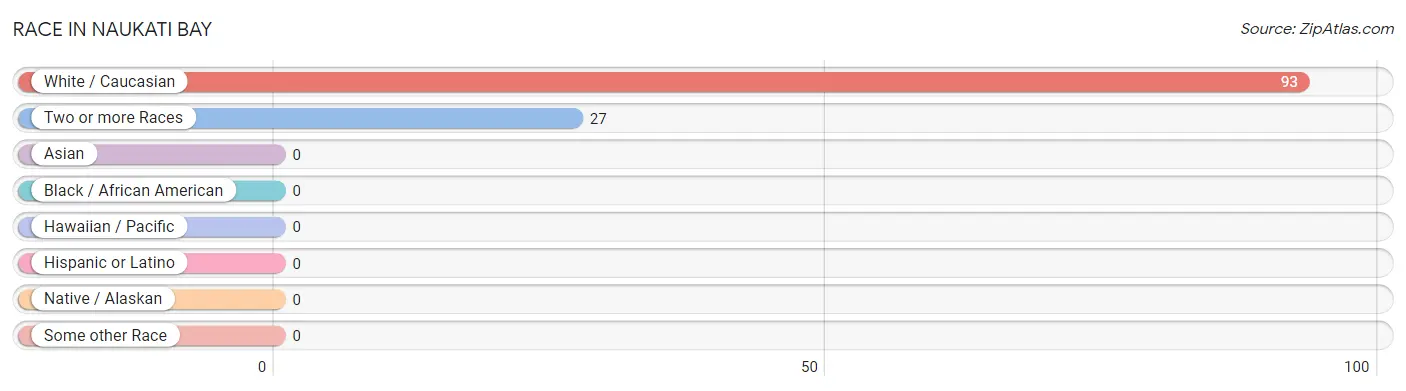
| Race | # Population | % Population |
| Asian | 0 | 0.0% |
| Black / African American | 0 | 0.0% |
| Hawaiian / Pacific | 0 | 0.0% |
| Hispanic or Latino | 0 | 0.0% |
| Native / Alaskan | 0 | 0.0% |
| White / Caucasian | 93 | 77.5% |
| Two or more Races | 27 | 22.5% |
| Some other Race | 0 | 0.0% |
| Total | 120 | 100.0% |
Ancestry in Naukati Bay
The most populous ancestries reported in Naukati Bay are Irish (34 | 28.3%), Norwegian (21 | 17.5%), German (19 | 15.8%), Yakama (18 | 15.0%), and French (11 | 9.2%), together accounting for 85.8% of all Naukati Bay residents.
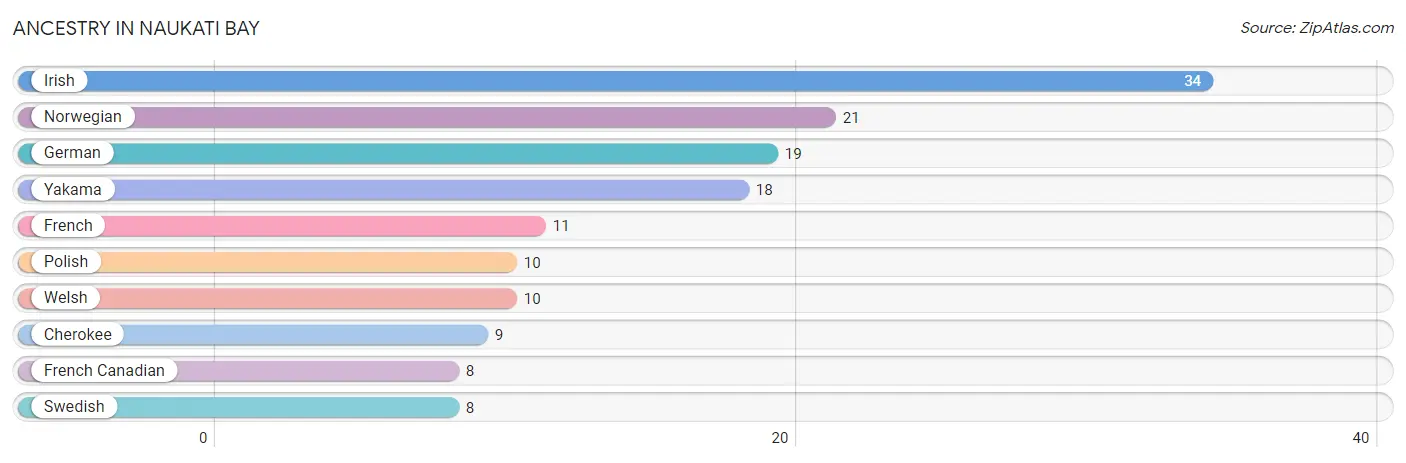
| Ancestry | # Population | % Population |
| Cherokee | 9 | 7.5% |
| French | 11 | 9.2% |
| French Canadian | 8 | 6.7% |
| German | 19 | 15.8% |
| Irish | 34 | 28.3% |
| Norwegian | 21 | 17.5% |
| Polish | 10 | 8.3% |
| Swedish | 8 | 6.7% |
| Welsh | 10 | 8.3% |
| Yakama | 18 | 15.0% | View All 10 Rows |
Immigrants in Naukati Bay

| Immigration Origin | # Population | % Population | View All 0 Rows |
Sex and Age in Naukati Bay
Sex and Age in Naukati Bay
The most populous age groups in Naukati Bay are 55 to 59 Years (19 | 24.7%) for men and 60 to 64 Years (17 | 39.5%) for women.
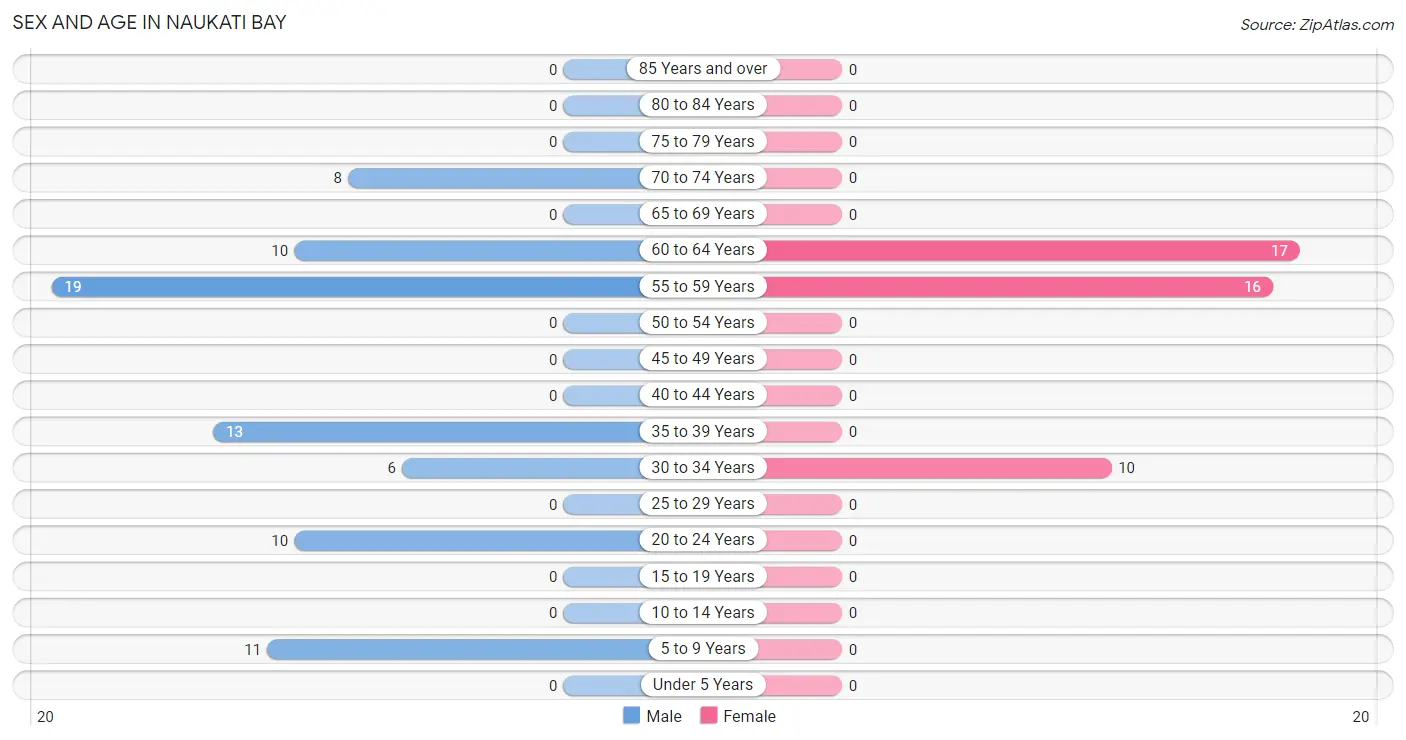
| Age Bracket | Male | Female |
| Under 5 Years | 0 (0.0%) | 0 (0.0%) |
| 5 to 9 Years | 11 (14.3%) | 0 (0.0%) |
| 10 to 14 Years | 0 (0.0%) | 0 (0.0%) |
| 15 to 19 Years | 0 (0.0%) | 0 (0.0%) |
| 20 to 24 Years | 10 (13.0%) | 0 (0.0%) |
| 25 to 29 Years | 0 (0.0%) | 0 (0.0%) |
| 30 to 34 Years | 6 (7.8%) | 10 (23.3%) |
| 35 to 39 Years | 13 (16.9%) | 0 (0.0%) |
| 40 to 44 Years | 0 (0.0%) | 0 (0.0%) |
| 45 to 49 Years | 0 (0.0%) | 0 (0.0%) |
| 50 to 54 Years | 0 (0.0%) | 0 (0.0%) |
| 55 to 59 Years | 19 (24.7%) | 16 (37.2%) |
| 60 to 64 Years | 10 (13.0%) | 17 (39.5%) |
| 65 to 69 Years | 0 (0.0%) | 0 (0.0%) |
| 70 to 74 Years | 8 (10.4%) | 0 (0.0%) |
| 75 to 79 Years | 0 (0.0%) | 0 (0.0%) |
| 80 to 84 Years | 0 (0.0%) | 0 (0.0%) |
| 85 Years and over | 0 (0.0%) | 0 (0.0%) |
| Total | 77 (100.0%) | 43 (100.0%) |
Families and Households in Naukati Bay
Median Family Size in Naukati Bay
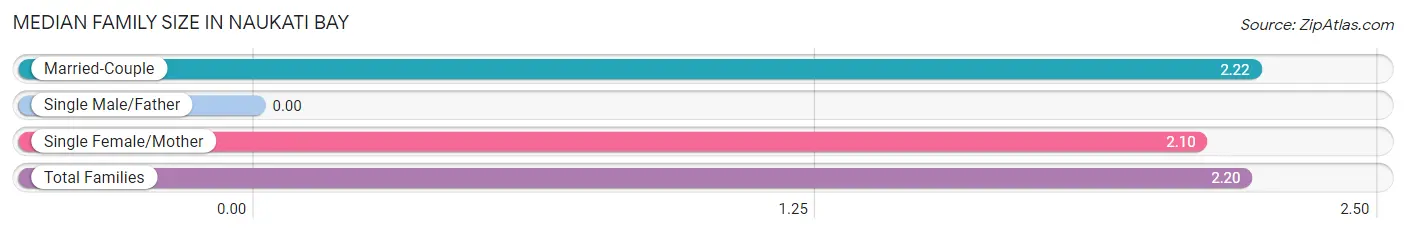
| Family Type | # Families | Family Size |
| Married-Couple | 36 (78.3%) | 2.22 |
| Single Male/Father | 0 (0.0%) | - |
| Single Female/Mother | 10 (21.7%) | 2.10 |
| Total Families | 46 (100.0%) | 2.20 |
Median Household Size in Naukati Bay
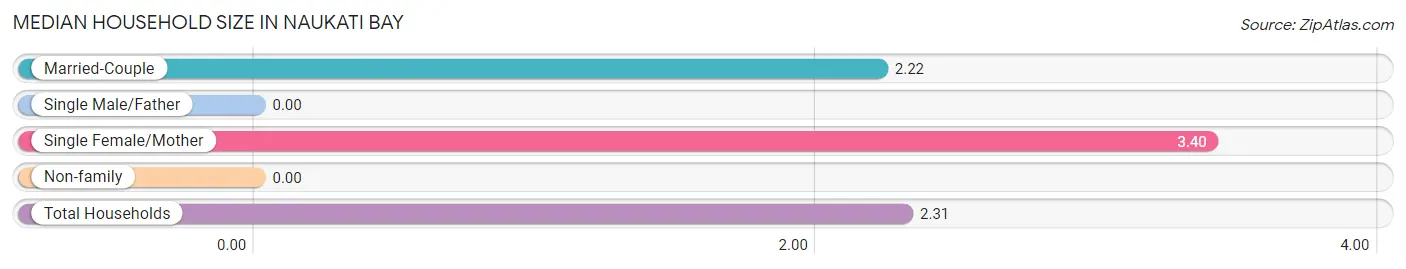
| Household Type | # Households | Household Size |
| Married-Couple | 36 (69.2%) | 2.22 |
| Single Male/Father | 0 (0.0%) | - |
| Single Female/Mother | 10 (19.2%) | 3.40 |
| Non-family | 6 (11.5%) | - |
| Total Households | 52 (100.0%) | 2.31 |
Household Size by Marriage Status in Naukati Bay
Out of a total of 52 households in Naukati Bay, 46 (88.5%) are family households, while 6 (11.5%) are nonfamily households. The most numerous type of family households are 2-person households, comprising 28, and the most common type of nonfamily households are 1-person households, comprising 6.
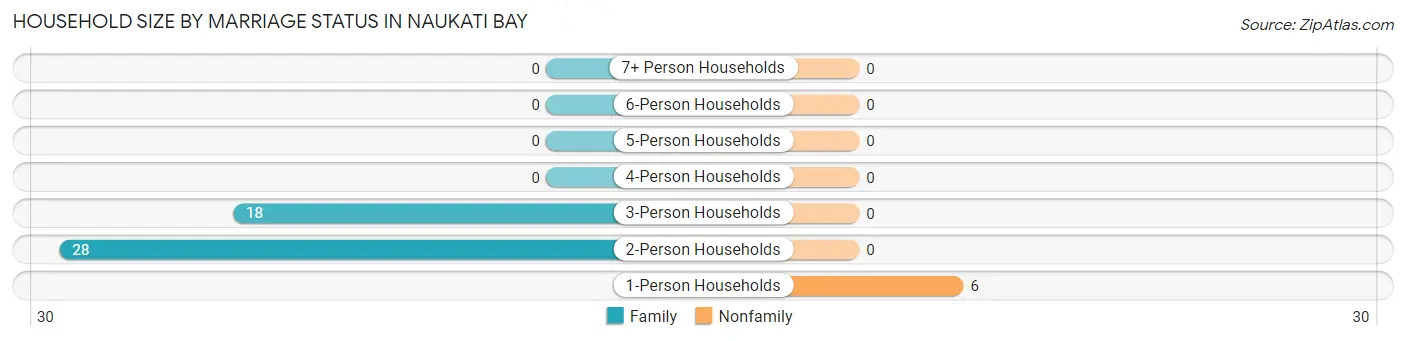
| Household Size | Family Households | Nonfamily Households |
| 1-Person Households | - | 6 (11.5%) |
| 2-Person Households | 28 (53.8%) | 0 (0.0%) |
| 3-Person Households | 18 (34.6%) | 0 (0.0%) |
| 4-Person Households | 0 (0.0%) | 0 (0.0%) |
| 5-Person Households | 0 (0.0%) | 0 (0.0%) |
| 6-Person Households | 0 (0.0%) | 0 (0.0%) |
| 7+ Person Households | 0 (0.0%) | 0 (0.0%) |
| Total | 46 (88.5%) | 6 (11.5%) |
Female Fertility in Naukati Bay
Fertility by Age in Naukati Bay
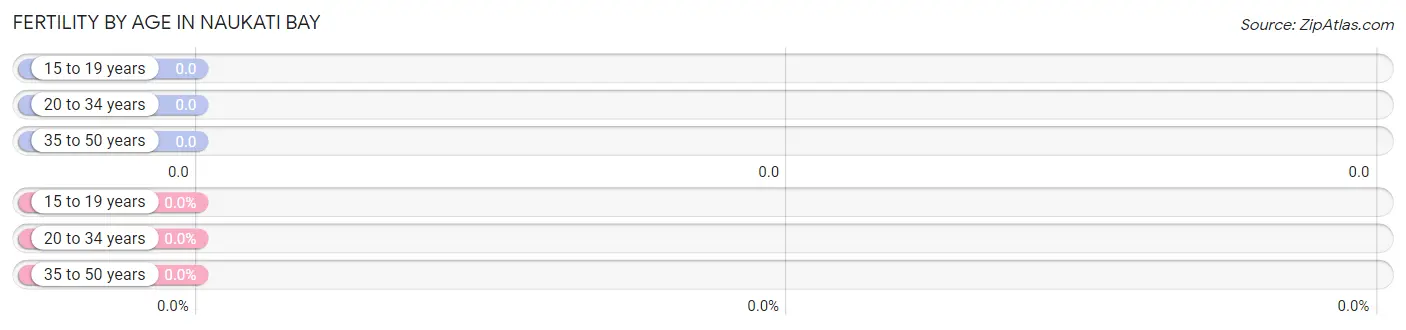
| Age Bracket | Women with Births | Births / 1,000 Women |
| 15 to 19 years | 0 (0.0%) | 0.0 |
| 20 to 34 years | 0 (0.0%) | 0.0 |
| 35 to 50 years | 0 (0.0%) | 0.0 |
| Total | 0 (0.0%) | 0.0 |
Fertility by Age by Marriage Status in Naukati Bay
| Age Bracket | Married | Unmarried |
| 15 to 19 years | 0 (0.0%) | 0 (0.0%) |
| 20 to 34 years | 0 (0.0%) | 0 (0.0%) |
| 35 to 50 years | 0 (0.0%) | 0 (0.0%) |
| Total | 0 (0.0%) | 0 (0.0%) |
Fertility by Education in Naukati Bay
| Educational Attainment | Women with Births | Births / 1,000 Women |
| Less than High School | 0 (0.0%) | 0.0 |
| High School Diploma | 0 (0.0%) | 0.0 |
| College or Associate's Degree | 0 (0.0%) | 0.0 |
| Bachelor's Degree | 0 (0.0%) | 0.0 |
| Graduate Degree | 0 (0.0%) | 0.0 |
| Total | 0 (0.0%) | 0.0 |
Fertility by Education by Marriage Status in Naukati Bay
| Educational Attainment | Married | Unmarried |
| Less than High School | 0 (0.0%) | 0 (0.0%) |
| High School Diploma | 0 (0.0%) | 0 (0.0%) |
| College or Associate's Degree | 0 (0.0%) | 0 (0.0%) |
| Bachelor's Degree | 0 (0.0%) | 0 (0.0%) |
| Graduate Degree | 0 (0.0%) | 0 (0.0%) |
| Total | 0 (0.0%) | 0 (0.0%) |
Employment Characteristics in Naukati Bay
Employment by Class of Employer in Naukati Bay
Among the 77 employed individuals in Naukati Bay, self-employed (not incorporated) (32 | 41.6%), private company employees (20 | 26.0%), and self-employed (incorporated) (16 | 20.8%) make up the most common classes of employment.
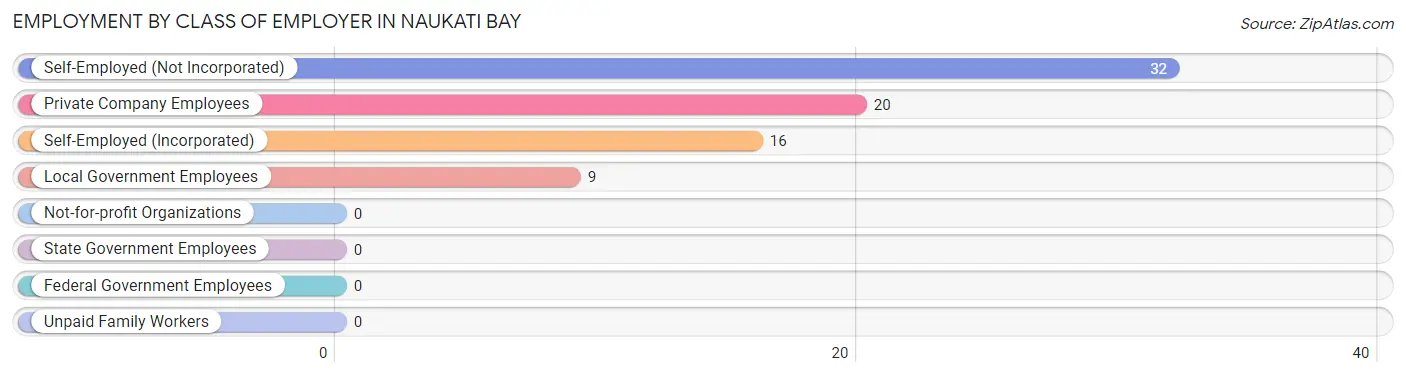
| Employer Class | # Employees | % Employees |
| Private Company Employees | 20 | 26.0% |
| Self-Employed (Incorporated) | 16 | 20.8% |
| Self-Employed (Not Incorporated) | 32 | 41.6% |
| Not-for-profit Organizations | 0 | 0.0% |
| Local Government Employees | 9 | 11.7% |
| State Government Employees | 0 | 0.0% |
| Federal Government Employees | 0 | 0.0% |
| Unpaid Family Workers | 0 | 0.0% |
| Total | 77 | 100.0% |
Employment Status by Age in Naukati Bay
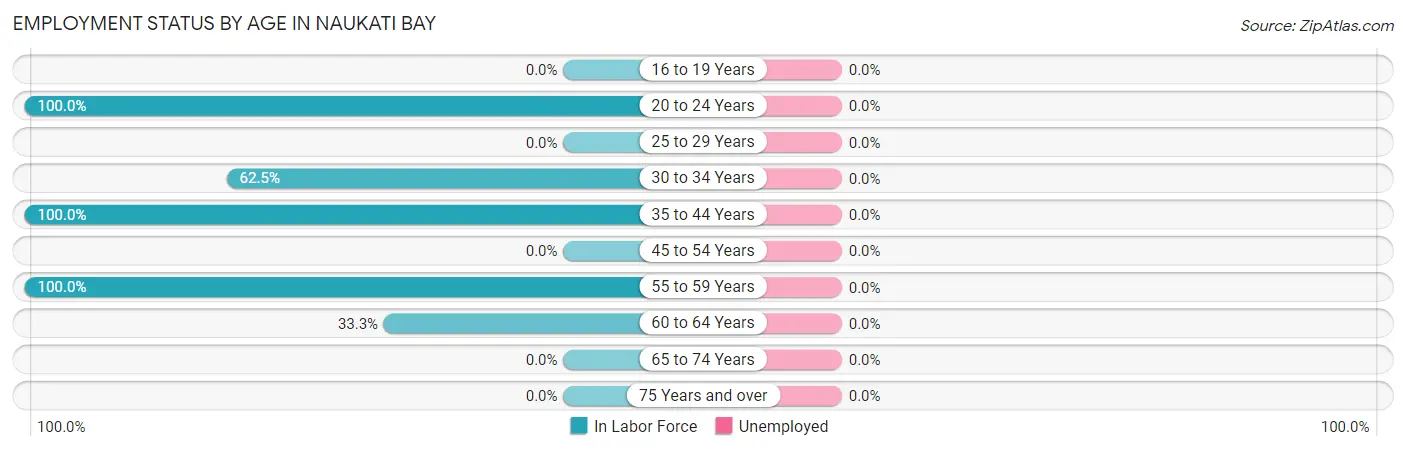
| Age Bracket | In Labor Force | Unemployed |
| 16 to 19 Years | 0 (0.0%) | 0 (0.0%) |
| 20 to 24 Years | 10 (100.0%) | 0 (0.0%) |
| 25 to 29 Years | 0 (0.0%) | 0 (0.0%) |
| 30 to 34 Years | 10 (62.5%) | 0 (0.0%) |
| 35 to 44 Years | 13 (100.0%) | 0 (0.0%) |
| 45 to 54 Years | 0 (0.0%) | 0 (0.0%) |
| 55 to 59 Years | 35 (100.0%) | 0 (0.0%) |
| 60 to 64 Years | 9 (33.3%) | 0 (0.0%) |
| 65 to 74 Years | 0 (0.0%) | 0 (0.0%) |
| 75 Years and over | 0 (0.0%) | 0 (0.0%) |
| Total | 77 (70.6%) | 0 (0.0%) |
Employment Status by Educational Attainment in Naukati Bay
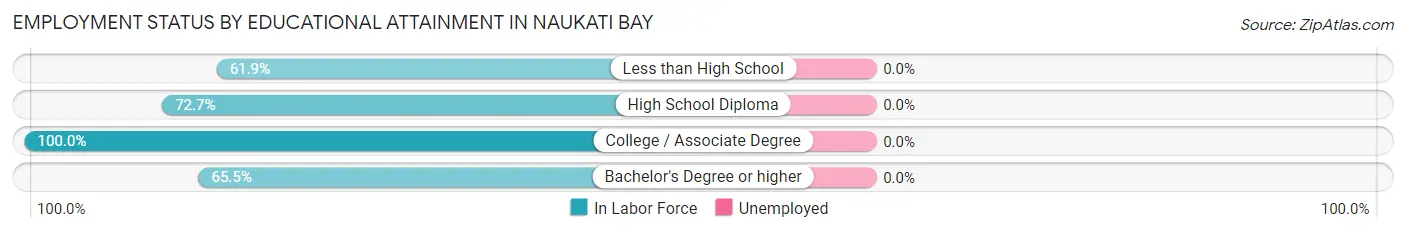
| Educational Attainment | In Labor Force | Unemployed |
| Less than High School | 13 (61.9%) | 0 (0.0%) |
| High School Diploma | 16 (72.7%) | 0 (0.0%) |
| College / Associate Degree | 19 (100.0%) | 0 (0.0%) |
| Bachelor's Degree or higher | 19 (65.5%) | 0 (0.0%) |
| Total | 67 (73.6%) | 0 (0.0%) |
Employment Occupations by Sex in Naukati Bay
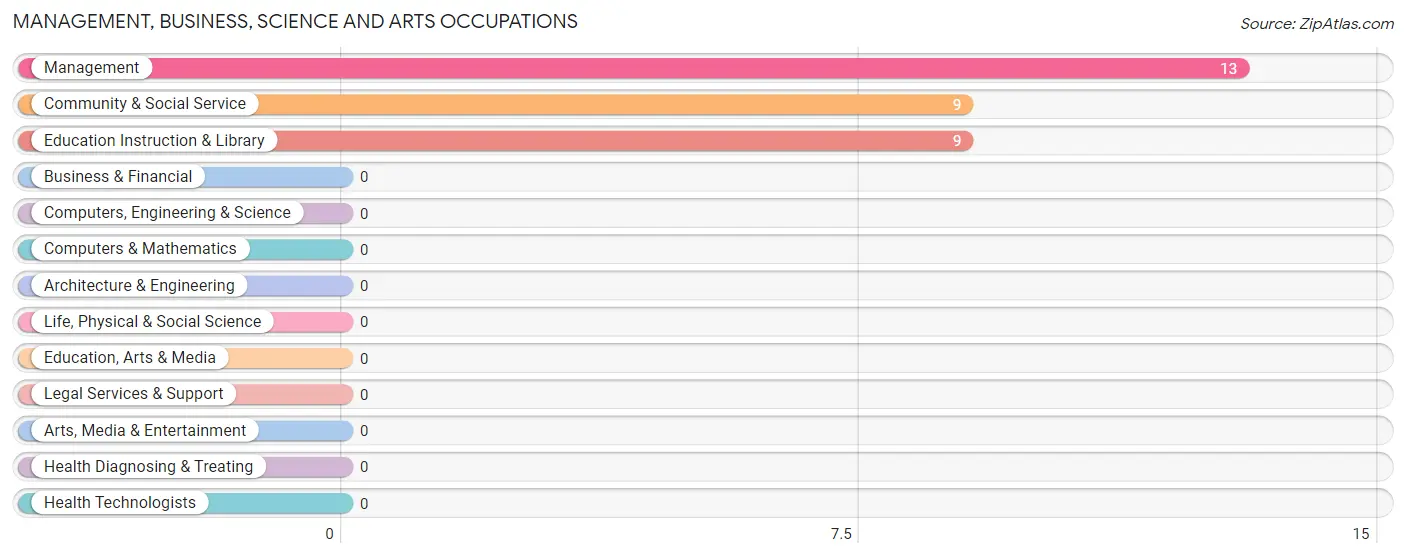
Management, Business, Science and Arts Occupations
The most common Management, Business, Science and Arts occupations in Naukati Bay are Management (13 | 16.9%), Community & Social Service (9 | 11.7%), and Education Instruction & Library (9 | 11.7%).
Management, Business, Science and Arts Occupations by Sex
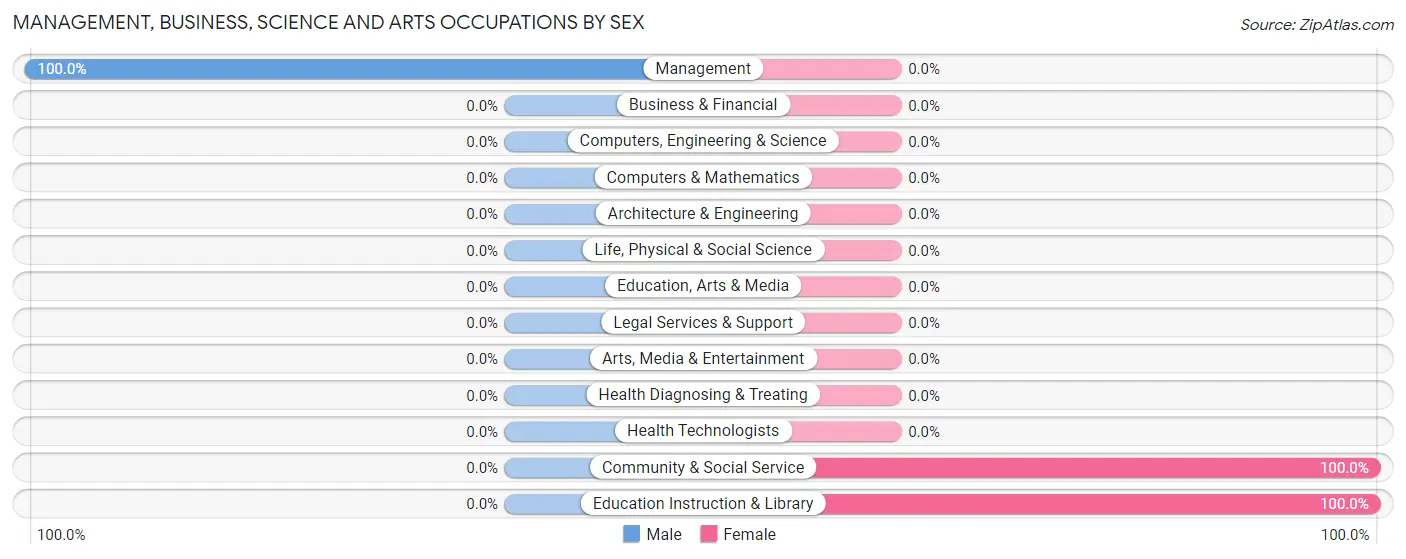
| Occupation | Male | Female |
| Management | 13 (100.0%) | 0 (0.0%) |
| Business & Financial | 0 (0.0%) | 0 (0.0%) |
| Computers, Engineering & Science | 0 (0.0%) | 0 (0.0%) |
| Computers & Mathematics | 0 (0.0%) | 0 (0.0%) |
| Architecture & Engineering | 0 (0.0%) | 0 (0.0%) |
| Life, Physical & Social Science | 0 (0.0%) | 0 (0.0%) |
| Community & Social Service | 0 (0.0%) | 9 (100.0%) |
| Education, Arts & Media | 0 (0.0%) | 0 (0.0%) |
| Legal Services & Support | 0 (0.0%) | 0 (0.0%) |
| Education Instruction & Library | 0 (0.0%) | 9 (100.0%) |
| Arts, Media & Entertainment | 0 (0.0%) | 0 (0.0%) |
| Health Diagnosing & Treating | 0 (0.0%) | 0 (0.0%) |
| Health Technologists | 0 (0.0%) | 0 (0.0%) |
| Total (Category) | 13 (59.1%) | 9 (40.9%) |
| Total (Overall) | 42 (54.5%) | 35 (45.5%) |
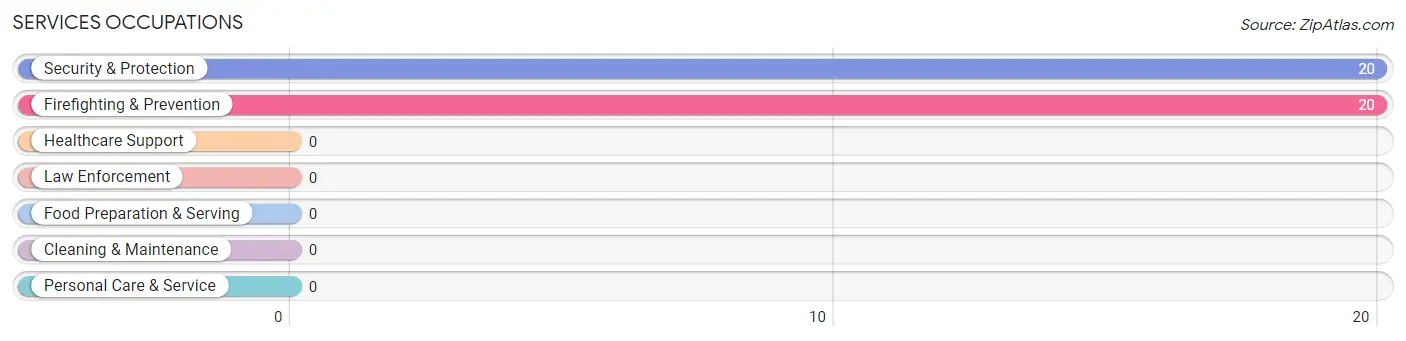
Services Occupations
The most common Services occupations in Naukati Bay are Security & Protection (20 | 26.0%), and Firefighting & Prevention (20 | 26.0%).
Services Occupations by Sex
Within the Services occupations in Naukati Bay, the most male-oriented occupations are Security & Protection (50.0%), and Firefighting & Prevention (50.0%), while the most female-oriented occupations are Security & Protection (50.0%), and Firefighting & Prevention (50.0%).
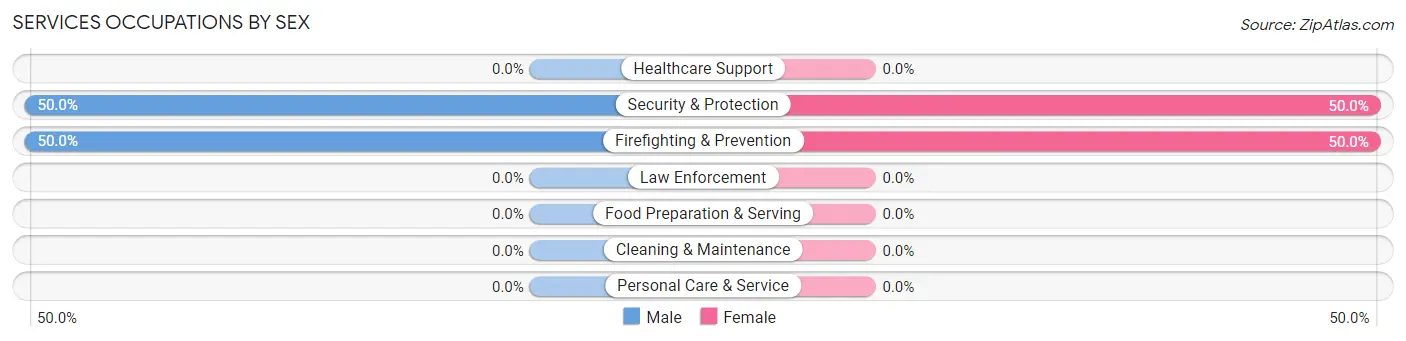
| Occupation | Male | Female |
| Healthcare Support | 0 (0.0%) | 0 (0.0%) |
| Security & Protection | 10 (50.0%) | 10 (50.0%) |
| Firefighting & Prevention | 10 (50.0%) | 10 (50.0%) |
| Law Enforcement | 0 (0.0%) | 0 (0.0%) |
| Food Preparation & Serving | 0 (0.0%) | 0 (0.0%) |
| Cleaning & Maintenance | 0 (0.0%) | 0 (0.0%) |
| Personal Care & Service | 0 (0.0%) | 0 (0.0%) |
| Total (Category) | 10 (50.0%) | 10 (50.0%) |
| Total (Overall) | 42 (54.5%) | 35 (45.5%) |
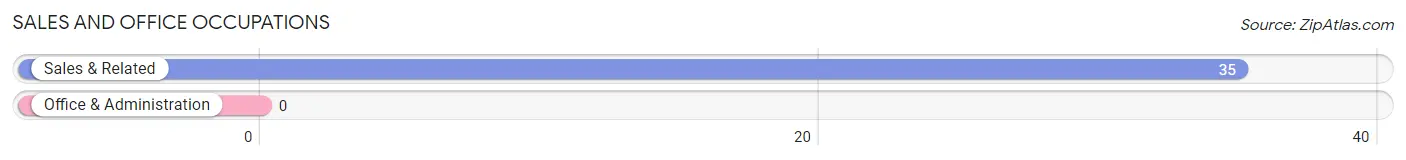
Sales and Office Occupations
The most common Sales and Office occupations in Naukati Bay are , and Sales & Related (35 | 45.5%).
Sales and Office Occupations by Sex
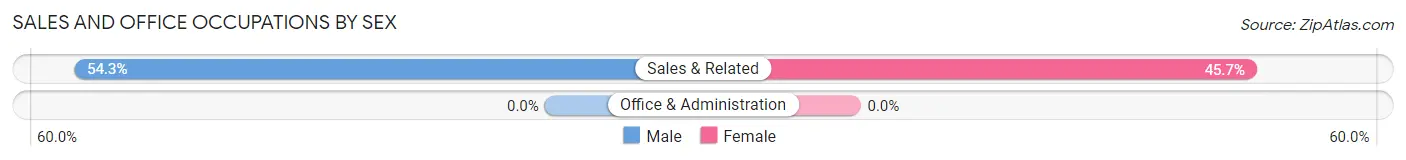
| Occupation | Male | Female |
| Sales & Related | 19 (54.3%) | 16 (45.7%) |
| Office & Administration | 0 (0.0%) | 0 (0.0%) |
| Total (Category) | 19 (54.3%) | 16 (45.7%) |
| Total (Overall) | 42 (54.5%) | 35 (45.5%) |
Natural Resources, Construction and Maintenance Occupations
Natural Resources, Construction and Maintenance Occupations by Sex
| Occupation | Male | Female |
| Farming, Fishing & Forestry | 0 (0.0%) | 0 (0.0%) |
| Construction & Extraction | 0 (0.0%) | 0 (0.0%) |
| Installation, Maintenance & Repair | 0 (0.0%) | 0 (0.0%) |
| Total (Category) | 0 (0.0%) | 0 (0.0%) |
| Total (Overall) | 42 (54.5%) | 35 (45.5%) |
Production, Transportation and Moving Occupations
Production, Transportation and Moving Occupations by Sex
| Occupation | Male | Female |
| Production | 0 (0.0%) | 0 (0.0%) |
| Transportation | 0 (0.0%) | 0 (0.0%) |
| Material Moving | 0 (0.0%) | 0 (0.0%) |
| Total (Category) | 0 (0.0%) | 0 (0.0%) |
| Total (Overall) | 42 (54.5%) | 35 (45.5%) |
Employment Industries by Sex in Naukati Bay
Employment Industries in Naukati Bay
The major employment industries in Naukati Bay include Retail Trade (35 | 45.5%), Construction (23 | 29.9%), Utilities (10 | 13.0%), and Educational Services (9 | 11.7%).
Employment Industries by Sex in Naukati Bay
The Naukati Bay industries that see more men than women are Utilities (100.0%), Construction (56.5%), and Retail Trade (54.3%), whereas the industries that tend to have a higher number of women are Educational Services (100.0%), Retail Trade (45.7%), and Construction (43.5%).
| Industry | Male | Female |
| Agriculture, Fishing & Hunting | 0 (0.0%) | 0 (0.0%) |
| Mining, Quarrying, & Extraction | 0 (0.0%) | 0 (0.0%) |
| Construction | 13 (56.5%) | 10 (43.5%) |
| Manufacturing | 0 (0.0%) | 0 (0.0%) |
| Wholesale Trade | 0 (0.0%) | 0 (0.0%) |
| Retail Trade | 19 (54.3%) | 16 (45.7%) |
| Transportation & Warehousing | 0 (0.0%) | 0 (0.0%) |
| Utilities | 10 (100.0%) | 0 (0.0%) |
| Information | 0 (0.0%) | 0 (0.0%) |
| Finance & Insurance | 0 (0.0%) | 0 (0.0%) |
| Real Estate, Rental & Leasing | 0 (0.0%) | 0 (0.0%) |
| Professional & Scientific | 0 (0.0%) | 0 (0.0%) |
| Enterprise Management | 0 (0.0%) | 0 (0.0%) |
| Administrative & Support | 0 (0.0%) | 0 (0.0%) |
| Educational Services | 0 (0.0%) | 9 (100.0%) |
| Health Care & Social Assistance | 0 (0.0%) | 0 (0.0%) |
| Arts, Entertainment & Recreation | 0 (0.0%) | 0 (0.0%) |
| Accommodation & Food Services | 0 (0.0%) | 0 (0.0%) |
| Public Administration | 0 (0.0%) | 0 (0.0%) |
| Total | 42 (54.5%) | 35 (45.5%) |
Education in Naukati Bay
School Enrollment in Naukati Bay
| School Level | # Students | % Students |
| Nursery / Preschool | 0 | 0.0% |
| Kindergarten | 0 | 0.0% |
| Elementary School | 11 | 100.0% |
| Middle School | 0 | 0.0% |
| High School | 0 | 0.0% |
| College / Undergraduate | 0 | 0.0% |
| Graduate / Professional | 0 | 0.0% |
| Total | 11 | 100.0% |
School Enrollment by Age by Funding Source in Naukati Bay
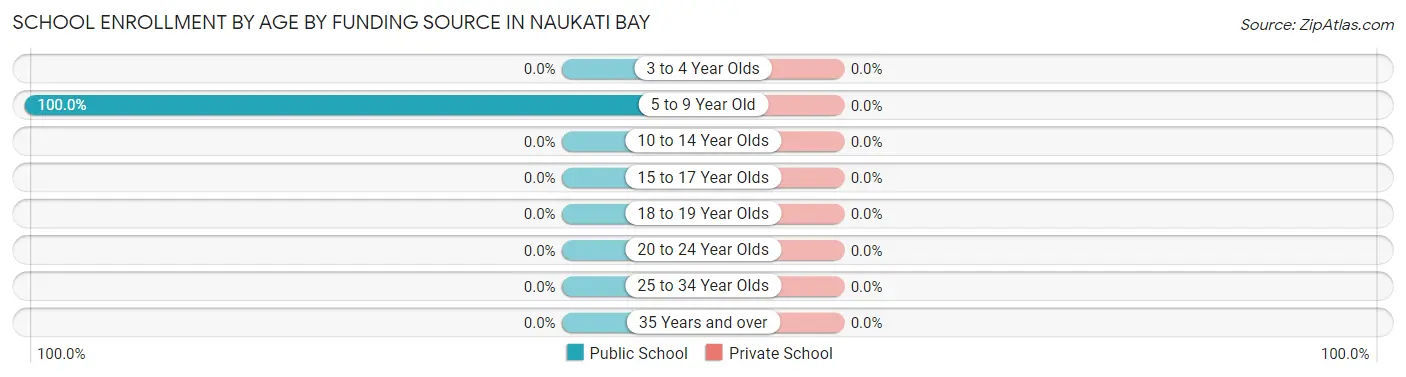
| Age Bracket | Public School | Private School |
| 3 to 4 Year Olds | 0 (0.0%) | 0 (0.0%) |
| 5 to 9 Year Old | 11 (100.0%) | 0 (0.0%) |
| 10 to 14 Year Olds | 0 (0.0%) | 0 (0.0%) |
| 15 to 17 Year Olds | 0 (0.0%) | 0 (0.0%) |
| 18 to 19 Year Olds | 0 (0.0%) | 0 (0.0%) |
| 20 to 24 Year Olds | 0 (0.0%) | 0 (0.0%) |
| 25 to 34 Year Olds | 0 (0.0%) | 0 (0.0%) |
| 35 Years and over | 0 (0.0%) | 0 (0.0%) |
| Total | 11 (100.0%) | 0 (0.0%) |
Educational Attainment by Field of Study in Naukati Bay
Business (10 | 26.3%), education (10 | 26.3%), bio, nature & agricultural (9 | 23.7%), and literature & languages (9 | 23.7%) are the most common fields of study among 38 individuals in Naukati Bay who have obtained a bachelor's degree or higher.
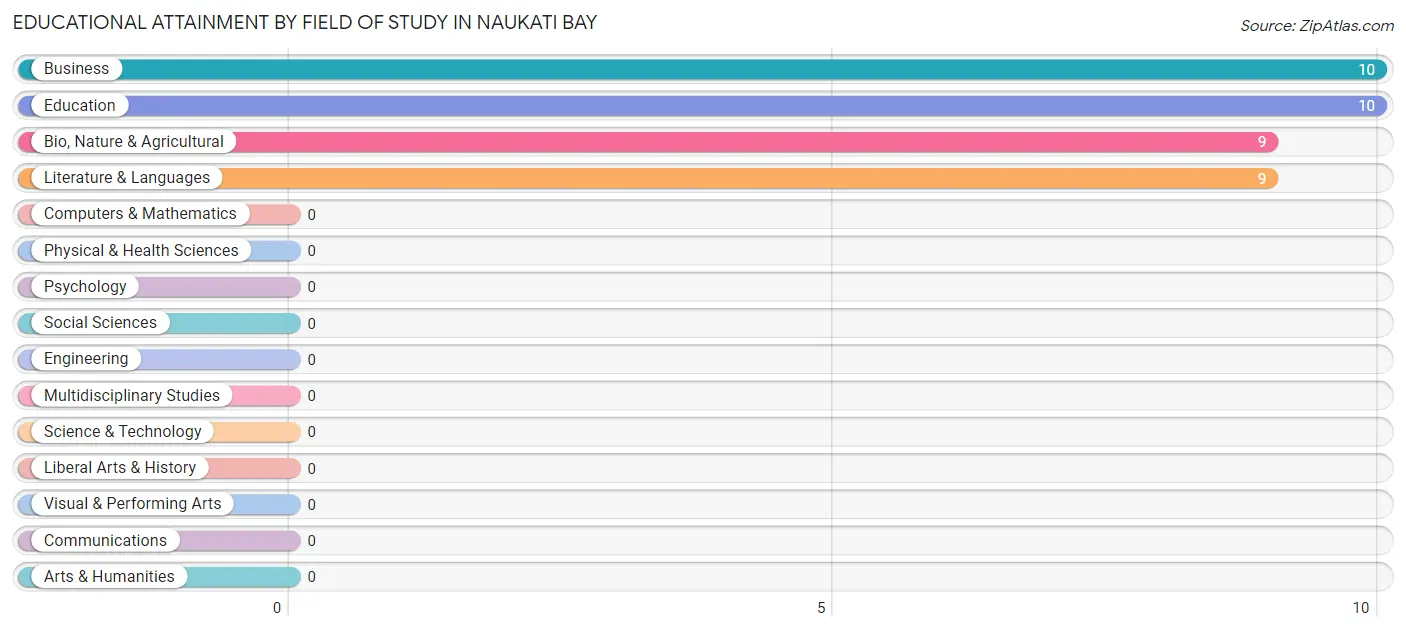
| Field of Study | # Graduates | % Graduates |
| Computers & Mathematics | 0 | 0.0% |
| Bio, Nature & Agricultural | 9 | 23.7% |
| Physical & Health Sciences | 0 | 0.0% |
| Psychology | 0 | 0.0% |
| Social Sciences | 0 | 0.0% |
| Engineering | 0 | 0.0% |
| Multidisciplinary Studies | 0 | 0.0% |
| Science & Technology | 0 | 0.0% |
| Business | 10 | 26.3% |
| Education | 10 | 26.3% |
| Literature & Languages | 9 | 23.7% |
| Liberal Arts & History | 0 | 0.0% |
| Visual & Performing Arts | 0 | 0.0% |
| Communications | 0 | 0.0% |
| Arts & Humanities | 0 | 0.0% |
| Total | 38 | 100.0% |
Transportation & Commute in Naukati Bay
Vehicle Availability by Sex in Naukati Bay
The most prevalent vehicle ownership categories in Naukati Bay are males with 2 vehicles (32, accounting for 76.2%) and females with 2 vehicles (35, making up 91.4%).
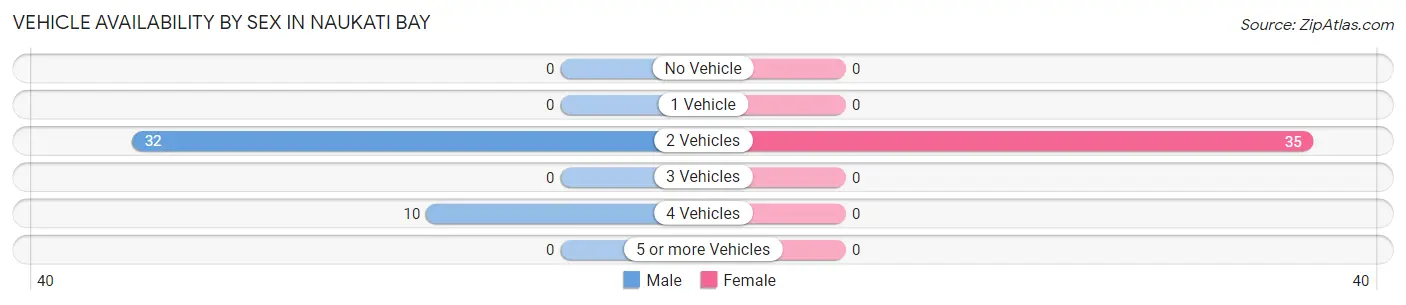
| Vehicles Available | Male | Female |
| No Vehicle | 0 (0.0%) | 0 (0.0%) |
| 1 Vehicle | 0 (0.0%) | 0 (0.0%) |
| 2 Vehicles | 32 (76.2%) | 35 (100.0%) |
| 3 Vehicles | 0 (0.0%) | 0 (0.0%) |
| 4 Vehicles | 10 (23.8%) | 0 (0.0%) |
| 5 or more Vehicles | 0 (0.0%) | 0 (0.0%) |
| Total | 42 (100.0%) | 35 (100.0%) |
Commute Time in Naukati Bay
The most frequently occuring commute durations in Naukati Bay are less than 5 minutes (35 commuters, 63.6%), 45 to 59 minutes (10 commuters, 18.2%), and 60 to 89 minutes (10 commuters, 18.2%).
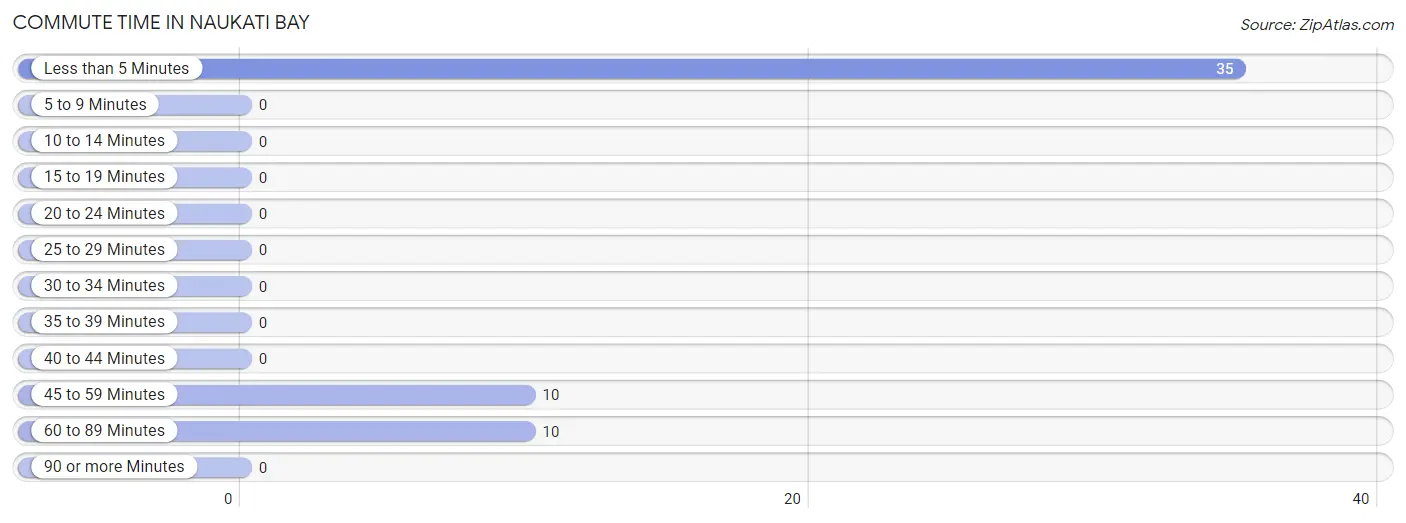
| Commute Time | # Commuters | % Commuters |
| Less than 5 Minutes | 35 | 63.6% |
| 5 to 9 Minutes | 0 | 0.0% |
| 10 to 14 Minutes | 0 | 0.0% |
| 15 to 19 Minutes | 0 | 0.0% |
| 20 to 24 Minutes | 0 | 0.0% |
| 25 to 29 Minutes | 0 | 0.0% |
| 30 to 34 Minutes | 0 | 0.0% |
| 35 to 39 Minutes | 0 | 0.0% |
| 40 to 44 Minutes | 0 | 0.0% |
| 45 to 59 Minutes | 10 | 18.2% |
| 60 to 89 Minutes | 10 | 18.2% |
| 90 or more Minutes | 0 | 0.0% |
Commute Time by Sex in Naukati Bay
The most common commute times in Naukati Bay are less than 5 minutes (19 commuters, 65.5%) for males and less than 5 minutes (16 commuters, 61.5%) for females.
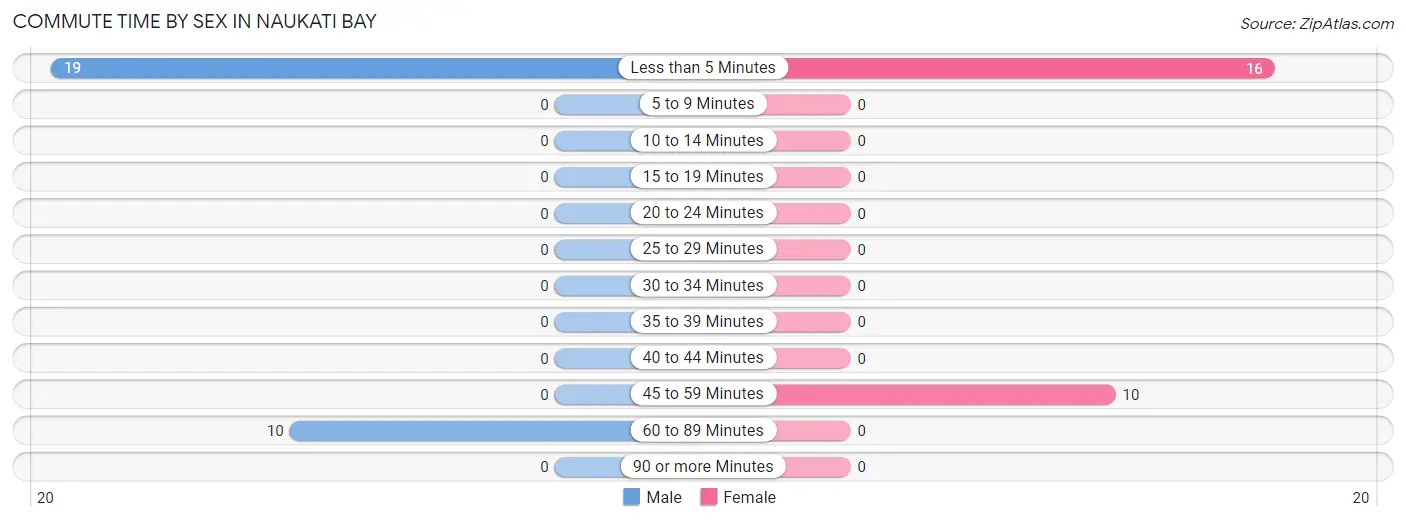
| Commute Time | Male | Female |
| Less than 5 Minutes | 19 (65.5%) | 16 (61.5%) |
| 5 to 9 Minutes | 0 (0.0%) | 0 (0.0%) |
| 10 to 14 Minutes | 0 (0.0%) | 0 (0.0%) |
| 15 to 19 Minutes | 0 (0.0%) | 0 (0.0%) |
| 20 to 24 Minutes | 0 (0.0%) | 0 (0.0%) |
| 25 to 29 Minutes | 0 (0.0%) | 0 (0.0%) |
| 30 to 34 Minutes | 0 (0.0%) | 0 (0.0%) |
| 35 to 39 Minutes | 0 (0.0%) | 0 (0.0%) |
| 40 to 44 Minutes | 0 (0.0%) | 0 (0.0%) |
| 45 to 59 Minutes | 0 (0.0%) | 10 (38.5%) |
| 60 to 89 Minutes | 10 (34.5%) | 0 (0.0%) |
| 90 or more Minutes | 0 (0.0%) | 0 (0.0%) |
Time of Departure to Work by Sex in Naukati Bay
The most frequent times of departure to work in Naukati Bay are 8:00 AM to 8:29 AM (19, 65.5%) for males and 9:00 AM to 9:59 AM (16, 61.5%) for females.
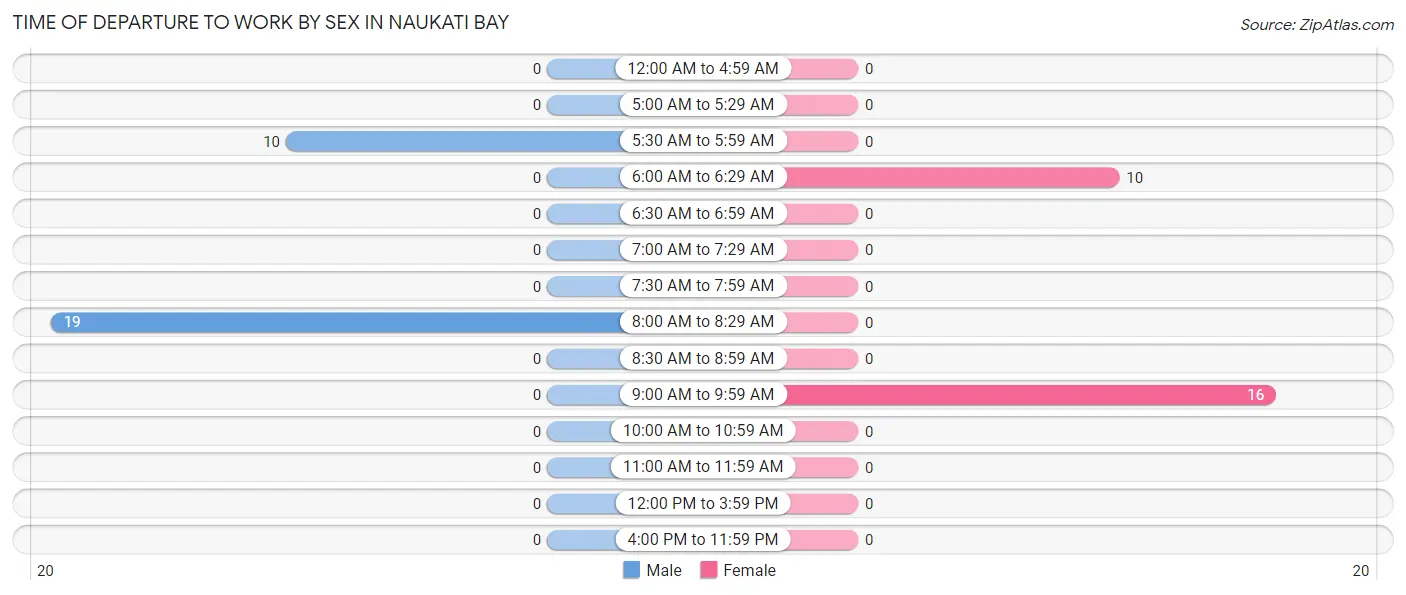
| Time of Departure | Male | Female |
| 12:00 AM to 4:59 AM | 0 (0.0%) | 0 (0.0%) |
| 5:00 AM to 5:29 AM | 0 (0.0%) | 0 (0.0%) |
| 5:30 AM to 5:59 AM | 10 (34.5%) | 0 (0.0%) |
| 6:00 AM to 6:29 AM | 0 (0.0%) | 10 (38.5%) |
| 6:30 AM to 6:59 AM | 0 (0.0%) | 0 (0.0%) |
| 7:00 AM to 7:29 AM | 0 (0.0%) | 0 (0.0%) |
| 7:30 AM to 7:59 AM | 0 (0.0%) | 0 (0.0%) |
| 8:00 AM to 8:29 AM | 19 (65.5%) | 0 (0.0%) |
| 8:30 AM to 8:59 AM | 0 (0.0%) | 0 (0.0%) |
| 9:00 AM to 9:59 AM | 0 (0.0%) | 16 (61.5%) |
| 10:00 AM to 10:59 AM | 0 (0.0%) | 0 (0.0%) |
| 11:00 AM to 11:59 AM | 0 (0.0%) | 0 (0.0%) |
| 12:00 PM to 3:59 PM | 0 (0.0%) | 0 (0.0%) |
| 4:00 PM to 11:59 PM | 0 (0.0%) | 0 (0.0%) |
| Total | 29 (100.0%) | 26 (100.0%) |
Housing Occupancy in Naukati Bay
Occupancy by Ownership in Naukati Bay
Of the total 52 dwellings in Naukati Bay, owner-occupied units account for 18 (34.6%), while renter-occupied units make up 34 (65.4%).
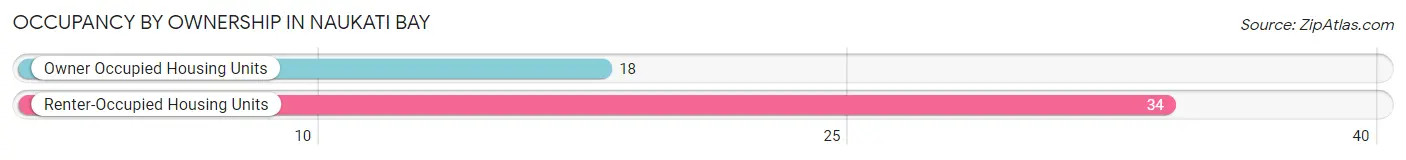
| Occupancy | # Housing Units | % Housing Units |
| Owner Occupied Housing Units | 18 | 34.6% |
| Renter-Occupied Housing Units | 34 | 65.4% |
| Total Occupied Housing Units | 52 | 100.0% |
Occupancy by Household Size in Naukati Bay
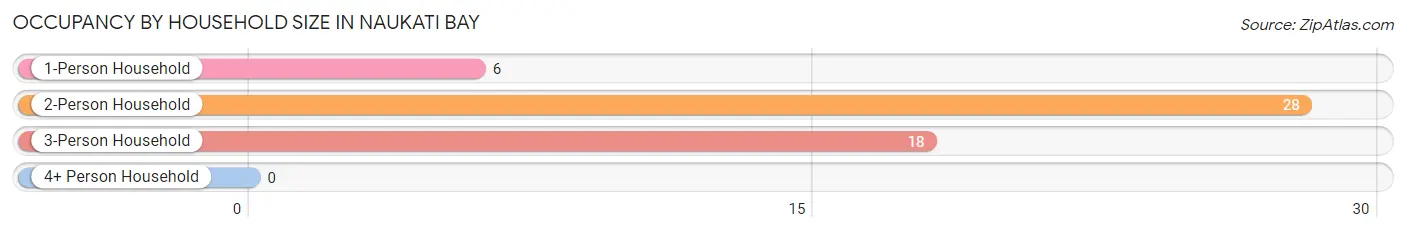
| Household Size | # Housing Units | % Housing Units |
| 1-Person Household | 6 | 11.5% |
| 2-Person Household | 28 | 53.8% |
| 3-Person Household | 18 | 34.6% |
| 4+ Person Household | 0 | 0.0% |
| Total Housing Units | 52 | 100.0% |
Occupancy by Ownership by Household Size in Naukati Bay
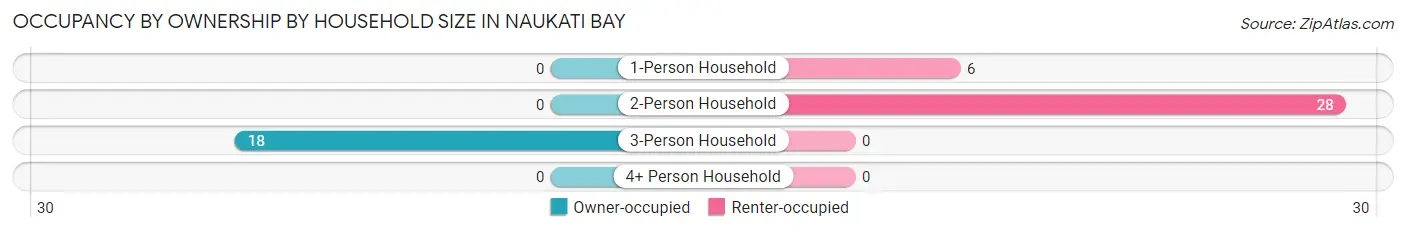
| Household Size | Owner-occupied | Renter-occupied |
| 1-Person Household | 0 (0.0%) | 6 (100.0%) |
| 2-Person Household | 0 (0.0%) | 28 (100.0%) |
| 3-Person Household | 18 (100.0%) | 0 (0.0%) |
| 4+ Person Household | 0 (0.0%) | 0 (0.0%) |
| Total Housing Units | 18 (34.6%) | 34 (65.4%) |
Occupancy by Educational Attainment in Naukati Bay
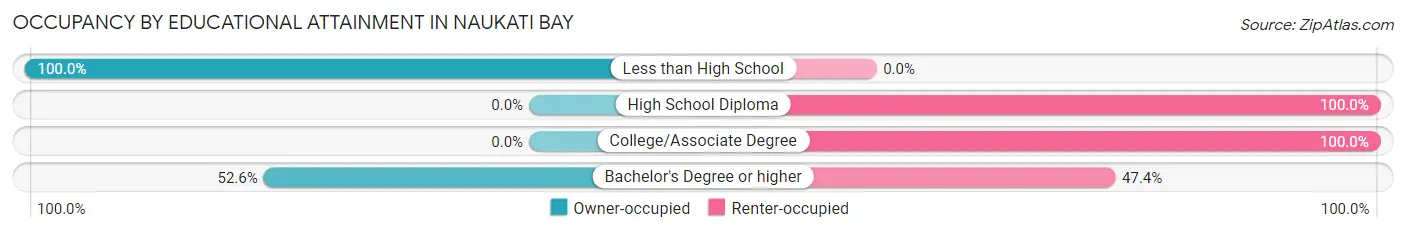
| Household Size | Owner-occupied | Renter-occupied |
| Less than High School | 8 (100.0%) | 0 (0.0%) |
| High School Diploma | 0 (0.0%) | 6 (100.0%) |
| College/Associate Degree | 0 (0.0%) | 19 (100.0%) |
| Bachelor's Degree or higher | 10 (52.6%) | 9 (47.4%) |
Occupancy by Age of Householder in Naukati Bay
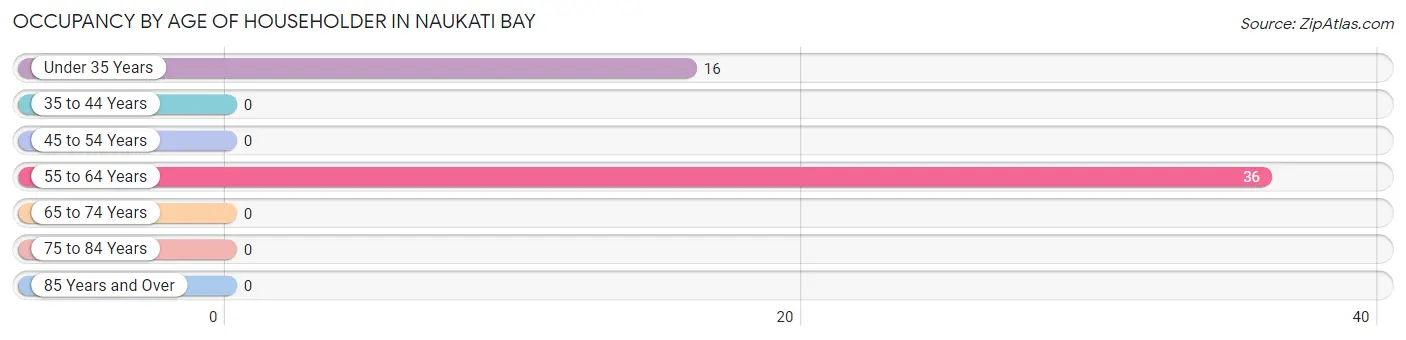
| Age Bracket | # Households | % Households |
| Under 35 Years | 16 | 30.8% |
| 35 to 44 Years | 0 | 0.0% |
| 45 to 54 Years | 0 | 0.0% |
| 55 to 64 Years | 36 | 69.2% |
| 65 to 74 Years | 0 | 0.0% |
| 75 to 84 Years | 0 | 0.0% |
| 85 Years and Over | 0 | 0.0% |
| Total | 52 | 100.0% |
Housing Finances in Naukati Bay
Median Income by Occupancy in Naukati Bay
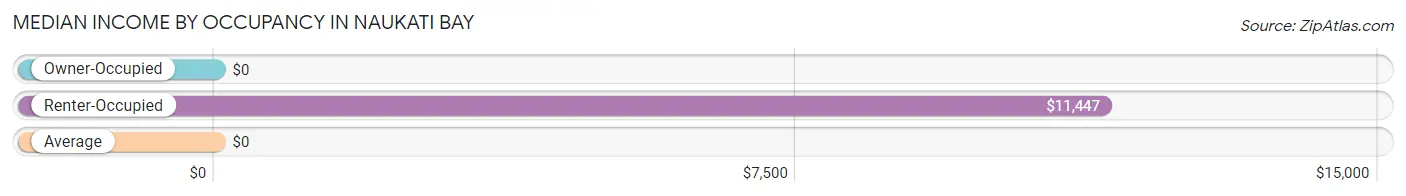
| Occupancy Type | # Households | Median Income |
| Owner-Occupied | 18 (34.6%) | $0 |
| Renter-Occupied | 34 (65.4%) | $11,447 |
| Average | 52 (100.0%) | $0 |
Occupancy by Householder Income Bracket in Naukati Bay
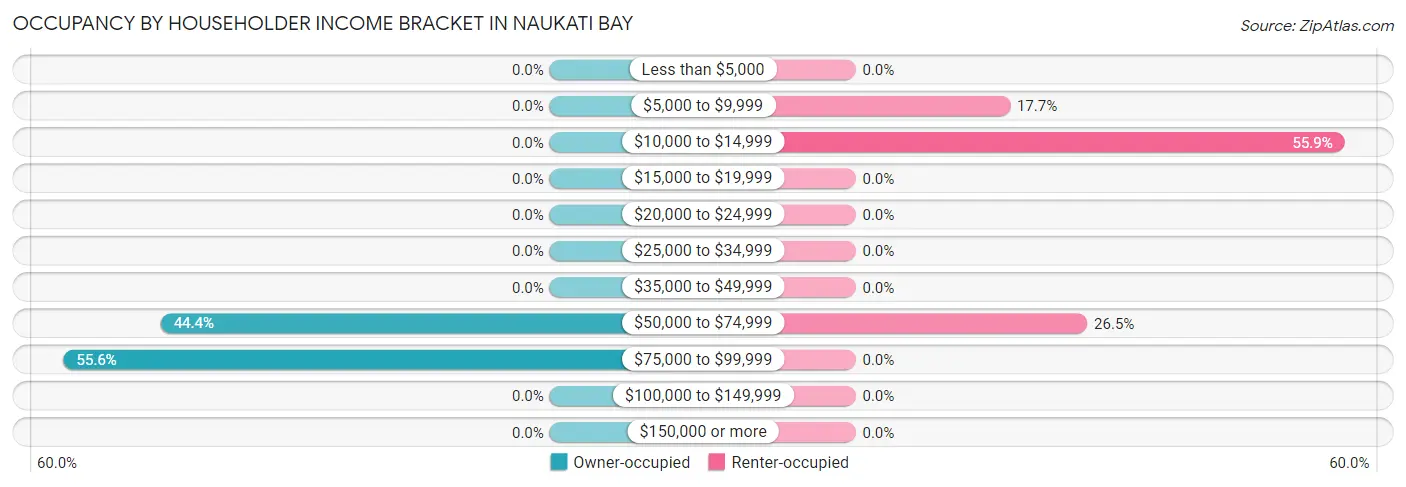
| Income Bracket | Owner-occupied | Renter-occupied |
| Less than $5,000 | 0 (0.0%) | 0 (0.0%) |
| $5,000 to $9,999 | 0 (0.0%) | 6 (17.6%) |
| $10,000 to $14,999 | 0 (0.0%) | 19 (55.9%) |
| $15,000 to $19,999 | 0 (0.0%) | 0 (0.0%) |
| $20,000 to $24,999 | 0 (0.0%) | 0 (0.0%) |
| $25,000 to $34,999 | 0 (0.0%) | 0 (0.0%) |
| $35,000 to $49,999 | 0 (0.0%) | 0 (0.0%) |
| $50,000 to $74,999 | 8 (44.4%) | 9 (26.5%) |
| $75,000 to $99,999 | 10 (55.6%) | 0 (0.0%) |
| $100,000 to $149,999 | 0 (0.0%) | 0 (0.0%) |
| $150,000 or more | 0 (0.0%) | 0 (0.0%) |
| Total | 18 (100.0%) | 34 (100.0%) |
Monthly Housing Cost Tiers in Naukati Bay
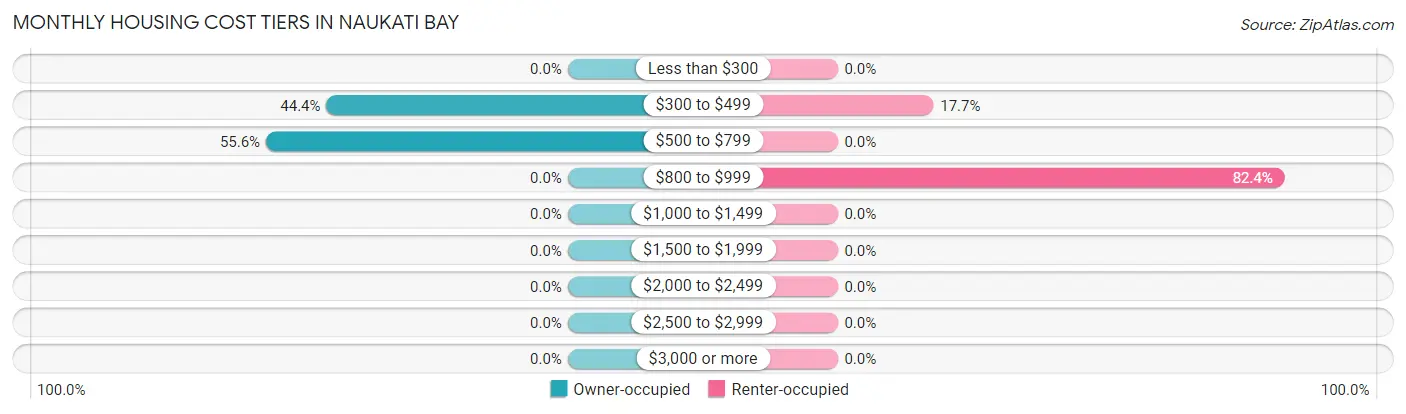
| Monthly Cost | Owner-occupied | Renter-occupied |
| Less than $300 | 0 (0.0%) | 0 (0.0%) |
| $300 to $499 | 8 (44.4%) | 6 (17.6%) |
| $500 to $799 | 10 (55.6%) | 0 (0.0%) |
| $800 to $999 | 0 (0.0%) | 28 (82.4%) |
| $1,000 to $1,499 | 0 (0.0%) | 0 (0.0%) |
| $1,500 to $1,999 | 0 (0.0%) | 0 (0.0%) |
| $2,000 to $2,499 | 0 (0.0%) | 0 (0.0%) |
| $2,500 to $2,999 | 0 (0.0%) | 0 (0.0%) |
| $3,000 or more | 0 (0.0%) | 0 (0.0%) |
| Total | 18 (100.0%) | 34 (100.0%) |
Physical Housing Characteristics in Naukati Bay
Housing Structures in Naukati Bay
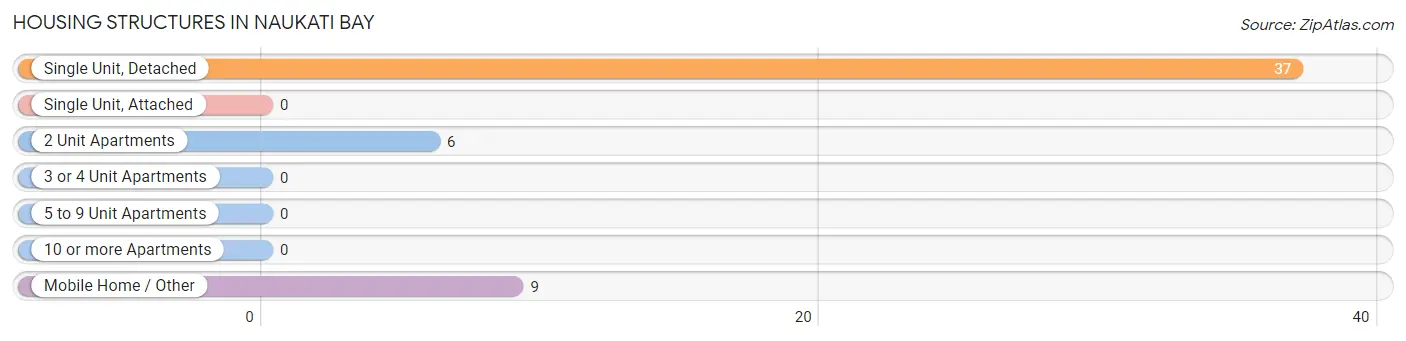
| Structure Type | # Housing Units | % Housing Units |
| Single Unit, Detached | 37 | 71.2% |
| Single Unit, Attached | 0 | 0.0% |
| 2 Unit Apartments | 6 | 11.5% |
| 3 or 4 Unit Apartments | 0 | 0.0% |
| 5 to 9 Unit Apartments | 0 | 0.0% |
| 10 or more Apartments | 0 | 0.0% |
| Mobile Home / Other | 9 | 17.3% |
| Total | 52 | 100.0% |
Housing Structures by Occupancy in Naukati Bay
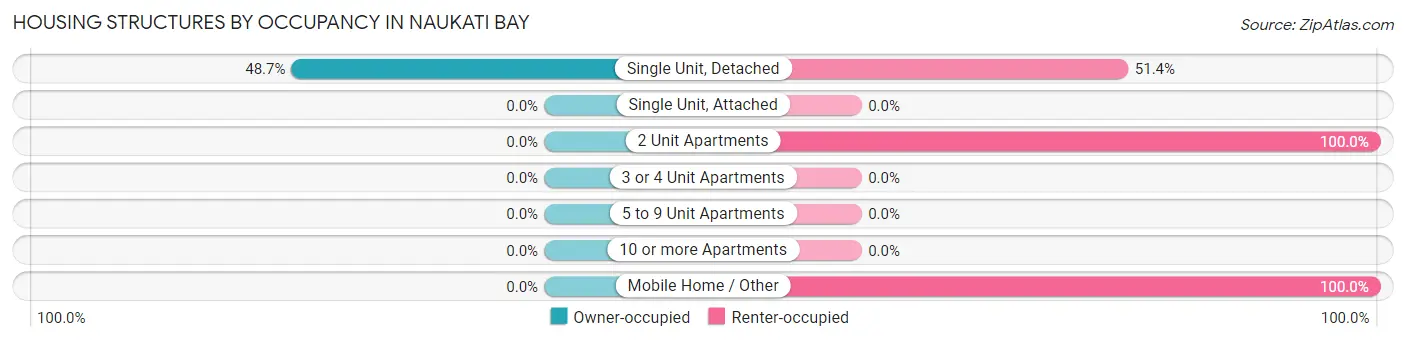
| Structure Type | Owner-occupied | Renter-occupied |
| Single Unit, Detached | 18 (48.6%) | 19 (51.3%) |
| Single Unit, Attached | 0 (0.0%) | 0 (0.0%) |
| 2 Unit Apartments | 0 (0.0%) | 6 (100.0%) |
| 3 or 4 Unit Apartments | 0 (0.0%) | 0 (0.0%) |
| 5 to 9 Unit Apartments | 0 (0.0%) | 0 (0.0%) |
| 10 or more Apartments | 0 (0.0%) | 0 (0.0%) |
| Mobile Home / Other | 0 (0.0%) | 9 (100.0%) |
| Total | 18 (34.6%) | 34 (65.4%) |
Housing Structures by Number of Rooms in Naukati Bay
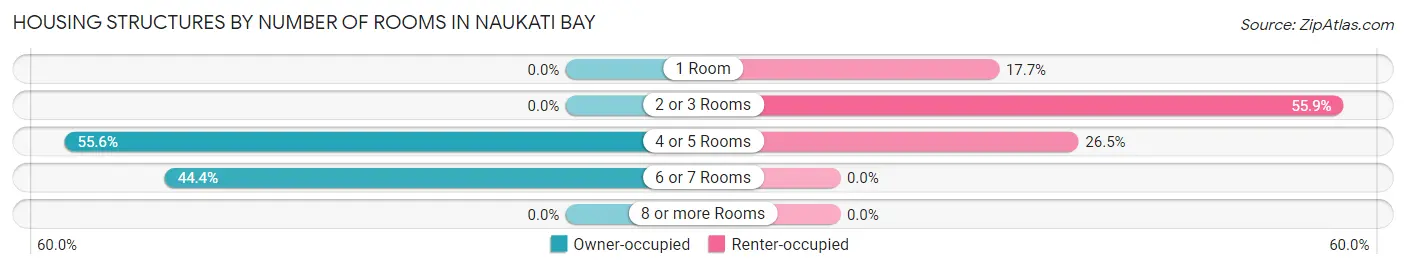
| Number of Rooms | Owner-occupied | Renter-occupied |
| 1 Room | 0 (0.0%) | 6 (17.6%) |
| 2 or 3 Rooms | 0 (0.0%) | 19 (55.9%) |
| 4 or 5 Rooms | 10 (55.6%) | 9 (26.5%) |
| 6 or 7 Rooms | 8 (44.4%) | 0 (0.0%) |
| 8 or more Rooms | 0 (0.0%) | 0 (0.0%) |
| Total | 18 (100.0%) | 34 (100.0%) |
Housing Structure by Heating Type in Naukati Bay
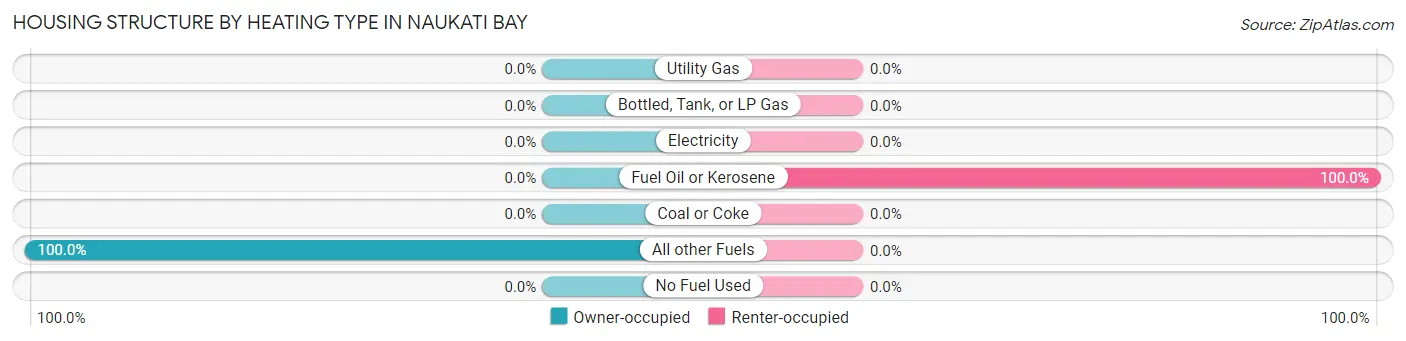
| Heating Type | Owner-occupied | Renter-occupied |
| Utility Gas | 0 (0.0%) | 0 (0.0%) |
| Bottled, Tank, or LP Gas | 0 (0.0%) | 0 (0.0%) |
| Electricity | 0 (0.0%) | 0 (0.0%) |
| Fuel Oil or Kerosene | 0 (0.0%) | 34 (100.0%) |
| Coal or Coke | 0 (0.0%) | 0 (0.0%) |
| All other Fuels | 18 (100.0%) | 0 (0.0%) |
| No Fuel Used | 0 (0.0%) | 0 (0.0%) |
| Total | 18 (100.0%) | 34 (100.0%) |
Household Vehicle Usage in Naukati Bay
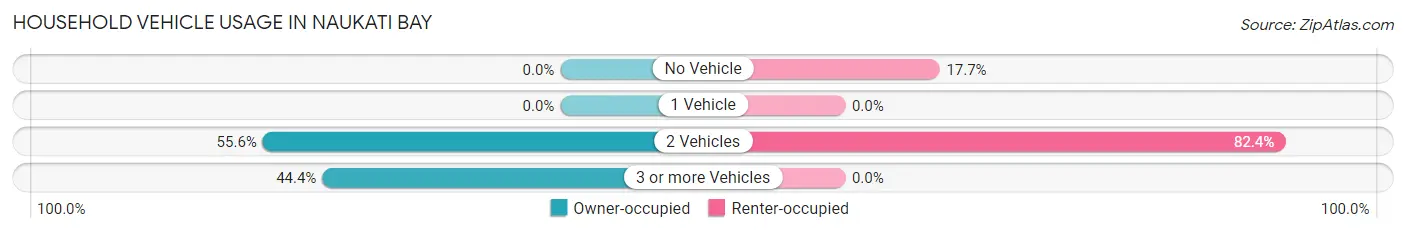
| Vehicles per Household | Owner-occupied | Renter-occupied |
| No Vehicle | 0 (0.0%) | 6 (17.6%) |
| 1 Vehicle | 0 (0.0%) | 0 (0.0%) |
| 2 Vehicles | 10 (55.6%) | 28 (82.4%) |
| 3 or more Vehicles | 8 (44.4%) | 0 (0.0%) |
| Total | 18 (100.0%) | 34 (100.0%) |
Real Estate & Mortgages in Naukati Bay
Real Estate and Mortgage Overview in Naukati Bay
| Characteristic | Without Mortgage | With Mortgage |
| Housing Units | 8 | 10 |
| Median Property Value | - | - |
| Median Household Income | - | - |
| Monthly Housing Costs | - | - |
| Real Estate Taxes | - | - |
Property Value by Mortgage Status in Naukati Bay
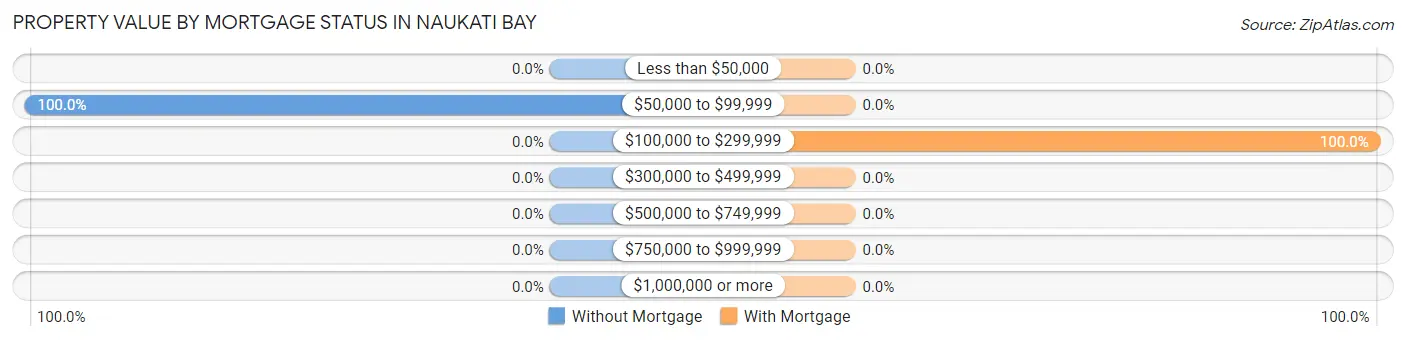
| Property Value | Without Mortgage | With Mortgage |
| Less than $50,000 | 0 (0.0%) | 0 (0.0%) |
| $50,000 to $99,999 | 8 (100.0%) | 0 (0.0%) |
| $100,000 to $299,999 | 0 (0.0%) | 10 (100.0%) |
| $300,000 to $499,999 | 0 (0.0%) | 0 (0.0%) |
| $500,000 to $749,999 | 0 (0.0%) | 0 (0.0%) |
| $750,000 to $999,999 | 0 (0.0%) | 0 (0.0%) |
| $1,000,000 or more | 0 (0.0%) | 0 (0.0%) |
| Total | 8 (100.0%) | 10 (100.0%) |
Household Income by Mortgage Status in Naukati Bay
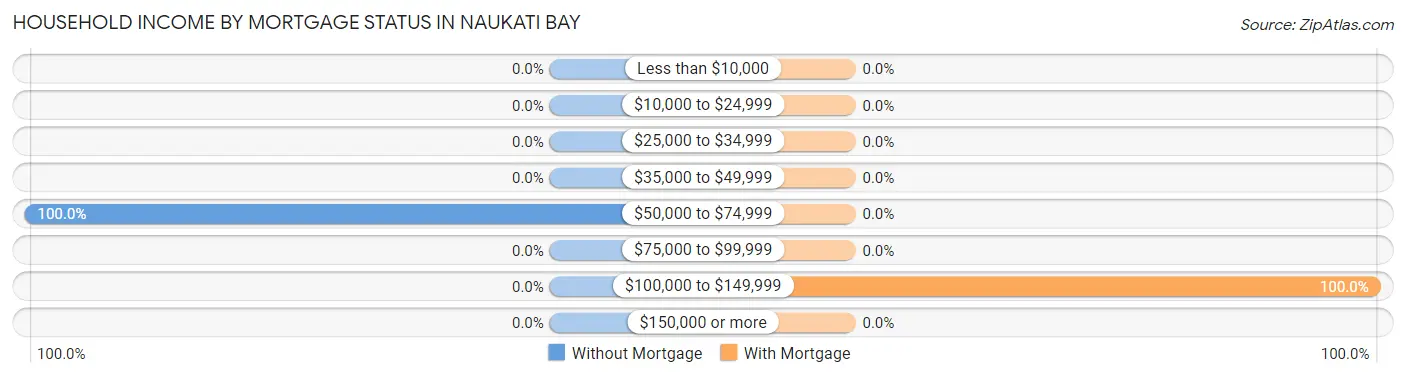
| Household Income | Without Mortgage | With Mortgage |
| Less than $10,000 | 0 (0.0%) | 0 (0.0%) |
| $10,000 to $24,999 | 0 (0.0%) | 0 (0.0%) |
| $25,000 to $34,999 | 0 (0.0%) | 0 (0.0%) |
| $35,000 to $49,999 | 0 (0.0%) | 0 (0.0%) |
| $50,000 to $74,999 | 8 (100.0%) | 0 (0.0%) |
| $75,000 to $99,999 | 0 (0.0%) | 0 (0.0%) |
| $100,000 to $149,999 | 0 (0.0%) | 10 (100.0%) |
| $150,000 or more | 0 (0.0%) | 0 (0.0%) |
| Total | 8 (100.0%) | 10 (100.0%) |
Property Value to Household Income Ratio in Naukati Bay
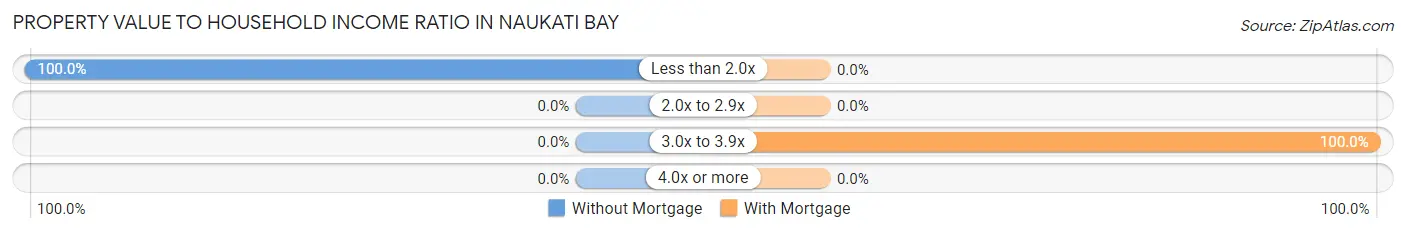
| Value-to-Income Ratio | Without Mortgage | With Mortgage |
| Less than 2.0x | 8 (100.0%) | 0 (0.0%) |
| 2.0x to 2.9x | 0 (0.0%) | 0 (0.0%) |
| 3.0x to 3.9x | 0 (0.0%) | 10 (100.0%) |
| 4.0x or more | 0 (0.0%) | 0 (0.0%) |
| Total | 8 (100.0%) | 10 (100.0%) |
Real Estate Taxes by Mortgage Status in Naukati Bay
| Property Taxes | Without Mortgage | With Mortgage |
| Less than $800 | 0 (0.0%) | 0 (0.0%) |
| $800 to $1,499 | 0 (0.0%) | 0 (0.0%) |
| $800 to $1,499 | 0 (0.0%) | 0 (0.0%) |
| Total | 8 (100.0%) | 10 (100.0%) |
Health & Disability in Naukati Bay
Health Insurance Coverage by Age in Naukati Bay
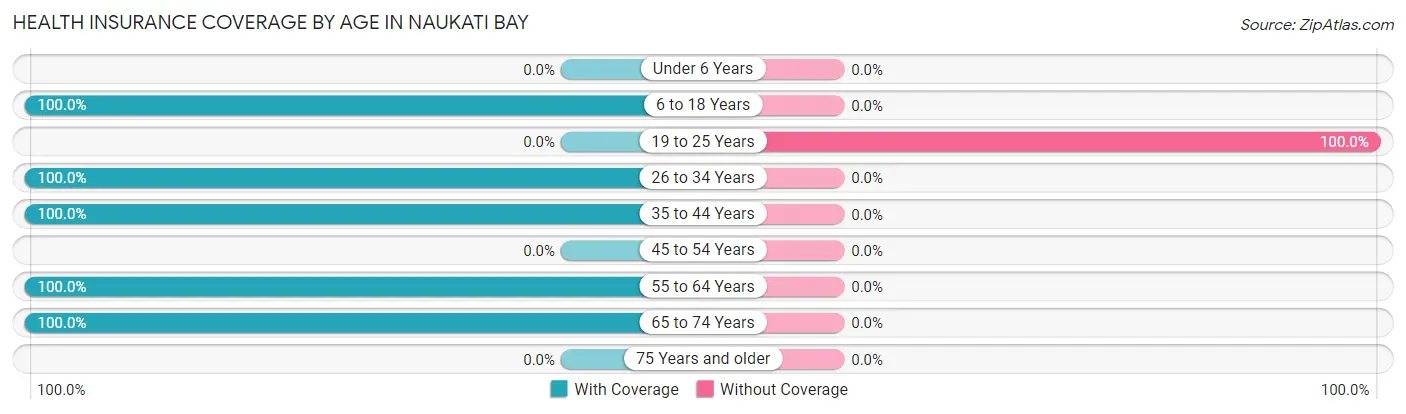
| Age Bracket | With Coverage | Without Coverage |
| Under 6 Years | 0 (0.0%) | 0 (0.0%) |
| 6 to 18 Years | 11 (100.0%) | 0 (0.0%) |
| 19 to 25 Years | 0 (0.0%) | 10 (100.0%) |
| 26 to 34 Years | 16 (100.0%) | 0 (0.0%) |
| 35 to 44 Years | 13 (100.0%) | 0 (0.0%) |
| 45 to 54 Years | 0 (0.0%) | 0 (0.0%) |
| 55 to 64 Years | 62 (100.0%) | 0 (0.0%) |
| 65 to 74 Years | 8 (100.0%) | 0 (0.0%) |
| 75 Years and older | 0 (0.0%) | 0 (0.0%) |
| Total | 110 (91.7%) | 10 (8.3%) |
Health Insurance Coverage by Citizenship Status in Naukati Bay
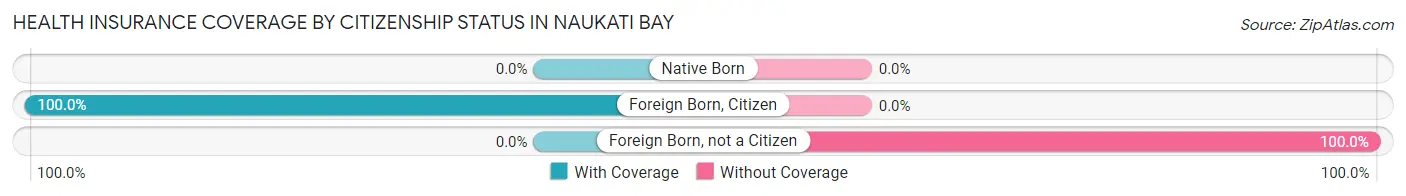
| Citizenship Status | With Coverage | Without Coverage |
| Native Born | 0 (0.0%) | 0 (0.0%) |
| Foreign Born, Citizen | 11 (100.0%) | 0 (0.0%) |
| Foreign Born, not a Citizen | 0 (0.0%) | 10 (100.0%) |
Health Insurance Coverage by Household Income in Naukati Bay
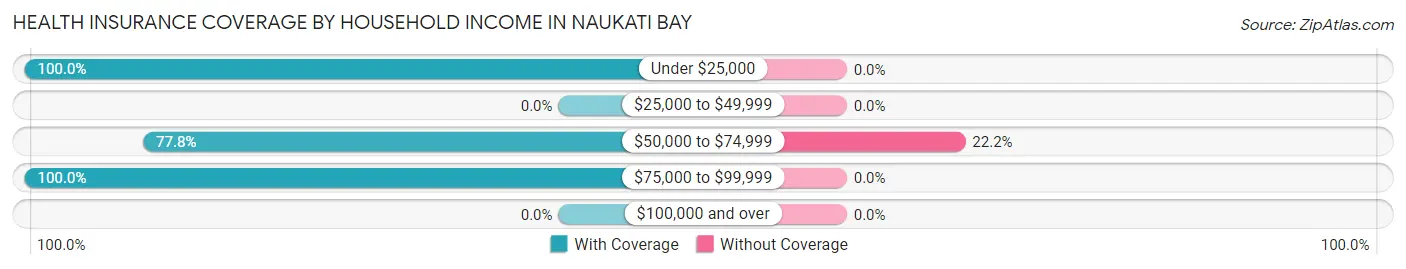
| Household Income | With Coverage | Without Coverage |
| Under $25,000 | 41 (100.0%) | 0 (0.0%) |
| $25,000 to $49,999 | 0 (0.0%) | 0 (0.0%) |
| $50,000 to $74,999 | 35 (77.8%) | 10 (22.2%) |
| $75,000 to $99,999 | 34 (100.0%) | 0 (0.0%) |
| $100,000 and over | 0 (0.0%) | 0 (0.0%) |
Public vs Private Health Insurance Coverage by Age in Naukati Bay
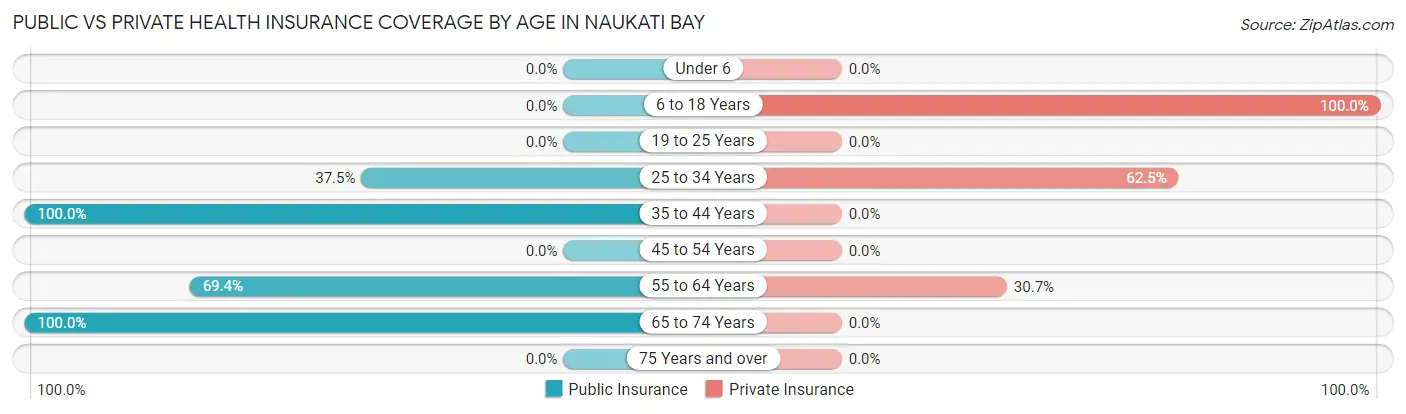
| Age Bracket | Public Insurance | Private Insurance |
| Under 6 | 0 (0.0%) | 0 (0.0%) |
| 6 to 18 Years | 0 (0.0%) | 11 (100.0%) |
| 19 to 25 Years | 0 (0.0%) | 0 (0.0%) |
| 25 to 34 Years | 6 (37.5%) | 10 (62.5%) |
| 35 to 44 Years | 13 (100.0%) | 0 (0.0%) |
| 45 to 54 Years | 0 (0.0%) | 0 (0.0%) |
| 55 to 64 Years | 43 (69.4%) | 19 (30.6%) |
| 65 to 74 Years | 8 (100.0%) | 0 (0.0%) |
| 75 Years and over | 0 (0.0%) | 0 (0.0%) |
| Total | 70 (58.3%) | 40 (33.3%) |
Disability Status by Sex by Age in Naukati Bay
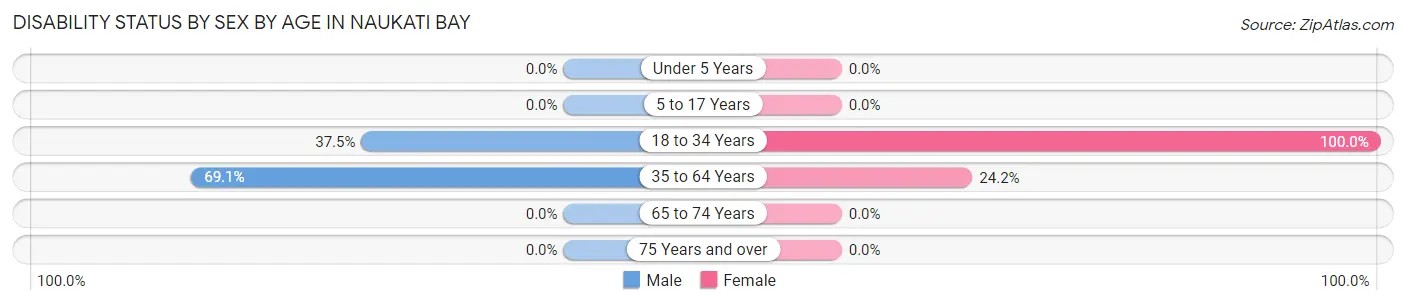
| Age Bracket | Male | Female |
| Under 5 Years | 0 (0.0%) | 0 (0.0%) |
| 5 to 17 Years | 0 (0.0%) | 0 (0.0%) |
| 18 to 34 Years | 6 (37.5%) | 10 (100.0%) |
| 35 to 64 Years | 29 (69.1%) | 8 (24.2%) |
| 65 to 74 Years | 0 (0.0%) | 0 (0.0%) |
| 75 Years and over | 0 (0.0%) | 0 (0.0%) |
Disability Class by Sex by Age in Naukati Bay
Disability Class: Hearing Difficulty
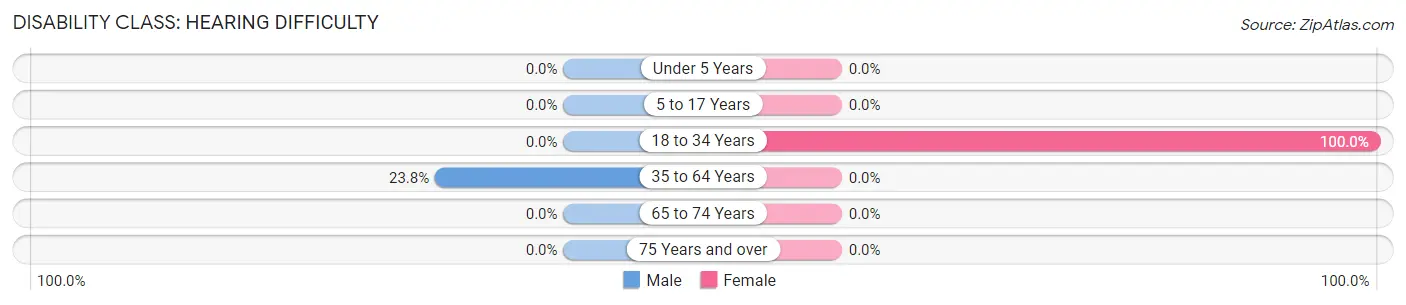
| Age Bracket | Male | Female |
| Under 5 Years | 0 (0.0%) | 0 (0.0%) |
| 5 to 17 Years | 0 (0.0%) | 0 (0.0%) |
| 18 to 34 Years | 0 (0.0%) | 10 (100.0%) |
| 35 to 64 Years | 10 (23.8%) | 0 (0.0%) |
| 65 to 74 Years | 0 (0.0%) | 0 (0.0%) |
| 75 Years and over | 0 (0.0%) | 0 (0.0%) |
Disability Class: Vision Difficulty
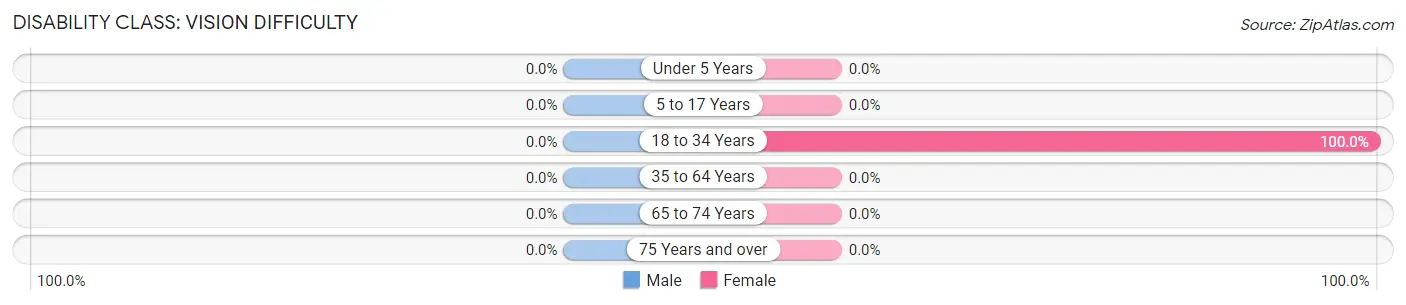
| Age Bracket | Male | Female |
| Under 5 Years | 0 (0.0%) | 0 (0.0%) |
| 5 to 17 Years | 0 (0.0%) | 0 (0.0%) |
| 18 to 34 Years | 0 (0.0%) | 10 (100.0%) |
| 35 to 64 Years | 0 (0.0%) | 0 (0.0%) |
| 65 to 74 Years | 0 (0.0%) | 0 (0.0%) |
| 75 Years and over | 0 (0.0%) | 0 (0.0%) |
Disability Class: Cognitive Difficulty
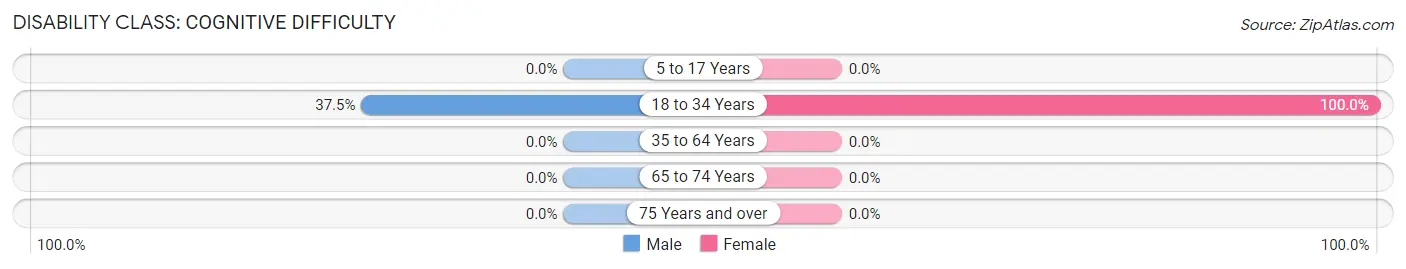
| Age Bracket | Male | Female |
| 5 to 17 Years | 0 (0.0%) | 0 (0.0%) |
| 18 to 34 Years | 6 (37.5%) | 10 (100.0%) |
| 35 to 64 Years | 0 (0.0%) | 0 (0.0%) |
| 65 to 74 Years | 0 (0.0%) | 0 (0.0%) |
| 75 Years and over | 0 (0.0%) | 0 (0.0%) |
Disability Class: Ambulatory Difficulty
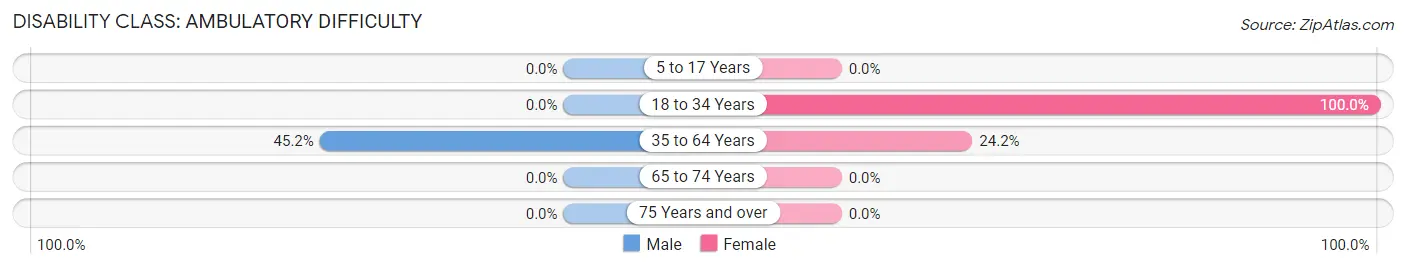
| Age Bracket | Male | Female |
| 5 to 17 Years | 0 (0.0%) | 0 (0.0%) |
| 18 to 34 Years | 0 (0.0%) | 10 (100.0%) |
| 35 to 64 Years | 19 (45.2%) | 8 (24.2%) |
| 65 to 74 Years | 0 (0.0%) | 0 (0.0%) |
| 75 Years and over | 0 (0.0%) | 0 (0.0%) |
Disability Class: Self-Care Difficulty
| Age Bracket | Male | Female |
| 5 to 17 Years | 0 (0.0%) | 0 (0.0%) |
| 18 to 34 Years | 0 (0.0%) | 10 (100.0%) |
| 35 to 64 Years | 0 (0.0%) | 0 (0.0%) |
| 65 to 74 Years | 0 (0.0%) | 0 (0.0%) |
| 75 Years and over | 0 (0.0%) | 0 (0.0%) |
Technology Access in Naukati Bay
Computing Device Access in Naukati Bay
| Device Type | # Households | % Households |
| Desktop or Laptop | 52 | 100.0% |
| Smartphone | 19 | 36.5% |
| Tablet | 18 | 34.6% |
| No Computing Device | 0 | 0.0% |
| Total | 52 | 100.0% |
Internet Access in Naukati Bay
| Internet Type | # Households | % Households |
| Dial-Up Internet | 0 | 0.0% |
| Broadband Home | 43 | 82.7% |
| Cellular Data Only | 0 | 0.0% |
| Satellite Internet | 10 | 19.2% |
| No Internet | 9 | 17.3% |
| Total | 52 | 100.0% |
Naukati Bay Summary
Naukati Bay is a small unincorporated community located on the western coast of Prince of Wales Island in the Alexander Archipelago of southeastern Alaska. It is situated on the northern shore of the bay of the same name, which is part of the larger Clarence Strait. The community is located approximately 40 miles (64 km) southwest of Ketchikan and is accessible only by boat or floatplane.
History
The area around Naukati Bay has been inhabited by the Tlingit people for centuries. The bay was first charted by the British explorer George Vancouver in 1793. In the late 19th century, the area was settled by a small group of Scandinavian immigrants, who established a fishing and logging camp. The community was officially established in the early 1900s and was named after the bay.
Geography
Naukati Bay is located on the northern shore of the bay of the same name, which is part of the larger Clarence Strait. The bay is approximately 4 miles (6 km) long and 1 mile (1.6 km) wide. The community is surrounded by the Tongass National Forest and is situated at an elevation of approximately 20 feet (6 m).
Economy
The economy of Naukati Bay is largely based on fishing and logging. The community is home to several commercial fishing operations, which harvest salmon, halibut, and other species. Logging is also an important industry in the area, with several logging companies operating in the region. Tourism is also an important part of the local economy, with visitors coming to the area to enjoy the natural beauty and recreational opportunities.
Demographics
As of the 2010 census, the population of Naukati Bay was estimated to be approximately 200 people. The majority of the population is of Native American descent, with the Tlingit people making up the largest ethnic group. The median household income in the community is approximately $30,000, and the median age is 44 years.
Conclusion
Naukati Bay is a small unincorporated community located on the western coast of Prince of Wales Island in the Alexander Archipelago of southeastern Alaska. The economy of the community is largely based on fishing and logging, and tourism is also an important part of the local economy. The population of the community is primarily of Native American descent, with the Tlingit people making up the largest ethnic group.
Common Questions
What is Per Capita Income in Naukati Bay?
Per Capita income in Naukati Bay is $18,933.
What is Inequality or Gini Index in Naukati Bay?
Inequality or Gini Index in Naukati Bay is 0.41.
What is the Total Population of Naukati Bay?
Total Population of Naukati Bay is 120.
What is the Total Male Population of Naukati Bay?
Total Male Population of Naukati Bay is 77.
What is the Total Female Population of Naukati Bay?
Total Female Population of Naukati Bay is 43.
What is the Ratio of Males per 100 Females in Naukati Bay?
There are 179.07 Males per 100 Females in Naukati Bay.
What is the Ratio of Females per 100 Males in Naukati Bay?
There are 55.84 Females per 100 Males in Naukati Bay.
What is the Median Population Age in Naukati Bay?
Median Population Age in Naukati Bay is 58.3 Years.
What is the Average Family Size in Naukati Bay
Average Family Size in Naukati Bay is 2.2 People.
What is the Average Household Size in Naukati Bay
Average Household Size in Naukati Bay is 2.3 People.
How Large is the Labor Force in Naukati Bay?
There are 77 People in the Labor Forcein in Naukati Bay.
What is the Percentage of People in the Labor Force in Naukati Bay?
70.6% of People are in the Labor Force in Naukati Bay.