Enterprise, OR Map & Demographics
Enterprise Map
Enterprise Overview
$36,878
PER CAPITA INCOME
$73,090
AVG FAMILY INCOME
$53,750
AVG HOUSEHOLD INCOME
2.1%
WAGE / INCOME GAP [ % ]
97.9¢/ $1
WAGE / INCOME GAP [ $ ]
0.56
INEQUALITY / GINI INDEX
2,172
TOTAL POPULATION
1,032
MALE POPULATION
1,140
FEMALE POPULATION
90.53
MALES / 100 FEMALES
110.47
FEMALES / 100 MALES
39.8
MEDIAN AGE
3.2
AVG FAMILY SIZE
2.4
AVG HOUSEHOLD SIZE
1,016
LABOR FORCE [ PEOPLE ]
60.2%
PERCENT IN LABOR FORCE
10.5%
UNEMPLOYMENT RATE
Enterprise Zip Codes
Enterprise Area Codes
Income in Enterprise
Income Overview in Enterprise
Per Capita Income in Enterprise is $36,878, while median incomes of families and households are $73,090 and $53,750 respectively.
| Characteristic | Number | Measure |
| Per Capita Income | 2,172 | $36,878 |
| Median Family Income | 481 | $73,090 |
| Mean Family Income | 481 | $91,448 |
| Median Household Income | 894 | $53,750 |
| Mean Household Income | 894 | $86,500 |
| Income Deficit | 481 | $0 |
| Wage / Income Gap (%) | 2,172 | 2.13% |
| Wage / Income Gap ($) | 2,172 | 97.87¢ per $1 |
| Gini / Inequality Index | 2,172 | 0.56 |
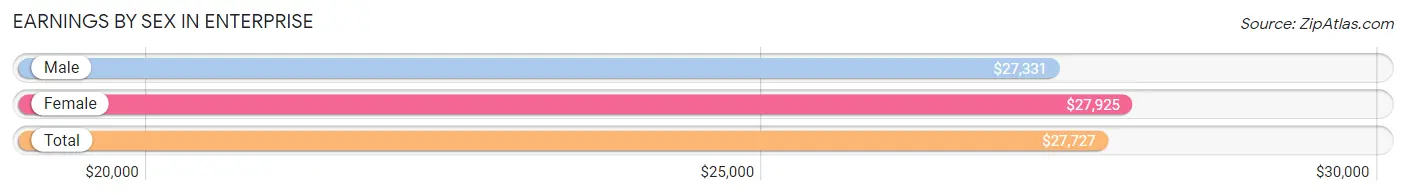
Earnings by Sex in Enterprise
Average Earnings in Enterprise are $27,727, $27,331 for men and $27,925 for women, a difference of 2.1%.
| Sex | Number | Average Earnings |
| Male | 491 (46.2%) | $27,331 |
| Female | 573 (53.8%) | $27,925 |
| Total | 1,064 (100.0%) | $27,727 |
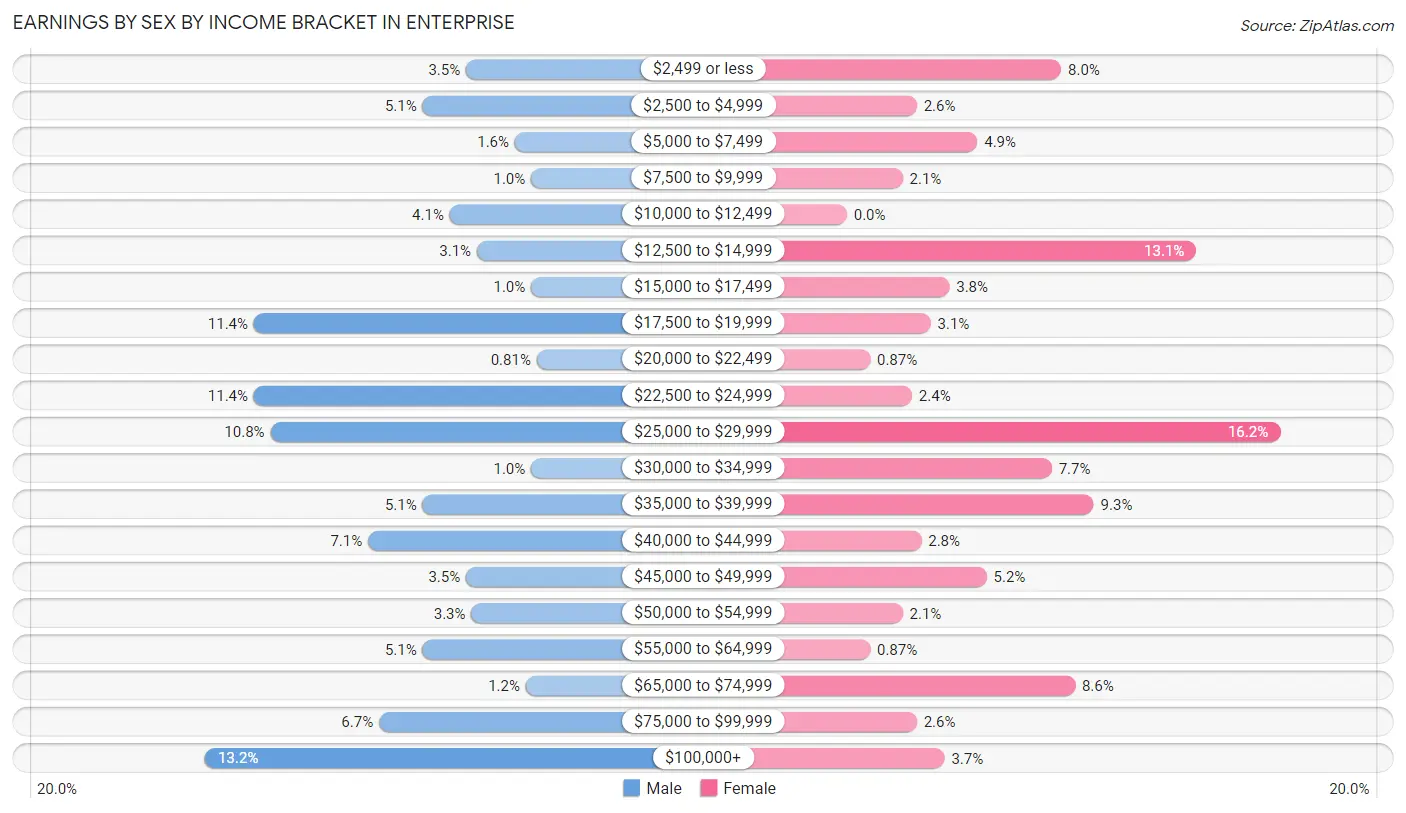
Earnings by Sex by Income Bracket in Enterprise
The most common earnings brackets in Enterprise are $100,000+ for men (65 | 13.2%) and $25,000 to $29,999 for women (93 | 16.2%).
| Income | Male | Female |
| $2,499 or less | 17 (3.5%) | 46 (8.0%) |
| $2,500 to $4,999 | 25 (5.1%) | 15 (2.6%) |
| $5,000 to $7,499 | 8 (1.6%) | 28 (4.9%) |
| $7,500 to $9,999 | 5 (1.0%) | 12 (2.1%) |
| $10,000 to $12,499 | 20 (4.1%) | 0 (0.0%) |
| $12,500 to $14,999 | 15 (3.0%) | 75 (13.1%) |
| $15,000 to $17,499 | 5 (1.0%) | 22 (3.8%) |
| $17,500 to $19,999 | 56 (11.4%) | 18 (3.1%) |
| $20,000 to $22,499 | 4 (0.8%) | 5 (0.9%) |
| $22,500 to $24,999 | 56 (11.4%) | 14 (2.4%) |
| $25,000 to $29,999 | 53 (10.8%) | 93 (16.2%) |
| $30,000 to $34,999 | 5 (1.0%) | 44 (7.7%) |
| $35,000 to $39,999 | 25 (5.1%) | 53 (9.2%) |
| $40,000 to $44,999 | 35 (7.1%) | 16 (2.8%) |
| $45,000 to $49,999 | 17 (3.5%) | 30 (5.2%) |
| $50,000 to $54,999 | 16 (3.3%) | 12 (2.1%) |
| $55,000 to $64,999 | 25 (5.1%) | 5 (0.9%) |
| $65,000 to $74,999 | 6 (1.2%) | 49 (8.6%) |
| $75,000 to $99,999 | 33 (6.7%) | 15 (2.6%) |
| $100,000+ | 65 (13.2%) | 21 (3.7%) |
| Total | 491 (100.0%) | 573 (100.0%) |
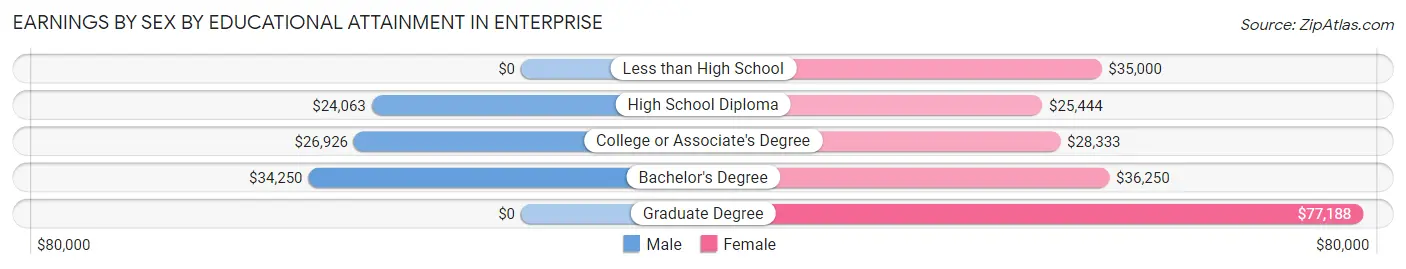
Earnings by Sex by Educational Attainment in Enterprise
Average earnings in Enterprise are $29,063 for men and $28,378 for women, a difference of 2.4%. Men with an educational attainment of bachelor's degree enjoy the highest average annual earnings of $34,250, while those with high school diploma education earn the least with $24,063. Women with an educational attainment of graduate degree earn the most with the average annual earnings of $77,188, while those with high school diploma education have the smallest earnings of $25,444.
| Educational Attainment | Male Income | Female Income |
| Less than High School | - | - |
| High School Diploma | $24,063 | $25,444 |
| College or Associate's Degree | $26,926 | $28,333 |
| Bachelor's Degree | $34,250 | $36,250 |
| Graduate Degree | - | - |
| Total | $29,063 | $28,378 |
Family Income in Enterprise
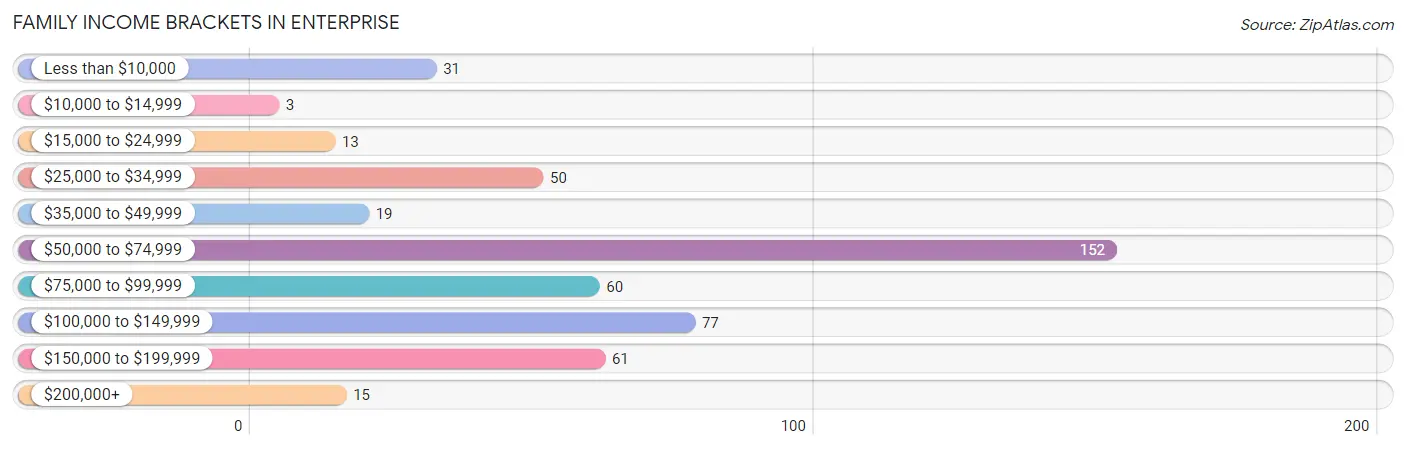
Family Income Brackets in Enterprise
According to the Enterprise family income data, there are 152 families falling into the $50,000 to $74,999 income range, which is the most common income bracket and makes up 31.6% of all families. Conversely, the $10,000 to $14,999 income bracket is the least frequent group with only 3 families (0.6%) belonging to this category.
| Income Bracket | # Families | % Families |
| Less than $10,000 | 31 | 6.4% |
| $10,000 to $14,999 | 3 | 0.6% |
| $15,000 to $24,999 | 13 | 2.7% |
| $25,000 to $34,999 | 50 | 10.4% |
| $35,000 to $49,999 | 19 | 4.0% |
| $50,000 to $74,999 | 152 | 31.6% |
| $75,000 to $99,999 | 60 | 12.5% |
| $100,000 to $149,999 | 77 | 16.0% |
| $150,000 to $199,999 | 61 | 12.7% |
| $200,000+ | 15 | 3.1% |
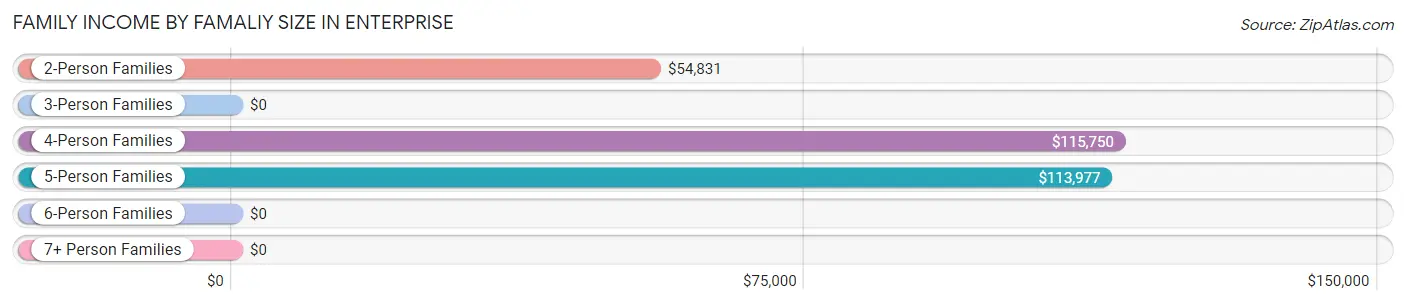
Family Income by Famaliy Size in Enterprise
4-person families (121 | 25.2%) account for the highest median family income in Enterprise with $115,750 per family, while 4-person families (121 | 25.2%) have the highest median income of $28,938 per family member.
| Income Bracket | # Families | Median Income |
| 2-Person Families | 220 (45.7%) | $54,831 |
| 3-Person Families | 87 (18.1%) | $0 |
| 4-Person Families | 121 (25.2%) | $115,750 |
| 5-Person Families | 31 (6.4%) | $113,977 |
| 6-Person Families | 22 (4.6%) | $0 |
| 7+ Person Families | 0 (0.0%) | $0 |
| Total | 481 (100.0%) | $73,090 |
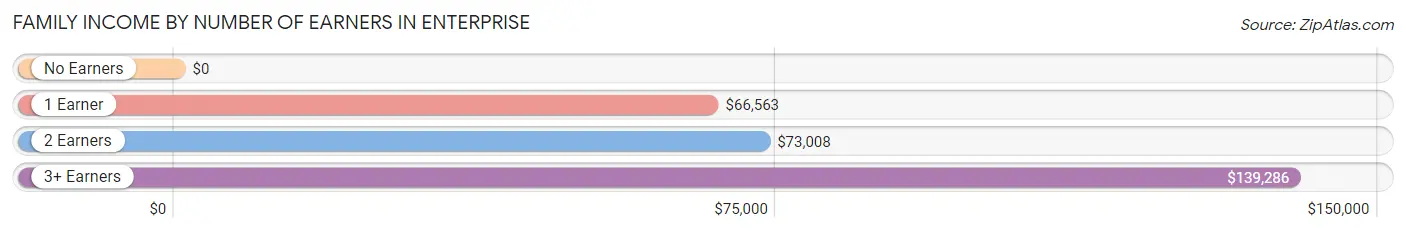
Family Income by Number of Earners in Enterprise
| Number of Earners | # Families | Median Income |
| No Earners | 101 (21.0%) | $0 |
| 1 Earner | 83 (17.3%) | $66,563 |
| 2 Earners | 249 (51.8%) | $73,008 |
| 3+ Earners | 48 (10.0%) | $139,286 |
| Total | 481 (100.0%) | $73,090 |
Household Income in Enterprise
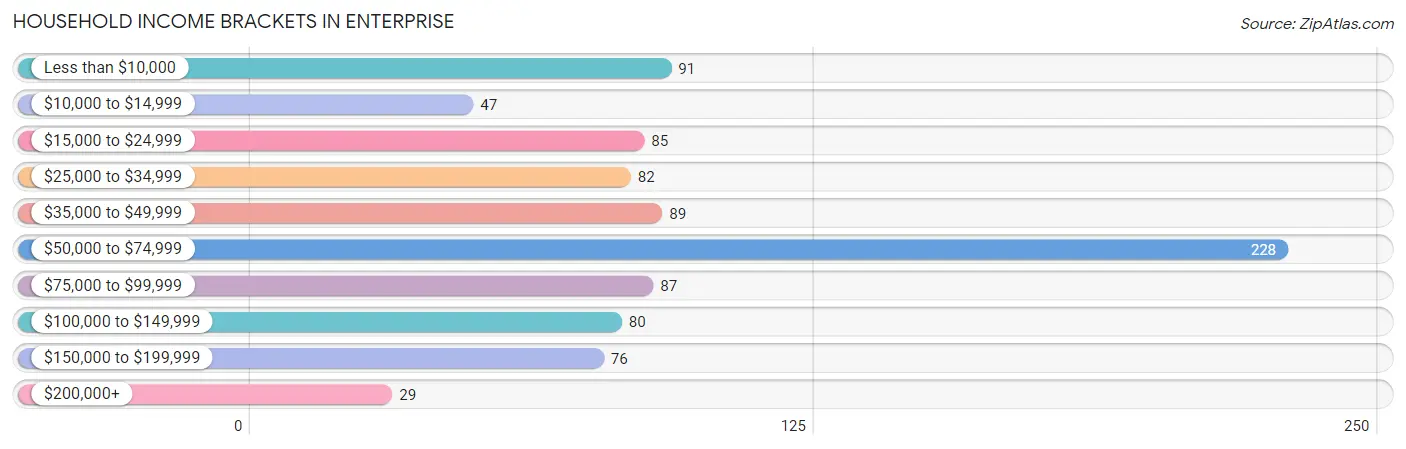
Household Income Brackets in Enterprise
With 228 households falling in the category, the $50,000 to $74,999 income range is the most frequent in Enterprise, accounting for 25.5% of all households. In contrast, only 29 households (3.2%) fall into the $200,000+ income bracket, making it the least populous group.
| Income Bracket | # Households | % Households |
| Less than $10,000 | 91 | 10.2% |
| $10,000 to $14,999 | 47 | 5.3% |
| $15,000 to $24,999 | 85 | 9.5% |
| $25,000 to $34,999 | 82 | 9.2% |
| $35,000 to $49,999 | 89 | 10.0% |
| $50,000 to $74,999 | 228 | 25.5% |
| $75,000 to $99,999 | 87 | 9.7% |
| $100,000 to $149,999 | 80 | 8.9% |
| $150,000 to $199,999 | 76 | 8.5% |
| $200,000+ | 29 | 3.2% |
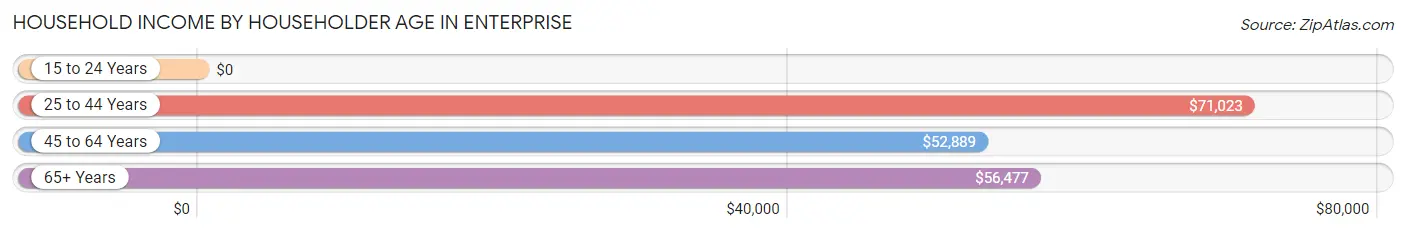
Household Income by Householder Age in Enterprise
The median household income in Enterprise is $53,750, with the highest median household income of $71,023 found in the 25 to 44 years age bracket for the primary householder. A total of 295 households (33.0%) fall into this category. Meanwhile, the 15 to 24 years age bracket for the primary householder has the lowest median household income of $0, with 27 households (3.0%) in this group.
| Income Bracket | # Households | Median Income |
| 15 to 24 Years | 27 (3.0%) | $0 |
| 25 to 44 Years | 295 (33.0%) | $71,023 |
| 45 to 64 Years | 281 (31.4%) | $52,889 |
| 65+ Years | 291 (32.6%) | $56,477 |
| Total | 894 (100.0%) | $53,750 |
Poverty in Enterprise
Income Below Poverty by Sex and Age in Enterprise
With 14.5% poverty level for males and 13.3% for females among the residents of Enterprise, 15 year old males and 18 to 24 year old females are the most vulnerable to poverty, with 27 males (48.2%) and 36 females (36.4%) in their respective age groups living below the poverty level.
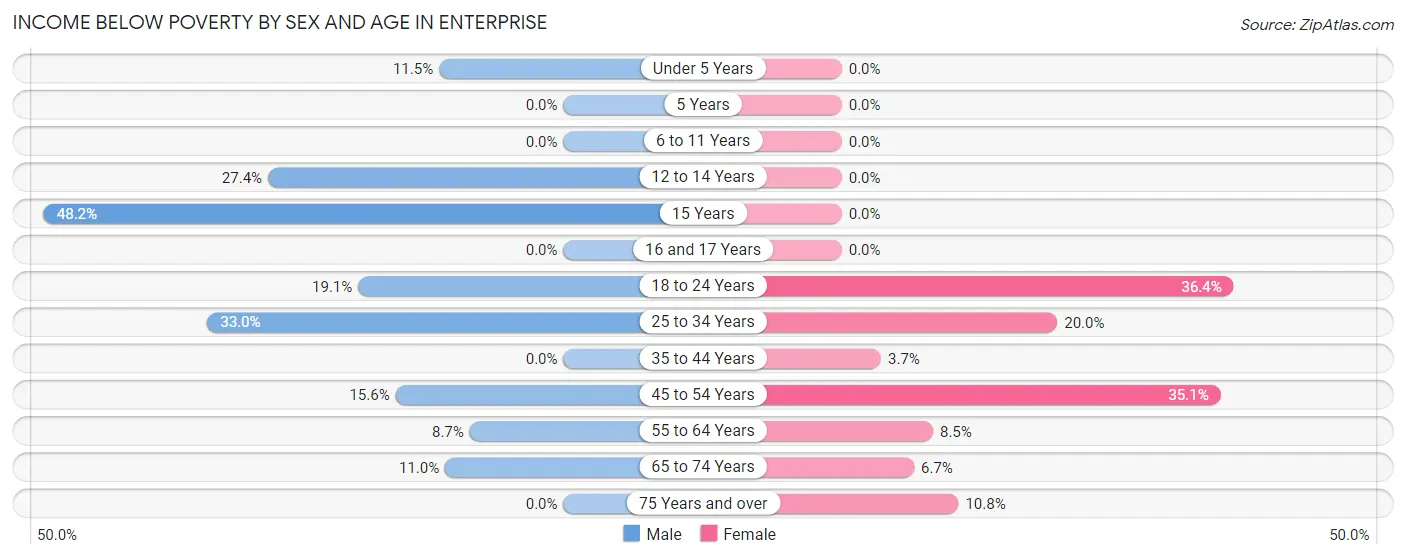
| Age Bracket | Male | Female |
| Under 5 Years | 6 (11.5%) | 0 (0.0%) |
| 5 Years | 0 (0.0%) | 0 (0.0%) |
| 6 to 11 Years | 0 (0.0%) | 0 (0.0%) |
| 12 to 14 Years | 34 (27.4%) | 0 (0.0%) |
| 15 Years | 27 (48.2%) | 0 (0.0%) |
| 16 and 17 Years | 0 (0.0%) | 0 (0.0%) |
| 18 to 24 Years | 8 (19.1%) | 36 (36.4%) |
| 25 to 34 Years | 38 (33.0%) | 31 (20.0%) |
| 35 to 44 Years | 0 (0.0%) | 5 (3.6%) |
| 45 to 54 Years | 12 (15.6%) | 39 (35.1%) |
| 55 to 64 Years | 6 (8.7%) | 15 (8.5%) |
| 65 to 74 Years | 19 (11.0%) | 10 (6.7%) |
| 75 Years and over | 0 (0.0%) | 13 (10.8%) |
| Total | 150 (14.5%) | 149 (13.3%) |
Income Above Poverty by Sex and Age in Enterprise
According to the poverty statistics in Enterprise, males aged 5 years and females aged under 5 years are the age groups that are most secure financially, with 100.0% of males and 100.0% of females in these age groups living above the poverty line.
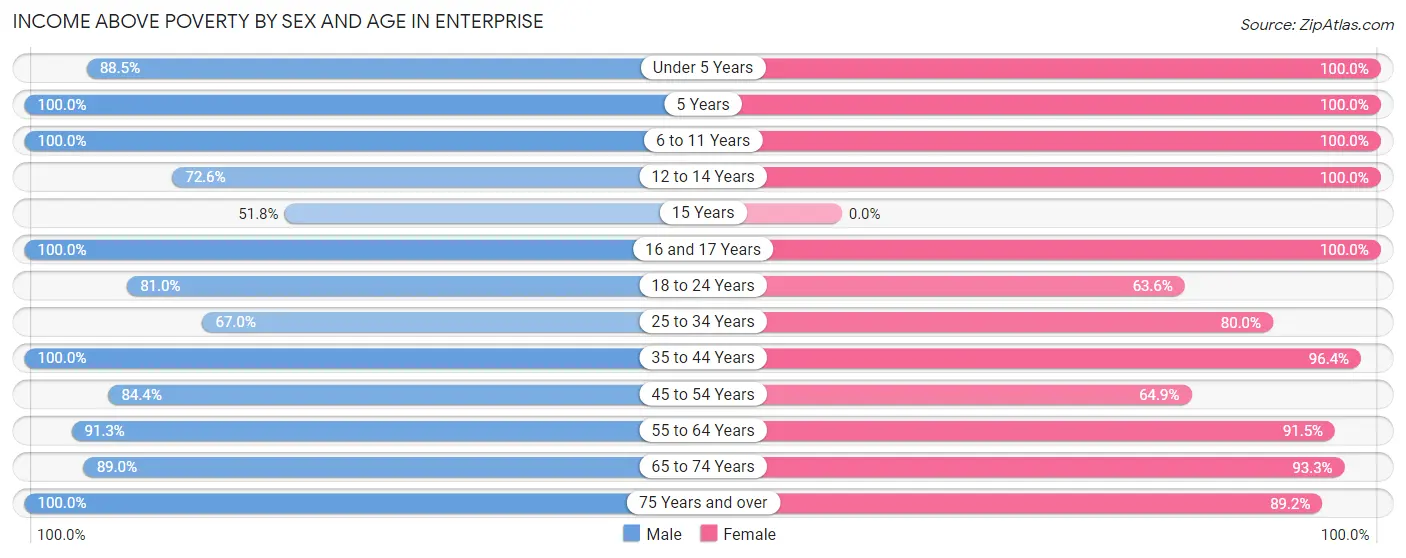
| Age Bracket | Male | Female |
| Under 5 Years | 46 (88.5%) | 61 (100.0%) |
| 5 Years | 16 (100.0%) | 10 (100.0%) |
| 6 to 11 Years | 88 (100.0%) | 43 (100.0%) |
| 12 to 14 Years | 90 (72.6%) | 35 (100.0%) |
| 15 Years | 29 (51.8%) | 0 (0.0%) |
| 16 and 17 Years | 19 (100.0%) | 23 (100.0%) |
| 18 to 24 Years | 34 (80.9%) | 63 (63.6%) |
| 25 to 34 Years | 77 (67.0%) | 124 (80.0%) |
| 35 to 44 Years | 144 (100.0%) | 132 (96.4%) |
| 45 to 54 Years | 65 (84.4%) | 72 (64.9%) |
| 55 to 64 Years | 63 (91.3%) | 162 (91.5%) |
| 65 to 74 Years | 154 (89.0%) | 139 (93.3%) |
| 75 Years and over | 57 (100.0%) | 107 (89.2%) |
| Total | 882 (85.5%) | 971 (86.7%) |
Income Below Poverty Among Married-Couple Families in Enterprise
The poverty statistics for married-couple families in Enterprise show that 1.8% or 7 of the total 387 families live below the poverty line. Families with 1 or 2 children have the highest poverty rate of 2.5%, comprising of 4 families. On the other hand, families with 3 or 4 children have the lowest poverty rate of 0.0%, which includes 0 families.
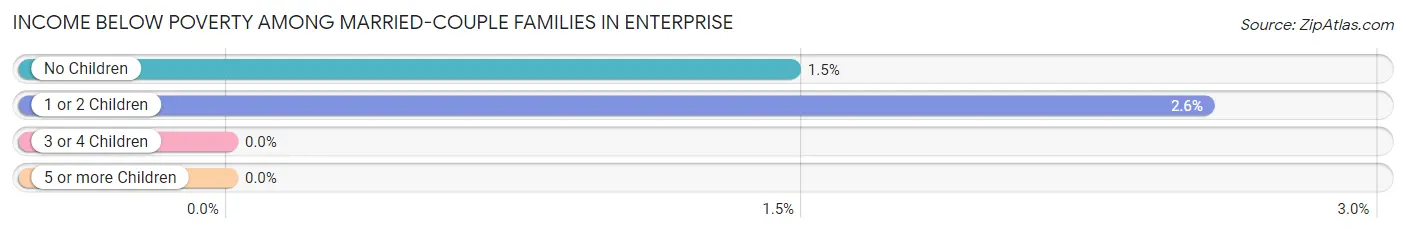
| Children | Above Poverty | Below Poverty |
| No Children | 201 (98.5%) | 3 (1.5%) |
| 1 or 2 Children | 153 (97.5%) | 4 (2.5%) |
| 3 or 4 Children | 26 (100.0%) | 0 (0.0%) |
| 5 or more Children | 0 (0.0%) | 0 (0.0%) |
| Total | 380 (98.2%) | 7 (1.8%) |
Income Below Poverty Among Single-Parent Households in Enterprise
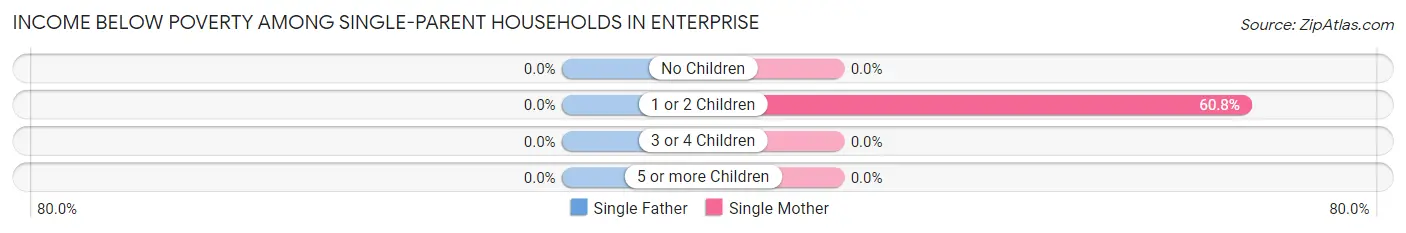
| Children | Single Father | Single Mother |
| No Children | 0 (0.0%) | 0 (0.0%) |
| 1 or 2 Children | 0 (0.0%) | 31 (60.8%) |
| 3 or 4 Children | 0 (0.0%) | 0 (0.0%) |
| 5 or more Children | 0 (0.0%) | 0 (0.0%) |
| Total | 0 (0.0%) | 31 (45.6%) |
Income Below Poverty Among Married-Couple vs Single-Parent Households in Enterprise
The poverty data for Enterprise shows that 7 of the married-couple family households (1.8%) and 31 of the single-parent households (33.0%) are living below the poverty level. Within the married-couple family households, those with 1 or 2 children have the highest poverty rate, with 4 households (2.5%) falling below the poverty line. Among the single-parent households, those with 1 or 2 children have the highest poverty rate, with 31 household (54.4%) living below poverty.
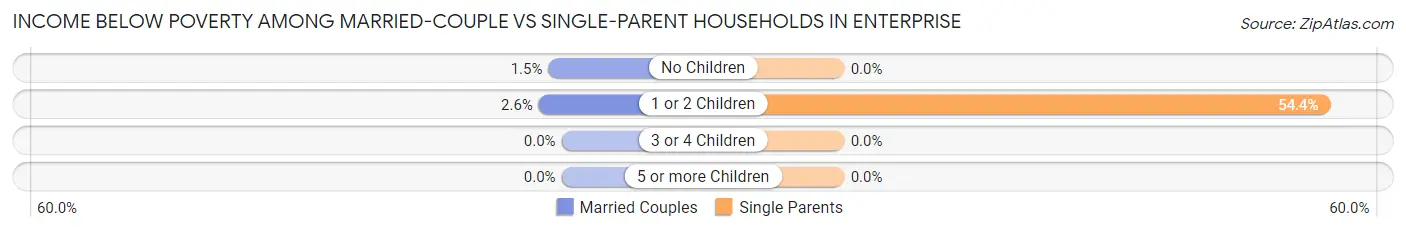
| Children | Married-Couple Families | Single-Parent Households |
| No Children | 3 (1.5%) | 0 (0.0%) |
| 1 or 2 Children | 4 (2.5%) | 31 (54.4%) |
| 3 or 4 Children | 0 (0.0%) | 0 (0.0%) |
| 5 or more Children | 0 (0.0%) | 0 (0.0%) |
| Total | 7 (1.8%) | 31 (33.0%) |
Race in Enterprise
The most populous races in Enterprise are White / Caucasian (2,016 | 92.8%), Two or more Races (62 | 2.9%), and Hispanic or Latino (45 | 2.1%).
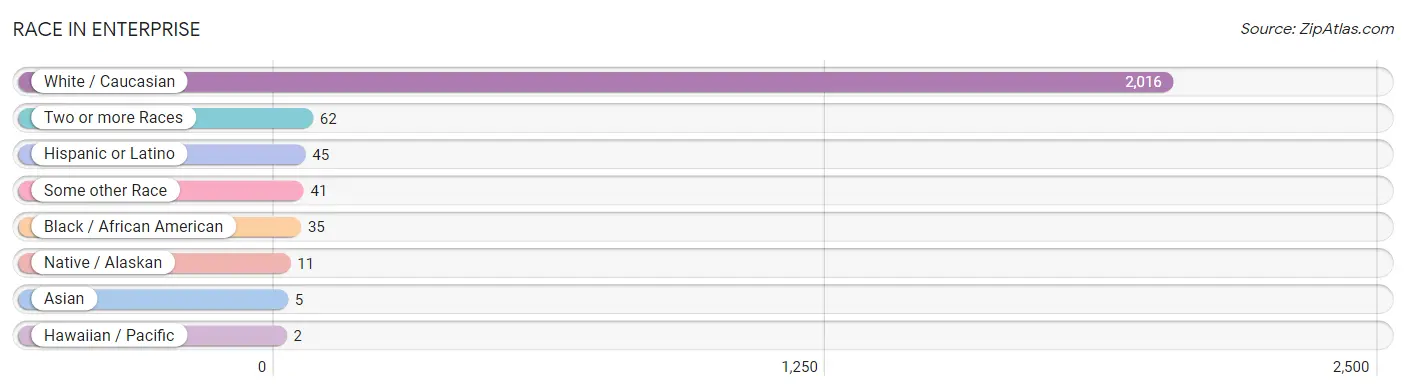
| Race | # Population | % Population |
| Asian | 5 | 0.2% |
| Black / African American | 35 | 1.6% |
| Hawaiian / Pacific | 2 | 0.1% |
| Hispanic or Latino | 45 | 2.1% |
| Native / Alaskan | 11 | 0.5% |
| White / Caucasian | 2,016 | 92.8% |
| Two or more Races | 62 | 2.9% |
| Some other Race | 41 | 1.9% |
| Total | 2,172 | 100.0% |
Ancestry in Enterprise
The most populous ancestries reported in Enterprise are German (329 | 15.1%), English (254 | 11.7%), Norwegian (148 | 6.8%), American (141 | 6.5%), and Irish (136 | 6.3%), together accounting for 46.4% of all Enterprise residents.
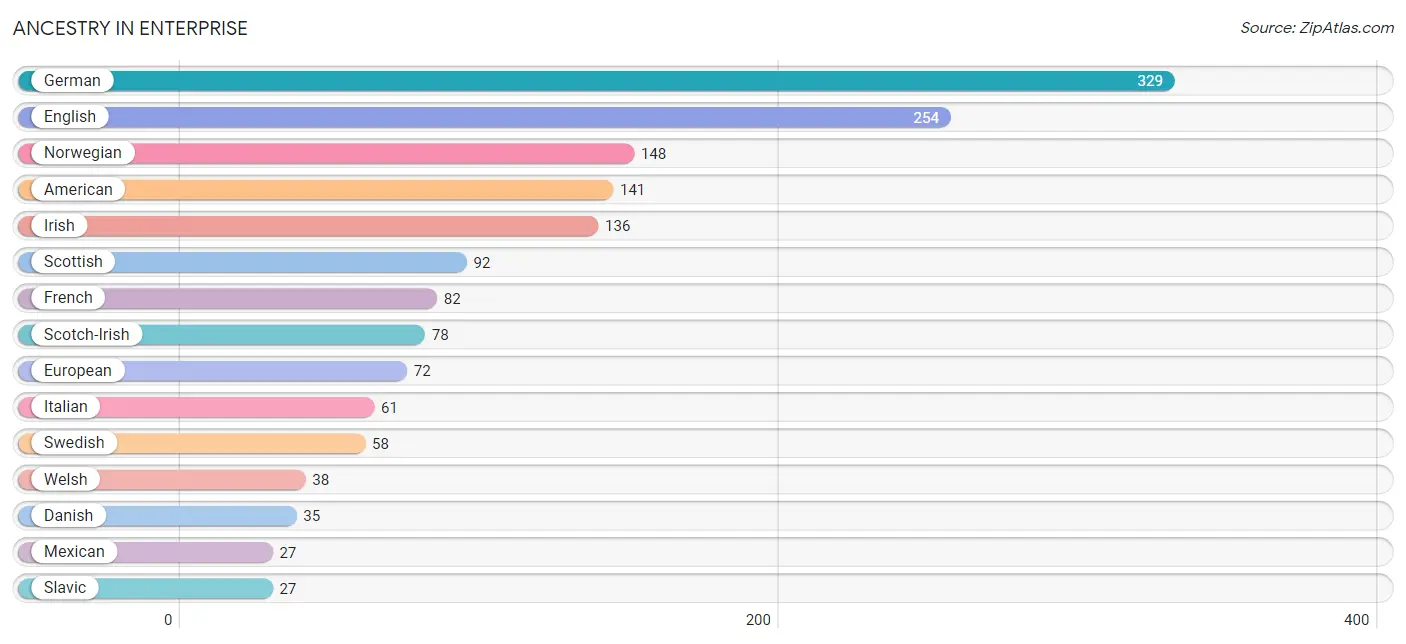
| Ancestry | # Population | % Population |
| American | 141 | 6.5% |
| Austrian | 5 | 0.2% |
| British | 15 | 0.7% |
| Celtic | 9 | 0.4% |
| Chippewa | 5 | 0.2% |
| Czech | 19 | 0.9% |
| Czechoslovakian | 13 | 0.6% |
| Danish | 35 | 1.6% |
| Dutch | 26 | 1.2% |
| Eastern European | 16 | 0.7% |
| English | 254 | 11.7% |
| European | 72 | 3.3% |
| Finnish | 3 | 0.1% |
| French | 82 | 3.8% |
| French Canadian | 7 | 0.3% |
| German | 329 | 15.1% |
| Guamanian / Chamorro | 2 | 0.1% |
| Indian (Asian) | 13 | 0.6% |
| Irish | 136 | 6.3% |
| Italian | 61 | 2.8% |
| Korean | 2 | 0.1% |
| Mexican | 27 | 1.2% |
| Northern European | 4 | 0.2% |
| Norwegian | 148 | 6.8% |
| Pakistani | 3 | 0.1% |
| Potawatomi | 11 | 0.5% |
| Puerto Rican | 11 | 0.5% |
| Russian | 12 | 0.5% |
| Scandinavian | 4 | 0.2% |
| Scotch-Irish | 78 | 3.6% |
| Scottish | 92 | 4.2% |
| Sioux | 5 | 0.2% |
| Slavic | 27 | 1.2% |
| Slovak | 6 | 0.3% |
| Slovene | 6 | 0.3% |
| Spaniard | 7 | 0.3% |
| Swedish | 58 | 2.7% |
| Swiss | 6 | 0.3% |
| Welsh | 38 | 1.8% |
| Yakama | 3 | 0.1% | View All 40 Rows |
Immigrants in Enterprise
The most numerous immigrant groups reported in Enterprise came from Central America (21 | 1.0%), Latin America (21 | 1.0%), Mexico (21 | 1.0%), Asia (5 | 0.2%), and England (5 | 0.2%), together accounting for 3.4% of all Enterprise residents.
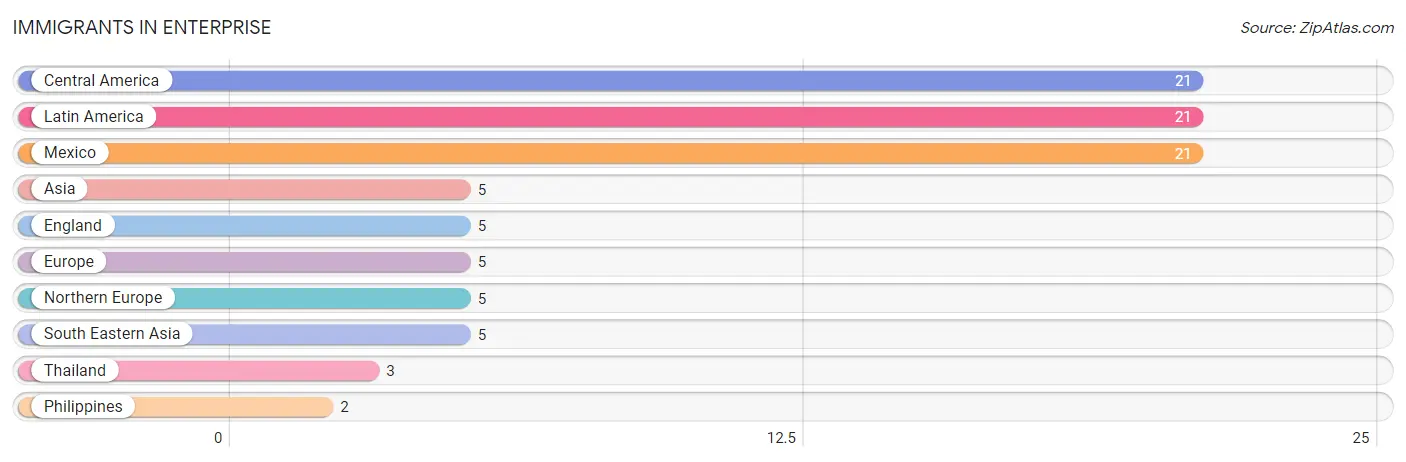
| Immigration Origin | # Population | % Population |
| Asia | 5 | 0.2% |
| Central America | 21 | 1.0% |
| England | 5 | 0.2% |
| Europe | 5 | 0.2% |
| Latin America | 21 | 1.0% |
| Mexico | 21 | 1.0% |
| Northern Europe | 5 | 0.2% |
| Philippines | 2 | 0.1% |
| South Eastern Asia | 5 | 0.2% |
| Thailand | 3 | 0.1% | View All 10 Rows |
Sex and Age in Enterprise
Sex and Age in Enterprise
The most populous age groups in Enterprise are 65 to 69 Years (137 | 13.3%) for men and 55 to 59 Years (118 | 10.3%) for women.
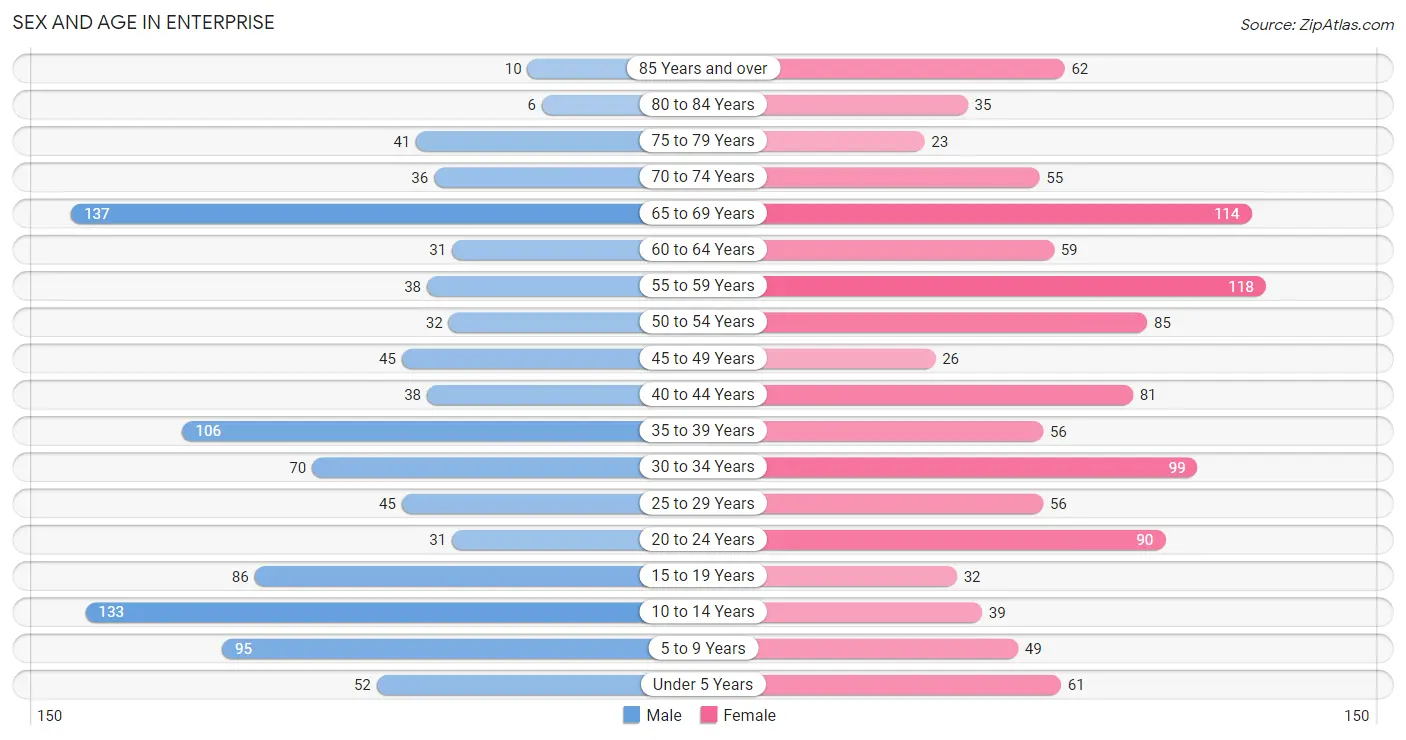
| Age Bracket | Male | Female |
| Under 5 Years | 52 (5.0%) | 61 (5.3%) |
| 5 to 9 Years | 95 (9.2%) | 49 (4.3%) |
| 10 to 14 Years | 133 (12.9%) | 39 (3.4%) |
| 15 to 19 Years | 86 (8.3%) | 32 (2.8%) |
| 20 to 24 Years | 31 (3.0%) | 90 (7.9%) |
| 25 to 29 Years | 45 (4.4%) | 56 (4.9%) |
| 30 to 34 Years | 70 (6.8%) | 99 (8.7%) |
| 35 to 39 Years | 106 (10.3%) | 56 (4.9%) |
| 40 to 44 Years | 38 (3.7%) | 81 (7.1%) |
| 45 to 49 Years | 45 (4.4%) | 26 (2.3%) |
| 50 to 54 Years | 32 (3.1%) | 85 (7.5%) |
| 55 to 59 Years | 38 (3.7%) | 118 (10.3%) |
| 60 to 64 Years | 31 (3.0%) | 59 (5.2%) |
| 65 to 69 Years | 137 (13.3%) | 114 (10.0%) |
| 70 to 74 Years | 36 (3.5%) | 55 (4.8%) |
| 75 to 79 Years | 41 (4.0%) | 23 (2.0%) |
| 80 to 84 Years | 6 (0.6%) | 35 (3.1%) |
| 85 Years and over | 10 (1.0%) | 62 (5.4%) |
| Total | 1,032 (100.0%) | 1,140 (100.0%) |
Families and Households in Enterprise
Median Family Size in Enterprise
The median family size in Enterprise is 3.19 persons per family, with married-couple families (387 | 80.5%) accounting for the largest median family size of 3.3 persons per family. On the other hand, single male/father families (26 | 5.4%) represent the smallest median family size with 2.65 persons per family.
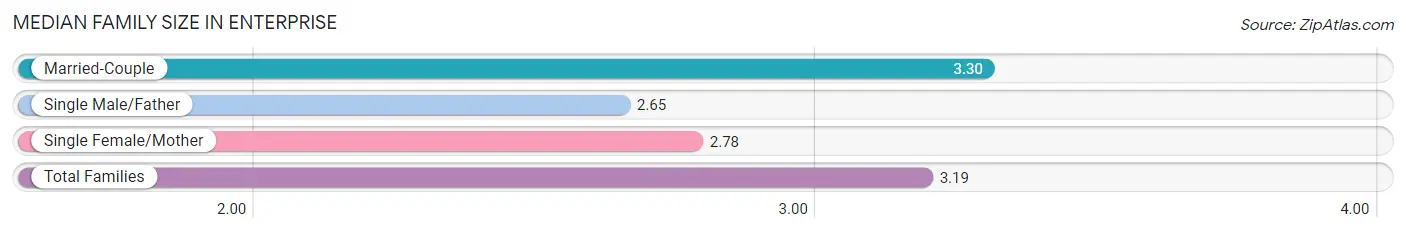
| Family Type | # Families | Family Size |
| Married-Couple | 387 (80.5%) | 3.30 |
| Single Male/Father | 26 (5.4%) | 2.65 |
| Single Female/Mother | 68 (14.1%) | 2.78 |
| Total Families | 481 (100.0%) | 3.19 |
Median Household Size in Enterprise
The median household size in Enterprise is 2.36 persons per household, with married-couple households (387 | 43.3%) accounting for the largest median household size of 3.35 persons per household. non-family households (413 | 46.2%) represent the smallest median household size with 1.26 persons per household.
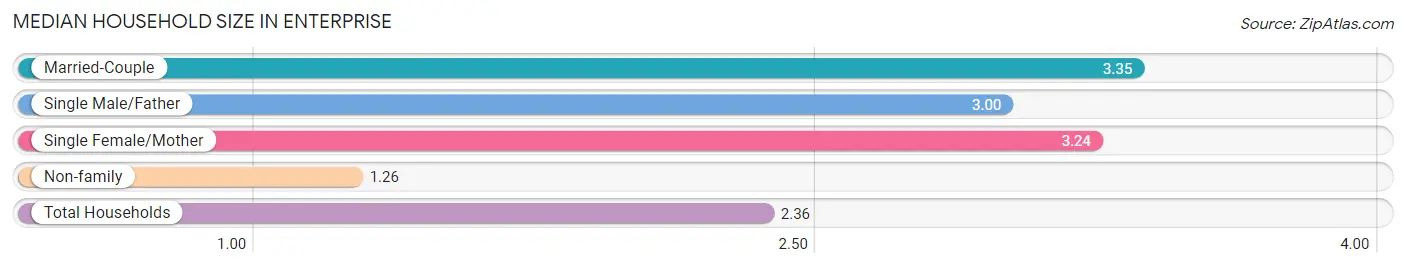
| Household Type | # Households | Household Size |
| Married-Couple | 387 (43.3%) | 3.35 |
| Single Male/Father | 26 (2.9%) | 3.00 |
| Single Female/Mother | 68 (7.6%) | 3.24 |
| Non-family | 413 (46.2%) | 1.26 |
| Total Households | 894 (100.0%) | 2.36 |
Household Size by Marriage Status in Enterprise
Out of a total of 894 households in Enterprise, 481 (53.8%) are family households, while 413 (46.2%) are nonfamily households. The most numerous type of family households are 2-person households, comprising 205, and the most common type of nonfamily households are 1-person households, comprising 345.
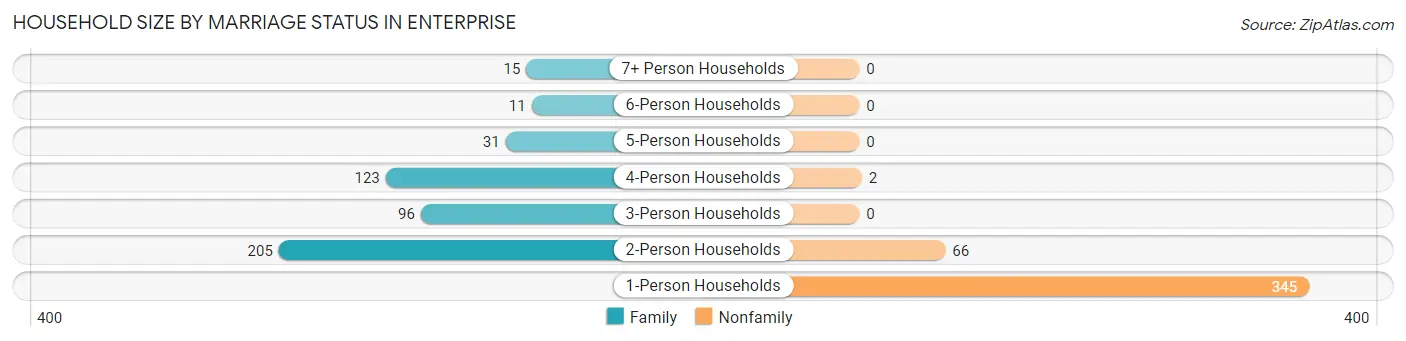
| Household Size | Family Households | Nonfamily Households |
| 1-Person Households | - | 345 (38.6%) |
| 2-Person Households | 205 (22.9%) | 66 (7.4%) |
| 3-Person Households | 96 (10.7%) | 0 (0.0%) |
| 4-Person Households | 123 (13.8%) | 2 (0.2%) |
| 5-Person Households | 31 (3.5%) | 0 (0.0%) |
| 6-Person Households | 11 (1.2%) | 0 (0.0%) |
| 7+ Person Households | 15 (1.7%) | 0 (0.0%) |
| Total | 481 (53.8%) | 413 (46.2%) |
Female Fertility in Enterprise
Fertility by Age in Enterprise
Average fertility rate in Enterprise is 11.0 births per 1,000 women. Women in the age bracket of 20 to 34 years have the highest fertility rate with 20.0 births per 1,000 women. Women in the age bracket of 20 to 34 years acount for 100.0% of all women with births.
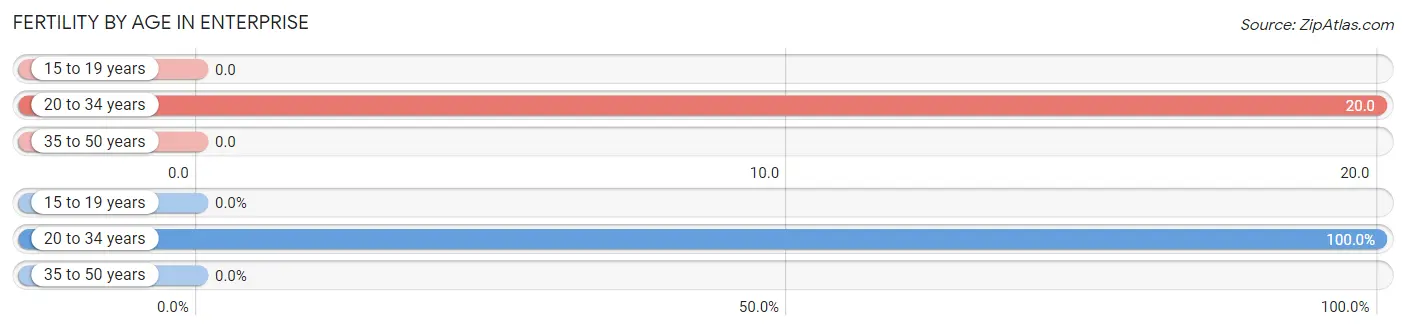
| Age Bracket | Women with Births | Births / 1,000 Women |
| 15 to 19 years | 0 (0.0%) | 0.0 |
| 20 to 34 years | 5 (100.0%) | 20.0 |
| 35 to 50 years | 0 (0.0%) | 0.0 |
| Total | 5 (100.0%) | 11.0 |
Fertility by Age by Marriage Status in Enterprise
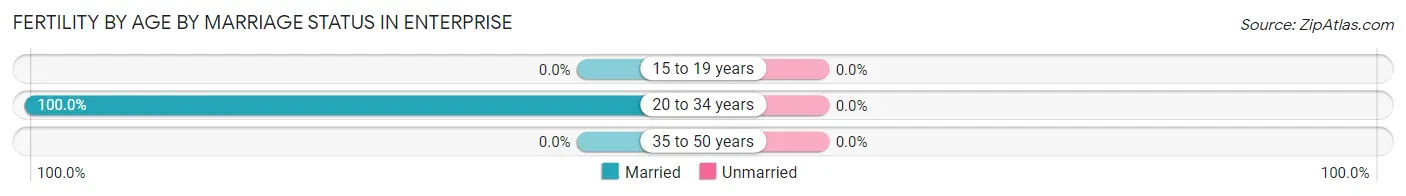
| Age Bracket | Married | Unmarried |
| 15 to 19 years | 0 (0.0%) | 0 (0.0%) |
| 20 to 34 years | 5 (100.0%) | 0 (0.0%) |
| 35 to 50 years | 0 (0.0%) | 0 (0.0%) |
| Total | 5 (100.0%) | 0 (0.0%) |
Fertility by Education in Enterprise
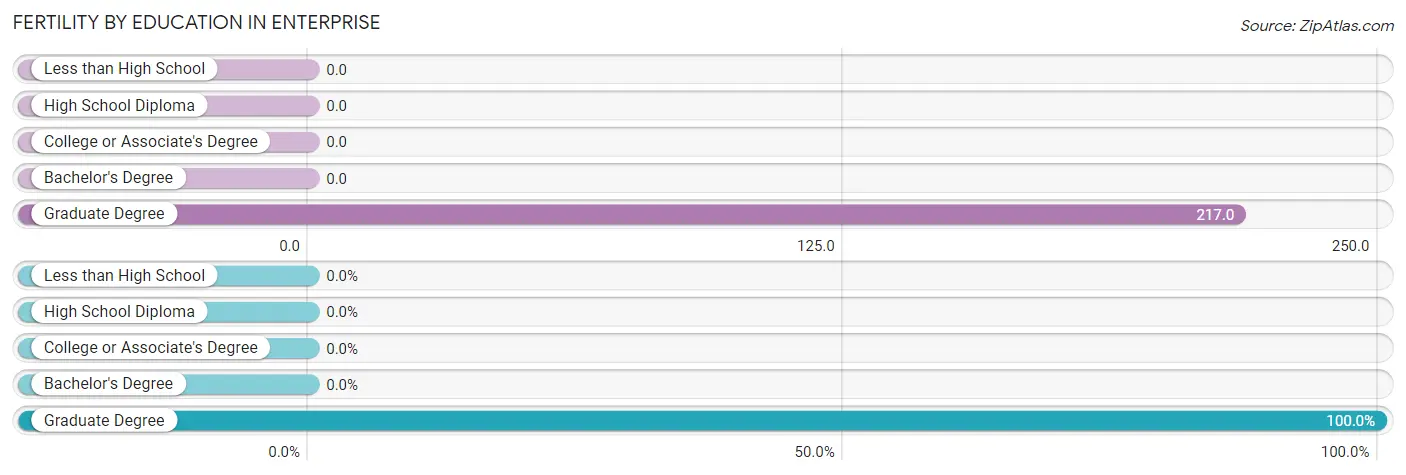
| Educational Attainment | Women with Births | Births / 1,000 Women |
| Less than High School | 0 (0.0%) | 0.0 |
| High School Diploma | 0 (0.0%) | 0.0 |
| College or Associate's Degree | 0 (0.0%) | 0.0 |
| Bachelor's Degree | 0 (0.0%) | 0.0 |
| Graduate Degree | 5 (100.0%) | 217.0 |
| Total | 5 (100.0%) | 11.0 |
Fertility by Education by Marriage Status in Enterprise
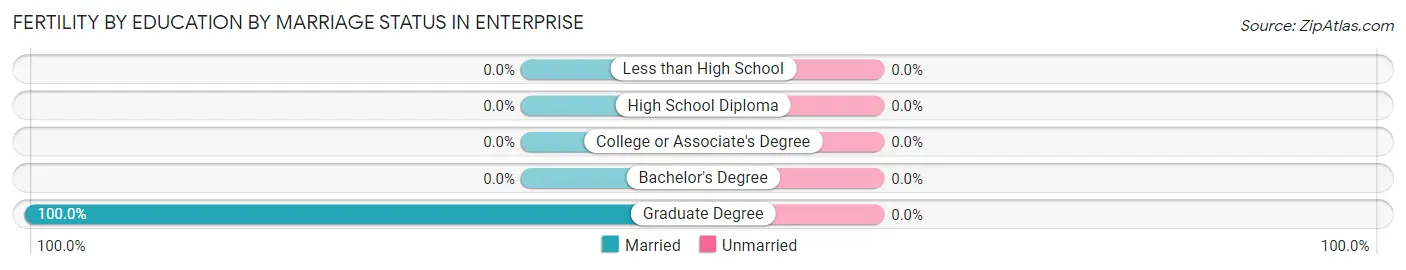
| Educational Attainment | Married | Unmarried |
| Less than High School | 0 (0.0%) | 0 (0.0%) |
| High School Diploma | 0 (0.0%) | 0 (0.0%) |
| College or Associate's Degree | 0 (0.0%) | 0 (0.0%) |
| Bachelor's Degree | 0 (0.0%) | 0 (0.0%) |
| Graduate Degree | 5 (100.0%) | 0 (0.0%) |
| Total | 5 (100.0%) | 0 (0.0%) |
Employment Characteristics in Enterprise
Employment by Class of Employer in Enterprise
Among the 908 employed individuals in Enterprise, private company employees (598 | 65.9%), local government employees (119 | 13.1%), and not-for-profit organizations (77 | 8.5%) make up the most common classes of employment.
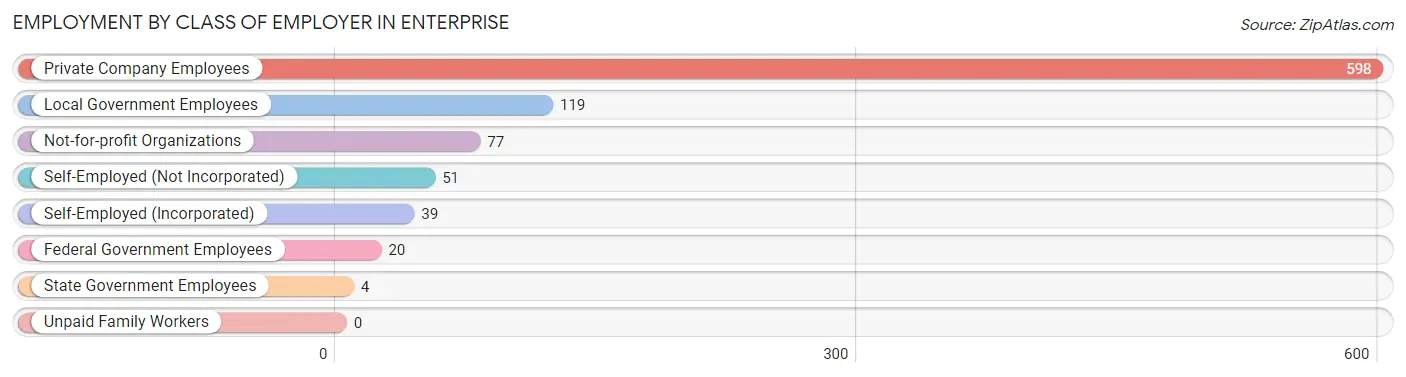
| Employer Class | # Employees | % Employees |
| Private Company Employees | 598 | 65.9% |
| Self-Employed (Incorporated) | 39 | 4.3% |
| Self-Employed (Not Incorporated) | 51 | 5.6% |
| Not-for-profit Organizations | 77 | 8.5% |
| Local Government Employees | 119 | 13.1% |
| State Government Employees | 4 | 0.4% |
| Federal Government Employees | 20 | 2.2% |
| Unpaid Family Workers | 0 | 0.0% |
| Total | 908 | 100.0% |
Employment Status by Age in Enterprise
According to the labor force statistics for Enterprise, out of the total population over 16 years of age (1,687), 60.2% or 1,016 individuals are in the labor force, with 10.5% or 107 of them unemployed. The age group with the highest labor force participation rate is 20 to 24 years, with 100.0% or 121 individuals in the labor force. Within the labor force, the 55 to 59 years age range has the highest percentage of unemployed individuals, with 55.7% or 59 of them being unemployed.
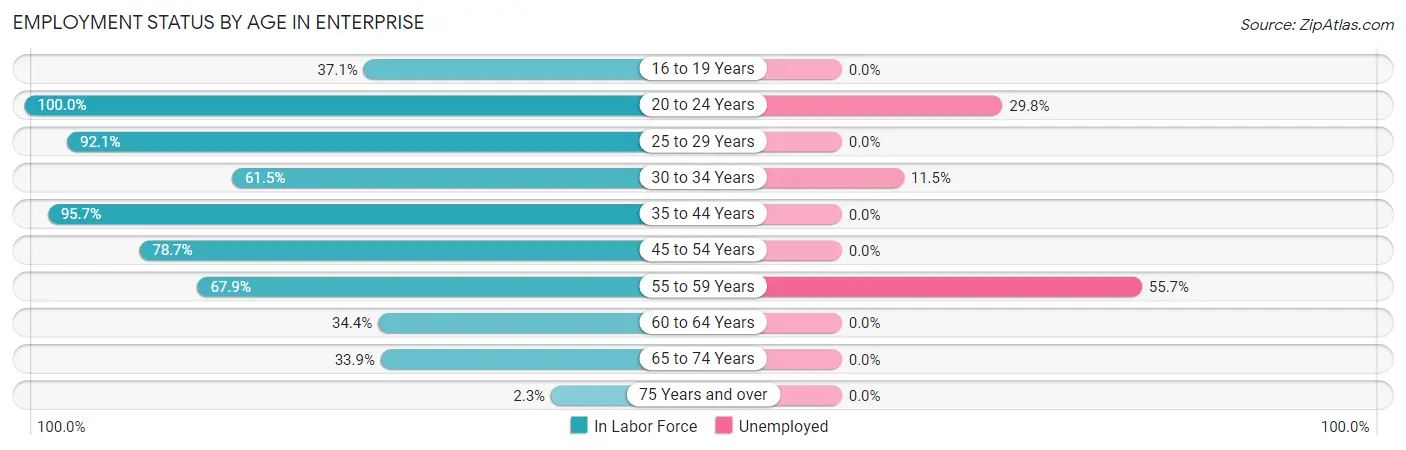
| Age Bracket | In Labor Force | Unemployed |
| 16 to 19 Years | 23 (37.1%) | 0 (0.0%) |
| 20 to 24 Years | 121 (100.0%) | 36 (29.8%) |
| 25 to 29 Years | 93 (92.1%) | 0 (0.0%) |
| 30 to 34 Years | 104 (61.5%) | 12 (11.5%) |
| 35 to 44 Years | 269 (95.7%) | 0 (0.0%) |
| 45 to 54 Years | 148 (78.7%) | 0 (0.0%) |
| 55 to 59 Years | 106 (67.9%) | 59 (55.7%) |
| 60 to 64 Years | 31 (34.4%) | 0 (0.0%) |
| 65 to 74 Years | 116 (33.9%) | 0 (0.0%) |
| 75 Years and over | 4 (2.3%) | 0 (0.0%) |
| Total | 1,016 (60.2%) | 107 (10.5%) |
Employment Status by Educational Attainment in Enterprise
According to labor force statistics for Enterprise, 76.2% of individuals (751) out of the total population between 25 and 64 years of age (985) are in the labor force, with 9.5% or 71 of them being unemployed. The group with the highest labor force participation rate are those with the educational attainment of bachelor's degree or higher, with 94.1% or 317 individuals in the labor force. Within the labor force, individuals with bachelor's degree or higher education have the highest percentage of unemployment, with 18.6% or 59 of them being unemployed.
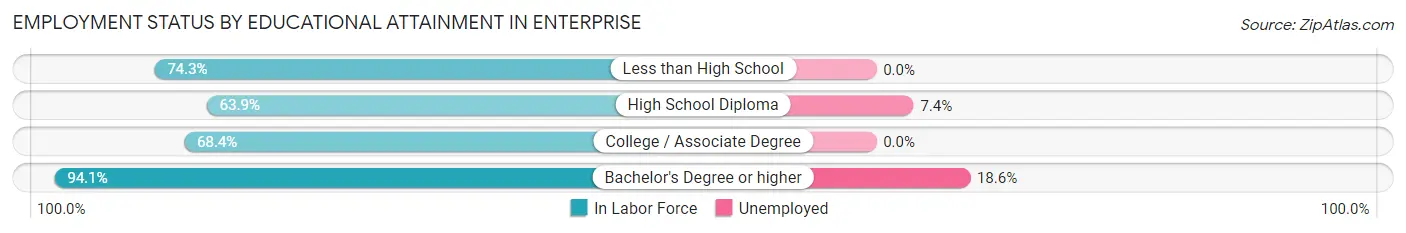
| Educational Attainment | In Labor Force | Unemployed |
| Less than High School | 26 (74.3%) | 0 (0.0%) |
| High School Diploma | 163 (63.9%) | 19 (7.4%) |
| College / Associate Degree | 245 (68.4%) | 0 (0.0%) |
| Bachelor's Degree or higher | 317 (94.1%) | 63 (18.6%) |
| Total | 751 (76.2%) | 94 (9.5%) |
Employment Occupations by Sex in Enterprise
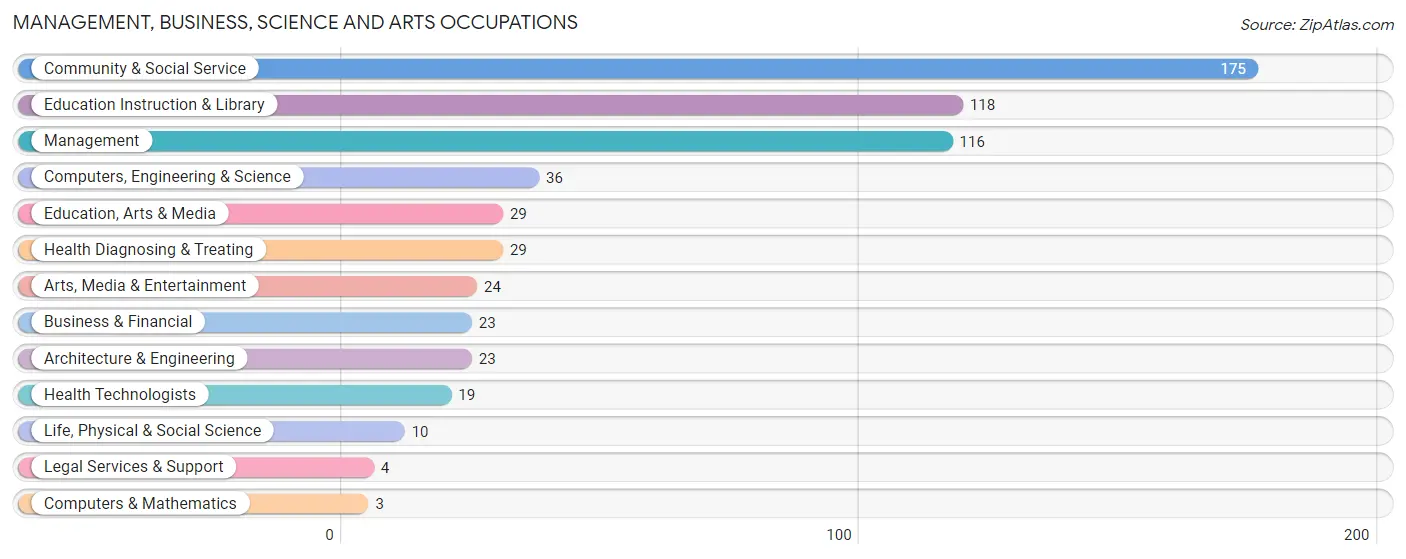
Management, Business, Science and Arts Occupations
The most common Management, Business, Science and Arts occupations in Enterprise are Community & Social Service (175 | 19.3%), Education Instruction & Library (118 | 13.0%), Management (116 | 12.8%), Computers, Engineering & Science (36 | 4.0%), and Education, Arts & Media (29 | 3.2%).
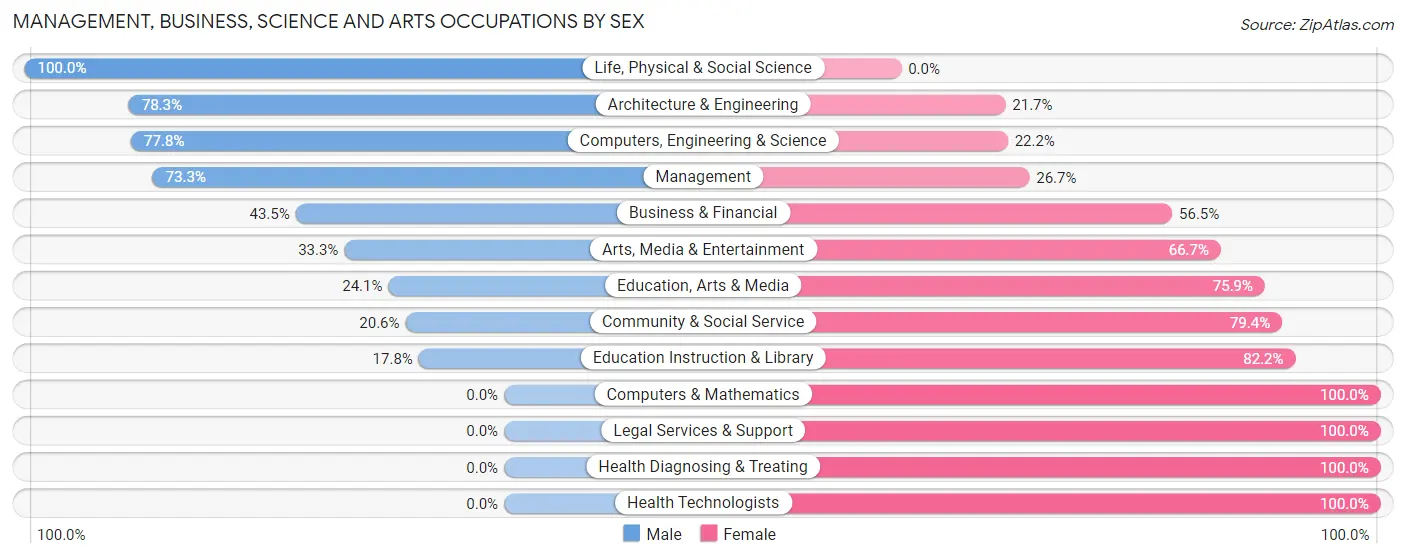
Management, Business, Science and Arts Occupations by Sex
Within the Management, Business, Science and Arts occupations in Enterprise, the most male-oriented occupations are Life, Physical & Social Science (100.0%), Architecture & Engineering (78.3%), and Computers, Engineering & Science (77.8%), while the most female-oriented occupations are Computers & Mathematics (100.0%), Legal Services & Support (100.0%), and Health Diagnosing & Treating (100.0%).
| Occupation | Male | Female |
| Management | 85 (73.3%) | 31 (26.7%) |
| Business & Financial | 10 (43.5%) | 13 (56.5%) |
| Computers, Engineering & Science | 28 (77.8%) | 8 (22.2%) |
| Computers & Mathematics | 0 (0.0%) | 3 (100.0%) |
| Architecture & Engineering | 18 (78.3%) | 5 (21.7%) |
| Life, Physical & Social Science | 10 (100.0%) | 0 (0.0%) |
| Community & Social Service | 36 (20.6%) | 139 (79.4%) |
| Education, Arts & Media | 7 (24.1%) | 22 (75.9%) |
| Legal Services & Support | 0 (0.0%) | 4 (100.0%) |
| Education Instruction & Library | 21 (17.8%) | 97 (82.2%) |
| Arts, Media & Entertainment | 8 (33.3%) | 16 (66.7%) |
| Health Diagnosing & Treating | 0 (0.0%) | 29 (100.0%) |
| Health Technologists | 0 (0.0%) | 19 (100.0%) |
| Total (Category) | 159 (41.9%) | 220 (58.1%) |
| Total (Overall) | 453 (49.9%) | 455 (50.1%) |
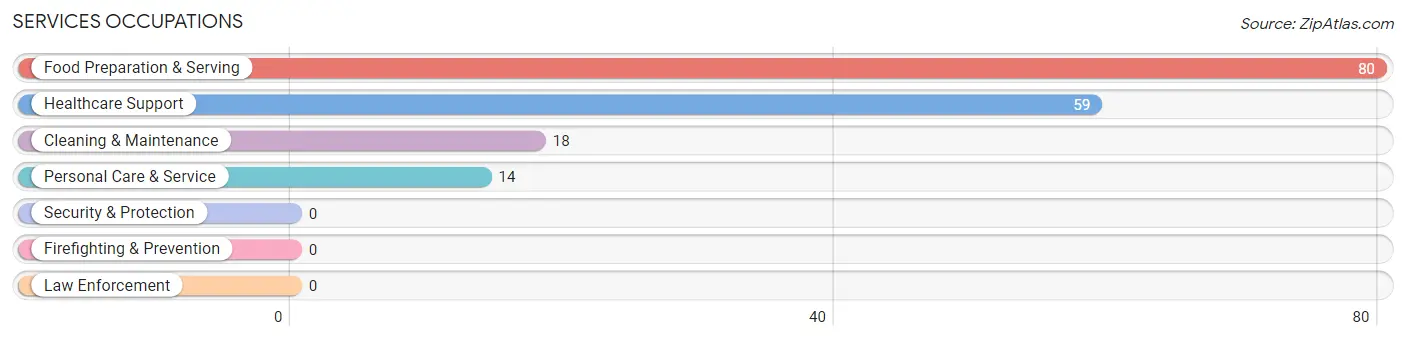
Services Occupations
The most common Services occupations in Enterprise are Food Preparation & Serving (80 | 8.8%), Healthcare Support (59 | 6.5%), Cleaning & Maintenance (18 | 2.0%), and Personal Care & Service (14 | 1.5%).
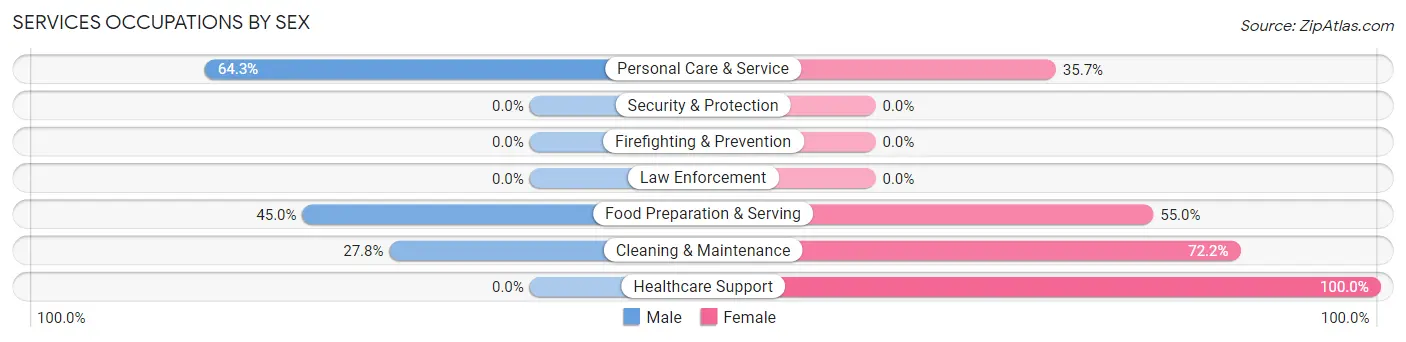
Services Occupations by Sex
Within the Services occupations in Enterprise, the most male-oriented occupations are Personal Care & Service (64.3%), Food Preparation & Serving (45.0%), and Cleaning & Maintenance (27.8%), while the most female-oriented occupations are Healthcare Support (100.0%), Cleaning & Maintenance (72.2%), and Food Preparation & Serving (55.0%).
| Occupation | Male | Female |
| Healthcare Support | 0 (0.0%) | 59 (100.0%) |
| Security & Protection | 0 (0.0%) | 0 (0.0%) |
| Firefighting & Prevention | 0 (0.0%) | 0 (0.0%) |
| Law Enforcement | 0 (0.0%) | 0 (0.0%) |
| Food Preparation & Serving | 36 (45.0%) | 44 (55.0%) |
| Cleaning & Maintenance | 5 (27.8%) | 13 (72.2%) |
| Personal Care & Service | 9 (64.3%) | 5 (35.7%) |
| Total (Category) | 50 (29.2%) | 121 (70.8%) |
| Total (Overall) | 453 (49.9%) | 455 (50.1%) |
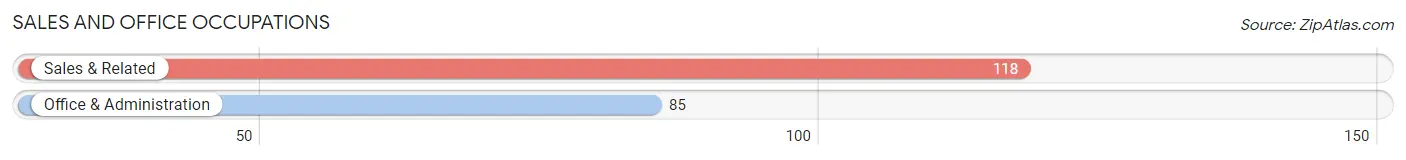
Sales and Office Occupations
The most common Sales and Office occupations in Enterprise are Sales & Related (118 | 13.0%), and Office & Administration (85 | 9.4%).
Sales and Office Occupations by Sex
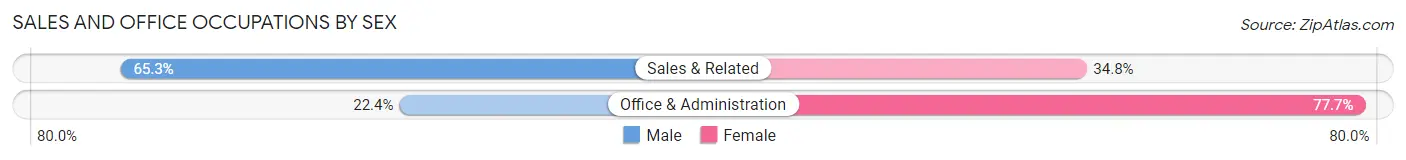
| Occupation | Male | Female |
| Sales & Related | 77 (65.2%) | 41 (34.7%) |
| Office & Administration | 19 (22.4%) | 66 (77.6%) |
| Total (Category) | 96 (47.3%) | 107 (52.7%) |
| Total (Overall) | 453 (49.9%) | 455 (50.1%) |
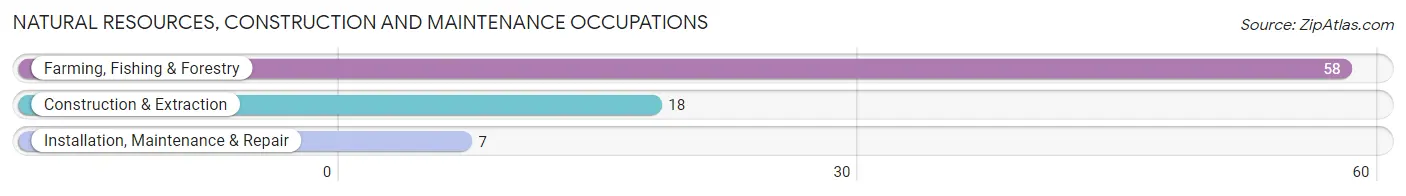
Natural Resources, Construction and Maintenance Occupations
The most common Natural Resources, Construction and Maintenance occupations in Enterprise are Farming, Fishing & Forestry (58 | 6.4%), Construction & Extraction (18 | 2.0%), and Installation, Maintenance & Repair (7 | 0.8%).
Natural Resources, Construction and Maintenance Occupations by Sex
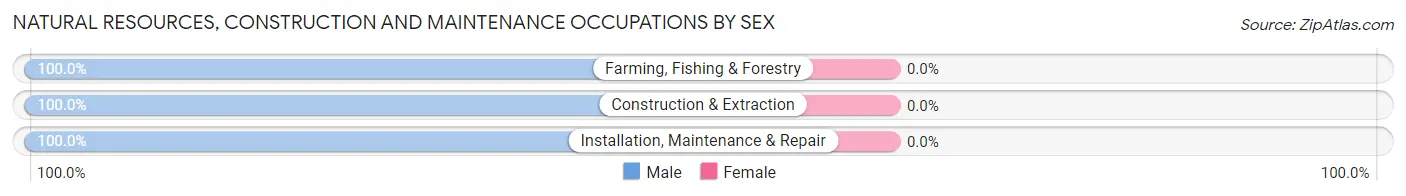
| Occupation | Male | Female |
| Farming, Fishing & Forestry | 58 (100.0%) | 0 (0.0%) |
| Construction & Extraction | 18 (100.0%) | 0 (0.0%) |
| Installation, Maintenance & Repair | 7 (100.0%) | 0 (0.0%) |
| Total (Category) | 83 (100.0%) | 0 (0.0%) |
| Total (Overall) | 453 (49.9%) | 455 (50.1%) |
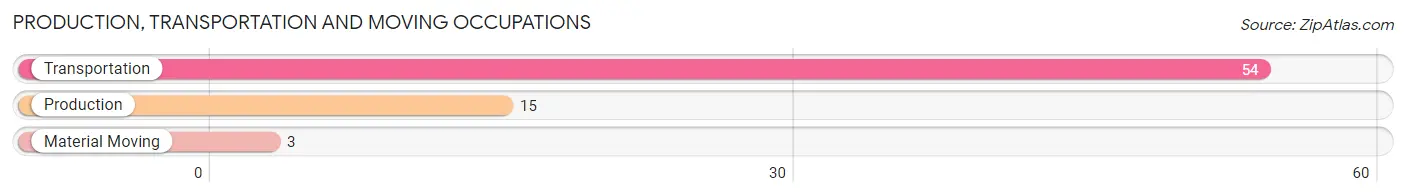
Production, Transportation and Moving Occupations
The most common Production, Transportation and Moving occupations in Enterprise are Transportation (54 | 5.9%), Production (15 | 1.7%), and Material Moving (3 | 0.3%).
Production, Transportation and Moving Occupations by Sex
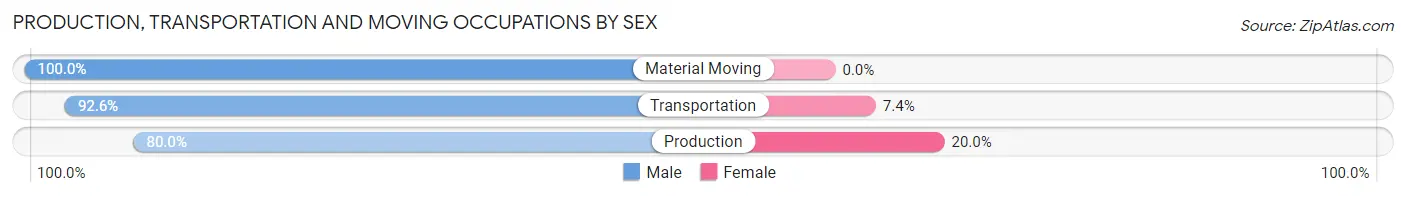
| Occupation | Male | Female |
| Production | 12 (80.0%) | 3 (20.0%) |
| Transportation | 50 (92.6%) | 4 (7.4%) |
| Material Moving | 3 (100.0%) | 0 (0.0%) |
| Total (Category) | 65 (90.3%) | 7 (9.7%) |
| Total (Overall) | 453 (49.9%) | 455 (50.1%) |
Employment Industries by Sex in Enterprise
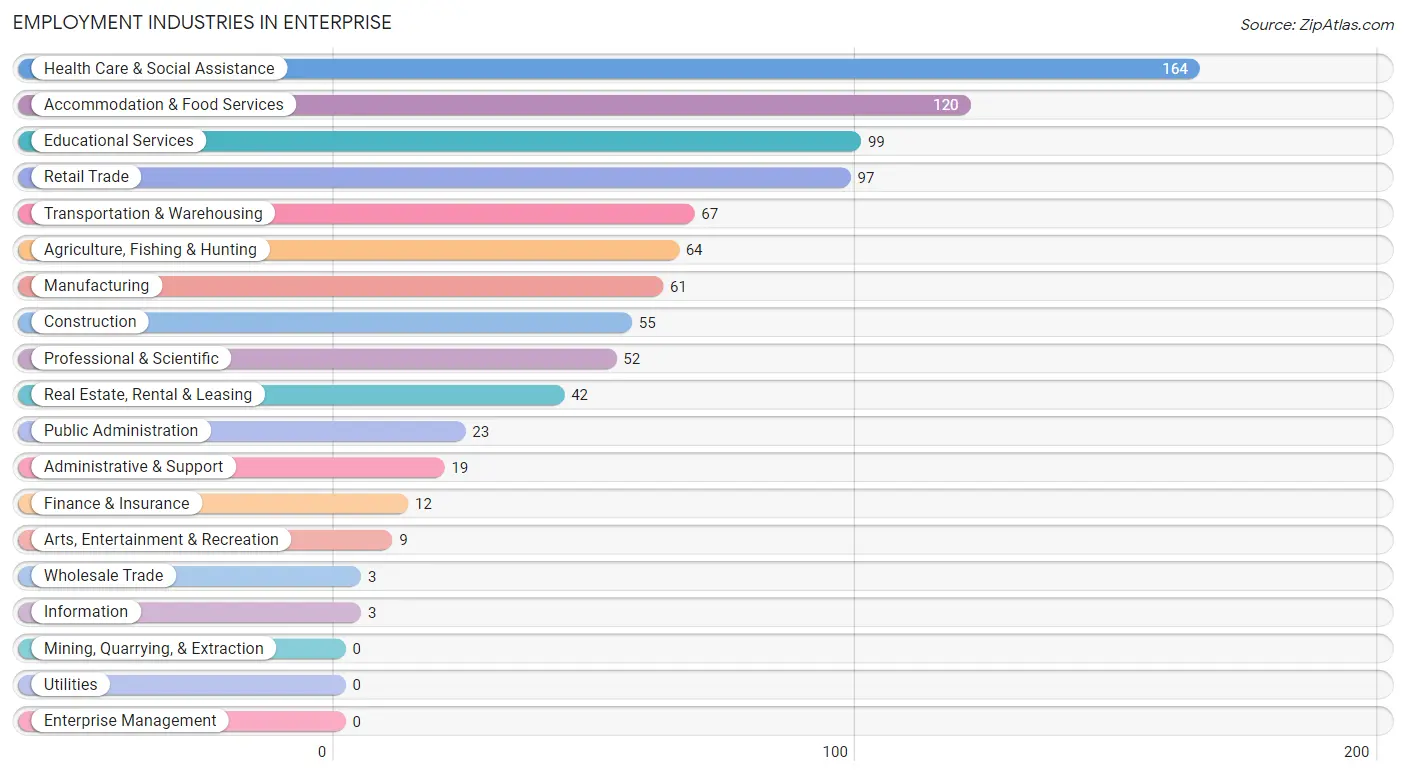
Employment Industries in Enterprise
The major employment industries in Enterprise include Health Care & Social Assistance (164 | 18.1%), Accommodation & Food Services (120 | 13.2%), Educational Services (99 | 10.9%), Retail Trade (97 | 10.7%), and Transportation & Warehousing (67 | 7.4%).
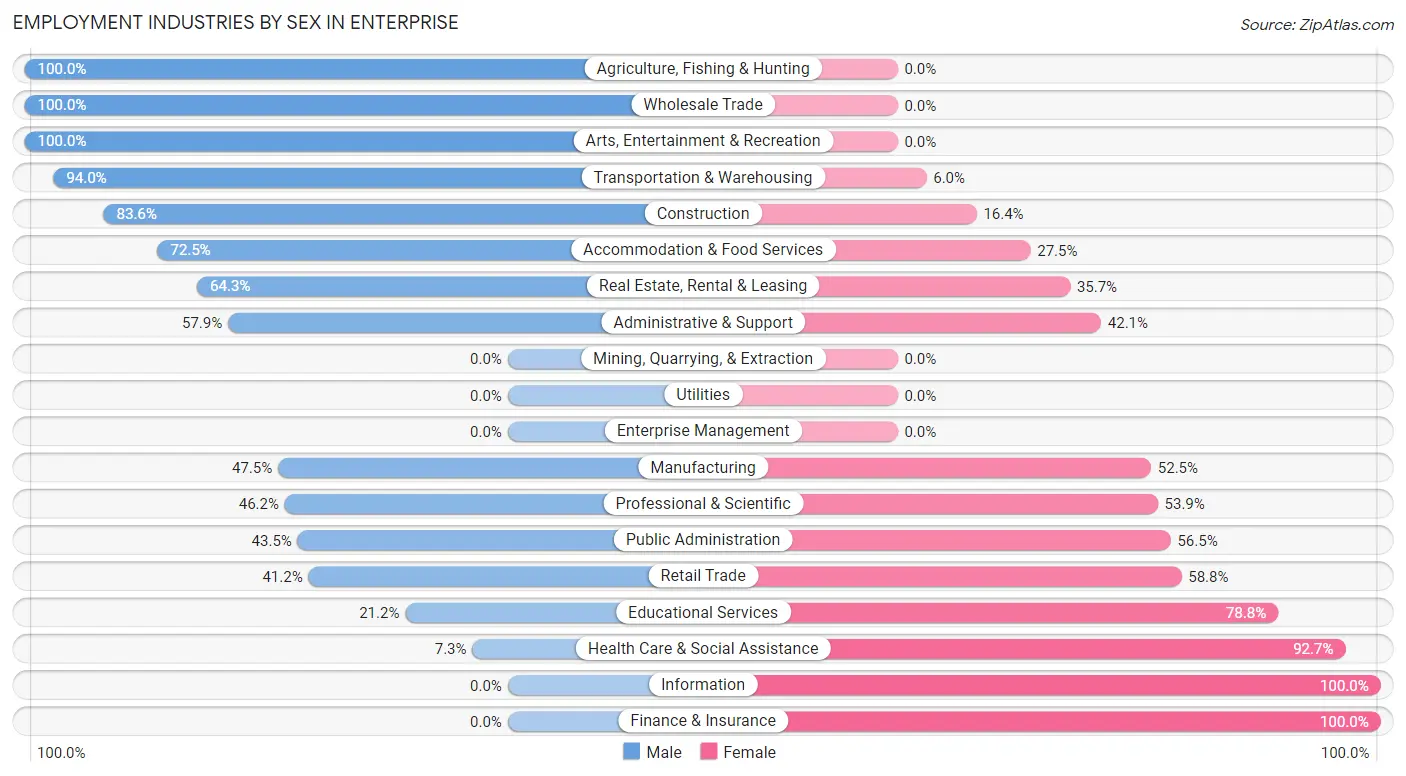
Employment Industries by Sex in Enterprise
The Enterprise industries that see more men than women are Agriculture, Fishing & Hunting (100.0%), Wholesale Trade (100.0%), and Arts, Entertainment & Recreation (100.0%), whereas the industries that tend to have a higher number of women are Information (100.0%), Finance & Insurance (100.0%), and Health Care & Social Assistance (92.7%).
| Industry | Male | Female |
| Agriculture, Fishing & Hunting | 64 (100.0%) | 0 (0.0%) |
| Mining, Quarrying, & Extraction | 0 (0.0%) | 0 (0.0%) |
| Construction | 46 (83.6%) | 9 (16.4%) |
| Manufacturing | 29 (47.5%) | 32 (52.5%) |
| Wholesale Trade | 3 (100.0%) | 0 (0.0%) |
| Retail Trade | 40 (41.2%) | 57 (58.8%) |
| Transportation & Warehousing | 63 (94.0%) | 4 (6.0%) |
| Utilities | 0 (0.0%) | 0 (0.0%) |
| Information | 0 (0.0%) | 3 (100.0%) |
| Finance & Insurance | 0 (0.0%) | 12 (100.0%) |
| Real Estate, Rental & Leasing | 27 (64.3%) | 15 (35.7%) |
| Professional & Scientific | 24 (46.2%) | 28 (53.8%) |
| Enterprise Management | 0 (0.0%) | 0 (0.0%) |
| Administrative & Support | 11 (57.9%) | 8 (42.1%) |
| Educational Services | 21 (21.2%) | 78 (78.8%) |
| Health Care & Social Assistance | 12 (7.3%) | 152 (92.7%) |
| Arts, Entertainment & Recreation | 9 (100.0%) | 0 (0.0%) |
| Accommodation & Food Services | 87 (72.5%) | 33 (27.5%) |
| Public Administration | 10 (43.5%) | 13 (56.5%) |
| Total | 453 (49.9%) | 455 (50.1%) |
Education in Enterprise
School Enrollment in Enterprise
The most common levels of schooling among the 482 students in Enterprise are middle school (146 | 30.3%), high school (124 | 25.7%), and elementary school (85 | 17.6%).
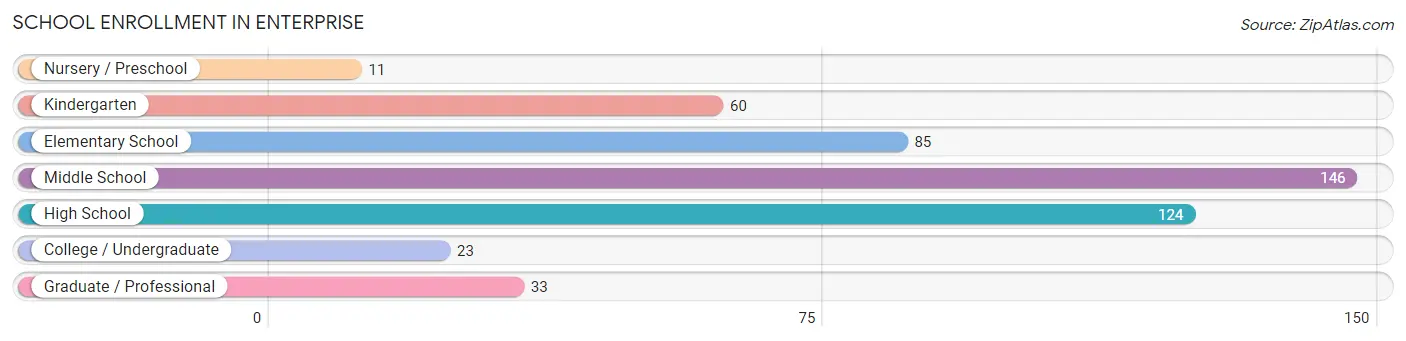
| School Level | # Students | % Students |
| Nursery / Preschool | 11 | 2.3% |
| Kindergarten | 60 | 12.4% |
| Elementary School | 85 | 17.6% |
| Middle School | 146 | 30.3% |
| High School | 124 | 25.7% |
| College / Undergraduate | 23 | 4.8% |
| Graduate / Professional | 33 | 6.9% |
| Total | 482 | 100.0% |
School Enrollment by Age by Funding Source in Enterprise
Out of a total of 482 students who are enrolled in schools in Enterprise, 47 (9.8%) attend a private institution, while the remaining 435 (90.2%) are enrolled in public schools. The age group of 18 to 19 year olds has the highest likelihood of being enrolled in private schools, with 7 (100.0% in the age bracket) enrolled. Conversely, the age group of 10 to 14 year olds has the lowest likelihood of being enrolled in a private school, with 172 (100.0% in the age bracket) attending a public institution.
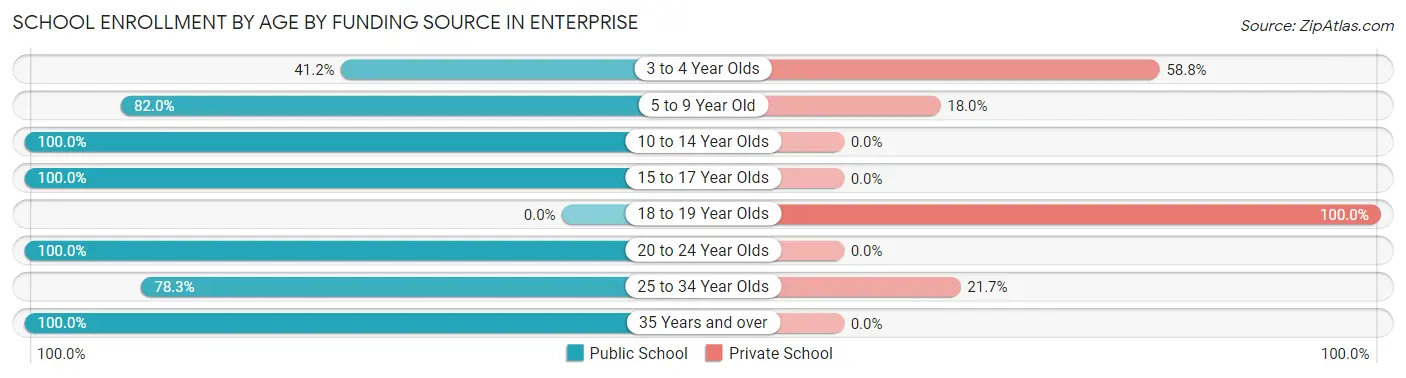
| Age Bracket | Public School | Private School |
| 3 to 4 Year Olds | 7 (41.2%) | 10 (58.8%) |
| 5 to 9 Year Old | 114 (82.0%) | 25 (18.0%) |
| 10 to 14 Year Olds | 172 (100.0%) | 0 (0.0%) |
| 15 to 17 Year Olds | 98 (100.0%) | 0 (0.0%) |
| 18 to 19 Year Olds | 0 (0.0%) | 7 (100.0%) |
| 20 to 24 Year Olds | 11 (100.0%) | 0 (0.0%) |
| 25 to 34 Year Olds | 18 (78.3%) | 5 (21.7%) |
| 35 Years and over | 15 (100.0%) | 0 (0.0%) |
| Total | 435 (90.2%) | 47 (9.8%) |
Educational Attainment by Field of Study in Enterprise
Bio, nature & agricultural (110 | 20.1%), psychology (74 | 13.5%), education (73 | 13.4%), arts & humanities (51 | 9.3%), and science & technology (39 | 7.1%) are the most common fields of study among 547 individuals in Enterprise who have obtained a bachelor's degree or higher.
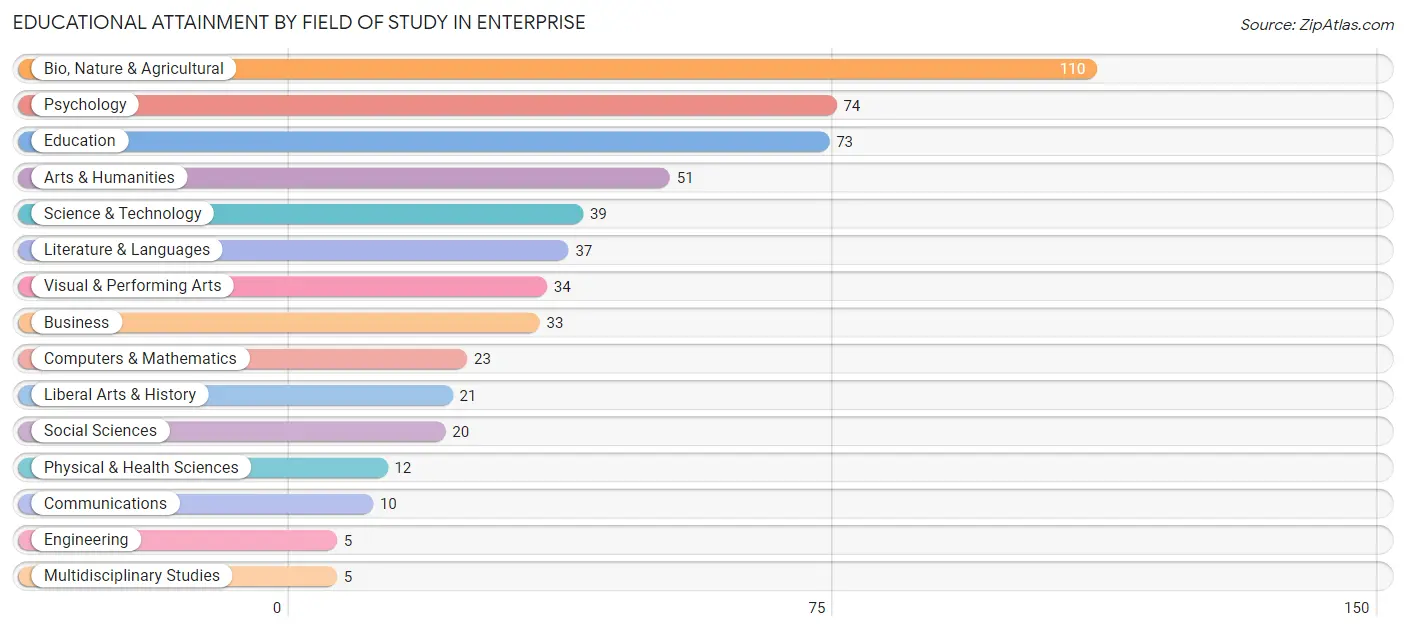
| Field of Study | # Graduates | % Graduates |
| Computers & Mathematics | 23 | 4.2% |
| Bio, Nature & Agricultural | 110 | 20.1% |
| Physical & Health Sciences | 12 | 2.2% |
| Psychology | 74 | 13.5% |
| Social Sciences | 20 | 3.7% |
| Engineering | 5 | 0.9% |
| Multidisciplinary Studies | 5 | 0.9% |
| Science & Technology | 39 | 7.1% |
| Business | 33 | 6.0% |
| Education | 73 | 13.4% |
| Literature & Languages | 37 | 6.8% |
| Liberal Arts & History | 21 | 3.8% |
| Visual & Performing Arts | 34 | 6.2% |
| Communications | 10 | 1.8% |
| Arts & Humanities | 51 | 9.3% |
| Total | 547 | 100.0% |
Transportation & Commute in Enterprise
Vehicle Availability by Sex in Enterprise
The most prevalent vehicle ownership categories in Enterprise are males with 2 vehicles (183, accounting for 40.4%) and females with 2 vehicles (200, making up 40.2%).
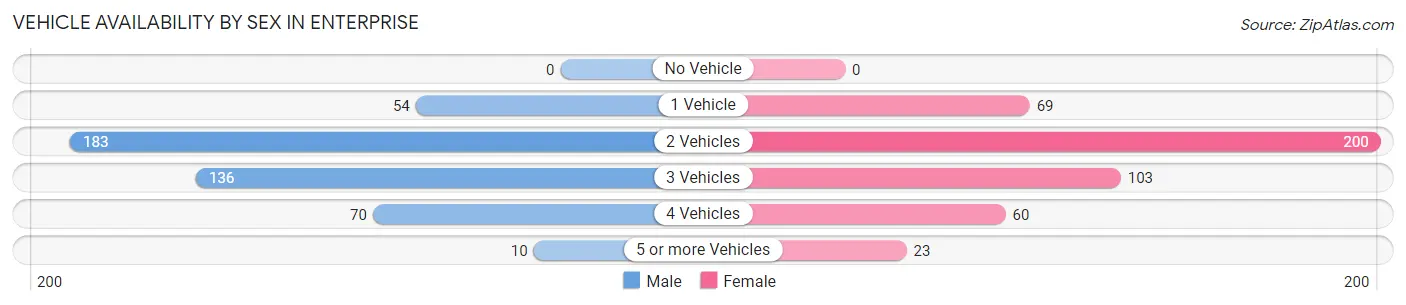
| Vehicles Available | Male | Female |
| No Vehicle | 0 (0.0%) | 0 (0.0%) |
| 1 Vehicle | 54 (11.9%) | 69 (15.2%) |
| 2 Vehicles | 183 (40.4%) | 200 (44.0%) |
| 3 Vehicles | 136 (30.0%) | 103 (22.6%) |
| 4 Vehicles | 70 (15.4%) | 60 (13.2%) |
| 5 or more Vehicles | 10 (2.2%) | 23 (5.1%) |
| Total | 453 (100.0%) | 455 (100.0%) |
Commute Time in Enterprise
The most frequently occuring commute durations in Enterprise are 5 to 9 minutes (318 commuters, 37.2%), less than 5 minutes (203 commuters, 23.7%), and 10 to 14 minutes (153 commuters, 17.9%).
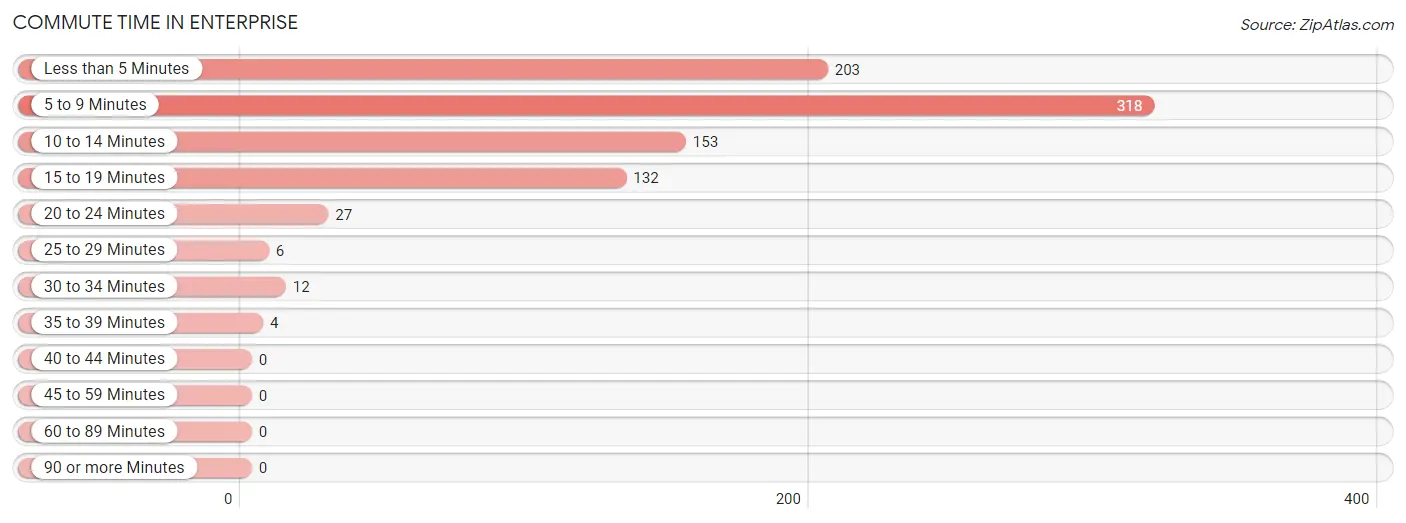
| Commute Time | # Commuters | % Commuters |
| Less than 5 Minutes | 203 | 23.7% |
| 5 to 9 Minutes | 318 | 37.2% |
| 10 to 14 Minutes | 153 | 17.9% |
| 15 to 19 Minutes | 132 | 15.4% |
| 20 to 24 Minutes | 27 | 3.2% |
| 25 to 29 Minutes | 6 | 0.7% |
| 30 to 34 Minutes | 12 | 1.4% |
| 35 to 39 Minutes | 4 | 0.5% |
| 40 to 44 Minutes | 0 | 0.0% |
| 45 to 59 Minutes | 0 | 0.0% |
| 60 to 89 Minutes | 0 | 0.0% |
| 90 or more Minutes | 0 | 0.0% |
Commute Time by Sex in Enterprise
The most common commute times in Enterprise are less than 5 minutes (144 commuters, 32.5%) for males and 5 to 9 minutes (243 commuters, 59.0%) for females.
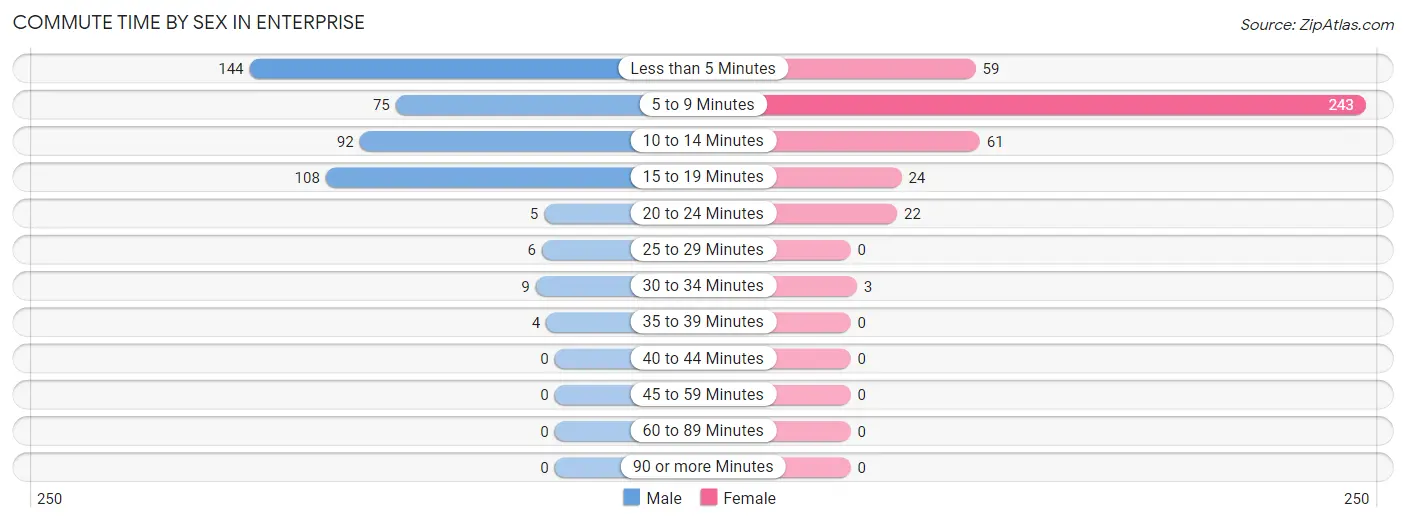
| Commute Time | Male | Female |
| Less than 5 Minutes | 144 (32.5%) | 59 (14.3%) |
| 5 to 9 Minutes | 75 (16.9%) | 243 (59.0%) |
| 10 to 14 Minutes | 92 (20.8%) | 61 (14.8%) |
| 15 to 19 Minutes | 108 (24.4%) | 24 (5.8%) |
| 20 to 24 Minutes | 5 (1.1%) | 22 (5.3%) |
| 25 to 29 Minutes | 6 (1.3%) | 0 (0.0%) |
| 30 to 34 Minutes | 9 (2.0%) | 3 (0.7%) |
| 35 to 39 Minutes | 4 (0.9%) | 0 (0.0%) |
| 40 to 44 Minutes | 0 (0.0%) | 0 (0.0%) |
| 45 to 59 Minutes | 0 (0.0%) | 0 (0.0%) |
| 60 to 89 Minutes | 0 (0.0%) | 0 (0.0%) |
| 90 or more Minutes | 0 (0.0%) | 0 (0.0%) |
Time of Departure to Work by Sex in Enterprise
The most frequent times of departure to work in Enterprise are 6:00 AM to 6:29 AM (124, 28.0%) for males and 7:00 AM to 7:29 AM (103, 25.0%) for females.
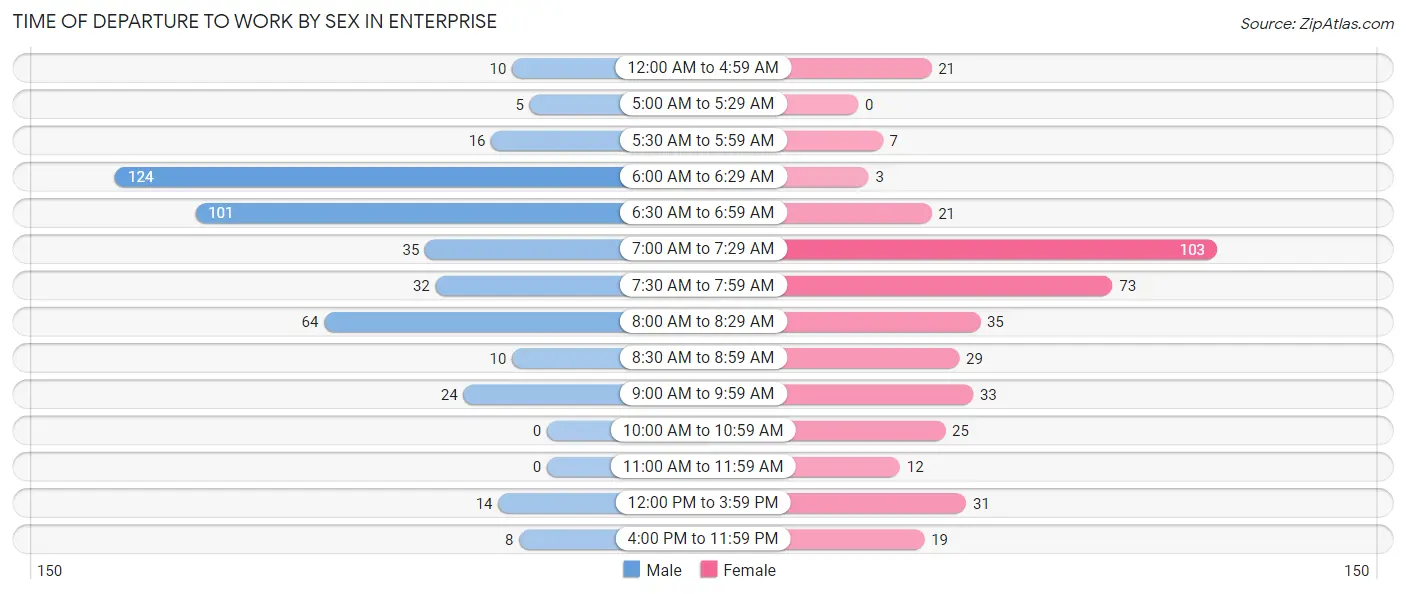
| Time of Departure | Male | Female |
| 12:00 AM to 4:59 AM | 10 (2.3%) | 21 (5.1%) |
| 5:00 AM to 5:29 AM | 5 (1.1%) | 0 (0.0%) |
| 5:30 AM to 5:59 AM | 16 (3.6%) | 7 (1.7%) |
| 6:00 AM to 6:29 AM | 124 (28.0%) | 3 (0.7%) |
| 6:30 AM to 6:59 AM | 101 (22.8%) | 21 (5.1%) |
| 7:00 AM to 7:29 AM | 35 (7.9%) | 103 (25.0%) |
| 7:30 AM to 7:59 AM | 32 (7.2%) | 73 (17.7%) |
| 8:00 AM to 8:29 AM | 64 (14.4%) | 35 (8.5%) |
| 8:30 AM to 8:59 AM | 10 (2.3%) | 29 (7.0%) |
| 9:00 AM to 9:59 AM | 24 (5.4%) | 33 (8.0%) |
| 10:00 AM to 10:59 AM | 0 (0.0%) | 25 (6.1%) |
| 11:00 AM to 11:59 AM | 0 (0.0%) | 12 (2.9%) |
| 12:00 PM to 3:59 PM | 14 (3.2%) | 31 (7.5%) |
| 4:00 PM to 11:59 PM | 8 (1.8%) | 19 (4.6%) |
| Total | 443 (100.0%) | 412 (100.0%) |
Housing Occupancy in Enterprise
Occupancy by Ownership in Enterprise
Of the total 894 dwellings in Enterprise, owner-occupied units account for 602 (67.3%), while renter-occupied units make up 292 (32.7%).
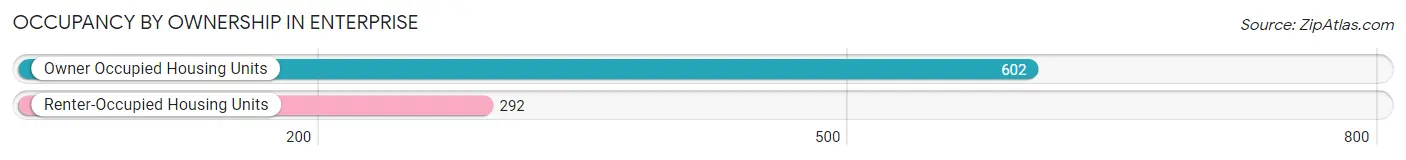
| Occupancy | # Housing Units | % Housing Units |
| Owner Occupied Housing Units | 602 | 67.3% |
| Renter-Occupied Housing Units | 292 | 32.7% |
| Total Occupied Housing Units | 894 | 100.0% |
Occupancy by Household Size in Enterprise
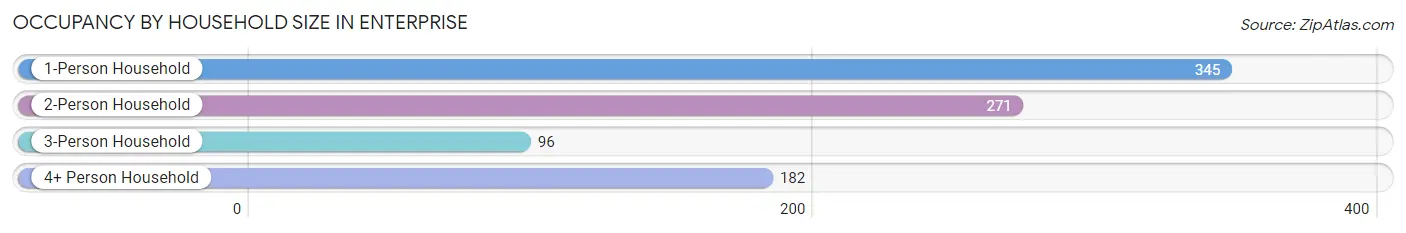
| Household Size | # Housing Units | % Housing Units |
| 1-Person Household | 345 | 38.6% |
| 2-Person Household | 271 | 30.3% |
| 3-Person Household | 96 | 10.7% |
| 4+ Person Household | 182 | 20.4% |
| Total Housing Units | 894 | 100.0% |
Occupancy by Ownership by Household Size in Enterprise
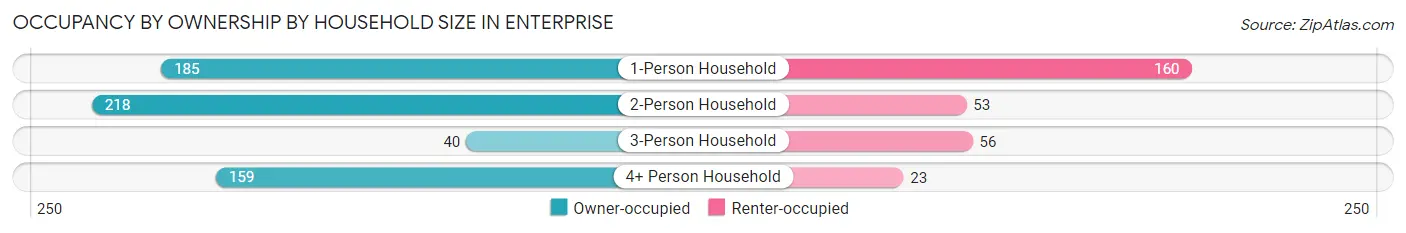
| Household Size | Owner-occupied | Renter-occupied |
| 1-Person Household | 185 (53.6%) | 160 (46.4%) |
| 2-Person Household | 218 (80.4%) | 53 (19.6%) |
| 3-Person Household | 40 (41.7%) | 56 (58.3%) |
| 4+ Person Household | 159 (87.4%) | 23 (12.6%) |
| Total Housing Units | 602 (67.3%) | 292 (32.7%) |
Occupancy by Educational Attainment in Enterprise
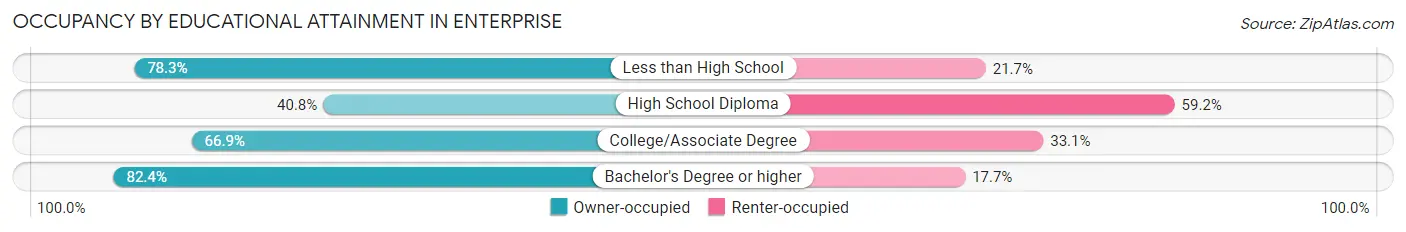
| Household Size | Owner-occupied | Renter-occupied |
| Less than High School | 18 (78.3%) | 5 (21.7%) |
| High School Diploma | 80 (40.8%) | 116 (59.2%) |
| College/Associate Degree | 224 (66.9%) | 111 (33.1%) |
| Bachelor's Degree or higher | 280 (82.4%) | 60 (17.6%) |
Occupancy by Age of Householder in Enterprise
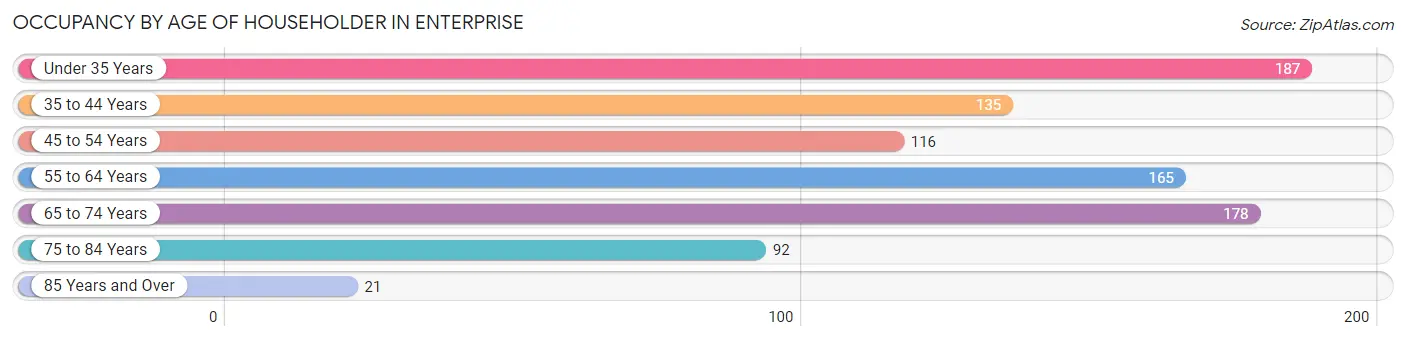
| Age Bracket | # Households | % Households |
| Under 35 Years | 187 | 20.9% |
| 35 to 44 Years | 135 | 15.1% |
| 45 to 54 Years | 116 | 13.0% |
| 55 to 64 Years | 165 | 18.5% |
| 65 to 74 Years | 178 | 19.9% |
| 75 to 84 Years | 92 | 10.3% |
| 85 Years and Over | 21 | 2.4% |
| Total | 894 | 100.0% |
Housing Finances in Enterprise
Median Income by Occupancy in Enterprise
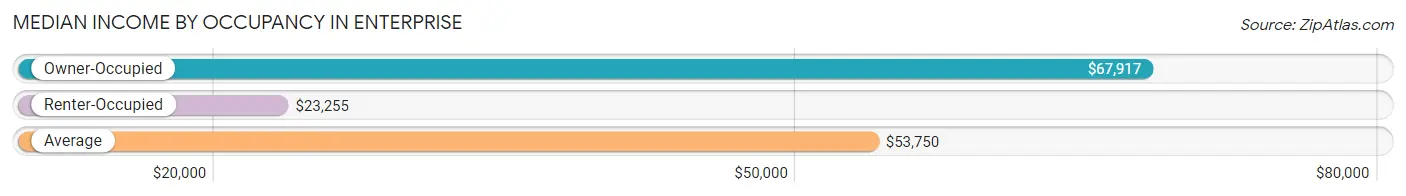
| Occupancy Type | # Households | Median Income |
| Owner-Occupied | 602 (67.3%) | $67,917 |
| Renter-Occupied | 292 (32.7%) | $23,255 |
| Average | 894 (100.0%) | $53,750 |
Occupancy by Householder Income Bracket in Enterprise
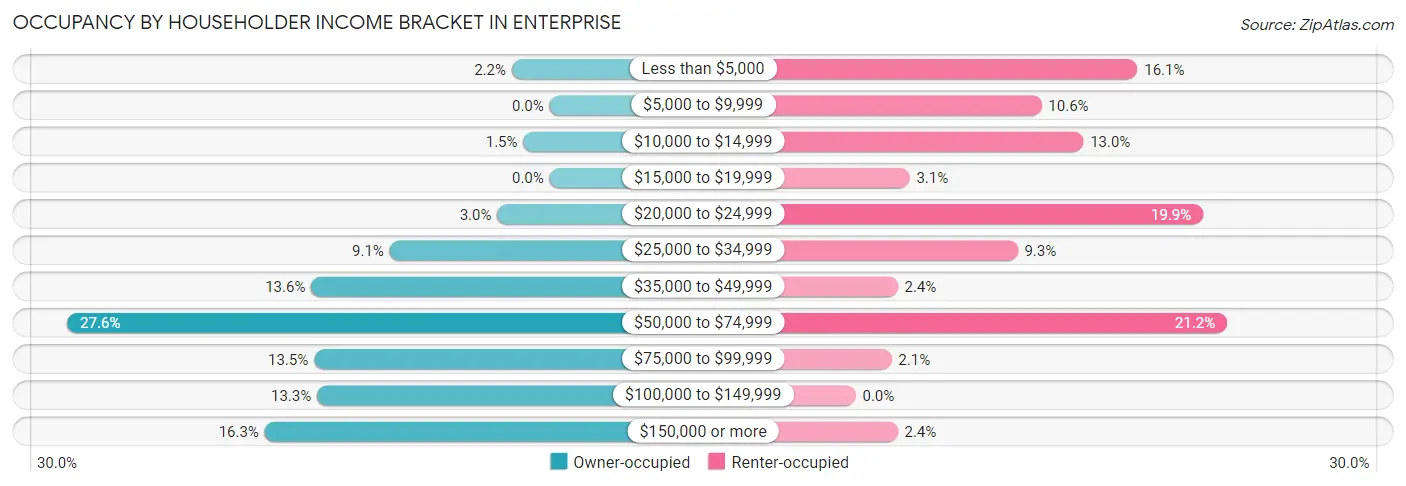
| Income Bracket | Owner-occupied | Renter-occupied |
| Less than $5,000 | 13 (2.2%) | 47 (16.1%) |
| $5,000 to $9,999 | 0 (0.0%) | 31 (10.6%) |
| $10,000 to $14,999 | 9 (1.5%) | 38 (13.0%) |
| $15,000 to $19,999 | 0 (0.0%) | 9 (3.1%) |
| $20,000 to $24,999 | 18 (3.0%) | 58 (19.9%) |
| $25,000 to $34,999 | 55 (9.1%) | 27 (9.2%) |
| $35,000 to $49,999 | 82 (13.6%) | 7 (2.4%) |
| $50,000 to $74,999 | 166 (27.6%) | 62 (21.2%) |
| $75,000 to $99,999 | 81 (13.5%) | 6 (2.1%) |
| $100,000 to $149,999 | 80 (13.3%) | 0 (0.0%) |
| $150,000 or more | 98 (16.3%) | 7 (2.4%) |
| Total | 602 (100.0%) | 292 (100.0%) |
Monthly Housing Cost Tiers in Enterprise
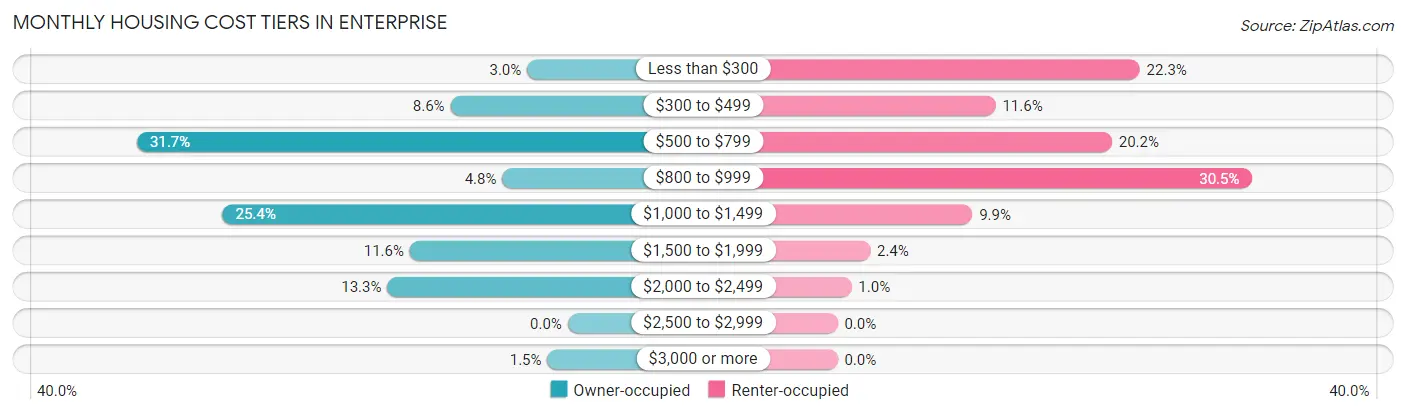
| Monthly Cost | Owner-occupied | Renter-occupied |
| Less than $300 | 18 (3.0%) | 65 (22.3%) |
| $300 to $499 | 52 (8.6%) | 34 (11.6%) |
| $500 to $799 | 191 (31.7%) | 59 (20.2%) |
| $800 to $999 | 29 (4.8%) | 89 (30.5%) |
| $1,000 to $1,499 | 153 (25.4%) | 29 (9.9%) |
| $1,500 to $1,999 | 70 (11.6%) | 7 (2.4%) |
| $2,000 to $2,499 | 80 (13.3%) | 3 (1.0%) |
| $2,500 to $2,999 | 0 (0.0%) | 0 (0.0%) |
| $3,000 or more | 9 (1.5%) | 0 (0.0%) |
| Total | 602 (100.0%) | 292 (100.0%) |
Physical Housing Characteristics in Enterprise
Housing Structures in Enterprise
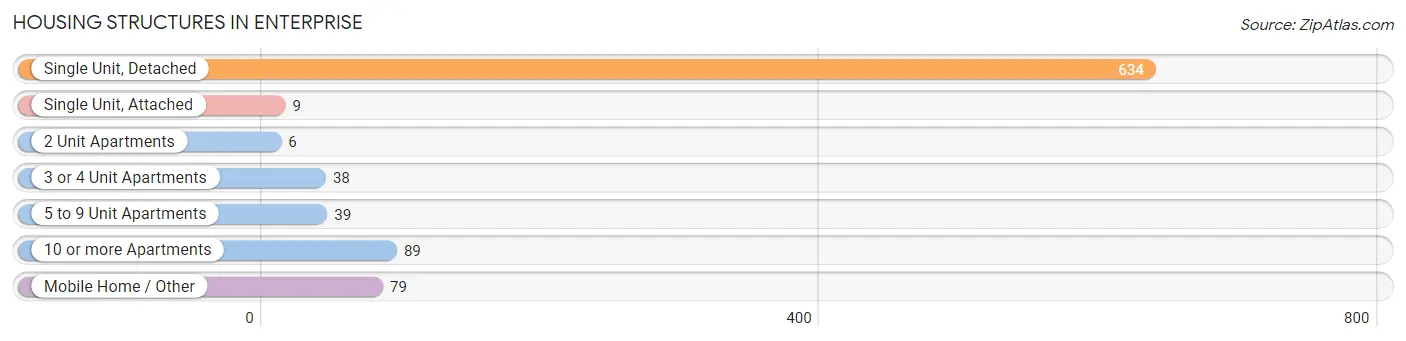
| Structure Type | # Housing Units | % Housing Units |
| Single Unit, Detached | 634 | 70.9% |
| Single Unit, Attached | 9 | 1.0% |
| 2 Unit Apartments | 6 | 0.7% |
| 3 or 4 Unit Apartments | 38 | 4.3% |
| 5 to 9 Unit Apartments | 39 | 4.4% |
| 10 or more Apartments | 89 | 10.0% |
| Mobile Home / Other | 79 | 8.8% |
| Total | 894 | 100.0% |
Housing Structures by Occupancy in Enterprise
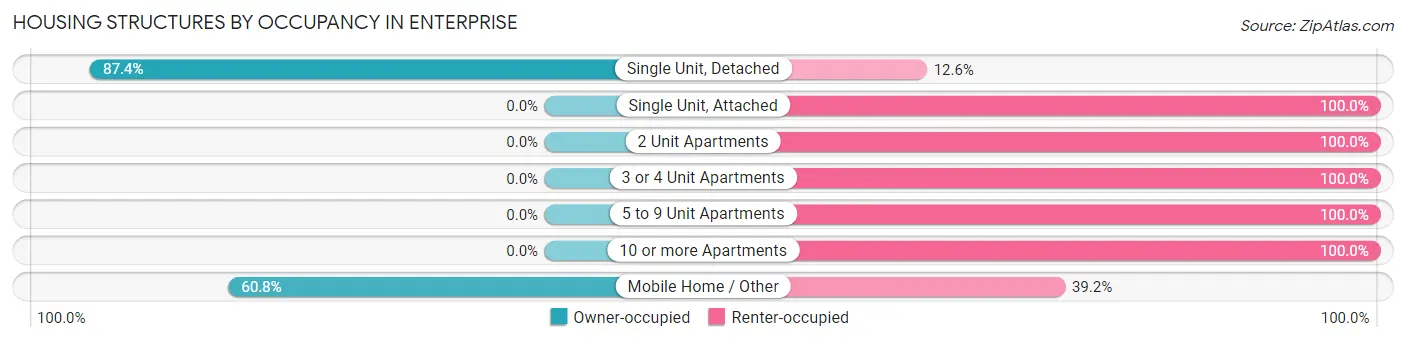
| Structure Type | Owner-occupied | Renter-occupied |
| Single Unit, Detached | 554 (87.4%) | 80 (12.6%) |
| Single Unit, Attached | 0 (0.0%) | 9 (100.0%) |
| 2 Unit Apartments | 0 (0.0%) | 6 (100.0%) |
| 3 or 4 Unit Apartments | 0 (0.0%) | 38 (100.0%) |
| 5 to 9 Unit Apartments | 0 (0.0%) | 39 (100.0%) |
| 10 or more Apartments | 0 (0.0%) | 89 (100.0%) |
| Mobile Home / Other | 48 (60.8%) | 31 (39.2%) |
| Total | 602 (67.3%) | 292 (32.7%) |
Housing Structures by Number of Rooms in Enterprise
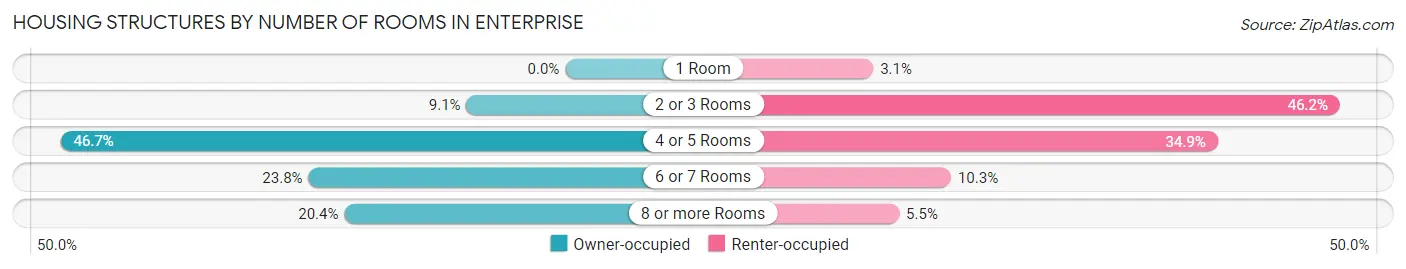
| Number of Rooms | Owner-occupied | Renter-occupied |
| 1 Room | 0 (0.0%) | 9 (3.1%) |
| 2 or 3 Rooms | 55 (9.1%) | 135 (46.2%) |
| 4 or 5 Rooms | 281 (46.7%) | 102 (34.9%) |
| 6 or 7 Rooms | 143 (23.7%) | 30 (10.3%) |
| 8 or more Rooms | 123 (20.4%) | 16 (5.5%) |
| Total | 602 (100.0%) | 292 (100.0%) |
Housing Structure by Heating Type in Enterprise
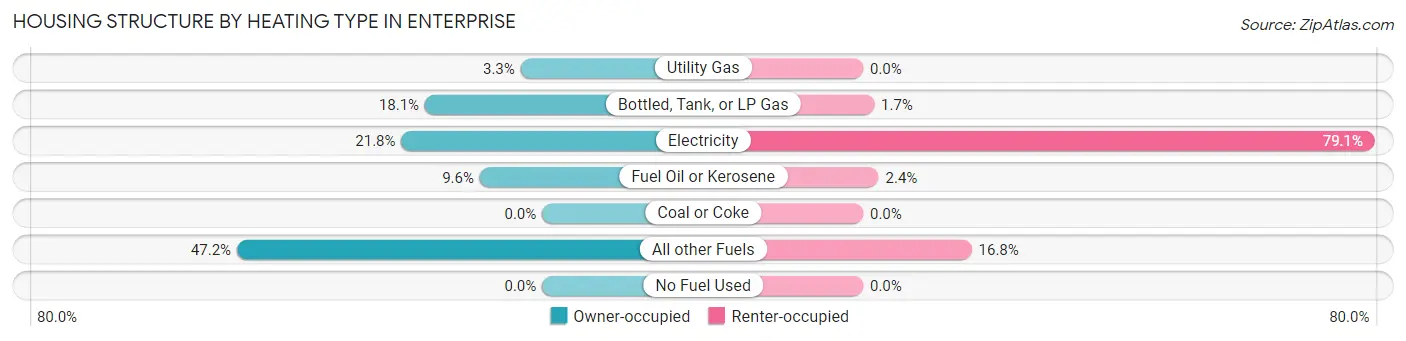
| Heating Type | Owner-occupied | Renter-occupied |
| Utility Gas | 20 (3.3%) | 0 (0.0%) |
| Bottled, Tank, or LP Gas | 109 (18.1%) | 5 (1.7%) |
| Electricity | 131 (21.8%) | 231 (79.1%) |
| Fuel Oil or Kerosene | 58 (9.6%) | 7 (2.4%) |
| Coal or Coke | 0 (0.0%) | 0 (0.0%) |
| All other Fuels | 284 (47.2%) | 49 (16.8%) |
| No Fuel Used | 0 (0.0%) | 0 (0.0%) |
| Total | 602 (100.0%) | 292 (100.0%) |
Household Vehicle Usage in Enterprise
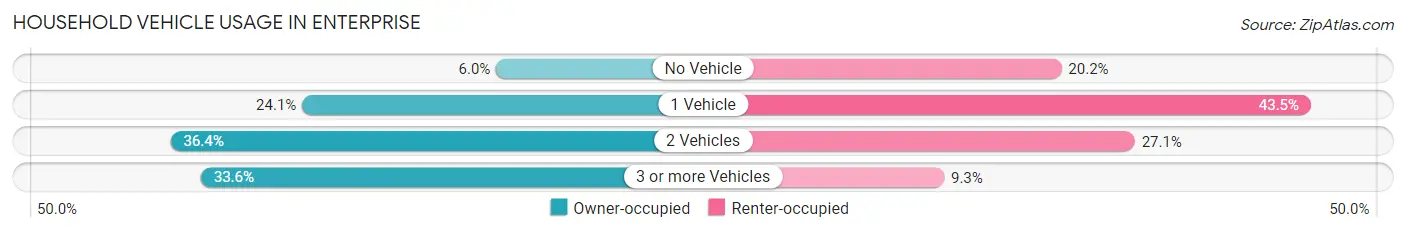
| Vehicles per Household | Owner-occupied | Renter-occupied |
| No Vehicle | 36 (6.0%) | 59 (20.2%) |
| 1 Vehicle | 145 (24.1%) | 127 (43.5%) |
| 2 Vehicles | 219 (36.4%) | 79 (27.1%) |
| 3 or more Vehicles | 202 (33.6%) | 27 (9.2%) |
| Total | 602 (100.0%) | 292 (100.0%) |
Real Estate & Mortgages in Enterprise
Real Estate and Mortgage Overview in Enterprise
| Characteristic | Without Mortgage | With Mortgage |
| Housing Units | 252 | 350 |
| Median Property Value | $279,600 | $257,000 |
| Median Household Income | $57,031 | $84 |
| Monthly Housing Costs | $573 | $4 |
| Real Estate Taxes | $2,394 | $0 |
Property Value by Mortgage Status in Enterprise
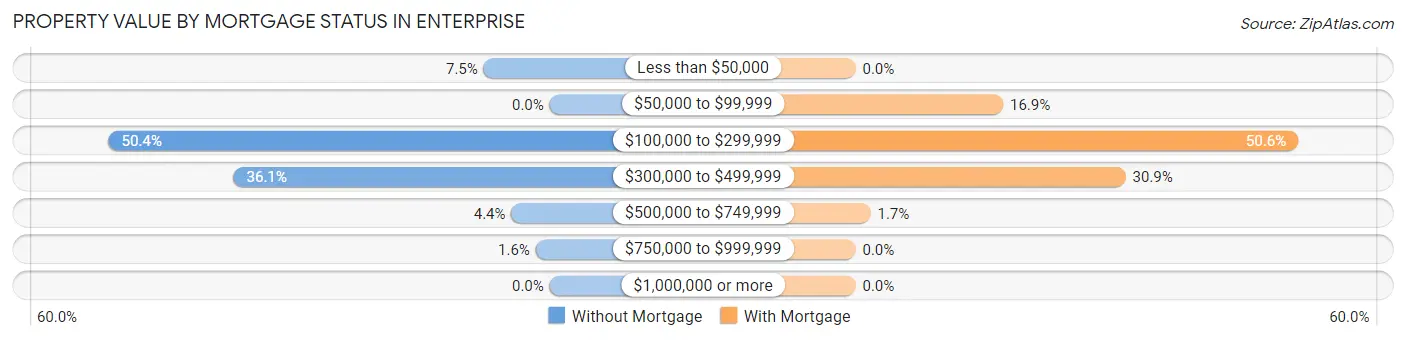
| Property Value | Without Mortgage | With Mortgage |
| Less than $50,000 | 19 (7.5%) | 0 (0.0%) |
| $50,000 to $99,999 | 0 (0.0%) | 59 (16.9%) |
| $100,000 to $299,999 | 127 (50.4%) | 177 (50.6%) |
| $300,000 to $499,999 | 91 (36.1%) | 108 (30.9%) |
| $500,000 to $749,999 | 11 (4.4%) | 6 (1.7%) |
| $750,000 to $999,999 | 4 (1.6%) | 0 (0.0%) |
| $1,000,000 or more | 0 (0.0%) | 0 (0.0%) |
| Total | 252 (100.0%) | 350 (100.0%) |
Household Income by Mortgage Status in Enterprise
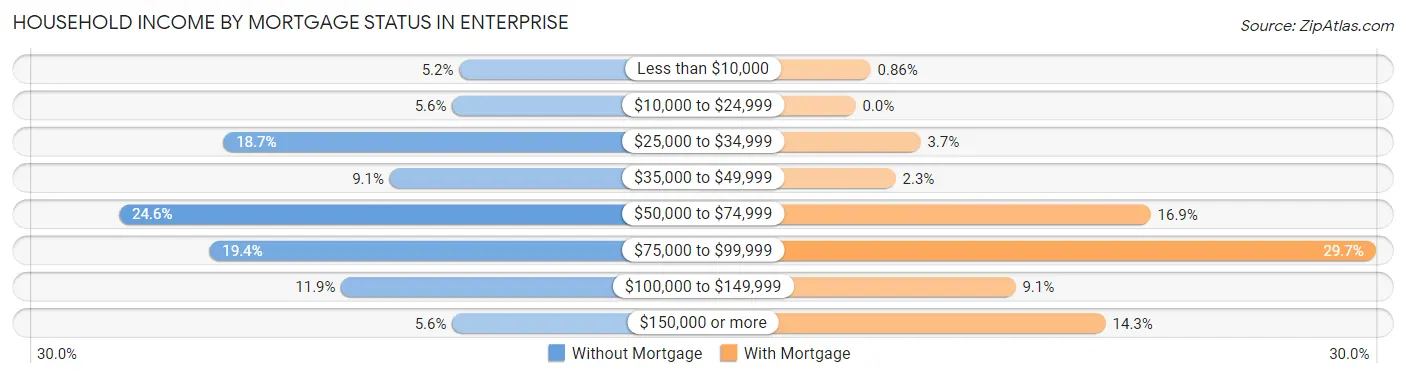
| Household Income | Without Mortgage | With Mortgage |
| Less than $10,000 | 13 (5.2%) | 3 (0.9%) |
| $10,000 to $24,999 | 14 (5.6%) | 0 (0.0%) |
| $25,000 to $34,999 | 47 (18.6%) | 13 (3.7%) |
| $35,000 to $49,999 | 23 (9.1%) | 8 (2.3%) |
| $50,000 to $74,999 | 62 (24.6%) | 59 (16.9%) |
| $75,000 to $99,999 | 49 (19.4%) | 104 (29.7%) |
| $100,000 to $149,999 | 30 (11.9%) | 32 (9.1%) |
| $150,000 or more | 14 (5.6%) | 50 (14.3%) |
| Total | 252 (100.0%) | 350 (100.0%) |
Property Value to Household Income Ratio in Enterprise
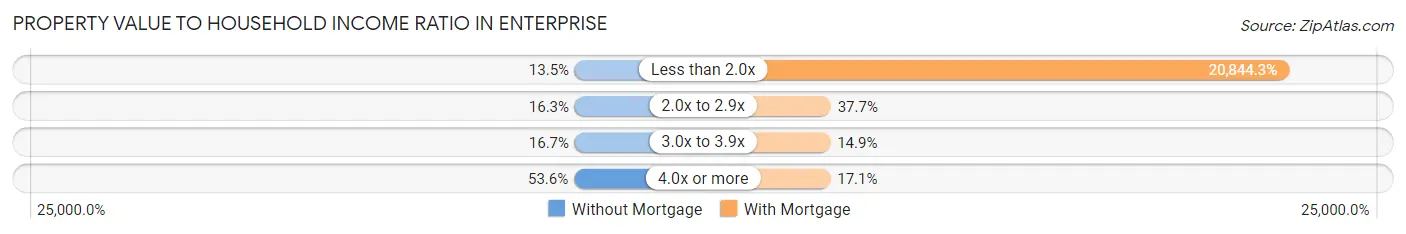
| Value-to-Income Ratio | Without Mortgage | With Mortgage |
| Less than 2.0x | 34 (13.5%) | 72,955 (20,844.3%) |
| 2.0x to 2.9x | 41 (16.3%) | 132 (37.7%) |
| 3.0x to 3.9x | 42 (16.7%) | 52 (14.9%) |
| 4.0x or more | 135 (53.6%) | 60 (17.1%) |
| Total | 252 (100.0%) | 350 (100.0%) |
Real Estate Taxes by Mortgage Status in Enterprise
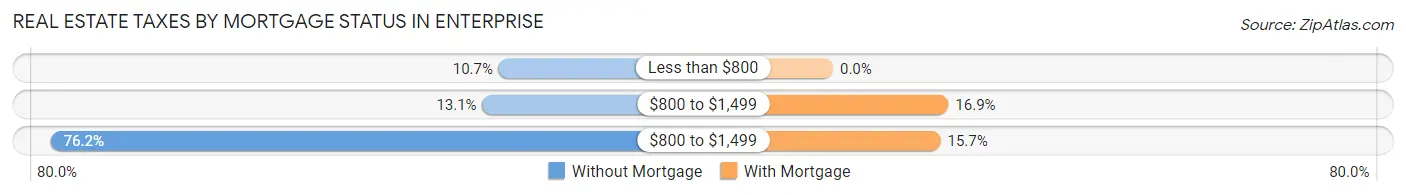
| Property Taxes | Without Mortgage | With Mortgage |
| Less than $800 | 27 (10.7%) | 0 (0.0%) |
| $800 to $1,499 | 33 (13.1%) | 59 (16.9%) |
| $800 to $1,499 | 192 (76.2%) | 55 (15.7%) |
| Total | 252 (100.0%) | 350 (100.0%) |
Health & Disability in Enterprise
Health Insurance Coverage by Age in Enterprise
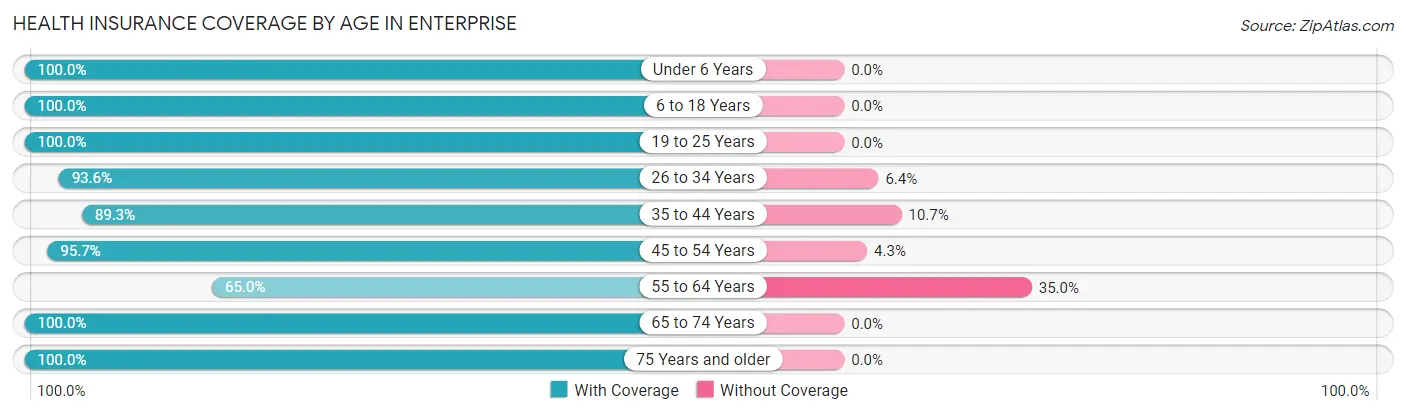
| Age Bracket | With Coverage | Without Coverage |
| Under 6 Years | 139 (100.0%) | 0 (0.0%) |
| 6 to 18 Years | 399 (100.0%) | 0 (0.0%) |
| 19 to 25 Years | 149 (100.0%) | 0 (0.0%) |
| 26 to 34 Years | 235 (93.6%) | 16 (6.4%) |
| 35 to 44 Years | 251 (89.3%) | 30 (10.7%) |
| 45 to 54 Years | 180 (95.7%) | 8 (4.3%) |
| 55 to 64 Years | 160 (65.0%) | 86 (35.0%) |
| 65 to 74 Years | 322 (100.0%) | 0 (0.0%) |
| 75 Years and older | 177 (100.0%) | 0 (0.0%) |
| Total | 2,012 (93.5%) | 140 (6.5%) |
Health Insurance Coverage by Citizenship Status in Enterprise
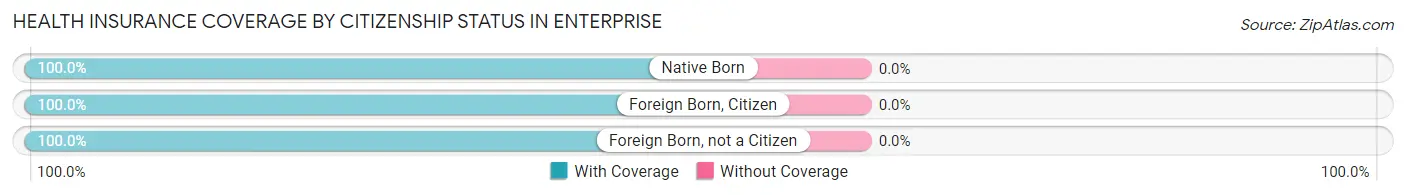
| Citizenship Status | With Coverage | Without Coverage |
| Native Born | 139 (100.0%) | 0 (0.0%) |
| Foreign Born, Citizen | 399 (100.0%) | 0 (0.0%) |
| Foreign Born, not a Citizen | 149 (100.0%) | 0 (0.0%) |
Health Insurance Coverage by Household Income in Enterprise
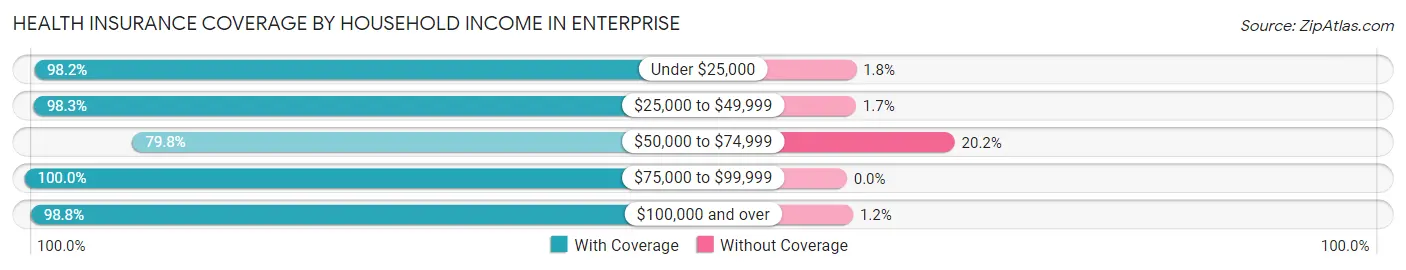
| Household Income | With Coverage | Without Coverage |
| Under $25,000 | 334 (98.2%) | 6 (1.8%) |
| $25,000 to $49,999 | 287 (98.3%) | 5 (1.7%) |
| $50,000 to $74,999 | 478 (79.8%) | 121 (20.2%) |
| $75,000 to $99,999 | 196 (100.0%) | 0 (0.0%) |
| $100,000 and over | 679 (98.8%) | 8 (1.2%) |
Public vs Private Health Insurance Coverage by Age in Enterprise
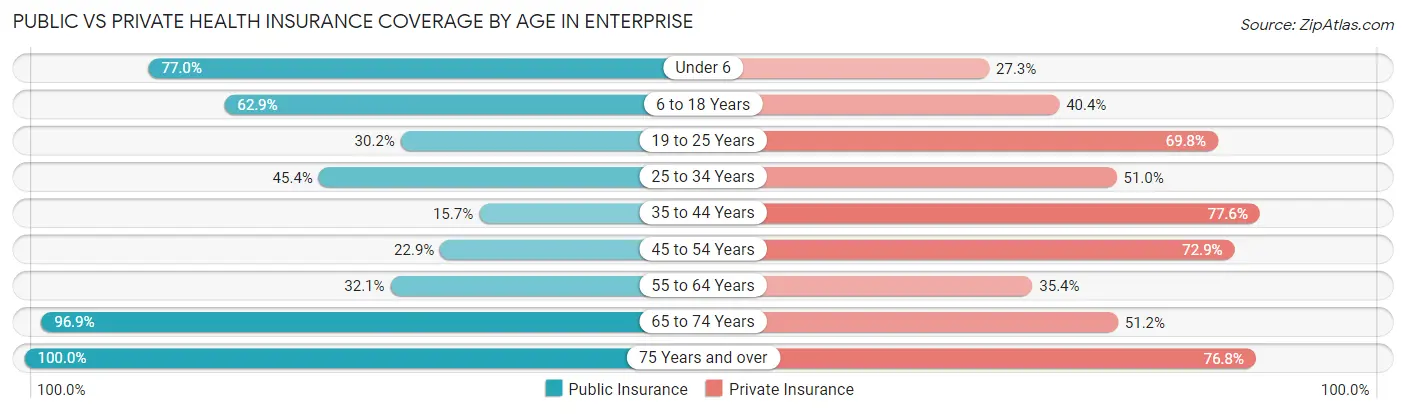
| Age Bracket | Public Insurance | Private Insurance |
| Under 6 | 107 (77.0%) | 38 (27.3%) |
| 6 to 18 Years | 251 (62.9%) | 161 (40.4%) |
| 19 to 25 Years | 45 (30.2%) | 104 (69.8%) |
| 25 to 34 Years | 114 (45.4%) | 128 (51.0%) |
| 35 to 44 Years | 44 (15.7%) | 218 (77.6%) |
| 45 to 54 Years | 43 (22.9%) | 137 (72.9%) |
| 55 to 64 Years | 79 (32.1%) | 87 (35.4%) |
| 65 to 74 Years | 312 (96.9%) | 165 (51.2%) |
| 75 Years and over | 177 (100.0%) | 136 (76.8%) |
| Total | 1,172 (54.5%) | 1,174 (54.5%) |
Disability Status by Sex by Age in Enterprise
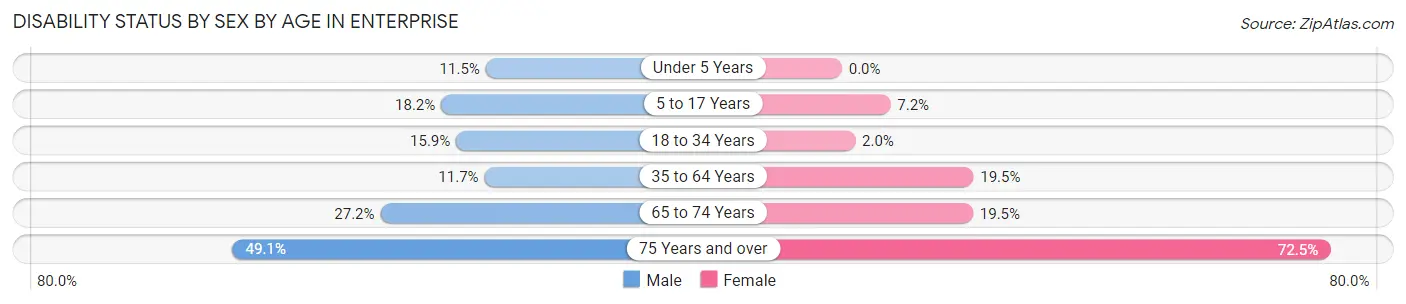
| Age Bracket | Male | Female |
| Under 5 Years | 6 (11.5%) | 0 (0.0%) |
| 5 to 17 Years | 55 (18.1%) | 8 (7.2%) |
| 18 to 34 Years | 25 (15.9%) | 5 (2.0%) |
| 35 to 64 Years | 34 (11.7%) | 83 (19.5%) |
| 65 to 74 Years | 47 (27.2%) | 29 (19.5%) |
| 75 Years and over | 28 (49.1%) | 87 (72.5%) |
Disability Class by Sex by Age in Enterprise
Disability Class: Hearing Difficulty
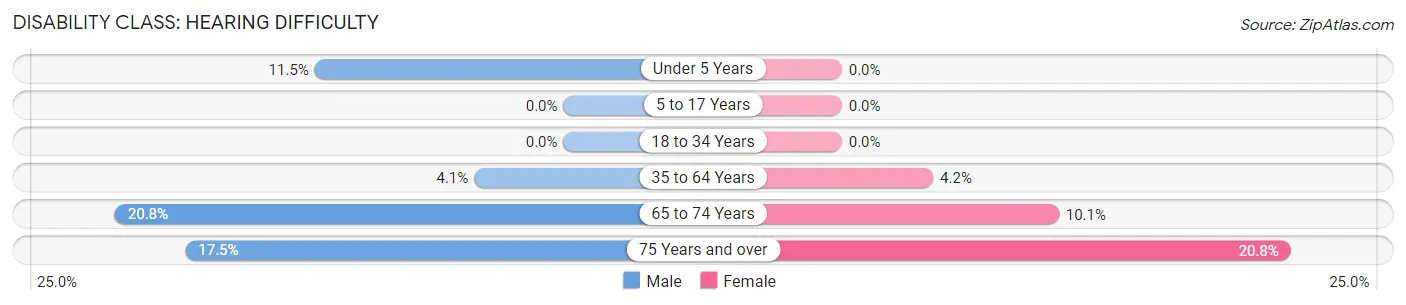
| Age Bracket | Male | Female |
| Under 5 Years | 6 (11.5%) | 0 (0.0%) |
| 5 to 17 Years | 0 (0.0%) | 0 (0.0%) |
| 18 to 34 Years | 0 (0.0%) | 0 (0.0%) |
| 35 to 64 Years | 12 (4.1%) | 18 (4.2%) |
| 65 to 74 Years | 36 (20.8%) | 15 (10.1%) |
| 75 Years and over | 10 (17.5%) | 25 (20.8%) |
Disability Class: Vision Difficulty
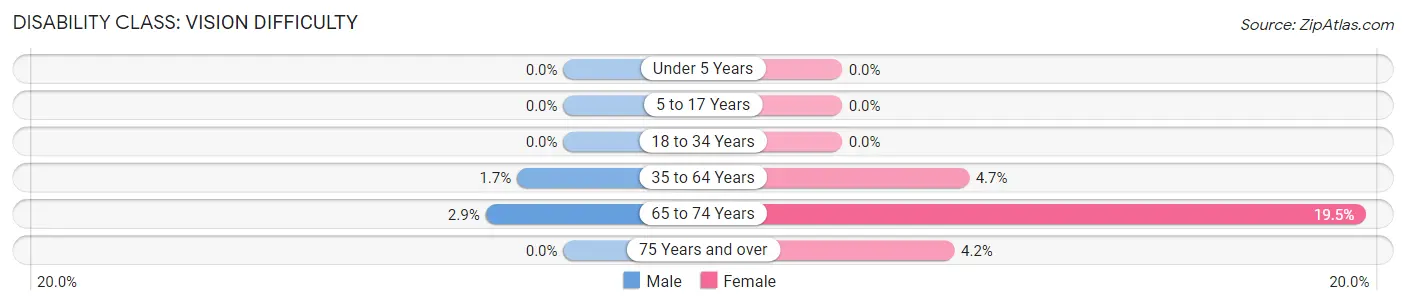
| Age Bracket | Male | Female |
| Under 5 Years | 0 (0.0%) | 0 (0.0%) |
| 5 to 17 Years | 0 (0.0%) | 0 (0.0%) |
| 18 to 34 Years | 0 (0.0%) | 0 (0.0%) |
| 35 to 64 Years | 5 (1.7%) | 20 (4.7%) |
| 65 to 74 Years | 5 (2.9%) | 29 (19.5%) |
| 75 Years and over | 0 (0.0%) | 5 (4.2%) |
Disability Class: Cognitive Difficulty
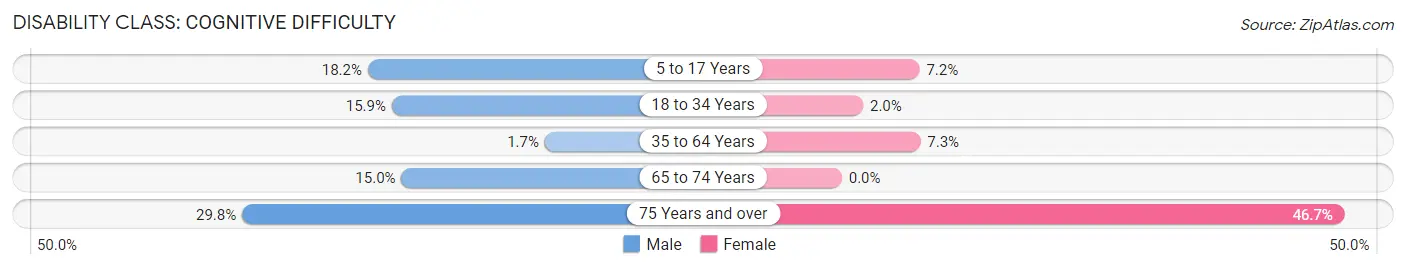
| Age Bracket | Male | Female |
| 5 to 17 Years | 55 (18.1%) | 8 (7.2%) |
| 18 to 34 Years | 25 (15.9%) | 5 (2.0%) |
| 35 to 64 Years | 5 (1.7%) | 31 (7.3%) |
| 65 to 74 Years | 26 (15.0%) | 0 (0.0%) |
| 75 Years and over | 17 (29.8%) | 56 (46.7%) |
Disability Class: Ambulatory Difficulty
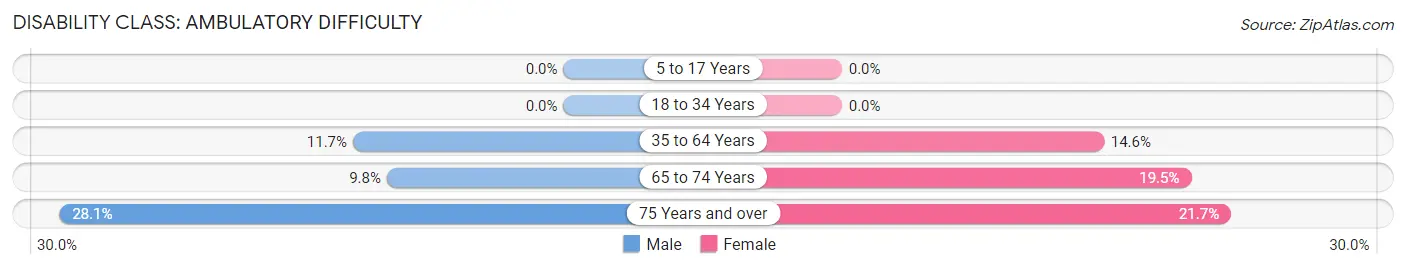
| Age Bracket | Male | Female |
| 5 to 17 Years | 0 (0.0%) | 0 (0.0%) |
| 18 to 34 Years | 0 (0.0%) | 0 (0.0%) |
| 35 to 64 Years | 34 (11.7%) | 62 (14.6%) |
| 65 to 74 Years | 17 (9.8%) | 29 (19.5%) |
| 75 Years and over | 16 (28.1%) | 26 (21.7%) |
Disability Class: Self-Care Difficulty
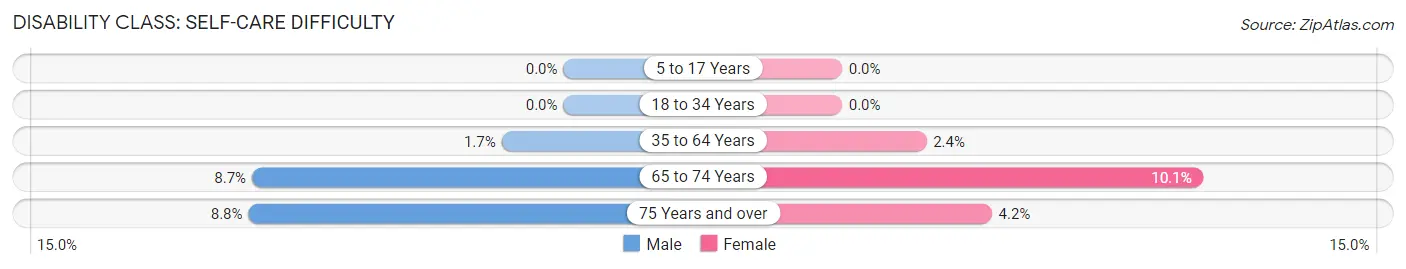
| Age Bracket | Male | Female |
| 5 to 17 Years | 0 (0.0%) | 0 (0.0%) |
| 18 to 34 Years | 0 (0.0%) | 0 (0.0%) |
| 35 to 64 Years | 5 (1.7%) | 10 (2.4%) |
| 65 to 74 Years | 15 (8.7%) | 15 (10.1%) |
| 75 Years and over | 5 (8.8%) | 5 (4.2%) |
Technology Access in Enterprise
Computing Device Access in Enterprise
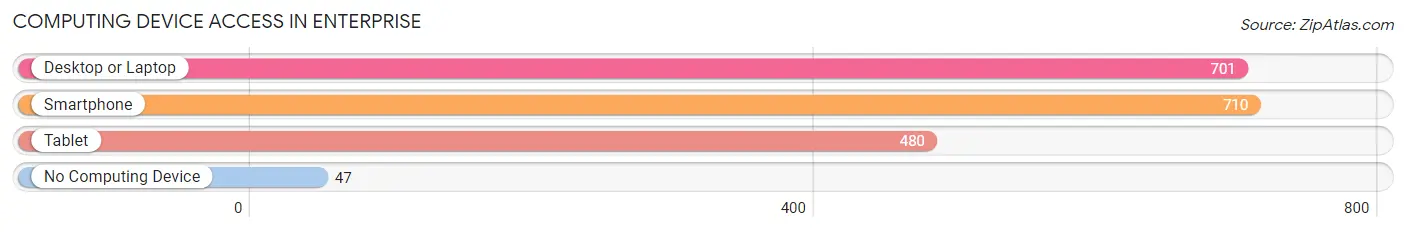
| Device Type | # Households | % Households |
| Desktop or Laptop | 701 | 78.4% |
| Smartphone | 710 | 79.4% |
| Tablet | 480 | 53.7% |
| No Computing Device | 47 | 5.3% |
| Total | 894 | 100.0% |
Internet Access in Enterprise
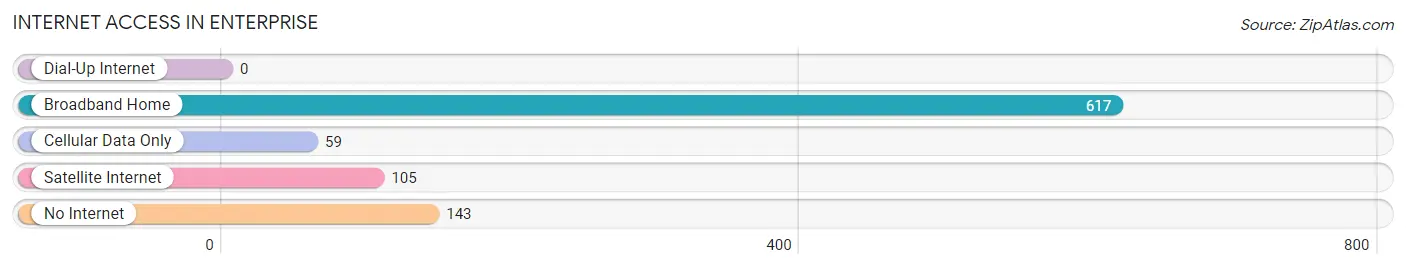
| Internet Type | # Households | % Households |
| Dial-Up Internet | 0 | 0.0% |
| Broadband Home | 617 | 69.0% |
| Cellular Data Only | 59 | 6.6% |
| Satellite Internet | 105 | 11.7% |
| No Internet | 143 | 16.0% |
| Total | 894 | 100.0% |
Enterprise Summary
Enterprise is a city located in the Wallowa County of Oregon, United States. It is the county seat of Wallowa County and is located in the northeastern corner of the state. The city is situated at the confluence of the Wallowa and Grande Ronde Rivers, and is surrounded by the Wallowa Mountains. As of the 2010 census, the population of Enterprise was 1,769.
History
The area that is now Enterprise was first inhabited by the Nez Perce Native American tribe. The first white settlers arrived in the area in the 1860s, and the city was officially incorporated in 1887. The city was named after the USS Enterprise, a ship that was part of the U.S. Navy's Pacific Squadron during the Civil War.
The city was an important center for the timber industry in the late 19th and early 20th centuries. The city was also home to a large sheep ranching industry, which was an important part of the local economy.
Geography
Enterprise is located at an elevation of 2,845 feet (867 m) above sea level. The city is situated at the confluence of the Wallowa and Grande Ronde Rivers, and is surrounded by the Wallowa Mountains. The city is located in the northeastern corner of Oregon, and is approximately 100 miles (160 km) east of Portland.
The climate in Enterprise is semi-arid, with hot summers and cold winters. The average annual temperature is 46°F (8°C), and the average annual precipitation is 16.5 inches (420 mm).
Economy
The economy of Enterprise is largely based on agriculture and tourism. The city is home to several large farms and ranches, and is a major producer of wheat, barley, and hay. The city is also home to several wineries and vineyards, and is a popular destination for wine-tasting tours.
Tourism is an important part of the local economy, and the city is home to several popular attractions, including the Wallowa Lake Tramway, the Wallowa Lake State Park, and the Wallowa Lake National Wildlife Refuge. The city is also home to several museums, including the Wallowa County Museum and the Enterprise Museum.
Demographics
As of the 2010 census, the population of Enterprise was 1,769. The racial makeup of the city was 94.2% White, 0.3% African American, 0.7% Native American, 0.3% Asian, 0.1% Pacific Islander, 0.7% from other races, and 3.1% from two or more races. Hispanic or Latino of any race were 2.2% of the population.
The median household income in Enterprise was $35,938, and the median family income was $41,250. The per capita income in the city was $17,945. About 11.2% of the population was below the poverty line.
Common Questions
What is Per Capita Income in Enterprise?
Per Capita income in Enterprise is $36,878.
What is the Median Family Income in Enterprise?
Median Family Income in Enterprise is $73,090.
What is the Median Household income in Enterprise?
Median Household Income in Enterprise is $53,750.
What is Income or Wage Gap in Enterprise?
Income or Wage Gap in Enterprise is 2.1%.
Women in Enterprise earn 97.9 cents for every dollar earned by a man.
What is Inequality or Gini Index in Enterprise?
Inequality or Gini Index in Enterprise is 0.56.
What is the Total Population of Enterprise?
Total Population of Enterprise is 2,172.
What is the Total Male Population of Enterprise?
Total Male Population of Enterprise is 1,032.
What is the Total Female Population of Enterprise?
Total Female Population of Enterprise is 1,140.
What is the Ratio of Males per 100 Females in Enterprise?
There are 90.53 Males per 100 Females in Enterprise.
What is the Ratio of Females per 100 Males in Enterprise?
There are 110.47 Females per 100 Males in Enterprise.
What is the Median Population Age in Enterprise?
Median Population Age in Enterprise is 39.8 Years.
What is the Average Family Size in Enterprise
Average Family Size in Enterprise is 3.2 People.
What is the Average Household Size in Enterprise
Average Household Size in Enterprise is 2.4 People.
How Large is the Labor Force in Enterprise?
There are 1,016 People in the Labor Forcein in Enterprise.
What is the Percentage of People in the Labor Force in Enterprise?
60.2% of People are in the Labor Force in Enterprise.
What is the Unemployment Rate in Enterprise?
Unemployment Rate in Enterprise is 10.5%.