Kickapoo Tribal Center, KS Map & Demographics
Kickapoo Tribal Center Map
Kickapoo Tribal Center Overview
$11,588
PER CAPITA INCOME
$15,625
AVG HOUSEHOLD INCOME
0.53
INEQUALITY / GINI INDEX
130
TOTAL POPULATION
79
MALE POPULATION
51
FEMALE POPULATION
154.90
MALES / 100 FEMALES
64.56
FEMALES / 100 MALES
50.0
MEDIAN AGE
4.8
AVG FAMILY SIZE
2.6
AVG HOUSEHOLD SIZE
51
LABOR FORCE [ PEOPLE ]
47.7%
PERCENT IN LABOR FORCE
5.9%
UNEMPLOYMENT RATE
Income in Kickapoo Tribal Center
Income Overview in Kickapoo Tribal Center
| Characteristic | Number | Measure |
| Per Capita Income | 130 | $11,588 |
| Median Family Income | 21 | $0 |
| Mean Family Income | 21 | $58,848 |
| Median Household Income | 50 | $15,625 |
| Mean Household Income | 50 | $30,804 |
| Income Deficit | 21 | $0 |
| Wage / Income Gap (%) | 130 | 0.00% |
| Wage / Income Gap ($) | 130 | 100.00¢ per $1 |
| Gini / Inequality Index | 130 | 0.53 |
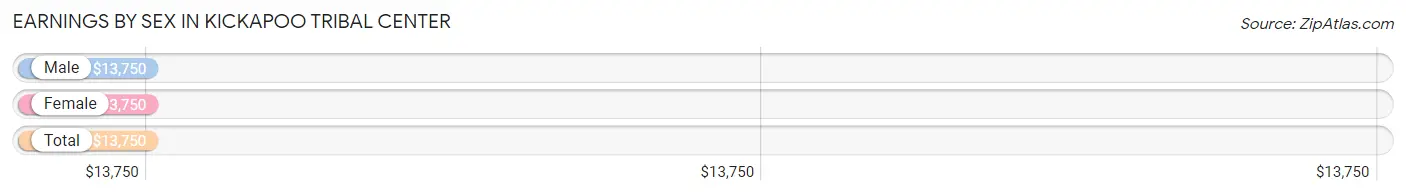
Earnings by Sex in Kickapoo Tribal Center
Average Earnings in Kickapoo Tribal Center are $13,750, $13,750 for men and $13,750 for women, a difference of 0.0%.
| Sex | Number | Average Earnings |
| Male | 31 (58.5%) | $13,750 |
| Female | 22 (41.5%) | $13,750 |
| Total | 53 (100.0%) | $13,750 |
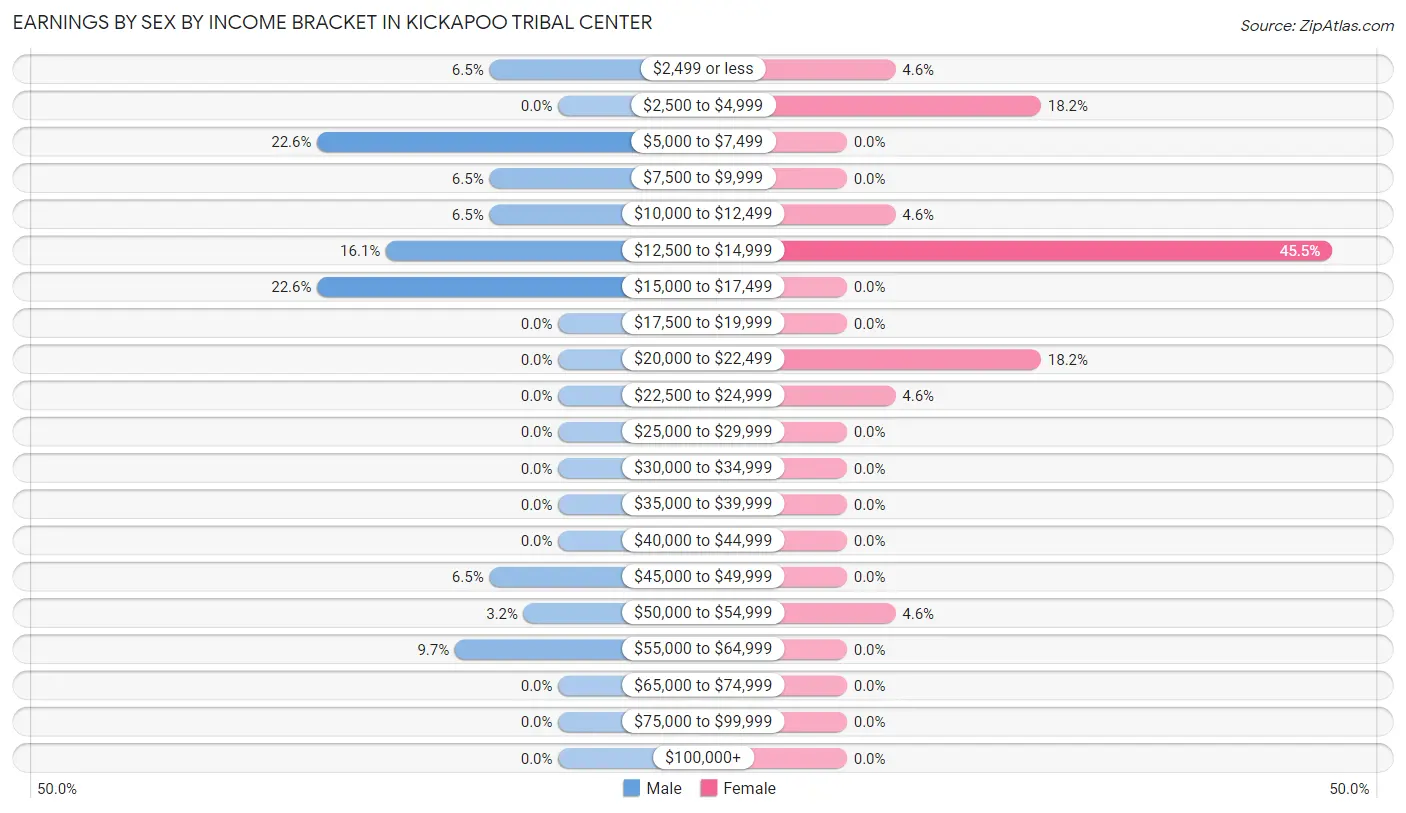
Earnings by Sex by Income Bracket in Kickapoo Tribal Center
The most common earnings brackets in Kickapoo Tribal Center are $5,000 to $7,499 for men (7 | 22.6%) and $12,500 to $14,999 for women (10 | 45.5%).
| Income | Male | Female |
| $2,499 or less | 2 (6.5%) | 1 (4.5%) |
| $2,500 to $4,999 | 0 (0.0%) | 4 (18.2%) |
| $5,000 to $7,499 | 7 (22.6%) | 0 (0.0%) |
| $7,500 to $9,999 | 2 (6.5%) | 0 (0.0%) |
| $10,000 to $12,499 | 2 (6.5%) | 1 (4.5%) |
| $12,500 to $14,999 | 5 (16.1%) | 10 (45.5%) |
| $15,000 to $17,499 | 7 (22.6%) | 0 (0.0%) |
| $17,500 to $19,999 | 0 (0.0%) | 0 (0.0%) |
| $20,000 to $22,499 | 0 (0.0%) | 4 (18.2%) |
| $22,500 to $24,999 | 0 (0.0%) | 1 (4.5%) |
| $25,000 to $29,999 | 0 (0.0%) | 0 (0.0%) |
| $30,000 to $34,999 | 0 (0.0%) | 0 (0.0%) |
| $35,000 to $39,999 | 0 (0.0%) | 0 (0.0%) |
| $40,000 to $44,999 | 0 (0.0%) | 0 (0.0%) |
| $45,000 to $49,999 | 2 (6.5%) | 0 (0.0%) |
| $50,000 to $54,999 | 1 (3.2%) | 1 (4.5%) |
| $55,000 to $64,999 | 3 (9.7%) | 0 (0.0%) |
| $65,000 to $74,999 | 0 (0.0%) | 0 (0.0%) |
| $75,000 to $99,999 | 0 (0.0%) | 0 (0.0%) |
| $100,000+ | 0 (0.0%) | 0 (0.0%) |
| Total | 31 (100.0%) | 22 (100.0%) |
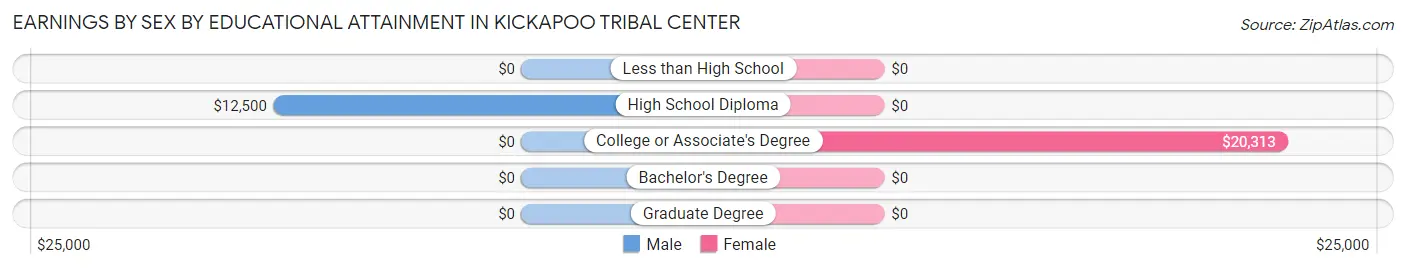
Earnings by Sex by Educational Attainment in Kickapoo Tribal Center
Average earnings in Kickapoo Tribal Center are $13,750 for men and $13,750 for women, a difference of 0.0%. Men with an educational attainment of high school diploma enjoy the highest average annual earnings of $12,500, while those with high school diploma education earn the least with $12,500. Women with an educational attainment of college or associate's degree earn the most with the average annual earnings of $20,313, while those with college or associate's degree education have the smallest earnings of $20,313.
| Educational Attainment | Male Income | Female Income |
| Less than High School | - | - |
| High School Diploma | $12,500 | $0 |
| College or Associate's Degree | - | - |
| Bachelor's Degree | - | - |
| Graduate Degree | - | - |
| Total | $13,750 | $13,750 |
Family Income in Kickapoo Tribal Center
Family Income Brackets in Kickapoo Tribal Center
According to the Kickapoo Tribal Center family income data, there are 8 families falling into the $25,000 to $34,999 income range, which is the most common income bracket and makes up 38.1% of all families.
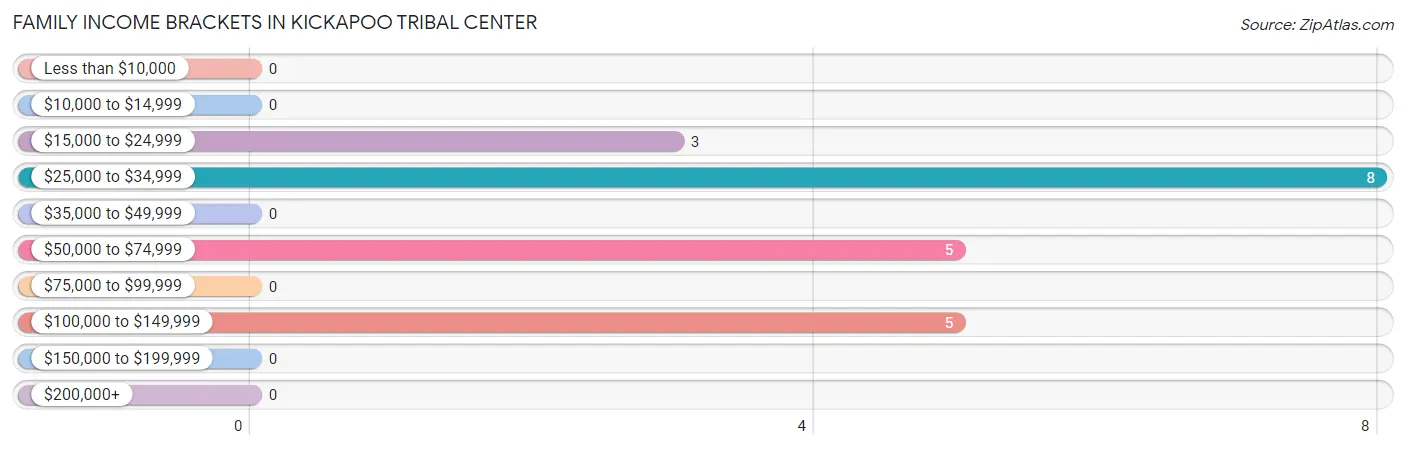
| Income Bracket | # Families | % Families |
| Less than $10,000 | 0 | 0.0% |
| $10,000 to $14,999 | 0 | 0.0% |
| $15,000 to $24,999 | 3 | 14.3% |
| $25,000 to $34,999 | 8 | 38.1% |
| $35,000 to $49,999 | 0 | 0.0% |
| $50,000 to $74,999 | 5 | 23.8% |
| $75,000 to $99,999 | 0 | 0.0% |
| $100,000 to $149,999 | 5 | 23.8% |
| $150,000 to $199,999 | 0 | 0.0% |
| $200,000+ | 0 | 0.0% |
Family Income by Famaliy Size in Kickapoo Tribal Center
2-person families (6 | 28.6%) account for the highest median family income in Kickapoo Tribal Center with $125,625 per family, while 2-person families (6 | 28.6%) have the highest median income of $62,812 per family member.
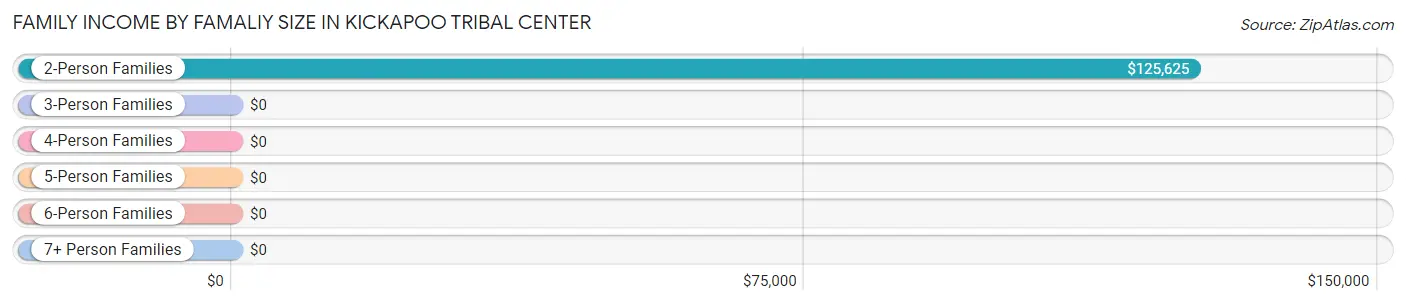
| Income Bracket | # Families | Median Income |
| 2-Person Families | 6 (28.6%) | $125,625 |
| 3-Person Families | 4 (19.1%) | $0 |
| 4-Person Families | 5 (23.8%) | $0 |
| 5-Person Families | 0 (0.0%) | $0 |
| 6-Person Families | 2 (9.5%) | $0 |
| 7+ Person Families | 4 (19.1%) | $0 |
| Total | 21 (100.0%) | $0 |
Family Income by Number of Earners in Kickapoo Tribal Center
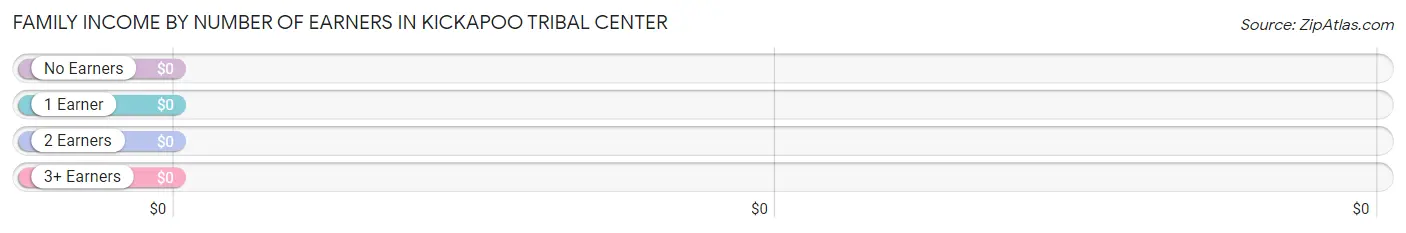
| Number of Earners | # Families | Median Income |
| No Earners | 2 (9.5%) | $0 |
| 1 Earner | 7 (33.3%) | $0 |
| 2 Earners | 11 (52.4%) | $0 |
| 3+ Earners | 1 (4.8%) | $0 |
| Total | 21 (100.0%) | $0 |
Household Income in Kickapoo Tribal Center
Household Income Brackets in Kickapoo Tribal Center
With 16 households falling in the category, the $10,000 to $14,999 income range is the most frequent in Kickapoo Tribal Center, accounting for 32.0% of all households.
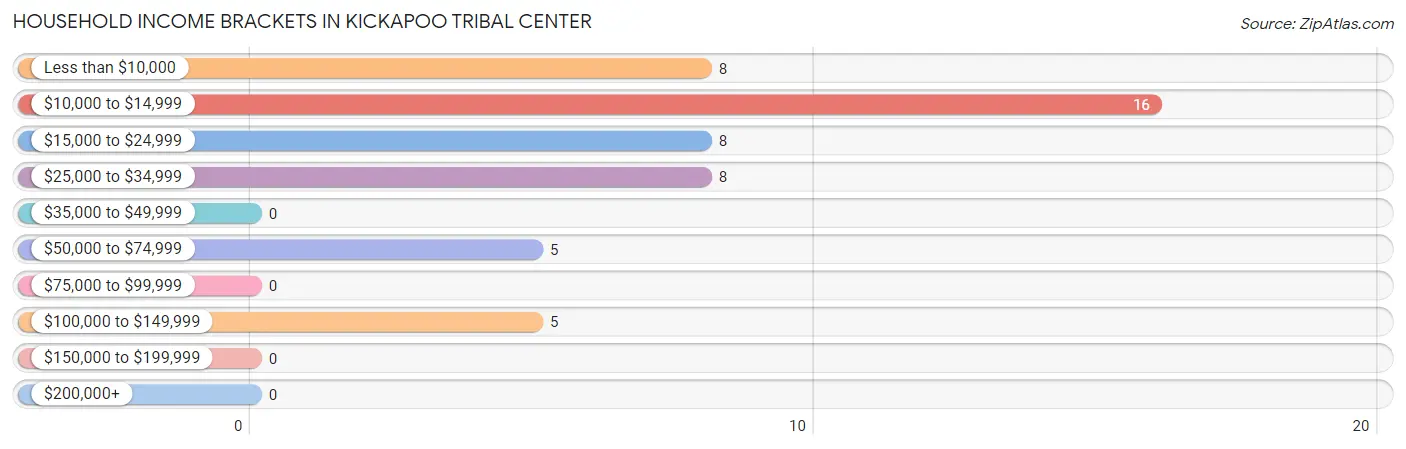
| Income Bracket | # Households | % Households |
| Less than $10,000 | 8 | 16.0% |
| $10,000 to $14,999 | 16 | 32.0% |
| $15,000 to $24,999 | 8 | 16.0% |
| $25,000 to $34,999 | 8 | 16.0% |
| $35,000 to $49,999 | 0 | 0.0% |
| $50,000 to $74,999 | 5 | 10.0% |
| $75,000 to $99,999 | 0 | 0.0% |
| $100,000 to $149,999 | 5 | 10.0% |
| $150,000 to $199,999 | 0 | 0.0% |
| $200,000+ | 0 | 0.0% |
Household Income by Householder Age in Kickapoo Tribal Center
The median household income in Kickapoo Tribal Center is $15,625, with the highest median household income of $15,625 found in the 45 to 64 years age bracket for the primary householder. A total of 30 households (60.0%) fall into this category.
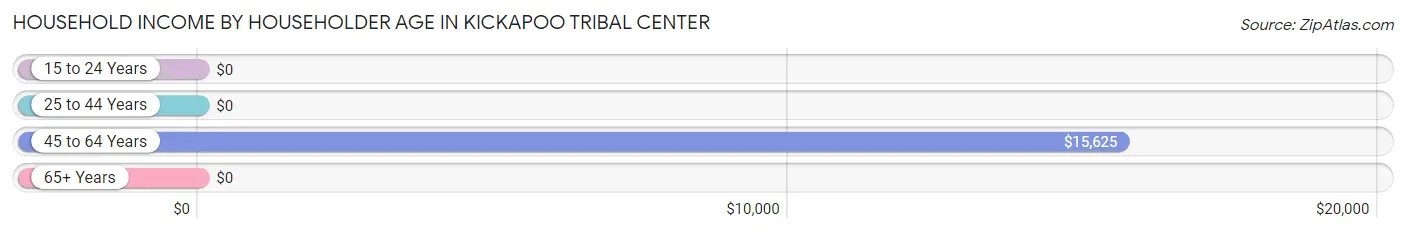
| Income Bracket | # Households | Median Income |
| 15 to 24 Years | 0 (0.0%) | $0 |
| 25 to 44 Years | 9 (18.0%) | $0 |
| 45 to 64 Years | 30 (60.0%) | $15,625 |
| 65+ Years | 11 (22.0%) | $0 |
| Total | 50 (100.0%) | $15,625 |
Poverty in Kickapoo Tribal Center
Income Below Poverty by Sex and Age in Kickapoo Tribal Center
With 51.9% poverty level for males and 49.0% for females among the residents of Kickapoo Tribal Center, 18 to 24 year old males and 12 to 14 year old females are the most vulnerable to poverty, with 10 males (100.0%) and 2 females (100.0%) in their respective age groups living below the poverty level.
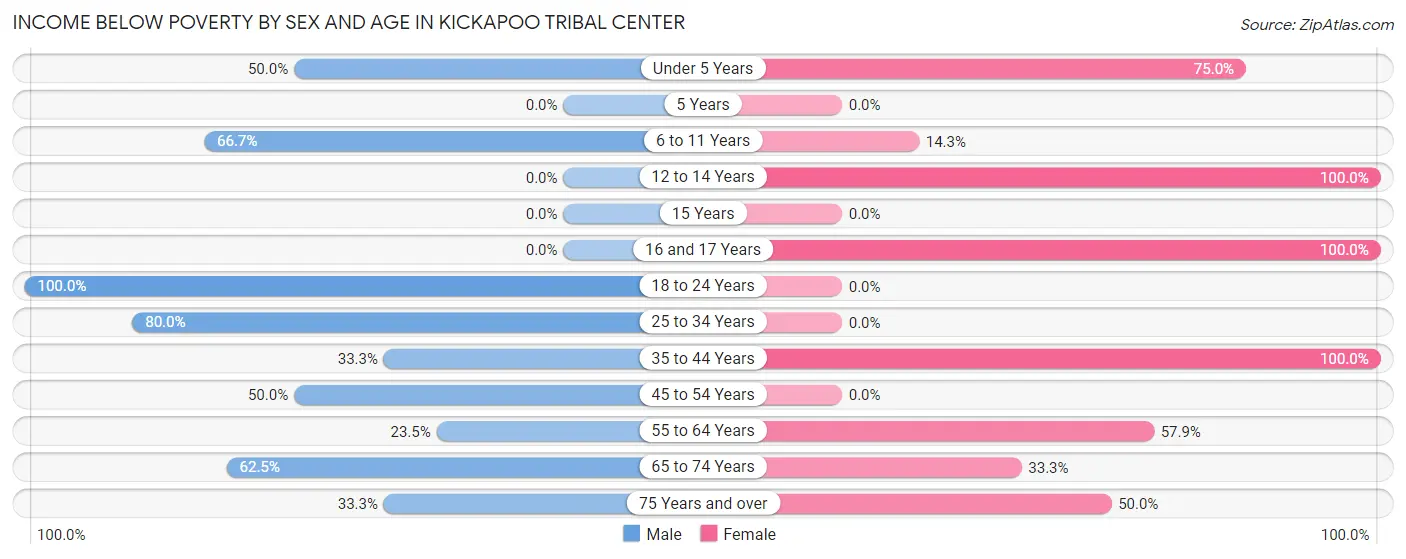
| Age Bracket | Male | Female |
| Under 5 Years | 2 (50.0%) | 3 (75.0%) |
| 5 Years | 0 (0.0%) | 0 (0.0%) |
| 6 to 11 Years | 4 (66.7%) | 1 (14.3%) |
| 12 to 14 Years | 0 (0.0%) | 2 (100.0%) |
| 15 Years | 0 (0.0%) | 0 (0.0%) |
| 16 and 17 Years | 0 (0.0%) | 2 (100.0%) |
| 18 to 24 Years | 10 (100.0%) | 0 (0.0%) |
| 25 to 34 Years | 4 (80.0%) | 0 (0.0%) |
| 35 to 44 Years | 3 (33.3%) | 4 (100.0%) |
| 45 to 54 Years | 7 (50.0%) | 0 (0.0%) |
| 55 to 64 Years | 4 (23.5%) | 11 (57.9%) |
| 65 to 74 Years | 5 (62.5%) | 1 (33.3%) |
| 75 Years and over | 2 (33.3%) | 1 (50.0%) |
| Total | 41 (51.9%) | 25 (49.0%) |
Income Above Poverty by Sex and Age in Kickapoo Tribal Center
According to the poverty statistics in Kickapoo Tribal Center, males aged 55 to 64 years and females aged 25 to 34 years are the age groups that are most secure financially, with 76.5% of males and 100.0% of females in these age groups living above the poverty line.
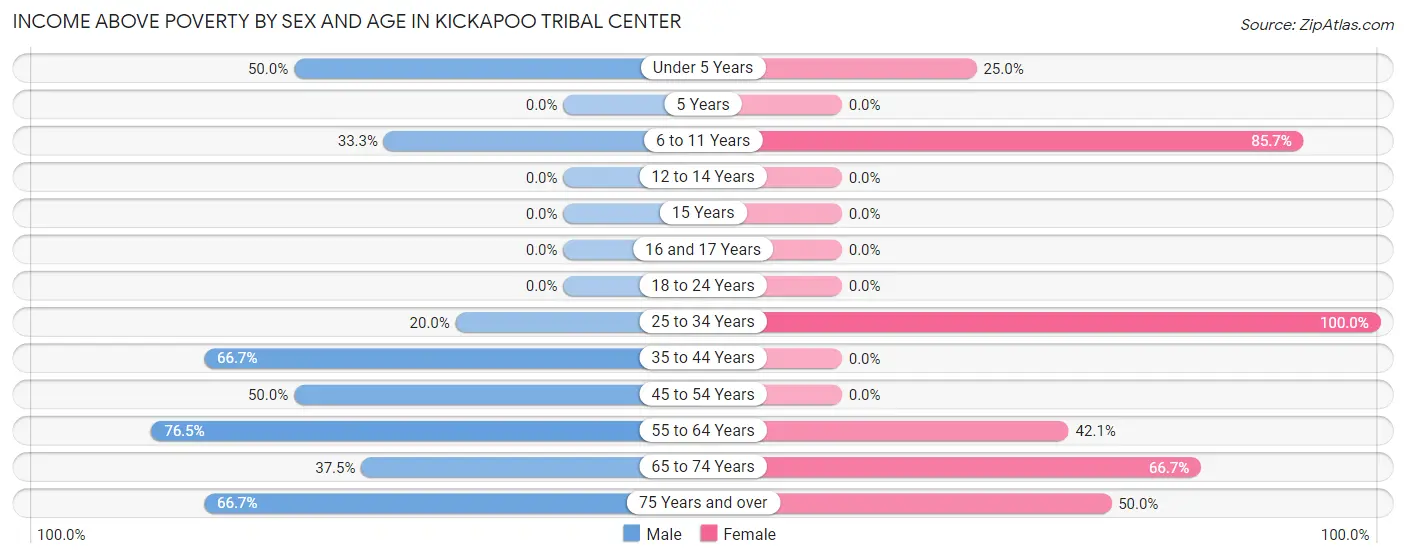
| Age Bracket | Male | Female |
| Under 5 Years | 2 (50.0%) | 1 (25.0%) |
| 5 Years | 0 (0.0%) | 0 (0.0%) |
| 6 to 11 Years | 2 (33.3%) | 6 (85.7%) |
| 12 to 14 Years | 0 (0.0%) | 0 (0.0%) |
| 15 Years | 0 (0.0%) | 0 (0.0%) |
| 16 and 17 Years | 0 (0.0%) | 0 (0.0%) |
| 18 to 24 Years | 0 (0.0%) | 0 (0.0%) |
| 25 to 34 Years | 1 (20.0%) | 8 (100.0%) |
| 35 to 44 Years | 6 (66.7%) | 0 (0.0%) |
| 45 to 54 Years | 7 (50.0%) | 0 (0.0%) |
| 55 to 64 Years | 13 (76.5%) | 8 (42.1%) |
| 65 to 74 Years | 3 (37.5%) | 2 (66.7%) |
| 75 Years and over | 4 (66.7%) | 1 (50.0%) |
| Total | 38 (48.1%) | 26 (51.0%) |
Income Below Poverty Among Married-Couple Families in Kickapoo Tribal Center
The poverty statistics for married-couple families in Kickapoo Tribal Center show that 40.0% or 6 of the total 15 families live below the poverty line. Families with 3 or 4 children have the highest poverty rate of 80.0%, comprising of 4 families. On the other hand, families with no children have the lowest poverty rate of 20.0%, which includes 2 families.
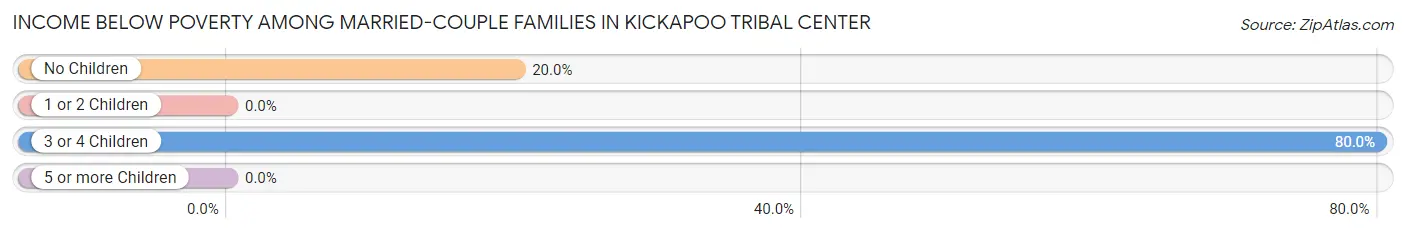
| Children | Above Poverty | Below Poverty |
| No Children | 8 (80.0%) | 2 (20.0%) |
| 1 or 2 Children | 0 (0.0%) | 0 (0.0%) |
| 3 or 4 Children | 1 (20.0%) | 4 (80.0%) |
| 5 or more Children | 0 (0.0%) | 0 (0.0%) |
| Total | 9 (60.0%) | 6 (40.0%) |
Income Below Poverty Among Single-Parent Households in Kickapoo Tribal Center
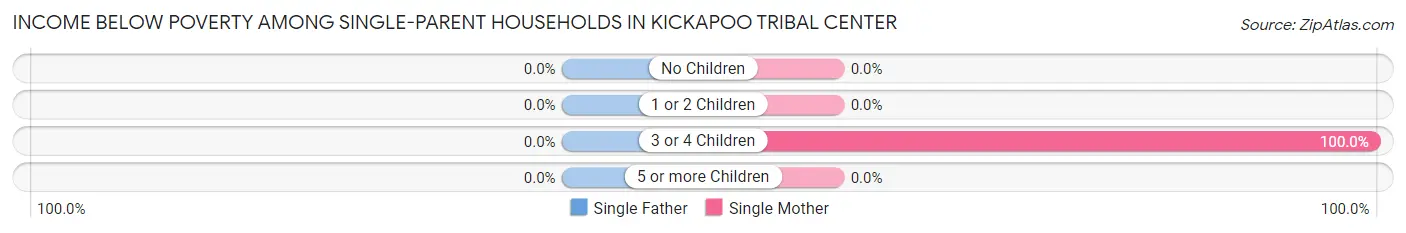
| Children | Single Father | Single Mother |
| No Children | 0 (0.0%) | 0 (0.0%) |
| 1 or 2 Children | 0 (0.0%) | 0 (0.0%) |
| 3 or 4 Children | 0 (0.0%) | 1 (100.0%) |
| 5 or more Children | 0 (0.0%) | 0 (0.0%) |
| Total | 0 (0.0%) | 1 (33.3%) |
Income Below Poverty Among Married-Couple vs Single-Parent Households in Kickapoo Tribal Center
The poverty data for Kickapoo Tribal Center shows that 6 of the married-couple family households (40.0%) and 1 of the single-parent households (16.7%) are living below the poverty level. Within the married-couple family households, those with 3 or 4 children have the highest poverty rate, with 4 households (80.0%) falling below the poverty line. Among the single-parent households, those with 3 or 4 children have the highest poverty rate, with 1 household (100.0%) living below poverty.
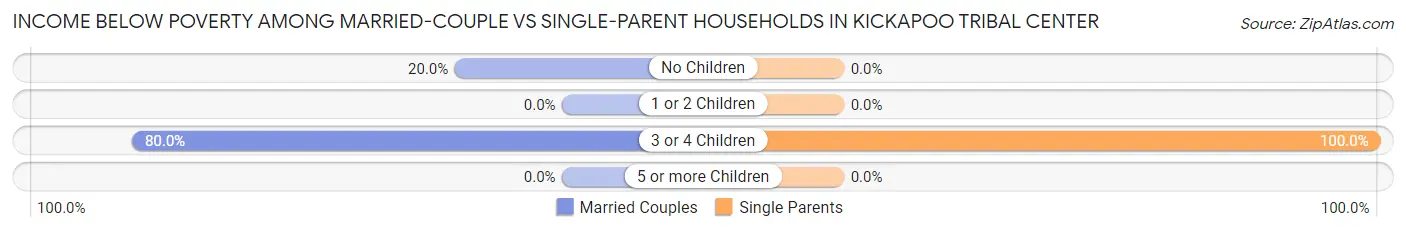
| Children | Married-Couple Families | Single-Parent Households |
| No Children | 2 (20.0%) | 0 (0.0%) |
| 1 or 2 Children | 0 (0.0%) | 0 (0.0%) |
| 3 or 4 Children | 4 (80.0%) | 1 (100.0%) |
| 5 or more Children | 0 (0.0%) | 0 (0.0%) |
| Total | 6 (40.0%) | 1 (16.7%) |
Race in Kickapoo Tribal Center
The most populous races in Kickapoo Tribal Center are Native / Alaskan (120 | 92.3%), Hispanic or Latino (6 | 4.6%), and Two or more Races (4 | 3.1%).
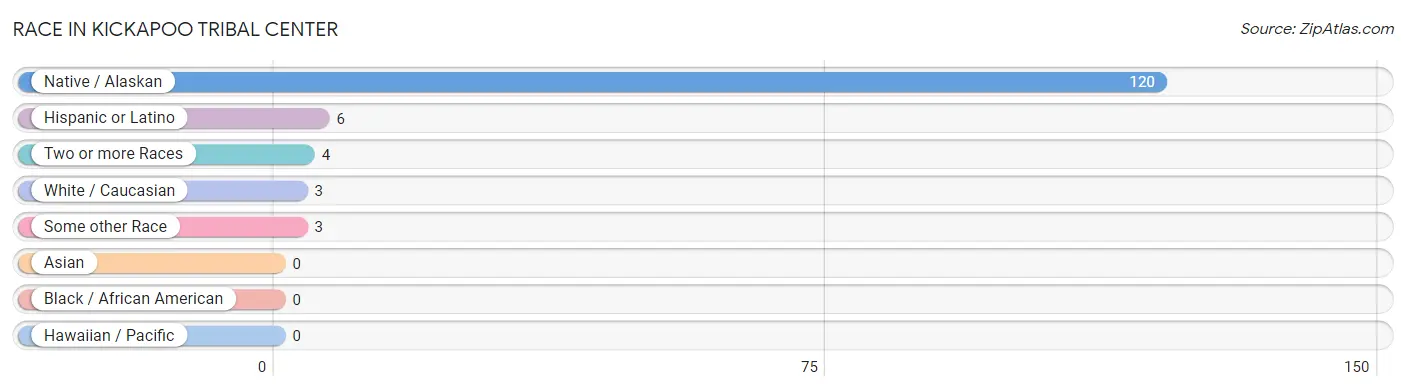
| Race | # Population | % Population |
| Asian | 0 | 0.0% |
| Black / African American | 0 | 0.0% |
| Hawaiian / Pacific | 0 | 0.0% |
| Hispanic or Latino | 6 | 4.6% |
| Native / Alaskan | 120 | 92.3% |
| White / Caucasian | 3 | 2.3% |
| Two or more Races | 4 | 3.1% |
| Some other Race | 3 | 2.3% |
| Total | 130 | 100.0% |
Ancestry in Kickapoo Tribal Center
The most populous ancestries reported in Kickapoo Tribal Center are Sioux (14 | 10.8%), German (10 | 7.7%), French (8 | 6.1%), Mexican (5 | 3.8%), and Potawatomi (5 | 3.8%), together accounting for 32.3% of all Kickapoo Tribal Center residents.
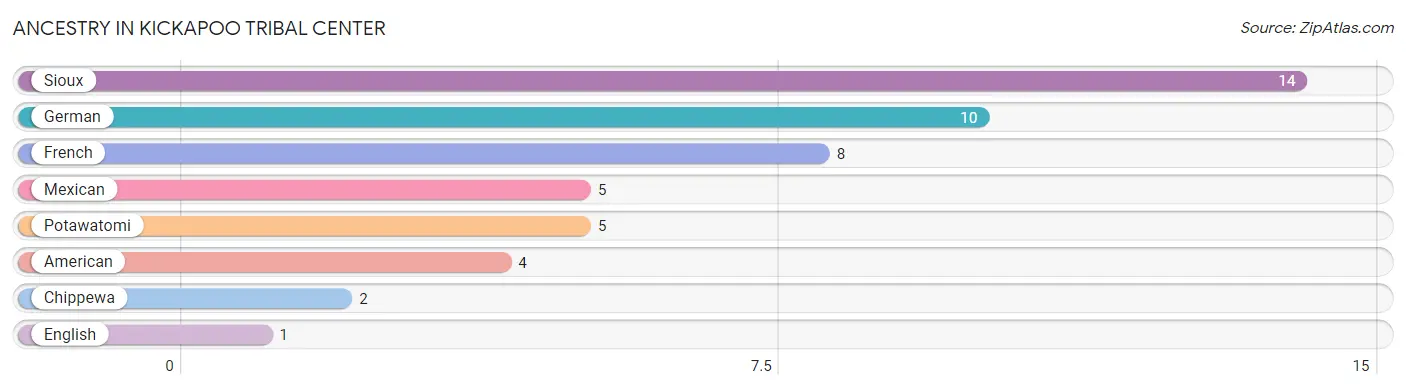
| Ancestry | # Population | % Population |
| American | 4 | 3.1% |
| Chippewa | 2 | 1.5% |
| English | 1 | 0.8% |
| French | 8 | 6.1% |
| German | 10 | 7.7% |
| Mexican | 5 | 3.8% |
| Potawatomi | 5 | 3.8% |
| Sioux | 14 | 10.8% | View All 8 Rows |
Immigrants in Kickapoo Tribal Center

| Immigration Origin | # Population | % Population | View All 0 Rows |
Sex and Age in Kickapoo Tribal Center
Sex and Age in Kickapoo Tribal Center
The most populous age groups in Kickapoo Tribal Center are 55 to 59 Years (15 | 19.0%) for men and 60 to 64 Years (12 | 23.5%) for women.
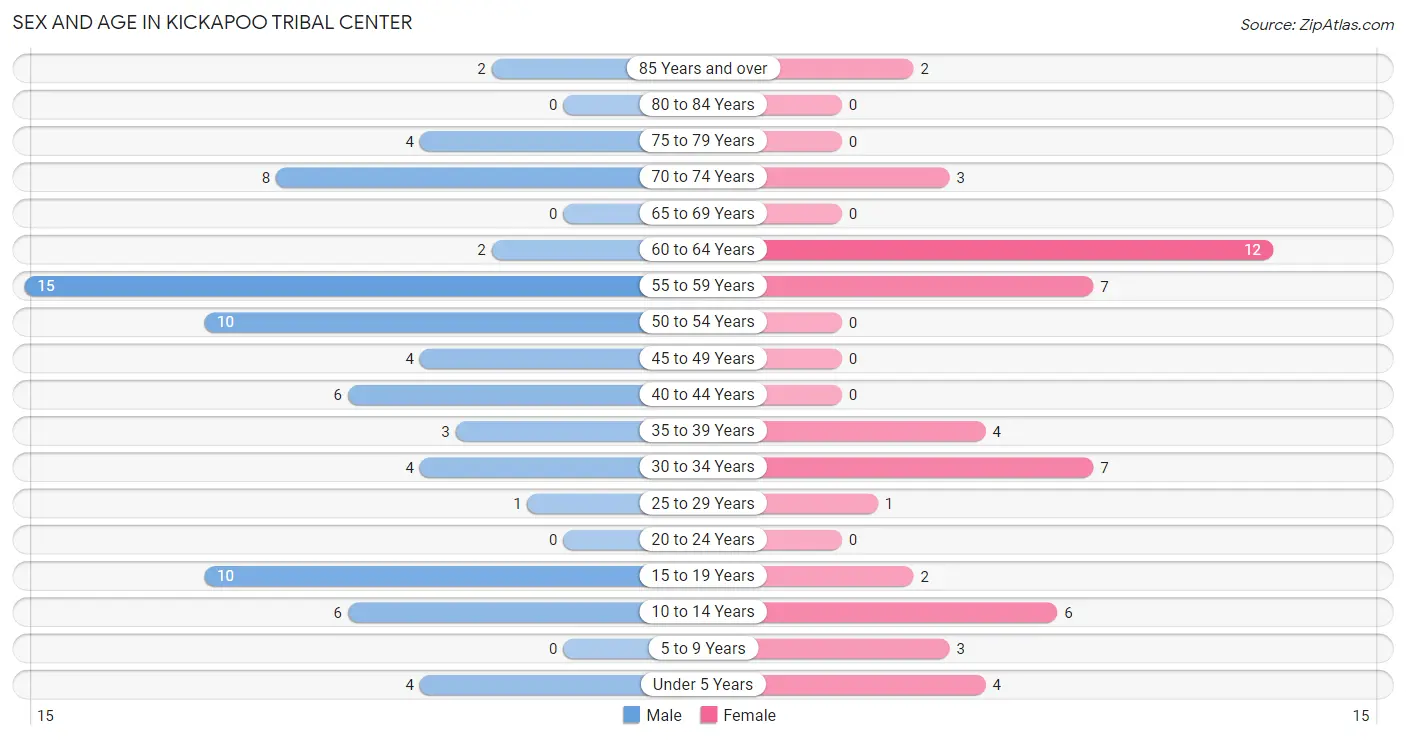
| Age Bracket | Male | Female |
| Under 5 Years | 4 (5.1%) | 4 (7.8%) |
| 5 to 9 Years | 0 (0.0%) | 3 (5.9%) |
| 10 to 14 Years | 6 (7.6%) | 6 (11.8%) |
| 15 to 19 Years | 10 (12.7%) | 2 (3.9%) |
| 20 to 24 Years | 0 (0.0%) | 0 (0.0%) |
| 25 to 29 Years | 1 (1.3%) | 1 (2.0%) |
| 30 to 34 Years | 4 (5.1%) | 7 (13.7%) |
| 35 to 39 Years | 3 (3.8%) | 4 (7.8%) |
| 40 to 44 Years | 6 (7.6%) | 0 (0.0%) |
| 45 to 49 Years | 4 (5.1%) | 0 (0.0%) |
| 50 to 54 Years | 10 (12.7%) | 0 (0.0%) |
| 55 to 59 Years | 15 (19.0%) | 7 (13.7%) |
| 60 to 64 Years | 2 (2.5%) | 12 (23.5%) |
| 65 to 69 Years | 0 (0.0%) | 0 (0.0%) |
| 70 to 74 Years | 8 (10.1%) | 3 (5.9%) |
| 75 to 79 Years | 4 (5.1%) | 0 (0.0%) |
| 80 to 84 Years | 0 (0.0%) | 0 (0.0%) |
| 85 Years and over | 2 (2.5%) | 2 (3.9%) |
| Total | 79 (100.0%) | 51 (100.0%) |
Families and Households in Kickapoo Tribal Center
Median Family Size in Kickapoo Tribal Center
The median family size in Kickapoo Tribal Center is 4.81 persons per family, with single female/mother families (3 | 14.3%) accounting for the largest median family size of 6 persons per family. On the other hand, married-couple families (15 | 71.4%) represent the smallest median family size with 4.47 persons per family.
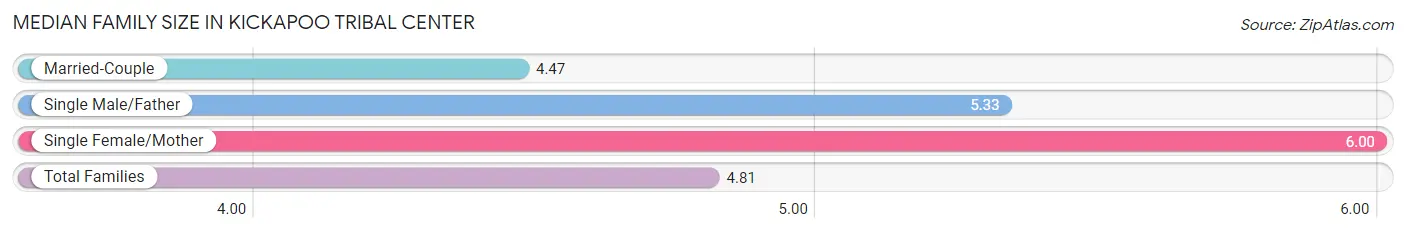
| Family Type | # Families | Family Size |
| Married-Couple | 15 (71.4%) | 4.47 |
| Single Male/Father | 3 (14.3%) | 5.33 |
| Single Female/Mother | 3 (14.3%) | 6.00 |
| Total Families | 21 (100.0%) | 4.81 |
Median Household Size in Kickapoo Tribal Center
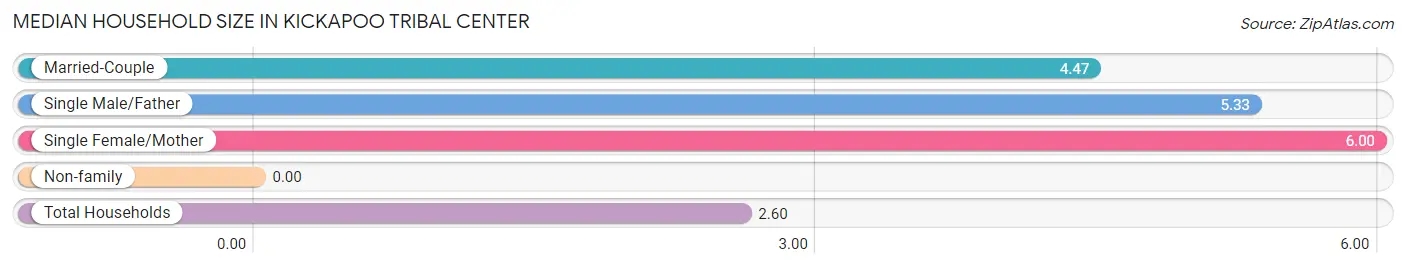
| Household Type | # Households | Household Size |
| Married-Couple | 15 (30.0%) | 4.47 |
| Single Male/Father | 3 (6.0%) | 5.33 |
| Single Female/Mother | 3 (6.0%) | 6.00 |
| Non-family | 29 (58.0%) | - |
| Total Households | 50 (100.0%) | 2.60 |
Household Size by Marriage Status in Kickapoo Tribal Center
Out of a total of 50 households in Kickapoo Tribal Center, 21 (42.0%) are family households, while 29 (58.0%) are nonfamily households. The most numerous type of family households are 2-person households, comprising 6, and the most common type of nonfamily households are 1-person households, comprising 29.
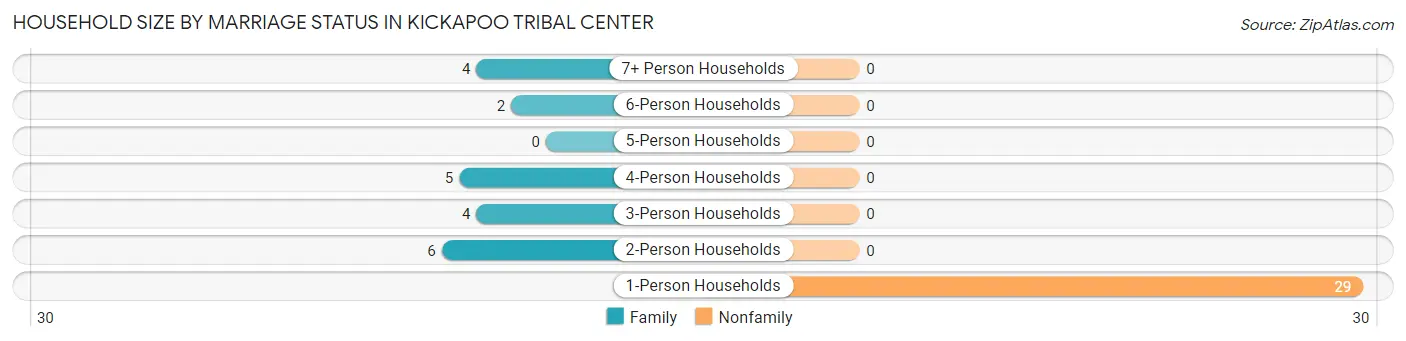
| Household Size | Family Households | Nonfamily Households |
| 1-Person Households | - | 29 (58.0%) |
| 2-Person Households | 6 (12.0%) | 0 (0.0%) |
| 3-Person Households | 4 (8.0%) | 0 (0.0%) |
| 4-Person Households | 5 (10.0%) | 0 (0.0%) |
| 5-Person Households | 0 (0.0%) | 0 (0.0%) |
| 6-Person Households | 2 (4.0%) | 0 (0.0%) |
| 7+ Person Households | 4 (8.0%) | 0 (0.0%) |
| Total | 21 (42.0%) | 29 (58.0%) |
Female Fertility in Kickapoo Tribal Center
Fertility by Age in Kickapoo Tribal Center
Average fertility rate in Kickapoo Tribal Center is 286.0 births per 1,000 women. Women in the age bracket of 35 to 50 years have the highest fertility rate with 1,000.0 births per 1,000 women. Women in the age bracket of 35 to 50 years acount for 100.0% of all women with births.
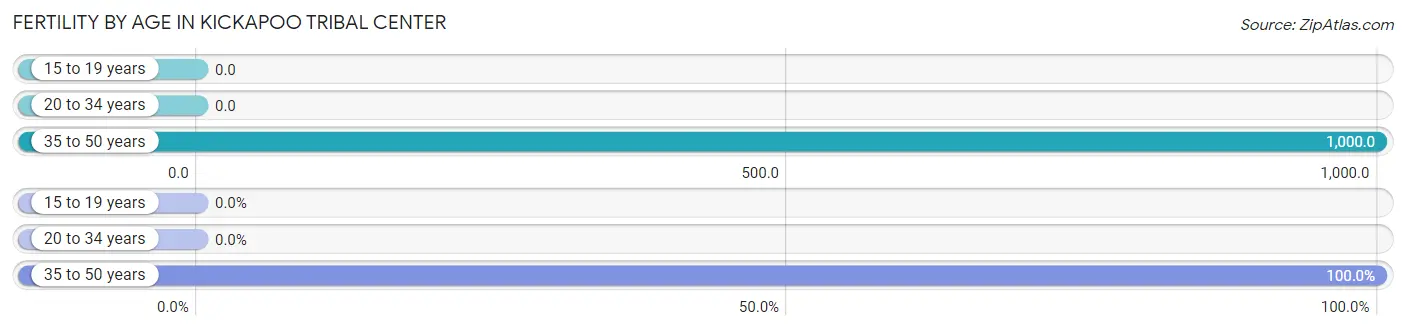
| Age Bracket | Women with Births | Births / 1,000 Women |
| 15 to 19 years | 0 (0.0%) | 0.0 |
| 20 to 34 years | 0 (0.0%) | 0.0 |
| 35 to 50 years | 4 (100.0%) | 1,000.0 |
| Total | 4 (100.0%) | 286.0 |
Fertility by Age by Marriage Status in Kickapoo Tribal Center
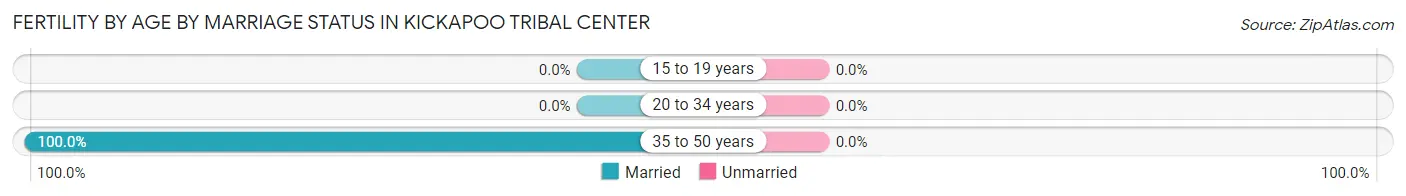
| Age Bracket | Married | Unmarried |
| 15 to 19 years | 0 (0.0%) | 0 (0.0%) |
| 20 to 34 years | 0 (0.0%) | 0 (0.0%) |
| 35 to 50 years | 4 (100.0%) | 0 (0.0%) |
| Total | 4 (100.0%) | 0 (0.0%) |
Fertility by Education in Kickapoo Tribal Center
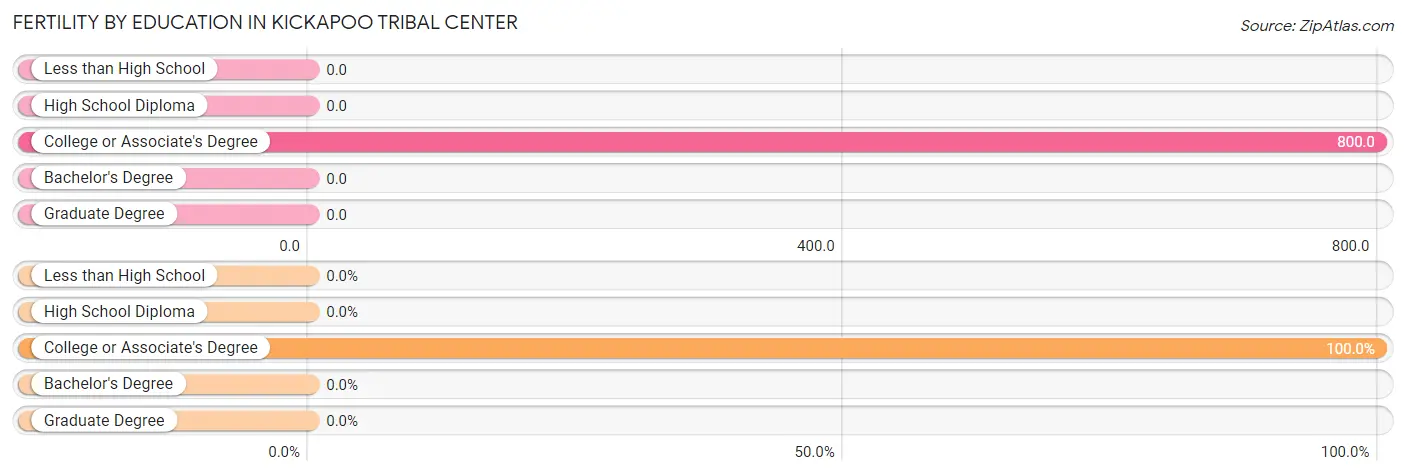
| Educational Attainment | Women with Births | Births / 1,000 Women |
| Less than High School | 0 (0.0%) | 0.0 |
| High School Diploma | 0 (0.0%) | 0.0 |
| College or Associate's Degree | 4 (100.0%) | 800.0 |
| Bachelor's Degree | 0 (0.0%) | 0.0 |
| Graduate Degree | 0 (0.0%) | 0.0 |
| Total | 4 (100.0%) | 286.0 |
Fertility by Education by Marriage Status in Kickapoo Tribal Center
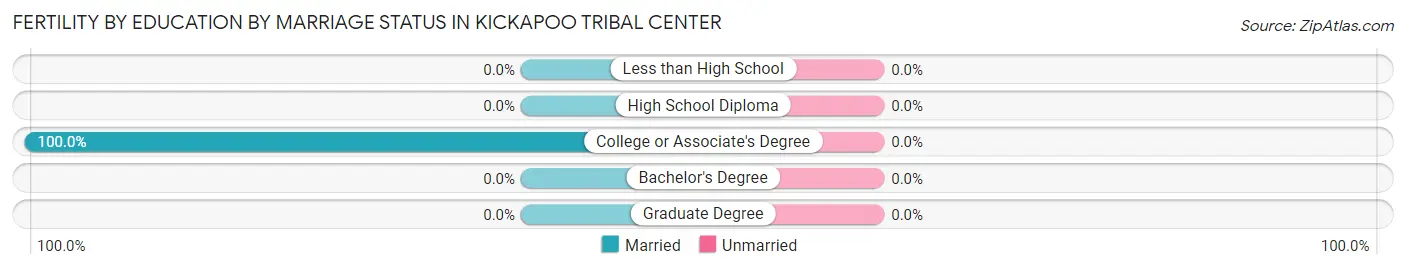
| Educational Attainment | Married | Unmarried |
| Less than High School | 0 (0.0%) | 0 (0.0%) |
| High School Diploma | 0 (0.0%) | 0 (0.0%) |
| College or Associate's Degree | 4 (100.0%) | 0 (0.0%) |
| Bachelor's Degree | 0 (0.0%) | 0 (0.0%) |
| Graduate Degree | 0 (0.0%) | 0 (0.0%) |
| Total | 4 (100.0%) | 0 (0.0%) |
Employment Characteristics in Kickapoo Tribal Center
Employment by Class of Employer in Kickapoo Tribal Center
Among the 43 employed individuals in Kickapoo Tribal Center, private company employees (34 | 79.1%), local government employees (6 | 14.0%), and federal government employees (3 | 7.0%) make up the most common classes of employment.
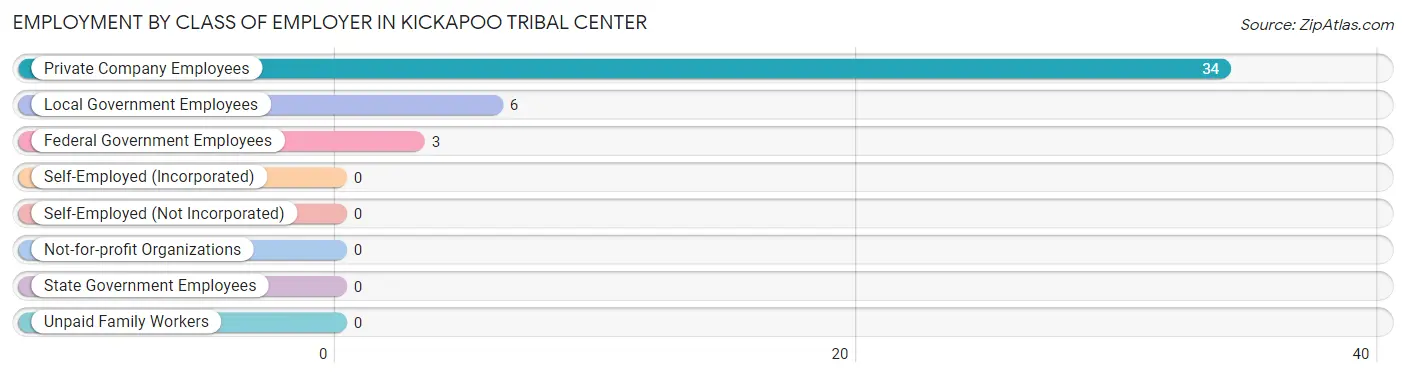
| Employer Class | # Employees | % Employees |
| Private Company Employees | 34 | 79.1% |
| Self-Employed (Incorporated) | 0 | 0.0% |
| Self-Employed (Not Incorporated) | 0 | 0.0% |
| Not-for-profit Organizations | 0 | 0.0% |
| Local Government Employees | 6 | 14.0% |
| State Government Employees | 0 | 0.0% |
| Federal Government Employees | 3 | 7.0% |
| Unpaid Family Workers | 0 | 0.0% |
| Total | 43 | 100.0% |
Employment Status by Age in Kickapoo Tribal Center
According to the labor force statistics for Kickapoo Tribal Center, out of the total population over 16 years of age (107), 47.7% or 51 individuals are in the labor force, with 5.9% or 3 of them unemployed. The age group with the highest labor force participation rate is 25 to 29 years, with 100.0% or 2 individuals in the labor force. Within the labor force, the 35 to 44 years age range has the highest percentage of unemployed individuals, with 42.9% or 3 of them being unemployed.
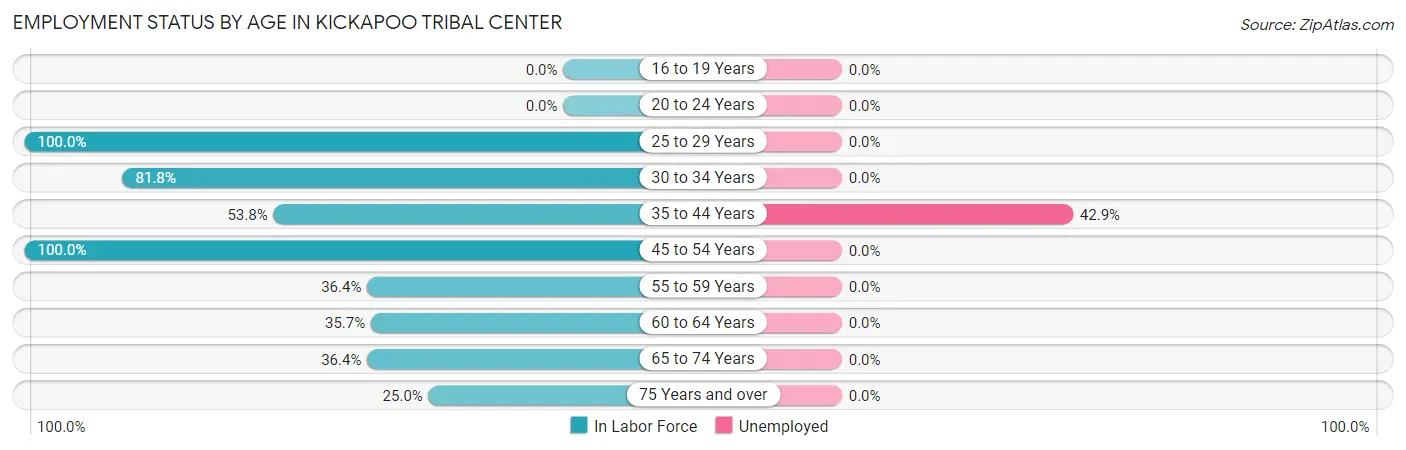
| Age Bracket | In Labor Force | Unemployed |
| 16 to 19 Years | 0 (0.0%) | 0 (0.0%) |
| 20 to 24 Years | 0 (0.0%) | 0 (0.0%) |
| 25 to 29 Years | 2 (100.0%) | 0 (0.0%) |
| 30 to 34 Years | 9 (81.8%) | 0 (0.0%) |
| 35 to 44 Years | 7 (53.8%) | 3 (42.9%) |
| 45 to 54 Years | 14 (100.0%) | 0 (0.0%) |
| 55 to 59 Years | 8 (36.4%) | 0 (0.0%) |
| 60 to 64 Years | 5 (35.7%) | 0 (0.0%) |
| 65 to 74 Years | 4 (36.4%) | 0 (0.0%) |
| 75 Years and over | 2 (25.0%) | 0 (0.0%) |
| Total | 51 (47.7%) | 3 (5.9%) |
Employment Status by Educational Attainment in Kickapoo Tribal Center
According to labor force statistics for Kickapoo Tribal Center, 59.2% of individuals (45) out of the total population between 25 and 64 years of age (76) are in the labor force, with 6.7% or 3 of them being unemployed. The group with the highest labor force participation rate are those with the educational attainment of less than high school, with 100.0% or 8 individuals in the labor force. Within the labor force, individuals with bachelor's degree or higher education have the highest percentage of unemployment, with 100.0% or 3 of them being unemployed.
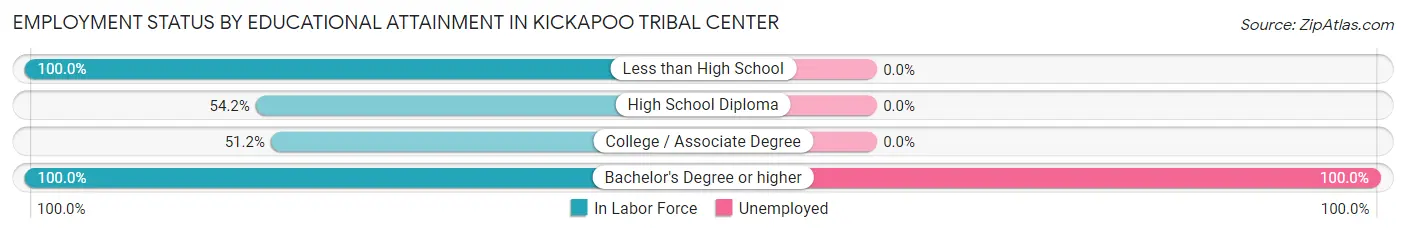
| Educational Attainment | In Labor Force | Unemployed |
| Less than High School | 8 (100.0%) | 0 (0.0%) |
| High School Diploma | 13 (54.2%) | 0 (0.0%) |
| College / Associate Degree | 21 (51.2%) | 0 (0.0%) |
| Bachelor's Degree or higher | 3 (100.0%) | 3 (100.0%) |
| Total | 45 (59.2%) | 5 (6.7%) |
Employment Occupations by Sex in Kickapoo Tribal Center
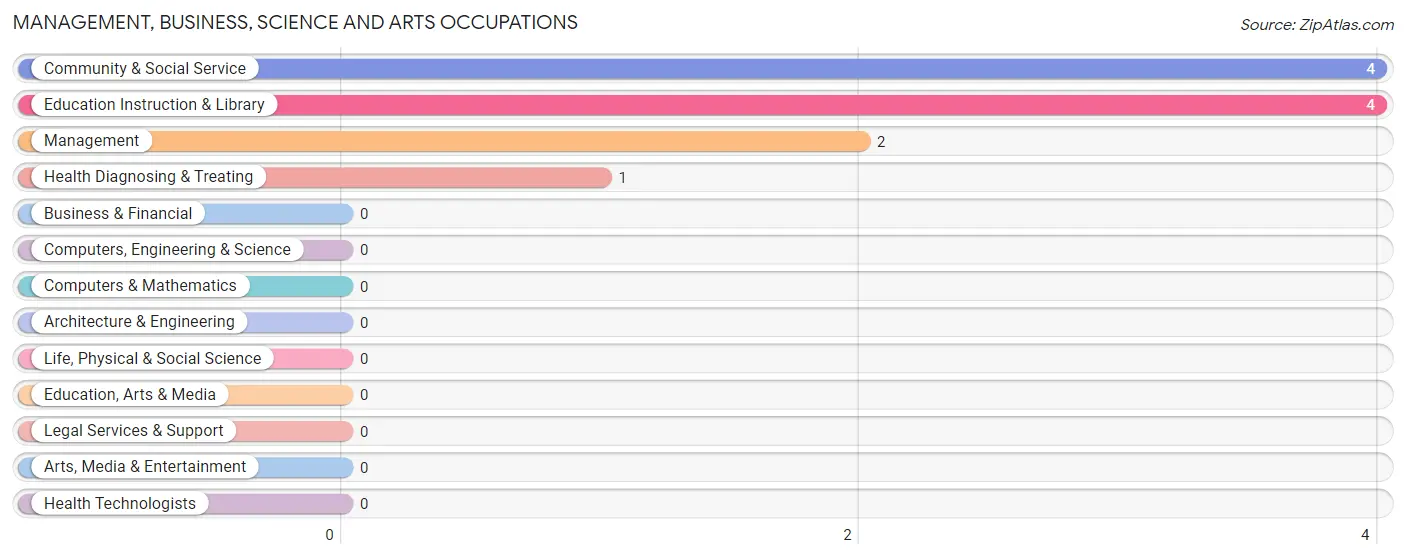
Management, Business, Science and Arts Occupations
The most common Management, Business, Science and Arts occupations in Kickapoo Tribal Center are Community & Social Service (4 | 8.3%), Education Instruction & Library (4 | 8.3%), Management (2 | 4.2%), and Health Diagnosing & Treating (1 | 2.1%).
Management, Business, Science and Arts Occupations by Sex
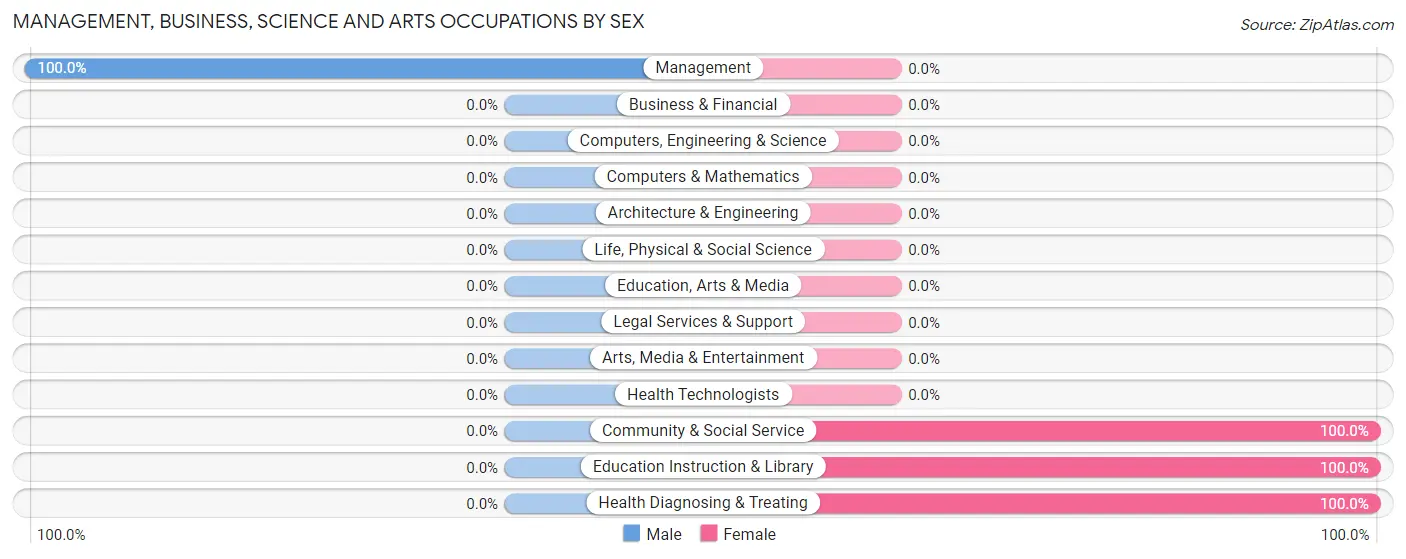
| Occupation | Male | Female |
| Management | 2 (100.0%) | 0 (0.0%) |
| Business & Financial | 0 (0.0%) | 0 (0.0%) |
| Computers, Engineering & Science | 0 (0.0%) | 0 (0.0%) |
| Computers & Mathematics | 0 (0.0%) | 0 (0.0%) |
| Architecture & Engineering | 0 (0.0%) | 0 (0.0%) |
| Life, Physical & Social Science | 0 (0.0%) | 0 (0.0%) |
| Community & Social Service | 0 (0.0%) | 4 (100.0%) |
| Education, Arts & Media | 0 (0.0%) | 0 (0.0%) |
| Legal Services & Support | 0 (0.0%) | 0 (0.0%) |
| Education Instruction & Library | 0 (0.0%) | 4 (100.0%) |
| Arts, Media & Entertainment | 0 (0.0%) | 0 (0.0%) |
| Health Diagnosing & Treating | 0 (0.0%) | 1 (100.0%) |
| Health Technologists | 0 (0.0%) | 0 (0.0%) |
| Total (Category) | 2 (28.6%) | 5 (71.4%) |
| Total (Overall) | 27 (56.2%) | 21 (43.8%) |
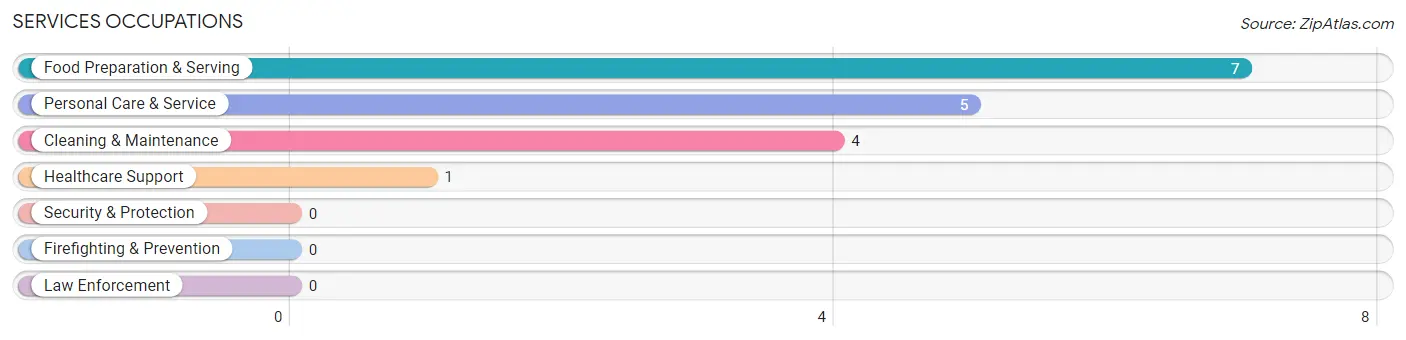
Services Occupations
The most common Services occupations in Kickapoo Tribal Center are Food Preparation & Serving (7 | 14.6%), Personal Care & Service (5 | 10.4%), Cleaning & Maintenance (4 | 8.3%), and Healthcare Support (1 | 2.1%).
Services Occupations by Sex
Within the Services occupations in Kickapoo Tribal Center, the most male-oriented occupations are Cleaning & Maintenance (100.0%), Personal Care & Service (100.0%), and Food Preparation & Serving (42.9%), while the most female-oriented occupations are Healthcare Support (100.0%), and Food Preparation & Serving (57.1%).
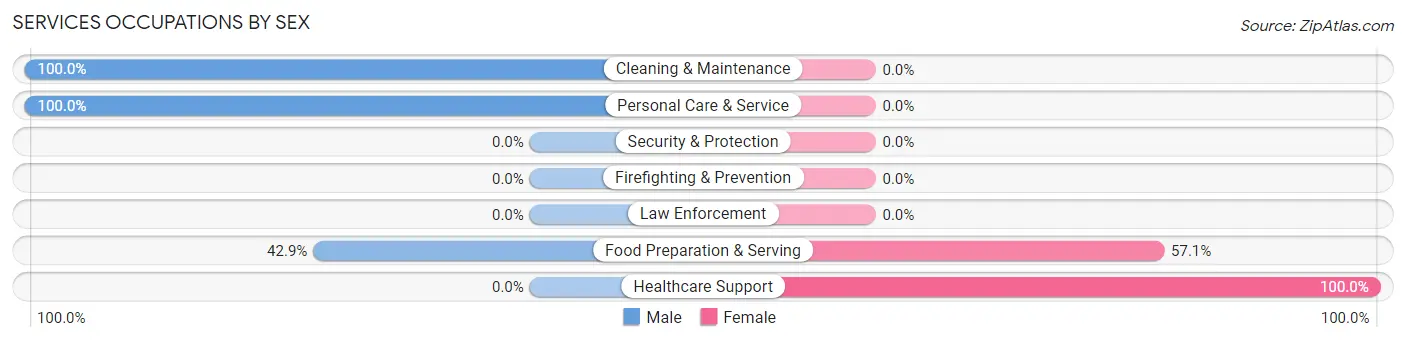
| Occupation | Male | Female |
| Healthcare Support | 0 (0.0%) | 1 (100.0%) |
| Security & Protection | 0 (0.0%) | 0 (0.0%) |
| Firefighting & Prevention | 0 (0.0%) | 0 (0.0%) |
| Law Enforcement | 0 (0.0%) | 0 (0.0%) |
| Food Preparation & Serving | 3 (42.9%) | 4 (57.1%) |
| Cleaning & Maintenance | 4 (100.0%) | 0 (0.0%) |
| Personal Care & Service | 5 (100.0%) | 0 (0.0%) |
| Total (Category) | 12 (70.6%) | 5 (29.4%) |
| Total (Overall) | 27 (56.2%) | 21 (43.8%) |
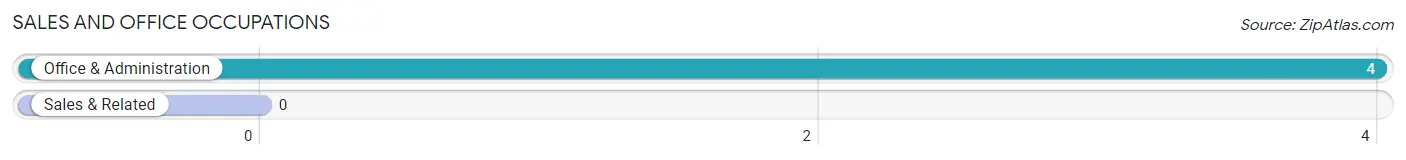
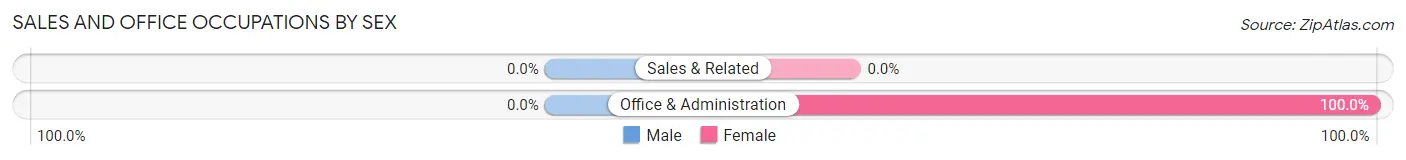
Sales and Office Occupations
The most common Sales and Office occupations in Kickapoo Tribal Center are , and Office & Administration (4 | 8.3%).
Sales and Office Occupations by Sex
| Occupation | Male | Female |
| Sales & Related | 0 (0.0%) | 0 (0.0%) |
| Office & Administration | 0 (0.0%) | 4 (100.0%) |
| Total (Category) | 0 (0.0%) | 4 (100.0%) |
| Total (Overall) | 27 (56.2%) | 21 (43.8%) |
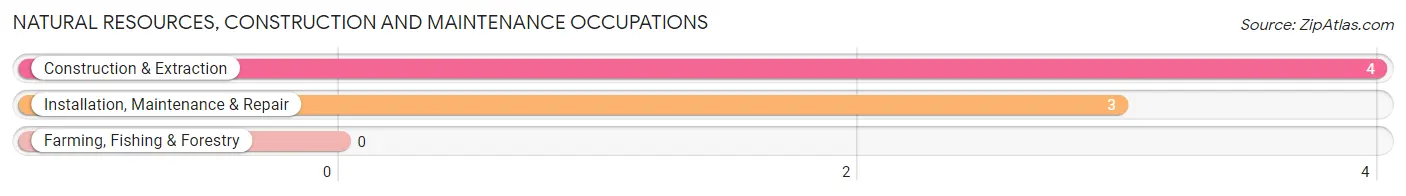
Natural Resources, Construction and Maintenance Occupations
The most common Natural Resources, Construction and Maintenance occupations in Kickapoo Tribal Center are Construction & Extraction (4 | 8.3%), and Installation, Maintenance & Repair (3 | 6.2%).
Natural Resources, Construction and Maintenance Occupations by Sex
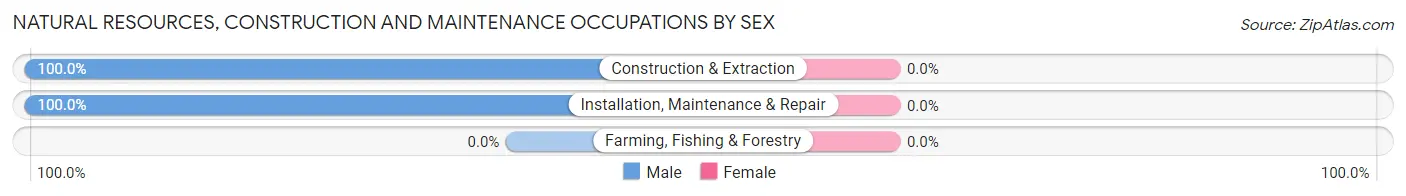
| Occupation | Male | Female |
| Farming, Fishing & Forestry | 0 (0.0%) | 0 (0.0%) |
| Construction & Extraction | 4 (100.0%) | 0 (0.0%) |
| Installation, Maintenance & Repair | 3 (100.0%) | 0 (0.0%) |
| Total (Category) | 7 (100.0%) | 0 (0.0%) |
| Total (Overall) | 27 (56.2%) | 21 (43.8%) |
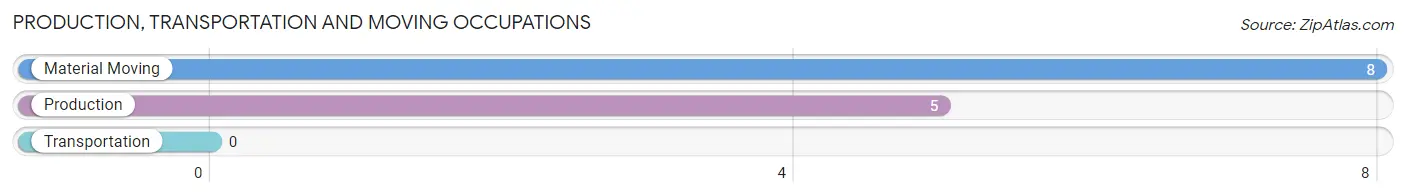
Production, Transportation and Moving Occupations
The most common Production, Transportation and Moving occupations in Kickapoo Tribal Center are Material Moving (8 | 16.7%), and Production (5 | 10.4%).
Production, Transportation and Moving Occupations by Sex
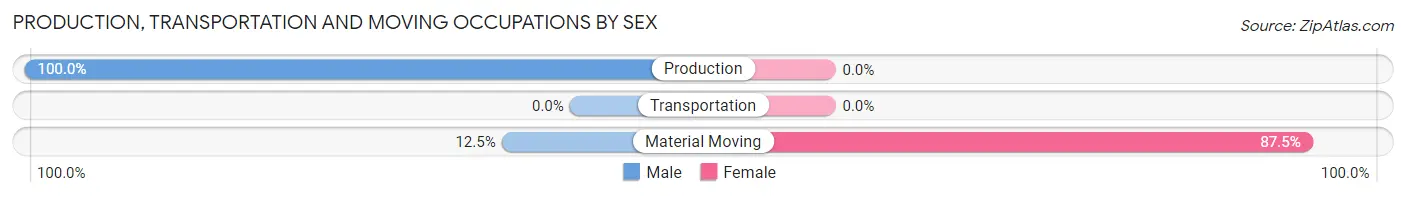
| Occupation | Male | Female |
| Production | 5 (100.0%) | 0 (0.0%) |
| Transportation | 0 (0.0%) | 0 (0.0%) |
| Material Moving | 1 (12.5%) | 7 (87.5%) |
| Total (Category) | 6 (46.2%) | 7 (53.8%) |
| Total (Overall) | 27 (56.2%) | 21 (43.8%) |
Employment Industries by Sex in Kickapoo Tribal Center
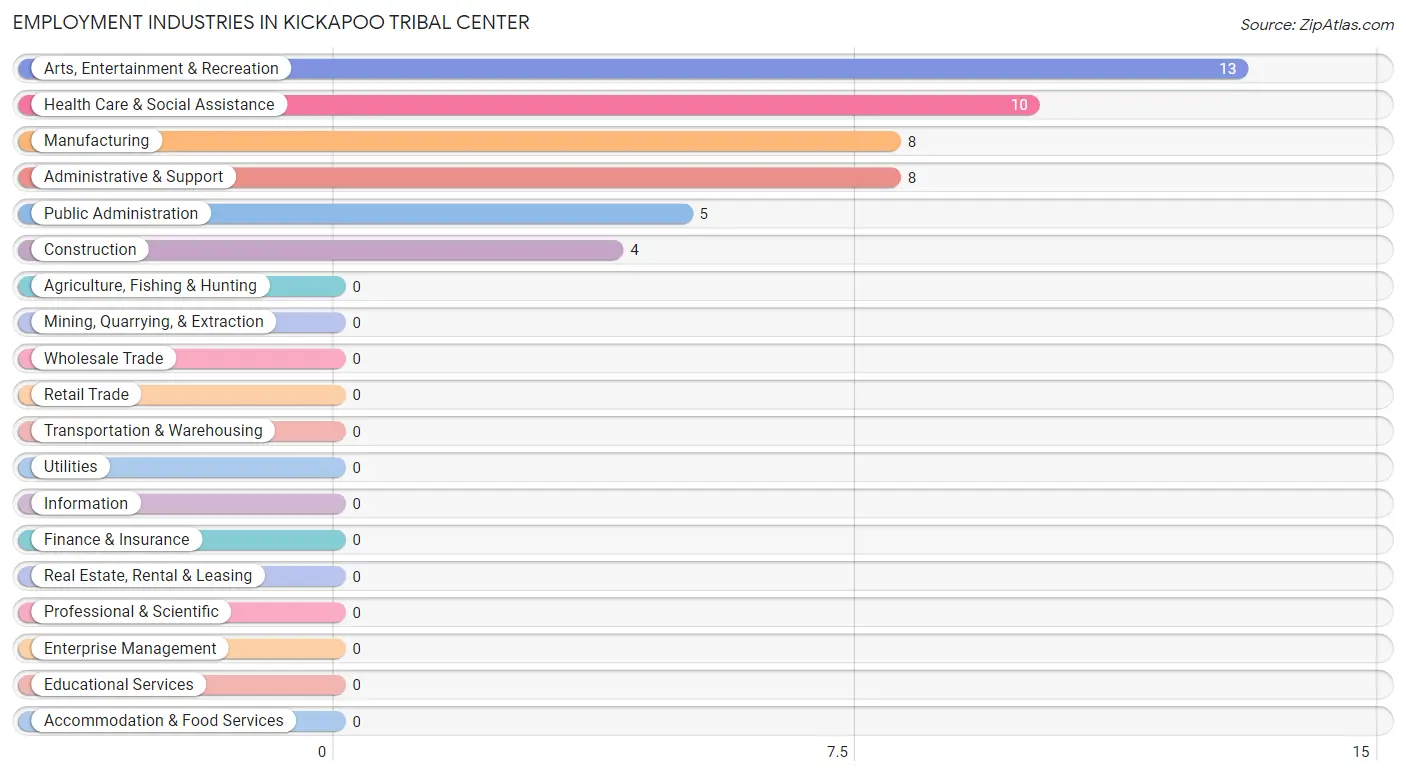
Employment Industries in Kickapoo Tribal Center
The major employment industries in Kickapoo Tribal Center include Arts, Entertainment & Recreation (13 | 27.1%), Health Care & Social Assistance (10 | 20.8%), Manufacturing (8 | 16.7%), Administrative & Support (8 | 16.7%), and Public Administration (5 | 10.4%).
Employment Industries by Sex in Kickapoo Tribal Center
The Kickapoo Tribal Center industries that see more men than women are Construction (100.0%), Administrative & Support (100.0%), and Arts, Entertainment & Recreation (69.2%), whereas the industries that tend to have a higher number of women are Manufacturing (87.5%), Health Care & Social Assistance (70.0%), and Public Administration (60.0%).
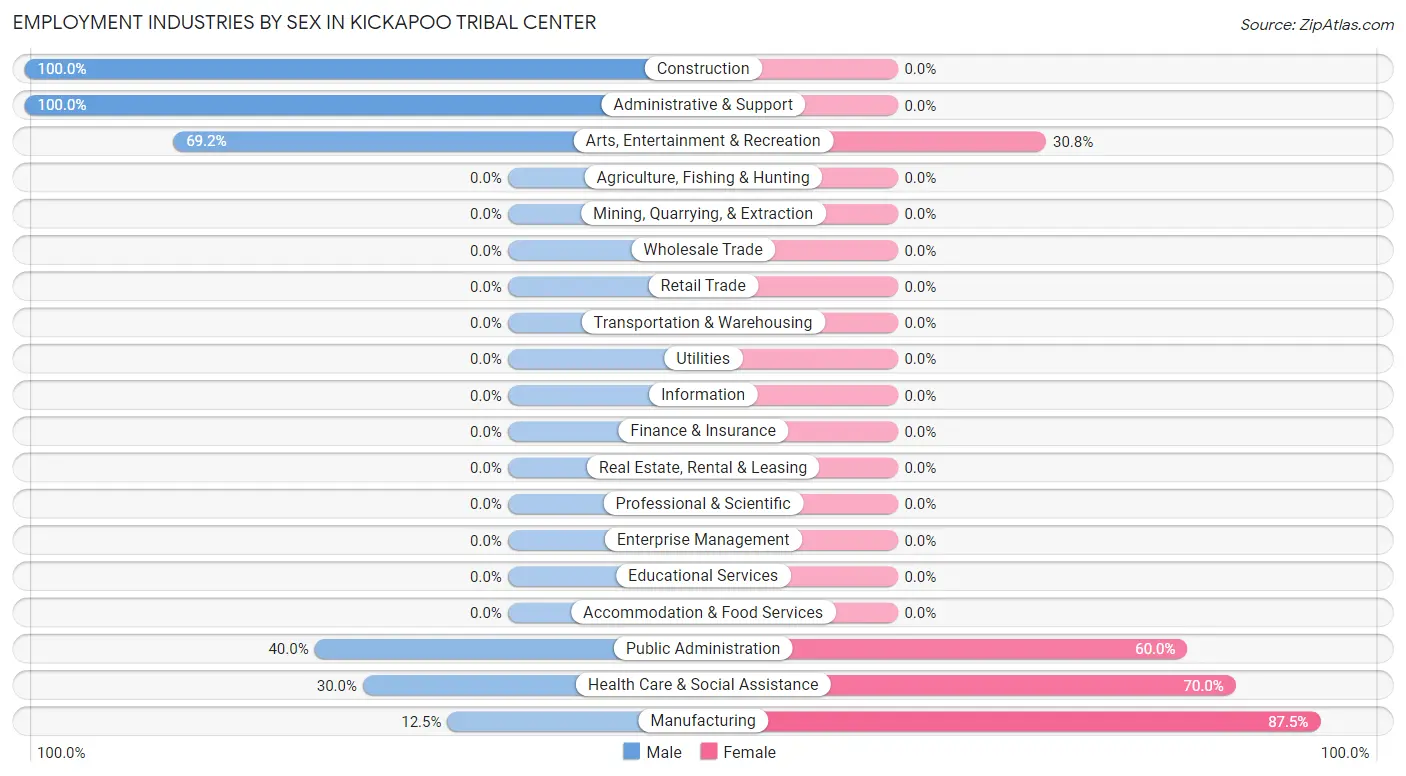
| Industry | Male | Female |
| Agriculture, Fishing & Hunting | 0 (0.0%) | 0 (0.0%) |
| Mining, Quarrying, & Extraction | 0 (0.0%) | 0 (0.0%) |
| Construction | 4 (100.0%) | 0 (0.0%) |
| Manufacturing | 1 (12.5%) | 7 (87.5%) |
| Wholesale Trade | 0 (0.0%) | 0 (0.0%) |
| Retail Trade | 0 (0.0%) | 0 (0.0%) |
| Transportation & Warehousing | 0 (0.0%) | 0 (0.0%) |
| Utilities | 0 (0.0%) | 0 (0.0%) |
| Information | 0 (0.0%) | 0 (0.0%) |
| Finance & Insurance | 0 (0.0%) | 0 (0.0%) |
| Real Estate, Rental & Leasing | 0 (0.0%) | 0 (0.0%) |
| Professional & Scientific | 0 (0.0%) | 0 (0.0%) |
| Enterprise Management | 0 (0.0%) | 0 (0.0%) |
| Administrative & Support | 8 (100.0%) | 0 (0.0%) |
| Educational Services | 0 (0.0%) | 0 (0.0%) |
| Health Care & Social Assistance | 3 (30.0%) | 7 (70.0%) |
| Arts, Entertainment & Recreation | 9 (69.2%) | 4 (30.8%) |
| Accommodation & Food Services | 0 (0.0%) | 0 (0.0%) |
| Public Administration | 2 (40.0%) | 3 (60.0%) |
| Total | 27 (56.2%) | 21 (43.8%) |
Education in Kickapoo Tribal Center
School Enrollment in Kickapoo Tribal Center
The most common levels of schooling among the 30 students in Kickapoo Tribal Center are high school (12 | 40.0%), middle school (8 | 26.7%), and elementary school (7 | 23.3%).
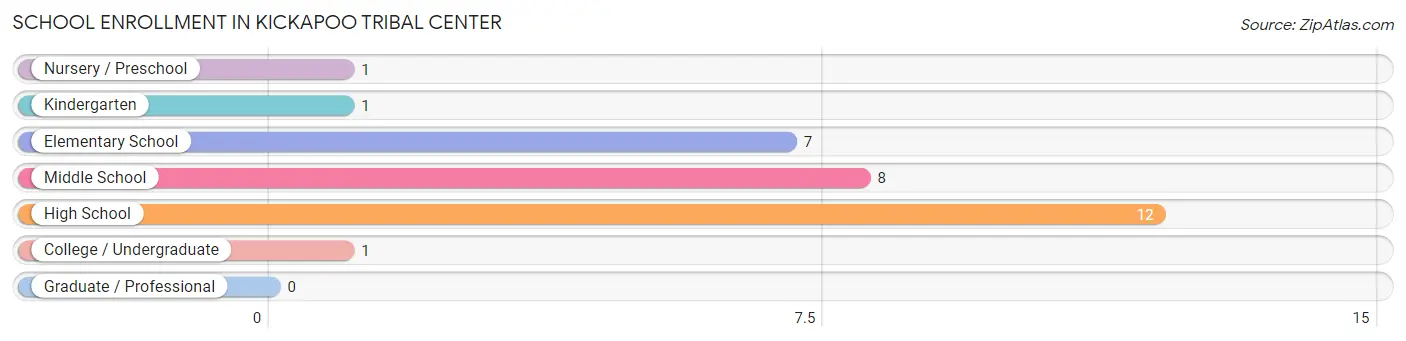
| School Level | # Students | % Students |
| Nursery / Preschool | 1 | 3.3% |
| Kindergarten | 1 | 3.3% |
| Elementary School | 7 | 23.3% |
| Middle School | 8 | 26.7% |
| High School | 12 | 40.0% |
| College / Undergraduate | 1 | 3.3% |
| Graduate / Professional | 0 | 0.0% |
| Total | 30 | 100.0% |
School Enrollment by Age by Funding Source in Kickapoo Tribal Center
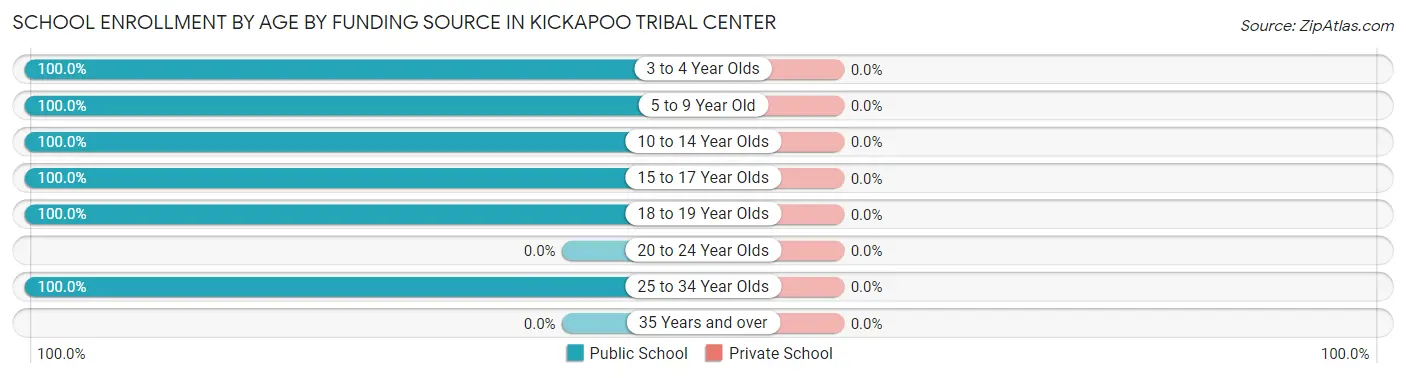
| Age Bracket | Public School | Private School |
| 3 to 4 Year Olds | 2 (100.0%) | 0 (0.0%) |
| 5 to 9 Year Old | 3 (100.0%) | 0 (0.0%) |
| 10 to 14 Year Olds | 12 (100.0%) | 0 (0.0%) |
| 15 to 17 Year Olds | 2 (100.0%) | 0 (0.0%) |
| 18 to 19 Year Olds | 10 (100.0%) | 0 (0.0%) |
| 20 to 24 Year Olds | 0 (0.0%) | 0 (0.0%) |
| 25 to 34 Year Olds | 1 (100.0%) | 0 (0.0%) |
| 35 Years and over | 0 (0.0%) | 0 (0.0%) |
| Total | 30 (100.0%) | 0 (0.0%) |
Educational Attainment by Field of Study in Kickapoo Tribal Center
Computers & mathematics (3 | 75.0%), and science & technology (1 | 25.0%) are the most common fields of study among 4 individuals in Kickapoo Tribal Center who have obtained a bachelor's degree or higher.
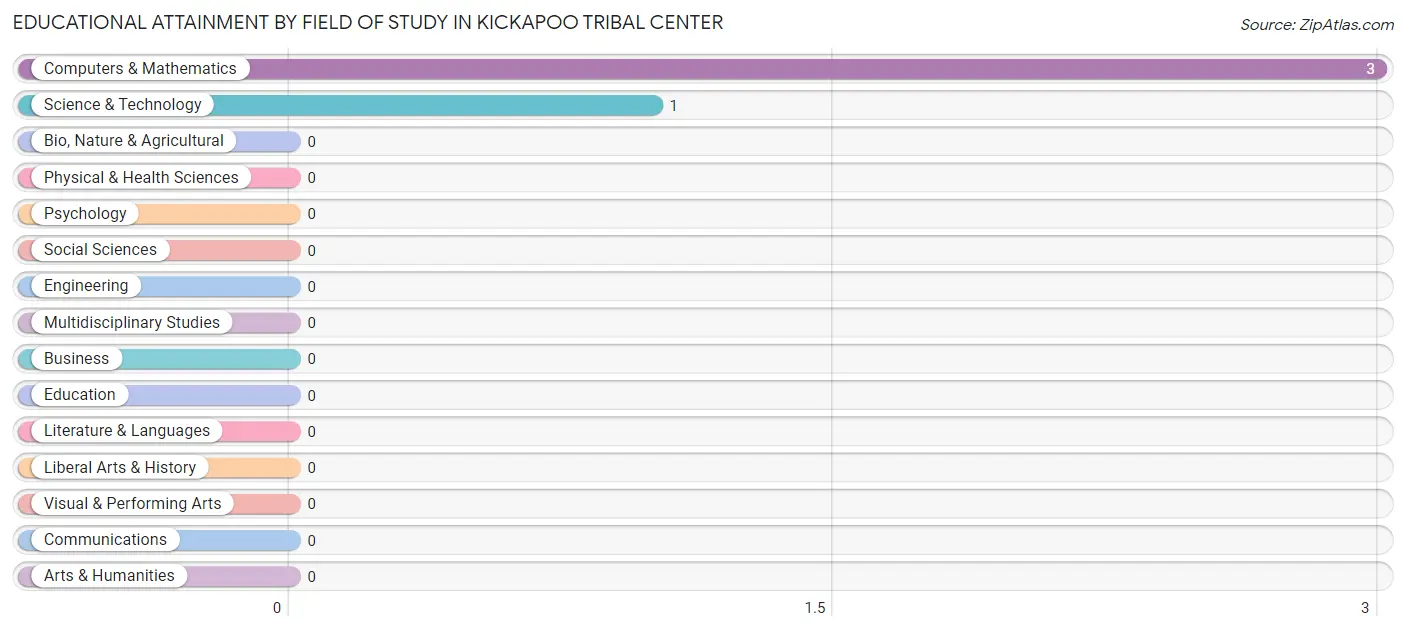
| Field of Study | # Graduates | % Graduates |
| Computers & Mathematics | 3 | 75.0% |
| Bio, Nature & Agricultural | 0 | 0.0% |
| Physical & Health Sciences | 0 | 0.0% |
| Psychology | 0 | 0.0% |
| Social Sciences | 0 | 0.0% |
| Engineering | 0 | 0.0% |
| Multidisciplinary Studies | 0 | 0.0% |
| Science & Technology | 1 | 25.0% |
| Business | 0 | 0.0% |
| Education | 0 | 0.0% |
| Literature & Languages | 0 | 0.0% |
| Liberal Arts & History | 0 | 0.0% |
| Visual & Performing Arts | 0 | 0.0% |
| Communications | 0 | 0.0% |
| Arts & Humanities | 0 | 0.0% |
| Total | 4 | 100.0% |
Transportation & Commute in Kickapoo Tribal Center
Vehicle Availability by Sex in Kickapoo Tribal Center
The most prevalent vehicle ownership categories in Kickapoo Tribal Center are males with 2 vehicles (15, accounting for 55.6%) and females with 2 vehicles (9, making up 93.8%).
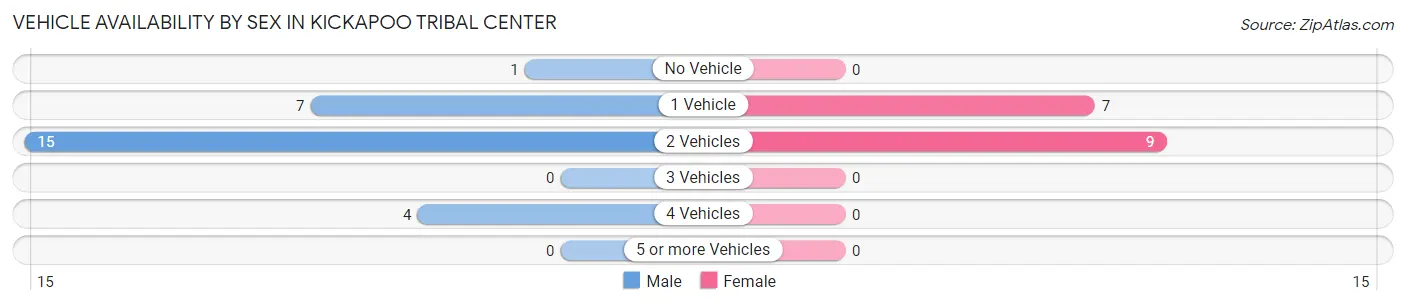
| Vehicles Available | Male | Female |
| No Vehicle | 1 (3.7%) | 0 (0.0%) |
| 1 Vehicle | 7 (25.9%) | 7 (43.8%) |
| 2 Vehicles | 15 (55.6%) | 9 (56.2%) |
| 3 Vehicles | 0 (0.0%) | 0 (0.0%) |
| 4 Vehicles | 4 (14.8%) | 0 (0.0%) |
| 5 or more Vehicles | 0 (0.0%) | 0 (0.0%) |
| Total | 27 (100.0%) | 16 (100.0%) |
Commute Time in Kickapoo Tribal Center
The most frequently occuring commute durations in Kickapoo Tribal Center are less than 5 minutes (12 commuters, 28.6%), 15 to 19 minutes (11 commuters, 26.2%), and 20 to 24 minutes (8 commuters, 19.1%).
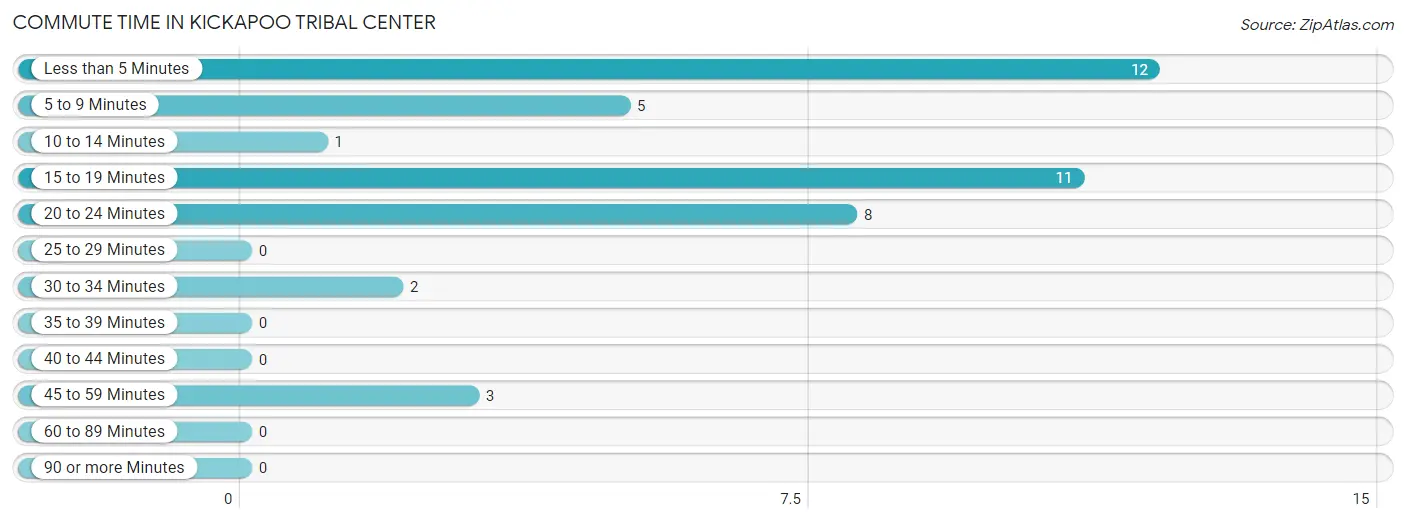
| Commute Time | # Commuters | % Commuters |
| Less than 5 Minutes | 12 | 28.6% |
| 5 to 9 Minutes | 5 | 11.9% |
| 10 to 14 Minutes | 1 | 2.4% |
| 15 to 19 Minutes | 11 | 26.2% |
| 20 to 24 Minutes | 8 | 19.1% |
| 25 to 29 Minutes | 0 | 0.0% |
| 30 to 34 Minutes | 2 | 4.8% |
| 35 to 39 Minutes | 0 | 0.0% |
| 40 to 44 Minutes | 0 | 0.0% |
| 45 to 59 Minutes | 3 | 7.1% |
| 60 to 89 Minutes | 0 | 0.0% |
| 90 or more Minutes | 0 | 0.0% |
Commute Time by Sex in Kickapoo Tribal Center
The most common commute times in Kickapoo Tribal Center are 20 to 24 minutes (8 commuters, 29.6%) for males and less than 5 minutes (7 commuters, 46.7%) for females.
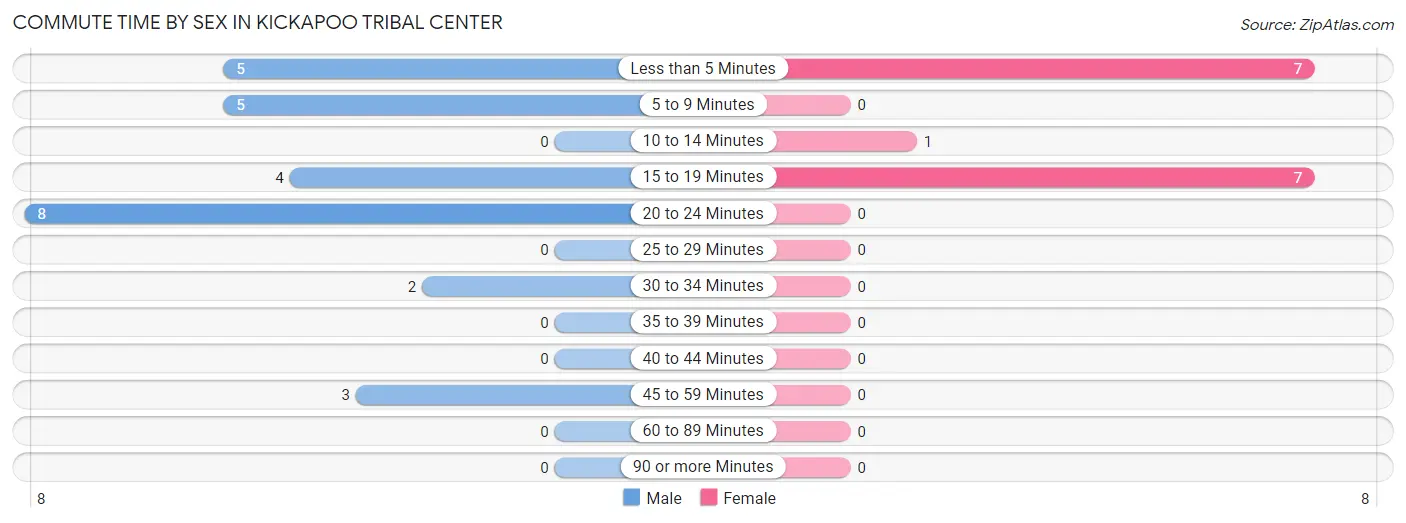
| Commute Time | Male | Female |
| Less than 5 Minutes | 5 (18.5%) | 7 (46.7%) |
| 5 to 9 Minutes | 5 (18.5%) | 0 (0.0%) |
| 10 to 14 Minutes | 0 (0.0%) | 1 (6.7%) |
| 15 to 19 Minutes | 4 (14.8%) | 7 (46.7%) |
| 20 to 24 Minutes | 8 (29.6%) | 0 (0.0%) |
| 25 to 29 Minutes | 0 (0.0%) | 0 (0.0%) |
| 30 to 34 Minutes | 2 (7.4%) | 0 (0.0%) |
| 35 to 39 Minutes | 0 (0.0%) | 0 (0.0%) |
| 40 to 44 Minutes | 0 (0.0%) | 0 (0.0%) |
| 45 to 59 Minutes | 3 (11.1%) | 0 (0.0%) |
| 60 to 89 Minutes | 0 (0.0%) | 0 (0.0%) |
| 90 or more Minutes | 0 (0.0%) | 0 (0.0%) |
Time of Departure to Work by Sex in Kickapoo Tribal Center
The most frequent times of departure to work in Kickapoo Tribal Center are 12:00 PM to 3:59 PM (12, 44.4%) for males and 12:00 AM to 4:59 AM (11, 73.3%) for females.
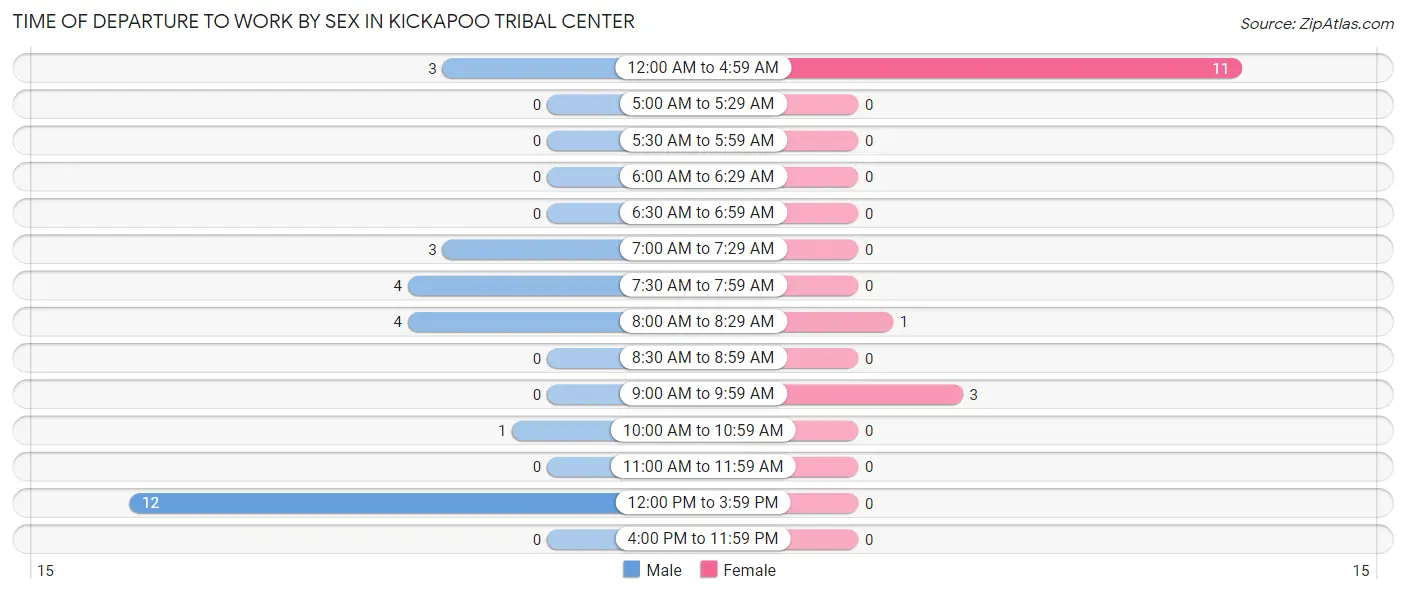
| Time of Departure | Male | Female |
| 12:00 AM to 4:59 AM | 3 (11.1%) | 11 (73.3%) |
| 5:00 AM to 5:29 AM | 0 (0.0%) | 0 (0.0%) |
| 5:30 AM to 5:59 AM | 0 (0.0%) | 0 (0.0%) |
| 6:00 AM to 6:29 AM | 0 (0.0%) | 0 (0.0%) |
| 6:30 AM to 6:59 AM | 0 (0.0%) | 0 (0.0%) |
| 7:00 AM to 7:29 AM | 3 (11.1%) | 0 (0.0%) |
| 7:30 AM to 7:59 AM | 4 (14.8%) | 0 (0.0%) |
| 8:00 AM to 8:29 AM | 4 (14.8%) | 1 (6.7%) |
| 8:30 AM to 8:59 AM | 0 (0.0%) | 0 (0.0%) |
| 9:00 AM to 9:59 AM | 0 (0.0%) | 3 (20.0%) |
| 10:00 AM to 10:59 AM | 1 (3.7%) | 0 (0.0%) |
| 11:00 AM to 11:59 AM | 0 (0.0%) | 0 (0.0%) |
| 12:00 PM to 3:59 PM | 12 (44.4%) | 0 (0.0%) |
| 4:00 PM to 11:59 PM | 0 (0.0%) | 0 (0.0%) |
| Total | 27 (100.0%) | 15 (100.0%) |
Housing Occupancy in Kickapoo Tribal Center
Occupancy by Ownership in Kickapoo Tribal Center
Of the total 50 dwellings in Kickapoo Tribal Center, owner-occupied units account for 30 (60.0%), while renter-occupied units make up 20 (40.0%).
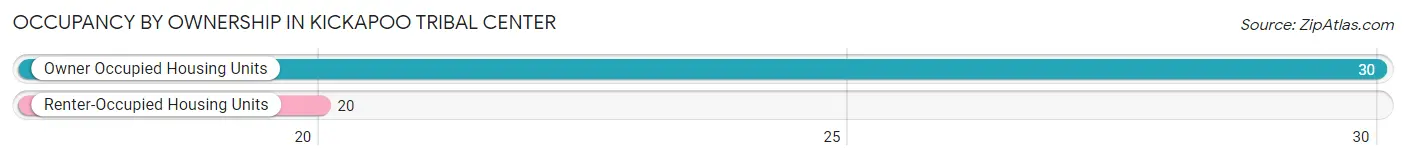
| Occupancy | # Housing Units | % Housing Units |
| Owner Occupied Housing Units | 30 | 60.0% |
| Renter-Occupied Housing Units | 20 | 40.0% |
| Total Occupied Housing Units | 50 | 100.0% |
Occupancy by Household Size in Kickapoo Tribal Center
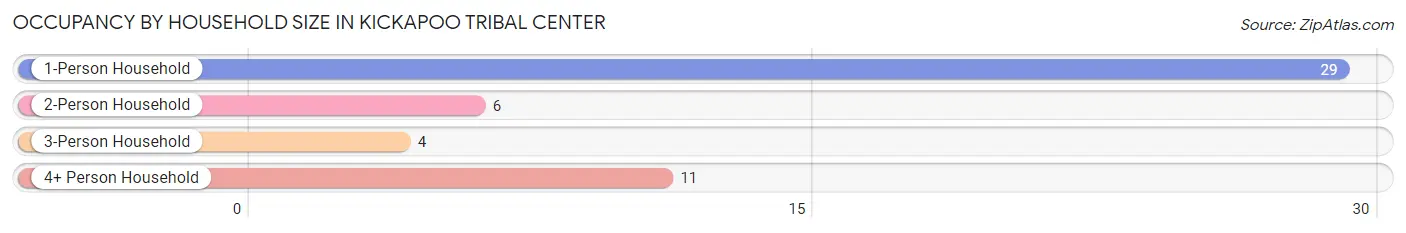
| Household Size | # Housing Units | % Housing Units |
| 1-Person Household | 29 | 58.0% |
| 2-Person Household | 6 | 12.0% |
| 3-Person Household | 4 | 8.0% |
| 4+ Person Household | 11 | 22.0% |
| Total Housing Units | 50 | 100.0% |
Occupancy by Ownership by Household Size in Kickapoo Tribal Center
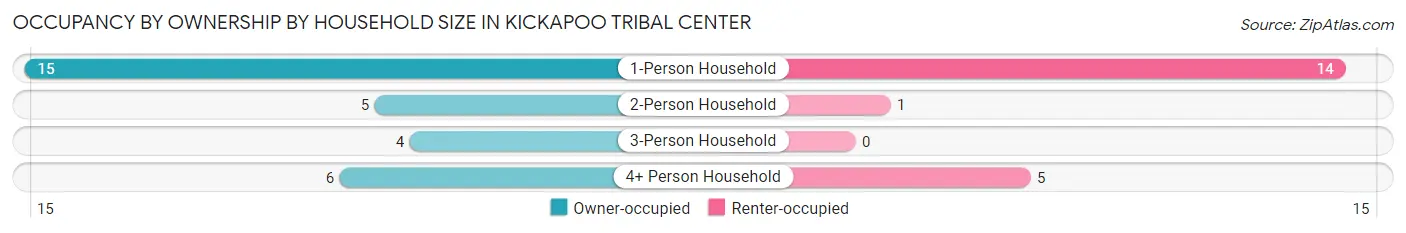
| Household Size | Owner-occupied | Renter-occupied |
| 1-Person Household | 15 (51.7%) | 14 (48.3%) |
| 2-Person Household | 5 (83.3%) | 1 (16.7%) |
| 3-Person Household | 4 (100.0%) | 0 (0.0%) |
| 4+ Person Household | 6 (54.5%) | 5 (45.5%) |
| Total Housing Units | 30 (60.0%) | 20 (40.0%) |
Occupancy by Educational Attainment in Kickapoo Tribal Center
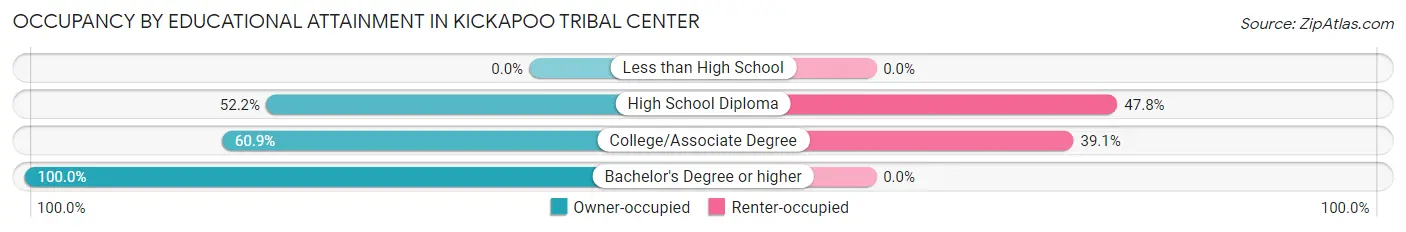
| Household Size | Owner-occupied | Renter-occupied |
| Less than High School | 0 (0.0%) | 0 (0.0%) |
| High School Diploma | 12 (52.2%) | 11 (47.8%) |
| College/Associate Degree | 14 (60.9%) | 9 (39.1%) |
| Bachelor's Degree or higher | 4 (100.0%) | 0 (0.0%) |
Occupancy by Age of Householder in Kickapoo Tribal Center
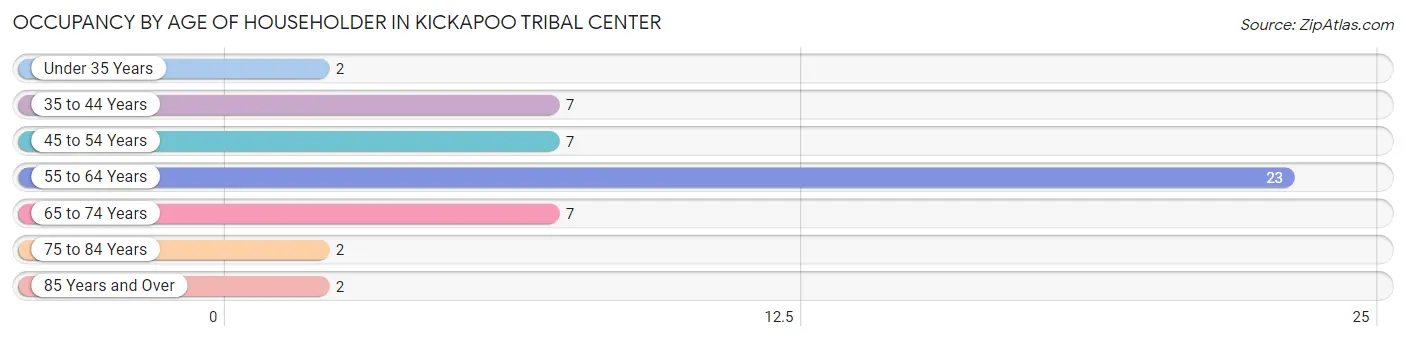
| Age Bracket | # Households | % Households |
| Under 35 Years | 2 | 4.0% |
| 35 to 44 Years | 7 | 14.0% |
| 45 to 54 Years | 7 | 14.0% |
| 55 to 64 Years | 23 | 46.0% |
| 65 to 74 Years | 7 | 14.0% |
| 75 to 84 Years | 2 | 4.0% |
| 85 Years and Over | 2 | 4.0% |
| Total | 50 | 100.0% |
Housing Finances in Kickapoo Tribal Center
Median Income by Occupancy in Kickapoo Tribal Center
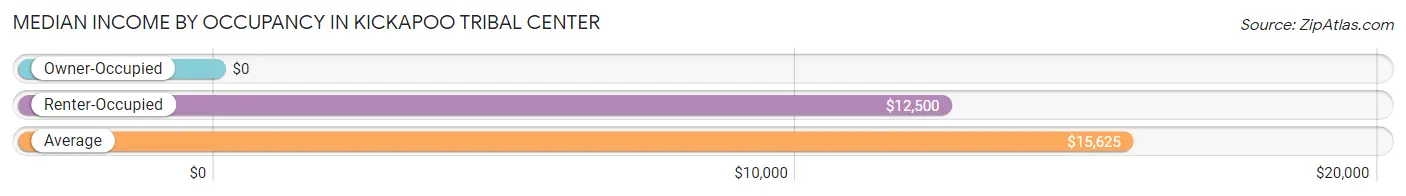
| Occupancy Type | # Households | Median Income |
| Owner-Occupied | 30 (60.0%) | $0 |
| Renter-Occupied | 20 (40.0%) | $12,500 |
| Average | 50 (100.0%) | $15,625 |
Occupancy by Householder Income Bracket in Kickapoo Tribal Center
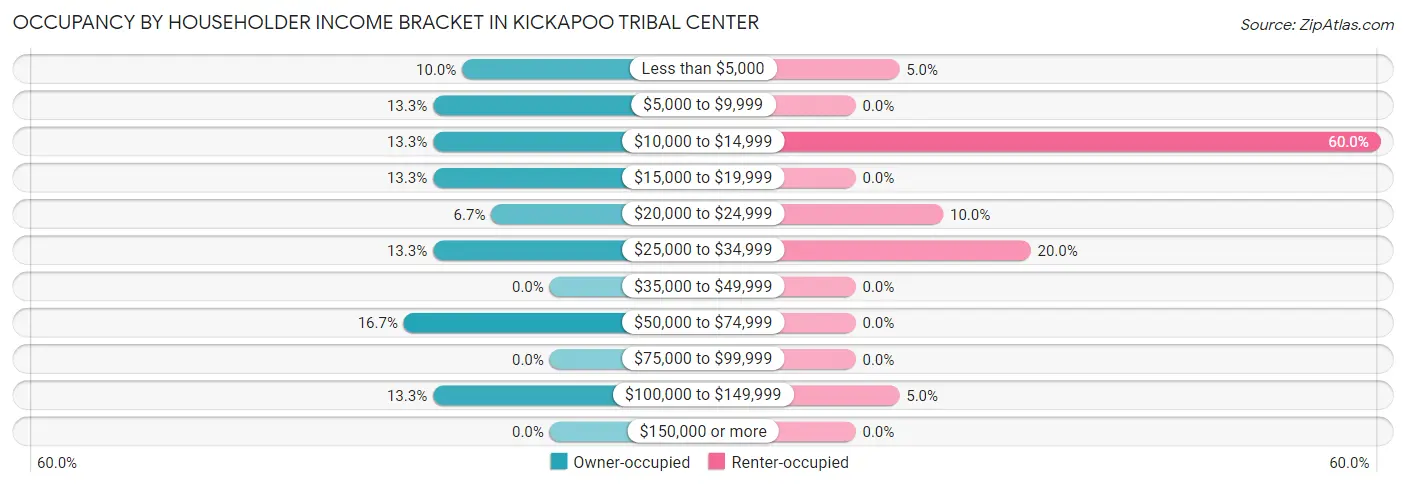
| Income Bracket | Owner-occupied | Renter-occupied |
| Less than $5,000 | 3 (10.0%) | 1 (5.0%) |
| $5,000 to $9,999 | 4 (13.3%) | 0 (0.0%) |
| $10,000 to $14,999 | 4 (13.3%) | 12 (60.0%) |
| $15,000 to $19,999 | 4 (13.3%) | 0 (0.0%) |
| $20,000 to $24,999 | 2 (6.7%) | 2 (10.0%) |
| $25,000 to $34,999 | 4 (13.3%) | 4 (20.0%) |
| $35,000 to $49,999 | 0 (0.0%) | 0 (0.0%) |
| $50,000 to $74,999 | 5 (16.7%) | 0 (0.0%) |
| $75,000 to $99,999 | 0 (0.0%) | 0 (0.0%) |
| $100,000 to $149,999 | 4 (13.3%) | 1 (5.0%) |
| $150,000 or more | 0 (0.0%) | 0 (0.0%) |
| Total | 30 (100.0%) | 20 (100.0%) |
Monthly Housing Cost Tiers in Kickapoo Tribal Center
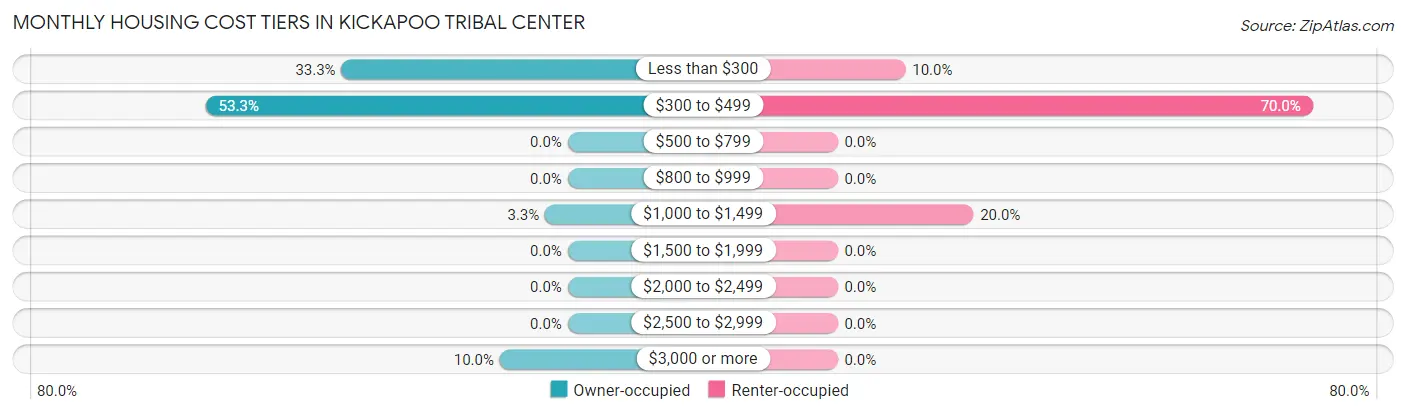
| Monthly Cost | Owner-occupied | Renter-occupied |
| Less than $300 | 10 (33.3%) | 2 (10.0%) |
| $300 to $499 | 16 (53.3%) | 14 (70.0%) |
| $500 to $799 | 0 (0.0%) | 0 (0.0%) |
| $800 to $999 | 0 (0.0%) | 0 (0.0%) |
| $1,000 to $1,499 | 1 (3.3%) | 4 (20.0%) |
| $1,500 to $1,999 | 0 (0.0%) | 0 (0.0%) |
| $2,000 to $2,499 | 0 (0.0%) | 0 (0.0%) |
| $2,500 to $2,999 | 0 (0.0%) | 0 (0.0%) |
| $3,000 or more | 3 (10.0%) | 0 (0.0%) |
| Total | 30 (100.0%) | 20 (100.0%) |
Physical Housing Characteristics in Kickapoo Tribal Center
Housing Structures in Kickapoo Tribal Center
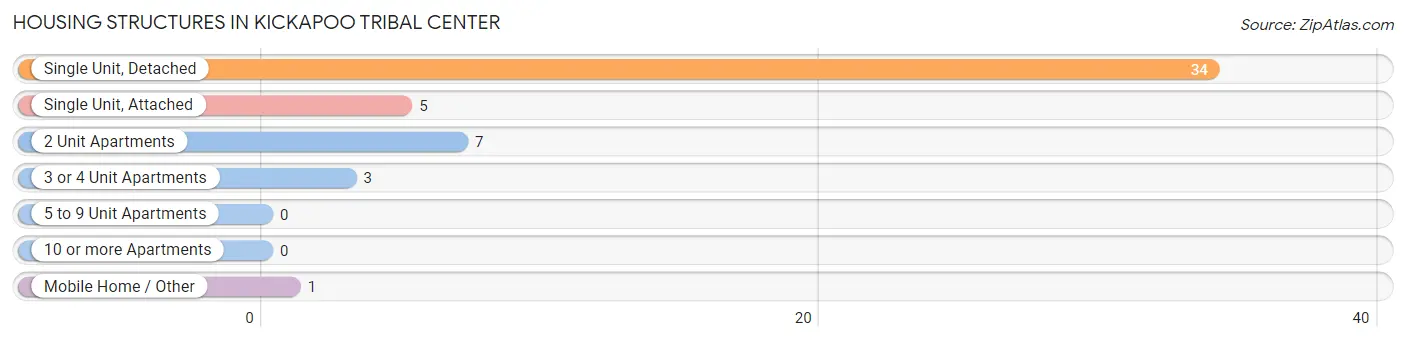
| Structure Type | # Housing Units | % Housing Units |
| Single Unit, Detached | 34 | 68.0% |
| Single Unit, Attached | 5 | 10.0% |
| 2 Unit Apartments | 7 | 14.0% |
| 3 or 4 Unit Apartments | 3 | 6.0% |
| 5 to 9 Unit Apartments | 0 | 0.0% |
| 10 or more Apartments | 0 | 0.0% |
| Mobile Home / Other | 1 | 2.0% |
| Total | 50 | 100.0% |
Housing Structures by Occupancy in Kickapoo Tribal Center
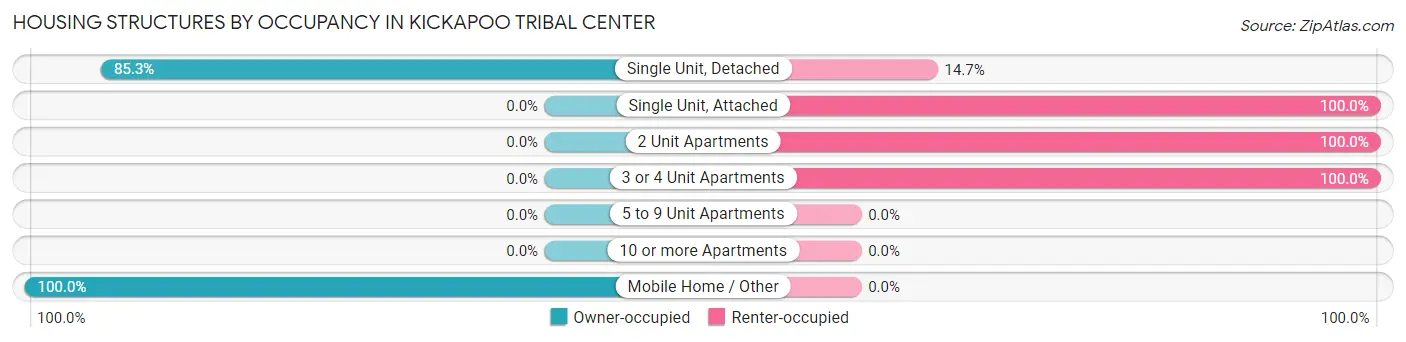
| Structure Type | Owner-occupied | Renter-occupied |
| Single Unit, Detached | 29 (85.3%) | 5 (14.7%) |
| Single Unit, Attached | 0 (0.0%) | 5 (100.0%) |
| 2 Unit Apartments | 0 (0.0%) | 7 (100.0%) |
| 3 or 4 Unit Apartments | 0 (0.0%) | 3 (100.0%) |
| 5 to 9 Unit Apartments | 0 (0.0%) | 0 (0.0%) |
| 10 or more Apartments | 0 (0.0%) | 0 (0.0%) |
| Mobile Home / Other | 1 (100.0%) | 0 (0.0%) |
| Total | 30 (60.0%) | 20 (40.0%) |
Housing Structures by Number of Rooms in Kickapoo Tribal Center
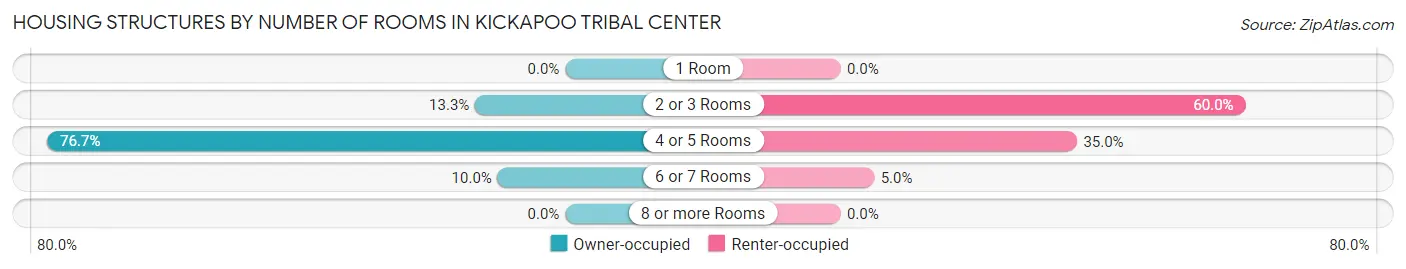
| Number of Rooms | Owner-occupied | Renter-occupied |
| 1 Room | 0 (0.0%) | 0 (0.0%) |
| 2 or 3 Rooms | 4 (13.3%) | 12 (60.0%) |
| 4 or 5 Rooms | 23 (76.7%) | 7 (35.0%) |
| 6 or 7 Rooms | 3 (10.0%) | 1 (5.0%) |
| 8 or more Rooms | 0 (0.0%) | 0 (0.0%) |
| Total | 30 (100.0%) | 20 (100.0%) |
Housing Structure by Heating Type in Kickapoo Tribal Center
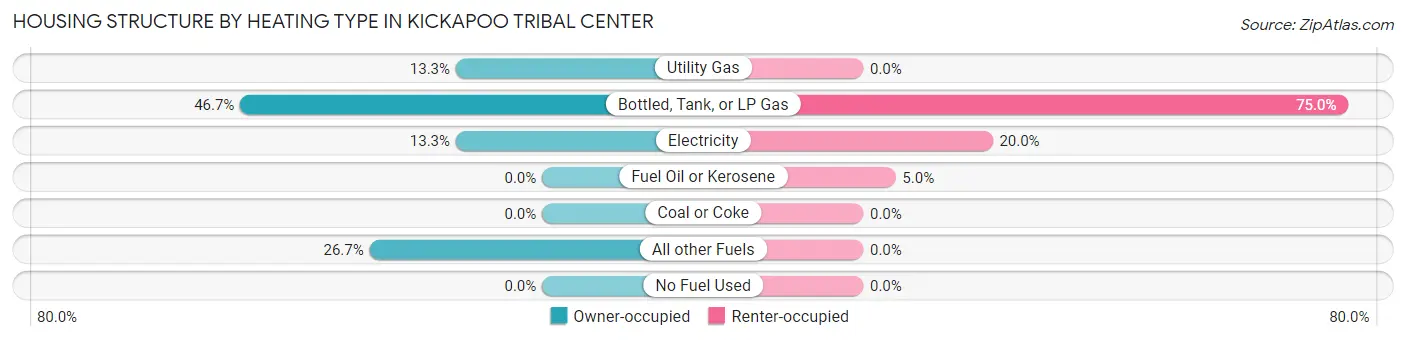
| Heating Type | Owner-occupied | Renter-occupied |
| Utility Gas | 4 (13.3%) | 0 (0.0%) |
| Bottled, Tank, or LP Gas | 14 (46.7%) | 15 (75.0%) |
| Electricity | 4 (13.3%) | 4 (20.0%) |
| Fuel Oil or Kerosene | 0 (0.0%) | 1 (5.0%) |
| Coal or Coke | 0 (0.0%) | 0 (0.0%) |
| All other Fuels | 8 (26.7%) | 0 (0.0%) |
| No Fuel Used | 0 (0.0%) | 0 (0.0%) |
| Total | 30 (100.0%) | 20 (100.0%) |
Household Vehicle Usage in Kickapoo Tribal Center

| Vehicles per Household | Owner-occupied | Renter-occupied |
| No Vehicle | 4 (13.3%) | 7 (35.0%) |
| 1 Vehicle | 11 (36.7%) | 12 (60.0%) |
| 2 Vehicles | 13 (43.3%) | 1 (5.0%) |
| 3 or more Vehicles | 2 (6.7%) | 0 (0.0%) |
| Total | 30 (100.0%) | 20 (100.0%) |
Real Estate & Mortgages in Kickapoo Tribal Center
Real Estate and Mortgage Overview in Kickapoo Tribal Center
| Characteristic | Without Mortgage | With Mortgage |
| Housing Units | 27 | 3 |
| Median Property Value | $56,300 | $0 |
| Median Household Income | - | - |
| Monthly Housing Costs | $344 | $3 |
| Real Estate Taxes | $700 | $0 |
Property Value by Mortgage Status in Kickapoo Tribal Center
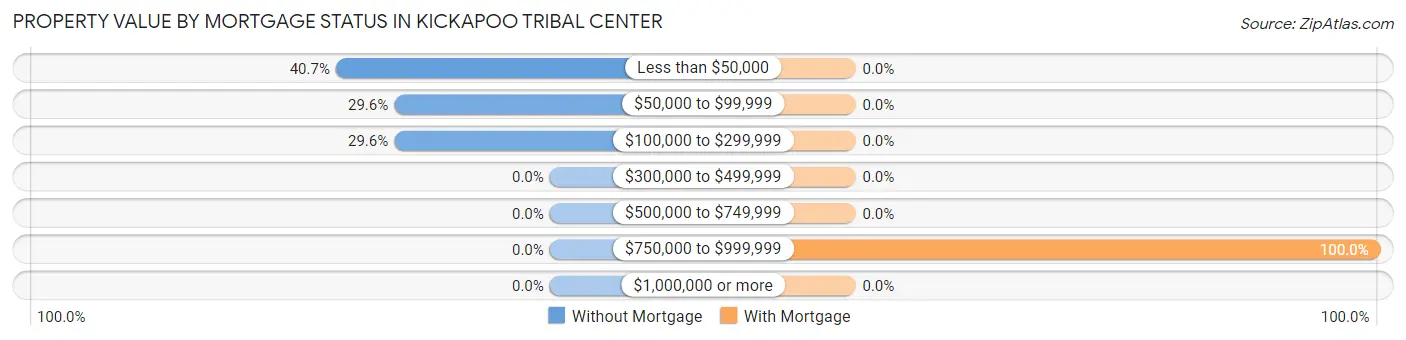
| Property Value | Without Mortgage | With Mortgage |
| Less than $50,000 | 11 (40.7%) | 0 (0.0%) |
| $50,000 to $99,999 | 8 (29.6%) | 0 (0.0%) |
| $100,000 to $299,999 | 8 (29.6%) | 0 (0.0%) |
| $300,000 to $499,999 | 0 (0.0%) | 0 (0.0%) |
| $500,000 to $749,999 | 0 (0.0%) | 0 (0.0%) |
| $750,000 to $999,999 | 0 (0.0%) | 3 (100.0%) |
| $1,000,000 or more | 0 (0.0%) | 0 (0.0%) |
| Total | 27 (100.0%) | 3 (100.0%) |
Household Income by Mortgage Status in Kickapoo Tribal Center
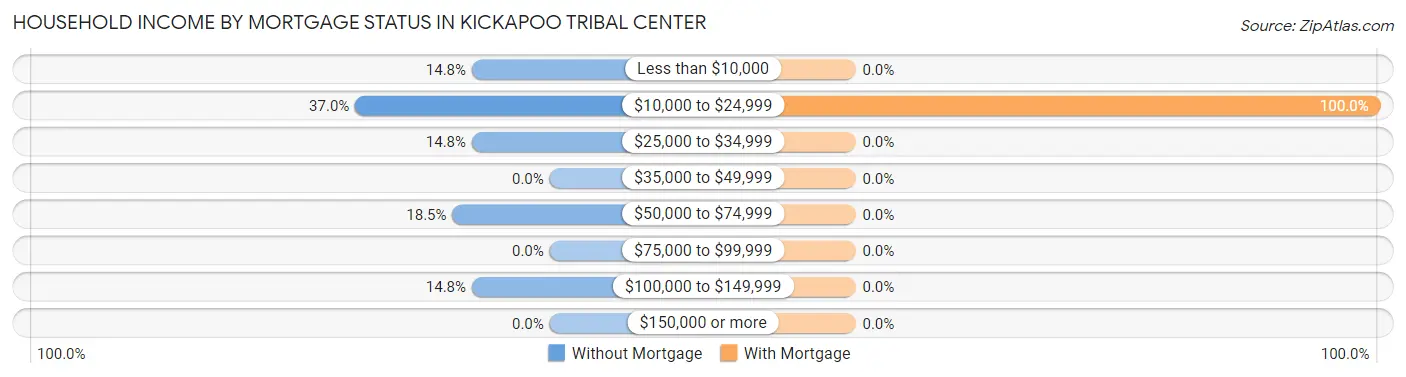
| Household Income | Without Mortgage | With Mortgage |
| Less than $10,000 | 4 (14.8%) | 0 (0.0%) |
| $10,000 to $24,999 | 10 (37.0%) | 3 (100.0%) |
| $25,000 to $34,999 | 4 (14.8%) | 0 (0.0%) |
| $35,000 to $49,999 | 0 (0.0%) | 0 (0.0%) |
| $50,000 to $74,999 | 5 (18.5%) | 0 (0.0%) |
| $75,000 to $99,999 | 0 (0.0%) | 0 (0.0%) |
| $100,000 to $149,999 | 4 (14.8%) | 0 (0.0%) |
| $150,000 or more | 0 (0.0%) | 0 (0.0%) |
| Total | 27 (100.0%) | 3 (100.0%) |
Property Value to Household Income Ratio in Kickapoo Tribal Center
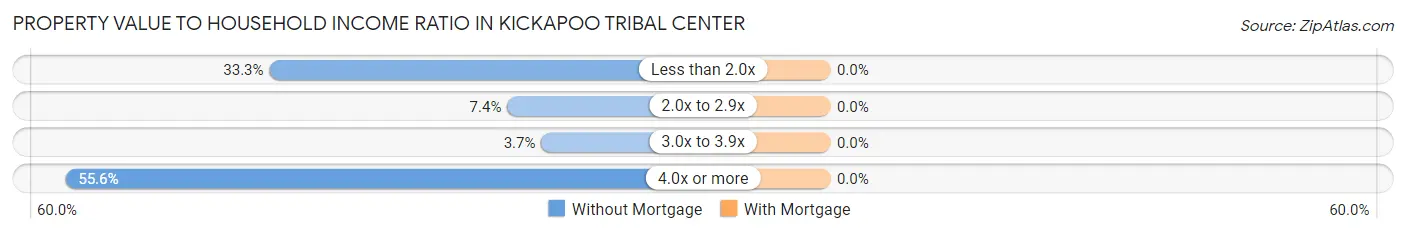
| Value-to-Income Ratio | Without Mortgage | With Mortgage |
| Less than 2.0x | 9 (33.3%) | 0 (0.0%) |
| 2.0x to 2.9x | 2 (7.4%) | 0 (0.0%) |
| 3.0x to 3.9x | 1 (3.7%) | 0 (0.0%) |
| 4.0x or more | 15 (55.6%) | 0 (0.0%) |
| Total | 27 (100.0%) | 3 (100.0%) |
Real Estate Taxes by Mortgage Status in Kickapoo Tribal Center
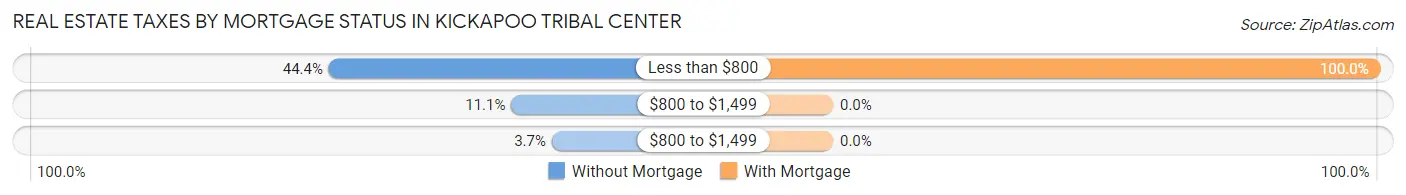
| Property Taxes | Without Mortgage | With Mortgage |
| Less than $800 | 12 (44.4%) | 3 (100.0%) |
| $800 to $1,499 | 3 (11.1%) | 0 (0.0%) |
| $800 to $1,499 | 1 (3.7%) | 0 (0.0%) |
| Total | 27 (100.0%) | 3 (100.0%) |
Health & Disability in Kickapoo Tribal Center
Health Insurance Coverage by Age in Kickapoo Tribal Center
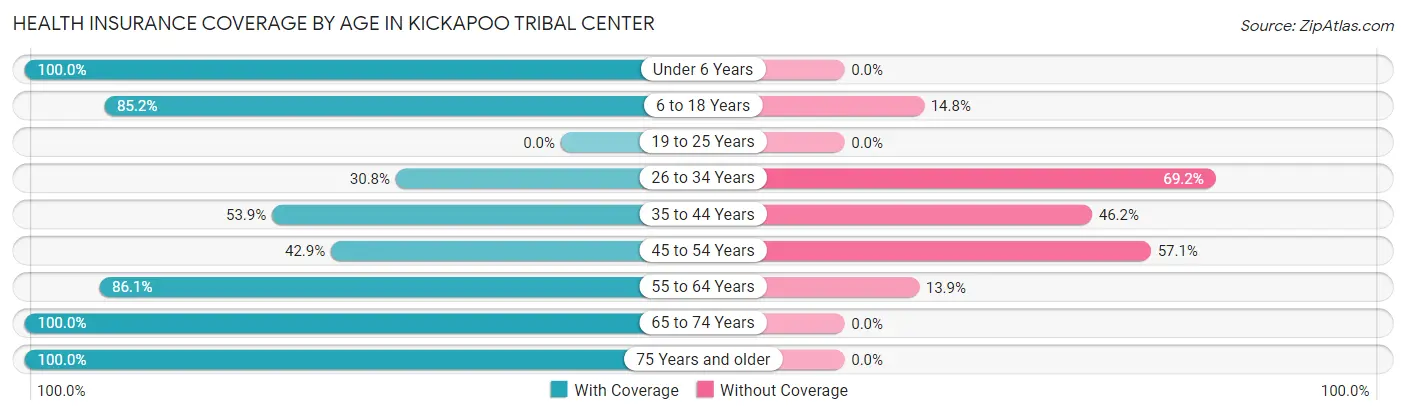
| Age Bracket | With Coverage | Without Coverage |
| Under 6 Years | 8 (100.0%) | 0 (0.0%) |
| 6 to 18 Years | 23 (85.2%) | 4 (14.8%) |
| 19 to 25 Years | 0 (0.0%) | 0 (0.0%) |
| 26 to 34 Years | 4 (30.8%) | 9 (69.2%) |
| 35 to 44 Years | 7 (53.8%) | 6 (46.2%) |
| 45 to 54 Years | 6 (42.9%) | 8 (57.1%) |
| 55 to 64 Years | 31 (86.1%) | 5 (13.9%) |
| 65 to 74 Years | 11 (100.0%) | 0 (0.0%) |
| 75 Years and older | 8 (100.0%) | 0 (0.0%) |
| Total | 98 (75.4%) | 32 (24.6%) |
Health Insurance Coverage by Citizenship Status in Kickapoo Tribal Center
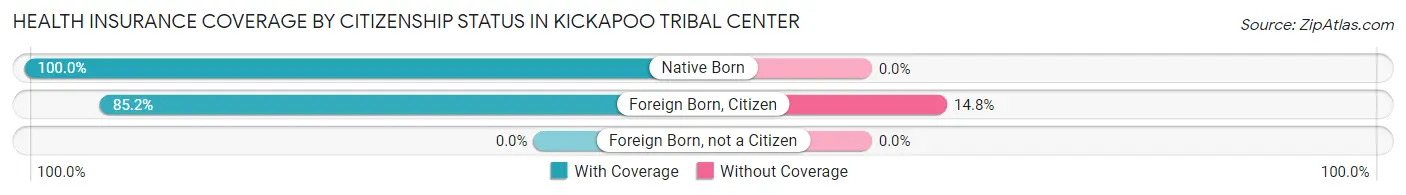
| Citizenship Status | With Coverage | Without Coverage |
| Native Born | 8 (100.0%) | 0 (0.0%) |
| Foreign Born, Citizen | 23 (85.2%) | 4 (14.8%) |
| Foreign Born, not a Citizen | 0 (0.0%) | 0 (0.0%) |
Health Insurance Coverage by Household Income in Kickapoo Tribal Center
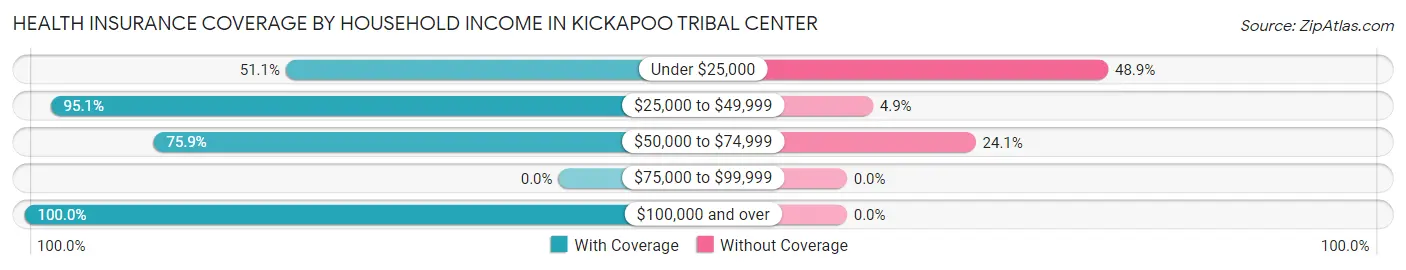
| Household Income | With Coverage | Without Coverage |
| Under $25,000 | 24 (51.1%) | 23 (48.9%) |
| $25,000 to $49,999 | 39 (95.1%) | 2 (4.9%) |
| $50,000 to $74,999 | 22 (75.9%) | 7 (24.1%) |
| $75,000 to $99,999 | 0 (0.0%) | 0 (0.0%) |
| $100,000 and over | 13 (100.0%) | 0 (0.0%) |
Public vs Private Health Insurance Coverage by Age in Kickapoo Tribal Center
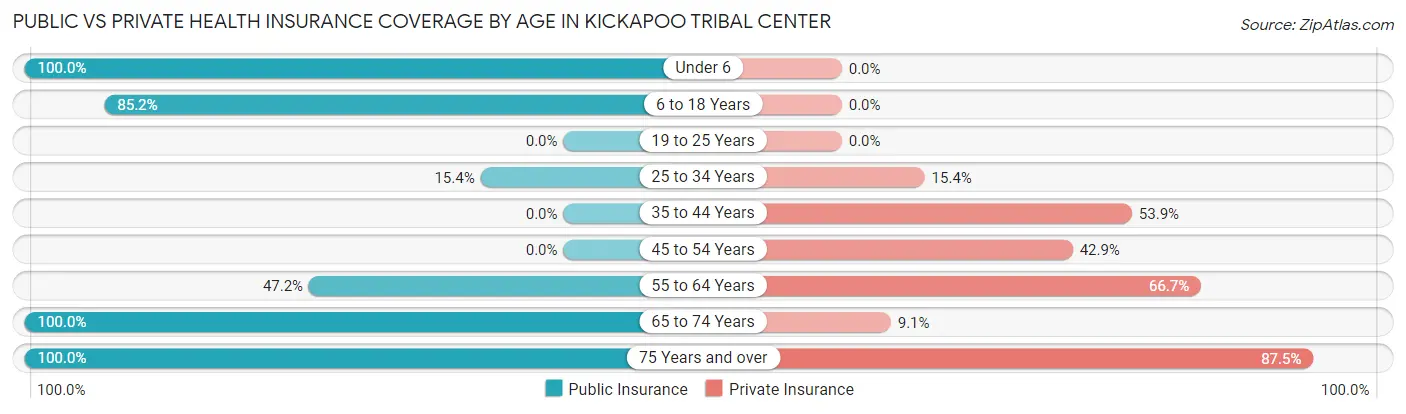
| Age Bracket | Public Insurance | Private Insurance |
| Under 6 | 8 (100.0%) | 0 (0.0%) |
| 6 to 18 Years | 23 (85.2%) | 0 (0.0%) |
| 19 to 25 Years | 0 (0.0%) | 0 (0.0%) |
| 25 to 34 Years | 2 (15.4%) | 2 (15.4%) |
| 35 to 44 Years | 0 (0.0%) | 7 (53.8%) |
| 45 to 54 Years | 0 (0.0%) | 6 (42.9%) |
| 55 to 64 Years | 17 (47.2%) | 24 (66.7%) |
| 65 to 74 Years | 11 (100.0%) | 1 (9.1%) |
| 75 Years and over | 8 (100.0%) | 7 (87.5%) |
| Total | 69 (53.1%) | 47 (36.1%) |
Disability Status by Sex by Age in Kickapoo Tribal Center
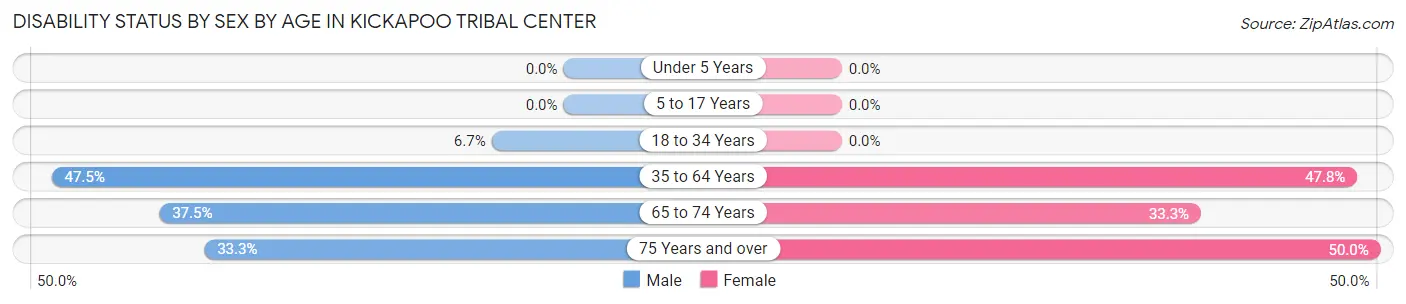
| Age Bracket | Male | Female |
| Under 5 Years | 0 (0.0%) | 0 (0.0%) |
| 5 to 17 Years | 0 (0.0%) | 0 (0.0%) |
| 18 to 34 Years | 1 (6.7%) | 0 (0.0%) |
| 35 to 64 Years | 19 (47.5%) | 11 (47.8%) |
| 65 to 74 Years | 3 (37.5%) | 1 (33.3%) |
| 75 Years and over | 2 (33.3%) | 1 (50.0%) |
Disability Class by Sex by Age in Kickapoo Tribal Center
Disability Class: Hearing Difficulty
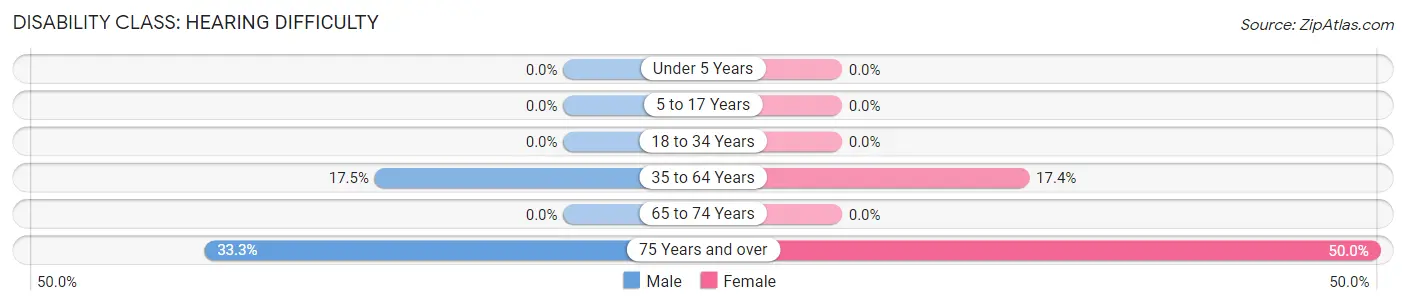
| Age Bracket | Male | Female |
| Under 5 Years | 0 (0.0%) | 0 (0.0%) |
| 5 to 17 Years | 0 (0.0%) | 0 (0.0%) |
| 18 to 34 Years | 0 (0.0%) | 0 (0.0%) |
| 35 to 64 Years | 7 (17.5%) | 4 (17.4%) |
| 65 to 74 Years | 0 (0.0%) | 0 (0.0%) |
| 75 Years and over | 2 (33.3%) | 1 (50.0%) |
Disability Class: Vision Difficulty
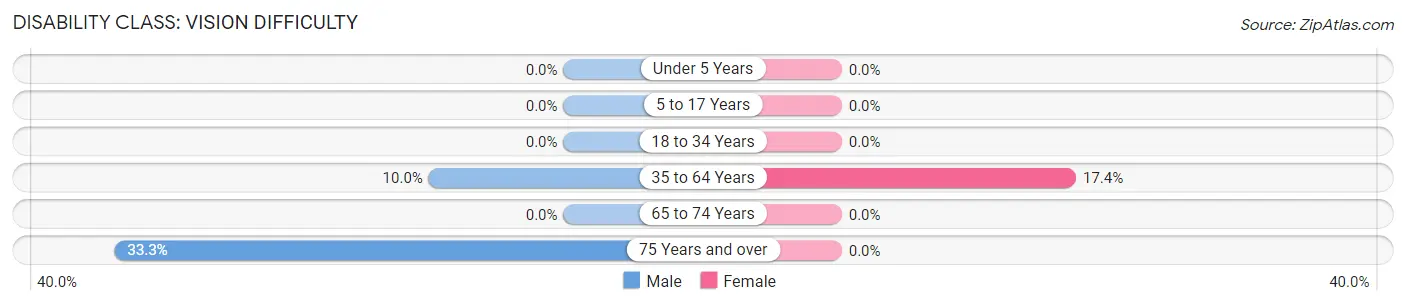
| Age Bracket | Male | Female |
| Under 5 Years | 0 (0.0%) | 0 (0.0%) |
| 5 to 17 Years | 0 (0.0%) | 0 (0.0%) |
| 18 to 34 Years | 0 (0.0%) | 0 (0.0%) |
| 35 to 64 Years | 4 (10.0%) | 4 (17.4%) |
| 65 to 74 Years | 0 (0.0%) | 0 (0.0%) |
| 75 Years and over | 2 (33.3%) | 0 (0.0%) |
Disability Class: Cognitive Difficulty
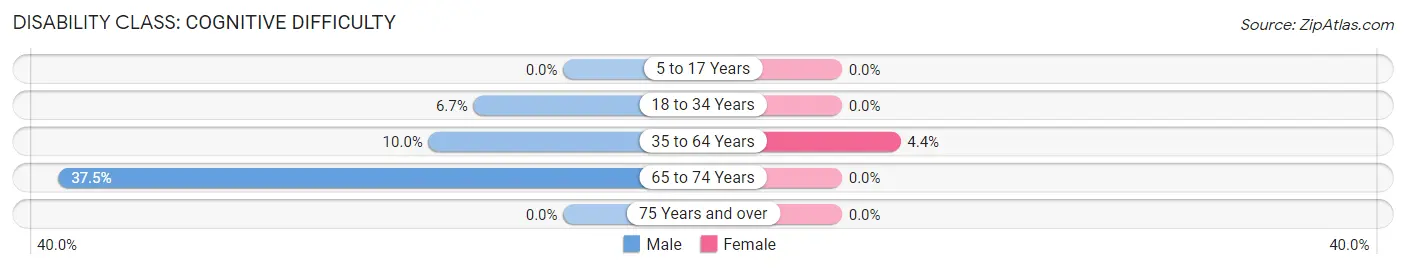
| Age Bracket | Male | Female |
| 5 to 17 Years | 0 (0.0%) | 0 (0.0%) |
| 18 to 34 Years | 1 (6.7%) | 0 (0.0%) |
| 35 to 64 Years | 4 (10.0%) | 1 (4.3%) |
| 65 to 74 Years | 3 (37.5%) | 0 (0.0%) |
| 75 Years and over | 0 (0.0%) | 0 (0.0%) |
Disability Class: Ambulatory Difficulty
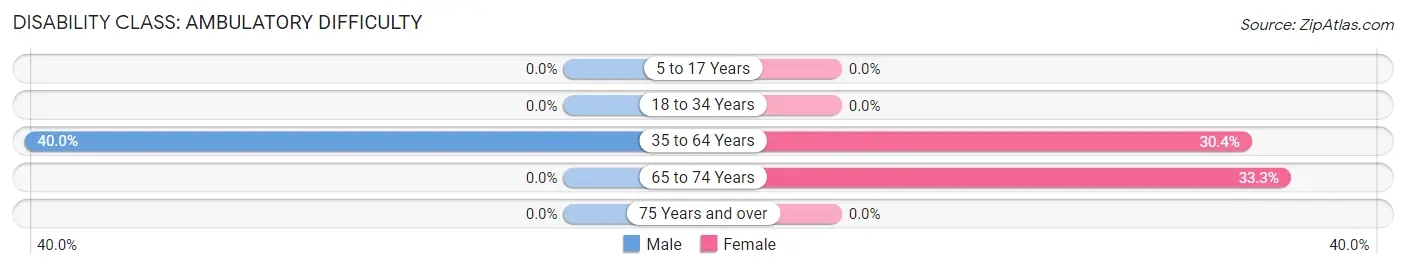
| Age Bracket | Male | Female |
| 5 to 17 Years | 0 (0.0%) | 0 (0.0%) |
| 18 to 34 Years | 0 (0.0%) | 0 (0.0%) |
| 35 to 64 Years | 16 (40.0%) | 7 (30.4%) |
| 65 to 74 Years | 0 (0.0%) | 1 (33.3%) |
| 75 Years and over | 0 (0.0%) | 0 (0.0%) |
Disability Class: Self-Care Difficulty
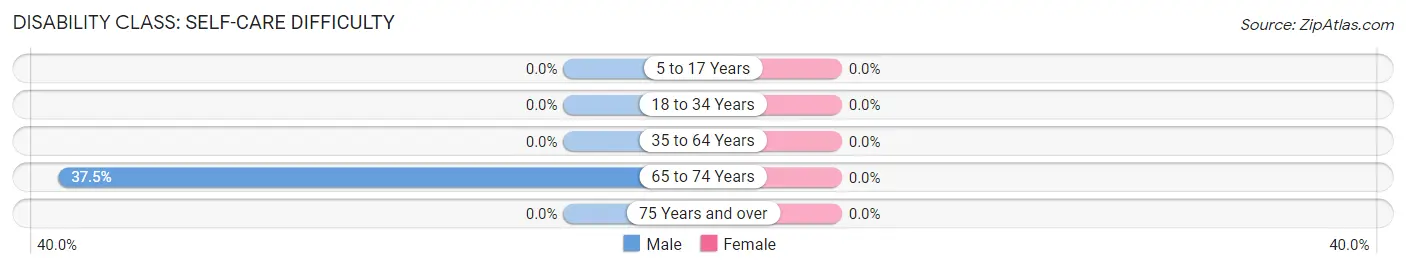
| Age Bracket | Male | Female |
| 5 to 17 Years | 0 (0.0%) | 0 (0.0%) |
| 18 to 34 Years | 0 (0.0%) | 0 (0.0%) |
| 35 to 64 Years | 0 (0.0%) | 0 (0.0%) |
| 65 to 74 Years | 3 (37.5%) | 0 (0.0%) |
| 75 Years and over | 0 (0.0%) | 0 (0.0%) |
Technology Access in Kickapoo Tribal Center
Computing Device Access in Kickapoo Tribal Center
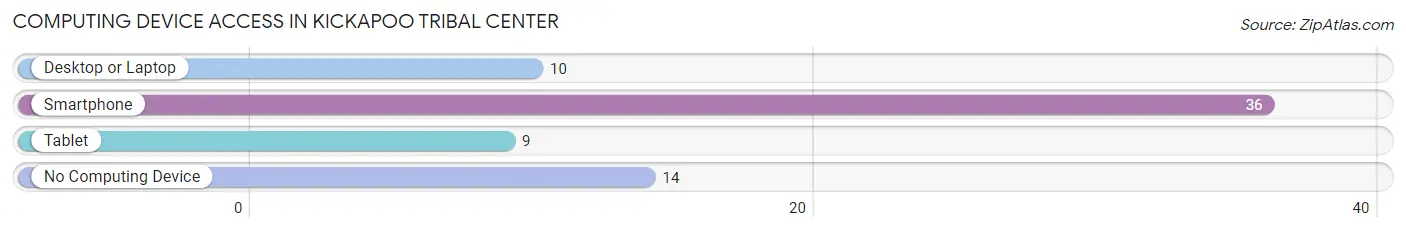
| Device Type | # Households | % Households |
| Desktop or Laptop | 10 | 20.0% |
| Smartphone | 36 | 72.0% |
| Tablet | 9 | 18.0% |
| No Computing Device | 14 | 28.0% |
| Total | 50 | 100.0% |
Internet Access in Kickapoo Tribal Center
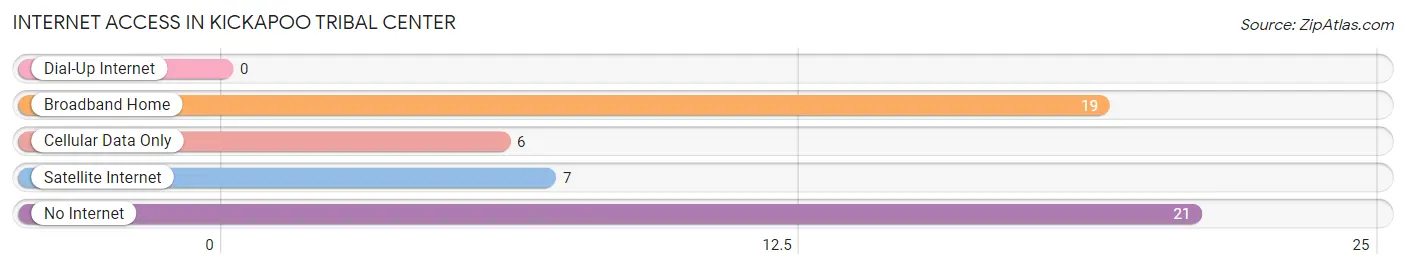
| Internet Type | # Households | % Households |
| Dial-Up Internet | 0 | 0.0% |
| Broadband Home | 19 | 38.0% |
| Cellular Data Only | 6 | 12.0% |
| Satellite Internet | 7 | 14.0% |
| No Internet | 21 | 42.0% |
| Total | 50 | 100.0% |
Kickapoo Tribal Center Summary
The Kickapoo Tribal Center is located in Brown County, Kansas, and is the headquarters of the Kickapoo Tribe of Indians of Kansas. The Kickapoo Tribe of Indians of Kansas is a federally recognized tribe of Native Americans, and is one of three federally recognized Kickapoo tribes in the United States. The Kickapoo Tribal Center is located on the Kickapoo Reservation, which is a reservation of the Kickapoo Tribe of Indians of Kansas. The Kickapoo Tribal Center is the administrative center of the Kickapoo Tribe of Indians of Kansas, and is responsible for the day-to-day operations of the tribe.
History
The Kickapoo Tribe of Indians of Kansas is a federally recognized tribe of Native Americans, and is one of three federally recognized Kickapoo tribes in the United States. The Kickapoo Tribe of Indians of Kansas is descended from the Kickapoo Tribe of Indians of Oklahoma, which was originally located in the Great Lakes region. The Kickapoo Tribe of Indians of Oklahoma was forcibly relocated to Oklahoma in the 1830s as part of the Indian Removal Act. The Kickapoo Tribe of Indians of Kansas was established in 1873, when the Kickapoo Tribe of Indians of Oklahoma was divided into two separate tribes. The Kickapoo Tribe of Indians of Kansas was established on a reservation in Brown County, Kansas.
The Kickapoo Tribal Center was established in the early 1900s, and is the administrative center of the Kickapoo Tribe of Indians of Kansas. The Kickapoo Tribal Center is responsible for the day-to-day operations of the tribe, and is the headquarters of the Kickapoo Tribe of Indians of Kansas. The Kickapoo Tribal Center is located on the Kickapoo Reservation, which is a reservation of the Kickapoo Tribe of Indians of Kansas.
Geography
The Kickapoo Tribal Center is located in Brown County, Kansas, and is situated on the Kickapoo Reservation. The Kickapoo Reservation is located in the northeastern corner of Kansas, and is bordered by the states of Nebraska and Missouri. The Kickapoo Reservation is approximately 1,000 square miles in size, and is home to the Kickapoo Tribe of Indians of Kansas. The Kickapoo Reservation is located in a rural area, and is primarily composed of rolling hills and prairies. The Kickapoo Reservation is home to a variety of wildlife, including deer, turkey, and quail.
Economy
The Kickapoo Tribe of Indians of Kansas is a federally recognized tribe, and is eligible for certain federal benefits and services. The Kickapoo Tribe of Indians of Kansas is also eligible for certain state benefits and services, including health care, education, and housing. The Kickapoo Tribe of Indians of Kansas is also eligible for certain tribal benefits and services, including tribal housing, tribal health care, and tribal education.
The Kickapoo Tribe of Indians of Kansas is also involved in a variety of economic activities, including agriculture, forestry, and tourism. The Kickapoo Tribe of Indians of Kansas operates a variety of businesses, including a casino, a gas station, and a convenience store. The Kickapoo Tribe of Indians of Kansas also operates a variety of cultural and recreational activities, including a powwow, a rodeo, and a cultural center.
Demographics
The Kickapoo Tribe of Indians of Kansas is composed of approximately 1,500 members, and is the smallest of the three federally recognized Kickapoo tribes in the United States. The Kickapoo Tribe of Indians of Kansas is composed of members from both the Kickapoo Tribe of Indians of Oklahoma and the Kickapoo Tribe of Indians of Texas. The Kickapoo Tribe of Indians of Kansas is a diverse tribe, and is composed of members from a variety of ethnic and racial backgrounds. The Kickapoo Tribe of Indians of Kansas is also composed of members from a variety of religious backgrounds, including Christianity, traditional Native American religions, and other faiths.
Common Questions
What is Per Capita Income in Kickapoo Tribal Center?
Per Capita income in Kickapoo Tribal Center is $11,588.
What is the Median Household income in Kickapoo Tribal Center?
Median Household Income in Kickapoo Tribal Center is $15,625.
What is Inequality or Gini Index in Kickapoo Tribal Center?
Inequality or Gini Index in Kickapoo Tribal Center is 0.53.
What is the Total Population of Kickapoo Tribal Center?
Total Population of Kickapoo Tribal Center is 130.
What is the Total Male Population of Kickapoo Tribal Center?
Total Male Population of Kickapoo Tribal Center is 79.
What is the Total Female Population of Kickapoo Tribal Center?
Total Female Population of Kickapoo Tribal Center is 51.
What is the Ratio of Males per 100 Females in Kickapoo Tribal Center?
There are 154.90 Males per 100 Females in Kickapoo Tribal Center.
What is the Ratio of Females per 100 Males in Kickapoo Tribal Center?
There are 64.56 Females per 100 Males in Kickapoo Tribal Center.
What is the Median Population Age in Kickapoo Tribal Center?
Median Population Age in Kickapoo Tribal Center is 50.0 Years.
What is the Average Family Size in Kickapoo Tribal Center
Average Family Size in Kickapoo Tribal Center is 4.8 People.
What is the Average Household Size in Kickapoo Tribal Center
Average Household Size in Kickapoo Tribal Center is 2.6 People.
How Large is the Labor Force in Kickapoo Tribal Center?
There are 51 People in the Labor Forcein in Kickapoo Tribal Center.
What is the Percentage of People in the Labor Force in Kickapoo Tribal Center?
47.7% of People are in the Labor Force in Kickapoo Tribal Center.
What is the Unemployment Rate in Kickapoo Tribal Center?
Unemployment Rate in Kickapoo Tribal Center is 5.9%.