Zip Codes with the Highest Percentage of Population with a Degree in Computers and Mathematics in the United States
RELATED REPORTS & OPTIONS
Computers and Mathematics
United States
Compare Zip Codes
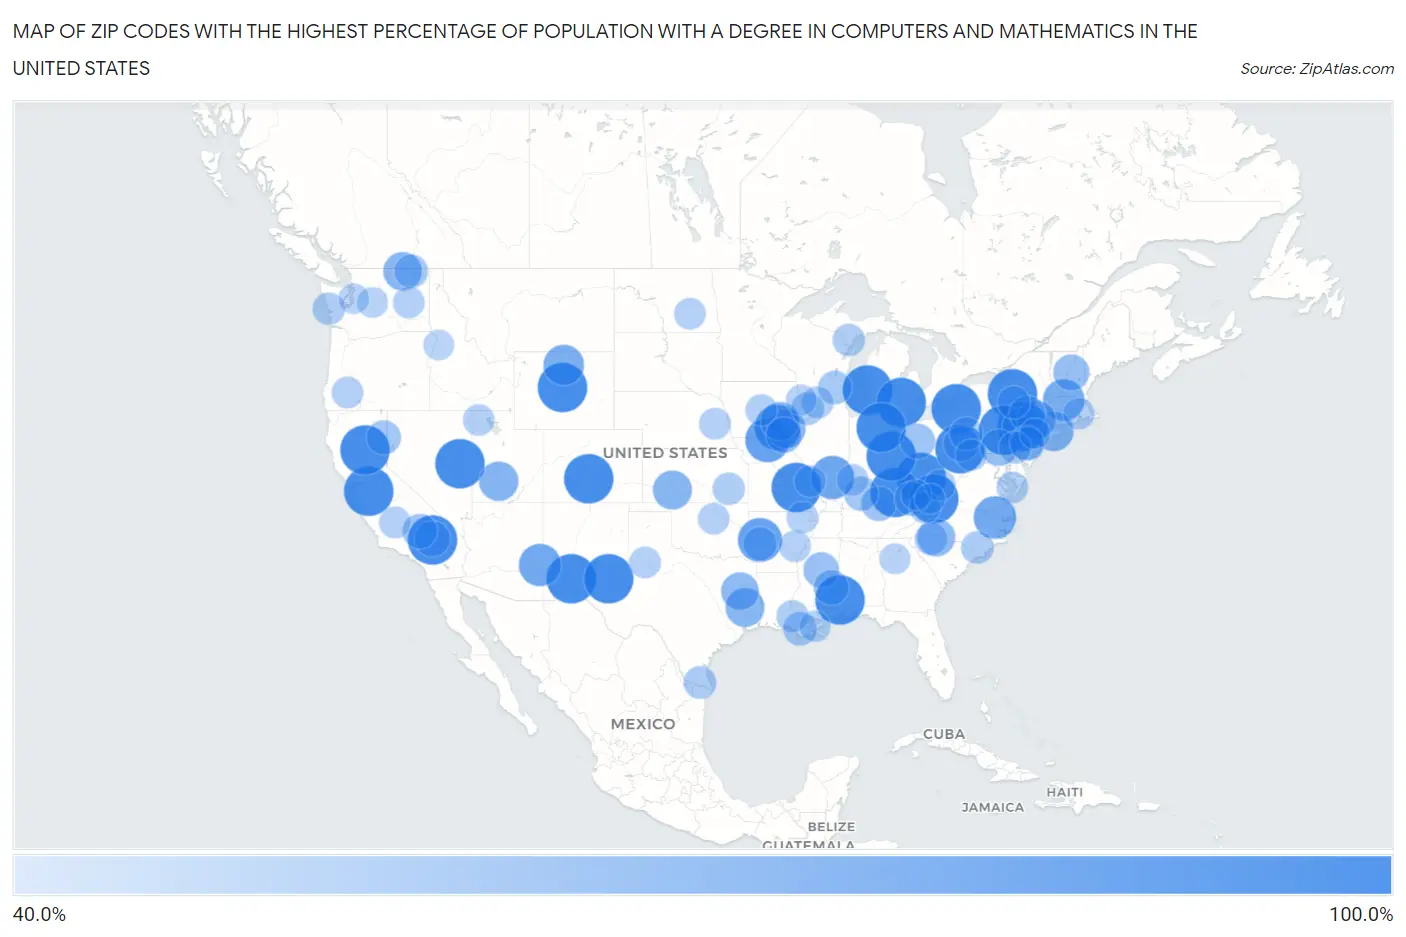
Map of Zip Codes with the Highest Percentage of Population with a Degree in Computers and Mathematics in the United States
40.0%
100.0%
Zip Codes with the Highest Percentage of Population with a Degree in Computers and Mathematics in the United States
| Zip Code | % Graduates | vs State | vs National | |
| 1. | 16563 | 100.0% | 4.6%(+95.4)#1 | 4.9%(+95.1)#1 |
| 2. | 25755 | 100.0% | 3.0%(+97.0)#1 | 4.9%(+95.1)#2 |
| 3. | 40404 | 100.0% | 3.8%(+96.2)#1 | 4.9%(+95.1)#3 |
| 4. | 92327 | 100.0% | 5.8%(+94.2)#1 | 4.9%(+95.1)#4 |
| 5. | 24866 | 100.0% | 3.0%(+97.0)#2 | 4.9%(+95.1)#5 |
| 6. | 95385 | 100.0% | 5.8%(+94.2)#2 | 4.9%(+95.1)#6 |
| 7. | 36583 | 100.0% | 4.4%(+95.6)#1 | 4.9%(+95.1)#7 |
| 8. | 65446 | 100.0% | 4.4%(+95.6)#1 | 4.9%(+95.1)#8 |
| 9. | 87940 | 100.0% | 3.7%(+96.3)#1 | 4.9%(+95.1)#9 |
| 10. | 81222 | 100.0% | 5.2%(+94.8)#1 | 4.9%(+95.1)#10 |
| 11. | 15489 | 100.0% | 4.6%(+95.4)#2 | 4.9%(+95.1)#11 |
| 12. | 45070 | 100.0% | 4.1%(+95.9)#1 | 4.9%(+95.1)#12 |
| 13. | 13138 | 100.0% | 4.7%(+95.3)#1 | 4.9%(+95.1)#13 |
| 14. | 49409 | 100.0% | 4.2%(+95.8)#1 | 4.9%(+95.1)#14 |
| 15. | 95978 | 100.0% | 5.8%(+94.2)#3 | 4.9%(+95.1)#15 |
| 16. | 48139 | 100.0% | 4.2%(+95.8)#2 | 4.9%(+95.1)#16 |
| 17. | 18323 | 100.0% | 4.6%(+95.4)#3 | 4.9%(+95.1)#17 |
| 18. | 89315 | 100.0% | 4.2%(+95.8)#1 | 4.9%(+95.1)#18 |
| 19. | 82642 | 100.0% | 2.6%(+97.4)#1 | 4.9%(+95.1)#19 |
| 20. | 46704 | 100.0% | 4.2%(+95.8)#1 | 4.9%(+95.1)#20 |
| 21. | 88254 | 100.0% | 3.7%(+96.3)#2 | 4.9%(+95.1)#21 |
| 22. | 17822 | 100.0% | 4.6%(+95.4)#4 | 4.9%(+95.1)#22 |
| 23. | 52566 | 88.9% | 3.7%(+85.2)#1 | 4.9%(+84.0)#23 |
| 24. | 64655 | 85.7% | 4.4%(+81.3)#2 | 4.9%(+80.8)#24 |
| 25. | 72841 | 84.8% | 4.0%(+80.7)#1 | 4.9%(+79.9)#25 |
| 26. | 62851 | 82.4% | 5.1%(+77.3)#1 | 4.9%(+77.5)#26 |
| 27. | 27847 | 80.2% | 5.0%(+75.2)#1 | 4.9%(+75.3)#27 |
| 28. | 85922 | 79.6% | 4.5%(+75.1)#1 | 4.9%(+74.7)#28 |
| 29. | 01380 | 77.8% | 5.3%(+72.5)#1 | 4.9%(+72.9)#29 |
| 30. | 82428 | 75.0% | 2.6%(+72.4)#2 | 4.9%(+70.1)#30 |
| 31. | 18349 | 74.6% | 4.6%(+70.1)#5 | 4.9%(+69.8)#31 |
| 32. | 11794 | 72.5% | 4.7%(+67.8)#2 | 4.9%(+67.7)#32 |
| 33. | 84743 | 71.4% | 5.5%(+65.9)#1 | 4.9%(+66.5)#33 |
| 34. | 10919 | 70.9% | 4.7%(+66.2)#3 | 4.9%(+66.0)#34 |
| 35. | 67843 | 70.6% | 4.0%(+66.6)#1 | 4.9%(+65.7)#35 |
| 36. | 75960 | 70.0% | 5.2%(+64.8)#1 | 4.9%(+65.1)#36 |
| 37. | 52557 | 69.5% | 3.7%(+65.8)#2 | 4.9%(+64.6)#37 |
| 38. | 50255 | 69.2% | 3.7%(+65.5)#3 | 4.9%(+64.3)#38 |
| 39. | 98859 | 68.8% | 7.0%(+61.8)#1 | 4.9%(+63.9)#39 |
| 40. | 29743 | 67.1% | 3.7%(+63.3)#1 | 4.9%(+62.2)#40 |
| 41. | 75764 | 66.7% | 5.2%(+61.5)#2 | 4.9%(+61.8)#41 |
| 42. | 17323 | 64.3% | 4.6%(+59.7)#6 | 4.9%(+59.4)#42 |
| 43. | 03238 | 62.5% | 4.9%(+57.6)#1 | 4.9%(+57.6)#43 |
| 44. | 12724 | 62.5% | 4.7%(+57.8)#4 | 4.9%(+57.6)#44 |
| 45. | 52570 | 61.5% | 3.7%(+57.9)#4 | 4.9%(+56.6)#45 |
| 46. | 39067 | 61.1% | 3.2%(+57.9)#1 | 4.9%(+56.2)#46 |
| 47. | 92398 | 60.9% | 5.8%(+55.1)#4 | 4.9%(+56.0)#47 |
| 48. | 15617 | 60.5% | 4.6%(+56.0)#7 | 4.9%(+55.6)#48 |
| 49. | 43350 | 60.0% | 4.1%(+55.9)#2 | 4.9%(+55.1)#49 |
| 50. | 39363 | 59.6% | 3.2%(+56.3)#2 | 4.9%(+54.7)#50 |
| 51. | 93528 | 58.8% | 5.8%(+53.0)#5 | 4.9%(+53.9)#51 |
| 52. | 42715 | 58.6% | 3.8%(+54.8)#2 | 4.9%(+53.7)#52 |
| 53. | 96117 | 57.6% | 5.8%(+51.8)#6 | 4.9%(+52.7)#53 |
| 54. | 42361 | 57.4% | 3.8%(+53.6)#3 | 4.9%(+52.6)#54 |
| 55. | 18912 | 57.1% | 4.6%(+52.6)#8 | 4.9%(+52.2)#55 |
| 56. | 18980 | 56.8% | 4.6%(+52.2)#9 | 4.9%(+51.9)#56 |
| 57. | 41751 | 56.5% | 3.8%(+52.7)#4 | 4.9%(+51.6)#57 |
| 58. | 70356 | 55.6% | 3.0%(+52.5)#1 | 4.9%(+50.7)#58 |
| 59. | 71965 | 55.6% | 4.0%(+51.5)#2 | 4.9%(+50.7)#59 |
| 60. | 53003 | 55.6% | 3.9%(+51.7)#1 | 4.9%(+50.7)#60 |
| 61. | 99160 | 55.6% | 7.0%(+48.6)#2 | 4.9%(+50.7)#61 |
| 62. | 16244 | 54.5% | 4.6%(+50.0)#10 | 4.9%(+49.7)#62 |
| 63. | 29373 | 53.3% | 3.7%(+49.6)#2 | 4.9%(+48.4)#63 |
| 64. | 52074 | 53.1% | 3.7%(+49.4)#5 | 4.9%(+48.2)#64 |
| 65. | 13863 | 53.1% | 4.7%(+48.3)#5 | 4.9%(+48.2)#65 |
| 66. | 78558 | 53.0% | 5.2%(+47.9)#3 | 4.9%(+48.1)#66 |
| 67. | 28434 | 52.9% | 5.0%(+47.9)#2 | 4.9%(+48.0)#67 |
| 68. | 98535 | 52.4% | 7.0%(+45.5)#3 | 4.9%(+47.5)#68 |
| 69. | 49863 | 52.4% | 4.2%(+48.1)#3 | 4.9%(+47.5)#69 |
| 70. | 19316 | 52.4% | 4.6%(+47.8)#11 | 4.9%(+47.5)#70 |
| 71. | 66777 | 52.3% | 4.0%(+48.3)#2 | 4.9%(+47.4)#71 |
| 72. | 70757 | 51.4% | 3.0%(+48.4)#2 | 4.9%(+46.5)#72 |
| 73. | 61050 | 51.0% | 5.1%(+45.9)#2 | 4.9%(+46.1)#73 |
| 74. | 79406 | 50.0% | 5.2%(+44.8)#4 | 4.9%(+45.1)#74 |
| 75. | 02912 | 50.0% | 3.9%(+46.1)#1 | 4.9%(+45.1)#75 |
| 76. | 50012 | 50.0% | 3.7%(+46.3)#6 | 4.9%(+45.1)#76 |
| 77. | 74077 | 50.0% | 3.4%(+46.6)#1 | 4.9%(+45.1)#77 |
| 78. | 93201 | 50.0% | 5.8%(+44.2)#7 | 4.9%(+45.1)#78 |
| 79. | 24270 | 50.0% | 6.6%(+43.4)#1 | 4.9%(+45.1)#79 |
| 80. | 23440 | 50.0% | 6.6%(+43.4)#2 | 4.9%(+45.1)#80 |
| 81. | 21543 | 50.0% | 7.0%(+43.0)#1 | 4.9%(+45.1)#81 |
| 82. | 72026 | 50.0% | 4.0%(+46.0)#3 | 4.9%(+45.1)#82 |
| 83. | 97484 | 50.0% | 3.9%(+46.1)#1 | 4.9%(+45.1)#83 |
| 84. | 47584 | 50.0% | 4.2%(+45.8)#2 | 4.9%(+45.1)#84 |
| 85. | 72449 | 50.0% | 4.0%(+46.0)#4 | 4.9%(+45.1)#85 |
| 86. | 58402 | 50.0% | 3.4%(+46.6)#1 | 4.9%(+45.1)#86 |
| 87. | 68001 | 50.0% | 3.8%(+46.2)#1 | 4.9%(+45.1)#87 |
| 88. | 84313 | 50.0% | 5.5%(+44.5)#2 | 4.9%(+45.1)#88 |
| 89. | 62256 | 50.0% | 5.1%(+44.9)#3 | 4.9%(+45.1)#89 |
| 90. | 99144 | 50.0% | 7.0%(+43.0)#4 | 4.9%(+45.1)#90 |
| 91. | 25866 | 48.7% | 3.0%(+45.7)#3 | 4.9%(+43.8)#91 |
| 92. | 70040 | 48.6% | 3.0%(+45.6)#3 | 4.9%(+43.8)#92 |
| 93. | 52039 | 47.7% | 3.7%(+44.0)#7 | 4.9%(+42.8)#93 |
| 94. | 30322 | 47.6% | 5.5%(+42.1)#1 | 4.9%(+42.7)#94 |
| 95. | 07961 | 47.6% | 6.2%(+41.5)#1 | 4.9%(+42.7)#95 |
| 96. | 98940 | 47.4% | 7.0%(+40.5)#5 | 4.9%(+42.5)#96 |
| 97. | 83547 | 47.2% | 3.5%(+43.6)#1 | 4.9%(+42.3)#97 |
| 98. | 41651 | 47.1% | 3.8%(+43.2)#5 | 4.9%(+42.2)#98 |
| 99. | 24622 | 46.9% | 6.6%(+40.3)#3 | 4.9%(+42.0)#99 |
| 100. | 98164 | 46.8% | 7.0%(+39.8)#6 | 4.9%(+41.9)#100 |
Common Questions
What are the Top 10 Zip Codes with the Highest Percentage of Population with a Degree in Computers and Mathematics in the United States?
Top 10 Zip Codes with the Highest Percentage of Population with a Degree in Computers and Mathematics in the United States are:
#1
100.0%
#2
100.0%
#3
100.0%
#4
100.0%
#5
100.0%
#6
100.0%
#7
100.0%
#8
100.0%
#9
100.0%
#10
100.0%
What zip code has the Highest Percentage of Population with a Degree in Computers and Mathematics in the United States?
16563 has the Highest Percentage of Population with a Degree in Computers and Mathematics in the United States with 100.0%.
What is the Percentage of Population with a Degree in Computers and Mathematics in the United States?
Percentage of Population with a Degree in Computers and Mathematics in the United States is 4.9%.