Earnings by Sex by Educational Attainment in Hyattville
Educational Attainment
Male Income
Female Income
Less than High School
-
-
High School Diploma
-
-
College or Associate's Degree
-
-
Bachelor's Degree
-
-
Graduate Degree
-
-
Total
-
-
Family Income in Hyattville
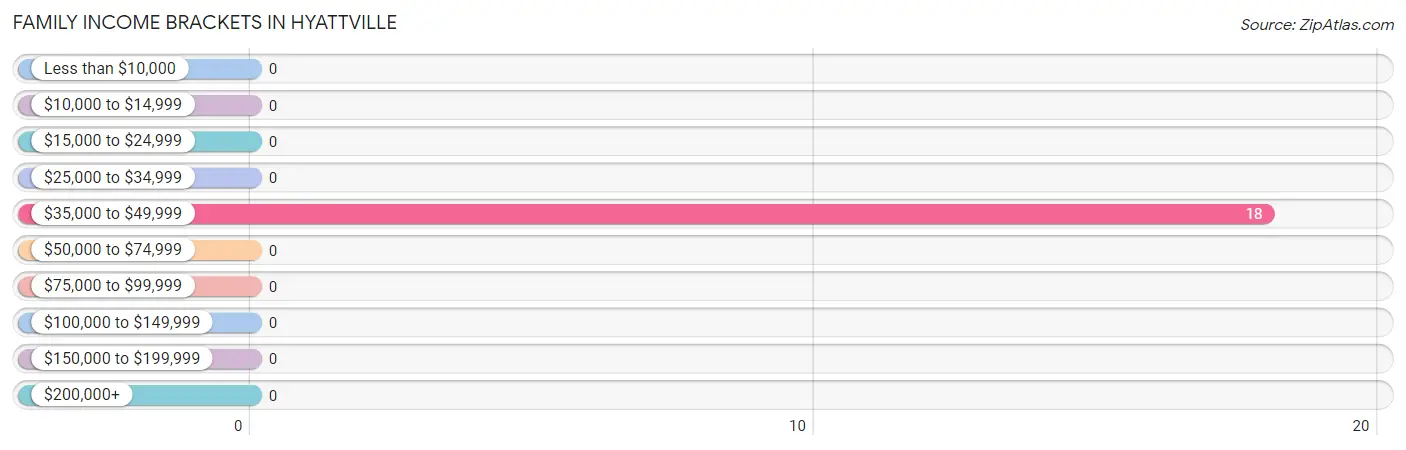
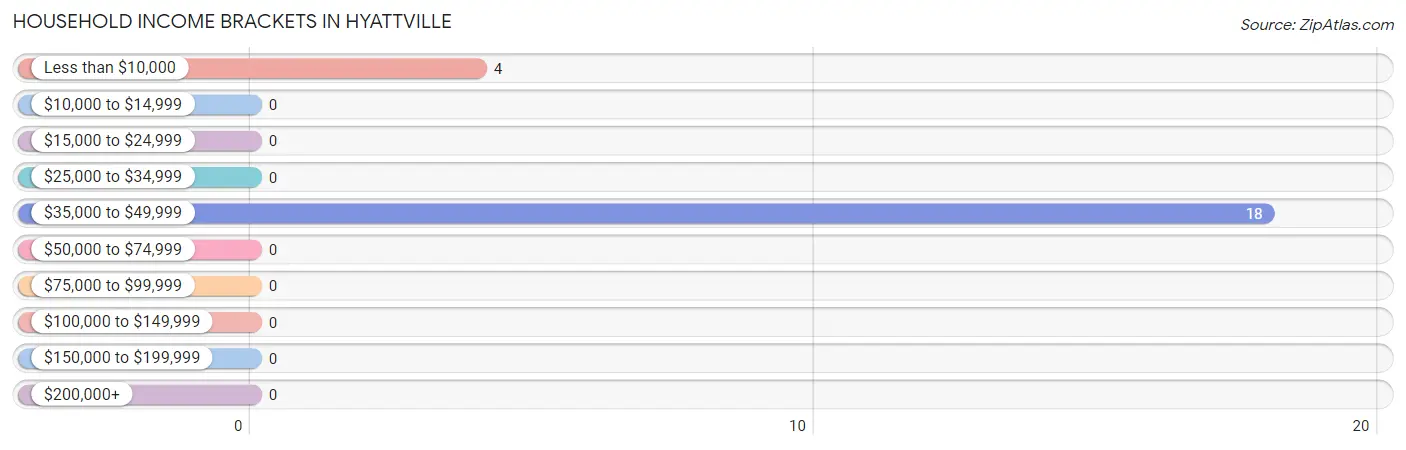
Family Income Brackets in Hyattville
According to the Hyattville family income data, there are 18 families falling into the $35,000 to $49,999 income range, which is the most common income bracket and makes up 100.0% of all families.
Income Bracket
# Families
% Families
Less than $10,000
0
0.0%
$10,000 to $14,999
0
0.0%
$15,000 to $24,999
0
0.0%
$25,000 to $34,999
0
0.0%
$35,000 to $49,999
18
100.0%
$50,000 to $74,999
0
0.0%
$75,000 to $99,999
0
0.0%
$100,000 to $149,999
0
0.0%
$150,000 to $199,999
0
0.0%
$200,000+
0
0.0%
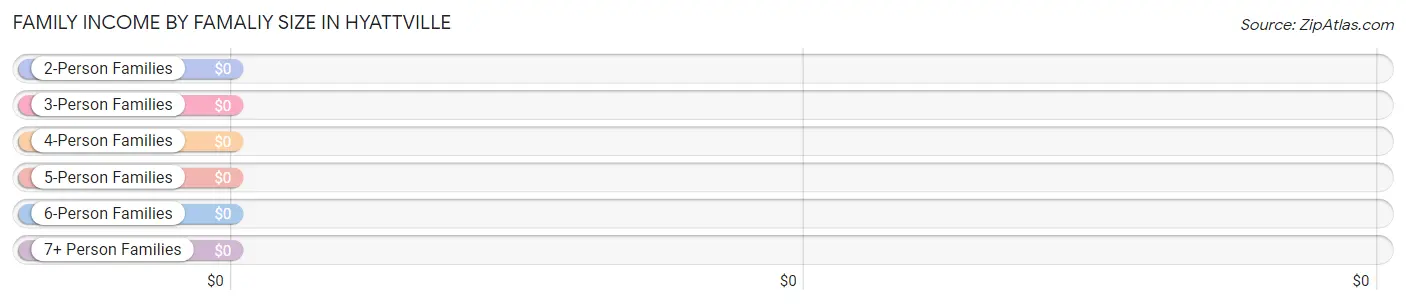
Family Income by Famaliy Size in Hyattville
Income Bracket
# Families
Median Income
2-Person Families
18 (100.0%)
$0
3-Person Families
0 (0.0%)
$0
4-Person Families
0 (0.0%)
$0
5-Person Families
0 (0.0%)
$0
6-Person Families
0 (0.0%)
$0
7+ Person Families
0 (0.0%)
$0
Total
18 (100.0%)
$0
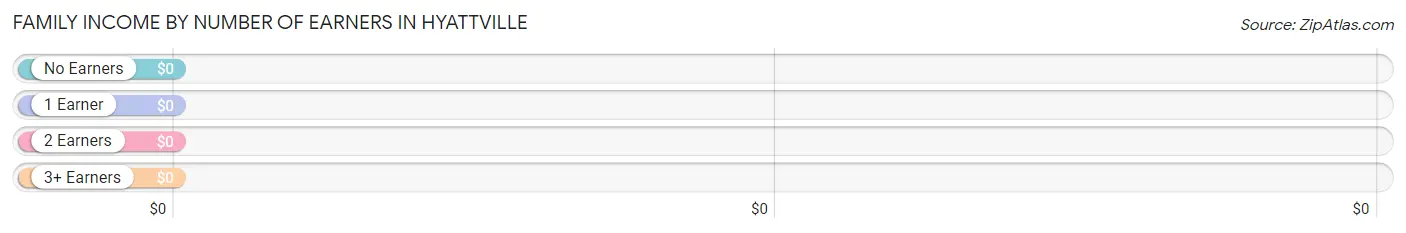
Family Income by Number of Earners in Hyattville
Number of Earners
# Families
Median Income
No Earners
18 (100.0%)
$0
1 Earner
0 (0.0%)
$0
2 Earners
0 (0.0%)
$0
3+ Earners
0 (0.0%)
$0
Total
18 (100.0%)
$0
Household Income in Hyattville
Household Income Brackets in Hyattville
With 18 households falling in the category, the $35,000 to $49,999 income range is the most frequent in Hyattville, accounting for 81.8% of all households.
Income Bracket
# Households
% Households
Less than $10,000
4
18.2%
$10,000 to $14,999
0
0.0%
$15,000 to $24,999
0
0.0%
$25,000 to $34,999
0
0.0%
$35,000 to $49,999
18
81.8%
$50,000 to $74,999
0
0.0%
$75,000 to $99,999
0
0.0%
$100,000 to $149,999
0
0.0%
$150,000 to $199,999
0
0.0%
$200,000+
0
0.0%
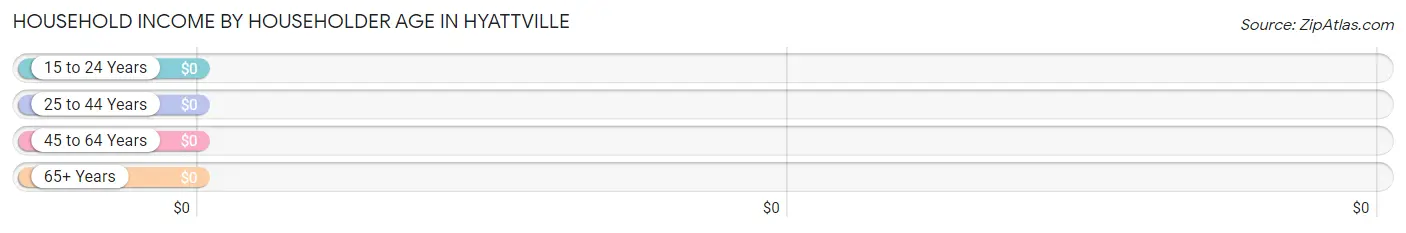
Household Income by Householder Age in Hyattville
Income Bracket
# Households
Median Income
15 to 24 Years
0 (0.0%)
$0
25 to 44 Years
0 (0.0%)
$0
45 to 64 Years
4 (18.2%)
$0
65+ Years
18 (81.8%)
$0
Total
22 (100.0%)
$40,536
Poverty in Hyattville
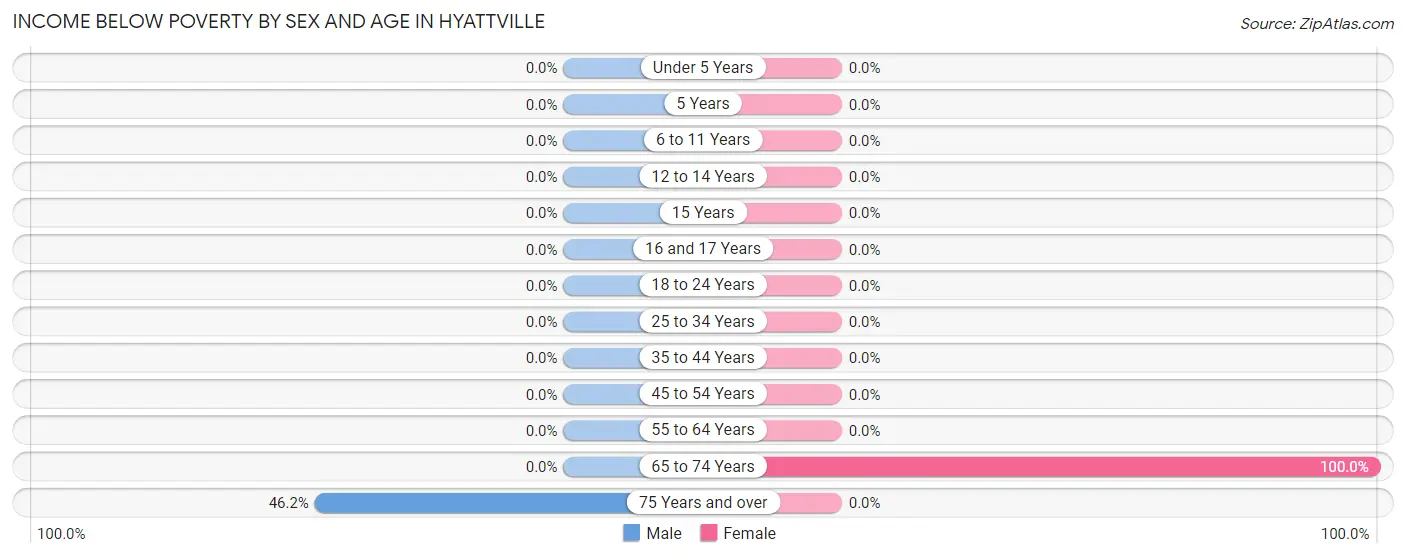
Income Below Poverty by Sex and Age in Hyattville
With 40.0% poverty level for males and 25.0% for females among the residents of Hyattville, 75 year old and over males and 65 to 74 year old females are the most vulnerable to poverty, with 12 males (46.2%) and 4 females (100.0%) in their respective age groups living below the poverty level.
Age Bracket
Male
Female
Under 5 Years
0 (0.0%)
0 (0.0%)
5 Years
0 (0.0%)
0 (0.0%)
6 to 11 Years
0 (0.0%)
0 (0.0%)
12 to 14 Years
0 (0.0%)
0 (0.0%)
15 Years
0 (0.0%)
0 (0.0%)
16 and 17 Years
0 (0.0%)
0 (0.0%)
18 to 24 Years
0 (0.0%)
0 (0.0%)
25 to 34 Years
0 (0.0%)
0 (0.0%)
35 to 44 Years
0 (0.0%)
0 (0.0%)
45 to 54 Years
0 (0.0%)
0 (0.0%)
55 to 64 Years
0 (0.0%)
0 (0.0%)
65 to 74 Years
0 (0.0%)
4 (100.0%)
75 Years and over
12 (46.2%)
0 (0.0%)
Total
12 (40.0%)
4 (25.0%)
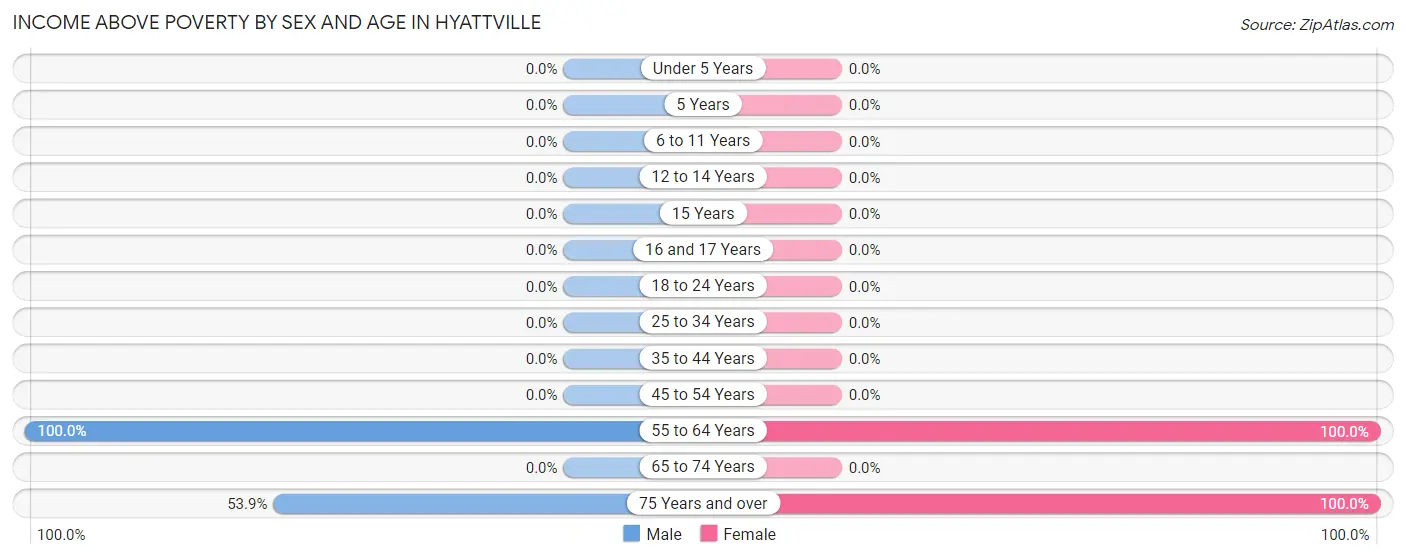
Income Above Poverty by Sex and Age in Hyattville
According to the poverty statistics in Hyattville, males aged 55 to 64 years and females aged 55 to 64 years are the age groups that are most secure financially, with 100.0% of males and 100.0% of females in these age groups living above the poverty line.
Age Bracket
Male
Female
Under 5 Years
0 (0.0%)
0 (0.0%)
5 Years
0 (0.0%)
0 (0.0%)
6 to 11 Years
0 (0.0%)
0 (0.0%)
12 to 14 Years
0 (0.0%)
0 (0.0%)
15 Years
0 (0.0%)
0 (0.0%)
16 and 17 Years
0 (0.0%)
0 (0.0%)
18 to 24 Years
0 (0.0%)
0 (0.0%)
25 to 34 Years
0 (0.0%)
0 (0.0%)
35 to 44 Years
0 (0.0%)
0 (0.0%)
45 to 54 Years
0 (0.0%)
0 (0.0%)
55 to 64 Years
4 (100.0%)
3 (100.0%)
65 to 74 Years
0 (0.0%)
0 (0.0%)
75 Years and over
14 (53.8%)
9 (100.0%)
Total
18 (60.0%)
12 (75.0%)
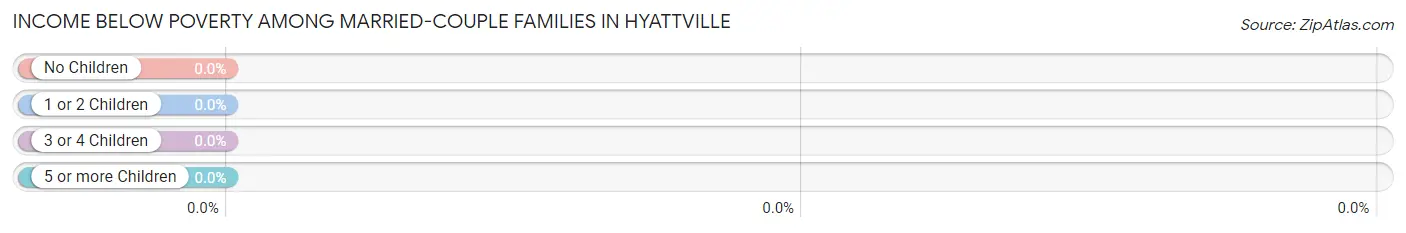
Income Below Poverty Among Married-Couple Families in Hyattville
Children
Above Poverty
Below Poverty
No Children
18 (100.0%)
0 (0.0%)
1 or 2 Children
0 (0.0%)
0 (0.0%)
3 or 4 Children
0 (0.0%)
0 (0.0%)
5 or more Children
0 (0.0%)
0 (0.0%)
Total
18 (100.0%)
0 (0.0%)
Income Below Poverty Among Single-Parent Households in Hyattville
Children
Single Father
Single Mother
No Children
0 (0.0%)
0 (0.0%)
1 or 2 Children
0 (0.0%)
0 (0.0%)
3 or 4 Children
0 (0.0%)
0 (0.0%)
5 or more Children
0 (0.0%)
0 (0.0%)
Total
0 (0.0%)
0 (0.0%)
Income Below Poverty Among Married-Couple vs Single-Parent Households in Hyattville
Children
Married-Couple Families
Single-Parent Households
No Children
0 (0.0%)
0 (0.0%)
1 or 2 Children
0 (0.0%)
0 (0.0%)
3 or 4 Children
0 (0.0%)
0 (0.0%)
5 or more Children
0 (0.0%)
0 (0.0%)
Total
0 (0.0%)
0 (0.0%)
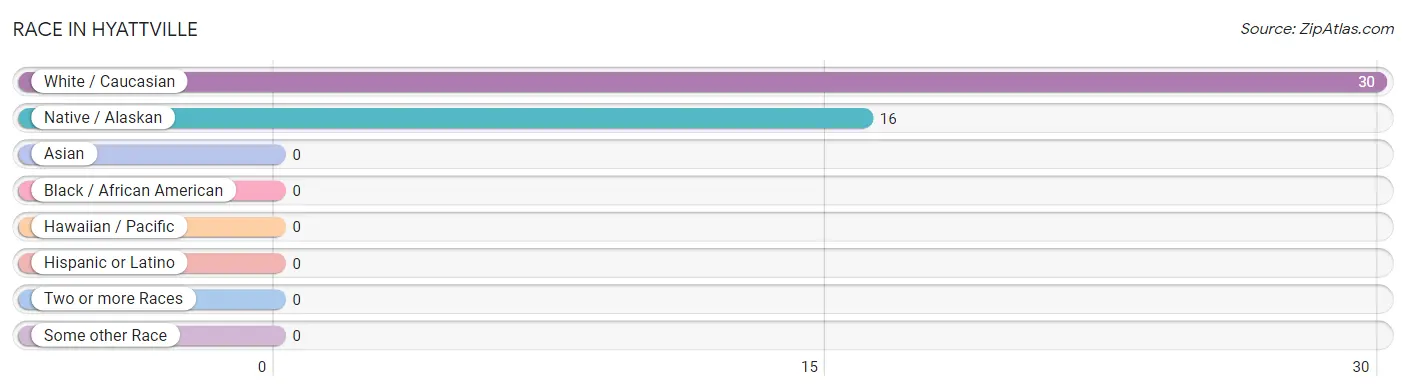
Race in Hyattville
The most populous races in Hyattville are White / Caucasian (30 | 65.2%), and Native / Alaskan (16 | 34.8%).
Race
# Population
% Population
Asian
0
0.0%
Black / African American
0
0.0%
Hawaiian / Pacific
0
0.0%
Hispanic or Latino
0
0.0%
Native / Alaskan
16
34.8%
White / Caucasian
30
65.2%
Two or more Races
0
0.0%
Some other Race
0
0.0%
Total
46
100.0%
Ancestry in Hyattville
The most populous ancestries reported in Hyattville are , and Inupiat (16 | 34.8%), together accounting for 34.8% of all Hyattville residents.
Ancestry
# Population
% Population
Inupiat
16
34.8%
View All 1 Rows
Immigrants in Hyattville
Immigration Origin
# Population
% Population
View All 0 Rows
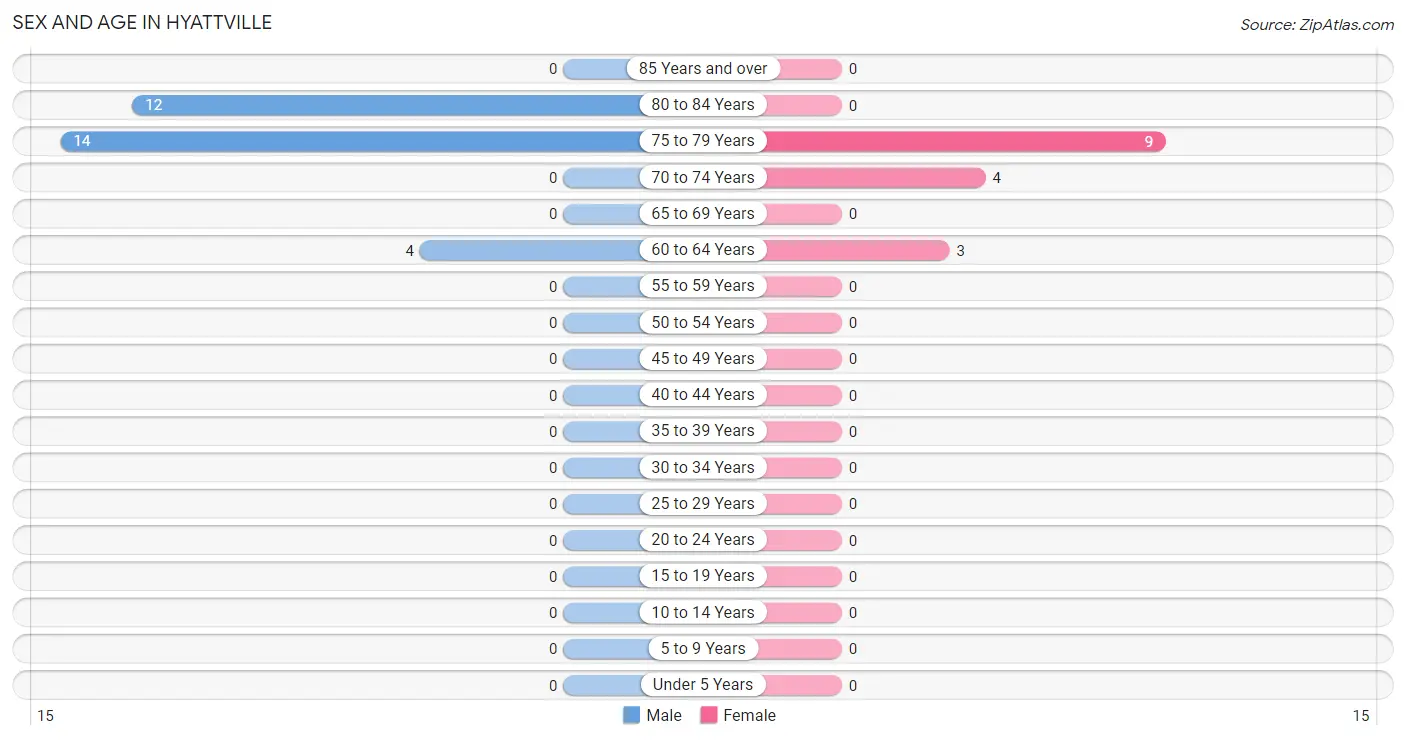
Sex and Age in Hyattville
Sex and Age in Hyattville
The most populous age groups in Hyattville are 75 to 79 Years (14 | 46.7%) for men and 75 to 79 Years (9 | 56.2%) for women.
Age Bracket
Male
Female
Under 5 Years
0 (0.0%)
0 (0.0%)
5 to 9 Years
0 (0.0%)
0 (0.0%)
10 to 14 Years
0 (0.0%)
0 (0.0%)
15 to 19 Years
0 (0.0%)
0 (0.0%)
20 to 24 Years
0 (0.0%)
0 (0.0%)
25 to 29 Years
0 (0.0%)
0 (0.0%)
30 to 34 Years
0 (0.0%)
0 (0.0%)
35 to 39 Years
0 (0.0%)
0 (0.0%)
40 to 44 Years
0 (0.0%)
0 (0.0%)
45 to 49 Years
0 (0.0%)
0 (0.0%)
50 to 54 Years
0 (0.0%)
0 (0.0%)
55 to 59 Years
0 (0.0%)
0 (0.0%)
60 to 64 Years
4 (13.3%)
3 (18.8%)
65 to 69 Years
0 (0.0%)
0 (0.0%)
70 to 74 Years
0 (0.0%)
4 (25.0%)
75 to 79 Years
14 (46.7%)
9 (56.2%)
80 to 84 Years
12 (40.0%)
0 (0.0%)
85 Years and over
0 (0.0%)
0 (0.0%)
Total
30 (100.0%)
16 (100.0%)
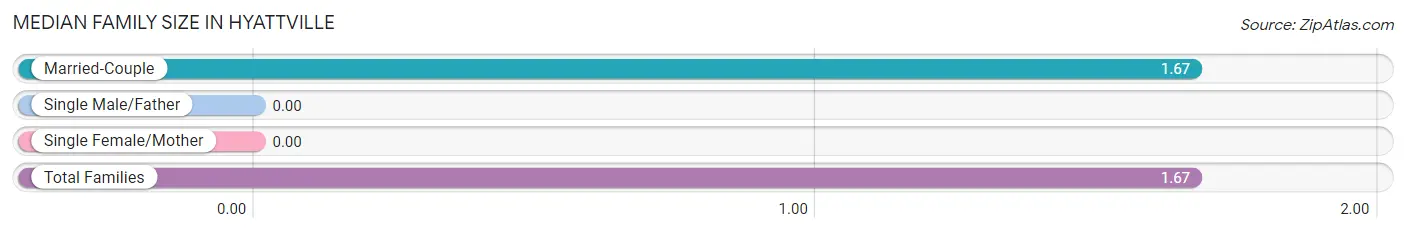
Families and Households in Hyattville
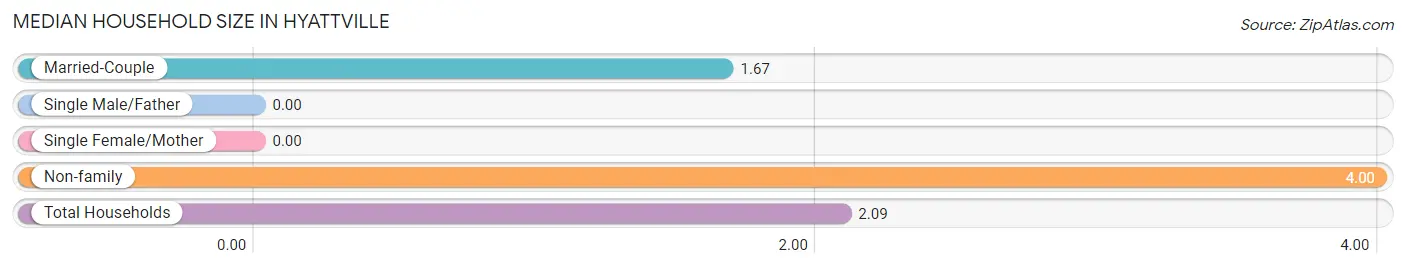
Median Family Size in Hyattville
Family Type
# Families
Family Size
Married-Couple
18 (100.0%)
1.67
Single Male/Father
0 (0.0%)
-
Single Female/Mother
0 (0.0%)
-
Total Families
18 (100.0%)
1.67
Median Household Size in Hyattville
Household Type
# Households
Household Size
Married-Couple
18 (81.8%)
1.67
Single Male/Father
0 (0.0%)
-
Single Female/Mother
0 (0.0%)
-
Non-family
4 (18.2%)
4.00
Total Households
22 (100.0%)
2.09
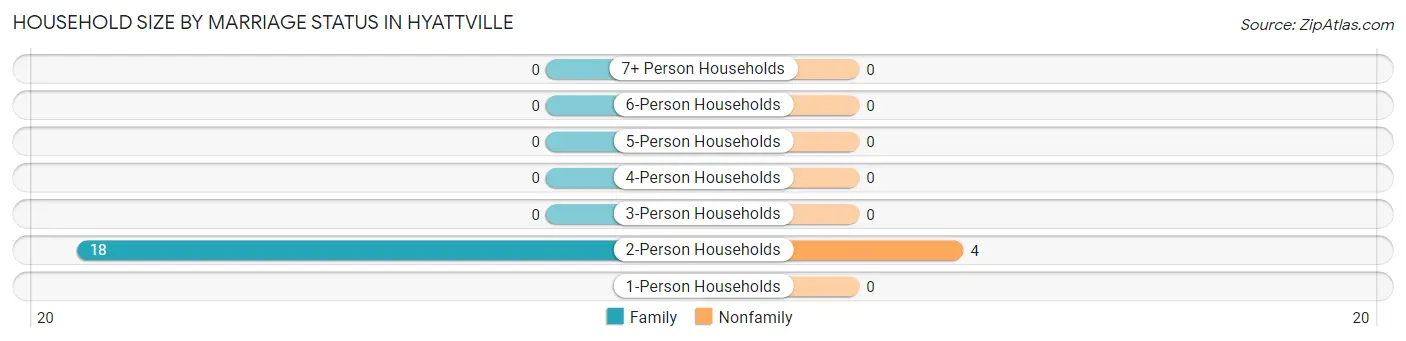
Household Size by Marriage Status in Hyattville
Out of a total of 22 households in Hyattville, 18 (81.8%) are family households, while 4 (18.2%) are nonfamily households. The most numerous type of family households are 2-person households, comprising 18, and the most common type of nonfamily households are 2-person households, comprising 4.
Household Size
Family Households
Nonfamily Households
1-Person Households
-
0 (0.0%)
2-Person Households
18 (81.8%)
4 (18.2%)
3-Person Households
0 (0.0%)
0 (0.0%)
4-Person Households
0 (0.0%)
0 (0.0%)
5-Person Households
0 (0.0%)
0 (0.0%)
6-Person Households
0 (0.0%)
0 (0.0%)
7+ Person Households
0 (0.0%)
0 (0.0%)
Total
18 (81.8%)
4 (18.2%)
Female Fertility in Hyattville
Fertility by Age in Hyattville
Age Bracket
Women with Births
Births / 1,000 Women
15 to 19 years
0 (0.0%)
0.0
20 to 34 years
0 (0.0%)
0.0
35 to 50 years
0 (0.0%)
0.0
Total
0 (0.0%)
0.0
Fertility by Age by Marriage Status in Hyattville
Age Bracket
Married
Unmarried
15 to 19 years
0 (0.0%)
0 (0.0%)
20 to 34 years
0 (0.0%)
0 (0.0%)
35 to 50 years
0 (0.0%)
0 (0.0%)
Total
0 (0.0%)
0 (0.0%)
Fertility by Education in Hyattville
Educational Attainment
Women with Births
Births / 1,000 Women
Less than High School
0 (0.0%)
0.0
High School Diploma
0 (0.0%)
0.0
College or Associate's Degree
0 (0.0%)
0.0
Bachelor's Degree
0 (0.0%)
0.0
Graduate Degree
0 (0.0%)
0.0
Total
0 (0.0%)
0.0
Fertility by Education by Marriage Status in Hyattville
Educational Attainment
Married
Unmarried
Less than High School
0 (0.0%)
0 (0.0%)
High School Diploma
0 (0.0%)
0 (0.0%)
College or Associate's Degree
0 (0.0%)
0 (0.0%)
Bachelor's Degree
0 (0.0%)
0 (0.0%)
Graduate Degree
0 (0.0%)
0 (0.0%)
Total
0 (0.0%)
0 (0.0%)
Employment Characteristics in Hyattville
Employment by Class of Employer in Hyattville
Employer Class
# Employees
% Employees
Private Company Employees
0
0.0%
Self-Employed (Incorporated)
0
0.0%
Self-Employed (Not Incorporated)
0
0.0%
Not-for-profit Organizations
0
0.0%
Local Government Employees
0
0.0%
State Government Employees
0
0.0%
Federal Government Employees
0
0.0%
Unpaid Family Workers
0
0.0%
Total
0
0.0%
Employment Status by Age in Hyattville
Age Bracket
In Labor Force
Unemployed
16 to 19 Years
0 (0.0%)
0 (0.0%)
20 to 24 Years
0 (0.0%)
0 (0.0%)
25 to 29 Years
0 (0.0%)
0 (0.0%)
30 to 34 Years
0 (0.0%)
0 (0.0%)
35 to 44 Years
0 (0.0%)
0 (0.0%)
45 to 54 Years
0 (0.0%)
0 (0.0%)
55 to 59 Years
0 (0.0%)
0 (0.0%)
60 to 64 Years
0 (0.0%)
0 (0.0%)
65 to 74 Years
0 (0.0%)
0 (0.0%)
75 Years and over
0 (0.0%)
0 (0.0%)
Total
0 (0.0%)
0 (0.0%)
Employment Status by Educational Attainment in Hyattville
Educational Attainment
In Labor Force
Unemployed
Less than High School
0 (0.0%)
0 (0.0%)
High School Diploma
0 (0.0%)
0 (0.0%)
College / Associate Degree
0 (0.0%)
0 (0.0%)
Bachelor's Degree or higher
0 (0.0%)
0 (0.0%)
Total
0 (0.0%)
0 (0.0%)
Employment Occupations by Sex in Hyattville
Management, Business, Science and Arts Occupations
Management, Business, Science and Arts Occupations by Sex
Occupation
Male
Female
Management
0 (0.0%)
0 (0.0%)
Business & Financial
0 (0.0%)
0 (0.0%)
Computers, Engineering & Science
0 (0.0%)
0 (0.0%)
Computers & Mathematics
0 (0.0%)
0 (0.0%)
Architecture & Engineering
0 (0.0%)
0 (0.0%)
Life, Physical & Social Science
0 (0.0%)
0 (0.0%)
Community & Social Service
0 (0.0%)
0 (0.0%)
Education, Arts & Media
0 (0.0%)
0 (0.0%)
Legal Services & Support
0 (0.0%)
0 (0.0%)
Education Instruction & Library
0 (0.0%)
0 (0.0%)
Arts, Media & Entertainment
0 (0.0%)
0 (0.0%)
Health Diagnosing & Treating
0 (0.0%)
0 (0.0%)
Health Technologists
0 (0.0%)
0 (0.0%)
Total (Category)
0 (0.0%)
0 (0.0%)
Total (Overall)
0 (0.0%)
0 (0.0%)
Services Occupations
Services Occupations by Sex
Occupation
Male
Female
Healthcare Support
0 (0.0%)
0 (0.0%)
Security & Protection
0 (0.0%)
0 (0.0%)
Firefighting & Prevention
0 (0.0%)
0 (0.0%)
Law Enforcement
0 (0.0%)
0 (0.0%)
Food Preparation & Serving
0 (0.0%)
0 (0.0%)
Cleaning & Maintenance
0 (0.0%)
0 (0.0%)
Personal Care & Service
0 (0.0%)
0 (0.0%)
Total (Category)
0 (0.0%)
0 (0.0%)
Total (Overall)
0 (0.0%)
0 (0.0%)
Sales and Office Occupations
Sales and Office Occupations by Sex
Occupation
Male
Female
Sales & Related
0 (0.0%)
0 (0.0%)
Office & Administration
0 (0.0%)
0 (0.0%)
Total (Category)
0 (0.0%)
0 (0.0%)
Total (Overall)
0 (0.0%)
0 (0.0%)
Natural Resources, Construction and Maintenance Occupations
Natural Resources, Construction and Maintenance Occupations by Sex
Occupation
Male
Female
Farming, Fishing & Forestry
0 (0.0%)
0 (0.0%)
Construction & Extraction
0 (0.0%)
0 (0.0%)
Installation, Maintenance & Repair
0 (0.0%)
0 (0.0%)
Total (Category)
0 (0.0%)
0 (0.0%)
Total (Overall)
0 (0.0%)
0 (0.0%)
Production, Transportation and Moving Occupations
Production, Transportation and Moving Occupations by Sex
Occupation
Male
Female
Production
0 (0.0%)
0 (0.0%)
Transportation
0 (0.0%)
0 (0.0%)
Material Moving
0 (0.0%)
0 (0.0%)
Total (Category)
0 (0.0%)
0 (0.0%)
Total (Overall)
0 (0.0%)
0 (0.0%)
Employment Industries by Sex in Hyattville
Employment Industries in Hyattville
Employment Industries by Sex in Hyattville
Industry
Male
Female
Agriculture, Fishing & Hunting
0 (0.0%)
0 (0.0%)
Mining, Quarrying, & Extraction
0 (0.0%)
0 (0.0%)
Construction
0 (0.0%)
0 (0.0%)
Manufacturing
0 (0.0%)
0 (0.0%)
Wholesale Trade
0 (0.0%)
0 (0.0%)
Retail Trade
0 (0.0%)
0 (0.0%)
Transportation & Warehousing
0 (0.0%)
0 (0.0%)
Utilities
0 (0.0%)
0 (0.0%)
Information
0 (0.0%)
0 (0.0%)
Finance & Insurance
0 (0.0%)
0 (0.0%)
Real Estate, Rental & Leasing
0 (0.0%)
0 (0.0%)
Professional & Scientific
0 (0.0%)
0 (0.0%)
Enterprise Management
0 (0.0%)
0 (0.0%)
Administrative & Support
0 (0.0%)
0 (0.0%)
Educational Services
0 (0.0%)
0 (0.0%)
Health Care & Social Assistance
0 (0.0%)
0 (0.0%)
Arts, Entertainment & Recreation
0 (0.0%)
0 (0.0%)
Accommodation & Food Services
0 (0.0%)
0 (0.0%)
Public Administration
0 (0.0%)
0 (0.0%)
Total
0 (0.0%)
0 (0.0%)
Education in Hyattville
School Enrollment in Hyattville
School Level
# Students
% Students
Nursery / Preschool
0
0.0%
Kindergarten
0
0.0%
Elementary School
0
0.0%
Middle School
0
0.0%
High School
0
0.0%
College / Undergraduate
0
0.0%
Graduate / Professional
0
0.0%
Total
0
0.0%
School Enrollment by Age by Funding Source in Hyattville
Age Bracket
Public School
Private School
3 to 4 Year Olds
0 (0.0%)
0 (0.0%)
5 to 9 Year Old
0 (0.0%)
0 (0.0%)
10 to 14 Year Olds
0 (0.0%)
0 (0.0%)
15 to 17 Year Olds
0 (0.0%)
0 (0.0%)
18 to 19 Year Olds
0 (0.0%)
0 (0.0%)
20 to 24 Year Olds
0 (0.0%)
0 (0.0%)
25 to 34 Year Olds
0 (0.0%)
0 (0.0%)
35 Years and over
0 (0.0%)
0 (0.0%)
Total
0 (0.0%)
0 (0.0%)
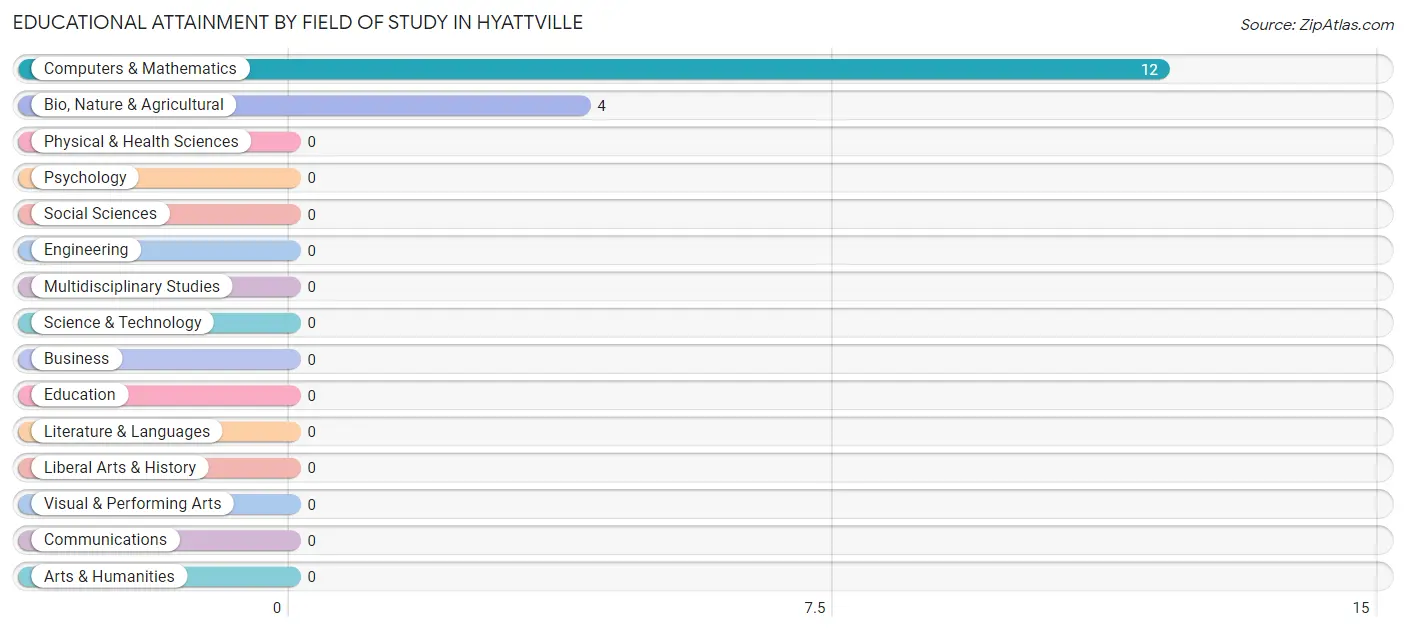
Educational Attainment by Field of Study in Hyattville
Computers & mathematics (12 | 75.0%), and bio, nature & agricultural (4 | 25.0%) are the most common fields of study among 16 individuals in Hyattville who have obtained a bachelor's degree or higher.
Field of Study
# Graduates
% Graduates
Computers & Mathematics
12
75.0%
Bio, Nature & Agricultural
4
25.0%
Physical & Health Sciences
0
0.0%
Psychology
0
0.0%
Social Sciences
0
0.0%
Engineering
0
0.0%
Multidisciplinary Studies
0
0.0%
Science & Technology
0
0.0%
Business
0
0.0%
Education
0
0.0%
Literature & Languages
0
0.0%
Liberal Arts & History
0
0.0%
Visual & Performing Arts
0
0.0%
Communications
0
0.0%
Arts & Humanities
0
0.0%
Total
16
100.0%
Transportation & Commute in Hyattville
Vehicle Availability by Sex in Hyattville
Vehicles Available
Male
Female
No Vehicle
0 (0.0%)
0 (0.0%)
1 Vehicle
0 (0.0%)
0 (0.0%)
2 Vehicles
0 (0.0%)
0 (0.0%)
3 Vehicles
0 (0.0%)
0 (0.0%)
4 Vehicles
0 (0.0%)
0 (0.0%)
5 or more Vehicles
0 (0.0%)
0 (0.0%)
Total
0 (0.0%)
0 (0.0%)
Commute Time in Hyattville
Commute Time
# Commuters
% Commuters
Less than 5 Minutes
0
0.0%
5 to 9 Minutes
0
0.0%
10 to 14 Minutes
0
0.0%
15 to 19 Minutes
0
0.0%
20 to 24 Minutes
0
0.0%
25 to 29 Minutes
0
0.0%
30 to 34 Minutes
0
0.0%
35 to 39 Minutes
0
0.0%
40 to 44 Minutes
0
0.0%
45 to 59 Minutes
0
0.0%
60 to 89 Minutes
0
0.0%
90 or more Minutes
0
0.0%
Commute Time by Sex in Hyattville
Commute Time
Male
Female
Less than 5 Minutes
0 (0.0%)
0 (0.0%)
5 to 9 Minutes
0 (0.0%)
0 (0.0%)
10 to 14 Minutes
0 (0.0%)
0 (0.0%)
15 to 19 Minutes
0 (0.0%)
0 (0.0%)
20 to 24 Minutes
0 (0.0%)
0 (0.0%)
25 to 29 Minutes
0 (0.0%)
0 (0.0%)
30 to 34 Minutes
0 (0.0%)
0 (0.0%)
35 to 39 Minutes
0 (0.0%)
0 (0.0%)
40 to 44 Minutes
0 (0.0%)
0 (0.0%)
45 to 59 Minutes
0 (0.0%)
0 (0.0%)
60 to 89 Minutes
0 (0.0%)
0 (0.0%)
90 or more Minutes
0 (0.0%)
0 (0.0%)
Time of Departure to Work by Sex in Hyattville
Time of Departure
Male
Female
12:00 AM to 4:59 AM
0 (0.0%)
0 (0.0%)
5:00 AM to 5:29 AM
0 (0.0%)
0 (0.0%)
5:30 AM to 5:59 AM
0 (0.0%)
0 (0.0%)
6:00 AM to 6:29 AM
0 (0.0%)
0 (0.0%)
6:30 AM to 6:59 AM
0 (0.0%)
0 (0.0%)
7:00 AM to 7:29 AM
0 (0.0%)
0 (0.0%)
7:30 AM to 7:59 AM
0 (0.0%)
0 (0.0%)
8:00 AM to 8:29 AM
0 (0.0%)
0 (0.0%)
8:30 AM to 8:59 AM
0 (0.0%)
0 (0.0%)
9:00 AM to 9:59 AM
0 (0.0%)
0 (0.0%)
10:00 AM to 10:59 AM
0 (0.0%)
0 (0.0%)
11:00 AM to 11:59 AM
0 (0.0%)
0 (0.0%)
12:00 PM to 3:59 PM
0 (0.0%)
0 (0.0%)
4:00 PM to 11:59 PM
0 (0.0%)
0 (0.0%)
Total
0 (0.0%)
0 (0.0%)
Housing Occupancy in Hyattville
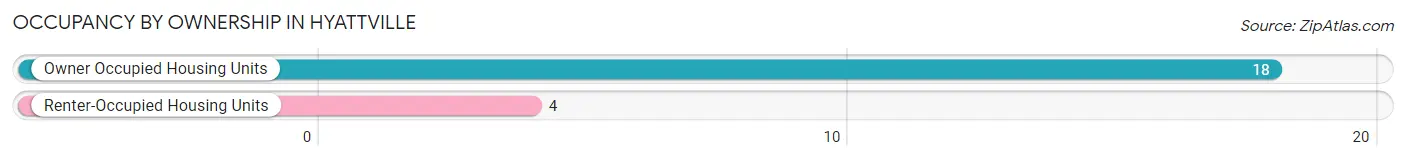
Occupancy by Ownership in Hyattville
Of the total 22 dwellings in Hyattville, owner-occupied units account for 18 (81.8%), while renter-occupied units make up 4 (18.2%).
Occupancy
# Housing Units
% Housing Units
Owner Occupied Housing Units
18
81.8%
Renter-Occupied Housing Units
4
18.2%
Total Occupied Housing Units
22
100.0%
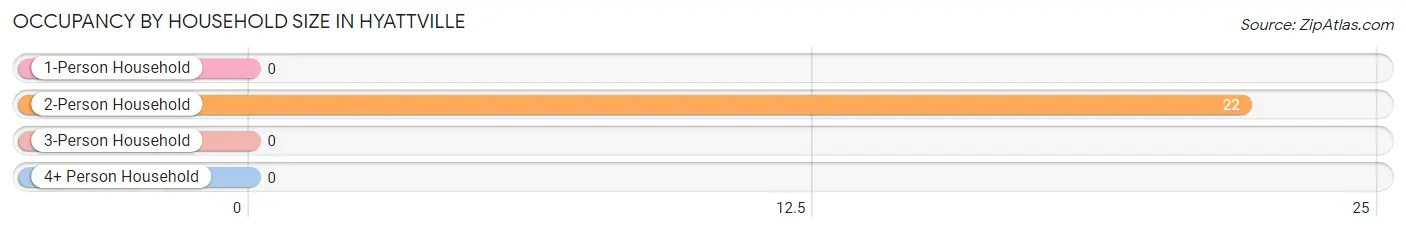
Occupancy by Household Size in Hyattville
Household Size
# Housing Units
% Housing Units
1-Person Household
0
0.0%
2-Person Household
22
100.0%
3-Person Household
0
0.0%
4+ Person Household
0
0.0%
Total Housing Units
22
100.0%
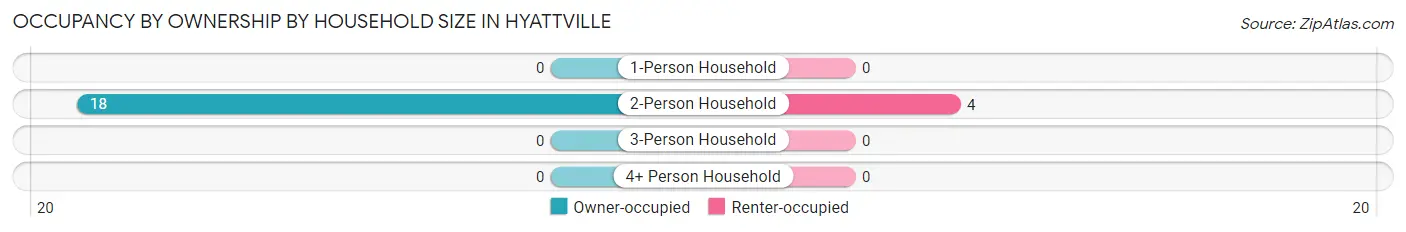
Occupancy by Ownership by Household Size in Hyattville
Household Size
Owner-occupied
Renter-occupied
1-Person Household
0 (0.0%)
0 (0.0%)
2-Person Household
18 (81.8%)
4 (18.2%)
3-Person Household
0 (0.0%)
0 (0.0%)
4+ Person Household
0 (0.0%)
0 (0.0%)
Total Housing Units
18 (81.8%)
4 (18.2%)
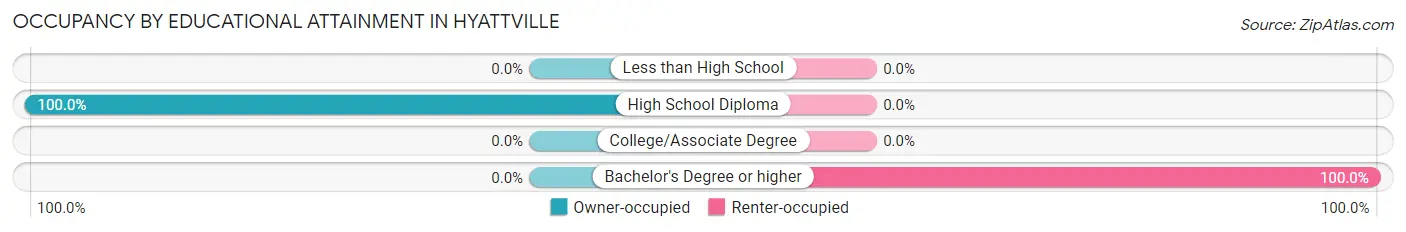
Occupancy by Educational Attainment in Hyattville
Household Size
Owner-occupied
Renter-occupied
Less than High School
0 (0.0%)
0 (0.0%)
High School Diploma
18 (100.0%)
0 (0.0%)
College/Associate Degree
0 (0.0%)
0 (0.0%)
Bachelor's Degree or higher
0 (0.0%)
4 (100.0%)
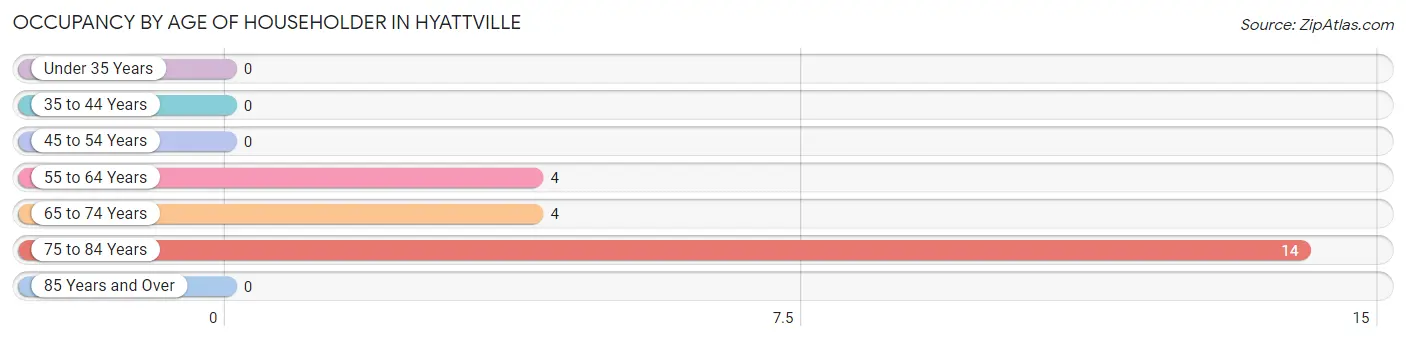
Occupancy by Age of Householder in Hyattville
Age Bracket
# Households
% Households
Under 35 Years
0
0.0%
35 to 44 Years
0
0.0%
45 to 54 Years
0
0.0%
55 to 64 Years
4
18.2%
65 to 74 Years
4
18.2%
75 to 84 Years
14
63.6%
85 Years and Over
0
0.0%
Total
22
100.0%
Housing Finances in Hyattville
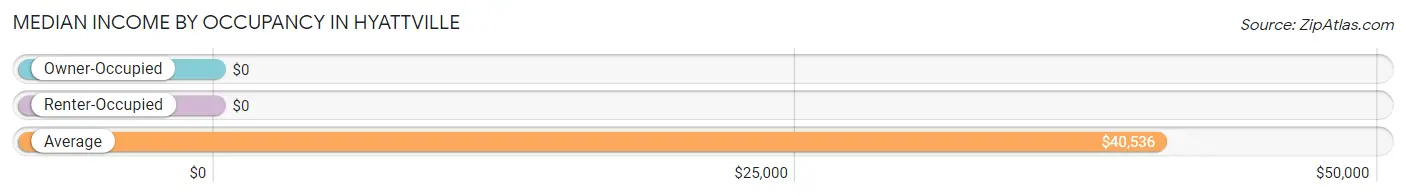
Median Income by Occupancy in Hyattville
Occupancy Type
# Households
Median Income
Owner-Occupied
18 (81.8%)
$0
Renter-Occupied
4 (18.2%)
$0
Average
22 (100.0%)
$40,536
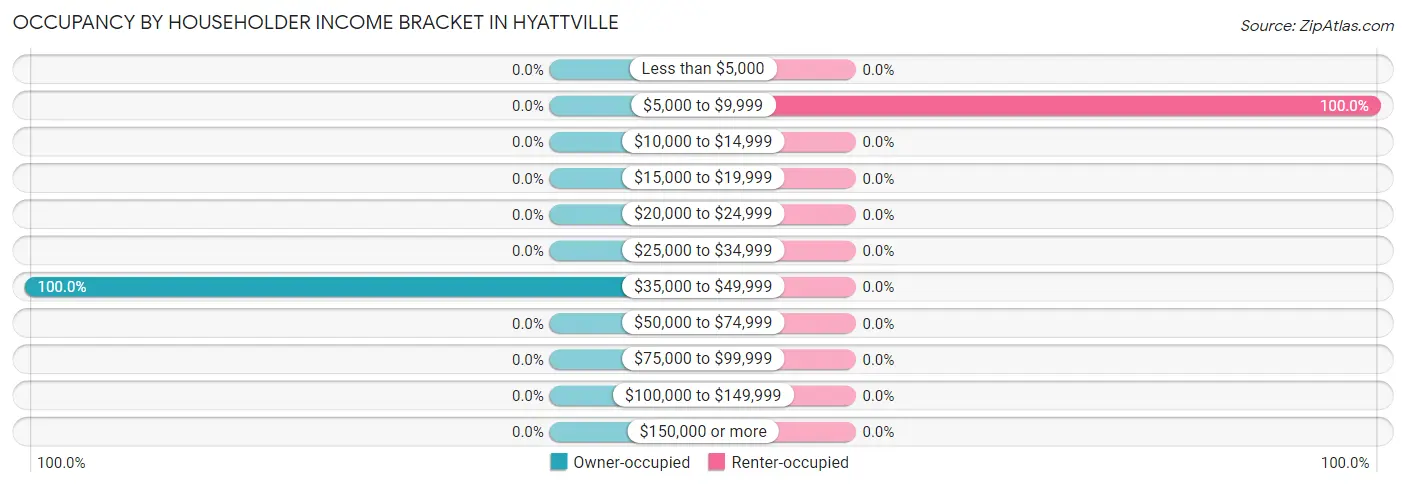
Occupancy by Householder Income Bracket in Hyattville
Income Bracket
Owner-occupied
Renter-occupied
Less than $5,000
0 (0.0%)
0 (0.0%)
$5,000 to $9,999
0 (0.0%)
4 (100.0%)
$10,000 to $14,999
0 (0.0%)
0 (0.0%)
$15,000 to $19,999
0 (0.0%)
0 (0.0%)
$20,000 to $24,999
0 (0.0%)
0 (0.0%)
$25,000 to $34,999
0 (0.0%)
0 (0.0%)
$35,000 to $49,999
18 (100.0%)
0 (0.0%)
$50,000 to $74,999
0 (0.0%)
0 (0.0%)
$75,000 to $99,999
0 (0.0%)
0 (0.0%)
$100,000 to $149,999
0 (0.0%)
0 (0.0%)
$150,000 or more
0 (0.0%)
0 (0.0%)
Total
18 (100.0%)
4 (100.0%)
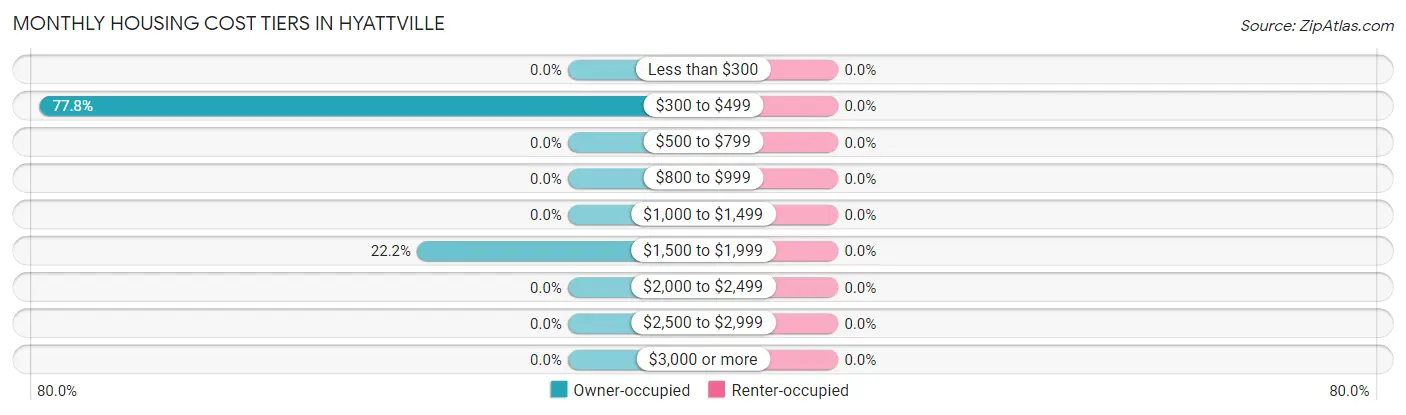
Monthly Housing Cost Tiers in Hyattville
Monthly Cost
Owner-occupied
Renter-occupied
Less than $300
0 (0.0%)
0 (0.0%)
$300 to $499
14 (77.8%)
0 (0.0%)
$500 to $799
0 (0.0%)
0 (0.0%)
$800 to $999
0 (0.0%)
0 (0.0%)
$1,000 to $1,499
0 (0.0%)
0 (0.0%)
$1,500 to $1,999
4 (22.2%)
0 (0.0%)
$2,000 to $2,499
0 (0.0%)
0 (0.0%)
$2,500 to $2,999
0 (0.0%)
0 (0.0%)
$3,000 or more
0 (0.0%)
0 (0.0%)
Total
18 (100.0%)
4 (100.0%)
Physical Housing Characteristics in Hyattville
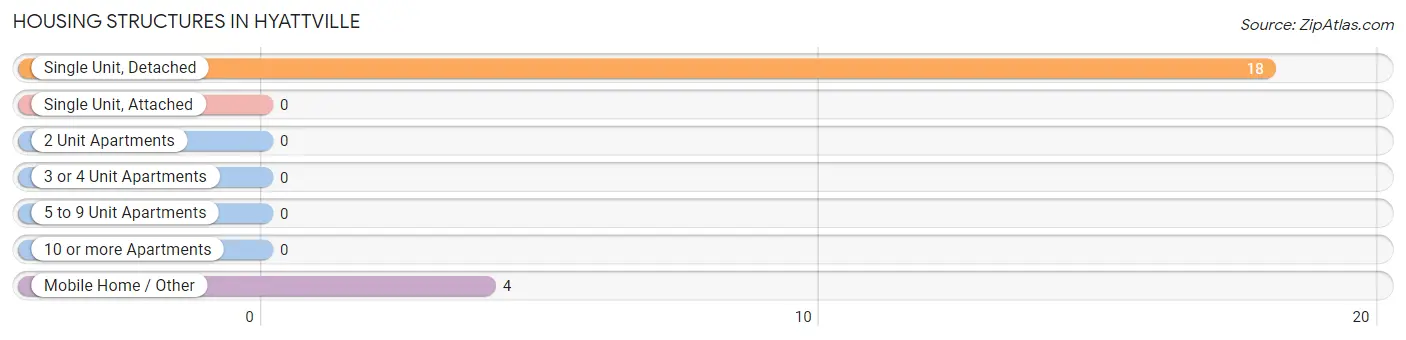
Housing Structures in Hyattville
Structure Type
# Housing Units
% Housing Units
Single Unit, Detached
18
81.8%
Single Unit, Attached
0
0.0%
2 Unit Apartments
0
0.0%
3 or 4 Unit Apartments
0
0.0%
5 to 9 Unit Apartments
0
0.0%
10 or more Apartments
0
0.0%
Mobile Home / Other
4
18.2%
Total
22
100.0%
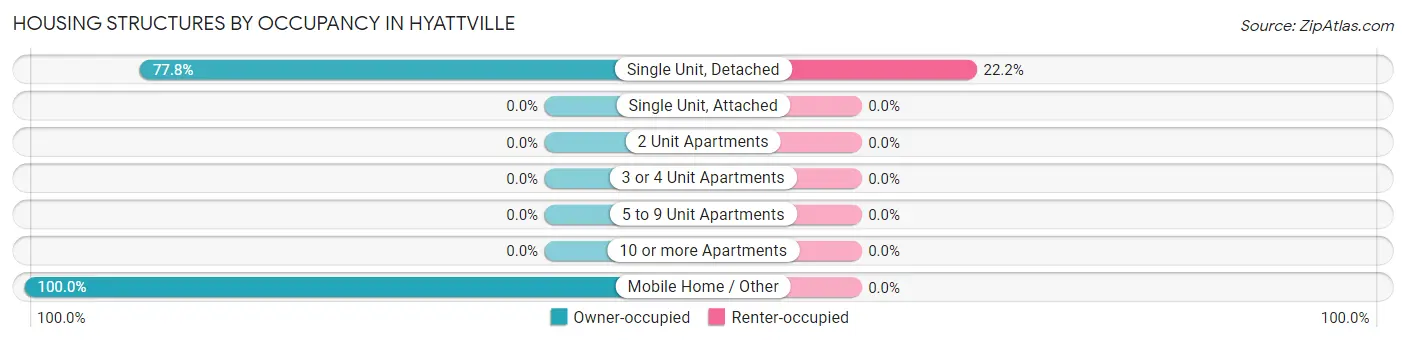
Housing Structures by Occupancy in Hyattville
Structure Type
Owner-occupied
Renter-occupied
Single Unit, Detached
14 (77.8%)
4 (22.2%)
Single Unit, Attached
0 (0.0%)
0 (0.0%)
2 Unit Apartments
0 (0.0%)
0 (0.0%)
3 or 4 Unit Apartments
0 (0.0%)
0 (0.0%)
5 to 9 Unit Apartments
0 (0.0%)
0 (0.0%)
10 or more Apartments
0 (0.0%)
0 (0.0%)
Mobile Home / Other
4 (100.0%)
0 (0.0%)
Total
18 (81.8%)
4 (18.2%)
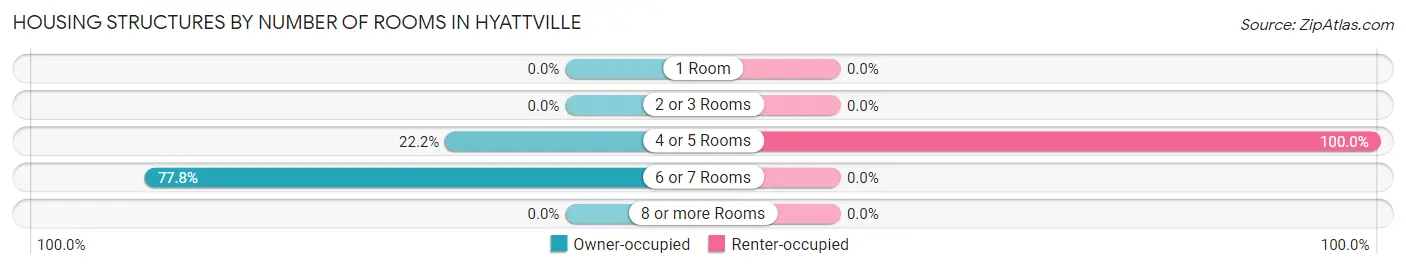
Housing Structures by Number of Rooms in Hyattville
Number of Rooms
Owner-occupied
Renter-occupied
1 Room
0 (0.0%)
0 (0.0%)
2 or 3 Rooms
0 (0.0%)
0 (0.0%)
4 or 5 Rooms
4 (22.2%)
4 (100.0%)
6 or 7 Rooms
14 (77.8%)
0 (0.0%)
8 or more Rooms
0 (0.0%)
0 (0.0%)
Total
18 (100.0%)
4 (100.0%)
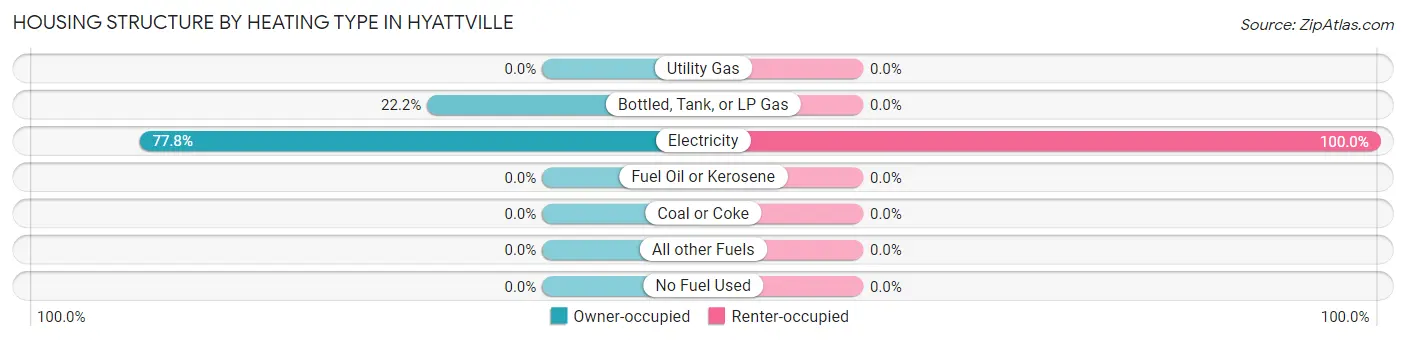
Housing Structure by Heating Type in Hyattville
Heating Type
Owner-occupied
Renter-occupied
Utility Gas
0 (0.0%)
0 (0.0%)
Bottled, Tank, or LP Gas
4 (22.2%)
0 (0.0%)
Electricity
14 (77.8%)
4 (100.0%)
Fuel Oil or Kerosene
0 (0.0%)
0 (0.0%)
Coal or Coke
0 (0.0%)
0 (0.0%)
All other Fuels
0 (0.0%)
0 (0.0%)
No Fuel Used
0 (0.0%)
0 (0.0%)
Total
18 (100.0%)
4 (100.0%)
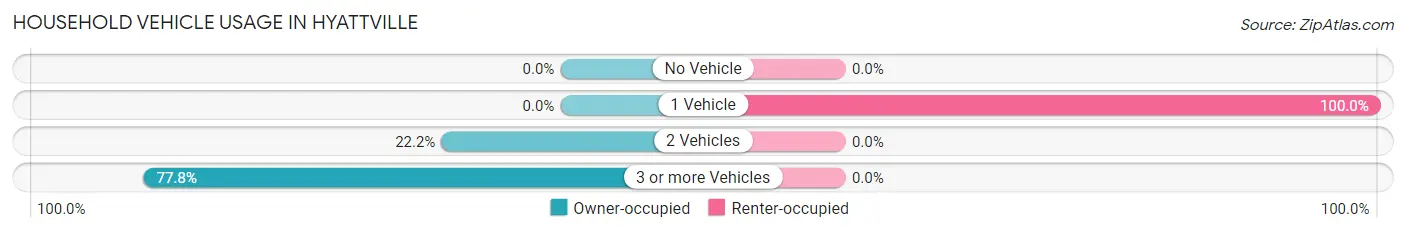
Household Vehicle Usage in Hyattville
Vehicles per Household
Owner-occupied
Renter-occupied
No Vehicle
0 (0.0%)
0 (0.0%)
1 Vehicle
0 (0.0%)
4 (100.0%)
2 Vehicles
4 (22.2%)
0 (0.0%)
3 or more Vehicles
14 (77.8%)
0 (0.0%)
Total
18 (100.0%)
4 (100.0%)
Real Estate & Mortgages in Hyattville
Real Estate and Mortgage Overview in Hyattville
Characteristic
Without Mortgage
With Mortgage
Housing Units
14
4
Median Property Value
-
-
Median Household Income
-
-
Monthly Housing Costs
-
-
Real Estate Taxes
-
-
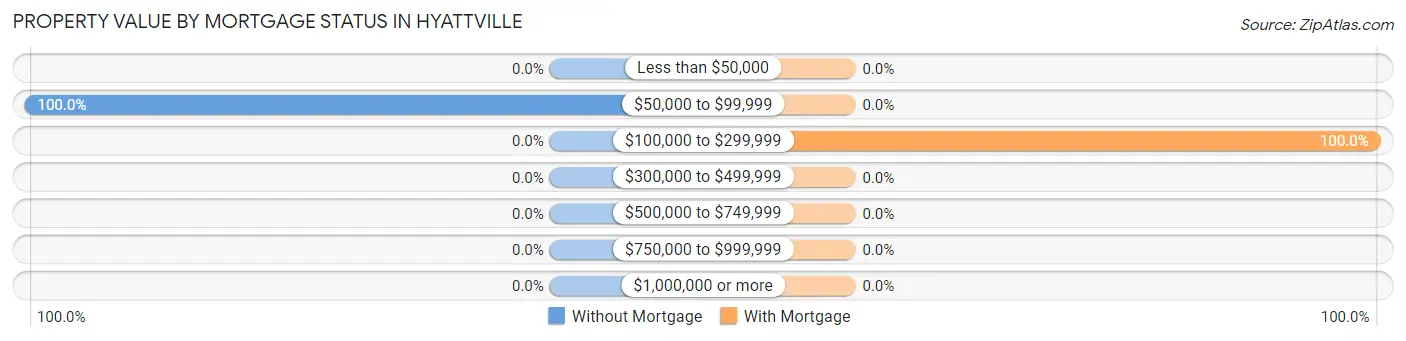
Property Value by Mortgage Status in Hyattville
Property Value
Without Mortgage
With Mortgage
Less than $50,000
0 (0.0%)
0 (0.0%)
$50,000 to $99,999
14 (100.0%)
0 (0.0%)
$100,000 to $299,999
0 (0.0%)
4 (100.0%)
$300,000 to $499,999
0 (0.0%)
0 (0.0%)
$500,000 to $749,999
0 (0.0%)
0 (0.0%)
$750,000 to $999,999
0 (0.0%)
0 (0.0%)
$1,000,000 or more
0 (0.0%)
0 (0.0%)
Total
14 (100.0%)
4 (100.0%)
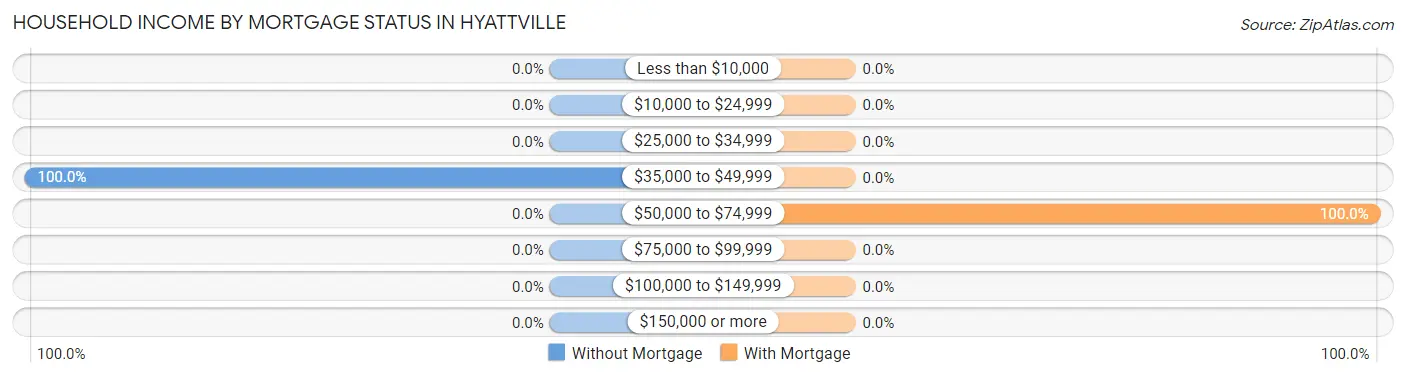
Household Income by Mortgage Status in Hyattville
Household Income
Without Mortgage
With Mortgage
Less than $10,000
0 (0.0%)
0 (0.0%)
$10,000 to $24,999
0 (0.0%)
0 (0.0%)
$25,000 to $34,999
0 (0.0%)
0 (0.0%)
$35,000 to $49,999
14 (100.0%)
0 (0.0%)
$50,000 to $74,999
0 (0.0%)
4 (100.0%)
$75,000 to $99,999
0 (0.0%)
0 (0.0%)
$100,000 to $149,999
0 (0.0%)
0 (0.0%)
$150,000 or more
0 (0.0%)
0 (0.0%)
Total
14 (100.0%)
4 (100.0%)
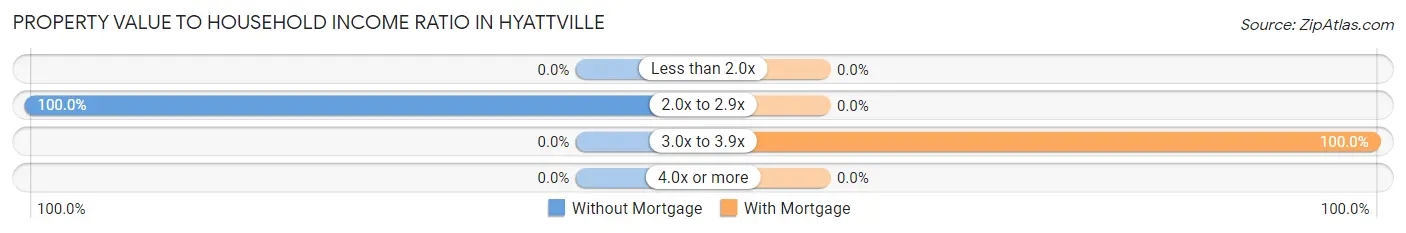
Property Value to Household Income Ratio in Hyattville
Value-to-Income Ratio
Without Mortgage
With Mortgage
Less than 2.0x
0 (0.0%)
0 (0.0%)
2.0x to 2.9x
14 (100.0%)
0 (0.0%)
3.0x to 3.9x
0 (0.0%)
4 (100.0%)
4.0x or more
0 (0.0%)
0 (0.0%)
Total
14 (100.0%)
4 (100.0%)
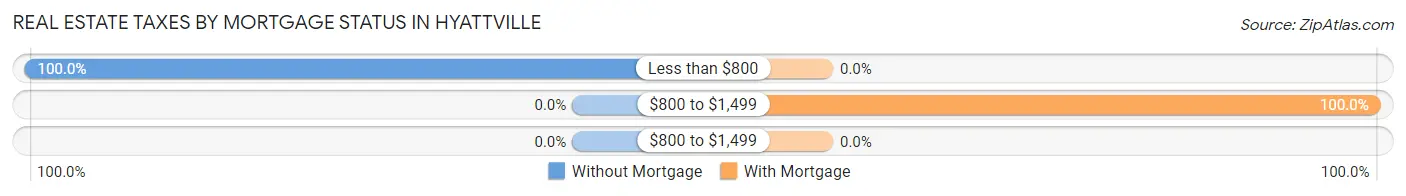
Real Estate Taxes by Mortgage Status in Hyattville
Property Taxes
Without Mortgage
With Mortgage
Less than $800
14 (100.0%)
0 (0.0%)
$800 to $1,499
0 (0.0%)
4 (100.0%)
$800 to $1,499
0 (0.0%)
0 (0.0%)
Total
14 (100.0%)
4 (100.0%)
Health & Disability in Hyattville
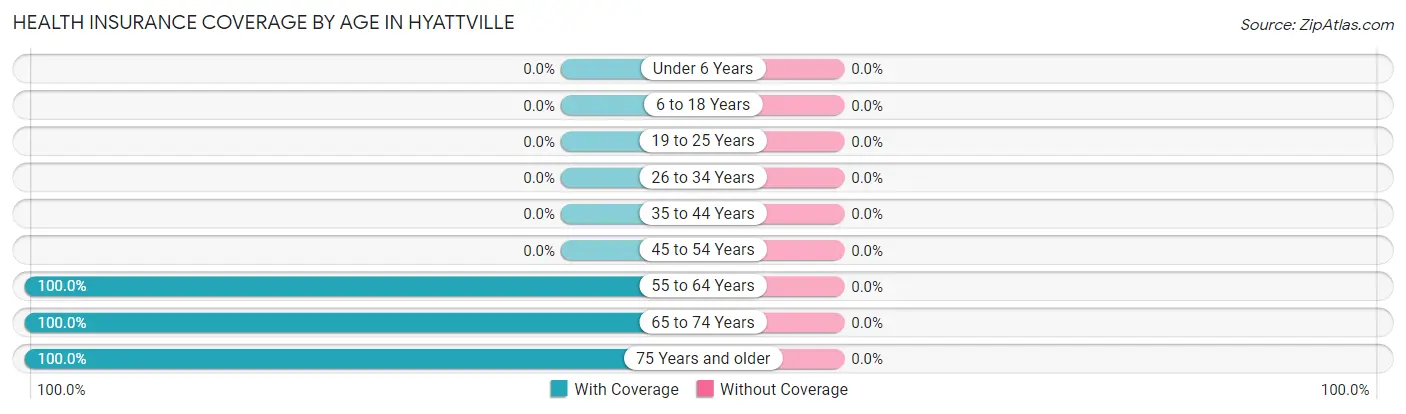
Health Insurance Coverage by Age in Hyattville
Age Bracket
With Coverage
Without Coverage
Under 6 Years
0 (0.0%)
0 (0.0%)
6 to 18 Years
0 (0.0%)
0 (0.0%)
19 to 25 Years
0 (0.0%)
0 (0.0%)
26 to 34 Years
0 (0.0%)
0 (0.0%)
35 to 44 Years
0 (0.0%)
0 (0.0%)
45 to 54 Years
0 (0.0%)
0 (0.0%)
55 to 64 Years
7 (100.0%)
0 (0.0%)
65 to 74 Years
4 (100.0%)
0 (0.0%)
75 Years and older
35 (100.0%)
0 (0.0%)
Total
46 (100.0%)
0 (0.0%)
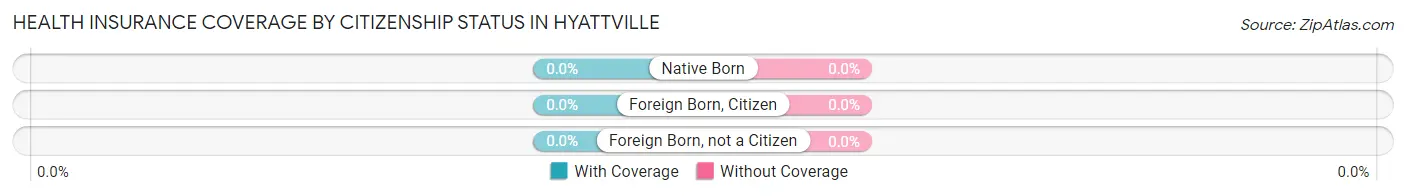
Health Insurance Coverage by Citizenship Status in Hyattville
Citizenship Status
With Coverage
Without Coverage
Native Born
0 (0.0%)
0 (0.0%)
Foreign Born, Citizen
0 (0.0%)
0 (0.0%)
Foreign Born, not a Citizen
0 (0.0%)
0 (0.0%)
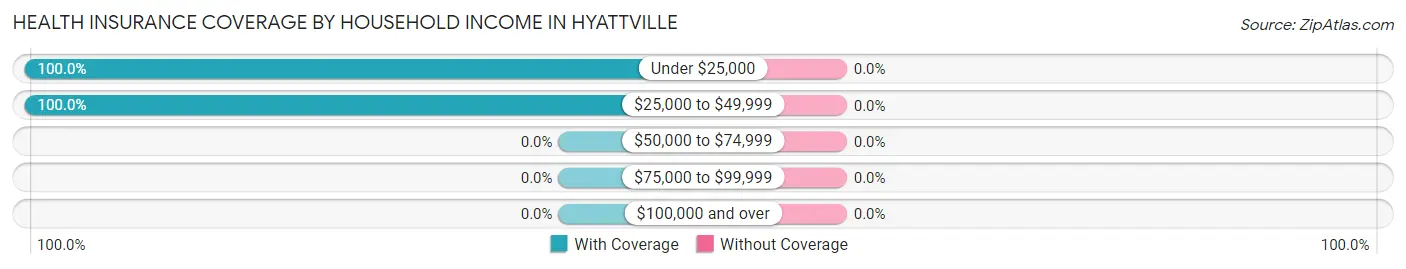
Health Insurance Coverage by Household Income in Hyattville
Household Income
With Coverage
Without Coverage
Under $25,000
16 (100.0%)
0 (0.0%)
$25,000 to $49,999
30 (100.0%)
0 (0.0%)
$50,000 to $74,999
0 (0.0%)
0 (0.0%)
$75,000 to $99,999
0 (0.0%)
0 (0.0%)
$100,000 and over
0 (0.0%)
0 (0.0%)
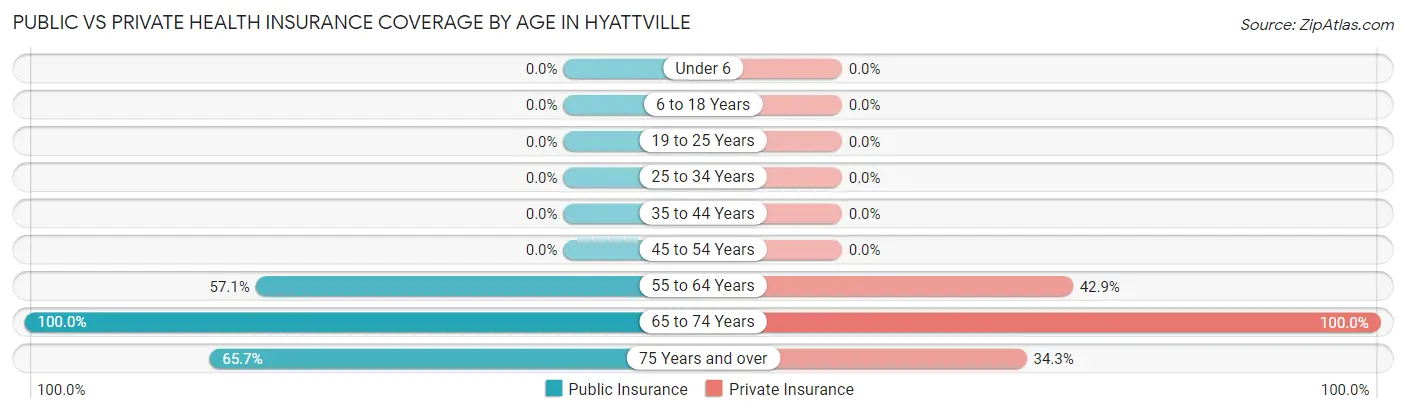
Public vs Private Health Insurance Coverage by Age in Hyattville
Age Bracket
Public Insurance
Private Insurance
Under 6
0 (0.0%)
0 (0.0%)
6 to 18 Years
0 (0.0%)
0 (0.0%)
19 to 25 Years
0 (0.0%)
0 (0.0%)
25 to 34 Years
0 (0.0%)
0 (0.0%)
35 to 44 Years
0 (0.0%)
0 (0.0%)
45 to 54 Years
0 (0.0%)
0 (0.0%)
55 to 64 Years
4 (57.1%)
3 (42.9%)
65 to 74 Years
4 (100.0%)
4 (100.0%)
75 Years and over
23 (65.7%)
12 (34.3%)
Total
31 (67.4%)
19 (41.3%)
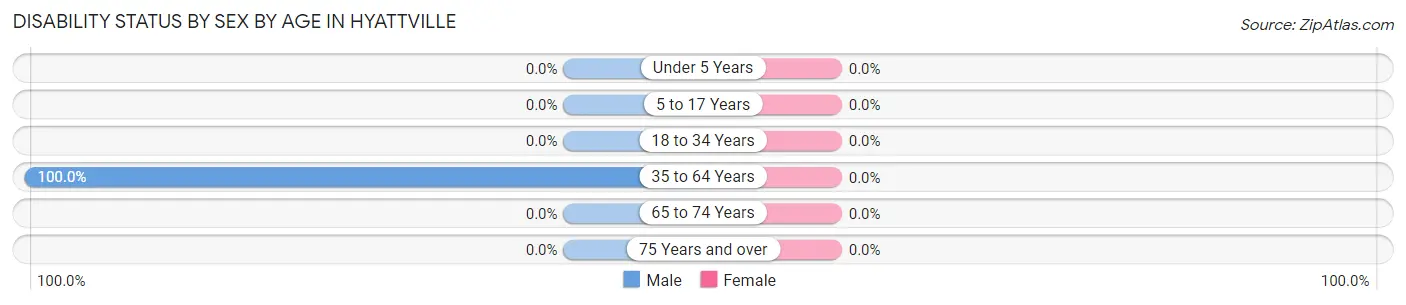
Disability Status by Sex by Age in Hyattville
Age Bracket
Male
Female
Under 5 Years
0 (0.0%)
0 (0.0%)
5 to 17 Years
0 (0.0%)
0 (0.0%)
18 to 34 Years
0 (0.0%)
0 (0.0%)
35 to 64 Years
4 (100.0%)
0 (0.0%)
65 to 74 Years
0 (0.0%)
0 (0.0%)
75 Years and over
0 (0.0%)
0 (0.0%)
Disability Class by Sex by Age in Hyattville
Disability Class: Hearing Difficulty
Age Bracket
Male
Female
Under 5 Years
0 (0.0%)
0 (0.0%)
5 to 17 Years
0 (0.0%)
0 (0.0%)
18 to 34 Years
0 (0.0%)
0 (0.0%)
35 to 64 Years
0 (0.0%)
0 (0.0%)
65 to 74 Years
0 (0.0%)
0 (0.0%)
75 Years and over
0 (0.0%)
0 (0.0%)
Disability Class: Vision Difficulty
Age Bracket
Male
Female
Under 5 Years
0 (0.0%)
0 (0.0%)
5 to 17 Years
0 (0.0%)
0 (0.0%)
18 to 34 Years
0 (0.0%)
0 (0.0%)
35 to 64 Years
0 (0.0%)
0 (0.0%)
65 to 74 Years
0 (0.0%)
0 (0.0%)
75 Years and over
0 (0.0%)
0 (0.0%)
Disability Class: Cognitive Difficulty
Age Bracket
Male
Female
5 to 17 Years
0 (0.0%)
0 (0.0%)
18 to 34 Years
0 (0.0%)
0 (0.0%)
35 to 64 Years
0 (0.0%)
0 (0.0%)
65 to 74 Years
0 (0.0%)
0 (0.0%)
75 Years and over
0 (0.0%)
0 (0.0%)
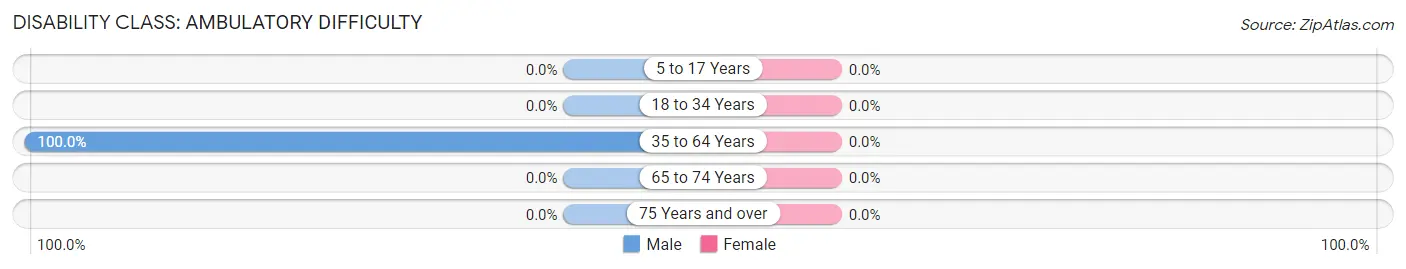
Disability Class: Ambulatory Difficulty
Age Bracket
Male
Female
5 to 17 Years
0 (0.0%)
0 (0.0%)
18 to 34 Years
0 (0.0%)
0 (0.0%)
35 to 64 Years
4 (100.0%)
0 (0.0%)
65 to 74 Years
0 (0.0%)
0 (0.0%)
75 Years and over
0 (0.0%)
0 (0.0%)
Disability Class: Self-Care Difficulty
Age Bracket
Male
Female
5 to 17 Years
0 (0.0%)
0 (0.0%)
18 to 34 Years
0 (0.0%)
0 (0.0%)
35 to 64 Years
0 (0.0%)
0 (0.0%)
65 to 74 Years
0 (0.0%)
0 (0.0%)
75 Years and over
0 (0.0%)
0 (0.0%)
Technology Access in Hyattville
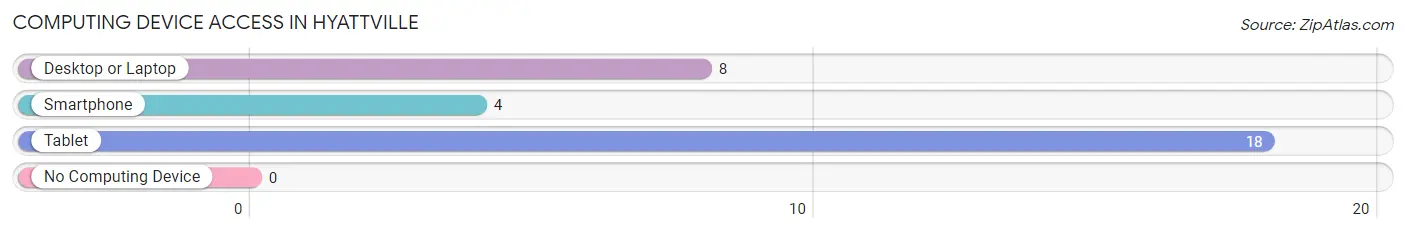
Computing Device Access in Hyattville
Device Type
# Households
% Households
Desktop or Laptop
8
36.4%
Smartphone
4
18.2%
Tablet
18
81.8%
No Computing Device
0
0.0%
Total
22
100.0%
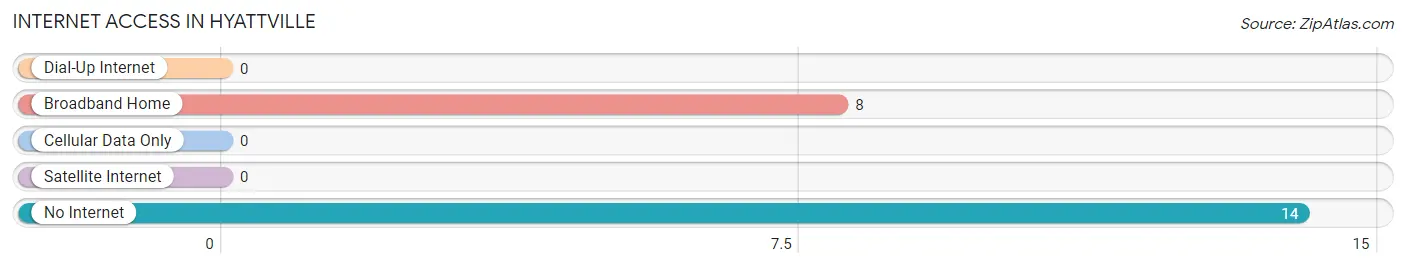
Internet Access in Hyattville
Internet Type
# Households
% Households
Dial-Up Internet
0
0.0%
Broadband Home
8
36.4%
Cellular Data Only
0
0.0%
Satellite Internet
0
0.0%
No Internet
14
63.6%
Total
22
100.0%
Hyattville Summary
Hyattville, Wyoming is a small town located in the Big Horn Basin of the state. It is situated in the foothills of the Big Horn Mountains, and is surrounded by the Bighorn National Forest. The town was founded in 1882 by William Hyatt, who was a rancher and homesteader. The town was named after him, and it has been a part of the Big Horn County since its inception.
Geography
Hyattville is located in the Big Horn Basin of Wyoming, and is situated in the foothills of the Big Horn Mountains. The town is surrounded by the Bighorn National Forest, and is located at an elevation of 4,890 feet. The town is located in the Big Horn River Valley, and is situated between the Big Horn and Greybull Rivers. The town is located approximately 30 miles south of the city of Sheridan, and is approximately 60 miles north of the city of Cody.
The town is located in a semi-arid climate, and is characterized by hot summers and cold winters. The average annual temperature is approximately 45 degrees Fahrenheit, and the average annual precipitation is approximately 12 inches. The town is located in an area of high winds, and is prone to dust storms and thunderstorms.
Economy
The economy of Hyattville is largely based on agriculture and ranching. The town is home to several large ranches, and the surrounding area is used for grazing cattle and sheep. The town is also home to several small businesses, including a grocery store, a hardware store, and a restaurant. The town is also home to a small airport, which is used for recreational and business purposes.
Demographics
As of the 2010 census, the population of Hyattville was approximately 200 people. The town is predominantly white, with approximately 95% of the population being white. The remaining 5% of the population is made up of Native Americans, Hispanics, and African Americans. The median household income in the town is approximately $35,000, and the median home value is approximately $90,000.
Conclusion
Hyattville, Wyoming is a small town located in the Big Horn Basin of the state. It is situated in the foothills of the Big Horn Mountains, and is surrounded by the Bighorn National Forest. The town was founded in 1882 by William Hyatt, and has been a part of the Big Horn County since its inception. The town is characterized by a semi-arid climate, and is home to several large ranches and small businesses. The population of Hyattville is predominantly white, with the median household income being approximately $35,000 and the median home value being approximately $90,000.
Common Questions
What is Per Capita Income in Hyattville?
Per Capita income in Hyattville is $15,280.
What is the Median Household income in Hyattville?
Median Household Income in Hyattville is $40,536.
What is Inequality or Gini Index in Hyattville?
Inequality or Gini Index in Hyattville is 0.16.
What is the Total Population of Hyattville?
Total Population of Hyattville is 46.
What is the Total Male Population of Hyattville?
Total Male Population of Hyattville is 30.
What is the Total Female Population of Hyattville?
Total Female Population of Hyattville is 16.
What is the Ratio of Males per 100 Females in Hyattville?
There are 187.50 Males per 100 Females in Hyattville.
What is the Ratio of Females per 100 Males in Hyattville?
There are 53.33 Females per 100 Males in Hyattville.
What is the Median Population Age in Hyattville?
Median Population Age in Hyattville is 78.5 Years.
What is the Average Family Size in Hyattville
Average Family Size in Hyattville is 1.7 People.
What is the Average Household Size in Hyattville
Average Household Size in Hyattville is 2.1 People.
Report Title
Report Link
HTML Copy & Paste Link
Social Media
Copy and paste the folowing code into any webpage where you would like this interactive chart to display