McKinney Acres, TX Map & Demographics
McKinney Acres Map
McKinney Acres Overview
$28,710
PER CAPITA INCOME
$61,552
AVG FAMILY INCOME
$61,401
AVG HOUSEHOLD INCOME
23.6%
WAGE / INCOME GAP [ % ]
76.4¢/ $1
WAGE / INCOME GAP [ $ ]
0.33
INEQUALITY / GINI INDEX
868
TOTAL POPULATION
516
MALE POPULATION
352
FEMALE POPULATION
146.59
MALES / 100 FEMALES
68.22
FEMALES / 100 MALES
31.9
MEDIAN AGE
2.7
AVG FAMILY SIZE
2.5
AVG HOUSEHOLD SIZE
413
LABOR FORCE [ PEOPLE ]
57.0%
PERCENT IN LABOR FORCE
4.1%
UNEMPLOYMENT RATE
Income in McKinney Acres
Income Overview in McKinney Acres
Per Capita Income in McKinney Acres is $28,710, while median incomes of families and households are $61,552 and $61,401 respectively.
| Characteristic | Number | Measure |
| Per Capita Income | 868 | $28,710 |
| Median Family Income | 259 | $61,552 |
| Mean Family Income | 259 | $68,968 |
| Median Household Income | 340 | $61,401 |
| Mean Household Income | 340 | $88,392 |
| Income Deficit | 259 | $0 |
| Wage / Income Gap (%) | 868 | 23.60% |
| Wage / Income Gap ($) | 868 | 76.40¢ per $1 |
| Gini / Inequality Index | 868 | 0.33 |
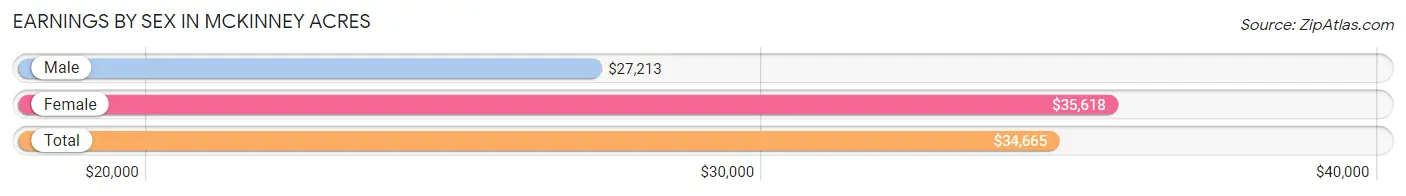
Earnings by Sex in McKinney Acres
Average Earnings in McKinney Acres are $34,665, $27,213 for men and $35,618 for women, a difference of 23.6%.
| Sex | Number | Average Earnings |
| Male | 338 (63.6%) | $27,213 |
| Female | 193 (36.3%) | $35,618 |
| Total | 531 (100.0%) | $34,665 |
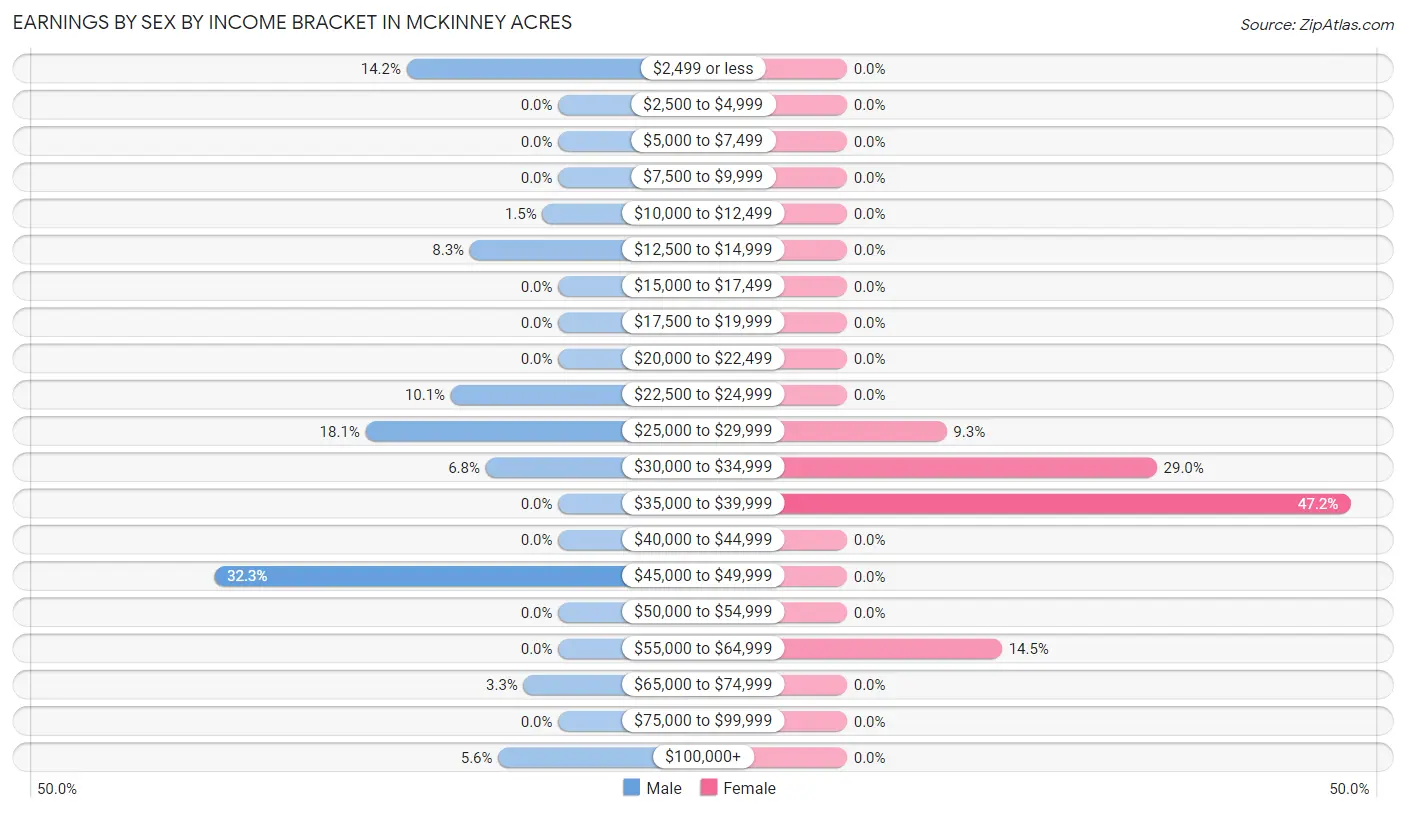
Earnings by Sex by Income Bracket in McKinney Acres
The most common earnings brackets in McKinney Acres are $45,000 to $49,999 for men (109 | 32.3%) and $35,000 to $39,999 for women (91 | 47.1%).
| Income | Male | Female |
| $2,499 or less | 48 (14.2%) | 0 (0.0%) |
| $2,500 to $4,999 | 0 (0.0%) | 0 (0.0%) |
| $5,000 to $7,499 | 0 (0.0%) | 0 (0.0%) |
| $7,500 to $9,999 | 0 (0.0%) | 0 (0.0%) |
| $10,000 to $12,499 | 5 (1.5%) | 0 (0.0%) |
| $12,500 to $14,999 | 28 (8.3%) | 0 (0.0%) |
| $15,000 to $17,499 | 0 (0.0%) | 0 (0.0%) |
| $17,500 to $19,999 | 0 (0.0%) | 0 (0.0%) |
| $20,000 to $22,499 | 0 (0.0%) | 0 (0.0%) |
| $22,500 to $24,999 | 34 (10.1%) | 0 (0.0%) |
| $25,000 to $29,999 | 61 (18.0%) | 18 (9.3%) |
| $30,000 to $34,999 | 23 (6.8%) | 56 (29.0%) |
| $35,000 to $39,999 | 0 (0.0%) | 91 (47.1%) |
| $40,000 to $44,999 | 0 (0.0%) | 0 (0.0%) |
| $45,000 to $49,999 | 109 (32.3%) | 0 (0.0%) |
| $50,000 to $54,999 | 0 (0.0%) | 0 (0.0%) |
| $55,000 to $64,999 | 0 (0.0%) | 28 (14.5%) |
| $65,000 to $74,999 | 11 (3.3%) | 0 (0.0%) |
| $75,000 to $99,999 | 0 (0.0%) | 0 (0.0%) |
| $100,000+ | 19 (5.6%) | 0 (0.0%) |
| Total | 338 (100.0%) | 193 (100.0%) |
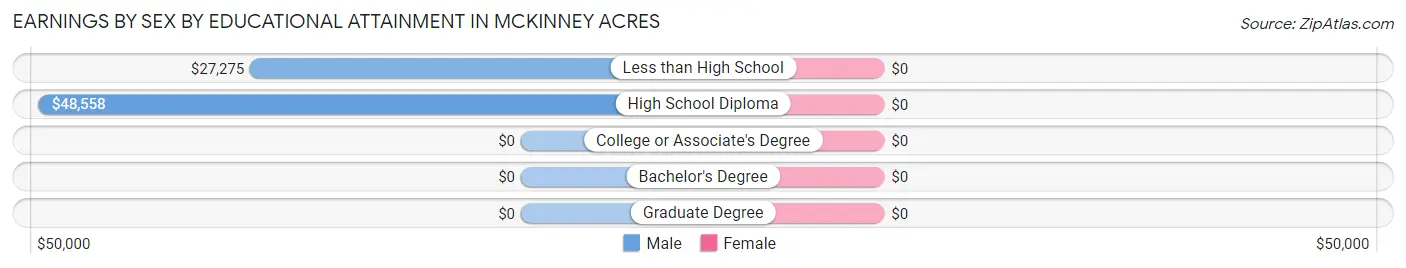
Earnings by Sex by Educational Attainment in McKinney Acres
| Educational Attainment | Male Income | Female Income |
| Less than High School | $27,275 | $0 |
| High School Diploma | $48,558 | $0 |
| College or Associate's Degree | - | - |
| Bachelor's Degree | - | - |
| Graduate Degree | - | - |
| Total | $30,326 | $33,973 |
Family Income in McKinney Acres
Family Income Brackets in McKinney Acres
According to the McKinney Acres family income data, there are 91 families falling into the $50,000 to $74,999 income range, which is the most common income bracket and makes up 35.1% of all families.
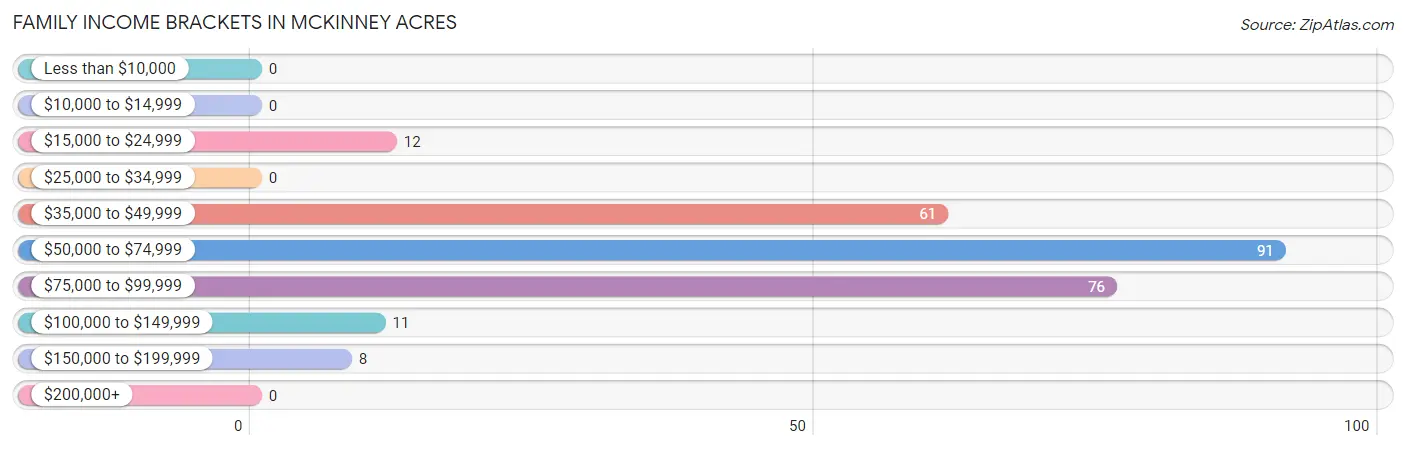
| Income Bracket | # Families | % Families |
| Less than $10,000 | 0 | 0.0% |
| $10,000 to $14,999 | 0 | 0.0% |
| $15,000 to $24,999 | 12 | 4.6% |
| $25,000 to $34,999 | 0 | 0.0% |
| $35,000 to $49,999 | 61 | 23.6% |
| $50,000 to $74,999 | 91 | 35.1% |
| $75,000 to $99,999 | 76 | 29.3% |
| $100,000 to $149,999 | 11 | 4.2% |
| $150,000 to $199,999 | 8 | 3.1% |
| $200,000+ | 0 | 0.0% |
Family Income by Famaliy Size in McKinney Acres
2-person families (114 | 44.0%) account for the highest median family income in McKinney Acres with $61,236 per family, while 2-person families (114 | 44.0%) have the highest median income of $30,618 per family member.
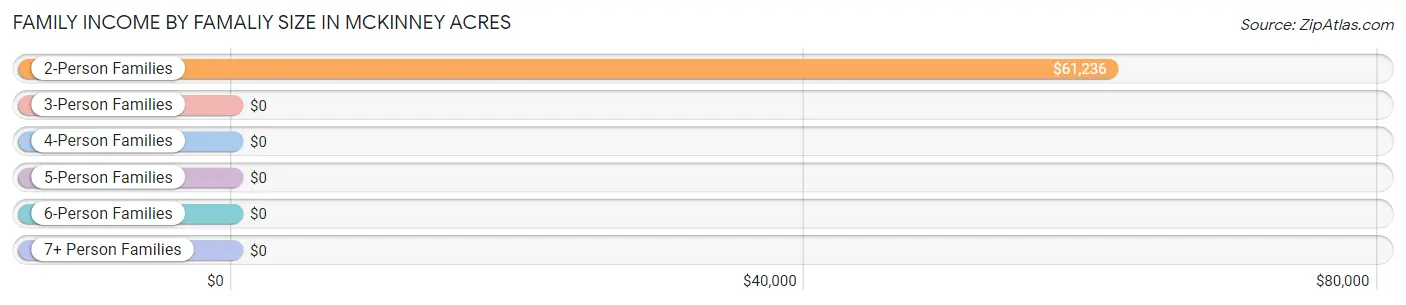
| Income Bracket | # Families | Median Income |
| 2-Person Families | 114 (44.0%) | $61,236 |
| 3-Person Families | 80 (30.9%) | $0 |
| 4-Person Families | 8 (3.1%) | $0 |
| 5-Person Families | 37 (14.3%) | $0 |
| 6-Person Families | 20 (7.7%) | $0 |
| 7+ Person Families | 0 (0.0%) | $0 |
| Total | 259 (100.0%) | $61,552 |
Family Income by Number of Earners in McKinney Acres
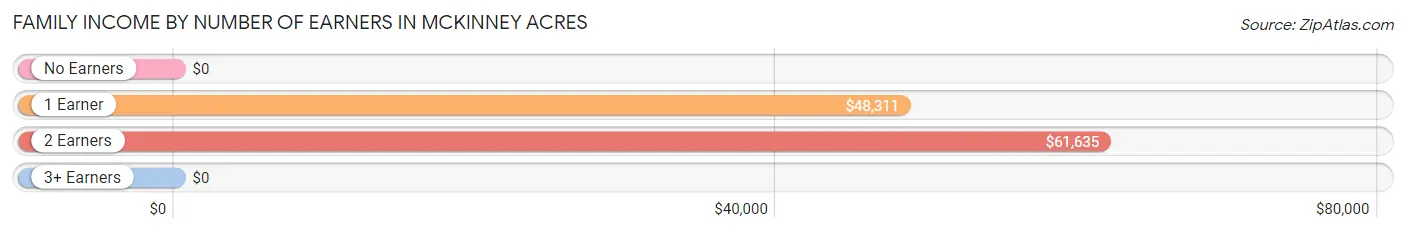
| Number of Earners | # Families | Median Income |
| No Earners | 12 (4.6%) | $0 |
| 1 Earner | 72 (27.8%) | $48,311 |
| 2 Earners | 119 (46.0%) | $61,635 |
| 3+ Earners | 56 (21.6%) | $0 |
| Total | 259 (100.0%) | $61,552 |
Household Income in McKinney Acres
Household Income Brackets in McKinney Acres
With 118 households falling in the category, the $50,000 to $74,999 income range is the most frequent in McKinney Acres, accounting for 34.7% of all households.
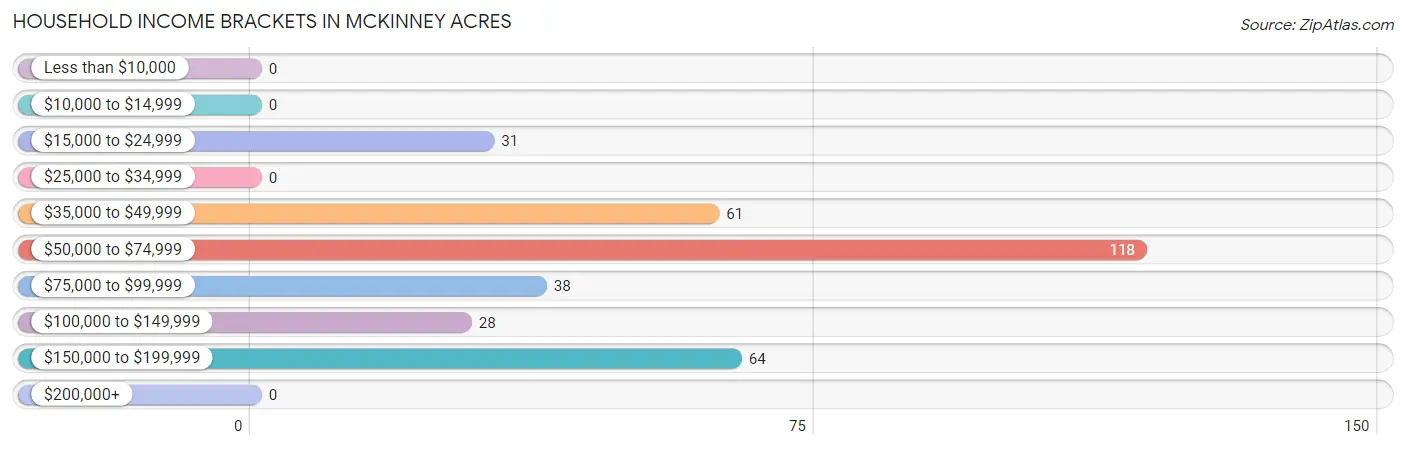
| Income Bracket | # Households | % Households |
| Less than $10,000 | 0 | 0.0% |
| $10,000 to $14,999 | 0 | 0.0% |
| $15,000 to $24,999 | 31 | 9.1% |
| $25,000 to $34,999 | 0 | 0.0% |
| $35,000 to $49,999 | 61 | 17.9% |
| $50,000 to $74,999 | 118 | 34.7% |
| $75,000 to $99,999 | 38 | 11.2% |
| $100,000 to $149,999 | 28 | 8.2% |
| $150,000 to $199,999 | 64 | 18.8% |
| $200,000+ | 0 | 0.0% |
Household Income by Householder Age in McKinney Acres
The median household income in McKinney Acres is $61,401, with the highest median household income of $175,625 found in the 45 to 64 years age bracket for the primary householder. A total of 124 households (36.5%) fall into this category. Meanwhile, the 15 to 24 years age bracket for the primary householder has the lowest median household income of $0, with 128 households (37.7%) in this group.
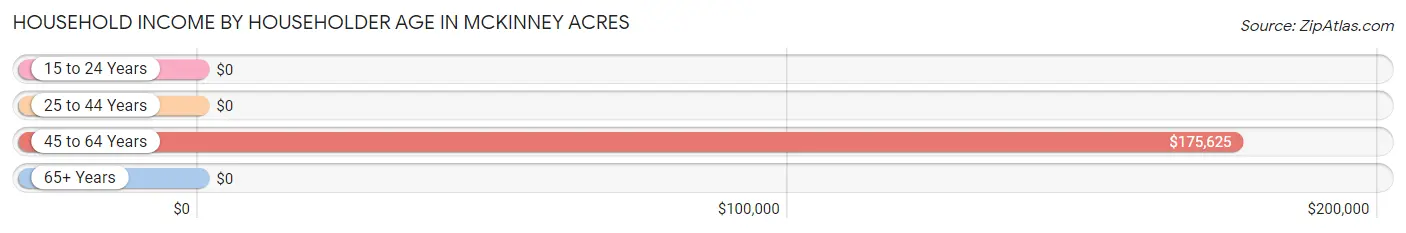
| Income Bracket | # Households | Median Income |
| 15 to 24 Years | 128 (37.7%) | $0 |
| 25 to 44 Years | 20 (5.9%) | $0 |
| 45 to 64 Years | 124 (36.5%) | $175,625 |
| 65+ Years | 68 (20.0%) | $0 |
| Total | 340 (100.0%) | $61,401 |
Poverty in McKinney Acres
Income Below Poverty by Sex and Age in McKinney Acres
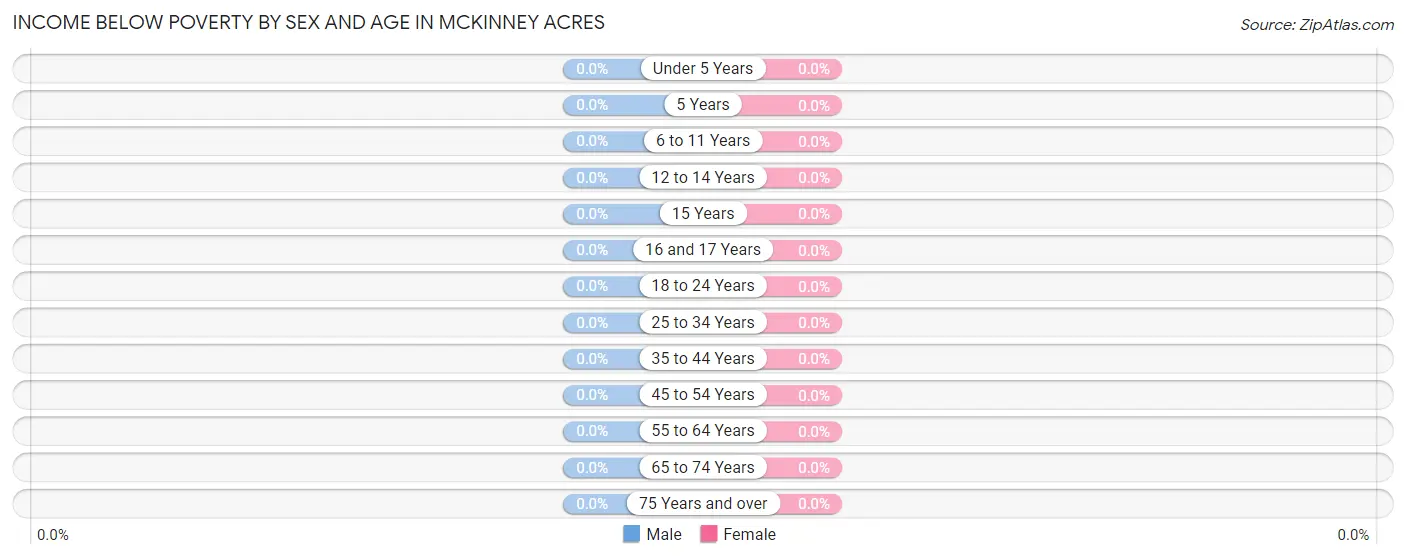
| Age Bracket | Male | Female |
| Under 5 Years | 0 (0.0%) | 0 (0.0%) |
| 5 Years | 0 (0.0%) | 0 (0.0%) |
| 6 to 11 Years | 0 (0.0%) | 0 (0.0%) |
| 12 to 14 Years | 0 (0.0%) | 0 (0.0%) |
| 15 Years | 0 (0.0%) | 0 (0.0%) |
| 16 and 17 Years | 0 (0.0%) | 0 (0.0%) |
| 18 to 24 Years | 0 (0.0%) | 0 (0.0%) |
| 25 to 34 Years | 0 (0.0%) | 0 (0.0%) |
| 35 to 44 Years | 0 (0.0%) | 0 (0.0%) |
| 45 to 54 Years | 0 (0.0%) | 0 (0.0%) |
| 55 to 64 Years | 0 (0.0%) | 0 (0.0%) |
| 65 to 74 Years | 0 (0.0%) | 0 (0.0%) |
| 75 Years and over | 0 (0.0%) | 0 (0.0%) |
| Total | 0 (0.0%) | 0 (0.0%) |
Income Above Poverty by Sex and Age in McKinney Acres
According to the poverty statistics in McKinney Acres, males aged under 5 years and females aged 16 and 17 years are the age groups that are most secure financially, with 100.0% of males and 100.0% of females in these age groups living above the poverty line.
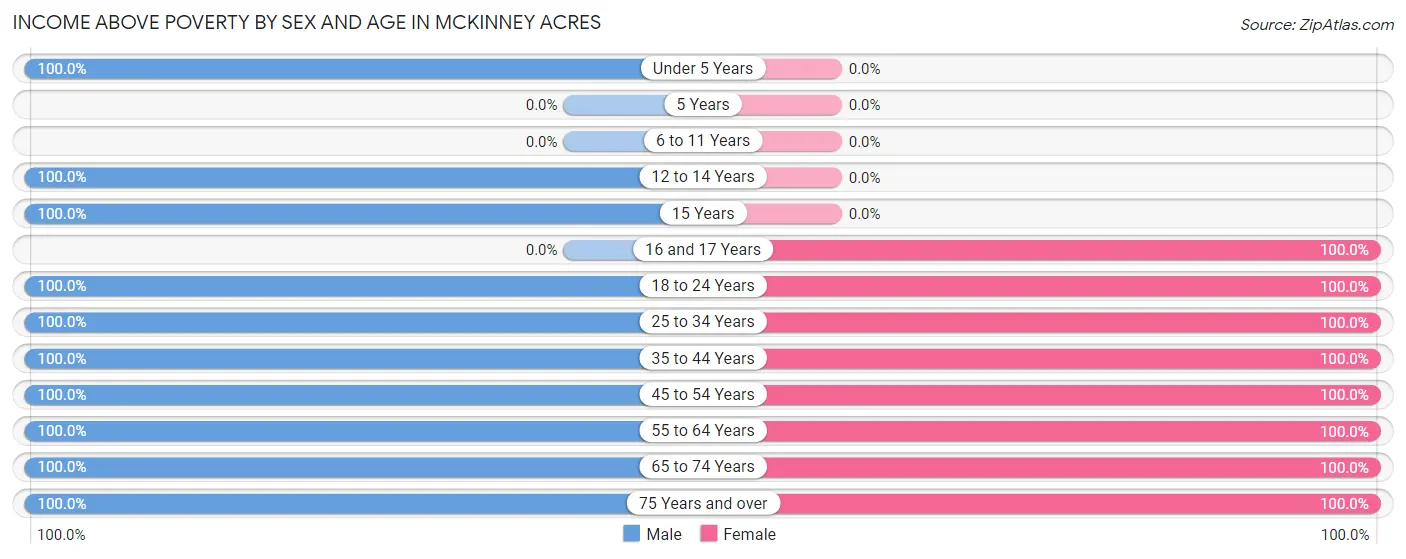
| Age Bracket | Male | Female |
| Under 5 Years | 29 (100.0%) | 0 (0.0%) |
| 5 Years | 0 (0.0%) | 0 (0.0%) |
| 6 to 11 Years | 0 (0.0%) | 0 (0.0%) |
| 12 to 14 Years | 91 (100.0%) | 0 (0.0%) |
| 15 Years | 24 (100.0%) | 0 (0.0%) |
| 16 and 17 Years | 0 (0.0%) | 22 (100.0%) |
| 18 to 24 Years | 94 (100.0%) | 91 (100.0%) |
| 25 to 34 Years | 89 (100.0%) | 5 (100.0%) |
| 35 to 44 Years | 33 (100.0%) | 52 (100.0%) |
| 45 to 54 Years | 58 (100.0%) | 84 (100.0%) |
| 55 to 64 Years | 58 (100.0%) | 32 (100.0%) |
| 65 to 74 Years | 17 (100.0%) | 59 (100.0%) |
| 75 Years and over | 23 (100.0%) | 7 (100.0%) |
| Total | 516 (100.0%) | 352 (100.0%) |
Income Below Poverty Among Married-Couple Families in McKinney Acres
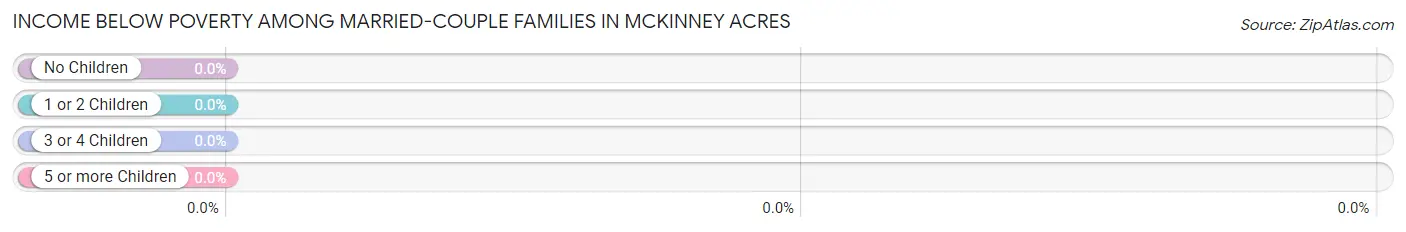
| Children | Above Poverty | Below Poverty |
| No Children | 146 (100.0%) | 0 (0.0%) |
| 1 or 2 Children | 0 (0.0%) | 0 (0.0%) |
| 3 or 4 Children | 37 (100.0%) | 0 (0.0%) |
| 5 or more Children | 0 (0.0%) | 0 (0.0%) |
| Total | 183 (100.0%) | 0 (0.0%) |
Income Below Poverty Among Single-Parent Households in McKinney Acres
| Children | Single Father | Single Mother |
| No Children | 0 (0.0%) | 0 (0.0%) |
| 1 or 2 Children | 0 (0.0%) | 0 (0.0%) |
| 3 or 4 Children | 0 (0.0%) | 0 (0.0%) |
| 5 or more Children | 0 (0.0%) | 0 (0.0%) |
| Total | 0 (0.0%) | 0 (0.0%) |
Income Below Poverty Among Married-Couple vs Single-Parent Households in McKinney Acres
| Children | Married-Couple Families | Single-Parent Households |
| No Children | 0 (0.0%) | 0 (0.0%) |
| 1 or 2 Children | 0 (0.0%) | 0 (0.0%) |
| 3 or 4 Children | 0 (0.0%) | 0 (0.0%) |
| 5 or more Children | 0 (0.0%) | 0 (0.0%) |
| Total | 0 (0.0%) | 0 (0.0%) |
Race in McKinney Acres
The most populous races in McKinney Acres are Hispanic or Latino (802 | 92.4%), White / Caucasian (525 | 60.5%), and Two or more Races (178 | 20.5%).
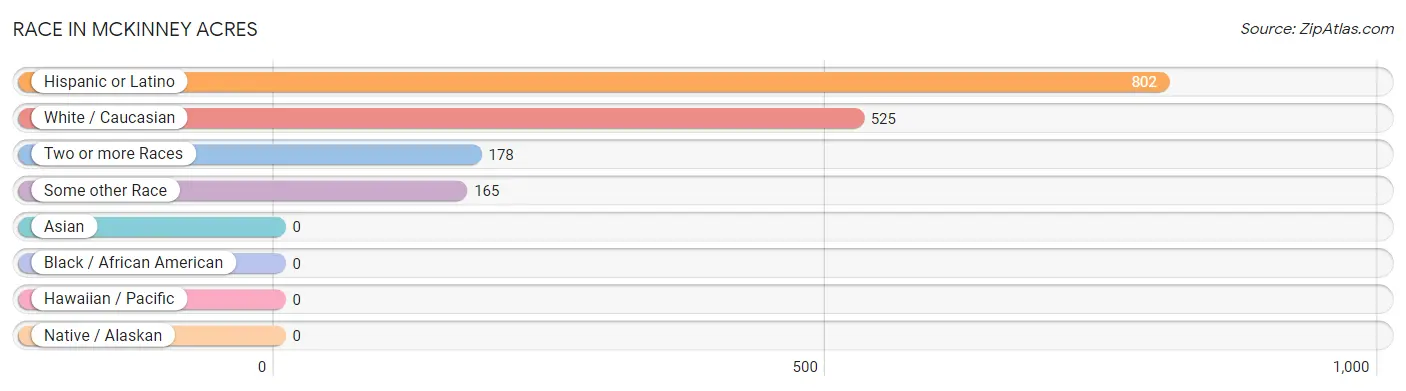
| Race | # Population | % Population |
| Asian | 0 | 0.0% |
| Black / African American | 0 | 0.0% |
| Hawaiian / Pacific | 0 | 0.0% |
| Hispanic or Latino | 802 | 92.4% |
| Native / Alaskan | 0 | 0.0% |
| White / Caucasian | 525 | 60.5% |
| Two or more Races | 178 | 20.5% |
| Some other Race | 165 | 19.0% |
| Total | 868 | 100.0% |
Ancestry in McKinney Acres
The most populous ancestries reported in McKinney Acres are Mexican (785 | 90.4%), German (13 | 1.5%), and Irish (8 | 0.9%), together accounting for 92.9% of all McKinney Acres residents.
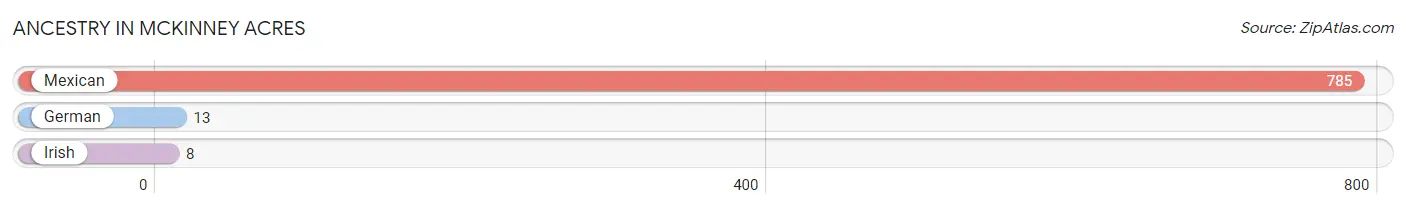
| Ancestry | # Population | % Population |
| German | 13 | 1.5% |
| Irish | 8 | 0.9% |
| Mexican | 785 | 90.4% | View All 3 Rows |
Immigrants in McKinney Acres
The most numerous immigrant groups reported in McKinney Acres came from Central America (397 | 45.7%), Latin America (397 | 45.7%), and Mexico (397 | 45.7%), together accounting for 137.2% of all McKinney Acres residents.
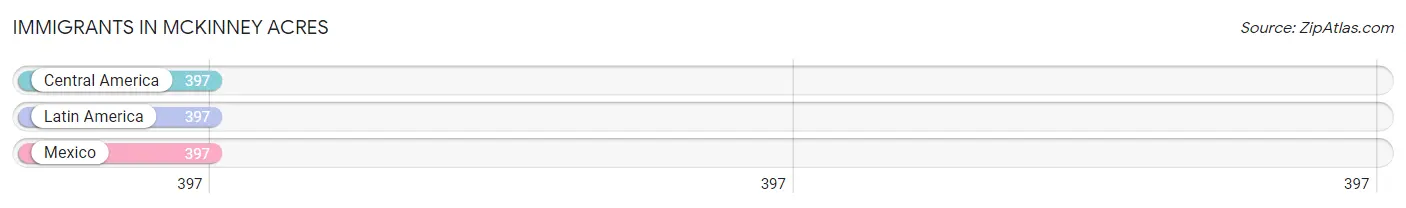
| Immigration Origin | # Population | % Population |
| Central America | 397 | 45.7% |
| Latin America | 397 | 45.7% |
| Mexico | 397 | 45.7% | View All 3 Rows |
Sex and Age in McKinney Acres
Sex and Age in McKinney Acres
The most populous age groups in McKinney Acres are 20 to 24 Years (94 | 18.2%) for men and 20 to 24 Years (91 | 25.9%) for women.
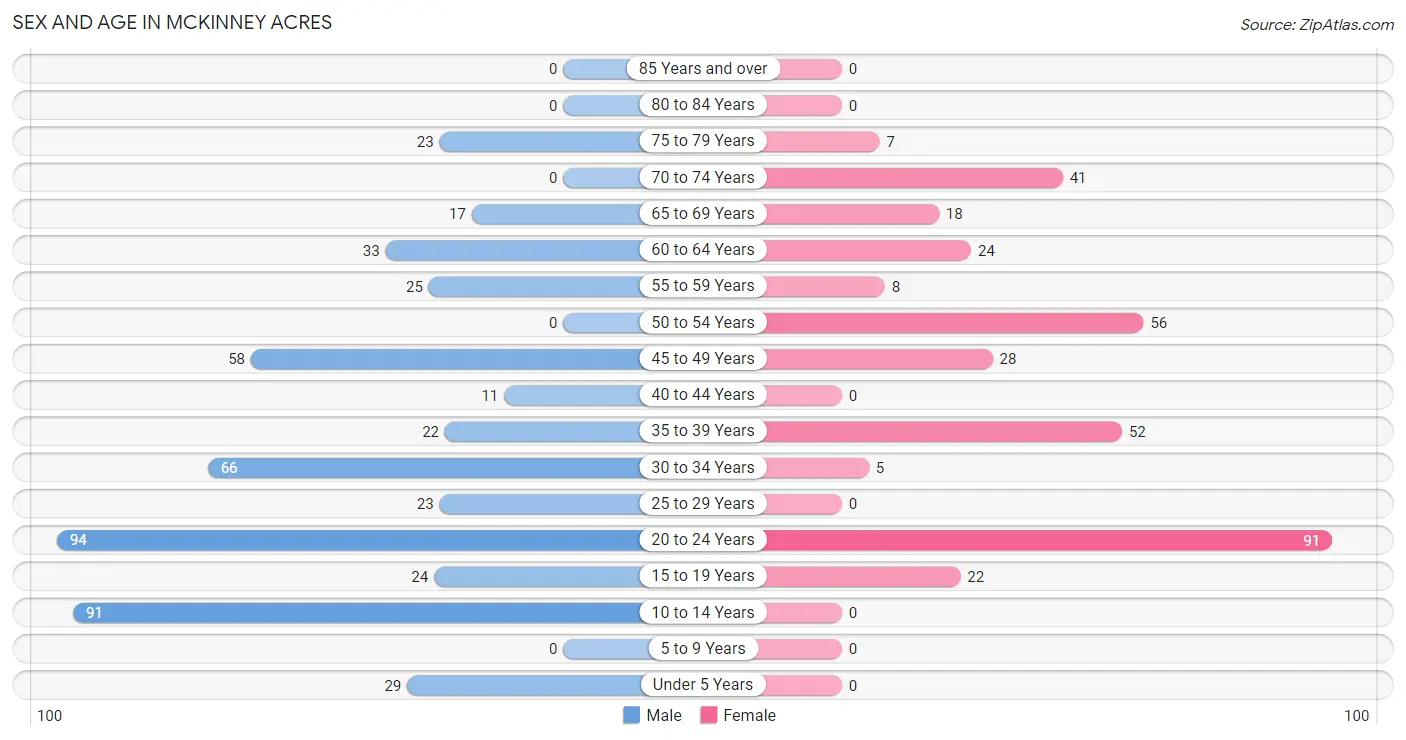
| Age Bracket | Male | Female |
| Under 5 Years | 29 (5.6%) | 0 (0.0%) |
| 5 to 9 Years | 0 (0.0%) | 0 (0.0%) |
| 10 to 14 Years | 91 (17.6%) | 0 (0.0%) |
| 15 to 19 Years | 24 (4.6%) | 22 (6.2%) |
| 20 to 24 Years | 94 (18.2%) | 91 (25.9%) |
| 25 to 29 Years | 23 (4.5%) | 0 (0.0%) |
| 30 to 34 Years | 66 (12.8%) | 5 (1.4%) |
| 35 to 39 Years | 22 (4.3%) | 52 (14.8%) |
| 40 to 44 Years | 11 (2.1%) | 0 (0.0%) |
| 45 to 49 Years | 58 (11.2%) | 28 (8.0%) |
| 50 to 54 Years | 0 (0.0%) | 56 (15.9%) |
| 55 to 59 Years | 25 (4.8%) | 8 (2.3%) |
| 60 to 64 Years | 33 (6.4%) | 24 (6.8%) |
| 65 to 69 Years | 17 (3.3%) | 18 (5.1%) |
| 70 to 74 Years | 0 (0.0%) | 41 (11.7%) |
| 75 to 79 Years | 23 (4.5%) | 7 (2.0%) |
| 80 to 84 Years | 0 (0.0%) | 0 (0.0%) |
| 85 Years and over | 0 (0.0%) | 0 (0.0%) |
| Total | 516 (100.0%) | 352 (100.0%) |
Families and Households in McKinney Acres
Median Family Size in McKinney Acres
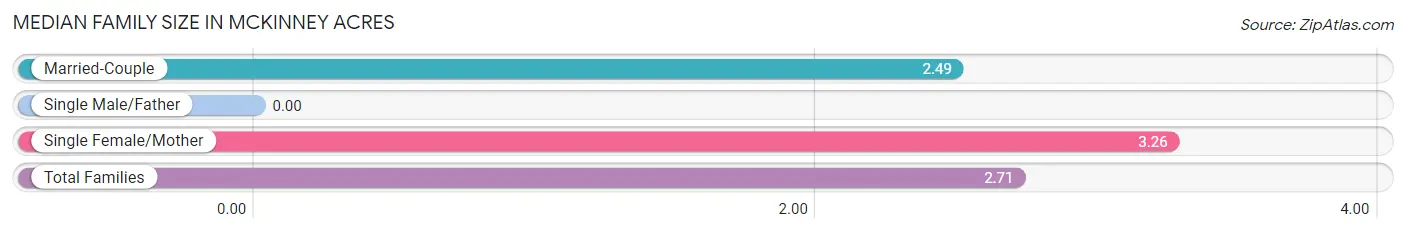
| Family Type | # Families | Family Size |
| Married-Couple | 183 (70.7%) | 2.49 |
| Single Male/Father | 0 (0.0%) | - |
| Single Female/Mother | 76 (29.3%) | 3.26 |
| Total Families | 259 (100.0%) | 2.71 |
Median Household Size in McKinney Acres
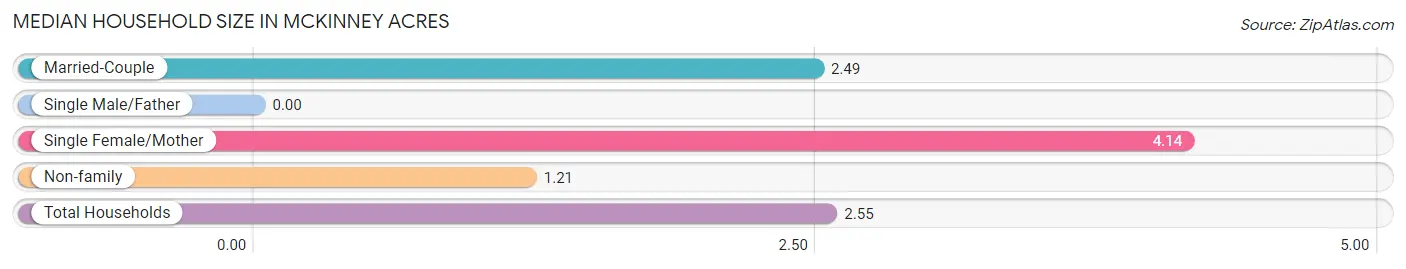
| Household Type | # Households | Household Size |
| Married-Couple | 183 (53.8%) | 2.49 |
| Single Male/Father | 0 (0.0%) | - |
| Single Female/Mother | 76 (22.4%) | 4.14 |
| Non-family | 81 (23.8%) | 1.21 |
| Total Households | 340 (100.0%) | 2.55 |
Household Size by Marriage Status in McKinney Acres
Out of a total of 340 households in McKinney Acres, 259 (76.2%) are family households, while 81 (23.8%) are nonfamily households. The most numerous type of family households are 2-person households, comprising 114, and the most common type of nonfamily households are 1-person households, comprising 63.
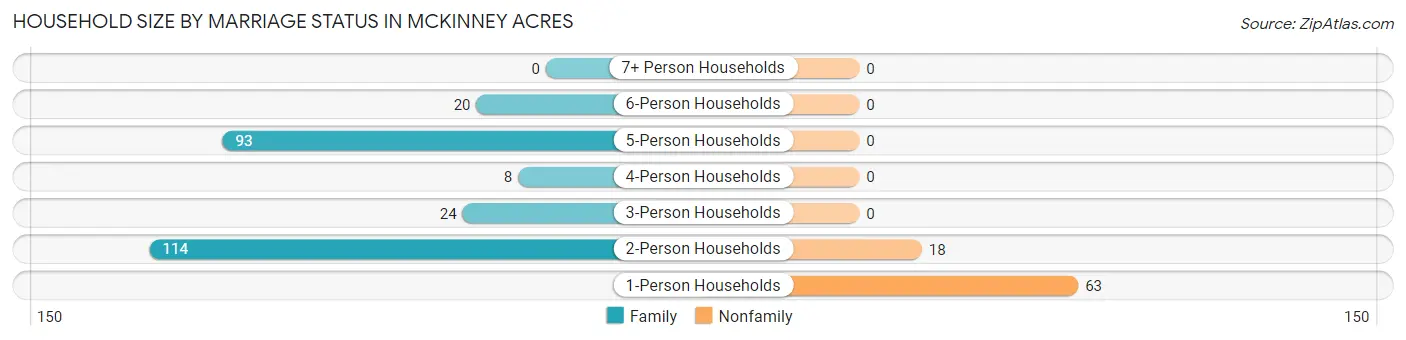
| Household Size | Family Households | Nonfamily Households |
| 1-Person Households | - | 63 (18.5%) |
| 2-Person Households | 114 (33.5%) | 18 (5.3%) |
| 3-Person Households | 24 (7.1%) | 0 (0.0%) |
| 4-Person Households | 8 (2.4%) | 0 (0.0%) |
| 5-Person Households | 93 (27.4%) | 0 (0.0%) |
| 6-Person Households | 20 (5.9%) | 0 (0.0%) |
| 7+ Person Households | 0 (0.0%) | 0 (0.0%) |
| Total | 259 (76.2%) | 81 (23.8%) |
Female Fertility in McKinney Acres
Fertility by Age in McKinney Acres
Average fertility rate in McKinney Acres is 162.0 births per 1,000 women. Women in the age bracket of 35 to 50 years have the highest fertility rate with 400.0 births per 1,000 women. Women in the age bracket of 35 to 50 years acount for 100.0% of all women with births.
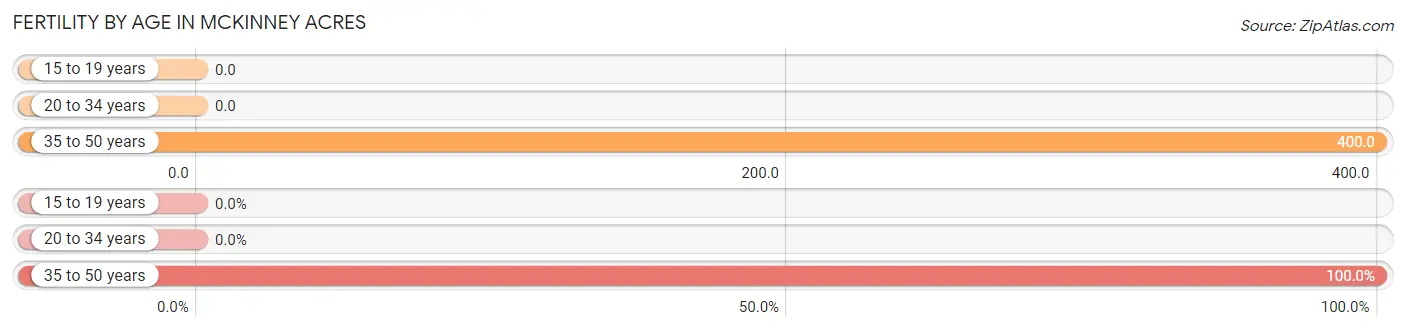
| Age Bracket | Women with Births | Births / 1,000 Women |
| 15 to 19 years | 0 (0.0%) | 0.0 |
| 20 to 34 years | 0 (0.0%) | 0.0 |
| 35 to 50 years | 32 (100.0%) | 400.0 |
| Total | 32 (100.0%) | 162.0 |
Fertility by Age by Marriage Status in McKinney Acres
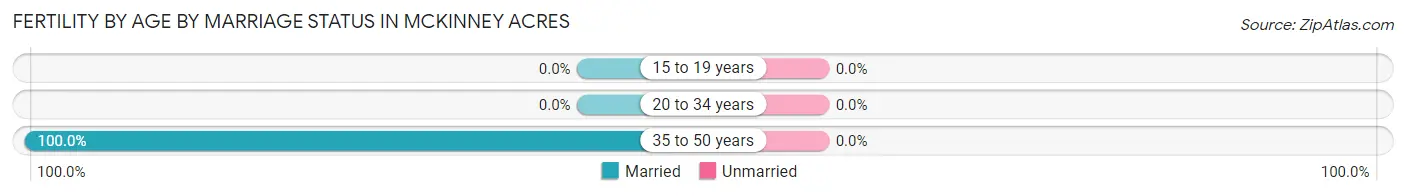
| Age Bracket | Married | Unmarried |
| 15 to 19 years | 0 (0.0%) | 0 (0.0%) |
| 20 to 34 years | 0 (0.0%) | 0 (0.0%) |
| 35 to 50 years | 32 (100.0%) | 0 (0.0%) |
| Total | 32 (100.0%) | 0 (0.0%) |
Fertility by Education in McKinney Acres
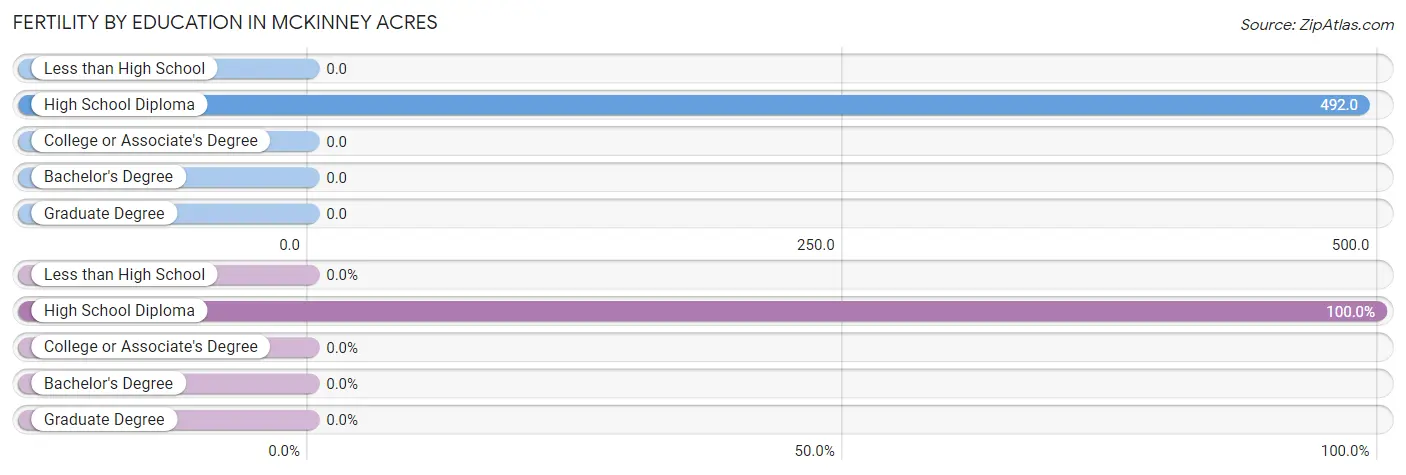
| Educational Attainment | Women with Births | Births / 1,000 Women |
| Less than High School | 0 (0.0%) | 0.0 |
| High School Diploma | 32 (100.0%) | 492.0 |
| College or Associate's Degree | 0 (0.0%) | 0.0 |
| Bachelor's Degree | 0 (0.0%) | 0.0 |
| Graduate Degree | 0 (0.0%) | 0.0 |
| Total | 32 (100.0%) | 162.0 |
Fertility by Education by Marriage Status in McKinney Acres
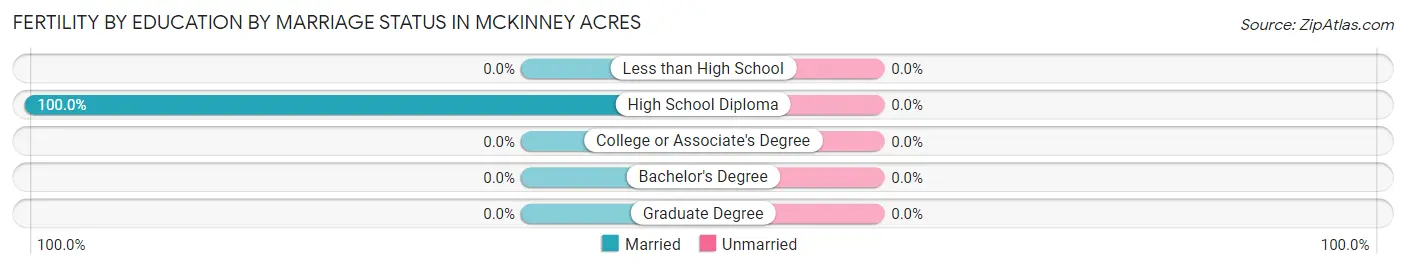
| Educational Attainment | Married | Unmarried |
| Less than High School | 0 (0.0%) | 0 (0.0%) |
| High School Diploma | 32 (100.0%) | 0 (0.0%) |
| College or Associate's Degree | 0 (0.0%) | 0 (0.0%) |
| Bachelor's Degree | 0 (0.0%) | 0 (0.0%) |
| Graduate Degree | 0 (0.0%) | 0 (0.0%) |
| Total | 32 (100.0%) | 0 (0.0%) |
Employment Characteristics in McKinney Acres
Employment by Class of Employer in McKinney Acres
Among the 396 employed individuals in McKinney Acres, private company employees (328 | 82.8%), self-employed (not incorporated) (49 | 12.4%), and self-employed (incorporated) (19 | 4.8%) make up the most common classes of employment.
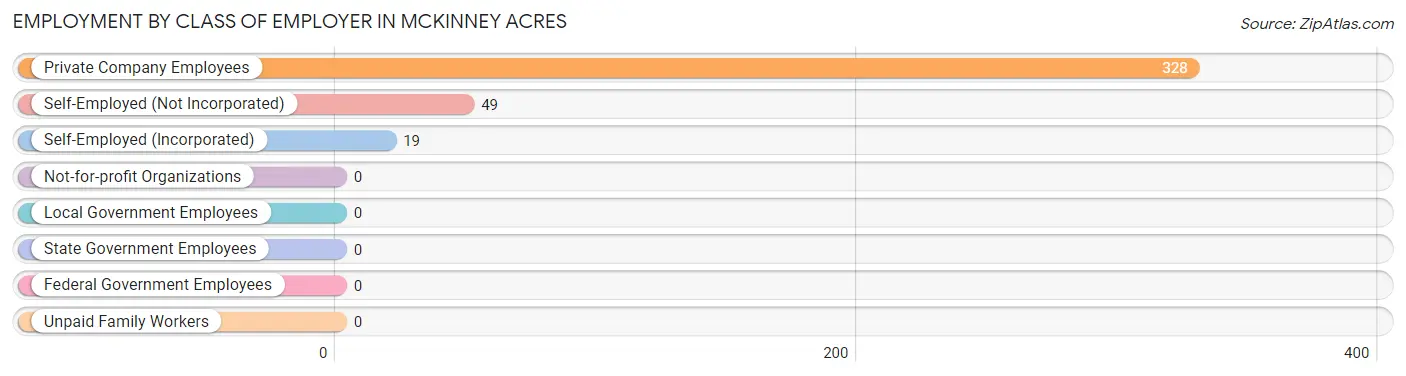
| Employer Class | # Employees | % Employees |
| Private Company Employees | 328 | 82.8% |
| Self-Employed (Incorporated) | 19 | 4.8% |
| Self-Employed (Not Incorporated) | 49 | 12.4% |
| Not-for-profit Organizations | 0 | 0.0% |
| Local Government Employees | 0 | 0.0% |
| State Government Employees | 0 | 0.0% |
| Federal Government Employees | 0 | 0.0% |
| Unpaid Family Workers | 0 | 0.0% |
| Total | 396 | 100.0% |
Employment Status by Age in McKinney Acres
According to the labor force statistics for McKinney Acres, out of the total population over 16 years of age (724), 57.0% or 413 individuals are in the labor force, with 4.1% or 17 of them unemployed. The age group with the highest labor force participation rate is 25 to 29 years, with 100.0% or 23 individuals in the labor force. Within the labor force, the 55 to 59 years age range has the highest percentage of unemployed individuals, with 68.0% or 17 of them being unemployed.
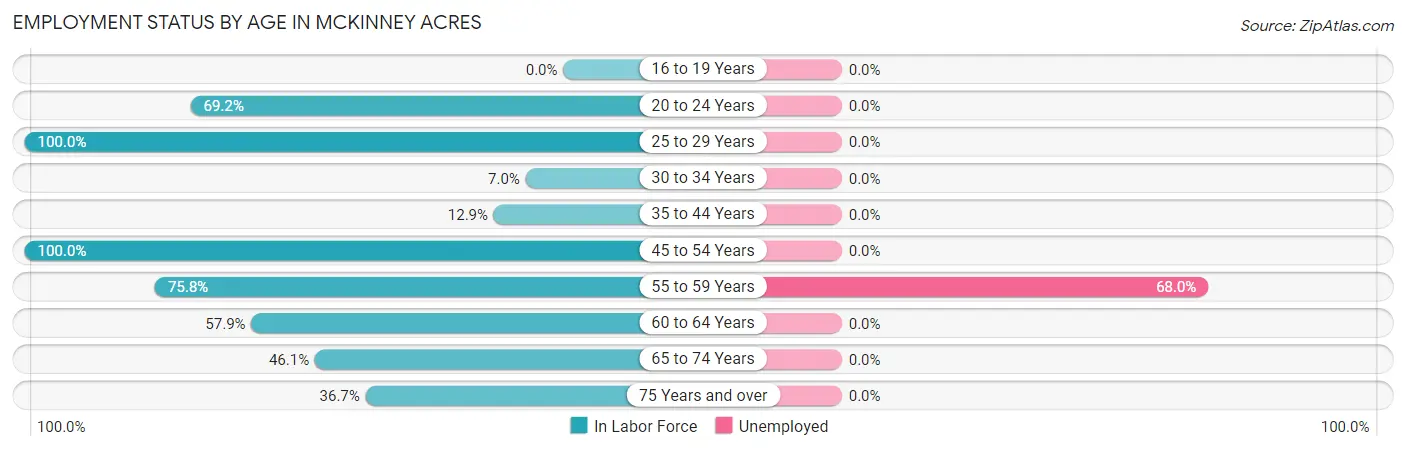
| Age Bracket | In Labor Force | Unemployed |
| 16 to 19 Years | 0 (0.0%) | 0 (0.0%) |
| 20 to 24 Years | 128 (69.2%) | 0 (0.0%) |
| 25 to 29 Years | 23 (100.0%) | 0 (0.0%) |
| 30 to 34 Years | 5 (7.0%) | 0 (0.0%) |
| 35 to 44 Years | 11 (12.9%) | 0 (0.0%) |
| 45 to 54 Years | 142 (100.0%) | 0 (0.0%) |
| 55 to 59 Years | 25 (75.8%) | 17 (68.0%) |
| 60 to 64 Years | 33 (57.9%) | 0 (0.0%) |
| 65 to 74 Years | 35 (46.1%) | 0 (0.0%) |
| 75 Years and over | 11 (36.7%) | 0 (0.0%) |
| Total | 413 (57.0%) | 17 (4.1%) |
Employment Status by Educational Attainment in McKinney Acres
According to labor force statistics for McKinney Acres, 58.2% of individuals (239) out of the total population between 25 and 64 years of age (411) are in the labor force, with 7.1% or 17 of them being unemployed. The group with the highest labor force participation rate are those with the educational attainment of bachelor's degree or higher, with 100.0% or 8 individuals in the labor force. Within the labor force, individuals with high school diploma education have the highest percentage of unemployment, with 17.9% or 17 of them being unemployed.
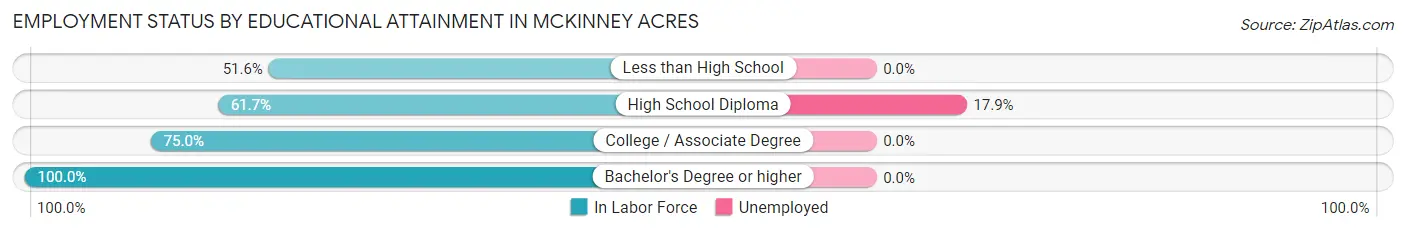
| Educational Attainment | In Labor Force | Unemployed |
| Less than High School | 112 (51.6%) | 0 (0.0%) |
| High School Diploma | 95 (61.7%) | 28 (17.9%) |
| College / Associate Degree | 24 (75.0%) | 0 (0.0%) |
| Bachelor's Degree or higher | 8 (100.0%) | 0 (0.0%) |
| Total | 239 (58.2%) | 29 (7.1%) |
Employment Occupations by Sex in McKinney Acres
Management, Business, Science and Arts Occupations
The most common Management, Business, Science and Arts occupations in McKinney Acres are , and Management (58 | 14.6%).
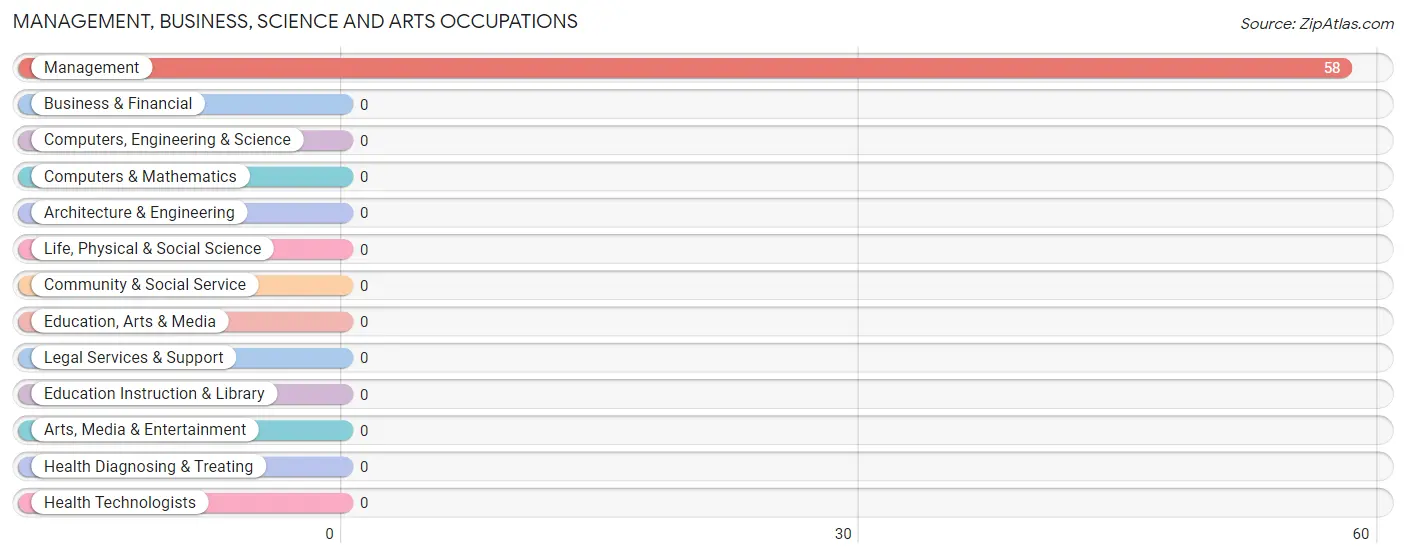
Management, Business, Science and Arts Occupations by Sex
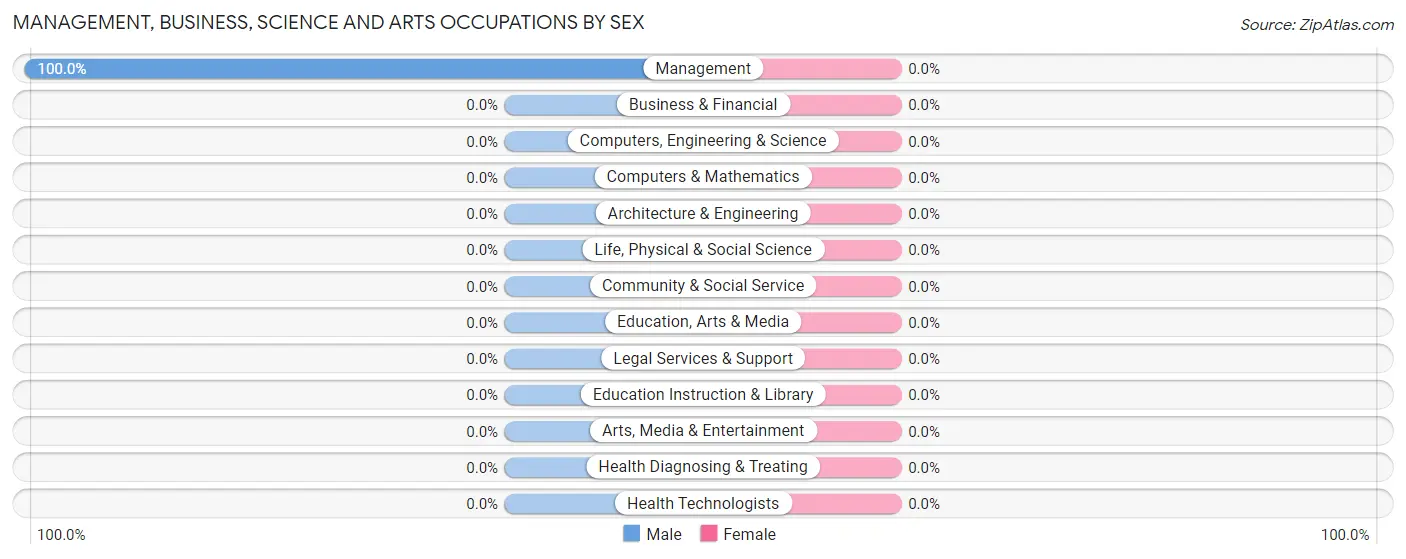
| Occupation | Male | Female |
| Management | 58 (100.0%) | 0 (0.0%) |
| Business & Financial | 0 (0.0%) | 0 (0.0%) |
| Computers, Engineering & Science | 0 (0.0%) | 0 (0.0%) |
| Computers & Mathematics | 0 (0.0%) | 0 (0.0%) |
| Architecture & Engineering | 0 (0.0%) | 0 (0.0%) |
| Life, Physical & Social Science | 0 (0.0%) | 0 (0.0%) |
| Community & Social Service | 0 (0.0%) | 0 (0.0%) |
| Education, Arts & Media | 0 (0.0%) | 0 (0.0%) |
| Legal Services & Support | 0 (0.0%) | 0 (0.0%) |
| Education Instruction & Library | 0 (0.0%) | 0 (0.0%) |
| Arts, Media & Entertainment | 0 (0.0%) | 0 (0.0%) |
| Health Diagnosing & Treating | 0 (0.0%) | 0 (0.0%) |
| Health Technologists | 0 (0.0%) | 0 (0.0%) |
| Total (Category) | 58 (100.0%) | 0 (0.0%) |
| Total (Overall) | 203 (51.3%) | 193 (48.7%) |
Services Occupations
The most common Services occupations in McKinney Acres are Food Preparation & Serving (91 | 23.0%), and Cleaning & Maintenance (56 | 14.1%).
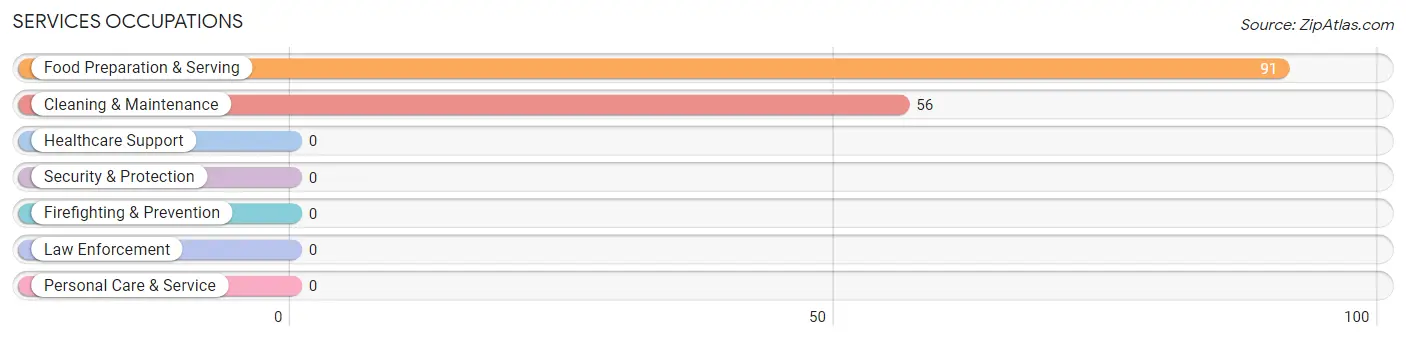
Services Occupations by Sex
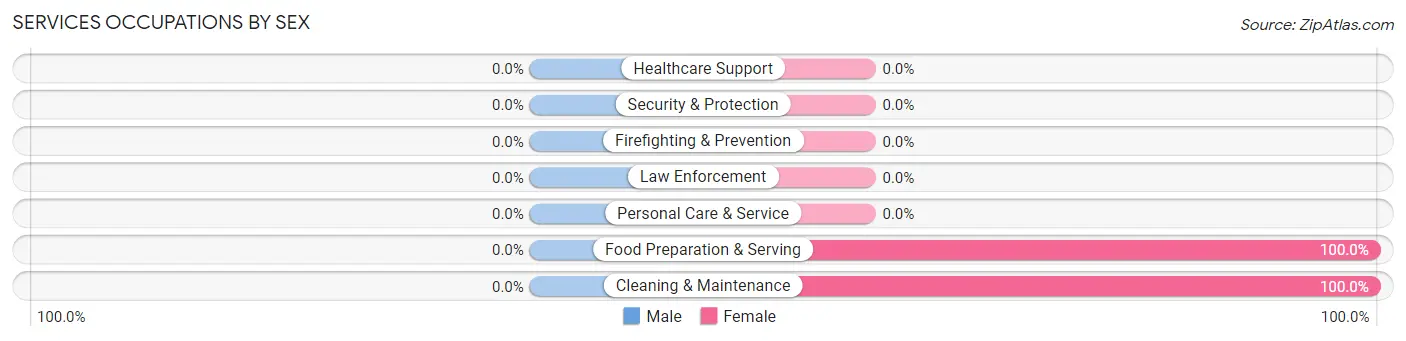
| Occupation | Male | Female |
| Healthcare Support | 0 (0.0%) | 0 (0.0%) |
| Security & Protection | 0 (0.0%) | 0 (0.0%) |
| Firefighting & Prevention | 0 (0.0%) | 0 (0.0%) |
| Law Enforcement | 0 (0.0%) | 0 (0.0%) |
| Food Preparation & Serving | 0 (0.0%) | 91 (100.0%) |
| Cleaning & Maintenance | 0 (0.0%) | 56 (100.0%) |
| Personal Care & Service | 0 (0.0%) | 0 (0.0%) |
| Total (Category) | 0 (0.0%) | 147 (100.0%) |
| Total (Overall) | 203 (51.3%) | 193 (48.7%) |
Sales and Office Occupations
The most common Sales and Office occupations in McKinney Acres are , and Sales & Related (28 | 7.1%).
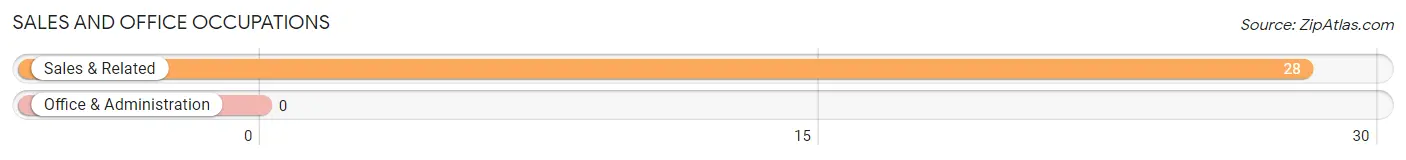
Sales and Office Occupations by Sex
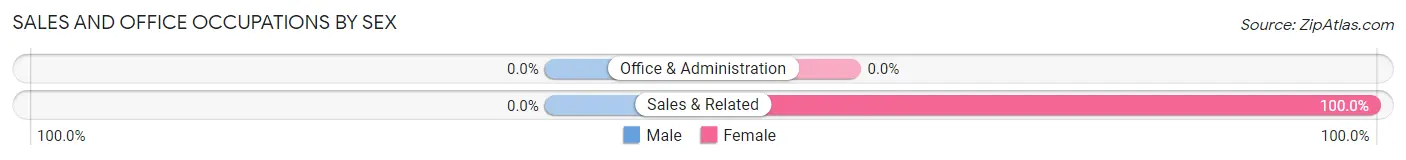
| Occupation | Male | Female |
| Sales & Related | 0 (0.0%) | 28 (100.0%) |
| Office & Administration | 0 (0.0%) | 0 (0.0%) |
| Total (Category) | 0 (0.0%) | 28 (100.0%) |
| Total (Overall) | 203 (51.3%) | 193 (48.7%) |
Natural Resources, Construction and Maintenance Occupations
The most common Natural Resources, Construction and Maintenance occupations in McKinney Acres are Construction & Extraction (92 | 23.2%), and Installation, Maintenance & Repair (11 | 2.8%).
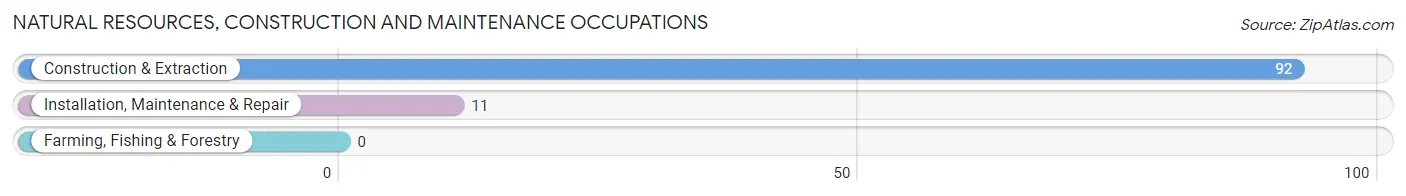
Natural Resources, Construction and Maintenance Occupations by Sex
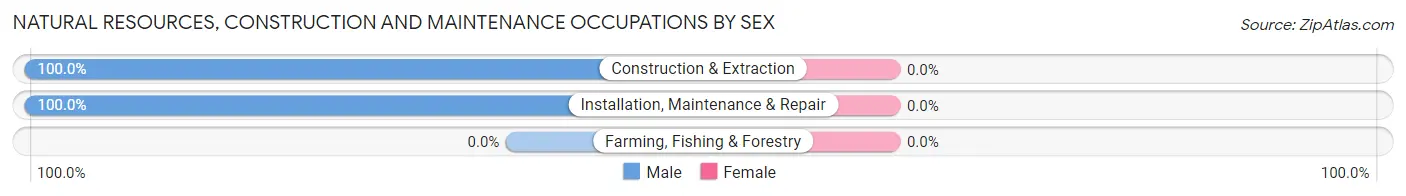
| Occupation | Male | Female |
| Farming, Fishing & Forestry | 0 (0.0%) | 0 (0.0%) |
| Construction & Extraction | 92 (100.0%) | 0 (0.0%) |
| Installation, Maintenance & Repair | 11 (100.0%) | 0 (0.0%) |
| Total (Category) | 103 (100.0%) | 0 (0.0%) |
| Total (Overall) | 203 (51.3%) | 193 (48.7%) |
Production, Transportation and Moving Occupations
The most common Production, Transportation and Moving occupations in McKinney Acres are Material Moving (37 | 9.3%), and Production (23 | 5.8%).
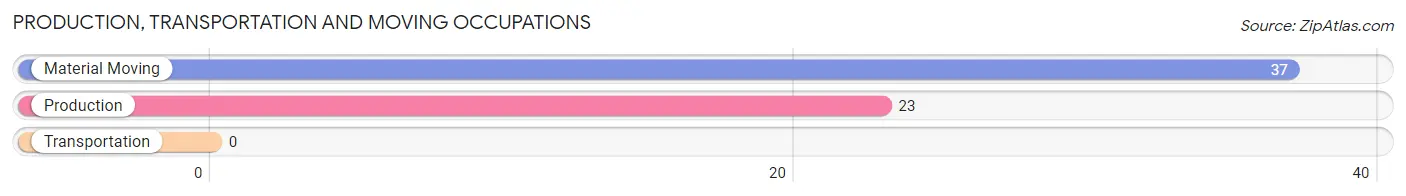
Production, Transportation and Moving Occupations by Sex
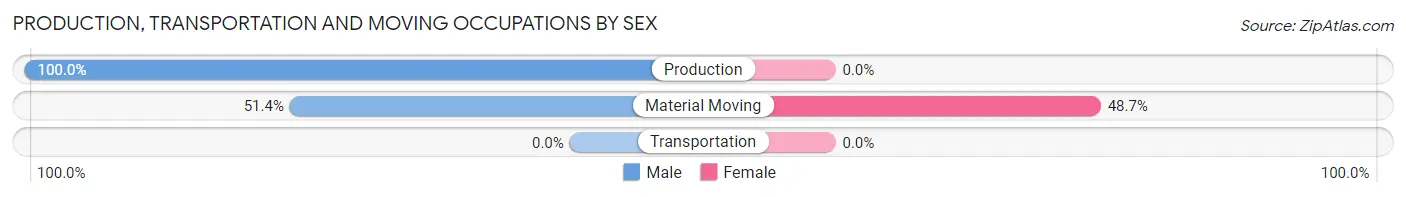
| Occupation | Male | Female |
| Production | 23 (100.0%) | 0 (0.0%) |
| Transportation | 0 (0.0%) | 0 (0.0%) |
| Material Moving | 19 (51.3%) | 18 (48.6%) |
| Total (Category) | 42 (70.0%) | 18 (30.0%) |
| Total (Overall) | 203 (51.3%) | 193 (48.7%) |
Employment Industries by Sex in McKinney Acres
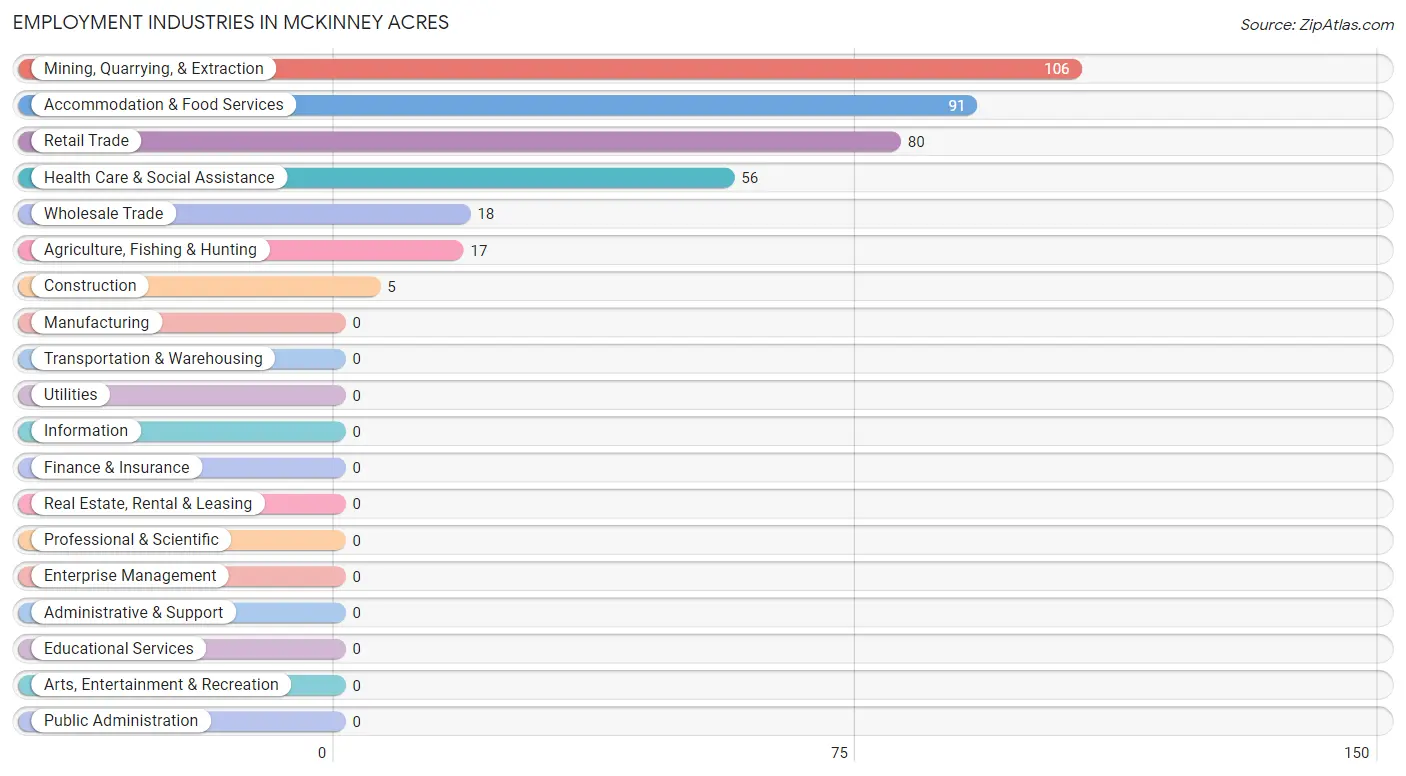
Employment Industries in McKinney Acres
The major employment industries in McKinney Acres include Mining, Quarrying, & Extraction (106 | 26.8%), Accommodation & Food Services (91 | 23.0%), Retail Trade (80 | 20.2%), Health Care & Social Assistance (56 | 14.1%), and Wholesale Trade (18 | 4.5%).
Employment Industries by Sex in McKinney Acres
The McKinney Acres industries that see more men than women are Agriculture, Fishing & Hunting (100.0%), Mining, Quarrying, & Extraction (100.0%), and Construction (100.0%), whereas the industries that tend to have a higher number of women are Wholesale Trade (100.0%), Health Care & Social Assistance (100.0%), and Accommodation & Food Services (100.0%).
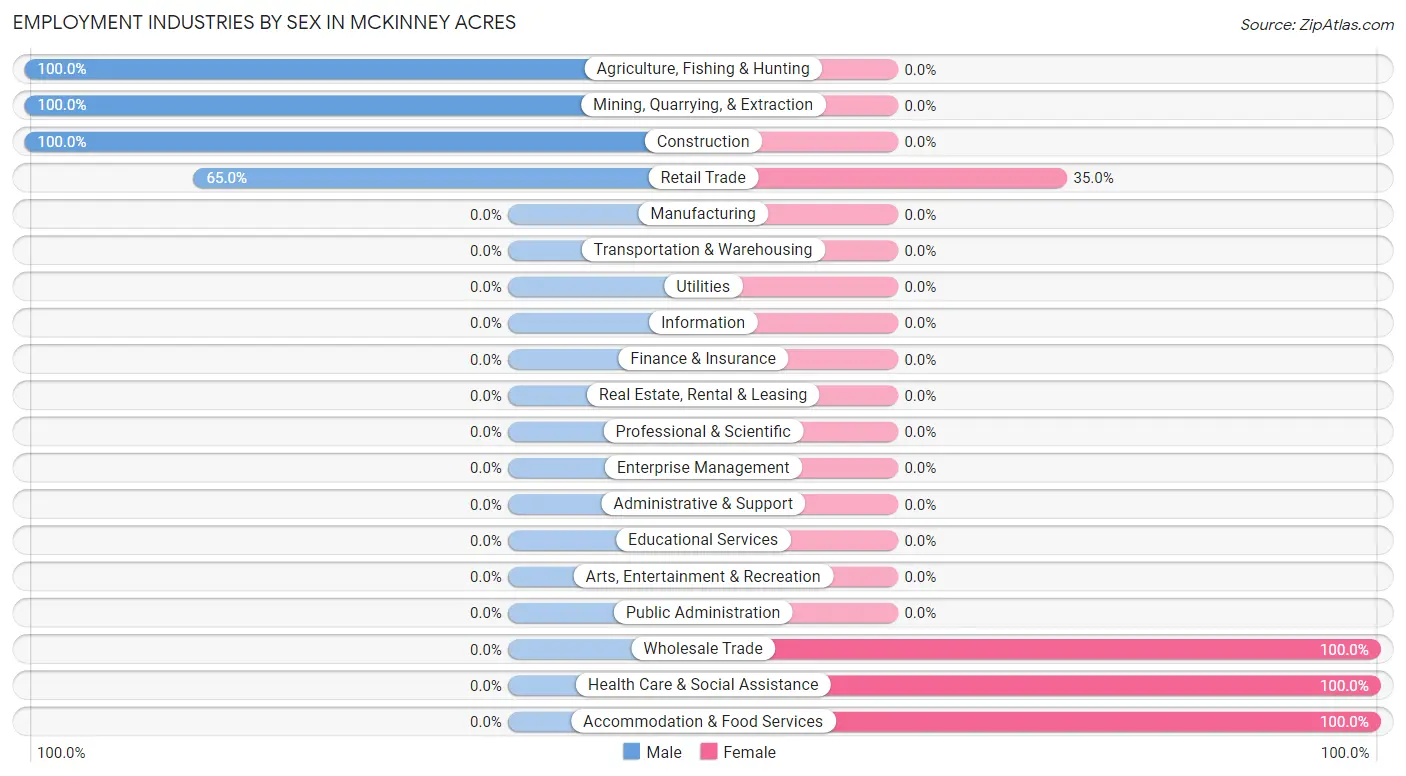
| Industry | Male | Female |
| Agriculture, Fishing & Hunting | 17 (100.0%) | 0 (0.0%) |
| Mining, Quarrying, & Extraction | 106 (100.0%) | 0 (0.0%) |
| Construction | 5 (100.0%) | 0 (0.0%) |
| Manufacturing | 0 (0.0%) | 0 (0.0%) |
| Wholesale Trade | 0 (0.0%) | 18 (100.0%) |
| Retail Trade | 52 (65.0%) | 28 (35.0%) |
| Transportation & Warehousing | 0 (0.0%) | 0 (0.0%) |
| Utilities | 0 (0.0%) | 0 (0.0%) |
| Information | 0 (0.0%) | 0 (0.0%) |
| Finance & Insurance | 0 (0.0%) | 0 (0.0%) |
| Real Estate, Rental & Leasing | 0 (0.0%) | 0 (0.0%) |
| Professional & Scientific | 0 (0.0%) | 0 (0.0%) |
| Enterprise Management | 0 (0.0%) | 0 (0.0%) |
| Administrative & Support | 0 (0.0%) | 0 (0.0%) |
| Educational Services | 0 (0.0%) | 0 (0.0%) |
| Health Care & Social Assistance | 0 (0.0%) | 56 (100.0%) |
| Arts, Entertainment & Recreation | 0 (0.0%) | 0 (0.0%) |
| Accommodation & Food Services | 0 (0.0%) | 91 (100.0%) |
| Public Administration | 0 (0.0%) | 0 (0.0%) |
| Total | 203 (51.3%) | 193 (48.7%) |
Education in McKinney Acres
School Enrollment in McKinney Acres
The most common levels of schooling among the 194 students in McKinney Acres are middle school (84 | 43.3%), college / undergraduate (57 | 29.4%), and high school (53 | 27.3%).
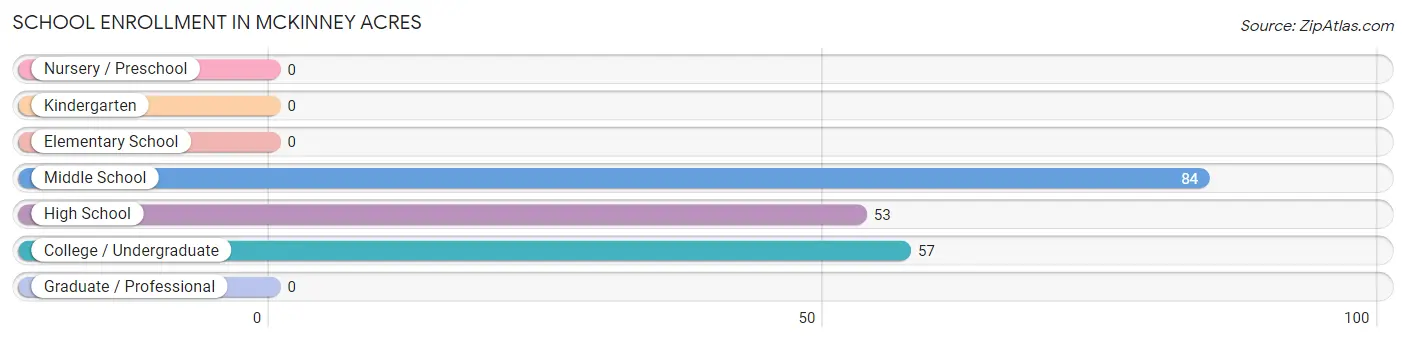
| School Level | # Students | % Students |
| Nursery / Preschool | 0 | 0.0% |
| Kindergarten | 0 | 0.0% |
| Elementary School | 0 | 0.0% |
| Middle School | 84 | 43.3% |
| High School | 53 | 27.3% |
| College / Undergraduate | 57 | 29.4% |
| Graduate / Professional | 0 | 0.0% |
| Total | 194 | 100.0% |
School Enrollment by Age by Funding Source in McKinney Acres
Out of a total of 194 students who are enrolled in schools in McKinney Acres, 29 (14.9%) attend a private institution, while the remaining 165 (85.1%) are enrolled in public schools. The age group of 20 to 24 year olds has the highest likelihood of being enrolled in private schools, with 29 (50.9% in the age bracket) enrolled. Conversely, the age group of 10 to 14 year olds has the lowest likelihood of being enrolled in a private school, with 91 (100.0% in the age bracket) attending a public institution.
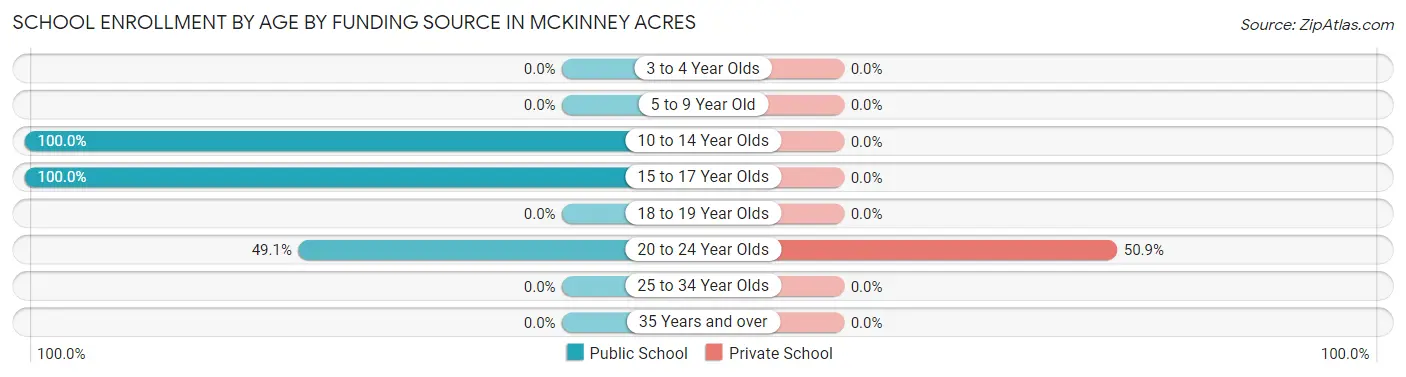
| Age Bracket | Public School | Private School |
| 3 to 4 Year Olds | 0 (0.0%) | 0 (0.0%) |
| 5 to 9 Year Old | 0 (0.0%) | 0 (0.0%) |
| 10 to 14 Year Olds | 91 (100.0%) | 0 (0.0%) |
| 15 to 17 Year Olds | 46 (100.0%) | 0 (0.0%) |
| 18 to 19 Year Olds | 0 (0.0%) | 0 (0.0%) |
| 20 to 24 Year Olds | 28 (49.1%) | 29 (50.9%) |
| 25 to 34 Year Olds | 0 (0.0%) | 0 (0.0%) |
| 35 Years and over | 0 (0.0%) | 0 (0.0%) |
| Total | 165 (85.1%) | 29 (14.9%) |
Educational Attainment by Field of Study in McKinney Acres
, and computers & mathematics (8 | 100.0%) are the most common fields of study among 8 individuals in McKinney Acres who have obtained a bachelor's degree or higher.
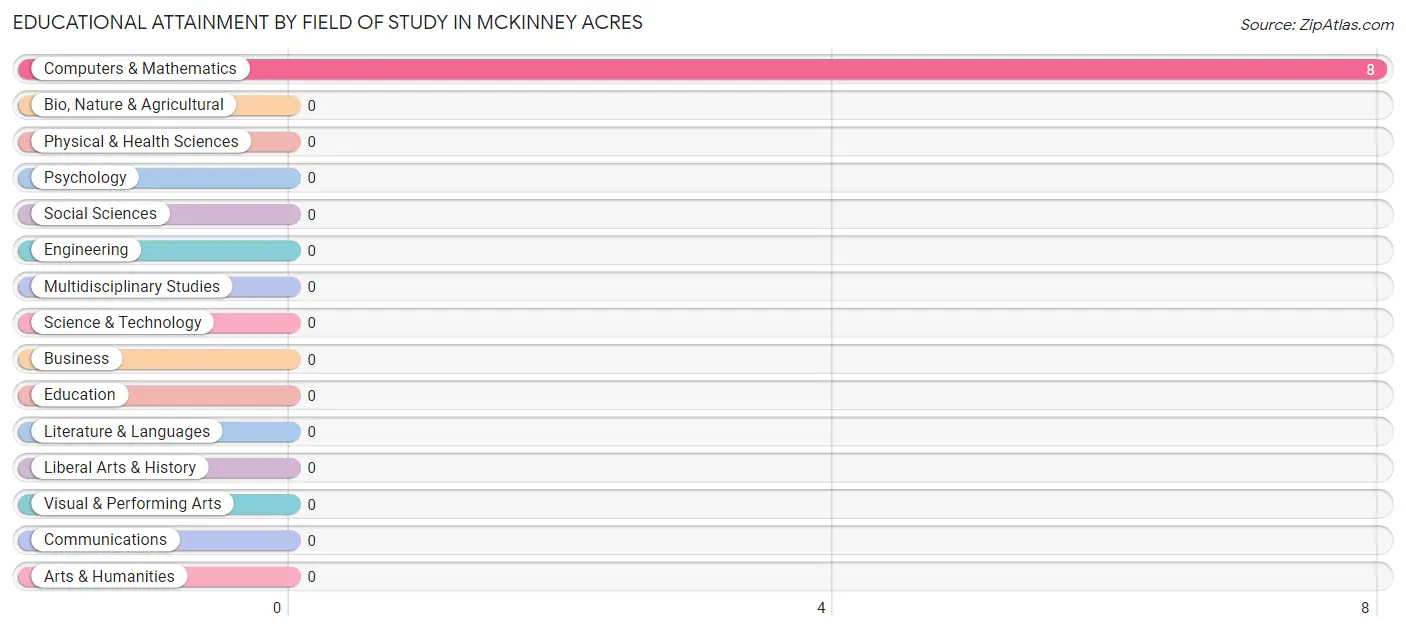
| Field of Study | # Graduates | % Graduates |
| Computers & Mathematics | 8 | 100.0% |
| Bio, Nature & Agricultural | 0 | 0.0% |
| Physical & Health Sciences | 0 | 0.0% |
| Psychology | 0 | 0.0% |
| Social Sciences | 0 | 0.0% |
| Engineering | 0 | 0.0% |
| Multidisciplinary Studies | 0 | 0.0% |
| Science & Technology | 0 | 0.0% |
| Business | 0 | 0.0% |
| Education | 0 | 0.0% |
| Literature & Languages | 0 | 0.0% |
| Liberal Arts & History | 0 | 0.0% |
| Visual & Performing Arts | 0 | 0.0% |
| Communications | 0 | 0.0% |
| Arts & Humanities | 0 | 0.0% |
| Total | 8 | 100.0% |
Transportation & Commute in McKinney Acres
Vehicle Availability by Sex in McKinney Acres
The most prevalent vehicle ownership categories in McKinney Acres are males with 2 vehicles (65, accounting for 32.0%) and females with 2 vehicles (18, making up 33.7%).
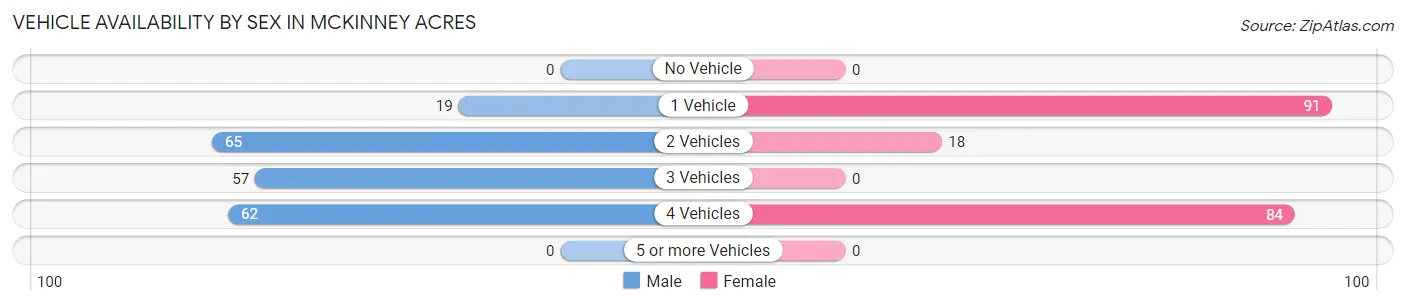
| Vehicles Available | Male | Female |
| No Vehicle | 0 (0.0%) | 0 (0.0%) |
| 1 Vehicle | 19 (9.4%) | 91 (47.1%) |
| 2 Vehicles | 65 (32.0%) | 18 (9.3%) |
| 3 Vehicles | 57 (28.1%) | 0 (0.0%) |
| 4 Vehicles | 62 (30.5%) | 84 (43.5%) |
| 5 or more Vehicles | 0 (0.0%) | 0 (0.0%) |
| Total | 203 (100.0%) | 193 (100.0%) |
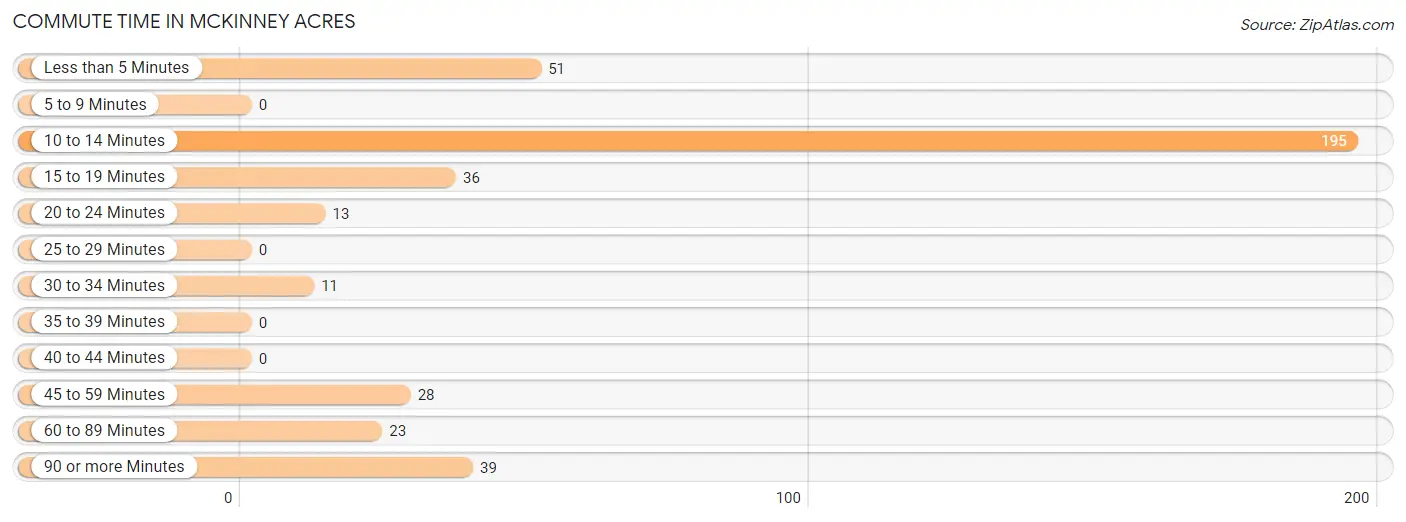
Commute Time in McKinney Acres
The most frequently occuring commute durations in McKinney Acres are 10 to 14 minutes (195 commuters, 49.2%), less than 5 minutes (51 commuters, 12.9%), and 90 or more minutes (39 commuters, 9.9%).
| Commute Time | # Commuters | % Commuters |
| Less than 5 Minutes | 51 | 12.9% |
| 5 to 9 Minutes | 0 | 0.0% |
| 10 to 14 Minutes | 195 | 49.2% |
| 15 to 19 Minutes | 36 | 9.1% |
| 20 to 24 Minutes | 13 | 3.3% |
| 25 to 29 Minutes | 0 | 0.0% |
| 30 to 34 Minutes | 11 | 2.8% |
| 35 to 39 Minutes | 0 | 0.0% |
| 40 to 44 Minutes | 0 | 0.0% |
| 45 to 59 Minutes | 28 | 7.1% |
| 60 to 89 Minutes | 23 | 5.8% |
| 90 or more Minutes | 39 | 9.9% |
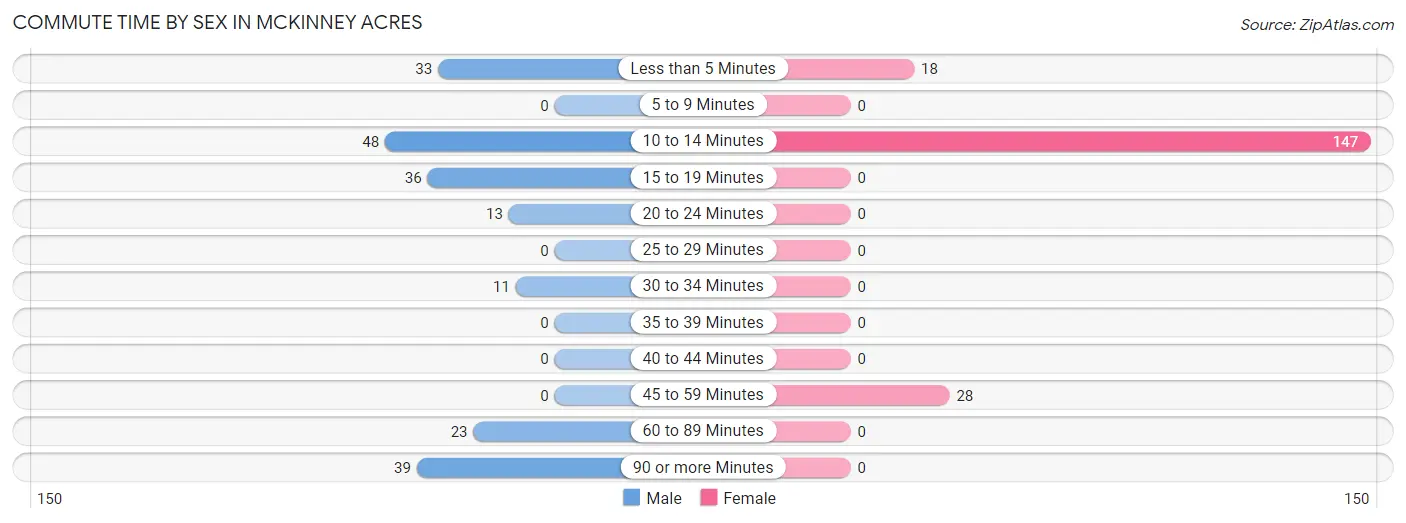
Commute Time by Sex in McKinney Acres
The most common commute times in McKinney Acres are 10 to 14 minutes (48 commuters, 23.6%) for males and 10 to 14 minutes (147 commuters, 76.2%) for females.
| Commute Time | Male | Female |
| Less than 5 Minutes | 33 (16.3%) | 18 (9.3%) |
| 5 to 9 Minutes | 0 (0.0%) | 0 (0.0%) |
| 10 to 14 Minutes | 48 (23.6%) | 147 (76.2%) |
| 15 to 19 Minutes | 36 (17.7%) | 0 (0.0%) |
| 20 to 24 Minutes | 13 (6.4%) | 0 (0.0%) |
| 25 to 29 Minutes | 0 (0.0%) | 0 (0.0%) |
| 30 to 34 Minutes | 11 (5.4%) | 0 (0.0%) |
| 35 to 39 Minutes | 0 (0.0%) | 0 (0.0%) |
| 40 to 44 Minutes | 0 (0.0%) | 0 (0.0%) |
| 45 to 59 Minutes | 0 (0.0%) | 28 (14.5%) |
| 60 to 89 Minutes | 23 (11.3%) | 0 (0.0%) |
| 90 or more Minutes | 39 (19.2%) | 0 (0.0%) |
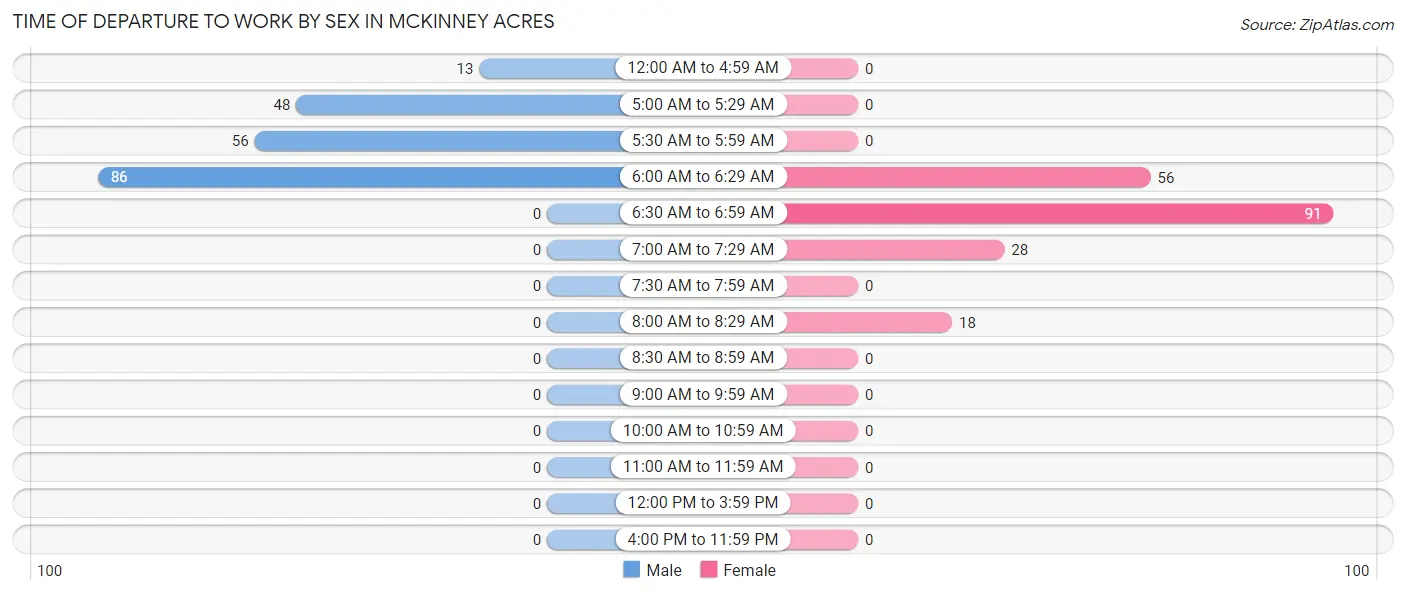
Time of Departure to Work by Sex in McKinney Acres
The most frequent times of departure to work in McKinney Acres are 6:00 AM to 6:29 AM (86, 42.4%) for males and 6:30 AM to 6:59 AM (91, 47.1%) for females.
| Time of Departure | Male | Female |
| 12:00 AM to 4:59 AM | 13 (6.4%) | 0 (0.0%) |
| 5:00 AM to 5:29 AM | 48 (23.6%) | 0 (0.0%) |
| 5:30 AM to 5:59 AM | 56 (27.6%) | 0 (0.0%) |
| 6:00 AM to 6:29 AM | 86 (42.4%) | 56 (29.0%) |
| 6:30 AM to 6:59 AM | 0 (0.0%) | 91 (47.1%) |
| 7:00 AM to 7:29 AM | 0 (0.0%) | 28 (14.5%) |
| 7:30 AM to 7:59 AM | 0 (0.0%) | 0 (0.0%) |
| 8:00 AM to 8:29 AM | 0 (0.0%) | 18 (9.3%) |
| 8:30 AM to 8:59 AM | 0 (0.0%) | 0 (0.0%) |
| 9:00 AM to 9:59 AM | 0 (0.0%) | 0 (0.0%) |
| 10:00 AM to 10:59 AM | 0 (0.0%) | 0 (0.0%) |
| 11:00 AM to 11:59 AM | 0 (0.0%) | 0 (0.0%) |
| 12:00 PM to 3:59 PM | 0 (0.0%) | 0 (0.0%) |
| 4:00 PM to 11:59 PM | 0 (0.0%) | 0 (0.0%) |
| Total | 203 (100.0%) | 193 (100.0%) |
Housing Occupancy in McKinney Acres
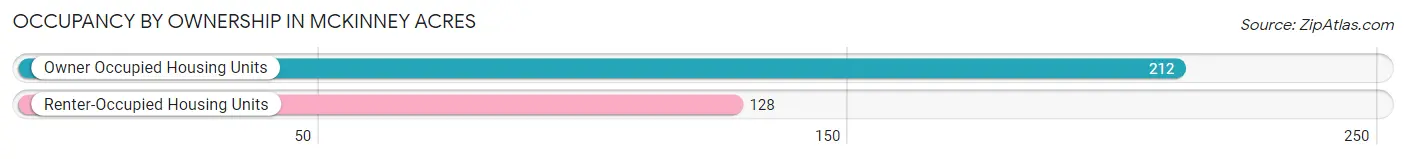
Occupancy by Ownership in McKinney Acres
Of the total 340 dwellings in McKinney Acres, owner-occupied units account for 212 (62.4%), while renter-occupied units make up 128 (37.7%).
| Occupancy | # Housing Units | % Housing Units |
| Owner Occupied Housing Units | 212 | 62.4% |
| Renter-Occupied Housing Units | 128 | 37.7% |
| Total Occupied Housing Units | 340 | 100.0% |
Occupancy by Household Size in McKinney Acres
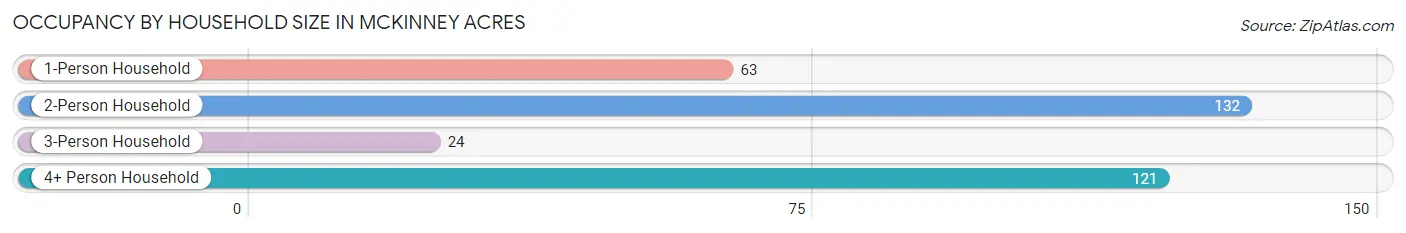
| Household Size | # Housing Units | % Housing Units |
| 1-Person Household | 63 | 18.5% |
| 2-Person Household | 132 | 38.8% |
| 3-Person Household | 24 | 7.1% |
| 4+ Person Household | 121 | 35.6% |
| Total Housing Units | 340 | 100.0% |
Occupancy by Ownership by Household Size in McKinney Acres
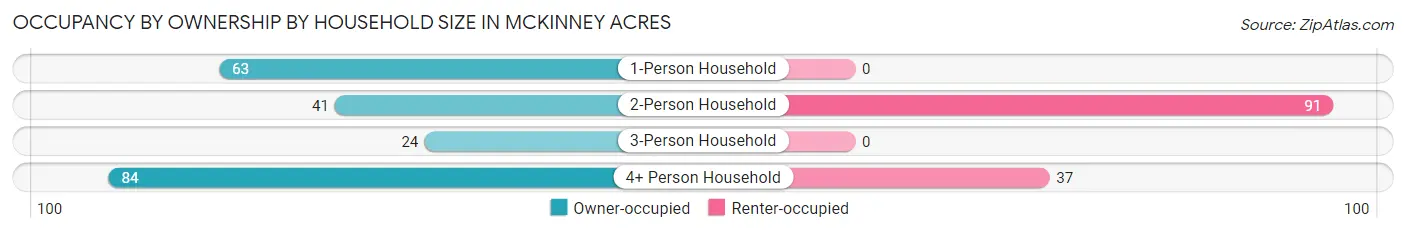
| Household Size | Owner-occupied | Renter-occupied |
| 1-Person Household | 63 (100.0%) | 0 (0.0%) |
| 2-Person Household | 41 (31.1%) | 91 (68.9%) |
| 3-Person Household | 24 (100.0%) | 0 (0.0%) |
| 4+ Person Household | 84 (69.4%) | 37 (30.6%) |
| Total Housing Units | 212 (62.4%) | 128 (37.7%) |
Occupancy by Educational Attainment in McKinney Acres
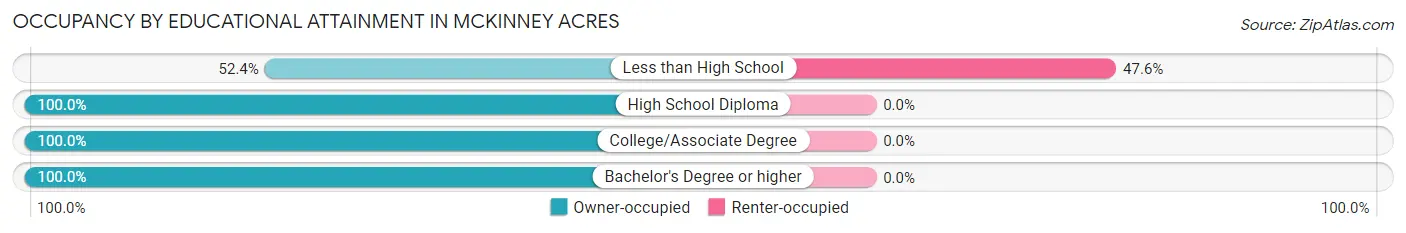
| Household Size | Owner-occupied | Renter-occupied |
| Less than High School | 141 (52.4%) | 128 (47.6%) |
| High School Diploma | 17 (100.0%) | 0 (0.0%) |
| College/Associate Degree | 46 (100.0%) | 0 (0.0%) |
| Bachelor's Degree or higher | 8 (100.0%) | 0 (0.0%) |
Occupancy by Age of Householder in McKinney Acres
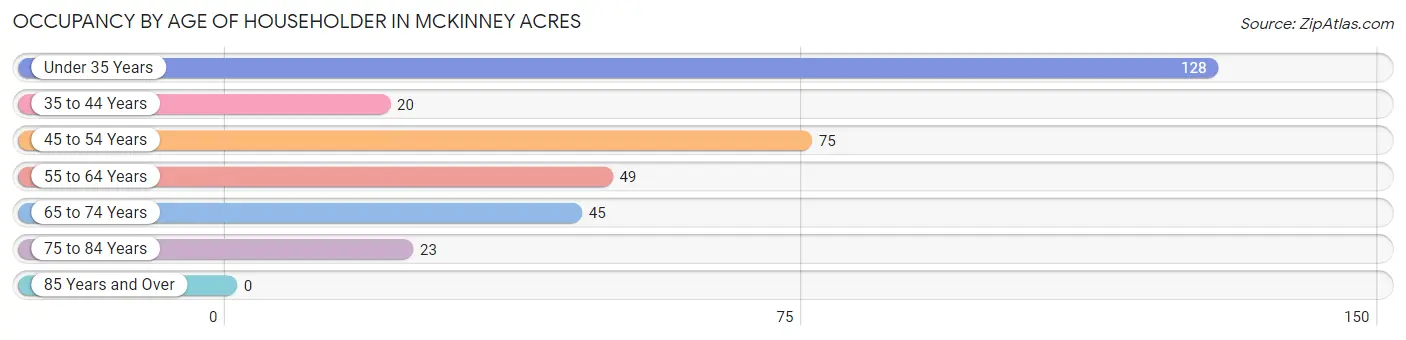
| Age Bracket | # Households | % Households |
| Under 35 Years | 128 | 37.7% |
| 35 to 44 Years | 20 | 5.9% |
| 45 to 54 Years | 75 | 22.1% |
| 55 to 64 Years | 49 | 14.4% |
| 65 to 74 Years | 45 | 13.2% |
| 75 to 84 Years | 23 | 6.8% |
| 85 Years and Over | 0 | 0.0% |
| Total | 340 | 100.0% |
Housing Finances in McKinney Acres
Median Income by Occupancy in McKinney Acres
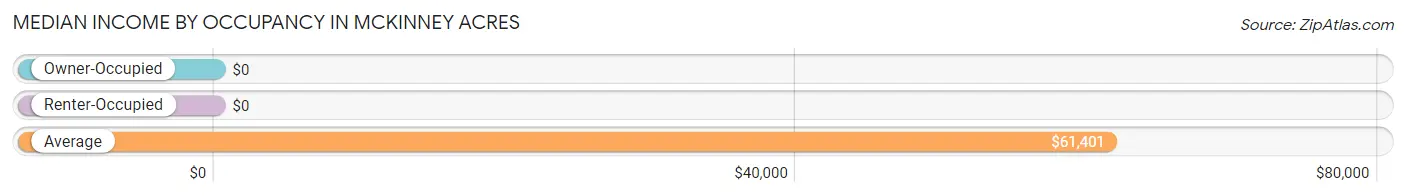
| Occupancy Type | # Households | Median Income |
| Owner-Occupied | 212 (62.4%) | $0 |
| Renter-Occupied | 128 (37.7%) | $0 |
| Average | 340 (100.0%) | $61,401 |
Occupancy by Householder Income Bracket in McKinney Acres
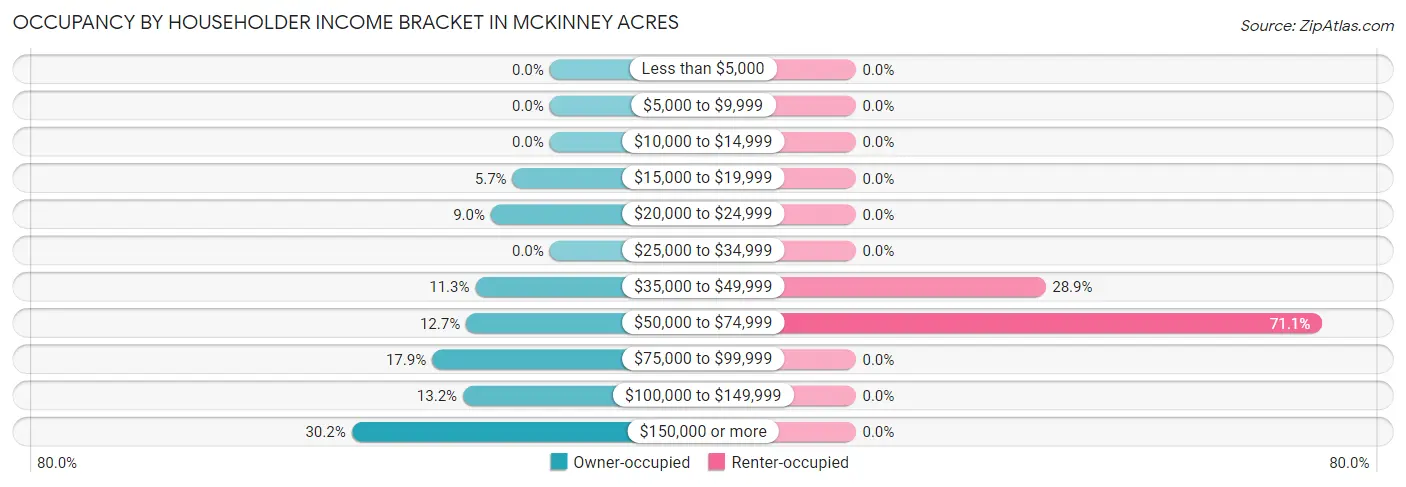
| Income Bracket | Owner-occupied | Renter-occupied |
| Less than $5,000 | 0 (0.0%) | 0 (0.0%) |
| $5,000 to $9,999 | 0 (0.0%) | 0 (0.0%) |
| $10,000 to $14,999 | 0 (0.0%) | 0 (0.0%) |
| $15,000 to $19,999 | 12 (5.7%) | 0 (0.0%) |
| $20,000 to $24,999 | 19 (9.0%) | 0 (0.0%) |
| $25,000 to $34,999 | 0 (0.0%) | 0 (0.0%) |
| $35,000 to $49,999 | 24 (11.3%) | 37 (28.9%) |
| $50,000 to $74,999 | 27 (12.7%) | 91 (71.1%) |
| $75,000 to $99,999 | 38 (17.9%) | 0 (0.0%) |
| $100,000 to $149,999 | 28 (13.2%) | 0 (0.0%) |
| $150,000 or more | 64 (30.2%) | 0 (0.0%) |
| Total | 212 (100.0%) | 128 (100.0%) |
Monthly Housing Cost Tiers in McKinney Acres
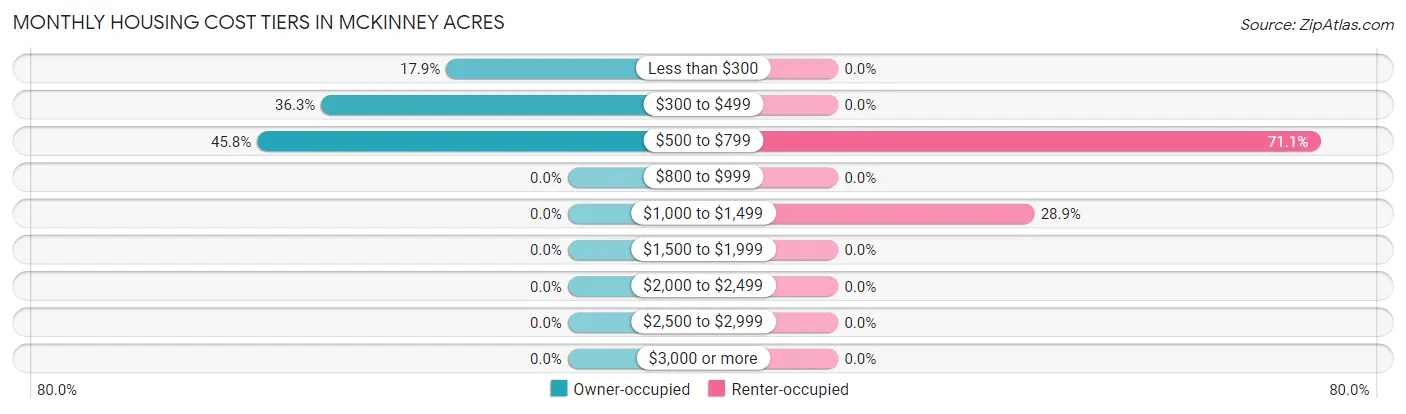
| Monthly Cost | Owner-occupied | Renter-occupied |
| Less than $300 | 38 (17.9%) | 0 (0.0%) |
| $300 to $499 | 77 (36.3%) | 0 (0.0%) |
| $500 to $799 | 97 (45.8%) | 91 (71.1%) |
| $800 to $999 | 0 (0.0%) | 0 (0.0%) |
| $1,000 to $1,499 | 0 (0.0%) | 37 (28.9%) |
| $1,500 to $1,999 | 0 (0.0%) | 0 (0.0%) |
| $2,000 to $2,499 | 0 (0.0%) | 0 (0.0%) |
| $2,500 to $2,999 | 0 (0.0%) | 0 (0.0%) |
| $3,000 or more | 0 (0.0%) | 0 (0.0%) |
| Total | 212 (100.0%) | 128 (100.0%) |
Physical Housing Characteristics in McKinney Acres
Housing Structures in McKinney Acres
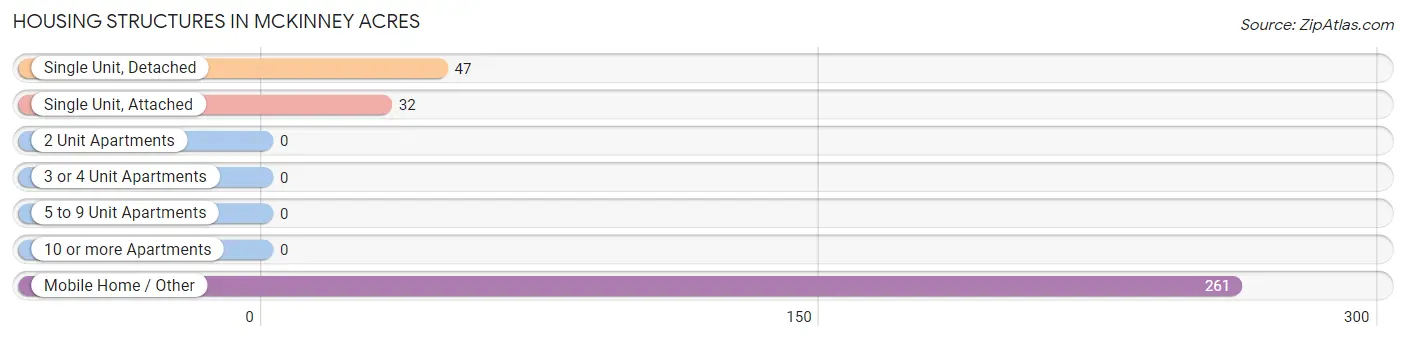
| Structure Type | # Housing Units | % Housing Units |
| Single Unit, Detached | 47 | 13.8% |
| Single Unit, Attached | 32 | 9.4% |
| 2 Unit Apartments | 0 | 0.0% |
| 3 or 4 Unit Apartments | 0 | 0.0% |
| 5 to 9 Unit Apartments | 0 | 0.0% |
| 10 or more Apartments | 0 | 0.0% |
| Mobile Home / Other | 261 | 76.8% |
| Total | 340 | 100.0% |
Housing Structures by Occupancy in McKinney Acres
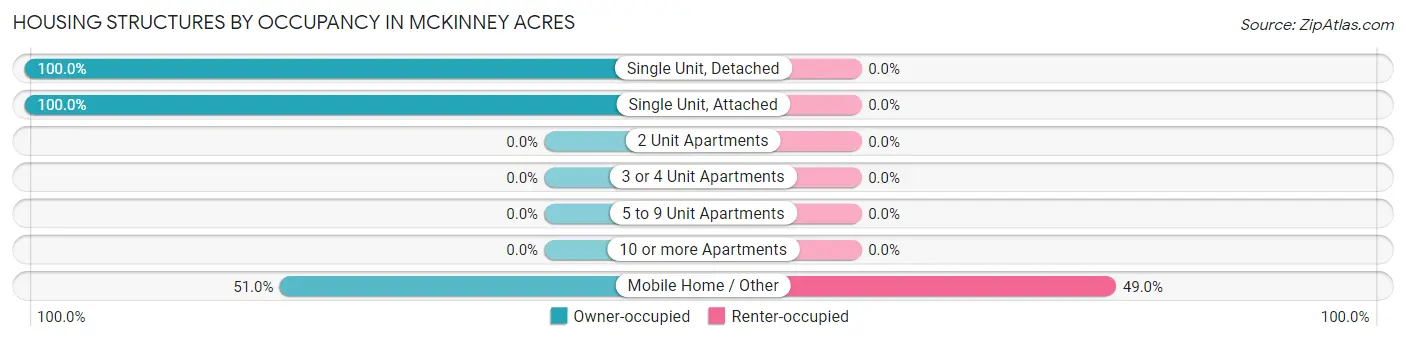
| Structure Type | Owner-occupied | Renter-occupied |
| Single Unit, Detached | 47 (100.0%) | 0 (0.0%) |
| Single Unit, Attached | 32 (100.0%) | 0 (0.0%) |
| 2 Unit Apartments | 0 (0.0%) | 0 (0.0%) |
| 3 or 4 Unit Apartments | 0 (0.0%) | 0 (0.0%) |
| 5 to 9 Unit Apartments | 0 (0.0%) | 0 (0.0%) |
| 10 or more Apartments | 0 (0.0%) | 0 (0.0%) |
| Mobile Home / Other | 133 (51.0%) | 128 (49.0%) |
| Total | 212 (62.4%) | 128 (37.7%) |
Housing Structures by Number of Rooms in McKinney Acres
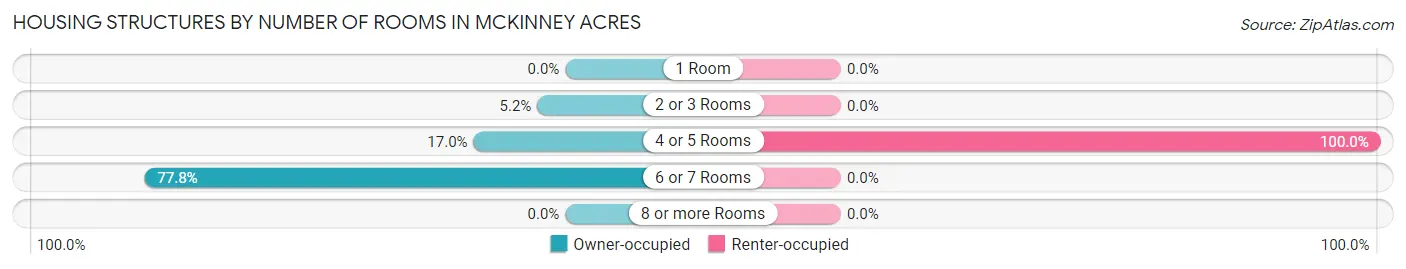
| Number of Rooms | Owner-occupied | Renter-occupied |
| 1 Room | 0 (0.0%) | 0 (0.0%) |
| 2 or 3 Rooms | 11 (5.2%) | 0 (0.0%) |
| 4 or 5 Rooms | 36 (17.0%) | 128 (100.0%) |
| 6 or 7 Rooms | 165 (77.8%) | 0 (0.0%) |
| 8 or more Rooms | 0 (0.0%) | 0 (0.0%) |
| Total | 212 (100.0%) | 128 (100.0%) |
Housing Structure by Heating Type in McKinney Acres
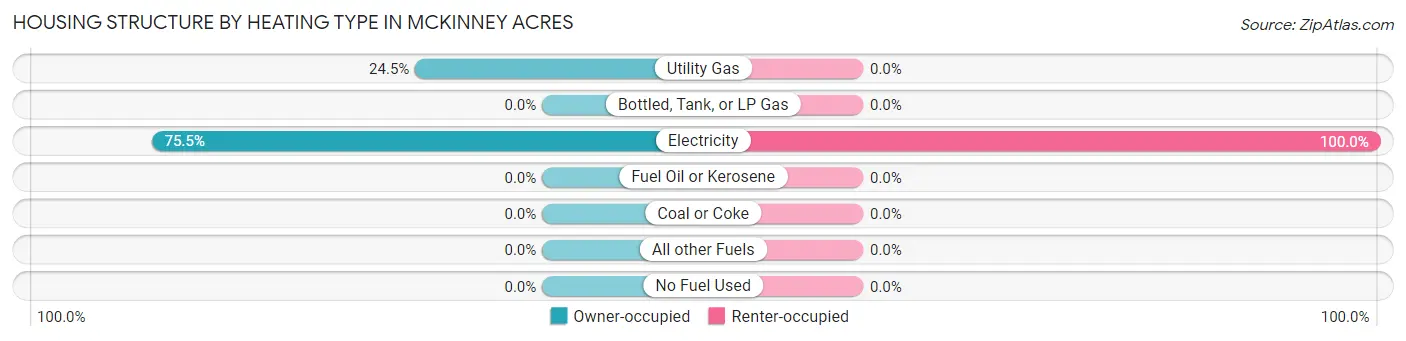
| Heating Type | Owner-occupied | Renter-occupied |
| Utility Gas | 52 (24.5%) | 0 (0.0%) |
| Bottled, Tank, or LP Gas | 0 (0.0%) | 0 (0.0%) |
| Electricity | 160 (75.5%) | 128 (100.0%) |
| Fuel Oil or Kerosene | 0 (0.0%) | 0 (0.0%) |
| Coal or Coke | 0 (0.0%) | 0 (0.0%) |
| All other Fuels | 0 (0.0%) | 0 (0.0%) |
| No Fuel Used | 0 (0.0%) | 0 (0.0%) |
| Total | 212 (100.0%) | 128 (100.0%) |
Household Vehicle Usage in McKinney Acres
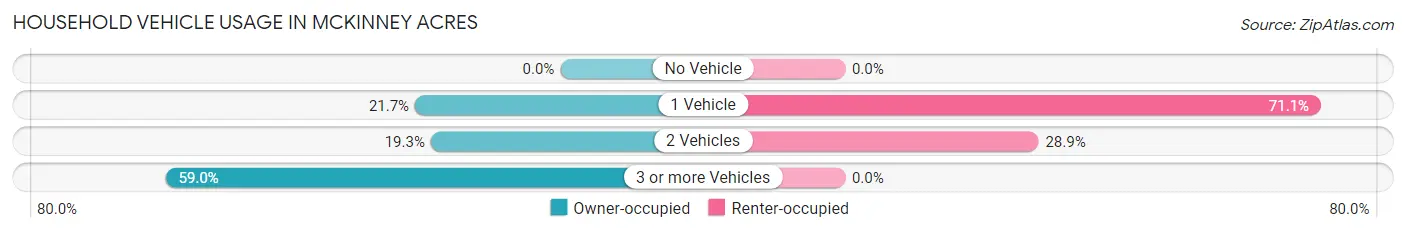
| Vehicles per Household | Owner-occupied | Renter-occupied |
| No Vehicle | 0 (0.0%) | 0 (0.0%) |
| 1 Vehicle | 46 (21.7%) | 91 (71.1%) |
| 2 Vehicles | 41 (19.3%) | 37 (28.9%) |
| 3 or more Vehicles | 125 (59.0%) | 0 (0.0%) |
| Total | 212 (100.0%) | 128 (100.0%) |
Real Estate & Mortgages in McKinney Acres
Real Estate and Mortgage Overview in McKinney Acres
| Characteristic | Without Mortgage | With Mortgage |
| Housing Units | 212 | 0 |
| Median Property Value | $100,900 | $0 |
| Median Household Income | - | - |
| Monthly Housing Costs | $467 | $0 |
| Real Estate Taxes | $1,230 | $0 |
Property Value by Mortgage Status in McKinney Acres
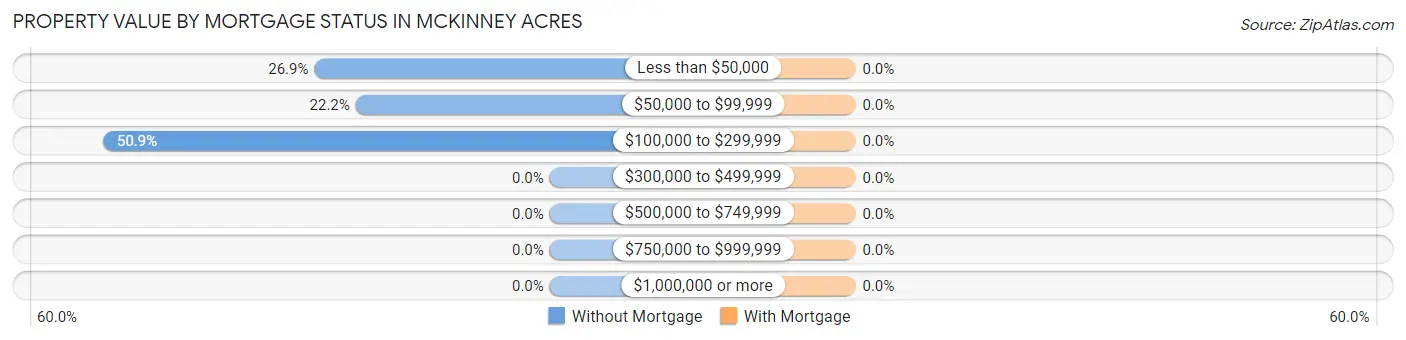
| Property Value | Without Mortgage | With Mortgage |
| Less than $50,000 | 57 (26.9%) | 0 (0.0%) |
| $50,000 to $99,999 | 47 (22.2%) | 0 (0.0%) |
| $100,000 to $299,999 | 108 (50.9%) | 0 (0.0%) |
| $300,000 to $499,999 | 0 (0.0%) | 0 (0.0%) |
| $500,000 to $749,999 | 0 (0.0%) | 0 (0.0%) |
| $750,000 to $999,999 | 0 (0.0%) | 0 (0.0%) |
| $1,000,000 or more | 0 (0.0%) | 0 (0.0%) |
| Total | 212 (100.0%) | 0 (0.0%) |
Household Income by Mortgage Status in McKinney Acres
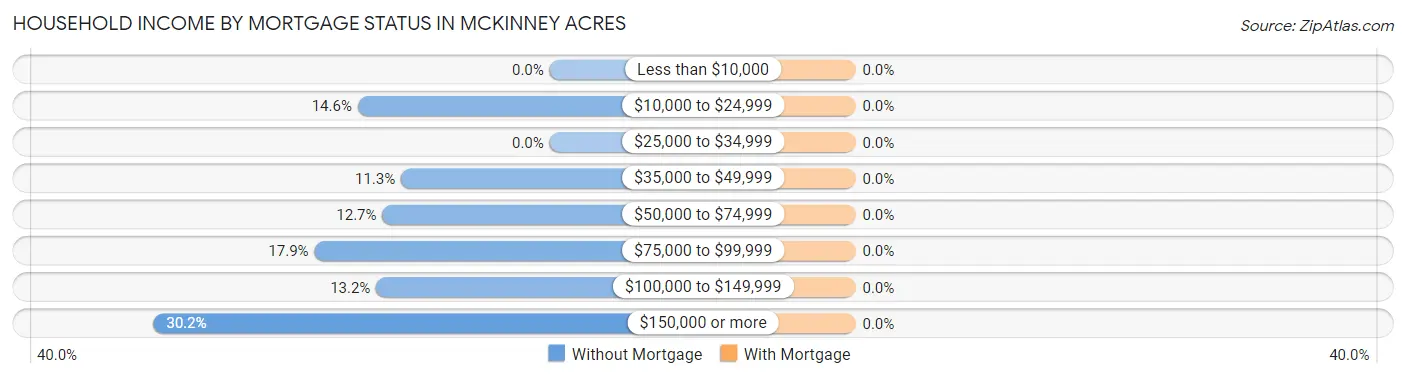
| Household Income | Without Mortgage | With Mortgage |
| Less than $10,000 | 0 (0.0%) | 0 (0.0%) |
| $10,000 to $24,999 | 31 (14.6%) | 0 (0.0%) |
| $25,000 to $34,999 | 0 (0.0%) | 0 (0.0%) |
| $35,000 to $49,999 | 24 (11.3%) | 0 (0.0%) |
| $50,000 to $74,999 | 27 (12.7%) | 0 (0.0%) |
| $75,000 to $99,999 | 38 (17.9%) | 0 (0.0%) |
| $100,000 to $149,999 | 28 (13.2%) | 0 (0.0%) |
| $150,000 or more | 64 (30.2%) | 0 (0.0%) |
| Total | 212 (100.0%) | 0 (0.0%) |
Property Value to Household Income Ratio in McKinney Acres
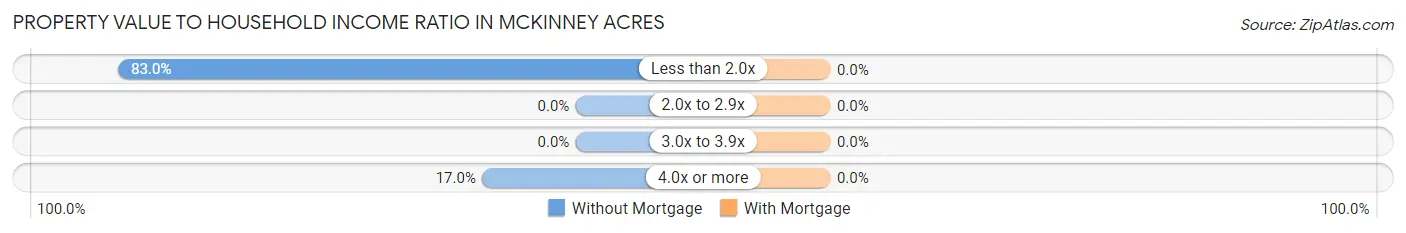
| Value-to-Income Ratio | Without Mortgage | With Mortgage |
| Less than 2.0x | 176 (83.0%) | 0 (0.0%) |
| 2.0x to 2.9x | 0 (0.0%) | 0 (0.0%) |
| 3.0x to 3.9x | 0 (0.0%) | 0 (0.0%) |
| 4.0x or more | 36 (17.0%) | 0 (0.0%) |
| Total | 212 (100.0%) | 0 (0.0%) |
Real Estate Taxes by Mortgage Status in McKinney Acres
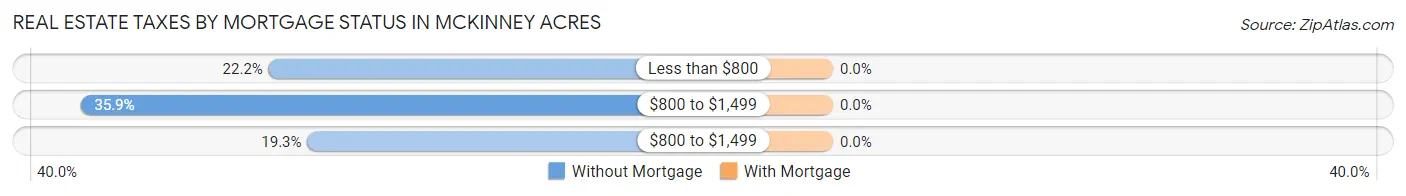
| Property Taxes | Without Mortgage | With Mortgage |
| Less than $800 | 47 (22.2%) | 0 (0.0%) |
| $800 to $1,499 | 76 (35.8%) | 0 (0.0%) |
| $800 to $1,499 | 41 (19.3%) | 0 (0.0%) |
| Total | 212 (100.0%) | 0 (0.0%) |
Health & Disability in McKinney Acres
Health Insurance Coverage by Age in McKinney Acres
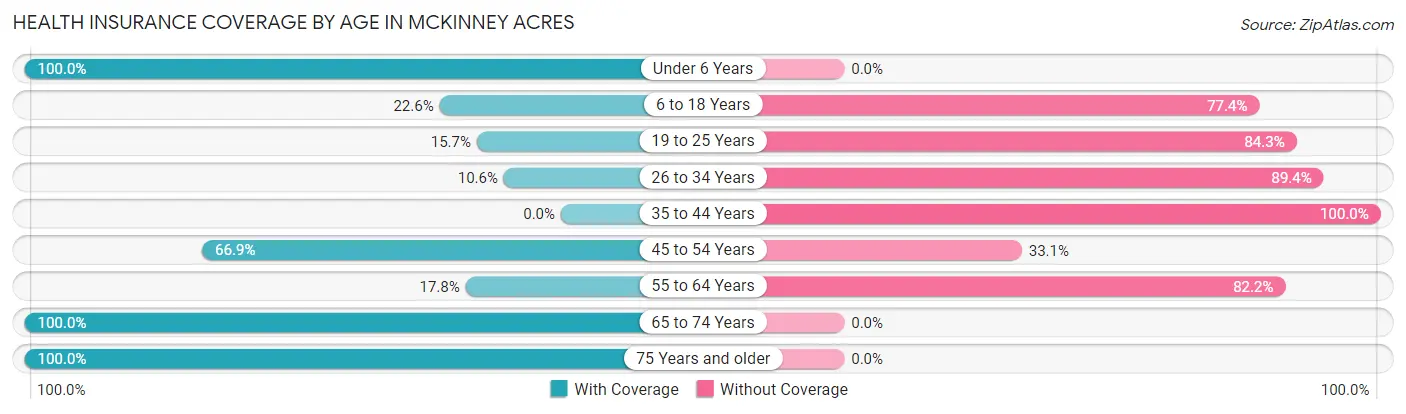
| Age Bracket | With Coverage | Without Coverage |
| Under 6 Years | 29 (100.0%) | 0 (0.0%) |
| 6 to 18 Years | 31 (22.6%) | 106 (77.4%) |
| 19 to 25 Years | 29 (15.7%) | 156 (84.3%) |
| 26 to 34 Years | 10 (10.6%) | 84 (89.4%) |
| 35 to 44 Years | 0 (0.0%) | 85 (100.0%) |
| 45 to 54 Years | 95 (66.9%) | 47 (33.1%) |
| 55 to 64 Years | 16 (17.8%) | 74 (82.2%) |
| 65 to 74 Years | 76 (100.0%) | 0 (0.0%) |
| 75 Years and older | 30 (100.0%) | 0 (0.0%) |
| Total | 316 (36.4%) | 552 (63.6%) |
Health Insurance Coverage by Citizenship Status in McKinney Acres
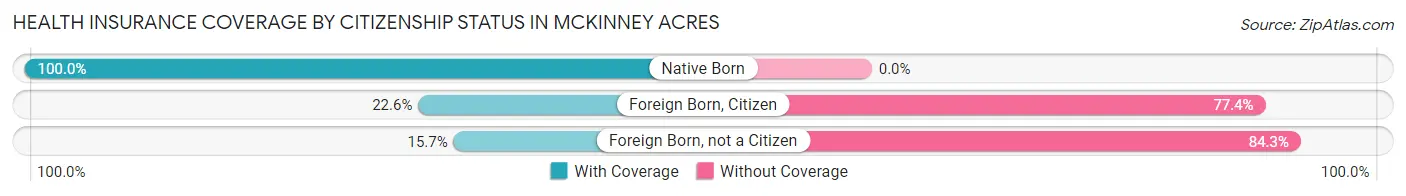
| Citizenship Status | With Coverage | Without Coverage |
| Native Born | 29 (100.0%) | 0 (0.0%) |
| Foreign Born, Citizen | 31 (22.6%) | 106 (77.4%) |
| Foreign Born, not a Citizen | 29 (15.7%) | 156 (84.3%) |
Health Insurance Coverage by Household Income in McKinney Acres
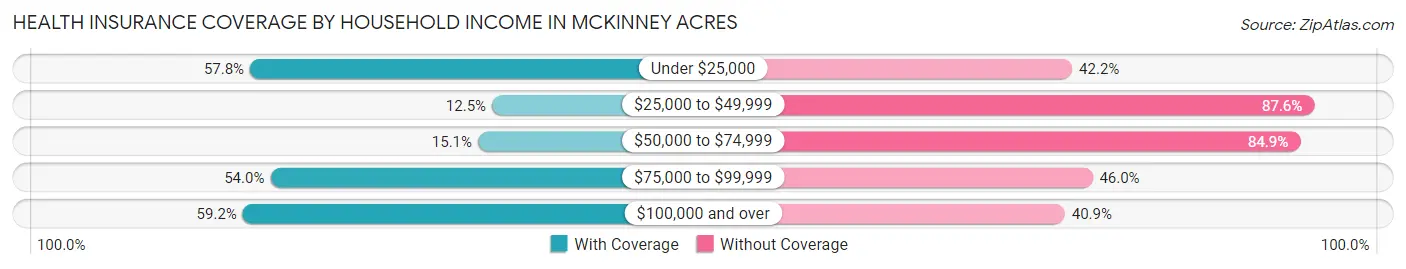
| Household Income | With Coverage | Without Coverage |
| Under $25,000 | 26 (57.8%) | 19 (42.2%) |
| $25,000 to $49,999 | 29 (12.4%) | 204 (87.5%) |
| $50,000 to $74,999 | 27 (15.1%) | 152 (84.9%) |
| $75,000 to $99,999 | 95 (54.0%) | 81 (46.0%) |
| $100,000 and over | 139 (59.2%) | 96 (40.8%) |
Public vs Private Health Insurance Coverage by Age in McKinney Acres
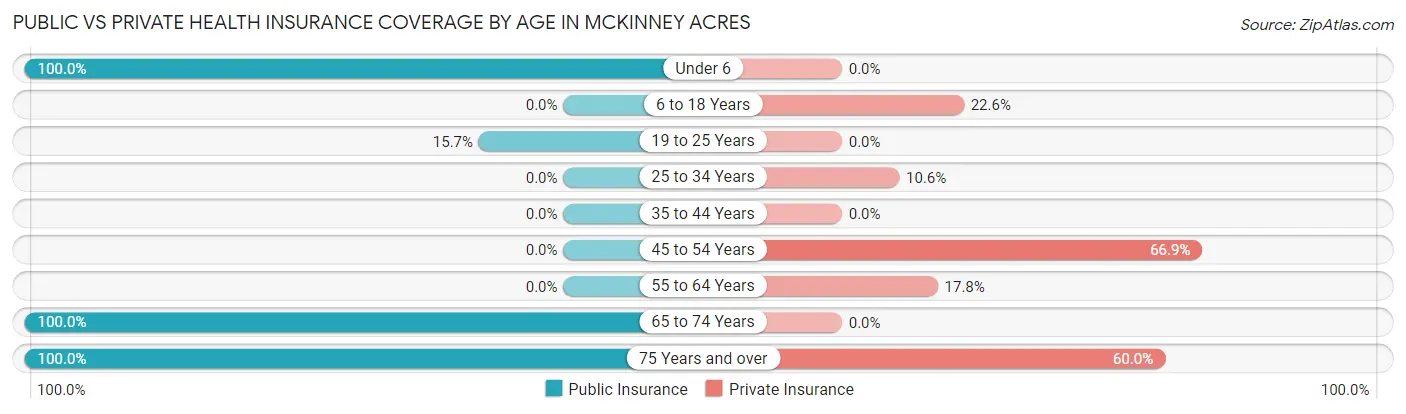
| Age Bracket | Public Insurance | Private Insurance |
| Under 6 | 29 (100.0%) | 0 (0.0%) |
| 6 to 18 Years | 0 (0.0%) | 31 (22.6%) |
| 19 to 25 Years | 29 (15.7%) | 0 (0.0%) |
| 25 to 34 Years | 0 (0.0%) | 10 (10.6%) |
| 35 to 44 Years | 0 (0.0%) | 0 (0.0%) |
| 45 to 54 Years | 0 (0.0%) | 95 (66.9%) |
| 55 to 64 Years | 0 (0.0%) | 16 (17.8%) |
| 65 to 74 Years | 76 (100.0%) | 0 (0.0%) |
| 75 Years and over | 30 (100.0%) | 18 (60.0%) |
| Total | 164 (18.9%) | 170 (19.6%) |
Disability Status by Sex by Age in McKinney Acres
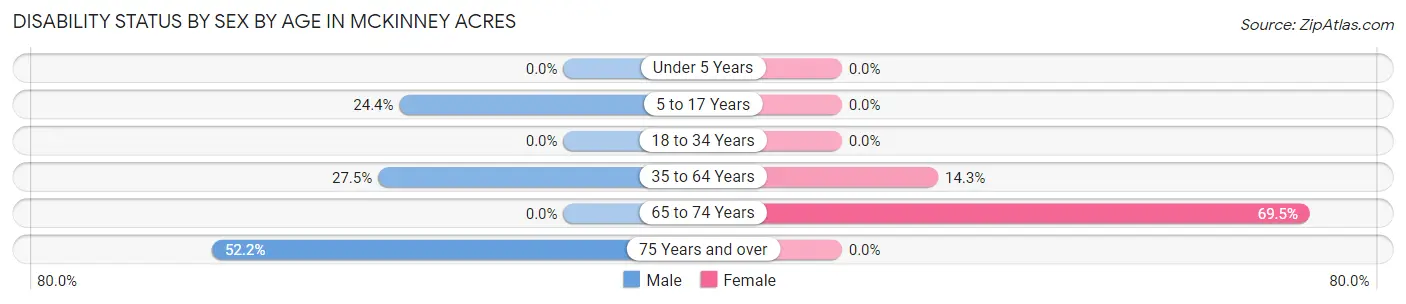
| Age Bracket | Male | Female |
| Under 5 Years | 0 (0.0%) | 0 (0.0%) |
| 5 to 17 Years | 28 (24.3%) | 0 (0.0%) |
| 18 to 34 Years | 0 (0.0%) | 0 (0.0%) |
| 35 to 64 Years | 41 (27.5%) | 24 (14.3%) |
| 65 to 74 Years | 0 (0.0%) | 41 (69.5%) |
| 75 Years and over | 12 (52.2%) | 0 (0.0%) |
Disability Class by Sex by Age in McKinney Acres
Disability Class: Hearing Difficulty
| Age Bracket | Male | Female |
| Under 5 Years | 0 (0.0%) | 0 (0.0%) |
| 5 to 17 Years | 0 (0.0%) | 0 (0.0%) |
| 18 to 34 Years | 0 (0.0%) | 0 (0.0%) |
| 35 to 64 Years | 0 (0.0%) | 0 (0.0%) |
| 65 to 74 Years | 0 (0.0%) | 0 (0.0%) |
| 75 Years and over | 0 (0.0%) | 0 (0.0%) |
Disability Class: Vision Difficulty
| Age Bracket | Male | Female |
| Under 5 Years | 0 (0.0%) | 0 (0.0%) |
| 5 to 17 Years | 0 (0.0%) | 0 (0.0%) |
| 18 to 34 Years | 0 (0.0%) | 0 (0.0%) |
| 35 to 64 Years | 0 (0.0%) | 0 (0.0%) |
| 65 to 74 Years | 0 (0.0%) | 0 (0.0%) |
| 75 Years and over | 0 (0.0%) | 0 (0.0%) |
Disability Class: Cognitive Difficulty
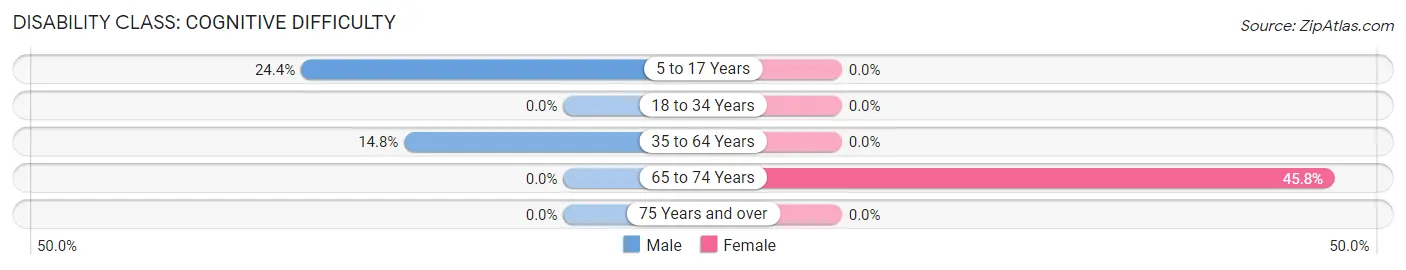
| Age Bracket | Male | Female |
| 5 to 17 Years | 28 (24.3%) | 0 (0.0%) |
| 18 to 34 Years | 0 (0.0%) | 0 (0.0%) |
| 35 to 64 Years | 22 (14.8%) | 0 (0.0%) |
| 65 to 74 Years | 0 (0.0%) | 27 (45.8%) |
| 75 Years and over | 0 (0.0%) | 0 (0.0%) |
Disability Class: Ambulatory Difficulty
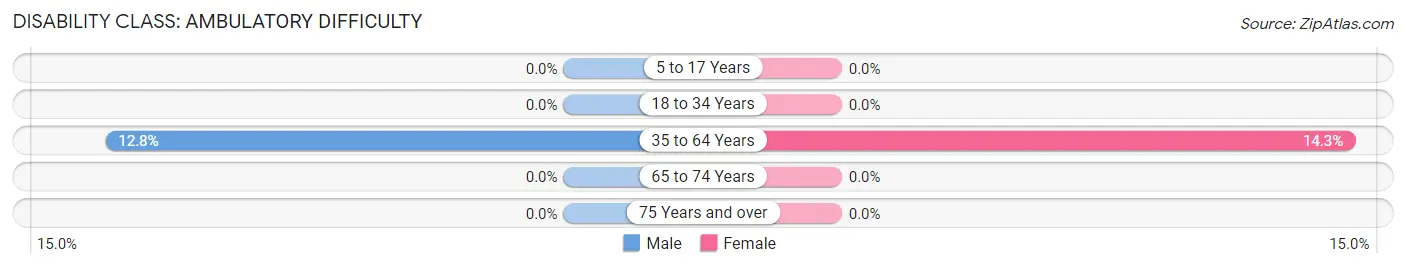
| Age Bracket | Male | Female |
| 5 to 17 Years | 0 (0.0%) | 0 (0.0%) |
| 18 to 34 Years | 0 (0.0%) | 0 (0.0%) |
| 35 to 64 Years | 19 (12.8%) | 24 (14.3%) |
| 65 to 74 Years | 0 (0.0%) | 0 (0.0%) |
| 75 Years and over | 0 (0.0%) | 0 (0.0%) |
Disability Class: Self-Care Difficulty
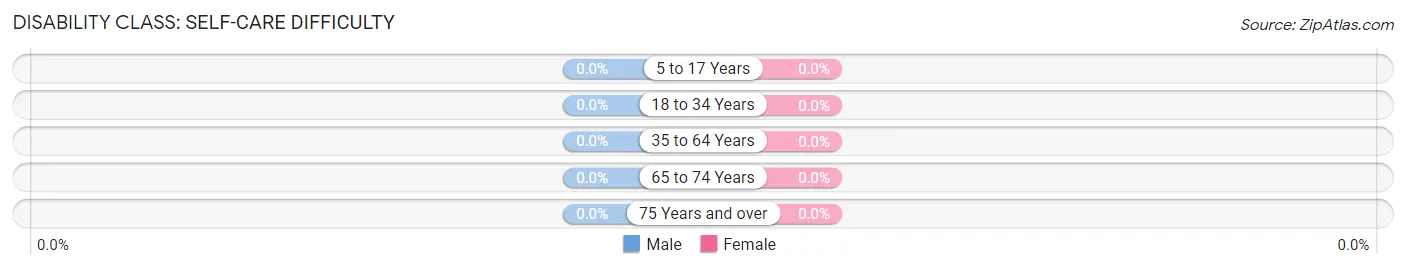
| Age Bracket | Male | Female |
| 5 to 17 Years | 0 (0.0%) | 0 (0.0%) |
| 18 to 34 Years | 0 (0.0%) | 0 (0.0%) |
| 35 to 64 Years | 0 (0.0%) | 0 (0.0%) |
| 65 to 74 Years | 0 (0.0%) | 0 (0.0%) |
| 75 Years and over | 0 (0.0%) | 0 (0.0%) |
Technology Access in McKinney Acres
Computing Device Access in McKinney Acres
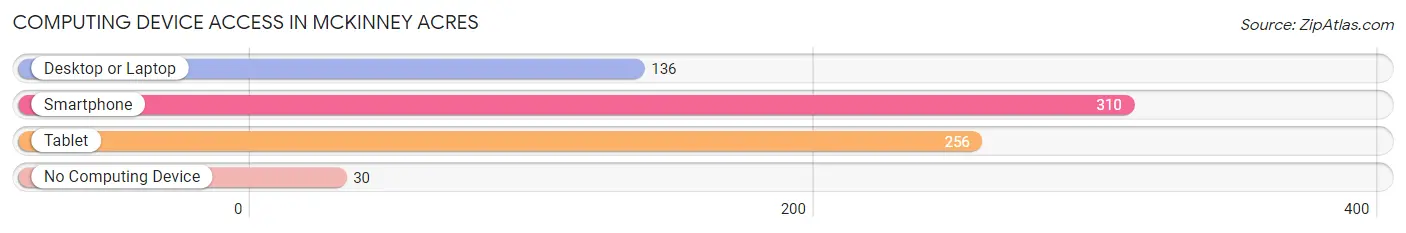
| Device Type | # Households | % Households |
| Desktop or Laptop | 136 | 40.0% |
| Smartphone | 310 | 91.2% |
| Tablet | 256 | 75.3% |
| No Computing Device | 30 | 8.8% |
| Total | 340 | 100.0% |
Internet Access in McKinney Acres
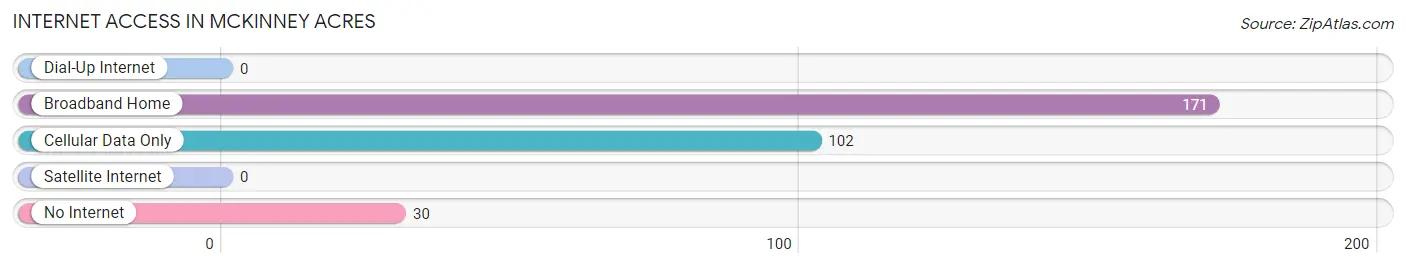
| Internet Type | # Households | % Households |
| Dial-Up Internet | 0 | 0.0% |
| Broadband Home | 171 | 50.3% |
| Cellular Data Only | 102 | 30.0% |
| Satellite Internet | 0 | 0.0% |
| No Internet | 30 | 8.8% |
| Total | 340 | 100.0% |
McKinney Acres Summary
McKinney Acres is a small town located in the state of Texas, United States. It is situated in Collin County, about 30 miles north of Dallas. The town was founded in the late 1800s and has a population of around 1,500 people.
History
McKinney Acres was founded in 1887 by a group of settlers from Kentucky. The town was named after the first settler, William McKinney, who was a veteran of the Civil War. The town was originally a farming community, but it soon developed into a small town with a variety of businesses. In the early 1900s, the town was home to a cotton gin, a blacksmith shop, a general store, and a post office.
In the 1920s, the town began to grow and expand. The population increased and new businesses opened, including a bank, a movie theater, and a hotel. The town also had a school, a library, and a hospital.
In the 1950s, the town began to decline as many of the businesses closed and the population decreased. However, in the late 1980s, the town began to experience a resurgence as new businesses opened and the population increased.
Geography
McKinney Acres is located in Collin County, Texas. It is situated about 30 miles north of Dallas and is bordered by the cities of Plano and Frisco. The town is located in the Blackland Prairie region of Texas, which is characterized by rolling hills and flat plains. The town is located in a humid subtropical climate zone, which means that it experiences hot summers and mild winters.
Economy
McKinney Acres is a small town with a limited economy. The town is primarily a bedroom community, with most of its residents commuting to nearby cities for work. The town does have some businesses, including a few restaurants, a grocery store, and a few small shops. The town also has a few small manufacturing businesses.
Demographics
As of the 2010 census, the population of McKinney Acres was 1,521. The town is predominantly white, with about 85% of the population being white. The remaining 15% of the population is made up of African Americans, Hispanics, and other ethnicities. The median household income in the town is $50,000, and the median home value is $150,000.
McKinney Acres is a small town with a rich history and a diverse population. The town has experienced a resurgence in recent years, and it is now home to a variety of businesses and amenities. The town is a great place to live and work, and it is a great place to raise a family.
Common Questions
What is Per Capita Income in McKinney Acres?
Per Capita income in McKinney Acres is $28,710.
What is the Median Family Income in McKinney Acres?
Median Family Income in McKinney Acres is $61,552.
What is the Median Household income in McKinney Acres?
Median Household Income in McKinney Acres is $61,401.
What is Income or Wage Gap in McKinney Acres?
Income or Wage Gap in McKinney Acres is 23.6%.
Women in McKinney Acres earn 76.4 cents for every dollar earned by a man.
What is Inequality or Gini Index in McKinney Acres?
Inequality or Gini Index in McKinney Acres is 0.33.
What is the Total Population of McKinney Acres?
Total Population of McKinney Acres is 868.
What is the Total Male Population of McKinney Acres?
Total Male Population of McKinney Acres is 516.
What is the Total Female Population of McKinney Acres?
Total Female Population of McKinney Acres is 352.
What is the Ratio of Males per 100 Females in McKinney Acres?
There are 146.59 Males per 100 Females in McKinney Acres.
What is the Ratio of Females per 100 Males in McKinney Acres?
There are 68.22 Females per 100 Males in McKinney Acres.
What is the Median Population Age in McKinney Acres?
Median Population Age in McKinney Acres is 31.9 Years.
What is the Average Family Size in McKinney Acres
Average Family Size in McKinney Acres is 2.7 People.
What is the Average Household Size in McKinney Acres
Average Household Size in McKinney Acres is 2.5 People.
How Large is the Labor Force in McKinney Acres?
There are 413 People in the Labor Forcein in McKinney Acres.
What is the Percentage of People in the Labor Force in McKinney Acres?
57.0% of People are in the Labor Force in McKinney Acres.
What is the Unemployment Rate in McKinney Acres?
Unemployment Rate in McKinney Acres is 4.1%.