Short, OK Map & Demographics
Short Map
Short Overview
$20,837
PER CAPITA INCOME
$45,625
AVG FAMILY INCOME
0.58
INEQUALITY / GINI INDEX
241
TOTAL POPULATION
97
MALE POPULATION
144
FEMALE POPULATION
67.36
MALES / 100 FEMALES
148.45
FEMALES / 100 MALES
53.8
MEDIAN AGE
2.8
AVG FAMILY SIZE
2.4
AVG HOUSEHOLD SIZE
76
LABOR FORCE [ PEOPLE ]
39.8%
PERCENT IN LABOR FORCE
Income in Short
Income Overview in Short
| Characteristic | Number | Measure |
| Per Capita Income | 241 | $20,837 |
| Median Family Income | 77 | $45,625 |
| Mean Family Income | 77 | $65,931 |
| Median Household Income | 99 | $0 |
| Mean Household Income | 99 | $53,545 |
| Income Deficit | 77 | $0 |
| Wage / Income Gap (%) | 241 | 0.00% |
| Wage / Income Gap ($) | 241 | 100.00¢ per $1 |
| Gini / Inequality Index | 241 | 0.58 |
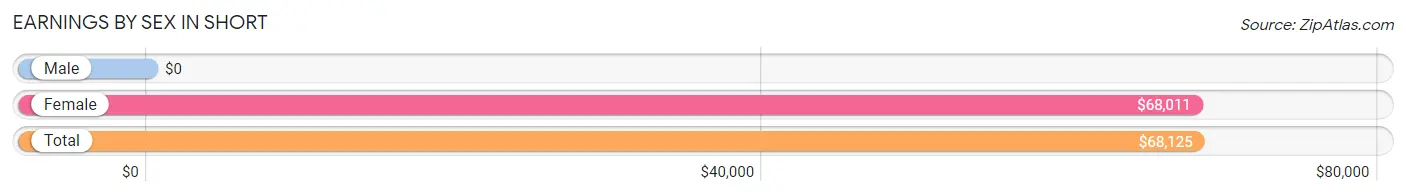
Earnings by Sex in Short
| Sex | Number | Average Earnings |
| Male | 40 (50.6%) | $0 |
| Female | 39 (49.4%) | $68,011 |
| Total | 79 (100.0%) | $68,125 |
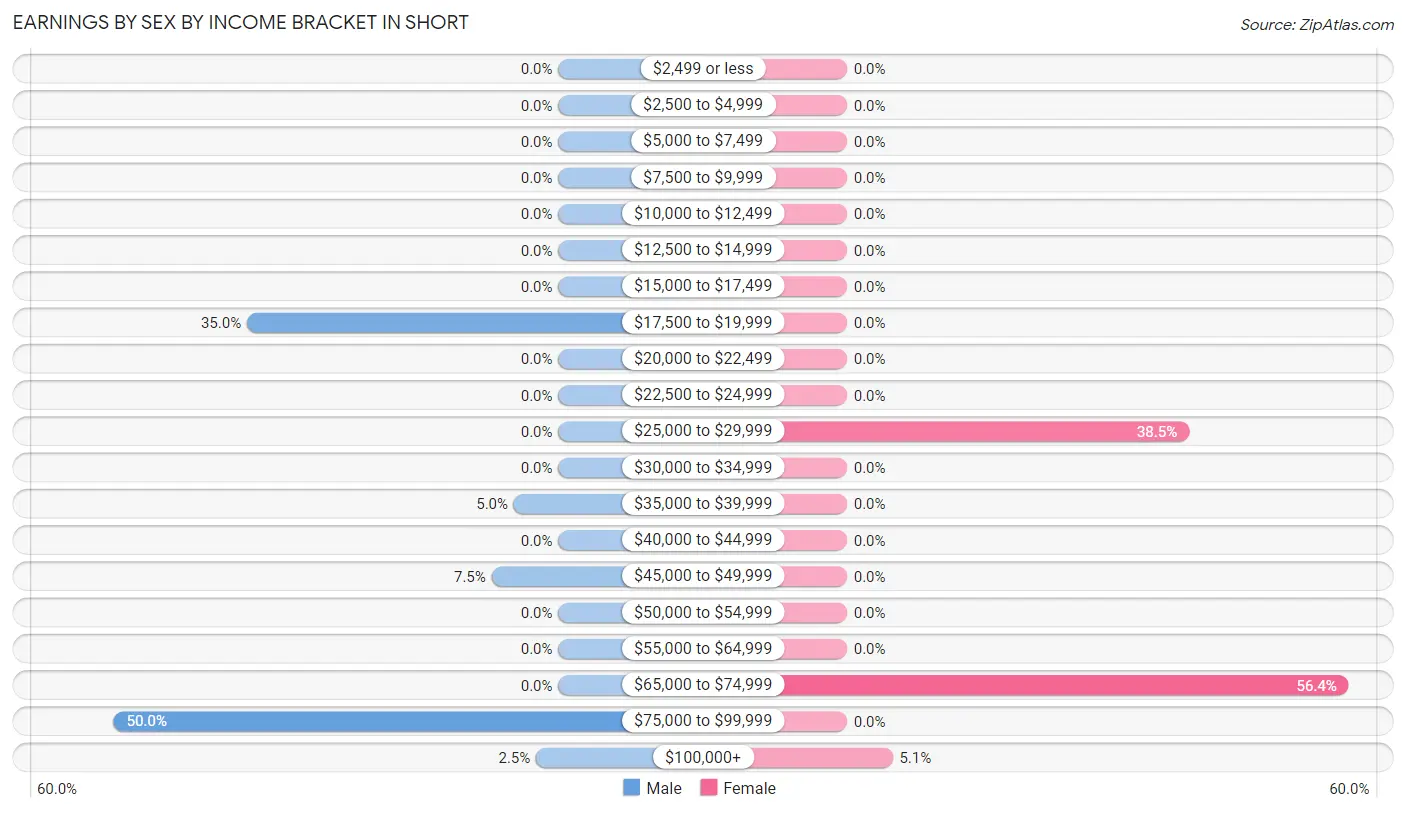
Earnings by Sex by Income Bracket in Short
The most common earnings brackets in Short are $75,000 to $99,999 for men (20 | 50.0%) and $65,000 to $74,999 for women (22 | 56.4%).
| Income | Male | Female |
| $2,499 or less | 0 (0.0%) | 0 (0.0%) |
| $2,500 to $4,999 | 0 (0.0%) | 0 (0.0%) |
| $5,000 to $7,499 | 0 (0.0%) | 0 (0.0%) |
| $7,500 to $9,999 | 0 (0.0%) | 0 (0.0%) |
| $10,000 to $12,499 | 0 (0.0%) | 0 (0.0%) |
| $12,500 to $14,999 | 0 (0.0%) | 0 (0.0%) |
| $15,000 to $17,499 | 0 (0.0%) | 0 (0.0%) |
| $17,500 to $19,999 | 14 (35.0%) | 0 (0.0%) |
| $20,000 to $22,499 | 0 (0.0%) | 0 (0.0%) |
| $22,500 to $24,999 | 0 (0.0%) | 0 (0.0%) |
| $25,000 to $29,999 | 0 (0.0%) | 15 (38.5%) |
| $30,000 to $34,999 | 0 (0.0%) | 0 (0.0%) |
| $35,000 to $39,999 | 2 (5.0%) | 0 (0.0%) |
| $40,000 to $44,999 | 0 (0.0%) | 0 (0.0%) |
| $45,000 to $49,999 | 3 (7.5%) | 0 (0.0%) |
| $50,000 to $54,999 | 0 (0.0%) | 0 (0.0%) |
| $55,000 to $64,999 | 0 (0.0%) | 0 (0.0%) |
| $65,000 to $74,999 | 0 (0.0%) | 22 (56.4%) |
| $75,000 to $99,999 | 20 (50.0%) | 0 (0.0%) |
| $100,000+ | 1 (2.5%) | 2 (5.1%) |
| Total | 40 (100.0%) | 39 (100.0%) |
Earnings by Sex by Educational Attainment in Short
| Educational Attainment | Male Income | Female Income |
| Less than High School | - | - |
| High School Diploma | - | - |
| College or Associate's Degree | - | - |
| Bachelor's Degree | - | - |
| Graduate Degree | - | - |
| Total | - | - |
Family Income in Short
Family Income Brackets in Short
According to the Short family income data, there are 22 families falling into the $150,000 to $199,999 income range, which is the most common income bracket and makes up 28.6% of all families.
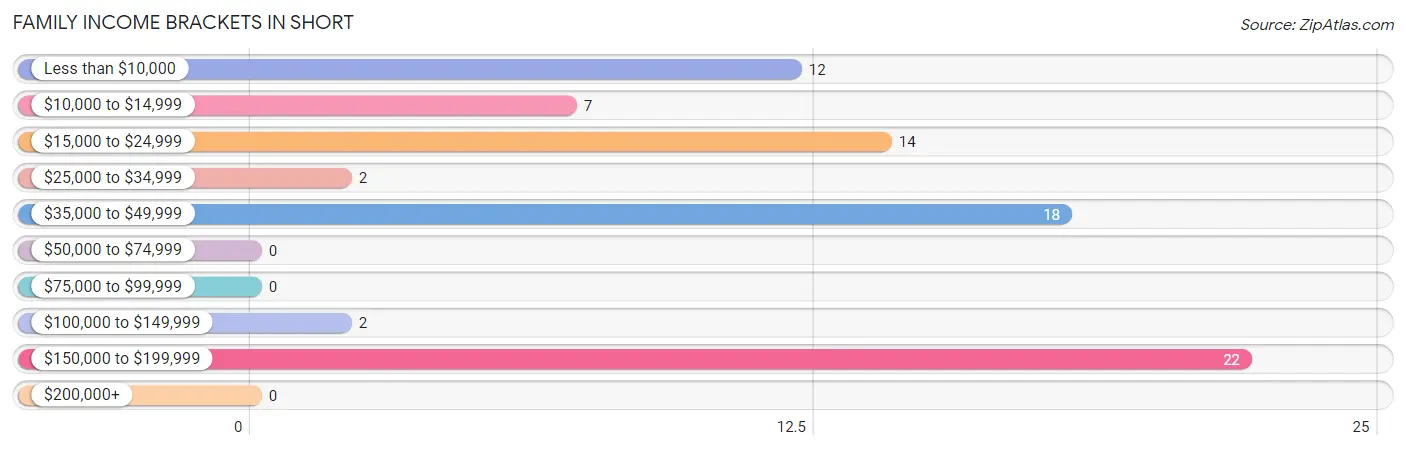
| Income Bracket | # Families | % Families |
| Less than $10,000 | 12 | 15.6% |
| $10,000 to $14,999 | 7 | 9.1% |
| $15,000 to $24,999 | 14 | 18.2% |
| $25,000 to $34,999 | 2 | 2.6% |
| $35,000 to $49,999 | 18 | 23.4% |
| $50,000 to $74,999 | 0 | 0.0% |
| $75,000 to $99,999 | 0 | 0.0% |
| $100,000 to $149,999 | 2 | 2.6% |
| $150,000 to $199,999 | 22 | 28.6% |
| $200,000+ | 0 | 0.0% |
Family Income by Famaliy Size in Short
2-person families (51 | 66.2%) account for the highest median family income in Short with $23,661 per family, while 2-person families (51 | 66.2%) have the highest median income of $11,830 per family member.
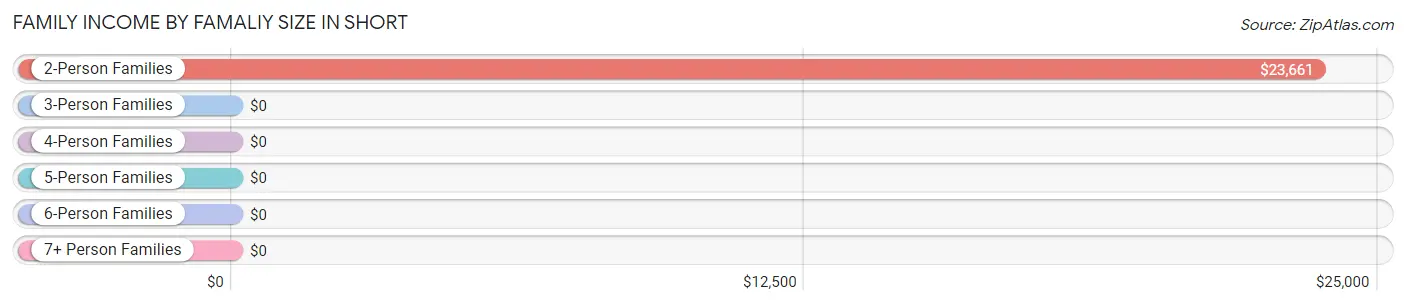
| Income Bracket | # Families | Median Income |
| 2-Person Families | 51 (66.2%) | $23,661 |
| 3-Person Families | 0 (0.0%) | $0 |
| 4-Person Families | 22 (28.6%) | $0 |
| 5-Person Families | 0 (0.0%) | $0 |
| 6-Person Families | 0 (0.0%) | $0 |
| 7+ Person Families | 4 (5.2%) | $0 |
| Total | 77 (100.0%) | $45,625 |
Family Income by Number of Earners in Short
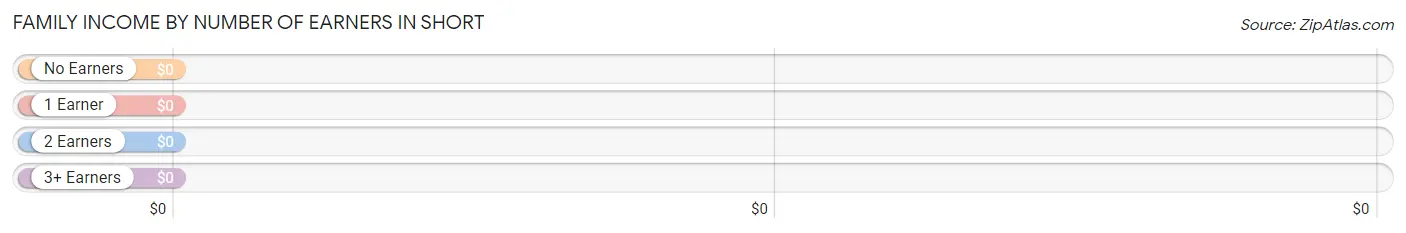
| Number of Earners | # Families | Median Income |
| No Earners | 35 (45.5%) | $0 |
| 1 Earner | 4 (5.2%) | $0 |
| 2 Earners | 38 (49.3%) | $0 |
| 3+ Earners | 0 (0.0%) | $0 |
| Total | 77 (100.0%) | $45,625 |
Household Income in Short
Household Income Brackets in Short
With 27 households falling in the category, the less than $10,000 income range is the most frequent in Short, accounting for 27.3% of all households.
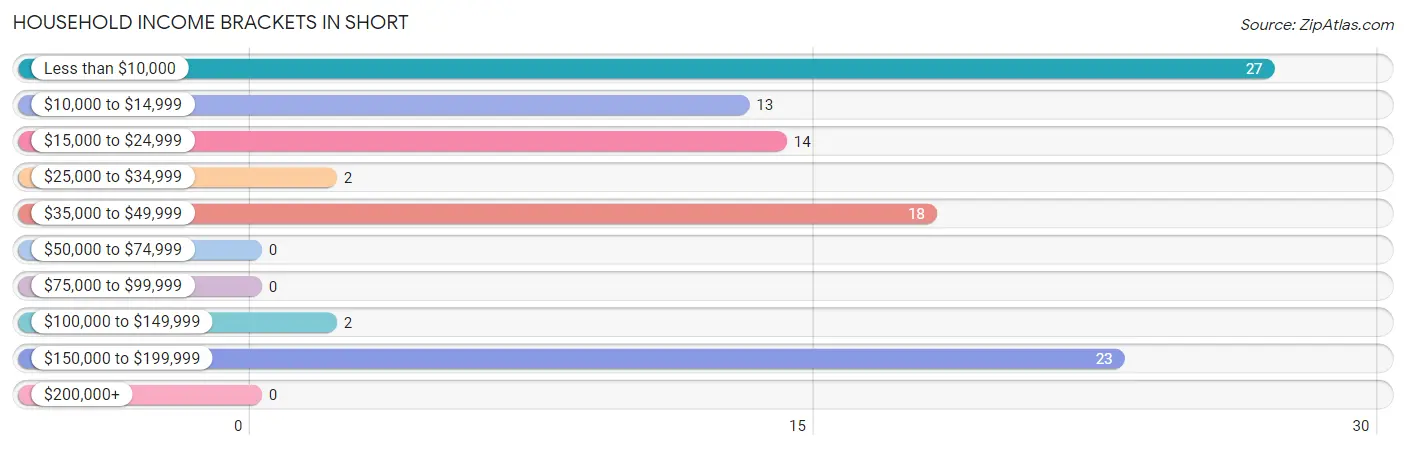
| Income Bracket | # Households | % Households |
| Less than $10,000 | 27 | 27.3% |
| $10,000 to $14,999 | 13 | 13.1% |
| $15,000 to $24,999 | 14 | 14.1% |
| $25,000 to $34,999 | 2 | 2.0% |
| $35,000 to $49,999 | 18 | 18.2% |
| $50,000 to $74,999 | 0 | 0.0% |
| $75,000 to $99,999 | 0 | 0.0% |
| $100,000 to $149,999 | 2 | 2.0% |
| $150,000 to $199,999 | 23 | 23.2% |
| $200,000+ | 0 | 0.0% |
Household Income by Householder Age in Short
The median household income in Short is $0, with the highest median household income of $23,393 found in the 65+ years age bracket for the primary householder. A total of 22 households (22.2%) fall into this category.
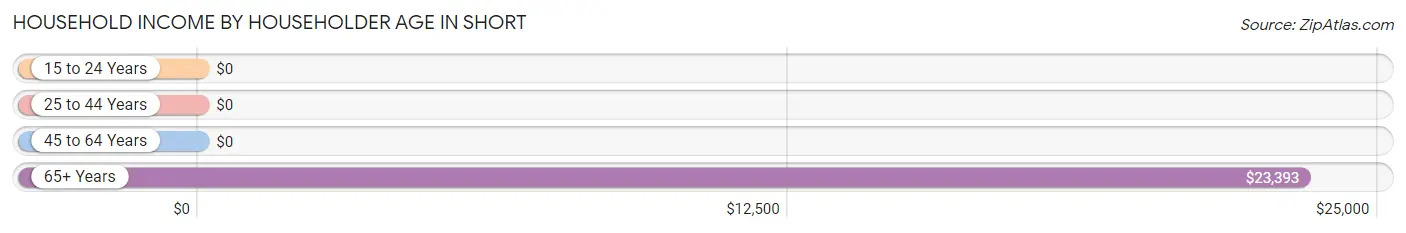
| Income Bracket | # Households | Median Income |
| 15 to 24 Years | 0 (0.0%) | $0 |
| 25 to 44 Years | 26 (26.3%) | $0 |
| 45 to 64 Years | 51 (51.5%) | $0 |
| 65+ Years | 22 (22.2%) | $23,393 |
| Total | 99 (100.0%) | $0 |
Poverty in Short
Income Below Poverty by Sex and Age in Short
With 38.1% poverty level for males and 13.9% for females among the residents of Short, 65 to 74 year old males and 75 year old and over females are the most vulnerable to poverty, with 3 males (75.0%) and 3 females (100.0%) in their respective age groups living below the poverty level.
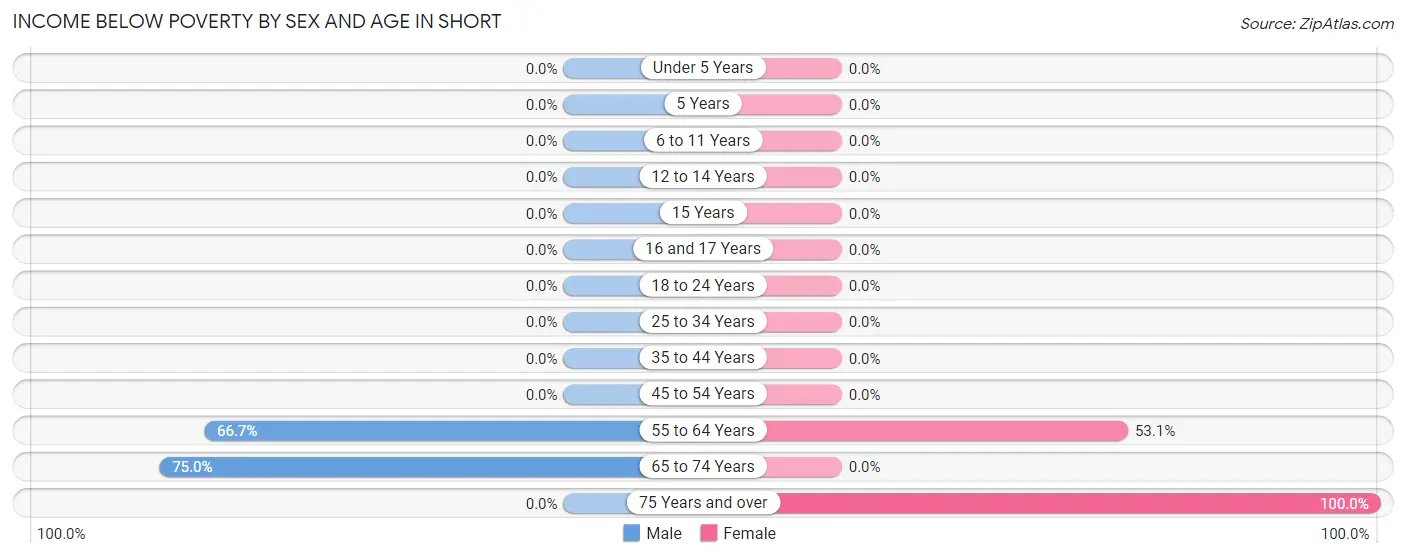
| Age Bracket | Male | Female |
| Under 5 Years | 0 (0.0%) | 0 (0.0%) |
| 5 Years | 0 (0.0%) | 0 (0.0%) |
| 6 to 11 Years | 0 (0.0%) | 0 (0.0%) |
| 12 to 14 Years | 0 (0.0%) | 0 (0.0%) |
| 15 Years | 0 (0.0%) | 0 (0.0%) |
| 16 and 17 Years | 0 (0.0%) | 0 (0.0%) |
| 18 to 24 Years | 0 (0.0%) | 0 (0.0%) |
| 25 to 34 Years | 0 (0.0%) | 0 (0.0%) |
| 35 to 44 Years | 0 (0.0%) | 0 (0.0%) |
| 45 to 54 Years | 0 (0.0%) | 0 (0.0%) |
| 55 to 64 Years | 34 (66.7%) | 17 (53.1%) |
| 65 to 74 Years | 3 (75.0%) | 0 (0.0%) |
| 75 Years and over | 0 (0.0%) | 3 (100.0%) |
| Total | 37 (38.1%) | 20 (13.9%) |
Income Above Poverty by Sex and Age in Short
According to the poverty statistics in Short, males aged 6 to 11 years and females aged 6 to 11 years are the age groups that are most secure financially, with 100.0% of males and 100.0% of females in these age groups living above the poverty line.
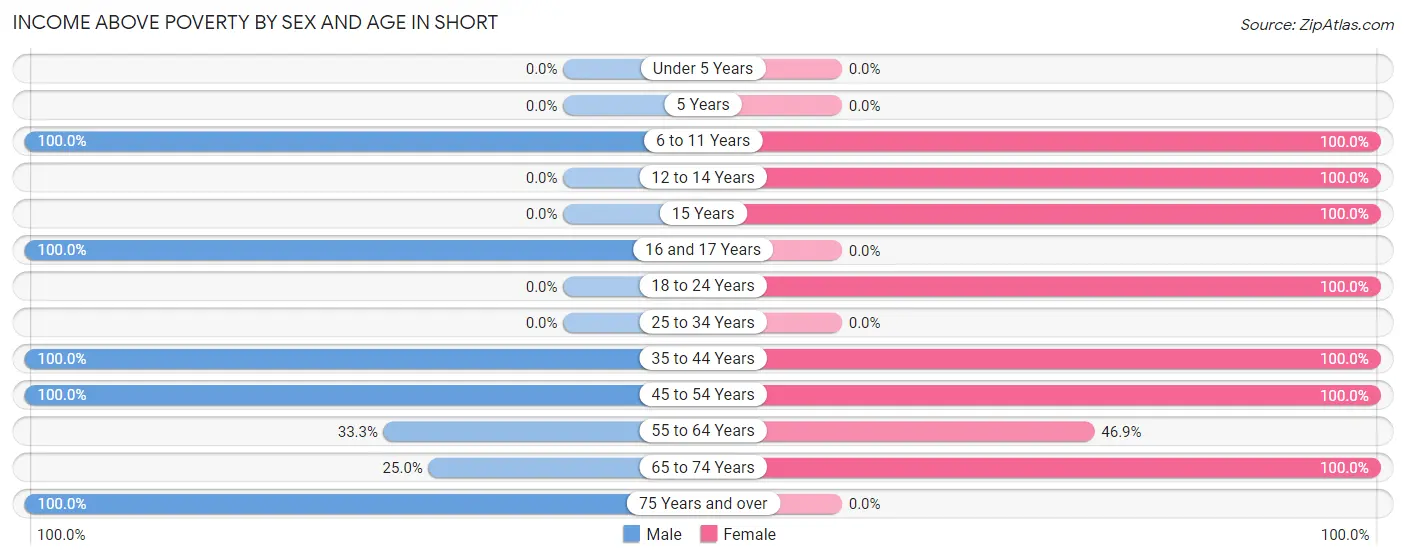
| Age Bracket | Male | Female |
| Under 5 Years | 0 (0.0%) | 0 (0.0%) |
| 5 Years | 0 (0.0%) | 0 (0.0%) |
| 6 to 11 Years | 6 (100.0%) | 9 (100.0%) |
| 12 to 14 Years | 0 (0.0%) | 29 (100.0%) |
| 15 Years | 0 (0.0%) | 6 (100.0%) |
| 16 and 17 Years | 3 (100.0%) | 0 (0.0%) |
| 18 to 24 Years | 0 (0.0%) | 21 (100.0%) |
| 25 to 34 Years | 0 (0.0%) | 0 (0.0%) |
| 35 to 44 Years | 3 (100.0%) | 26 (100.0%) |
| 45 to 54 Years | 20 (100.0%) | 2 (100.0%) |
| 55 to 64 Years | 17 (33.3%) | 15 (46.9%) |
| 65 to 74 Years | 1 (25.0%) | 16 (100.0%) |
| 75 Years and over | 10 (100.0%) | 0 (0.0%) |
| Total | 60 (61.9%) | 124 (86.1%) |
Income Below Poverty Among Married-Couple Families in Short
The poverty statistics for married-couple families in Short show that 24.7% or 19 of the total 77 families live below the poverty line. Families with no children have the highest poverty rate of 37.2%, comprising of 19 families. On the other hand, families with 1 or 2 children have the lowest poverty rate of 0.0%, which includes 0 families.
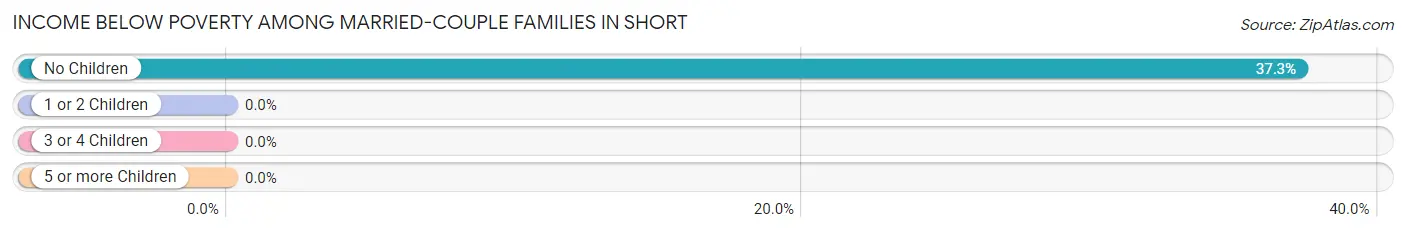
| Children | Above Poverty | Below Poverty |
| No Children | 32 (62.7%) | 19 (37.2%) |
| 1 or 2 Children | 22 (100.0%) | 0 (0.0%) |
| 3 or 4 Children | 0 (0.0%) | 0 (0.0%) |
| 5 or more Children | 4 (100.0%) | 0 (0.0%) |
| Total | 58 (75.3%) | 19 (24.7%) |
Income Below Poverty Among Single-Parent Households in Short
| Children | Single Father | Single Mother |
| No Children | 0 (0.0%) | 0 (0.0%) |
| 1 or 2 Children | 0 (0.0%) | 0 (0.0%) |
| 3 or 4 Children | 0 (0.0%) | 0 (0.0%) |
| 5 or more Children | 0 (0.0%) | 0 (0.0%) |
| Total | 0 (0.0%) | 0 (0.0%) |
Income Below Poverty Among Married-Couple vs Single-Parent Households in Short
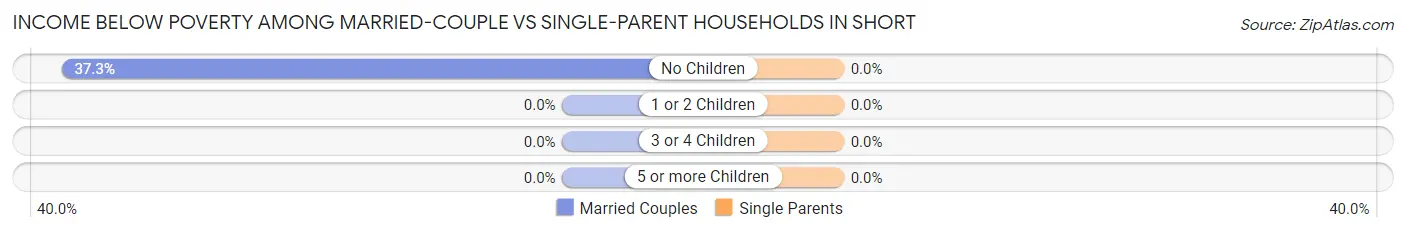
| Children | Married-Couple Families | Single-Parent Households |
| No Children | 19 (37.2%) | 0 (0.0%) |
| 1 or 2 Children | 0 (0.0%) | 0 (0.0%) |
| 3 or 4 Children | 0 (0.0%) | 0 (0.0%) |
| 5 or more Children | 0 (0.0%) | 0 (0.0%) |
| Total | 19 (24.7%) | 0 (0.0%) |
Race in Short
The most populous races in Short are White / Caucasian (219 | 90.9%), Native / Alaskan (16 | 6.6%), and Two or more Races (6 | 2.5%).
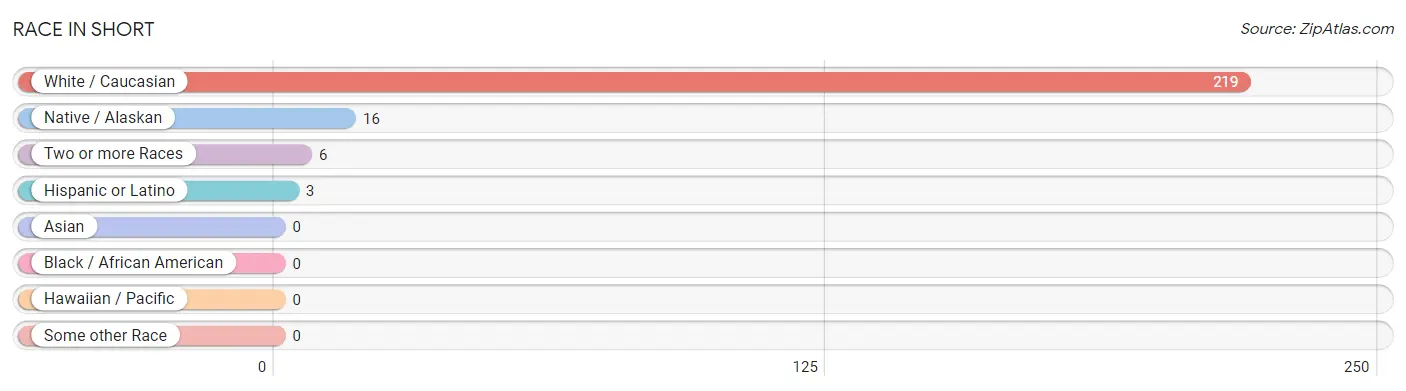
| Race | # Population | % Population |
| Asian | 0 | 0.0% |
| Black / African American | 0 | 0.0% |
| Hawaiian / Pacific | 0 | 0.0% |
| Hispanic or Latino | 3 | 1.2% |
| Native / Alaskan | 16 | 6.6% |
| White / Caucasian | 219 | 90.9% |
| Two or more Races | 6 | 2.5% |
| Some other Race | 0 | 0.0% |
| Total | 241 | 100.0% |
Ancestry in Short
The most populous ancestries reported in Short are English (24 | 10.0%), Cherokee (22 | 9.1%), French (14 | 5.8%), Dutch (10 | 4.2%), and American (3 | 1.2%), together accounting for 30.3% of all Short residents.
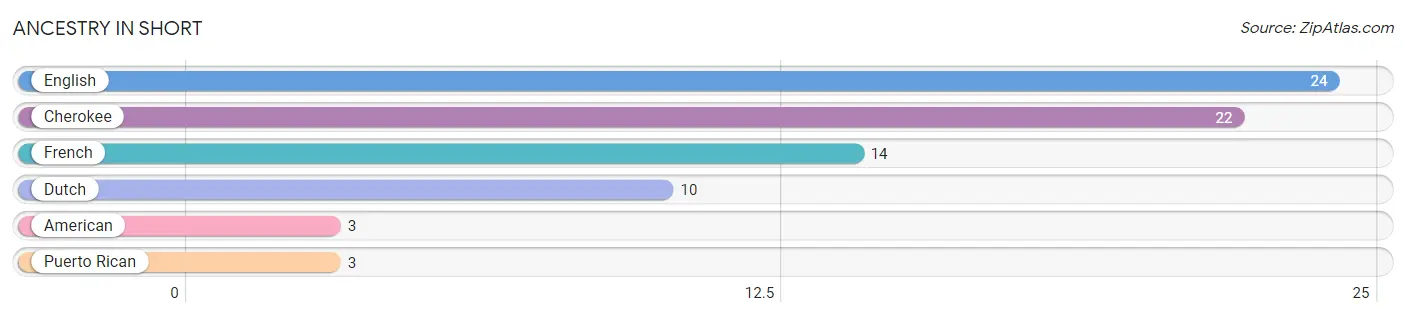
| Ancestry | # Population | % Population |
| American | 3 | 1.2% |
| Cherokee | 22 | 9.1% |
| Dutch | 10 | 4.2% |
| English | 24 | 10.0% |
| French | 14 | 5.8% |
| Puerto Rican | 3 | 1.2% | View All 6 Rows |
Immigrants in Short

| Immigration Origin | # Population | % Population | View All 0 Rows |
Sex and Age in Short
Sex and Age in Short
The most populous age groups in Short are 60 to 64 Years (37 | 38.1%) for men and 10 to 14 Years (29 | 20.1%) for women.
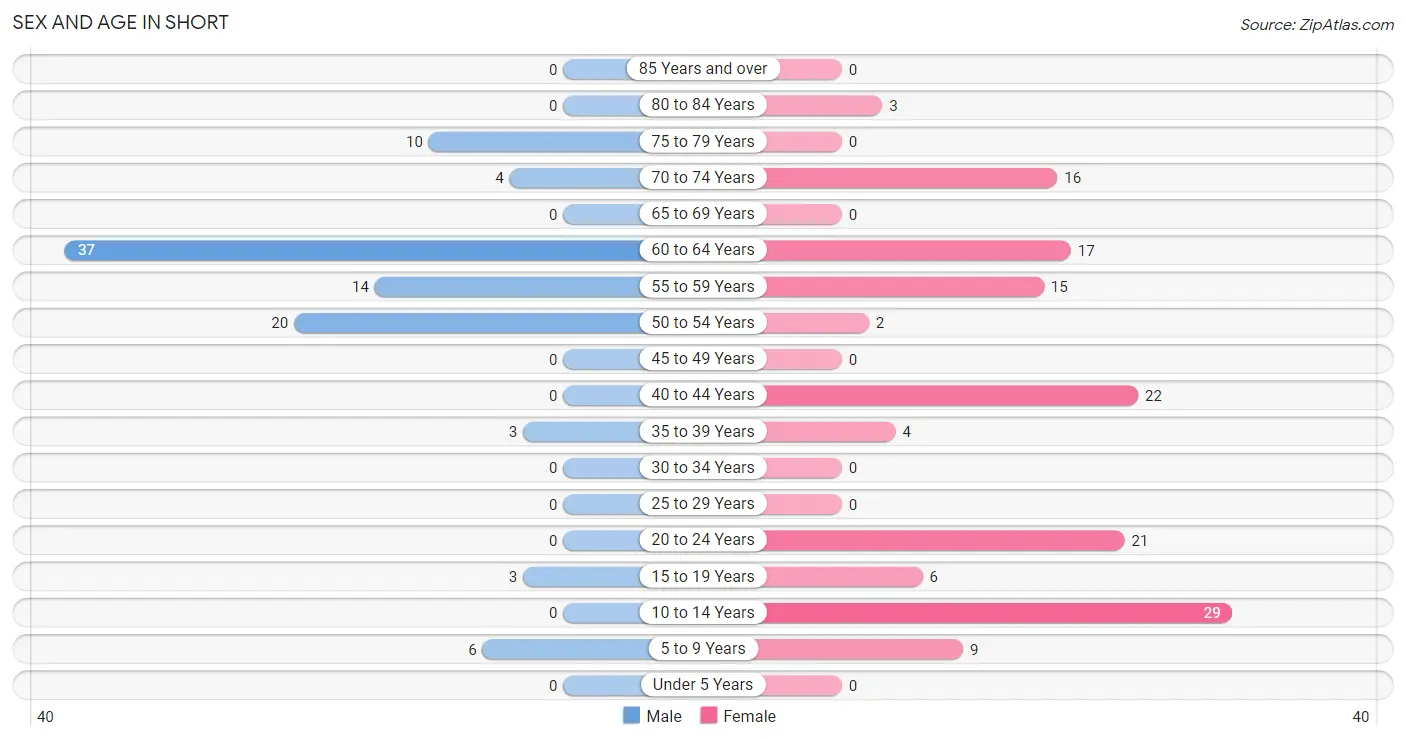
| Age Bracket | Male | Female |
| Under 5 Years | 0 (0.0%) | 0 (0.0%) |
| 5 to 9 Years | 6 (6.2%) | 9 (6.2%) |
| 10 to 14 Years | 0 (0.0%) | 29 (20.1%) |
| 15 to 19 Years | 3 (3.1%) | 6 (4.2%) |
| 20 to 24 Years | 0 (0.0%) | 21 (14.6%) |
| 25 to 29 Years | 0 (0.0%) | 0 (0.0%) |
| 30 to 34 Years | 0 (0.0%) | 0 (0.0%) |
| 35 to 39 Years | 3 (3.1%) | 4 (2.8%) |
| 40 to 44 Years | 0 (0.0%) | 22 (15.3%) |
| 45 to 49 Years | 0 (0.0%) | 0 (0.0%) |
| 50 to 54 Years | 20 (20.6%) | 2 (1.4%) |
| 55 to 59 Years | 14 (14.4%) | 15 (10.4%) |
| 60 to 64 Years | 37 (38.1%) | 17 (11.8%) |
| 65 to 69 Years | 0 (0.0%) | 0 (0.0%) |
| 70 to 74 Years | 4 (4.1%) | 16 (11.1%) |
| 75 to 79 Years | 10 (10.3%) | 0 (0.0%) |
| 80 to 84 Years | 0 (0.0%) | 3 (2.1%) |
| 85 Years and over | 0 (0.0%) | 0 (0.0%) |
| Total | 97 (100.0%) | 144 (100.0%) |
Families and Households in Short
Median Family Size in Short
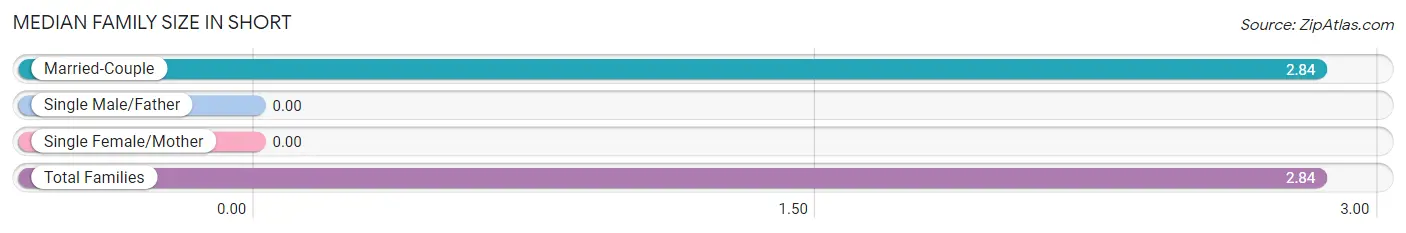
| Family Type | # Families | Family Size |
| Married-Couple | 77 (100.0%) | 2.84 |
| Single Male/Father | 0 (0.0%) | - |
| Single Female/Mother | 0 (0.0%) | - |
| Total Families | 77 (100.0%) | 2.84 |
Median Household Size in Short
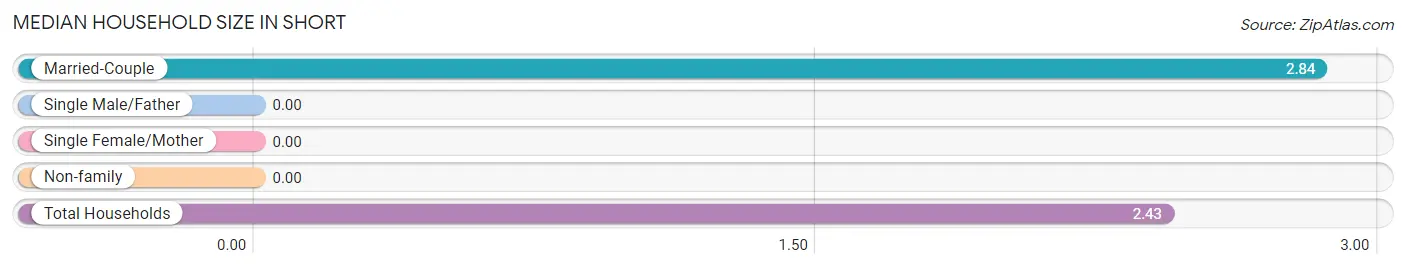
| Household Type | # Households | Household Size |
| Married-Couple | 77 (77.8%) | 2.84 |
| Single Male/Father | 0 (0.0%) | - |
| Single Female/Mother | 0 (0.0%) | - |
| Non-family | 22 (22.2%) | - |
| Total Households | 99 (100.0%) | 2.43 |
Household Size by Marriage Status in Short
Out of a total of 99 households in Short, 77 (77.8%) are family households, while 22 (22.2%) are nonfamily households. The most numerous type of family households are 2-person households, comprising 51, and the most common type of nonfamily households are 1-person households, comprising 22.
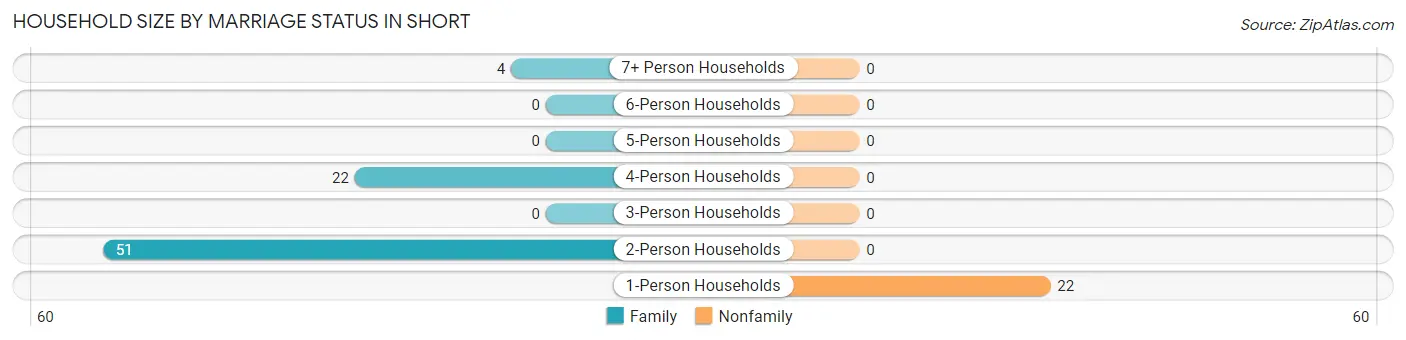
| Household Size | Family Households | Nonfamily Households |
| 1-Person Households | - | 22 (22.2%) |
| 2-Person Households | 51 (51.5%) | 0 (0.0%) |
| 3-Person Households | 0 (0.0%) | 0 (0.0%) |
| 4-Person Households | 22 (22.2%) | 0 (0.0%) |
| 5-Person Households | 0 (0.0%) | 0 (0.0%) |
| 6-Person Households | 0 (0.0%) | 0 (0.0%) |
| 7+ Person Households | 4 (4.0%) | 0 (0.0%) |
| Total | 77 (77.8%) | 22 (22.2%) |
Female Fertility in Short
Fertility by Age in Short
| Age Bracket | Women with Births | Births / 1,000 Women |
| 15 to 19 years | 0 (0.0%) | 0.0 |
| 20 to 34 years | 0 (0.0%) | 0.0 |
| 35 to 50 years | 0 (0.0%) | 0.0 |
| Total | 0 (0.0%) | 0.0 |
Fertility by Age by Marriage Status in Short
| Age Bracket | Married | Unmarried |
| 15 to 19 years | 0 (0.0%) | 0 (0.0%) |
| 20 to 34 years | 0 (0.0%) | 0 (0.0%) |
| 35 to 50 years | 0 (0.0%) | 0 (0.0%) |
| Total | 0 (0.0%) | 0 (0.0%) |
Fertility by Education in Short
| Educational Attainment | Women with Births | Births / 1,000 Women |
| Less than High School | 0 (0.0%) | 0.0 |
| High School Diploma | 0 (0.0%) | 0.0 |
| College or Associate's Degree | 0 (0.0%) | 0.0 |
| Bachelor's Degree | 0 (0.0%) | 0.0 |
| Graduate Degree | 0 (0.0%) | 0.0 |
| Total | 0 (0.0%) | 0.0 |
Fertility by Education by Marriage Status in Short
| Educational Attainment | Married | Unmarried |
| Less than High School | 0 (0.0%) | 0 (0.0%) |
| High School Diploma | 0 (0.0%) | 0 (0.0%) |
| College or Associate's Degree | 0 (0.0%) | 0 (0.0%) |
| Bachelor's Degree | 0 (0.0%) | 0 (0.0%) |
| Graduate Degree | 0 (0.0%) | 0 (0.0%) |
| Total | 0 (0.0%) | 0 (0.0%) |
Employment Characteristics in Short
Employment by Class of Employer in Short
Among the 76 employed individuals in Short, private company employees (38 | 50.0%), state government employees (22 | 28.9%), and self-employed (not incorporated) (16 | 21.0%) make up the most common classes of employment.
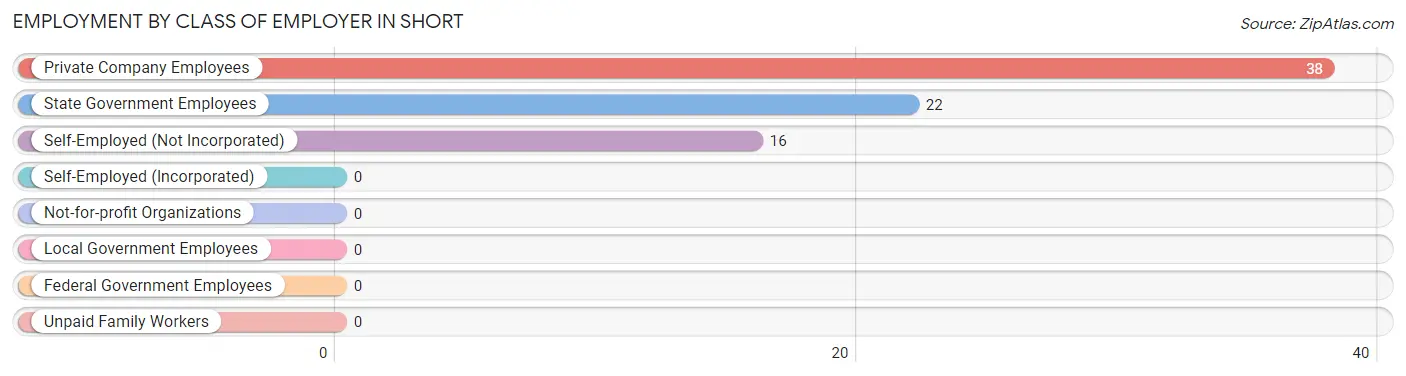
| Employer Class | # Employees | % Employees |
| Private Company Employees | 38 | 50.0% |
| Self-Employed (Incorporated) | 0 | 0.0% |
| Self-Employed (Not Incorporated) | 16 | 21.0% |
| Not-for-profit Organizations | 0 | 0.0% |
| Local Government Employees | 0 | 0.0% |
| State Government Employees | 22 | 28.9% |
| Federal Government Employees | 0 | 0.0% |
| Unpaid Family Workers | 0 | 0.0% |
| Total | 76 | 100.0% |
Employment Status by Age in Short
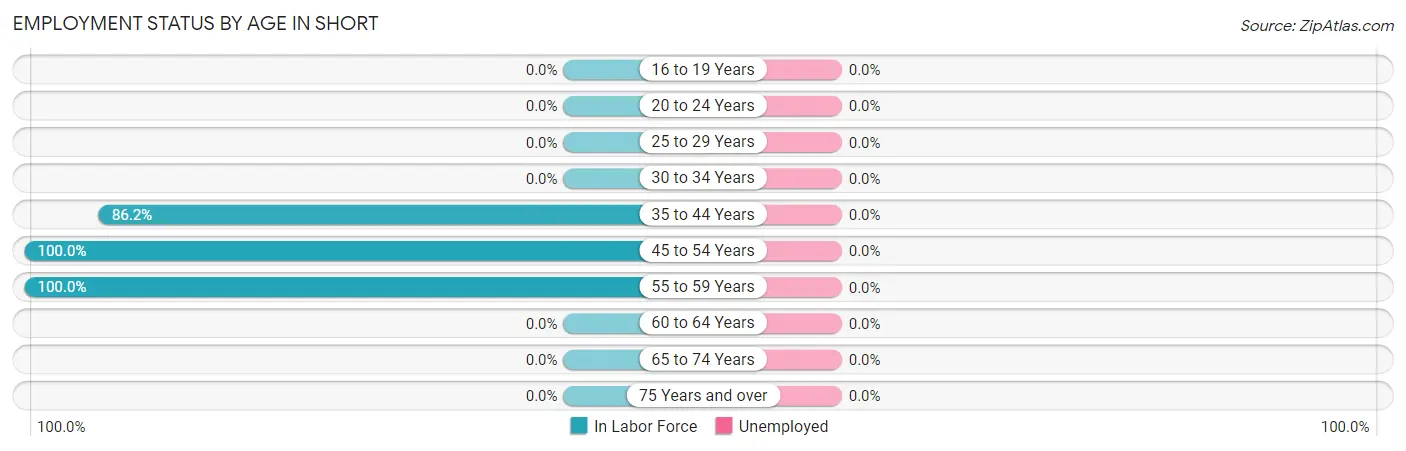
| Age Bracket | In Labor Force | Unemployed |
| 16 to 19 Years | 0 (0.0%) | 0 (0.0%) |
| 20 to 24 Years | 0 (0.0%) | 0 (0.0%) |
| 25 to 29 Years | 0 (0.0%) | 0 (0.0%) |
| 30 to 34 Years | 0 (0.0%) | 0 (0.0%) |
| 35 to 44 Years | 25 (86.2%) | 0 (0.0%) |
| 45 to 54 Years | 22 (100.0%) | 0 (0.0%) |
| 55 to 59 Years | 29 (100.0%) | 0 (0.0%) |
| 60 to 64 Years | 0 (0.0%) | 0 (0.0%) |
| 65 to 74 Years | 0 (0.0%) | 0 (0.0%) |
| 75 Years and over | 0 (0.0%) | 0 (0.0%) |
| Total | 76 (39.8%) | 0 (0.0%) |
Employment Status by Educational Attainment in Short
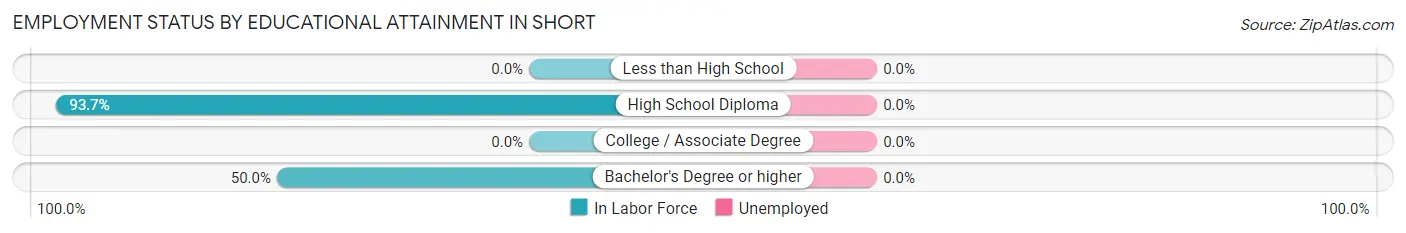
| Educational Attainment | In Labor Force | Unemployed |
| Less than High School | 0 (0.0%) | 0 (0.0%) |
| High School Diploma | 74 (93.7%) | 0 (0.0%) |
| College / Associate Degree | 0 (0.0%) | 0 (0.0%) |
| Bachelor's Degree or higher | 2 (50.0%) | 0 (0.0%) |
| Total | 76 (56.7%) | 0 (0.0%) |
Employment Occupations by Sex in Short
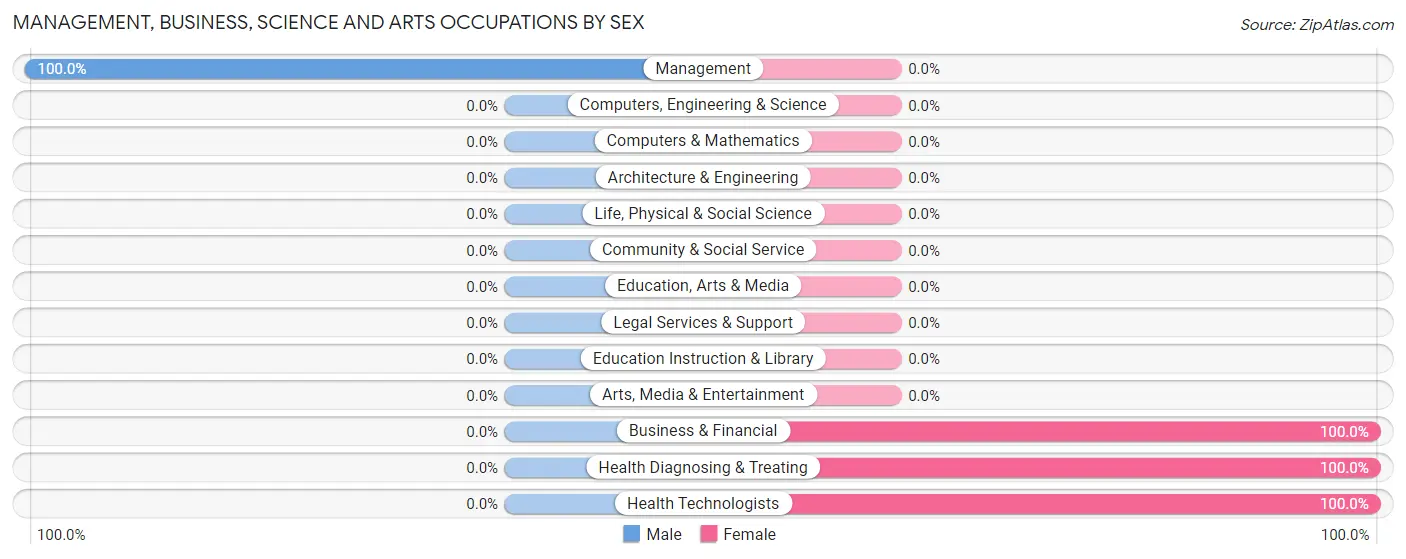
Management, Business, Science and Arts Occupations
The most common Management, Business, Science and Arts occupations in Short are Business & Financial (22 | 28.9%), Management (14 | 18.4%), Health Diagnosing & Treating (2 | 2.6%), and Health Technologists (2 | 2.6%).
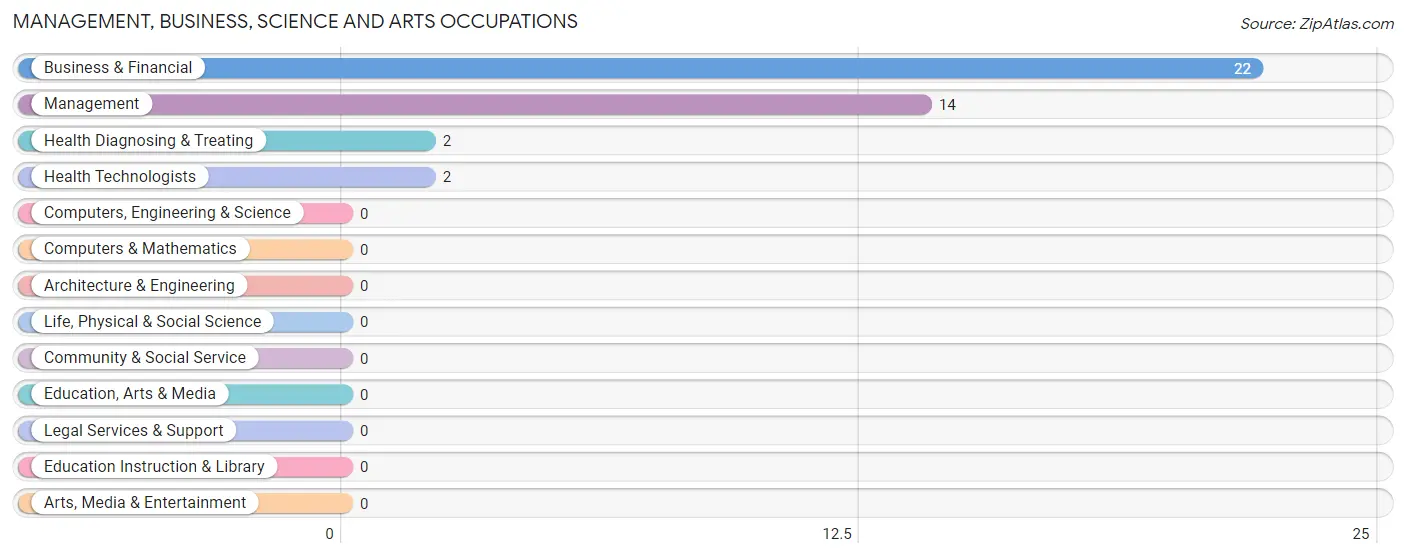
Management, Business, Science and Arts Occupations by Sex
| Occupation | Male | Female |
| Management | 14 (100.0%) | 0 (0.0%) |
| Business & Financial | 0 (0.0%) | 22 (100.0%) |
| Computers, Engineering & Science | 0 (0.0%) | 0 (0.0%) |
| Computers & Mathematics | 0 (0.0%) | 0 (0.0%) |
| Architecture & Engineering | 0 (0.0%) | 0 (0.0%) |
| Life, Physical & Social Science | 0 (0.0%) | 0 (0.0%) |
| Community & Social Service | 0 (0.0%) | 0 (0.0%) |
| Education, Arts & Media | 0 (0.0%) | 0 (0.0%) |
| Legal Services & Support | 0 (0.0%) | 0 (0.0%) |
| Education Instruction & Library | 0 (0.0%) | 0 (0.0%) |
| Arts, Media & Entertainment | 0 (0.0%) | 0 (0.0%) |
| Health Diagnosing & Treating | 0 (0.0%) | 2 (100.0%) |
| Health Technologists | 0 (0.0%) | 2 (100.0%) |
| Total (Category) | 14 (36.8%) | 24 (63.2%) |
| Total (Overall) | 37 (48.7%) | 39 (51.3%) |
Services Occupations
Services Occupations by Sex
| Occupation | Male | Female |
| Healthcare Support | 0 (0.0%) | 0 (0.0%) |
| Security & Protection | 0 (0.0%) | 0 (0.0%) |
| Firefighting & Prevention | 0 (0.0%) | 0 (0.0%) |
| Law Enforcement | 0 (0.0%) | 0 (0.0%) |
| Food Preparation & Serving | 0 (0.0%) | 0 (0.0%) |
| Cleaning & Maintenance | 0 (0.0%) | 0 (0.0%) |
| Personal Care & Service | 0 (0.0%) | 0 (0.0%) |
| Total (Category) | 0 (0.0%) | 0 (0.0%) |
| Total (Overall) | 37 (48.7%) | 39 (51.3%) |
Sales and Office Occupations
The most common Sales and Office occupations in Short are , and Office & Administration (15 | 19.7%).
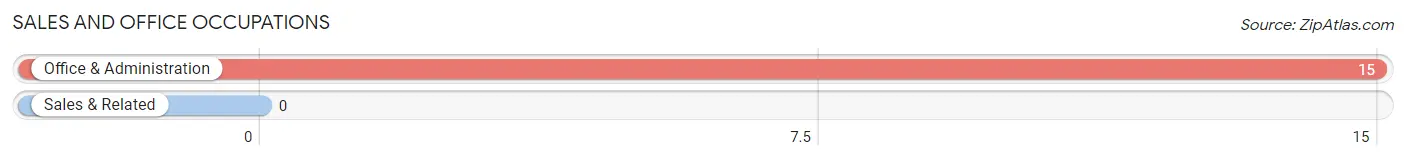
Sales and Office Occupations by Sex
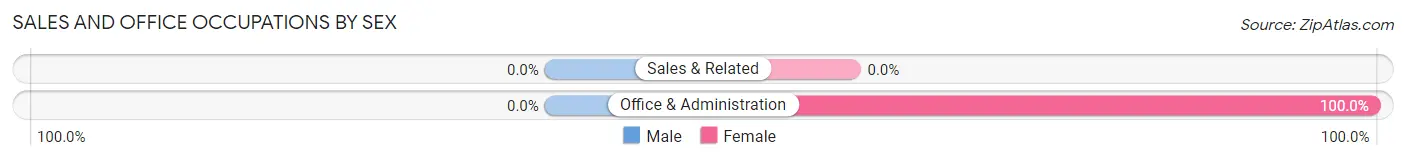
| Occupation | Male | Female |
| Sales & Related | 0 (0.0%) | 0 (0.0%) |
| Office & Administration | 0 (0.0%) | 15 (100.0%) |
| Total (Category) | 0 (0.0%) | 15 (100.0%) |
| Total (Overall) | 37 (48.7%) | 39 (51.3%) |
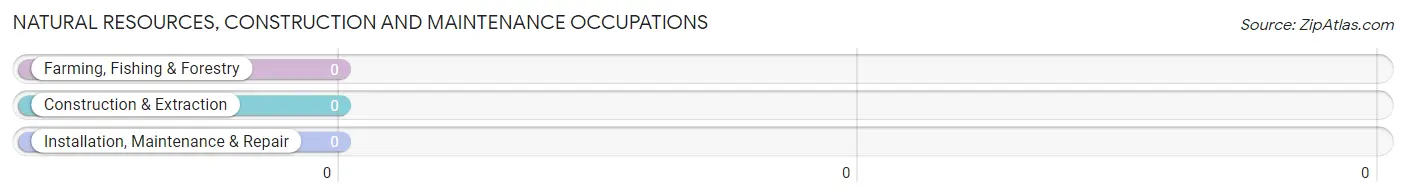
Natural Resources, Construction and Maintenance Occupations
Natural Resources, Construction and Maintenance Occupations by Sex
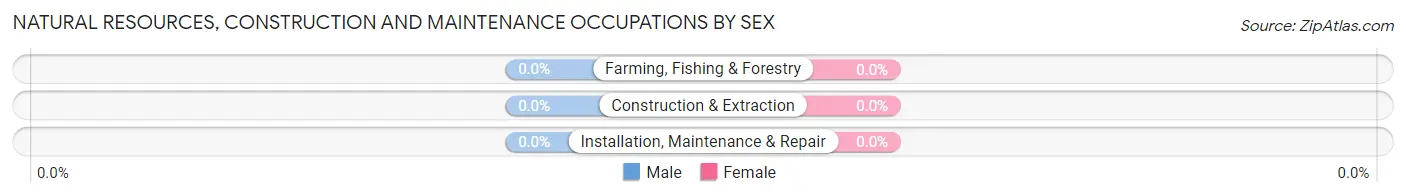
| Occupation | Male | Female |
| Farming, Fishing & Forestry | 0 (0.0%) | 0 (0.0%) |
| Construction & Extraction | 0 (0.0%) | 0 (0.0%) |
| Installation, Maintenance & Repair | 0 (0.0%) | 0 (0.0%) |
| Total (Category) | 0 (0.0%) | 0 (0.0%) |
| Total (Overall) | 37 (48.7%) | 39 (51.3%) |
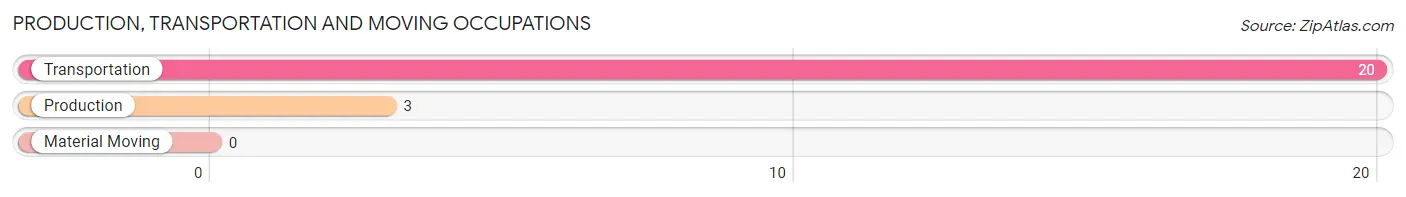
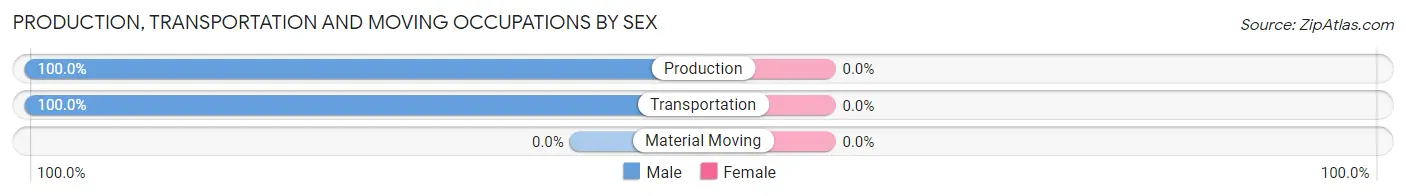
Production, Transportation and Moving Occupations
The most common Production, Transportation and Moving occupations in Short are Transportation (20 | 26.3%), and Production (3 | 4.0%).
Production, Transportation and Moving Occupations by Sex
| Occupation | Male | Female |
| Production | 3 (100.0%) | 0 (0.0%) |
| Transportation | 20 (100.0%) | 0 (0.0%) |
| Material Moving | 0 (0.0%) | 0 (0.0%) |
| Total (Category) | 23 (100.0%) | 0 (0.0%) |
| Total (Overall) | 37 (48.7%) | 39 (51.3%) |
Employment Industries by Sex in Short
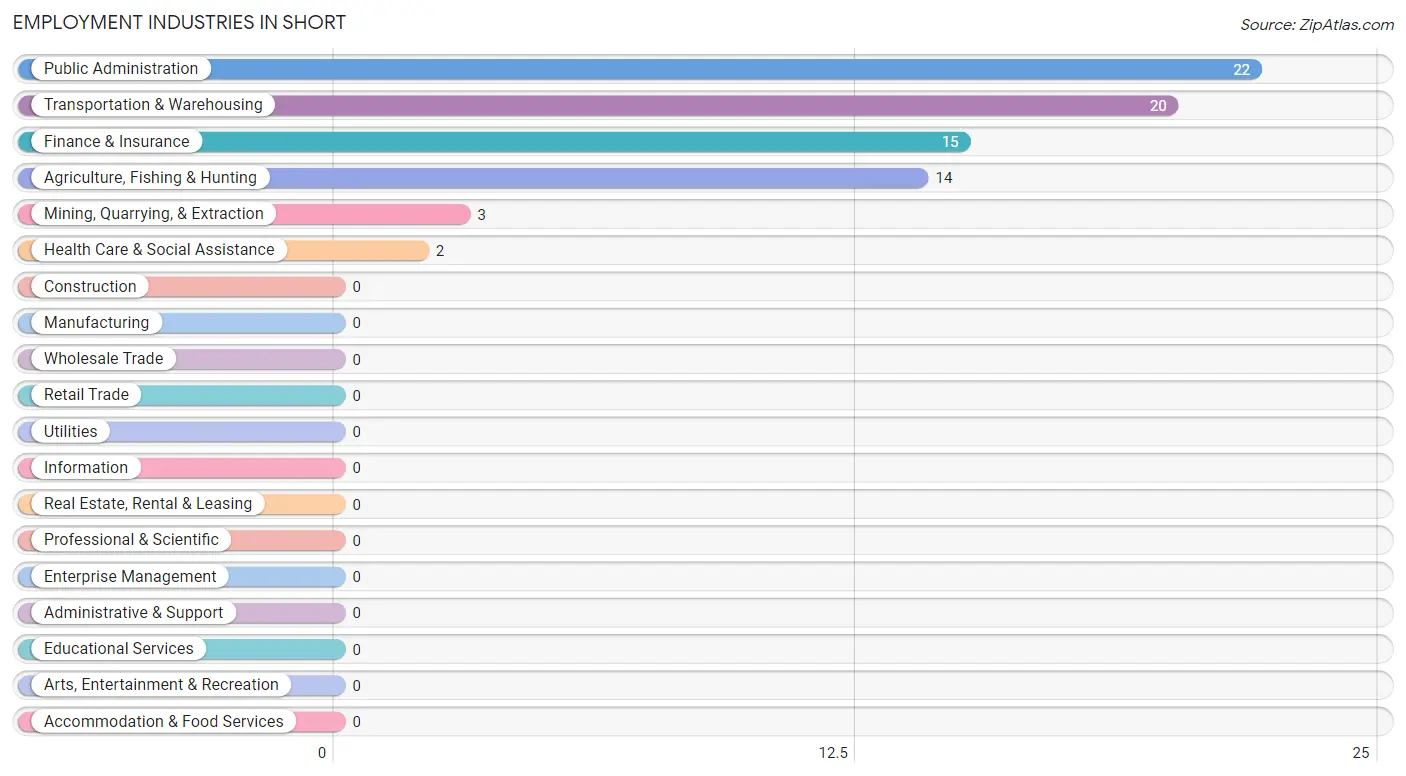
Employment Industries in Short
The major employment industries in Short include Public Administration (22 | 28.9%), Transportation & Warehousing (20 | 26.3%), Finance & Insurance (15 | 19.7%), Agriculture, Fishing & Hunting (14 | 18.4%), and Mining, Quarrying, & Extraction (3 | 4.0%).
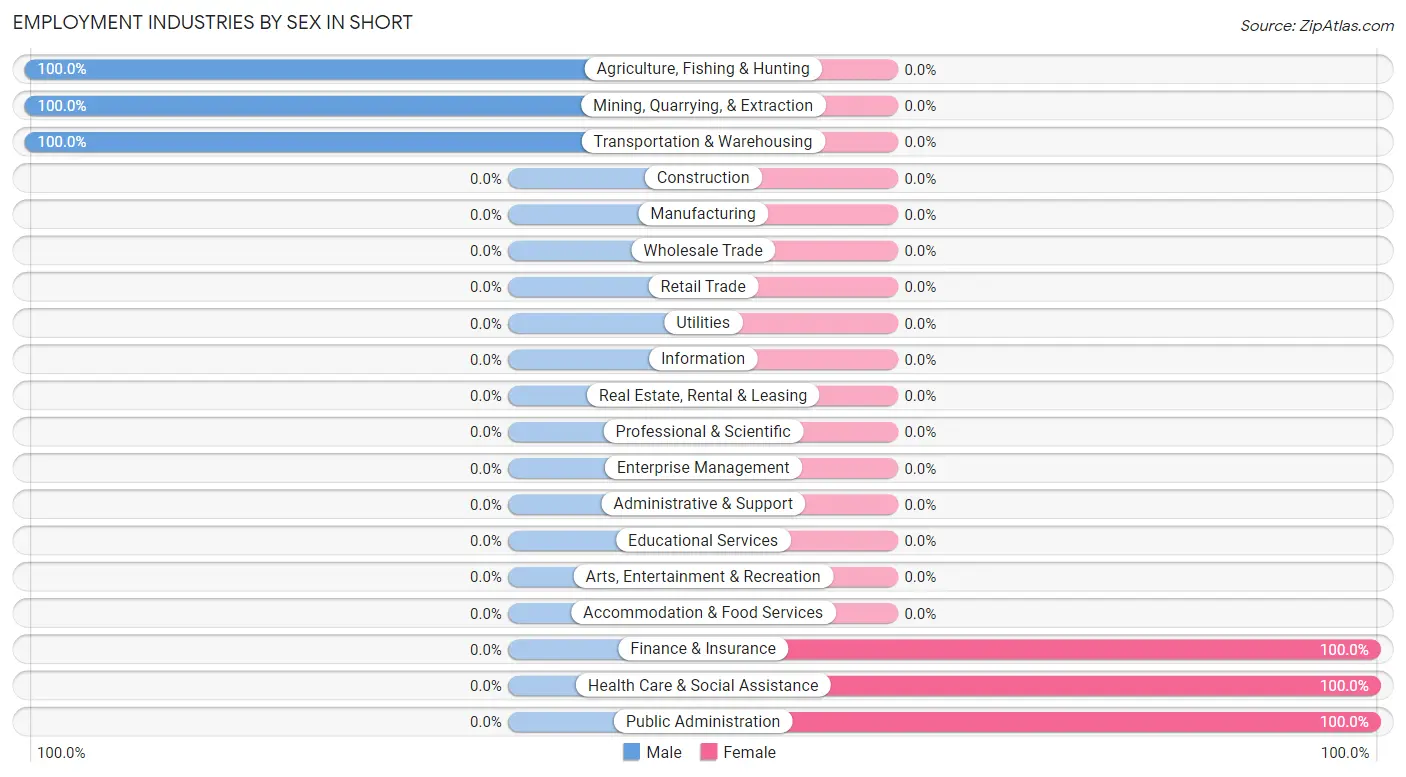
Employment Industries by Sex in Short
The Short industries that see more men than women are Agriculture, Fishing & Hunting (100.0%), Mining, Quarrying, & Extraction (100.0%), and Transportation & Warehousing (100.0%), whereas the industries that tend to have a higher number of women are Finance & Insurance (100.0%), Health Care & Social Assistance (100.0%), and Public Administration (100.0%).
| Industry | Male | Female |
| Agriculture, Fishing & Hunting | 14 (100.0%) | 0 (0.0%) |
| Mining, Quarrying, & Extraction | 3 (100.0%) | 0 (0.0%) |
| Construction | 0 (0.0%) | 0 (0.0%) |
| Manufacturing | 0 (0.0%) | 0 (0.0%) |
| Wholesale Trade | 0 (0.0%) | 0 (0.0%) |
| Retail Trade | 0 (0.0%) | 0 (0.0%) |
| Transportation & Warehousing | 20 (100.0%) | 0 (0.0%) |
| Utilities | 0 (0.0%) | 0 (0.0%) |
| Information | 0 (0.0%) | 0 (0.0%) |
| Finance & Insurance | 0 (0.0%) | 15 (100.0%) |
| Real Estate, Rental & Leasing | 0 (0.0%) | 0 (0.0%) |
| Professional & Scientific | 0 (0.0%) | 0 (0.0%) |
| Enterprise Management | 0 (0.0%) | 0 (0.0%) |
| Administrative & Support | 0 (0.0%) | 0 (0.0%) |
| Educational Services | 0 (0.0%) | 0 (0.0%) |
| Health Care & Social Assistance | 0 (0.0%) | 2 (100.0%) |
| Arts, Entertainment & Recreation | 0 (0.0%) | 0 (0.0%) |
| Accommodation & Food Services | 0 (0.0%) | 0 (0.0%) |
| Public Administration | 0 (0.0%) | 22 (100.0%) |
| Total | 37 (48.7%) | 39 (51.3%) |
Education in Short
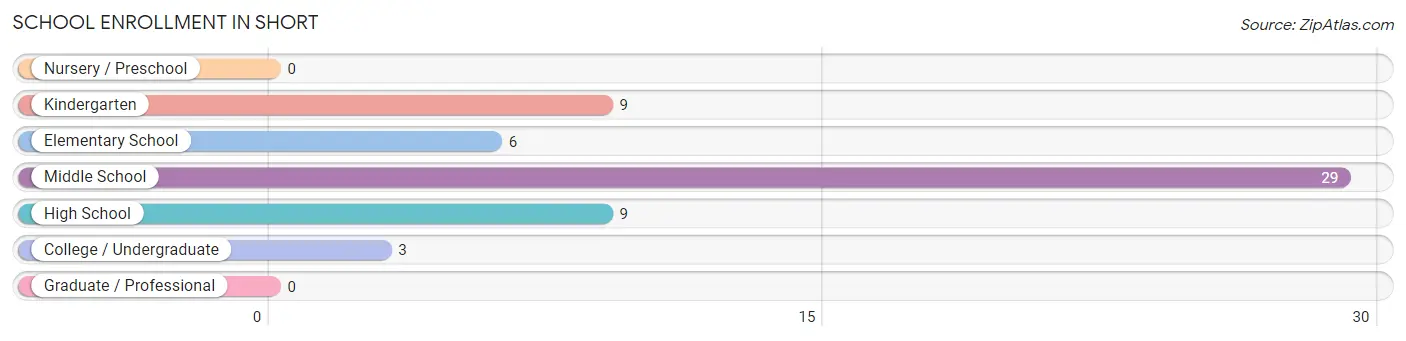
School Enrollment in Short
The most common levels of schooling among the 56 students in Short are middle school (29 | 51.8%), kindergarten (9 | 16.1%), and high school (9 | 16.1%).
| School Level | # Students | % Students |
| Nursery / Preschool | 0 | 0.0% |
| Kindergarten | 9 | 16.1% |
| Elementary School | 6 | 10.7% |
| Middle School | 29 | 51.8% |
| High School | 9 | 16.1% |
| College / Undergraduate | 3 | 5.4% |
| Graduate / Professional | 0 | 0.0% |
| Total | 56 | 100.0% |
School Enrollment by Age by Funding Source in Short
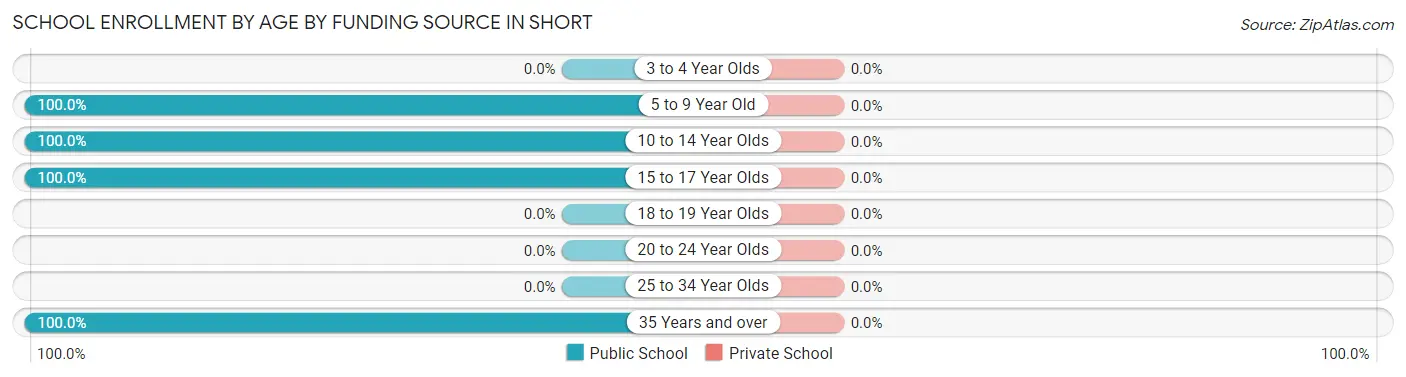
| Age Bracket | Public School | Private School |
| 3 to 4 Year Olds | 0 (0.0%) | 0 (0.0%) |
| 5 to 9 Year Old | 15 (100.0%) | 0 (0.0%) |
| 10 to 14 Year Olds | 29 (100.0%) | 0 (0.0%) |
| 15 to 17 Year Olds | 9 (100.0%) | 0 (0.0%) |
| 18 to 19 Year Olds | 0 (0.0%) | 0 (0.0%) |
| 20 to 24 Year Olds | 0 (0.0%) | 0 (0.0%) |
| 25 to 34 Year Olds | 0 (0.0%) | 0 (0.0%) |
| 35 Years and over | 3 (100.0%) | 0 (0.0%) |
| Total | 56 (100.0%) | 0 (0.0%) |
Educational Attainment by Field of Study in Short
Computers & mathematics (10 | 71.4%), psychology (2 | 14.3%), and business (2 | 14.3%) are the most common fields of study among 14 individuals in Short who have obtained a bachelor's degree or higher.
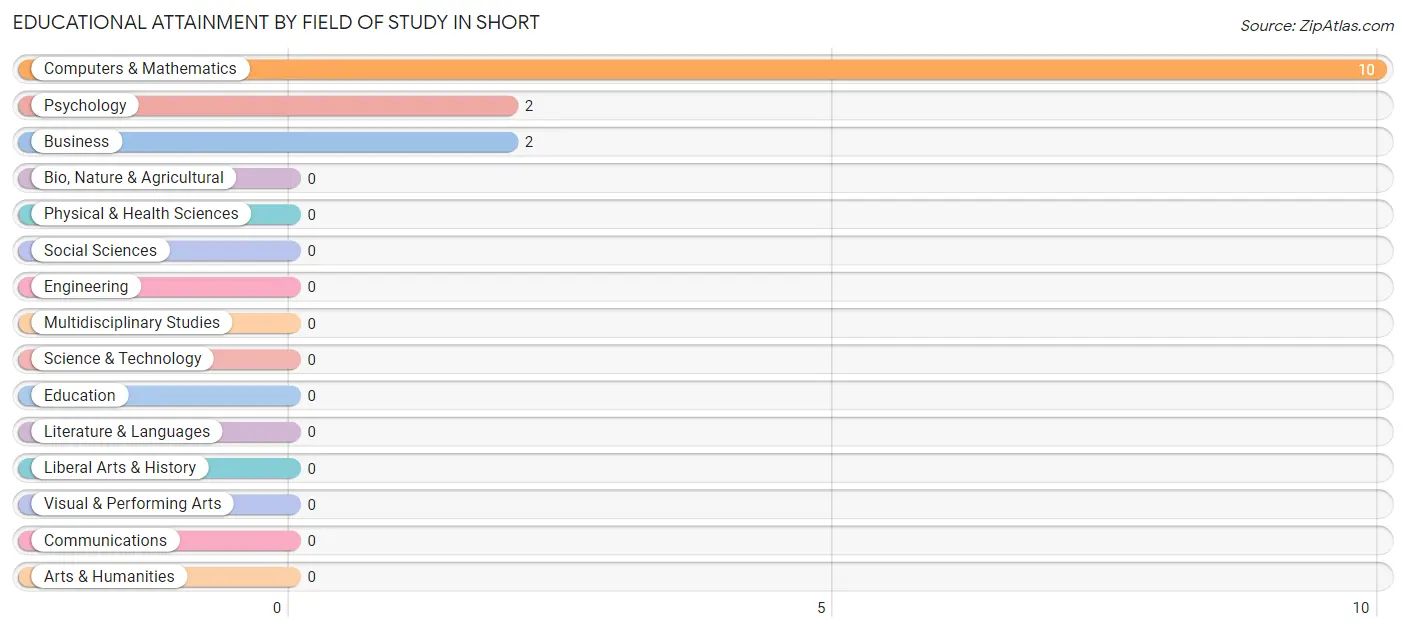
| Field of Study | # Graduates | % Graduates |
| Computers & Mathematics | 10 | 71.4% |
| Bio, Nature & Agricultural | 0 | 0.0% |
| Physical & Health Sciences | 0 | 0.0% |
| Psychology | 2 | 14.3% |
| Social Sciences | 0 | 0.0% |
| Engineering | 0 | 0.0% |
| Multidisciplinary Studies | 0 | 0.0% |
| Science & Technology | 0 | 0.0% |
| Business | 2 | 14.3% |
| Education | 0 | 0.0% |
| Literature & Languages | 0 | 0.0% |
| Liberal Arts & History | 0 | 0.0% |
| Visual & Performing Arts | 0 | 0.0% |
| Communications | 0 | 0.0% |
| Arts & Humanities | 0 | 0.0% |
| Total | 14 | 100.0% |
Transportation & Commute in Short
Vehicle Availability by Sex in Short
The most prevalent vehicle ownership categories in Short are males with 1 vehicle (20, accounting for 54.0%) and females with 1 vehicle (22, making up 51.3%).
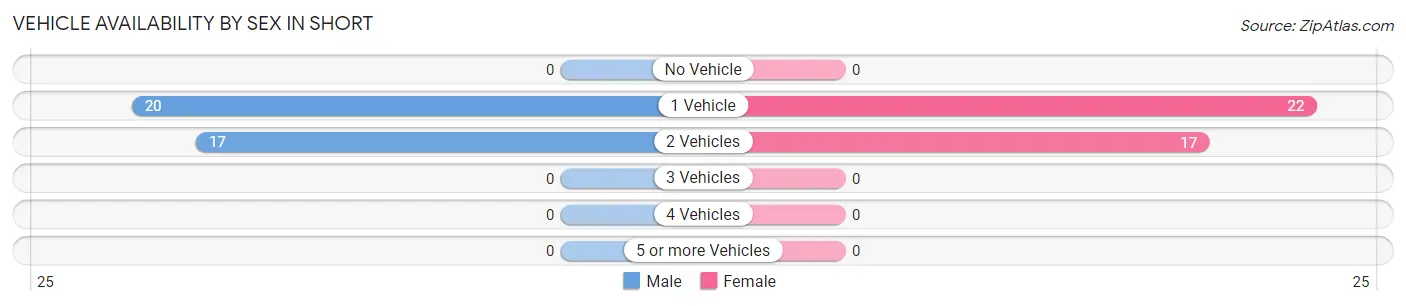
| Vehicles Available | Male | Female |
| No Vehicle | 0 (0.0%) | 0 (0.0%) |
| 1 Vehicle | 20 (54.0%) | 22 (56.4%) |
| 2 Vehicles | 17 (46.0%) | 17 (43.6%) |
| 3 Vehicles | 0 (0.0%) | 0 (0.0%) |
| 4 Vehicles | 0 (0.0%) | 0 (0.0%) |
| 5 or more Vehicles | 0 (0.0%) | 0 (0.0%) |
| Total | 37 (100.0%) | 39 (100.0%) |
Commute Time in Short
The most frequently occuring commute durations in Short are 5 to 9 minutes (22 commuters, 28.9%), 15 to 19 minutes (20 commuters, 26.3%), and 25 to 29 minutes (15 commuters, 19.7%).
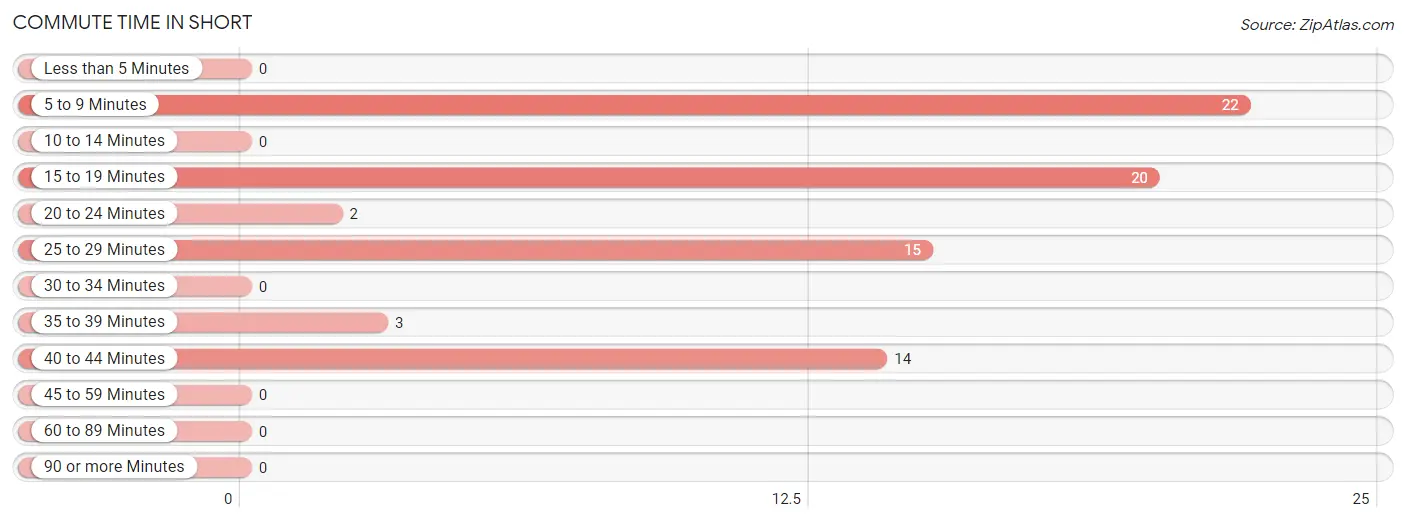
| Commute Time | # Commuters | % Commuters |
| Less than 5 Minutes | 0 | 0.0% |
| 5 to 9 Minutes | 22 | 28.9% |
| 10 to 14 Minutes | 0 | 0.0% |
| 15 to 19 Minutes | 20 | 26.3% |
| 20 to 24 Minutes | 2 | 2.6% |
| 25 to 29 Minutes | 15 | 19.7% |
| 30 to 34 Minutes | 0 | 0.0% |
| 35 to 39 Minutes | 3 | 4.0% |
| 40 to 44 Minutes | 14 | 18.4% |
| 45 to 59 Minutes | 0 | 0.0% |
| 60 to 89 Minutes | 0 | 0.0% |
| 90 or more Minutes | 0 | 0.0% |
Commute Time by Sex in Short
The most common commute times in Short are 15 to 19 minutes (20 commuters, 54.0%) for males and 5 to 9 minutes (22 commuters, 56.4%) for females.
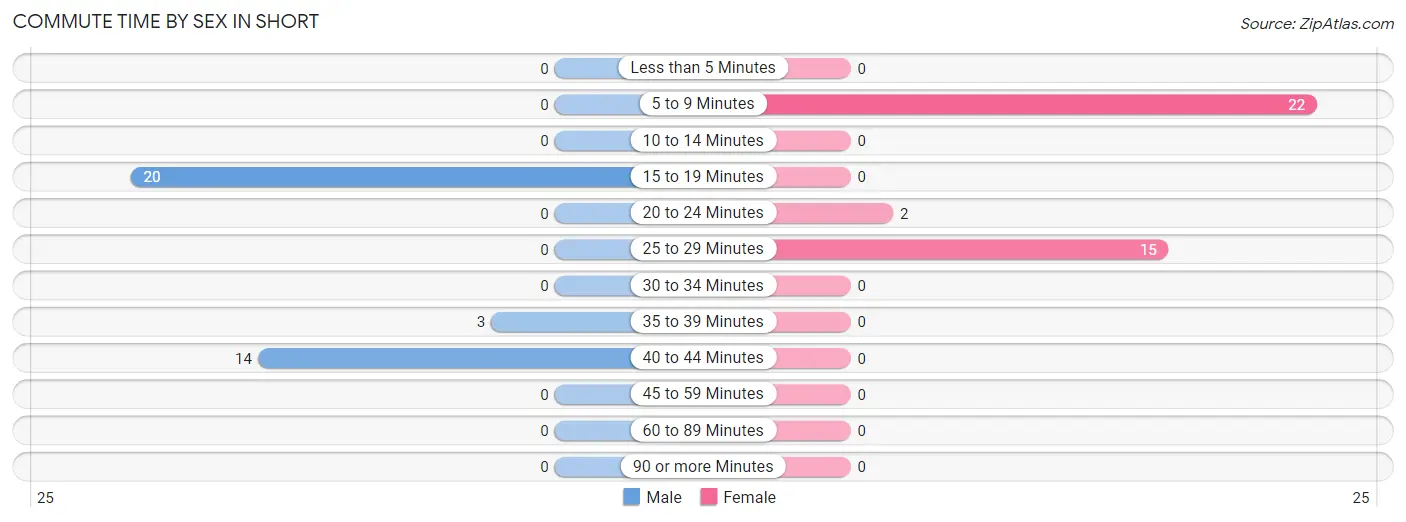
| Commute Time | Male | Female |
| Less than 5 Minutes | 0 (0.0%) | 0 (0.0%) |
| 5 to 9 Minutes | 0 (0.0%) | 22 (56.4%) |
| 10 to 14 Minutes | 0 (0.0%) | 0 (0.0%) |
| 15 to 19 Minutes | 20 (54.0%) | 0 (0.0%) |
| 20 to 24 Minutes | 0 (0.0%) | 2 (5.1%) |
| 25 to 29 Minutes | 0 (0.0%) | 15 (38.5%) |
| 30 to 34 Minutes | 0 (0.0%) | 0 (0.0%) |
| 35 to 39 Minutes | 3 (8.1%) | 0 (0.0%) |
| 40 to 44 Minutes | 14 (37.8%) | 0 (0.0%) |
| 45 to 59 Minutes | 0 (0.0%) | 0 (0.0%) |
| 60 to 89 Minutes | 0 (0.0%) | 0 (0.0%) |
| 90 or more Minutes | 0 (0.0%) | 0 (0.0%) |
Time of Departure to Work by Sex in Short
The most frequent times of departure to work in Short are 6:30 AM to 6:59 AM (20, 54.0%) for males and 6:30 AM to 6:59 AM (22, 56.4%) for females.
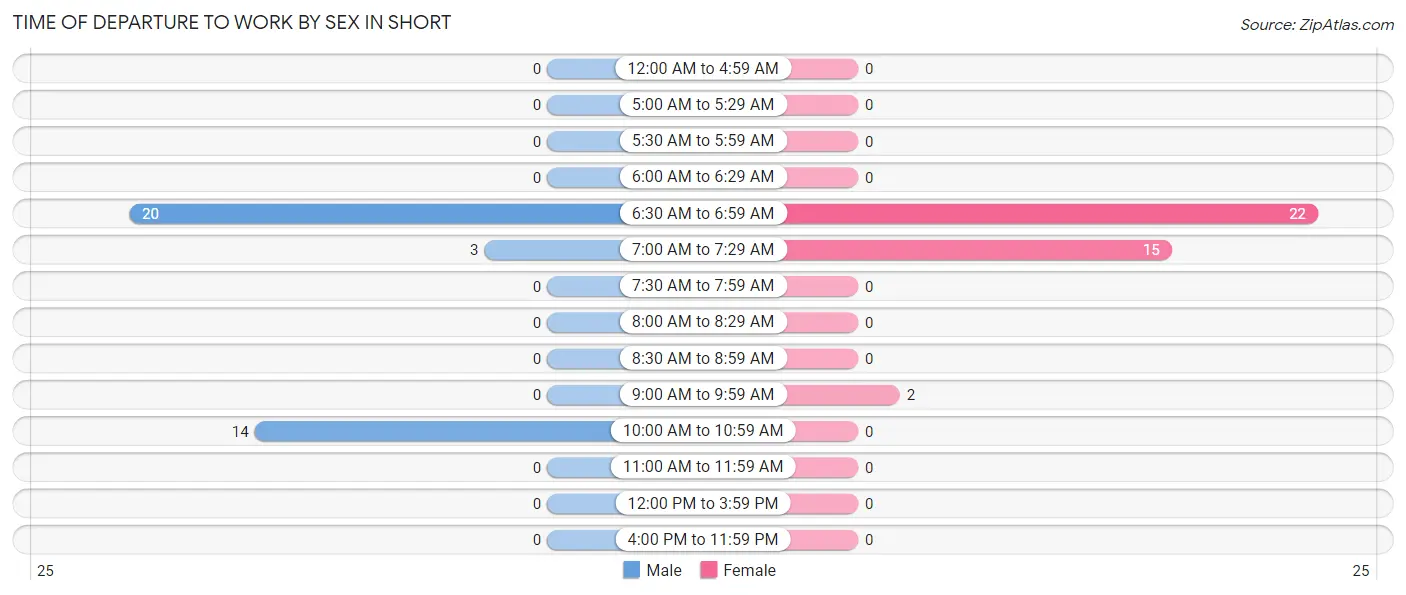
| Time of Departure | Male | Female |
| 12:00 AM to 4:59 AM | 0 (0.0%) | 0 (0.0%) |
| 5:00 AM to 5:29 AM | 0 (0.0%) | 0 (0.0%) |
| 5:30 AM to 5:59 AM | 0 (0.0%) | 0 (0.0%) |
| 6:00 AM to 6:29 AM | 0 (0.0%) | 0 (0.0%) |
| 6:30 AM to 6:59 AM | 20 (54.0%) | 22 (56.4%) |
| 7:00 AM to 7:29 AM | 3 (8.1%) | 15 (38.5%) |
| 7:30 AM to 7:59 AM | 0 (0.0%) | 0 (0.0%) |
| 8:00 AM to 8:29 AM | 0 (0.0%) | 0 (0.0%) |
| 8:30 AM to 8:59 AM | 0 (0.0%) | 0 (0.0%) |
| 9:00 AM to 9:59 AM | 0 (0.0%) | 2 (5.1%) |
| 10:00 AM to 10:59 AM | 14 (37.8%) | 0 (0.0%) |
| 11:00 AM to 11:59 AM | 0 (0.0%) | 0 (0.0%) |
| 12:00 PM to 3:59 PM | 0 (0.0%) | 0 (0.0%) |
| 4:00 PM to 11:59 PM | 0 (0.0%) | 0 (0.0%) |
| Total | 37 (100.0%) | 39 (100.0%) |
Housing Occupancy in Short
Occupancy by Ownership in Short
Of the total 99 dwellings in Short, owner-occupied units account for 95 (96.0%), while renter-occupied units make up 4 (4.0%).
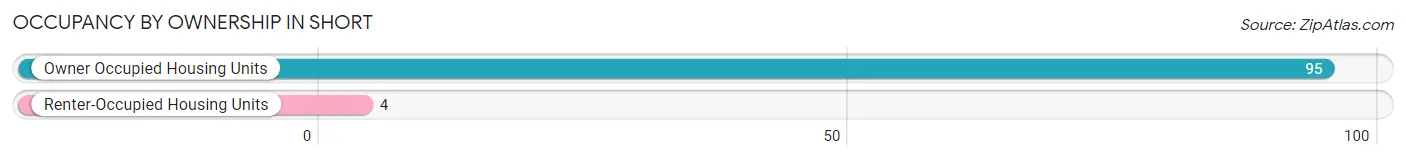
| Occupancy | # Housing Units | % Housing Units |
| Owner Occupied Housing Units | 95 | 96.0% |
| Renter-Occupied Housing Units | 4 | 4.0% |
| Total Occupied Housing Units | 99 | 100.0% |
Occupancy by Household Size in Short
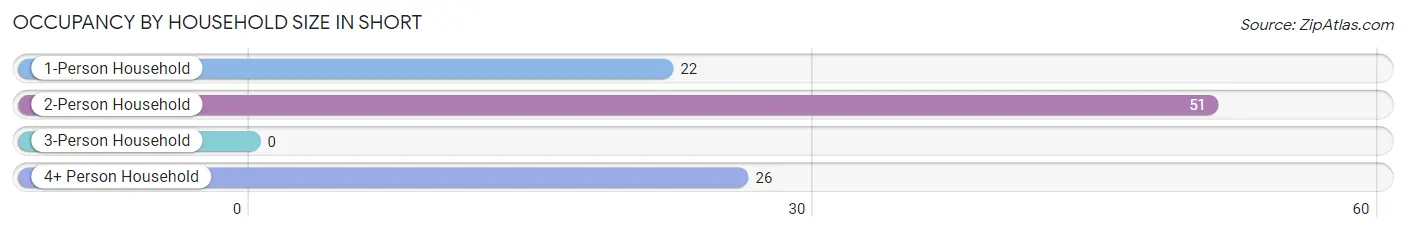
| Household Size | # Housing Units | % Housing Units |
| 1-Person Household | 22 | 22.2% |
| 2-Person Household | 51 | 51.5% |
| 3-Person Household | 0 | 0.0% |
| 4+ Person Household | 26 | 26.3% |
| Total Housing Units | 99 | 100.0% |
Occupancy by Ownership by Household Size in Short
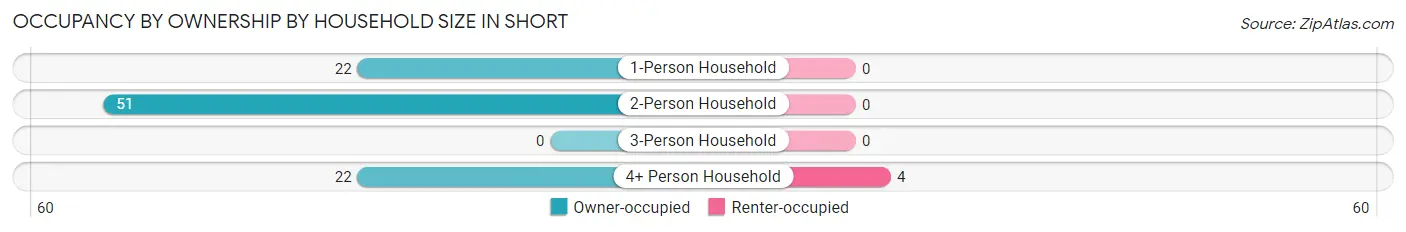
| Household Size | Owner-occupied | Renter-occupied |
| 1-Person Household | 22 (100.0%) | 0 (0.0%) |
| 2-Person Household | 51 (100.0%) | 0 (0.0%) |
| 3-Person Household | 0 (0.0%) | 0 (0.0%) |
| 4+ Person Household | 22 (84.6%) | 4 (15.4%) |
| Total Housing Units | 95 (96.0%) | 4 (4.0%) |
Occupancy by Educational Attainment in Short
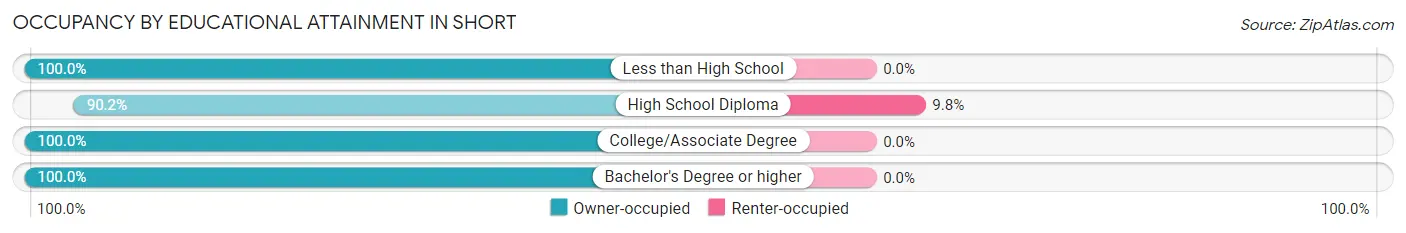
| Household Size | Owner-occupied | Renter-occupied |
| Less than High School | 22 (100.0%) | 0 (0.0%) |
| High School Diploma | 37 (90.2%) | 4 (9.8%) |
| College/Associate Degree | 34 (100.0%) | 0 (0.0%) |
| Bachelor's Degree or higher | 2 (100.0%) | 0 (0.0%) |
Occupancy by Age of Householder in Short
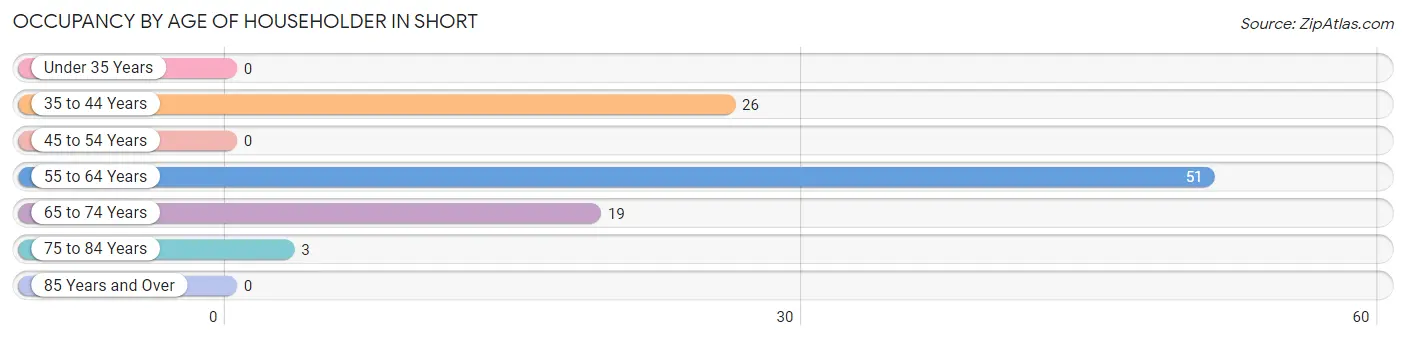
| Age Bracket | # Households | % Households |
| Under 35 Years | 0 | 0.0% |
| 35 to 44 Years | 26 | 26.3% |
| 45 to 54 Years | 0 | 0.0% |
| 55 to 64 Years | 51 | 51.5% |
| 65 to 74 Years | 19 | 19.2% |
| 75 to 84 Years | 3 | 3.0% |
| 85 Years and Over | 0 | 0.0% |
| Total | 99 | 100.0% |
Housing Finances in Short
Median Income by Occupancy in Short
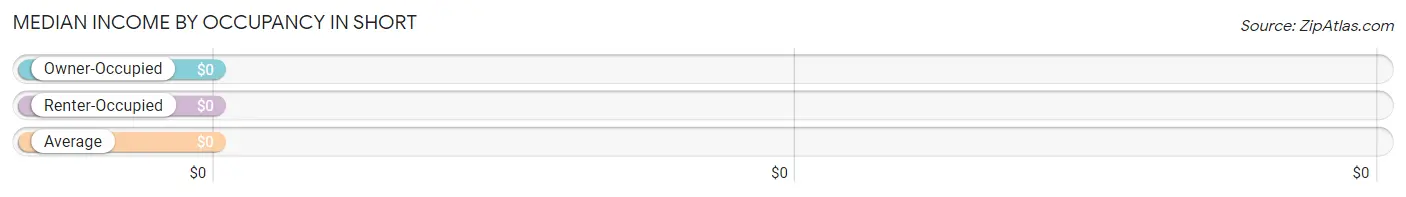
| Occupancy Type | # Households | Median Income |
| Owner-Occupied | 95 (96.0%) | $0 |
| Renter-Occupied | 4 (4.0%) | $0 |
| Average | 99 (100.0%) | $0 |
Occupancy by Householder Income Bracket in Short
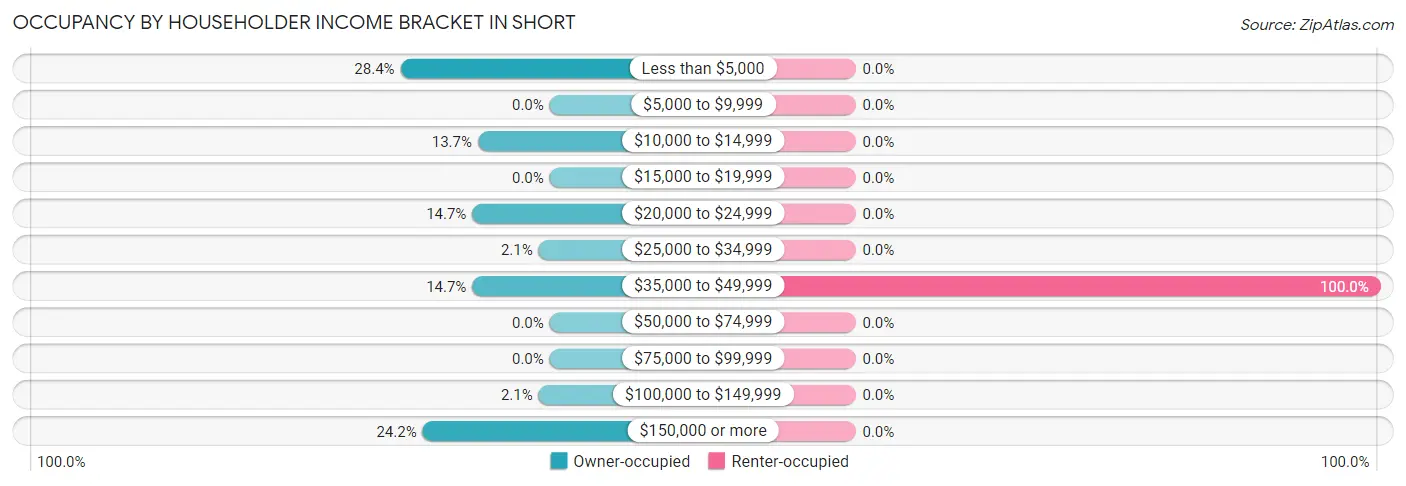
| Income Bracket | Owner-occupied | Renter-occupied |
| Less than $5,000 | 27 (28.4%) | 0 (0.0%) |
| $5,000 to $9,999 | 0 (0.0%) | 0 (0.0%) |
| $10,000 to $14,999 | 13 (13.7%) | 0 (0.0%) |
| $15,000 to $19,999 | 0 (0.0%) | 0 (0.0%) |
| $20,000 to $24,999 | 14 (14.7%) | 0 (0.0%) |
| $25,000 to $34,999 | 2 (2.1%) | 0 (0.0%) |
| $35,000 to $49,999 | 14 (14.7%) | 4 (100.0%) |
| $50,000 to $74,999 | 0 (0.0%) | 0 (0.0%) |
| $75,000 to $99,999 | 0 (0.0%) | 0 (0.0%) |
| $100,000 to $149,999 | 2 (2.1%) | 0 (0.0%) |
| $150,000 or more | 23 (24.2%) | 0 (0.0%) |
| Total | 95 (100.0%) | 4 (100.0%) |
Monthly Housing Cost Tiers in Short
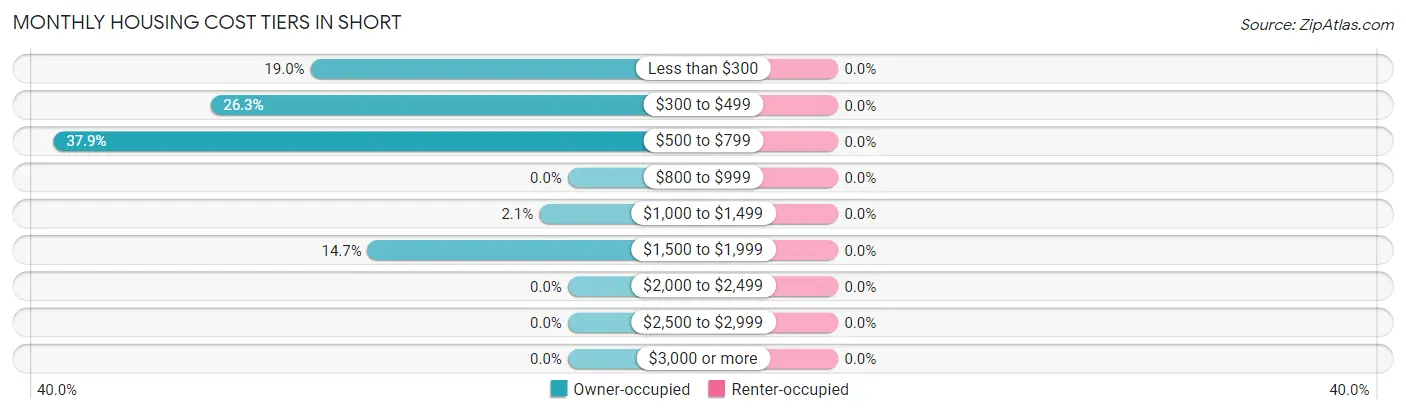
| Monthly Cost | Owner-occupied | Renter-occupied |
| Less than $300 | 18 (19.0%) | 0 (0.0%) |
| $300 to $499 | 25 (26.3%) | 0 (0.0%) |
| $500 to $799 | 36 (37.9%) | 0 (0.0%) |
| $800 to $999 | 0 (0.0%) | 0 (0.0%) |
| $1,000 to $1,499 | 2 (2.1%) | 0 (0.0%) |
| $1,500 to $1,999 | 14 (14.7%) | 0 (0.0%) |
| $2,000 to $2,499 | 0 (0.0%) | 0 (0.0%) |
| $2,500 to $2,999 | 0 (0.0%) | 0 (0.0%) |
| $3,000 or more | 0 (0.0%) | 0 (0.0%) |
| Total | 95 (100.0%) | 4 (100.0%) |
Physical Housing Characteristics in Short
Housing Structures in Short
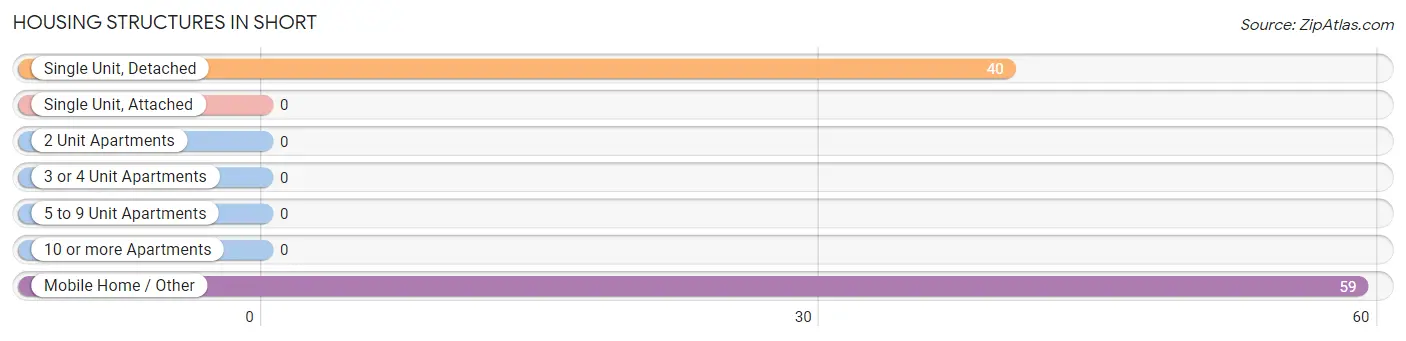
| Structure Type | # Housing Units | % Housing Units |
| Single Unit, Detached | 40 | 40.4% |
| Single Unit, Attached | 0 | 0.0% |
| 2 Unit Apartments | 0 | 0.0% |
| 3 or 4 Unit Apartments | 0 | 0.0% |
| 5 to 9 Unit Apartments | 0 | 0.0% |
| 10 or more Apartments | 0 | 0.0% |
| Mobile Home / Other | 59 | 59.6% |
| Total | 99 | 100.0% |
Housing Structures by Occupancy in Short
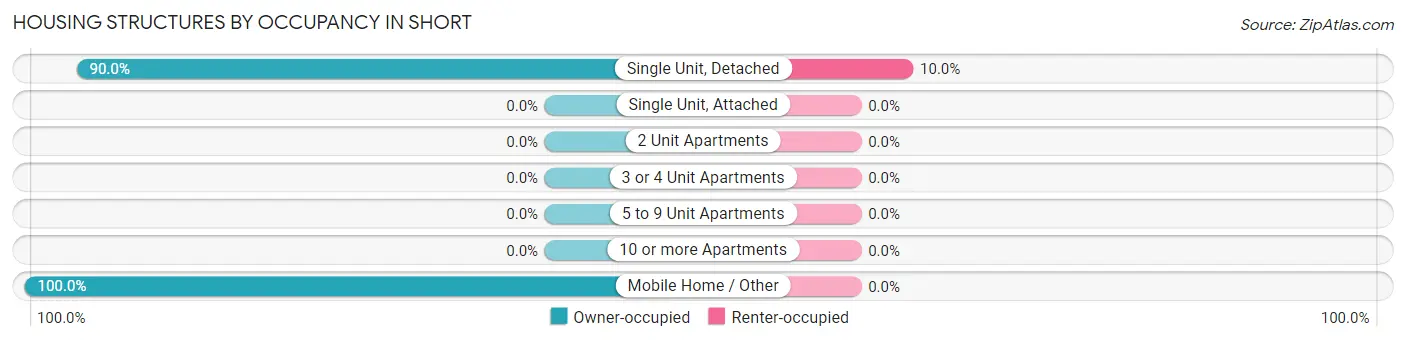
| Structure Type | Owner-occupied | Renter-occupied |
| Single Unit, Detached | 36 (90.0%) | 4 (10.0%) |
| Single Unit, Attached | 0 (0.0%) | 0 (0.0%) |
| 2 Unit Apartments | 0 (0.0%) | 0 (0.0%) |
| 3 or 4 Unit Apartments | 0 (0.0%) | 0 (0.0%) |
| 5 to 9 Unit Apartments | 0 (0.0%) | 0 (0.0%) |
| 10 or more Apartments | 0 (0.0%) | 0 (0.0%) |
| Mobile Home / Other | 59 (100.0%) | 0 (0.0%) |
| Total | 95 (96.0%) | 4 (4.0%) |
Housing Structures by Number of Rooms in Short
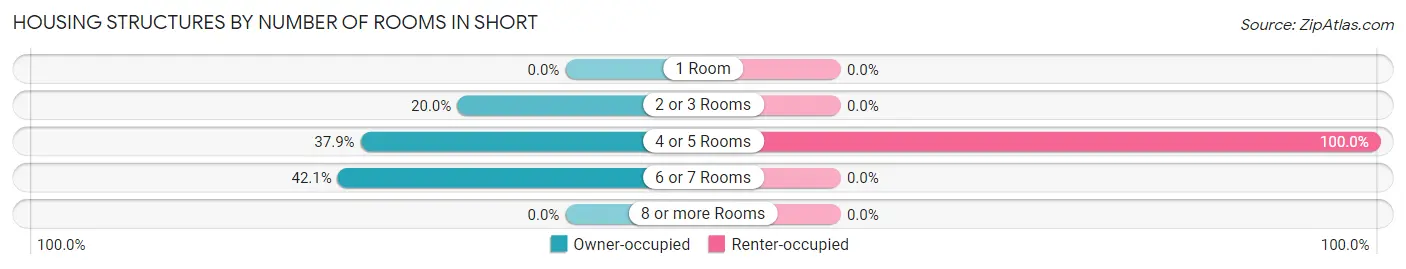
| Number of Rooms | Owner-occupied | Renter-occupied |
| 1 Room | 0 (0.0%) | 0 (0.0%) |
| 2 or 3 Rooms | 19 (20.0%) | 0 (0.0%) |
| 4 or 5 Rooms | 36 (37.9%) | 4 (100.0%) |
| 6 or 7 Rooms | 40 (42.1%) | 0 (0.0%) |
| 8 or more Rooms | 0 (0.0%) | 0 (0.0%) |
| Total | 95 (100.0%) | 4 (100.0%) |
Housing Structure by Heating Type in Short
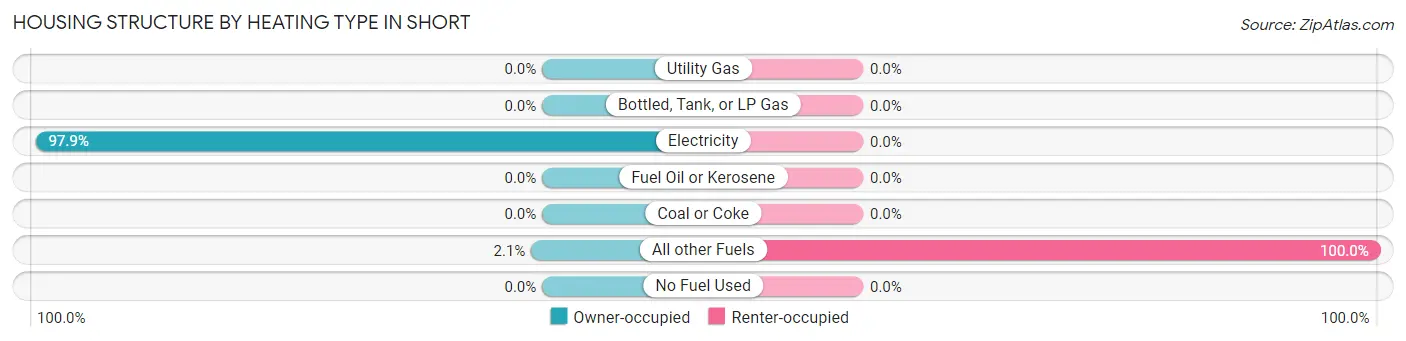
| Heating Type | Owner-occupied | Renter-occupied |
| Utility Gas | 0 (0.0%) | 0 (0.0%) |
| Bottled, Tank, or LP Gas | 0 (0.0%) | 0 (0.0%) |
| Electricity | 93 (97.9%) | 0 (0.0%) |
| Fuel Oil or Kerosene | 0 (0.0%) | 0 (0.0%) |
| Coal or Coke | 0 (0.0%) | 0 (0.0%) |
| All other Fuels | 2 (2.1%) | 4 (100.0%) |
| No Fuel Used | 0 (0.0%) | 0 (0.0%) |
| Total | 95 (100.0%) | 4 (100.0%) |
Household Vehicle Usage in Short
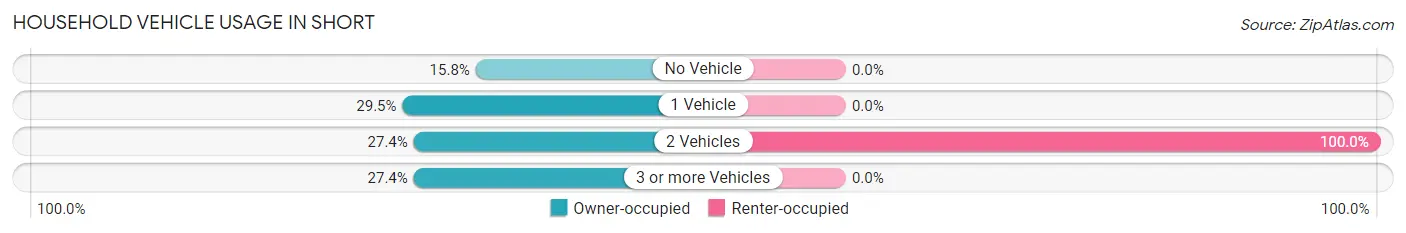
| Vehicles per Household | Owner-occupied | Renter-occupied |
| No Vehicle | 15 (15.8%) | 0 (0.0%) |
| 1 Vehicle | 28 (29.5%) | 0 (0.0%) |
| 2 Vehicles | 26 (27.4%) | 4 (100.0%) |
| 3 or more Vehicles | 26 (27.4%) | 0 (0.0%) |
| Total | 95 (100.0%) | 4 (100.0%) |
Real Estate & Mortgages in Short
Real Estate and Mortgage Overview in Short
| Characteristic | Without Mortgage | With Mortgage |
| Housing Units | 55 | 40 |
| Median Property Value | $44,500 | $0 |
| Median Household Income | - | - |
| Monthly Housing Costs | $348 | $0 |
| Real Estate Taxes | - | - |
Property Value by Mortgage Status in Short
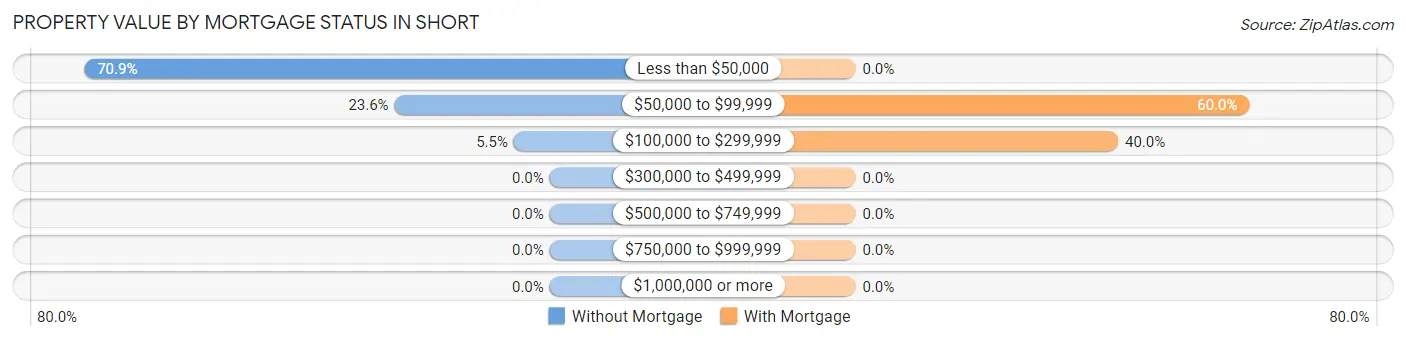
| Property Value | Without Mortgage | With Mortgage |
| Less than $50,000 | 39 (70.9%) | 0 (0.0%) |
| $50,000 to $99,999 | 13 (23.6%) | 24 (60.0%) |
| $100,000 to $299,999 | 3 (5.4%) | 16 (40.0%) |
| $300,000 to $499,999 | 0 (0.0%) | 0 (0.0%) |
| $500,000 to $749,999 | 0 (0.0%) | 0 (0.0%) |
| $750,000 to $999,999 | 0 (0.0%) | 0 (0.0%) |
| $1,000,000 or more | 0 (0.0%) | 0 (0.0%) |
| Total | 55 (100.0%) | 40 (100.0%) |
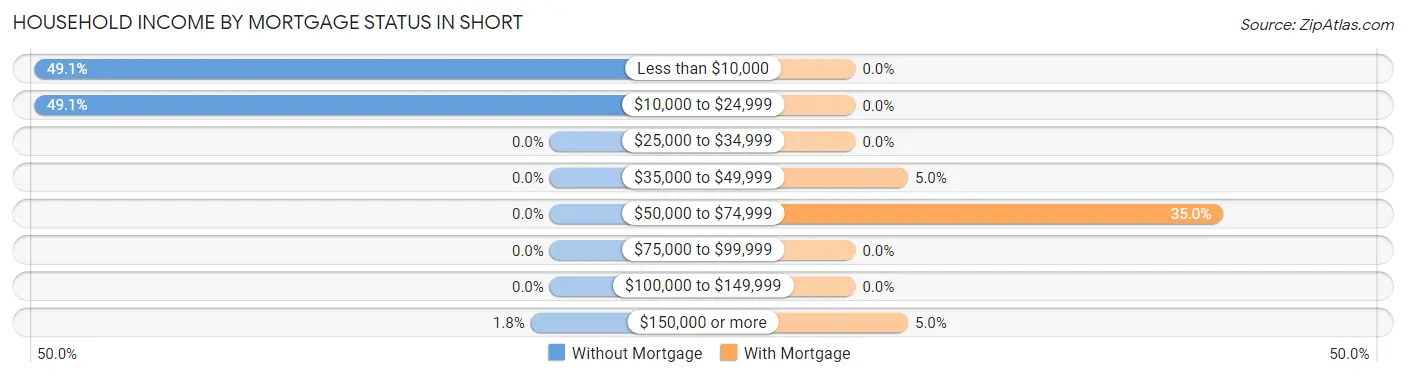
Household Income by Mortgage Status in Short
| Household Income | Without Mortgage | With Mortgage |
| Less than $10,000 | 27 (49.1%) | 0 (0.0%) |
| $10,000 to $24,999 | 27 (49.1%) | 0 (0.0%) |
| $25,000 to $34,999 | 0 (0.0%) | 0 (0.0%) |
| $35,000 to $49,999 | 0 (0.0%) | 2 (5.0%) |
| $50,000 to $74,999 | 0 (0.0%) | 14 (35.0%) |
| $75,000 to $99,999 | 0 (0.0%) | 0 (0.0%) |
| $100,000 to $149,999 | 0 (0.0%) | 0 (0.0%) |
| $150,000 or more | 1 (1.8%) | 2 (5.0%) |
| Total | 55 (100.0%) | 40 (100.0%) |
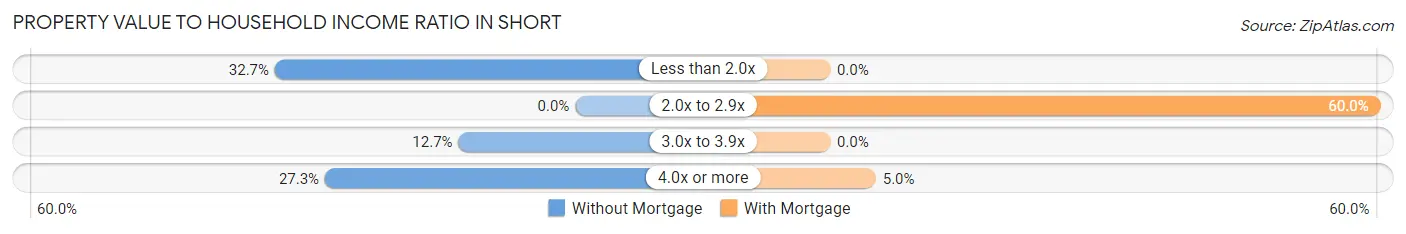
Property Value to Household Income Ratio in Short
| Value-to-Income Ratio | Without Mortgage | With Mortgage |
| Less than 2.0x | 18 (32.7%) | 0 (0.0%) |
| 2.0x to 2.9x | 0 (0.0%) | 24 (60.0%) |
| 3.0x to 3.9x | 7 (12.7%) | 0 (0.0%) |
| 4.0x or more | 15 (27.3%) | 2 (5.0%) |
| Total | 55 (100.0%) | 40 (100.0%) |
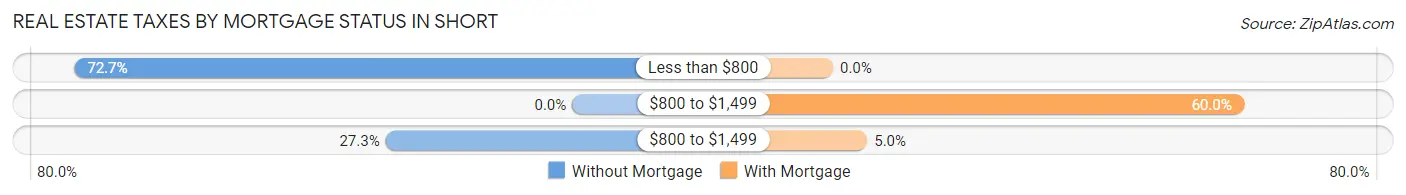
Real Estate Taxes by Mortgage Status in Short
| Property Taxes | Without Mortgage | With Mortgage |
| Less than $800 | 40 (72.7%) | 0 (0.0%) |
| $800 to $1,499 | 0 (0.0%) | 24 (60.0%) |
| $800 to $1,499 | 15 (27.3%) | 2 (5.0%) |
| Total | 55 (100.0%) | 40 (100.0%) |
Health & Disability in Short
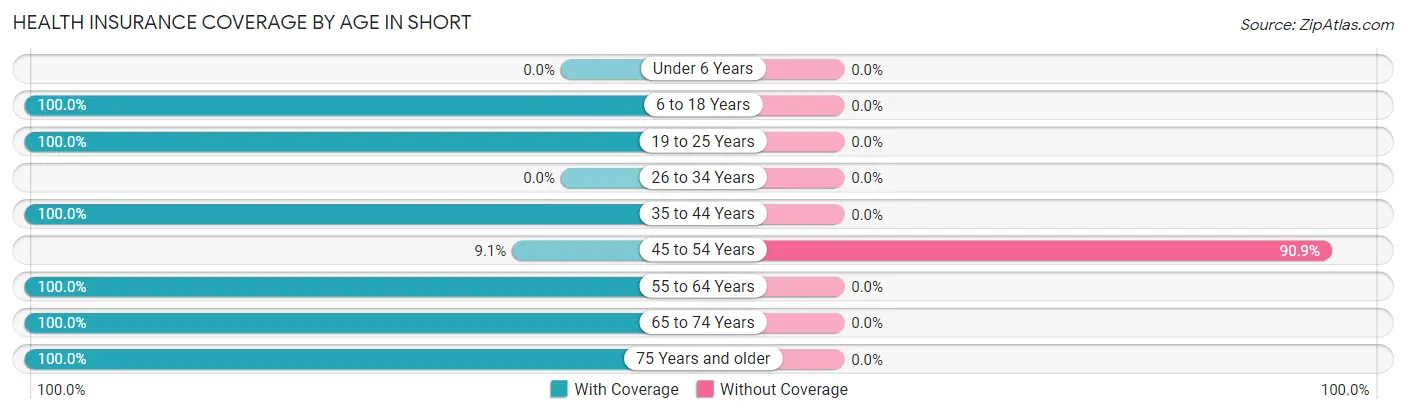
Health Insurance Coverage by Age in Short
| Age Bracket | With Coverage | Without Coverage |
| Under 6 Years | 0 (0.0%) | 0 (0.0%) |
| 6 to 18 Years | 53 (100.0%) | 0 (0.0%) |
| 19 to 25 Years | 21 (100.0%) | 0 (0.0%) |
| 26 to 34 Years | 0 (0.0%) | 0 (0.0%) |
| 35 to 44 Years | 29 (100.0%) | 0 (0.0%) |
| 45 to 54 Years | 2 (9.1%) | 20 (90.9%) |
| 55 to 64 Years | 83 (100.0%) | 0 (0.0%) |
| 65 to 74 Years | 20 (100.0%) | 0 (0.0%) |
| 75 Years and older | 13 (100.0%) | 0 (0.0%) |
| Total | 221 (91.7%) | 20 (8.3%) |
Health Insurance Coverage by Citizenship Status in Short
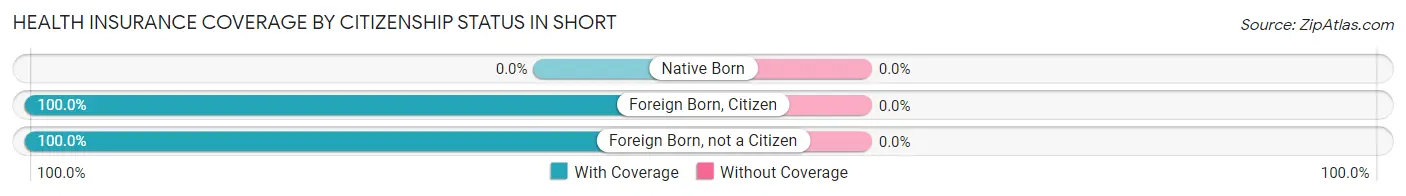
| Citizenship Status | With Coverage | Without Coverage |
| Native Born | 0 (0.0%) | 0 (0.0%) |
| Foreign Born, Citizen | 53 (100.0%) | 0 (0.0%) |
| Foreign Born, not a Citizen | 21 (100.0%) | 0 (0.0%) |
Health Insurance Coverage by Household Income in Short
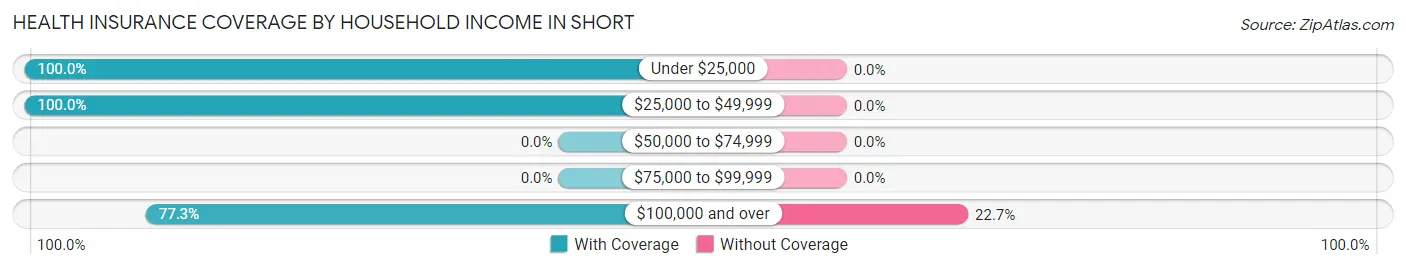
| Household Income | With Coverage | Without Coverage |
| Under $25,000 | 81 (100.0%) | 0 (0.0%) |
| $25,000 to $49,999 | 72 (100.0%) | 0 (0.0%) |
| $50,000 to $74,999 | 0 (0.0%) | 0 (0.0%) |
| $75,000 to $99,999 | 0 (0.0%) | 0 (0.0%) |
| $100,000 and over | 68 (77.3%) | 20 (22.7%) |
Public vs Private Health Insurance Coverage by Age in Short
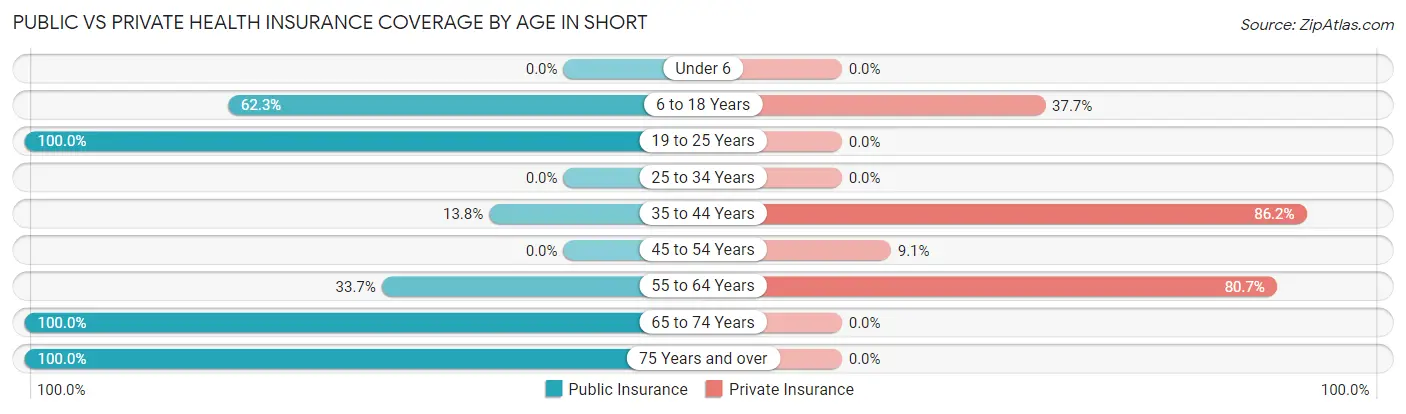
| Age Bracket | Public Insurance | Private Insurance |
| Under 6 | 0 (0.0%) | 0 (0.0%) |
| 6 to 18 Years | 33 (62.3%) | 20 (37.7%) |
| 19 to 25 Years | 21 (100.0%) | 0 (0.0%) |
| 25 to 34 Years | 0 (0.0%) | 0 (0.0%) |
| 35 to 44 Years | 4 (13.8%) | 25 (86.2%) |
| 45 to 54 Years | 0 (0.0%) | 2 (9.1%) |
| 55 to 64 Years | 28 (33.7%) | 67 (80.7%) |
| 65 to 74 Years | 20 (100.0%) | 0 (0.0%) |
| 75 Years and over | 13 (100.0%) | 0 (0.0%) |
| Total | 119 (49.4%) | 114 (47.3%) |
Disability Status by Sex by Age in Short
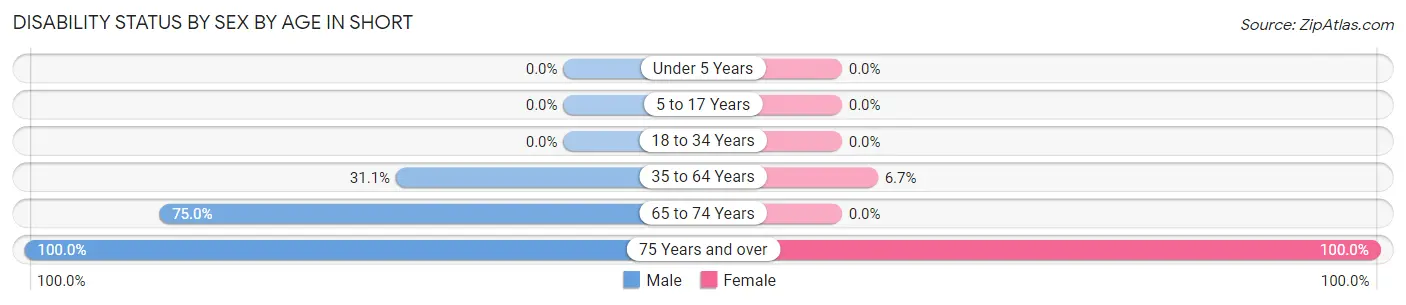
| Age Bracket | Male | Female |
| Under 5 Years | 0 (0.0%) | 0 (0.0%) |
| 5 to 17 Years | 0 (0.0%) | 0 (0.0%) |
| 18 to 34 Years | 0 (0.0%) | 0 (0.0%) |
| 35 to 64 Years | 23 (31.1%) | 4 (6.7%) |
| 65 to 74 Years | 3 (75.0%) | 0 (0.0%) |
| 75 Years and over | 10 (100.0%) | 3 (100.0%) |
Disability Class by Sex by Age in Short
Disability Class: Hearing Difficulty
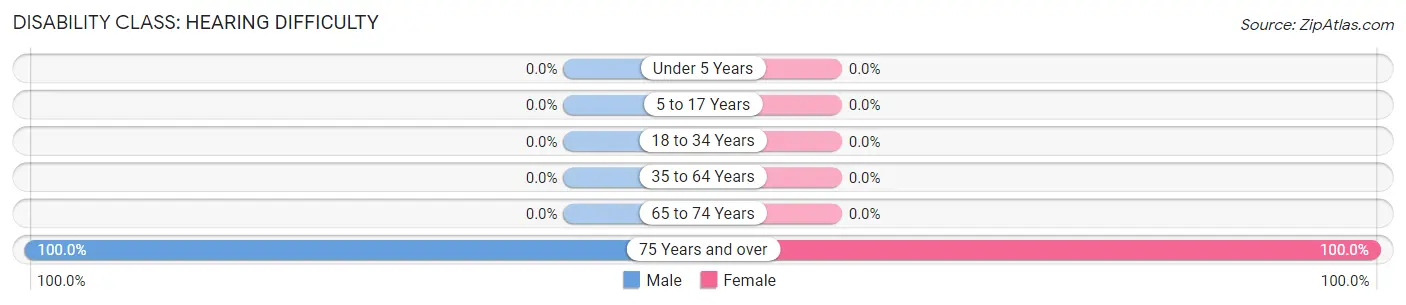
| Age Bracket | Male | Female |
| Under 5 Years | 0 (0.0%) | 0 (0.0%) |
| 5 to 17 Years | 0 (0.0%) | 0 (0.0%) |
| 18 to 34 Years | 0 (0.0%) | 0 (0.0%) |
| 35 to 64 Years | 0 (0.0%) | 0 (0.0%) |
| 65 to 74 Years | 0 (0.0%) | 0 (0.0%) |
| 75 Years and over | 10 (100.0%) | 3 (100.0%) |
Disability Class: Vision Difficulty
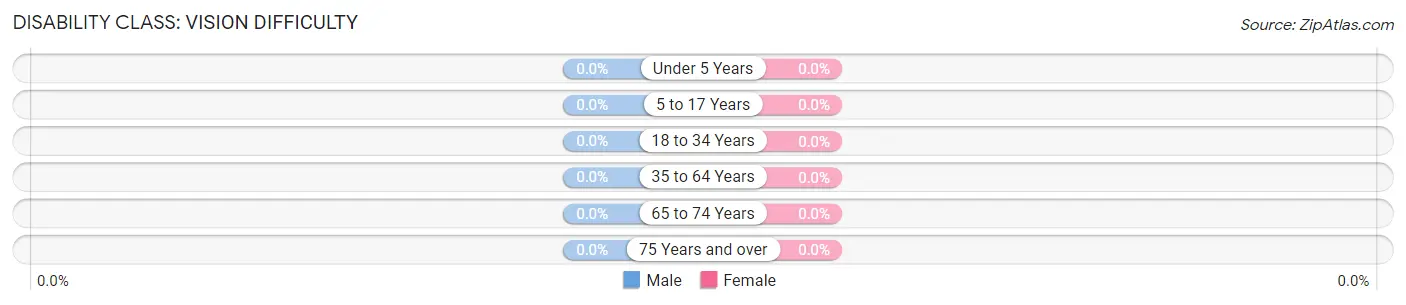
| Age Bracket | Male | Female |
| Under 5 Years | 0 (0.0%) | 0 (0.0%) |
| 5 to 17 Years | 0 (0.0%) | 0 (0.0%) |
| 18 to 34 Years | 0 (0.0%) | 0 (0.0%) |
| 35 to 64 Years | 0 (0.0%) | 0 (0.0%) |
| 65 to 74 Years | 0 (0.0%) | 0 (0.0%) |
| 75 Years and over | 0 (0.0%) | 0 (0.0%) |
Disability Class: Cognitive Difficulty
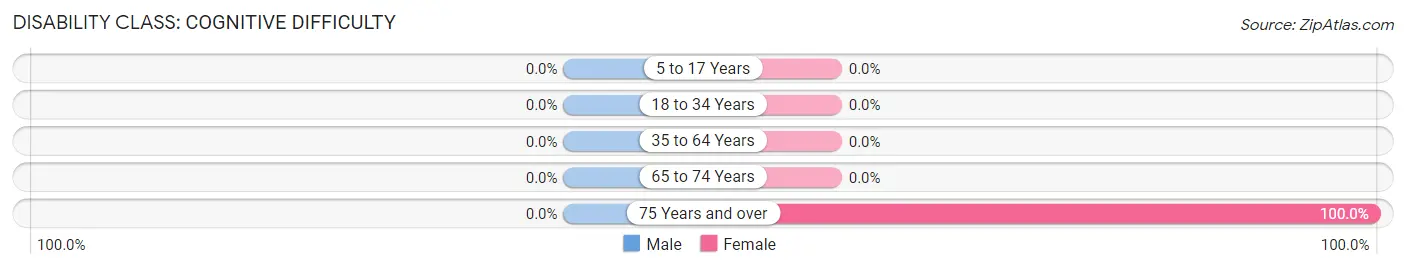
| Age Bracket | Male | Female |
| 5 to 17 Years | 0 (0.0%) | 0 (0.0%) |
| 18 to 34 Years | 0 (0.0%) | 0 (0.0%) |
| 35 to 64 Years | 0 (0.0%) | 0 (0.0%) |
| 65 to 74 Years | 0 (0.0%) | 0 (0.0%) |
| 75 Years and over | 0 (0.0%) | 3 (100.0%) |
Disability Class: Ambulatory Difficulty
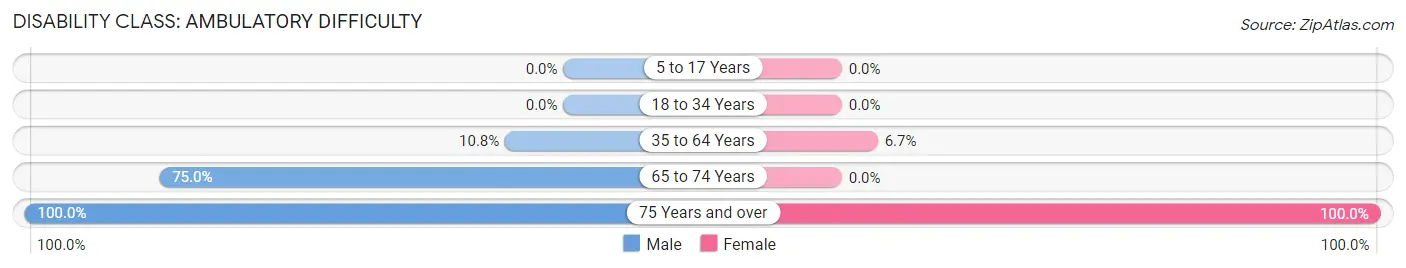
| Age Bracket | Male | Female |
| 5 to 17 Years | 0 (0.0%) | 0 (0.0%) |
| 18 to 34 Years | 0 (0.0%) | 0 (0.0%) |
| 35 to 64 Years | 8 (10.8%) | 4 (6.7%) |
| 65 to 74 Years | 3 (75.0%) | 0 (0.0%) |
| 75 Years and over | 10 (100.0%) | 3 (100.0%) |
Disability Class: Self-Care Difficulty
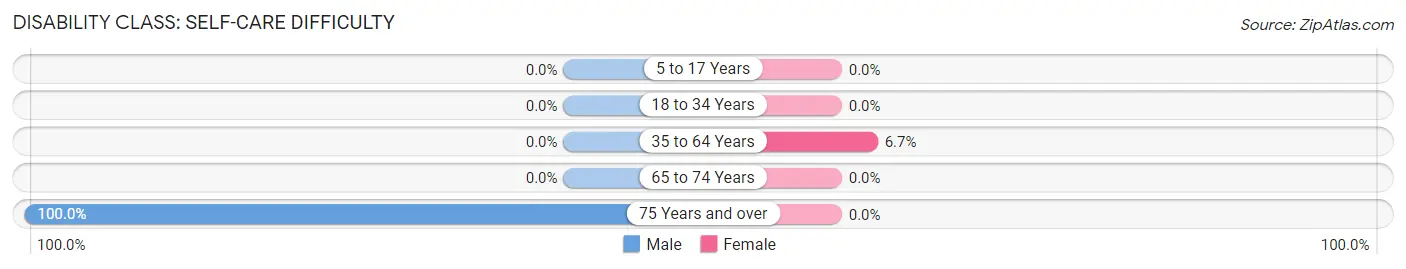
| Age Bracket | Male | Female |
| 5 to 17 Years | 0 (0.0%) | 0 (0.0%) |
| 18 to 34 Years | 0 (0.0%) | 0 (0.0%) |
| 35 to 64 Years | 0 (0.0%) | 4 (6.7%) |
| 65 to 74 Years | 0 (0.0%) | 0 (0.0%) |
| 75 Years and over | 10 (100.0%) | 0 (0.0%) |
Technology Access in Short
Computing Device Access in Short
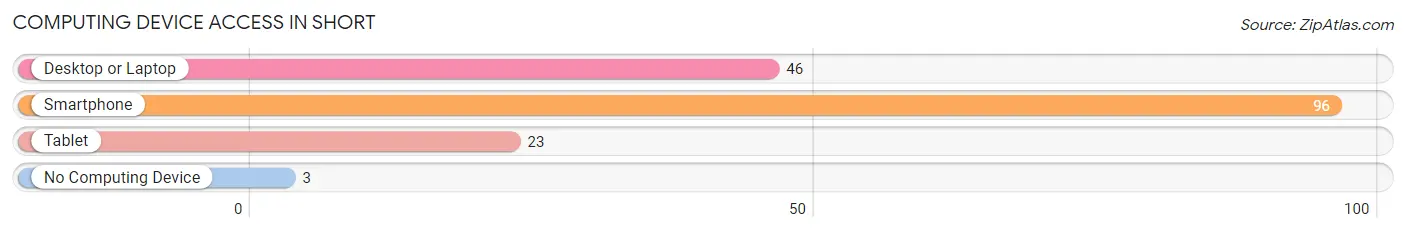
| Device Type | # Households | % Households |
| Desktop or Laptop | 46 | 46.5% |
| Smartphone | 96 | 97.0% |
| Tablet | 23 | 23.2% |
| No Computing Device | 3 | 3.0% |
| Total | 99 | 100.0% |
Internet Access in Short
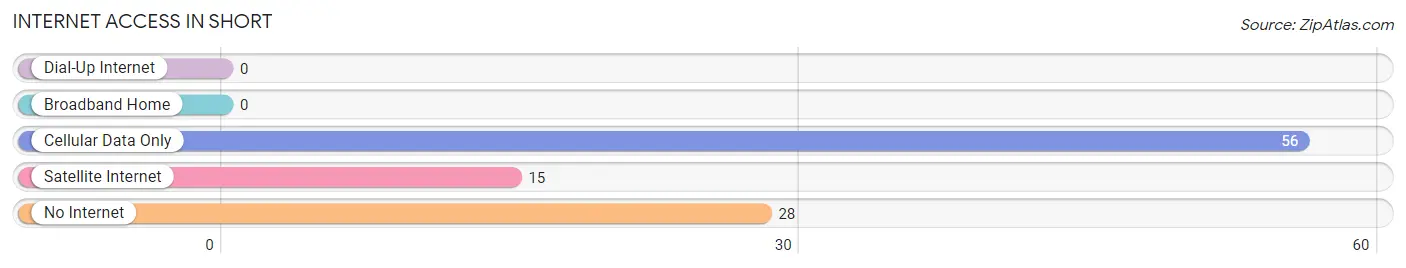
| Internet Type | # Households | % Households |
| Dial-Up Internet | 0 | 0.0% |
| Broadband Home | 0 | 0.0% |
| Cellular Data Only | 56 | 56.6% |
| Satellite Internet | 15 | 15.1% |
| No Internet | 28 | 28.3% |
| Total | 99 | 100.0% |
Short Summary
History
Oklahoma is a state located in the South Central region of the United States. It is bordered by Kansas to the north, Missouri to the northeast, Arkansas to the east, Texas to the south and west, and New Mexico to the west of its Panhandle region. The state's name is derived from the Choctaw words okla and humma, meaning "red people". It is also known informally by its nickname, The Sooner State, in reference to the non-Native settlers who staked their claims on the choicest pieces of land prior to the official opening date of lands in the western Oklahoma Territory or before the Indian Appropriations Act of 1889, which increased European-American settlement in the eastern part of the territory.
The area that is now Oklahoma was first settled by Native Americans, including the Caddo, Comanche, Osage, and Kiowa. In the early 19th century, the United States government began to negotiate treaties with the tribes to obtain land for settlement. In 1830, Congress passed the Indian Removal Act, which authorized the relocation of Native Americans from their homelands in the southeastern United States to Indian Territory, which was located in what is now Oklahoma. The relocation of the tribes was completed by 1842, and the area was opened to white settlement in 1889.
Oklahoma became the 46th state admitted to the Union on November 16, 1907. During the early 20th century, the state experienced significant economic growth, particularly in the oil and gas industry. The Dust Bowl of the 1930s caused a severe economic downturn, but the state recovered in the 1940s and 1950s with the development of the aerospace and defense industries.
Geography
Oklahoma is located in the South Central region of the United States. It is bordered by Kansas to the north, Missouri to the northeast, Arkansas to the east, Texas to the south and west, and New Mexico to the west of its Panhandle region. The state covers an area of 69,899 square miles, making it the 20th largest state in the country.
The geography of Oklahoma is diverse, with the eastern part of the state consisting of low rolling hills and prairies, while the western part of the state is dominated by the rugged Ouachita Mountains. The state is home to several major rivers, including the Arkansas, Canadian, and Red rivers. Oklahoma also has numerous lakes, including Lake Texoma, Lake Eufaula, and Lake Tenkiller.
Economy
Oklahoma's economy is largely based on the energy industry, with oil and natural gas production being the largest contributors to the state's GDP. Other major industries in the state include agriculture, manufacturing, and tourism.
Agriculture is an important part of Oklahoma's economy, with the state ranking in the top 10 nationally in production of wheat, cotton, and cattle. The state is also a major producer of peanuts, sorghum, and hay.
Manufacturing is also an important part of Oklahoma's economy, with the state being home to several major companies, including Boeing, General Electric, and Whirlpool.
Tourism is also an important part of Oklahoma's economy, with the state being home to several popular attractions, including the Oklahoma City National Memorial, the National Cowboy & Western Heritage Museum, and the Tulsa Zoo.
Demographics
As of 2019, Oklahoma had an estimated population of 3.9 million people. The state is home to a diverse population, with the largest ethnic groups being White (68.3%), American Indian and Alaska Native (9.2%), Black or African American (7.7%), and Hispanic or Latino (7.6%).
The median household income in Oklahoma is $50,051, and the median age is 36.7 years. The state's poverty rate is 16.2%, and the unemployment rate is 3.7%.
Oklahoma is home to several major cities, including Oklahoma City, Tulsa, Norman, and Lawton. Oklahoma City is the state's largest city, with an estimated population of 643,648. Tulsa is the second largest city, with an estimated population of 399,682.
Common Questions
What is Per Capita Income in Short?
Per Capita income in Short is $20,837.
What is the Median Family Income in Short?
Median Family Income in Short is $45,625.
What is Inequality or Gini Index in Short?
Inequality or Gini Index in Short is 0.58.
What is the Total Population of Short?
Total Population of Short is 241.
What is the Total Male Population of Short?
Total Male Population of Short is 97.
What is the Total Female Population of Short?
Total Female Population of Short is 144.
What is the Ratio of Males per 100 Females in Short?
There are 67.36 Males per 100 Females in Short.
What is the Ratio of Females per 100 Males in Short?
There are 148.45 Females per 100 Males in Short.
What is the Median Population Age in Short?
Median Population Age in Short is 53.8 Years.
What is the Average Family Size in Short
Average Family Size in Short is 2.8 People.
What is the Average Household Size in Short
Average Household Size in Short is 2.4 People.
How Large is the Labor Force in Short?
There are 76 People in the Labor Forcein in Short.
What is the Percentage of People in the Labor Force in Short?
39.8% of People are in the Labor Force in Short.