Tusayan, AZ Map & Demographics
Tusayan Map
Tusayan Overview
$33,846
PER CAPITA INCOME
0.47
INEQUALITY / GINI INDEX
394
TOTAL POPULATION
174
MALE POPULATION
220
FEMALE POPULATION
79.09
MALES / 100 FEMALES
126.44
FEMALES / 100 MALES
28.3
MEDIAN AGE
2.8
AVG FAMILY SIZE
2.1
AVG HOUSEHOLD SIZE
274
LABOR FORCE [ PEOPLE ]
82.3%
PERCENT IN LABOR FORCE
Income in Tusayan
Income Overview in Tusayan
| Characteristic | Number | Measure |
| Per Capita Income | 394 | $33,846 |
| Median Family Income | 46 | $0 |
| Mean Family Income | 46 | $139,159 |
| Median Household Income | 123 | $0 |
| Mean Household Income | 123 | $74,192 |
| Income Deficit | 46 | $0 |
| Wage / Income Gap (%) | 394 | 0.00% |
| Wage / Income Gap ($) | 394 | 100.00¢ per $1 |
| Gini / Inequality Index | 394 | 0.47 |
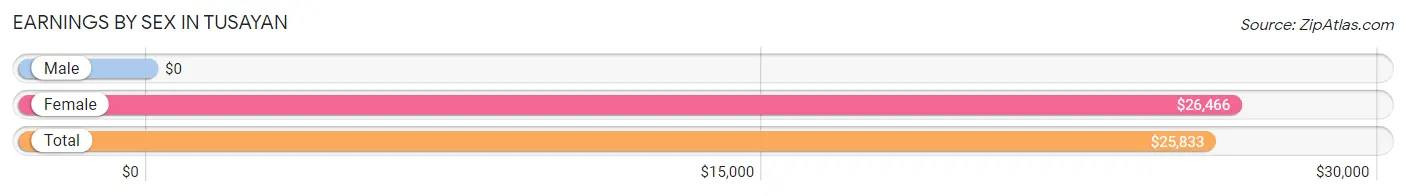
Earnings by Sex in Tusayan
| Sex | Number | Average Earnings |
| Male | 136 (49.6%) | $0 |
| Female | 138 (50.4%) | $26,466 |
| Total | 274 (100.0%) | $25,833 |
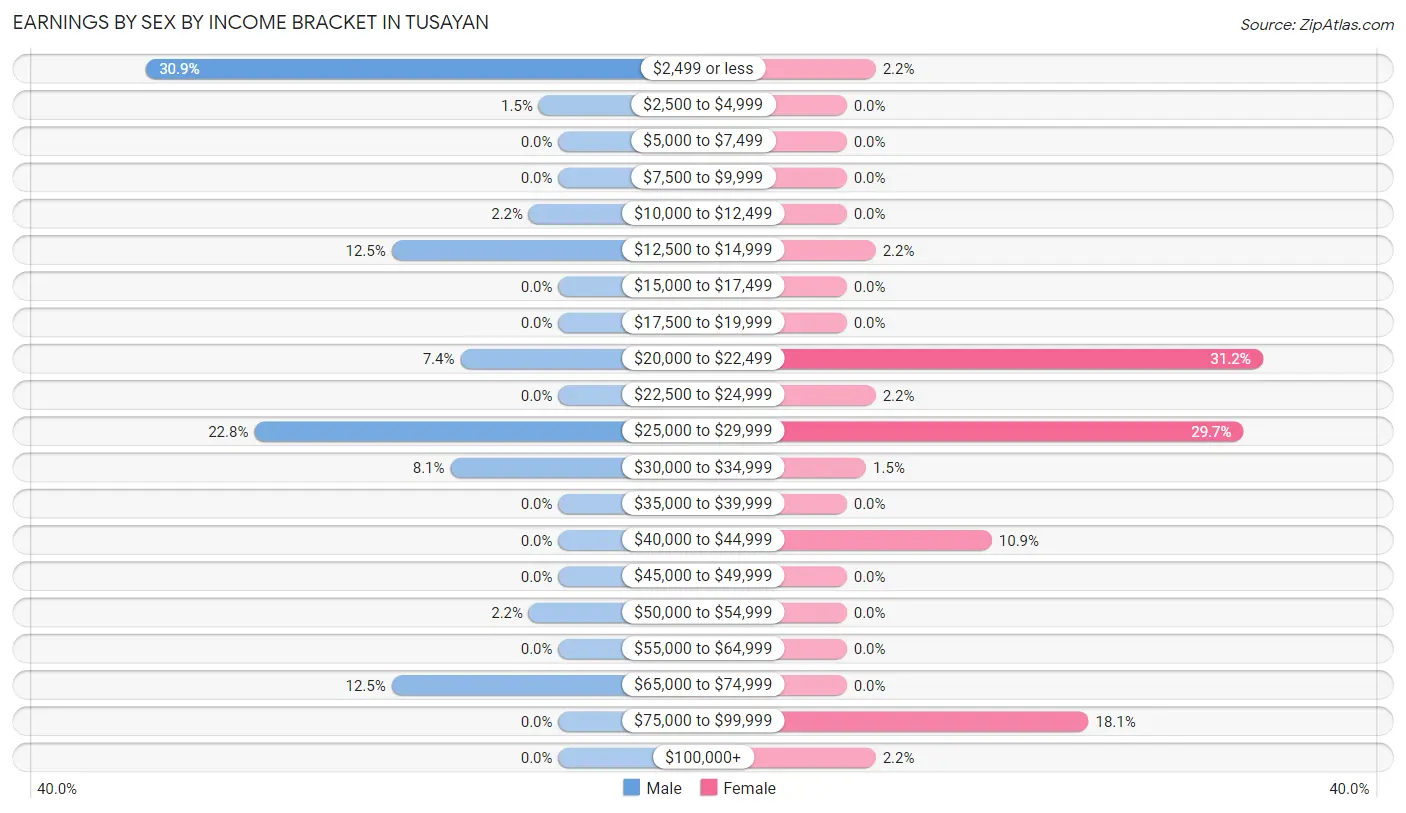
Earnings by Sex by Income Bracket in Tusayan
The most common earnings brackets in Tusayan are $2,499 or less for men (42 | 30.9%) and $20,000 to $22,499 for women (43 | 31.2%).
| Income | Male | Female |
| $2,499 or less | 42 (30.9%) | 3 (2.2%) |
| $2,500 to $4,999 | 2 (1.5%) | 0 (0.0%) |
| $5,000 to $7,499 | 0 (0.0%) | 0 (0.0%) |
| $7,500 to $9,999 | 0 (0.0%) | 0 (0.0%) |
| $10,000 to $12,499 | 3 (2.2%) | 0 (0.0%) |
| $12,500 to $14,999 | 17 (12.5%) | 3 (2.2%) |
| $15,000 to $17,499 | 0 (0.0%) | 0 (0.0%) |
| $17,500 to $19,999 | 0 (0.0%) | 0 (0.0%) |
| $20,000 to $22,499 | 10 (7.3%) | 43 (31.2%) |
| $22,500 to $24,999 | 0 (0.0%) | 3 (2.2%) |
| $25,000 to $29,999 | 31 (22.8%) | 41 (29.7%) |
| $30,000 to $34,999 | 11 (8.1%) | 2 (1.5%) |
| $35,000 to $39,999 | 0 (0.0%) | 0 (0.0%) |
| $40,000 to $44,999 | 0 (0.0%) | 15 (10.9%) |
| $45,000 to $49,999 | 0 (0.0%) | 0 (0.0%) |
| $50,000 to $54,999 | 3 (2.2%) | 0 (0.0%) |
| $55,000 to $64,999 | 0 (0.0%) | 0 (0.0%) |
| $65,000 to $74,999 | 17 (12.5%) | 0 (0.0%) |
| $75,000 to $99,999 | 0 (0.0%) | 25 (18.1%) |
| $100,000+ | 0 (0.0%) | 3 (2.2%) |
| Total | 136 (100.0%) | 138 (100.0%) |
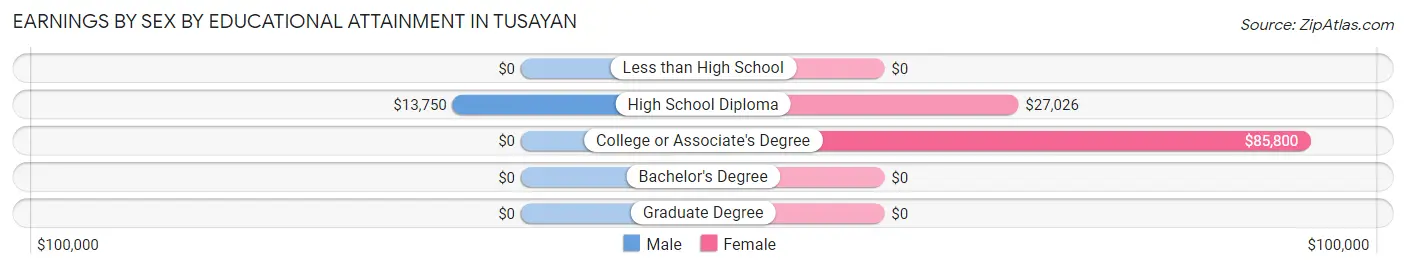
Earnings by Sex by Educational Attainment in Tusayan
| Educational Attainment | Male Income | Female Income |
| Less than High School | - | - |
| High School Diploma | $13,750 | $27,026 |
| College or Associate's Degree | - | - |
| Bachelor's Degree | - | - |
| Graduate Degree | - | - |
| Total | $28,657 | $0 |
Family Income in Tusayan
Family Income Brackets in Tusayan
According to the Tusayan family income data, there are 25 families falling into the $75,000 to $99,999 income range, which is the most common income bracket and makes up 54.3% of all families.
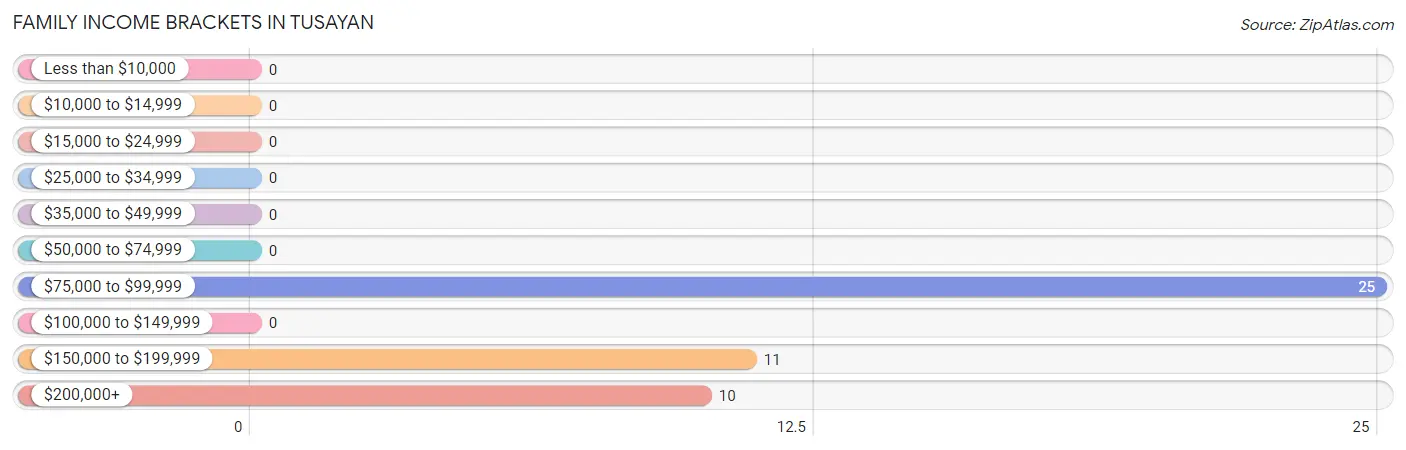
| Income Bracket | # Families | % Families |
| Less than $10,000 | 0 | 0.0% |
| $10,000 to $14,999 | 0 | 0.0% |
| $15,000 to $24,999 | 0 | 0.0% |
| $25,000 to $34,999 | 0 | 0.0% |
| $35,000 to $49,999 | 0 | 0.0% |
| $50,000 to $74,999 | 0 | 0.0% |
| $75,000 to $99,999 | 25 | 54.3% |
| $100,000 to $149,999 | 0 | 0.0% |
| $150,000 to $199,999 | 11 | 23.9% |
| $200,000+ | 10 | 21.7% |
Family Income by Famaliy Size in Tusayan
| Income Bracket | # Families | Median Income |
| 2-Person Families | 21 (45.7%) | $0 |
| 3-Person Families | 0 (0.0%) | $0 |
| 4-Person Families | 25 (54.3%) | $0 |
| 5-Person Families | 0 (0.0%) | $0 |
| 6-Person Families | 0 (0.0%) | $0 |
| 7+ Person Families | 0 (0.0%) | $0 |
| Total | 46 (100.0%) | $0 |
Family Income by Number of Earners in Tusayan
| Number of Earners | # Families | Median Income |
| No Earners | 0 (0.0%) | $0 |
| 1 Earner | 46 (100.0%) | $0 |
| 2 Earners | 0 (0.0%) | $0 |
| 3+ Earners | 0 (0.0%) | $0 |
| Total | 46 (100.0%) | $0 |
Household Income in Tusayan
Household Income Brackets in Tusayan
With 29 households falling in the category, the $25,000 to $34,999 income range is the most frequent in Tusayan, accounting for 23.6% of all households.
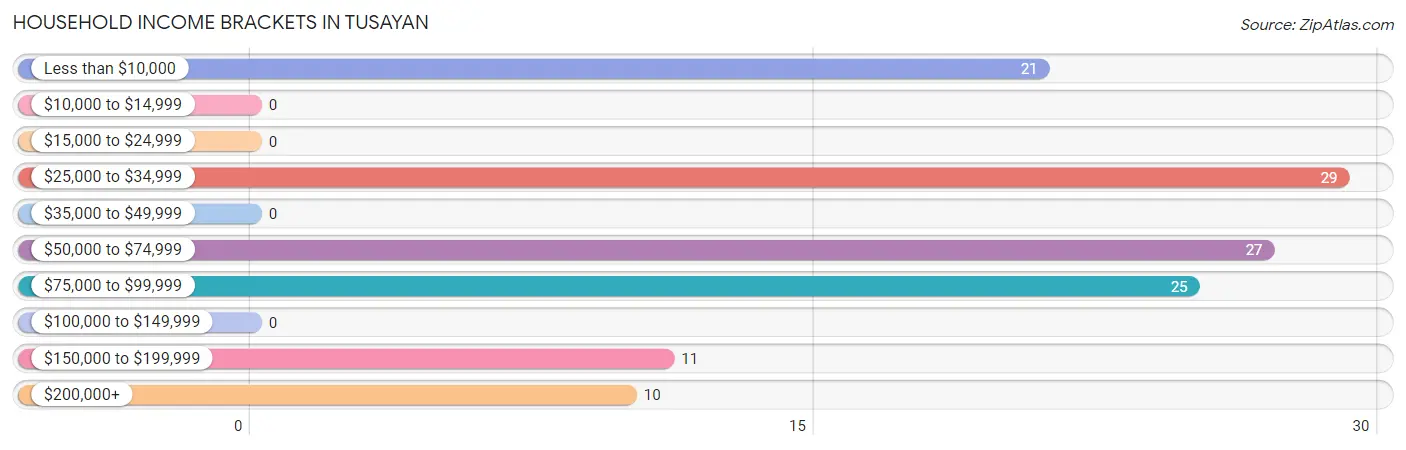
| Income Bracket | # Households | % Households |
| Less than $10,000 | 21 | 17.1% |
| $10,000 to $14,999 | 0 | 0.0% |
| $15,000 to $24,999 | 0 | 0.0% |
| $25,000 to $34,999 | 29 | 23.6% |
| $35,000 to $49,999 | 0 | 0.0% |
| $50,000 to $74,999 | 27 | 22.0% |
| $75,000 to $99,999 | 25 | 20.3% |
| $100,000 to $149,999 | 0 | 0.0% |
| $150,000 to $199,999 | 11 | 8.9% |
| $200,000+ | 10 | 8.1% |
Household Income by Householder Age in Tusayan
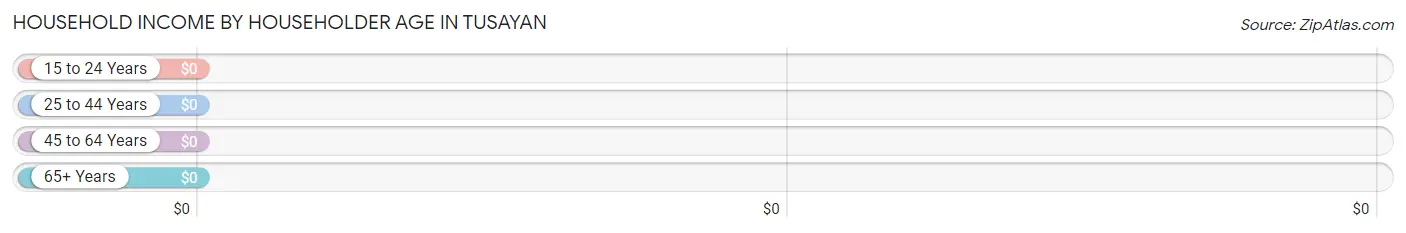
| Income Bracket | # Households | Median Income |
| 15 to 24 Years | 21 (17.1%) | $0 |
| 25 to 44 Years | 54 (43.9%) | $0 |
| 45 to 64 Years | 21 (17.1%) | $0 |
| 65+ Years | 27 (22.0%) | $0 |
| Total | 123 (100.0%) | $0 |
Poverty in Tusayan
Income Below Poverty by Sex and Age in Tusayan
With 50.6% poverty level for males and 1.4% for females among the residents of Tusayan, 16 and 17 year old males and 25 to 34 year old females are the most vulnerable to poverty, with 21 males (100.0%) and 3 females (8.6%) in their respective age groups living below the poverty level.
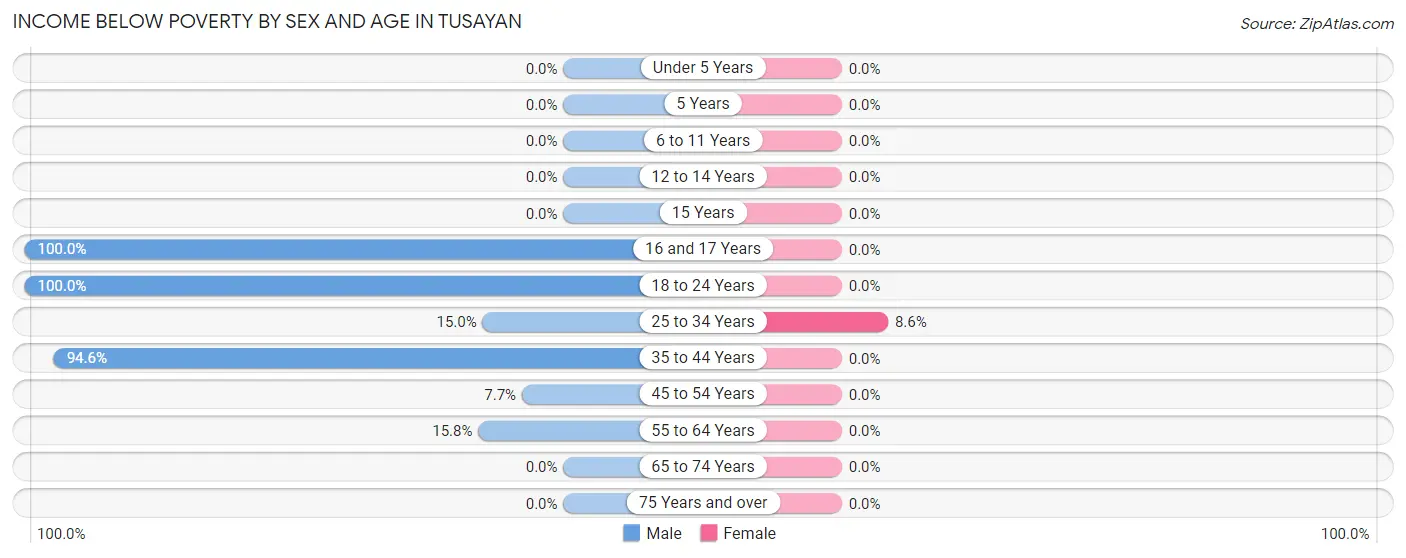
| Age Bracket | Male | Female |
| Under 5 Years | 0 (0.0%) | 0 (0.0%) |
| 5 Years | 0 (0.0%) | 0 (0.0%) |
| 6 to 11 Years | 0 (0.0%) | 0 (0.0%) |
| 12 to 14 Years | 0 (0.0%) | 0 (0.0%) |
| 15 Years | 0 (0.0%) | 0 (0.0%) |
| 16 and 17 Years | 21 (100.0%) | 0 (0.0%) |
| 18 to 24 Years | 24 (100.0%) | 0 (0.0%) |
| 25 to 34 Years | 3 (15.0%) | 3 (8.6%) |
| 35 to 44 Years | 35 (94.6%) | 0 (0.0%) |
| 45 to 54 Years | 2 (7.7%) | 0 (0.0%) |
| 55 to 64 Years | 3 (15.8%) | 0 (0.0%) |
| 65 to 74 Years | 0 (0.0%) | 0 (0.0%) |
| 75 Years and over | 0 (0.0%) | 0 (0.0%) |
| Total | 88 (50.6%) | 3 (1.4%) |
Income Above Poverty by Sex and Age in Tusayan
According to the poverty statistics in Tusayan, males aged 65 to 74 years and females aged 5 years are the age groups that are most secure financially, with 100.0% of males and 100.0% of females in these age groups living above the poverty line.
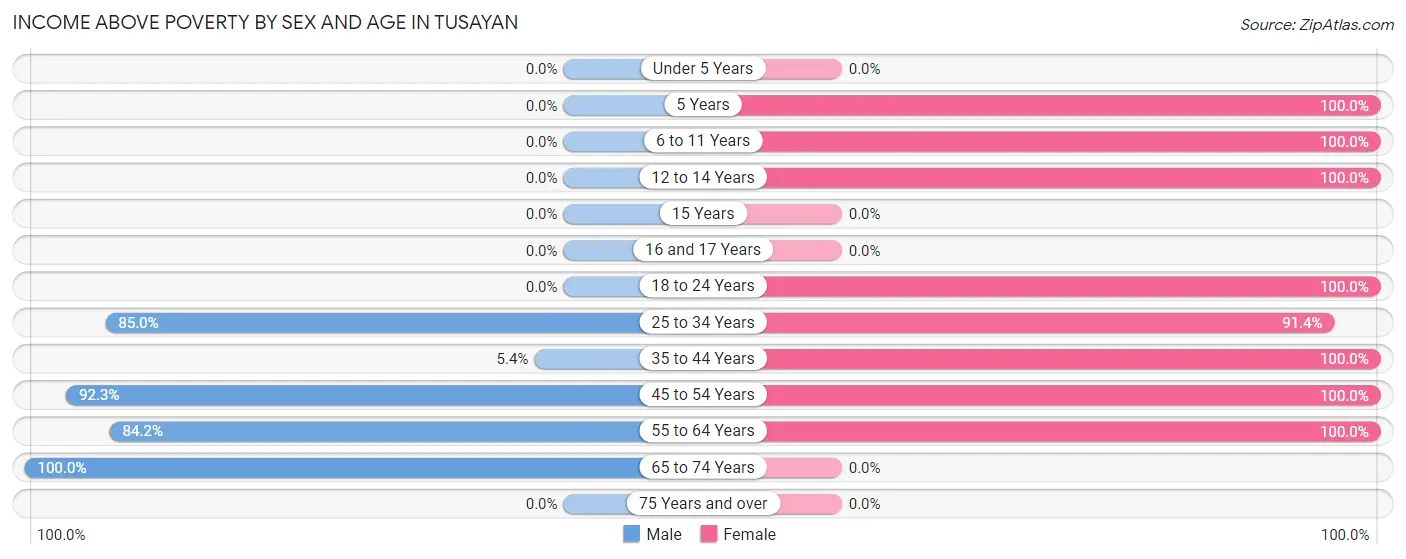
| Age Bracket | Male | Female |
| Under 5 Years | 0 (0.0%) | 0 (0.0%) |
| 5 Years | 0 (0.0%) | 18 (100.0%) |
| 6 to 11 Years | 0 (0.0%) | 18 (100.0%) |
| 12 to 14 Years | 0 (0.0%) | 25 (100.0%) |
| 15 Years | 0 (0.0%) | 0 (0.0%) |
| 16 and 17 Years | 0 (0.0%) | 0 (0.0%) |
| 18 to 24 Years | 0 (0.0%) | 57 (100.0%) |
| 25 to 34 Years | 17 (85.0%) | 32 (91.4%) |
| 35 to 44 Years | 2 (5.4%) | 25 (100.0%) |
| 45 to 54 Years | 24 (92.3%) | 36 (100.0%) |
| 55 to 64 Years | 16 (84.2%) | 6 (100.0%) |
| 65 to 74 Years | 27 (100.0%) | 0 (0.0%) |
| 75 Years and over | 0 (0.0%) | 0 (0.0%) |
| Total | 86 (49.4%) | 217 (98.6%) |
Income Below Poverty Among Married-Couple Families in Tusayan
| Children | Above Poverty | Below Poverty |
| No Children | 21 (100.0%) | 0 (0.0%) |
| 1 or 2 Children | 0 (0.0%) | 0 (0.0%) |
| 3 or 4 Children | 0 (0.0%) | 0 (0.0%) |
| 5 or more Children | 0 (0.0%) | 0 (0.0%) |
| Total | 21 (100.0%) | 0 (0.0%) |
Income Below Poverty Among Single-Parent Households in Tusayan
| Children | Single Father | Single Mother |
| No Children | 0 (0.0%) | 0 (0.0%) |
| 1 or 2 Children | 0 (0.0%) | 0 (0.0%) |
| 3 or 4 Children | 0 (0.0%) | 0 (0.0%) |
| 5 or more Children | 0 (0.0%) | 0 (0.0%) |
| Total | 0 (0.0%) | 0 (0.0%) |
Income Below Poverty Among Married-Couple vs Single-Parent Households in Tusayan
| Children | Married-Couple Families | Single-Parent Households |
| No Children | 0 (0.0%) | 0 (0.0%) |
| 1 or 2 Children | 0 (0.0%) | 0 (0.0%) |
| 3 or 4 Children | 0 (0.0%) | 0 (0.0%) |
| 5 or more Children | 0 (0.0%) | 0 (0.0%) |
| Total | 0 (0.0%) | 0 (0.0%) |
Race in Tusayan
The most populous races in Tusayan are Native / Alaskan (200 | 50.8%), White / Caucasian (143 | 36.3%), and Hispanic or Latino (132 | 33.5%).
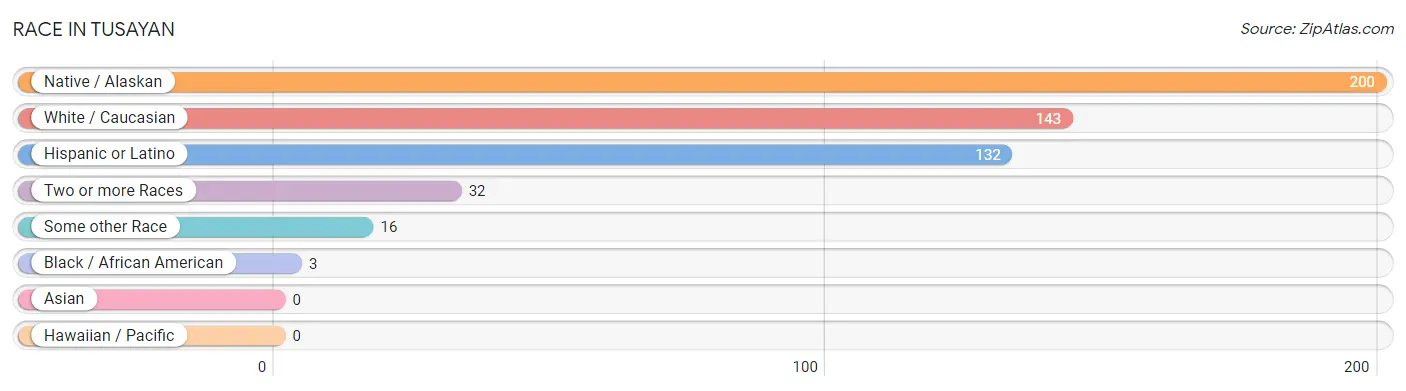
| Race | # Population | % Population |
| Asian | 0 | 0.0% |
| Black / African American | 3 | 0.8% |
| Hawaiian / Pacific | 0 | 0.0% |
| Hispanic or Latino | 132 | 33.5% |
| Native / Alaskan | 200 | 50.8% |
| White / Caucasian | 143 | 36.3% |
| Two or more Races | 32 | 8.1% |
| Some other Race | 16 | 4.1% |
| Total | 394 | 100.0% |
Ancestry in Tusayan
The most populous ancestries reported in Tusayan are Navajo (116 | 29.4%), Tohono O'Odham (71 | 18.0%), Mexican (47 | 11.9%), American (42 | 10.7%), and Hopi (30 | 7.6%), together accounting for 77.7% of all Tusayan residents.
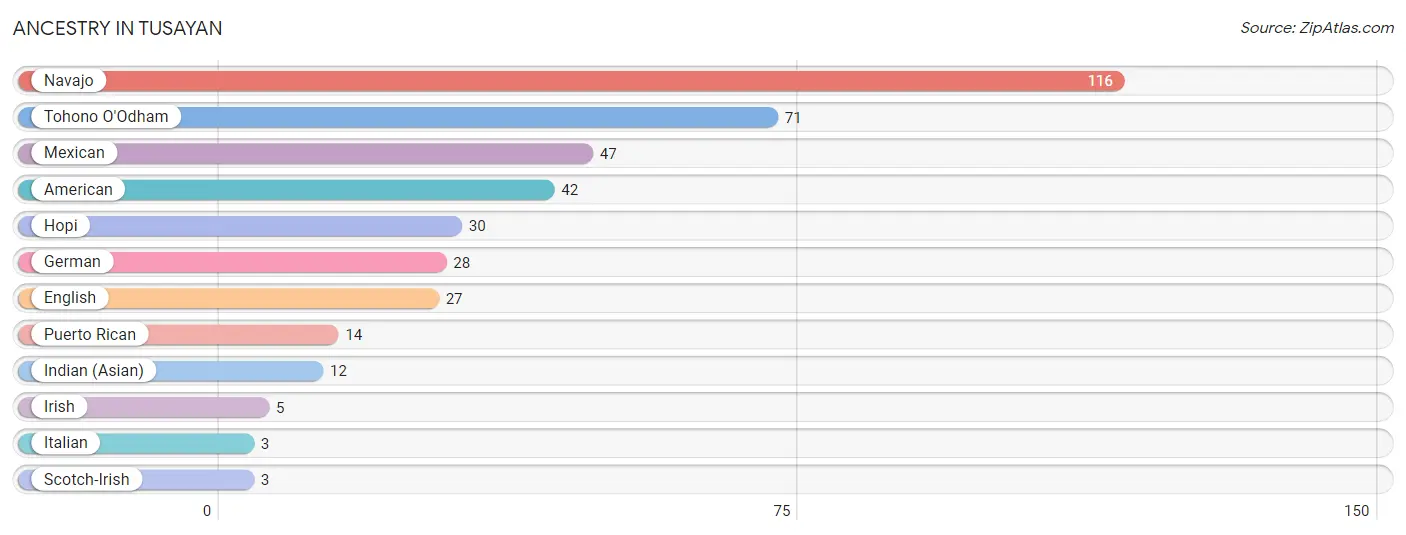
| Ancestry | # Population | % Population |
| American | 42 | 10.7% |
| English | 27 | 6.9% |
| German | 28 | 7.1% |
| Hopi | 30 | 7.6% |
| Indian (Asian) | 12 | 3.0% |
| Irish | 5 | 1.3% |
| Italian | 3 | 0.8% |
| Mexican | 47 | 11.9% |
| Navajo | 116 | 29.4% |
| Puerto Rican | 14 | 3.5% |
| Scotch-Irish | 3 | 0.8% |
| Tohono O'Odham | 71 | 18.0% | View All 12 Rows |
Immigrants in Tusayan
The most numerous immigrant groups reported in Tusayan came from Central America (15 | 3.8%), Latin America (15 | 3.8%), and Mexico (15 | 3.8%), together accounting for 11.4% of all Tusayan residents.
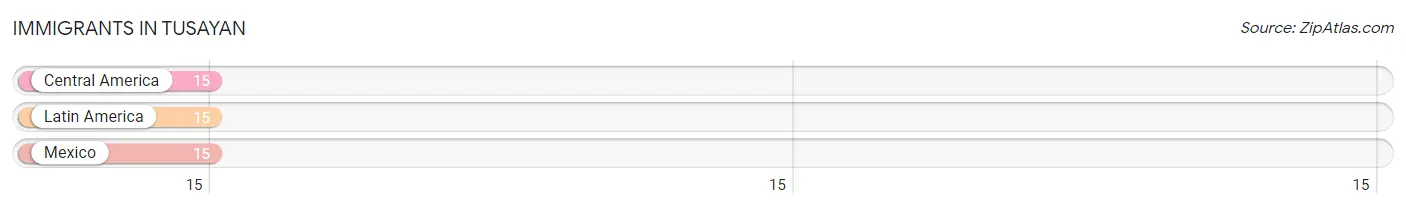
| Immigration Origin | # Population | % Population |
| Central America | 15 | 3.8% |
| Latin America | 15 | 3.8% |
| Mexico | 15 | 3.8% | View All 3 Rows |
Sex and Age in Tusayan
Sex and Age in Tusayan
The most populous age groups in Tusayan are 15 to 19 Years (42 | 24.1%) for men and 20 to 24 Years (57 | 25.9%) for women.
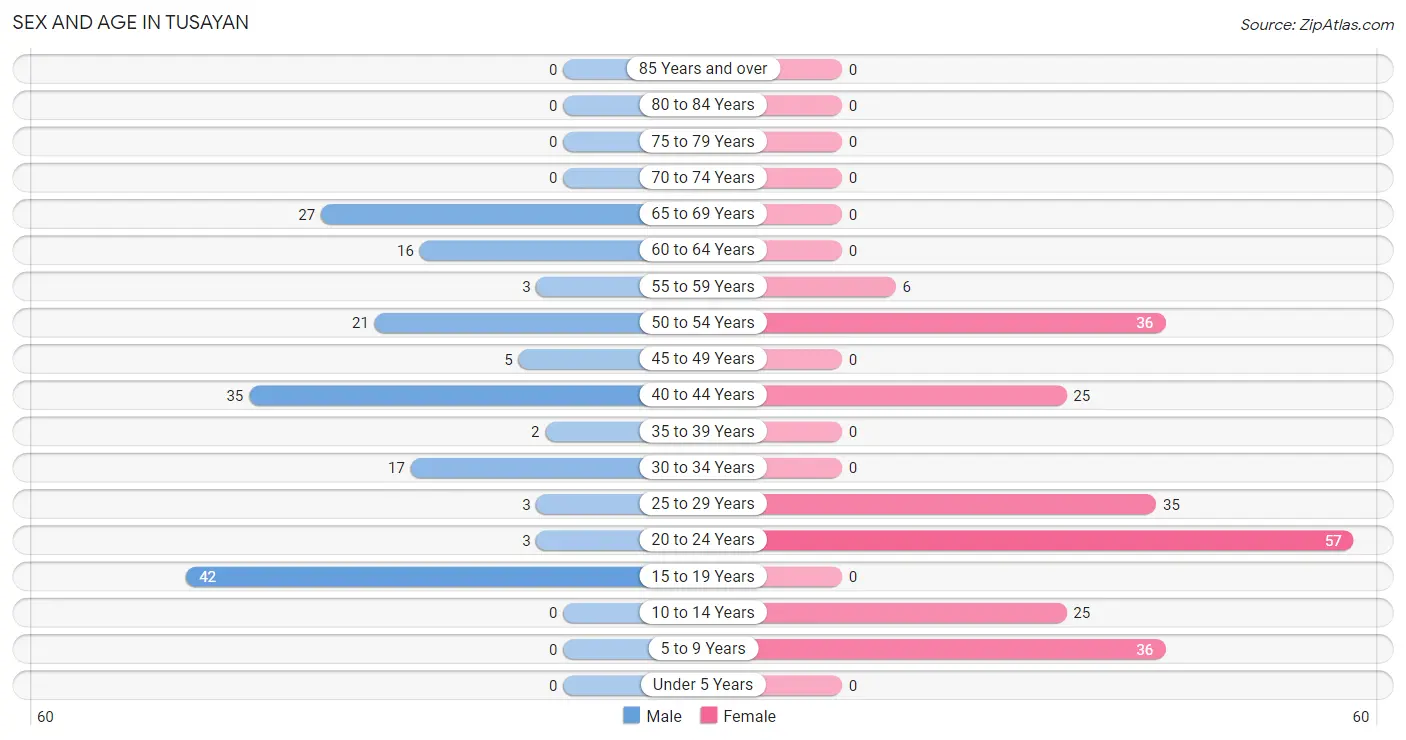
| Age Bracket | Male | Female |
| Under 5 Years | 0 (0.0%) | 0 (0.0%) |
| 5 to 9 Years | 0 (0.0%) | 36 (16.4%) |
| 10 to 14 Years | 0 (0.0%) | 25 (11.4%) |
| 15 to 19 Years | 42 (24.1%) | 0 (0.0%) |
| 20 to 24 Years | 3 (1.7%) | 57 (25.9%) |
| 25 to 29 Years | 3 (1.7%) | 35 (15.9%) |
| 30 to 34 Years | 17 (9.8%) | 0 (0.0%) |
| 35 to 39 Years | 2 (1.1%) | 0 (0.0%) |
| 40 to 44 Years | 35 (20.1%) | 25 (11.4%) |
| 45 to 49 Years | 5 (2.9%) | 0 (0.0%) |
| 50 to 54 Years | 21 (12.1%) | 36 (16.4%) |
| 55 to 59 Years | 3 (1.7%) | 6 (2.7%) |
| 60 to 64 Years | 16 (9.2%) | 0 (0.0%) |
| 65 to 69 Years | 27 (15.5%) | 0 (0.0%) |
| 70 to 74 Years | 0 (0.0%) | 0 (0.0%) |
| 75 to 79 Years | 0 (0.0%) | 0 (0.0%) |
| 80 to 84 Years | 0 (0.0%) | 0 (0.0%) |
| 85 Years and over | 0 (0.0%) | 0 (0.0%) |
| Total | 174 (100.0%) | 220 (100.0%) |
Families and Households in Tusayan
Median Family Size in Tusayan
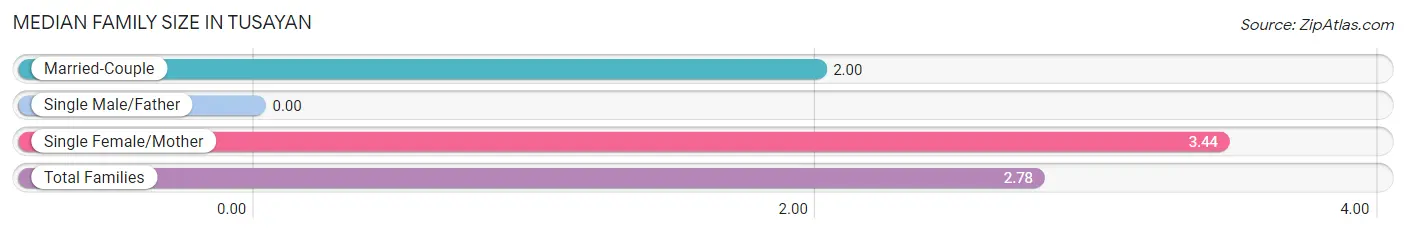
| Family Type | # Families | Family Size |
| Married-Couple | 21 (45.7%) | 2.00 |
| Single Male/Father | 0 (0.0%) | - |
| Single Female/Mother | 25 (54.3%) | 3.44 |
| Total Families | 46 (100.0%) | 2.78 |
Median Household Size in Tusayan
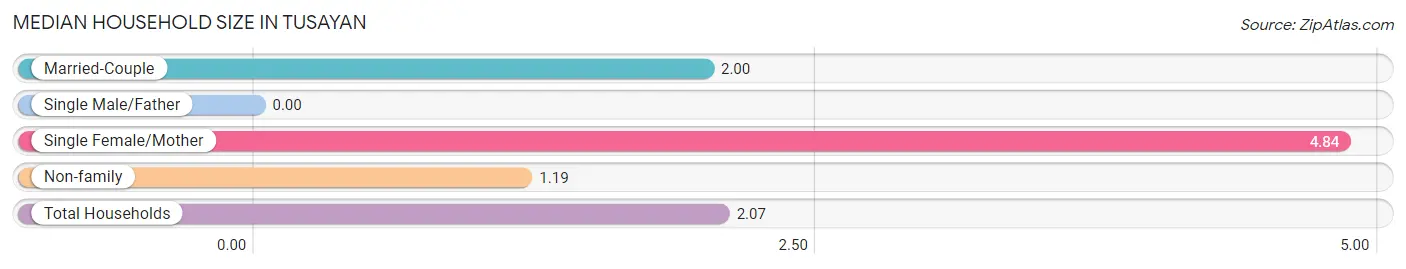
| Household Type | # Households | Household Size |
| Married-Couple | 21 (17.1%) | 2.00 |
| Single Male/Father | 0 (0.0%) | - |
| Single Female/Mother | 25 (20.3%) | 4.84 |
| Non-family | 77 (62.6%) | 1.19 |
| Total Households | 123 (100.0%) | 2.07 |
Household Size by Marriage Status in Tusayan
Out of a total of 123 households in Tusayan, 46 (37.4%) are family households, while 77 (62.6%) are nonfamily households. The most numerous type of family households are 5-person households, comprising 25, and the most common type of nonfamily households are 1-person households, comprising 50.
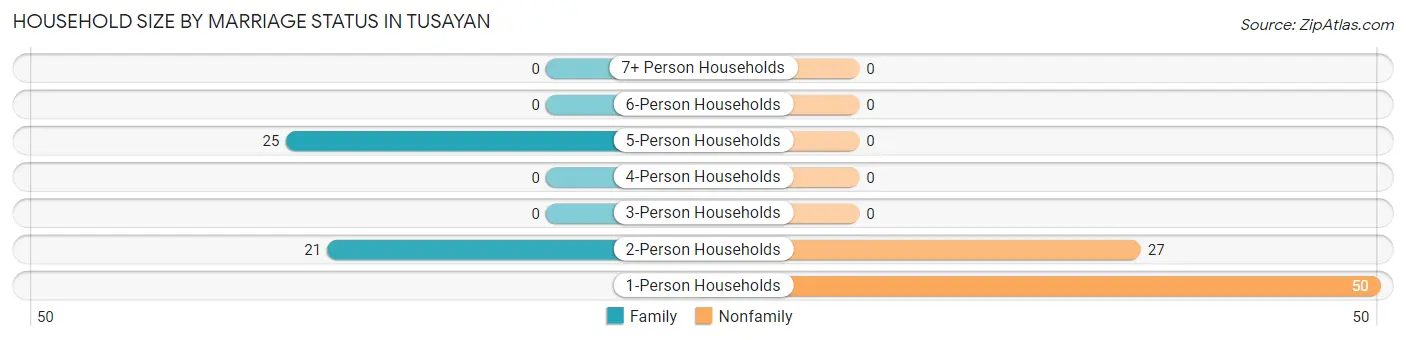
| Household Size | Family Households | Nonfamily Households |
| 1-Person Households | - | 50 (40.6%) |
| 2-Person Households | 21 (17.1%) | 27 (22.0%) |
| 3-Person Households | 0 (0.0%) | 0 (0.0%) |
| 4-Person Households | 0 (0.0%) | 0 (0.0%) |
| 5-Person Households | 25 (20.3%) | 0 (0.0%) |
| 6-Person Households | 0 (0.0%) | 0 (0.0%) |
| 7+ Person Households | 0 (0.0%) | 0 (0.0%) |
| Total | 46 (37.4%) | 77 (62.6%) |
Female Fertility in Tusayan
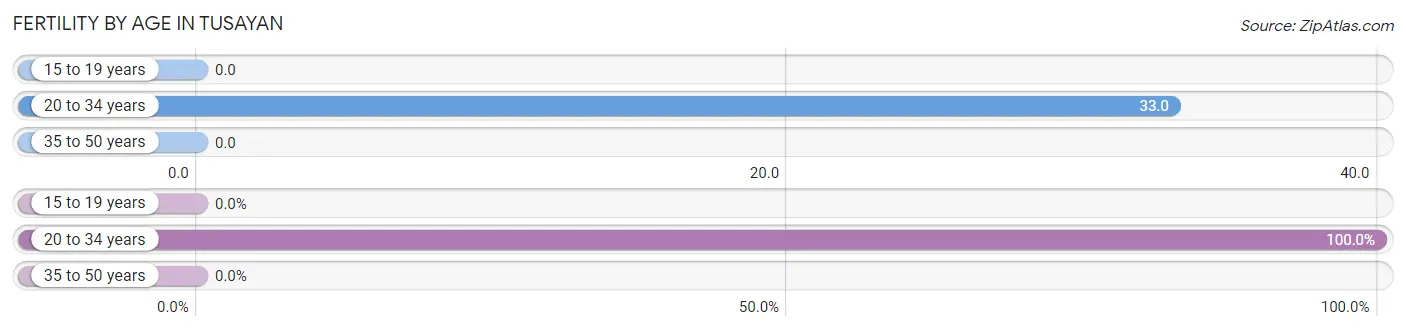
Fertility by Age in Tusayan
Average fertility rate in Tusayan is 26.0 births per 1,000 women. Women in the age bracket of 20 to 34 years have the highest fertility rate with 33.0 births per 1,000 women. Women in the age bracket of 20 to 34 years acount for 100.0% of all women with births.
| Age Bracket | Women with Births | Births / 1,000 Women |
| 15 to 19 years | 0 (0.0%) | 0.0 |
| 20 to 34 years | 3 (100.0%) | 33.0 |
| 35 to 50 years | 0 (0.0%) | 0.0 |
| Total | 3 (100.0%) | 26.0 |
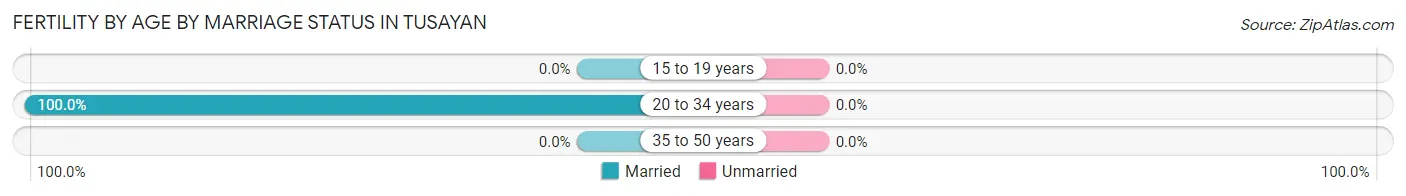
Fertility by Age by Marriage Status in Tusayan
| Age Bracket | Married | Unmarried |
| 15 to 19 years | 0 (0.0%) | 0 (0.0%) |
| 20 to 34 years | 3 (100.0%) | 0 (0.0%) |
| 35 to 50 years | 0 (0.0%) | 0 (0.0%) |
| Total | 3 (100.0%) | 0 (0.0%) |
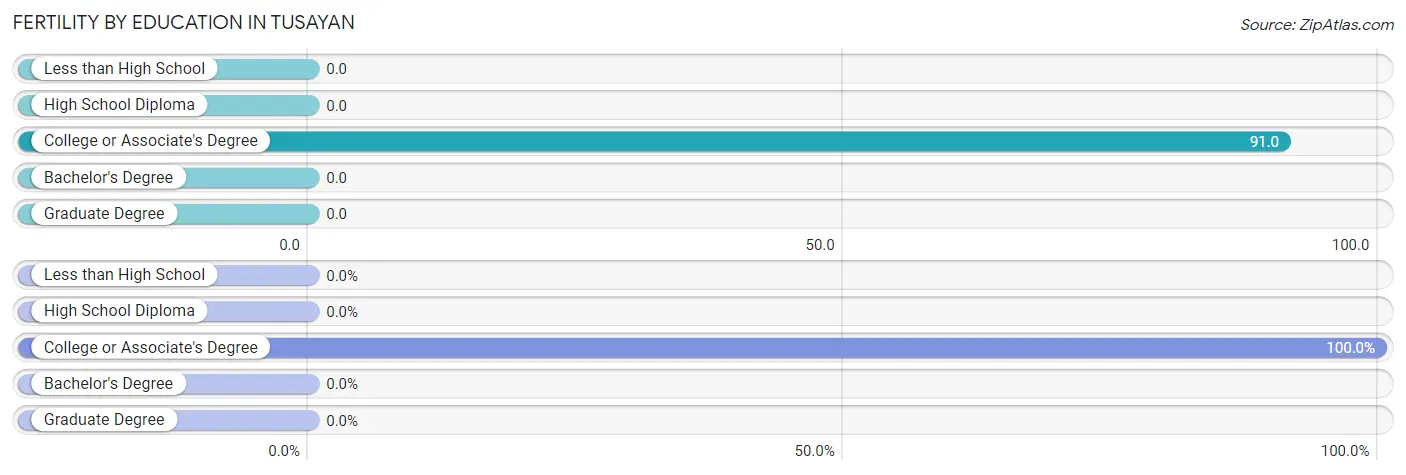
Fertility by Education in Tusayan
| Educational Attainment | Women with Births | Births / 1,000 Women |
| Less than High School | 0 (0.0%) | 0.0 |
| High School Diploma | 0 (0.0%) | 0.0 |
| College or Associate's Degree | 3 (100.0%) | 91.0 |
| Bachelor's Degree | 0 (0.0%) | 0.0 |
| Graduate Degree | 0 (0.0%) | 0.0 |
| Total | 3 (100.0%) | 26.0 |
Fertility by Education by Marriage Status in Tusayan
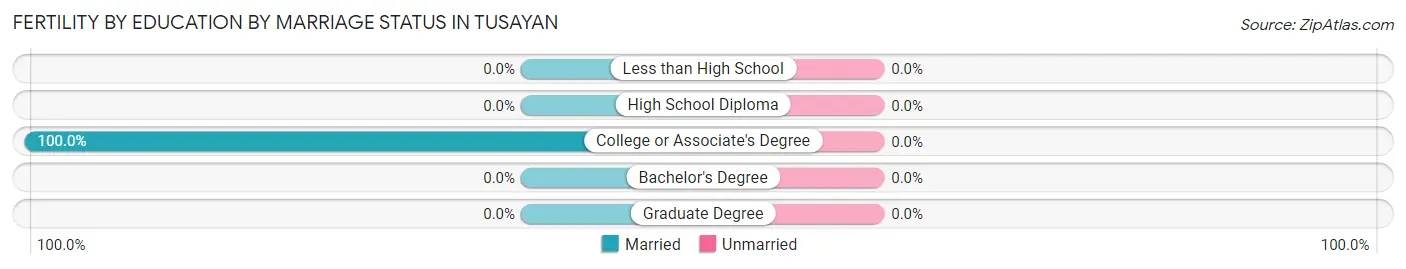
| Educational Attainment | Married | Unmarried |
| Less than High School | 0 (0.0%) | 0 (0.0%) |
| High School Diploma | 0 (0.0%) | 0 (0.0%) |
| College or Associate's Degree | 3 (100.0%) | 0 (0.0%) |
| Bachelor's Degree | 0 (0.0%) | 0 (0.0%) |
| Graduate Degree | 0 (0.0%) | 0 (0.0%) |
| Total | 3 (100.0%) | 0 (0.0%) |
Employment Characteristics in Tusayan
Employment by Class of Employer in Tusayan
Among the 274 employed individuals in Tusayan, private company employees (202 | 73.7%), federal government employees (25 | 9.1%), and state government employees (20 | 7.3%) make up the most common classes of employment.
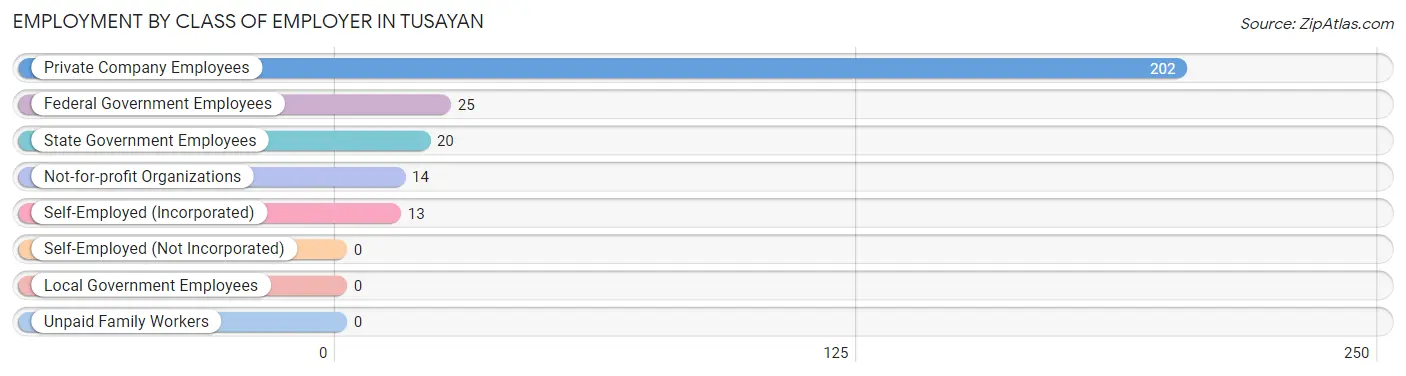
| Employer Class | # Employees | % Employees |
| Private Company Employees | 202 | 73.7% |
| Self-Employed (Incorporated) | 13 | 4.7% |
| Self-Employed (Not Incorporated) | 0 | 0.0% |
| Not-for-profit Organizations | 14 | 5.1% |
| Local Government Employees | 0 | 0.0% |
| State Government Employees | 20 | 7.3% |
| Federal Government Employees | 25 | 9.1% |
| Unpaid Family Workers | 0 | 0.0% |
| Total | 274 | 100.0% |
Employment Status by Age in Tusayan
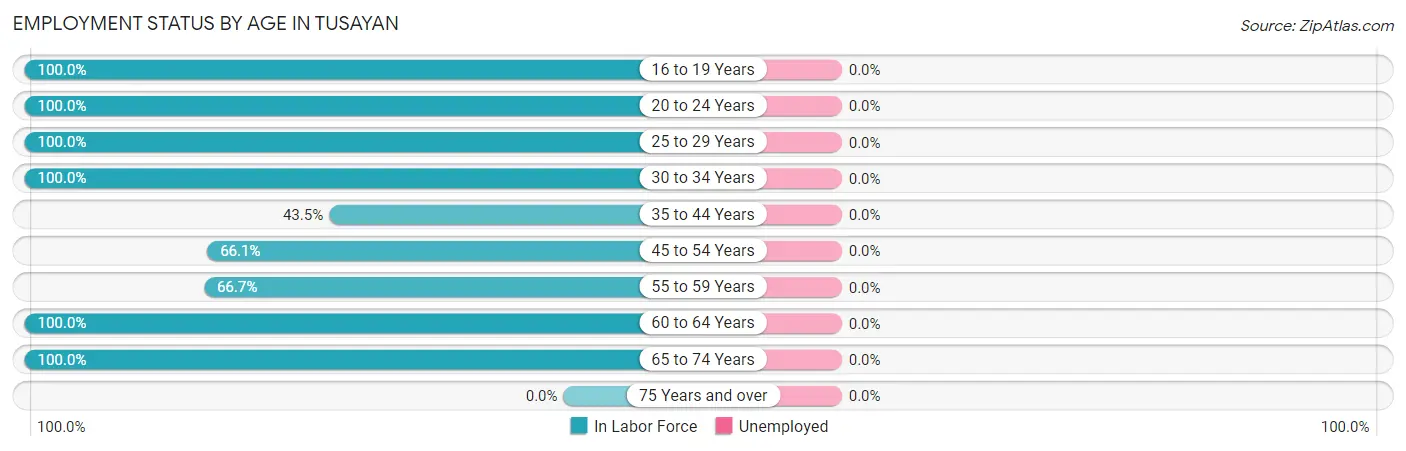
| Age Bracket | In Labor Force | Unemployed |
| 16 to 19 Years | 42 (100.0%) | 0 (0.0%) |
| 20 to 24 Years | 60 (100.0%) | 0 (0.0%) |
| 25 to 29 Years | 38 (100.0%) | 0 (0.0%) |
| 30 to 34 Years | 17 (100.0%) | 0 (0.0%) |
| 35 to 44 Years | 27 (43.5%) | 0 (0.0%) |
| 45 to 54 Years | 41 (66.1%) | 0 (0.0%) |
| 55 to 59 Years | 6 (66.7%) | 0 (0.0%) |
| 60 to 64 Years | 16 (100.0%) | 0 (0.0%) |
| 65 to 74 Years | 27 (100.0%) | 0 (0.0%) |
| 75 Years and over | 0 (0.0%) | 0 (0.0%) |
| Total | 274 (82.3%) | 0 (0.0%) |
Employment Status by Educational Attainment in Tusayan
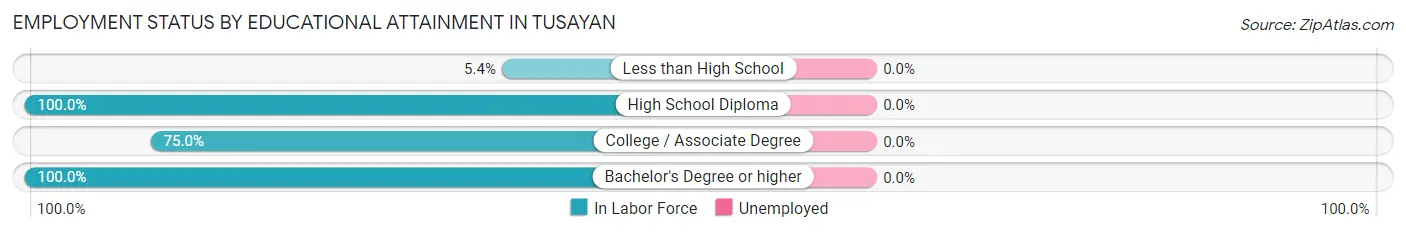
| Educational Attainment | In Labor Force | Unemployed |
| Less than High School | 2 (5.4%) | 0 (0.0%) |
| High School Diploma | 68 (100.0%) | 0 (0.0%) |
| College / Associate Degree | 72 (75.0%) | 0 (0.0%) |
| Bachelor's Degree or higher | 3 (100.0%) | 0 (0.0%) |
| Total | 145 (71.1%) | 0 (0.0%) |
Employment Occupations by Sex in Tusayan
Management, Business, Science and Arts Occupations
The most common Management, Business, Science and Arts occupations in Tusayan are Management (13 | 4.7%), and Business & Financial (3 | 1.1%).
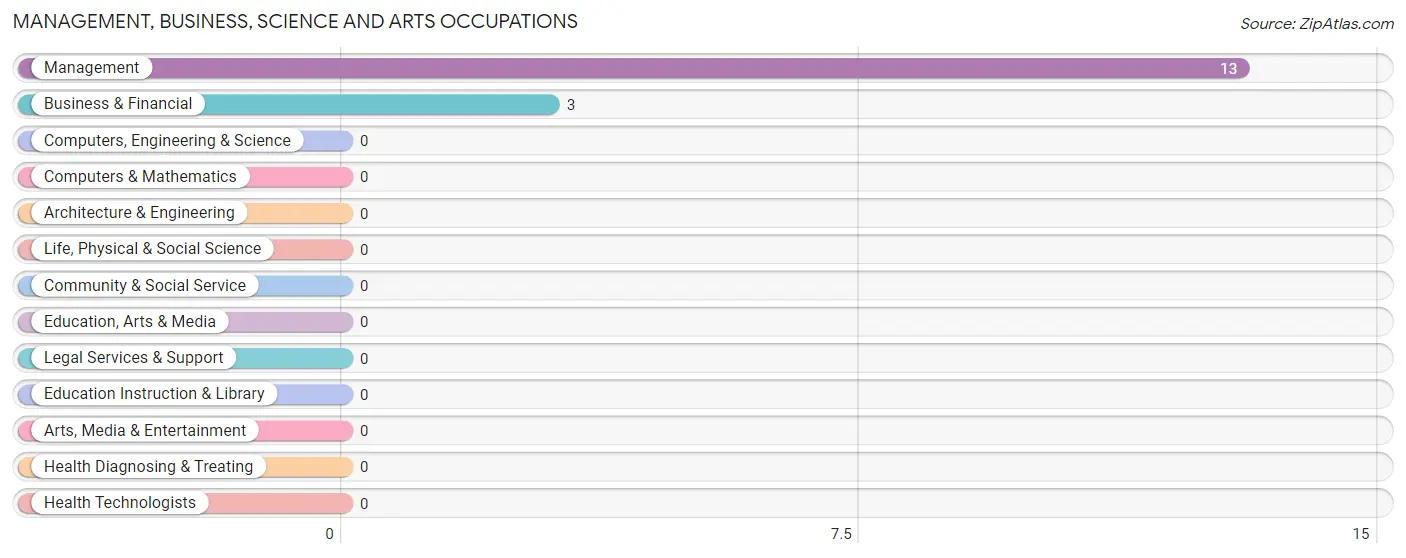
Management, Business, Science and Arts Occupations by Sex
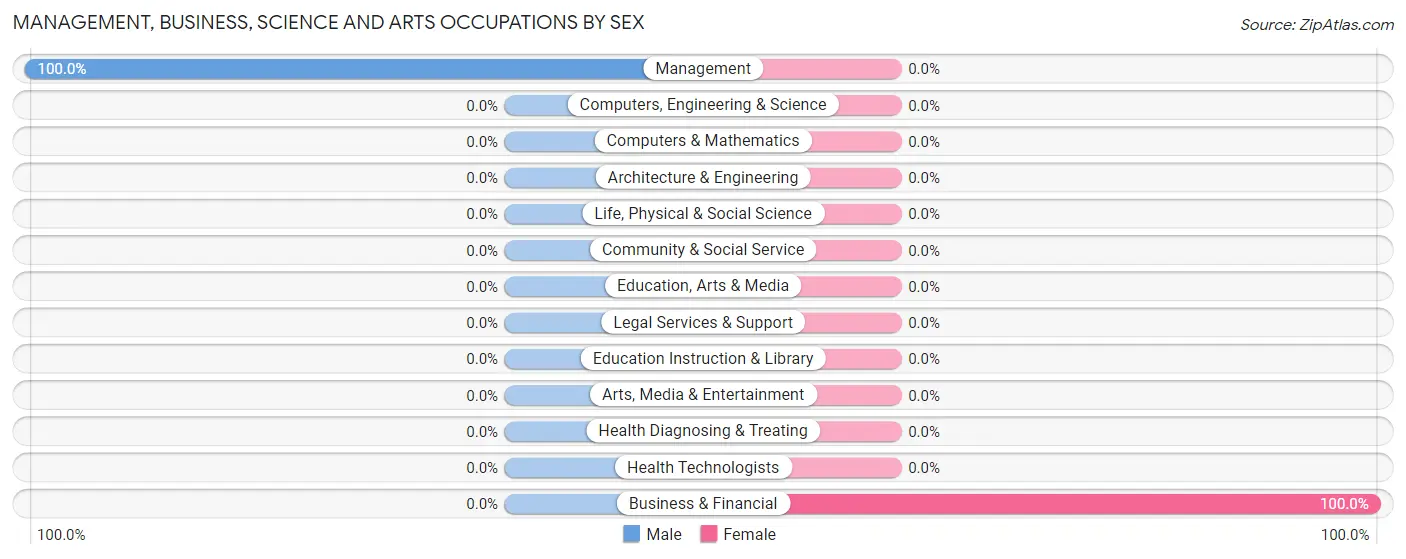
| Occupation | Male | Female |
| Management | 13 (100.0%) | 0 (0.0%) |
| Business & Financial | 0 (0.0%) | 3 (100.0%) |
| Computers, Engineering & Science | 0 (0.0%) | 0 (0.0%) |
| Computers & Mathematics | 0 (0.0%) | 0 (0.0%) |
| Architecture & Engineering | 0 (0.0%) | 0 (0.0%) |
| Life, Physical & Social Science | 0 (0.0%) | 0 (0.0%) |
| Community & Social Service | 0 (0.0%) | 0 (0.0%) |
| Education, Arts & Media | 0 (0.0%) | 0 (0.0%) |
| Legal Services & Support | 0 (0.0%) | 0 (0.0%) |
| Education Instruction & Library | 0 (0.0%) | 0 (0.0%) |
| Arts, Media & Entertainment | 0 (0.0%) | 0 (0.0%) |
| Health Diagnosing & Treating | 0 (0.0%) | 0 (0.0%) |
| Health Technologists | 0 (0.0%) | 0 (0.0%) |
| Total (Category) | 13 (81.2%) | 3 (18.8%) |
| Total (Overall) | 136 (49.6%) | 138 (50.4%) |
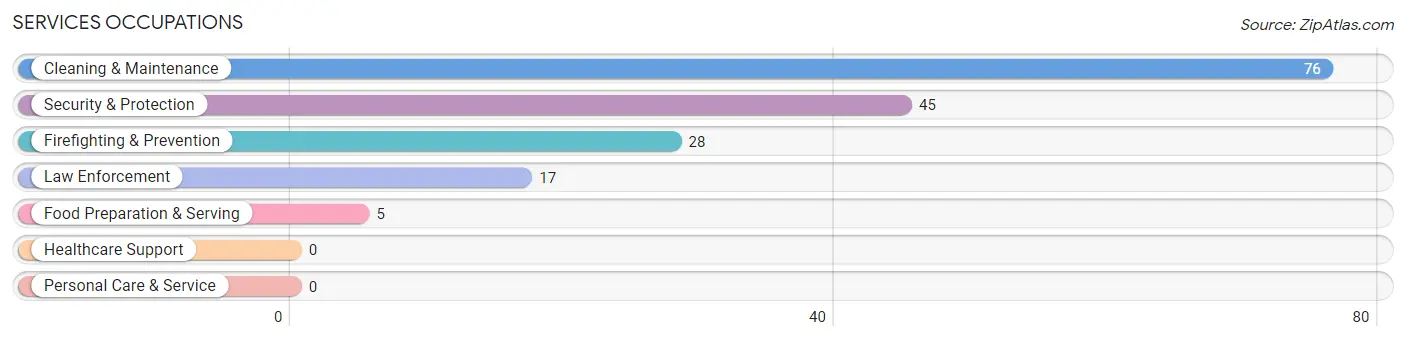
Services Occupations
The most common Services occupations in Tusayan are Cleaning & Maintenance (76 | 27.7%), Security & Protection (45 | 16.4%), Firefighting & Prevention (28 | 10.2%), Law Enforcement (17 | 6.2%), and Food Preparation & Serving (5 | 1.8%).
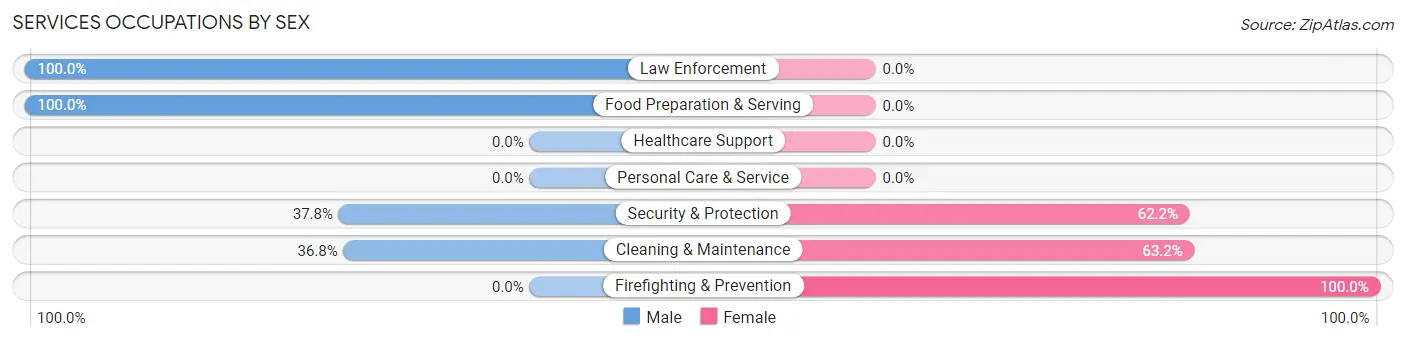
Services Occupations by Sex
Within the Services occupations in Tusayan, the most male-oriented occupations are Law Enforcement (100.0%), Food Preparation & Serving (100.0%), and Security & Protection (37.8%), while the most female-oriented occupations are Firefighting & Prevention (100.0%), Cleaning & Maintenance (63.2%), and Security & Protection (62.2%).
| Occupation | Male | Female |
| Healthcare Support | 0 (0.0%) | 0 (0.0%) |
| Security & Protection | 17 (37.8%) | 28 (62.2%) |
| Firefighting & Prevention | 0 (0.0%) | 28 (100.0%) |
| Law Enforcement | 17 (100.0%) | 0 (0.0%) |
| Food Preparation & Serving | 5 (100.0%) | 0 (0.0%) |
| Cleaning & Maintenance | 28 (36.8%) | 48 (63.2%) |
| Personal Care & Service | 0 (0.0%) | 0 (0.0%) |
| Total (Category) | 50 (39.7%) | 76 (60.3%) |
| Total (Overall) | 136 (49.6%) | 138 (50.4%) |
Sales and Office Occupations
The most common Sales and Office occupations in Tusayan are , and Office & Administration (84 | 30.7%).
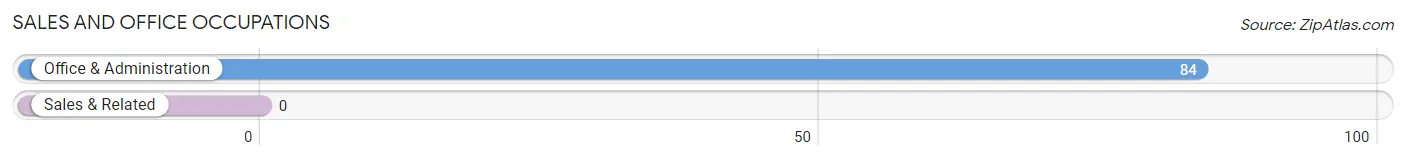
Sales and Office Occupations by Sex
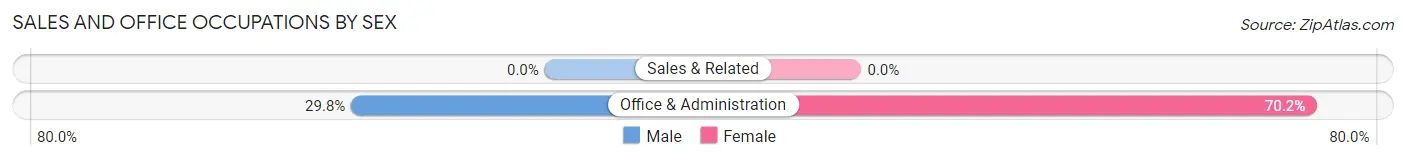
| Occupation | Male | Female |
| Sales & Related | 0 (0.0%) | 0 (0.0%) |
| Office & Administration | 25 (29.8%) | 59 (70.2%) |
| Total (Category) | 25 (29.8%) | 59 (70.2%) |
| Total (Overall) | 136 (49.6%) | 138 (50.4%) |
Natural Resources, Construction and Maintenance Occupations
The most common Natural Resources, Construction and Maintenance occupations in Tusayan are , and Installation, Maintenance & Repair (27 | 9.9%).
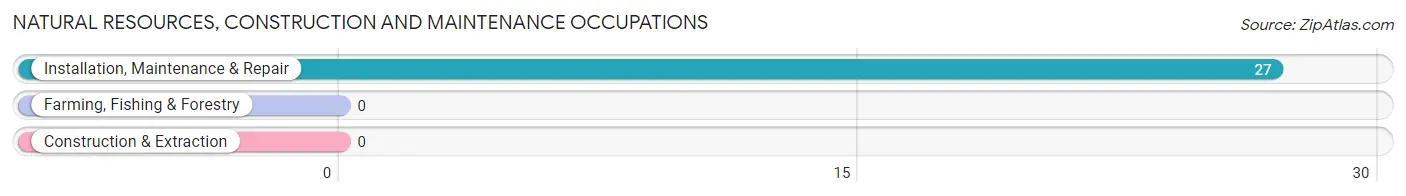
Natural Resources, Construction and Maintenance Occupations by Sex
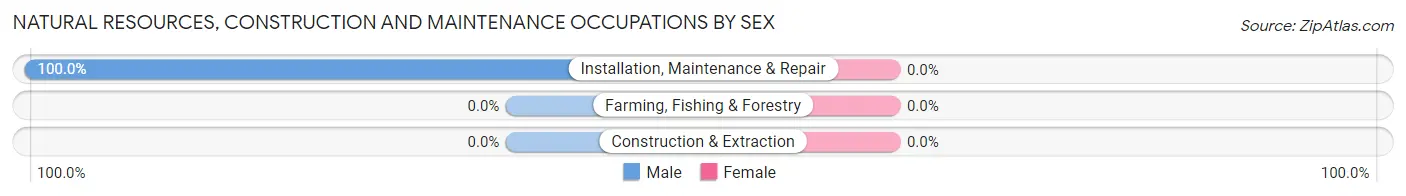
| Occupation | Male | Female |
| Farming, Fishing & Forestry | 0 (0.0%) | 0 (0.0%) |
| Construction & Extraction | 0 (0.0%) | 0 (0.0%) |
| Installation, Maintenance & Repair | 27 (100.0%) | 0 (0.0%) |
| Total (Category) | 27 (100.0%) | 0 (0.0%) |
| Total (Overall) | 136 (49.6%) | 138 (50.4%) |
Production, Transportation and Moving Occupations
The most common Production, Transportation and Moving occupations in Tusayan are , and Material Moving (21 | 7.7%).
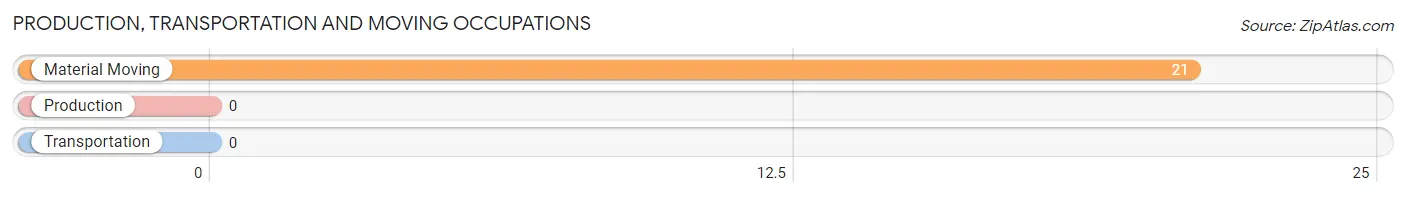
Production, Transportation and Moving Occupations by Sex
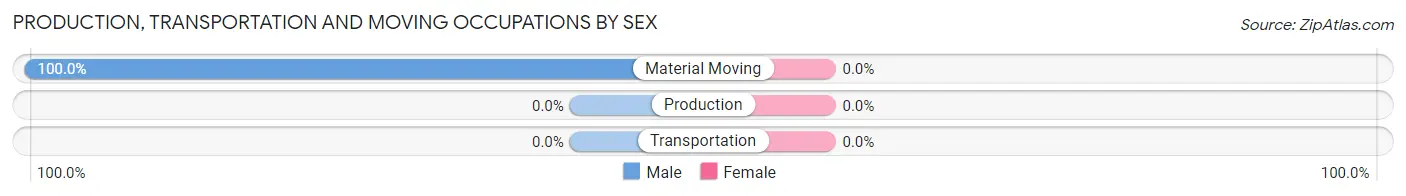
| Occupation | Male | Female |
| Production | 0 (0.0%) | 0 (0.0%) |
| Transportation | 0 (0.0%) | 0 (0.0%) |
| Material Moving | 21 (100.0%) | 0 (0.0%) |
| Total (Category) | 21 (100.0%) | 0 (0.0%) |
| Total (Overall) | 136 (49.6%) | 138 (50.4%) |
Employment Industries by Sex in Tusayan
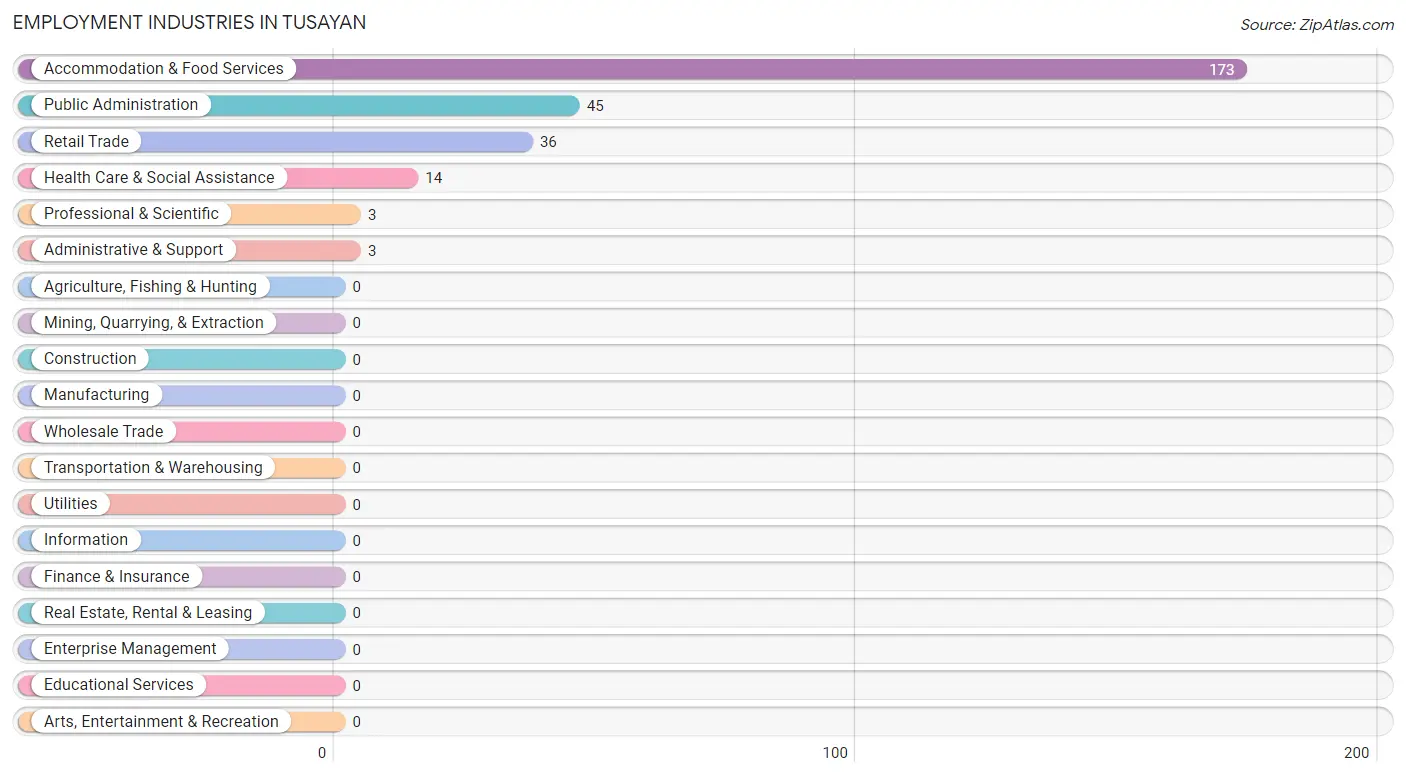
Employment Industries in Tusayan
The major employment industries in Tusayan include Accommodation & Food Services (173 | 63.1%), Public Administration (45 | 16.4%), Retail Trade (36 | 13.1%), Health Care & Social Assistance (14 | 5.1%), and Professional & Scientific (3 | 1.1%).
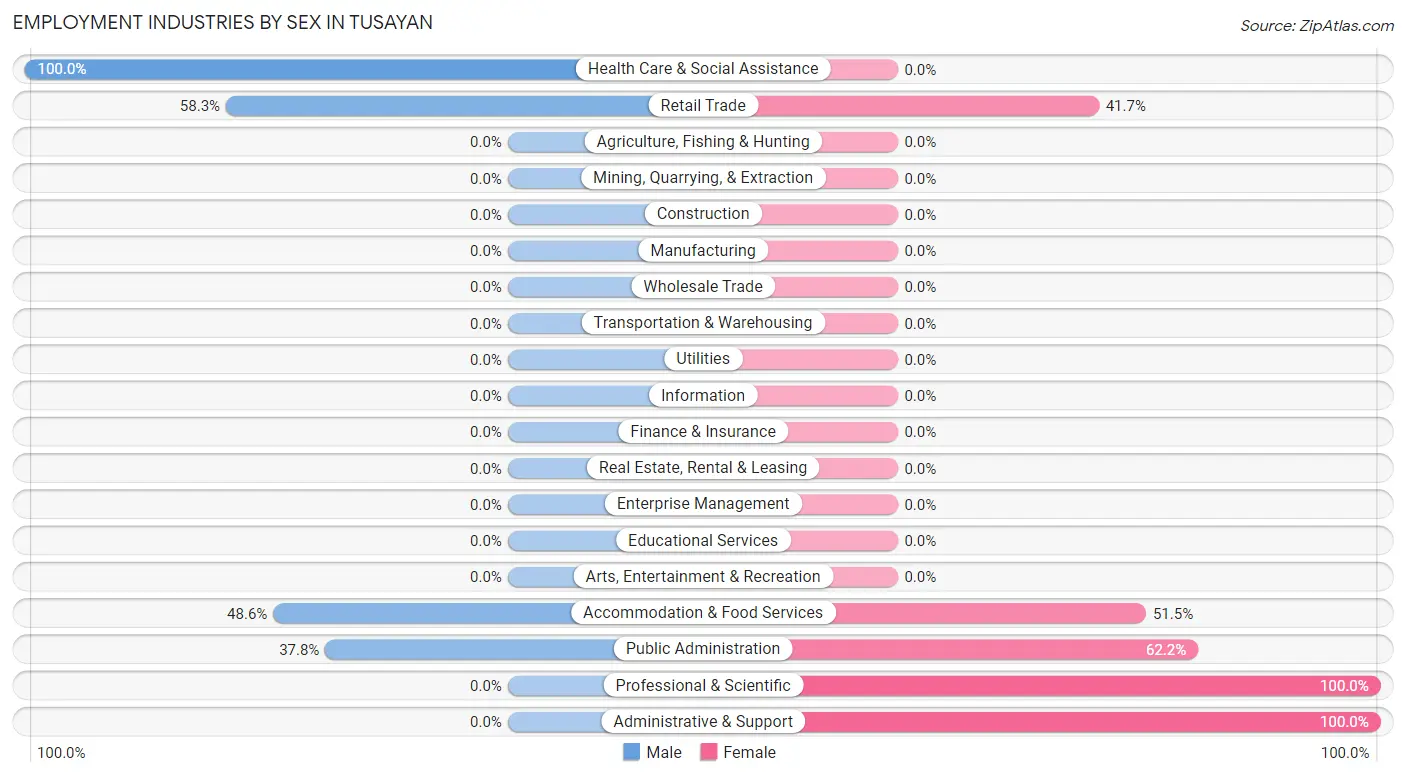
Employment Industries by Sex in Tusayan
The Tusayan industries that see more men than women are Health Care & Social Assistance (100.0%), Retail Trade (58.3%), and Accommodation & Food Services (48.5%), whereas the industries that tend to have a higher number of women are Professional & Scientific (100.0%), Administrative & Support (100.0%), and Public Administration (62.2%).
| Industry | Male | Female |
| Agriculture, Fishing & Hunting | 0 (0.0%) | 0 (0.0%) |
| Mining, Quarrying, & Extraction | 0 (0.0%) | 0 (0.0%) |
| Construction | 0 (0.0%) | 0 (0.0%) |
| Manufacturing | 0 (0.0%) | 0 (0.0%) |
| Wholesale Trade | 0 (0.0%) | 0 (0.0%) |
| Retail Trade | 21 (58.3%) | 15 (41.7%) |
| Transportation & Warehousing | 0 (0.0%) | 0 (0.0%) |
| Utilities | 0 (0.0%) | 0 (0.0%) |
| Information | 0 (0.0%) | 0 (0.0%) |
| Finance & Insurance | 0 (0.0%) | 0 (0.0%) |
| Real Estate, Rental & Leasing | 0 (0.0%) | 0 (0.0%) |
| Professional & Scientific | 0 (0.0%) | 3 (100.0%) |
| Enterprise Management | 0 (0.0%) | 0 (0.0%) |
| Administrative & Support | 0 (0.0%) | 3 (100.0%) |
| Educational Services | 0 (0.0%) | 0 (0.0%) |
| Health Care & Social Assistance | 14 (100.0%) | 0 (0.0%) |
| Arts, Entertainment & Recreation | 0 (0.0%) | 0 (0.0%) |
| Accommodation & Food Services | 84 (48.5%) | 89 (51.4%) |
| Public Administration | 17 (37.8%) | 28 (62.2%) |
| Total | 136 (49.6%) | 138 (50.4%) |
Education in Tusayan
School Enrollment in Tusayan
The most common levels of schooling among the 73 students in Tusayan are college / undergraduate (30 | 41.1%), middle school (25 | 34.3%), and kindergarten (18 | 24.7%).
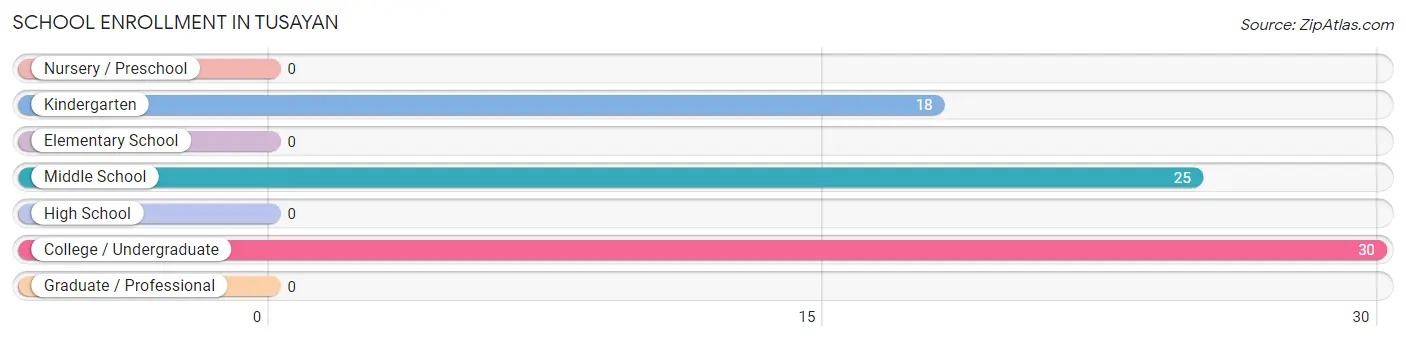
| School Level | # Students | % Students |
| Nursery / Preschool | 0 | 0.0% |
| Kindergarten | 18 | 24.7% |
| Elementary School | 0 | 0.0% |
| Middle School | 25 | 34.3% |
| High School | 0 | 0.0% |
| College / Undergraduate | 30 | 41.1% |
| Graduate / Professional | 0 | 0.0% |
| Total | 73 | 100.0% |
School Enrollment by Age by Funding Source in Tusayan
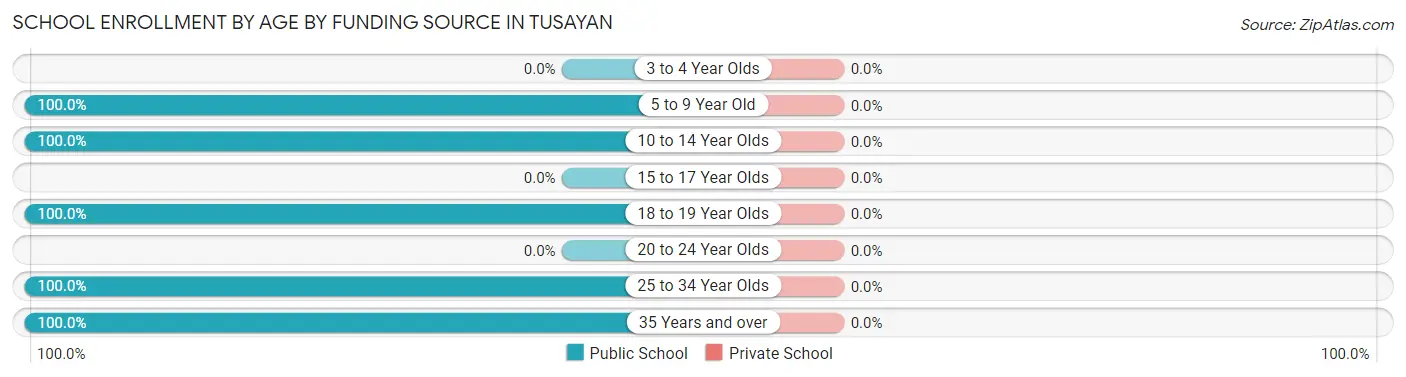
| Age Bracket | Public School | Private School |
| 3 to 4 Year Olds | 0 (0.0%) | 0 (0.0%) |
| 5 to 9 Year Old | 18 (100.0%) | 0 (0.0%) |
| 10 to 14 Year Olds | 25 (100.0%) | 0 (0.0%) |
| 15 to 17 Year Olds | 0 (0.0%) | 0 (0.0%) |
| 18 to 19 Year Olds | 21 (100.0%) | 0 (0.0%) |
| 20 to 24 Year Olds | 0 (0.0%) | 0 (0.0%) |
| 25 to 34 Year Olds | 3 (100.0%) | 0 (0.0%) |
| 35 Years and over | 6 (100.0%) | 0 (0.0%) |
| Total | 73 (100.0%) | 0 (0.0%) |
Educational Attainment by Field of Study in Tusayan
, and computers & mathematics (3 | 100.0%) are the most common fields of study among 3 individuals in Tusayan who have obtained a bachelor's degree or higher.
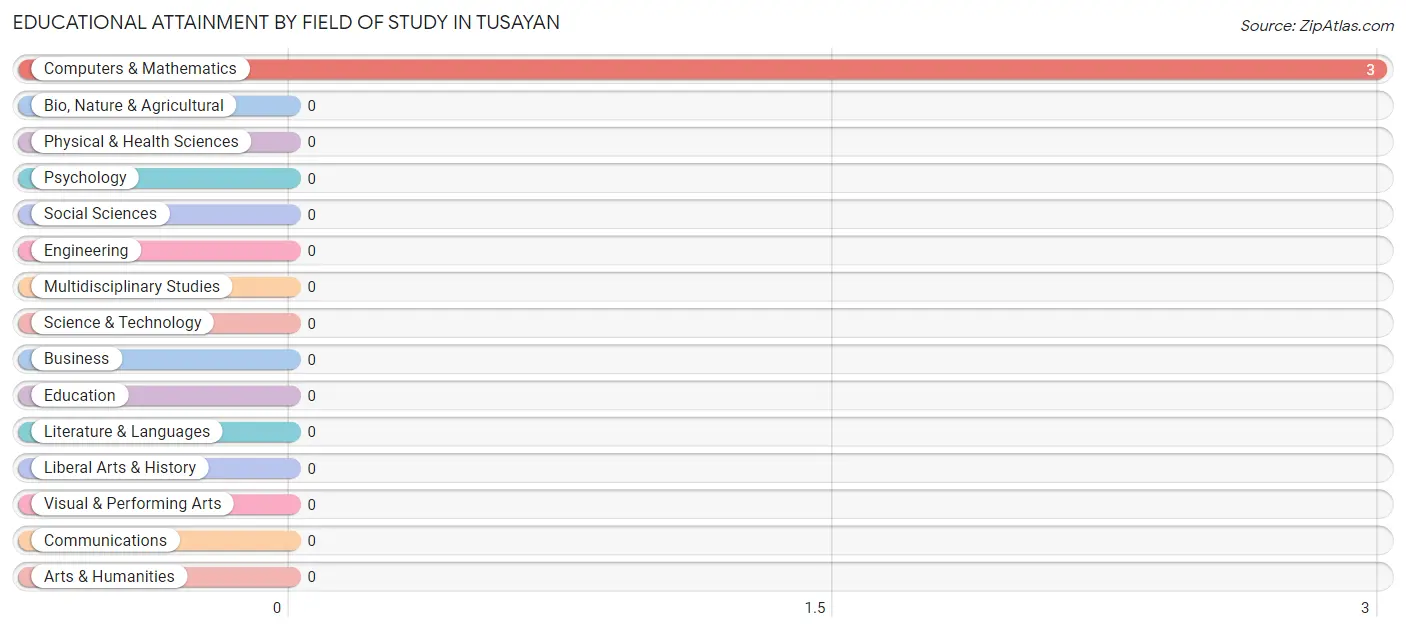
| Field of Study | # Graduates | % Graduates |
| Computers & Mathematics | 3 | 100.0% |
| Bio, Nature & Agricultural | 0 | 0.0% |
| Physical & Health Sciences | 0 | 0.0% |
| Psychology | 0 | 0.0% |
| Social Sciences | 0 | 0.0% |
| Engineering | 0 | 0.0% |
| Multidisciplinary Studies | 0 | 0.0% |
| Science & Technology | 0 | 0.0% |
| Business | 0 | 0.0% |
| Education | 0 | 0.0% |
| Literature & Languages | 0 | 0.0% |
| Liberal Arts & History | 0 | 0.0% |
| Visual & Performing Arts | 0 | 0.0% |
| Communications | 0 | 0.0% |
| Arts & Humanities | 0 | 0.0% |
| Total | 3 | 100.0% |
Transportation & Commute in Tusayan
Vehicle Availability by Sex in Tusayan
The most prevalent vehicle ownership categories in Tusayan are males with 2 vehicles (27, accounting for 39.1%) and females with 2 vehicles (15, making up 39.1%).
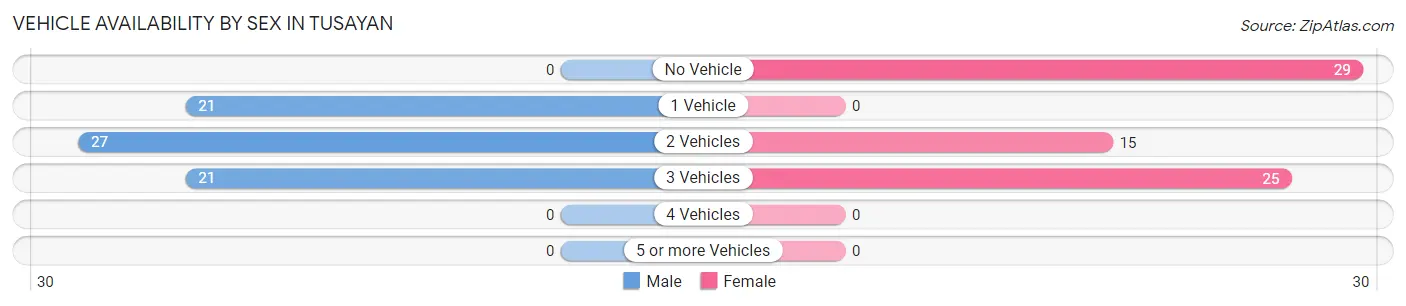
| Vehicles Available | Male | Female |
| No Vehicle | 0 (0.0%) | 29 (42.0%) |
| 1 Vehicle | 21 (30.4%) | 0 (0.0%) |
| 2 Vehicles | 27 (39.1%) | 15 (21.7%) |
| 3 Vehicles | 21 (30.4%) | 25 (36.2%) |
| 4 Vehicles | 0 (0.0%) | 0 (0.0%) |
| 5 or more Vehicles | 0 (0.0%) | 0 (0.0%) |
| Total | 69 (100.0%) | 69 (100.0%) |
Commute Time in Tusayan
The most frequently occuring commute durations in Tusayan are 5 to 9 minutes (131 commuters, 47.8%), less than 5 minutes (87 commuters, 31.8%), and 15 to 19 minutes (21 commuters, 7.7%).
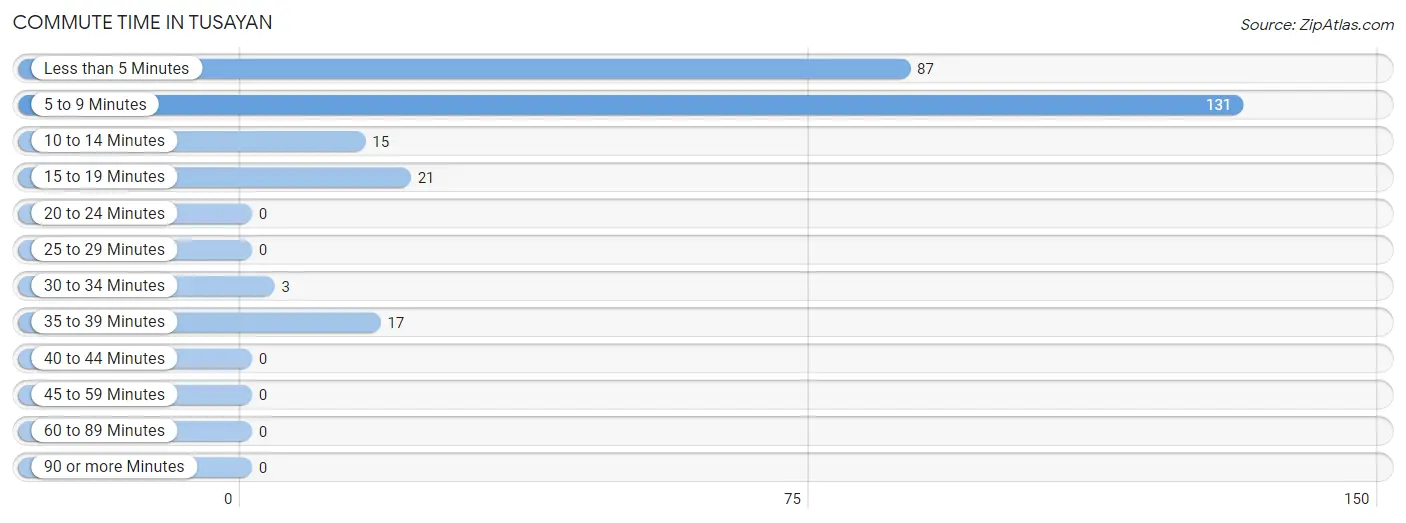
| Commute Time | # Commuters | % Commuters |
| Less than 5 Minutes | 87 | 31.8% |
| 5 to 9 Minutes | 131 | 47.8% |
| 10 to 14 Minutes | 15 | 5.5% |
| 15 to 19 Minutes | 21 | 7.7% |
| 20 to 24 Minutes | 0 | 0.0% |
| 25 to 29 Minutes | 0 | 0.0% |
| 30 to 34 Minutes | 3 | 1.1% |
| 35 to 39 Minutes | 17 | 6.2% |
| 40 to 44 Minutes | 0 | 0.0% |
| 45 to 59 Minutes | 0 | 0.0% |
| 60 to 89 Minutes | 0 | 0.0% |
| 90 or more Minutes | 0 | 0.0% |
Commute Time by Sex in Tusayan
The most common commute times in Tusayan are less than 5 minutes (60 commuters, 44.1%) for males and 5 to 9 minutes (93 commuters, 67.4%) for females.
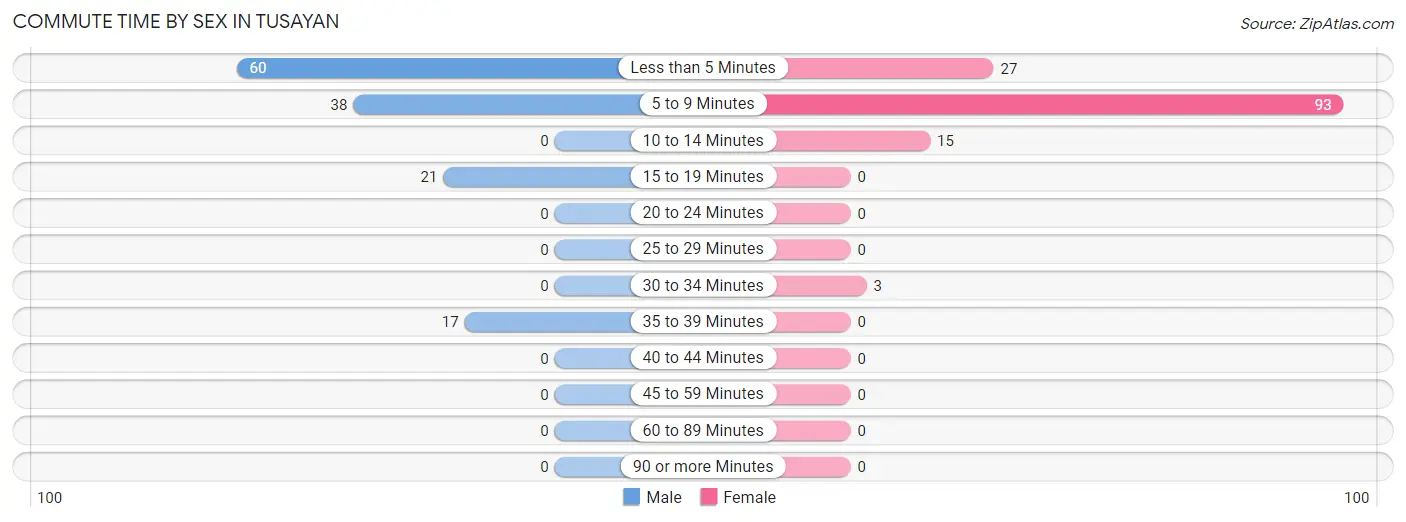
| Commute Time | Male | Female |
| Less than 5 Minutes | 60 (44.1%) | 27 (19.6%) |
| 5 to 9 Minutes | 38 (27.9%) | 93 (67.4%) |
| 10 to 14 Minutes | 0 (0.0%) | 15 (10.9%) |
| 15 to 19 Minutes | 21 (15.4%) | 0 (0.0%) |
| 20 to 24 Minutes | 0 (0.0%) | 0 (0.0%) |
| 25 to 29 Minutes | 0 (0.0%) | 0 (0.0%) |
| 30 to 34 Minutes | 0 (0.0%) | 3 (2.2%) |
| 35 to 39 Minutes | 17 (12.5%) | 0 (0.0%) |
| 40 to 44 Minutes | 0 (0.0%) | 0 (0.0%) |
| 45 to 59 Minutes | 0 (0.0%) | 0 (0.0%) |
| 60 to 89 Minutes | 0 (0.0%) | 0 (0.0%) |
| 90 or more Minutes | 0 (0.0%) | 0 (0.0%) |
Time of Departure to Work by Sex in Tusayan
The most frequent times of departure to work in Tusayan are 7:00 AM to 7:29 AM (44, 32.4%) for males and 6:30 AM to 6:59 AM (43, 31.2%) for females.
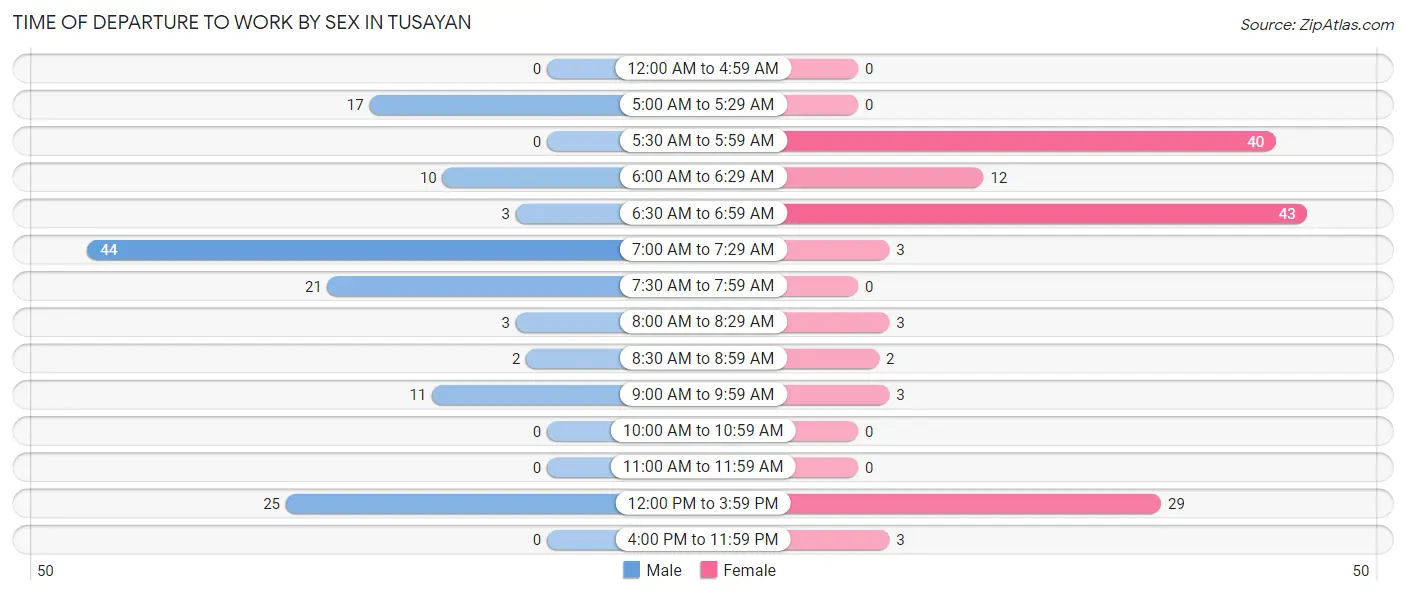
| Time of Departure | Male | Female |
| 12:00 AM to 4:59 AM | 0 (0.0%) | 0 (0.0%) |
| 5:00 AM to 5:29 AM | 17 (12.5%) | 0 (0.0%) |
| 5:30 AM to 5:59 AM | 0 (0.0%) | 40 (29.0%) |
| 6:00 AM to 6:29 AM | 10 (7.3%) | 12 (8.7%) |
| 6:30 AM to 6:59 AM | 3 (2.2%) | 43 (31.2%) |
| 7:00 AM to 7:29 AM | 44 (32.4%) | 3 (2.2%) |
| 7:30 AM to 7:59 AM | 21 (15.4%) | 0 (0.0%) |
| 8:00 AM to 8:29 AM | 3 (2.2%) | 3 (2.2%) |
| 8:30 AM to 8:59 AM | 2 (1.5%) | 2 (1.5%) |
| 9:00 AM to 9:59 AM | 11 (8.1%) | 3 (2.2%) |
| 10:00 AM to 10:59 AM | 0 (0.0%) | 0 (0.0%) |
| 11:00 AM to 11:59 AM | 0 (0.0%) | 0 (0.0%) |
| 12:00 PM to 3:59 PM | 25 (18.4%) | 29 (21.0%) |
| 4:00 PM to 11:59 PM | 0 (0.0%) | 3 (2.2%) |
| Total | 136 (100.0%) | 138 (100.0%) |
Housing Occupancy in Tusayan
Occupancy by Ownership in Tusayan
Of the total 123 dwellings in Tusayan, owner-occupied units account for 21 (17.1%), while renter-occupied units make up 102 (82.9%).
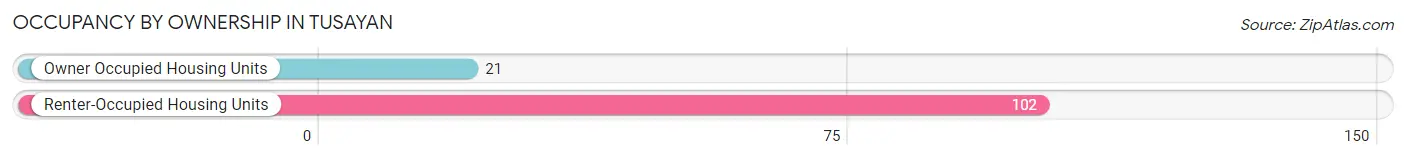
| Occupancy | # Housing Units | % Housing Units |
| Owner Occupied Housing Units | 21 | 17.1% |
| Renter-Occupied Housing Units | 102 | 82.9% |
| Total Occupied Housing Units | 123 | 100.0% |
Occupancy by Household Size in Tusayan
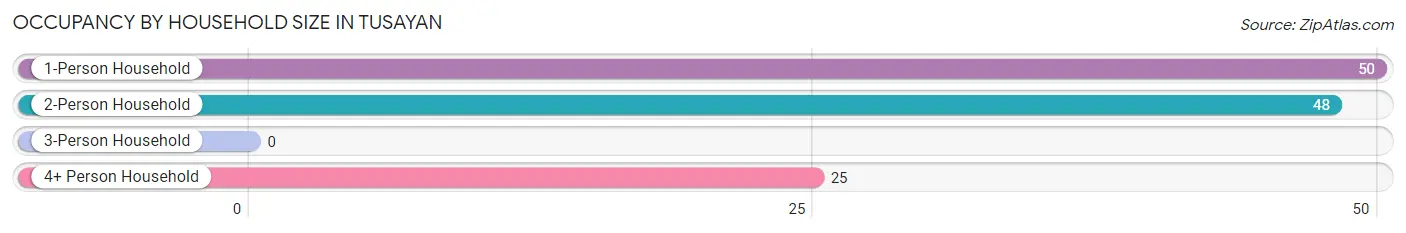
| Household Size | # Housing Units | % Housing Units |
| 1-Person Household | 50 | 40.6% |
| 2-Person Household | 48 | 39.0% |
| 3-Person Household | 0 | 0.0% |
| 4+ Person Household | 25 | 20.3% |
| Total Housing Units | 123 | 100.0% |
Occupancy by Ownership by Household Size in Tusayan
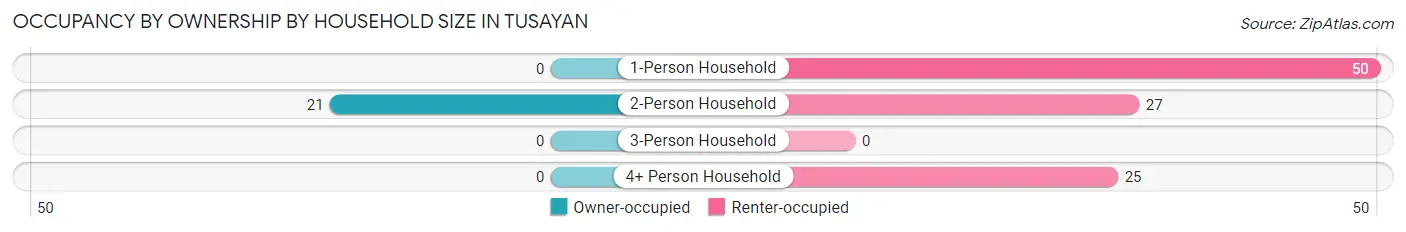
| Household Size | Owner-occupied | Renter-occupied |
| 1-Person Household | 0 (0.0%) | 50 (100.0%) |
| 2-Person Household | 21 (43.8%) | 27 (56.2%) |
| 3-Person Household | 0 (0.0%) | 0 (0.0%) |
| 4+ Person Household | 0 (0.0%) | 25 (100.0%) |
| Total Housing Units | 21 (17.1%) | 102 (82.9%) |
Occupancy by Educational Attainment in Tusayan
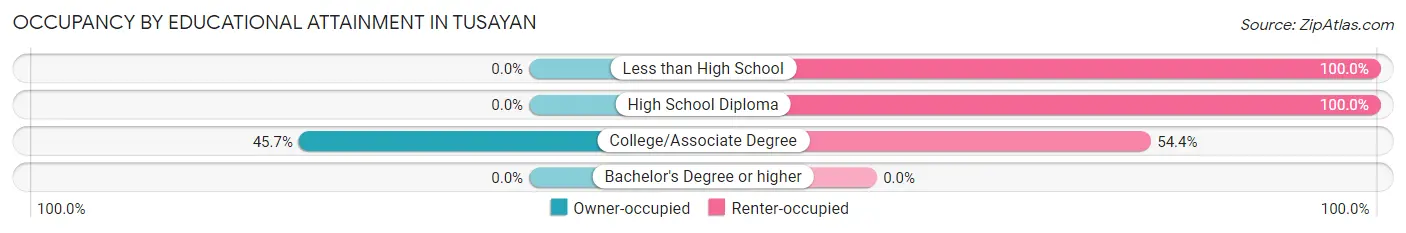
| Household Size | Owner-occupied | Renter-occupied |
| Less than High School | 0 (0.0%) | 27 (100.0%) |
| High School Diploma | 0 (0.0%) | 50 (100.0%) |
| College/Associate Degree | 21 (45.7%) | 25 (54.3%) |
| Bachelor's Degree or higher | 0 (0.0%) | 0 (0.0%) |
Occupancy by Age of Householder in Tusayan
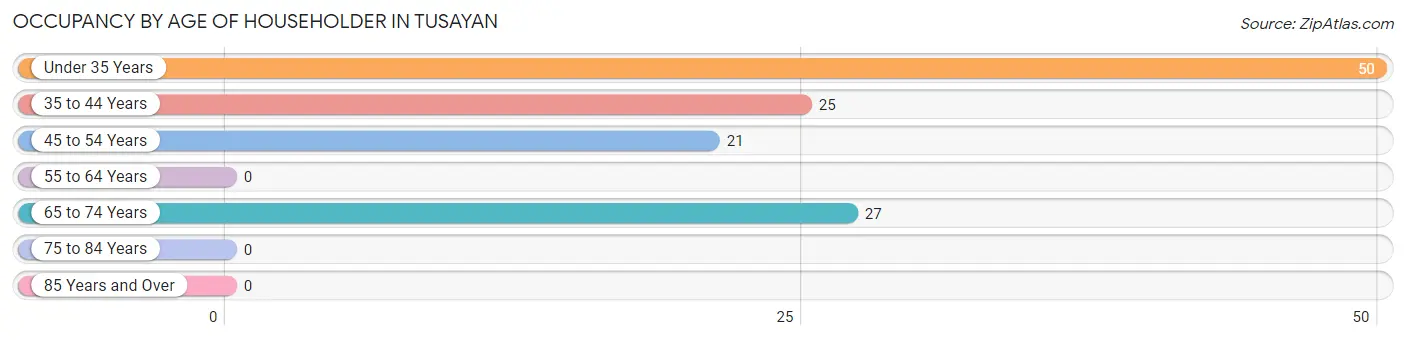
| Age Bracket | # Households | % Households |
| Under 35 Years | 50 | 40.6% |
| 35 to 44 Years | 25 | 20.3% |
| 45 to 54 Years | 21 | 17.1% |
| 55 to 64 Years | 0 | 0.0% |
| 65 to 74 Years | 27 | 22.0% |
| 75 to 84 Years | 0 | 0.0% |
| 85 Years and Over | 0 | 0.0% |
| Total | 123 | 100.0% |
Housing Finances in Tusayan
Median Income by Occupancy in Tusayan
| Occupancy Type | # Households | Median Income |
| Owner-Occupied | 21 (17.1%) | $0 |
| Renter-Occupied | 102 (82.9%) | $0 |
| Average | 123 (100.0%) | $0 |
Occupancy by Householder Income Bracket in Tusayan
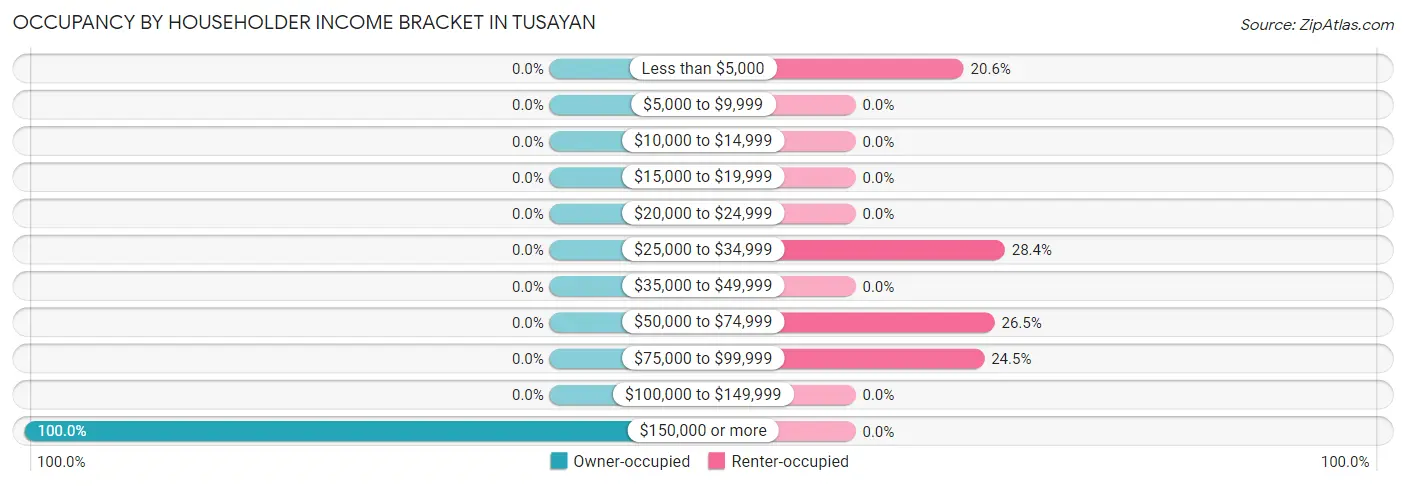
| Income Bracket | Owner-occupied | Renter-occupied |
| Less than $5,000 | 0 (0.0%) | 21 (20.6%) |
| $5,000 to $9,999 | 0 (0.0%) | 0 (0.0%) |
| $10,000 to $14,999 | 0 (0.0%) | 0 (0.0%) |
| $15,000 to $19,999 | 0 (0.0%) | 0 (0.0%) |
| $20,000 to $24,999 | 0 (0.0%) | 0 (0.0%) |
| $25,000 to $34,999 | 0 (0.0%) | 29 (28.4%) |
| $35,000 to $49,999 | 0 (0.0%) | 0 (0.0%) |
| $50,000 to $74,999 | 0 (0.0%) | 27 (26.5%) |
| $75,000 to $99,999 | 0 (0.0%) | 25 (24.5%) |
| $100,000 to $149,999 | 0 (0.0%) | 0 (0.0%) |
| $150,000 or more | 21 (100.0%) | 0 (0.0%) |
| Total | 21 (100.0%) | 102 (100.0%) |
Monthly Housing Cost Tiers in Tusayan
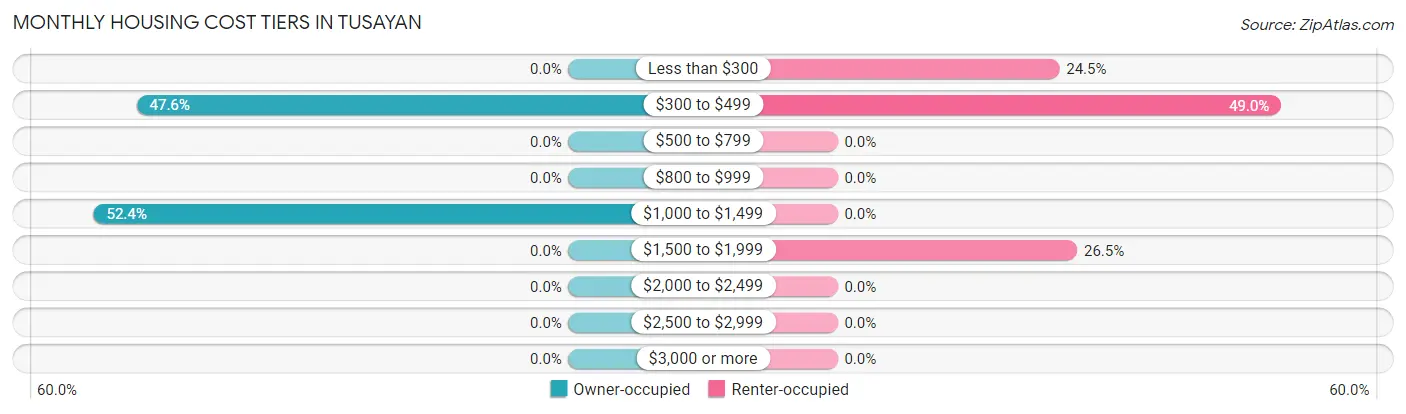
| Monthly Cost | Owner-occupied | Renter-occupied |
| Less than $300 | 0 (0.0%) | 25 (24.5%) |
| $300 to $499 | 10 (47.6%) | 50 (49.0%) |
| $500 to $799 | 0 (0.0%) | 0 (0.0%) |
| $800 to $999 | 0 (0.0%) | 0 (0.0%) |
| $1,000 to $1,499 | 11 (52.4%) | 0 (0.0%) |
| $1,500 to $1,999 | 0 (0.0%) | 27 (26.5%) |
| $2,000 to $2,499 | 0 (0.0%) | 0 (0.0%) |
| $2,500 to $2,999 | 0 (0.0%) | 0 (0.0%) |
| $3,000 or more | 0 (0.0%) | 0 (0.0%) |
| Total | 21 (100.0%) | 102 (100.0%) |
Physical Housing Characteristics in Tusayan
Housing Structures in Tusayan
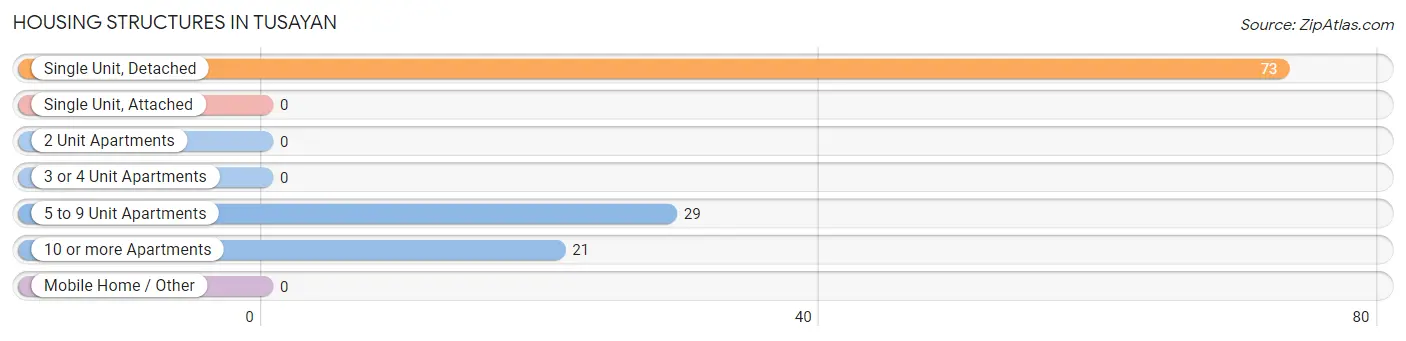
| Structure Type | # Housing Units | % Housing Units |
| Single Unit, Detached | 73 | 59.4% |
| Single Unit, Attached | 0 | 0.0% |
| 2 Unit Apartments | 0 | 0.0% |
| 3 or 4 Unit Apartments | 0 | 0.0% |
| 5 to 9 Unit Apartments | 29 | 23.6% |
| 10 or more Apartments | 21 | 17.1% |
| Mobile Home / Other | 0 | 0.0% |
| Total | 123 | 100.0% |
Housing Structures by Occupancy in Tusayan
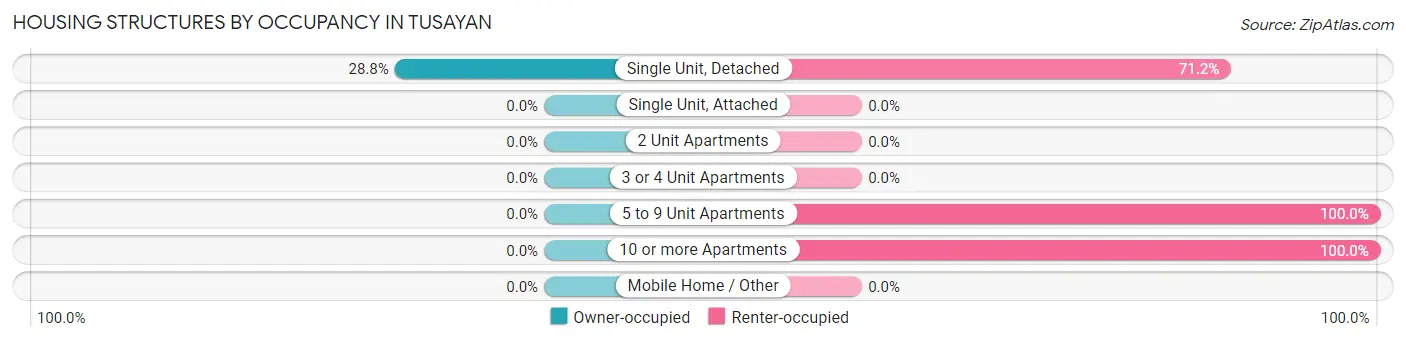
| Structure Type | Owner-occupied | Renter-occupied |
| Single Unit, Detached | 21 (28.8%) | 52 (71.2%) |
| Single Unit, Attached | 0 (0.0%) | 0 (0.0%) |
| 2 Unit Apartments | 0 (0.0%) | 0 (0.0%) |
| 3 or 4 Unit Apartments | 0 (0.0%) | 0 (0.0%) |
| 5 to 9 Unit Apartments | 0 (0.0%) | 29 (100.0%) |
| 10 or more Apartments | 0 (0.0%) | 21 (100.0%) |
| Mobile Home / Other | 0 (0.0%) | 0 (0.0%) |
| Total | 21 (17.1%) | 102 (82.9%) |
Housing Structures by Number of Rooms in Tusayan
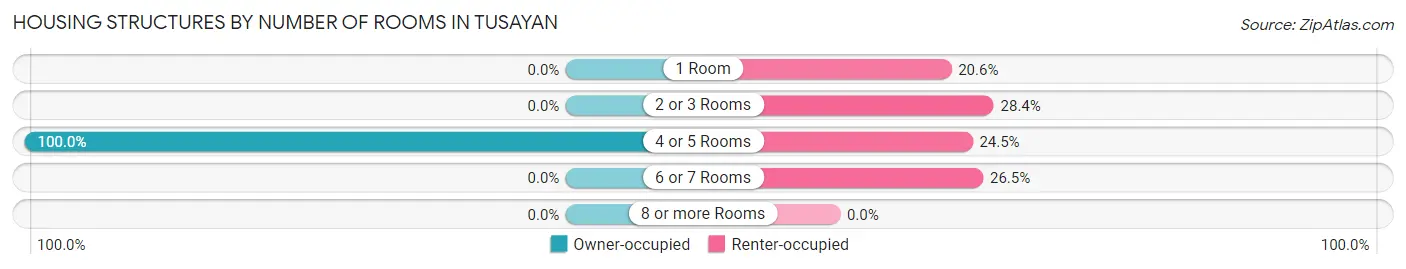
| Number of Rooms | Owner-occupied | Renter-occupied |
| 1 Room | 0 (0.0%) | 21 (20.6%) |
| 2 or 3 Rooms | 0 (0.0%) | 29 (28.4%) |
| 4 or 5 Rooms | 21 (100.0%) | 25 (24.5%) |
| 6 or 7 Rooms | 0 (0.0%) | 27 (26.5%) |
| 8 or more Rooms | 0 (0.0%) | 0 (0.0%) |
| Total | 21 (100.0%) | 102 (100.0%) |
Housing Structure by Heating Type in Tusayan
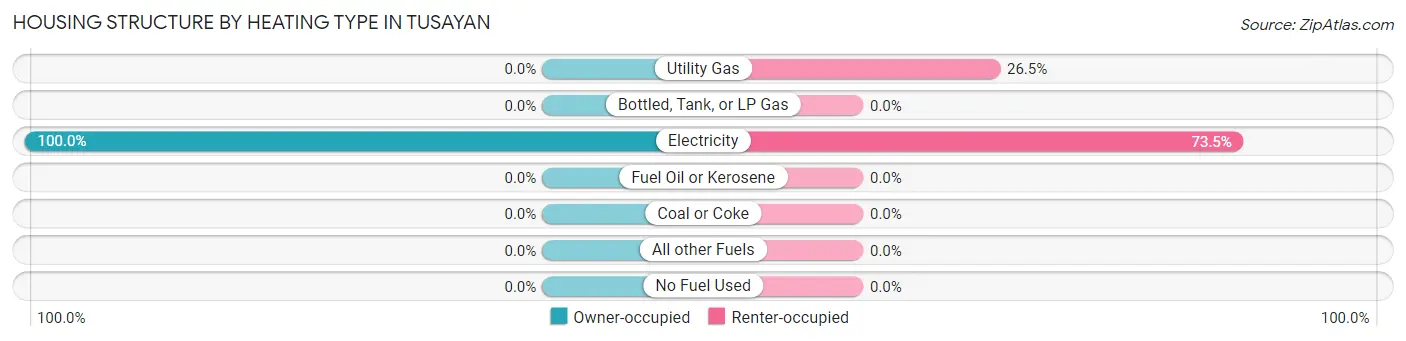
| Heating Type | Owner-occupied | Renter-occupied |
| Utility Gas | 0 (0.0%) | 27 (26.5%) |
| Bottled, Tank, or LP Gas | 0 (0.0%) | 0 (0.0%) |
| Electricity | 21 (100.0%) | 75 (73.5%) |
| Fuel Oil or Kerosene | 0 (0.0%) | 0 (0.0%) |
| Coal or Coke | 0 (0.0%) | 0 (0.0%) |
| All other Fuels | 0 (0.0%) | 0 (0.0%) |
| No Fuel Used | 0 (0.0%) | 0 (0.0%) |
| Total | 21 (100.0%) | 102 (100.0%) |
Household Vehicle Usage in Tusayan
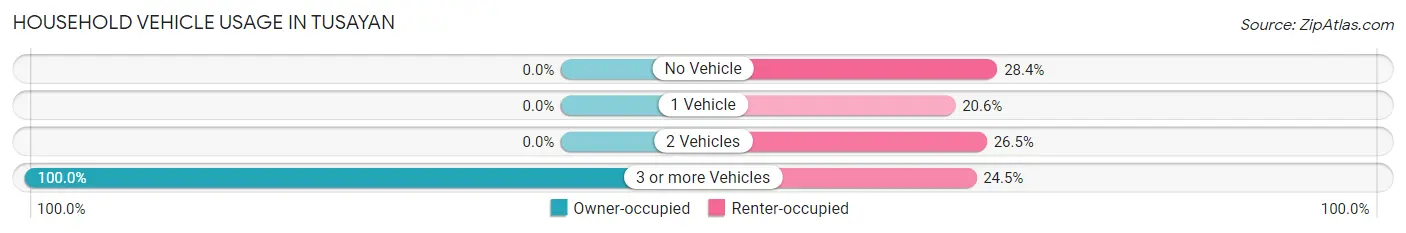
| Vehicles per Household | Owner-occupied | Renter-occupied |
| No Vehicle | 0 (0.0%) | 29 (28.4%) |
| 1 Vehicle | 0 (0.0%) | 21 (20.6%) |
| 2 Vehicles | 0 (0.0%) | 27 (26.5%) |
| 3 or more Vehicles | 21 (100.0%) | 25 (24.5%) |
| Total | 21 (100.0%) | 102 (100.0%) |
Real Estate & Mortgages in Tusayan
Real Estate and Mortgage Overview in Tusayan
| Characteristic | Without Mortgage | With Mortgage |
| Housing Units | 21 | 0 |
| Median Property Value | - | - |
| Median Household Income | - | - |
| Monthly Housing Costs | - | - |
| Real Estate Taxes | - | - |
Property Value by Mortgage Status in Tusayan
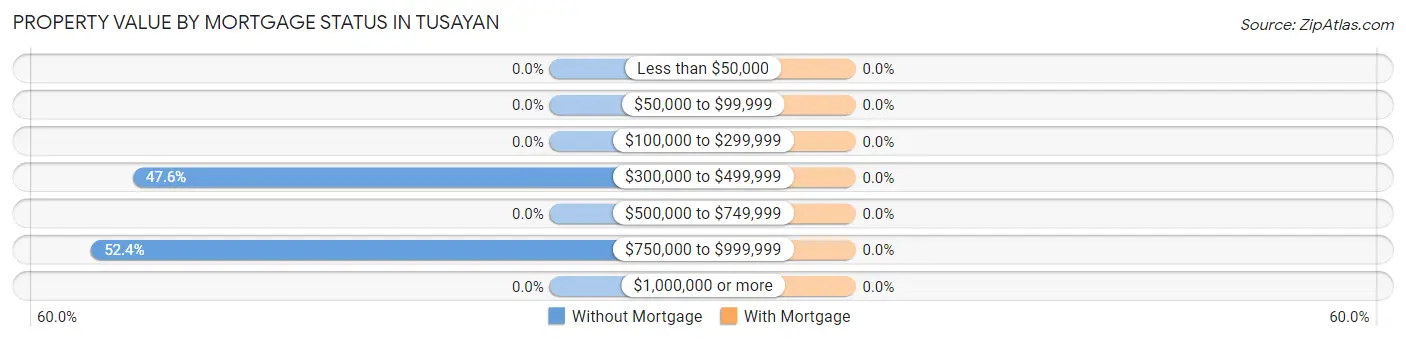
| Property Value | Without Mortgage | With Mortgage |
| Less than $50,000 | 0 (0.0%) | 0 (0.0%) |
| $50,000 to $99,999 | 0 (0.0%) | 0 (0.0%) |
| $100,000 to $299,999 | 0 (0.0%) | 0 (0.0%) |
| $300,000 to $499,999 | 10 (47.6%) | 0 (0.0%) |
| $500,000 to $749,999 | 0 (0.0%) | 0 (0.0%) |
| $750,000 to $999,999 | 11 (52.4%) | 0 (0.0%) |
| $1,000,000 or more | 0 (0.0%) | 0 (0.0%) |
| Total | 21 (100.0%) | 0 (0.0%) |
Household Income by Mortgage Status in Tusayan
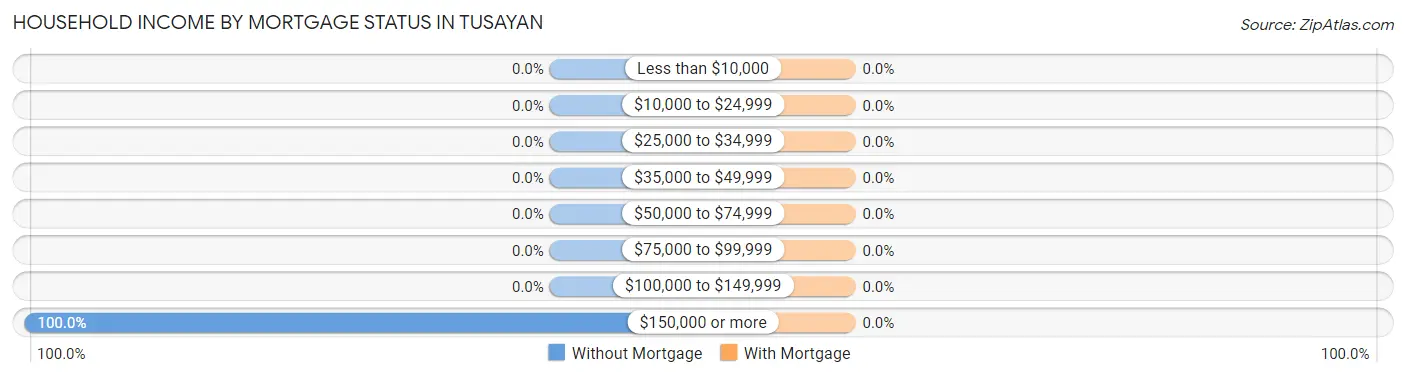
| Household Income | Without Mortgage | With Mortgage |
| Less than $10,000 | 0 (0.0%) | 0 (0.0%) |
| $10,000 to $24,999 | 0 (0.0%) | 0 (0.0%) |
| $25,000 to $34,999 | 0 (0.0%) | 0 (0.0%) |
| $35,000 to $49,999 | 0 (0.0%) | 0 (0.0%) |
| $50,000 to $74,999 | 0 (0.0%) | 0 (0.0%) |
| $75,000 to $99,999 | 0 (0.0%) | 0 (0.0%) |
| $100,000 to $149,999 | 0 (0.0%) | 0 (0.0%) |
| $150,000 or more | 21 (100.0%) | 0 (0.0%) |
| Total | 21 (100.0%) | 0 (0.0%) |
Property Value to Household Income Ratio in Tusayan
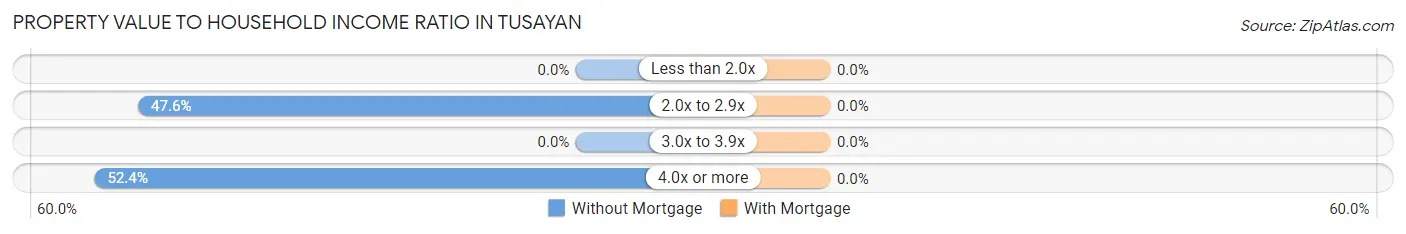
| Value-to-Income Ratio | Without Mortgage | With Mortgage |
| Less than 2.0x | 0 (0.0%) | 0 (0.0%) |
| 2.0x to 2.9x | 10 (47.6%) | 0 (0.0%) |
| 3.0x to 3.9x | 0 (0.0%) | 0 (0.0%) |
| 4.0x or more | 11 (52.4%) | 0 (0.0%) |
| Total | 21 (100.0%) | 0 (0.0%) |
Real Estate Taxes by Mortgage Status in Tusayan
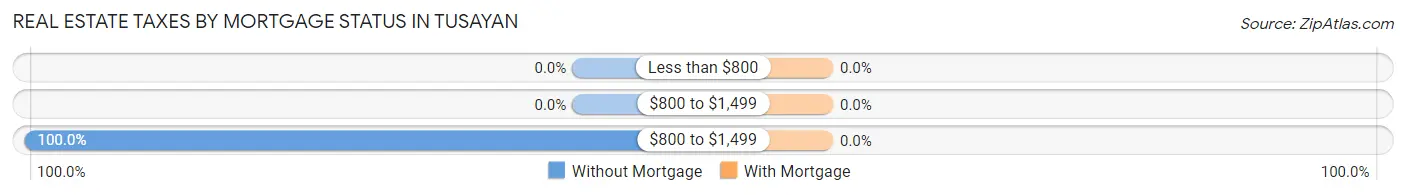
| Property Taxes | Without Mortgage | With Mortgage |
| Less than $800 | 0 (0.0%) | 0 (0.0%) |
| $800 to $1,499 | 0 (0.0%) | 0 (0.0%) |
| $800 to $1,499 | 21 (100.0%) | 0 (0.0%) |
| Total | 21 (100.0%) | 0 (0.0%) |
Health & Disability in Tusayan
Health Insurance Coverage by Age in Tusayan
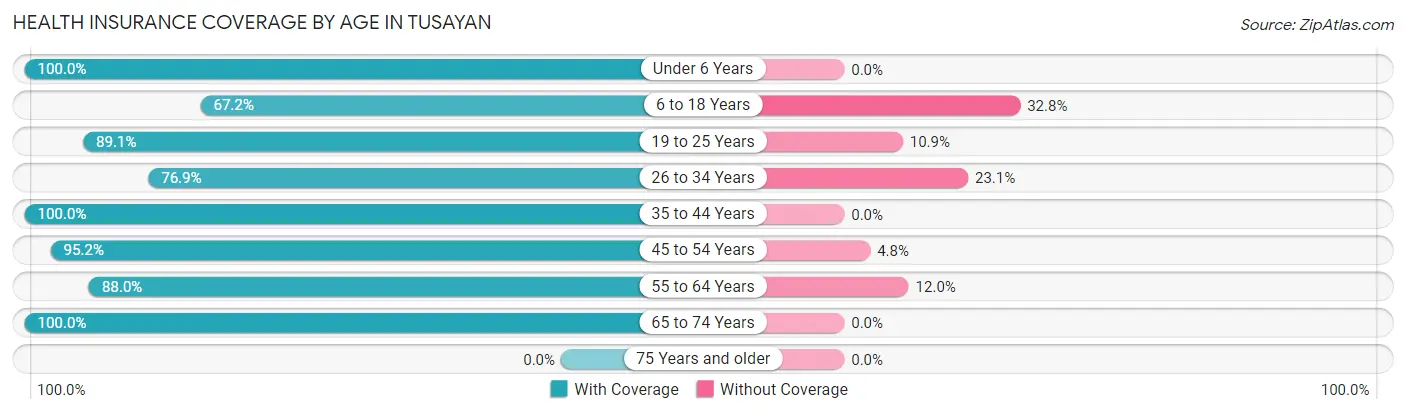
| Age Bracket | With Coverage | Without Coverage |
| Under 6 Years | 18 (100.0%) | 0 (0.0%) |
| 6 to 18 Years | 43 (67.2%) | 21 (32.8%) |
| 19 to 25 Years | 98 (89.1%) | 12 (10.9%) |
| 26 to 34 Years | 20 (76.9%) | 6 (23.1%) |
| 35 to 44 Years | 62 (100.0%) | 0 (0.0%) |
| 45 to 54 Years | 59 (95.2%) | 3 (4.8%) |
| 55 to 64 Years | 22 (88.0%) | 3 (12.0%) |
| 65 to 74 Years | 27 (100.0%) | 0 (0.0%) |
| 75 Years and older | 0 (0.0%) | 0 (0.0%) |
| Total | 349 (88.6%) | 45 (11.4%) |
Health Insurance Coverage by Citizenship Status in Tusayan
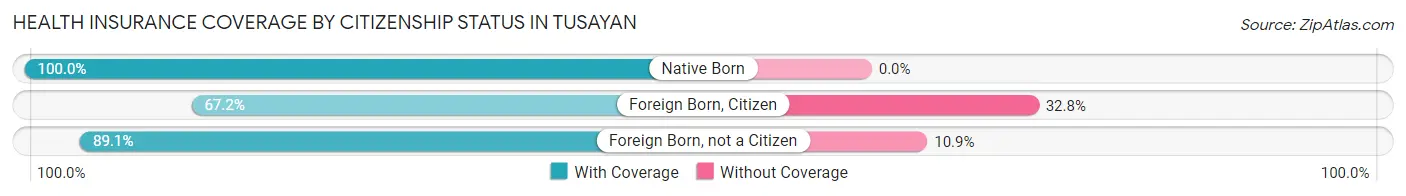
| Citizenship Status | With Coverage | Without Coverage |
| Native Born | 18 (100.0%) | 0 (0.0%) |
| Foreign Born, Citizen | 43 (67.2%) | 21 (32.8%) |
| Foreign Born, not a Citizen | 98 (89.1%) | 12 (10.9%) |
Health Insurance Coverage by Household Income in Tusayan
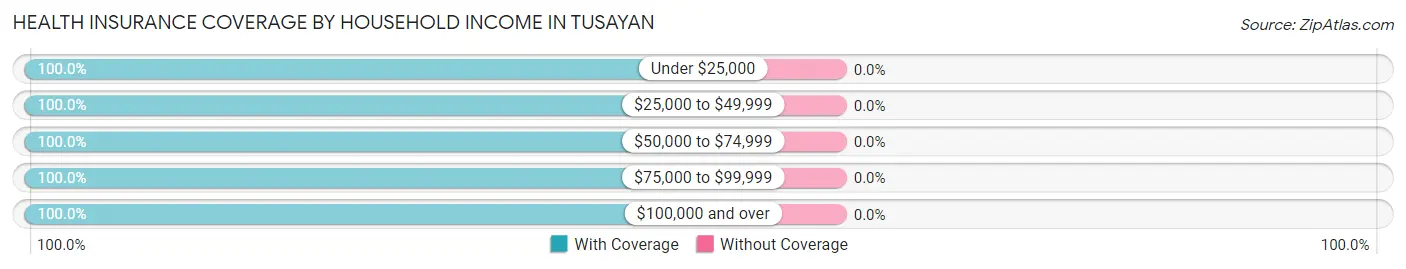
| Household Income | With Coverage | Without Coverage |
| Under $25,000 | 21 (100.0%) | 0 (0.0%) |
| $25,000 to $49,999 | 29 (100.0%) | 0 (0.0%) |
| $50,000 to $74,999 | 42 (100.0%) | 0 (0.0%) |
| $75,000 to $99,999 | 121 (100.0%) | 0 (0.0%) |
| $100,000 and over | 42 (100.0%) | 0 (0.0%) |
Public vs Private Health Insurance Coverage by Age in Tusayan
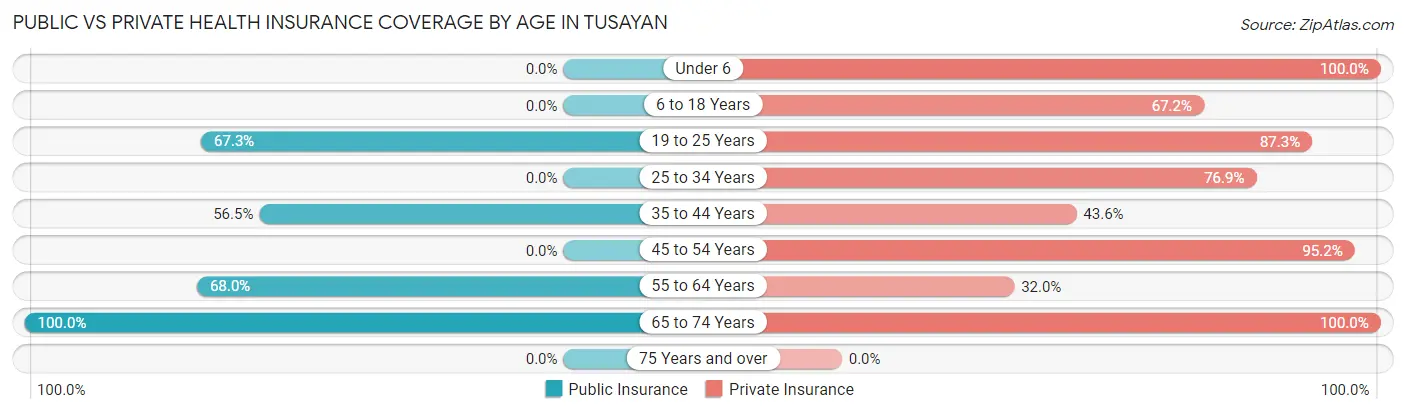
| Age Bracket | Public Insurance | Private Insurance |
| Under 6 | 0 (0.0%) | 18 (100.0%) |
| 6 to 18 Years | 0 (0.0%) | 43 (67.2%) |
| 19 to 25 Years | 74 (67.3%) | 96 (87.3%) |
| 25 to 34 Years | 0 (0.0%) | 20 (76.9%) |
| 35 to 44 Years | 35 (56.5%) | 27 (43.5%) |
| 45 to 54 Years | 0 (0.0%) | 59 (95.2%) |
| 55 to 64 Years | 17 (68.0%) | 8 (32.0%) |
| 65 to 74 Years | 27 (100.0%) | 27 (100.0%) |
| 75 Years and over | 0 (0.0%) | 0 (0.0%) |
| Total | 153 (38.8%) | 298 (75.6%) |
Disability Status by Sex by Age in Tusayan
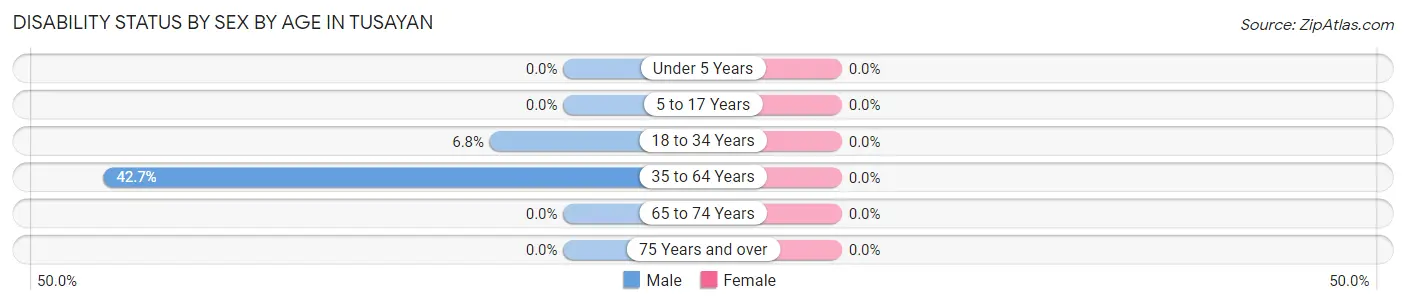
| Age Bracket | Male | Female |
| Under 5 Years | 0 (0.0%) | 0 (0.0%) |
| 5 to 17 Years | 0 (0.0%) | 0 (0.0%) |
| 18 to 34 Years | 3 (6.8%) | 0 (0.0%) |
| 35 to 64 Years | 35 (42.7%) | 0 (0.0%) |
| 65 to 74 Years | 0 (0.0%) | 0 (0.0%) |
| 75 Years and over | 0 (0.0%) | 0 (0.0%) |
Disability Class by Sex by Age in Tusayan
Disability Class: Hearing Difficulty
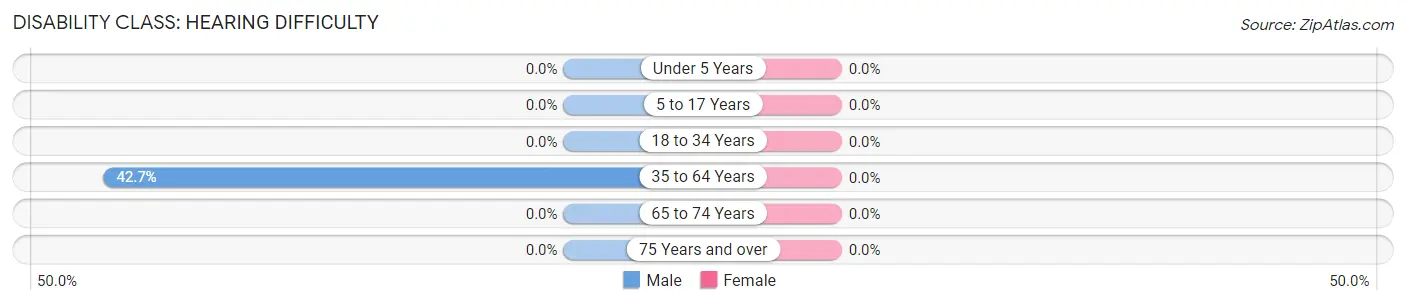
| Age Bracket | Male | Female |
| Under 5 Years | 0 (0.0%) | 0 (0.0%) |
| 5 to 17 Years | 0 (0.0%) | 0 (0.0%) |
| 18 to 34 Years | 0 (0.0%) | 0 (0.0%) |
| 35 to 64 Years | 35 (42.7%) | 0 (0.0%) |
| 65 to 74 Years | 0 (0.0%) | 0 (0.0%) |
| 75 Years and over | 0 (0.0%) | 0 (0.0%) |
Disability Class: Vision Difficulty
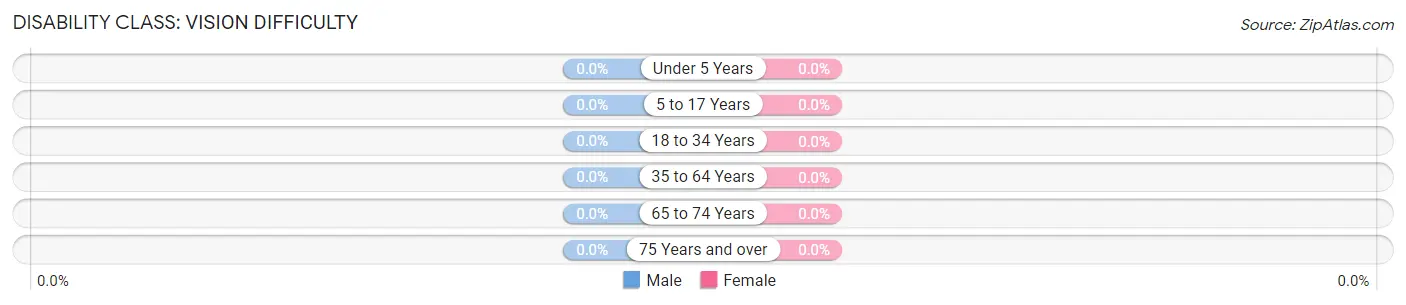
| Age Bracket | Male | Female |
| Under 5 Years | 0 (0.0%) | 0 (0.0%) |
| 5 to 17 Years | 0 (0.0%) | 0 (0.0%) |
| 18 to 34 Years | 0 (0.0%) | 0 (0.0%) |
| 35 to 64 Years | 0 (0.0%) | 0 (0.0%) |
| 65 to 74 Years | 0 (0.0%) | 0 (0.0%) |
| 75 Years and over | 0 (0.0%) | 0 (0.0%) |
Disability Class: Cognitive Difficulty
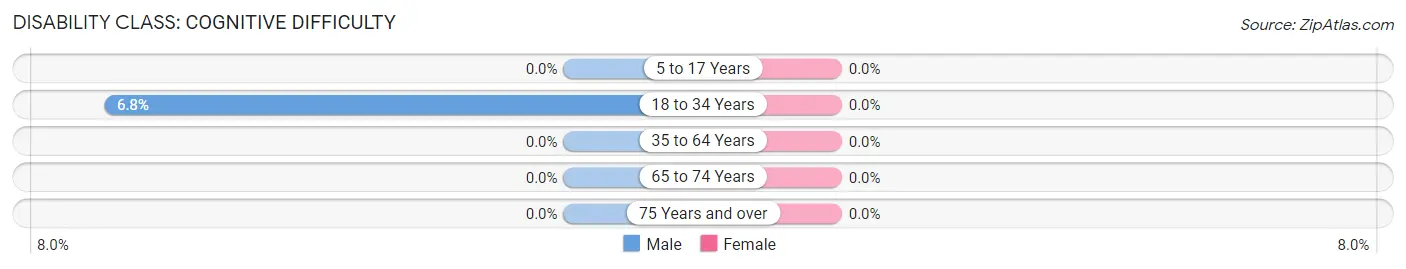
| Age Bracket | Male | Female |
| 5 to 17 Years | 0 (0.0%) | 0 (0.0%) |
| 18 to 34 Years | 3 (6.8%) | 0 (0.0%) |
| 35 to 64 Years | 0 (0.0%) | 0 (0.0%) |
| 65 to 74 Years | 0 (0.0%) | 0 (0.0%) |
| 75 Years and over | 0 (0.0%) | 0 (0.0%) |
Disability Class: Ambulatory Difficulty
| Age Bracket | Male | Female |
| 5 to 17 Years | 0 (0.0%) | 0 (0.0%) |
| 18 to 34 Years | 0 (0.0%) | 0 (0.0%) |
| 35 to 64 Years | 0 (0.0%) | 0 (0.0%) |
| 65 to 74 Years | 0 (0.0%) | 0 (0.0%) |
| 75 Years and over | 0 (0.0%) | 0 (0.0%) |
Disability Class: Self-Care Difficulty
| Age Bracket | Male | Female |
| 5 to 17 Years | 0 (0.0%) | 0 (0.0%) |
| 18 to 34 Years | 0 (0.0%) | 0 (0.0%) |
| 35 to 64 Years | 0 (0.0%) | 0 (0.0%) |
| 65 to 74 Years | 0 (0.0%) | 0 (0.0%) |
| 75 Years and over | 0 (0.0%) | 0 (0.0%) |
Technology Access in Tusayan
Computing Device Access in Tusayan
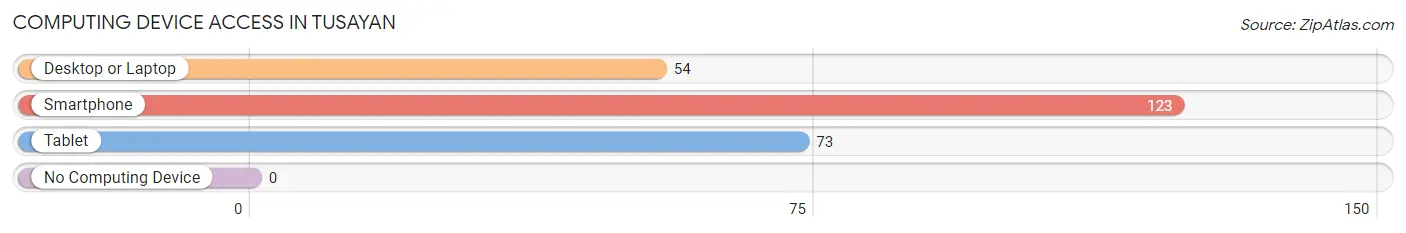
| Device Type | # Households | % Households |
| Desktop or Laptop | 54 | 43.9% |
| Smartphone | 123 | 100.0% |
| Tablet | 73 | 59.4% |
| No Computing Device | 0 | 0.0% |
| Total | 123 | 100.0% |
Internet Access in Tusayan
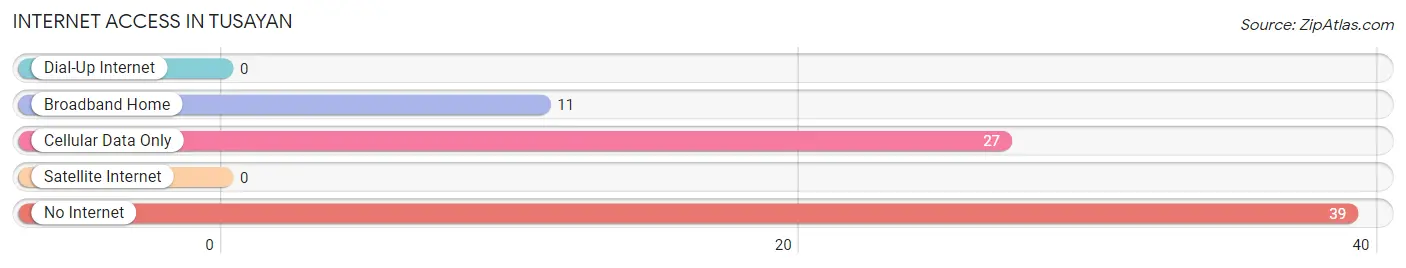
| Internet Type | # Households | % Households |
| Dial-Up Internet | 0 | 0.0% |
| Broadband Home | 11 | 8.9% |
| Cellular Data Only | 27 | 22.0% |
| Satellite Internet | 0 | 0.0% |
| No Internet | 39 | 31.7% |
| Total | 123 | 100.0% |
Tusayan Summary
Tusayan is a small town located in Coconino County, Arizona, United States. It is situated in the Grand Canyon National Park, just south of the Grand Canyon Village. The town is located on the Kaibab Plateau, at an elevation of 6,400 feet (1,951 m). The population of Tusayan was 562 at the 2010 census.
History
Tusayan was first settled in the late 1800s by Mormon settlers. The town was originally known as "Tusayan Springs" and was a popular stop for travelers on their way to the Grand Canyon. In the early 1900s, the town was renamed "Tusayan" and became a popular tourist destination.
In the 1920s, the Fred Harvey Company opened a hotel in Tusayan, which was the first hotel in the area. The hotel was a popular destination for tourists and was a major contributor to the town's economy.
In the 1950s, the town was incorporated and the population began to grow. The town was also home to a number of businesses, including a gas station, a grocery store, and a post office.
In the 1970s, the town began to experience a decline in population as tourists began to visit the Grand Canyon Village instead of Tusayan. The town's economy suffered as a result and many businesses closed.
In the 1980s, the town began to experience a resurgence in tourism as the Grand Canyon National Park was established. The town was also home to a number of new businesses, including a hotel, a restaurant, and a gift shop.
Geography
Tusayan is located in Coconino County, Arizona, United States. It is situated in the Grand Canyon National Park, just south of the Grand Canyon Village. The town is located on the Kaibab Plateau, at an elevation of 6,400 feet (1,951 m).
The town is located in a desert climate, with hot summers and mild winters. The average annual temperature is 57°F (14°C). The average annual precipitation is 11.5 inches (292 mm).
Economy
The economy of Tusayan is largely based on tourism. The town is home to a number of hotels, restaurants, and gift shops that cater to tourists visiting the Grand Canyon National Park. The town is also home to a number of businesses that provide services to the local community, such as a gas station, a grocery store, and a post office.
Demographics
As of the 2010 census, the population of Tusayan was 562. The racial makeup of the town was 94.2% White, 0.7% Native American, 0.2% Asian, 0.2% Pacific Islander, 0.2% from other races, and 4.7% from two or more races. Hispanic or Latino of any race were 2.3% of the population.
The median income for a household in the town was $45,000, and the median income for a family was $50,000. The per capita income for the town was $20,000. About 10.3% of families and 11.7% of the population were below the poverty line, including 15.2% of those under age 18 and none of those age 65 or over.
Common Questions
What is Per Capita Income in Tusayan?
Per Capita income in Tusayan is $33,846.
What is Inequality or Gini Index in Tusayan?
Inequality or Gini Index in Tusayan is 0.47.
What is the Total Population of Tusayan?
Total Population of Tusayan is 394.
What is the Total Male Population of Tusayan?
Total Male Population of Tusayan is 174.
What is the Total Female Population of Tusayan?
Total Female Population of Tusayan is 220.
What is the Ratio of Males per 100 Females in Tusayan?
There are 79.09 Males per 100 Females in Tusayan.
What is the Ratio of Females per 100 Males in Tusayan?
There are 126.44 Females per 100 Males in Tusayan.
What is the Median Population Age in Tusayan?
Median Population Age in Tusayan is 28.3 Years.
What is the Average Family Size in Tusayan
Average Family Size in Tusayan is 2.8 People.
What is the Average Household Size in Tusayan
Average Household Size in Tusayan is 2.1 People.
How Large is the Labor Force in Tusayan?
There are 274 People in the Labor Forcein in Tusayan.
What is the Percentage of People in the Labor Force in Tusayan?
82.3% of People are in the Labor Force in Tusayan.