Pleasure Bend, LA Map & Demographics
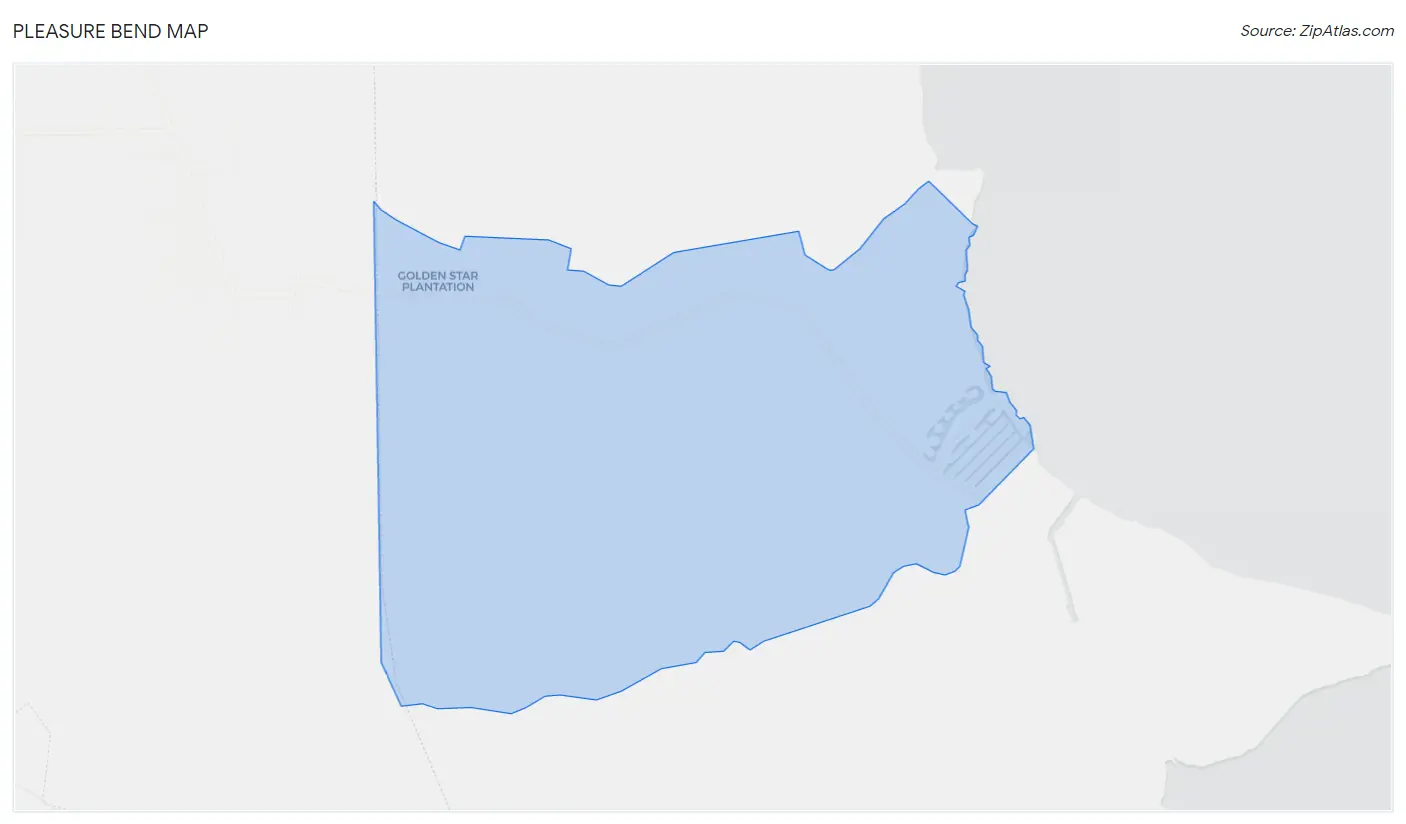
Pleasure Bend Map
Pleasure Bend Overview
$32,106
PER CAPITA INCOME
$72,981
AVG HOUSEHOLD INCOME
0.28
INEQUALITY / GINI INDEX
271
TOTAL POPULATION
137
MALE POPULATION
134
FEMALE POPULATION
102.24
MALES / 100 FEMALES
97.81
FEMALES / 100 MALES
54.1
MEDIAN AGE
3.8
AVG FAMILY SIZE
2.8
AVG HOUSEHOLD SIZE
113
LABOR FORCE [ PEOPLE ]
53.8%
PERCENT IN LABOR FORCE
Income in Pleasure Bend
Income Overview in Pleasure Bend
| Characteristic | Number | Measure |
| Per Capita Income | 271 | $32,106 |
| Median Family Income | 63 | $0 |
| Mean Family Income | 63 | $87,657 |
| Median Household Income | 98 | $72,981 |
| Mean Household Income | 98 | $77,980 |
| Income Deficit | 63 | $0 |
| Wage / Income Gap (%) | 271 | 0.00% |
| Wage / Income Gap ($) | 271 | 100.00¢ per $1 |
| Gini / Inequality Index | 271 | 0.28 |
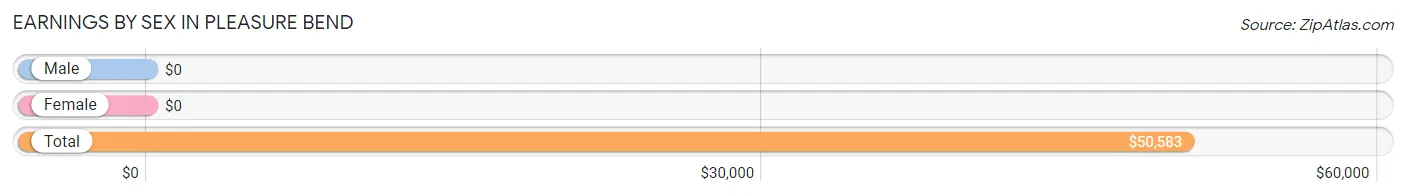
Earnings by Sex in Pleasure Bend
| Sex | Number | Average Earnings |
| Male | 34 (30.1%) | $0 |
| Female | 79 (69.9%) | $0 |
| Total | 113 (100.0%) | $50,583 |
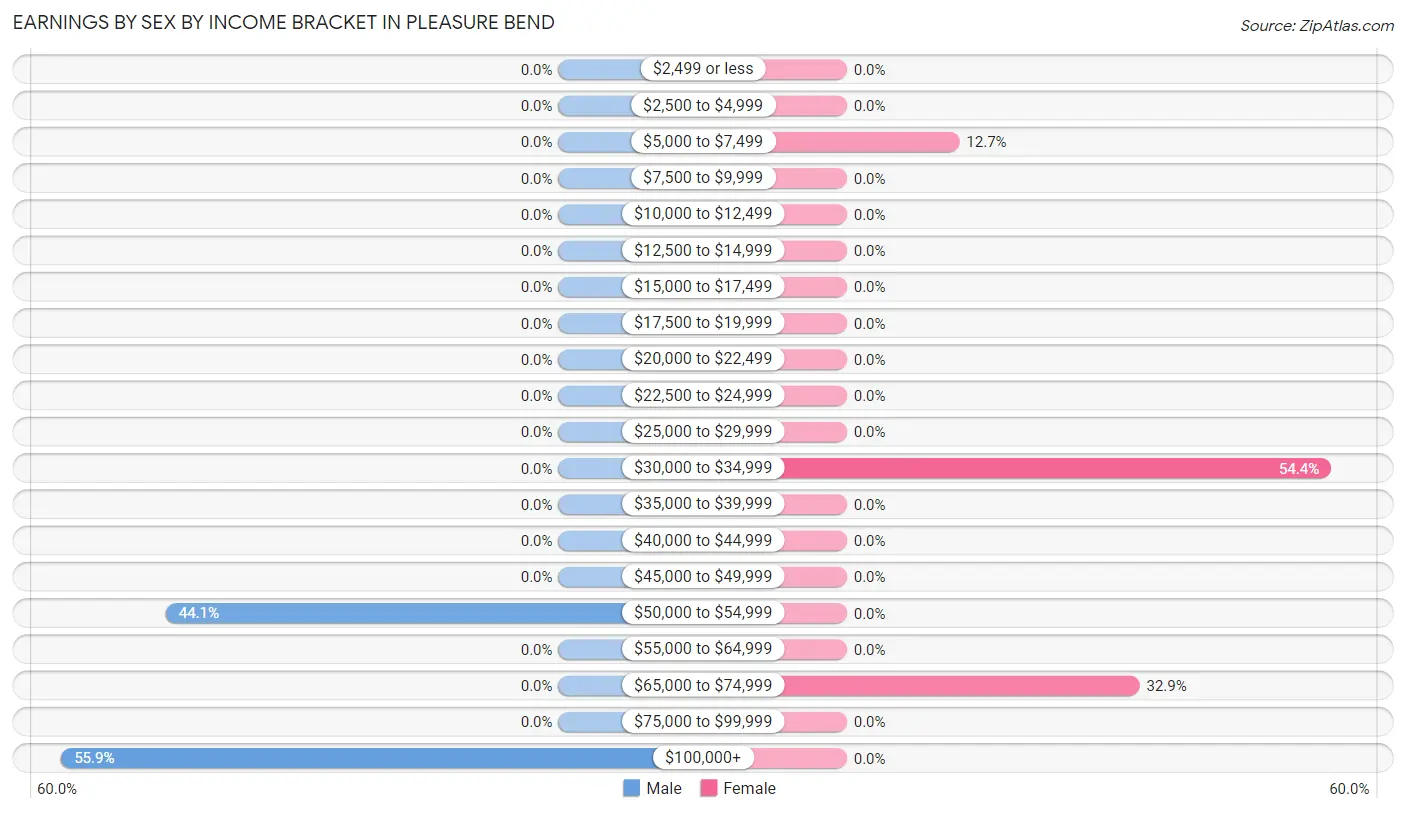
Earnings by Sex by Income Bracket in Pleasure Bend
The most common earnings brackets in Pleasure Bend are $100,000+ for men (19 | 55.9%) and $30,000 to $34,999 for women (43 | 54.4%).
| Income | Male | Female |
| $2,499 or less | 0 (0.0%) | 0 (0.0%) |
| $2,500 to $4,999 | 0 (0.0%) | 0 (0.0%) |
| $5,000 to $7,499 | 0 (0.0%) | 10 (12.7%) |
| $7,500 to $9,999 | 0 (0.0%) | 0 (0.0%) |
| $10,000 to $12,499 | 0 (0.0%) | 0 (0.0%) |
| $12,500 to $14,999 | 0 (0.0%) | 0 (0.0%) |
| $15,000 to $17,499 | 0 (0.0%) | 0 (0.0%) |
| $17,500 to $19,999 | 0 (0.0%) | 0 (0.0%) |
| $20,000 to $22,499 | 0 (0.0%) | 0 (0.0%) |
| $22,500 to $24,999 | 0 (0.0%) | 0 (0.0%) |
| $25,000 to $29,999 | 0 (0.0%) | 0 (0.0%) |
| $30,000 to $34,999 | 0 (0.0%) | 43 (54.4%) |
| $35,000 to $39,999 | 0 (0.0%) | 0 (0.0%) |
| $40,000 to $44,999 | 0 (0.0%) | 0 (0.0%) |
| $45,000 to $49,999 | 0 (0.0%) | 0 (0.0%) |
| $50,000 to $54,999 | 15 (44.1%) | 0 (0.0%) |
| $55,000 to $64,999 | 0 (0.0%) | 0 (0.0%) |
| $65,000 to $74,999 | 0 (0.0%) | 26 (32.9%) |
| $75,000 to $99,999 | 0 (0.0%) | 0 (0.0%) |
| $100,000+ | 19 (55.9%) | 0 (0.0%) |
| Total | 34 (100.0%) | 79 (100.0%) |
Earnings by Sex by Educational Attainment in Pleasure Bend
| Educational Attainment | Male Income | Female Income |
| Less than High School | - | - |
| High School Diploma | - | - |
| College or Associate's Degree | - | - |
| Bachelor's Degree | - | - |
| Graduate Degree | - | - |
| Total | - | - |
Family Income in Pleasure Bend
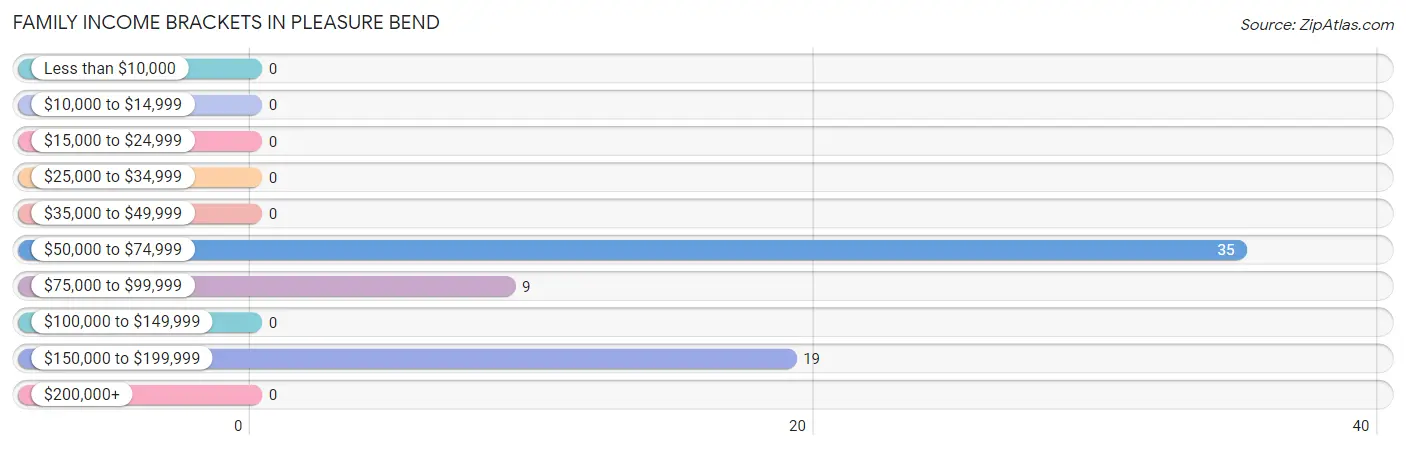
Family Income Brackets in Pleasure Bend
According to the Pleasure Bend family income data, there are 35 families falling into the $50,000 to $74,999 income range, which is the most common income bracket and makes up 55.6% of all families.
| Income Bracket | # Families | % Families |
| Less than $10,000 | 0 | 0.0% |
| $10,000 to $14,999 | 0 | 0.0% |
| $15,000 to $24,999 | 0 | 0.0% |
| $25,000 to $34,999 | 0 | 0.0% |
| $35,000 to $49,999 | 0 | 0.0% |
| $50,000 to $74,999 | 35 | 55.6% |
| $75,000 to $99,999 | 9 | 14.3% |
| $100,000 to $149,999 | 0 | 0.0% |
| $150,000 to $199,999 | 19 | 30.2% |
| $200,000+ | 0 | 0.0% |
Family Income by Famaliy Size in Pleasure Bend
| Income Bracket | # Families | Median Income |
| 2-Person Families | 54 (85.7%) | $0 |
| 3-Person Families | 0 (0.0%) | $0 |
| 4-Person Families | 0 (0.0%) | $0 |
| 5-Person Families | 0 (0.0%) | $0 |
| 6-Person Families | 0 (0.0%) | $0 |
| 7+ Person Families | 9 (14.3%) | $0 |
| Total | 63 (100.0%) | $0 |
Family Income by Number of Earners in Pleasure Bend
| Number of Earners | # Families | Median Income |
| No Earners | 35 (55.6%) | $0 |
| 1 Earner | 0 (0.0%) | $0 |
| 2 Earners | 28 (44.4%) | $0 |
| 3+ Earners | 0 (0.0%) | $0 |
| Total | 63 (100.0%) | $0 |
Household Income in Pleasure Bend
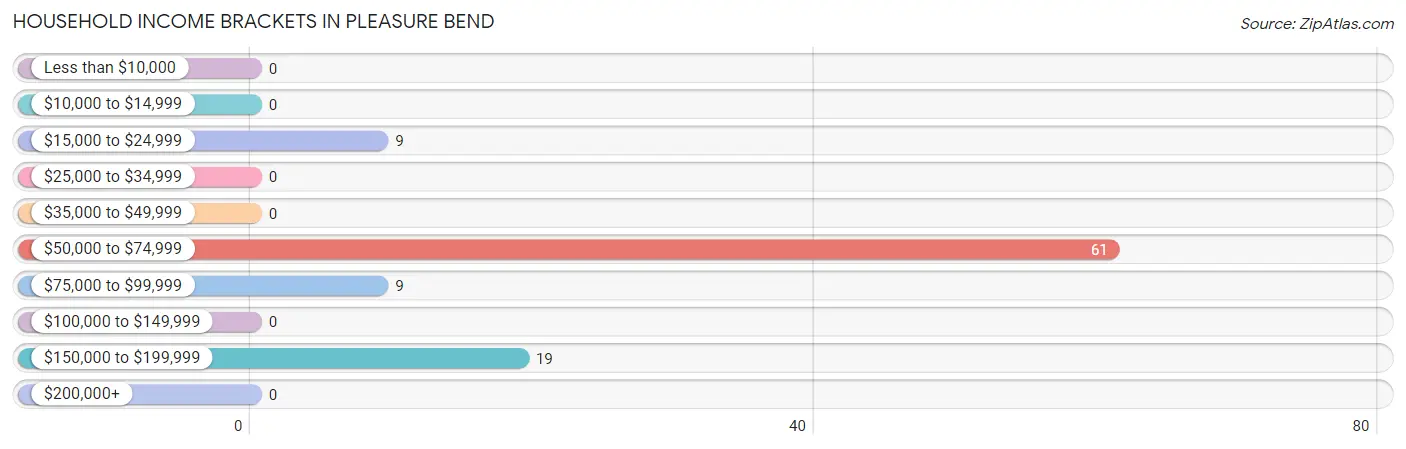
Household Income Brackets in Pleasure Bend
With 61 households falling in the category, the $50,000 to $74,999 income range is the most frequent in Pleasure Bend, accounting for 62.2% of all households.
| Income Bracket | # Households | % Households |
| Less than $10,000 | 0 | 0.0% |
| $10,000 to $14,999 | 0 | 0.0% |
| $15,000 to $24,999 | 9 | 9.2% |
| $25,000 to $34,999 | 0 | 0.0% |
| $35,000 to $49,999 | 0 | 0.0% |
| $50,000 to $74,999 | 61 | 62.2% |
| $75,000 to $99,999 | 9 | 9.2% |
| $100,000 to $149,999 | 0 | 0.0% |
| $150,000 to $199,999 | 19 | 19.4% |
| $200,000+ | 0 | 0.0% |
Household Income by Householder Age in Pleasure Bend
| Income Bracket | # Households | Median Income |
| 15 to 24 Years | 0 (0.0%) | $0 |
| 25 to 44 Years | 26 (26.5%) | $0 |
| 45 to 64 Years | 28 (28.6%) | $0 |
| 65+ Years | 44 (44.9%) | $0 |
| Total | 98 (100.0%) | $72,981 |
Poverty in Pleasure Bend
Income Below Poverty by Sex and Age in Pleasure Bend
| Age Bracket | Male | Female |
| Under 5 Years | 0 (0.0%) | 0 (0.0%) |
| 5 Years | 0 (0.0%) | 0 (0.0%) |
| 6 to 11 Years | 0 (0.0%) | 0 (0.0%) |
| 12 to 14 Years | 0 (0.0%) | 0 (0.0%) |
| 15 Years | 0 (0.0%) | 0 (0.0%) |
| 16 and 17 Years | 0 (0.0%) | 0 (0.0%) |
| 18 to 24 Years | 0 (0.0%) | 0 (0.0%) |
| 25 to 34 Years | 0 (0.0%) | 0 (0.0%) |
| 35 to 44 Years | 0 (0.0%) | 0 (0.0%) |
| 45 to 54 Years | 0 (0.0%) | 0 (0.0%) |
| 55 to 64 Years | 0 (0.0%) | 0 (0.0%) |
| 65 to 74 Years | 0 (0.0%) | 0 (0.0%) |
| 75 Years and over | 0 (0.0%) | 0 (0.0%) |
| Total | 0 (0.0%) | 0 (0.0%) |
Income Above Poverty by Sex and Age in Pleasure Bend
According to the poverty statistics in Pleasure Bend, males aged under 5 years and females aged 12 to 14 years are the age groups that are most secure financially, with 100.0% of males and 100.0% of females in these age groups living above the poverty line.
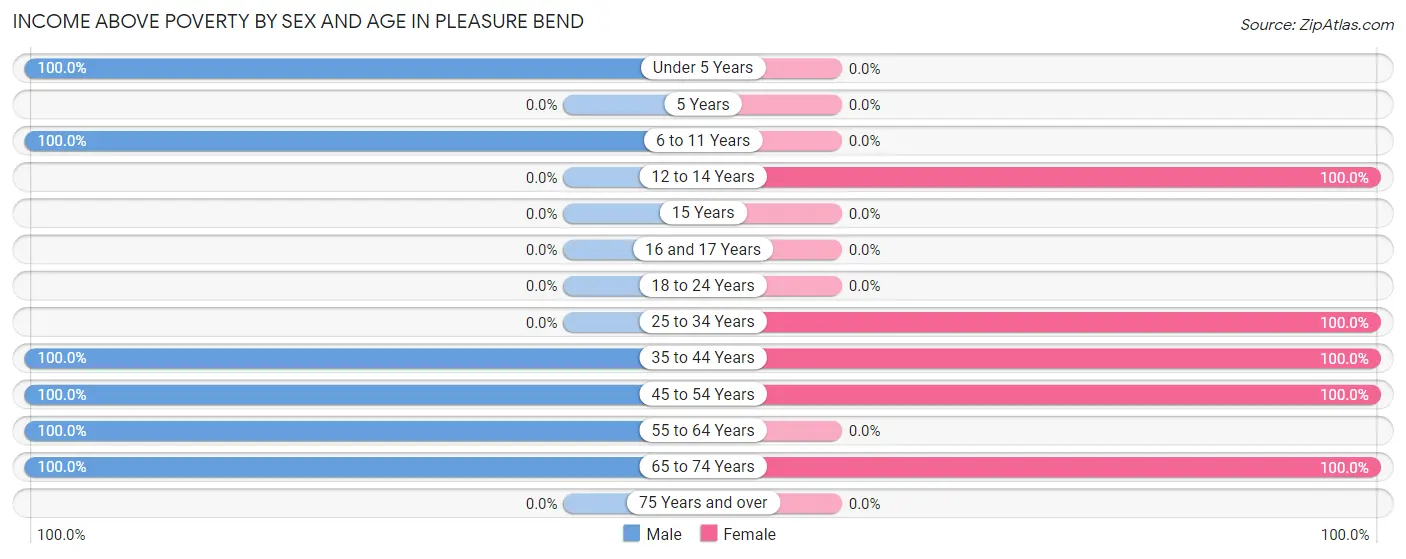
| Age Bracket | Male | Female |
| Under 5 Years | 9 (100.0%) | 0 (0.0%) |
| 5 Years | 0 (0.0%) | 0 (0.0%) |
| 6 to 11 Years | 41 (100.0%) | 0 (0.0%) |
| 12 to 14 Years | 0 (0.0%) | 11 (100.0%) |
| 15 Years | 0 (0.0%) | 0 (0.0%) |
| 16 and 17 Years | 0 (0.0%) | 0 (0.0%) |
| 18 to 24 Years | 0 (0.0%) | 0 (0.0%) |
| 25 to 34 Years | 0 (0.0%) | 26 (100.0%) |
| 35 to 44 Years | 15 (100.0%) | 10 (100.0%) |
| 45 to 54 Years | 19 (100.0%) | 43 (100.0%) |
| 55 to 64 Years | 9 (100.0%) | 0 (0.0%) |
| 65 to 74 Years | 44 (100.0%) | 44 (100.0%) |
| 75 Years and over | 0 (0.0%) | 0 (0.0%) |
| Total | 137 (100.0%) | 134 (100.0%) |
Income Below Poverty Among Married-Couple Families in Pleasure Bend
| Children | Above Poverty | Below Poverty |
| No Children | 54 (100.0%) | 0 (0.0%) |
| 1 or 2 Children | 0 (0.0%) | 0 (0.0%) |
| 3 or 4 Children | 9 (100.0%) | 0 (0.0%) |
| 5 or more Children | 0 (0.0%) | 0 (0.0%) |
| Total | 63 (100.0%) | 0 (0.0%) |
Income Below Poverty Among Single-Parent Households in Pleasure Bend
| Children | Single Father | Single Mother |
| No Children | 0 (0.0%) | 0 (0.0%) |
| 1 or 2 Children | 0 (0.0%) | 0 (0.0%) |
| 3 or 4 Children | 0 (0.0%) | 0 (0.0%) |
| 5 or more Children | 0 (0.0%) | 0 (0.0%) |
| Total | 0 (0.0%) | 0 (0.0%) |
Income Below Poverty Among Married-Couple vs Single-Parent Households in Pleasure Bend
| Children | Married-Couple Families | Single-Parent Households |
| No Children | 0 (0.0%) | 0 (0.0%) |
| 1 or 2 Children | 0 (0.0%) | 0 (0.0%) |
| 3 or 4 Children | 0 (0.0%) | 0 (0.0%) |
| 5 or more Children | 0 (0.0%) | 0 (0.0%) |
| Total | 0 (0.0%) | 0 (0.0%) |
Race in Pleasure Bend
The most populous races in Pleasure Bend are , and White / Caucasian (271 | 100.0%).
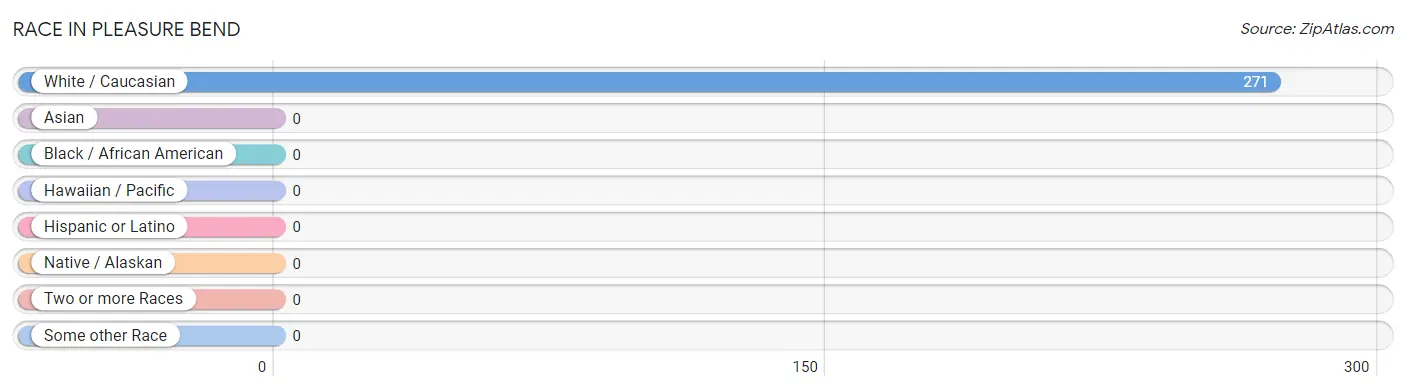
| Race | # Population | % Population |
| Asian | 0 | 0.0% |
| Black / African American | 0 | 0.0% |
| Hawaiian / Pacific | 0 | 0.0% |
| Hispanic or Latino | 0 | 0.0% |
| Native / Alaskan | 0 | 0.0% |
| White / Caucasian | 271 | 100.0% |
| Two or more Races | 0 | 0.0% |
| Some other Race | 0 | 0.0% |
| Total | 271 | 100.0% |
Ancestry in Pleasure Bend
The most populous ancestries reported in Pleasure Bend are American (70 | 25.8%), English (62 | 22.9%), Dutch (9 | 3.3%), and Irish (9 | 3.3%), together accounting for 55.3% of all Pleasure Bend residents.

| Ancestry | # Population | % Population |
| American | 70 | 25.8% |
| Dutch | 9 | 3.3% |
| English | 62 | 22.9% |
| Irish | 9 | 3.3% | View All 4 Rows |
Immigrants in Pleasure Bend

| Immigration Origin | # Population | % Population | View All 0 Rows |
Sex and Age in Pleasure Bend
Sex and Age in Pleasure Bend
The most populous age groups in Pleasure Bend are 70 to 74 Years (44 | 32.1%) for men and 50 to 54 Years (43 | 32.1%) for women.
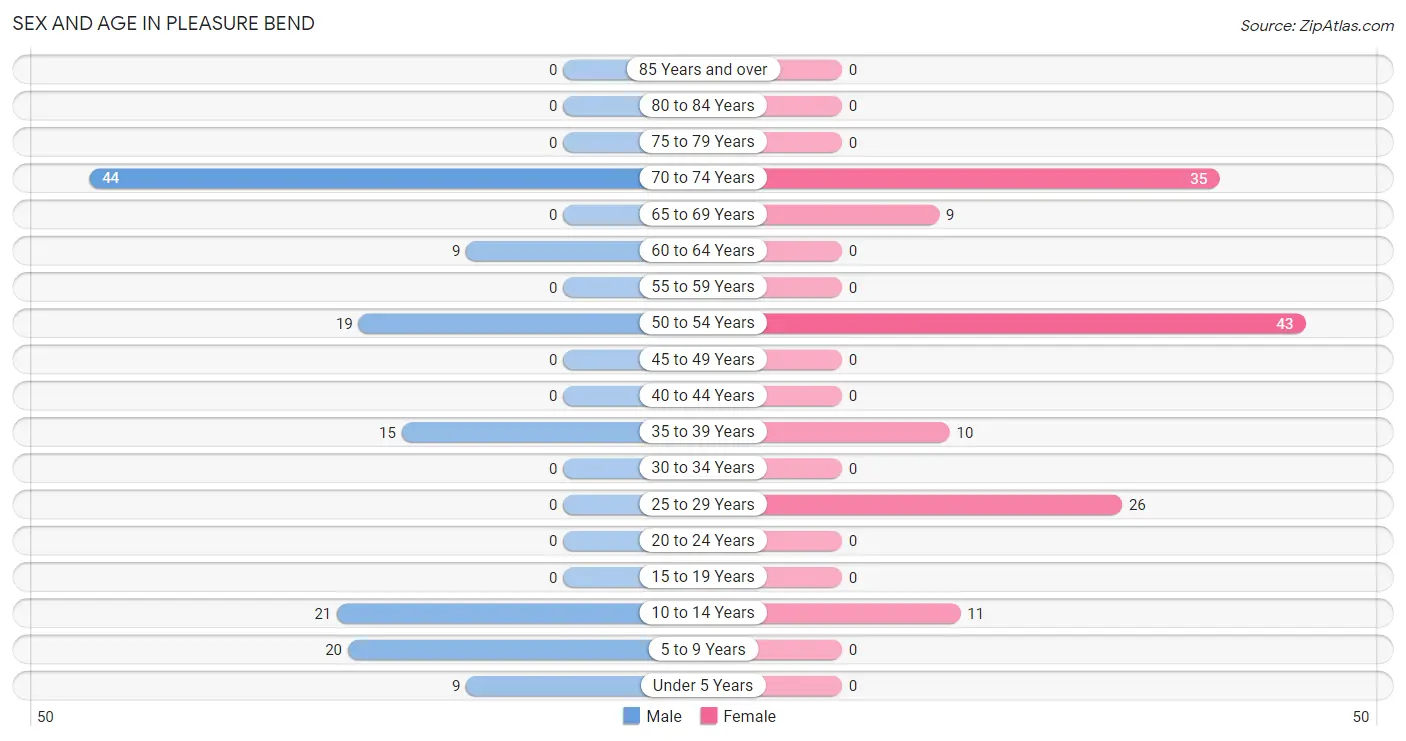
| Age Bracket | Male | Female |
| Under 5 Years | 9 (6.6%) | 0 (0.0%) |
| 5 to 9 Years | 20 (14.6%) | 0 (0.0%) |
| 10 to 14 Years | 21 (15.3%) | 11 (8.2%) |
| 15 to 19 Years | 0 (0.0%) | 0 (0.0%) |
| 20 to 24 Years | 0 (0.0%) | 0 (0.0%) |
| 25 to 29 Years | 0 (0.0%) | 26 (19.4%) |
| 30 to 34 Years | 0 (0.0%) | 0 (0.0%) |
| 35 to 39 Years | 15 (11.0%) | 10 (7.5%) |
| 40 to 44 Years | 0 (0.0%) | 0 (0.0%) |
| 45 to 49 Years | 0 (0.0%) | 0 (0.0%) |
| 50 to 54 Years | 19 (13.9%) | 43 (32.1%) |
| 55 to 59 Years | 0 (0.0%) | 0 (0.0%) |
| 60 to 64 Years | 9 (6.6%) | 0 (0.0%) |
| 65 to 69 Years | 0 (0.0%) | 9 (6.7%) |
| 70 to 74 Years | 44 (32.1%) | 35 (26.1%) |
| 75 to 79 Years | 0 (0.0%) | 0 (0.0%) |
| 80 to 84 Years | 0 (0.0%) | 0 (0.0%) |
| 85 Years and over | 0 (0.0%) | 0 (0.0%) |
| Total | 137 (100.0%) | 134 (100.0%) |
Families and Households in Pleasure Bend
Median Family Size in Pleasure Bend
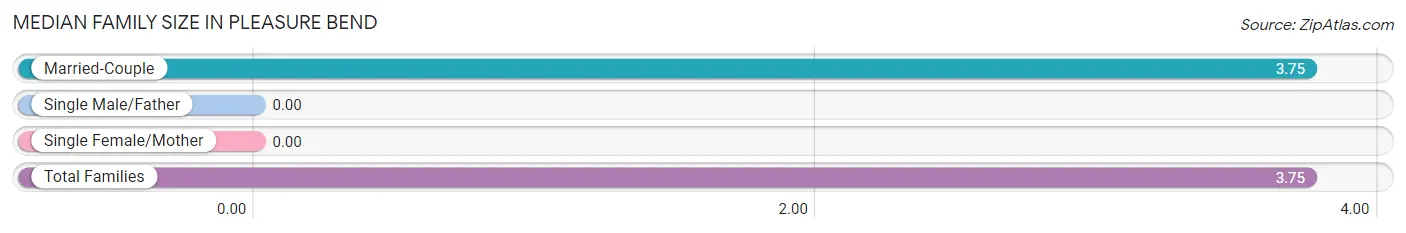
| Family Type | # Families | Family Size |
| Married-Couple | 63 (100.0%) | 3.75 |
| Single Male/Father | 0 (0.0%) | - |
| Single Female/Mother | 0 (0.0%) | - |
| Total Families | 63 (100.0%) | 3.75 |
Median Household Size in Pleasure Bend
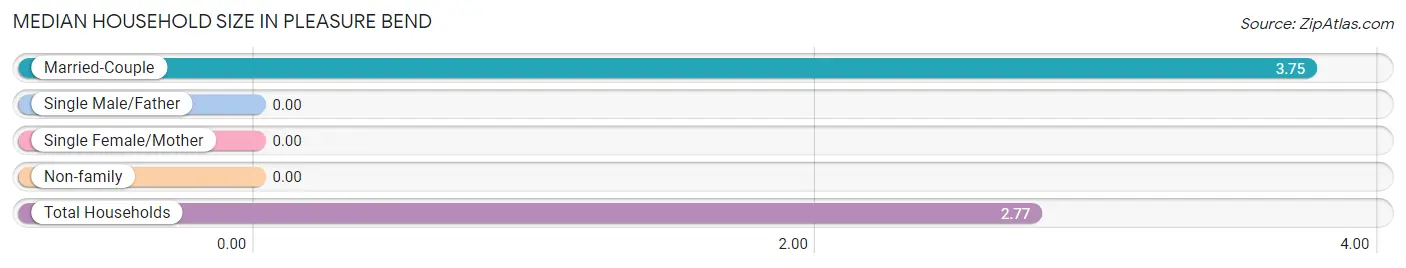
| Household Type | # Households | Household Size |
| Married-Couple | 63 (64.3%) | 3.75 |
| Single Male/Father | 0 (0.0%) | - |
| Single Female/Mother | 0 (0.0%) | - |
| Non-family | 35 (35.7%) | - |
| Total Households | 98 (100.0%) | 2.77 |
Household Size by Marriage Status in Pleasure Bend
Out of a total of 98 households in Pleasure Bend, 63 (64.3%) are family households, while 35 (35.7%) are nonfamily households. The most numerous type of family households are 2-person households, comprising 54, and the most common type of nonfamily households are 1-person households, comprising 35.
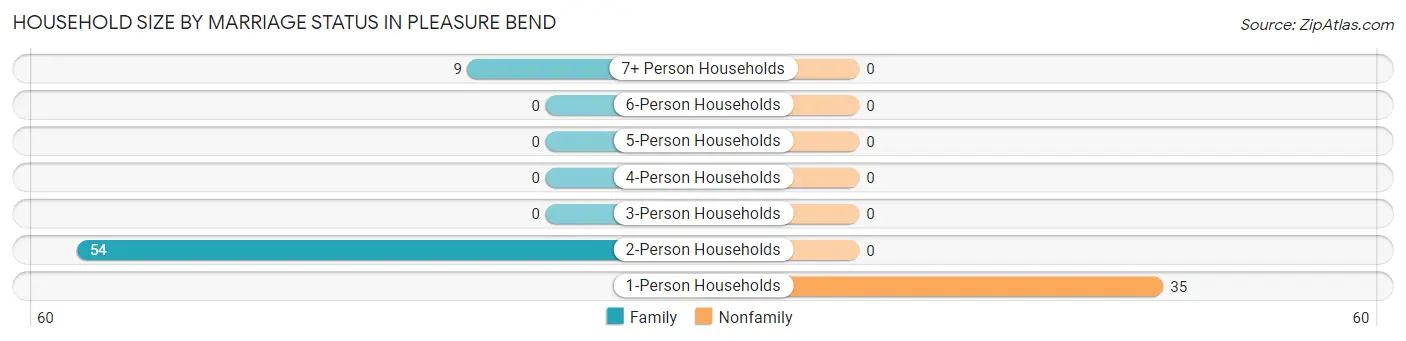
| Household Size | Family Households | Nonfamily Households |
| 1-Person Households | - | 35 (35.7%) |
| 2-Person Households | 54 (55.1%) | 0 (0.0%) |
| 3-Person Households | 0 (0.0%) | 0 (0.0%) |
| 4-Person Households | 0 (0.0%) | 0 (0.0%) |
| 5-Person Households | 0 (0.0%) | 0 (0.0%) |
| 6-Person Households | 0 (0.0%) | 0 (0.0%) |
| 7+ Person Households | 9 (9.2%) | 0 (0.0%) |
| Total | 63 (64.3%) | 35 (35.7%) |
Female Fertility in Pleasure Bend
Fertility by Age in Pleasure Bend
Average fertility rate in Pleasure Bend is 278.0 births per 1,000 women. Women in the age bracket of 35 to 50 years have the highest fertility rate with 1,000.0 births per 1,000 women. Women in the age bracket of 35 to 50 years acount for 100.0% of all women with births.
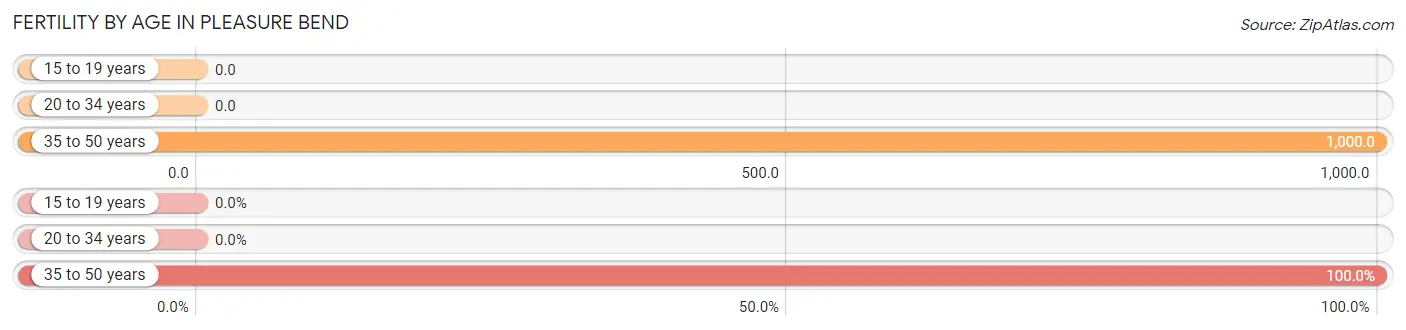
| Age Bracket | Women with Births | Births / 1,000 Women |
| 15 to 19 years | 0 (0.0%) | 0.0 |
| 20 to 34 years | 0 (0.0%) | 0.0 |
| 35 to 50 years | 10 (100.0%) | 1,000.0 |
| Total | 10 (100.0%) | 278.0 |
Fertility by Age by Marriage Status in Pleasure Bend
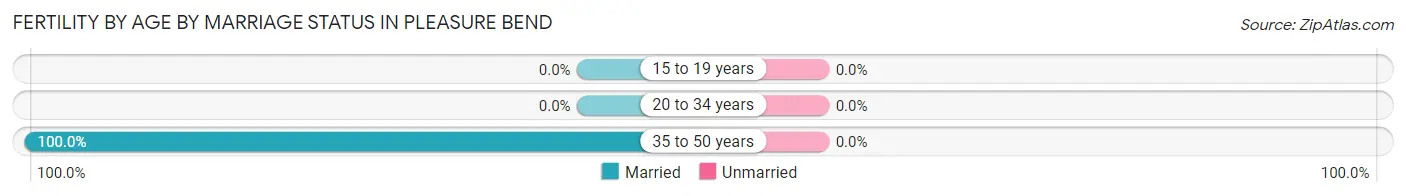
| Age Bracket | Married | Unmarried |
| 15 to 19 years | 0 (0.0%) | 0 (0.0%) |
| 20 to 34 years | 0 (0.0%) | 0 (0.0%) |
| 35 to 50 years | 10 (100.0%) | 0 (0.0%) |
| Total | 10 (100.0%) | 0 (0.0%) |
Fertility by Education in Pleasure Bend
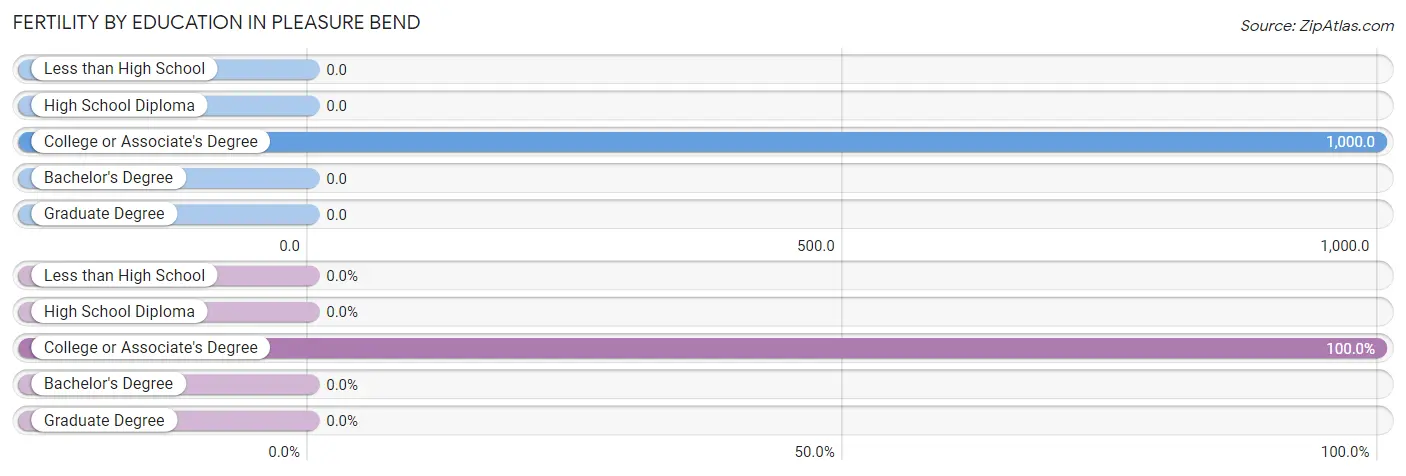
| Educational Attainment | Women with Births | Births / 1,000 Women |
| Less than High School | 0 (0.0%) | 0.0 |
| High School Diploma | 0 (0.0%) | 0.0 |
| College or Associate's Degree | 10 (100.0%) | 1,000.0 |
| Bachelor's Degree | 0 (0.0%) | 0.0 |
| Graduate Degree | 0 (0.0%) | 0.0 |
| Total | 10 (100.0%) | 278.0 |
Fertility by Education by Marriage Status in Pleasure Bend
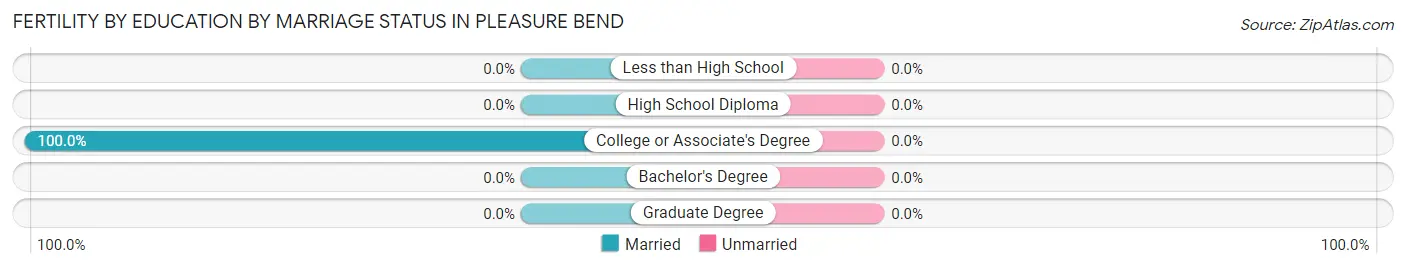
| Educational Attainment | Married | Unmarried |
| Less than High School | 0 (0.0%) | 0 (0.0%) |
| High School Diploma | 0 (0.0%) | 0 (0.0%) |
| College or Associate's Degree | 10 (100.0%) | 0 (0.0%) |
| Bachelor's Degree | 0 (0.0%) | 0 (0.0%) |
| Graduate Degree | 0 (0.0%) | 0 (0.0%) |
| Total | 10 (100.0%) | 0 (0.0%) |
Employment Characteristics in Pleasure Bend
Employment by Class of Employer in Pleasure Bend
Among the 113 employed individuals in Pleasure Bend, local government employees (69 | 61.1%), and private company employees (44 | 38.9%) make up the most common classes of employment.
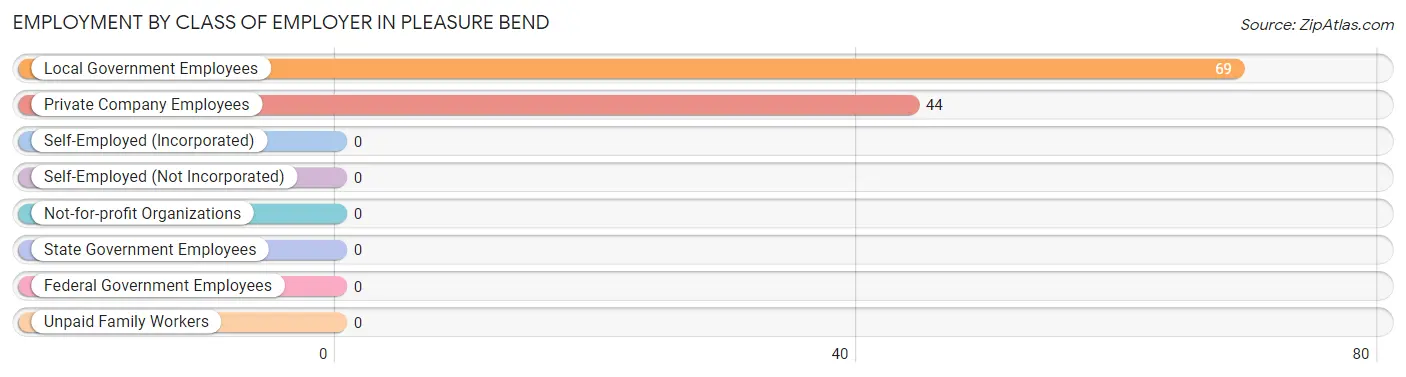
| Employer Class | # Employees | % Employees |
| Private Company Employees | 44 | 38.9% |
| Self-Employed (Incorporated) | 0 | 0.0% |
| Self-Employed (Not Incorporated) | 0 | 0.0% |
| Not-for-profit Organizations | 0 | 0.0% |
| Local Government Employees | 69 | 61.1% |
| State Government Employees | 0 | 0.0% |
| Federal Government Employees | 0 | 0.0% |
| Unpaid Family Workers | 0 | 0.0% |
| Total | 113 | 100.0% |
Employment Status by Age in Pleasure Bend
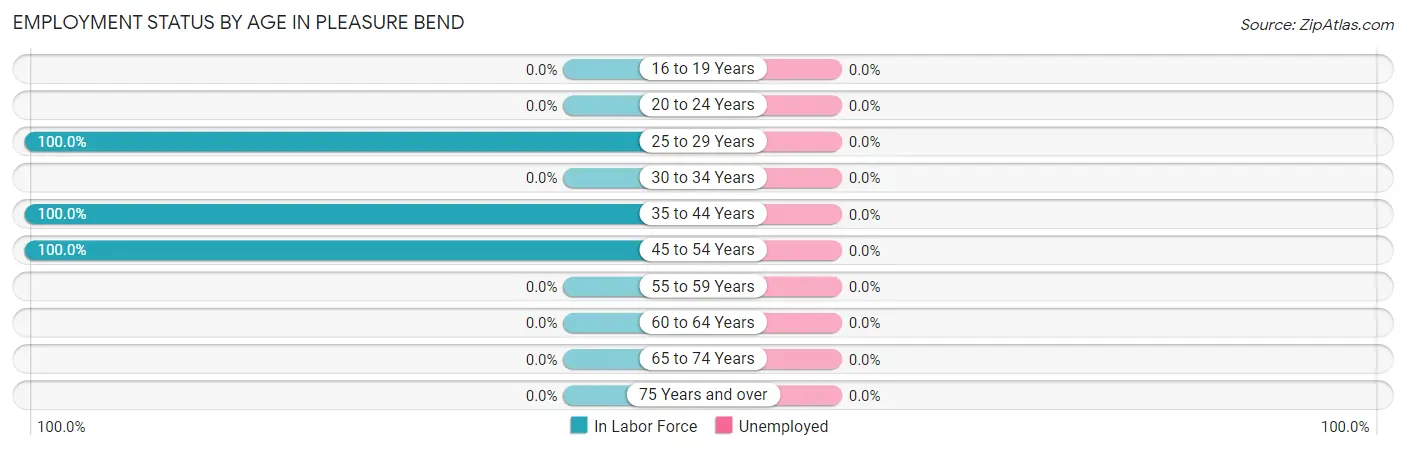
| Age Bracket | In Labor Force | Unemployed |
| 16 to 19 Years | 0 (0.0%) | 0 (0.0%) |
| 20 to 24 Years | 0 (0.0%) | 0 (0.0%) |
| 25 to 29 Years | 26 (100.0%) | 0 (0.0%) |
| 30 to 34 Years | 0 (0.0%) | 0 (0.0%) |
| 35 to 44 Years | 25 (100.0%) | 0 (0.0%) |
| 45 to 54 Years | 62 (100.0%) | 0 (0.0%) |
| 55 to 59 Years | 0 (0.0%) | 0 (0.0%) |
| 60 to 64 Years | 0 (0.0%) | 0 (0.0%) |
| 65 to 74 Years | 0 (0.0%) | 0 (0.0%) |
| 75 Years and over | 0 (0.0%) | 0 (0.0%) |
| Total | 113 (53.8%) | 0 (0.0%) |
Employment Status by Educational Attainment in Pleasure Bend
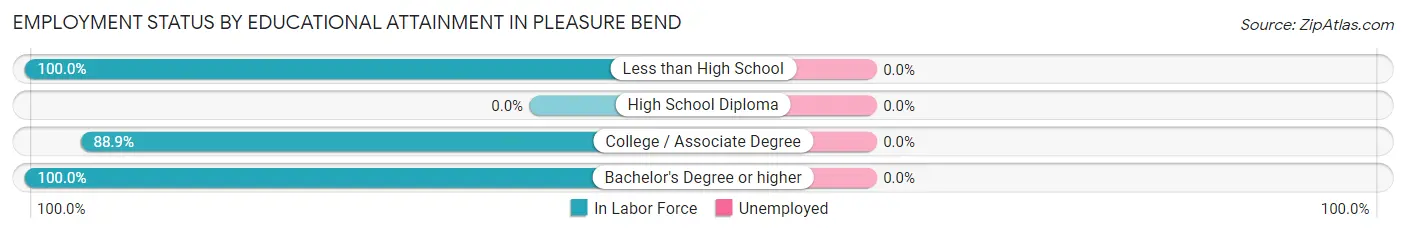
| Educational Attainment | In Labor Force | Unemployed |
| Less than High School | 15 (100.0%) | 0 (0.0%) |
| High School Diploma | 0 (0.0%) | 0 (0.0%) |
| College / Associate Degree | 72 (88.9%) | 0 (0.0%) |
| Bachelor's Degree or higher | 26 (100.0%) | 0 (0.0%) |
| Total | 113 (92.6%) | 0 (0.0%) |
Employment Occupations by Sex in Pleasure Bend
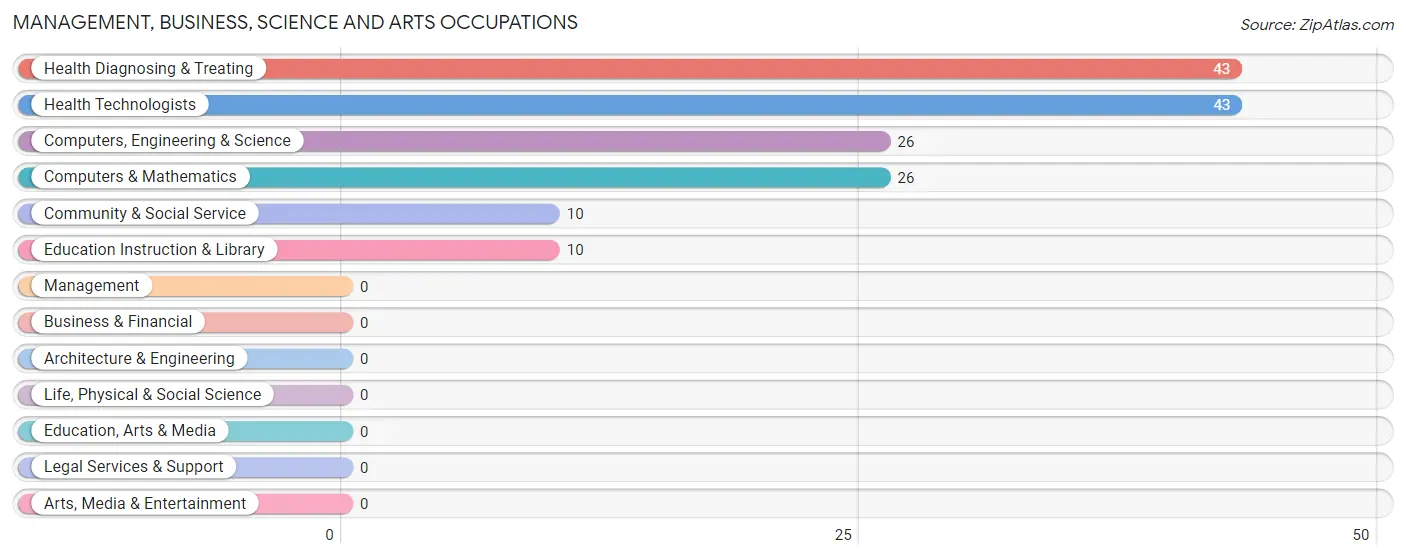
Management, Business, Science and Arts Occupations
The most common Management, Business, Science and Arts occupations in Pleasure Bend are Health Diagnosing & Treating (43 | 38.1%), Health Technologists (43 | 38.1%), Computers, Engineering & Science (26 | 23.0%), Computers & Mathematics (26 | 23.0%), and Community & Social Service (10 | 8.8%).
Management, Business, Science and Arts Occupations by Sex
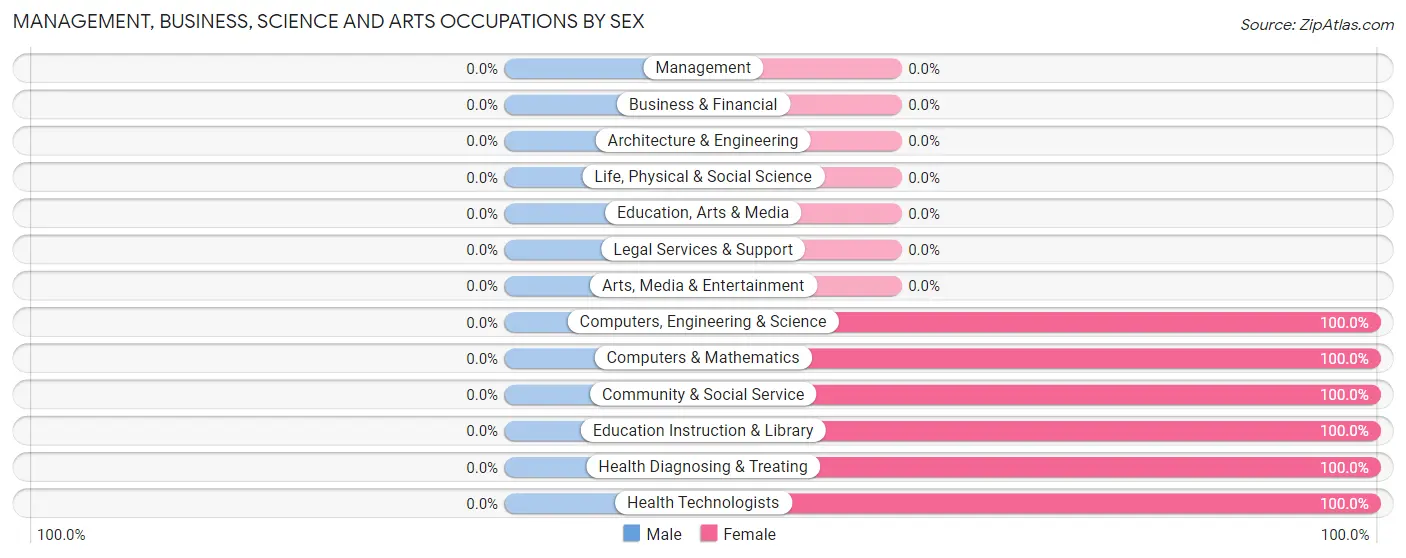
| Occupation | Male | Female |
| Management | 0 (0.0%) | 0 (0.0%) |
| Business & Financial | 0 (0.0%) | 0 (0.0%) |
| Computers, Engineering & Science | 0 (0.0%) | 26 (100.0%) |
| Computers & Mathematics | 0 (0.0%) | 26 (100.0%) |
| Architecture & Engineering | 0 (0.0%) | 0 (0.0%) |
| Life, Physical & Social Science | 0 (0.0%) | 0 (0.0%) |
| Community & Social Service | 0 (0.0%) | 10 (100.0%) |
| Education, Arts & Media | 0 (0.0%) | 0 (0.0%) |
| Legal Services & Support | 0 (0.0%) | 0 (0.0%) |
| Education Instruction & Library | 0 (0.0%) | 10 (100.0%) |
| Arts, Media & Entertainment | 0 (0.0%) | 0 (0.0%) |
| Health Diagnosing & Treating | 0 (0.0%) | 43 (100.0%) |
| Health Technologists | 0 (0.0%) | 43 (100.0%) |
| Total (Category) | 0 (0.0%) | 79 (100.0%) |
| Total (Overall) | 34 (30.1%) | 79 (69.9%) |
Services Occupations
Services Occupations by Sex
| Occupation | Male | Female |
| Healthcare Support | 0 (0.0%) | 0 (0.0%) |
| Security & Protection | 0 (0.0%) | 0 (0.0%) |
| Firefighting & Prevention | 0 (0.0%) | 0 (0.0%) |
| Law Enforcement | 0 (0.0%) | 0 (0.0%) |
| Food Preparation & Serving | 0 (0.0%) | 0 (0.0%) |
| Cleaning & Maintenance | 0 (0.0%) | 0 (0.0%) |
| Personal Care & Service | 0 (0.0%) | 0 (0.0%) |
| Total (Category) | 0 (0.0%) | 0 (0.0%) |
| Total (Overall) | 34 (30.1%) | 79 (69.9%) |
Sales and Office Occupations
Sales and Office Occupations by Sex
| Occupation | Male | Female |
| Sales & Related | 0 (0.0%) | 0 (0.0%) |
| Office & Administration | 0 (0.0%) | 0 (0.0%) |
| Total (Category) | 0 (0.0%) | 0 (0.0%) |
| Total (Overall) | 34 (30.1%) | 79 (69.9%) |
Natural Resources, Construction and Maintenance Occupations
The most common Natural Resources, Construction and Maintenance occupations in Pleasure Bend are Installation, Maintenance & Repair (19 | 16.8%), and Construction & Extraction (15 | 13.3%).
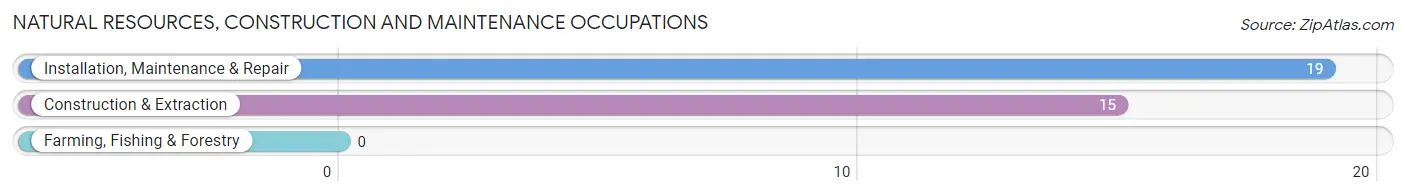
Natural Resources, Construction and Maintenance Occupations by Sex
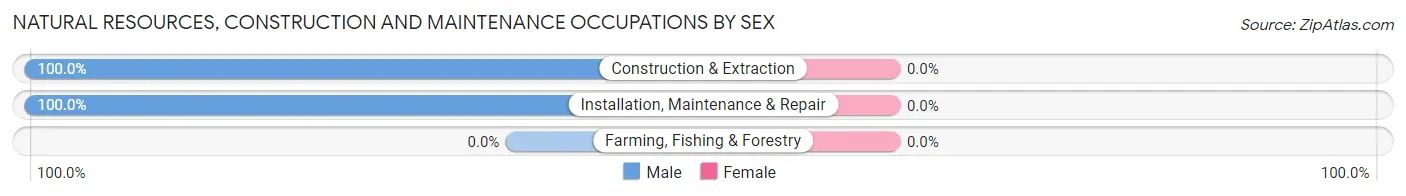
| Occupation | Male | Female |
| Farming, Fishing & Forestry | 0 (0.0%) | 0 (0.0%) |
| Construction & Extraction | 15 (100.0%) | 0 (0.0%) |
| Installation, Maintenance & Repair | 19 (100.0%) | 0 (0.0%) |
| Total (Category) | 34 (100.0%) | 0 (0.0%) |
| Total (Overall) | 34 (30.1%) | 79 (69.9%) |
Production, Transportation and Moving Occupations
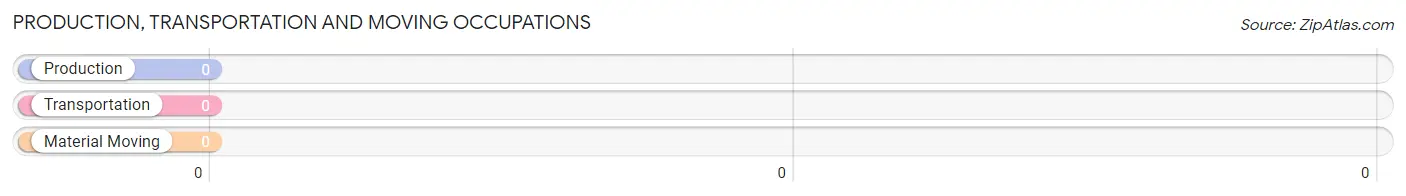
Production, Transportation and Moving Occupations by Sex
| Occupation | Male | Female |
| Production | 0 (0.0%) | 0 (0.0%) |
| Transportation | 0 (0.0%) | 0 (0.0%) |
| Material Moving | 0 (0.0%) | 0 (0.0%) |
| Total (Category) | 0 (0.0%) | 0 (0.0%) |
| Total (Overall) | 34 (30.1%) | 79 (69.9%) |
Employment Industries by Sex in Pleasure Bend
Employment Industries in Pleasure Bend
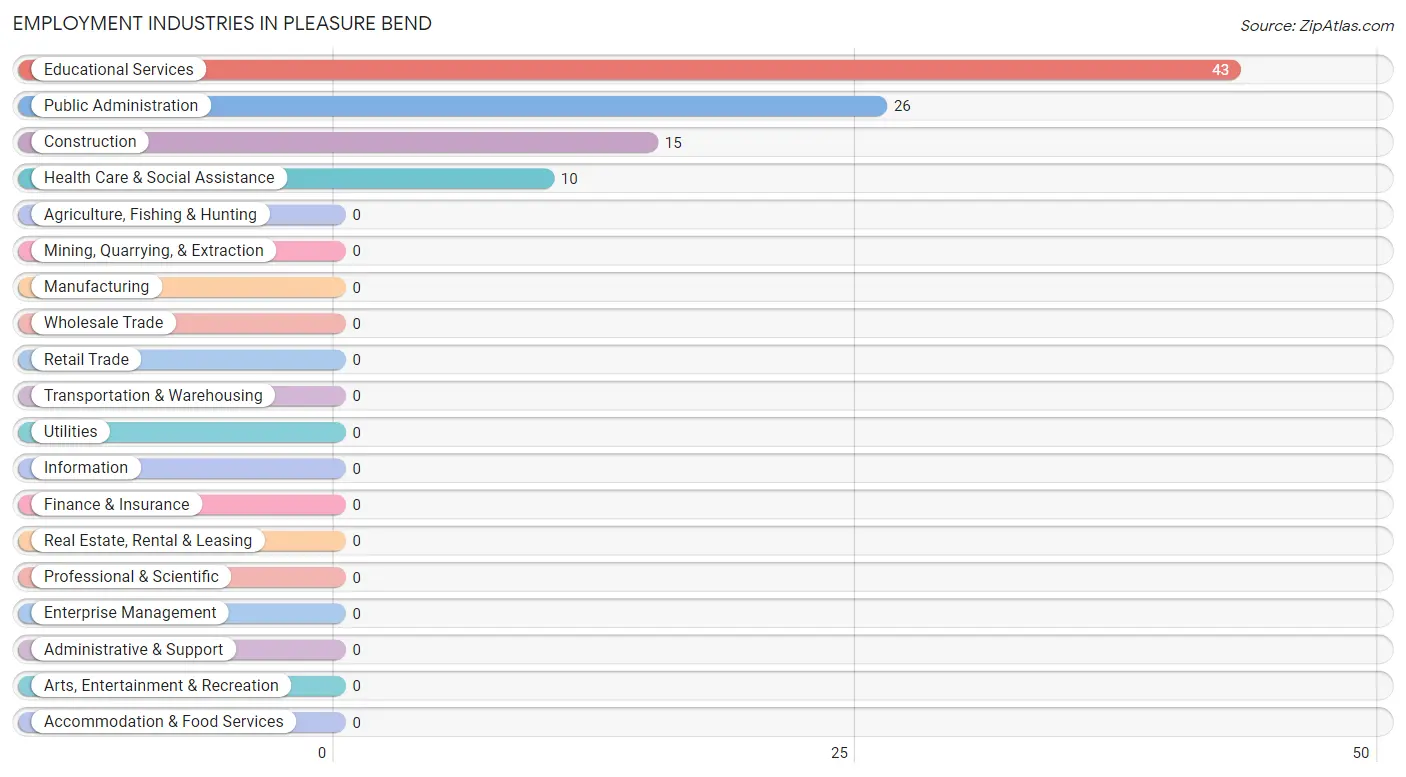
The major employment industries in Pleasure Bend include Educational Services (43 | 38.1%), Public Administration (26 | 23.0%), Construction (15 | 13.3%), and Health Care & Social Assistance (10 | 8.8%).
Employment Industries by Sex in Pleasure Bend
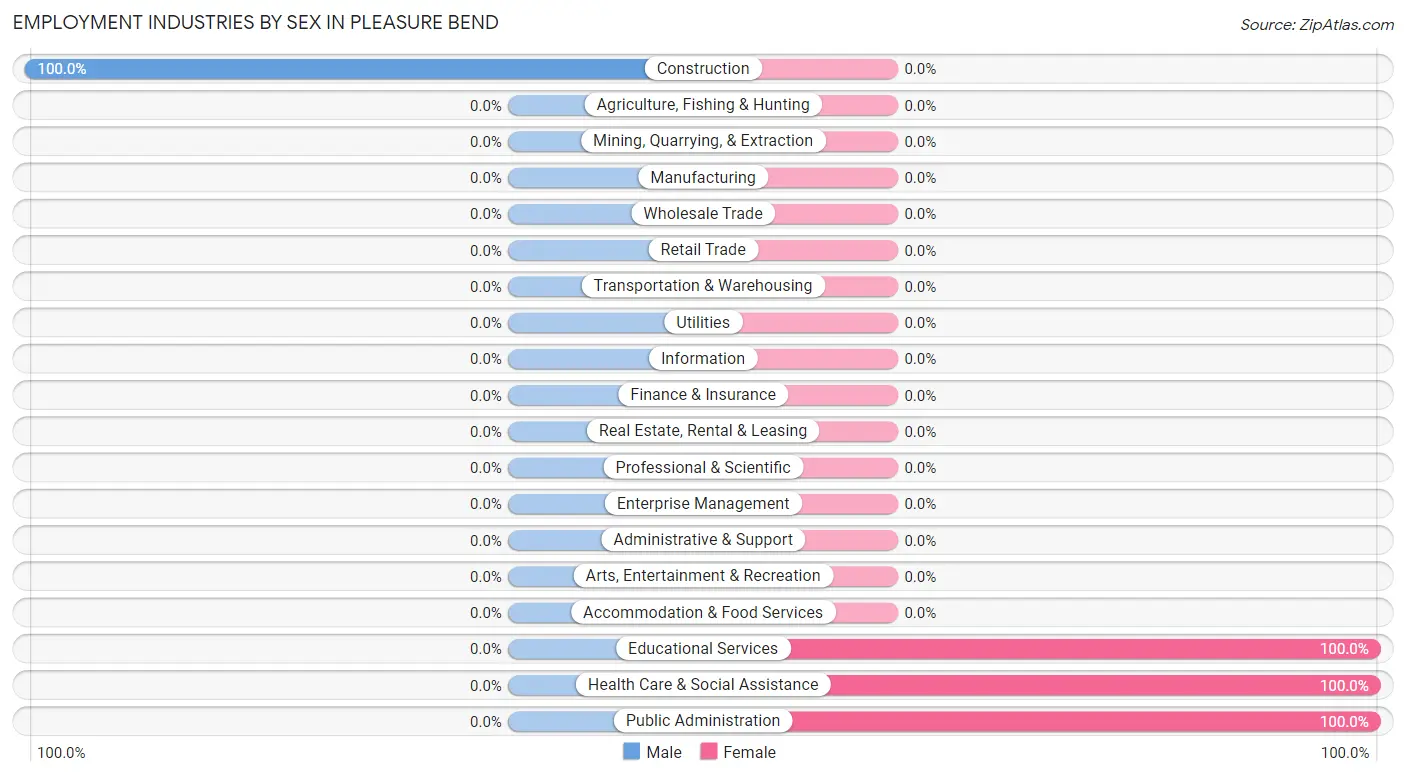
| Industry | Male | Female |
| Agriculture, Fishing & Hunting | 0 (0.0%) | 0 (0.0%) |
| Mining, Quarrying, & Extraction | 0 (0.0%) | 0 (0.0%) |
| Construction | 15 (100.0%) | 0 (0.0%) |
| Manufacturing | 0 (0.0%) | 0 (0.0%) |
| Wholesale Trade | 0 (0.0%) | 0 (0.0%) |
| Retail Trade | 0 (0.0%) | 0 (0.0%) |
| Transportation & Warehousing | 0 (0.0%) | 0 (0.0%) |
| Utilities | 0 (0.0%) | 0 (0.0%) |
| Information | 0 (0.0%) | 0 (0.0%) |
| Finance & Insurance | 0 (0.0%) | 0 (0.0%) |
| Real Estate, Rental & Leasing | 0 (0.0%) | 0 (0.0%) |
| Professional & Scientific | 0 (0.0%) | 0 (0.0%) |
| Enterprise Management | 0 (0.0%) | 0 (0.0%) |
| Administrative & Support | 0 (0.0%) | 0 (0.0%) |
| Educational Services | 0 (0.0%) | 43 (100.0%) |
| Health Care & Social Assistance | 0 (0.0%) | 10 (100.0%) |
| Arts, Entertainment & Recreation | 0 (0.0%) | 0 (0.0%) |
| Accommodation & Food Services | 0 (0.0%) | 0 (0.0%) |
| Public Administration | 0 (0.0%) | 26 (100.0%) |
| Total | 34 (30.1%) | 79 (69.9%) |
Education in Pleasure Bend
School Enrollment in Pleasure Bend
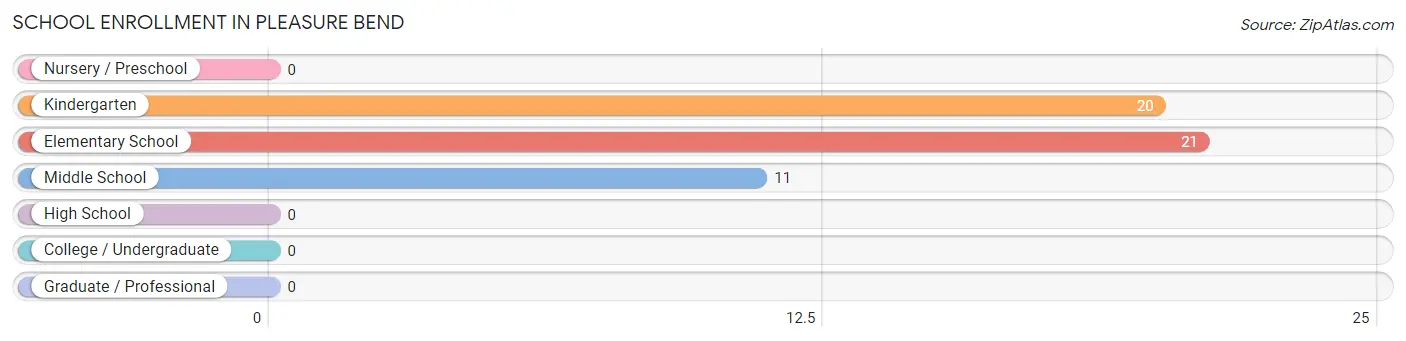
The most common levels of schooling among the 52 students in Pleasure Bend are elementary school (21 | 40.4%), kindergarten (20 | 38.5%), and middle school (11 | 21.1%).
| School Level | # Students | % Students |
| Nursery / Preschool | 0 | 0.0% |
| Kindergarten | 20 | 38.5% |
| Elementary School | 21 | 40.4% |
| Middle School | 11 | 21.1% |
| High School | 0 | 0.0% |
| College / Undergraduate | 0 | 0.0% |
| Graduate / Professional | 0 | 0.0% |
| Total | 52 | 100.0% |
School Enrollment by Age by Funding Source in Pleasure Bend
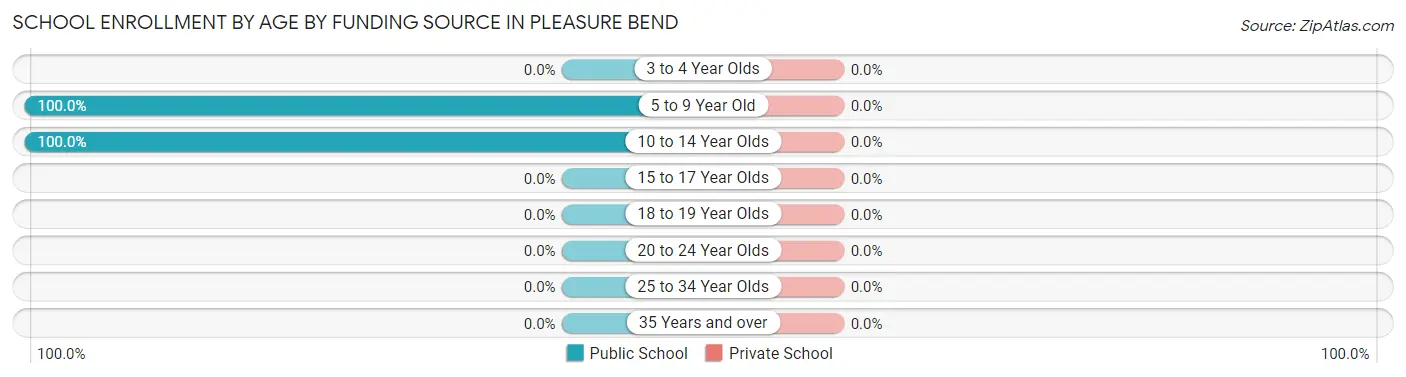
| Age Bracket | Public School | Private School |
| 3 to 4 Year Olds | 0 (0.0%) | 0 (0.0%) |
| 5 to 9 Year Old | 20 (100.0%) | 0 (0.0%) |
| 10 to 14 Year Olds | 32 (100.0%) | 0 (0.0%) |
| 15 to 17 Year Olds | 0 (0.0%) | 0 (0.0%) |
| 18 to 19 Year Olds | 0 (0.0%) | 0 (0.0%) |
| 20 to 24 Year Olds | 0 (0.0%) | 0 (0.0%) |
| 25 to 34 Year Olds | 0 (0.0%) | 0 (0.0%) |
| 35 Years and over | 0 (0.0%) | 0 (0.0%) |
| Total | 52 (100.0%) | 0 (0.0%) |
Educational Attainment by Field of Study in Pleasure Bend
, and computers & mathematics (26 | 100.0%) are the most common fields of study among 26 individuals in Pleasure Bend who have obtained a bachelor's degree or higher.
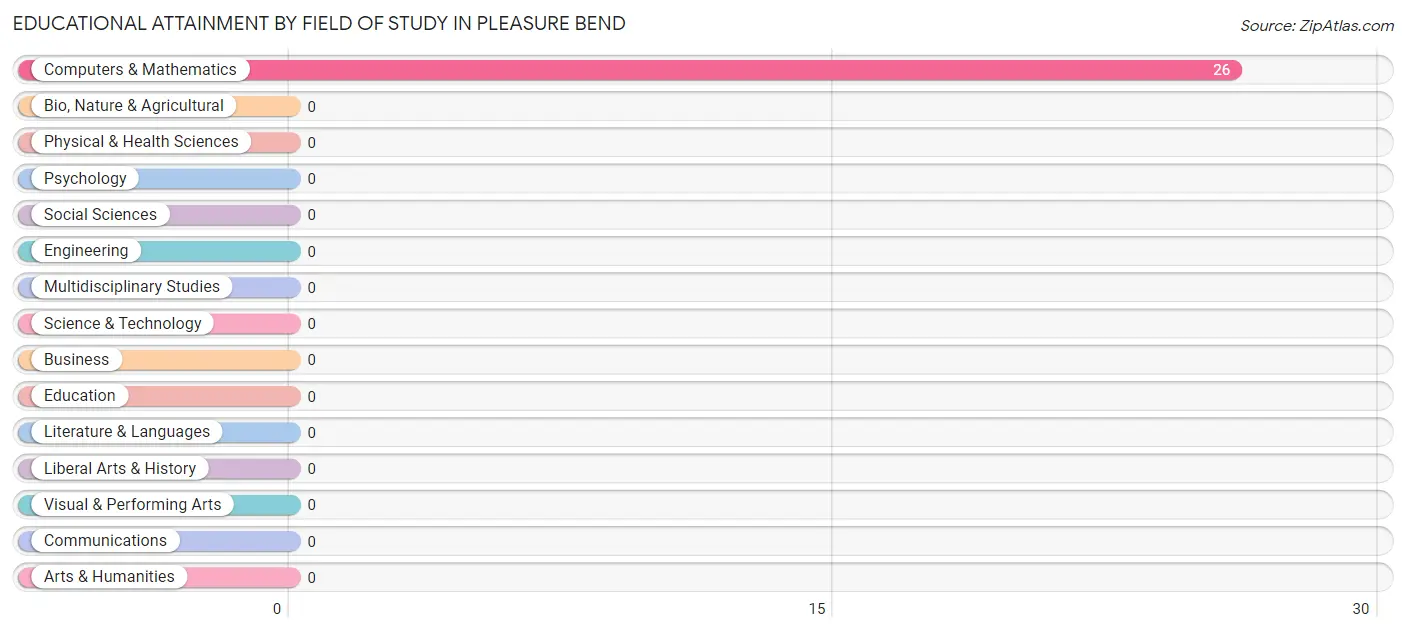
| Field of Study | # Graduates | % Graduates |
| Computers & Mathematics | 26 | 100.0% |
| Bio, Nature & Agricultural | 0 | 0.0% |
| Physical & Health Sciences | 0 | 0.0% |
| Psychology | 0 | 0.0% |
| Social Sciences | 0 | 0.0% |
| Engineering | 0 | 0.0% |
| Multidisciplinary Studies | 0 | 0.0% |
| Science & Technology | 0 | 0.0% |
| Business | 0 | 0.0% |
| Education | 0 | 0.0% |
| Literature & Languages | 0 | 0.0% |
| Liberal Arts & History | 0 | 0.0% |
| Visual & Performing Arts | 0 | 0.0% |
| Communications | 0 | 0.0% |
| Arts & Humanities | 0 | 0.0% |
| Total | 26 | 100.0% |
Transportation & Commute in Pleasure Bend
Vehicle Availability by Sex in Pleasure Bend
The most prevalent vehicle ownership categories in Pleasure Bend are males with 4 vehicles (34, accounting for 100.0%) and females with 4 vehicles (53, making up 43.0%).
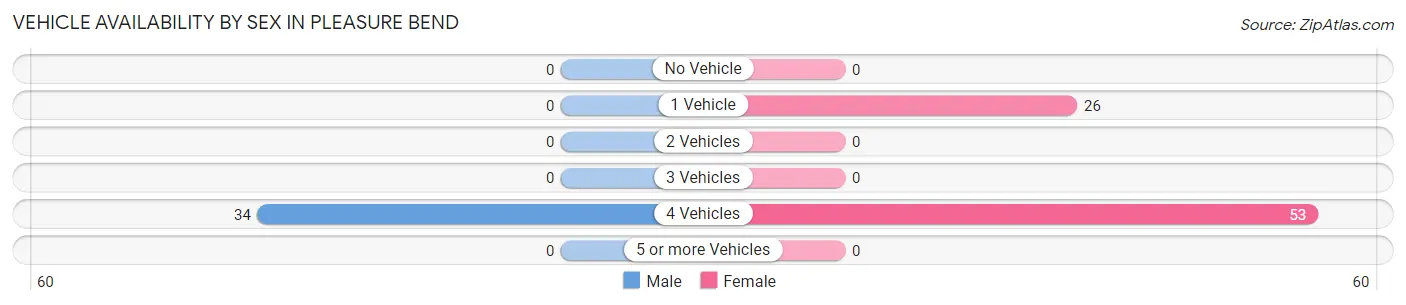
| Vehicles Available | Male | Female |
| No Vehicle | 0 (0.0%) | 0 (0.0%) |
| 1 Vehicle | 0 (0.0%) | 26 (32.9%) |
| 2 Vehicles | 0 (0.0%) | 0 (0.0%) |
| 3 Vehicles | 0 (0.0%) | 0 (0.0%) |
| 4 Vehicles | 34 (100.0%) | 53 (67.1%) |
| 5 or more Vehicles | 0 (0.0%) | 0 (0.0%) |
| Total | 34 (100.0%) | 79 (100.0%) |
Commute Time in Pleasure Bend
The most frequently occuring commute durations in Pleasure Bend are 10 to 14 minutes (43 commuters, 45.7%), 30 to 34 minutes (36 commuters, 38.3%), and 60 to 89 minutes (15 commuters, 16.0%).
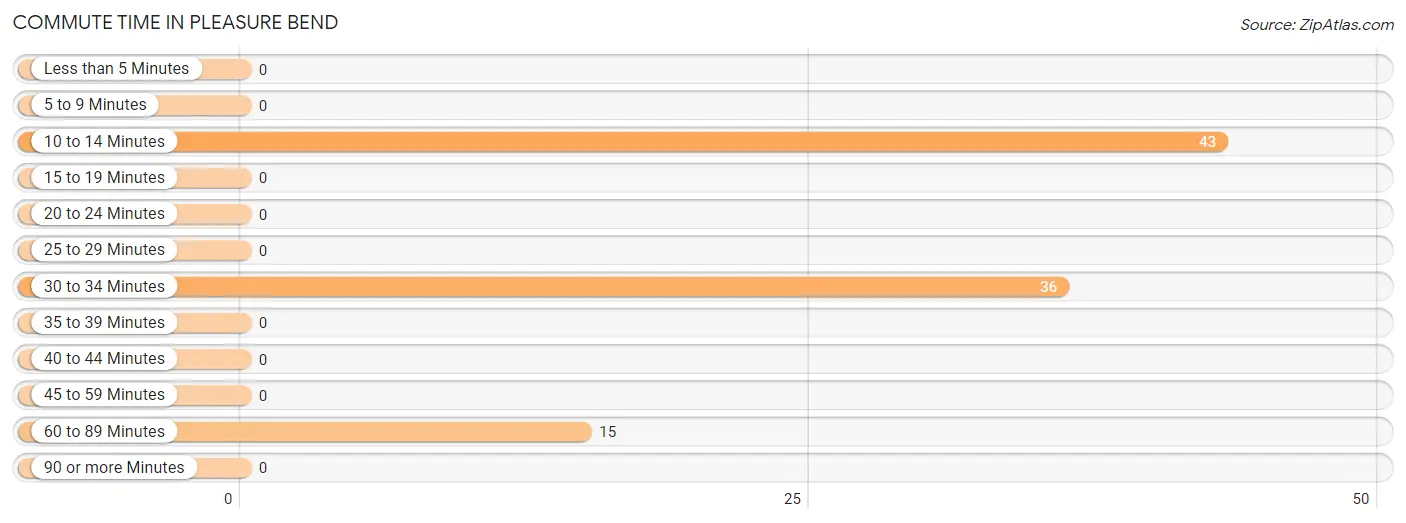
| Commute Time | # Commuters | % Commuters |
| Less than 5 Minutes | 0 | 0.0% |
| 5 to 9 Minutes | 0 | 0.0% |
| 10 to 14 Minutes | 43 | 45.7% |
| 15 to 19 Minutes | 0 | 0.0% |
| 20 to 24 Minutes | 0 | 0.0% |
| 25 to 29 Minutes | 0 | 0.0% |
| 30 to 34 Minutes | 36 | 38.3% |
| 35 to 39 Minutes | 0 | 0.0% |
| 40 to 44 Minutes | 0 | 0.0% |
| 45 to 59 Minutes | 0 | 0.0% |
| 60 to 89 Minutes | 15 | 16.0% |
| 90 or more Minutes | 0 | 0.0% |
Commute Time by Sex in Pleasure Bend
The most common commute times in Pleasure Bend are 60 to 89 minutes (15 commuters, 100.0%) for males and 10 to 14 minutes (43 commuters, 54.4%) for females.
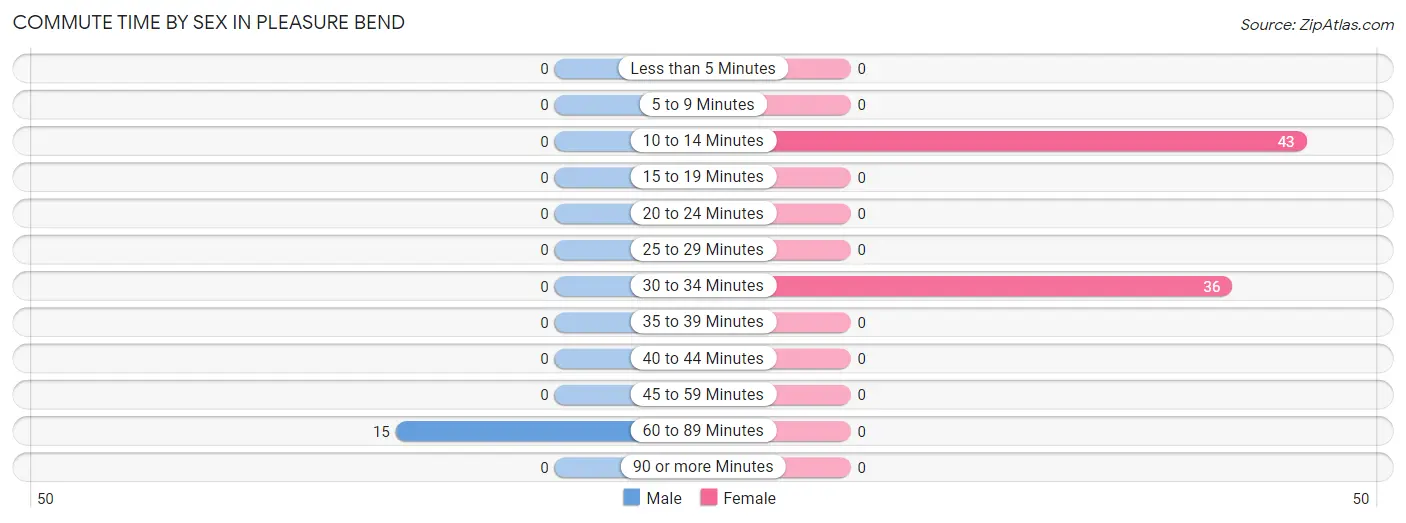
| Commute Time | Male | Female |
| Less than 5 Minutes | 0 (0.0%) | 0 (0.0%) |
| 5 to 9 Minutes | 0 (0.0%) | 0 (0.0%) |
| 10 to 14 Minutes | 0 (0.0%) | 43 (54.4%) |
| 15 to 19 Minutes | 0 (0.0%) | 0 (0.0%) |
| 20 to 24 Minutes | 0 (0.0%) | 0 (0.0%) |
| 25 to 29 Minutes | 0 (0.0%) | 0 (0.0%) |
| 30 to 34 Minutes | 0 (0.0%) | 36 (45.6%) |
| 35 to 39 Minutes | 0 (0.0%) | 0 (0.0%) |
| 40 to 44 Minutes | 0 (0.0%) | 0 (0.0%) |
| 45 to 59 Minutes | 0 (0.0%) | 0 (0.0%) |
| 60 to 89 Minutes | 15 (100.0%) | 0 (0.0%) |
| 90 or more Minutes | 0 (0.0%) | 0 (0.0%) |
Time of Departure to Work by Sex in Pleasure Bend
The most frequent times of departure to work in Pleasure Bend are 5:30 AM to 5:59 AM (15, 100.0%) for males and 7:00 AM to 7:29 AM (43, 54.4%) for females.
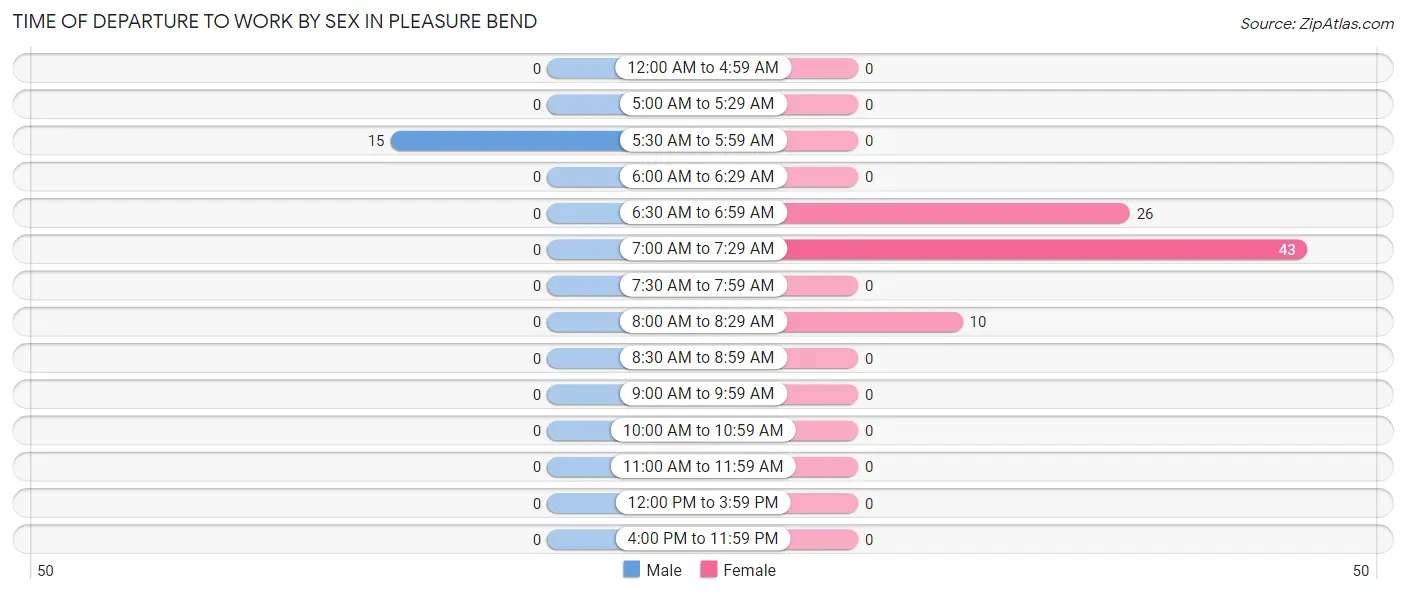
| Time of Departure | Male | Female |
| 12:00 AM to 4:59 AM | 0 (0.0%) | 0 (0.0%) |
| 5:00 AM to 5:29 AM | 0 (0.0%) | 0 (0.0%) |
| 5:30 AM to 5:59 AM | 15 (100.0%) | 0 (0.0%) |
| 6:00 AM to 6:29 AM | 0 (0.0%) | 0 (0.0%) |
| 6:30 AM to 6:59 AM | 0 (0.0%) | 26 (32.9%) |
| 7:00 AM to 7:29 AM | 0 (0.0%) | 43 (54.4%) |
| 7:30 AM to 7:59 AM | 0 (0.0%) | 0 (0.0%) |
| 8:00 AM to 8:29 AM | 0 (0.0%) | 10 (12.7%) |
| 8:30 AM to 8:59 AM | 0 (0.0%) | 0 (0.0%) |
| 9:00 AM to 9:59 AM | 0 (0.0%) | 0 (0.0%) |
| 10:00 AM to 10:59 AM | 0 (0.0%) | 0 (0.0%) |
| 11:00 AM to 11:59 AM | 0 (0.0%) | 0 (0.0%) |
| 12:00 PM to 3:59 PM | 0 (0.0%) | 0 (0.0%) |
| 4:00 PM to 11:59 PM | 0 (0.0%) | 0 (0.0%) |
| Total | 15 (100.0%) | 79 (100.0%) |
Housing Occupancy in Pleasure Bend
Occupancy by Ownership in Pleasure Bend
Of the total 98 dwellings in Pleasure Bend, owner-occupied units account for 98 (100.0%), while renter-occupied units make up 0 (0.0%).
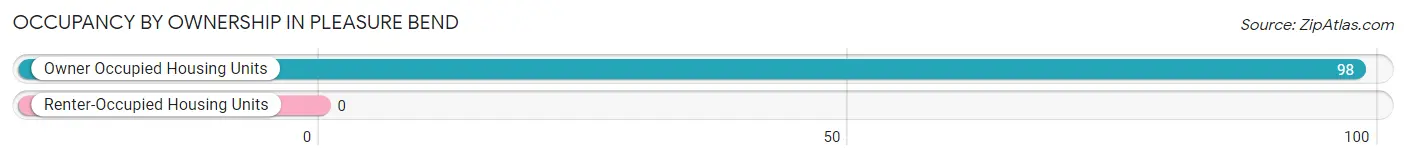
| Occupancy | # Housing Units | % Housing Units |
| Owner Occupied Housing Units | 98 | 100.0% |
| Renter-Occupied Housing Units | 0 | 0.0% |
| Total Occupied Housing Units | 98 | 100.0% |
Occupancy by Household Size in Pleasure Bend
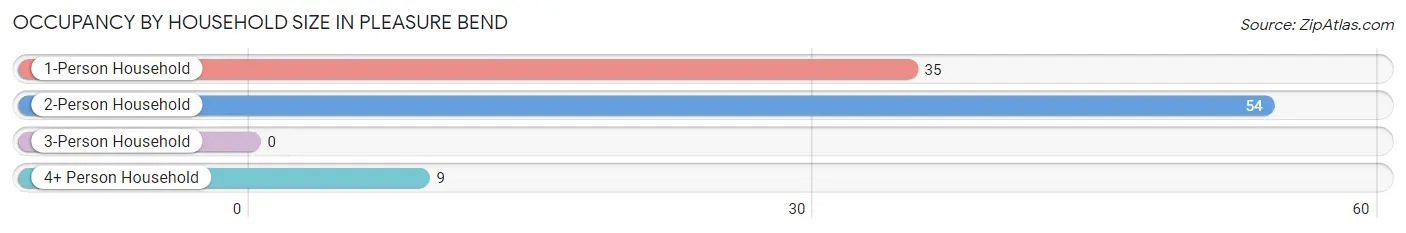
| Household Size | # Housing Units | % Housing Units |
| 1-Person Household | 35 | 35.7% |
| 2-Person Household | 54 | 55.1% |
| 3-Person Household | 0 | 0.0% |
| 4+ Person Household | 9 | 9.2% |
| Total Housing Units | 98 | 100.0% |
Occupancy by Ownership by Household Size in Pleasure Bend
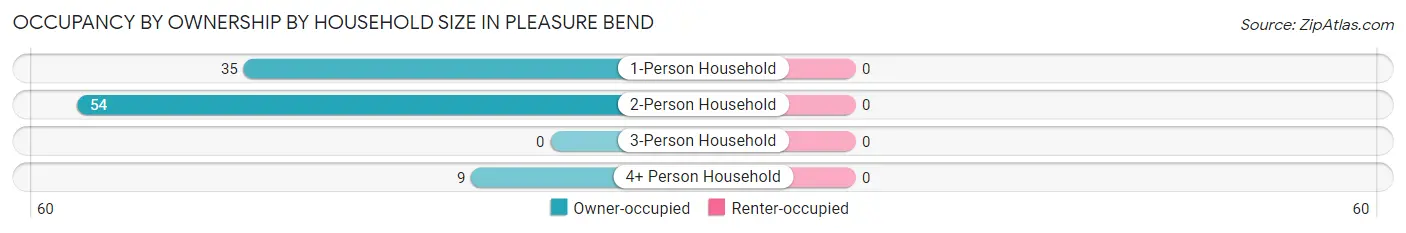
| Household Size | Owner-occupied | Renter-occupied |
| 1-Person Household | 35 (100.0%) | 0 (0.0%) |
| 2-Person Household | 54 (100.0%) | 0 (0.0%) |
| 3-Person Household | 0 (0.0%) | 0 (0.0%) |
| 4+ Person Household | 9 (100.0%) | 0 (0.0%) |
| Total Housing Units | 98 (100.0%) | 0 (0.0%) |
Occupancy by Educational Attainment in Pleasure Bend
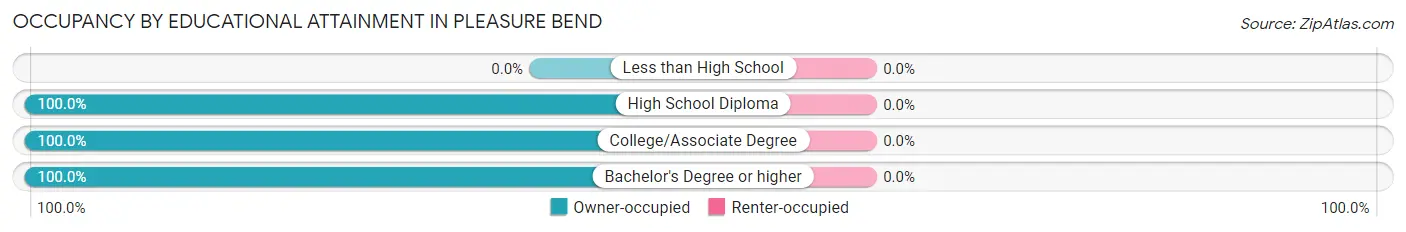
| Household Size | Owner-occupied | Renter-occupied |
| Less than High School | 0 (0.0%) | 0 (0.0%) |
| High School Diploma | 44 (100.0%) | 0 (0.0%) |
| College/Associate Degree | 28 (100.0%) | 0 (0.0%) |
| Bachelor's Degree or higher | 26 (100.0%) | 0 (0.0%) |
Occupancy by Age of Householder in Pleasure Bend
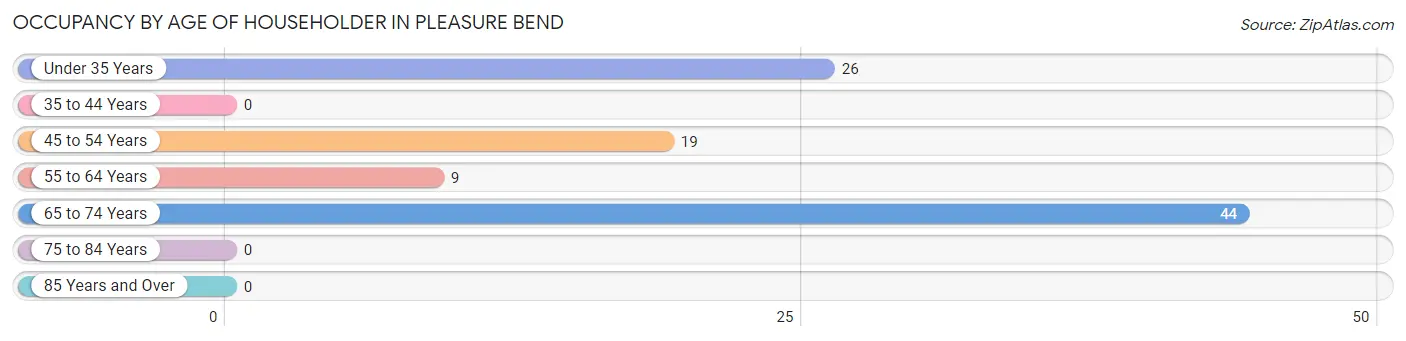
| Age Bracket | # Households | % Households |
| Under 35 Years | 26 | 26.5% |
| 35 to 44 Years | 0 | 0.0% |
| 45 to 54 Years | 19 | 19.4% |
| 55 to 64 Years | 9 | 9.2% |
| 65 to 74 Years | 44 | 44.9% |
| 75 to 84 Years | 0 | 0.0% |
| 85 Years and Over | 0 | 0.0% |
| Total | 98 | 100.0% |
Housing Finances in Pleasure Bend
Median Income by Occupancy in Pleasure Bend
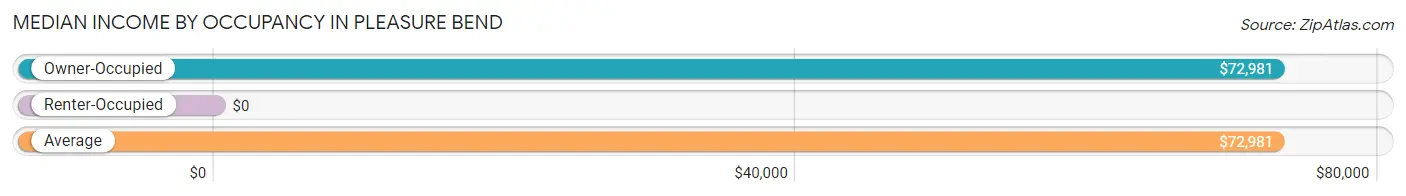
| Occupancy Type | # Households | Median Income |
| Owner-Occupied | 98 (100.0%) | $72,981 |
| Renter-Occupied | 0 (0.0%) | $0 |
| Average | 98 (100.0%) | $72,981 |
Occupancy by Householder Income Bracket in Pleasure Bend
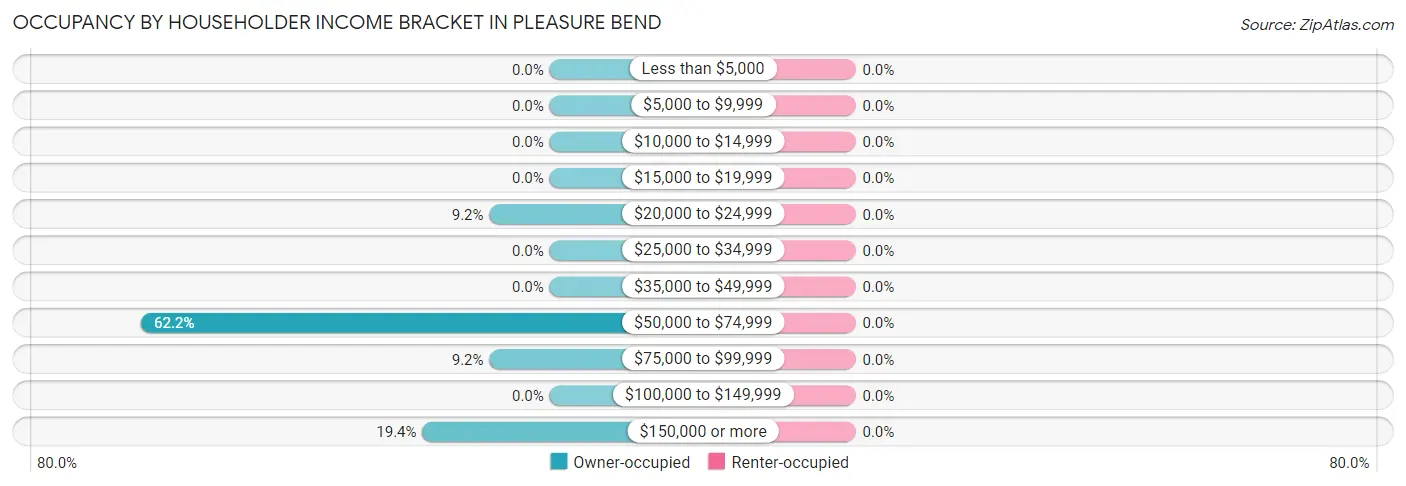
| Income Bracket | Owner-occupied | Renter-occupied |
| Less than $5,000 | 0 (0.0%) | 0 (0.0%) |
| $5,000 to $9,999 | 0 (0.0%) | 0 (0.0%) |
| $10,000 to $14,999 | 0 (0.0%) | 0 (0.0%) |
| $15,000 to $19,999 | 0 (0.0%) | 0 (0.0%) |
| $20,000 to $24,999 | 9 (9.2%) | 0 (0.0%) |
| $25,000 to $34,999 | 0 (0.0%) | 0 (0.0%) |
| $35,000 to $49,999 | 0 (0.0%) | 0 (0.0%) |
| $50,000 to $74,999 | 61 (62.2%) | 0 (0.0%) |
| $75,000 to $99,999 | 9 (9.2%) | 0 (0.0%) |
| $100,000 to $149,999 | 0 (0.0%) | 0 (0.0%) |
| $150,000 or more | 19 (19.4%) | 0 (0.0%) |
| Total | 98 (100.0%) | 0 (0.0%) |
Monthly Housing Cost Tiers in Pleasure Bend
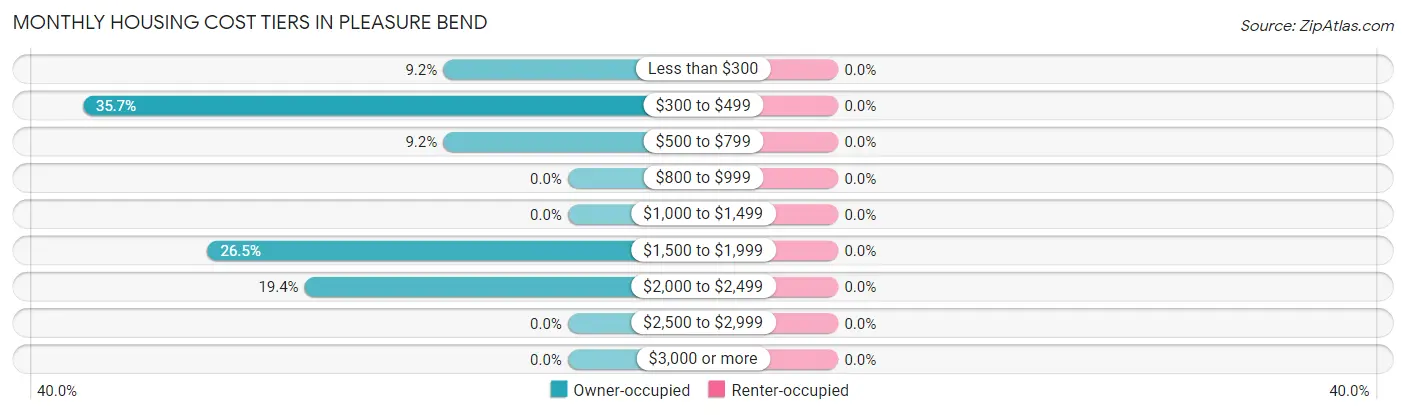
| Monthly Cost | Owner-occupied | Renter-occupied |
| Less than $300 | 9 (9.2%) | 0 (0.0%) |
| $300 to $499 | 35 (35.7%) | 0 (0.0%) |
| $500 to $799 | 9 (9.2%) | 0 (0.0%) |
| $800 to $999 | 0 (0.0%) | 0 (0.0%) |
| $1,000 to $1,499 | 0 (0.0%) | 0 (0.0%) |
| $1,500 to $1,999 | 26 (26.5%) | 0 (0.0%) |
| $2,000 to $2,499 | 19 (19.4%) | 0 (0.0%) |
| $2,500 to $2,999 | 0 (0.0%) | 0 (0.0%) |
| $3,000 or more | 0 (0.0%) | 0 (0.0%) |
| Total | 98 (100.0%) | 0 (0.0%) |
Physical Housing Characteristics in Pleasure Bend
Housing Structures in Pleasure Bend
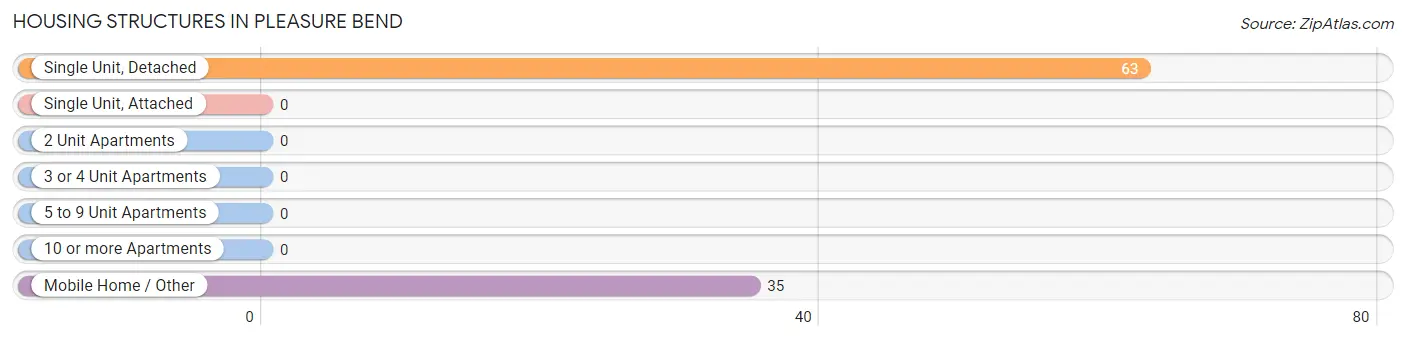
| Structure Type | # Housing Units | % Housing Units |
| Single Unit, Detached | 63 | 64.3% |
| Single Unit, Attached | 0 | 0.0% |
| 2 Unit Apartments | 0 | 0.0% |
| 3 or 4 Unit Apartments | 0 | 0.0% |
| 5 to 9 Unit Apartments | 0 | 0.0% |
| 10 or more Apartments | 0 | 0.0% |
| Mobile Home / Other | 35 | 35.7% |
| Total | 98 | 100.0% |
Housing Structures by Occupancy in Pleasure Bend
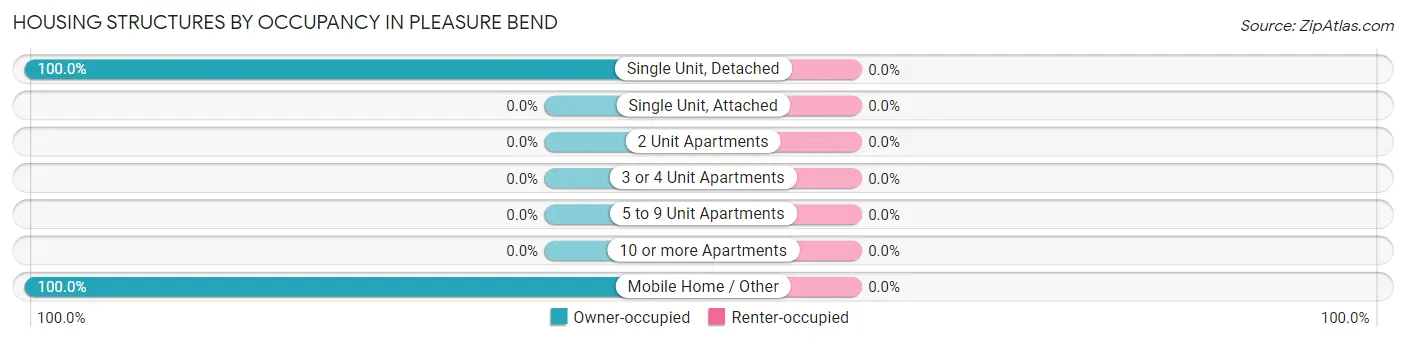
| Structure Type | Owner-occupied | Renter-occupied |
| Single Unit, Detached | 63 (100.0%) | 0 (0.0%) |
| Single Unit, Attached | 0 (0.0%) | 0 (0.0%) |
| 2 Unit Apartments | 0 (0.0%) | 0 (0.0%) |
| 3 or 4 Unit Apartments | 0 (0.0%) | 0 (0.0%) |
| 5 to 9 Unit Apartments | 0 (0.0%) | 0 (0.0%) |
| 10 or more Apartments | 0 (0.0%) | 0 (0.0%) |
| Mobile Home / Other | 35 (100.0%) | 0 (0.0%) |
| Total | 98 (100.0%) | 0 (0.0%) |
Housing Structures by Number of Rooms in Pleasure Bend
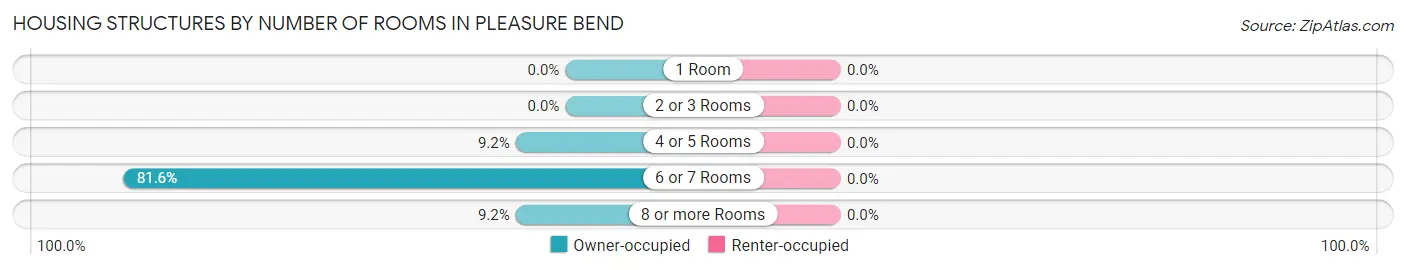
| Number of Rooms | Owner-occupied | Renter-occupied |
| 1 Room | 0 (0.0%) | 0 (0.0%) |
| 2 or 3 Rooms | 0 (0.0%) | 0 (0.0%) |
| 4 or 5 Rooms | 9 (9.2%) | 0 (0.0%) |
| 6 or 7 Rooms | 80 (81.6%) | 0 (0.0%) |
| 8 or more Rooms | 9 (9.2%) | 0 (0.0%) |
| Total | 98 (100.0%) | 0 (0.0%) |
Housing Structure by Heating Type in Pleasure Bend
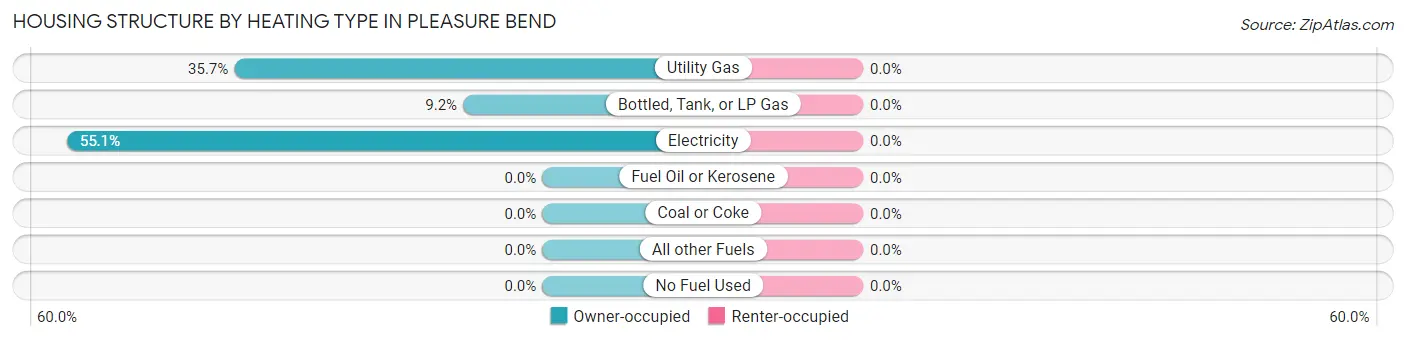
| Heating Type | Owner-occupied | Renter-occupied |
| Utility Gas | 35 (35.7%) | 0 (0.0%) |
| Bottled, Tank, or LP Gas | 9 (9.2%) | 0 (0.0%) |
| Electricity | 54 (55.1%) | 0 (0.0%) |
| Fuel Oil or Kerosene | 0 (0.0%) | 0 (0.0%) |
| Coal or Coke | 0 (0.0%) | 0 (0.0%) |
| All other Fuels | 0 (0.0%) | 0 (0.0%) |
| No Fuel Used | 0 (0.0%) | 0 (0.0%) |
| Total | 98 (100.0%) | 0 (0.0%) |
Household Vehicle Usage in Pleasure Bend
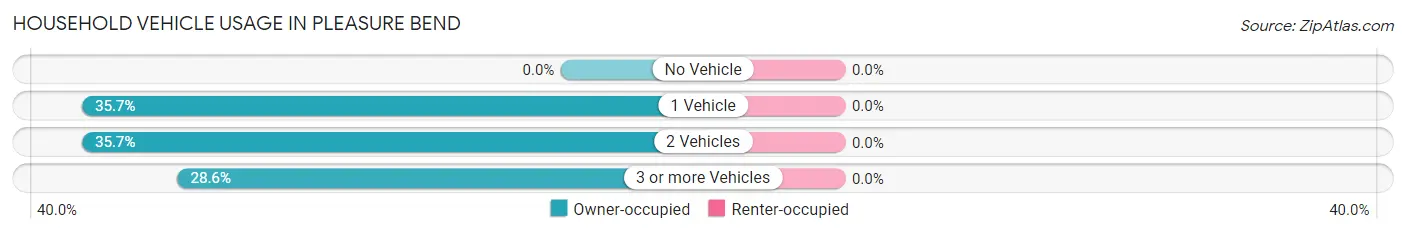
| Vehicles per Household | Owner-occupied | Renter-occupied |
| No Vehicle | 0 (0.0%) | 0 (0.0%) |
| 1 Vehicle | 35 (35.7%) | 0 (0.0%) |
| 2 Vehicles | 35 (35.7%) | 0 (0.0%) |
| 3 or more Vehicles | 28 (28.6%) | 0 (0.0%) |
| Total | 98 (100.0%) | 0 (0.0%) |
Real Estate & Mortgages in Pleasure Bend
Real Estate and Mortgage Overview in Pleasure Bend
| Characteristic | Without Mortgage | With Mortgage |
| Housing Units | 44 | 54 |
| Median Property Value | - | - |
| Median Household Income | - | - |
| Monthly Housing Costs | - | - |
| Real Estate Taxes | - | - |
Property Value by Mortgage Status in Pleasure Bend
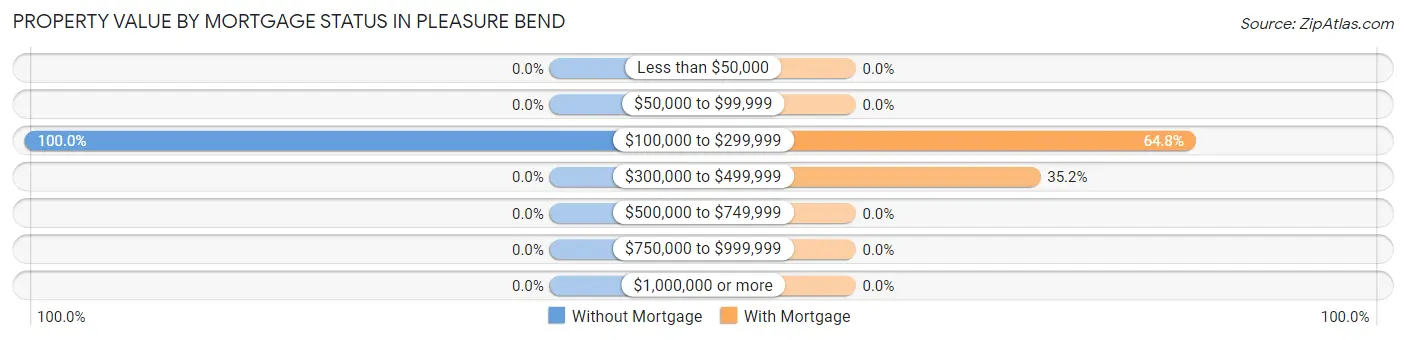
| Property Value | Without Mortgage | With Mortgage |
| Less than $50,000 | 0 (0.0%) | 0 (0.0%) |
| $50,000 to $99,999 | 0 (0.0%) | 0 (0.0%) |
| $100,000 to $299,999 | 44 (100.0%) | 35 (64.8%) |
| $300,000 to $499,999 | 0 (0.0%) | 19 (35.2%) |
| $500,000 to $749,999 | 0 (0.0%) | 0 (0.0%) |
| $750,000 to $999,999 | 0 (0.0%) | 0 (0.0%) |
| $1,000,000 or more | 0 (0.0%) | 0 (0.0%) |
| Total | 44 (100.0%) | 54 (100.0%) |
Household Income by Mortgage Status in Pleasure Bend
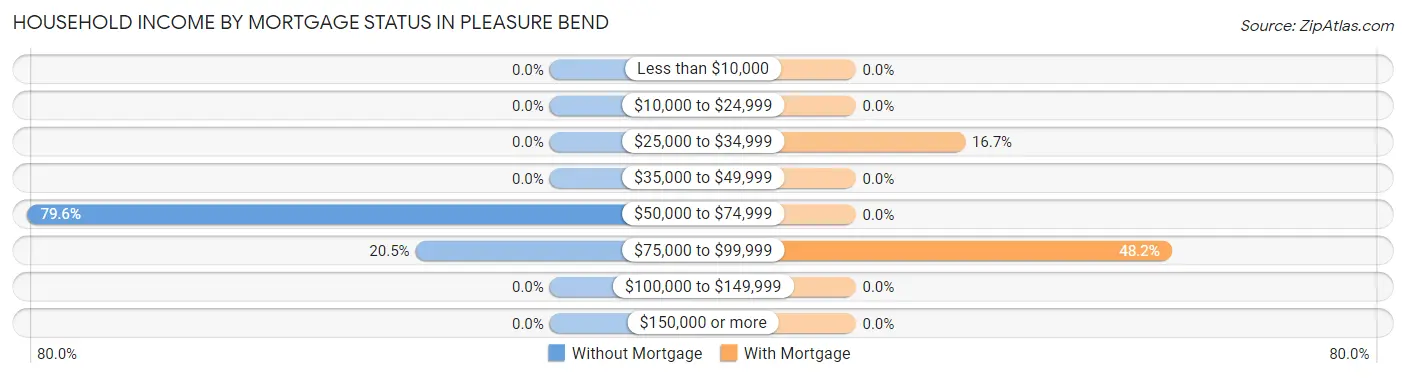
| Household Income | Without Mortgage | With Mortgage |
| Less than $10,000 | 0 (0.0%) | 0 (0.0%) |
| $10,000 to $24,999 | 0 (0.0%) | 0 (0.0%) |
| $25,000 to $34,999 | 0 (0.0%) | 9 (16.7%) |
| $35,000 to $49,999 | 0 (0.0%) | 0 (0.0%) |
| $50,000 to $74,999 | 35 (79.5%) | 0 (0.0%) |
| $75,000 to $99,999 | 9 (20.4%) | 26 (48.1%) |
| $100,000 to $149,999 | 0 (0.0%) | 0 (0.0%) |
| $150,000 or more | 0 (0.0%) | 0 (0.0%) |
| Total | 44 (100.0%) | 54 (100.0%) |
Property Value to Household Income Ratio in Pleasure Bend
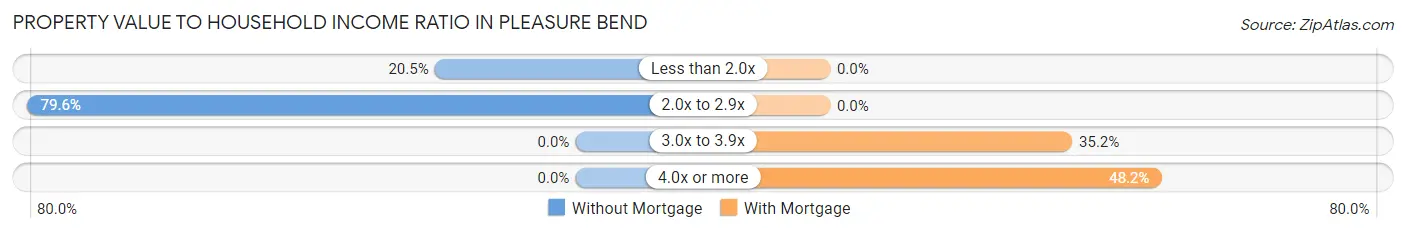
| Value-to-Income Ratio | Without Mortgage | With Mortgage |
| Less than 2.0x | 9 (20.4%) | 0 (0.0%) |
| 2.0x to 2.9x | 35 (79.5%) | 0 (0.0%) |
| 3.0x to 3.9x | 0 (0.0%) | 19 (35.2%) |
| 4.0x or more | 0 (0.0%) | 26 (48.1%) |
| Total | 44 (100.0%) | 54 (100.0%) |
Real Estate Taxes by Mortgage Status in Pleasure Bend
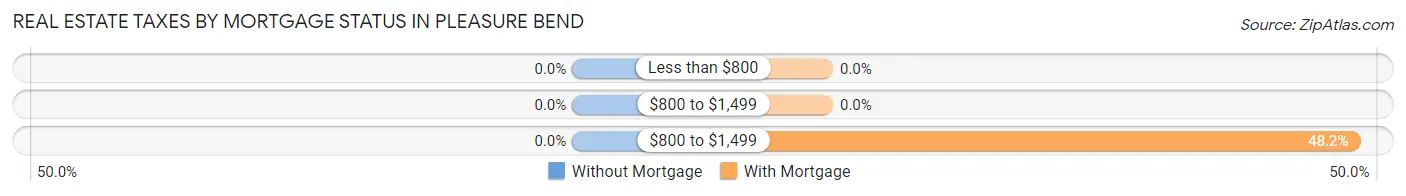
| Property Taxes | Without Mortgage | With Mortgage |
| Less than $800 | 0 (0.0%) | 0 (0.0%) |
| $800 to $1,499 | 0 (0.0%) | 0 (0.0%) |
| $800 to $1,499 | 0 (0.0%) | 26 (48.1%) |
| Total | 44 (100.0%) | 54 (100.0%) |
Health & Disability in Pleasure Bend
Health Insurance Coverage by Age in Pleasure Bend
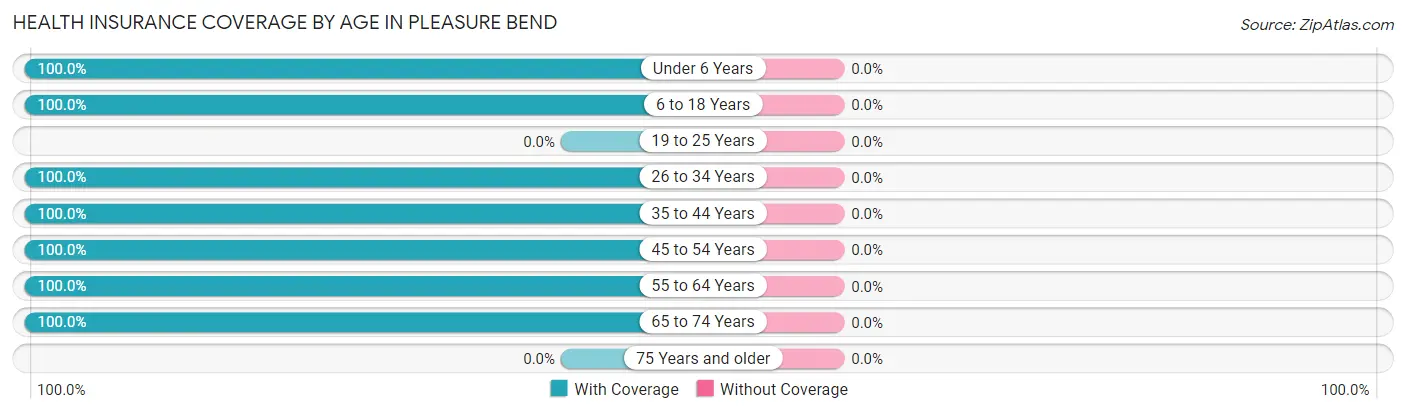
| Age Bracket | With Coverage | Without Coverage |
| Under 6 Years | 9 (100.0%) | 0 (0.0%) |
| 6 to 18 Years | 52 (100.0%) | 0 (0.0%) |
| 19 to 25 Years | 0 (0.0%) | 0 (0.0%) |
| 26 to 34 Years | 26 (100.0%) | 0 (0.0%) |
| 35 to 44 Years | 25 (100.0%) | 0 (0.0%) |
| 45 to 54 Years | 62 (100.0%) | 0 (0.0%) |
| 55 to 64 Years | 9 (100.0%) | 0 (0.0%) |
| 65 to 74 Years | 88 (100.0%) | 0 (0.0%) |
| 75 Years and older | 0 (0.0%) | 0 (0.0%) |
| Total | 271 (100.0%) | 0 (0.0%) |
Health Insurance Coverage by Citizenship Status in Pleasure Bend
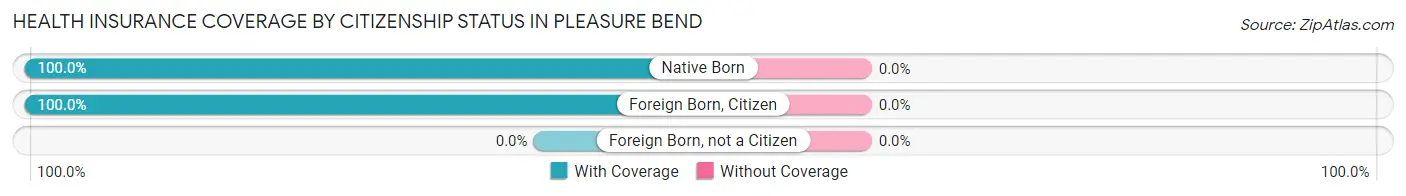
| Citizenship Status | With Coverage | Without Coverage |
| Native Born | 9 (100.0%) | 0 (0.0%) |
| Foreign Born, Citizen | 52 (100.0%) | 0 (0.0%) |
| Foreign Born, not a Citizen | 0 (0.0%) | 0 (0.0%) |
Health Insurance Coverage by Household Income in Pleasure Bend
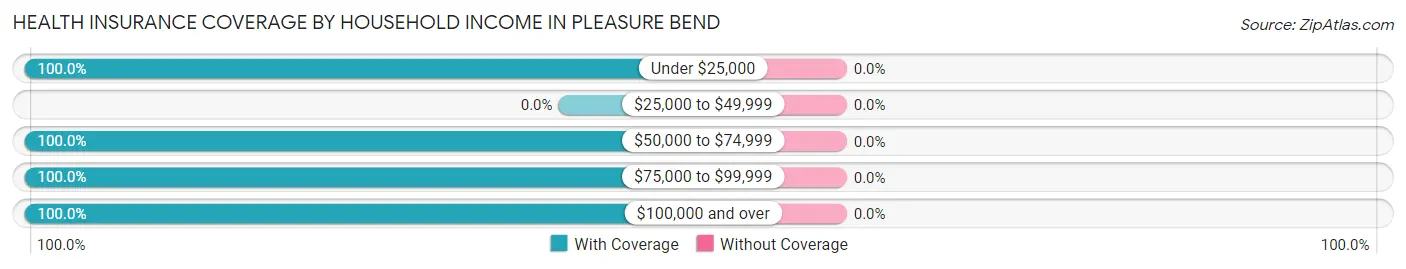
| Household Income | With Coverage | Without Coverage |
| Under $25,000 | 9 (100.0%) | 0 (0.0%) |
| $25,000 to $49,999 | 0 (0.0%) | 0 (0.0%) |
| $50,000 to $74,999 | 96 (100.0%) | 0 (0.0%) |
| $75,000 to $99,999 | 104 (100.0%) | 0 (0.0%) |
| $100,000 and over | 62 (100.0%) | 0 (0.0%) |
Public vs Private Health Insurance Coverage by Age in Pleasure Bend
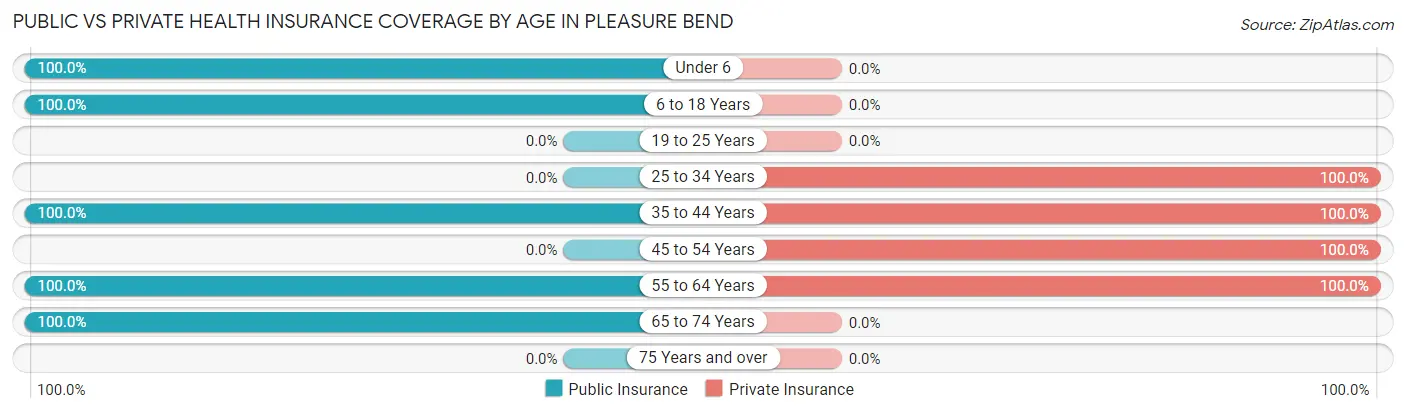
| Age Bracket | Public Insurance | Private Insurance |
| Under 6 | 9 (100.0%) | 0 (0.0%) |
| 6 to 18 Years | 52 (100.0%) | 0 (0.0%) |
| 19 to 25 Years | 0 (0.0%) | 0 (0.0%) |
| 25 to 34 Years | 0 (0.0%) | 26 (100.0%) |
| 35 to 44 Years | 25 (100.0%) | 25 (100.0%) |
| 45 to 54 Years | 0 (0.0%) | 62 (100.0%) |
| 55 to 64 Years | 9 (100.0%) | 9 (100.0%) |
| 65 to 74 Years | 88 (100.0%) | 0 (0.0%) |
| 75 Years and over | 0 (0.0%) | 0 (0.0%) |
| Total | 183 (67.5%) | 122 (45.0%) |
Disability Status by Sex by Age in Pleasure Bend
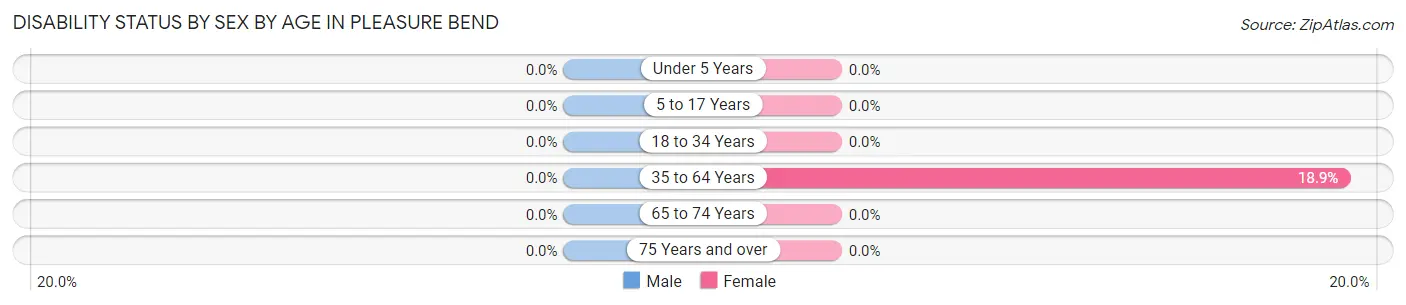
| Age Bracket | Male | Female |
| Under 5 Years | 0 (0.0%) | 0 (0.0%) |
| 5 to 17 Years | 0 (0.0%) | 0 (0.0%) |
| 18 to 34 Years | 0 (0.0%) | 0 (0.0%) |
| 35 to 64 Years | 0 (0.0%) | 10 (18.9%) |
| 65 to 74 Years | 0 (0.0%) | 0 (0.0%) |
| 75 Years and over | 0 (0.0%) | 0 (0.0%) |
Disability Class by Sex by Age in Pleasure Bend
Disability Class: Hearing Difficulty
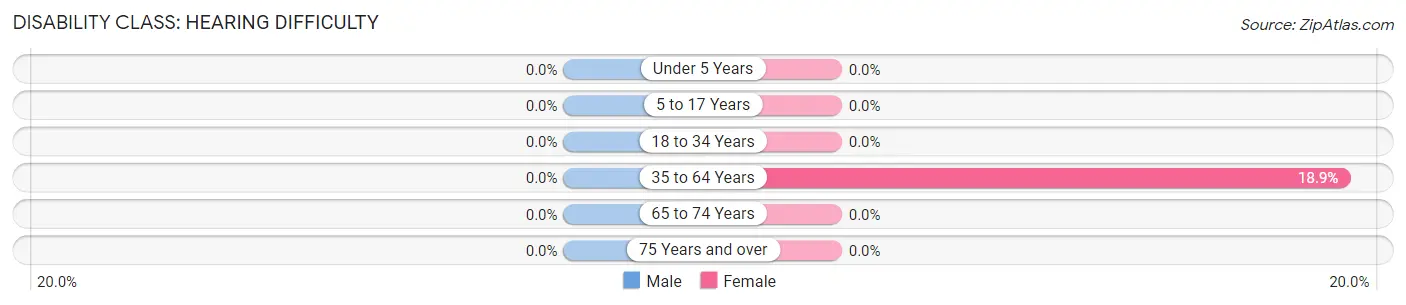
| Age Bracket | Male | Female |
| Under 5 Years | 0 (0.0%) | 0 (0.0%) |
| 5 to 17 Years | 0 (0.0%) | 0 (0.0%) |
| 18 to 34 Years | 0 (0.0%) | 0 (0.0%) |
| 35 to 64 Years | 0 (0.0%) | 10 (18.9%) |
| 65 to 74 Years | 0 (0.0%) | 0 (0.0%) |
| 75 Years and over | 0 (0.0%) | 0 (0.0%) |
Disability Class: Vision Difficulty
| Age Bracket | Male | Female |
| Under 5 Years | 0 (0.0%) | 0 (0.0%) |
| 5 to 17 Years | 0 (0.0%) | 0 (0.0%) |
| 18 to 34 Years | 0 (0.0%) | 0 (0.0%) |
| 35 to 64 Years | 0 (0.0%) | 0 (0.0%) |
| 65 to 74 Years | 0 (0.0%) | 0 (0.0%) |
| 75 Years and over | 0 (0.0%) | 0 (0.0%) |
Disability Class: Cognitive Difficulty
| Age Bracket | Male | Female |
| 5 to 17 Years | 0 (0.0%) | 0 (0.0%) |
| 18 to 34 Years | 0 (0.0%) | 0 (0.0%) |
| 35 to 64 Years | 0 (0.0%) | 0 (0.0%) |
| 65 to 74 Years | 0 (0.0%) | 0 (0.0%) |
| 75 Years and over | 0 (0.0%) | 0 (0.0%) |
Disability Class: Ambulatory Difficulty
| Age Bracket | Male | Female |
| 5 to 17 Years | 0 (0.0%) | 0 (0.0%) |
| 18 to 34 Years | 0 (0.0%) | 0 (0.0%) |
| 35 to 64 Years | 0 (0.0%) | 0 (0.0%) |
| 65 to 74 Years | 0 (0.0%) | 0 (0.0%) |
| 75 Years and over | 0 (0.0%) | 0 (0.0%) |
Disability Class: Self-Care Difficulty

| Age Bracket | Male | Female |
| 5 to 17 Years | 0 (0.0%) | 0 (0.0%) |
| 18 to 34 Years | 0 (0.0%) | 0 (0.0%) |
| 35 to 64 Years | 0 (0.0%) | 0 (0.0%) |
| 65 to 74 Years | 0 (0.0%) | 0 (0.0%) |
| 75 Years and over | 0 (0.0%) | 0 (0.0%) |
Technology Access in Pleasure Bend
Computing Device Access in Pleasure Bend
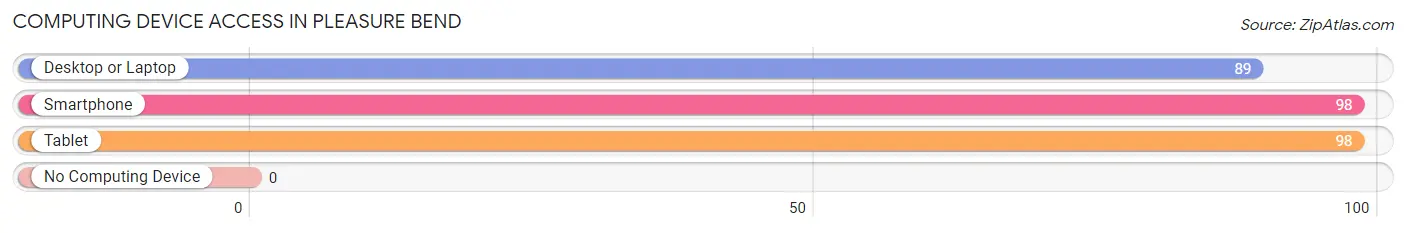
| Device Type | # Households | % Households |
| Desktop or Laptop | 89 | 90.8% |
| Smartphone | 98 | 100.0% |
| Tablet | 98 | 100.0% |
| No Computing Device | 0 | 0.0% |
| Total | 98 | 100.0% |
Internet Access in Pleasure Bend
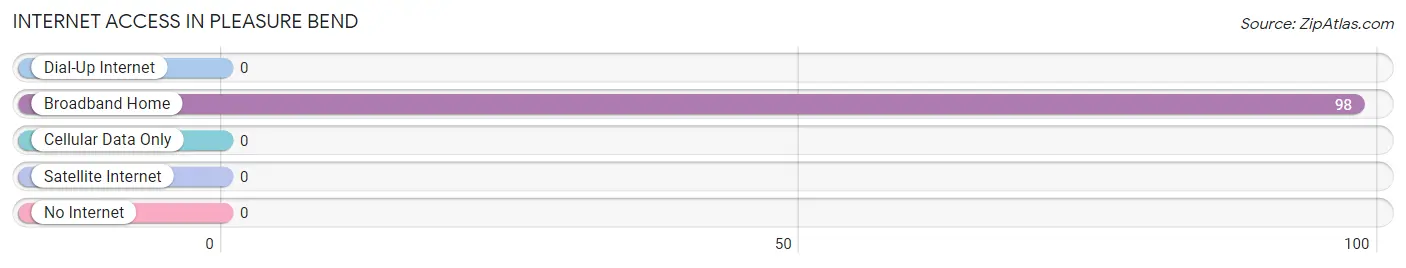
| Internet Type | # Households | % Households |
| Dial-Up Internet | 0 | 0.0% |
| Broadband Home | 98 | 100.0% |
| Cellular Data Only | 0 | 0.0% |
| Satellite Internet | 0 | 0.0% |
| No Internet | 0 | 0.0% |
| Total | 98 | 100.0% |
Pleasure Bend Summary
Pleasure Bend is a small unincorporated community located in the southeastern corner of Louisiana, in the parish of St. Charles. It is situated on the banks of the Mississippi River, approximately 25 miles south of New Orleans. The community is home to a diverse population of approximately 1,000 people, and is known for its unique culture and history.
Geography
Pleasure Bend is located in the southeastern corner of Louisiana, in the parish of St. Charles. It is situated on the banks of the Mississippi River, approximately 25 miles south of New Orleans. The community is surrounded by a variety of natural features, including the Mississippi River, the Atchafalaya River, and the Gulf of Mexico. The area is characterized by a humid subtropical climate, with hot, humid summers and mild winters.
Economy
The economy of Pleasure Bend is largely based on agriculture and fishing. The area is home to a variety of crops, including corn, soybeans, and cotton. Fishing is also an important part of the local economy, with the Mississippi River providing a variety of fish, including catfish, bass, and crappie. In addition, the area is home to a number of small businesses, including restaurants, convenience stores, and gas stations.
Demographics
As of the 2010 census, the population of Pleasure Bend was 1,000 people. The racial makeup of the community was 79.2% White, 17.2% African American, 0.7% Native American, 0.3% Asian, and 2.6% from other races. The median household income was $37,500, and the median age was 37.
History
Pleasure Bend was first settled in the early 1800s by French and Spanish settlers. The area was originally known as “La Pointe de Plaisir”, which translates to “Pleasure Point”. The community was officially established in 1845, and was named after the nearby bend in the Mississippi River. In the late 1800s, the area was home to a thriving lumber industry, and the town was known for its shipbuilding. In the early 1900s, the area was home to a number of small businesses, including a general store, a post office, and a blacksmith shop.
In the late 20th century, Pleasure Bend experienced a period of decline, as many of the local businesses closed and the population decreased. However, in recent years, the community has seen a resurgence, with new businesses opening and the population increasing. Today, Pleasure Bend is a vibrant community, with a unique culture and history.
Common Questions
What is Per Capita Income in Pleasure Bend?
Per Capita income in Pleasure Bend is $32,106.
What is the Median Household income in Pleasure Bend?
Median Household Income in Pleasure Bend is $72,981.
What is Inequality or Gini Index in Pleasure Bend?
Inequality or Gini Index in Pleasure Bend is 0.28.
What is the Total Population of Pleasure Bend?
Total Population of Pleasure Bend is 271.
What is the Total Male Population of Pleasure Bend?
Total Male Population of Pleasure Bend is 137.
What is the Total Female Population of Pleasure Bend?
Total Female Population of Pleasure Bend is 134.
What is the Ratio of Males per 100 Females in Pleasure Bend?
There are 102.24 Males per 100 Females in Pleasure Bend.
What is the Ratio of Females per 100 Males in Pleasure Bend?
There are 97.81 Females per 100 Males in Pleasure Bend.
What is the Median Population Age in Pleasure Bend?
Median Population Age in Pleasure Bend is 54.1 Years.
What is the Average Family Size in Pleasure Bend
Average Family Size in Pleasure Bend is 3.8 People.
What is the Average Household Size in Pleasure Bend
Average Household Size in Pleasure Bend is 2.8 People.
How Large is the Labor Force in Pleasure Bend?
There are 113 People in the Labor Forcein in Pleasure Bend.
What is the Percentage of People in the Labor Force in Pleasure Bend?
53.8% of People are in the Labor Force in Pleasure Bend.