Elrod, NC Map & Demographics
Elrod Map
Elrod Overview
$14,239
PER CAPITA INCOME
$25,481
AVG FAMILY INCOME
7.8%
WAGE / INCOME GAP [ % ]
92.2¢/ $1
WAGE / INCOME GAP [ $ ]
0.47
INEQUALITY / GINI INDEX
264
TOTAL POPULATION
161
MALE POPULATION
103
FEMALE POPULATION
156.31
MALES / 100 FEMALES
63.98
FEMALES / 100 MALES
36.3
MEDIAN AGE
2.6
AVG FAMILY SIZE
1.9
AVG HOUSEHOLD SIZE
94
LABOR FORCE [ PEOPLE ]
44.3%
PERCENT IN LABOR FORCE
13.8%
UNEMPLOYMENT RATE
Income in Elrod
Income Overview in Elrod
| Characteristic | Number | Measure |
| Per Capita Income | 264 | $14,239 |
| Median Family Income | 73 | $25,481 |
| Mean Family Income | 73 | $34,400 |
| Median Household Income | 137 | $0 |
| Mean Household Income | 137 | $28,080 |
| Income Deficit | 73 | $0 |
| Wage / Income Gap (%) | 264 | 7.75% |
| Wage / Income Gap ($) | 264 | 92.25¢ per $1 |
| Gini / Inequality Index | 264 | 0.47 |
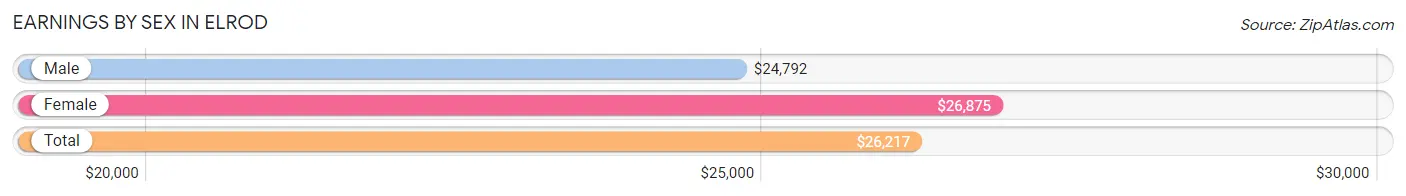
Earnings by Sex in Elrod
Average Earnings in Elrod are $26,217, $24,792 for men and $26,875 for women, a difference of 7.7%.
| Sex | Number | Average Earnings |
| Male | 56 (59.0%) | $24,792 |
| Female | 39 (41.0%) | $26,875 |
| Total | 95 (100.0%) | $26,217 |
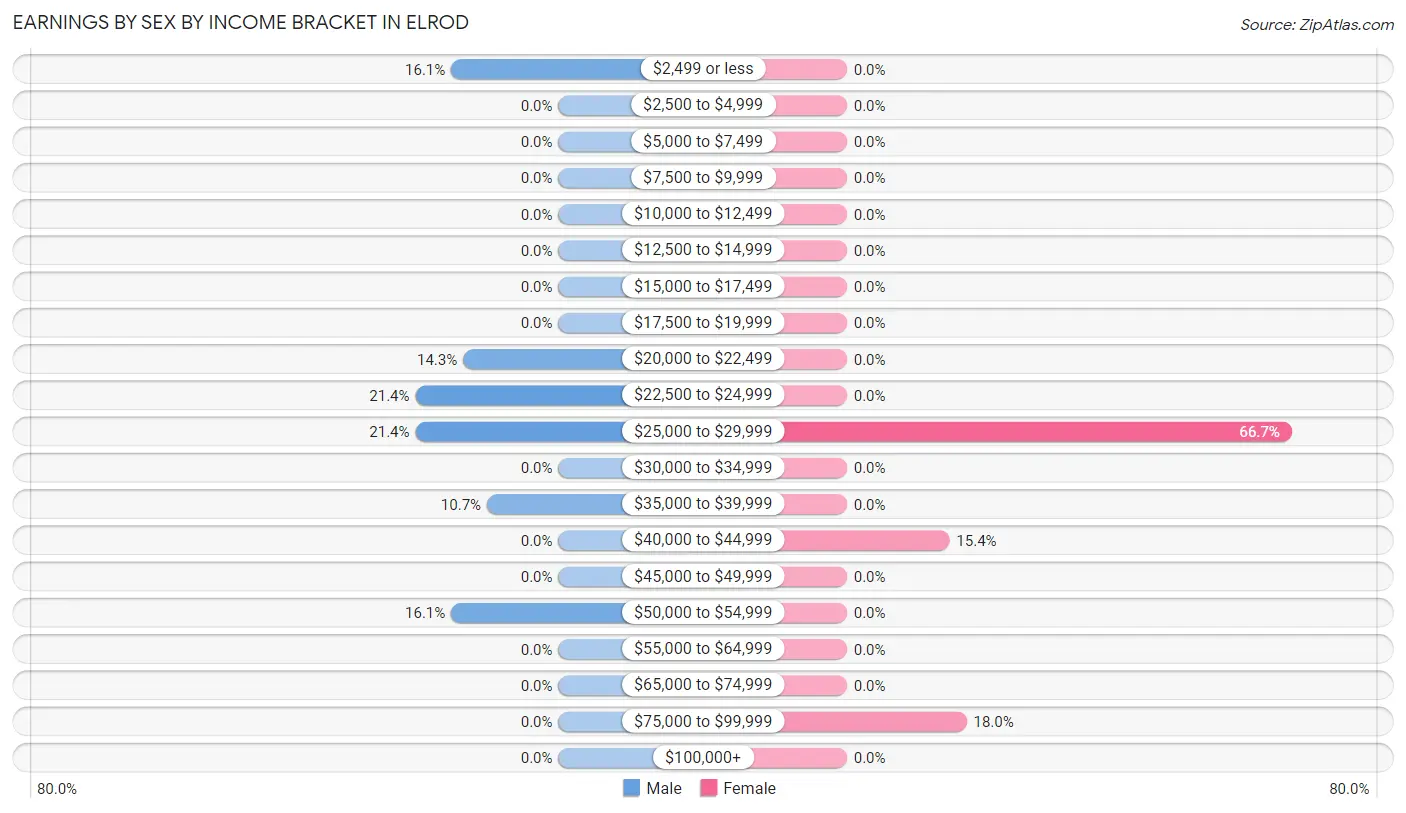
Earnings by Sex by Income Bracket in Elrod
The most common earnings brackets in Elrod are $22,500 to $24,999 for men (12 | 21.4%) and $25,000 to $29,999 for women (26 | 66.7%).
| Income | Male | Female |
| $2,499 or less | 9 (16.1%) | 0 (0.0%) |
| $2,500 to $4,999 | 0 (0.0%) | 0 (0.0%) |
| $5,000 to $7,499 | 0 (0.0%) | 0 (0.0%) |
| $7,500 to $9,999 | 0 (0.0%) | 0 (0.0%) |
| $10,000 to $12,499 | 0 (0.0%) | 0 (0.0%) |
| $12,500 to $14,999 | 0 (0.0%) | 0 (0.0%) |
| $15,000 to $17,499 | 0 (0.0%) | 0 (0.0%) |
| $17,500 to $19,999 | 0 (0.0%) | 0 (0.0%) |
| $20,000 to $22,499 | 8 (14.3%) | 0 (0.0%) |
| $22,500 to $24,999 | 12 (21.4%) | 0 (0.0%) |
| $25,000 to $29,999 | 12 (21.4%) | 26 (66.7%) |
| $30,000 to $34,999 | 0 (0.0%) | 0 (0.0%) |
| $35,000 to $39,999 | 6 (10.7%) | 0 (0.0%) |
| $40,000 to $44,999 | 0 (0.0%) | 6 (15.4%) |
| $45,000 to $49,999 | 0 (0.0%) | 0 (0.0%) |
| $50,000 to $54,999 | 9 (16.1%) | 0 (0.0%) |
| $55,000 to $64,999 | 0 (0.0%) | 0 (0.0%) |
| $65,000 to $74,999 | 0 (0.0%) | 0 (0.0%) |
| $75,000 to $99,999 | 0 (0.0%) | 7 (17.9%) |
| $100,000+ | 0 (0.0%) | 0 (0.0%) |
| Total | 56 (100.0%) | 39 (100.0%) |
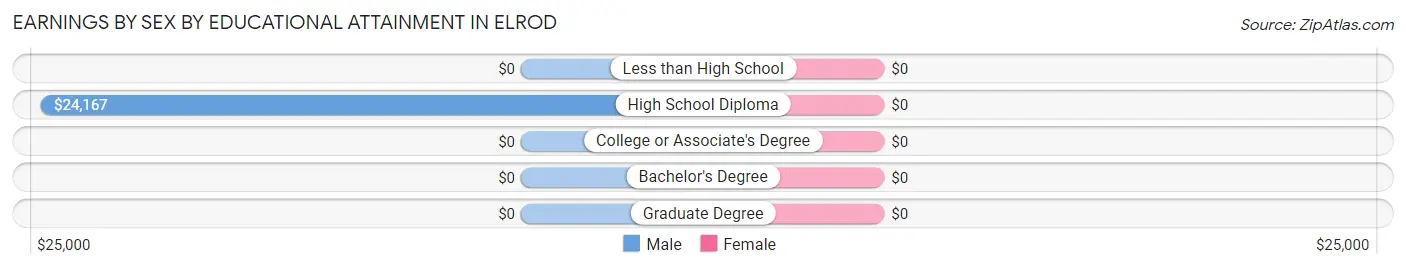
Earnings by Sex by Educational Attainment in Elrod
| Educational Attainment | Male Income | Female Income |
| Less than High School | - | - |
| High School Diploma | $24,167 | $0 |
| College or Associate's Degree | - | - |
| Bachelor's Degree | - | - |
| Graduate Degree | - | - |
| Total | $25,729 | $26,587 |
Family Income in Elrod
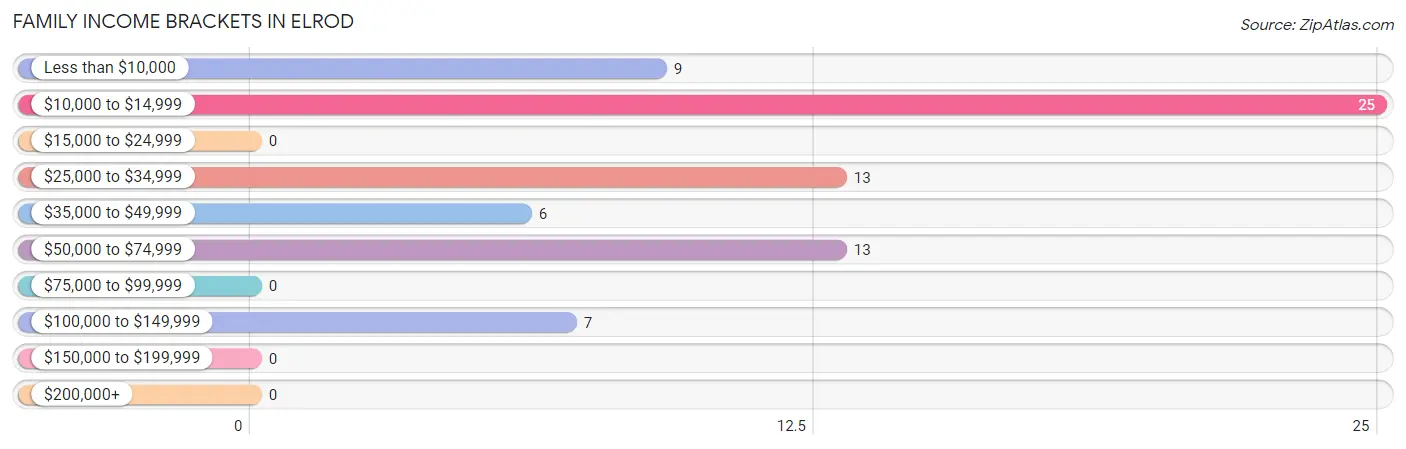
Family Income Brackets in Elrod
According to the Elrod family income data, there are 25 families falling into the $10,000 to $14,999 income range, which is the most common income bracket and makes up 34.3% of all families.
| Income Bracket | # Families | % Families |
| Less than $10,000 | 9 | 12.3% |
| $10,000 to $14,999 | 25 | 34.2% |
| $15,000 to $24,999 | 0 | 0.0% |
| $25,000 to $34,999 | 13 | 17.8% |
| $35,000 to $49,999 | 6 | 8.2% |
| $50,000 to $74,999 | 13 | 17.8% |
| $75,000 to $99,999 | 0 | 0.0% |
| $100,000 to $149,999 | 7 | 9.6% |
| $150,000 to $199,999 | 0 | 0.0% |
| $200,000+ | 0 | 0.0% |
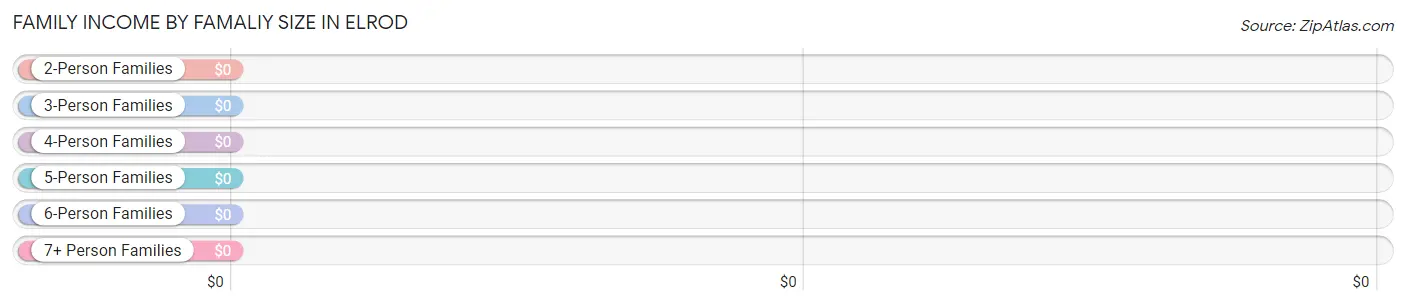
Family Income by Famaliy Size in Elrod
| Income Bracket | # Families | Median Income |
| 2-Person Families | 32 (43.8%) | $0 |
| 3-Person Families | 35 (47.9%) | $0 |
| 4-Person Families | 6 (8.2%) | $0 |
| 5-Person Families | 0 (0.0%) | $0 |
| 6-Person Families | 0 (0.0%) | $0 |
| 7+ Person Families | 0 (0.0%) | $0 |
| Total | 73 (100.0%) | $25,481 |
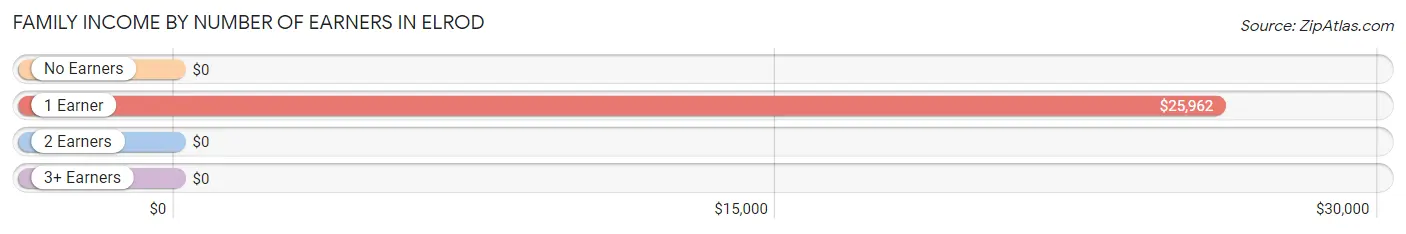
Family Income by Number of Earners in Elrod
| Number of Earners | # Families | Median Income |
| No Earners | 25 (34.3%) | $0 |
| 1 Earner | 28 (38.4%) | $25,962 |
| 2 Earners | 20 (27.4%) | $0 |
| 3+ Earners | 0 (0.0%) | $0 |
| Total | 73 (100.0%) | $25,481 |
Household Income in Elrod
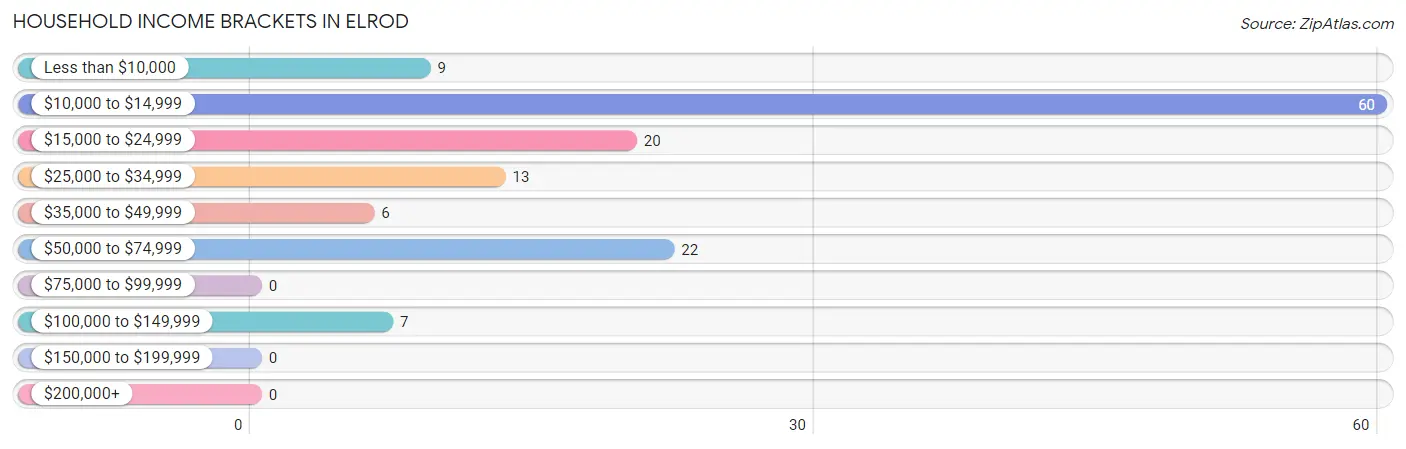
Household Income Brackets in Elrod
With 60 households falling in the category, the $10,000 to $14,999 income range is the most frequent in Elrod, accounting for 43.8% of all households.
| Income Bracket | # Households | % Households |
| Less than $10,000 | 9 | 6.6% |
| $10,000 to $14,999 | 60 | 43.8% |
| $15,000 to $24,999 | 20 | 14.6% |
| $25,000 to $34,999 | 13 | 9.5% |
| $35,000 to $49,999 | 6 | 4.4% |
| $50,000 to $74,999 | 22 | 16.1% |
| $75,000 to $99,999 | 0 | 0.0% |
| $100,000 to $149,999 | 7 | 5.1% |
| $150,000 to $199,999 | 0 | 0.0% |
| $200,000+ | 0 | 0.0% |
Household Income by Householder Age in Elrod
The median household income in Elrod is $0, with the highest median household income of $36,458 found in the 25 to 44 years age bracket for the primary householder. A total of 49 households (35.8%) fall into this category. Meanwhile, the 15 to 24 years age bracket for the primary householder has the lowest median household income of $0, with 9 households (6.6%) in this group.
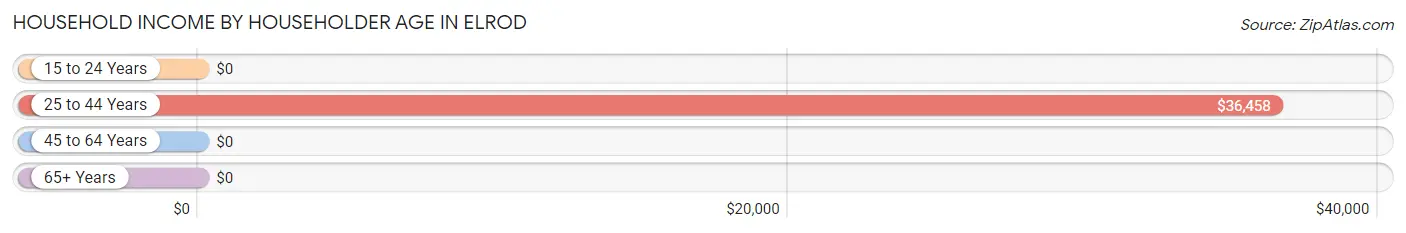
| Income Bracket | # Households | Median Income |
| 15 to 24 Years | 9 (6.6%) | $0 |
| 25 to 44 Years | 49 (35.8%) | $36,458 |
| 45 to 64 Years | 62 (45.3%) | $0 |
| 65+ Years | 17 (12.4%) | $0 |
| Total | 137 (100.0%) | $0 |
Poverty in Elrod
Income Below Poverty by Sex and Age in Elrod
With 49.7% poverty level for males and 41.7% for females among the residents of Elrod, 15 year old males and 25 to 34 year old females are the most vulnerable to poverty, with 23 males (100.0%) and 15 females (100.0%) in their respective age groups living below the poverty level.
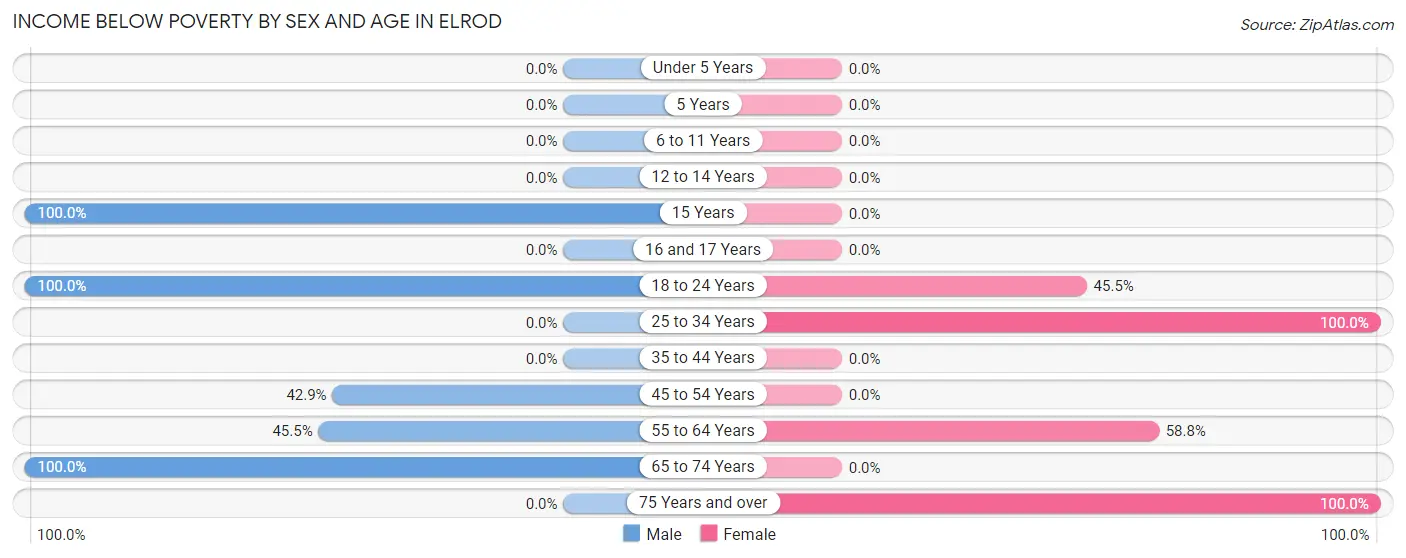
| Age Bracket | Male | Female |
| Under 5 Years | 0 (0.0%) | 0 (0.0%) |
| 5 Years | 0 (0.0%) | 0 (0.0%) |
| 6 to 11 Years | 0 (0.0%) | 0 (0.0%) |
| 12 to 14 Years | 0 (0.0%) | 0 (0.0%) |
| 15 Years | 23 (100.0%) | 0 (0.0%) |
| 16 and 17 Years | 0 (0.0%) | 0 (0.0%) |
| 18 to 24 Years | 22 (100.0%) | 10 (45.5%) |
| 25 to 34 Years | 0 (0.0%) | 15 (100.0%) |
| 35 to 44 Years | 0 (0.0%) | 0 (0.0%) |
| 45 to 54 Years | 15 (42.9%) | 0 (0.0%) |
| 55 to 64 Years | 10 (45.5%) | 10 (58.8%) |
| 65 to 74 Years | 10 (100.0%) | 0 (0.0%) |
| 75 Years and over | 0 (0.0%) | 8 (100.0%) |
| Total | 80 (49.7%) | 43 (41.7%) |
Income Above Poverty by Sex and Age in Elrod
According to the poverty statistics in Elrod, males aged 6 to 11 years and females aged 6 to 11 years are the age groups that are most secure financially, with 100.0% of males and 100.0% of females in these age groups living above the poverty line.
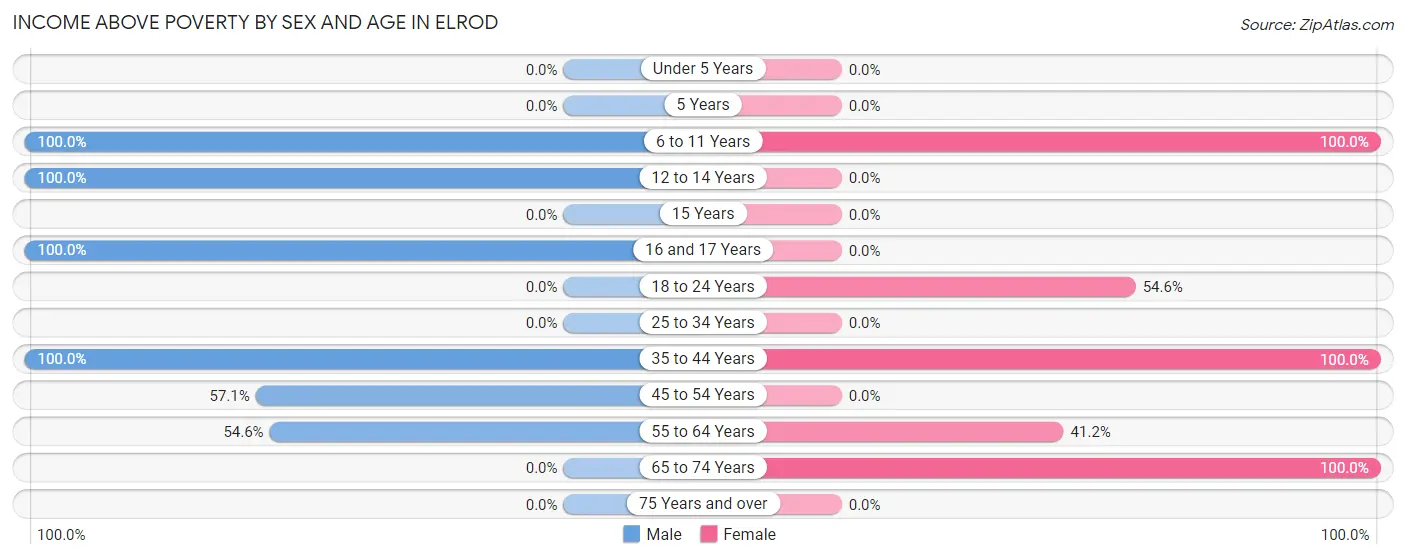
| Age Bracket | Male | Female |
| Under 5 Years | 0 (0.0%) | 0 (0.0%) |
| 5 Years | 0 (0.0%) | 0 (0.0%) |
| 6 to 11 Years | 11 (100.0%) | 6 (100.0%) |
| 12 to 14 Years | 12 (100.0%) | 0 (0.0%) |
| 15 Years | 0 (0.0%) | 0 (0.0%) |
| 16 and 17 Years | 11 (100.0%) | 0 (0.0%) |
| 18 to 24 Years | 0 (0.0%) | 12 (54.5%) |
| 25 to 34 Years | 0 (0.0%) | 0 (0.0%) |
| 35 to 44 Years | 15 (100.0%) | 26 (100.0%) |
| 45 to 54 Years | 20 (57.1%) | 0 (0.0%) |
| 55 to 64 Years | 12 (54.5%) | 7 (41.2%) |
| 65 to 74 Years | 0 (0.0%) | 9 (100.0%) |
| 75 Years and over | 0 (0.0%) | 0 (0.0%) |
| Total | 81 (50.3%) | 60 (58.3%) |
Income Below Poverty Among Married-Couple Families in Elrod
The poverty statistics for married-couple families in Elrod show that 43.5% or 10 of the total 23 families live below the poverty line. Families with no children have the highest poverty rate of 100.0%, comprising of 10 families. On the other hand, families with 1 or 2 children have the lowest poverty rate of 0.0%, which includes 0 families.
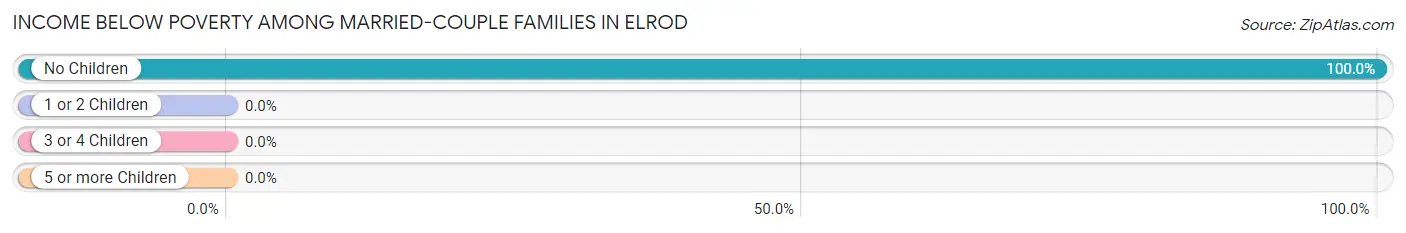
| Children | Above Poverty | Below Poverty |
| No Children | 0 (0.0%) | 10 (100.0%) |
| 1 or 2 Children | 13 (100.0%) | 0 (0.0%) |
| 3 or 4 Children | 0 (0.0%) | 0 (0.0%) |
| 5 or more Children | 0 (0.0%) | 0 (0.0%) |
| Total | 13 (56.5%) | 10 (43.5%) |
Income Below Poverty Among Single-Parent Households in Elrod

| Children | Single Father | Single Mother |
| No Children | 9 (100.0%) | 0 (0.0%) |
| 1 or 2 Children | 15 (100.0%) | 0 (0.0%) |
| 3 or 4 Children | 0 (0.0%) | 0 (0.0%) |
| 5 or more Children | 0 (0.0%) | 0 (0.0%) |
| Total | 24 (80.0%) | 0 (0.0%) |
Income Below Poverty Among Married-Couple vs Single-Parent Households in Elrod
The poverty data for Elrod shows that 10 of the married-couple family households (43.5%) and 24 of the single-parent households (48.0%) are living below the poverty level. Within the married-couple family households, those with no children have the highest poverty rate, with 10 households (100.0%) falling below the poverty line. Among the single-parent households, those with no children have the highest poverty rate, with 9 household (56.2%) living below poverty.
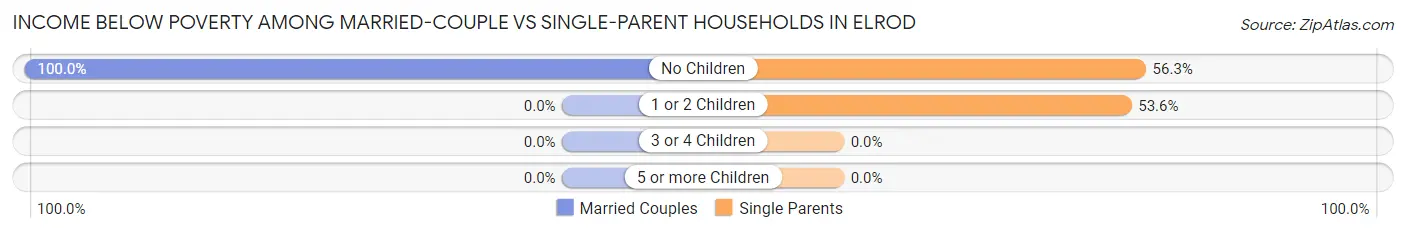
| Children | Married-Couple Families | Single-Parent Households |
| No Children | 10 (100.0%) | 9 (56.2%) |
| 1 or 2 Children | 0 (0.0%) | 15 (53.6%) |
| 3 or 4 Children | 0 (0.0%) | 0 (0.0%) |
| 5 or more Children | 0 (0.0%) | 0 (0.0%) |
| Total | 10 (43.5%) | 24 (48.0%) |
Race in Elrod
The most populous races in Elrod are Native / Alaskan (237 | 89.8%), White / Caucasian (19 | 7.2%), and Black / African American (8 | 3.0%).
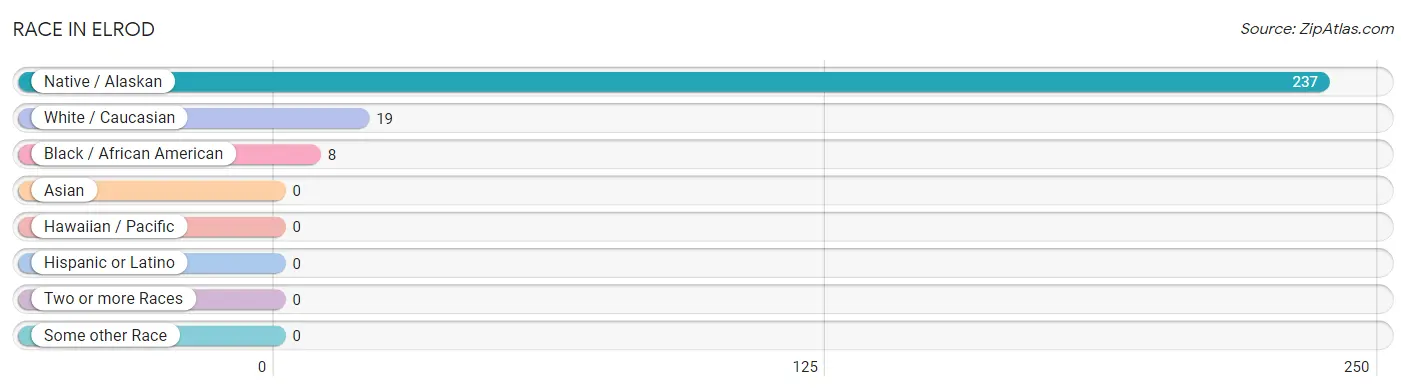
| Race | # Population | % Population |
| Asian | 0 | 0.0% |
| Black / African American | 8 | 3.0% |
| Hawaiian / Pacific | 0 | 0.0% |
| Hispanic or Latino | 0 | 0.0% |
| Native / Alaskan | 237 | 89.8% |
| White / Caucasian | 19 | 7.2% |
| Two or more Races | 0 | 0.0% |
| Some other Race | 0 | 0.0% |
| Total | 264 | 100.0% |
Ancestry in Elrod
The most populous ancestries reported in Elrod are Lumbee (164 | 62.1%), American (19 | 7.2%), and Cherokee (9 | 3.4%), together accounting for 72.7% of all Elrod residents.
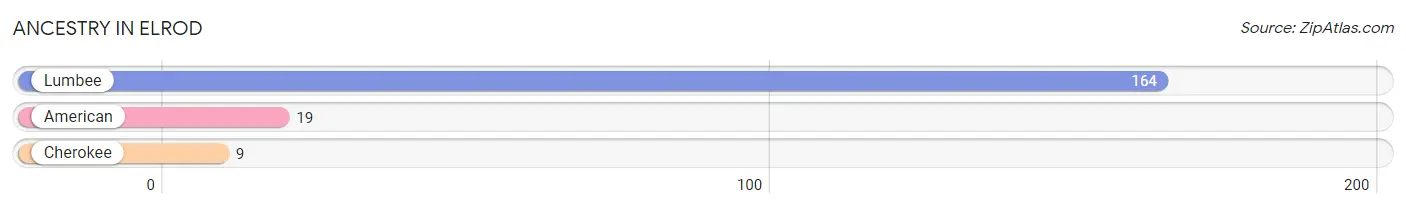
| Ancestry | # Population | % Population |
| American | 19 | 7.2% |
| Cherokee | 9 | 3.4% |
| Lumbee | 164 | 62.1% | View All 3 Rows |
Immigrants in Elrod

| Immigration Origin | # Population | % Population | View All 0 Rows |
Sex and Age in Elrod
Sex and Age in Elrod
The most populous age groups in Elrod are 15 to 19 Years (43 | 26.7%) for men and 30 to 34 Years (15 | 14.6%) for women.
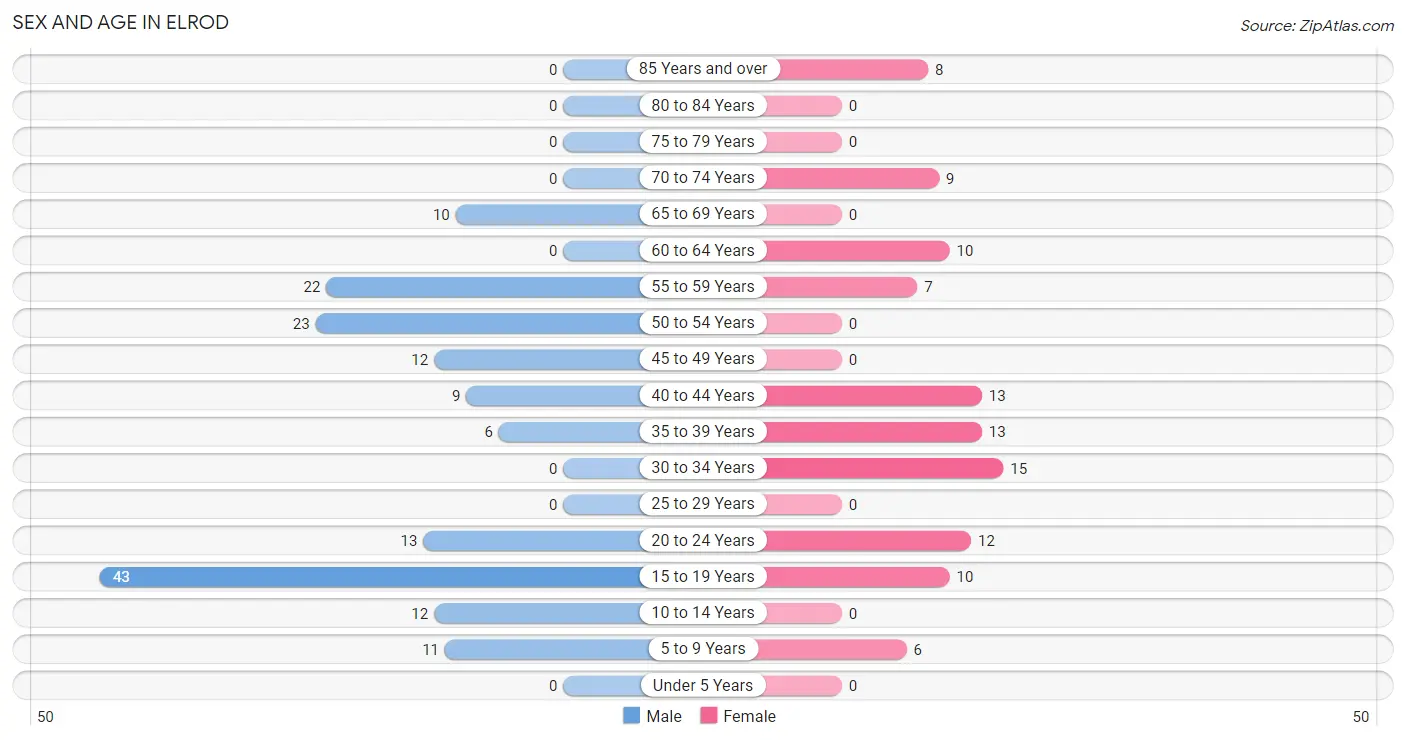
| Age Bracket | Male | Female |
| Under 5 Years | 0 (0.0%) | 0 (0.0%) |
| 5 to 9 Years | 11 (6.8%) | 6 (5.8%) |
| 10 to 14 Years | 12 (7.4%) | 0 (0.0%) |
| 15 to 19 Years | 43 (26.7%) | 10 (9.7%) |
| 20 to 24 Years | 13 (8.1%) | 12 (11.7%) |
| 25 to 29 Years | 0 (0.0%) | 0 (0.0%) |
| 30 to 34 Years | 0 (0.0%) | 15 (14.6%) |
| 35 to 39 Years | 6 (3.7%) | 13 (12.6%) |
| 40 to 44 Years | 9 (5.6%) | 13 (12.6%) |
| 45 to 49 Years | 12 (7.4%) | 0 (0.0%) |
| 50 to 54 Years | 23 (14.3%) | 0 (0.0%) |
| 55 to 59 Years | 22 (13.7%) | 7 (6.8%) |
| 60 to 64 Years | 0 (0.0%) | 10 (9.7%) |
| 65 to 69 Years | 10 (6.2%) | 0 (0.0%) |
| 70 to 74 Years | 0 (0.0%) | 9 (8.7%) |
| 75 to 79 Years | 0 (0.0%) | 0 (0.0%) |
| 80 to 84 Years | 0 (0.0%) | 0 (0.0%) |
| 85 Years and over | 0 (0.0%) | 8 (7.8%) |
| Total | 161 (100.0%) | 103 (100.0%) |
Families and Households in Elrod
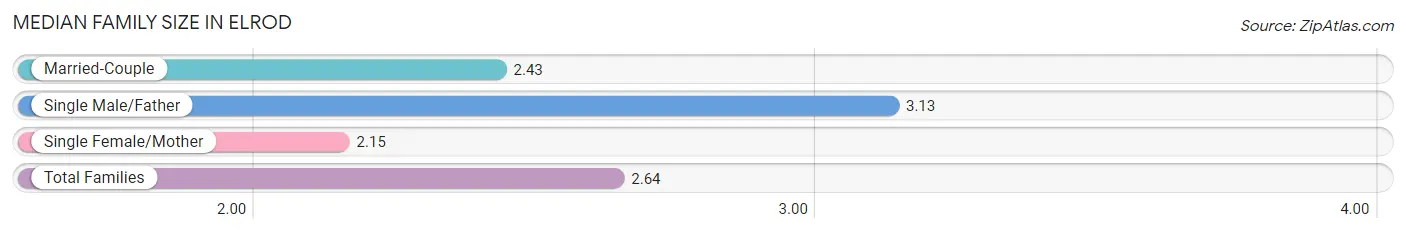
Median Family Size in Elrod
The median family size in Elrod is 2.64 persons per family, with single male/father families (30 | 41.1%) accounting for the largest median family size of 3.13 persons per family. On the other hand, single female/mother families (20 | 27.4%) represent the smallest median family size with 2.15 persons per family.
| Family Type | # Families | Family Size |
| Married-Couple | 23 (31.5%) | 2.43 |
| Single Male/Father | 30 (41.1%) | 3.13 |
| Single Female/Mother | 20 (27.4%) | 2.15 |
| Total Families | 73 (100.0%) | 2.64 |
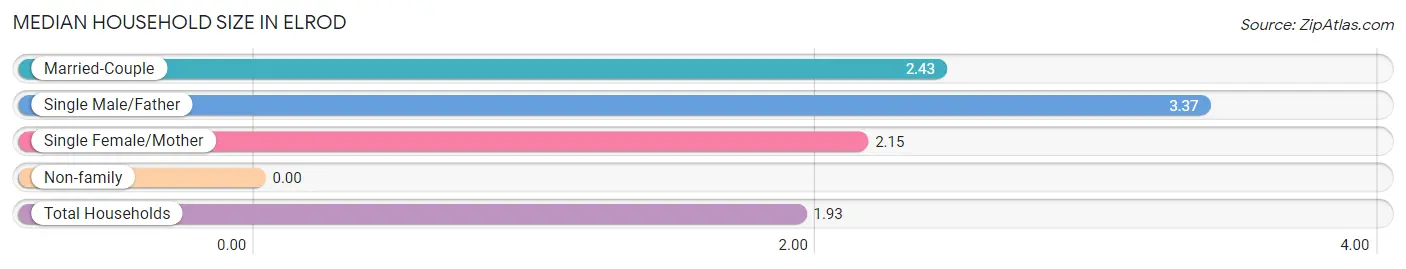
Median Household Size in Elrod
| Household Type | # Households | Household Size |
| Married-Couple | 23 (16.8%) | 2.43 |
| Single Male/Father | 30 (21.9%) | 3.37 |
| Single Female/Mother | 20 (14.6%) | 2.15 |
| Non-family | 64 (46.7%) | - |
| Total Households | 137 (100.0%) | 1.93 |
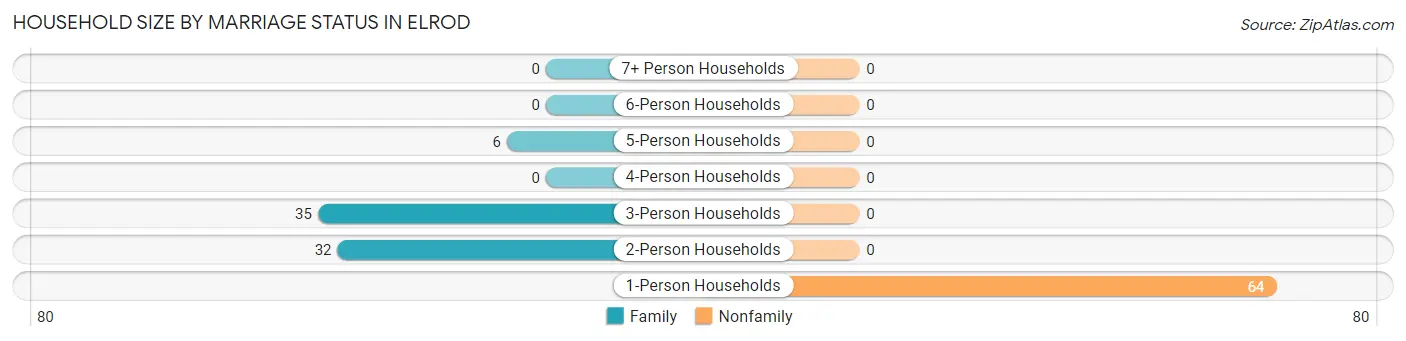
Household Size by Marriage Status in Elrod
Out of a total of 137 households in Elrod, 73 (53.3%) are family households, while 64 (46.7%) are nonfamily households. The most numerous type of family households are 3-person households, comprising 35, and the most common type of nonfamily households are 1-person households, comprising 64.
| Household Size | Family Households | Nonfamily Households |
| 1-Person Households | - | 64 (46.7%) |
| 2-Person Households | 32 (23.4%) | 0 (0.0%) |
| 3-Person Households | 35 (25.6%) | 0 (0.0%) |
| 4-Person Households | 0 (0.0%) | 0 (0.0%) |
| 5-Person Households | 6 (4.4%) | 0 (0.0%) |
| 6-Person Households | 0 (0.0%) | 0 (0.0%) |
| 7+ Person Households | 0 (0.0%) | 0 (0.0%) |
| Total | 73 (53.3%) | 64 (46.7%) |
Female Fertility in Elrod
Fertility by Age in Elrod
| Age Bracket | Women with Births | Births / 1,000 Women |
| 15 to 19 years | 0 (0.0%) | 0.0 |
| 20 to 34 years | 0 (0.0%) | 0.0 |
| 35 to 50 years | 0 (0.0%) | 0.0 |
| Total | 0 (0.0%) | 0.0 |
Fertility by Age by Marriage Status in Elrod
| Age Bracket | Married | Unmarried |
| 15 to 19 years | 0 (0.0%) | 0 (0.0%) |
| 20 to 34 years | 0 (0.0%) | 0 (0.0%) |
| 35 to 50 years | 0 (0.0%) | 0 (0.0%) |
| Total | 0 (0.0%) | 0 (0.0%) |
Fertility by Education in Elrod
| Educational Attainment | Women with Births | Births / 1,000 Women |
| Less than High School | 0 (0.0%) | 0.0 |
| High School Diploma | 0 (0.0%) | 0.0 |
| College or Associate's Degree | 0 (0.0%) | 0.0 |
| Bachelor's Degree | 0 (0.0%) | 0.0 |
| Graduate Degree | 0 (0.0%) | 0.0 |
| Total | 0 (0.0%) | 0.0 |
Fertility by Education by Marriage Status in Elrod
| Educational Attainment | Married | Unmarried |
| Less than High School | 0 (0.0%) | 0 (0.0%) |
| High School Diploma | 0 (0.0%) | 0 (0.0%) |
| College or Associate's Degree | 0 (0.0%) | 0 (0.0%) |
| Bachelor's Degree | 0 (0.0%) | 0 (0.0%) |
| Graduate Degree | 0 (0.0%) | 0 (0.0%) |
| Total | 0 (0.0%) | 0 (0.0%) |
Employment Characteristics in Elrod
Employment by Class of Employer in Elrod
Among the 81 employed individuals in Elrod, private company employees (68 | 84.0%), and local government employees (13 | 16.1%) make up the most common classes of employment.
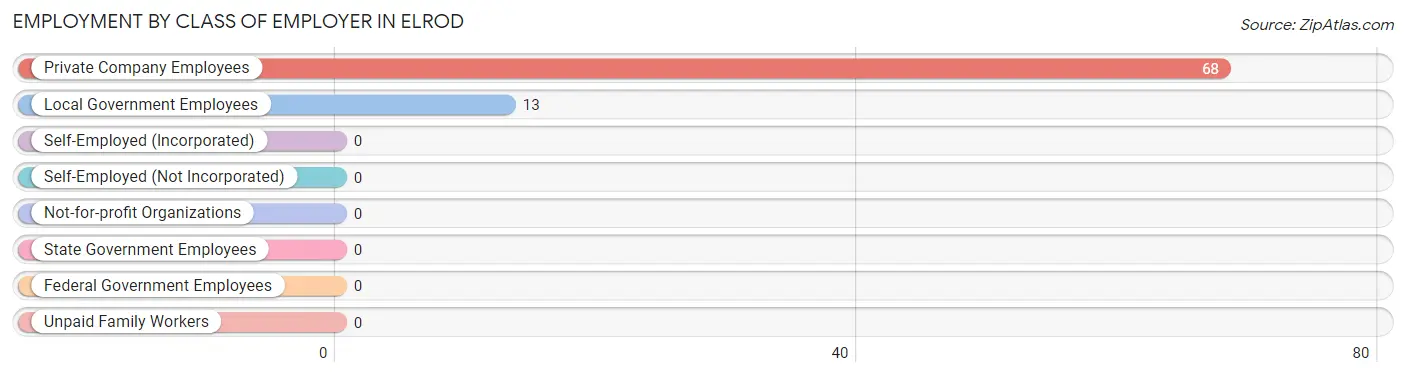
| Employer Class | # Employees | % Employees |
| Private Company Employees | 68 | 84.0% |
| Self-Employed (Incorporated) | 0 | 0.0% |
| Self-Employed (Not Incorporated) | 0 | 0.0% |
| Not-for-profit Organizations | 0 | 0.0% |
| Local Government Employees | 13 | 16.1% |
| State Government Employees | 0 | 0.0% |
| Federal Government Employees | 0 | 0.0% |
| Unpaid Family Workers | 0 | 0.0% |
| Total | 81 | 100.0% |
Employment Status by Age in Elrod
According to the labor force statistics for Elrod, out of the total population over 16 years of age (212), 44.3% or 94 individuals are in the labor force, with 13.8% or 13 of them unemployed. The age group with the highest labor force participation rate is 35 to 44 years, with 100.0% or 41 individuals in the labor force. Within the labor force, the 30 to 34 years age range has the highest percentage of unemployed individuals, with 100.0% or 7 of them being unemployed.
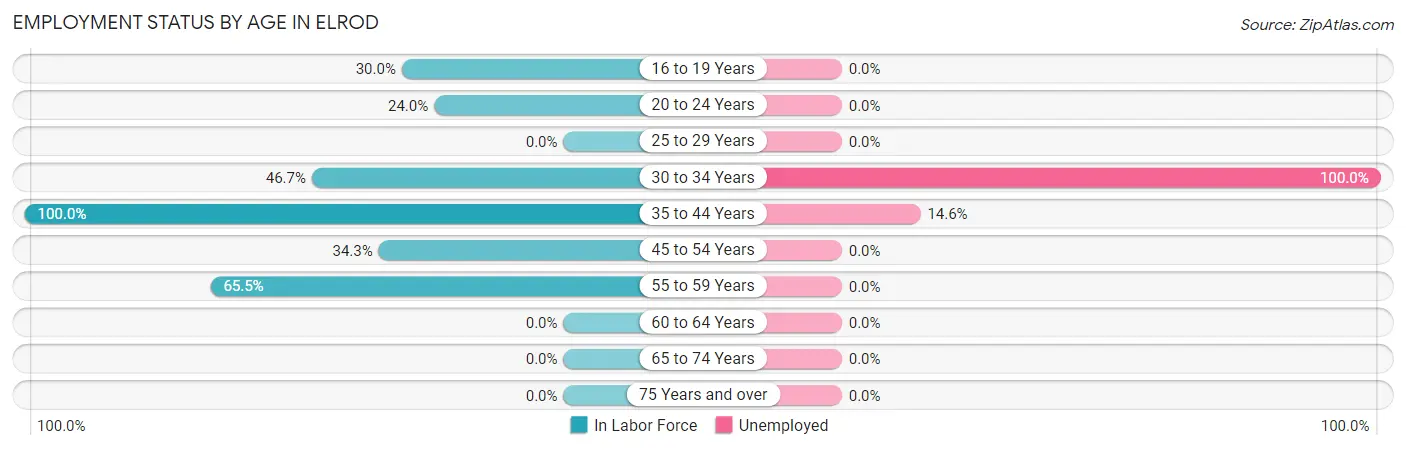
| Age Bracket | In Labor Force | Unemployed |
| 16 to 19 Years | 9 (30.0%) | 0 (0.0%) |
| 20 to 24 Years | 6 (24.0%) | 0 (0.0%) |
| 25 to 29 Years | 0 (0.0%) | 0 (0.0%) |
| 30 to 34 Years | 7 (46.7%) | 7 (100.0%) |
| 35 to 44 Years | 41 (100.0%) | 6 (14.6%) |
| 45 to 54 Years | 12 (34.3%) | 0 (0.0%) |
| 55 to 59 Years | 19 (65.5%) | 0 (0.0%) |
| 60 to 64 Years | 0 (0.0%) | 0 (0.0%) |
| 65 to 74 Years | 0 (0.0%) | 0 (0.0%) |
| 75 Years and over | 0 (0.0%) | 0 (0.0%) |
| Total | 94 (44.3%) | 13 (13.8%) |
Employment Status by Educational Attainment in Elrod
According to labor force statistics for Elrod, 60.8% of individuals (79) out of the total population between 25 and 64 years of age (130) are in the labor force, with 16.5% or 13 of them being unemployed. The group with the highest labor force participation rate are those with the educational attainment of bachelor's degree or higher, with 100.0% or 7 individuals in the labor force. Within the labor force, individuals with less than high school education have the highest percentage of unemployment, with 50.0% or 13 of them being unemployed.
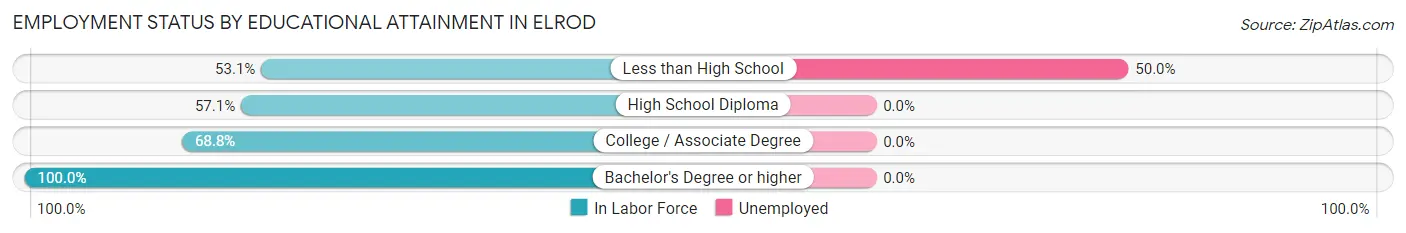
| Educational Attainment | In Labor Force | Unemployed |
| Less than High School | 26 (53.1%) | 24 (50.0%) |
| High School Diploma | 24 (57.1%) | 0 (0.0%) |
| College / Associate Degree | 22 (68.8%) | 0 (0.0%) |
| Bachelor's Degree or higher | 7 (100.0%) | 0 (0.0%) |
| Total | 79 (60.8%) | 21 (16.5%) |
Employment Occupations by Sex in Elrod
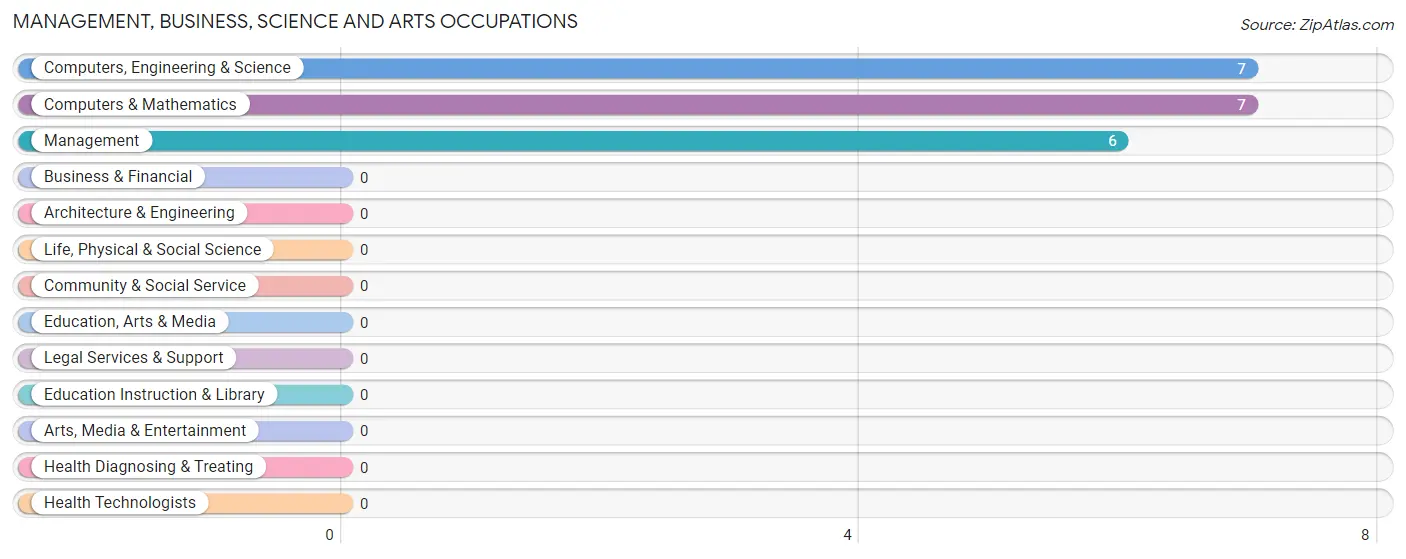
Management, Business, Science and Arts Occupations
The most common Management, Business, Science and Arts occupations in Elrod are Computers, Engineering & Science (7 | 8.6%), Computers & Mathematics (7 | 8.6%), and Management (6 | 7.4%).
Management, Business, Science and Arts Occupations by Sex
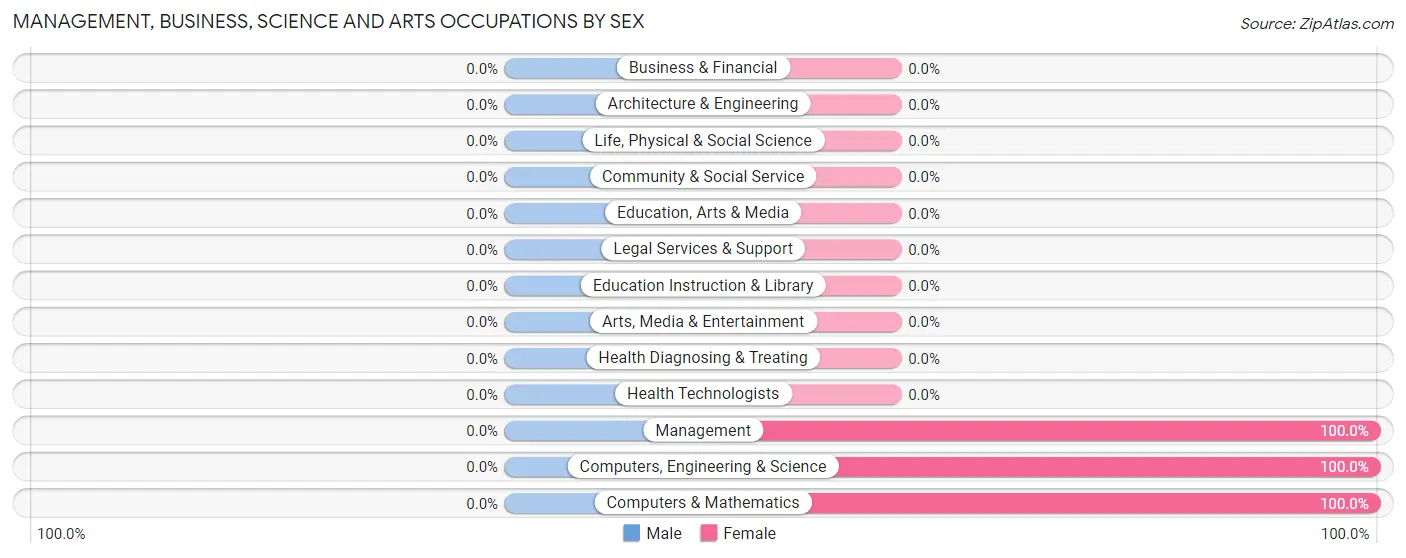
| Occupation | Male | Female |
| Management | 0 (0.0%) | 6 (100.0%) |
| Business & Financial | 0 (0.0%) | 0 (0.0%) |
| Computers, Engineering & Science | 0 (0.0%) | 7 (100.0%) |
| Computers & Mathematics | 0 (0.0%) | 7 (100.0%) |
| Architecture & Engineering | 0 (0.0%) | 0 (0.0%) |
| Life, Physical & Social Science | 0 (0.0%) | 0 (0.0%) |
| Community & Social Service | 0 (0.0%) | 0 (0.0%) |
| Education, Arts & Media | 0 (0.0%) | 0 (0.0%) |
| Legal Services & Support | 0 (0.0%) | 0 (0.0%) |
| Education Instruction & Library | 0 (0.0%) | 0 (0.0%) |
| Arts, Media & Entertainment | 0 (0.0%) | 0 (0.0%) |
| Health Diagnosing & Treating | 0 (0.0%) | 0 (0.0%) |
| Health Technologists | 0 (0.0%) | 0 (0.0%) |
| Total (Category) | 0 (0.0%) | 13 (100.0%) |
| Total (Overall) | 42 (51.8%) | 39 (48.1%) |
Services Occupations
Services Occupations by Sex
| Occupation | Male | Female |
| Healthcare Support | 0 (0.0%) | 0 (0.0%) |
| Security & Protection | 0 (0.0%) | 0 (0.0%) |
| Firefighting & Prevention | 0 (0.0%) | 0 (0.0%) |
| Law Enforcement | 0 (0.0%) | 0 (0.0%) |
| Food Preparation & Serving | 0 (0.0%) | 0 (0.0%) |
| Cleaning & Maintenance | 0 (0.0%) | 0 (0.0%) |
| Personal Care & Service | 0 (0.0%) | 0 (0.0%) |
| Total (Category) | 0 (0.0%) | 0 (0.0%) |
| Total (Overall) | 42 (51.8%) | 39 (48.1%) |
Sales and Office Occupations
The most common Sales and Office occupations in Elrod are , and Sales & Related (9 | 11.1%).
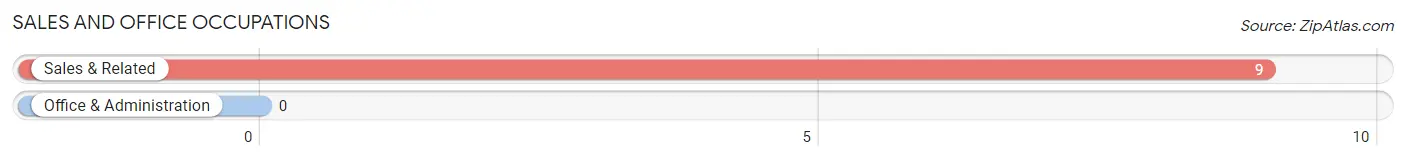
Sales and Office Occupations by Sex

| Occupation | Male | Female |
| Sales & Related | 9 (100.0%) | 0 (0.0%) |
| Office & Administration | 0 (0.0%) | 0 (0.0%) |
| Total (Category) | 9 (100.0%) | 0 (0.0%) |
| Total (Overall) | 42 (51.8%) | 39 (48.1%) |
Natural Resources, Construction and Maintenance Occupations
The most common Natural Resources, Construction and Maintenance occupations in Elrod are , and Installation, Maintenance & Repair (13 | 16.1%).
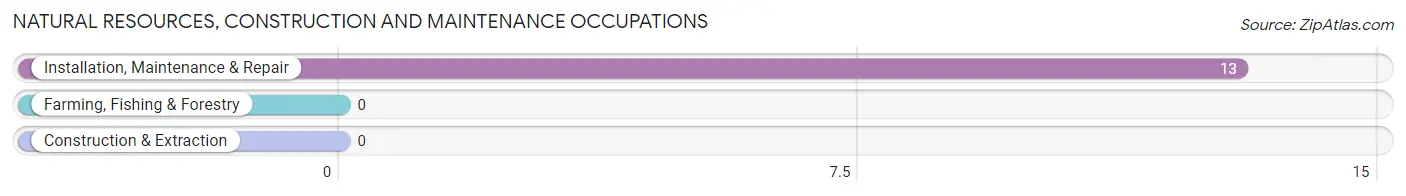
Natural Resources, Construction and Maintenance Occupations by Sex

| Occupation | Male | Female |
| Farming, Fishing & Forestry | 0 (0.0%) | 0 (0.0%) |
| Construction & Extraction | 0 (0.0%) | 0 (0.0%) |
| Installation, Maintenance & Repair | 0 (0.0%) | 13 (100.0%) |
| Total (Category) | 0 (0.0%) | 13 (100.0%) |
| Total (Overall) | 42 (51.8%) | 39 (48.1%) |
Production, Transportation and Moving Occupations
The most common Production, Transportation and Moving occupations in Elrod are Material Moving (24 | 29.6%), and Production (22 | 27.2%).
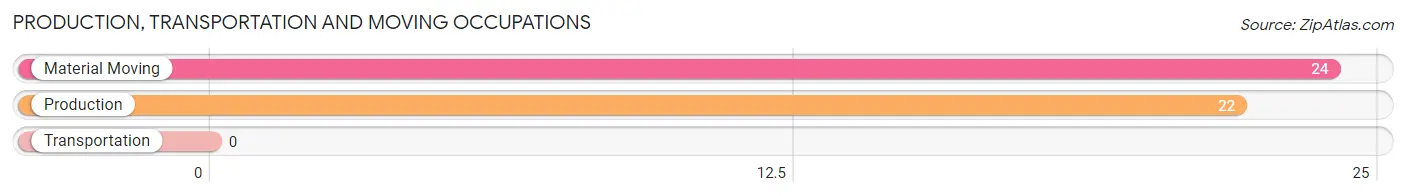
Production, Transportation and Moving Occupations by Sex
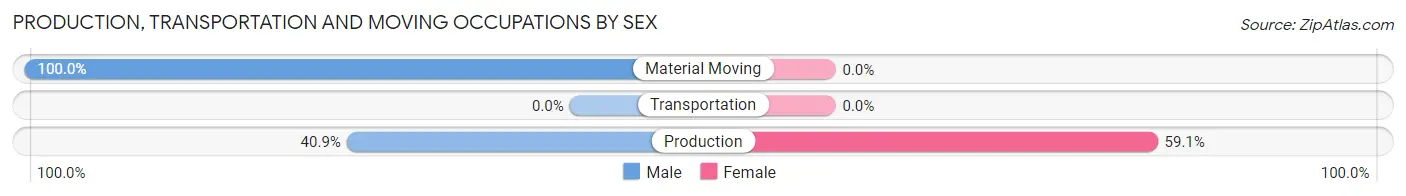
| Occupation | Male | Female |
| Production | 9 (40.9%) | 13 (59.1%) |
| Transportation | 0 (0.0%) | 0 (0.0%) |
| Material Moving | 24 (100.0%) | 0 (0.0%) |
| Total (Category) | 33 (71.7%) | 13 (28.3%) |
| Total (Overall) | 42 (51.8%) | 39 (48.1%) |
Employment Industries by Sex in Elrod
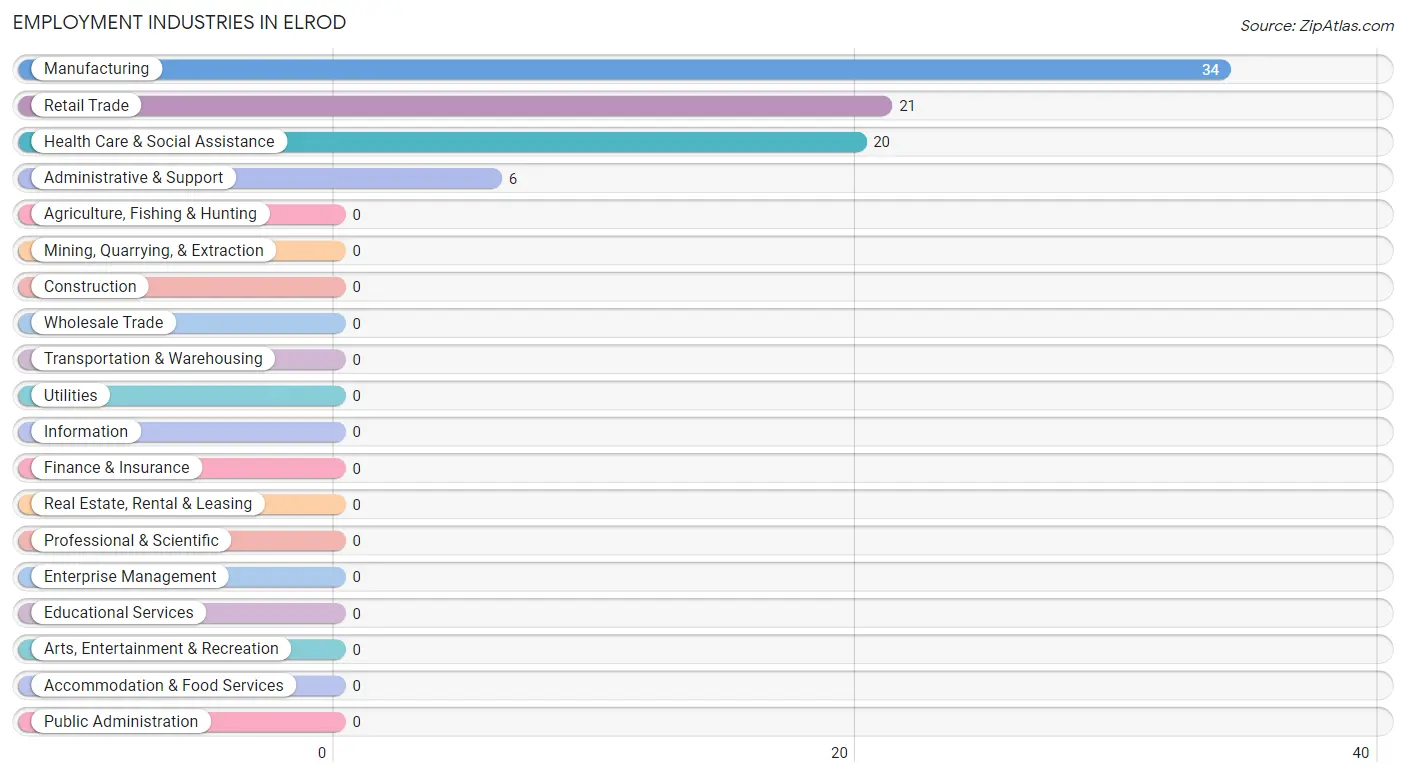
Employment Industries in Elrod
The major employment industries in Elrod include Manufacturing (34 | 42.0%), Retail Trade (21 | 25.9%), Health Care & Social Assistance (20 | 24.7%), and Administrative & Support (6 | 7.4%).
Employment Industries by Sex in Elrod
The Elrod industries that see more men than women are Retail Trade (100.0%), and Manufacturing (61.8%), whereas the industries that tend to have a higher number of women are Administrative & Support (100.0%), Health Care & Social Assistance (100.0%), and Manufacturing (38.2%).
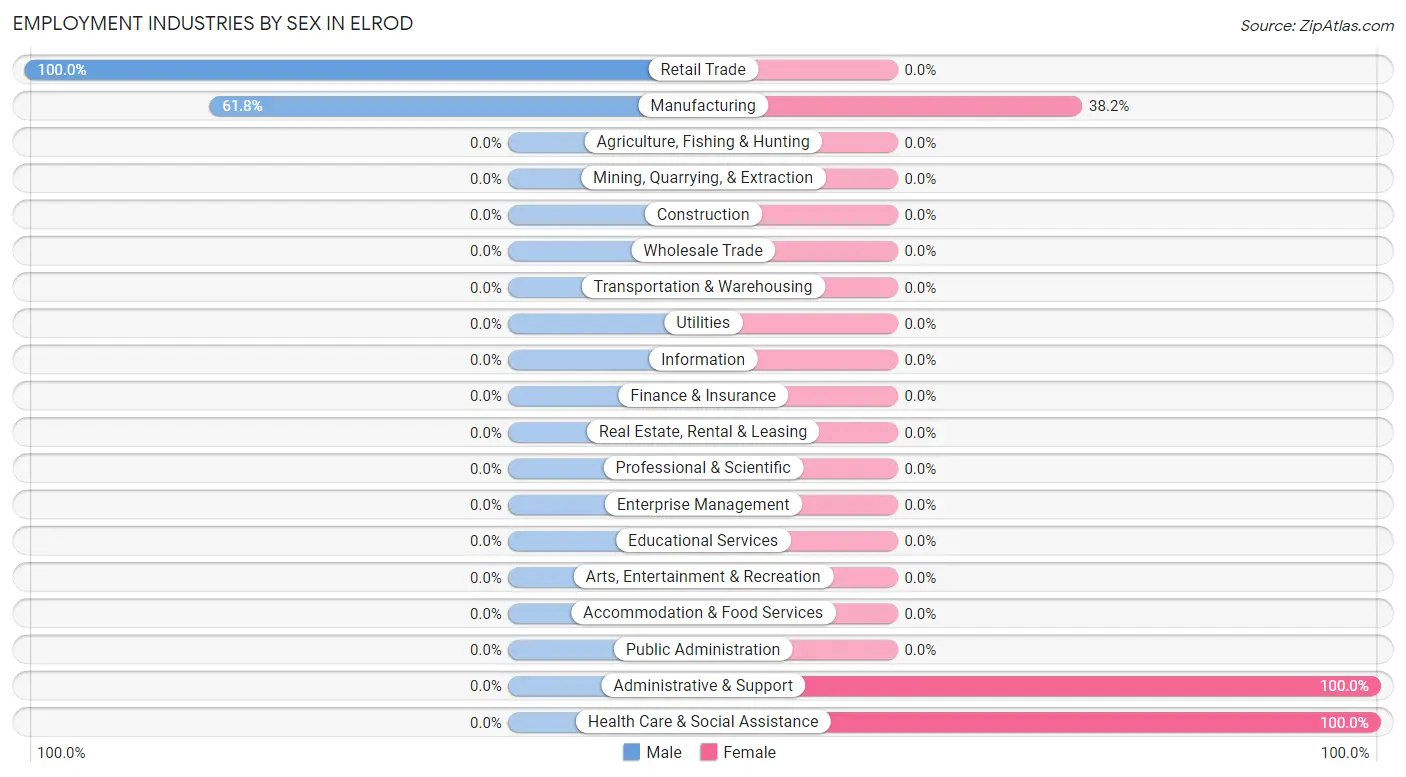
| Industry | Male | Female |
| Agriculture, Fishing & Hunting | 0 (0.0%) | 0 (0.0%) |
| Mining, Quarrying, & Extraction | 0 (0.0%) | 0 (0.0%) |
| Construction | 0 (0.0%) | 0 (0.0%) |
| Manufacturing | 21 (61.8%) | 13 (38.2%) |
| Wholesale Trade | 0 (0.0%) | 0 (0.0%) |
| Retail Trade | 21 (100.0%) | 0 (0.0%) |
| Transportation & Warehousing | 0 (0.0%) | 0 (0.0%) |
| Utilities | 0 (0.0%) | 0 (0.0%) |
| Information | 0 (0.0%) | 0 (0.0%) |
| Finance & Insurance | 0 (0.0%) | 0 (0.0%) |
| Real Estate, Rental & Leasing | 0 (0.0%) | 0 (0.0%) |
| Professional & Scientific | 0 (0.0%) | 0 (0.0%) |
| Enterprise Management | 0 (0.0%) | 0 (0.0%) |
| Administrative & Support | 0 (0.0%) | 6 (100.0%) |
| Educational Services | 0 (0.0%) | 0 (0.0%) |
| Health Care & Social Assistance | 0 (0.0%) | 20 (100.0%) |
| Arts, Entertainment & Recreation | 0 (0.0%) | 0 (0.0%) |
| Accommodation & Food Services | 0 (0.0%) | 0 (0.0%) |
| Public Administration | 0 (0.0%) | 0 (0.0%) |
| Total | 42 (51.8%) | 39 (48.1%) |
Education in Elrod
School Enrollment in Elrod
The most common levels of schooling among the 59 students in Elrod are high school (24 | 40.7%), elementary school (17 | 28.8%), and middle school (12 | 20.3%).
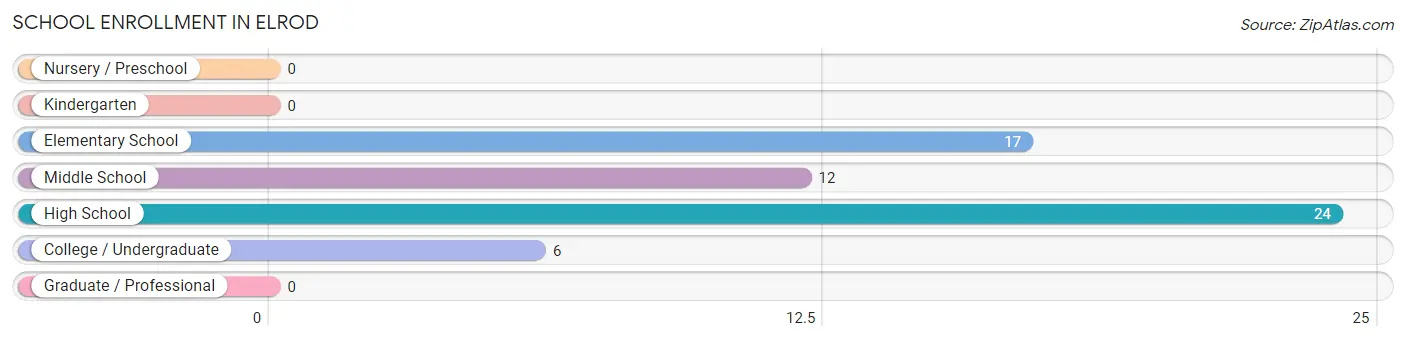
| School Level | # Students | % Students |
| Nursery / Preschool | 0 | 0.0% |
| Kindergarten | 0 | 0.0% |
| Elementary School | 17 | 28.8% |
| Middle School | 12 | 20.3% |
| High School | 24 | 40.7% |
| College / Undergraduate | 6 | 10.2% |
| Graduate / Professional | 0 | 0.0% |
| Total | 59 | 100.0% |
School Enrollment by Age by Funding Source in Elrod
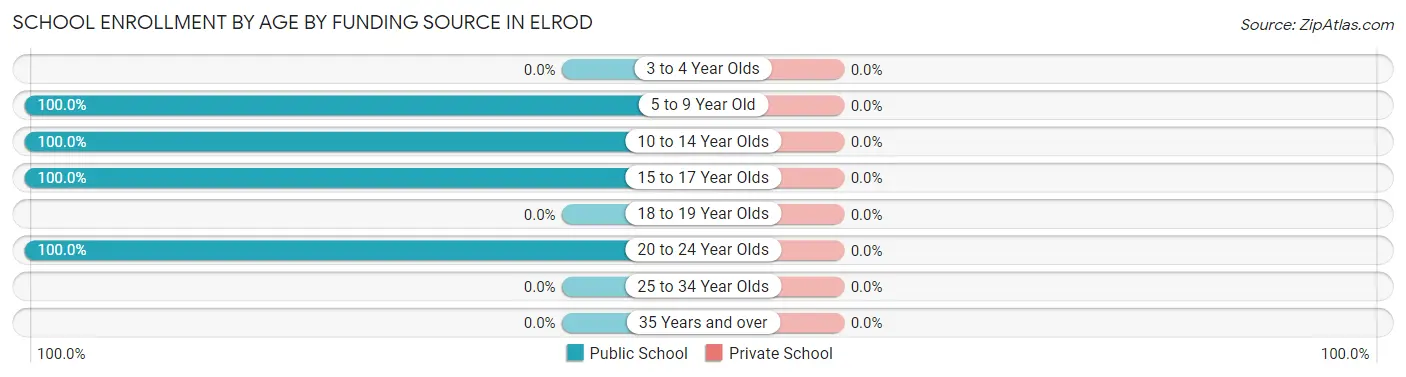
| Age Bracket | Public School | Private School |
| 3 to 4 Year Olds | 0 (0.0%) | 0 (0.0%) |
| 5 to 9 Year Old | 17 (100.0%) | 0 (0.0%) |
| 10 to 14 Year Olds | 12 (100.0%) | 0 (0.0%) |
| 15 to 17 Year Olds | 11 (100.0%) | 0 (0.0%) |
| 18 to 19 Year Olds | 0 (0.0%) | 0 (0.0%) |
| 20 to 24 Year Olds | 19 (100.0%) | 0 (0.0%) |
| 25 to 34 Year Olds | 0 (0.0%) | 0 (0.0%) |
| 35 Years and over | 0 (0.0%) | 0 (0.0%) |
| Total | 59 (100.0%) | 0 (0.0%) |
Educational Attainment by Field of Study in Elrod
, and computers & mathematics (7 | 100.0%) are the most common fields of study among 7 individuals in Elrod who have obtained a bachelor's degree or higher.
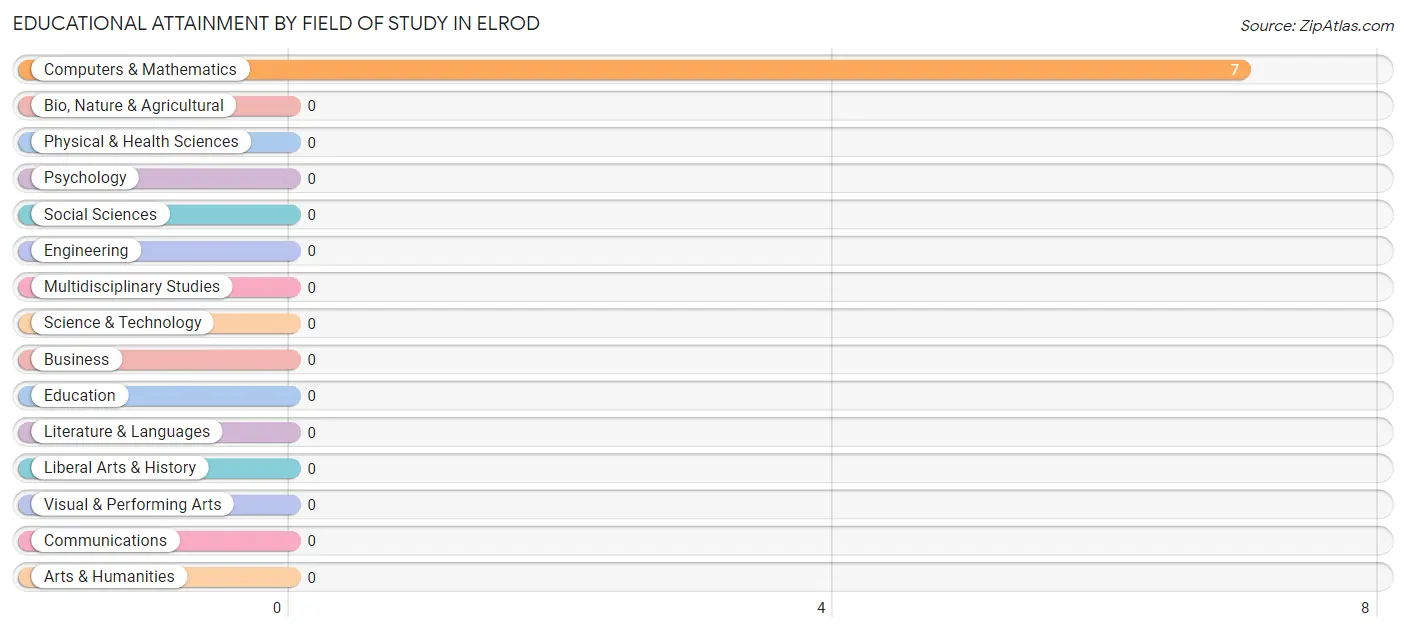
| Field of Study | # Graduates | % Graduates |
| Computers & Mathematics | 7 | 100.0% |
| Bio, Nature & Agricultural | 0 | 0.0% |
| Physical & Health Sciences | 0 | 0.0% |
| Psychology | 0 | 0.0% |
| Social Sciences | 0 | 0.0% |
| Engineering | 0 | 0.0% |
| Multidisciplinary Studies | 0 | 0.0% |
| Science & Technology | 0 | 0.0% |
| Business | 0 | 0.0% |
| Education | 0 | 0.0% |
| Literature & Languages | 0 | 0.0% |
| Liberal Arts & History | 0 | 0.0% |
| Visual & Performing Arts | 0 | 0.0% |
| Communications | 0 | 0.0% |
| Arts & Humanities | 0 | 0.0% |
| Total | 7 | 100.0% |
Transportation & Commute in Elrod
Vehicle Availability by Sex in Elrod
The most prevalent vehicle ownership categories in Elrod are males with 1 vehicle (21, accounting for 50.0%) and females with 1 vehicle (13, making up 53.8%).
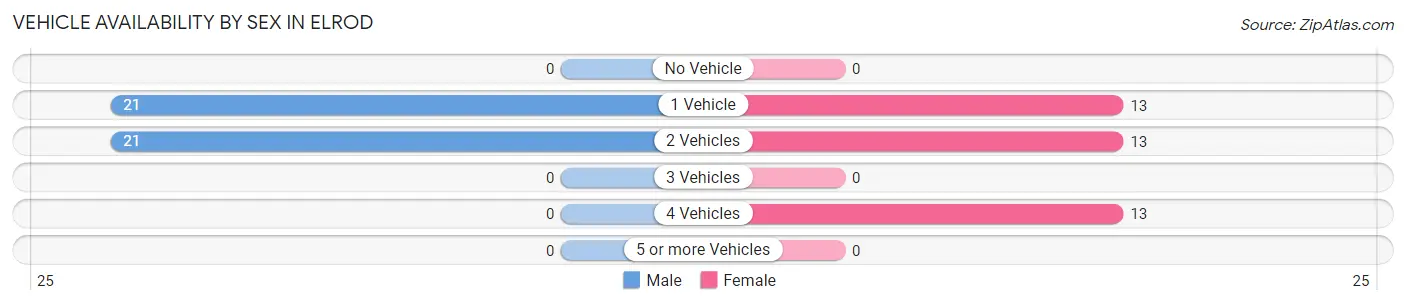
| Vehicles Available | Male | Female |
| No Vehicle | 0 (0.0%) | 0 (0.0%) |
| 1 Vehicle | 21 (50.0%) | 13 (33.3%) |
| 2 Vehicles | 21 (50.0%) | 13 (33.3%) |
| 3 Vehicles | 0 (0.0%) | 0 (0.0%) |
| 4 Vehicles | 0 (0.0%) | 13 (33.3%) |
| 5 or more Vehicles | 0 (0.0%) | 0 (0.0%) |
| Total | 42 (100.0%) | 39 (100.0%) |
Commute Time in Elrod
The most frequently occuring commute durations in Elrod are 15 to 19 minutes (30 commuters, 40.5%), 25 to 29 minutes (19 commuters, 25.7%), and 10 to 14 minutes (13 commuters, 17.6%).
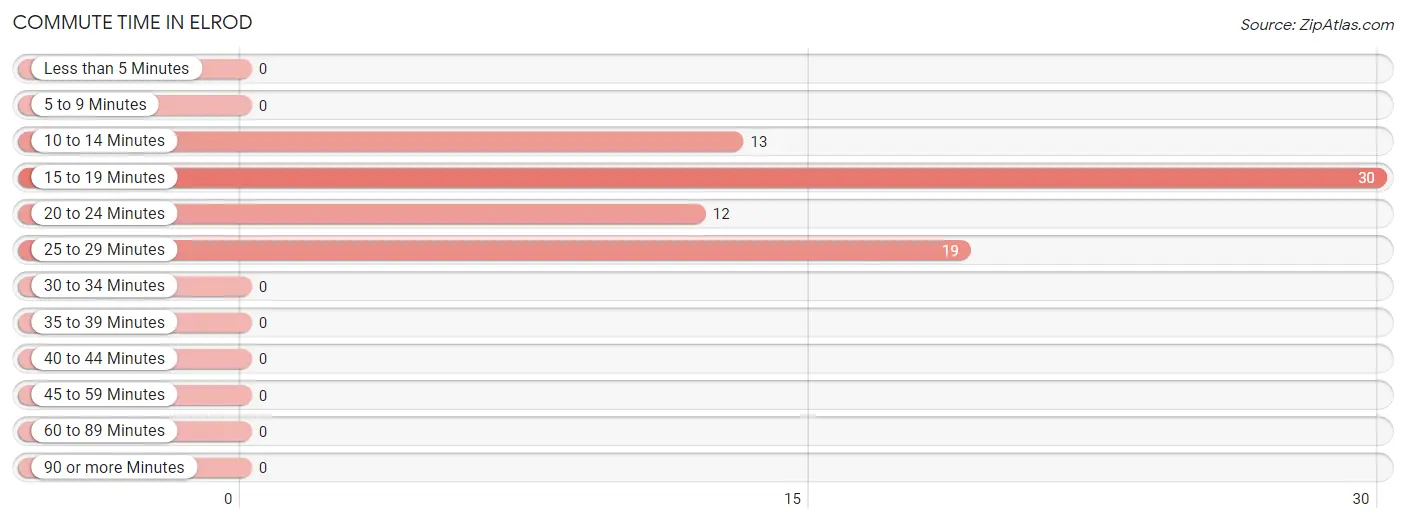
| Commute Time | # Commuters | % Commuters |
| Less than 5 Minutes | 0 | 0.0% |
| 5 to 9 Minutes | 0 | 0.0% |
| 10 to 14 Minutes | 13 | 17.6% |
| 15 to 19 Minutes | 30 | 40.5% |
| 20 to 24 Minutes | 12 | 16.2% |
| 25 to 29 Minutes | 19 | 25.7% |
| 30 to 34 Minutes | 0 | 0.0% |
| 35 to 39 Minutes | 0 | 0.0% |
| 40 to 44 Minutes | 0 | 0.0% |
| 45 to 59 Minutes | 0 | 0.0% |
| 60 to 89 Minutes | 0 | 0.0% |
| 90 or more Minutes | 0 | 0.0% |
Commute Time by Sex in Elrod
The most common commute times in Elrod are 15 to 19 minutes (30 commuters, 71.4%) for males and 25 to 29 minutes (19 commuters, 59.4%) for females.
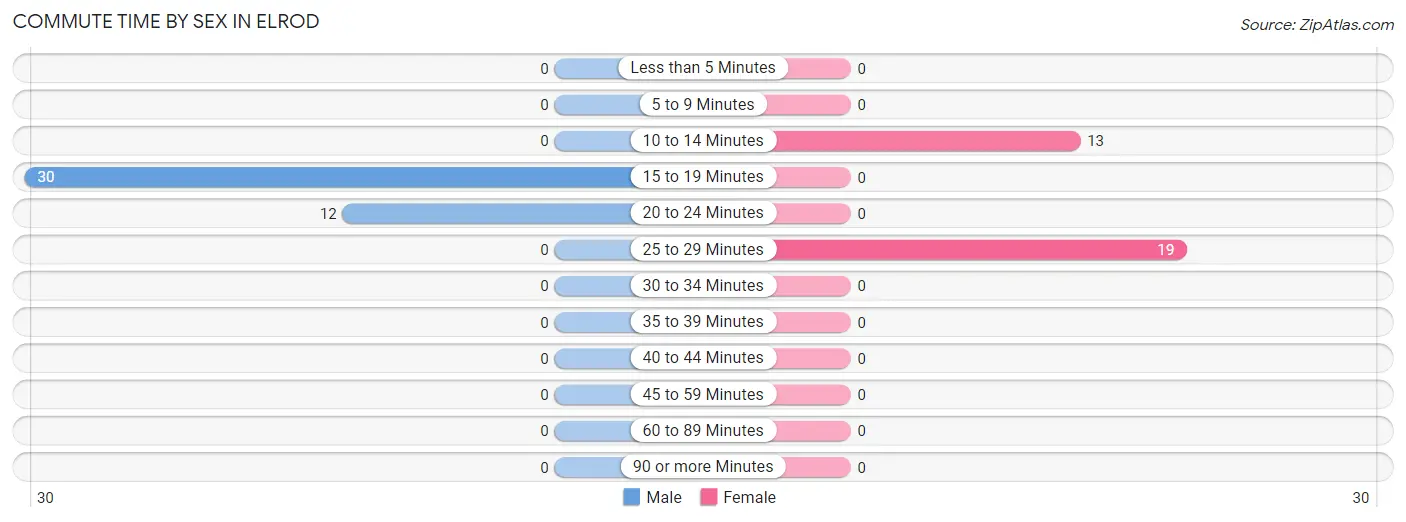
| Commute Time | Male | Female |
| Less than 5 Minutes | 0 (0.0%) | 0 (0.0%) |
| 5 to 9 Minutes | 0 (0.0%) | 0 (0.0%) |
| 10 to 14 Minutes | 0 (0.0%) | 13 (40.6%) |
| 15 to 19 Minutes | 30 (71.4%) | 0 (0.0%) |
| 20 to 24 Minutes | 12 (28.6%) | 0 (0.0%) |
| 25 to 29 Minutes | 0 (0.0%) | 19 (59.4%) |
| 30 to 34 Minutes | 0 (0.0%) | 0 (0.0%) |
| 35 to 39 Minutes | 0 (0.0%) | 0 (0.0%) |
| 40 to 44 Minutes | 0 (0.0%) | 0 (0.0%) |
| 45 to 59 Minutes | 0 (0.0%) | 0 (0.0%) |
| 60 to 89 Minutes | 0 (0.0%) | 0 (0.0%) |
| 90 or more Minutes | 0 (0.0%) | 0 (0.0%) |
Time of Departure to Work by Sex in Elrod
The most frequent times of departure to work in Elrod are 4:00 PM to 11:59 PM (21, 50.0%) for males and 7:00 AM to 7:29 AM (19, 59.4%) for females.
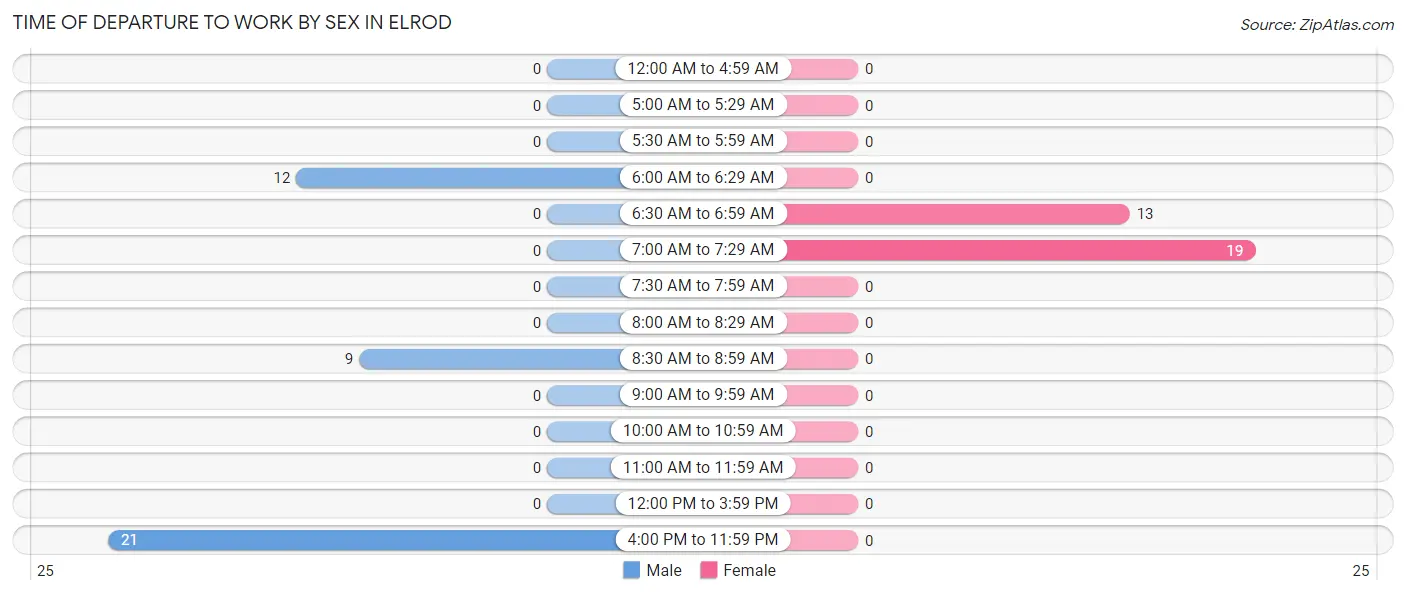
| Time of Departure | Male | Female |
| 12:00 AM to 4:59 AM | 0 (0.0%) | 0 (0.0%) |
| 5:00 AM to 5:29 AM | 0 (0.0%) | 0 (0.0%) |
| 5:30 AM to 5:59 AM | 0 (0.0%) | 0 (0.0%) |
| 6:00 AM to 6:29 AM | 12 (28.6%) | 0 (0.0%) |
| 6:30 AM to 6:59 AM | 0 (0.0%) | 13 (40.6%) |
| 7:00 AM to 7:29 AM | 0 (0.0%) | 19 (59.4%) |
| 7:30 AM to 7:59 AM | 0 (0.0%) | 0 (0.0%) |
| 8:00 AM to 8:29 AM | 0 (0.0%) | 0 (0.0%) |
| 8:30 AM to 8:59 AM | 9 (21.4%) | 0 (0.0%) |
| 9:00 AM to 9:59 AM | 0 (0.0%) | 0 (0.0%) |
| 10:00 AM to 10:59 AM | 0 (0.0%) | 0 (0.0%) |
| 11:00 AM to 11:59 AM | 0 (0.0%) | 0 (0.0%) |
| 12:00 PM to 3:59 PM | 0 (0.0%) | 0 (0.0%) |
| 4:00 PM to 11:59 PM | 21 (50.0%) | 0 (0.0%) |
| Total | 42 (100.0%) | 32 (100.0%) |
Housing Occupancy in Elrod
Occupancy by Ownership in Elrod
Of the total 137 dwellings in Elrod, owner-occupied units account for 77 (56.2%), while renter-occupied units make up 60 (43.8%).
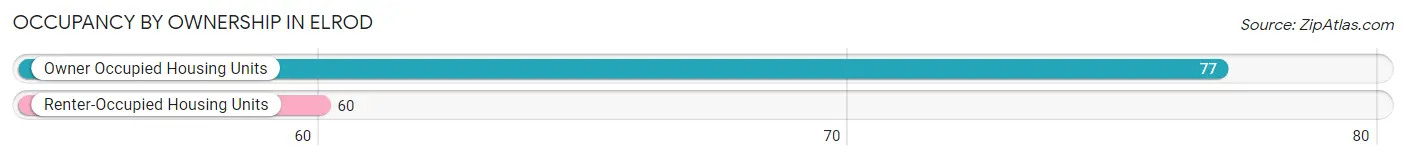
| Occupancy | # Housing Units | % Housing Units |
| Owner Occupied Housing Units | 77 | 56.2% |
| Renter-Occupied Housing Units | 60 | 43.8% |
| Total Occupied Housing Units | 137 | 100.0% |
Occupancy by Household Size in Elrod
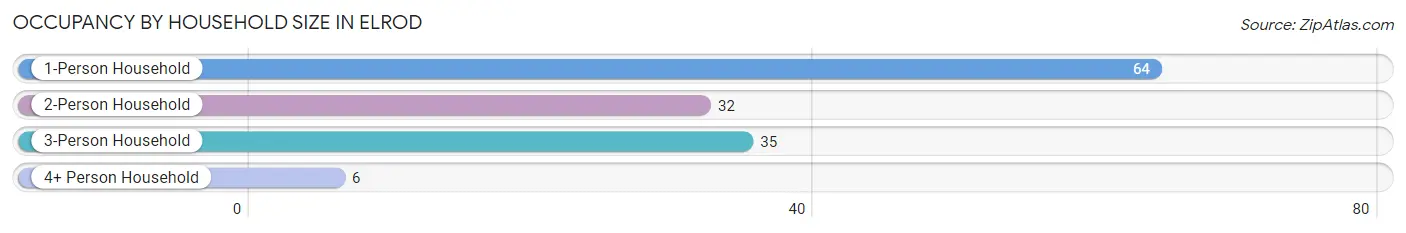
| Household Size | # Housing Units | % Housing Units |
| 1-Person Household | 64 | 46.7% |
| 2-Person Household | 32 | 23.4% |
| 3-Person Household | 35 | 25.6% |
| 4+ Person Household | 6 | 4.4% |
| Total Housing Units | 137 | 100.0% |
Occupancy by Ownership by Household Size in Elrod
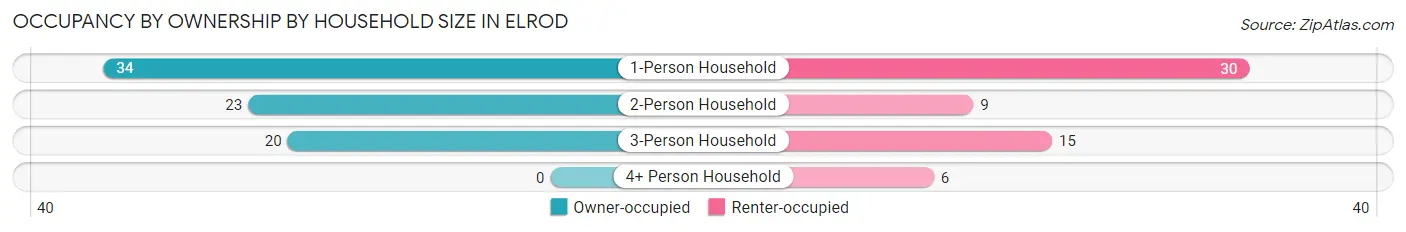
| Household Size | Owner-occupied | Renter-occupied |
| 1-Person Household | 34 (53.1%) | 30 (46.9%) |
| 2-Person Household | 23 (71.9%) | 9 (28.1%) |
| 3-Person Household | 20 (57.1%) | 15 (42.9%) |
| 4+ Person Household | 0 (0.0%) | 6 (100.0%) |
| Total Housing Units | 77 (56.2%) | 60 (43.8%) |
Occupancy by Educational Attainment in Elrod
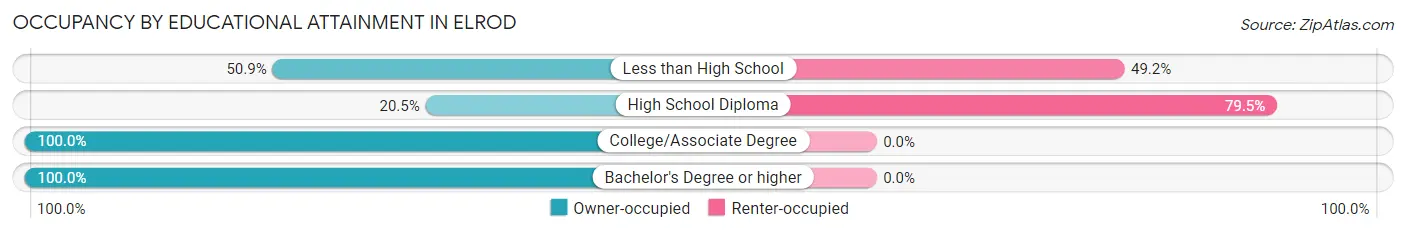
| Household Size | Owner-occupied | Renter-occupied |
| Less than High School | 30 (50.8%) | 29 (49.1%) |
| High School Diploma | 8 (20.5%) | 31 (79.5%) |
| College/Associate Degree | 32 (100.0%) | 0 (0.0%) |
| Bachelor's Degree or higher | 7 (100.0%) | 0 (0.0%) |
Occupancy by Age of Householder in Elrod
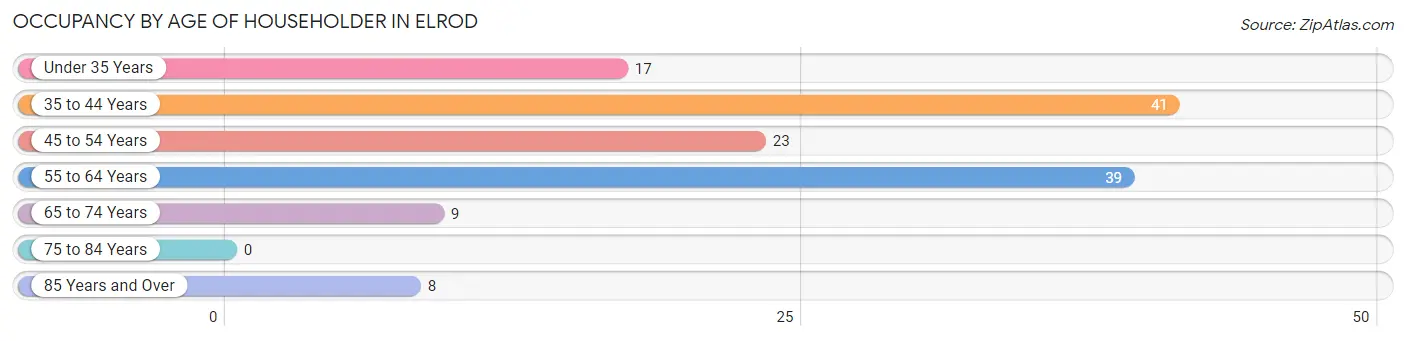
| Age Bracket | # Households | % Households |
| Under 35 Years | 17 | 12.4% |
| 35 to 44 Years | 41 | 29.9% |
| 45 to 54 Years | 23 | 16.8% |
| 55 to 64 Years | 39 | 28.5% |
| 65 to 74 Years | 9 | 6.6% |
| 75 to 84 Years | 0 | 0.0% |
| 85 Years and Over | 8 | 5.8% |
| Total | 137 | 100.0% |
Housing Finances in Elrod
Median Income by Occupancy in Elrod
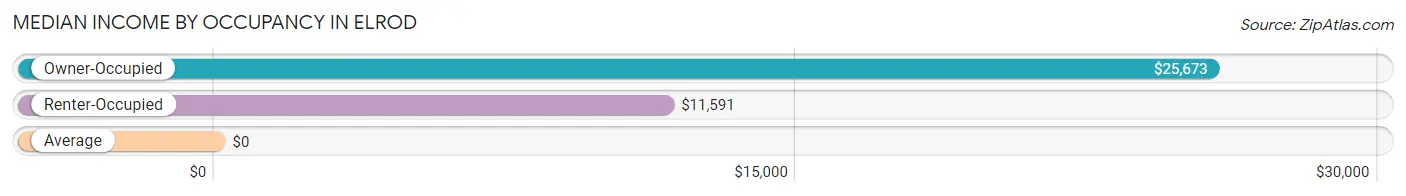
| Occupancy Type | # Households | Median Income |
| Owner-Occupied | 77 (56.2%) | $25,673 |
| Renter-Occupied | 60 (43.8%) | $11,591 |
| Average | 137 (100.0%) | $0 |
Occupancy by Householder Income Bracket in Elrod
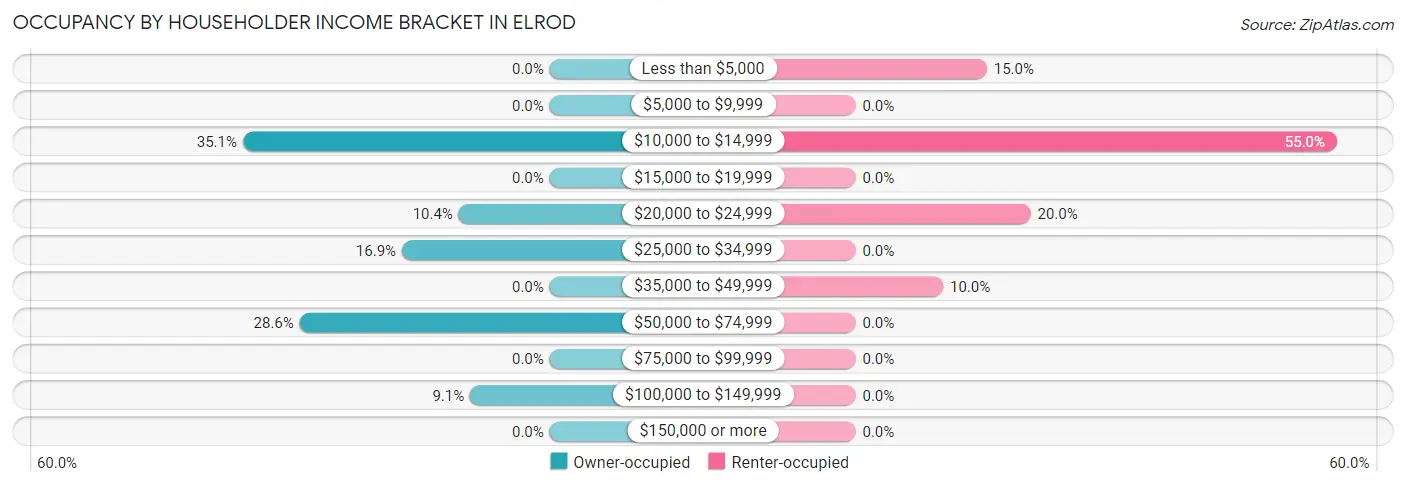
| Income Bracket | Owner-occupied | Renter-occupied |
| Less than $5,000 | 0 (0.0%) | 9 (15.0%) |
| $5,000 to $9,999 | 0 (0.0%) | 0 (0.0%) |
| $10,000 to $14,999 | 27 (35.1%) | 33 (55.0%) |
| $15,000 to $19,999 | 0 (0.0%) | 0 (0.0%) |
| $20,000 to $24,999 | 8 (10.4%) | 12 (20.0%) |
| $25,000 to $34,999 | 13 (16.9%) | 0 (0.0%) |
| $35,000 to $49,999 | 0 (0.0%) | 6 (10.0%) |
| $50,000 to $74,999 | 22 (28.6%) | 0 (0.0%) |
| $75,000 to $99,999 | 0 (0.0%) | 0 (0.0%) |
| $100,000 to $149,999 | 7 (9.1%) | 0 (0.0%) |
| $150,000 or more | 0 (0.0%) | 0 (0.0%) |
| Total | 77 (100.0%) | 60 (100.0%) |
Monthly Housing Cost Tiers in Elrod
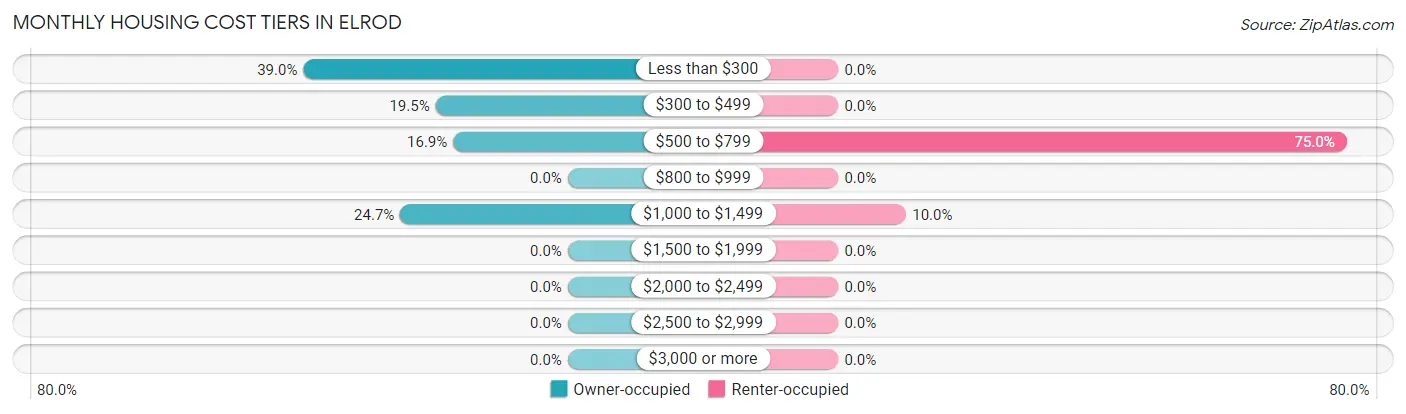
| Monthly Cost | Owner-occupied | Renter-occupied |
| Less than $300 | 30 (39.0%) | 0 (0.0%) |
| $300 to $499 | 15 (19.5%) | 0 (0.0%) |
| $500 to $799 | 13 (16.9%) | 45 (75.0%) |
| $800 to $999 | 0 (0.0%) | 0 (0.0%) |
| $1,000 to $1,499 | 19 (24.7%) | 6 (10.0%) |
| $1,500 to $1,999 | 0 (0.0%) | 0 (0.0%) |
| $2,000 to $2,499 | 0 (0.0%) | 0 (0.0%) |
| $2,500 to $2,999 | 0 (0.0%) | 0 (0.0%) |
| $3,000 or more | 0 (0.0%) | 0 (0.0%) |
| Total | 77 (100.0%) | 60 (100.0%) |
Physical Housing Characteristics in Elrod
Housing Structures in Elrod
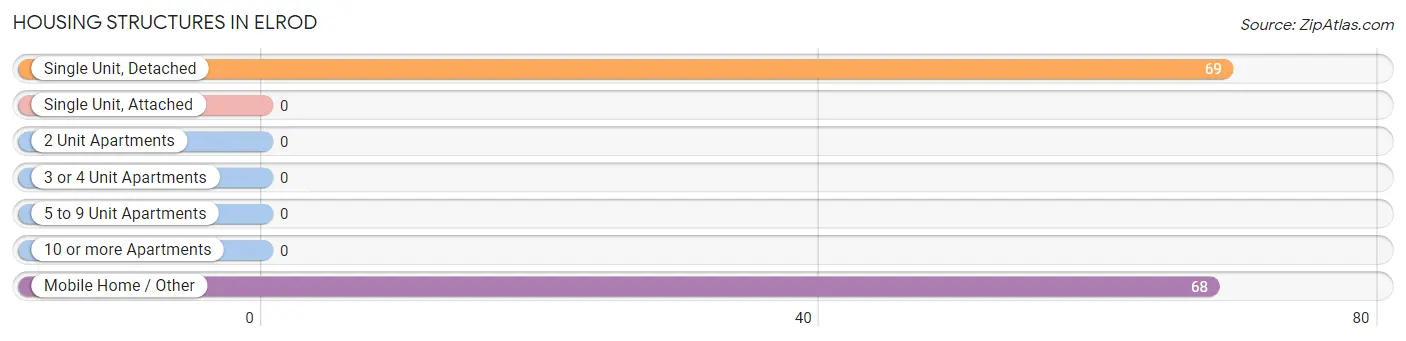
| Structure Type | # Housing Units | % Housing Units |
| Single Unit, Detached | 69 | 50.4% |
| Single Unit, Attached | 0 | 0.0% |
| 2 Unit Apartments | 0 | 0.0% |
| 3 or 4 Unit Apartments | 0 | 0.0% |
| 5 to 9 Unit Apartments | 0 | 0.0% |
| 10 or more Apartments | 0 | 0.0% |
| Mobile Home / Other | 68 | 49.6% |
| Total | 137 | 100.0% |
Housing Structures by Occupancy in Elrod
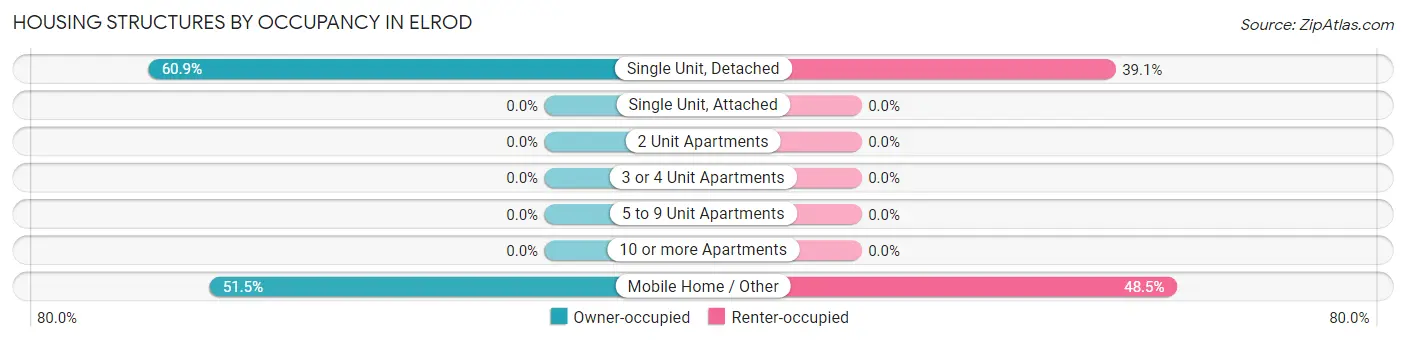
| Structure Type | Owner-occupied | Renter-occupied |
| Single Unit, Detached | 42 (60.9%) | 27 (39.1%) |
| Single Unit, Attached | 0 (0.0%) | 0 (0.0%) |
| 2 Unit Apartments | 0 (0.0%) | 0 (0.0%) |
| 3 or 4 Unit Apartments | 0 (0.0%) | 0 (0.0%) |
| 5 to 9 Unit Apartments | 0 (0.0%) | 0 (0.0%) |
| 10 or more Apartments | 0 (0.0%) | 0 (0.0%) |
| Mobile Home / Other | 35 (51.5%) | 33 (48.5%) |
| Total | 77 (56.2%) | 60 (43.8%) |
Housing Structures by Number of Rooms in Elrod
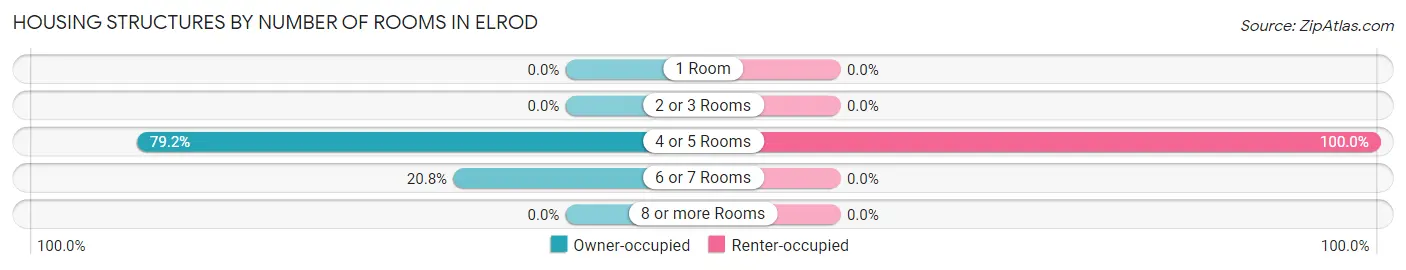
| Number of Rooms | Owner-occupied | Renter-occupied |
| 1 Room | 0 (0.0%) | 0 (0.0%) |
| 2 or 3 Rooms | 0 (0.0%) | 0 (0.0%) |
| 4 or 5 Rooms | 61 (79.2%) | 60 (100.0%) |
| 6 or 7 Rooms | 16 (20.8%) | 0 (0.0%) |
| 8 or more Rooms | 0 (0.0%) | 0 (0.0%) |
| Total | 77 (100.0%) | 60 (100.0%) |
Housing Structure by Heating Type in Elrod
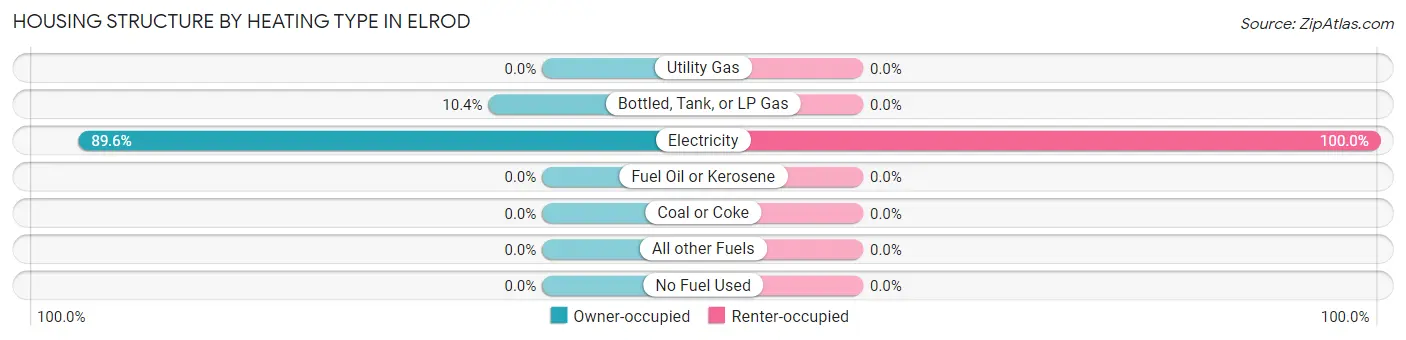
| Heating Type | Owner-occupied | Renter-occupied |
| Utility Gas | 0 (0.0%) | 0 (0.0%) |
| Bottled, Tank, or LP Gas | 8 (10.4%) | 0 (0.0%) |
| Electricity | 69 (89.6%) | 60 (100.0%) |
| Fuel Oil or Kerosene | 0 (0.0%) | 0 (0.0%) |
| Coal or Coke | 0 (0.0%) | 0 (0.0%) |
| All other Fuels | 0 (0.0%) | 0 (0.0%) |
| No Fuel Used | 0 (0.0%) | 0 (0.0%) |
| Total | 77 (100.0%) | 60 (100.0%) |
Household Vehicle Usage in Elrod
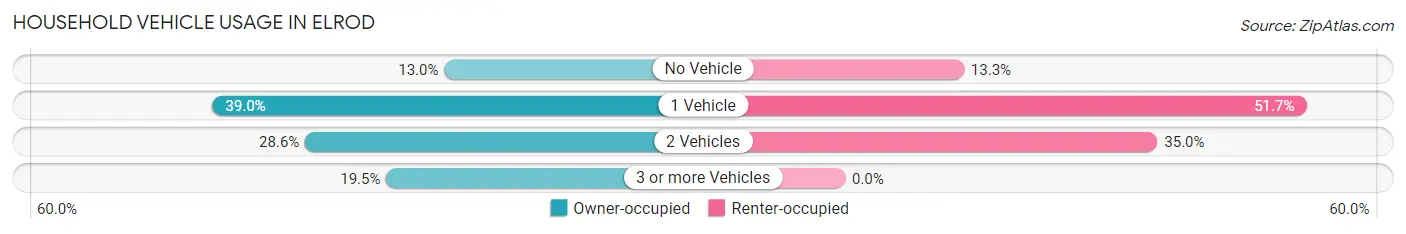
| Vehicles per Household | Owner-occupied | Renter-occupied |
| No Vehicle | 10 (13.0%) | 8 (13.3%) |
| 1 Vehicle | 30 (39.0%) | 31 (51.7%) |
| 2 Vehicles | 22 (28.6%) | 21 (35.0%) |
| 3 or more Vehicles | 15 (19.5%) | 0 (0.0%) |
| Total | 77 (100.0%) | 60 (100.0%) |
Real Estate & Mortgages in Elrod
Real Estate and Mortgage Overview in Elrod
| Characteristic | Without Mortgage | With Mortgage |
| Housing Units | 58 | 19 |
| Median Property Value | $52,400 | $0 |
| Median Household Income | $25,769 | $0 |
| Monthly Housing Costs | - | - |
| Real Estate Taxes | $354 | $10 |
Property Value by Mortgage Status in Elrod
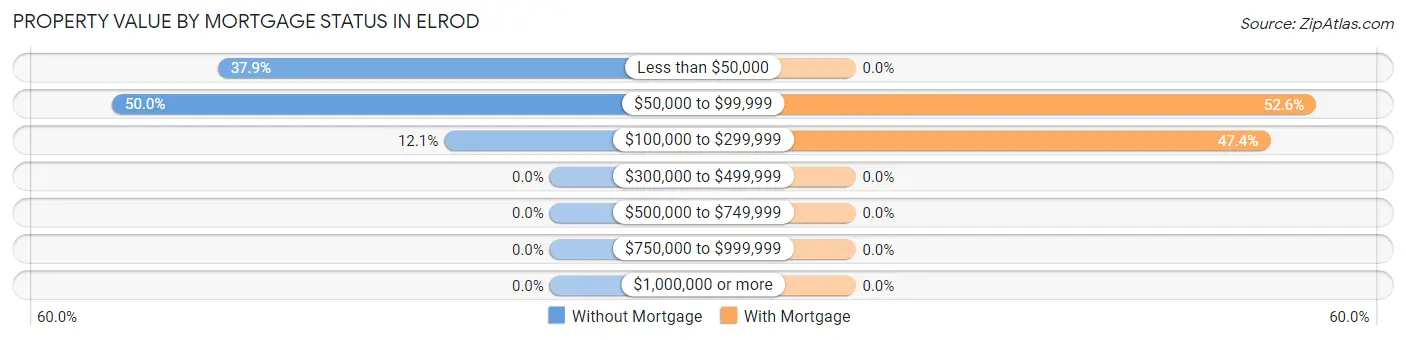
| Property Value | Without Mortgage | With Mortgage |
| Less than $50,000 | 22 (37.9%) | 0 (0.0%) |
| $50,000 to $99,999 | 29 (50.0%) | 10 (52.6%) |
| $100,000 to $299,999 | 7 (12.1%) | 9 (47.4%) |
| $300,000 to $499,999 | 0 (0.0%) | 0 (0.0%) |
| $500,000 to $749,999 | 0 (0.0%) | 0 (0.0%) |
| $750,000 to $999,999 | 0 (0.0%) | 0 (0.0%) |
| $1,000,000 or more | 0 (0.0%) | 0 (0.0%) |
| Total | 58 (100.0%) | 19 (100.0%) |
Household Income by Mortgage Status in Elrod
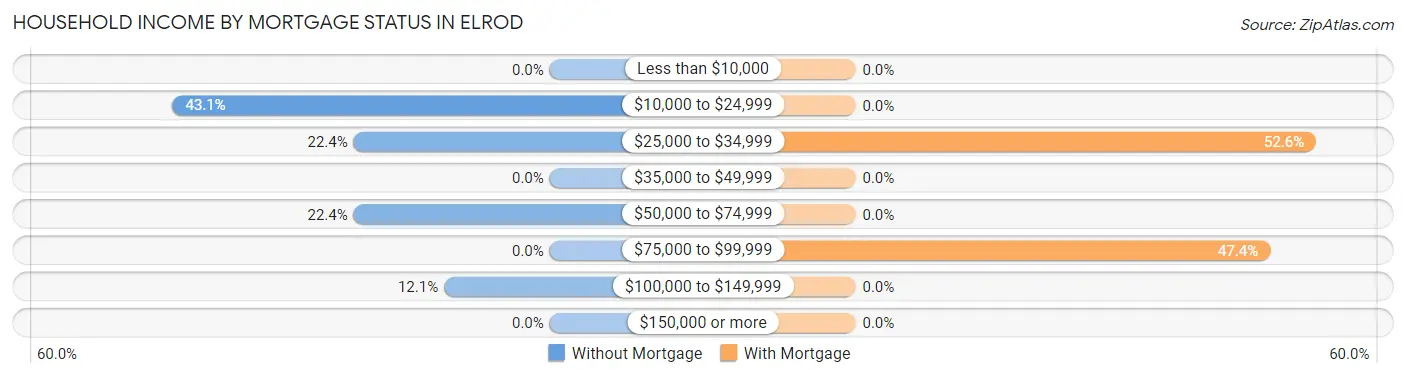
| Household Income | Without Mortgage | With Mortgage |
| Less than $10,000 | 0 (0.0%) | 0 (0.0%) |
| $10,000 to $24,999 | 25 (43.1%) | 0 (0.0%) |
| $25,000 to $34,999 | 13 (22.4%) | 10 (52.6%) |
| $35,000 to $49,999 | 0 (0.0%) | 0 (0.0%) |
| $50,000 to $74,999 | 13 (22.4%) | 0 (0.0%) |
| $75,000 to $99,999 | 0 (0.0%) | 9 (47.4%) |
| $100,000 to $149,999 | 7 (12.1%) | 0 (0.0%) |
| $150,000 or more | 0 (0.0%) | 0 (0.0%) |
| Total | 58 (100.0%) | 19 (100.0%) |
Property Value to Household Income Ratio in Elrod
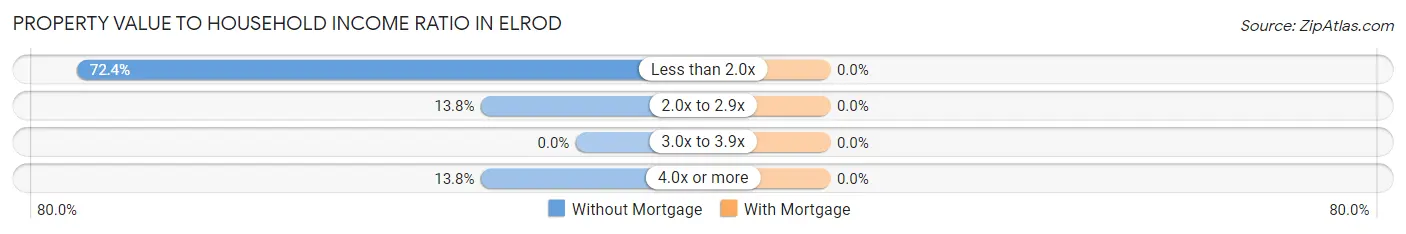
| Value-to-Income Ratio | Without Mortgage | With Mortgage |
| Less than 2.0x | 42 (72.4%) | 0 (0.0%) |
| 2.0x to 2.9x | 8 (13.8%) | 0 (0.0%) |
| 3.0x to 3.9x | 0 (0.0%) | 0 (0.0%) |
| 4.0x or more | 8 (13.8%) | 0 (0.0%) |
| Total | 58 (100.0%) | 19 (100.0%) |
Real Estate Taxes by Mortgage Status in Elrod
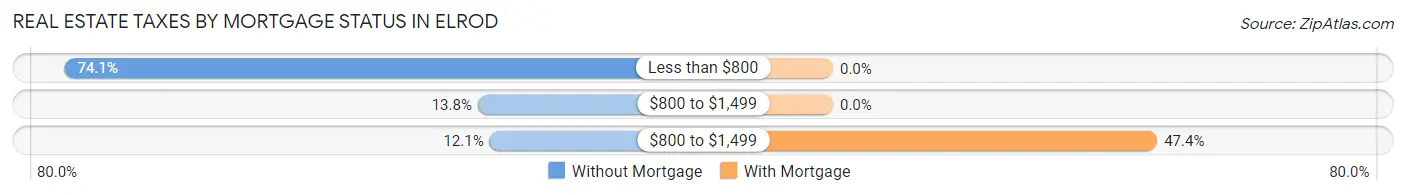
| Property Taxes | Without Mortgage | With Mortgage |
| Less than $800 | 43 (74.1%) | 0 (0.0%) |
| $800 to $1,499 | 8 (13.8%) | 0 (0.0%) |
| $800 to $1,499 | 7 (12.1%) | 9 (47.4%) |
| Total | 58 (100.0%) | 19 (100.0%) |
Health & Disability in Elrod
Health Insurance Coverage by Age in Elrod
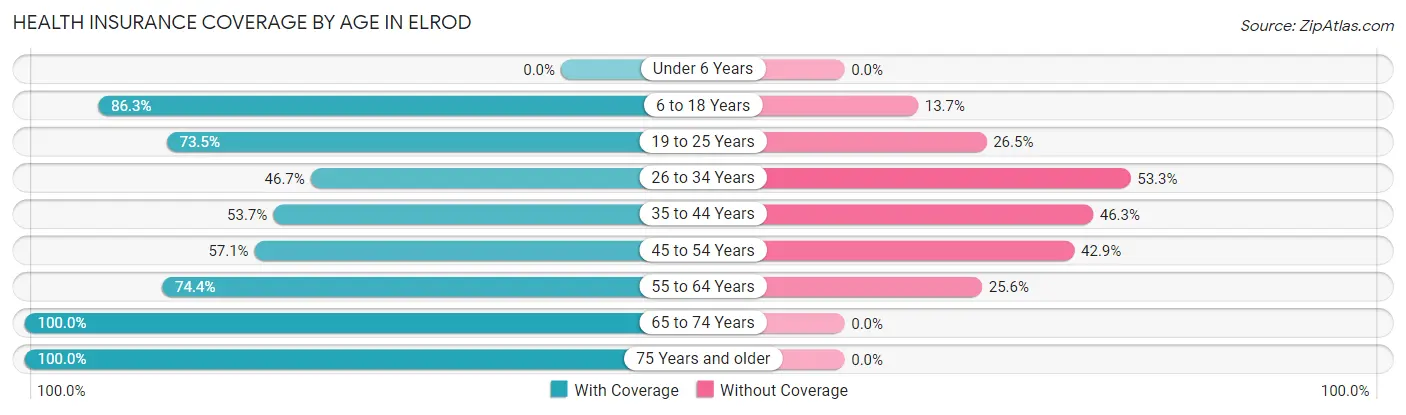
| Age Bracket | With Coverage | Without Coverage |
| Under 6 Years | 0 (0.0%) | 0 (0.0%) |
| 6 to 18 Years | 63 (86.3%) | 10 (13.7%) |
| 19 to 25 Years | 25 (73.5%) | 9 (26.5%) |
| 26 to 34 Years | 7 (46.7%) | 8 (53.3%) |
| 35 to 44 Years | 22 (53.7%) | 19 (46.3%) |
| 45 to 54 Years | 20 (57.1%) | 15 (42.9%) |
| 55 to 64 Years | 29 (74.4%) | 10 (25.6%) |
| 65 to 74 Years | 19 (100.0%) | 0 (0.0%) |
| 75 Years and older | 8 (100.0%) | 0 (0.0%) |
| Total | 193 (73.1%) | 71 (26.9%) |
Health Insurance Coverage by Citizenship Status in Elrod
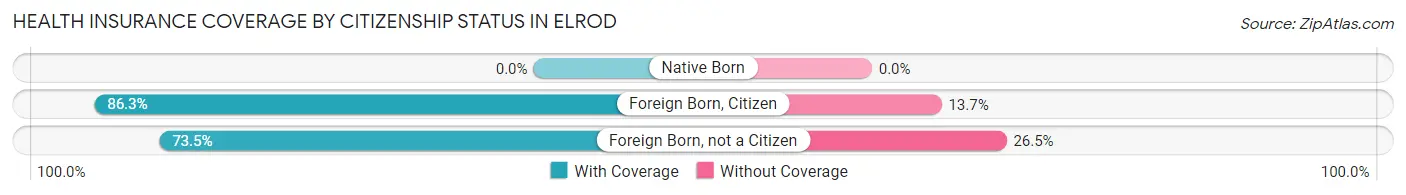
| Citizenship Status | With Coverage | Without Coverage |
| Native Born | 0 (0.0%) | 0 (0.0%) |
| Foreign Born, Citizen | 63 (86.3%) | 10 (13.7%) |
| Foreign Born, not a Citizen | 25 (73.5%) | 9 (26.5%) |
Health Insurance Coverage by Household Income in Elrod
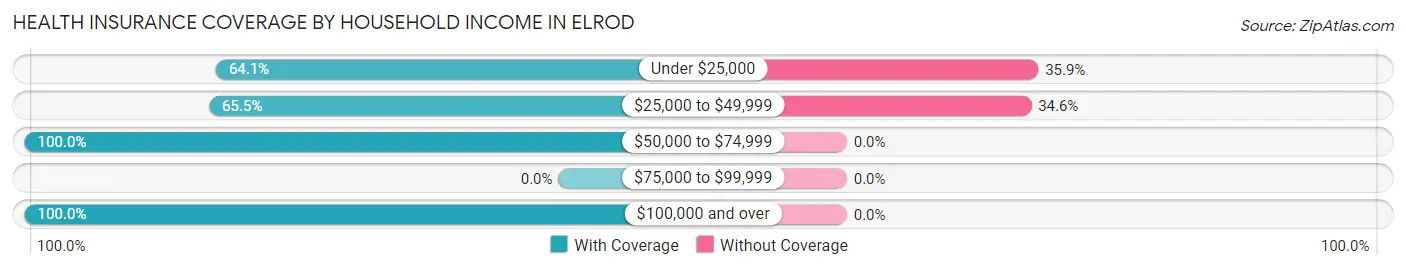
| Household Income | With Coverage | Without Coverage |
| Under $25,000 | 93 (64.1%) | 52 (35.9%) |
| $25,000 to $49,999 | 36 (65.4%) | 19 (34.5%) |
| $50,000 to $74,999 | 45 (100.0%) | 0 (0.0%) |
| $75,000 to $99,999 | 0 (0.0%) | 0 (0.0%) |
| $100,000 and over | 19 (100.0%) | 0 (0.0%) |
Public vs Private Health Insurance Coverage by Age in Elrod
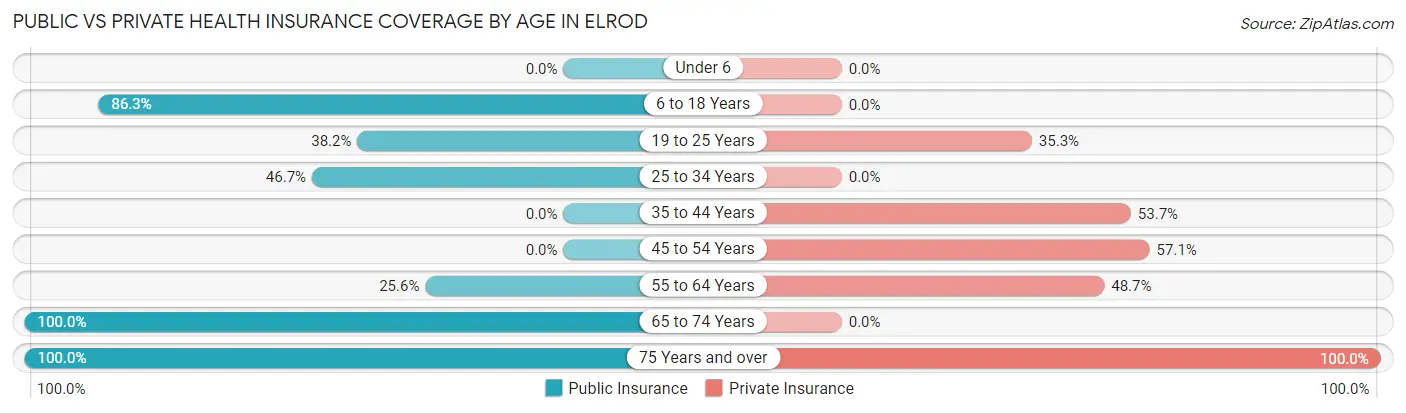
| Age Bracket | Public Insurance | Private Insurance |
| Under 6 | 0 (0.0%) | 0 (0.0%) |
| 6 to 18 Years | 63 (86.3%) | 0 (0.0%) |
| 19 to 25 Years | 13 (38.2%) | 12 (35.3%) |
| 25 to 34 Years | 7 (46.7%) | 0 (0.0%) |
| 35 to 44 Years | 0 (0.0%) | 22 (53.7%) |
| 45 to 54 Years | 0 (0.0%) | 20 (57.1%) |
| 55 to 64 Years | 10 (25.6%) | 19 (48.7%) |
| 65 to 74 Years | 19 (100.0%) | 0 (0.0%) |
| 75 Years and over | 8 (100.0%) | 8 (100.0%) |
| Total | 120 (45.5%) | 81 (30.7%) |
Disability Status by Sex by Age in Elrod
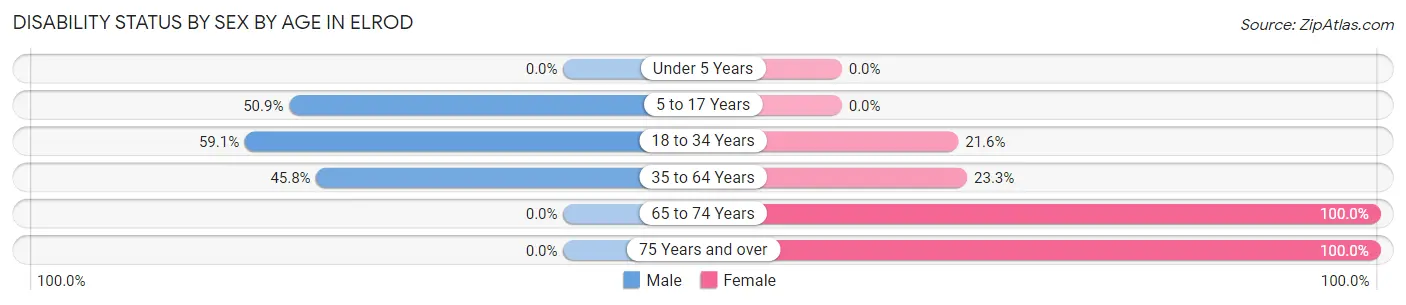
| Age Bracket | Male | Female |
| Under 5 Years | 0 (0.0%) | 0 (0.0%) |
| 5 to 17 Years | 29 (50.9%) | 0 (0.0%) |
| 18 to 34 Years | 13 (59.1%) | 8 (21.6%) |
| 35 to 64 Years | 33 (45.8%) | 10 (23.3%) |
| 65 to 74 Years | 0 (0.0%) | 9 (100.0%) |
| 75 Years and over | 0 (0.0%) | 8 (100.0%) |
Disability Class by Sex by Age in Elrod
Disability Class: Hearing Difficulty
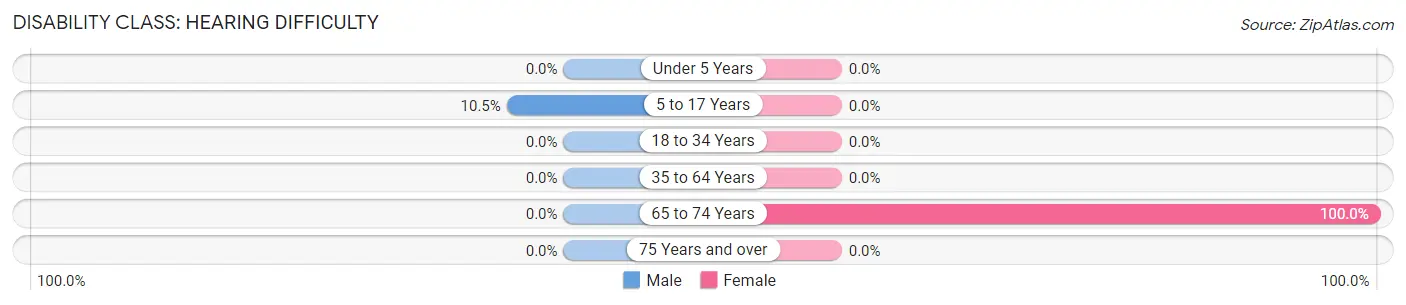
| Age Bracket | Male | Female |
| Under 5 Years | 0 (0.0%) | 0 (0.0%) |
| 5 to 17 Years | 6 (10.5%) | 0 (0.0%) |
| 18 to 34 Years | 0 (0.0%) | 0 (0.0%) |
| 35 to 64 Years | 0 (0.0%) | 0 (0.0%) |
| 65 to 74 Years | 0 (0.0%) | 9 (100.0%) |
| 75 Years and over | 0 (0.0%) | 0 (0.0%) |
Disability Class: Vision Difficulty
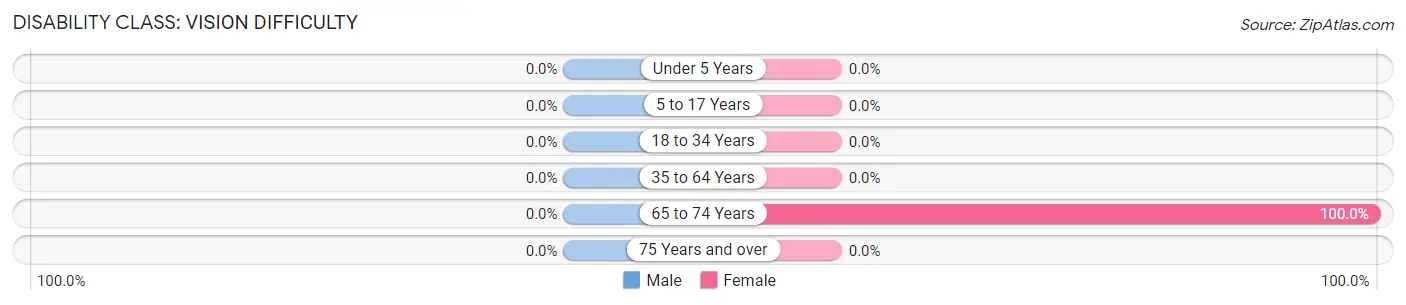
| Age Bracket | Male | Female |
| Under 5 Years | 0 (0.0%) | 0 (0.0%) |
| 5 to 17 Years | 0 (0.0%) | 0 (0.0%) |
| 18 to 34 Years | 0 (0.0%) | 0 (0.0%) |
| 35 to 64 Years | 0 (0.0%) | 0 (0.0%) |
| 65 to 74 Years | 0 (0.0%) | 9 (100.0%) |
| 75 Years and over | 0 (0.0%) | 0 (0.0%) |
Disability Class: Cognitive Difficulty
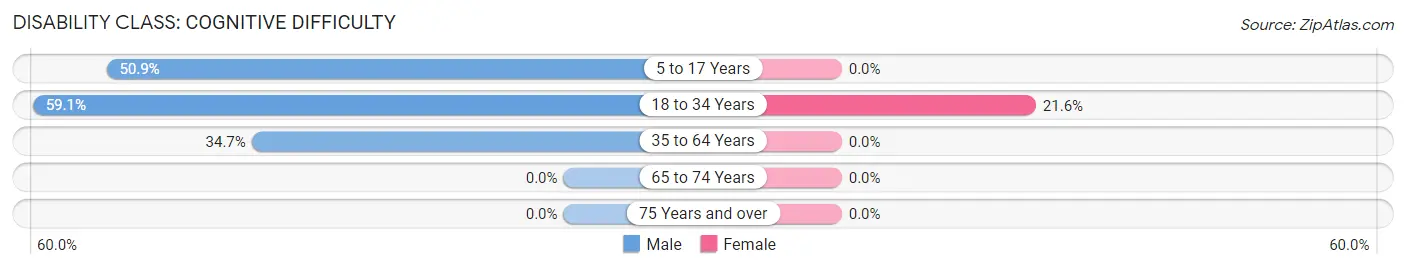
| Age Bracket | Male | Female |
| 5 to 17 Years | 29 (50.9%) | 0 (0.0%) |
| 18 to 34 Years | 13 (59.1%) | 8 (21.6%) |
| 35 to 64 Years | 25 (34.7%) | 0 (0.0%) |
| 65 to 74 Years | 0 (0.0%) | 0 (0.0%) |
| 75 Years and over | 0 (0.0%) | 0 (0.0%) |
Disability Class: Ambulatory Difficulty
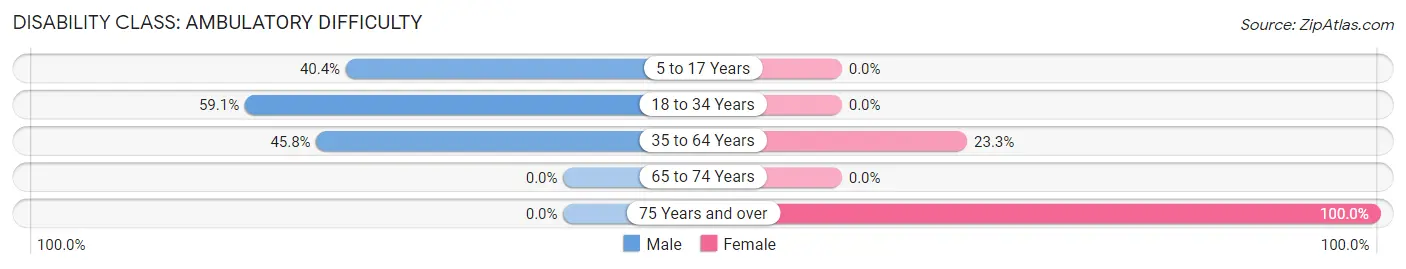
| Age Bracket | Male | Female |
| 5 to 17 Years | 23 (40.4%) | 0 (0.0%) |
| 18 to 34 Years | 13 (59.1%) | 0 (0.0%) |
| 35 to 64 Years | 33 (45.8%) | 10 (23.3%) |
| 65 to 74 Years | 0 (0.0%) | 0 (0.0%) |
| 75 Years and over | 0 (0.0%) | 8 (100.0%) |
Disability Class: Self-Care Difficulty
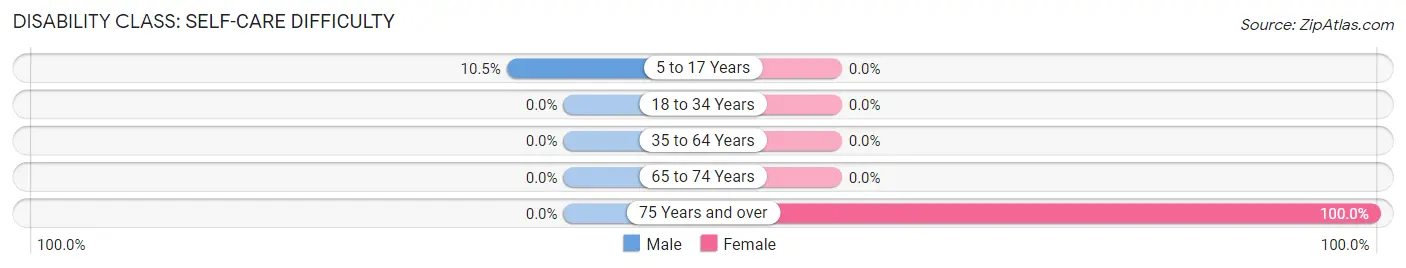
| Age Bracket | Male | Female |
| 5 to 17 Years | 6 (10.5%) | 0 (0.0%) |
| 18 to 34 Years | 0 (0.0%) | 0 (0.0%) |
| 35 to 64 Years | 0 (0.0%) | 0 (0.0%) |
| 65 to 74 Years | 0 (0.0%) | 0 (0.0%) |
| 75 Years and over | 0 (0.0%) | 8 (100.0%) |
Technology Access in Elrod
Computing Device Access in Elrod
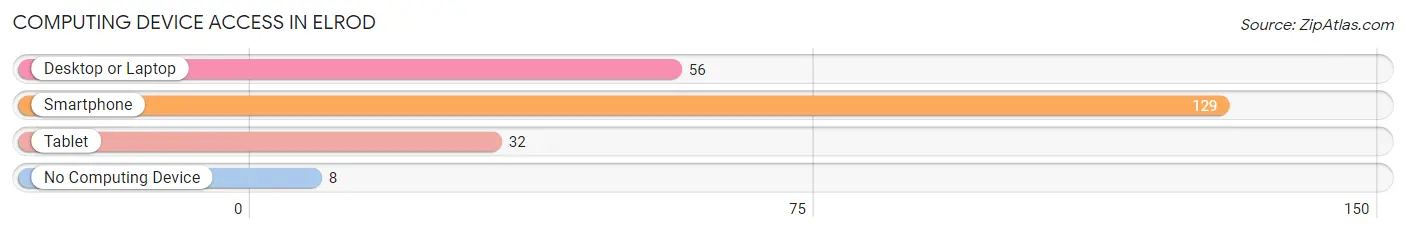
| Device Type | # Households | % Households |
| Desktop or Laptop | 56 | 40.9% |
| Smartphone | 129 | 94.2% |
| Tablet | 32 | 23.4% |
| No Computing Device | 8 | 5.8% |
| Total | 137 | 100.0% |
Internet Access in Elrod
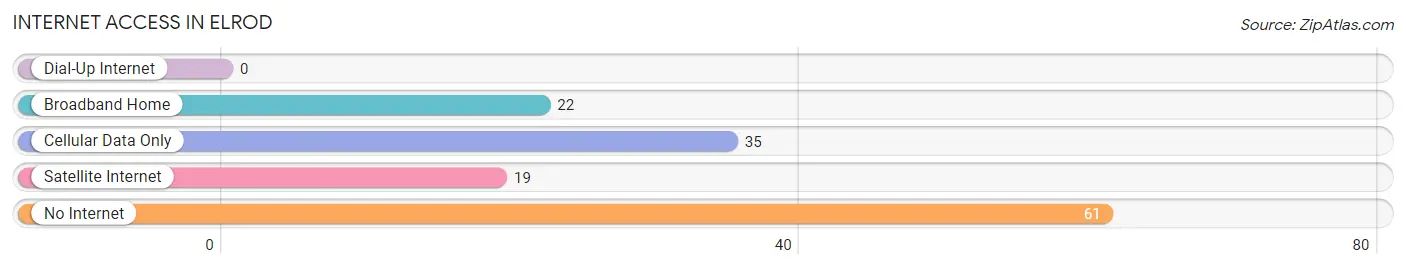
| Internet Type | # Households | % Households |
| Dial-Up Internet | 0 | 0.0% |
| Broadband Home | 22 | 16.1% |
| Cellular Data Only | 35 | 25.6% |
| Satellite Internet | 19 | 13.9% |
| No Internet | 61 | 44.5% |
| Total | 137 | 100.0% |
Elrod Summary
Elrod is a small unincorporated community located in Rowan County, North Carolina. It is situated in the foothills of the Blue Ridge Mountains, approximately 20 miles northeast of Salisbury. The community is named after the Elrod family, who were among the first settlers in the area.
History
The Elrod area was first settled in the late 1700s by the Elrod family, who were of German descent. The family had migrated from Pennsylvania and settled in the area, which was then part of Anson County. The Elrod family established a small farm and built a log cabin, which still stands today.
In 1808, the area was officially established as Elrod Township, and the Elrod family was granted a post office in 1809. The post office was located in the Elrod family home, and the family served as postmasters until 1845.
In 1845, the area was annexed by Rowan County, and the Elrod post office was closed. The Elrod family continued to live in the area, and the community grew slowly over the next several decades.
Geography
Elrod is located in the foothills of the Blue Ridge Mountains, approximately 20 miles northeast of Salisbury. The community is situated in a rural area, with rolling hills and forests. The nearest major city is Charlotte, which is approximately 70 miles away.
The climate in Elrod is temperate, with hot summers and mild winters. The average annual temperature is around 60 degrees Fahrenheit, and the average annual precipitation is around 40 inches.
Economy
The economy of Elrod is largely based on agriculture. The area is home to several small farms, which produce a variety of crops, including corn, soybeans, and tobacco. The area also has several small businesses, including a general store, a gas station, and a few restaurants.
Demographics
As of the 2010 census, the population of Elrod was 1,093. The racial makeup of the community was 97.3% White, 0.9% African American, 0.3% Native American, 0.2% Asian, and 1.3% from other races. The median household income was $37,500, and the median home value was $117,000.
Conclusion
Elrod is a small unincorporated community located in Rowan County, North Carolina. It is situated in the foothills of the Blue Ridge Mountains, approximately 20 miles northeast of Salisbury. The community was first settled in the late 1700s by the Elrod family, and the area was officially established as Elrod Township in 1808. The economy of Elrod is largely based on agriculture, and the population of the community was 1,093 as of the 2010 census.
Common Questions
What is Per Capita Income in Elrod?
Per Capita income in Elrod is $14,239.
What is the Median Family Income in Elrod?
Median Family Income in Elrod is $25,481.
What is Income or Wage Gap in Elrod?
Income or Wage Gap in Elrod is 7.8%.
Women in Elrod earn 92.2 cents for every dollar earned by a man.
What is Inequality or Gini Index in Elrod?
Inequality or Gini Index in Elrod is 0.47.
What is the Total Population of Elrod?
Total Population of Elrod is 264.
What is the Total Male Population of Elrod?
Total Male Population of Elrod is 161.
What is the Total Female Population of Elrod?
Total Female Population of Elrod is 103.
What is the Ratio of Males per 100 Females in Elrod?
There are 156.31 Males per 100 Females in Elrod.
What is the Ratio of Females per 100 Males in Elrod?
There are 63.98 Females per 100 Males in Elrod.
What is the Median Population Age in Elrod?
Median Population Age in Elrod is 36.3 Years.
What is the Average Family Size in Elrod
Average Family Size in Elrod is 2.6 People.
What is the Average Household Size in Elrod
Average Household Size in Elrod is 1.9 People.
How Large is the Labor Force in Elrod?
There are 94 People in the Labor Forcein in Elrod.
What is the Percentage of People in the Labor Force in Elrod?
44.3% of People are in the Labor Force in Elrod.
What is the Unemployment Rate in Elrod?
Unemployment Rate in Elrod is 13.8%.