Broadview Park, FL Map & Demographics
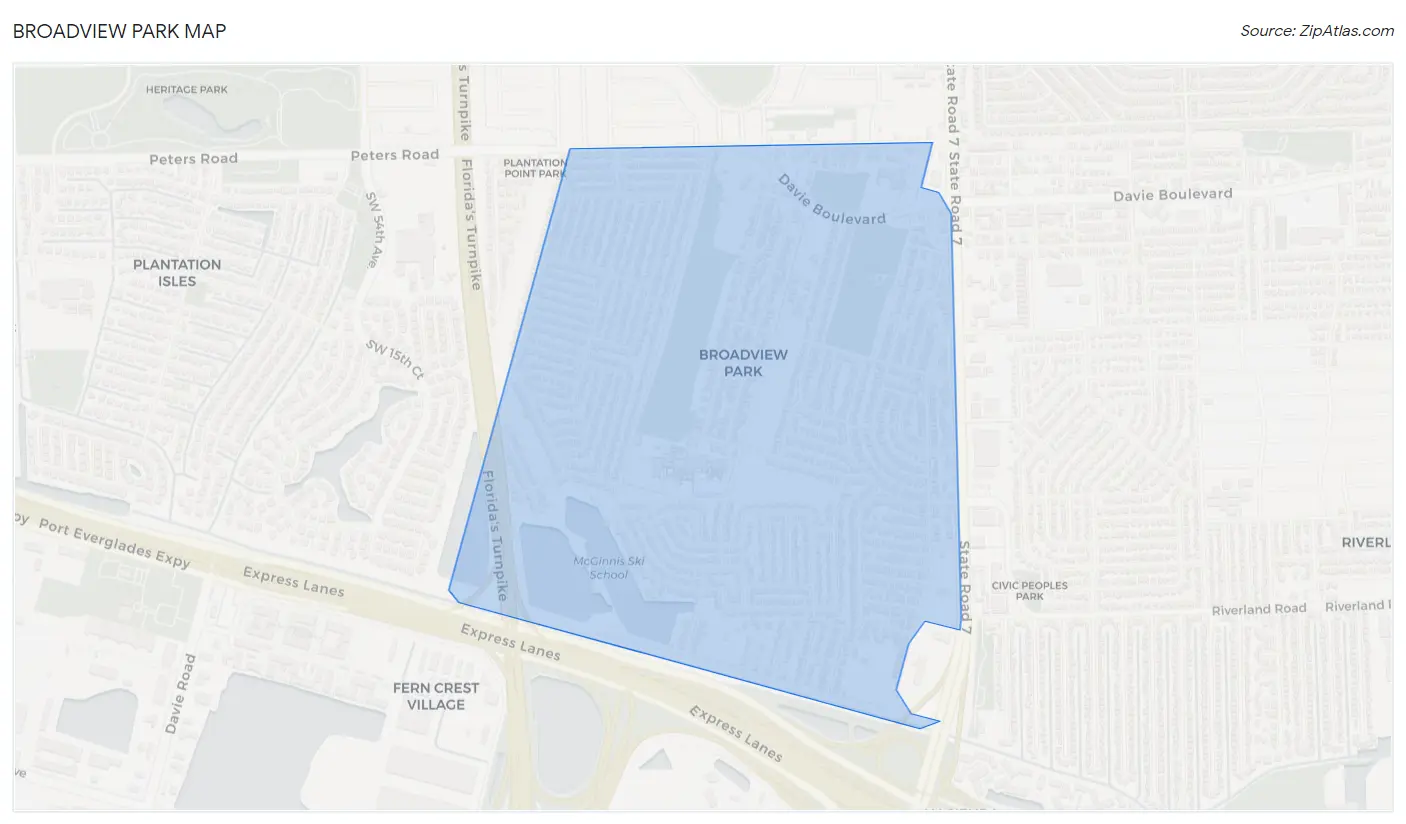
Broadview Park Map
Broadview Park Overview
$26,931
PER CAPITA INCOME
$53,890
AVG FAMILY INCOME
$60,791
AVG HOUSEHOLD INCOME
12.4%
WAGE / INCOME GAP [ % ]
87.6¢/ $1
WAGE / INCOME GAP [ $ ]
0.41
INEQUALITY / GINI INDEX
7,385
TOTAL POPULATION
4,384
MALE POPULATION
3,001
FEMALE POPULATION
146.08
MALES / 100 FEMALES
68.45
FEMALES / 100 MALES
40.9
MEDIAN AGE
3.3
AVG FAMILY SIZE
3.0
AVG HOUSEHOLD SIZE
4,329
LABOR FORCE [ PEOPLE ]
70.2%
PERCENT IN LABOR FORCE
6.6%
UNEMPLOYMENT RATE
Income in Broadview Park
Income Overview in Broadview Park
Per Capita Income in Broadview Park is $26,931, while median incomes of families and households are $53,890 and $60,791 respectively.
| Characteristic | Number | Measure |
| Per Capita Income | 7,385 | $26,931 |
| Median Family Income | 1,727 | $53,890 |
| Mean Family Income | 1,727 | $78,121 |
| Median Household Income | 2,423 | $60,791 |
| Mean Household Income | 2,423 | $74,126 |
| Income Deficit | 1,727 | $0 |
| Wage / Income Gap (%) | 7,385 | 12.36% |
| Wage / Income Gap ($) | 7,385 | 87.64¢ per $1 |
| Gini / Inequality Index | 7,385 | 0.41 |
Earnings by Sex in Broadview Park
Average Earnings in Broadview Park are $26,833, $29,271 for men and $25,654 for women, a difference of 12.4%.
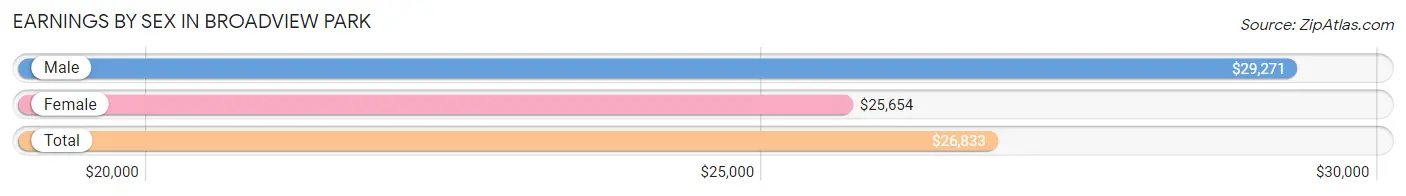
| Sex | Number | Average Earnings |
| Male | 2,631 (60.5%) | $29,271 |
| Female | 1,720 (39.5%) | $25,654 |
| Total | 4,351 (100.0%) | $26,833 |
Earnings by Sex by Income Bracket in Broadview Park
The most common earnings brackets in Broadview Park are $55,000 to $64,999 for men (316 | 12.0%) and $10,000 to $12,499 for women (274 | 15.9%).
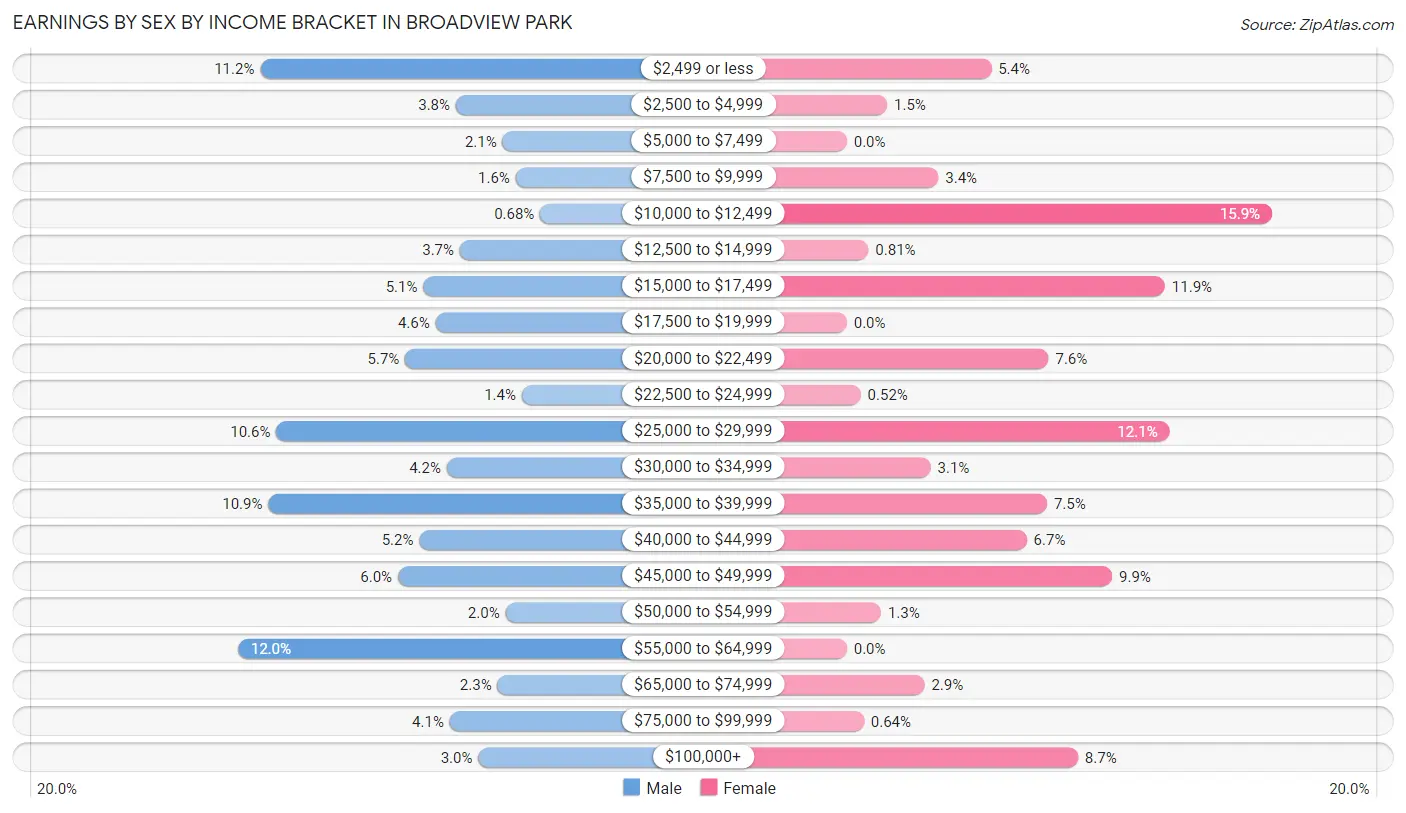
| Income | Male | Female |
| $2,499 or less | 294 (11.2%) | 93 (5.4%) |
| $2,500 to $4,999 | 101 (3.8%) | 26 (1.5%) |
| $5,000 to $7,499 | 55 (2.1%) | 0 (0.0%) |
| $7,500 to $9,999 | 42 (1.6%) | 59 (3.4%) |
| $10,000 to $12,499 | 18 (0.7%) | 274 (15.9%) |
| $12,500 to $14,999 | 97 (3.7%) | 14 (0.8%) |
| $15,000 to $17,499 | 133 (5.1%) | 205 (11.9%) |
| $17,500 to $19,999 | 121 (4.6%) | 0 (0.0%) |
| $20,000 to $22,499 | 151 (5.7%) | 130 (7.6%) |
| $22,500 to $24,999 | 36 (1.4%) | 9 (0.5%) |
| $25,000 to $29,999 | 278 (10.6%) | 208 (12.1%) |
| $30,000 to $34,999 | 110 (4.2%) | 54 (3.1%) |
| $35,000 to $39,999 | 286 (10.9%) | 129 (7.5%) |
| $40,000 to $44,999 | 137 (5.2%) | 116 (6.7%) |
| $45,000 to $49,999 | 158 (6.0%) | 171 (9.9%) |
| $50,000 to $54,999 | 52 (2.0%) | 22 (1.3%) |
| $55,000 to $64,999 | 316 (12.0%) | 0 (0.0%) |
| $65,000 to $74,999 | 60 (2.3%) | 50 (2.9%) |
| $75,000 to $99,999 | 107 (4.1%) | 11 (0.6%) |
| $100,000+ | 79 (3.0%) | 149 (8.7%) |
| Total | 2,631 (100.0%) | 1,720 (100.0%) |
Earnings by Sex by Educational Attainment in Broadview Park
Average earnings in Broadview Park are $35,789 for men and $26,132 for women, a difference of 27.0%. Men with an educational attainment of less than high school enjoy the highest average annual earnings of $37,126, while those with college or associate's degree education earn the least with $27,223. Women with an educational attainment of college or associate's degree earn the most with the average annual earnings of $45,585, while those with less than high school education have the smallest earnings of $15,893.
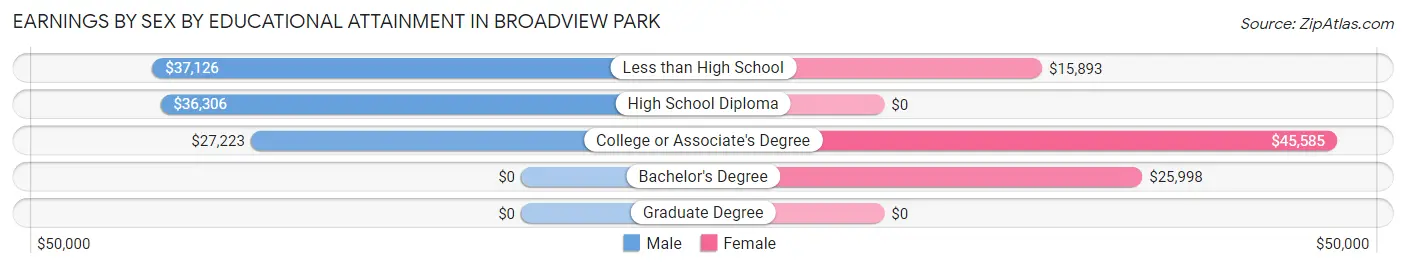
| Educational Attainment | Male Income | Female Income |
| Less than High School | $37,126 | $15,893 |
| High School Diploma | $36,306 | $0 |
| College or Associate's Degree | $27,223 | $45,585 |
| Bachelor's Degree | - | - |
| Graduate Degree | - | - |
| Total | $35,789 | $26,132 |
Family Income in Broadview Park
Family Income Brackets in Broadview Park
According to the Broadview Park family income data, there are 458 families falling into the $50,000 to $74,999 income range, which is the most common income bracket and makes up 26.5% of all families. Conversely, the less than $10,000 income bracket is the least frequent group with only 5 families (0.3%) belonging to this category.
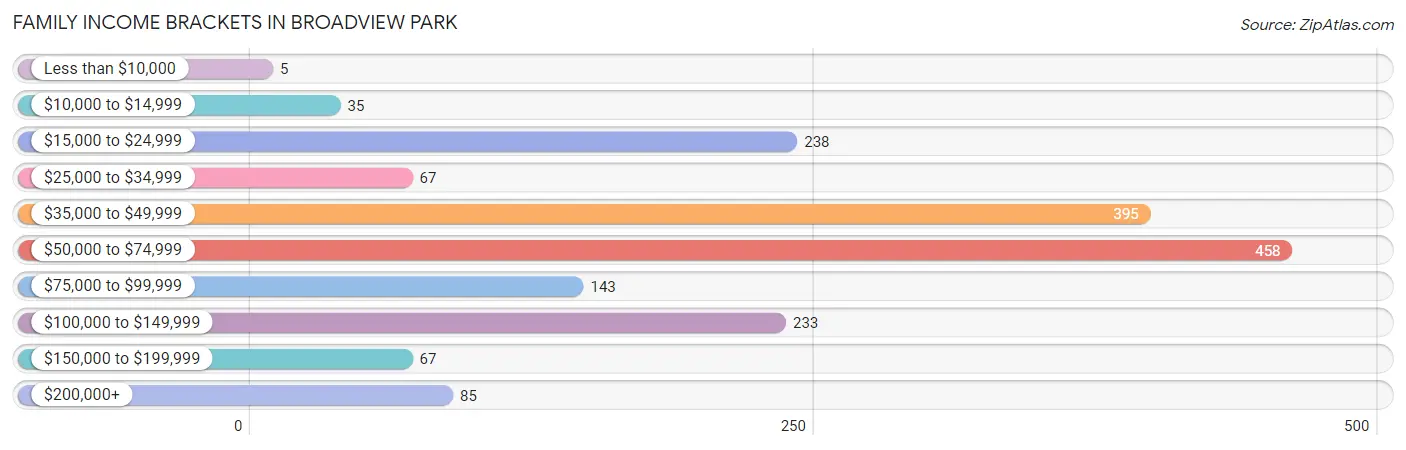
| Income Bracket | # Families | % Families |
| Less than $10,000 | 5 | 0.3% |
| $10,000 to $14,999 | 35 | 2.0% |
| $15,000 to $24,999 | 238 | 13.8% |
| $25,000 to $34,999 | 67 | 3.9% |
| $35,000 to $49,999 | 395 | 22.9% |
| $50,000 to $74,999 | 458 | 26.5% |
| $75,000 to $99,999 | 143 | 8.3% |
| $100,000 to $149,999 | 233 | 13.5% |
| $150,000 to $199,999 | 67 | 3.9% |
| $200,000+ | 85 | 4.9% |
Family Income by Famaliy Size in Broadview Park
2-person families (721 | 41.7%) account for the highest median family income in Broadview Park with $57,545 per family, while 2-person families (721 | 41.7%) have the highest median income of $28,772 per family member.
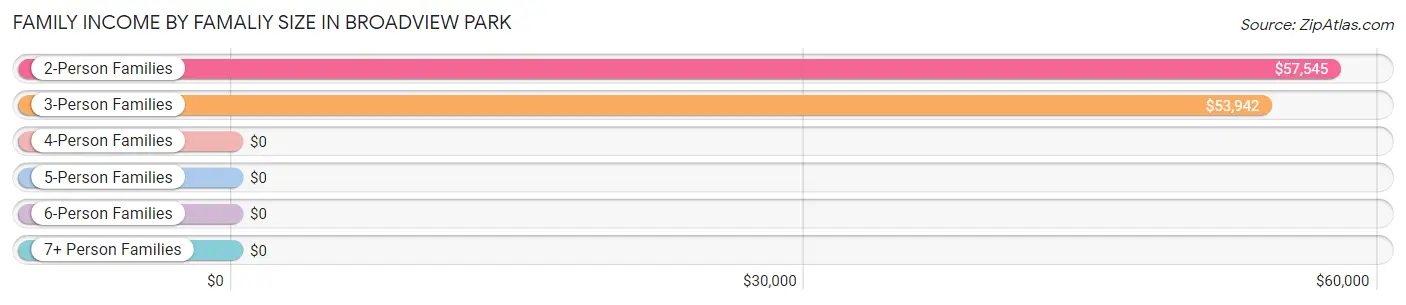
| Income Bracket | # Families | Median Income |
| 2-Person Families | 721 (41.7%) | $57,545 |
| 3-Person Families | 465 (26.9%) | $53,942 |
| 4-Person Families | 369 (21.4%) | $0 |
| 5-Person Families | 134 (7.8%) | $0 |
| 6-Person Families | 38 (2.2%) | $0 |
| 7+ Person Families | 0 (0.0%) | $0 |
| Total | 1,727 (100.0%) | $53,890 |
Family Income by Number of Earners in Broadview Park
The median family income in Broadview Park is $53,890, with families comprising 3+ earners (123) having the highest median family income of $110,598, while families with 1 earner (338) have the lowest median family income of $41,667, accounting for 7.1% and 19.6% of families, respectively.
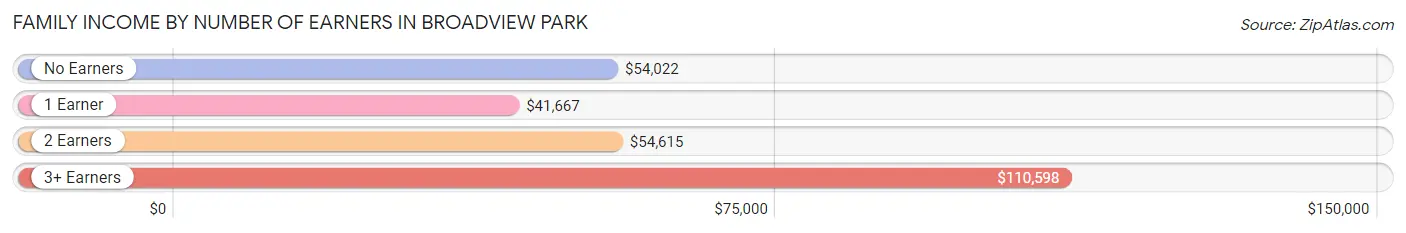
| Number of Earners | # Families | Median Income |
| No Earners | 330 (19.1%) | $54,022 |
| 1 Earner | 338 (19.6%) | $41,667 |
| 2 Earners | 936 (54.2%) | $54,615 |
| 3+ Earners | 123 (7.1%) | $110,598 |
| Total | 1,727 (100.0%) | $53,890 |
Household Income in Broadview Park
Household Income Brackets in Broadview Park
With 531 households falling in the category, the $50,000 to $74,999 income range is the most frequent in Broadview Park, accounting for 21.9% of all households.
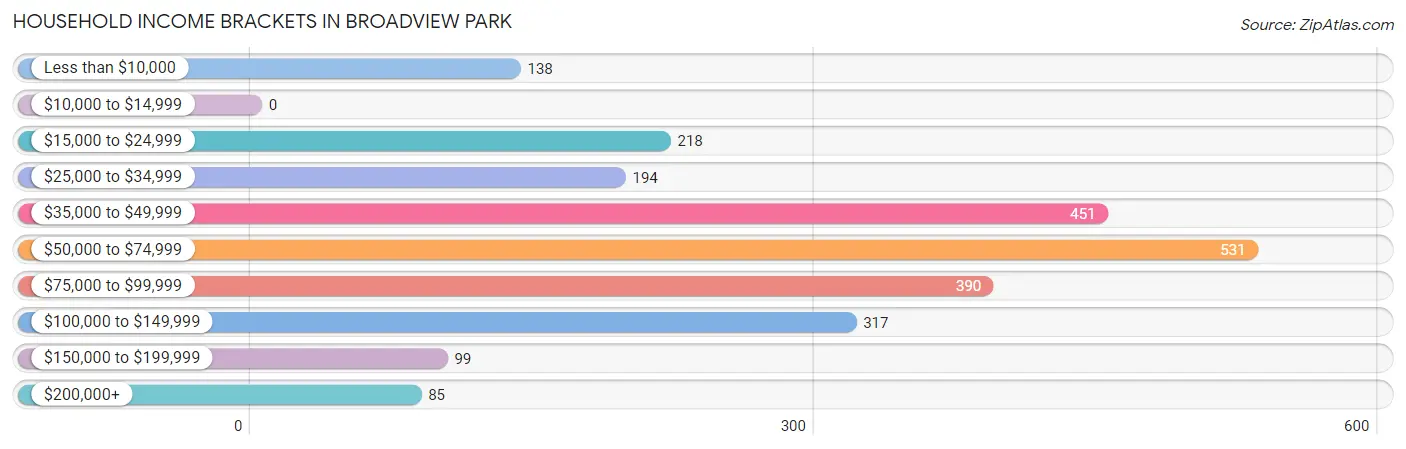
| Income Bracket | # Households | % Households |
| Less than $10,000 | 138 | 5.7% |
| $10,000 to $14,999 | 0 | 0.0% |
| $15,000 to $24,999 | 218 | 9.0% |
| $25,000 to $34,999 | 194 | 8.0% |
| $35,000 to $49,999 | 451 | 18.6% |
| $50,000 to $74,999 | 531 | 21.9% |
| $75,000 to $99,999 | 390 | 16.1% |
| $100,000 to $149,999 | 317 | 13.1% |
| $150,000 to $199,999 | 99 | 4.1% |
| $200,000+ | 85 | 3.5% |
Household Income by Householder Age in Broadview Park
The median household income in Broadview Park is $60,791, with the highest median household income of $63,112 found in the 45 to 64 years age bracket for the primary householder. A total of 942 households (38.9%) fall into this category.
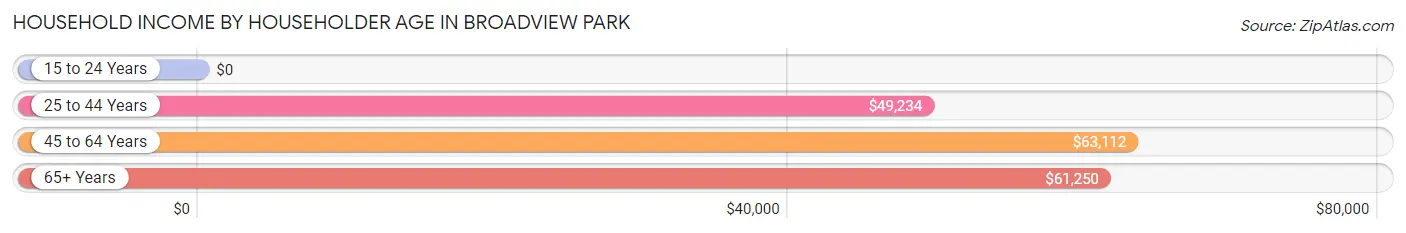
| Income Bracket | # Households | Median Income |
| 15 to 24 Years | 0 (0.0%) | $0 |
| 25 to 44 Years | 981 (40.5%) | $49,234 |
| 45 to 64 Years | 942 (38.9%) | $63,112 |
| 65+ Years | 500 (20.6%) | $61,250 |
| Total | 2,423 (100.0%) | $60,791 |
Poverty in Broadview Park
Income Below Poverty by Sex and Age in Broadview Park
With 18.8% poverty level for males and 19.5% for females among the residents of Broadview Park, under 5 year old males and under 5 year old females are the most vulnerable to poverty, with 105 males (49.3%) and 117 females (66.9%) in their respective age groups living below the poverty level.
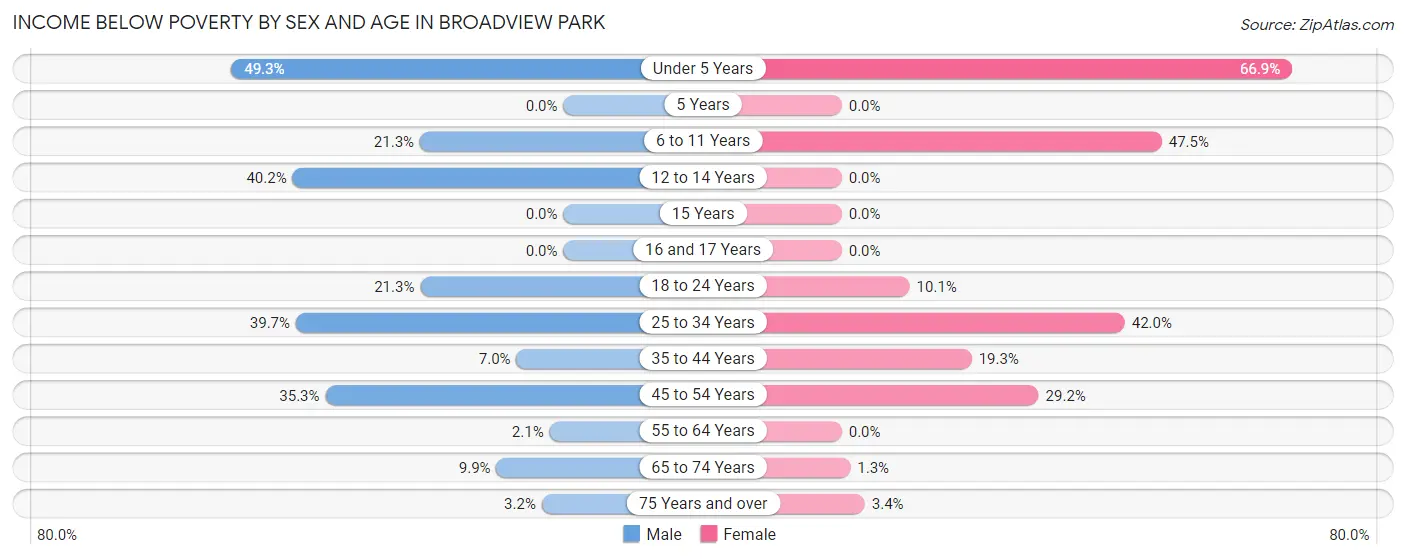
| Age Bracket | Male | Female |
| Under 5 Years | 105 (49.3%) | 117 (66.9%) |
| 5 Years | 0 (0.0%) | 0 (0.0%) |
| 6 to 11 Years | 69 (21.3%) | 48 (47.5%) |
| 12 to 14 Years | 37 (40.2%) | 0 (0.0%) |
| 15 Years | 0 (0.0%) | 0 (0.0%) |
| 16 and 17 Years | 0 (0.0%) | 0 (0.0%) |
| 18 to 24 Years | 102 (21.2%) | 12 (10.1%) |
| 25 to 34 Years | 197 (39.7%) | 195 (42.0%) |
| 35 to 44 Years | 62 (7.0%) | 108 (19.3%) |
| 45 to 54 Years | 200 (35.3%) | 95 (29.2%) |
| 55 to 64 Years | 13 (2.1%) | 0 (0.0%) |
| 65 to 74 Years | 32 (9.9%) | 4 (1.3%) |
| 75 Years and over | 5 (3.2%) | 5 (3.4%) |
| Total | 822 (18.8%) | 584 (19.5%) |
Income Above Poverty by Sex and Age in Broadview Park
According to the poverty statistics in Broadview Park, males aged 5 years and females aged 12 to 14 years are the age groups that are most secure financially, with 100.0% of males and 100.0% of females in these age groups living above the poverty line.
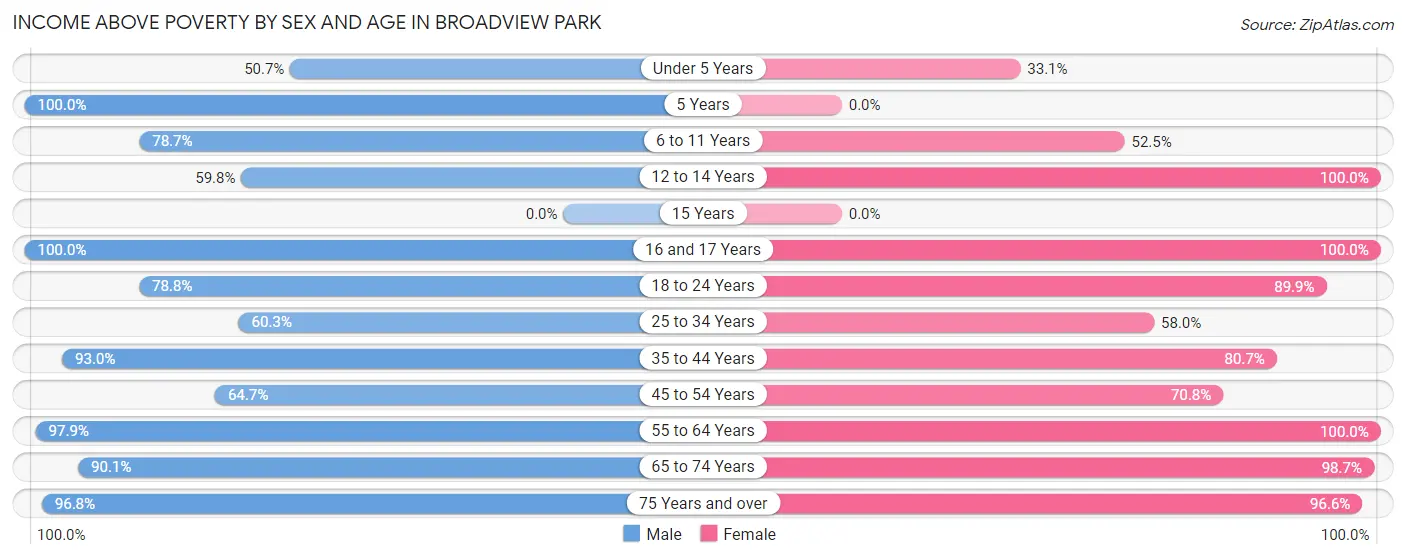
| Age Bracket | Male | Female |
| Under 5 Years | 108 (50.7%) | 58 (33.1%) |
| 5 Years | 128 (100.0%) | 0 (0.0%) |
| 6 to 11 Years | 255 (78.7%) | 53 (52.5%) |
| 12 to 14 Years | 55 (59.8%) | 182 (100.0%) |
| 15 Years | 0 (0.0%) | 0 (0.0%) |
| 16 and 17 Years | 78 (100.0%) | 57 (100.0%) |
| 18 to 24 Years | 378 (78.7%) | 107 (89.9%) |
| 25 to 34 Years | 299 (60.3%) | 269 (58.0%) |
| 35 to 44 Years | 828 (93.0%) | 452 (80.7%) |
| 45 to 54 Years | 366 (64.7%) | 230 (70.8%) |
| 55 to 64 Years | 617 (97.9%) | 551 (100.0%) |
| 65 to 74 Years | 290 (90.1%) | 311 (98.7%) |
| 75 Years and over | 151 (96.8%) | 141 (96.6%) |
| Total | 3,553 (81.2%) | 2,411 (80.5%) |
Income Below Poverty Among Married-Couple Families in Broadview Park
The poverty statistics for married-couple families in Broadview Park show that 13.9% or 135 of the total 969 families live below the poverty line. Families with 3 or 4 children have the highest poverty rate of 30.4%, comprising of 38 families. On the other hand, families with no children have the lowest poverty rate of 1.7%, which includes 9 families.
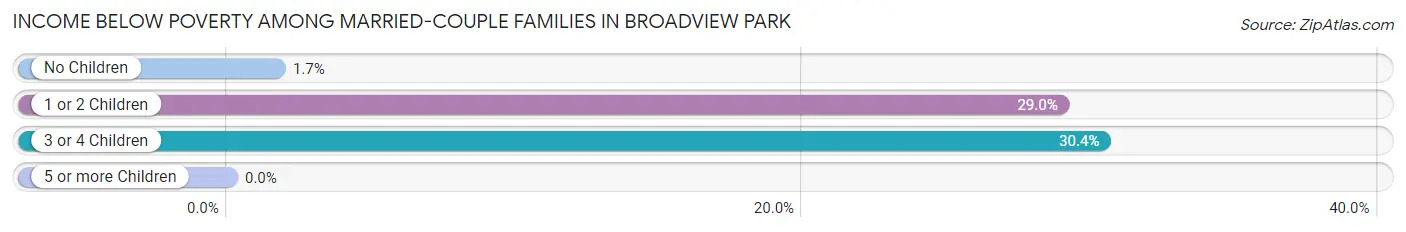
| Children | Above Poverty | Below Poverty |
| No Children | 531 (98.3%) | 9 (1.7%) |
| 1 or 2 Children | 216 (71.1%) | 88 (28.9%) |
| 3 or 4 Children | 87 (69.6%) | 38 (30.4%) |
| 5 or more Children | 0 (0.0%) | 0 (0.0%) |
| Total | 834 (86.1%) | 135 (13.9%) |
Income Below Poverty Among Single-Parent Households in Broadview Park
| Children | Single Father | Single Mother |
| No Children | 0 (0.0%) | 0 (0.0%) |
| 1 or 2 Children | 0 (0.0%) | 95 (34.3%) |
| 3 or 4 Children | 0 (0.0%) | 0 (0.0%) |
| 5 or more Children | 0 (0.0%) | 0 (0.0%) |
| Total | 0 (0.0%) | 95 (15.8%) |
Income Below Poverty Among Married-Couple vs Single-Parent Households in Broadview Park
The poverty data for Broadview Park shows that 135 of the married-couple family households (13.9%) and 95 of the single-parent households (12.5%) are living below the poverty level. Within the married-couple family households, those with 3 or 4 children have the highest poverty rate, with 38 households (30.4%) falling below the poverty line. Among the single-parent households, those with 1 or 2 children have the highest poverty rate, with 95 household (32.1%) living below poverty.
| Children | Married-Couple Families | Single-Parent Households |
| No Children | 9 (1.7%) | 0 (0.0%) |
| 1 or 2 Children | 88 (28.9%) | 95 (32.1%) |
| 3 or 4 Children | 38 (30.4%) | 0 (0.0%) |
| 5 or more Children | 0 (0.0%) | 0 (0.0%) |
| Total | 135 (13.9%) | 95 (12.5%) |
Race in Broadview Park
The most populous races in Broadview Park are Hispanic or Latino (4,633 | 62.7%), White / Caucasian (3,565 | 48.3%), and Two or more Races (1,907 | 25.8%).
| Race | # Population | % Population |
| Asian | 215 | 2.9% |
| Black / African American | 617 | 8.4% |
| Hawaiian / Pacific | 0 | 0.0% |
| Hispanic or Latino | 4,633 | 62.7% |
| Native / Alaskan | 21 | 0.3% |
| White / Caucasian | 3,565 | 48.3% |
| Two or more Races | 1,907 | 25.8% |
| Some other Race | 1,060 | 14.3% |
| Total | 7,385 | 100.0% |
Ancestry in Broadview Park
The most populous ancestries reported in Broadview Park are Cuban (1,157 | 15.7%), Central American (918 | 12.4%), South American (875 | 11.8%), Honduran (866 | 11.7%), and American (597 | 8.1%), together accounting for 59.8% of all Broadview Park residents.
| Ancestry | # Population | % Population |
| American | 597 | 8.1% |
| Argentinean | 43 | 0.6% |
| Australian | 100 | 1.3% |
| Bahamian | 244 | 3.3% |
| Bhutanese | 15 | 0.2% |
| British | 34 | 0.5% |
| Cape Verdean | 4 | 0.1% |
| Central American | 918 | 12.4% |
| Colombian | 368 | 5.0% |
| Cuban | 1,157 | 15.7% |
| Dominican | 219 | 3.0% |
| Dutch | 21 | 0.3% |
| Ecuadorian | 99 | 1.3% |
| English | 131 | 1.8% |
| European | 13 | 0.2% |
| German | 358 | 4.9% |
| Guatemalan | 52 | 0.7% |
| Haitian | 30 | 0.4% |
| Honduran | 866 | 11.7% |
| Hungarian | 15 | 0.2% |
| Indian (Asian) | 19 | 0.3% |
| Irish | 166 | 2.2% |
| Italian | 400 | 5.4% |
| Jamaican | 62 | 0.8% |
| Korean | 115 | 1.6% |
| Mexican | 480 | 6.5% |
| New Zealander | 100 | 1.3% |
| Peruvian | 21 | 0.3% |
| Polish | 16 | 0.2% |
| Portuguese | 26 | 0.4% |
| Puerto Rican | 502 | 6.8% |
| Russian | 17 | 0.2% |
| Slovak | 4 | 0.1% |
| South American | 875 | 11.8% |
| Subsaharan African | 4 | 0.1% |
| Thai | 85 | 1.1% |
| Venezuelan | 344 | 4.7% |
| Welsh | 11 | 0.2% |
| Yugoslavian | 42 | 0.6% | View All 39 Rows |
Immigrants in Broadview Park
The most numerous immigrant groups reported in Broadview Park came from Latin America (3,233 | 43.8%), Central America (1,236 | 16.7%), Caribbean (1,192 | 16.1%), Honduras (970 | 13.1%), and South America (805 | 10.9%), together accounting for 100.7% of all Broadview Park residents.
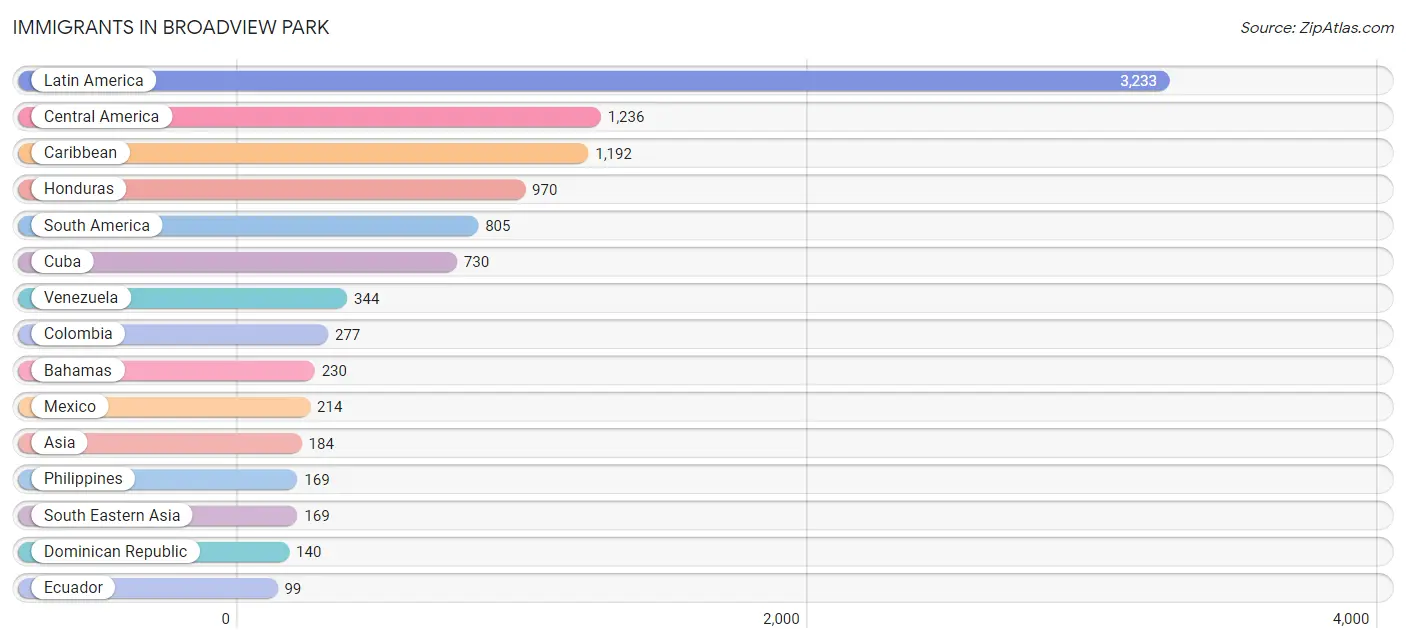
| Immigration Origin | # Population | % Population |
| Africa | 4 | 0.1% |
| Argentina | 43 | 0.6% |
| Asia | 184 | 2.5% |
| Bahamas | 230 | 3.1% |
| Cabo Verde | 4 | 0.1% |
| Caribbean | 1,192 | 16.1% |
| Central America | 1,236 | 16.7% |
| Colombia | 277 | 3.7% |
| Cuba | 730 | 9.9% |
| Dominican Republic | 140 | 1.9% |
| Eastern Asia | 15 | 0.2% |
| Ecuador | 99 | 1.3% |
| Europe | 22 | 0.3% |
| Guatemala | 52 | 0.7% |
| Haiti | 30 | 0.4% |
| Honduras | 970 | 13.1% |
| Jamaica | 62 | 0.8% |
| Japan | 15 | 0.2% |
| Latin America | 3,233 | 43.8% |
| Mexico | 214 | 2.9% |
| Northern Europe | 22 | 0.3% |
| Peru | 42 | 0.6% |
| Philippines | 169 | 2.3% |
| South America | 805 | 10.9% |
| South Eastern Asia | 169 | 2.3% |
| Sweden | 22 | 0.3% |
| Venezuela | 344 | 4.7% |
| Western Africa | 4 | 0.1% | View All 28 Rows |
Sex and Age in Broadview Park
Sex and Age in Broadview Park
The most populous age groups in Broadview Park are 40 to 44 Years (522 | 11.9%) for men and 40 to 44 Years (449 | 15.0%) for women.
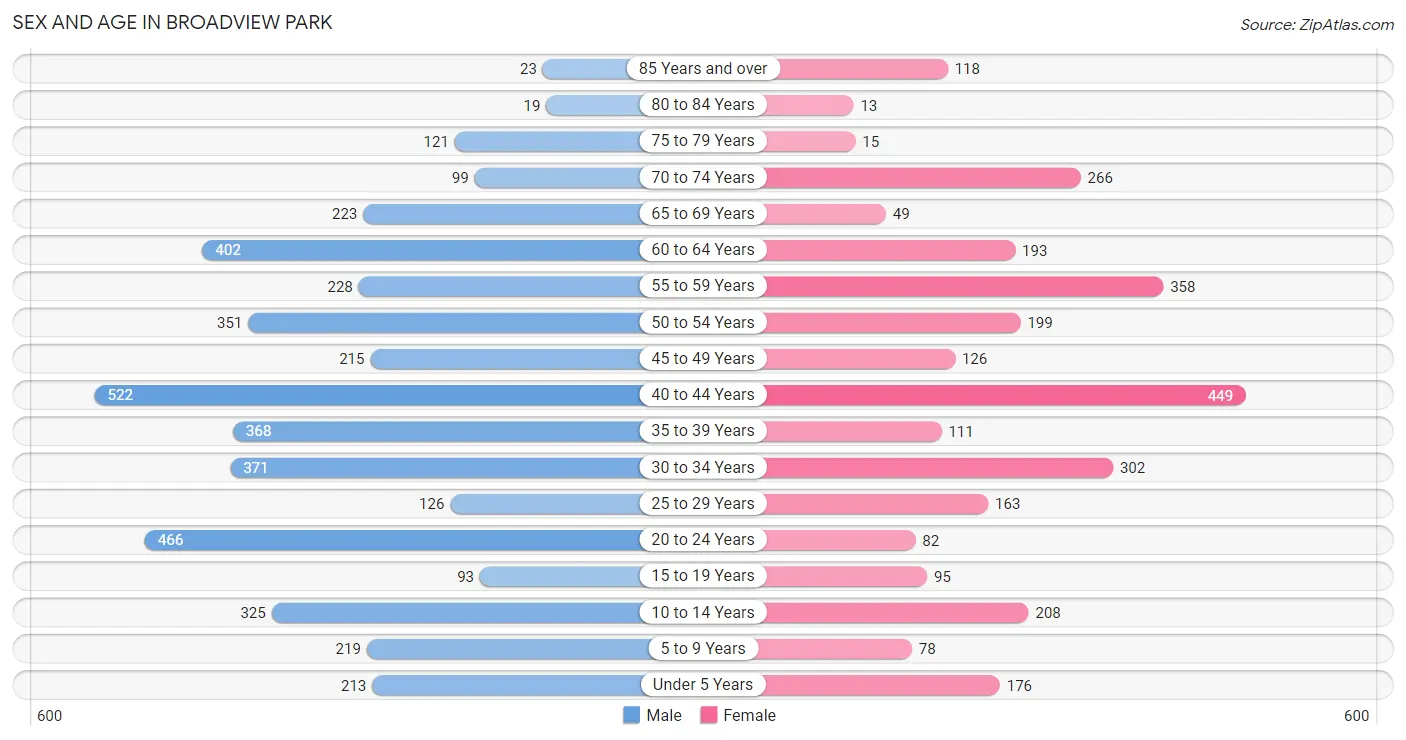
| Age Bracket | Male | Female |
| Under 5 Years | 213 (4.9%) | 176 (5.9%) |
| 5 to 9 Years | 219 (5.0%) | 78 (2.6%) |
| 10 to 14 Years | 325 (7.4%) | 208 (6.9%) |
| 15 to 19 Years | 93 (2.1%) | 95 (3.2%) |
| 20 to 24 Years | 466 (10.6%) | 82 (2.7%) |
| 25 to 29 Years | 126 (2.9%) | 163 (5.4%) |
| 30 to 34 Years | 371 (8.5%) | 302 (10.1%) |
| 35 to 39 Years | 368 (8.4%) | 111 (3.7%) |
| 40 to 44 Years | 522 (11.9%) | 449 (15.0%) |
| 45 to 49 Years | 215 (4.9%) | 126 (4.2%) |
| 50 to 54 Years | 351 (8.0%) | 199 (6.6%) |
| 55 to 59 Years | 228 (5.2%) | 358 (11.9%) |
| 60 to 64 Years | 402 (9.2%) | 193 (6.4%) |
| 65 to 69 Years | 223 (5.1%) | 49 (1.6%) |
| 70 to 74 Years | 99 (2.3%) | 266 (8.9%) |
| 75 to 79 Years | 121 (2.8%) | 15 (0.5%) |
| 80 to 84 Years | 19 (0.4%) | 13 (0.4%) |
| 85 Years and over | 23 (0.5%) | 118 (3.9%) |
| Total | 4,384 (100.0%) | 3,001 (100.0%) |
Families and Households in Broadview Park
Median Family Size in Broadview Park
The median family size in Broadview Park is 3.26 persons per family, with single female/mother families (603 | 34.9%) accounting for the largest median family size of 3.59 persons per family. On the other hand, single male/father families (155 | 9.0%) represent the smallest median family size with 2.45 persons per family.
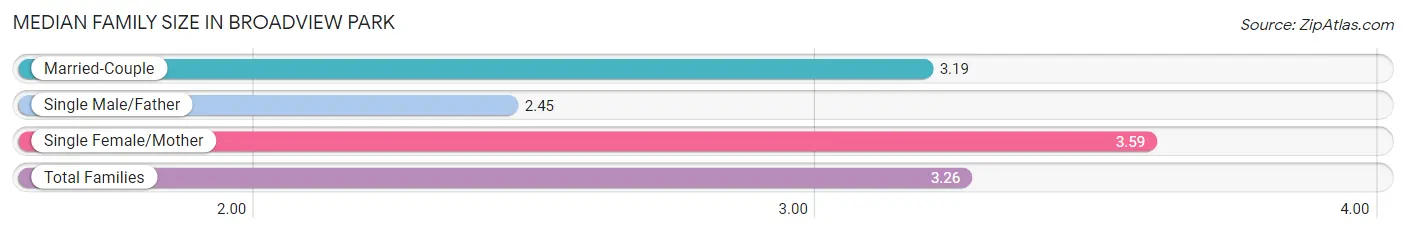
| Family Type | # Families | Family Size |
| Married-Couple | 969 (56.1%) | 3.19 |
| Single Male/Father | 155 (9.0%) | 2.45 |
| Single Female/Mother | 603 (34.9%) | 3.59 |
| Total Families | 1,727 (100.0%) | 3.26 |
Median Household Size in Broadview Park
The median household size in Broadview Park is 3.00 persons per household, with single female/mother households (603 | 24.9%) accounting for the largest median household size of 4.17 persons per household. non-family households (696 | 28.7%) represent the smallest median household size with 1.57 persons per household.
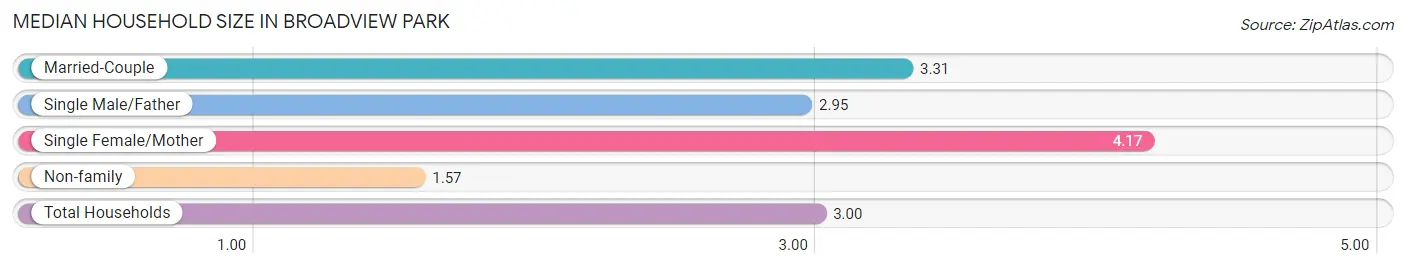
| Household Type | # Households | Household Size |
| Married-Couple | 969 (40.0%) | 3.31 |
| Single Male/Father | 155 (6.4%) | 2.95 |
| Single Female/Mother | 603 (24.9%) | 4.17 |
| Non-family | 696 (28.7%) | 1.57 |
| Total Households | 2,423 (100.0%) | 3.00 |
Household Size by Marriage Status in Broadview Park
Out of a total of 2,423 households in Broadview Park, 1,727 (71.3%) are family households, while 696 (28.7%) are nonfamily households. The most numerous type of family households are 2-person households, comprising 586, and the most common type of nonfamily households are 1-person households, comprising 461.
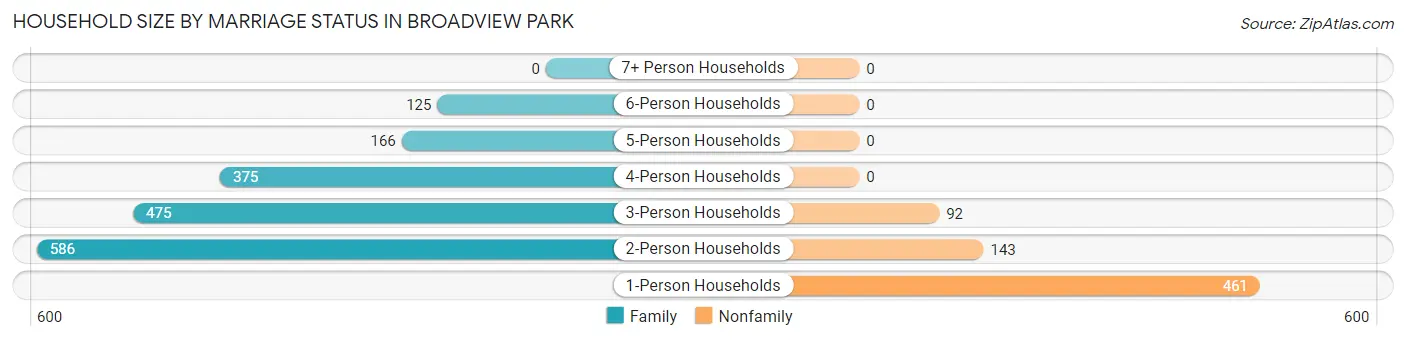
| Household Size | Family Households | Nonfamily Households |
| 1-Person Households | - | 461 (19.0%) |
| 2-Person Households | 586 (24.2%) | 143 (5.9%) |
| 3-Person Households | 475 (19.6%) | 92 (3.8%) |
| 4-Person Households | 375 (15.5%) | 0 (0.0%) |
| 5-Person Households | 166 (6.9%) | 0 (0.0%) |
| 6-Person Households | 125 (5.2%) | 0 (0.0%) |
| 7+ Person Households | 0 (0.0%) | 0 (0.0%) |
| Total | 1,727 (71.3%) | 696 (28.7%) |
Female Fertility in Broadview Park
Fertility by Age in Broadview Park
Average fertility rate in Broadview Park is 102.0 births per 1,000 women. Women in the age bracket of 20 to 34 years have the highest fertility rate with 210.0 births per 1,000 women. Women in the age bracket of 20 to 34 years acount for 82.7% of all women with births.
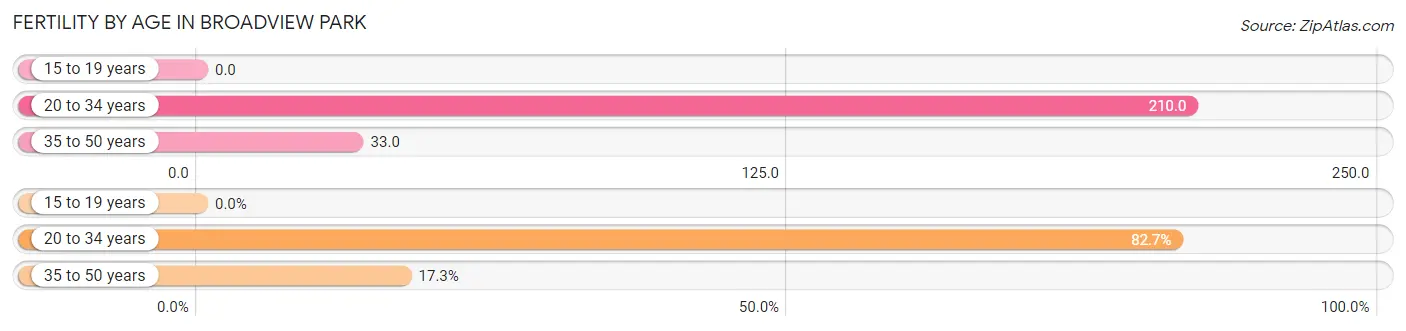
| Age Bracket | Women with Births | Births / 1,000 Women |
| 15 to 19 years | 0 (0.0%) | 0.0 |
| 20 to 34 years | 115 (82.7%) | 210.0 |
| 35 to 50 years | 24 (17.3%) | 33.0 |
| Total | 139 (100.0%) | 102.0 |
Fertility by Age by Marriage Status in Broadview Park
51.1% of women with births (139) in Broadview Park are married. The highest percentage of unmarried women with births falls into 20 to 34 years age bracket with 59.1% of them unmarried at the time of birth, while the lowest percentage of unmarried women with births belong to 35 to 50 years age bracket with 0.0% of them unmarried.
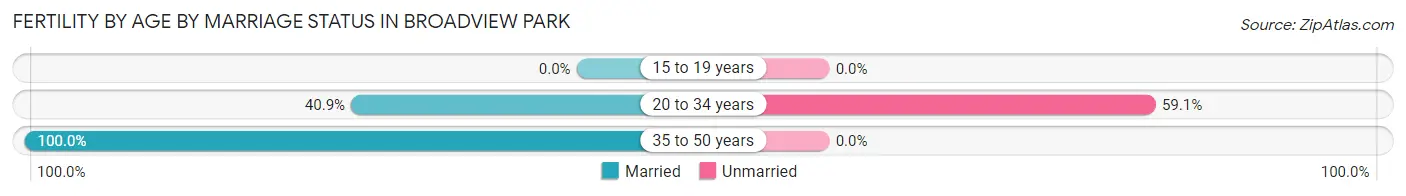
| Age Bracket | Married | Unmarried |
| 15 to 19 years | 0 (0.0%) | 0 (0.0%) |
| 20 to 34 years | 47 (40.9%) | 68 (59.1%) |
| 35 to 50 years | 24 (100.0%) | 0 (0.0%) |
| Total | 71 (51.1%) | 68 (48.9%) |
Fertility by Education in Broadview Park
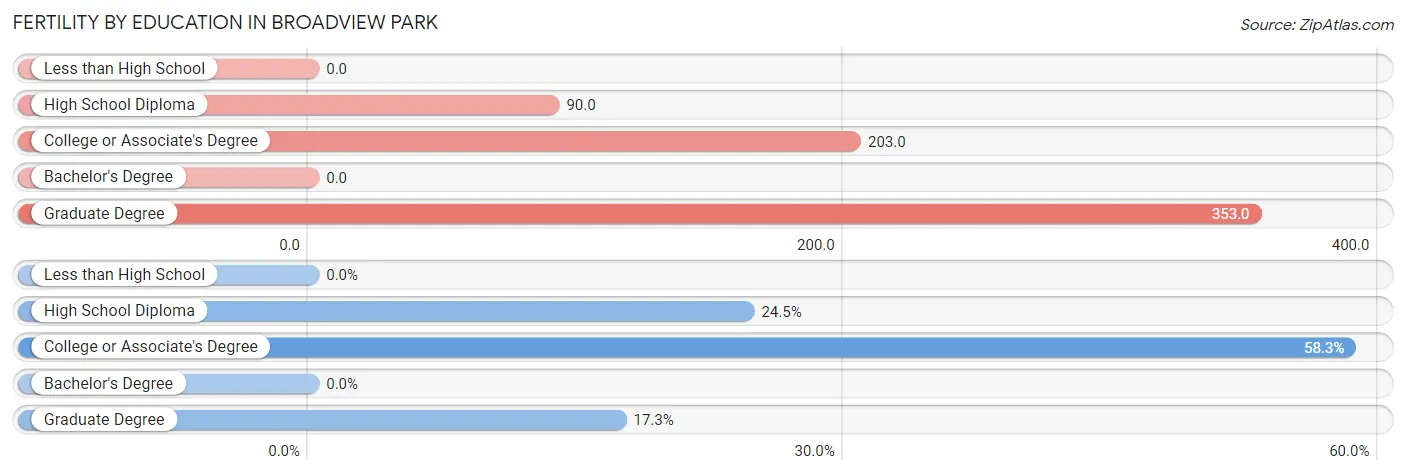
| Educational Attainment | Women with Births | Births / 1,000 Women |
| Less than High School | 0 (0.0%) | 0.0 |
| High School Diploma | 34 (24.5%) | 90.0 |
| College or Associate's Degree | 81 (58.3%) | 203.0 |
| Bachelor's Degree | 0 (0.0%) | 0.0 |
| Graduate Degree | 24 (17.3%) | 353.0 |
| Total | 139 (100.0%) | 102.0 |
Fertility by Education by Marriage Status in Broadview Park
48.9% of women with births in Broadview Park are unmarried. Women with the educational attainment of graduate degree are most likely to be married with 100.0% of them married at childbirth, while women with the educational attainment of high school diploma are least likely to be married with 100.0% of them unmarried at childbirth.
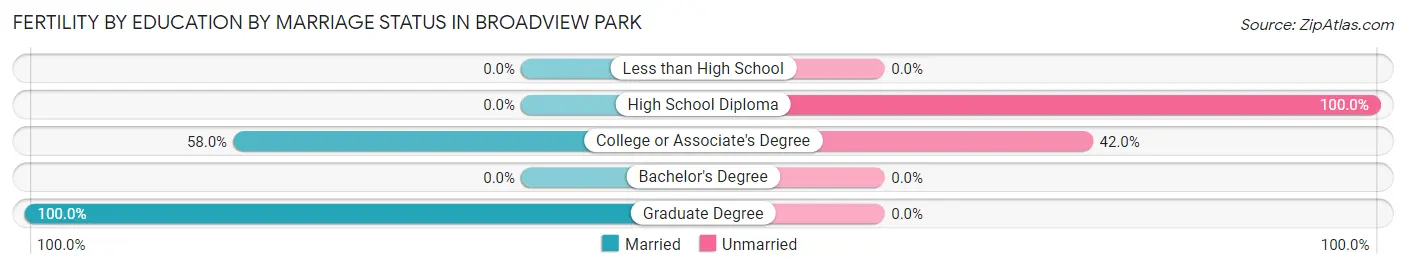
| Educational Attainment | Married | Unmarried |
| Less than High School | 0 (0.0%) | 0 (0.0%) |
| High School Diploma | 0 (0.0%) | 34 (100.0%) |
| College or Associate's Degree | 47 (58.0%) | 34 (42.0%) |
| Bachelor's Degree | 0 (0.0%) | 0 (0.0%) |
| Graduate Degree | 24 (100.0%) | 0 (0.0%) |
| Total | 71 (51.1%) | 68 (48.9%) |
Employment Characteristics in Broadview Park
Employment by Class of Employer in Broadview Park
Among the 4,043 employed individuals in Broadview Park, private company employees (2,977 | 73.6%), self-employed (not incorporated) (493 | 12.2%), and self-employed (incorporated) (401 | 9.9%) make up the most common classes of employment.
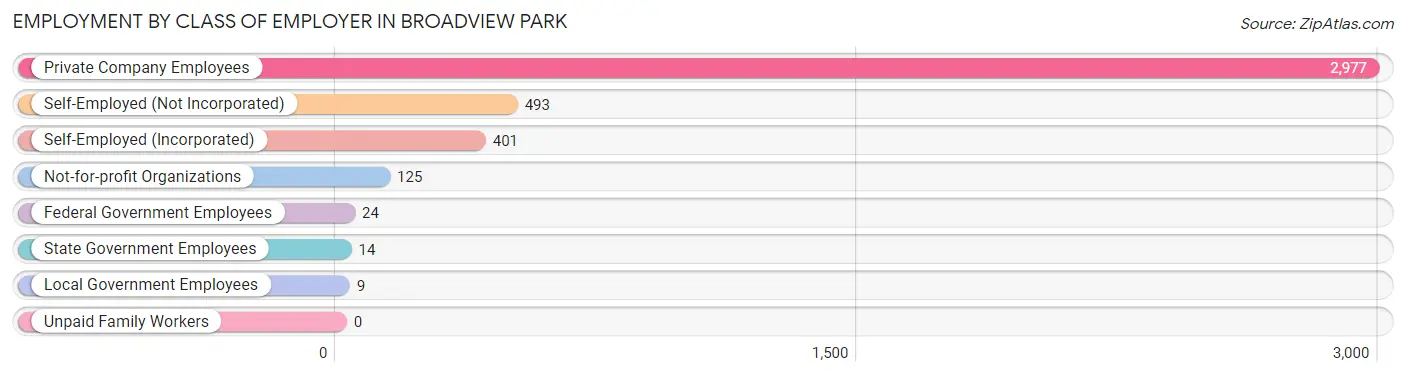
| Employer Class | # Employees | % Employees |
| Private Company Employees | 2,977 | 73.6% |
| Self-Employed (Incorporated) | 401 | 9.9% |
| Self-Employed (Not Incorporated) | 493 | 12.2% |
| Not-for-profit Organizations | 125 | 3.1% |
| Local Government Employees | 9 | 0.2% |
| State Government Employees | 14 | 0.4% |
| Federal Government Employees | 24 | 0.6% |
| Unpaid Family Workers | 0 | 0.0% |
| Total | 4,043 | 100.0% |
Employment Status by Age in Broadview Park
According to the labor force statistics for Broadview Park, out of the total population over 16 years of age (6,166), 70.2% or 4,329 individuals are in the labor force, with 6.6% or 286 of them unemployed. The age group with the highest labor force participation rate is 35 to 44 years, with 98.0% or 1,421 individuals in the labor force. Within the labor force, the 55 to 59 years age range has the highest percentage of unemployed individuals, with 21.5% or 109 of them being unemployed.
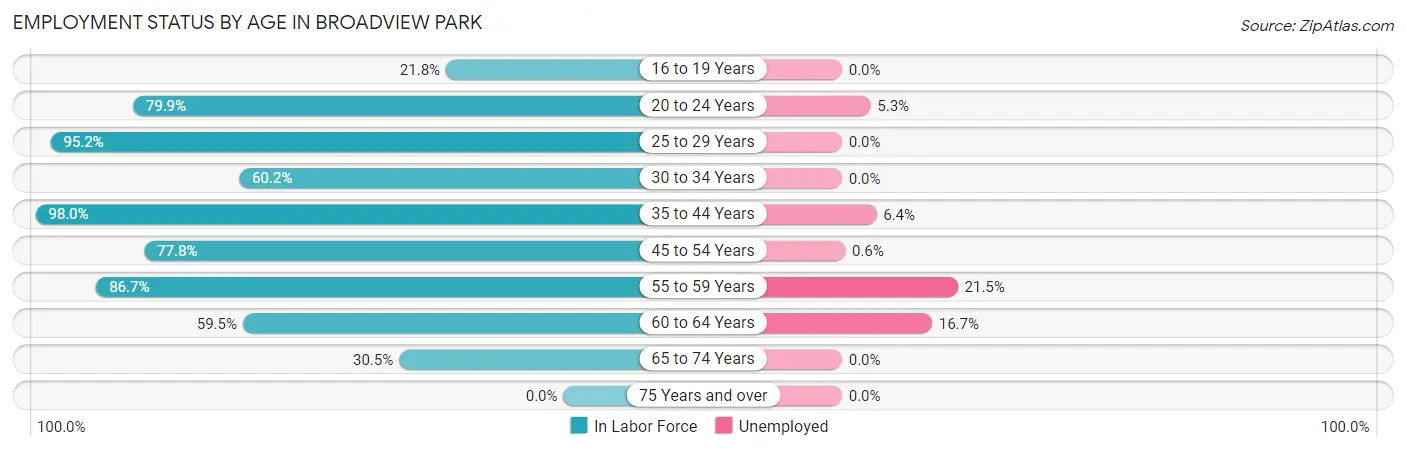
| Age Bracket | In Labor Force | Unemployed |
| 16 to 19 Years | 41 (21.8%) | 0 (0.0%) |
| 20 to 24 Years | 438 (79.9%) | 23 (5.3%) |
| 25 to 29 Years | 275 (95.2%) | 0 (0.0%) |
| 30 to 34 Years | 405 (60.2%) | 0 (0.0%) |
| 35 to 44 Years | 1,421 (98.0%) | 91 (6.4%) |
| 45 to 54 Years | 693 (77.8%) | 4 (0.6%) |
| 55 to 59 Years | 508 (86.7%) | 109 (21.5%) |
| 60 to 64 Years | 354 (59.5%) | 59 (16.7%) |
| 65 to 74 Years | 194 (30.5%) | 0 (0.0%) |
| 75 Years and over | 0 (0.0%) | 0 (0.0%) |
| Total | 4,329 (70.2%) | 286 (6.6%) |
Employment Status by Educational Attainment in Broadview Park
According to labor force statistics for Broadview Park, 81.5% of individuals (3,654) out of the total population between 25 and 64 years of age (4,484) are in the labor force, with 7.2% or 263 of them being unemployed. The group with the highest labor force participation rate are those with the educational attainment of college / associate degree, with 87.5% or 862 individuals in the labor force. Within the labor force, individuals with less than high school education have the highest percentage of unemployment, with 20.9% or 138 of them being unemployed.
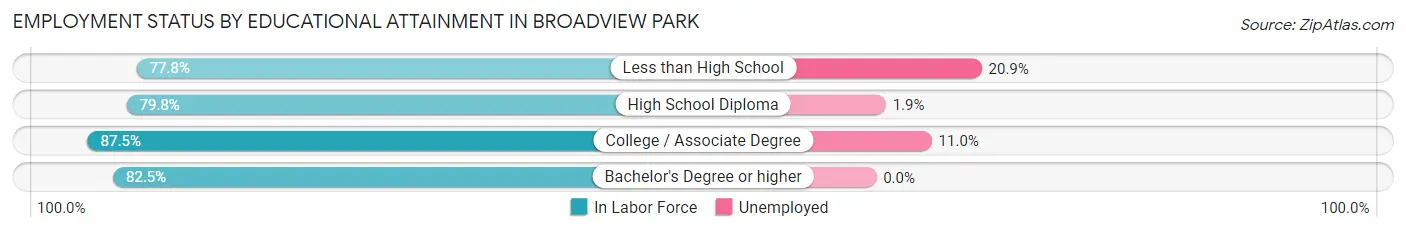
| Educational Attainment | In Labor Force | Unemployed |
| Less than High School | 660 (77.8%) | 177 (20.9%) |
| High School Diploma | 1,582 (79.8%) | 38 (1.9%) |
| College / Associate Degree | 862 (87.5%) | 108 (11.0%) |
| Bachelor's Degree or higher | 552 (82.5%) | 0 (0.0%) |
| Total | 3,654 (81.5%) | 323 (7.2%) |
Employment Occupations by Sex in Broadview Park
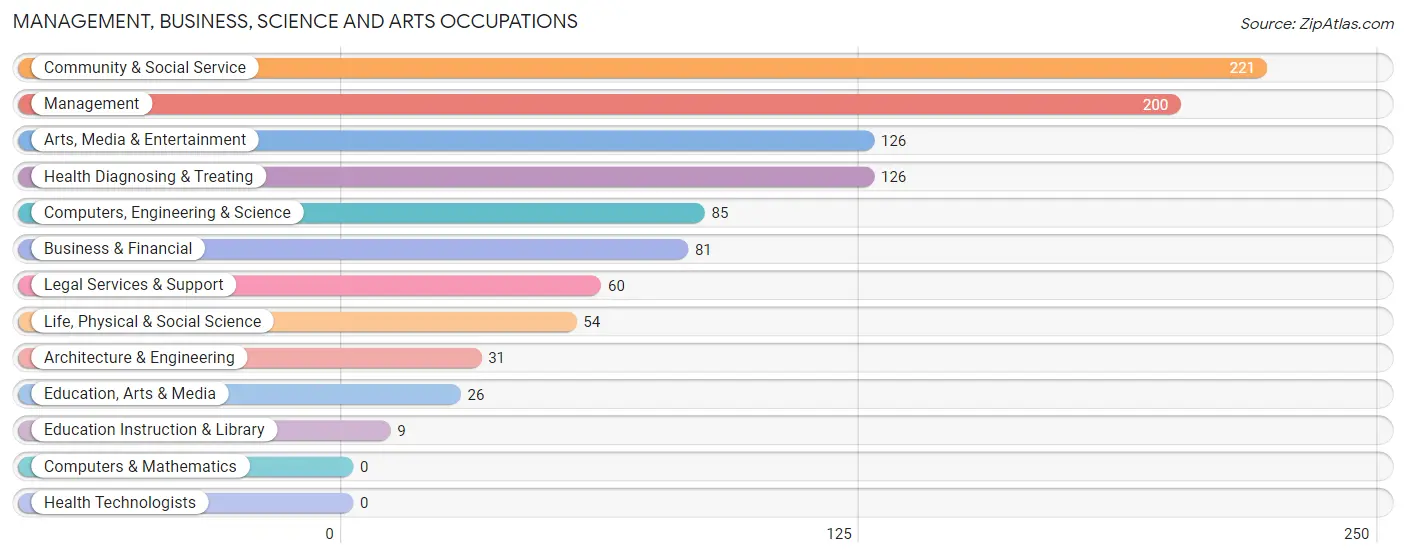
Management, Business, Science and Arts Occupations
The most common Management, Business, Science and Arts occupations in Broadview Park are Community & Social Service (221 | 5.5%), Management (200 | 5.0%), Arts, Media & Entertainment (126 | 3.1%), Health Diagnosing & Treating (126 | 3.1%), and Computers, Engineering & Science (85 | 2.1%).
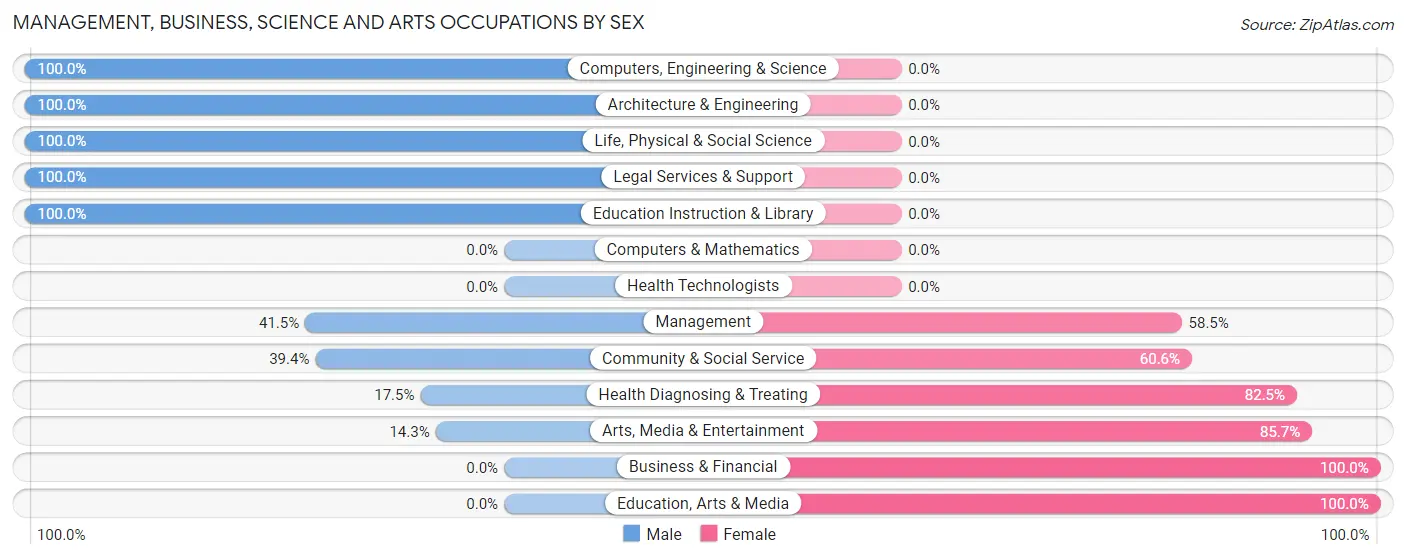
Management, Business, Science and Arts Occupations by Sex
Within the Management, Business, Science and Arts occupations in Broadview Park, the most male-oriented occupations are Computers, Engineering & Science (100.0%), Architecture & Engineering (100.0%), and Life, Physical & Social Science (100.0%), while the most female-oriented occupations are Business & Financial (100.0%), Education, Arts & Media (100.0%), and Arts, Media & Entertainment (85.7%).
| Occupation | Male | Female |
| Management | 83 (41.5%) | 117 (58.5%) |
| Business & Financial | 0 (0.0%) | 81 (100.0%) |
| Computers, Engineering & Science | 85 (100.0%) | 0 (0.0%) |
| Computers & Mathematics | 0 (0.0%) | 0 (0.0%) |
| Architecture & Engineering | 31 (100.0%) | 0 (0.0%) |
| Life, Physical & Social Science | 54 (100.0%) | 0 (0.0%) |
| Community & Social Service | 87 (39.4%) | 134 (60.6%) |
| Education, Arts & Media | 0 (0.0%) | 26 (100.0%) |
| Legal Services & Support | 60 (100.0%) | 0 (0.0%) |
| Education Instruction & Library | 9 (100.0%) | 0 (0.0%) |
| Arts, Media & Entertainment | 18 (14.3%) | 108 (85.7%) |
| Health Diagnosing & Treating | 22 (17.5%) | 104 (82.5%) |
| Health Technologists | 0 (0.0%) | 0 (0.0%) |
| Total (Category) | 277 (38.9%) | 436 (61.2%) |
| Total (Overall) | 2,445 (60.5%) | 1,598 (39.5%) |
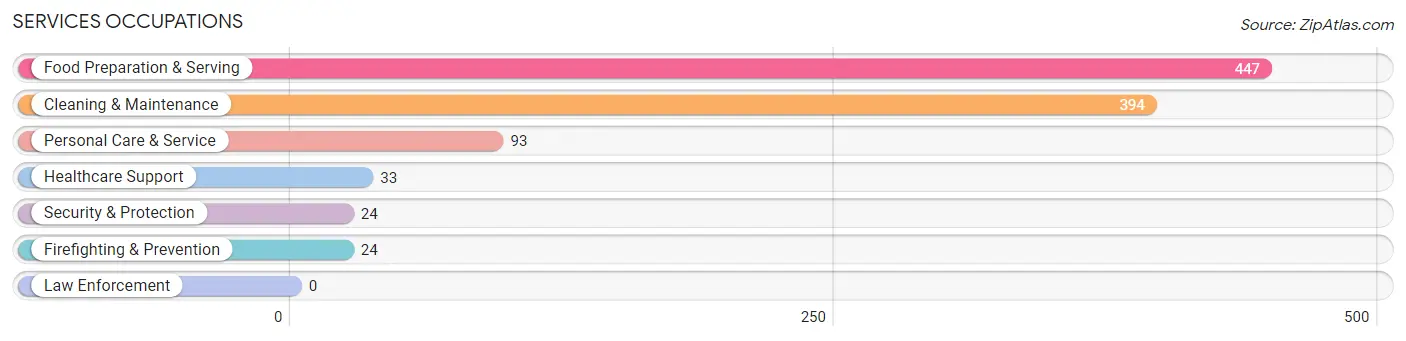
Services Occupations
The most common Services occupations in Broadview Park are Food Preparation & Serving (447 | 11.1%), Cleaning & Maintenance (394 | 9.8%), Personal Care & Service (93 | 2.3%), Healthcare Support (33 | 0.8%), and Security & Protection (24 | 0.6%).
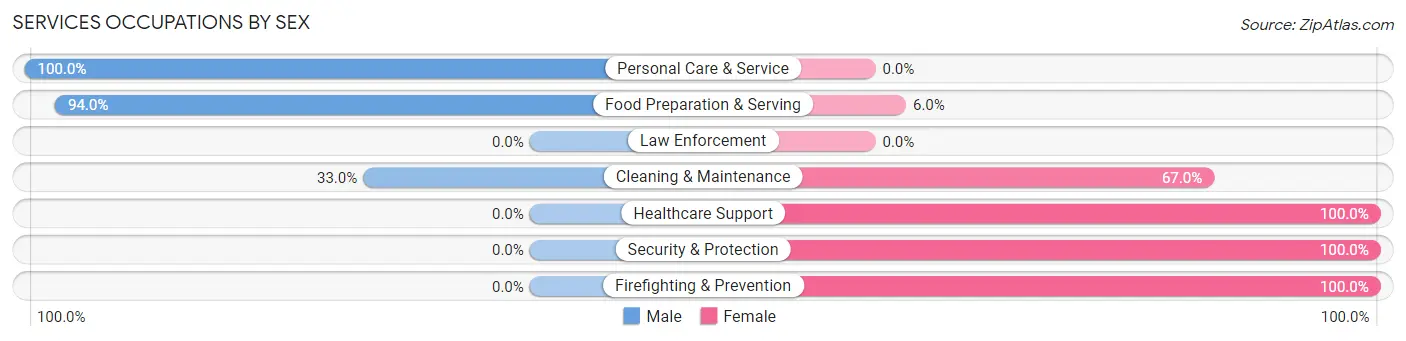
Services Occupations by Sex
Within the Services occupations in Broadview Park, the most male-oriented occupations are Personal Care & Service (100.0%), Food Preparation & Serving (94.0%), and Cleaning & Maintenance (33.0%), while the most female-oriented occupations are Healthcare Support (100.0%), Security & Protection (100.0%), and Firefighting & Prevention (100.0%).
| Occupation | Male | Female |
| Healthcare Support | 0 (0.0%) | 33 (100.0%) |
| Security & Protection | 0 (0.0%) | 24 (100.0%) |
| Firefighting & Prevention | 0 (0.0%) | 24 (100.0%) |
| Law Enforcement | 0 (0.0%) | 0 (0.0%) |
| Food Preparation & Serving | 420 (94.0%) | 27 (6.0%) |
| Cleaning & Maintenance | 130 (33.0%) | 264 (67.0%) |
| Personal Care & Service | 93 (100.0%) | 0 (0.0%) |
| Total (Category) | 643 (64.9%) | 348 (35.1%) |
| Total (Overall) | 2,445 (60.5%) | 1,598 (39.5%) |
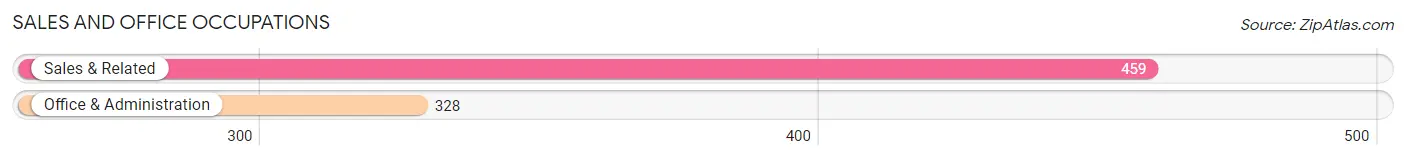
Sales and Office Occupations
The most common Sales and Office occupations in Broadview Park are Sales & Related (459 | 11.4%), and Office & Administration (328 | 8.1%).
Sales and Office Occupations by Sex
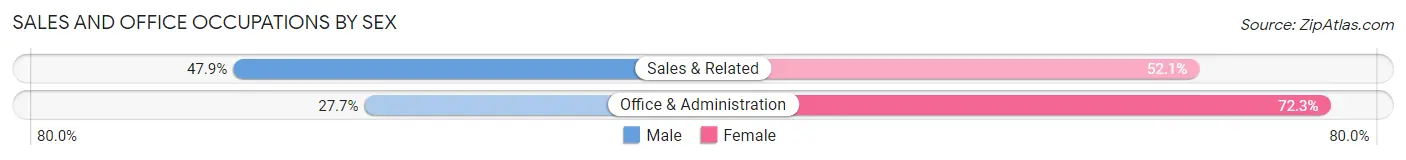
| Occupation | Male | Female |
| Sales & Related | 220 (47.9%) | 239 (52.1%) |
| Office & Administration | 91 (27.7%) | 237 (72.3%) |
| Total (Category) | 311 (39.5%) | 476 (60.5%) |
| Total (Overall) | 2,445 (60.5%) | 1,598 (39.5%) |
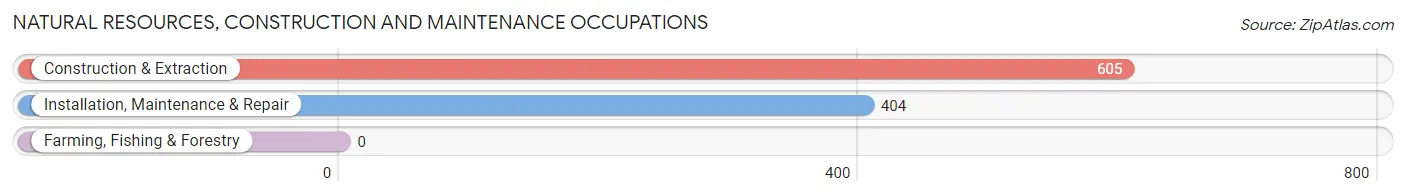
Natural Resources, Construction and Maintenance Occupations
The most common Natural Resources, Construction and Maintenance occupations in Broadview Park are Construction & Extraction (605 | 15.0%), and Installation, Maintenance & Repair (404 | 10.0%).
Natural Resources, Construction and Maintenance Occupations by Sex
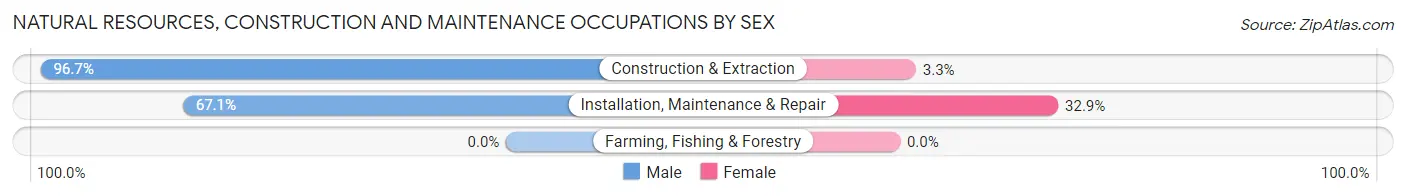
| Occupation | Male | Female |
| Farming, Fishing & Forestry | 0 (0.0%) | 0 (0.0%) |
| Construction & Extraction | 585 (96.7%) | 20 (3.3%) |
| Installation, Maintenance & Repair | 271 (67.1%) | 133 (32.9%) |
| Total (Category) | 856 (84.8%) | 153 (15.2%) |
| Total (Overall) | 2,445 (60.5%) | 1,598 (39.5%) |
Production, Transportation and Moving Occupations
The most common Production, Transportation and Moving occupations in Broadview Park are Transportation (208 | 5.1%), Material Moving (186 | 4.6%), and Production (149 | 3.7%).
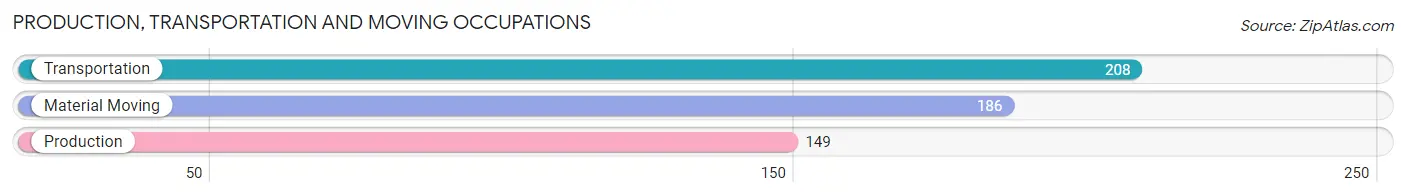
Production, Transportation and Moving Occupations by Sex
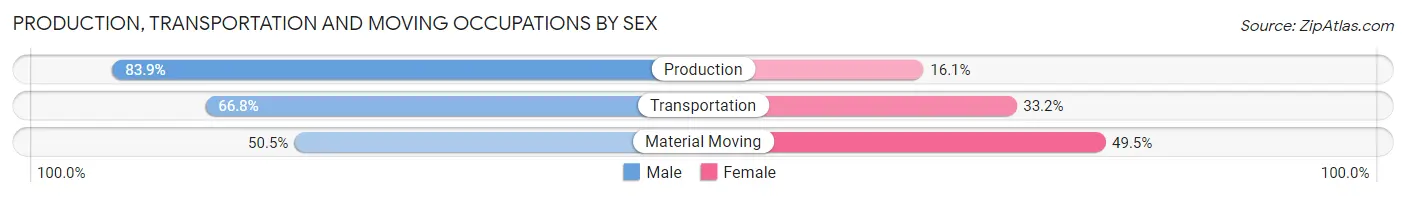
| Occupation | Male | Female |
| Production | 125 (83.9%) | 24 (16.1%) |
| Transportation | 139 (66.8%) | 69 (33.2%) |
| Material Moving | 94 (50.5%) | 92 (49.5%) |
| Total (Category) | 358 (65.9%) | 185 (34.1%) |
| Total (Overall) | 2,445 (60.5%) | 1,598 (39.5%) |
Employment Industries by Sex in Broadview Park
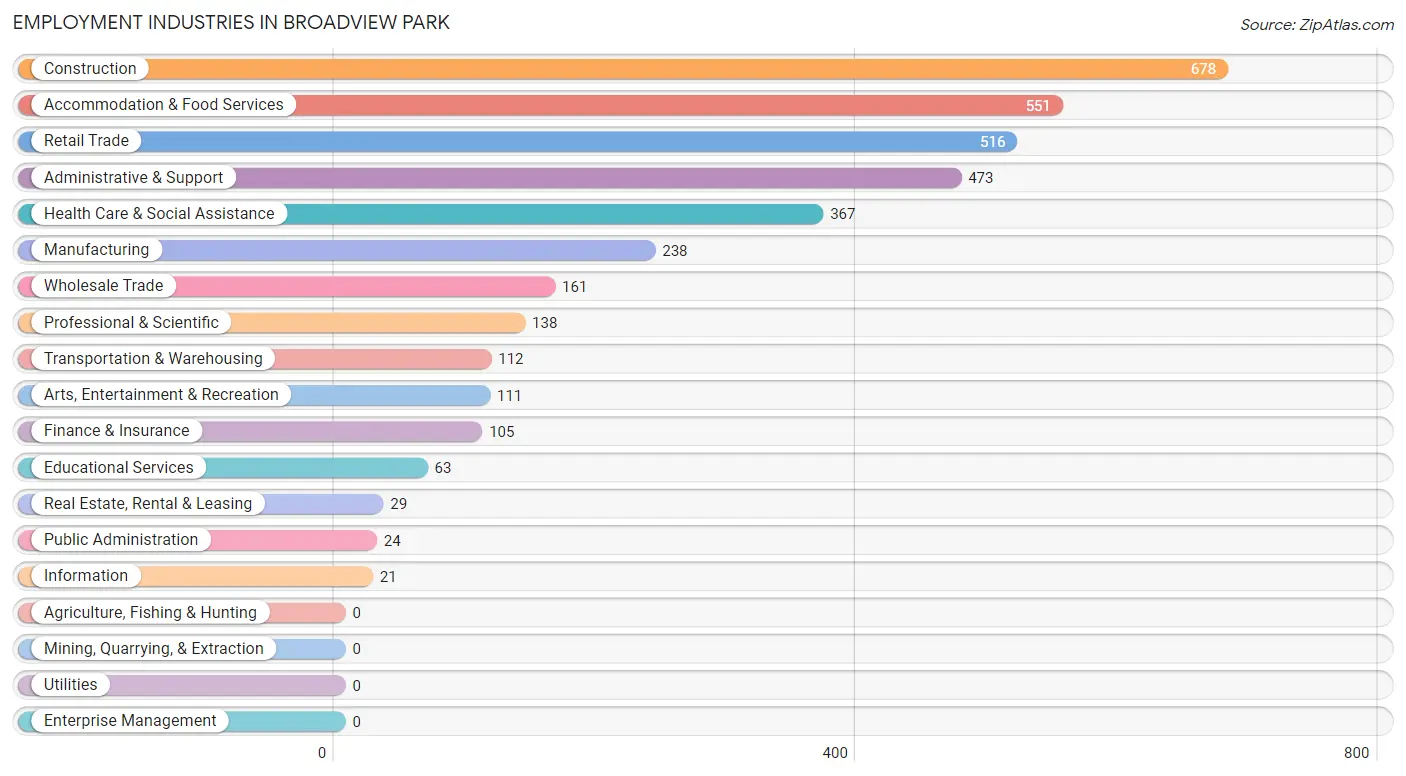
Employment Industries in Broadview Park
The major employment industries in Broadview Park include Construction (678 | 16.8%), Accommodation & Food Services (551 | 13.6%), Retail Trade (516 | 12.8%), Administrative & Support (473 | 11.7%), and Health Care & Social Assistance (367 | 9.1%).
Employment Industries by Sex in Broadview Park
The Broadview Park industries that see more men than women are Accommodation & Food Services (94.6%), Construction (91.0%), and Professional & Scientific (87.0%), whereas the industries that tend to have a higher number of women are Information (100.0%), Real Estate, Rental & Leasing (100.0%), and Arts, Entertainment & Recreation (100.0%).
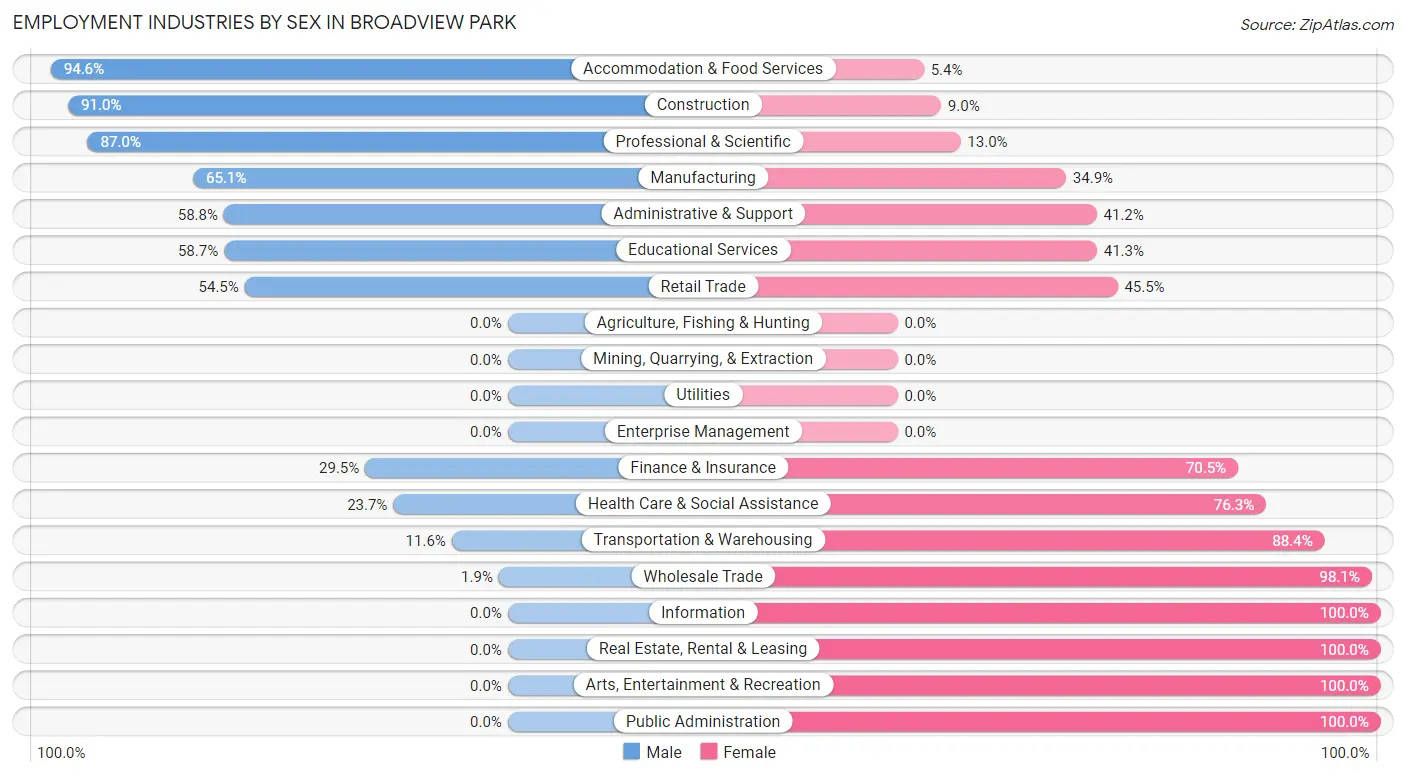
| Industry | Male | Female |
| Agriculture, Fishing & Hunting | 0 (0.0%) | 0 (0.0%) |
| Mining, Quarrying, & Extraction | 0 (0.0%) | 0 (0.0%) |
| Construction | 617 (91.0%) | 61 (9.0%) |
| Manufacturing | 155 (65.1%) | 83 (34.9%) |
| Wholesale Trade | 3 (1.9%) | 158 (98.1%) |
| Retail Trade | 281 (54.5%) | 235 (45.5%) |
| Transportation & Warehousing | 13 (11.6%) | 99 (88.4%) |
| Utilities | 0 (0.0%) | 0 (0.0%) |
| Information | 0 (0.0%) | 21 (100.0%) |
| Finance & Insurance | 31 (29.5%) | 74 (70.5%) |
| Real Estate, Rental & Leasing | 0 (0.0%) | 29 (100.0%) |
| Professional & Scientific | 120 (87.0%) | 18 (13.0%) |
| Enterprise Management | 0 (0.0%) | 0 (0.0%) |
| Administrative & Support | 278 (58.8%) | 195 (41.2%) |
| Educational Services | 37 (58.7%) | 26 (41.3%) |
| Health Care & Social Assistance | 87 (23.7%) | 280 (76.3%) |
| Arts, Entertainment & Recreation | 0 (0.0%) | 111 (100.0%) |
| Accommodation & Food Services | 521 (94.6%) | 30 (5.4%) |
| Public Administration | 0 (0.0%) | 24 (100.0%) |
| Total | 2,445 (60.5%) | 1,598 (39.5%) |
Education in Broadview Park
School Enrollment in Broadview Park
The most common levels of schooling among the 1,265 students in Broadview Park are middle school (433 | 34.2%), high school (222 | 17.5%), and kindergarten (181 | 14.3%).
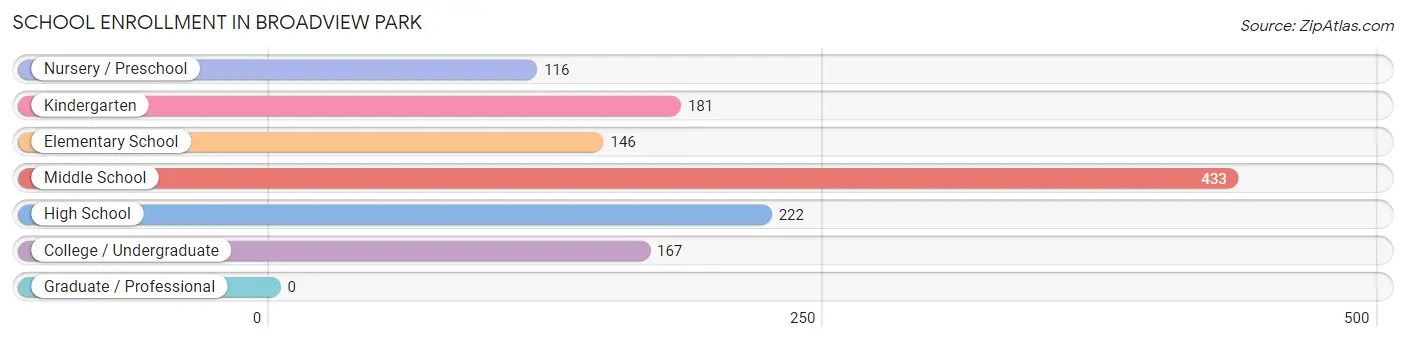
| School Level | # Students | % Students |
| Nursery / Preschool | 116 | 9.2% |
| Kindergarten | 181 | 14.3% |
| Elementary School | 146 | 11.5% |
| Middle School | 433 | 34.2% |
| High School | 222 | 17.5% |
| College / Undergraduate | 167 | 13.2% |
| Graduate / Professional | 0 | 0.0% |
| Total | 1,265 | 100.0% |
School Enrollment by Age by Funding Source in Broadview Park
Out of a total of 1,265 students who are enrolled in schools in Broadview Park, 176 (13.9%) attend a private institution, while the remaining 1,089 (86.1%) are enrolled in public schools. The age group of 5 to 9 year old has the highest likelihood of being enrolled in private schools, with 119 (40.1% in the age bracket) enrolled. Conversely, the age group of 10 to 14 year olds has the lowest likelihood of being enrolled in a private school, with 530 (100.0% in the age bracket) attending a public institution.
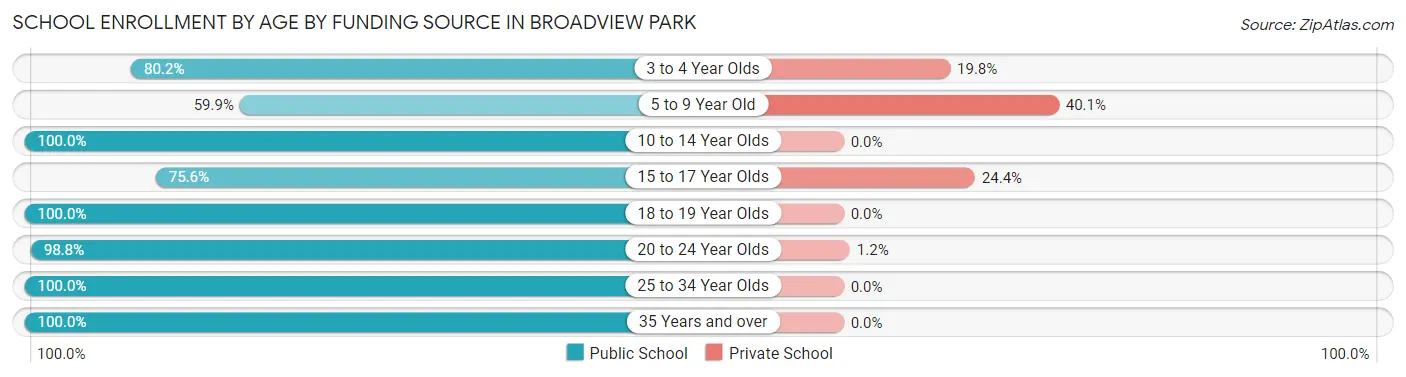
| Age Bracket | Public School | Private School |
| 3 to 4 Year Olds | 93 (80.2%) | 23 (19.8%) |
| 5 to 9 Year Old | 178 (59.9%) | 119 (40.1%) |
| 10 to 14 Year Olds | 530 (100.0%) | 0 (0.0%) |
| 15 to 17 Year Olds | 102 (75.6%) | 33 (24.4%) |
| 18 to 19 Year Olds | 41 (100.0%) | 0 (0.0%) |
| 20 to 24 Year Olds | 85 (98.8%) | 1 (1.2%) |
| 25 to 34 Year Olds | 1 (100.0%) | 0 (0.0%) |
| 35 Years and over | 59 (100.0%) | 0 (0.0%) |
| Total | 1,089 (86.1%) | 176 (13.9%) |
Educational Attainment by Field of Study in Broadview Park
Arts & humanities (213 | 22.3%), engineering (205 | 21.4%), visual & performing arts (150 | 15.7%), science & technology (110 | 11.5%), and business (87 | 9.1%) are the most common fields of study among 957 individuals in Broadview Park who have obtained a bachelor's degree or higher.
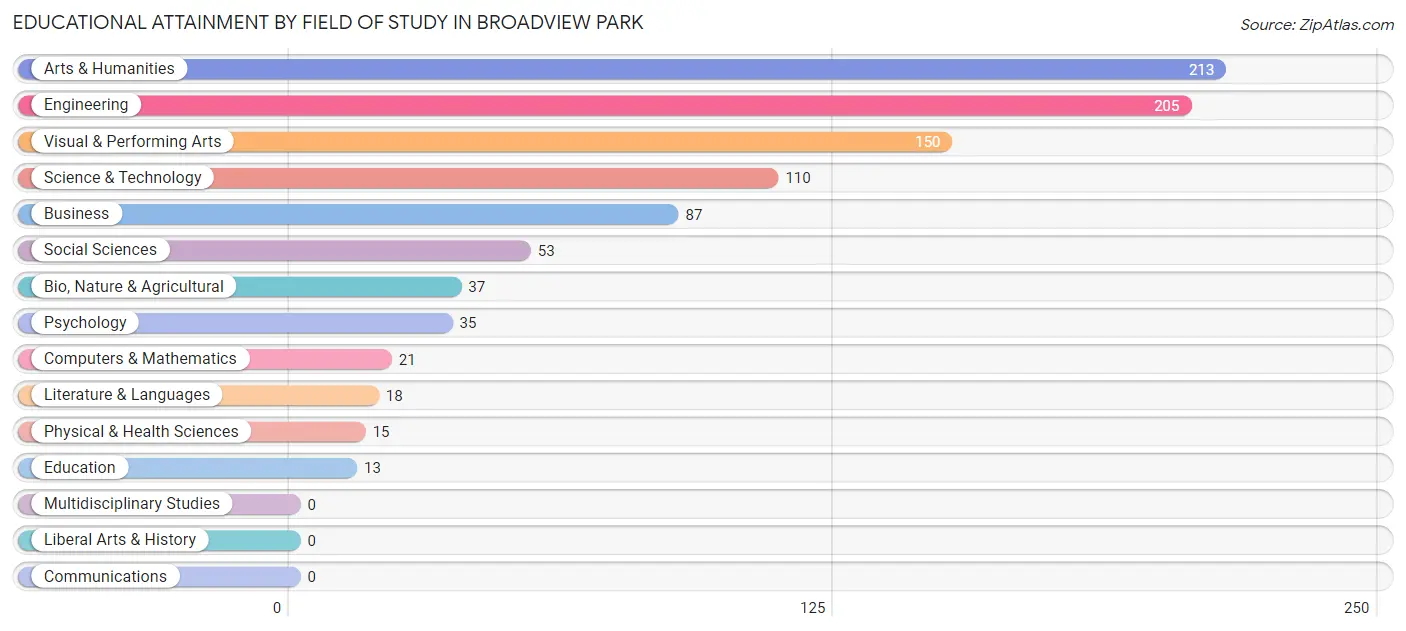
| Field of Study | # Graduates | % Graduates |
| Computers & Mathematics | 21 | 2.2% |
| Bio, Nature & Agricultural | 37 | 3.9% |
| Physical & Health Sciences | 15 | 1.6% |
| Psychology | 35 | 3.7% |
| Social Sciences | 53 | 5.5% |
| Engineering | 205 | 21.4% |
| Multidisciplinary Studies | 0 | 0.0% |
| Science & Technology | 110 | 11.5% |
| Business | 87 | 9.1% |
| Education | 13 | 1.4% |
| Literature & Languages | 18 | 1.9% |
| Liberal Arts & History | 0 | 0.0% |
| Visual & Performing Arts | 150 | 15.7% |
| Communications | 0 | 0.0% |
| Arts & Humanities | 213 | 22.3% |
| Total | 957 | 100.0% |
Transportation & Commute in Broadview Park
Vehicle Availability by Sex in Broadview Park
The most prevalent vehicle ownership categories in Broadview Park are males with 2 vehicles (1,107, accounting for 45.3%) and females with 2 vehicles (646, making up 69.9%).
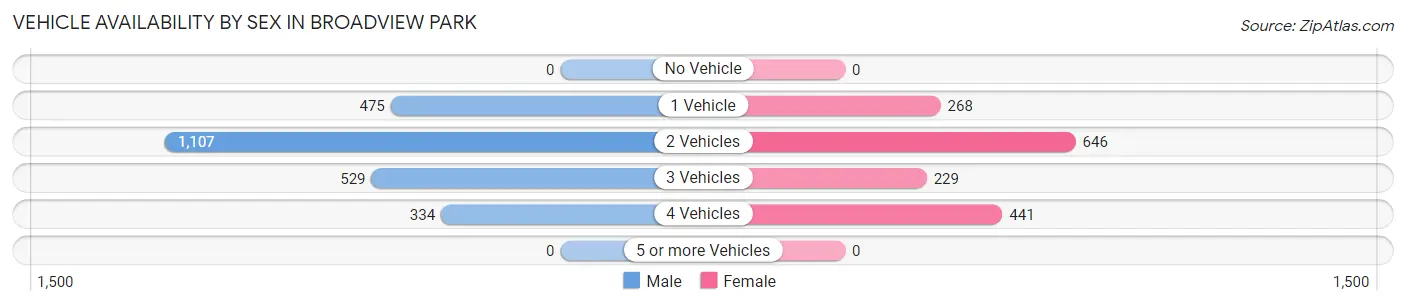
| Vehicles Available | Male | Female |
| No Vehicle | 0 (0.0%) | 0 (0.0%) |
| 1 Vehicle | 475 (19.4%) | 268 (16.9%) |
| 2 Vehicles | 1,107 (45.3%) | 646 (40.8%) |
| 3 Vehicles | 529 (21.6%) | 229 (14.5%) |
| 4 Vehicles | 334 (13.7%) | 441 (27.8%) |
| 5 or more Vehicles | 0 (0.0%) | 0 (0.0%) |
| Total | 2,445 (100.0%) | 1,584 (100.0%) |
Commute Time in Broadview Park
The most frequently occuring commute durations in Broadview Park are 30 to 34 minutes (1,036 commuters, 28.0%), 20 to 24 minutes (596 commuters, 16.1%), and 60 to 89 minutes (450 commuters, 12.1%).
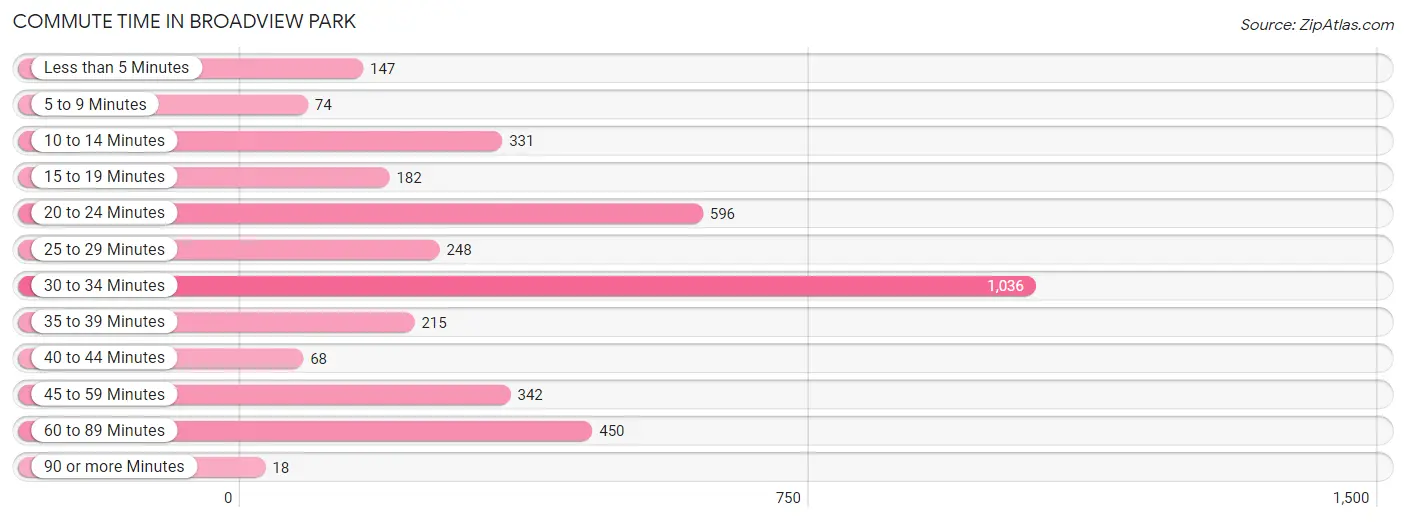
| Commute Time | # Commuters | % Commuters |
| Less than 5 Minutes | 147 | 4.0% |
| 5 to 9 Minutes | 74 | 2.0% |
| 10 to 14 Minutes | 331 | 8.9% |
| 15 to 19 Minutes | 182 | 4.9% |
| 20 to 24 Minutes | 596 | 16.1% |
| 25 to 29 Minutes | 248 | 6.7% |
| 30 to 34 Minutes | 1,036 | 28.0% |
| 35 to 39 Minutes | 215 | 5.8% |
| 40 to 44 Minutes | 68 | 1.8% |
| 45 to 59 Minutes | 342 | 9.2% |
| 60 to 89 Minutes | 450 | 12.1% |
| 90 or more Minutes | 18 | 0.5% |
Commute Time by Sex in Broadview Park
The most common commute times in Broadview Park are 30 to 34 minutes (516 commuters, 24.1%) for males and 30 to 34 minutes (520 commuters, 33.2%) for females.
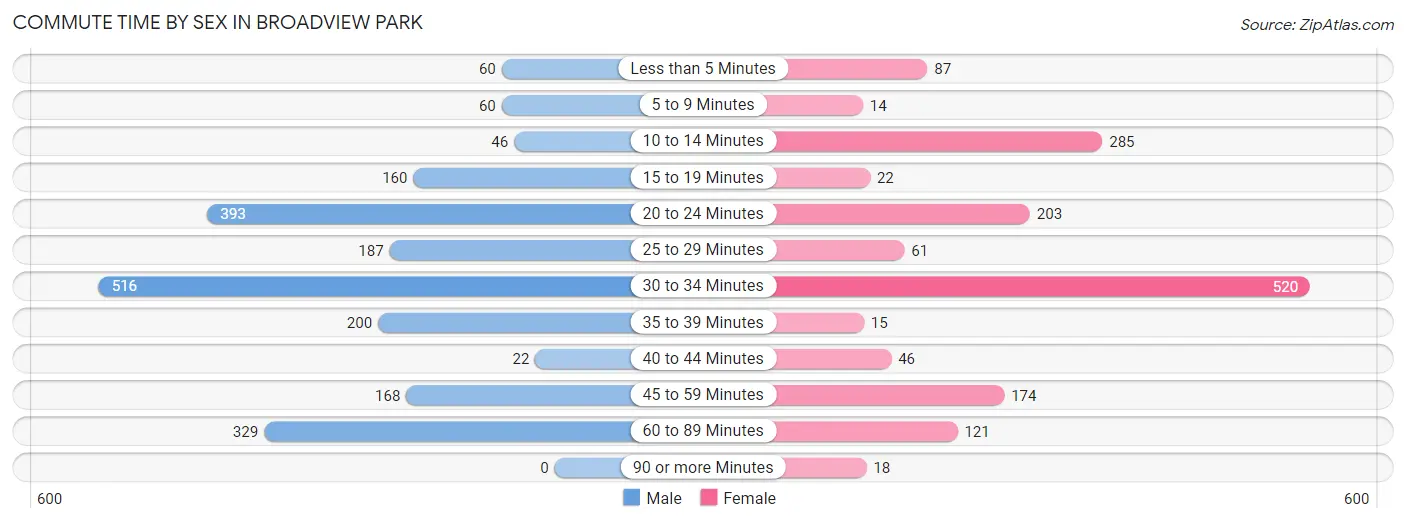
| Commute Time | Male | Female |
| Less than 5 Minutes | 60 (2.8%) | 87 (5.6%) |
| 5 to 9 Minutes | 60 (2.8%) | 14 (0.9%) |
| 10 to 14 Minutes | 46 (2.1%) | 285 (18.2%) |
| 15 to 19 Minutes | 160 (7.5%) | 22 (1.4%) |
| 20 to 24 Minutes | 393 (18.4%) | 203 (13.0%) |
| 25 to 29 Minutes | 187 (8.7%) | 61 (3.9%) |
| 30 to 34 Minutes | 516 (24.1%) | 520 (33.2%) |
| 35 to 39 Minutes | 200 (9.3%) | 15 (1.0%) |
| 40 to 44 Minutes | 22 (1.0%) | 46 (2.9%) |
| 45 to 59 Minutes | 168 (7.9%) | 174 (11.1%) |
| 60 to 89 Minutes | 329 (15.4%) | 121 (7.7%) |
| 90 or more Minutes | 0 (0.0%) | 18 (1.1%) |
Time of Departure to Work by Sex in Broadview Park
The most frequent times of departure to work in Broadview Park are 7:30 AM to 7:59 AM (567, 26.5%) for males and 6:00 AM to 6:29 AM (352, 22.5%) for females.
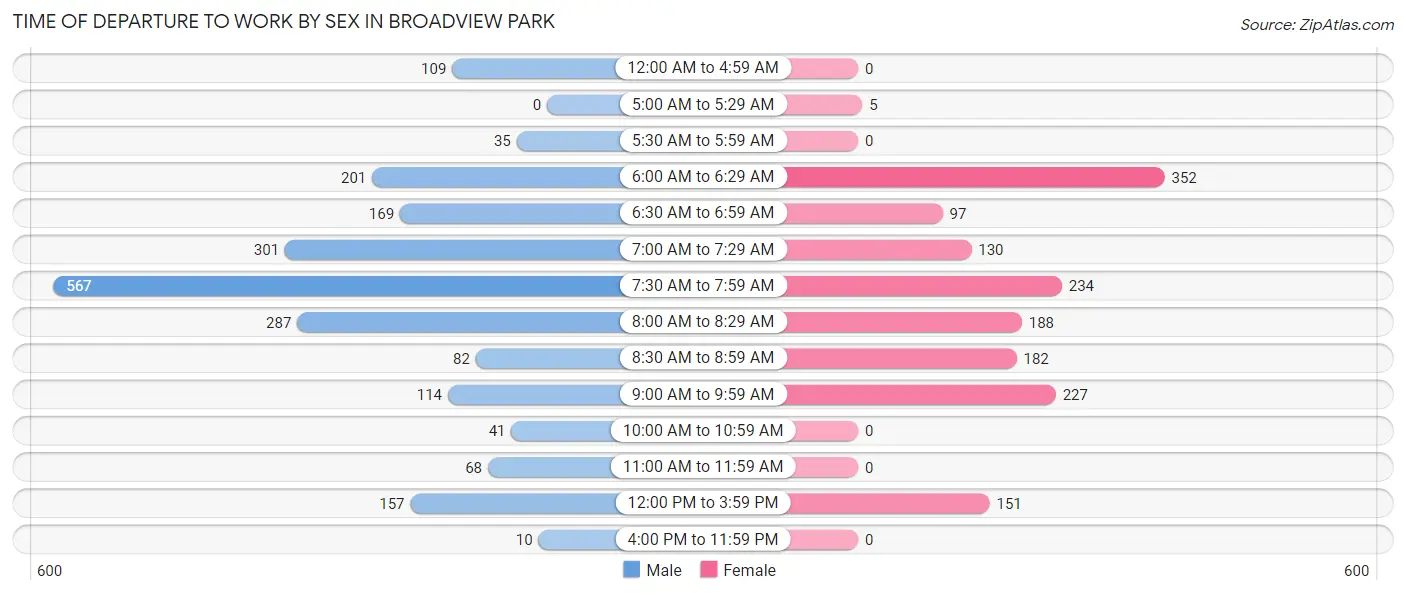
| Time of Departure | Male | Female |
| 12:00 AM to 4:59 AM | 109 (5.1%) | 0 (0.0%) |
| 5:00 AM to 5:29 AM | 0 (0.0%) | 5 (0.3%) |
| 5:30 AM to 5:59 AM | 35 (1.6%) | 0 (0.0%) |
| 6:00 AM to 6:29 AM | 201 (9.4%) | 352 (22.5%) |
| 6:30 AM to 6:59 AM | 169 (7.9%) | 97 (6.2%) |
| 7:00 AM to 7:29 AM | 301 (14.1%) | 130 (8.3%) |
| 7:30 AM to 7:59 AM | 567 (26.5%) | 234 (14.9%) |
| 8:00 AM to 8:29 AM | 287 (13.4%) | 188 (12.0%) |
| 8:30 AM to 8:59 AM | 82 (3.8%) | 182 (11.6%) |
| 9:00 AM to 9:59 AM | 114 (5.3%) | 227 (14.5%) |
| 10:00 AM to 10:59 AM | 41 (1.9%) | 0 (0.0%) |
| 11:00 AM to 11:59 AM | 68 (3.2%) | 0 (0.0%) |
| 12:00 PM to 3:59 PM | 157 (7.3%) | 151 (9.6%) |
| 4:00 PM to 11:59 PM | 10 (0.5%) | 0 (0.0%) |
| Total | 2,141 (100.0%) | 1,566 (100.0%) |
Housing Occupancy in Broadview Park
Occupancy by Ownership in Broadview Park
Of the total 2,423 dwellings in Broadview Park, owner-occupied units account for 1,336 (55.1%), while renter-occupied units make up 1,087 (44.9%).
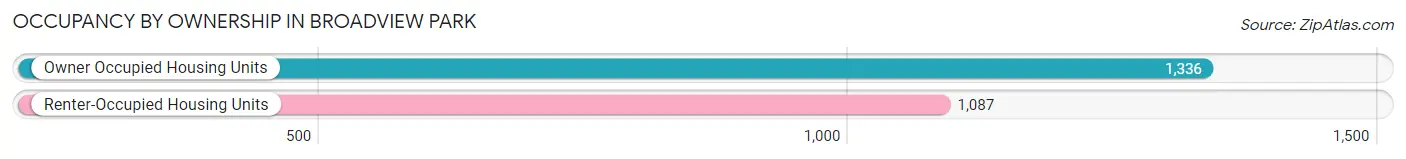
| Occupancy | # Housing Units | % Housing Units |
| Owner Occupied Housing Units | 1,336 | 55.1% |
| Renter-Occupied Housing Units | 1,087 | 44.9% |
| Total Occupied Housing Units | 2,423 | 100.0% |
Occupancy by Household Size in Broadview Park
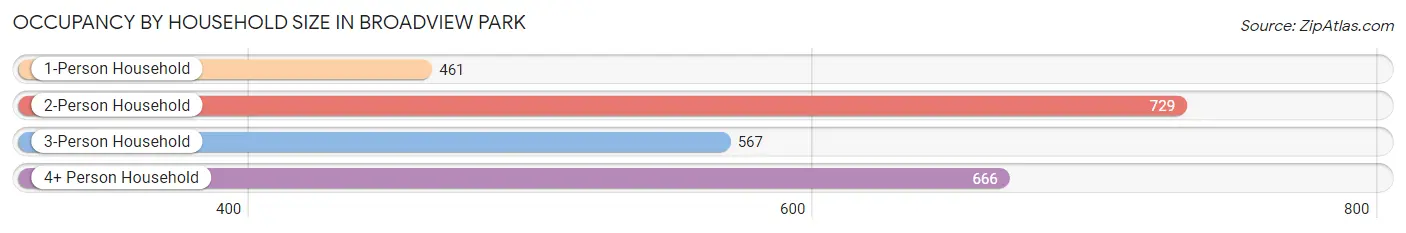
| Household Size | # Housing Units | % Housing Units |
| 1-Person Household | 461 | 19.0% |
| 2-Person Household | 729 | 30.1% |
| 3-Person Household | 567 | 23.4% |
| 4+ Person Household | 666 | 27.5% |
| Total Housing Units | 2,423 | 100.0% |
Occupancy by Ownership by Household Size in Broadview Park
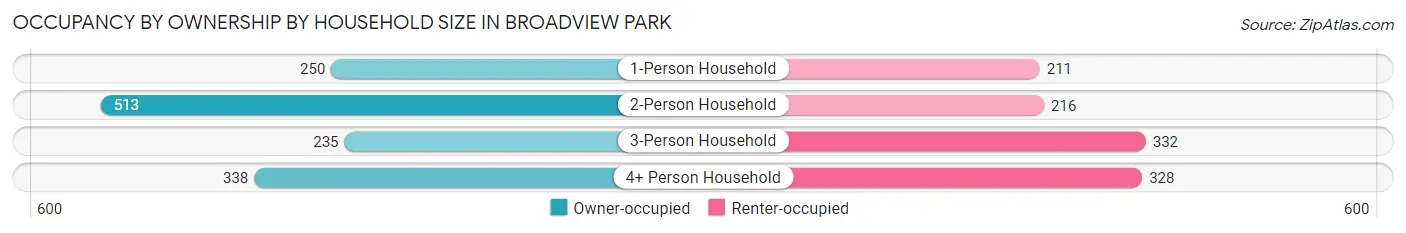
| Household Size | Owner-occupied | Renter-occupied |
| 1-Person Household | 250 (54.2%) | 211 (45.8%) |
| 2-Person Household | 513 (70.4%) | 216 (29.6%) |
| 3-Person Household | 235 (41.4%) | 332 (58.6%) |
| 4+ Person Household | 338 (50.7%) | 328 (49.2%) |
| Total Housing Units | 1,336 (55.1%) | 1,087 (44.9%) |
Occupancy by Educational Attainment in Broadview Park
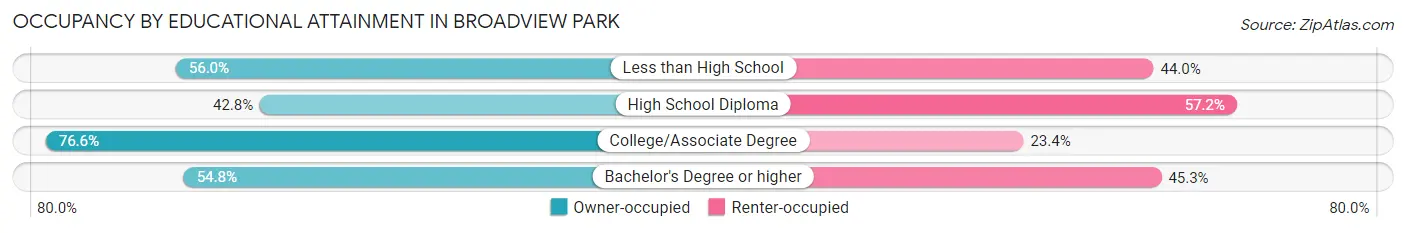
| Household Size | Owner-occupied | Renter-occupied |
| Less than High School | 294 (56.0%) | 231 (44.0%) |
| High School Diploma | 423 (42.8%) | 565 (57.2%) |
| College/Associate Degree | 423 (76.6%) | 129 (23.4%) |
| Bachelor's Degree or higher | 196 (54.7%) | 162 (45.3%) |
Occupancy by Age of Householder in Broadview Park
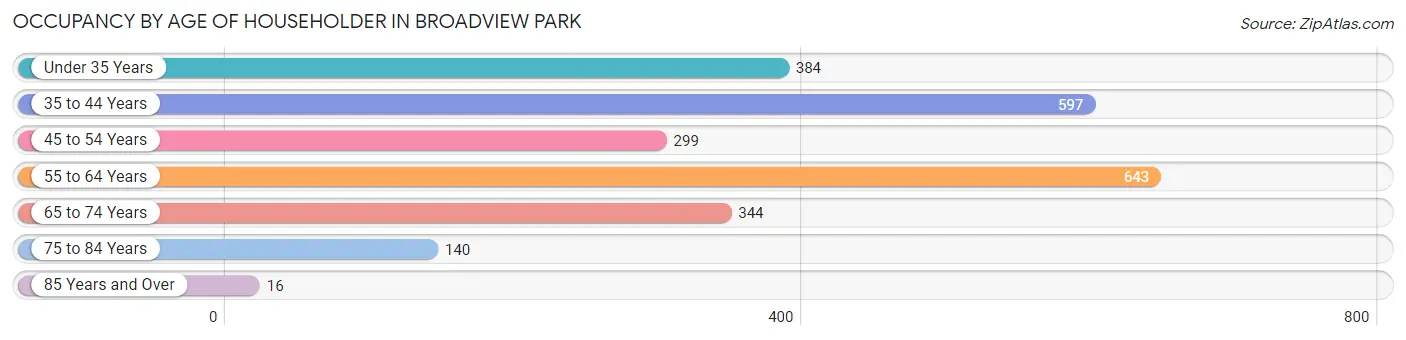
| Age Bracket | # Households | % Households |
| Under 35 Years | 384 | 15.9% |
| 35 to 44 Years | 597 | 24.6% |
| 45 to 54 Years | 299 | 12.3% |
| 55 to 64 Years | 643 | 26.5% |
| 65 to 74 Years | 344 | 14.2% |
| 75 to 84 Years | 140 | 5.8% |
| 85 Years and Over | 16 | 0.7% |
| Total | 2,423 | 100.0% |
Housing Finances in Broadview Park
Median Income by Occupancy in Broadview Park
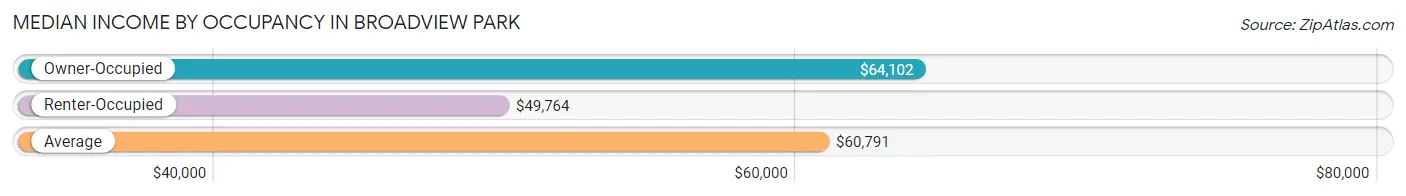
| Occupancy Type | # Households | Median Income |
| Owner-Occupied | 1,336 (55.1%) | $64,102 |
| Renter-Occupied | 1,087 (44.9%) | $49,764 |
| Average | 2,423 (100.0%) | $60,791 |
Occupancy by Householder Income Bracket in Broadview Park
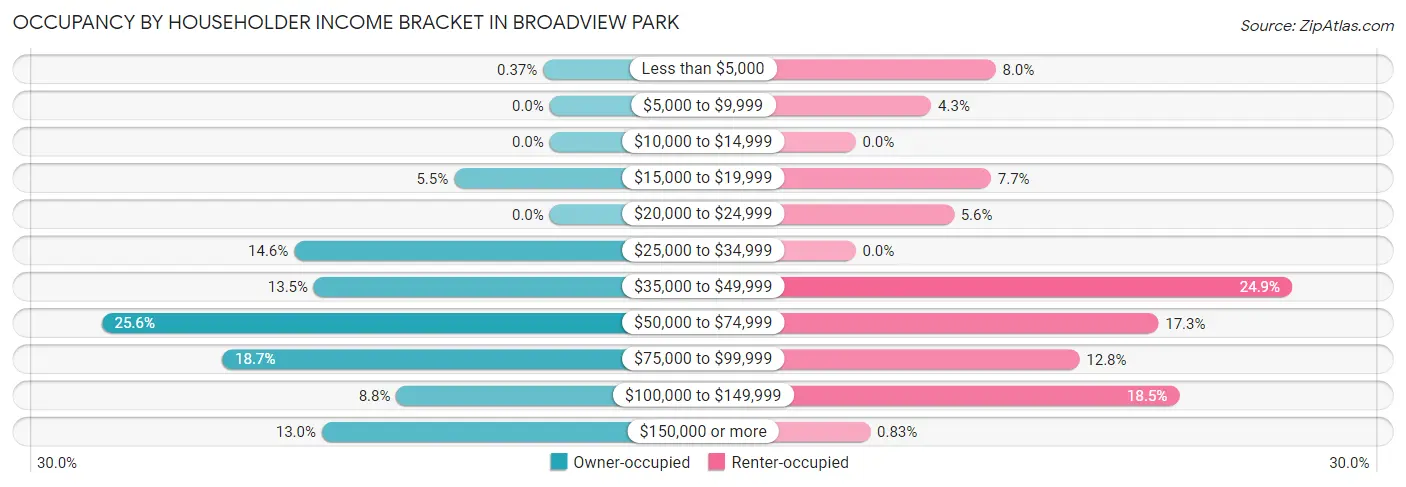
| Income Bracket | Owner-occupied | Renter-occupied |
| Less than $5,000 | 5 (0.4%) | 87 (8.0%) |
| $5,000 to $9,999 | 0 (0.0%) | 47 (4.3%) |
| $10,000 to $14,999 | 0 (0.0%) | 0 (0.0%) |
| $15,000 to $19,999 | 73 (5.5%) | 84 (7.7%) |
| $20,000 to $24,999 | 0 (0.0%) | 61 (5.6%) |
| $25,000 to $34,999 | 195 (14.6%) | 0 (0.0%) |
| $35,000 to $49,999 | 180 (13.5%) | 271 (24.9%) |
| $50,000 to $74,999 | 342 (25.6%) | 188 (17.3%) |
| $75,000 to $99,999 | 250 (18.7%) | 139 (12.8%) |
| $100,000 to $149,999 | 117 (8.8%) | 201 (18.5%) |
| $150,000 or more | 174 (13.0%) | 9 (0.8%) |
| Total | 1,336 (100.0%) | 1,087 (100.0%) |
Monthly Housing Cost Tiers in Broadview Park
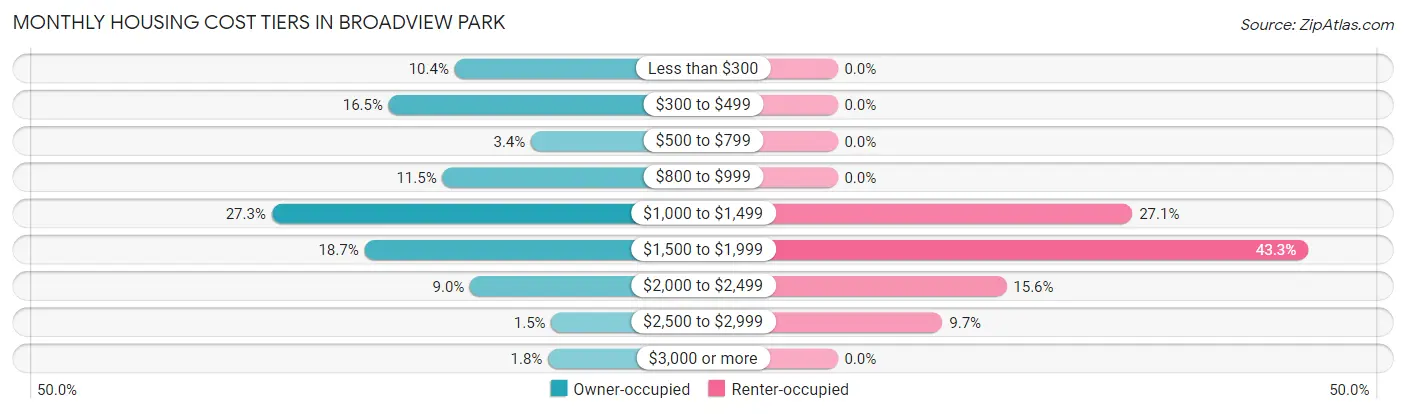
| Monthly Cost | Owner-occupied | Renter-occupied |
| Less than $300 | 139 (10.4%) | 0 (0.0%) |
| $300 to $499 | 220 (16.5%) | 0 (0.0%) |
| $500 to $799 | 45 (3.4%) | 0 (0.0%) |
| $800 to $999 | 154 (11.5%) | 0 (0.0%) |
| $1,000 to $1,499 | 364 (27.3%) | 295 (27.1%) |
| $1,500 to $1,999 | 250 (18.7%) | 471 (43.3%) |
| $2,000 to $2,499 | 120 (9.0%) | 169 (15.5%) |
| $2,500 to $2,999 | 20 (1.5%) | 105 (9.7%) |
| $3,000 or more | 24 (1.8%) | 0 (0.0%) |
| Total | 1,336 (100.0%) | 1,087 (100.0%) |
Physical Housing Characteristics in Broadview Park
Housing Structures in Broadview Park
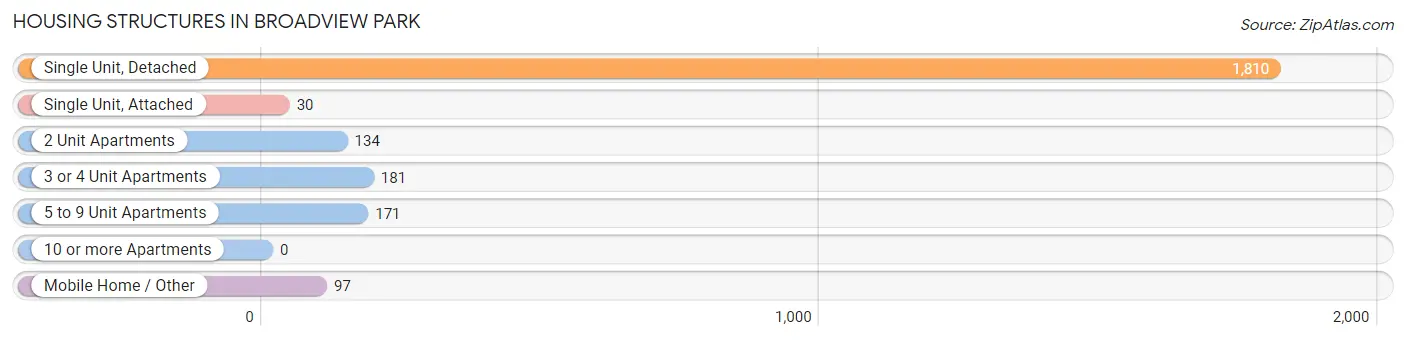
| Structure Type | # Housing Units | % Housing Units |
| Single Unit, Detached | 1,810 | 74.7% |
| Single Unit, Attached | 30 | 1.2% |
| 2 Unit Apartments | 134 | 5.5% |
| 3 or 4 Unit Apartments | 181 | 7.5% |
| 5 to 9 Unit Apartments | 171 | 7.1% |
| 10 or more Apartments | 0 | 0.0% |
| Mobile Home / Other | 97 | 4.0% |
| Total | 2,423 | 100.0% |
Housing Structures by Occupancy in Broadview Park
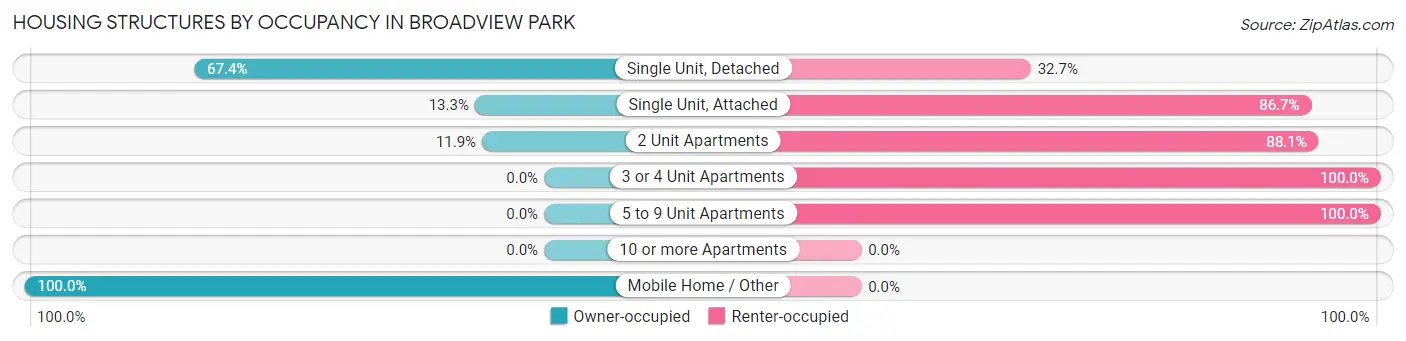
| Structure Type | Owner-occupied | Renter-occupied |
| Single Unit, Detached | 1,219 (67.3%) | 591 (32.7%) |
| Single Unit, Attached | 4 (13.3%) | 26 (86.7%) |
| 2 Unit Apartments | 16 (11.9%) | 118 (88.1%) |
| 3 or 4 Unit Apartments | 0 (0.0%) | 181 (100.0%) |
| 5 to 9 Unit Apartments | 0 (0.0%) | 171 (100.0%) |
| 10 or more Apartments | 0 (0.0%) | 0 (0.0%) |
| Mobile Home / Other | 97 (100.0%) | 0 (0.0%) |
| Total | 1,336 (55.1%) | 1,087 (44.9%) |
Housing Structures by Number of Rooms in Broadview Park
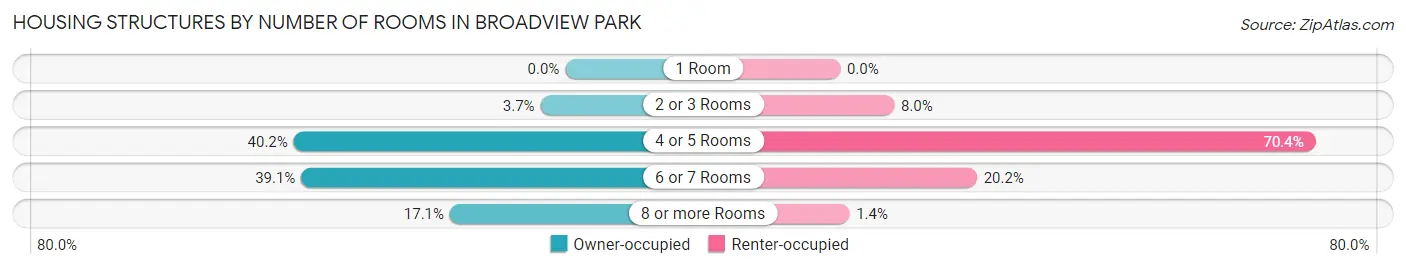
| Number of Rooms | Owner-occupied | Renter-occupied |
| 1 Room | 0 (0.0%) | 0 (0.0%) |
| 2 or 3 Rooms | 49 (3.7%) | 87 (8.0%) |
| 4 or 5 Rooms | 537 (40.2%) | 765 (70.4%) |
| 6 or 7 Rooms | 522 (39.1%) | 220 (20.2%) |
| 8 or more Rooms | 228 (17.1%) | 15 (1.4%) |
| Total | 1,336 (100.0%) | 1,087 (100.0%) |
Housing Structure by Heating Type in Broadview Park
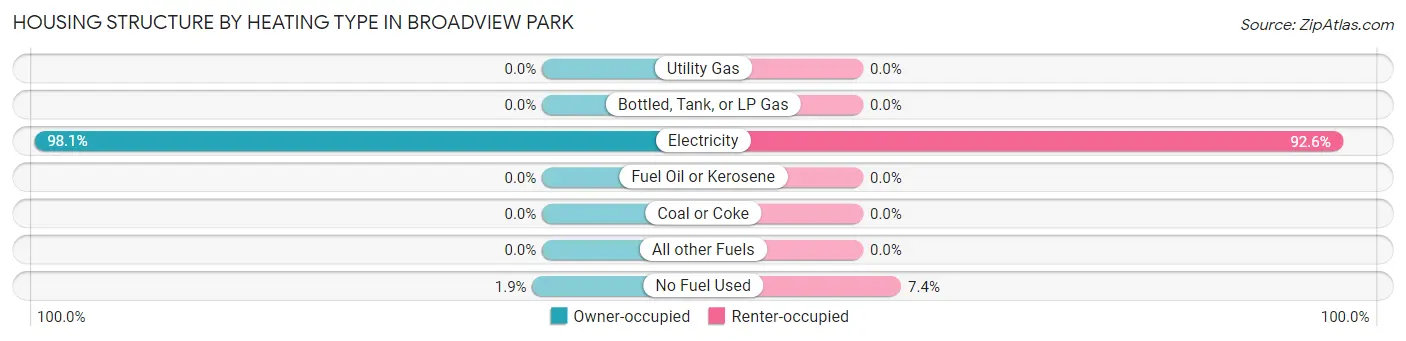
| Heating Type | Owner-occupied | Renter-occupied |
| Utility Gas | 0 (0.0%) | 0 (0.0%) |
| Bottled, Tank, or LP Gas | 0 (0.0%) | 0 (0.0%) |
| Electricity | 1,311 (98.1%) | 1,007 (92.6%) |
| Fuel Oil or Kerosene | 0 (0.0%) | 0 (0.0%) |
| Coal or Coke | 0 (0.0%) | 0 (0.0%) |
| All other Fuels | 0 (0.0%) | 0 (0.0%) |
| No Fuel Used | 25 (1.9%) | 80 (7.4%) |
| Total | 1,336 (100.0%) | 1,087 (100.0%) |
Household Vehicle Usage in Broadview Park
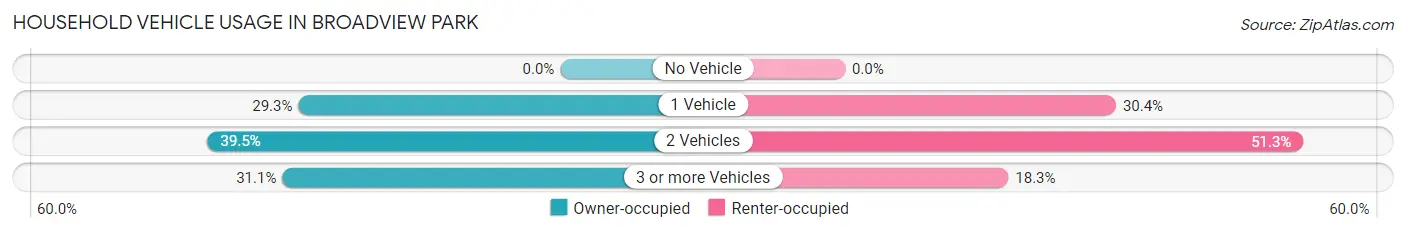
| Vehicles per Household | Owner-occupied | Renter-occupied |
| No Vehicle | 0 (0.0%) | 0 (0.0%) |
| 1 Vehicle | 392 (29.3%) | 330 (30.4%) |
| 2 Vehicles | 528 (39.5%) | 558 (51.3%) |
| 3 or more Vehicles | 416 (31.1%) | 199 (18.3%) |
| Total | 1,336 (100.0%) | 1,087 (100.0%) |
Real Estate & Mortgages in Broadview Park
Real Estate and Mortgage Overview in Broadview Park
| Characteristic | Without Mortgage | With Mortgage |
| Housing Units | 546 | 790 |
| Median Property Value | $295,000 | $289,500 |
| Median Household Income | $62,784 | $79 |
| Monthly Housing Costs | $416 | $24 |
| Real Estate Taxes | $1,418 | $191 |
Property Value by Mortgage Status in Broadview Park
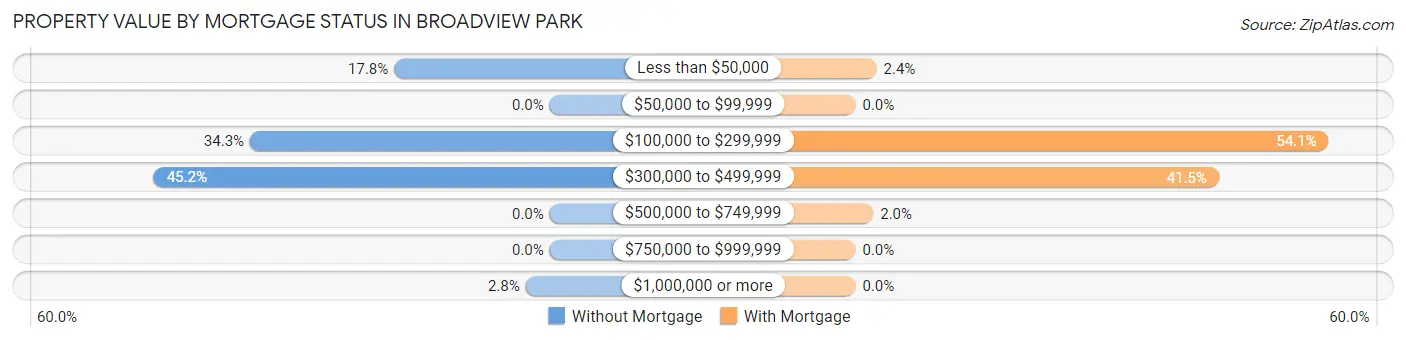
| Property Value | Without Mortgage | With Mortgage |
| Less than $50,000 | 97 (17.8%) | 19 (2.4%) |
| $50,000 to $99,999 | 0 (0.0%) | 0 (0.0%) |
| $100,000 to $299,999 | 187 (34.3%) | 427 (54.0%) |
| $300,000 to $499,999 | 247 (45.2%) | 328 (41.5%) |
| $500,000 to $749,999 | 0 (0.0%) | 16 (2.0%) |
| $750,000 to $999,999 | 0 (0.0%) | 0 (0.0%) |
| $1,000,000 or more | 15 (2.8%) | 0 (0.0%) |
| Total | 546 (100.0%) | 790 (100.0%) |
Household Income by Mortgage Status in Broadview Park
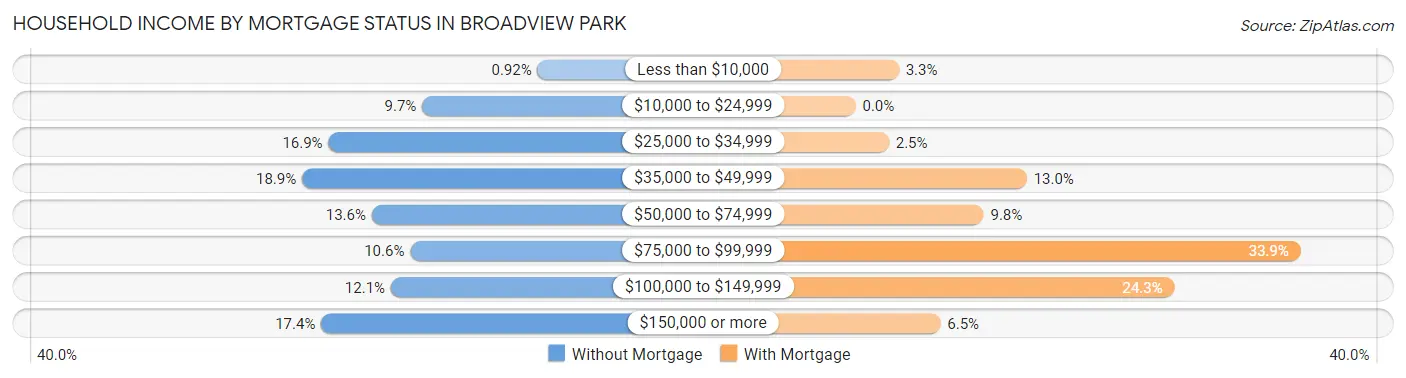
| Household Income | Without Mortgage | With Mortgage |
| Less than $10,000 | 5 (0.9%) | 26 (3.3%) |
| $10,000 to $24,999 | 53 (9.7%) | 0 (0.0%) |
| $25,000 to $34,999 | 92 (16.9%) | 20 (2.5%) |
| $35,000 to $49,999 | 103 (18.9%) | 103 (13.0%) |
| $50,000 to $74,999 | 74 (13.6%) | 77 (9.8%) |
| $75,000 to $99,999 | 58 (10.6%) | 268 (33.9%) |
| $100,000 to $149,999 | 66 (12.1%) | 192 (24.3%) |
| $150,000 or more | 95 (17.4%) | 51 (6.5%) |
| Total | 546 (100.0%) | 790 (100.0%) |
Property Value to Household Income Ratio in Broadview Park
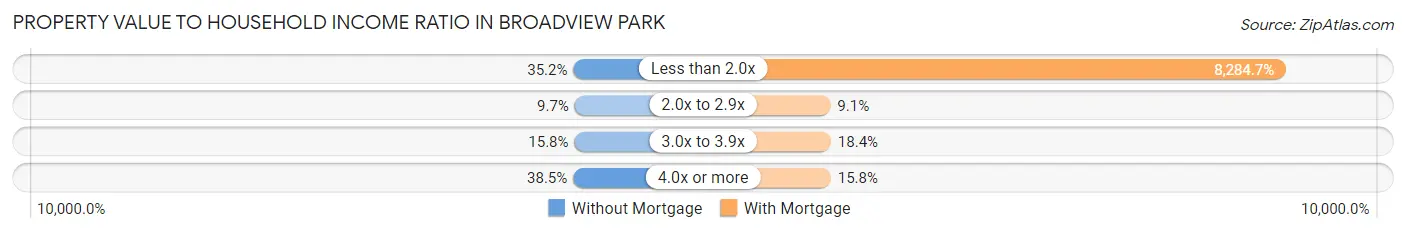
| Value-to-Income Ratio | Without Mortgage | With Mortgage |
| Less than 2.0x | 192 (35.2%) | 65,449 (8,284.7%) |
| 2.0x to 2.9x | 53 (9.7%) | 72 (9.1%) |
| 3.0x to 3.9x | 86 (15.8%) | 145 (18.3%) |
| 4.0x or more | 210 (38.5%) | 125 (15.8%) |
| Total | 546 (100.0%) | 790 (100.0%) |
Real Estate Taxes by Mortgage Status in Broadview Park
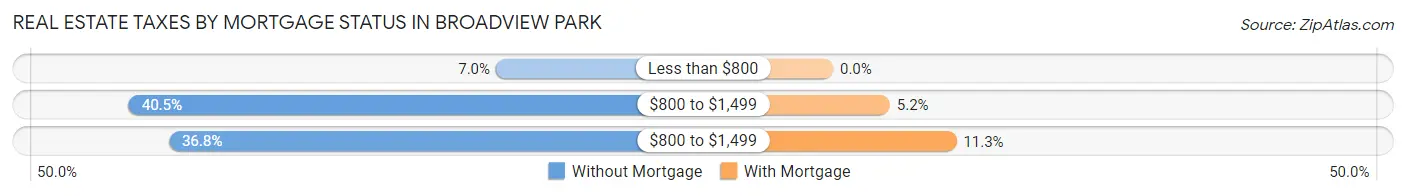
| Property Taxes | Without Mortgage | With Mortgage |
| Less than $800 | 38 (7.0%) | 0 (0.0%) |
| $800 to $1,499 | 221 (40.5%) | 41 (5.2%) |
| $800 to $1,499 | 201 (36.8%) | 89 (11.3%) |
| Total | 546 (100.0%) | 790 (100.0%) |
Health & Disability in Broadview Park
Health Insurance Coverage by Age in Broadview Park
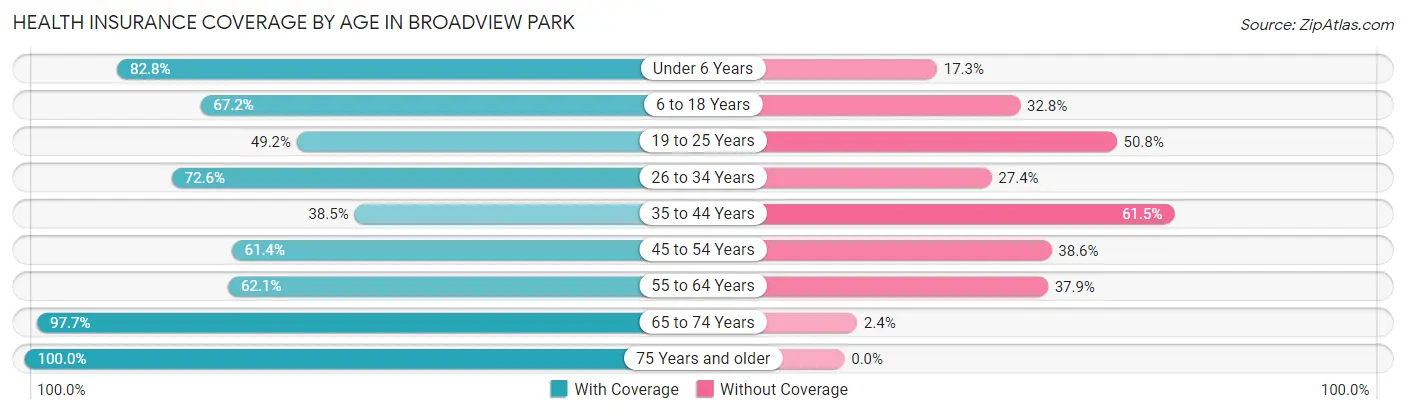
| Age Bracket | With Coverage | Without Coverage |
| Under 6 Years | 427 (82.8%) | 89 (17.2%) |
| 6 to 18 Years | 578 (67.2%) | 282 (32.8%) |
| 19 to 25 Years | 288 (49.2%) | 297 (50.8%) |
| 26 to 34 Years | 688 (72.6%) | 260 (27.4%) |
| 35 to 44 Years | 558 (38.5%) | 892 (61.5%) |
| 45 to 54 Years | 547 (61.4%) | 344 (38.6%) |
| 55 to 64 Years | 733 (62.1%) | 448 (37.9%) |
| 65 to 74 Years | 622 (97.7%) | 15 (2.4%) |
| 75 Years and older | 302 (100.0%) | 0 (0.0%) |
| Total | 4,743 (64.4%) | 2,627 (35.6%) |
Health Insurance Coverage by Citizenship Status in Broadview Park
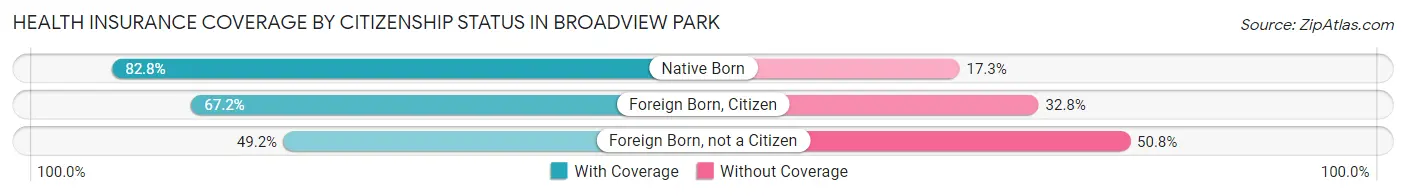
| Citizenship Status | With Coverage | Without Coverage |
| Native Born | 427 (82.8%) | 89 (17.2%) |
| Foreign Born, Citizen | 578 (67.2%) | 282 (32.8%) |
| Foreign Born, not a Citizen | 288 (49.2%) | 297 (50.8%) |
Health Insurance Coverage by Household Income in Broadview Park
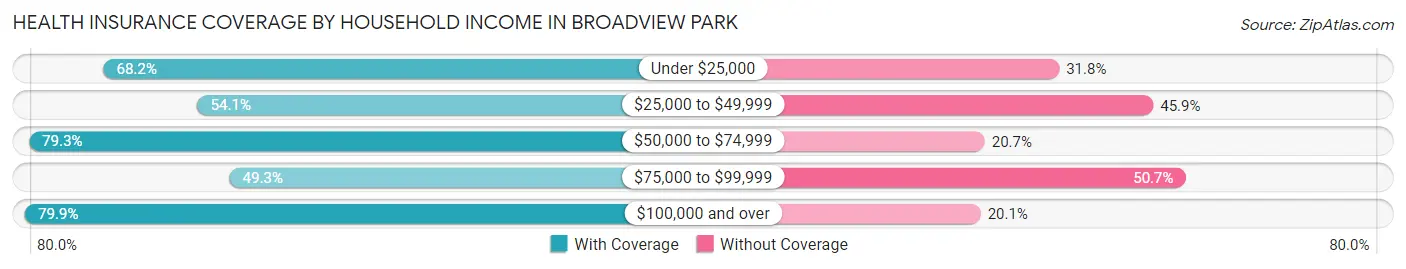
| Household Income | With Coverage | Without Coverage |
| Under $25,000 | 610 (68.2%) | 285 (31.8%) |
| $25,000 to $49,999 | 971 (54.1%) | 825 (45.9%) |
| $50,000 to $74,999 | 855 (79.3%) | 223 (20.7%) |
| $75,000 to $99,999 | 847 (49.3%) | 872 (50.7%) |
| $100,000 and over | 1,422 (79.9%) | 357 (20.1%) |
Public vs Private Health Insurance Coverage by Age in Broadview Park
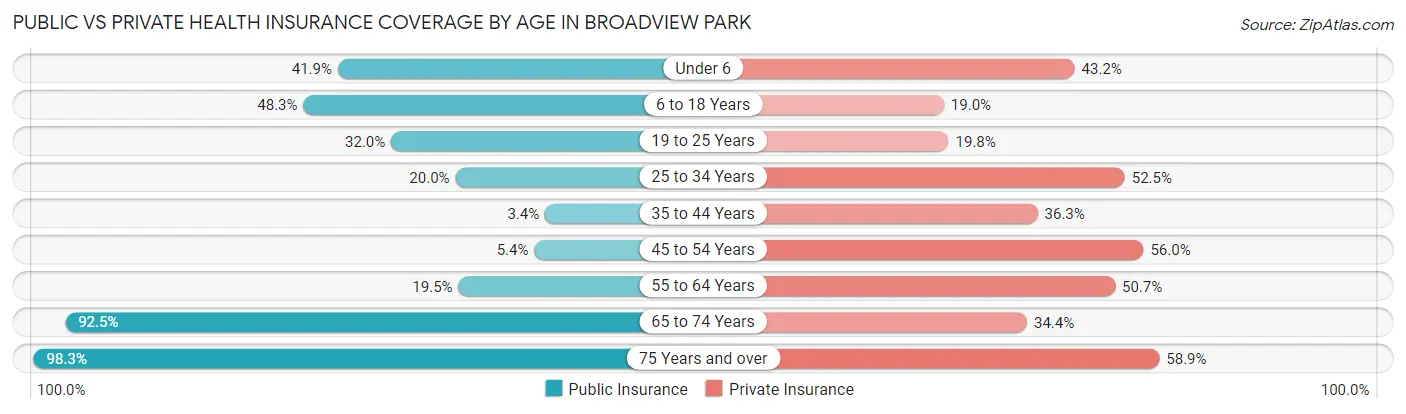
| Age Bracket | Public Insurance | Private Insurance |
| Under 6 | 216 (41.9%) | 223 (43.2%) |
| 6 to 18 Years | 415 (48.3%) | 163 (19.0%) |
| 19 to 25 Years | 187 (32.0%) | 116 (19.8%) |
| 25 to 34 Years | 190 (20.0%) | 498 (52.5%) |
| 35 to 44 Years | 49 (3.4%) | 527 (36.3%) |
| 45 to 54 Years | 48 (5.4%) | 499 (56.0%) |
| 55 to 64 Years | 230 (19.5%) | 599 (50.7%) |
| 65 to 74 Years | 589 (92.5%) | 219 (34.4%) |
| 75 Years and over | 297 (98.3%) | 178 (58.9%) |
| Total | 2,221 (30.1%) | 3,022 (41.0%) |
Disability Status by Sex by Age in Broadview Park
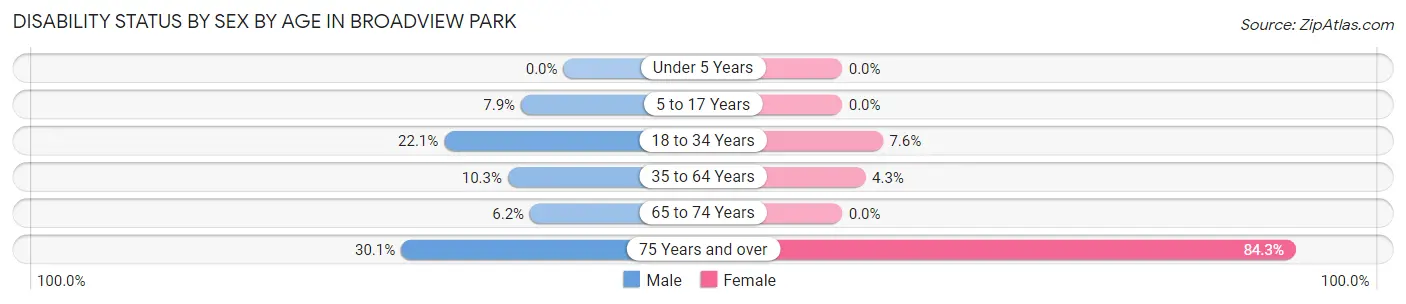
| Age Bracket | Male | Female |
| Under 5 Years | 0 (0.0%) | 0 (0.0%) |
| 5 to 17 Years | 49 (7.9%) | 0 (0.0%) |
| 18 to 34 Years | 216 (22.1%) | 44 (7.5%) |
| 35 to 64 Years | 215 (10.3%) | 62 (4.3%) |
| 65 to 74 Years | 20 (6.2%) | 0 (0.0%) |
| 75 Years and over | 47 (30.1%) | 123 (84.3%) |
Disability Class by Sex by Age in Broadview Park
Disability Class: Hearing Difficulty
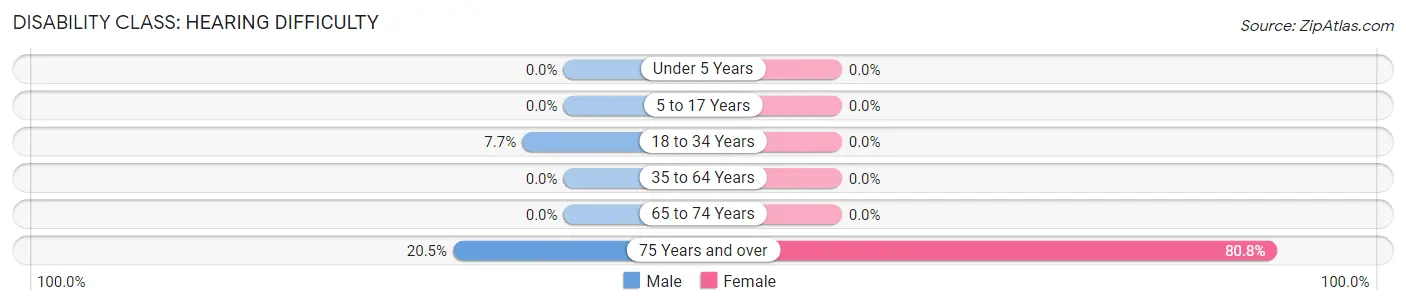
| Age Bracket | Male | Female |
| Under 5 Years | 0 (0.0%) | 0 (0.0%) |
| 5 to 17 Years | 0 (0.0%) | 0 (0.0%) |
| 18 to 34 Years | 75 (7.7%) | 0 (0.0%) |
| 35 to 64 Years | 0 (0.0%) | 0 (0.0%) |
| 65 to 74 Years | 0 (0.0%) | 0 (0.0%) |
| 75 Years and over | 32 (20.5%) | 118 (80.8%) |
Disability Class: Vision Difficulty
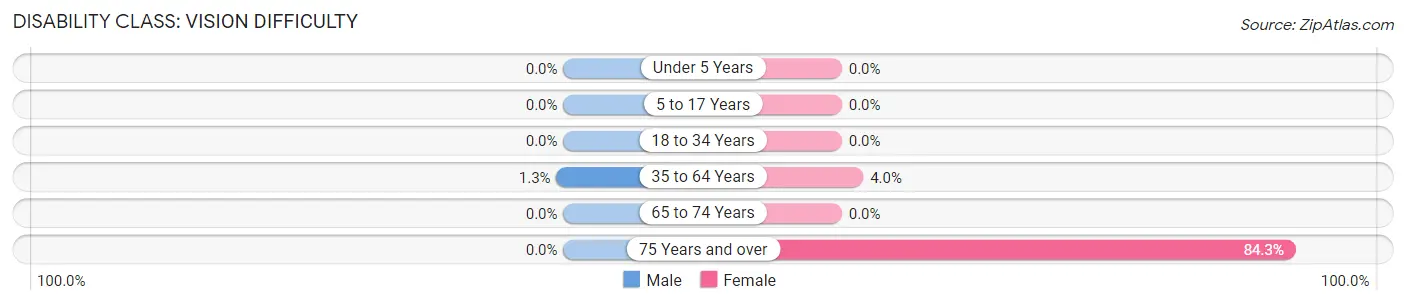
| Age Bracket | Male | Female |
| Under 5 Years | 0 (0.0%) | 0 (0.0%) |
| 5 to 17 Years | 0 (0.0%) | 0 (0.0%) |
| 18 to 34 Years | 0 (0.0%) | 0 (0.0%) |
| 35 to 64 Years | 27 (1.3%) | 57 (4.0%) |
| 65 to 74 Years | 0 (0.0%) | 0 (0.0%) |
| 75 Years and over | 0 (0.0%) | 123 (84.3%) |
Disability Class: Cognitive Difficulty
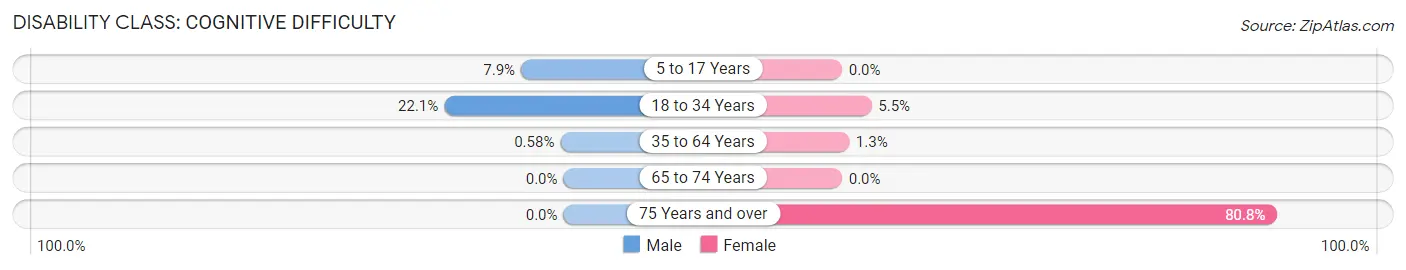
| Age Bracket | Male | Female |
| 5 to 17 Years | 49 (7.9%) | 0 (0.0%) |
| 18 to 34 Years | 216 (22.1%) | 32 (5.5%) |
| 35 to 64 Years | 12 (0.6%) | 19 (1.3%) |
| 65 to 74 Years | 0 (0.0%) | 0 (0.0%) |
| 75 Years and over | 0 (0.0%) | 118 (80.8%) |
Disability Class: Ambulatory Difficulty
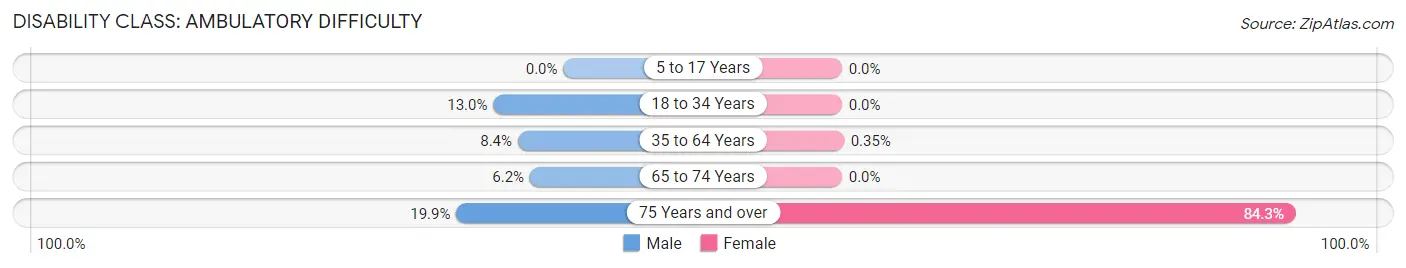
| Age Bracket | Male | Female |
| 5 to 17 Years | 0 (0.0%) | 0 (0.0%) |
| 18 to 34 Years | 127 (13.0%) | 0 (0.0%) |
| 35 to 64 Years | 176 (8.4%) | 5 (0.4%) |
| 65 to 74 Years | 20 (6.2%) | 0 (0.0%) |
| 75 Years and over | 31 (19.9%) | 123 (84.3%) |
Disability Class: Self-Care Difficulty
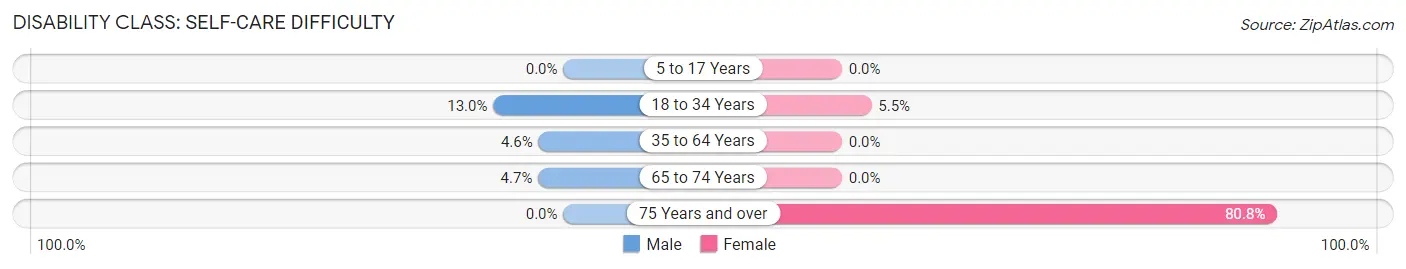
| Age Bracket | Male | Female |
| 5 to 17 Years | 0 (0.0%) | 0 (0.0%) |
| 18 to 34 Years | 127 (13.0%) | 32 (5.5%) |
| 35 to 64 Years | 96 (4.6%) | 0 (0.0%) |
| 65 to 74 Years | 15 (4.7%) | 0 (0.0%) |
| 75 Years and over | 0 (0.0%) | 118 (80.8%) |
Technology Access in Broadview Park
Computing Device Access in Broadview Park
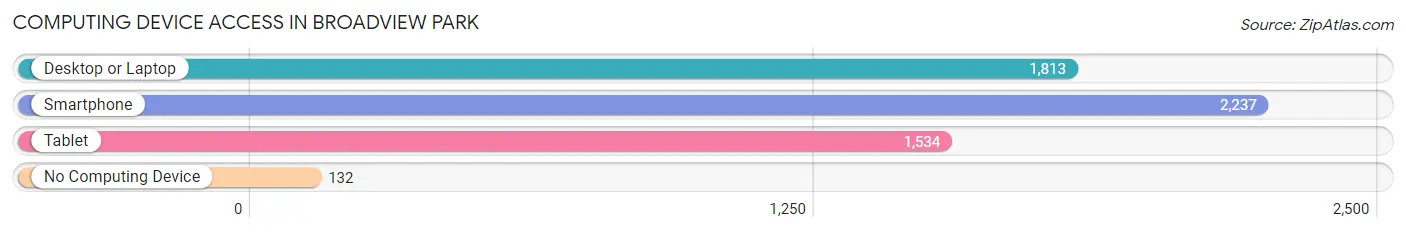
| Device Type | # Households | % Households |
| Desktop or Laptop | 1,813 | 74.8% |
| Smartphone | 2,237 | 92.3% |
| Tablet | 1,534 | 63.3% |
| No Computing Device | 132 | 5.4% |
| Total | 2,423 | 100.0% |
Internet Access in Broadview Park
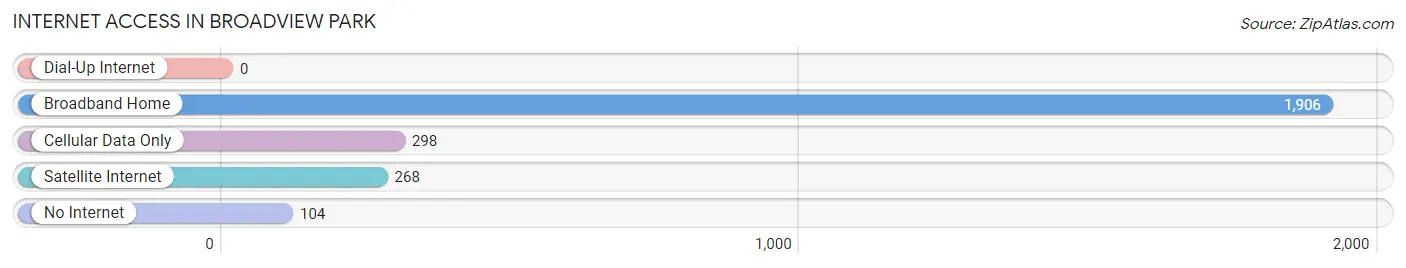
| Internet Type | # Households | % Households |
| Dial-Up Internet | 0 | 0.0% |
| Broadband Home | 1,906 | 78.7% |
| Cellular Data Only | 298 | 12.3% |
| Satellite Internet | 268 | 11.1% |
| No Internet | 104 | 4.3% |
| Total | 2,423 | 100.0% |
Broadview Park Summary
Overview
Broadview Park is a census-designated place (CDP) located in Broward County, Florida. It is located in the western part of the county, just north of the city of Hollywood. The population of Broadview Park was 8,845 at the 2010 census. The CDP is bordered by the cities of Hollywood and Pembroke Park, and is part of the Miami metropolitan area.
History
The area that is now Broadview Park was originally inhabited by the Tequesta Indians. The first European settlers arrived in the area in the late 19th century. The area was originally known as “Broadview” and was a farming community. In the early 20th century, the area was developed as a residential neighborhood. The area was annexed by the city of Hollywood in 1925.
In the 1950s, the area was rezoned for industrial use and many of the homes were demolished. In the 1960s, the area was rezoned for residential use and the area was renamed “Broadview Park”. The area was incorporated as a CDP in 1980.
Geography
Broadview Park is located at 26°1′17″N 80°13′17″W (26.0213, -80.2214). It is bordered by the cities of Hollywood and Pembroke Park. The CDP has a total area of 1.3 square miles (3.4 km2), all of which is land.
Economy
Broadview Park is primarily a residential area, but there are some businesses located in the CDP. The largest employer in the area is the Hollywood-based Memorial Healthcare System, which employs over 1,000 people. Other employers in the area include the Hollywood Police Department, the Broward County Sheriff’s Office, and the Broward County School Board.
Demographics
As of the 2010 census, there were 8,845 people, 3,541 households, and 2,521 families residing in the CDP. The population density was 6,845.3 people per square mile (2,637.2/km2). There were 3,945 housing units at an average density of 3,039.2 per square mile (1,174.2/km2). The racial makeup of the CDP was 64.2% White (non-Hispanic), 16.2% African American, 0.4% Native American, 1.2% Asian, 0.1% Pacific Islander, 15.2% from other races, and 2.7% from two or more races. Hispanic or Latino of any race were 44.2% of the population.
There were 3,541 households, out of which 33.2% had children under the age of 18 living with them, 44.2% were married couples living together, 17.7% had a female householder with no husband present, and 30.7% were non-families. 24.2% of all households were made up of individuals, and 8.3% had someone living alone who was 65 years of age or older. The average household size was 2.50 and the average family size was 2.97.
In the CDP, the population was spread out, with 24.2% under the age of 18, 10.2% from 18 to 24, 30.2% from 25 to 44, 22.2% from 45 to 64, and 13.2% who were 65 years of age or older. The median age was 35 years. For every 100 females, there were 95.2 males. For every 100 females age 18 and over, there were 92.2 males.
The median income for a household in the CDP was $33,917, and the median income for a family was $37,917. Males had a median income of $27,917 versus $22,917 for females. The per capita income for the CDP was $15,917. About 14.2% of families and 17.2% of the population were below the poverty line, including 24.2% of those under age 18 and 11.2% of those age 65 or over.
Common Questions
What is Per Capita Income in Broadview Park?
Per Capita income in Broadview Park is $26,931.
What is the Median Family Income in Broadview Park?
Median Family Income in Broadview Park is $53,890.
What is the Median Household income in Broadview Park?
Median Household Income in Broadview Park is $60,791.
What is Income or Wage Gap in Broadview Park?
Income or Wage Gap in Broadview Park is 12.4%.
Women in Broadview Park earn 87.6 cents for every dollar earned by a man.
What is Inequality or Gini Index in Broadview Park?
Inequality or Gini Index in Broadview Park is 0.41.
What is the Total Population of Broadview Park?
Total Population of Broadview Park is 7,385.
What is the Total Male Population of Broadview Park?
Total Male Population of Broadview Park is 4,384.
What is the Total Female Population of Broadview Park?
Total Female Population of Broadview Park is 3,001.
What is the Ratio of Males per 100 Females in Broadview Park?
There are 146.08 Males per 100 Females in Broadview Park.
What is the Ratio of Females per 100 Males in Broadview Park?
There are 68.45 Females per 100 Males in Broadview Park.
What is the Median Population Age in Broadview Park?
Median Population Age in Broadview Park is 40.9 Years.
What is the Average Family Size in Broadview Park
Average Family Size in Broadview Park is 3.3 People.
What is the Average Household Size in Broadview Park
Average Household Size in Broadview Park is 3.0 People.
How Large is the Labor Force in Broadview Park?
There are 4,329 People in the Labor Forcein in Broadview Park.
What is the Percentage of People in the Labor Force in Broadview Park?
70.2% of People are in the Labor Force in Broadview Park.
What is the Unemployment Rate in Broadview Park?
Unemployment Rate in Broadview Park is 6.6%.