St Leo, FL Map & Demographics
St Leo Map
St Leo Overview
$14,634
PER CAPITA INCOME
$92,500
AVG FAMILY INCOME
$82,115
AVG HOUSEHOLD INCOME
40.2%
WAGE / INCOME GAP [ % ]
59.8¢/ $1
WAGE / INCOME GAP [ $ ]
0.40
INEQUALITY / GINI INDEX
2,426
TOTAL POPULATION
1,295
MALE POPULATION
1,131
FEMALE POPULATION
114.50
MALES / 100 FEMALES
87.34
FEMALES / 100 MALES
20.4
MEDIAN AGE
3.1
AVG FAMILY SIZE
2.4
AVG HOUSEHOLD SIZE
966
LABOR FORCE [ PEOPLE ]
42.8%
PERCENT IN LABOR FORCE
10.4%
UNEMPLOYMENT RATE
Income in St Leo
Income Overview in St Leo
Per Capita Income in St Leo is $14,634, while median incomes of families and households are $92,500 and $82,115 respectively.
| Characteristic | Number | Measure |
| Per Capita Income | 2,426 | $14,634 |
| Median Family Income | 202 | $92,500 |
| Mean Family Income | 202 | $121,806 |
| Median Household Income | 308 | $82,115 |
| Mean Household Income | 308 | $92,502 |
| Income Deficit | 202 | $0 |
| Wage / Income Gap (%) | 2,426 | 40.20% |
| Wage / Income Gap ($) | 2,426 | 59.80¢ per $1 |
| Gini / Inequality Index | 2,426 | 0.40 |
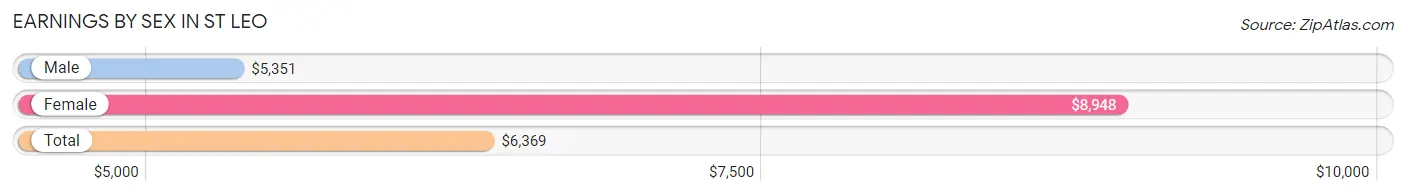
Earnings by Sex in St Leo
Average Earnings in St Leo are $6,369, $5,351 for men and $8,948 for women, a difference of 40.2%.
| Sex | Number | Average Earnings |
| Male | 775 (60.9%) | $5,351 |
| Female | 497 (39.1%) | $8,948 |
| Total | 1,272 (100.0%) | $6,369 |
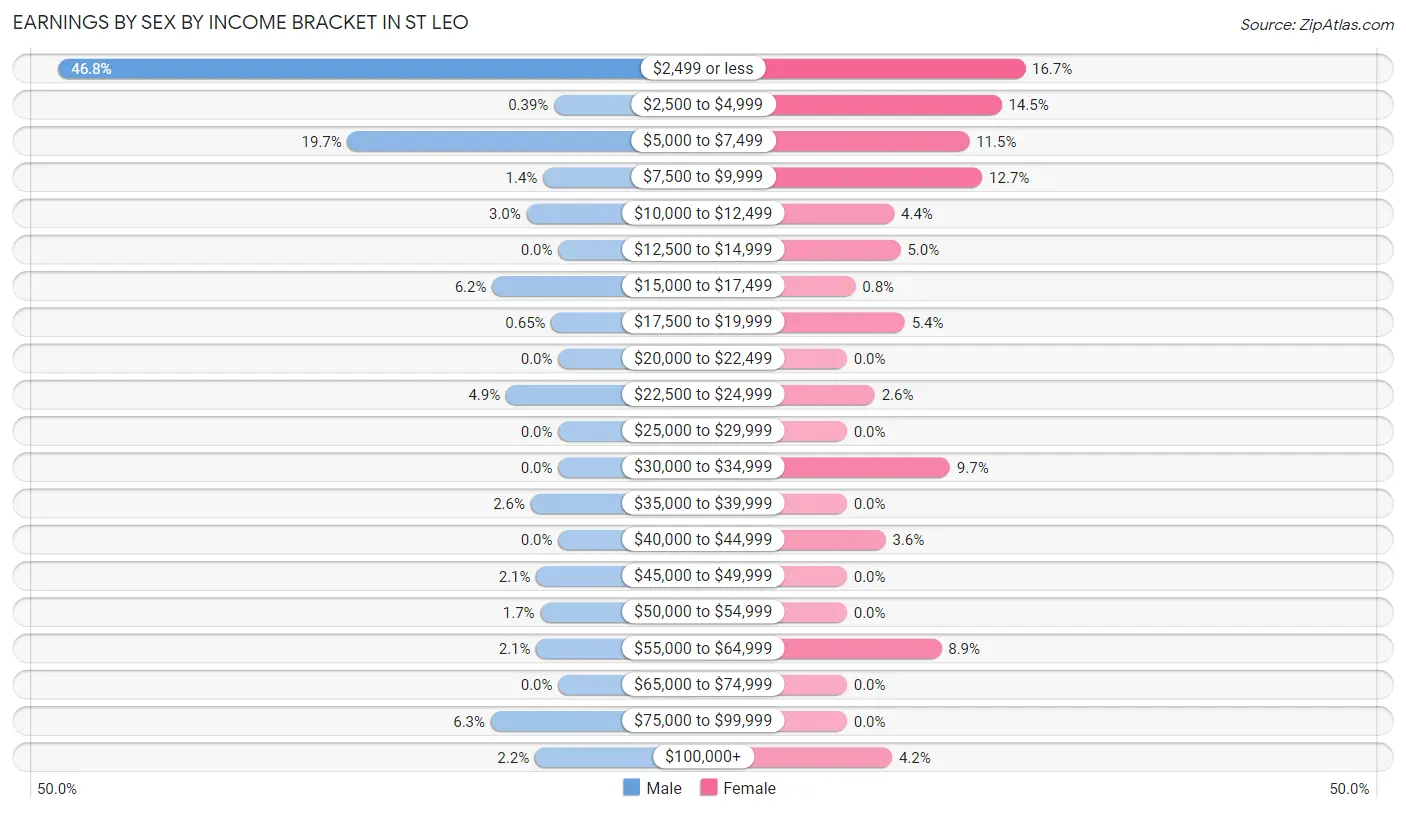
Earnings by Sex by Income Bracket in St Leo
The most common earnings brackets in St Leo are $2,499 or less for men (363 | 46.8%) and $2,499 or less for women (83 | 16.7%).
| Income | Male | Female |
| $2,499 or less | 363 (46.8%) | 83 (16.7%) |
| $2,500 to $4,999 | 3 (0.4%) | 72 (14.5%) |
| $5,000 to $7,499 | 153 (19.7%) | 57 (11.5%) |
| $7,500 to $9,999 | 11 (1.4%) | 63 (12.7%) |
| $10,000 to $12,499 | 23 (3.0%) | 22 (4.4%) |
| $12,500 to $14,999 | 0 (0.0%) | 25 (5.0%) |
| $15,000 to $17,499 | 48 (6.2%) | 4 (0.8%) |
| $17,500 to $19,999 | 5 (0.6%) | 27 (5.4%) |
| $20,000 to $22,499 | 0 (0.0%) | 0 (0.0%) |
| $22,500 to $24,999 | 38 (4.9%) | 13 (2.6%) |
| $25,000 to $29,999 | 0 (0.0%) | 0 (0.0%) |
| $30,000 to $34,999 | 0 (0.0%) | 48 (9.7%) |
| $35,000 to $39,999 | 20 (2.6%) | 0 (0.0%) |
| $40,000 to $44,999 | 0 (0.0%) | 18 (3.6%) |
| $45,000 to $49,999 | 16 (2.1%) | 0 (0.0%) |
| $50,000 to $54,999 | 13 (1.7%) | 0 (0.0%) |
| $55,000 to $64,999 | 16 (2.1%) | 44 (8.8%) |
| $65,000 to $74,999 | 0 (0.0%) | 0 (0.0%) |
| $75,000 to $99,999 | 49 (6.3%) | 0 (0.0%) |
| $100,000+ | 17 (2.2%) | 21 (4.2%) |
| Total | 775 (100.0%) | 497 (100.0%) |
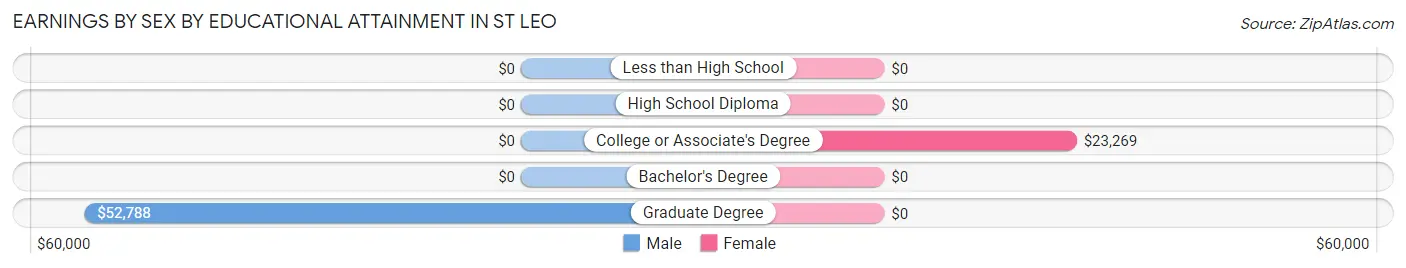
Earnings by Sex by Educational Attainment in St Leo
Average earnings in St Leo are $63,750 for men and $31,979 for women, a difference of 49.8%. Men with an educational attainment of graduate degree enjoy the highest average annual earnings of $52,788, while those with graduate degree education earn the least with $52,788. Women with an educational attainment of college or associate's degree earn the most with the average annual earnings of $23,269, while those with college or associate's degree education have the smallest earnings of $23,269.
| Educational Attainment | Male Income | Female Income |
| Less than High School | - | - |
| High School Diploma | - | - |
| College or Associate's Degree | - | - |
| Bachelor's Degree | - | - |
| Graduate Degree | $52,788 | $0 |
| Total | $63,750 | $31,979 |
Family Income in St Leo
Family Income Brackets in St Leo
According to the St Leo family income data, there are 69 families falling into the $75,000 to $99,999 income range, which is the most common income bracket and makes up 34.2% of all families.
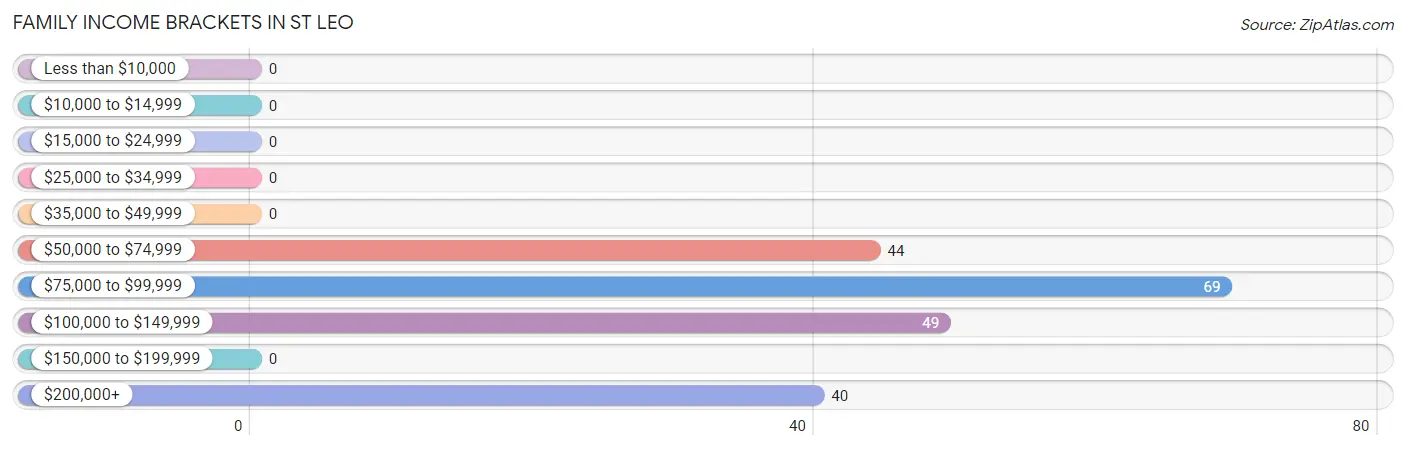
| Income Bracket | # Families | % Families |
| Less than $10,000 | 0 | 0.0% |
| $10,000 to $14,999 | 0 | 0.0% |
| $15,000 to $24,999 | 0 | 0.0% |
| $25,000 to $34,999 | 0 | 0.0% |
| $35,000 to $49,999 | 0 | 0.0% |
| $50,000 to $74,999 | 44 | 21.8% |
| $75,000 to $99,999 | 69 | 34.2% |
| $100,000 to $149,999 | 49 | 24.3% |
| $150,000 to $199,999 | 0 | 0.0% |
| $200,000+ | 40 | 19.8% |
Family Income by Famaliy Size in St Leo
2-person families (123 | 60.9%) account for the highest median family income in St Leo with $91,165 per family, while 2-person families (123 | 60.9%) have the highest median income of $45,582 per family member.
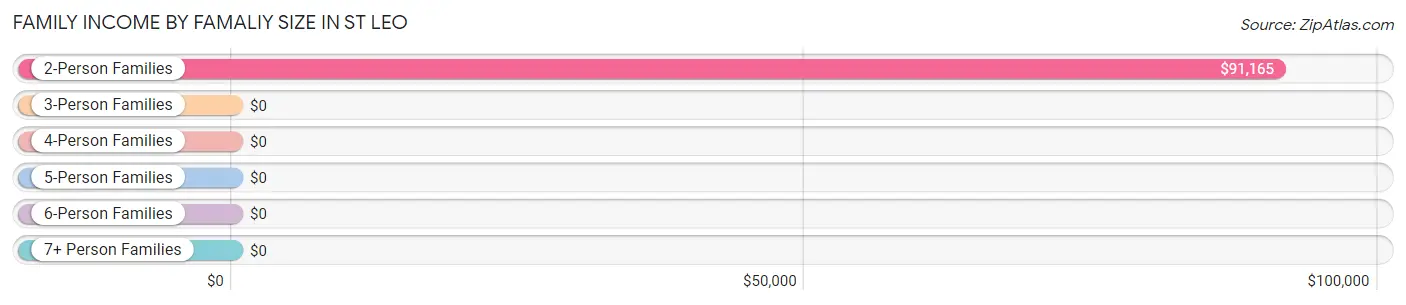
| Income Bracket | # Families | Median Income |
| 2-Person Families | 123 (60.9%) | $91,165 |
| 3-Person Families | 0 (0.0%) | $0 |
| 4-Person Families | 63 (31.2%) | $0 |
| 5-Person Families | 0 (0.0%) | $0 |
| 6-Person Families | 0 (0.0%) | $0 |
| 7+ Person Families | 16 (7.9%) | $0 |
| Total | 202 (100.0%) | $92,500 |
Family Income by Number of Earners in St Leo
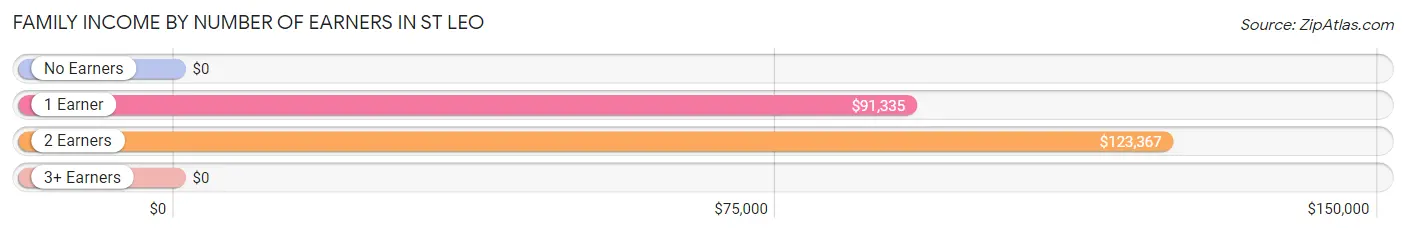
| Number of Earners | # Families | Median Income |
| No Earners | 23 (11.4%) | $0 |
| 1 Earner | 71 (35.1%) | $91,335 |
| 2 Earners | 92 (45.5%) | $123,367 |
| 3+ Earners | 16 (7.9%) | $0 |
| Total | 202 (100.0%) | $92,500 |
Household Income in St Leo
Household Income Brackets in St Leo
With 69 households falling in the category, the $75,000 to $99,999 income range is the most frequent in St Leo, accounting for 22.4% of all households.
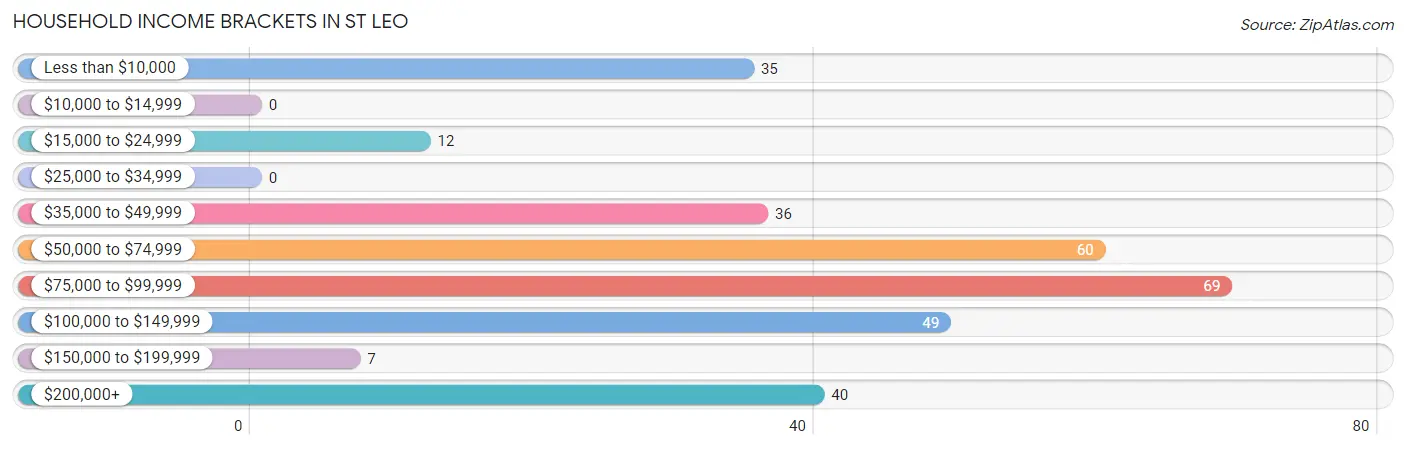
| Income Bracket | # Households | % Households |
| Less than $10,000 | 35 | 11.4% |
| $10,000 to $14,999 | 0 | 0.0% |
| $15,000 to $24,999 | 12 | 3.9% |
| $25,000 to $34,999 | 0 | 0.0% |
| $35,000 to $49,999 | 36 | 11.7% |
| $50,000 to $74,999 | 60 | 19.5% |
| $75,000 to $99,999 | 69 | 22.4% |
| $100,000 to $149,999 | 49 | 15.9% |
| $150,000 to $199,999 | 7 | 2.3% |
| $200,000+ | 40 | 13.0% |
Household Income by Householder Age in St Leo
The median household income in St Leo is $82,115, with the highest median household income of $123,699 found in the 25 to 44 years age bracket for the primary householder. A total of 79 households (25.7%) fall into this category.
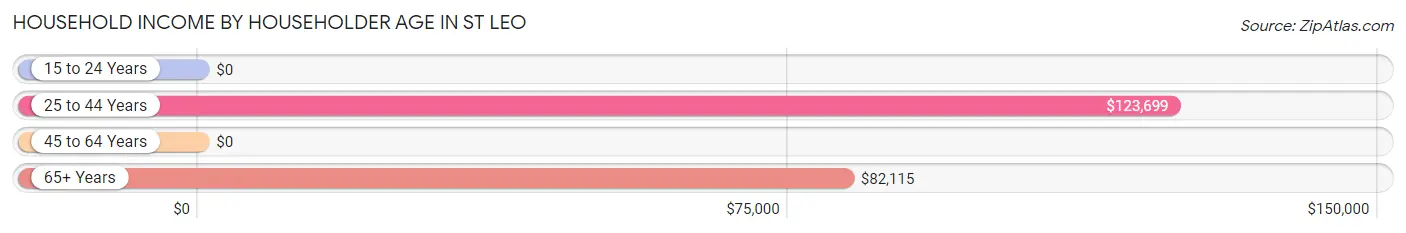
| Income Bracket | # Households | Median Income |
| 15 to 24 Years | 0 (0.0%) | $0 |
| 25 to 44 Years | 79 (25.7%) | $123,699 |
| 45 to 64 Years | 87 (28.2%) | $0 |
| 65+ Years | 142 (46.1%) | $82,115 |
| Total | 308 (100.0%) | $82,115 |
Poverty in St Leo
Income Below Poverty by Sex and Age in St Leo
With 3.9% poverty level for males and 10.0% for females among the residents of St Leo, 25 to 34 year old males and 25 to 34 year old females are the most vulnerable to poverty, with 2 males (100.0%) and 3 females (100.0%) in their respective age groups living below the poverty level.
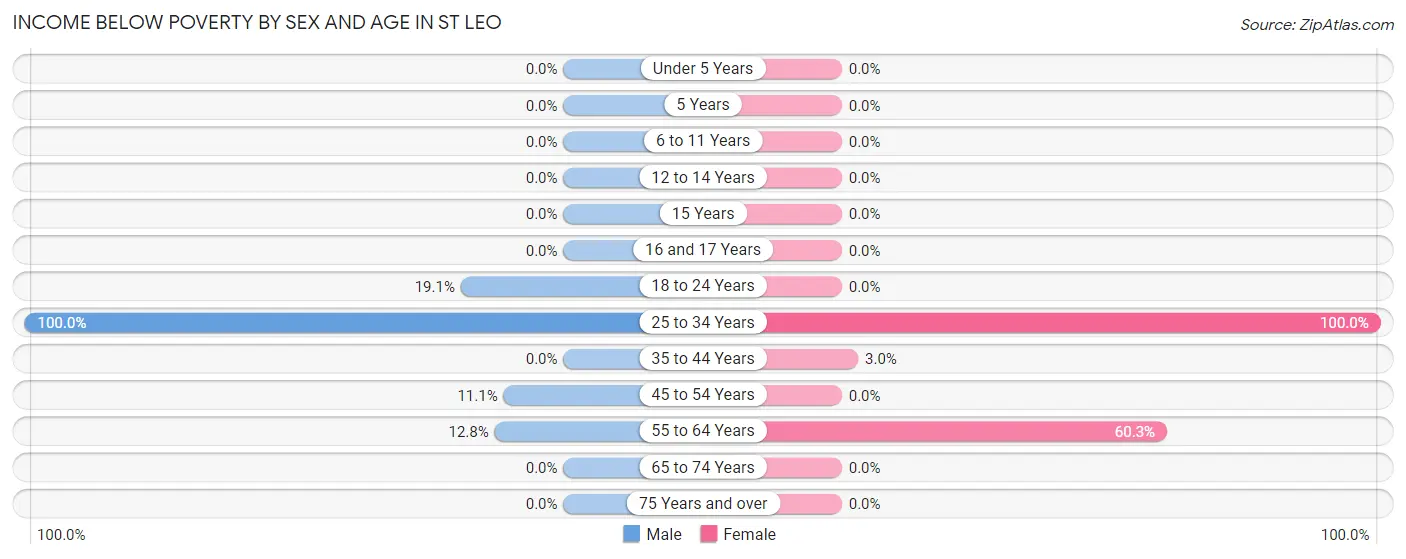
| Age Bracket | Male | Female |
| Under 5 Years | 0 (0.0%) | 0 (0.0%) |
| 5 Years | 0 (0.0%) | 0 (0.0%) |
| 6 to 11 Years | 0 (0.0%) | 0 (0.0%) |
| 12 to 14 Years | 0 (0.0%) | 0 (0.0%) |
| 15 Years | 0 (0.0%) | 0 (0.0%) |
| 16 and 17 Years | 0 (0.0%) | 0 (0.0%) |
| 18 to 24 Years | 4 (19.1%) | 0 (0.0%) |
| 25 to 34 Years | 2 (100.0%) | 3 (100.0%) |
| 35 to 44 Years | 0 (0.0%) | 3 (3.0%) |
| 45 to 54 Years | 2 (11.1%) | 0 (0.0%) |
| 55 to 64 Years | 6 (12.8%) | 35 (60.3%) |
| 65 to 74 Years | 0 (0.0%) | 0 (0.0%) |
| 75 Years and over | 0 (0.0%) | 0 (0.0%) |
| Total | 14 (3.9%) | 41 (10.0%) |
Income Above Poverty by Sex and Age in St Leo
According to the poverty statistics in St Leo, males aged 6 to 11 years and females aged 6 to 11 years are the age groups that are most secure financially, with 100.0% of males and 100.0% of females in these age groups living above the poverty line.
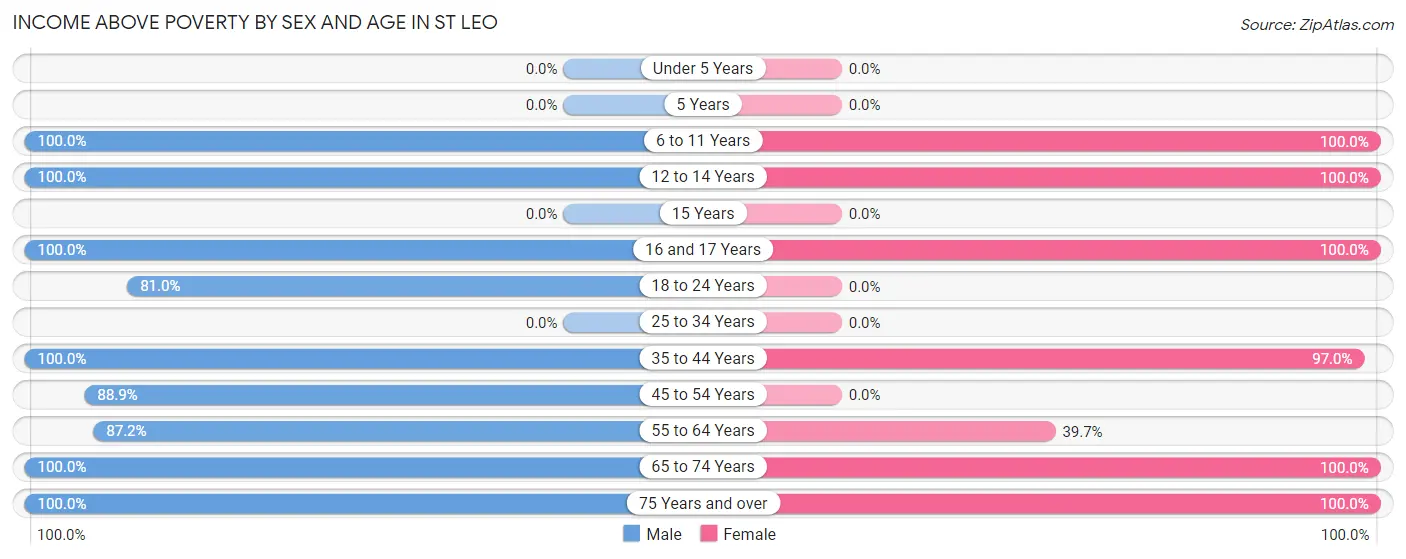
| Age Bracket | Male | Female |
| Under 5 Years | 0 (0.0%) | 0 (0.0%) |
| 5 Years | 0 (0.0%) | 0 (0.0%) |
| 6 to 11 Years | 67 (100.0%) | 17 (100.0%) |
| 12 to 14 Years | 15 (100.0%) | 70 (100.0%) |
| 15 Years | 0 (0.0%) | 0 (0.0%) |
| 16 and 17 Years | 13 (100.0%) | 13 (100.0%) |
| 18 to 24 Years | 17 (80.9%) | 0 (0.0%) |
| 25 to 34 Years | 0 (0.0%) | 0 (0.0%) |
| 35 to 44 Years | 84 (100.0%) | 96 (97.0%) |
| 45 to 54 Years | 16 (88.9%) | 0 (0.0%) |
| 55 to 64 Years | 41 (87.2%) | 23 (39.7%) |
| 65 to 74 Years | 75 (100.0%) | 104 (100.0%) |
| 75 Years and over | 15 (100.0%) | 48 (100.0%) |
| Total | 343 (96.1%) | 371 (90.0%) |
Income Below Poverty Among Married-Couple Families in St Leo
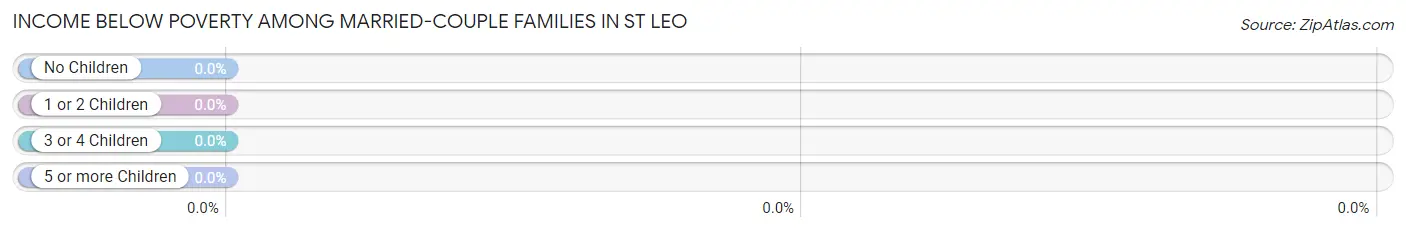
| Children | Above Poverty | Below Poverty |
| No Children | 110 (100.0%) | 0 (0.0%) |
| 1 or 2 Children | 63 (100.0%) | 0 (0.0%) |
| 3 or 4 Children | 16 (100.0%) | 0 (0.0%) |
| 5 or more Children | 0 (0.0%) | 0 (0.0%) |
| Total | 189 (100.0%) | 0 (0.0%) |
Income Below Poverty Among Single-Parent Households in St Leo
| Children | Single Father | Single Mother |
| No Children | 0 (0.0%) | 0 (0.0%) |
| 1 or 2 Children | 0 (0.0%) | 0 (0.0%) |
| 3 or 4 Children | 0 (0.0%) | 0 (0.0%) |
| 5 or more Children | 0 (0.0%) | 0 (0.0%) |
| Total | 0 (0.0%) | 0 (0.0%) |
Income Below Poverty Among Married-Couple vs Single-Parent Households in St Leo
| Children | Married-Couple Families | Single-Parent Households |
| No Children | 0 (0.0%) | 0 (0.0%) |
| 1 or 2 Children | 0 (0.0%) | 0 (0.0%) |
| 3 or 4 Children | 0 (0.0%) | 0 (0.0%) |
| 5 or more Children | 0 (0.0%) | 0 (0.0%) |
| Total | 0 (0.0%) | 0 (0.0%) |
Race in St Leo
The most populous races in St Leo are White / Caucasian (1,535 | 63.3%), Black / African American (605 | 24.9%), and Hispanic or Latino (289 | 11.9%).
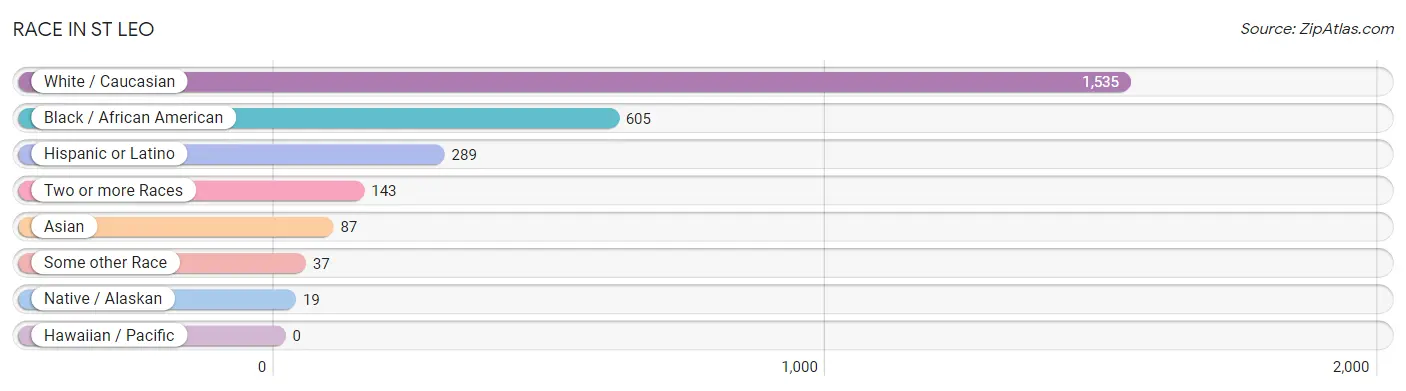
| Race | # Population | % Population |
| Asian | 87 | 3.6% |
| Black / African American | 605 | 24.9% |
| Hawaiian / Pacific | 0 | 0.0% |
| Hispanic or Latino | 289 | 11.9% |
| Native / Alaskan | 19 | 0.8% |
| White / Caucasian | 1,535 | 63.3% |
| Two or more Races | 143 | 5.9% |
| Some other Race | 37 | 1.5% |
| Total | 2,426 | 100.0% |
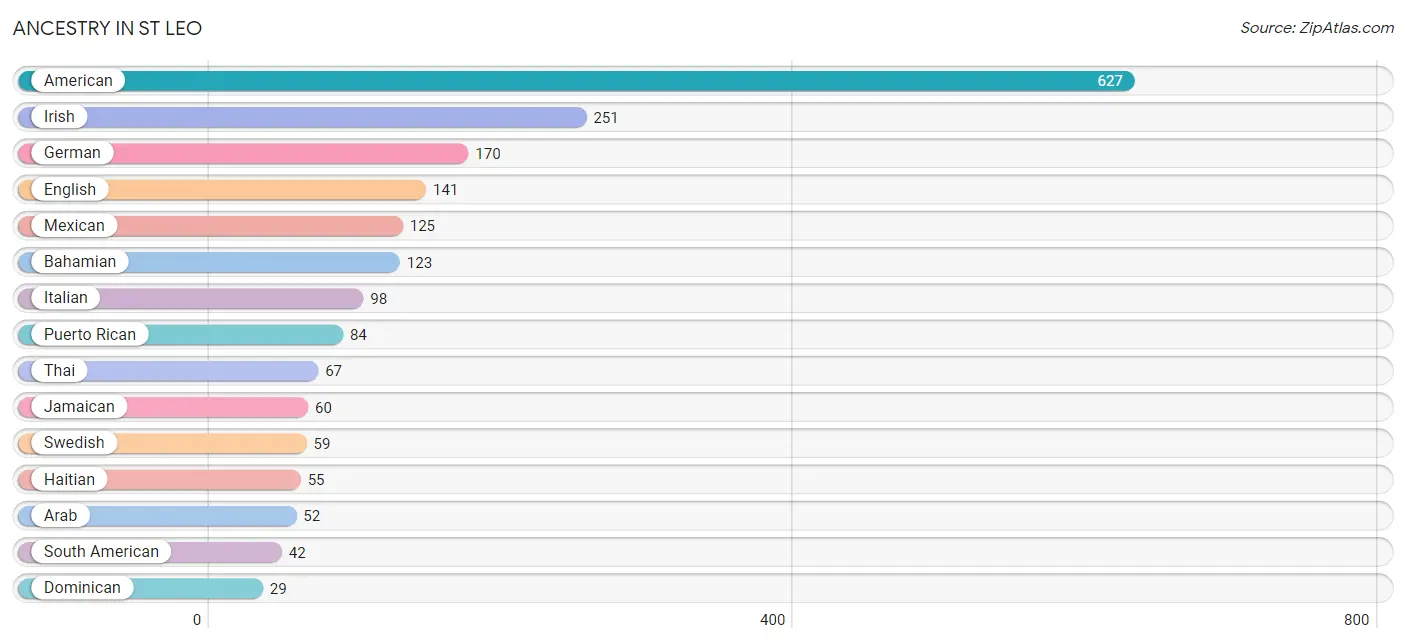
Ancestry in St Leo
The most populous ancestries reported in St Leo are American (627 | 25.9%), Irish (251 | 10.3%), German (170 | 7.0%), English (141 | 5.8%), and Mexican (125 | 5.1%), together accounting for 54.2% of all St Leo residents.
| Ancestry | # Population | % Population |
| African | 9 | 0.4% |
| American | 627 | 25.9% |
| Arab | 52 | 2.1% |
| Bahamian | 123 | 5.1% |
| Barbadian | 11 | 0.4% |
| British West Indian | 11 | 0.4% |
| Burmese | 2 | 0.1% |
| Central American | 9 | 0.4% |
| Cherokee | 19 | 0.8% |
| Colombian | 20 | 0.8% |
| Dominican | 29 | 1.2% |
| Dutch | 11 | 0.4% |
| English | 141 | 5.8% |
| Ethiopian | 3 | 0.1% |
| European | 12 | 0.5% |
| French | 26 | 1.1% |
| French Canadian | 18 | 0.7% |
| German | 170 | 7.0% |
| Haitian | 55 | 2.3% |
| Indian (Asian) | 11 | 0.4% |
| Irish | 251 | 10.3% |
| Italian | 98 | 4.0% |
| Jamaican | 60 | 2.5% |
| Mexican | 125 | 5.1% |
| Polish | 18 | 0.7% |
| Puerto Rican | 84 | 3.5% |
| Romanian | 13 | 0.5% |
| Salvadoran | 9 | 0.4% |
| Scotch-Irish | 12 | 0.5% |
| Scottish | 23 | 0.9% |
| Slovak | 2 | 0.1% |
| South American | 42 | 1.7% |
| Subsaharan African | 12 | 0.5% |
| Swedish | 59 | 2.4% |
| Swiss | 13 | 0.5% |
| Thai | 67 | 2.8% |
| Venezuelan | 22 | 0.9% |
| Welsh | 2 | 0.1% |
| West Indian | 15 | 0.6% | View All 39 Rows |
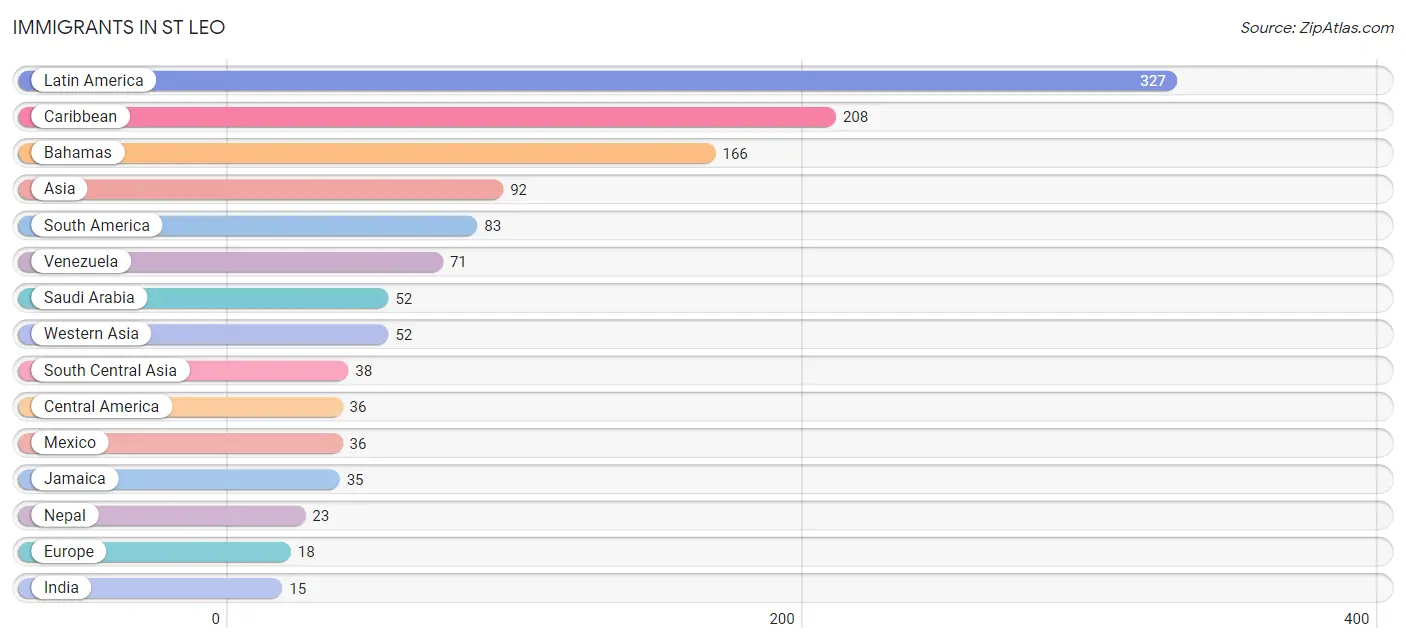
Immigrants in St Leo
The most numerous immigrant groups reported in St Leo came from Latin America (327 | 13.5%), Caribbean (208 | 8.6%), Bahamas (166 | 6.8%), Asia (92 | 3.8%), and South America (83 | 3.4%), together accounting for 36.1% of all St Leo residents.
| Immigration Origin | # Population | % Population |
| Africa | 3 | 0.1% |
| Asia | 92 | 3.8% |
| Bahamas | 166 | 6.8% |
| Caribbean | 208 | 8.6% |
| Central America | 36 | 1.5% |
| Colombia | 12 | 0.5% |
| Eastern Africa | 3 | 0.1% |
| Eastern Asia | 2 | 0.1% |
| Ethiopia | 3 | 0.1% |
| Europe | 18 | 0.7% |
| France | 9 | 0.4% |
| Haiti | 7 | 0.3% |
| India | 15 | 0.6% |
| Italy | 9 | 0.4% |
| Jamaica | 35 | 1.4% |
| Korea | 2 | 0.1% |
| Latin America | 327 | 13.5% |
| Mexico | 36 | 1.5% |
| Nepal | 23 | 0.9% |
| Saudi Arabia | 52 | 2.1% |
| South America | 83 | 3.4% |
| South Central Asia | 38 | 1.6% |
| Southern Europe | 9 | 0.4% |
| Venezuela | 71 | 2.9% |
| Western Asia | 52 | 2.1% |
| Western Europe | 9 | 0.4% | View All 26 Rows |
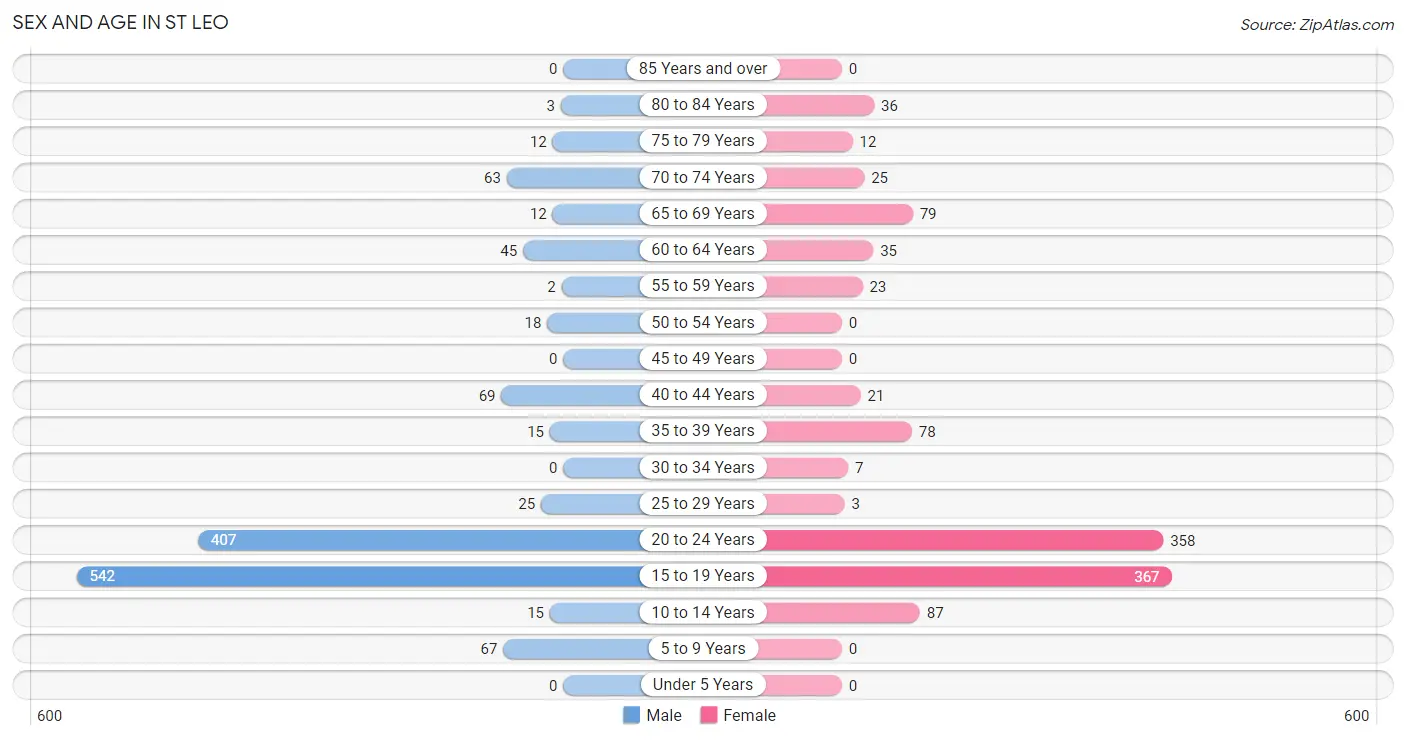
Sex and Age in St Leo
Sex and Age in St Leo
The most populous age groups in St Leo are 15 to 19 Years (542 | 41.8%) for men and 15 to 19 Years (367 | 32.5%) for women.
| Age Bracket | Male | Female |
| Under 5 Years | 0 (0.0%) | 0 (0.0%) |
| 5 to 9 Years | 67 (5.2%) | 0 (0.0%) |
| 10 to 14 Years | 15 (1.2%) | 87 (7.7%) |
| 15 to 19 Years | 542 (41.8%) | 367 (32.5%) |
| 20 to 24 Years | 407 (31.4%) | 358 (31.7%) |
| 25 to 29 Years | 25 (1.9%) | 3 (0.3%) |
| 30 to 34 Years | 0 (0.0%) | 7 (0.6%) |
| 35 to 39 Years | 15 (1.2%) | 78 (6.9%) |
| 40 to 44 Years | 69 (5.3%) | 21 (1.9%) |
| 45 to 49 Years | 0 (0.0%) | 0 (0.0%) |
| 50 to 54 Years | 18 (1.4%) | 0 (0.0%) |
| 55 to 59 Years | 2 (0.2%) | 23 (2.0%) |
| 60 to 64 Years | 45 (3.5%) | 35 (3.1%) |
| 65 to 69 Years | 12 (0.9%) | 79 (7.0%) |
| 70 to 74 Years | 63 (4.9%) | 25 (2.2%) |
| 75 to 79 Years | 12 (0.9%) | 12 (1.1%) |
| 80 to 84 Years | 3 (0.2%) | 36 (3.2%) |
| 85 Years and over | 0 (0.0%) | 0 (0.0%) |
| Total | 1,295 (100.0%) | 1,131 (100.0%) |
Families and Households in St Leo
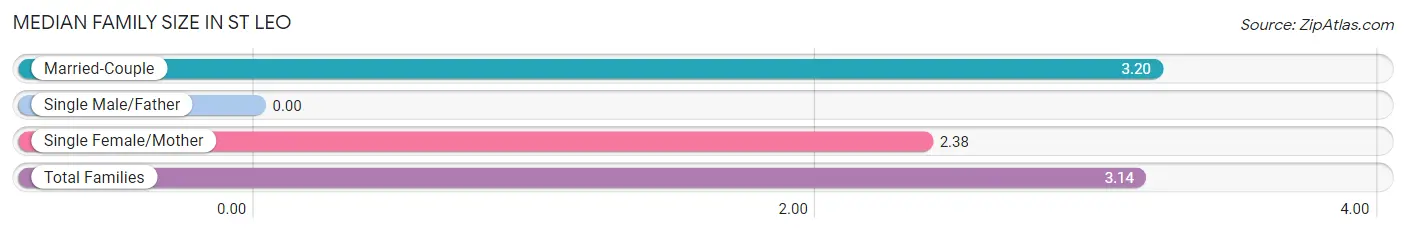
Median Family Size in St Leo
| Family Type | # Families | Family Size |
| Married-Couple | 189 (93.6%) | 3.20 |
| Single Male/Father | 0 (0.0%) | - |
| Single Female/Mother | 13 (6.4%) | 2.38 |
| Total Families | 202 (100.0%) | 3.14 |
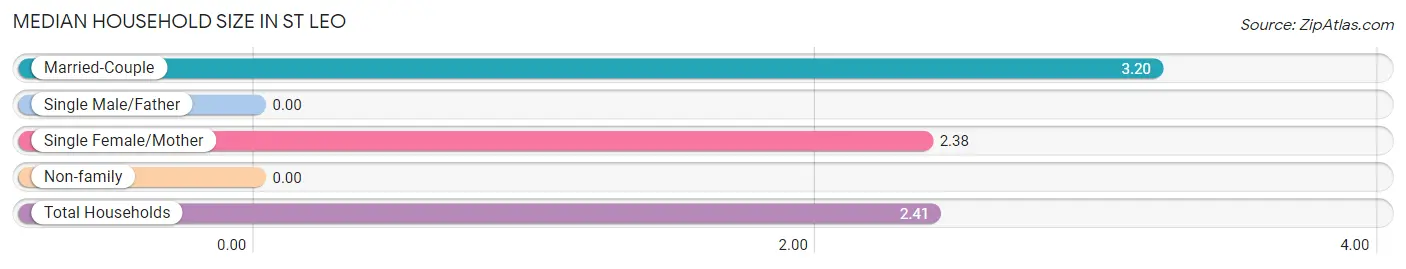
Median Household Size in St Leo
| Household Type | # Households | Household Size |
| Married-Couple | 189 (61.4%) | 3.20 |
| Single Male/Father | 0 (0.0%) | - |
| Single Female/Mother | 13 (4.2%) | 2.38 |
| Non-family | 106 (34.4%) | - |
| Total Households | 308 (100.0%) | 2.41 |
Household Size by Marriage Status in St Leo
Out of a total of 308 households in St Leo, 202 (65.6%) are family households, while 106 (34.4%) are nonfamily households. The most numerous type of family households are 2-person households, comprising 123, and the most common type of nonfamily households are 1-person households, comprising 106.
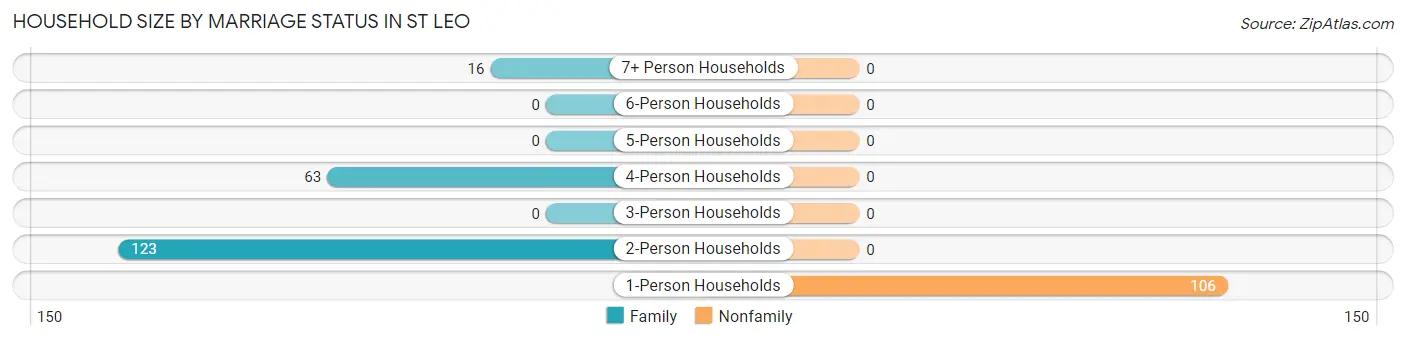
| Household Size | Family Households | Nonfamily Households |
| 1-Person Households | - | 106 (34.4%) |
| 2-Person Households | 123 (39.9%) | 0 (0.0%) |
| 3-Person Households | 0 (0.0%) | 0 (0.0%) |
| 4-Person Households | 63 (20.4%) | 0 (0.0%) |
| 5-Person Households | 0 (0.0%) | 0 (0.0%) |
| 6-Person Households | 0 (0.0%) | 0 (0.0%) |
| 7+ Person Households | 16 (5.2%) | 0 (0.0%) |
| Total | 202 (65.6%) | 106 (34.4%) |
Female Fertility in St Leo
Fertility by Age in St Leo
Average fertility rate in St Leo is 23.0 births per 1,000 women. Women in the age bracket of 20 to 34 years have the highest fertility rate with 52.0 births per 1,000 women. Women in the age bracket of 20 to 34 years acount for 100.0% of all women with births.
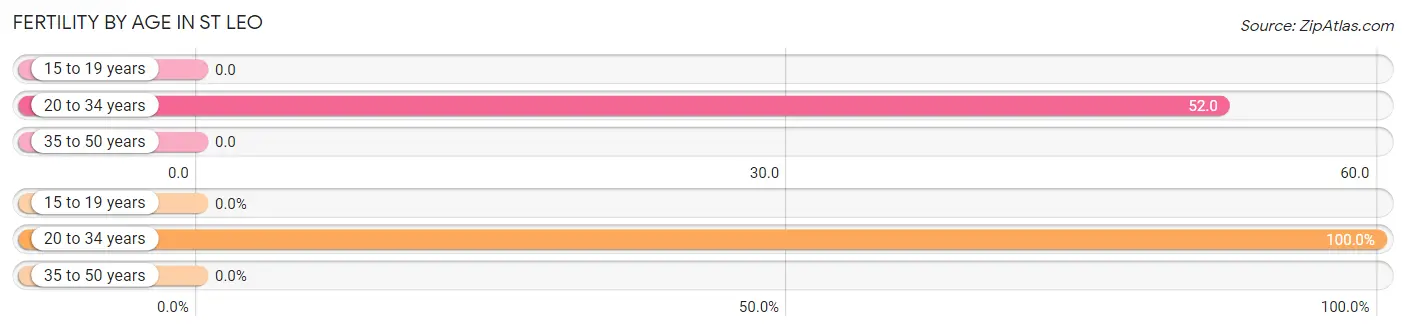
| Age Bracket | Women with Births | Births / 1,000 Women |
| 15 to 19 years | 0 (0.0%) | 0.0 |
| 20 to 34 years | 19 (100.0%) | 52.0 |
| 35 to 50 years | 0 (0.0%) | 0.0 |
| Total | 19 (100.0%) | 23.0 |
Fertility by Age by Marriage Status in St Leo
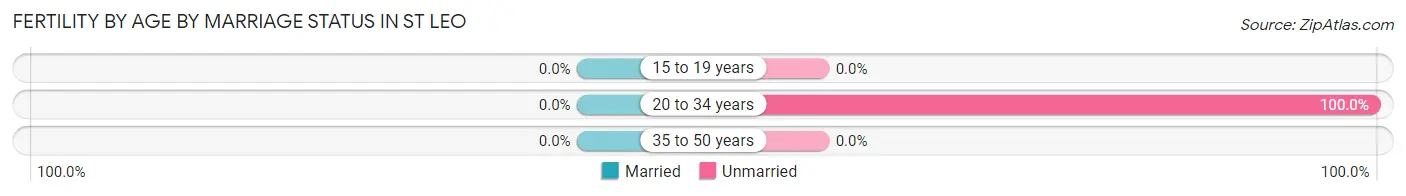
| Age Bracket | Married | Unmarried |
| 15 to 19 years | 0 (0.0%) | 0 (0.0%) |
| 20 to 34 years | 0 (0.0%) | 19 (100.0%) |
| 35 to 50 years | 0 (0.0%) | 0 (0.0%) |
| Total | 0 (0.0%) | 19 (100.0%) |
Fertility by Education in St Leo
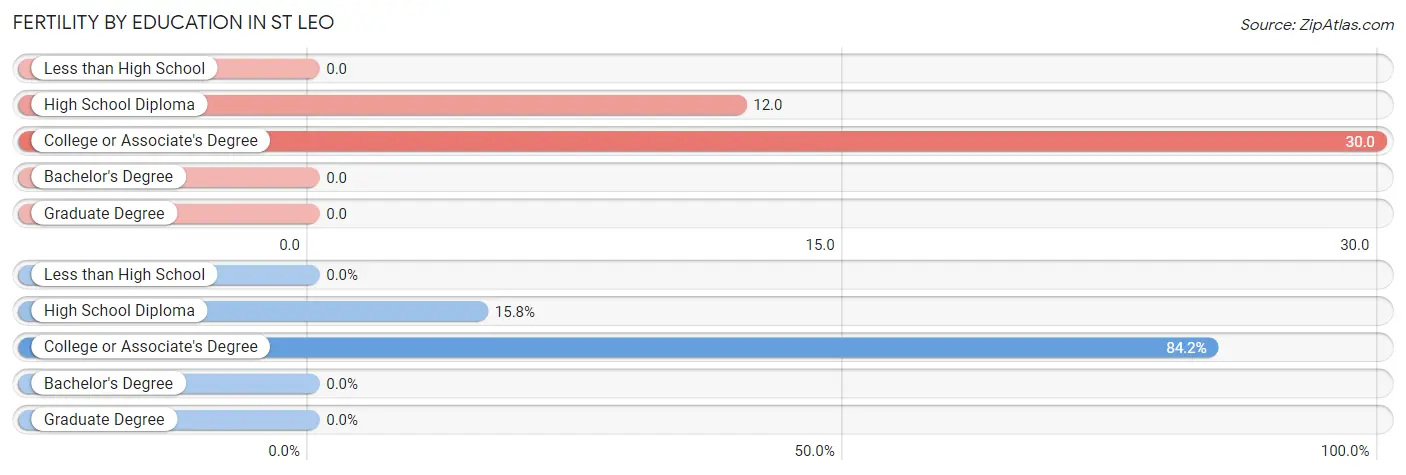
| Educational Attainment | Women with Births | Births / 1,000 Women |
| Less than High School | 0 (0.0%) | 0.0 |
| High School Diploma | 3 (15.8%) | 12.0 |
| College or Associate's Degree | 16 (84.2%) | 30.0 |
| Bachelor's Degree | 0 (0.0%) | 0.0 |
| Graduate Degree | 0 (0.0%) | 0.0 |
| Total | 19 (100.0%) | 23.0 |
Fertility by Education by Marriage Status in St Leo
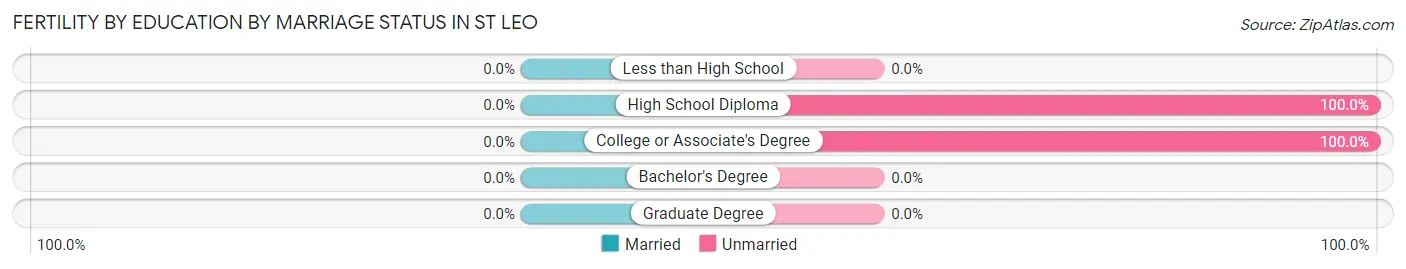
| Educational Attainment | Married | Unmarried |
| Less than High School | 0 (0.0%) | 0 (0.0%) |
| High School Diploma | 0 (0.0%) | 3 (100.0%) |
| College or Associate's Degree | 0 (0.0%) | 16 (100.0%) |
| Bachelor's Degree | 0 (0.0%) | 0 (0.0%) |
| Graduate Degree | 0 (0.0%) | 0 (0.0%) |
| Total | 0 (0.0%) | 19 (100.0%) |
Employment Characteristics in St Leo
Employment by Class of Employer in St Leo
Among the 865 employed individuals in St Leo, private company employees (409 | 47.3%), not-for-profit organizations (158 | 18.3%), and state government employees (124 | 14.3%) make up the most common classes of employment.
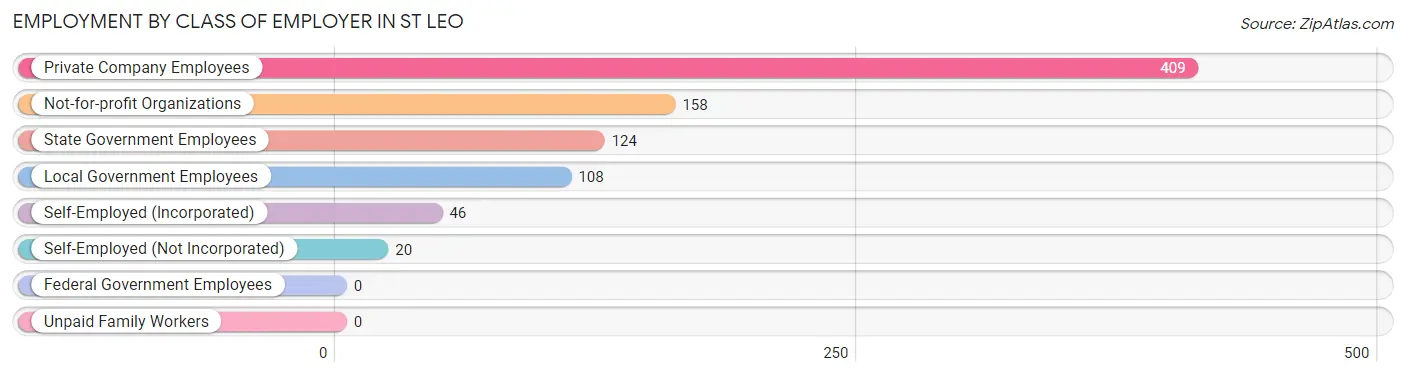
| Employer Class | # Employees | % Employees |
| Private Company Employees | 409 | 47.3% |
| Self-Employed (Incorporated) | 46 | 5.3% |
| Self-Employed (Not Incorporated) | 20 | 2.3% |
| Not-for-profit Organizations | 158 | 18.3% |
| Local Government Employees | 108 | 12.5% |
| State Government Employees | 124 | 14.3% |
| Federal Government Employees | 0 | 0.0% |
| Unpaid Family Workers | 0 | 0.0% |
| Total | 865 | 100.0% |
Employment Status by Age in St Leo
According to the labor force statistics for St Leo, out of the total population over 16 years of age (2,257), 42.8% or 966 individuals are in the labor force, with 10.4% or 100 of them unemployed. The age group with the highest labor force participation rate is 30 to 34 years, with 100.0% or 7 individuals in the labor force. Within the labor force, the 16 to 19 years age range has the highest percentage of unemployed individuals, with 19.4% or 56 of them being unemployed.
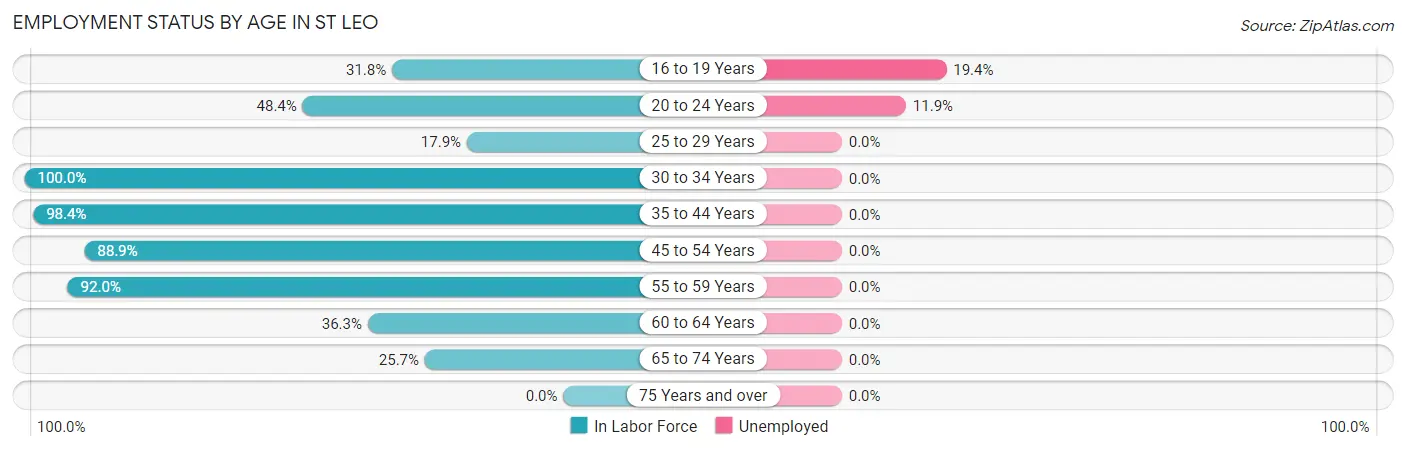
| Age Bracket | In Labor Force | Unemployed |
| 16 to 19 Years | 289 (31.8%) | 56 (19.4%) |
| 20 to 24 Years | 370 (48.4%) | 44 (11.9%) |
| 25 to 29 Years | 5 (17.9%) | 0 (0.0%) |
| 30 to 34 Years | 7 (100.0%) | 0 (0.0%) |
| 35 to 44 Years | 180 (98.4%) | 0 (0.0%) |
| 45 to 54 Years | 16 (88.9%) | 0 (0.0%) |
| 55 to 59 Years | 23 (92.0%) | 0 (0.0%) |
| 60 to 64 Years | 29 (36.3%) | 0 (0.0%) |
| 65 to 74 Years | 46 (25.7%) | 0 (0.0%) |
| 75 Years and over | 0 (0.0%) | 0 (0.0%) |
| Total | 966 (42.8%) | 100 (10.4%) |
Employment Status by Educational Attainment in St Leo
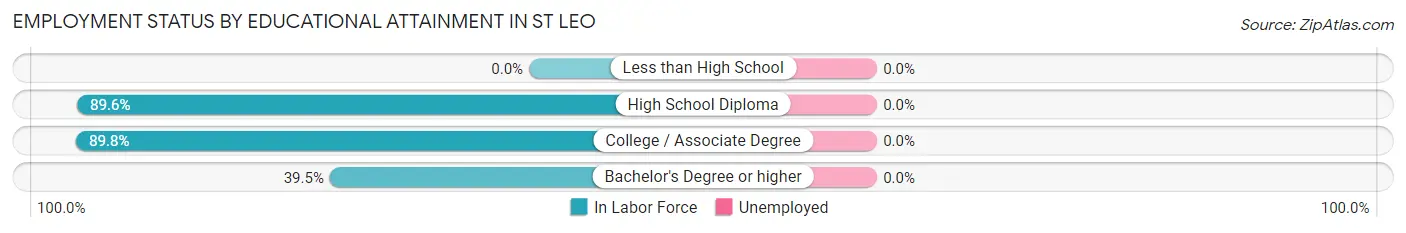
| Educational Attainment | In Labor Force | Unemployed |
| Less than High School | 0 (0.0%) | 0 (0.0%) |
| High School Diploma | 129 (89.6%) | 0 (0.0%) |
| College / Associate Degree | 97 (89.8%) | 0 (0.0%) |
| Bachelor's Degree or higher | 34 (39.5%) | 0 (0.0%) |
| Total | 260 (76.2%) | 0 (0.0%) |
Employment Occupations by Sex in St Leo
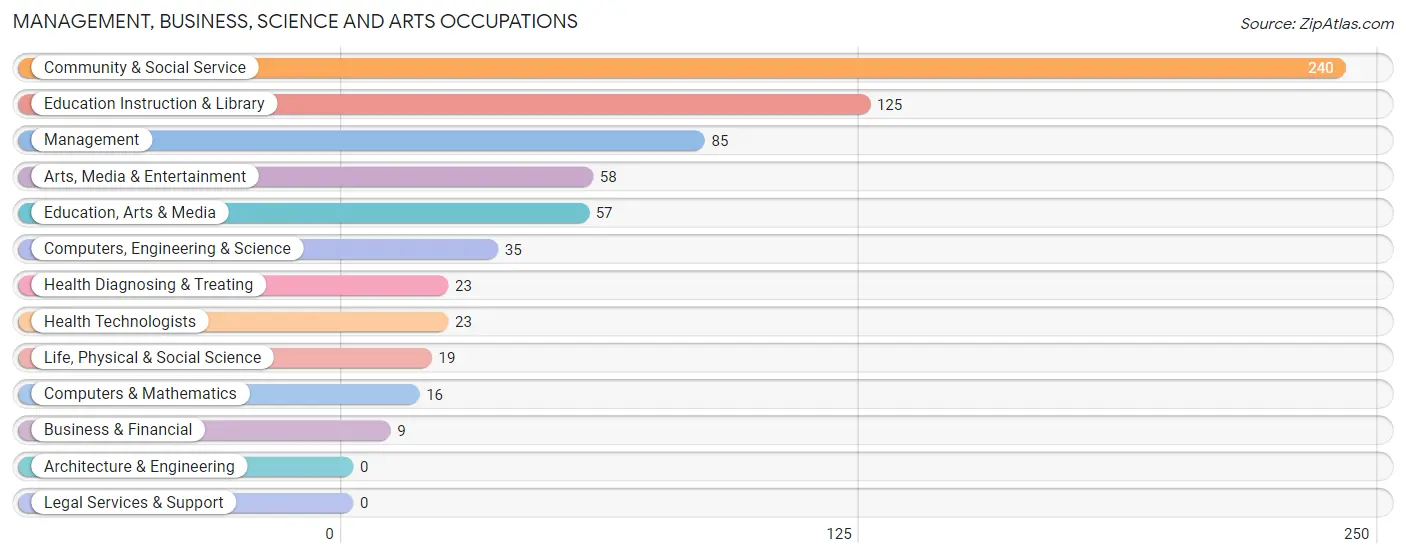
Management, Business, Science and Arts Occupations
The most common Management, Business, Science and Arts occupations in St Leo are Community & Social Service (240 | 27.8%), Education Instruction & Library (125 | 14.4%), Management (85 | 9.8%), Arts, Media & Entertainment (58 | 6.7%), and Education, Arts & Media (57 | 6.6%).
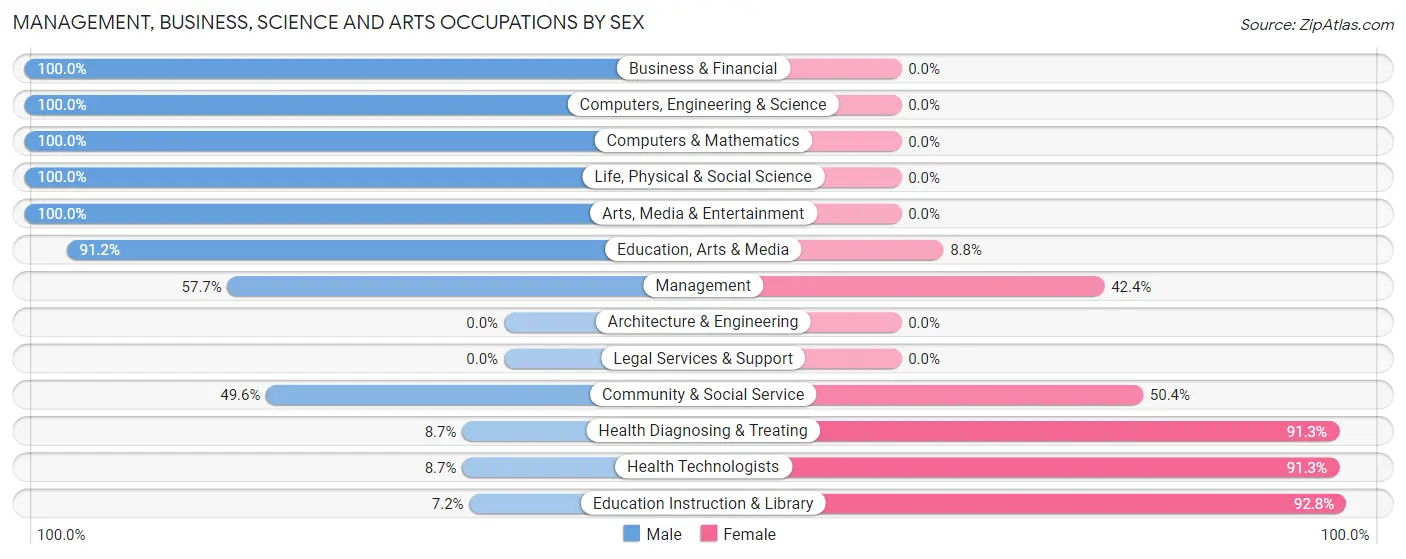
Management, Business, Science and Arts Occupations by Sex
Within the Management, Business, Science and Arts occupations in St Leo, the most male-oriented occupations are Business & Financial (100.0%), Computers, Engineering & Science (100.0%), and Computers & Mathematics (100.0%), while the most female-oriented occupations are Education Instruction & Library (92.8%), Health Diagnosing & Treating (91.3%), and Health Technologists (91.3%).
| Occupation | Male | Female |
| Management | 49 (57.7%) | 36 (42.3%) |
| Business & Financial | 9 (100.0%) | 0 (0.0%) |
| Computers, Engineering & Science | 35 (100.0%) | 0 (0.0%) |
| Computers & Mathematics | 16 (100.0%) | 0 (0.0%) |
| Architecture & Engineering | 0 (0.0%) | 0 (0.0%) |
| Life, Physical & Social Science | 19 (100.0%) | 0 (0.0%) |
| Community & Social Service | 119 (49.6%) | 121 (50.4%) |
| Education, Arts & Media | 52 (91.2%) | 5 (8.8%) |
| Legal Services & Support | 0 (0.0%) | 0 (0.0%) |
| Education Instruction & Library | 9 (7.2%) | 116 (92.8%) |
| Arts, Media & Entertainment | 58 (100.0%) | 0 (0.0%) |
| Health Diagnosing & Treating | 2 (8.7%) | 21 (91.3%) |
| Health Technologists | 2 (8.7%) | 21 (91.3%) |
| Total (Category) | 214 (54.6%) | 178 (45.4%) |
| Total (Overall) | 501 (57.9%) | 364 (42.1%) |
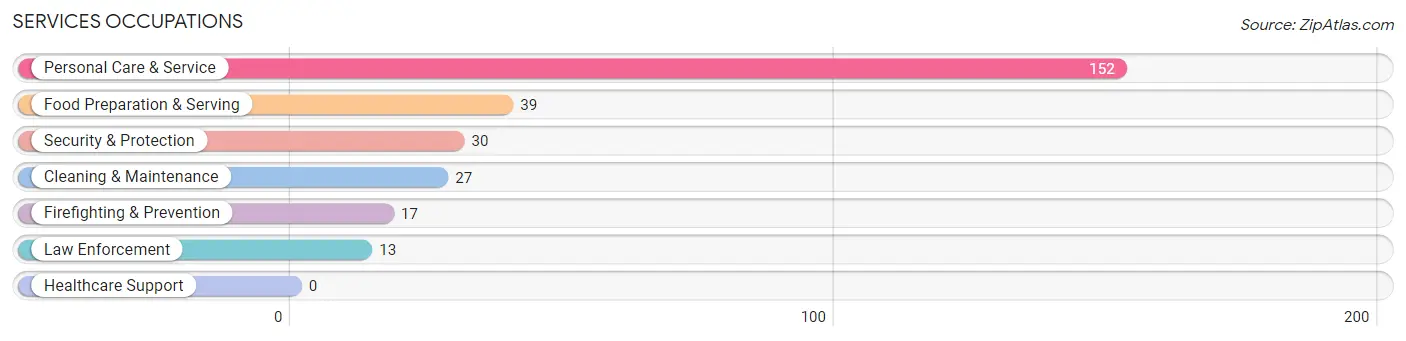
Services Occupations
The most common Services occupations in St Leo are Personal Care & Service (152 | 17.6%), Food Preparation & Serving (39 | 4.5%), Security & Protection (30 | 3.5%), Cleaning & Maintenance (27 | 3.1%), and Firefighting & Prevention (17 | 2.0%).
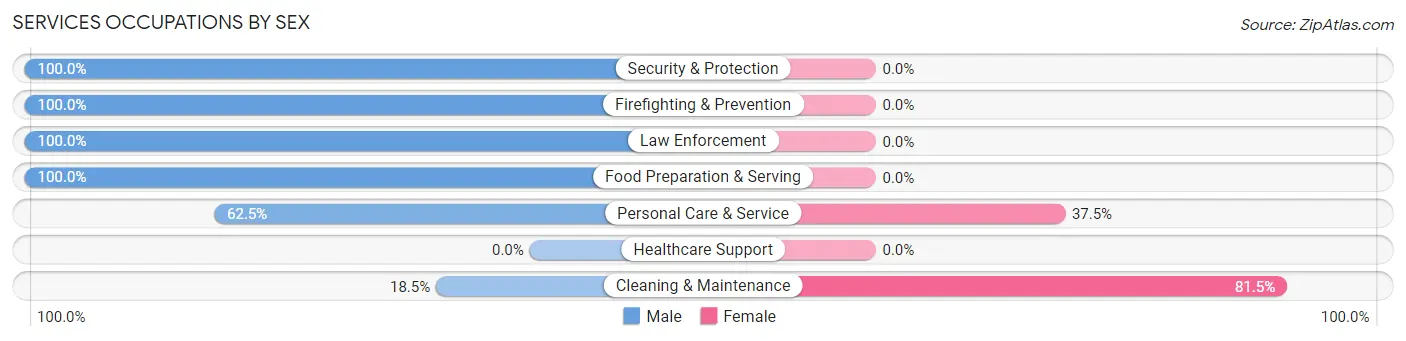
Services Occupations by Sex
Within the Services occupations in St Leo, the most male-oriented occupations are Security & Protection (100.0%), Firefighting & Prevention (100.0%), and Law Enforcement (100.0%), while the most female-oriented occupations are Cleaning & Maintenance (81.5%), and Personal Care & Service (37.5%).
| Occupation | Male | Female |
| Healthcare Support | 0 (0.0%) | 0 (0.0%) |
| Security & Protection | 30 (100.0%) | 0 (0.0%) |
| Firefighting & Prevention | 17 (100.0%) | 0 (0.0%) |
| Law Enforcement | 13 (100.0%) | 0 (0.0%) |
| Food Preparation & Serving | 39 (100.0%) | 0 (0.0%) |
| Cleaning & Maintenance | 5 (18.5%) | 22 (81.5%) |
| Personal Care & Service | 95 (62.5%) | 57 (37.5%) |
| Total (Category) | 169 (68.1%) | 79 (31.9%) |
| Total (Overall) | 501 (57.9%) | 364 (42.1%) |
Sales and Office Occupations
The most common Sales and Office occupations in St Leo are Sales & Related (92 | 10.6%), and Office & Administration (72 | 8.3%).
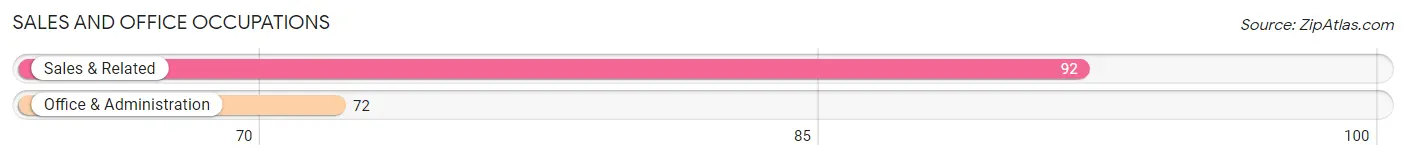
Sales and Office Occupations by Sex
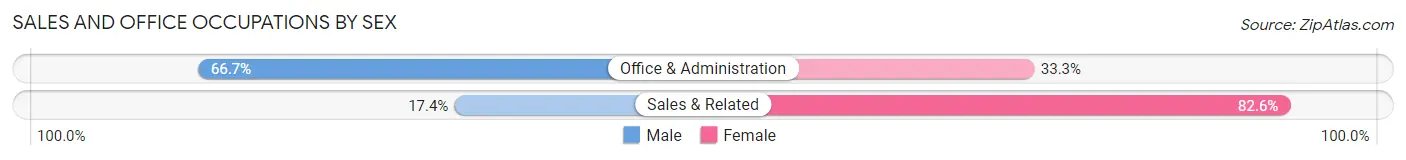
| Occupation | Male | Female |
| Sales & Related | 16 (17.4%) | 76 (82.6%) |
| Office & Administration | 48 (66.7%) | 24 (33.3%) |
| Total (Category) | 64 (39.0%) | 100 (61.0%) |
| Total (Overall) | 501 (57.9%) | 364 (42.1%) |
Natural Resources, Construction and Maintenance Occupations
The most common Natural Resources, Construction and Maintenance occupations in St Leo are , and Construction & Extraction (15 | 1.7%).
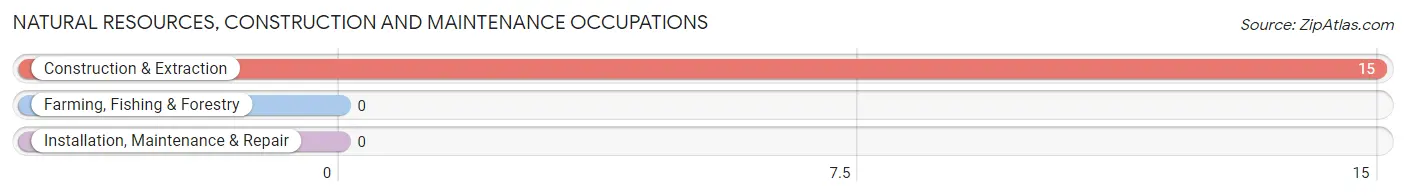
Natural Resources, Construction and Maintenance Occupations by Sex
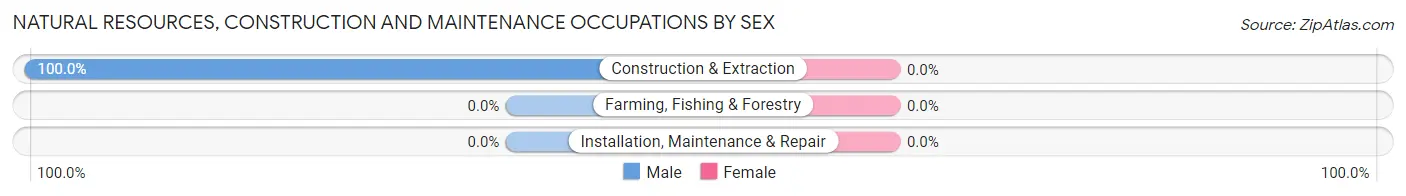
| Occupation | Male | Female |
| Farming, Fishing & Forestry | 0 (0.0%) | 0 (0.0%) |
| Construction & Extraction | 15 (100.0%) | 0 (0.0%) |
| Installation, Maintenance & Repair | 0 (0.0%) | 0 (0.0%) |
| Total (Category) | 15 (100.0%) | 0 (0.0%) |
| Total (Overall) | 501 (57.9%) | 364 (42.1%) |
Production, Transportation and Moving Occupations
The most common Production, Transportation and Moving occupations in St Leo are Material Moving (26 | 3.0%), and Transportation (20 | 2.3%).
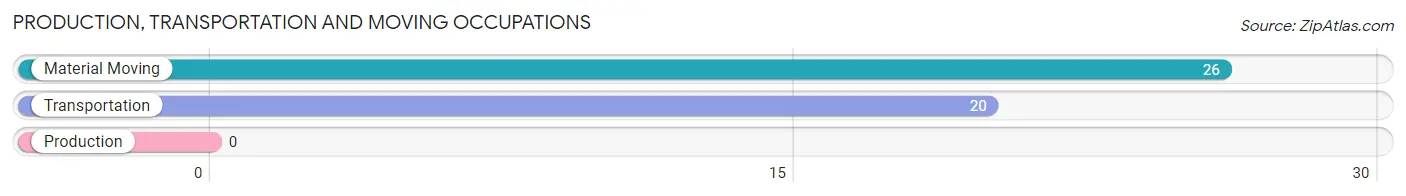
Production, Transportation and Moving Occupations by Sex
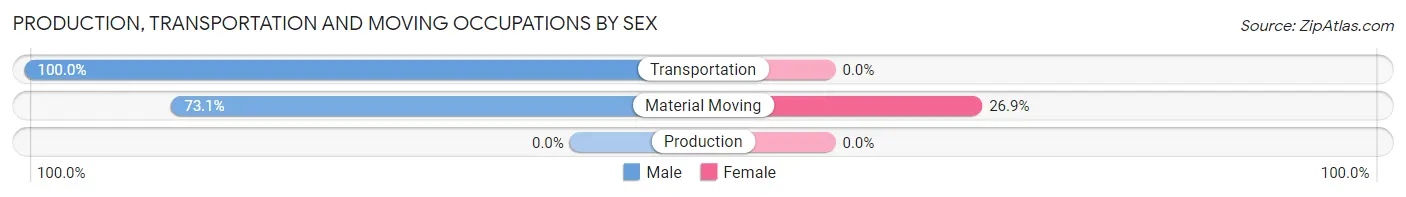
| Occupation | Male | Female |
| Production | 0 (0.0%) | 0 (0.0%) |
| Transportation | 20 (100.0%) | 0 (0.0%) |
| Material Moving | 19 (73.1%) | 7 (26.9%) |
| Total (Category) | 39 (84.8%) | 7 (15.2%) |
| Total (Overall) | 501 (57.9%) | 364 (42.1%) |
Employment Industries by Sex in St Leo
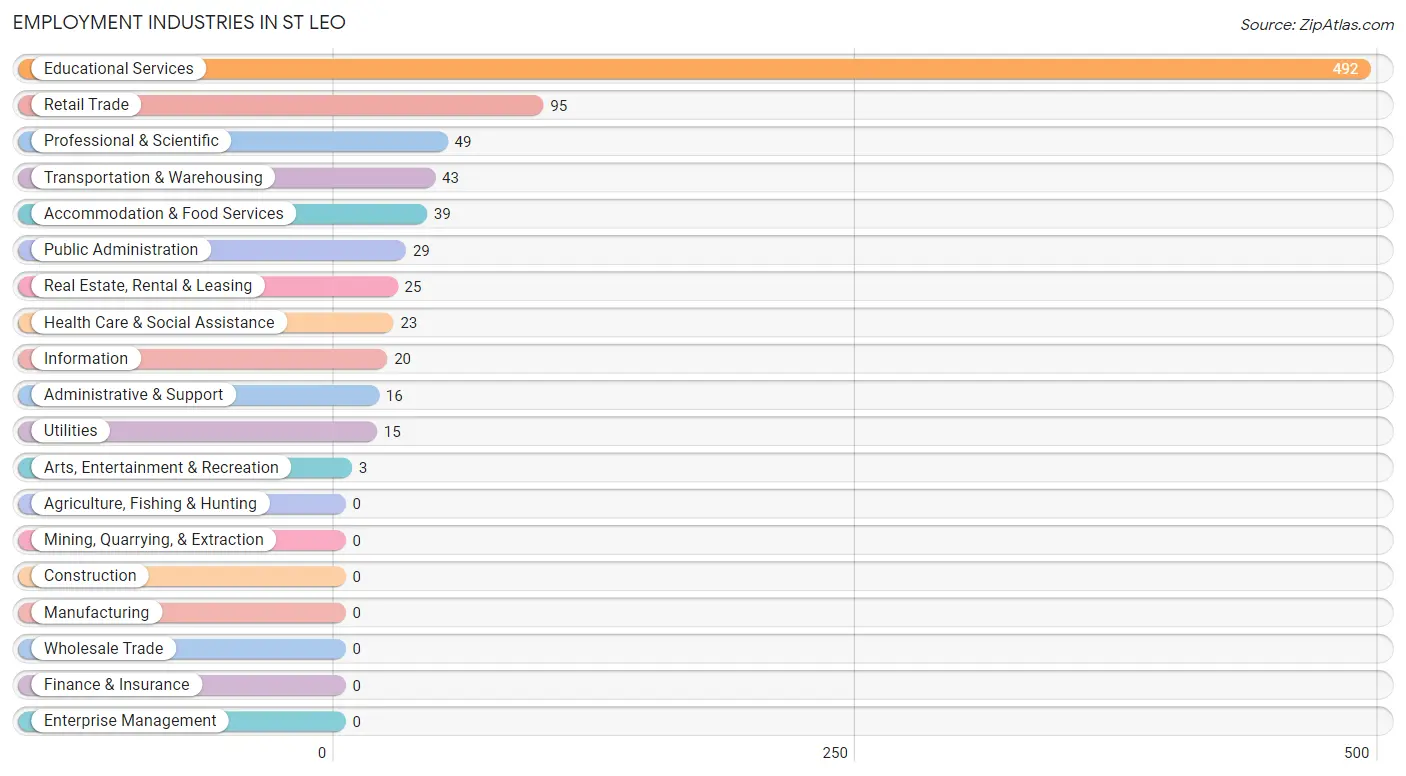
Employment Industries in St Leo
The major employment industries in St Leo include Educational Services (492 | 56.9%), Retail Trade (95 | 11.0%), Professional & Scientific (49 | 5.7%), Transportation & Warehousing (43 | 5.0%), and Accommodation & Food Services (39 | 4.5%).
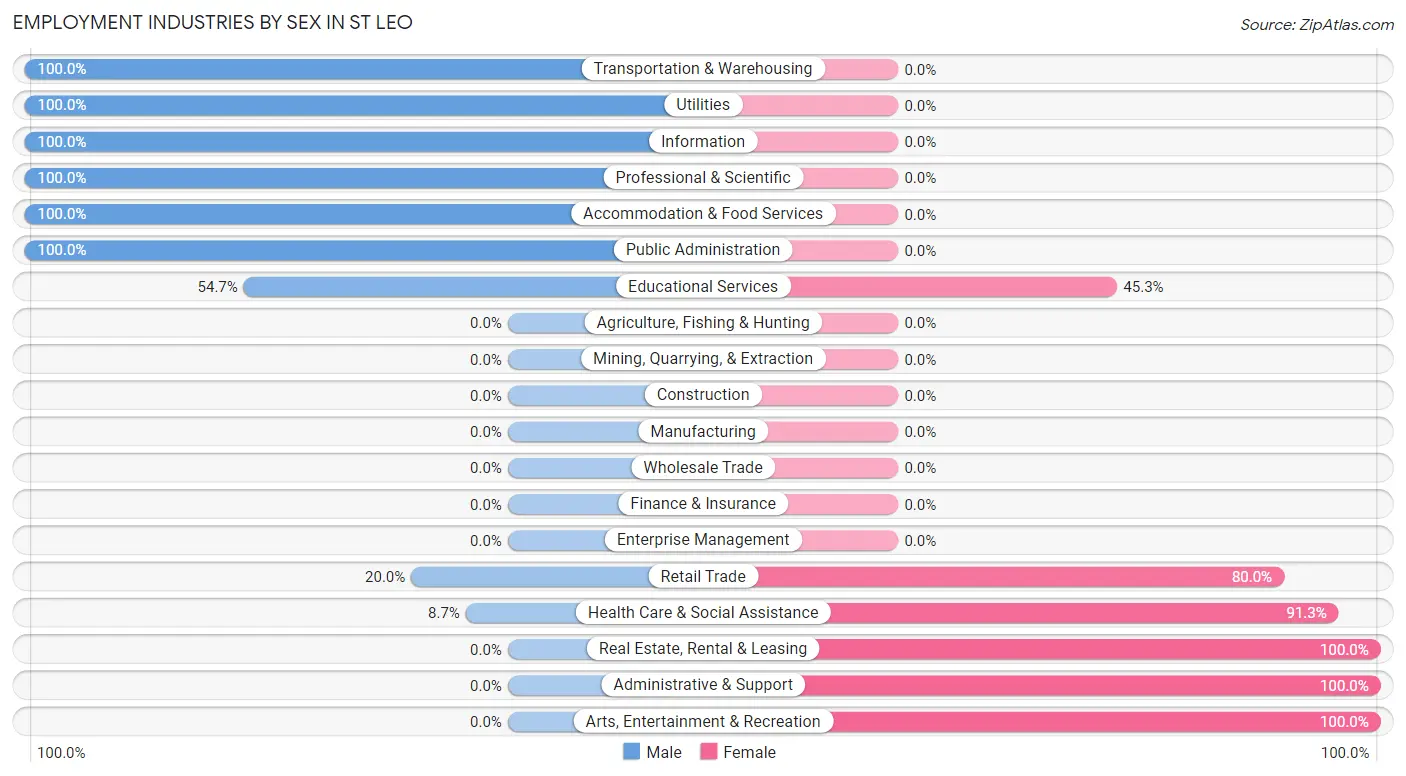
Employment Industries by Sex in St Leo
The St Leo industries that see more men than women are Transportation & Warehousing (100.0%), Utilities (100.0%), and Information (100.0%), whereas the industries that tend to have a higher number of women are Real Estate, Rental & Leasing (100.0%), Administrative & Support (100.0%), and Arts, Entertainment & Recreation (100.0%).
| Industry | Male | Female |
| Agriculture, Fishing & Hunting | 0 (0.0%) | 0 (0.0%) |
| Mining, Quarrying, & Extraction | 0 (0.0%) | 0 (0.0%) |
| Construction | 0 (0.0%) | 0 (0.0%) |
| Manufacturing | 0 (0.0%) | 0 (0.0%) |
| Wholesale Trade | 0 (0.0%) | 0 (0.0%) |
| Retail Trade | 19 (20.0%) | 76 (80.0%) |
| Transportation & Warehousing | 43 (100.0%) | 0 (0.0%) |
| Utilities | 15 (100.0%) | 0 (0.0%) |
| Information | 20 (100.0%) | 0 (0.0%) |
| Finance & Insurance | 0 (0.0%) | 0 (0.0%) |
| Real Estate, Rental & Leasing | 0 (0.0%) | 25 (100.0%) |
| Professional & Scientific | 49 (100.0%) | 0 (0.0%) |
| Enterprise Management | 0 (0.0%) | 0 (0.0%) |
| Administrative & Support | 0 (0.0%) | 16 (100.0%) |
| Educational Services | 269 (54.7%) | 223 (45.3%) |
| Health Care & Social Assistance | 2 (8.7%) | 21 (91.3%) |
| Arts, Entertainment & Recreation | 0 (0.0%) | 3 (100.0%) |
| Accommodation & Food Services | 39 (100.0%) | 0 (0.0%) |
| Public Administration | 29 (100.0%) | 0 (0.0%) |
| Total | 501 (57.9%) | 364 (42.1%) |
Education in St Leo
School Enrollment in St Leo
The most common levels of schooling among the 1,873 students in St Leo are college / undergraduate (1,638 | 87.5%), elementary school (84 | 4.5%), and middle school (72 | 3.8%).
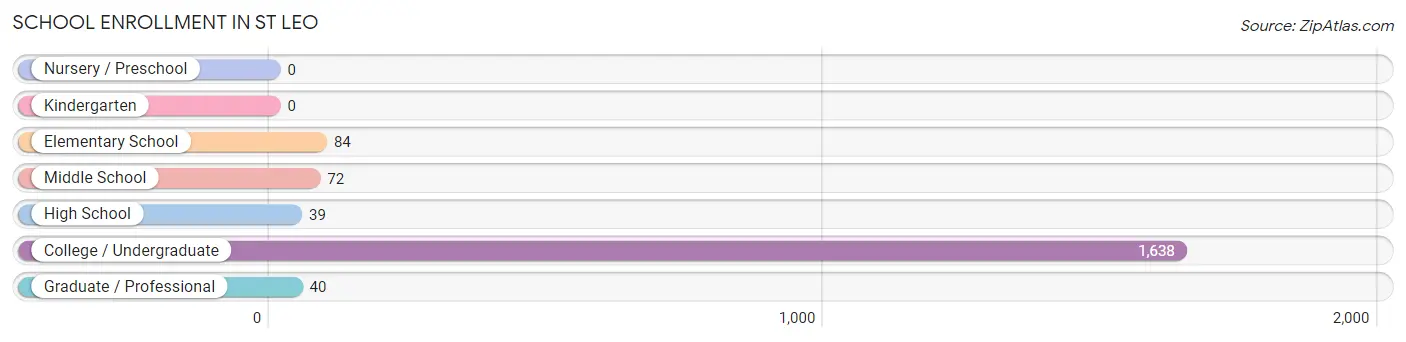
| School Level | # Students | % Students |
| Nursery / Preschool | 0 | 0.0% |
| Kindergarten | 0 | 0.0% |
| Elementary School | 84 | 4.5% |
| Middle School | 72 | 3.8% |
| High School | 39 | 2.1% |
| College / Undergraduate | 1,638 | 87.5% |
| Graduate / Professional | 40 | 2.1% |
| Total | 1,873 | 100.0% |
School Enrollment by Age by Funding Source in St Leo
Out of a total of 1,873 students who are enrolled in schools in St Leo, 1,504 (80.3%) attend a private institution, while the remaining 369 (19.7%) are enrolled in public schools. The age group of 25 to 34 year olds has the highest likelihood of being enrolled in private schools, with 32 (100.0% in the age bracket) enrolled. Conversely, the age group of 5 to 9 year old has the lowest likelihood of being enrolled in a private school, with 67 (100.0% in the age bracket) attending a public institution.
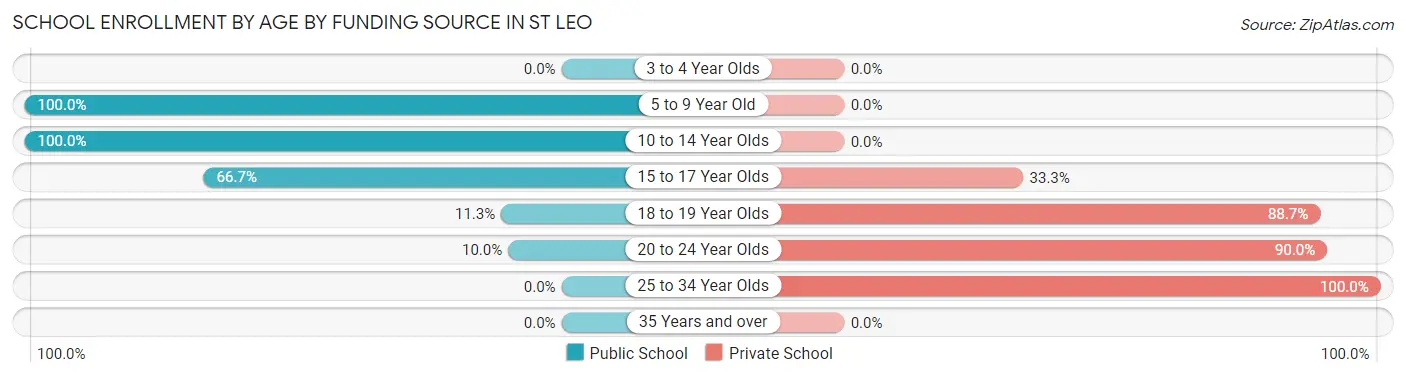
| Age Bracket | Public School | Private School |
| 3 to 4 Year Olds | 0 (0.0%) | 0 (0.0%) |
| 5 to 9 Year Old | 67 (100.0%) | 0 (0.0%) |
| 10 to 14 Year Olds | 102 (100.0%) | 0 (0.0%) |
| 15 to 17 Year Olds | 26 (66.7%) | 13 (33.3%) |
| 18 to 19 Year Olds | 98 (11.3%) | 772 (88.7%) |
| 20 to 24 Year Olds | 76 (10.0%) | 687 (90.0%) |
| 25 to 34 Year Olds | 0 (0.0%) | 32 (100.0%) |
| 35 Years and over | 0 (0.0%) | 0 (0.0%) |
| Total | 369 (19.7%) | 1,504 (80.3%) |
Educational Attainment by Field of Study in St Leo
Science & technology (51 | 20.0%), liberal arts & history (51 | 20.0%), physical & health sciences (44 | 17.2%), business (28 | 11.0%), and education (26 | 10.2%) are the most common fields of study among 255 individuals in St Leo who have obtained a bachelor's degree or higher.
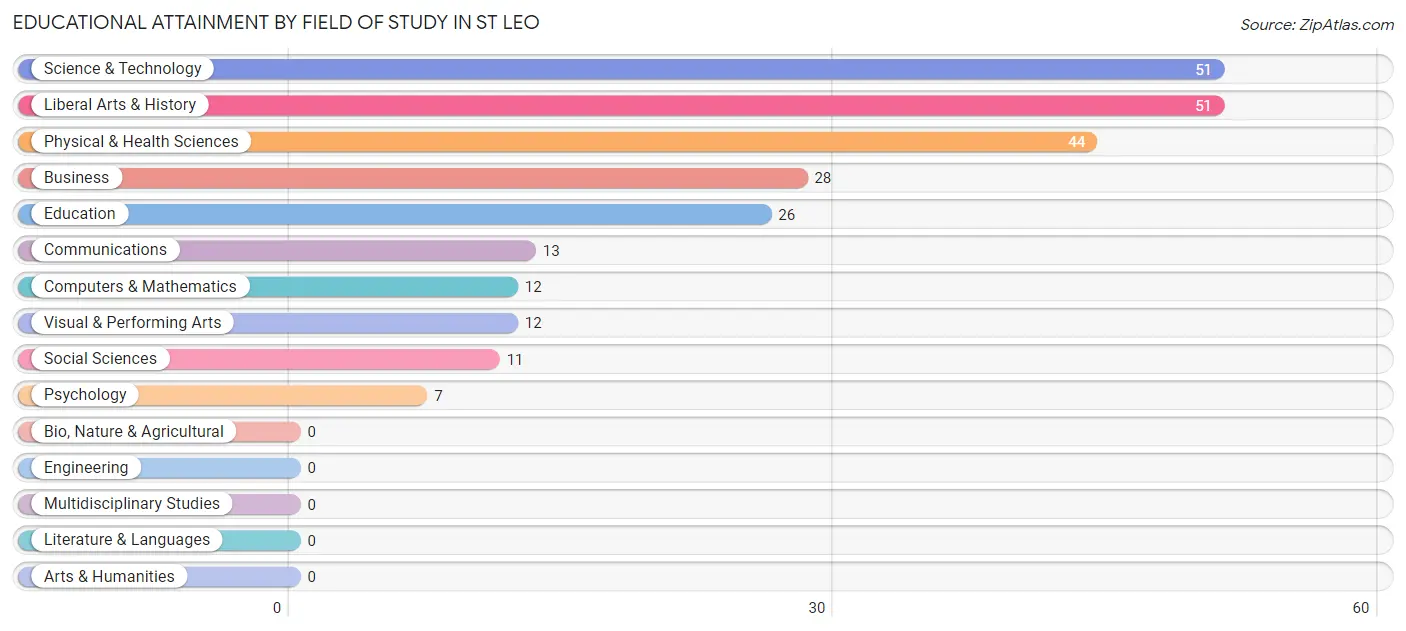
| Field of Study | # Graduates | % Graduates |
| Computers & Mathematics | 12 | 4.7% |
| Bio, Nature & Agricultural | 0 | 0.0% |
| Physical & Health Sciences | 44 | 17.2% |
| Psychology | 7 | 2.8% |
| Social Sciences | 11 | 4.3% |
| Engineering | 0 | 0.0% |
| Multidisciplinary Studies | 0 | 0.0% |
| Science & Technology | 51 | 20.0% |
| Business | 28 | 11.0% |
| Education | 26 | 10.2% |
| Literature & Languages | 0 | 0.0% |
| Liberal Arts & History | 51 | 20.0% |
| Visual & Performing Arts | 12 | 4.7% |
| Communications | 13 | 5.1% |
| Arts & Humanities | 0 | 0.0% |
| Total | 255 | 100.0% |
Transportation & Commute in St Leo
Vehicle Availability by Sex in St Leo
The most prevalent vehicle ownership categories in St Leo are males with 4 vehicles (64, accounting for 43.2%) and females with 4 vehicles (62, making up 39.3%).
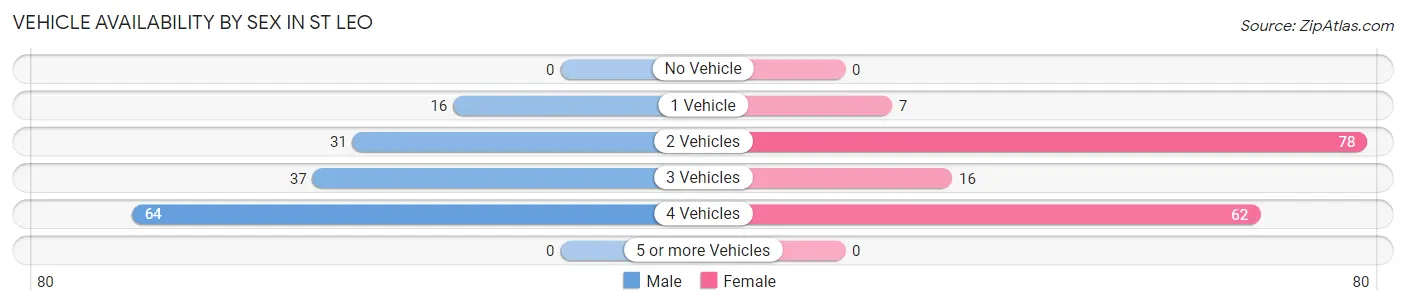
| Vehicles Available | Male | Female |
| No Vehicle | 0 (0.0%) | 0 (0.0%) |
| 1 Vehicle | 16 (10.8%) | 7 (4.3%) |
| 2 Vehicles | 31 (20.9%) | 78 (47.8%) |
| 3 Vehicles | 37 (25.0%) | 16 (9.8%) |
| 4 Vehicles | 64 (43.2%) | 62 (38.0%) |
| 5 or more Vehicles | 0 (0.0%) | 0 (0.0%) |
| Total | 148 (100.0%) | 163 (100.0%) |
Commute Time in St Leo
The most frequently occuring commute durations in St Leo are less than 5 minutes (135 commuters, 21.8%), 10 to 14 minutes (114 commuters, 18.4%), and 5 to 9 minutes (87 commuters, 14.1%).
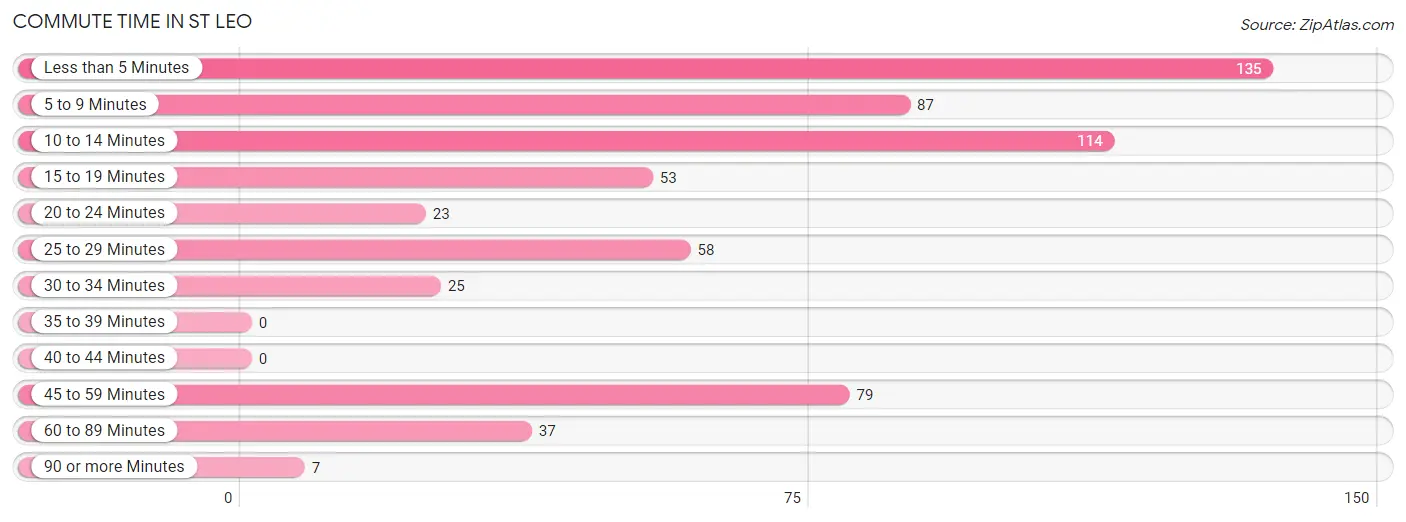
| Commute Time | # Commuters | % Commuters |
| Less than 5 Minutes | 135 | 21.8% |
| 5 to 9 Minutes | 87 | 14.1% |
| 10 to 14 Minutes | 114 | 18.4% |
| 15 to 19 Minutes | 53 | 8.6% |
| 20 to 24 Minutes | 23 | 3.7% |
| 25 to 29 Minutes | 58 | 9.4% |
| 30 to 34 Minutes | 25 | 4.1% |
| 35 to 39 Minutes | 0 | 0.0% |
| 40 to 44 Minutes | 0 | 0.0% |
| 45 to 59 Minutes | 79 | 12.8% |
| 60 to 89 Minutes | 37 | 6.0% |
| 90 or more Minutes | 7 | 1.1% |
Commute Time by Sex in St Leo
The most common commute times in St Leo are 10 to 14 minutes (77 commuters, 21.0%) for males and less than 5 minutes (108 commuters, 43.0%) for females.
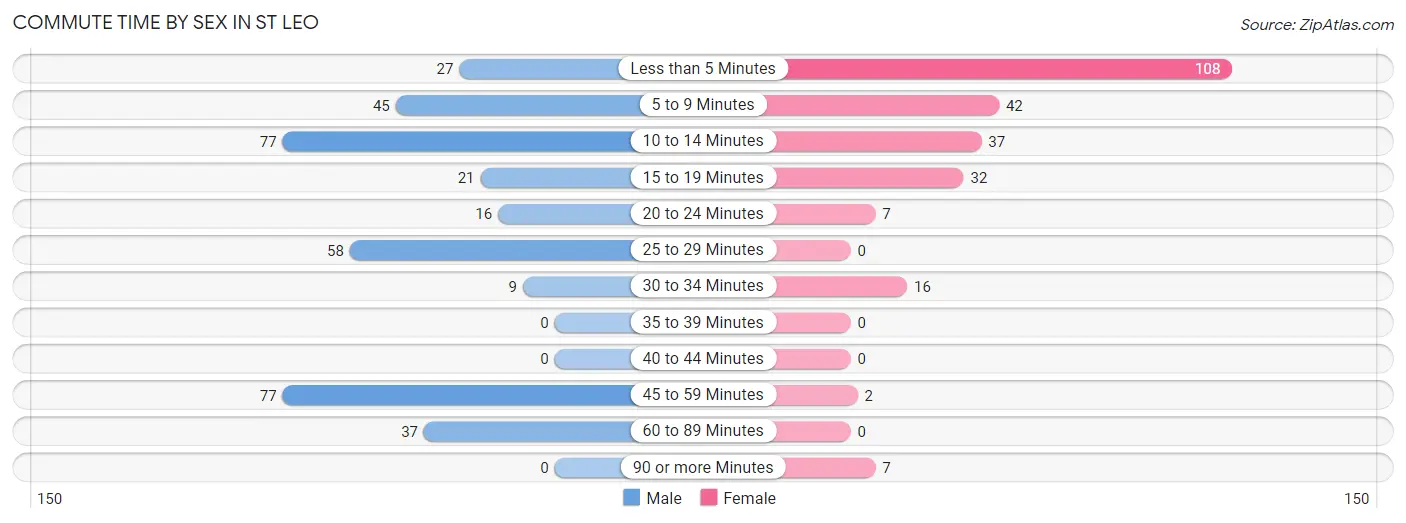
| Commute Time | Male | Female |
| Less than 5 Minutes | 27 (7.4%) | 108 (43.0%) |
| 5 to 9 Minutes | 45 (12.3%) | 42 (16.7%) |
| 10 to 14 Minutes | 77 (21.0%) | 37 (14.7%) |
| 15 to 19 Minutes | 21 (5.7%) | 32 (12.8%) |
| 20 to 24 Minutes | 16 (4.4%) | 7 (2.8%) |
| 25 to 29 Minutes | 58 (15.8%) | 0 (0.0%) |
| 30 to 34 Minutes | 9 (2.5%) | 16 (6.4%) |
| 35 to 39 Minutes | 0 (0.0%) | 0 (0.0%) |
| 40 to 44 Minutes | 0 (0.0%) | 0 (0.0%) |
| 45 to 59 Minutes | 77 (21.0%) | 2 (0.8%) |
| 60 to 89 Minutes | 37 (10.1%) | 0 (0.0%) |
| 90 or more Minutes | 0 (0.0%) | 7 (2.8%) |
Time of Departure to Work by Sex in St Leo
The most frequent times of departure to work in St Leo are 4:00 PM to 11:59 PM (122, 33.2%) for males and 12:00 PM to 3:59 PM (54, 21.5%) for females.
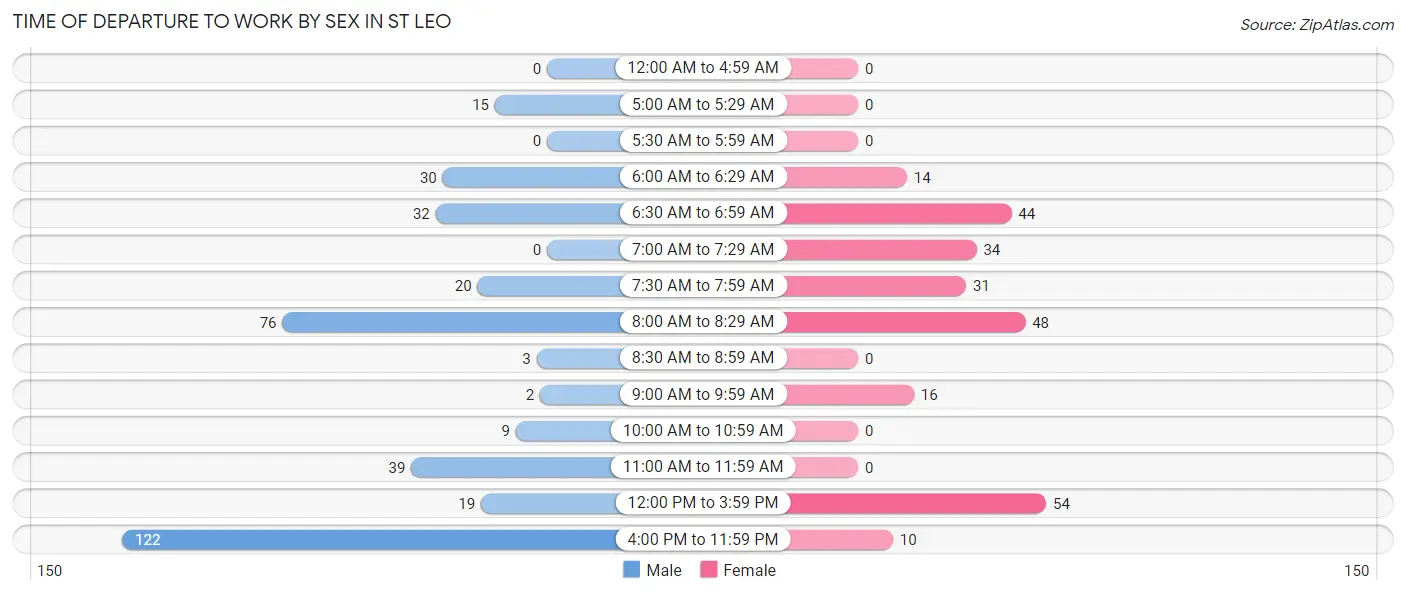
| Time of Departure | Male | Female |
| 12:00 AM to 4:59 AM | 0 (0.0%) | 0 (0.0%) |
| 5:00 AM to 5:29 AM | 15 (4.1%) | 0 (0.0%) |
| 5:30 AM to 5:59 AM | 0 (0.0%) | 0 (0.0%) |
| 6:00 AM to 6:29 AM | 30 (8.2%) | 14 (5.6%) |
| 6:30 AM to 6:59 AM | 32 (8.7%) | 44 (17.5%) |
| 7:00 AM to 7:29 AM | 0 (0.0%) | 34 (13.6%) |
| 7:30 AM to 7:59 AM | 20 (5.4%) | 31 (12.3%) |
| 8:00 AM to 8:29 AM | 76 (20.7%) | 48 (19.1%) |
| 8:30 AM to 8:59 AM | 3 (0.8%) | 0 (0.0%) |
| 9:00 AM to 9:59 AM | 2 (0.5%) | 16 (6.4%) |
| 10:00 AM to 10:59 AM | 9 (2.5%) | 0 (0.0%) |
| 11:00 AM to 11:59 AM | 39 (10.6%) | 0 (0.0%) |
| 12:00 PM to 3:59 PM | 19 (5.2%) | 54 (21.5%) |
| 4:00 PM to 11:59 PM | 122 (33.2%) | 10 (4.0%) |
| Total | 367 (100.0%) | 251 (100.0%) |
Housing Occupancy in St Leo
Occupancy by Ownership in St Leo
Of the total 308 dwellings in St Leo, owner-occupied units account for 285 (92.5%), while renter-occupied units make up 23 (7.5%).
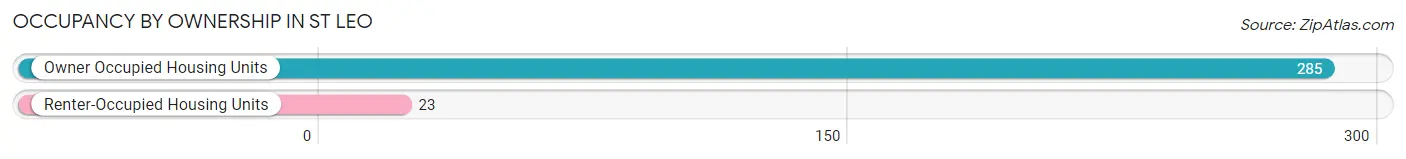
| Occupancy | # Housing Units | % Housing Units |
| Owner Occupied Housing Units | 285 | 92.5% |
| Renter-Occupied Housing Units | 23 | 7.5% |
| Total Occupied Housing Units | 308 | 100.0% |
Occupancy by Household Size in St Leo
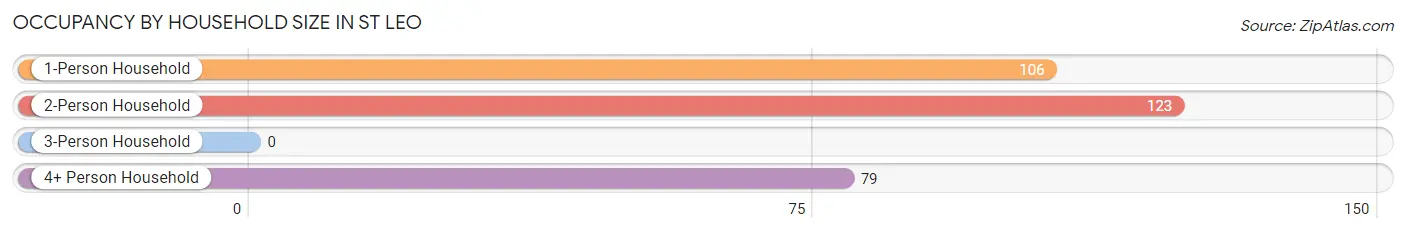
| Household Size | # Housing Units | % Housing Units |
| 1-Person Household | 106 | 34.4% |
| 2-Person Household | 123 | 39.9% |
| 3-Person Household | 0 | 0.0% |
| 4+ Person Household | 79 | 25.7% |
| Total Housing Units | 308 | 100.0% |
Occupancy by Ownership by Household Size in St Leo
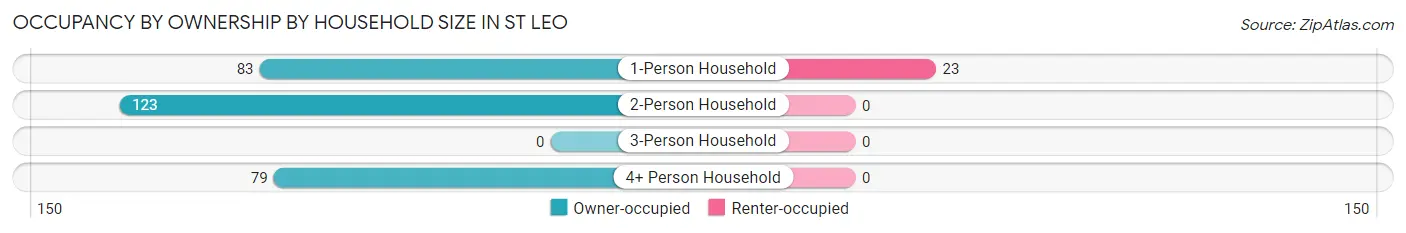
| Household Size | Owner-occupied | Renter-occupied |
| 1-Person Household | 83 (78.3%) | 23 (21.7%) |
| 2-Person Household | 123 (100.0%) | 0 (0.0%) |
| 3-Person Household | 0 (0.0%) | 0 (0.0%) |
| 4+ Person Household | 79 (100.0%) | 0 (0.0%) |
| Total Housing Units | 285 (92.5%) | 23 (7.5%) |
Occupancy by Educational Attainment in St Leo
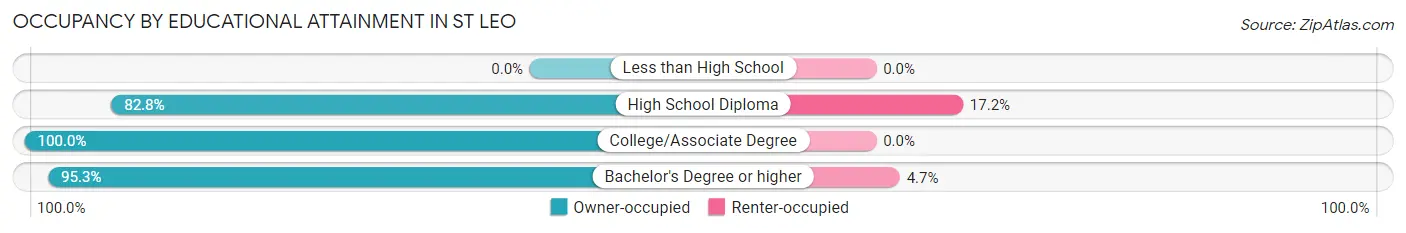
| Household Size | Owner-occupied | Renter-occupied |
| Less than High School | 0 (0.0%) | 0 (0.0%) |
| High School Diploma | 77 (82.8%) | 16 (17.2%) |
| College/Associate Degree | 65 (100.0%) | 0 (0.0%) |
| Bachelor's Degree or higher | 143 (95.3%) | 7 (4.7%) |
Occupancy by Age of Householder in St Leo
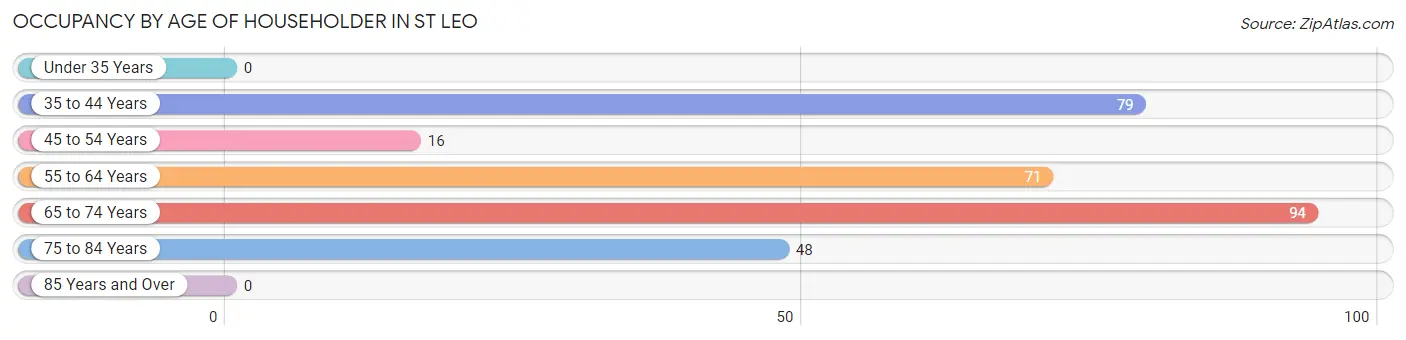
| Age Bracket | # Households | % Households |
| Under 35 Years | 0 | 0.0% |
| 35 to 44 Years | 79 | 25.7% |
| 45 to 54 Years | 16 | 5.2% |
| 55 to 64 Years | 71 | 23.1% |
| 65 to 74 Years | 94 | 30.5% |
| 75 to 84 Years | 48 | 15.6% |
| 85 Years and Over | 0 | 0.0% |
| Total | 308 | 100.0% |
Housing Finances in St Leo
Median Income by Occupancy in St Leo
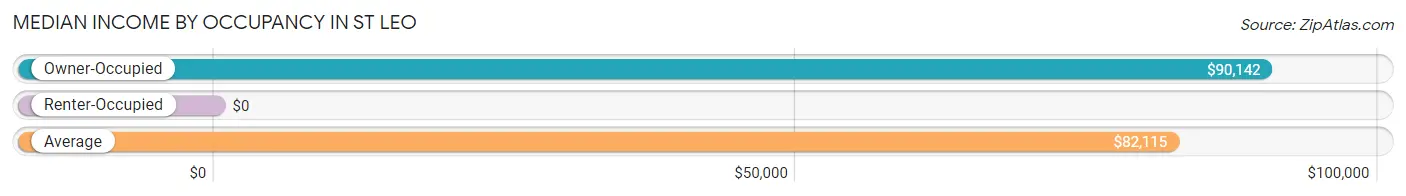
| Occupancy Type | # Households | Median Income |
| Owner-Occupied | 285 (92.5%) | $90,142 |
| Renter-Occupied | 23 (7.5%) | $0 |
| Average | 308 (100.0%) | $82,115 |
Occupancy by Householder Income Bracket in St Leo
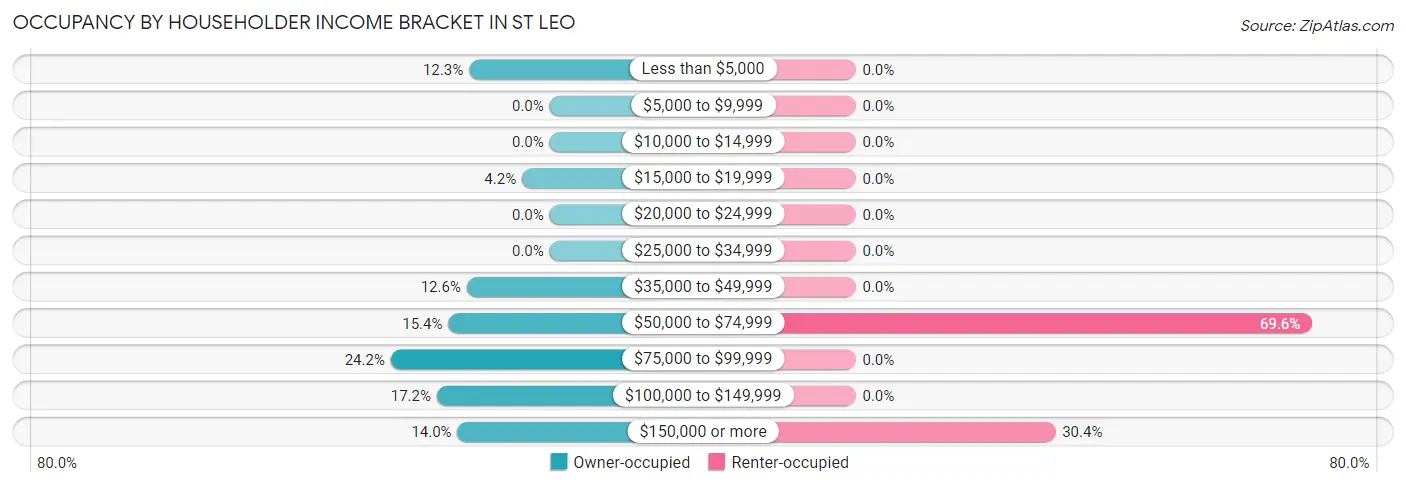
| Income Bracket | Owner-occupied | Renter-occupied |
| Less than $5,000 | 35 (12.3%) | 0 (0.0%) |
| $5,000 to $9,999 | 0 (0.0%) | 0 (0.0%) |
| $10,000 to $14,999 | 0 (0.0%) | 0 (0.0%) |
| $15,000 to $19,999 | 12 (4.2%) | 0 (0.0%) |
| $20,000 to $24,999 | 0 (0.0%) | 0 (0.0%) |
| $25,000 to $34,999 | 0 (0.0%) | 0 (0.0%) |
| $35,000 to $49,999 | 36 (12.6%) | 0 (0.0%) |
| $50,000 to $74,999 | 44 (15.4%) | 16 (69.6%) |
| $75,000 to $99,999 | 69 (24.2%) | 0 (0.0%) |
| $100,000 to $149,999 | 49 (17.2%) | 0 (0.0%) |
| $150,000 or more | 40 (14.0%) | 7 (30.4%) |
| Total | 285 (100.0%) | 23 (100.0%) |
Monthly Housing Cost Tiers in St Leo
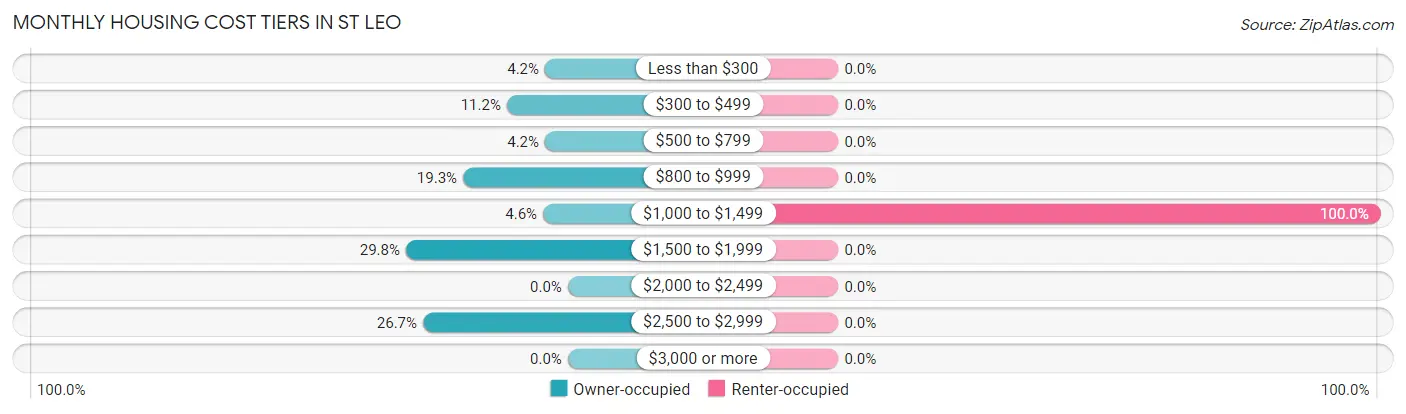
| Monthly Cost | Owner-occupied | Renter-occupied |
| Less than $300 | 12 (4.2%) | 0 (0.0%) |
| $300 to $499 | 32 (11.2%) | 0 (0.0%) |
| $500 to $799 | 12 (4.2%) | 0 (0.0%) |
| $800 to $999 | 55 (19.3%) | 0 (0.0%) |
| $1,000 to $1,499 | 13 (4.6%) | 23 (100.0%) |
| $1,500 to $1,999 | 85 (29.8%) | 0 (0.0%) |
| $2,000 to $2,499 | 0 (0.0%) | 0 (0.0%) |
| $2,500 to $2,999 | 76 (26.7%) | 0 (0.0%) |
| $3,000 or more | 0 (0.0%) | 0 (0.0%) |
| Total | 285 (100.0%) | 23 (100.0%) |
Physical Housing Characteristics in St Leo
Housing Structures in St Leo
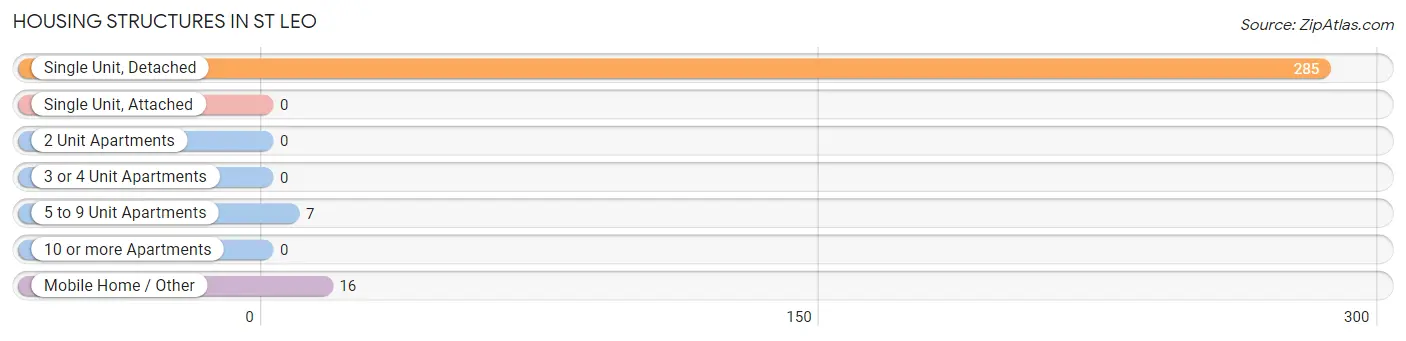
| Structure Type | # Housing Units | % Housing Units |
| Single Unit, Detached | 285 | 92.5% |
| Single Unit, Attached | 0 | 0.0% |
| 2 Unit Apartments | 0 | 0.0% |
| 3 or 4 Unit Apartments | 0 | 0.0% |
| 5 to 9 Unit Apartments | 7 | 2.3% |
| 10 or more Apartments | 0 | 0.0% |
| Mobile Home / Other | 16 | 5.2% |
| Total | 308 | 100.0% |
Housing Structures by Occupancy in St Leo
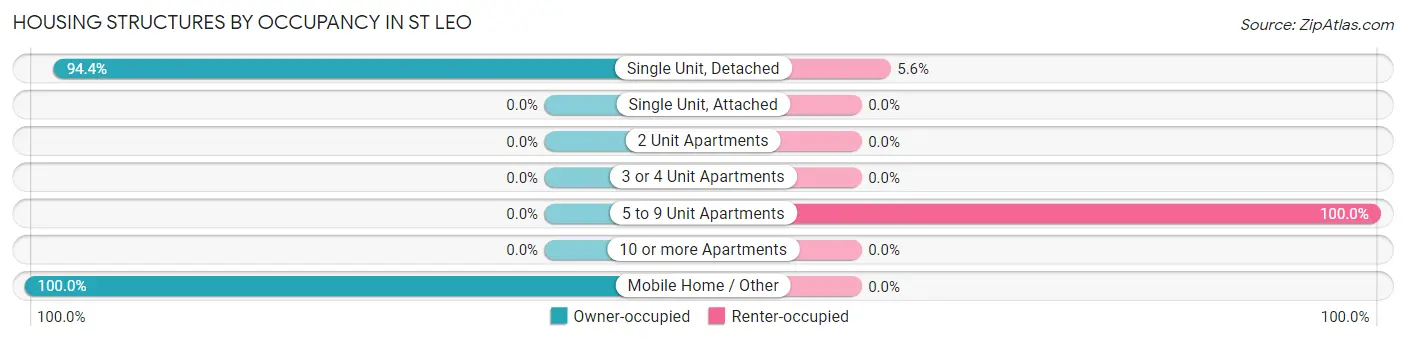
| Structure Type | Owner-occupied | Renter-occupied |
| Single Unit, Detached | 269 (94.4%) | 16 (5.6%) |
| Single Unit, Attached | 0 (0.0%) | 0 (0.0%) |
| 2 Unit Apartments | 0 (0.0%) | 0 (0.0%) |
| 3 or 4 Unit Apartments | 0 (0.0%) | 0 (0.0%) |
| 5 to 9 Unit Apartments | 0 (0.0%) | 7 (100.0%) |
| 10 or more Apartments | 0 (0.0%) | 0 (0.0%) |
| Mobile Home / Other | 16 (100.0%) | 0 (0.0%) |
| Total | 285 (92.5%) | 23 (7.5%) |
Housing Structures by Number of Rooms in St Leo
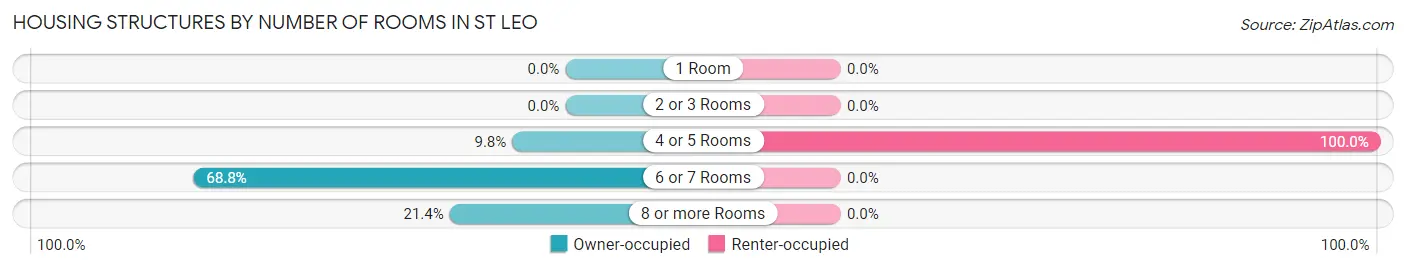
| Number of Rooms | Owner-occupied | Renter-occupied |
| 1 Room | 0 (0.0%) | 0 (0.0%) |
| 2 or 3 Rooms | 0 (0.0%) | 0 (0.0%) |
| 4 or 5 Rooms | 28 (9.8%) | 23 (100.0%) |
| 6 or 7 Rooms | 196 (68.8%) | 0 (0.0%) |
| 8 or more Rooms | 61 (21.4%) | 0 (0.0%) |
| Total | 285 (100.0%) | 23 (100.0%) |
Housing Structure by Heating Type in St Leo
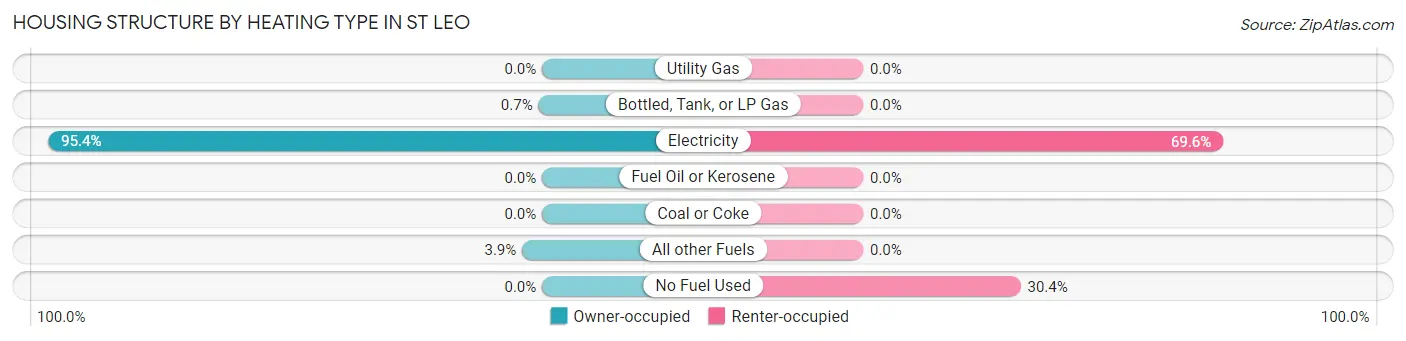
| Heating Type | Owner-occupied | Renter-occupied |
| Utility Gas | 0 (0.0%) | 0 (0.0%) |
| Bottled, Tank, or LP Gas | 2 (0.7%) | 0 (0.0%) |
| Electricity | 272 (95.4%) | 16 (69.6%) |
| Fuel Oil or Kerosene | 0 (0.0%) | 0 (0.0%) |
| Coal or Coke | 0 (0.0%) | 0 (0.0%) |
| All other Fuels | 11 (3.9%) | 0 (0.0%) |
| No Fuel Used | 0 (0.0%) | 7 (30.4%) |
| Total | 285 (100.0%) | 23 (100.0%) |
Household Vehicle Usage in St Leo
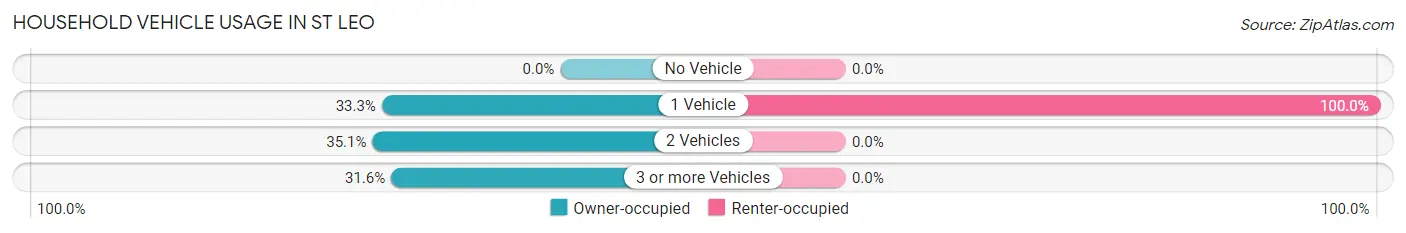
| Vehicles per Household | Owner-occupied | Renter-occupied |
| No Vehicle | 0 (0.0%) | 0 (0.0%) |
| 1 Vehicle | 95 (33.3%) | 23 (100.0%) |
| 2 Vehicles | 100 (35.1%) | 0 (0.0%) |
| 3 or more Vehicles | 90 (31.6%) | 0 (0.0%) |
| Total | 285 (100.0%) | 23 (100.0%) |
Real Estate & Mortgages in St Leo
Real Estate and Mortgage Overview in St Leo
| Characteristic | Without Mortgage | With Mortgage |
| Housing Units | 111 | 174 |
| Median Property Value | $362,500 | $418,800 |
| Median Household Income | $64,922 | $29 |
| Monthly Housing Costs | $696 | $0 |
| Real Estate Taxes | $4,205 | $0 |
Property Value by Mortgage Status in St Leo
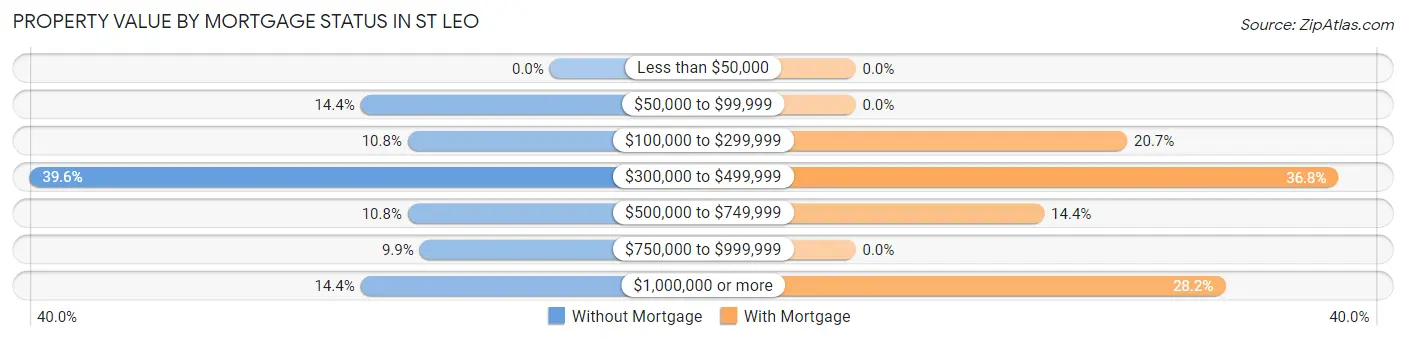
| Property Value | Without Mortgage | With Mortgage |
| Less than $50,000 | 0 (0.0%) | 0 (0.0%) |
| $50,000 to $99,999 | 16 (14.4%) | 0 (0.0%) |
| $100,000 to $299,999 | 12 (10.8%) | 36 (20.7%) |
| $300,000 to $499,999 | 44 (39.6%) | 64 (36.8%) |
| $500,000 to $749,999 | 12 (10.8%) | 25 (14.4%) |
| $750,000 to $999,999 | 11 (9.9%) | 0 (0.0%) |
| $1,000,000 or more | 16 (14.4%) | 49 (28.2%) |
| Total | 111 (100.0%) | 174 (100.0%) |
Household Income by Mortgage Status in St Leo
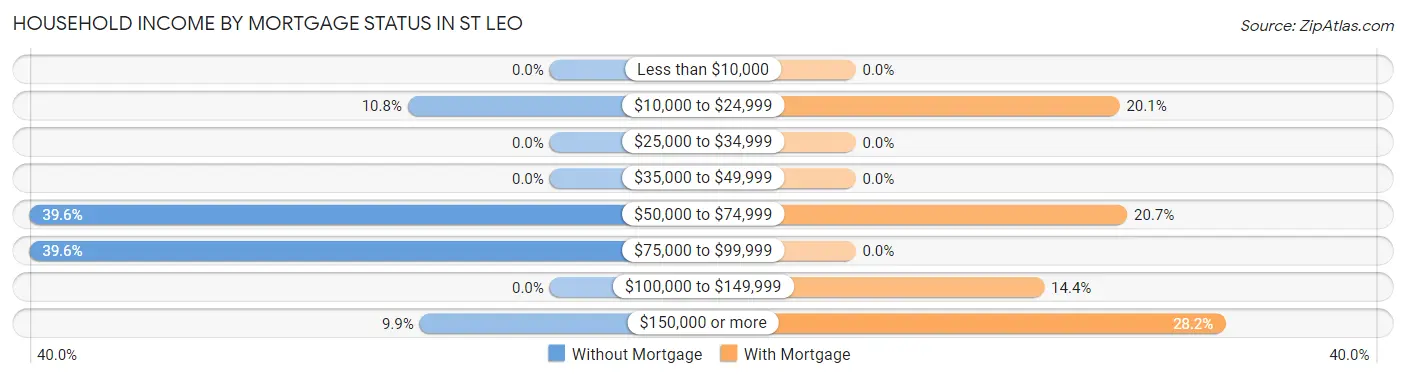
| Household Income | Without Mortgage | With Mortgage |
| Less than $10,000 | 0 (0.0%) | 0 (0.0%) |
| $10,000 to $24,999 | 12 (10.8%) | 35 (20.1%) |
| $25,000 to $34,999 | 0 (0.0%) | 0 (0.0%) |
| $35,000 to $49,999 | 0 (0.0%) | 0 (0.0%) |
| $50,000 to $74,999 | 44 (39.6%) | 36 (20.7%) |
| $75,000 to $99,999 | 44 (39.6%) | 0 (0.0%) |
| $100,000 to $149,999 | 0 (0.0%) | 25 (14.4%) |
| $150,000 or more | 11 (9.9%) | 49 (28.2%) |
| Total | 111 (100.0%) | 174 (100.0%) |
Property Value to Household Income Ratio in St Leo
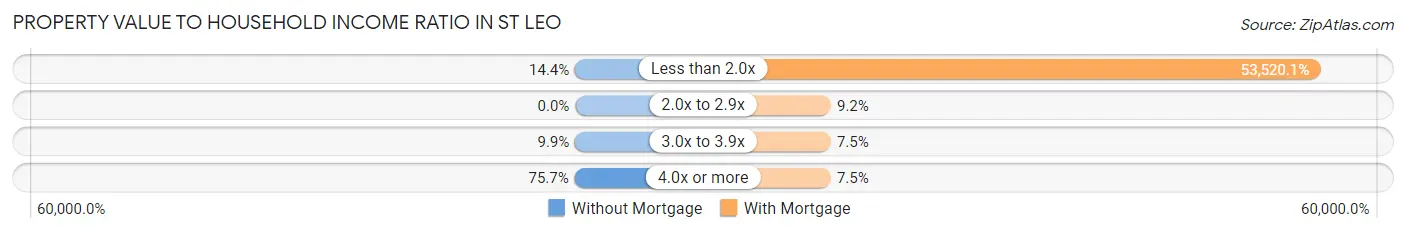
| Value-to-Income Ratio | Without Mortgage | With Mortgage |
| Less than 2.0x | 16 (14.4%) | 93,125 (53,520.1%) |
| 2.0x to 2.9x | 0 (0.0%) | 16 (9.2%) |
| 3.0x to 3.9x | 11 (9.9%) | 13 (7.5%) |
| 4.0x or more | 84 (75.7%) | 13 (7.5%) |
| Total | 111 (100.0%) | 174 (100.0%) |
Real Estate Taxes by Mortgage Status in St Leo
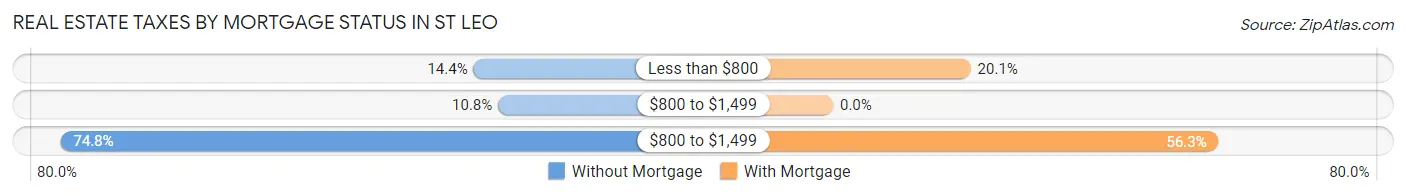
| Property Taxes | Without Mortgage | With Mortgage |
| Less than $800 | 16 (14.4%) | 35 (20.1%) |
| $800 to $1,499 | 12 (10.8%) | 0 (0.0%) |
| $800 to $1,499 | 83 (74.8%) | 98 (56.3%) |
| Total | 111 (100.0%) | 174 (100.0%) |
Health & Disability in St Leo
Health Insurance Coverage by Age in St Leo
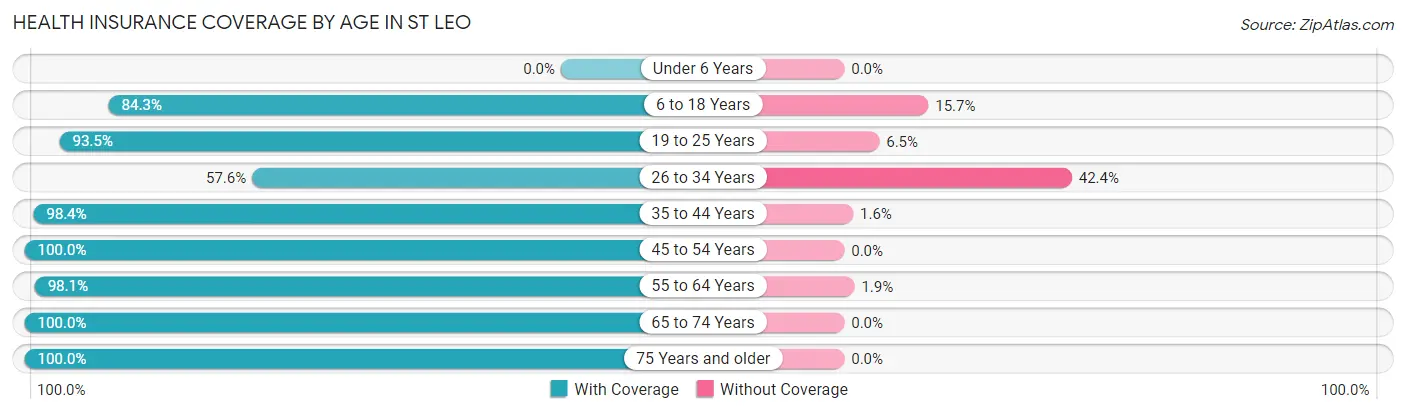
| Age Bracket | With Coverage | Without Coverage |
| Under 6 Years | 0 (0.0%) | 0 (0.0%) |
| 6 to 18 Years | 549 (84.3%) | 102 (15.7%) |
| 19 to 25 Years | 1,116 (93.5%) | 78 (6.5%) |
| 26 to 34 Years | 19 (57.6%) | 14 (42.4%) |
| 35 to 44 Years | 180 (98.4%) | 3 (1.6%) |
| 45 to 54 Years | 18 (100.0%) | 0 (0.0%) |
| 55 to 64 Years | 103 (98.1%) | 2 (1.9%) |
| 65 to 74 Years | 179 (100.0%) | 0 (0.0%) |
| 75 Years and older | 63 (100.0%) | 0 (0.0%) |
| Total | 2,227 (91.8%) | 199 (8.2%) |
Health Insurance Coverage by Citizenship Status in St Leo
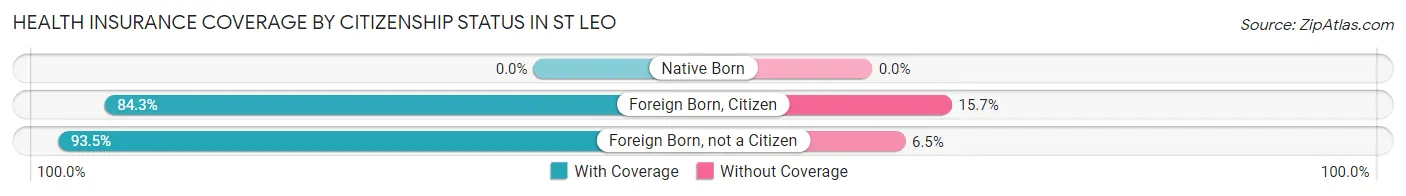
| Citizenship Status | With Coverage | Without Coverage |
| Native Born | 0 (0.0%) | 0 (0.0%) |
| Foreign Born, Citizen | 549 (84.3%) | 102 (15.7%) |
| Foreign Born, not a Citizen | 1,116 (93.5%) | 78 (6.5%) |
Health Insurance Coverage by Household Income in St Leo
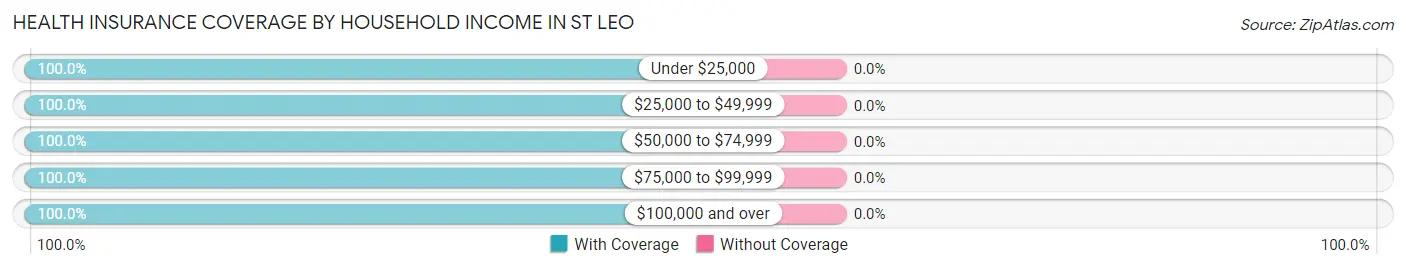
| Household Income | With Coverage | Without Coverage |
| Under $25,000 | 47 (100.0%) | 0 (0.0%) |
| $25,000 to $49,999 | 36 (100.0%) | 0 (0.0%) |
| $50,000 to $74,999 | 179 (100.0%) | 0 (0.0%) |
| $75,000 to $99,999 | 143 (100.0%) | 0 (0.0%) |
| $100,000 and over | 336 (100.0%) | 0 (0.0%) |
Public vs Private Health Insurance Coverage by Age in St Leo
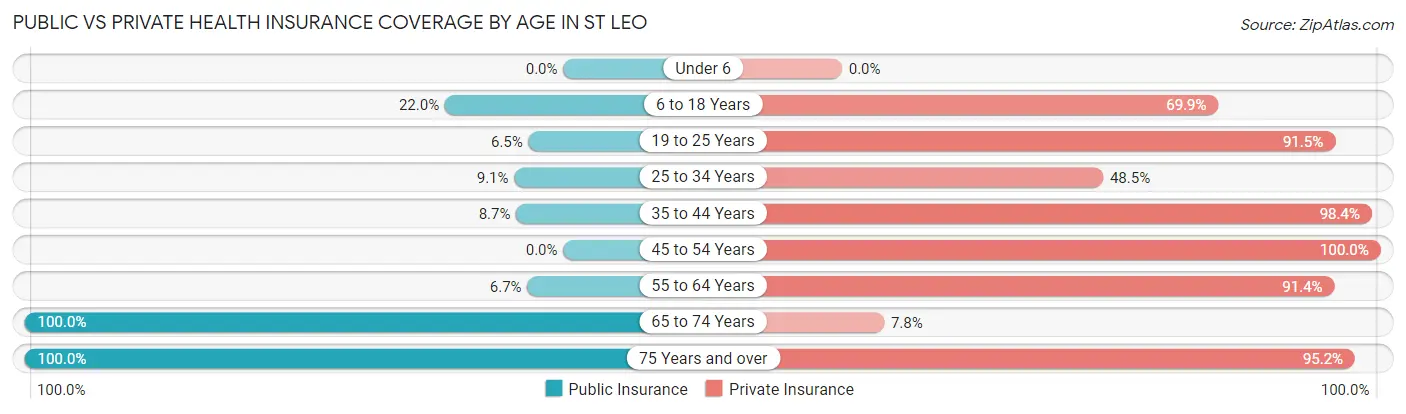
| Age Bracket | Public Insurance | Private Insurance |
| Under 6 | 0 (0.0%) | 0 (0.0%) |
| 6 to 18 Years | 143 (22.0%) | 455 (69.9%) |
| 19 to 25 Years | 77 (6.5%) | 1,093 (91.5%) |
| 25 to 34 Years | 3 (9.1%) | 16 (48.5%) |
| 35 to 44 Years | 16 (8.7%) | 180 (98.4%) |
| 45 to 54 Years | 0 (0.0%) | 18 (100.0%) |
| 55 to 64 Years | 7 (6.7%) | 96 (91.4%) |
| 65 to 74 Years | 179 (100.0%) | 14 (7.8%) |
| 75 Years and over | 63 (100.0%) | 60 (95.2%) |
| Total | 488 (20.1%) | 1,932 (79.6%) |
Disability Status by Sex by Age in St Leo
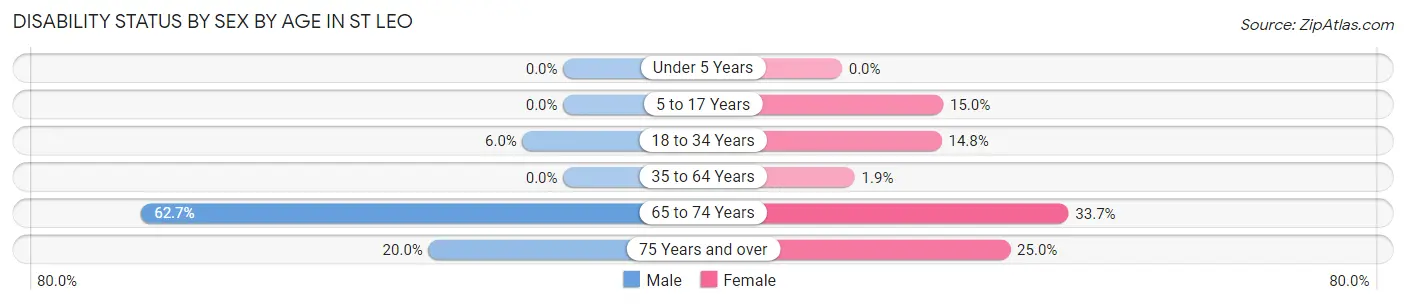
| Age Bracket | Male | Female |
| Under 5 Years | 0 (0.0%) | 0 (0.0%) |
| 5 to 17 Years | 0 (0.0%) | 17 (15.0%) |
| 18 to 34 Years | 58 (6.0%) | 105 (14.8%) |
| 35 to 64 Years | 0 (0.0%) | 3 (1.9%) |
| 65 to 74 Years | 47 (62.7%) | 35 (33.7%) |
| 75 Years and over | 3 (20.0%) | 12 (25.0%) |
Disability Class by Sex by Age in St Leo
Disability Class: Hearing Difficulty
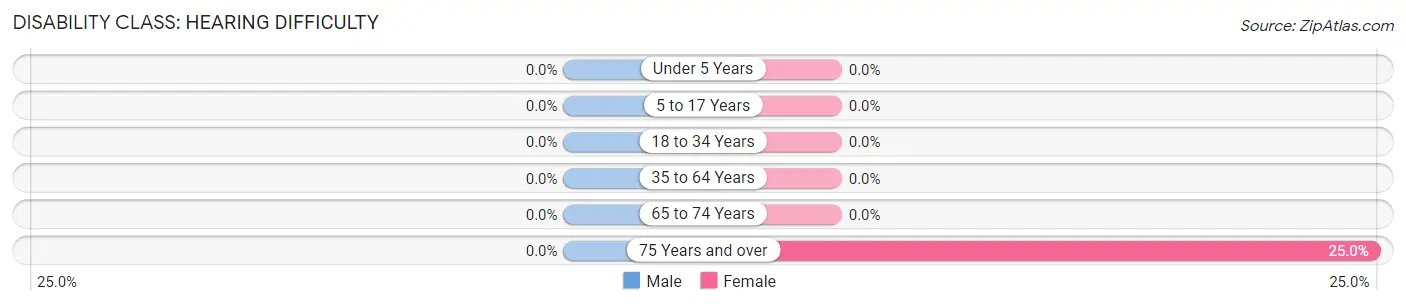
| Age Bracket | Male | Female |
| Under 5 Years | 0 (0.0%) | 0 (0.0%) |
| 5 to 17 Years | 0 (0.0%) | 0 (0.0%) |
| 18 to 34 Years | 0 (0.0%) | 0 (0.0%) |
| 35 to 64 Years | 0 (0.0%) | 0 (0.0%) |
| 65 to 74 Years | 0 (0.0%) | 0 (0.0%) |
| 75 Years and over | 0 (0.0%) | 12 (25.0%) |
Disability Class: Vision Difficulty
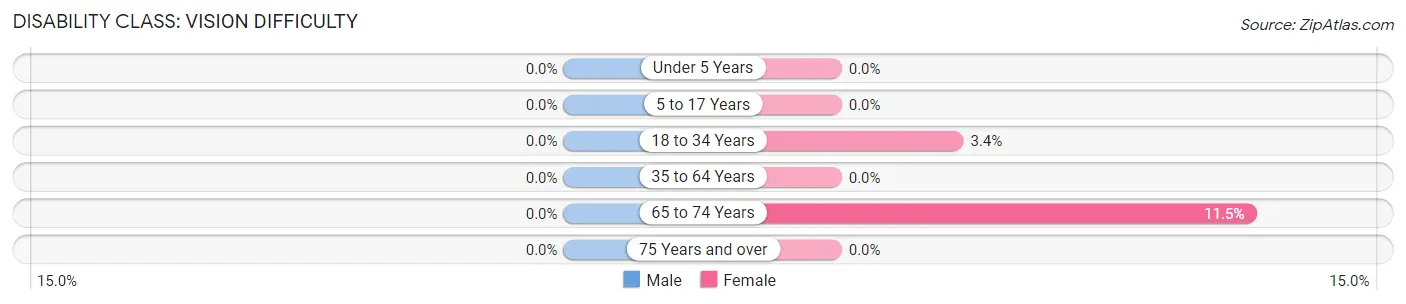
| Age Bracket | Male | Female |
| Under 5 Years | 0 (0.0%) | 0 (0.0%) |
| 5 to 17 Years | 0 (0.0%) | 0 (0.0%) |
| 18 to 34 Years | 0 (0.0%) | 24 (3.4%) |
| 35 to 64 Years | 0 (0.0%) | 0 (0.0%) |
| 65 to 74 Years | 0 (0.0%) | 12 (11.5%) |
| 75 Years and over | 0 (0.0%) | 0 (0.0%) |
Disability Class: Cognitive Difficulty
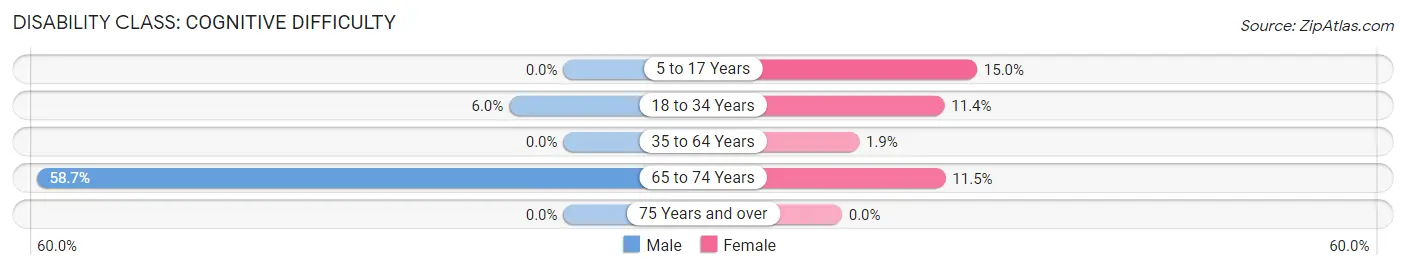
| Age Bracket | Male | Female |
| 5 to 17 Years | 0 (0.0%) | 17 (15.0%) |
| 18 to 34 Years | 58 (6.0%) | 81 (11.4%) |
| 35 to 64 Years | 0 (0.0%) | 3 (1.9%) |
| 65 to 74 Years | 44 (58.7%) | 12 (11.5%) |
| 75 Years and over | 0 (0.0%) | 0 (0.0%) |
Disability Class: Ambulatory Difficulty
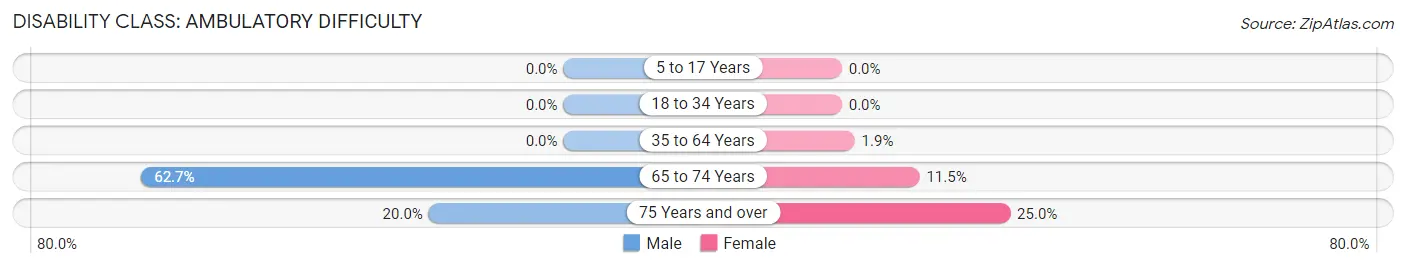
| Age Bracket | Male | Female |
| 5 to 17 Years | 0 (0.0%) | 0 (0.0%) |
| 18 to 34 Years | 0 (0.0%) | 0 (0.0%) |
| 35 to 64 Years | 0 (0.0%) | 3 (1.9%) |
| 65 to 74 Years | 47 (62.7%) | 12 (11.5%) |
| 75 Years and over | 3 (20.0%) | 12 (25.0%) |
Disability Class: Self-Care Difficulty
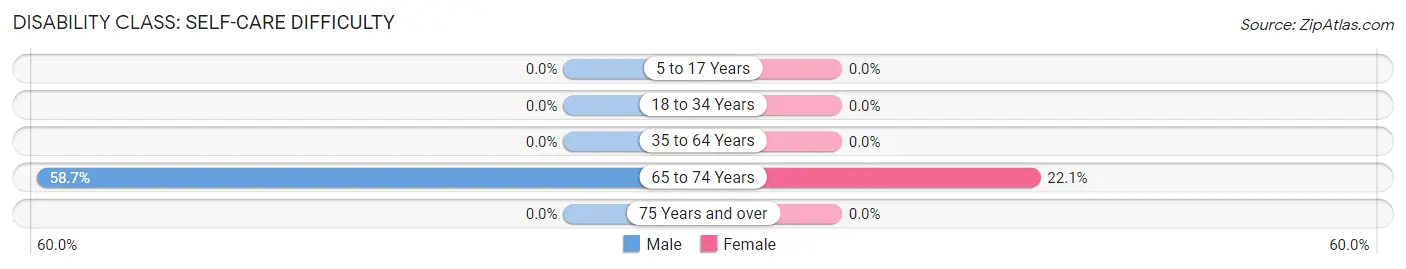
| Age Bracket | Male | Female |
| 5 to 17 Years | 0 (0.0%) | 0 (0.0%) |
| 18 to 34 Years | 0 (0.0%) | 0 (0.0%) |
| 35 to 64 Years | 0 (0.0%) | 0 (0.0%) |
| 65 to 74 Years | 44 (58.7%) | 23 (22.1%) |
| 75 Years and over | 0 (0.0%) | 0 (0.0%) |
Technology Access in St Leo
Computing Device Access in St Leo
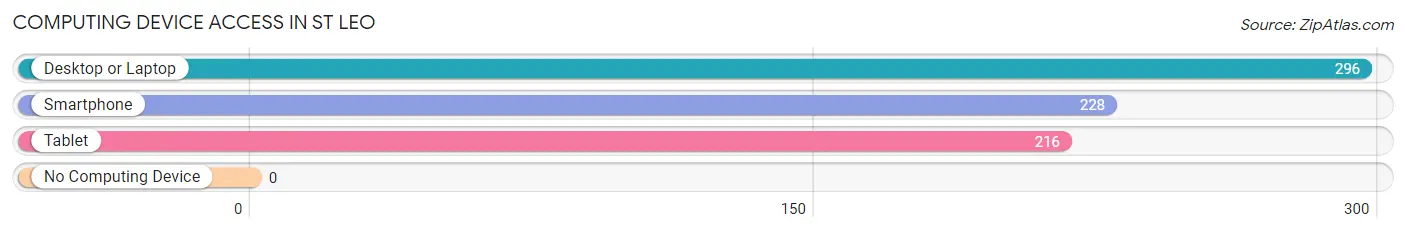
| Device Type | # Households | % Households |
| Desktop or Laptop | 296 | 96.1% |
| Smartphone | 228 | 74.0% |
| Tablet | 216 | 70.1% |
| No Computing Device | 0 | 0.0% |
| Total | 308 | 100.0% |
Internet Access in St Leo
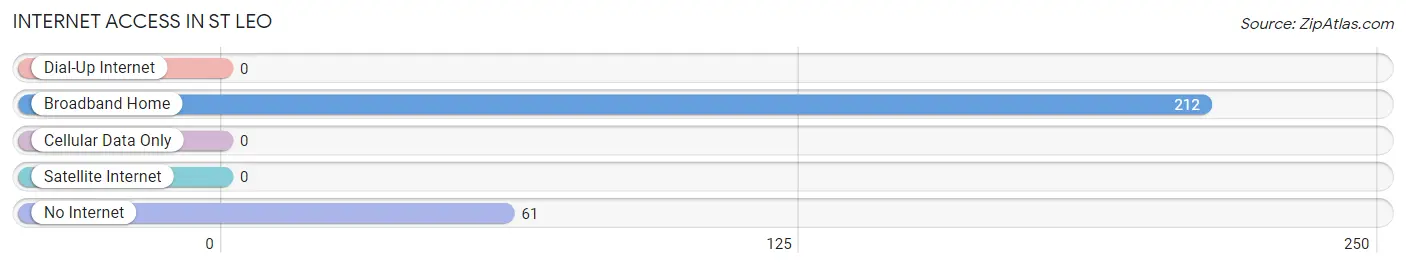
| Internet Type | # Households | % Households |
| Dial-Up Internet | 0 | 0.0% |
| Broadband Home | 212 | 68.8% |
| Cellular Data Only | 0 | 0.0% |
| Satellite Internet | 0 | 0.0% |
| No Internet | 61 | 19.8% |
| Total | 308 | 100.0% |
St Leo Summary
History
St. Leo, Florida is a small town located in Pasco County, Florida. It is located about 30 miles north of Tampa and is part of the Tampa Bay Area. The town was founded in 1883 by Father Charles Mohr, a German Catholic priest who was sent to the area by the Bishop of St. Augustine. Father Mohr established a Catholic mission in the area and named it after Pope Leo XIII. The mission was later expanded to include a school and a monastery.
The town of St. Leo was officially incorporated in 1925 and was named after the mission. The town was originally a farming community, but it has since grown to include a variety of businesses and services. The town is home to Saint Leo University, which was founded in 1889 and is the oldest Catholic university in Florida.
Geography
St. Leo is located in Pasco County, Florida. It is situated on the western side of the county, about 30 miles north of Tampa. The town is located on the banks of the Hillsborough River, which flows through the area. The town is surrounded by a variety of natural features, including the Withlacoochee State Forest, the Green Swamp, and the Hillsborough River State Park.
The town has a total area of 2.2 square miles, all of which is land. The town has a humid subtropical climate, with hot, humid summers and mild winters. The average temperature in the summer is around 90 degrees Fahrenheit, while the average temperature in the winter is around 60 degrees Fahrenheit.
Economy
The economy of St. Leo is largely based on tourism and education. The town is home to Saint Leo University, which is the oldest Catholic university in Florida. The university attracts students from all over the world and provides a variety of educational opportunities. The town is also home to a variety of businesses, including restaurants, retail stores, and professional services.
The town is also home to a variety of outdoor activities, including fishing, boating, and camping. The town is located near several state parks, including the Hillsborough River State Park and the Withlacoochee State Forest. These parks provide a variety of recreational opportunities for visitors.
Demographics
As of the 2010 census, the population of St. Leo was 2,639. The population is largely white (90.2%), with a small percentage of African Americans (4.2%) and Hispanics (3.3%). The median household income in the town is $45,938, and the median age is 43.
The town is home to a variety of religious denominations, including Catholic (44.2%), Baptist (17.2%), and Methodist (7.2%). The town is also home to a variety of businesses, including restaurants, retail stores, and professional services.
Conclusion
St. Leo, Florida is a small town located in Pasco County, Florida. It is located about 30 miles north of Tampa and is part of the Tampa Bay Area. The town was founded in 1883 by Father Charles Mohr, a German Catholic priest who was sent to the area by the Bishop of St. Augustine. The town is home to Saint Leo University, which was founded in 1889 and is the oldest Catholic university in Florida. The economy of St. Leo is largely based on tourism and education. As of the 2010 census, the population of St. Leo was 2,639. The town is home to a variety of religious denominations, including Catholic, Baptist, and Methodist. The town is also home to a variety of businesses, including restaurants, retail stores, and professional services.
Common Questions
What is Per Capita Income in St Leo?
Per Capita income in St Leo is $14,634.
What is the Median Family Income in St Leo?
Median Family Income in St Leo is $92,500.
What is the Median Household income in St Leo?
Median Household Income in St Leo is $82,115.
What is Income or Wage Gap in St Leo?
Income or Wage Gap in St Leo is 40.2%.
Women in St Leo earn 59.8 cents for every dollar earned by a man.
What is Inequality or Gini Index in St Leo?
Inequality or Gini Index in St Leo is 0.40.
What is the Total Population of St Leo?
Total Population of St Leo is 2,426.
What is the Total Male Population of St Leo?
Total Male Population of St Leo is 1,295.
What is the Total Female Population of St Leo?
Total Female Population of St Leo is 1,131.
What is the Ratio of Males per 100 Females in St Leo?
There are 114.50 Males per 100 Females in St Leo.
What is the Ratio of Females per 100 Males in St Leo?
There are 87.34 Females per 100 Males in St Leo.
What is the Median Population Age in St Leo?
Median Population Age in St Leo is 20.4 Years.
What is the Average Family Size in St Leo
Average Family Size in St Leo is 3.1 People.
What is the Average Household Size in St Leo
Average Household Size in St Leo is 2.4 People.
How Large is the Labor Force in St Leo?
There are 966 People in the Labor Forcein in St Leo.
What is the Percentage of People in the Labor Force in St Leo?
42.8% of People are in the Labor Force in St Leo.
What is the Unemployment Rate in St Leo?
Unemployment Rate in St Leo is 10.4%.