Woodlawn, NC Map & Demographics
Woodlawn Map
Woodlawn Overview
$39,314
PER CAPITA INCOME
$65,795
AVG FAMILY INCOME
$66,023
AVG HOUSEHOLD INCOME
50.2%
WAGE / INCOME GAP [ % ]
49.8¢/ $1
WAGE / INCOME GAP [ $ ]
0.32
INEQUALITY / GINI INDEX
947
TOTAL POPULATION
469
MALE POPULATION
478
FEMALE POPULATION
98.12
MALES / 100 FEMALES
101.92
FEMALES / 100 MALES
61.2
MEDIAN AGE
2.1
AVG FAMILY SIZE
1.8
AVG HOUSEHOLD SIZE
426
LABOR FORCE [ PEOPLE ]
48.4%
PERCENT IN LABOR FORCE
Income in Woodlawn
Income Overview in Woodlawn
Per Capita Income in Woodlawn is $39,314, while median incomes of families and households are $65,795 and $66,023 respectively.
| Characteristic | Number | Measure |
| Per Capita Income | 947 | $39,314 |
| Median Family Income | 363 | $65,795 |
| Mean Family Income | 363 | $77,187 |
| Median Household Income | 521 | $66,023 |
| Mean Household Income | 521 | $76,614 |
| Income Deficit | 363 | $0 |
| Wage / Income Gap (%) | 947 | 50.24% |
| Wage / Income Gap ($) | 947 | 49.76¢ per $1 |
| Gini / Inequality Index | 947 | 0.32 |
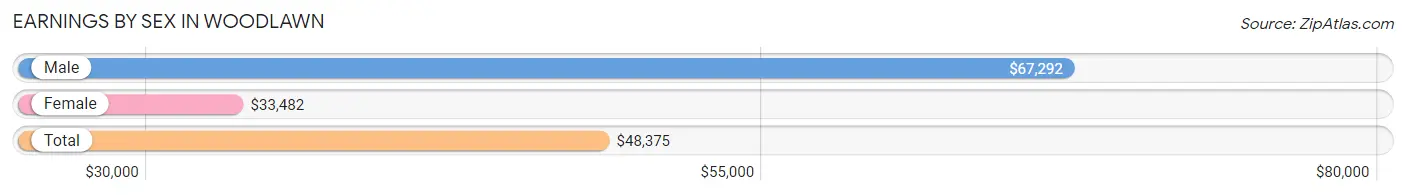
Earnings by Sex in Woodlawn
Average Earnings in Woodlawn are $48,375, $67,292 for men and $33,482 for women, a difference of 50.2%.
| Sex | Number | Average Earnings |
| Male | 310 (63.4%) | $67,292 |
| Female | 179 (36.6%) | $33,482 |
| Total | 489 (100.0%) | $48,375 |
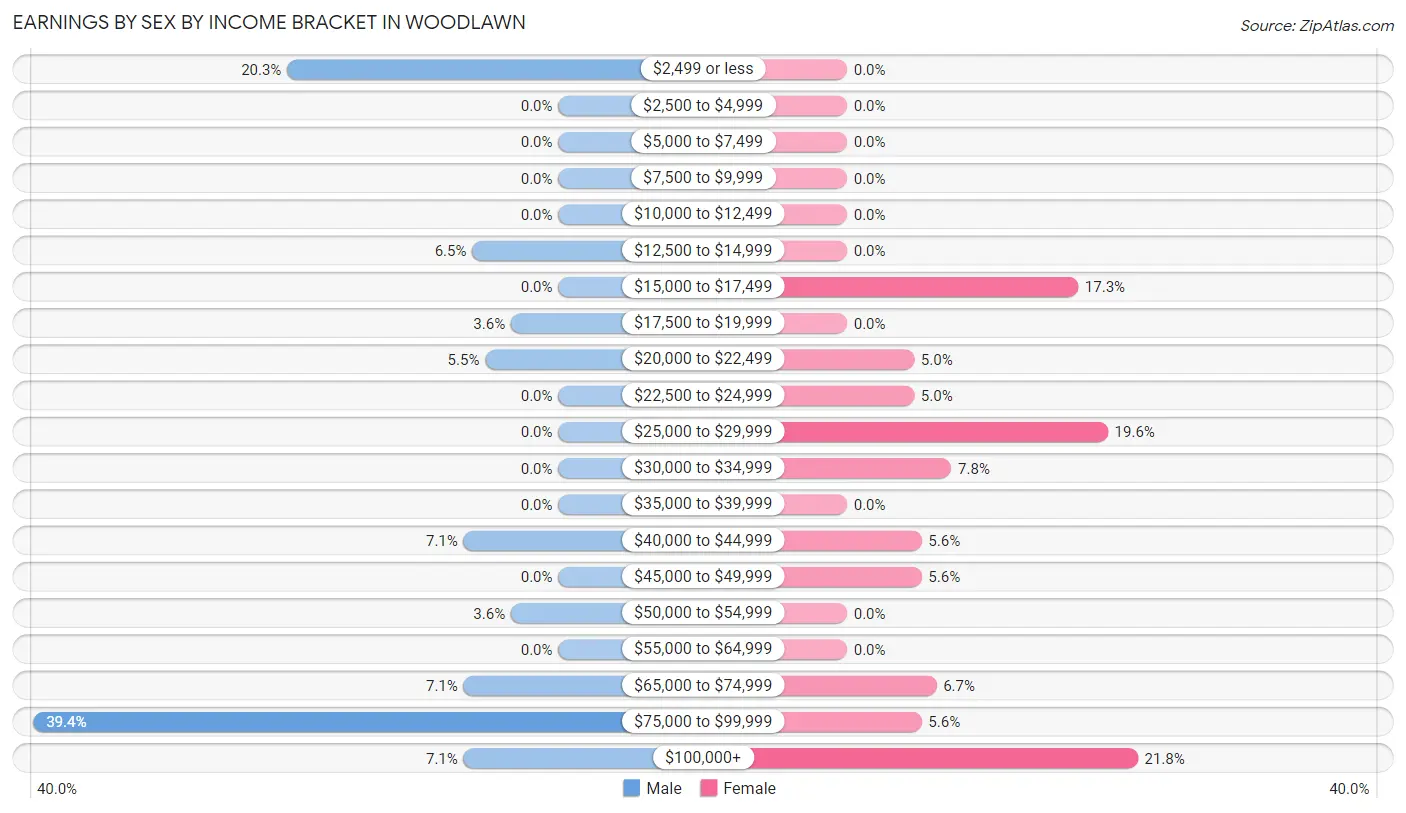
Earnings by Sex by Income Bracket in Woodlawn
The most common earnings brackets in Woodlawn are $75,000 to $99,999 for men (122 | 39.4%) and $100,000+ for women (39 | 21.8%).
| Income | Male | Female |
| $2,499 or less | 63 (20.3%) | 0 (0.0%) |
| $2,500 to $4,999 | 0 (0.0%) | 0 (0.0%) |
| $5,000 to $7,499 | 0 (0.0%) | 0 (0.0%) |
| $7,500 to $9,999 | 0 (0.0%) | 0 (0.0%) |
| $10,000 to $12,499 | 0 (0.0%) | 0 (0.0%) |
| $12,500 to $14,999 | 20 (6.5%) | 0 (0.0%) |
| $15,000 to $17,499 | 0 (0.0%) | 31 (17.3%) |
| $17,500 to $19,999 | 11 (3.5%) | 0 (0.0%) |
| $20,000 to $22,499 | 17 (5.5%) | 9 (5.0%) |
| $22,500 to $24,999 | 0 (0.0%) | 9 (5.0%) |
| $25,000 to $29,999 | 0 (0.0%) | 35 (19.6%) |
| $30,000 to $34,999 | 0 (0.0%) | 14 (7.8%) |
| $35,000 to $39,999 | 0 (0.0%) | 0 (0.0%) |
| $40,000 to $44,999 | 22 (7.1%) | 10 (5.6%) |
| $45,000 to $49,999 | 0 (0.0%) | 10 (5.6%) |
| $50,000 to $54,999 | 11 (3.5%) | 0 (0.0%) |
| $55,000 to $64,999 | 0 (0.0%) | 0 (0.0%) |
| $65,000 to $74,999 | 22 (7.1%) | 12 (6.7%) |
| $75,000 to $99,999 | 122 (39.4%) | 10 (5.6%) |
| $100,000+ | 22 (7.1%) | 39 (21.8%) |
| Total | 310 (100.0%) | 179 (100.0%) |
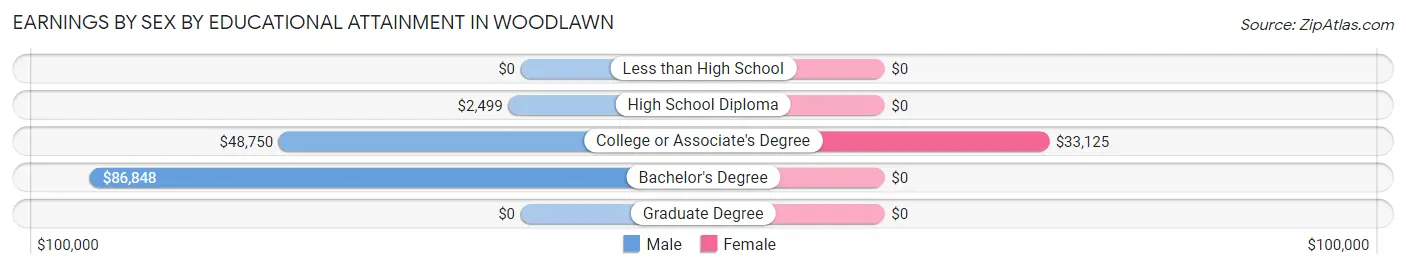
Earnings by Sex by Educational Attainment in Woodlawn
Average earnings in Woodlawn are $67,292 for men and $33,482 for women, a difference of 50.2%. Men with an educational attainment of bachelor's degree enjoy the highest average annual earnings of $86,848, while those with high school diploma education earn the least with $2,499. Women with an educational attainment of college or associate's degree earn the most with the average annual earnings of $33,125, while those with college or associate's degree education have the smallest earnings of $33,125.
| Educational Attainment | Male Income | Female Income |
| Less than High School | - | - |
| High School Diploma | $2,499 | $0 |
| College or Associate's Degree | $48,750 | $33,125 |
| Bachelor's Degree | $86,848 | $0 |
| Graduate Degree | - | - |
| Total | $67,292 | $33,482 |
Family Income in Woodlawn
Family Income Brackets in Woodlawn
According to the Woodlawn family income data, there are 119 families falling into the $75,000 to $99,999 income range, which is the most common income bracket and makes up 32.8% of all families.
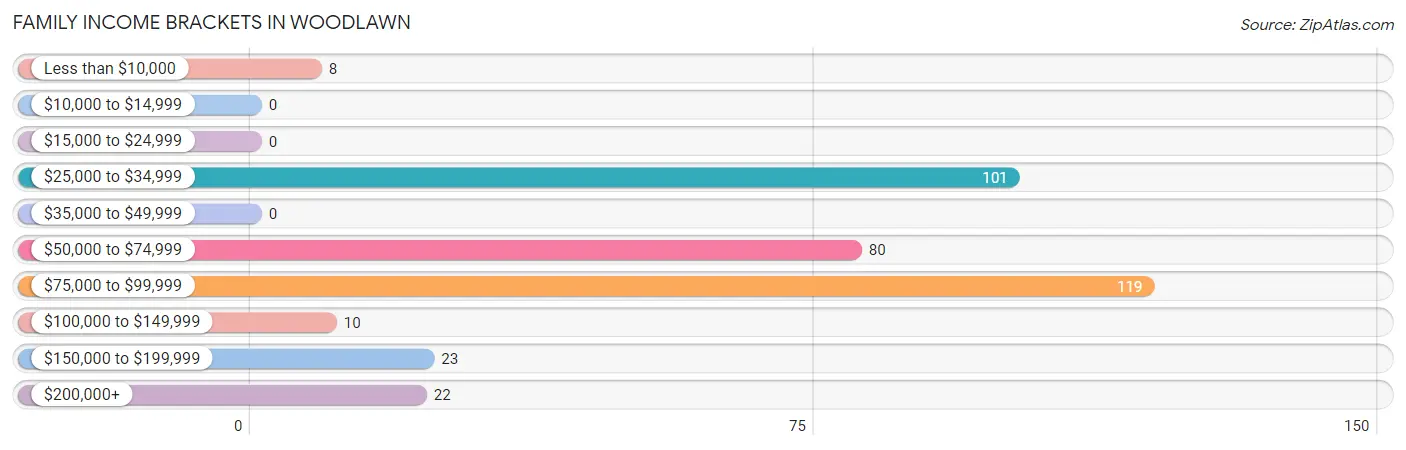
| Income Bracket | # Families | % Families |
| Less than $10,000 | 8 | 2.2% |
| $10,000 to $14,999 | 0 | 0.0% |
| $15,000 to $24,999 | 0 | 0.0% |
| $25,000 to $34,999 | 101 | 27.8% |
| $35,000 to $49,999 | 0 | 0.0% |
| $50,000 to $74,999 | 80 | 22.0% |
| $75,000 to $99,999 | 119 | 32.8% |
| $100,000 to $149,999 | 10 | 2.8% |
| $150,000 to $199,999 | 23 | 6.3% |
| $200,000+ | 22 | 6.1% |
Family Income by Famaliy Size in Woodlawn
2-person families (312 | 86.0%) account for the highest median family income in Woodlawn with $61,250 per family, while 2-person families (312 | 86.0%) have the highest median income of $30,625 per family member.
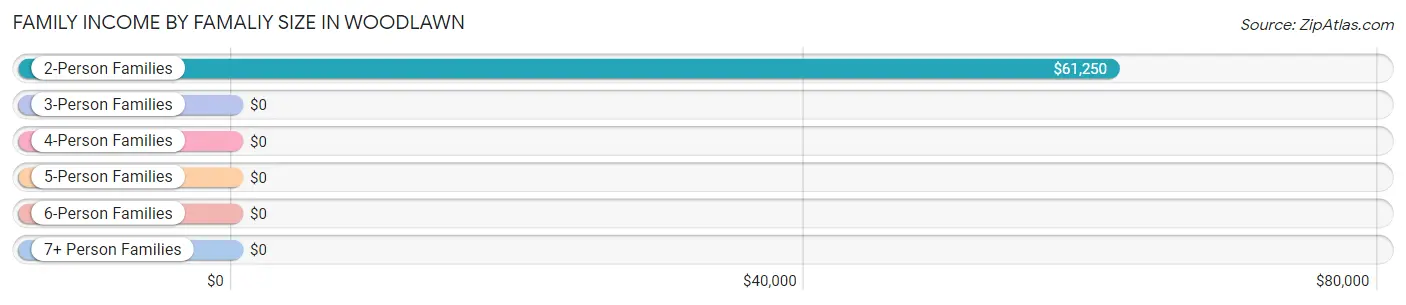
| Income Bracket | # Families | Median Income |
| 2-Person Families | 312 (86.0%) | $61,250 |
| 3-Person Families | 20 (5.5%) | $0 |
| 4-Person Families | 10 (2.8%) | $0 |
| 5-Person Families | 21 (5.8%) | $0 |
| 6-Person Families | 0 (0.0%) | $0 |
| 7+ Person Families | 0 (0.0%) | $0 |
| Total | 363 (100.0%) | $65,795 |
Family Income by Number of Earners in Woodlawn
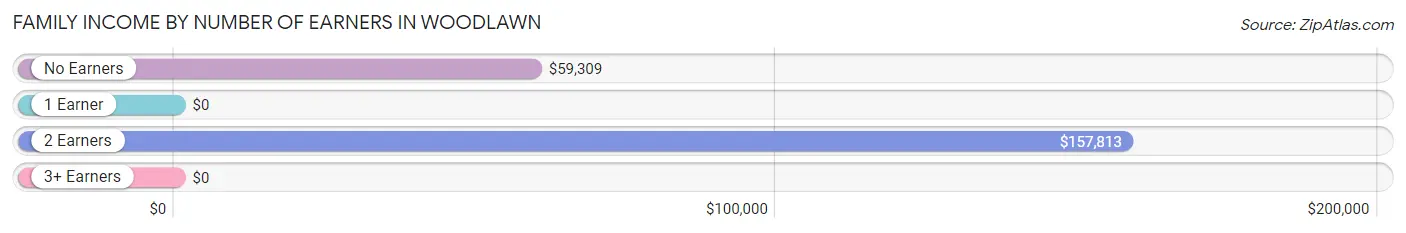
| Number of Earners | # Families | Median Income |
| No Earners | 84 (23.1%) | $59,309 |
| 1 Earner | 203 (55.9%) | $0 |
| 2 Earners | 65 (17.9%) | $157,813 |
| 3+ Earners | 11 (3.0%) | $0 |
| Total | 363 (100.0%) | $65,795 |
Household Income in Woodlawn
Household Income Brackets in Woodlawn
With 171 households falling in the category, the $75,000 to $99,999 income range is the most frequent in Woodlawn, accounting for 32.8% of all households.
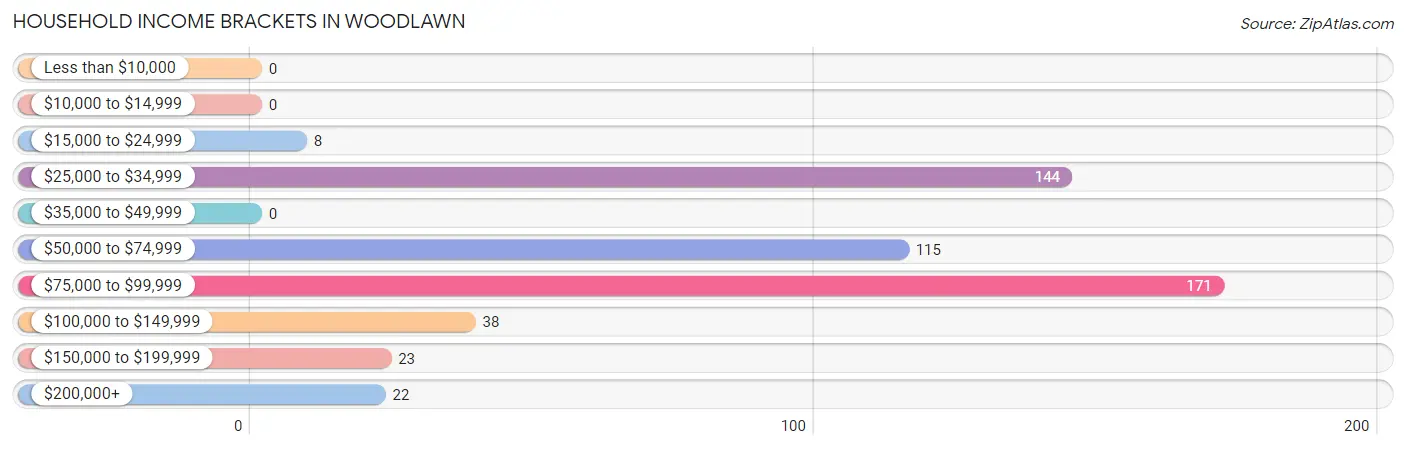
| Income Bracket | # Households | % Households |
| Less than $10,000 | 0 | 0.0% |
| $10,000 to $14,999 | 0 | 0.0% |
| $15,000 to $24,999 | 8 | 1.5% |
| $25,000 to $34,999 | 144 | 27.6% |
| $35,000 to $49,999 | 0 | 0.0% |
| $50,000 to $74,999 | 115 | 22.1% |
| $75,000 to $99,999 | 171 | 32.8% |
| $100,000 to $149,999 | 38 | 7.3% |
| $150,000 to $199,999 | 23 | 4.4% |
| $200,000+ | 22 | 4.2% |
Household Income by Householder Age in Woodlawn
The median household income in Woodlawn is $66,023, with the highest median household income of $86,588 found in the 45 to 64 years age bracket for the primary householder. A total of 229 households (44.0%) fall into this category.
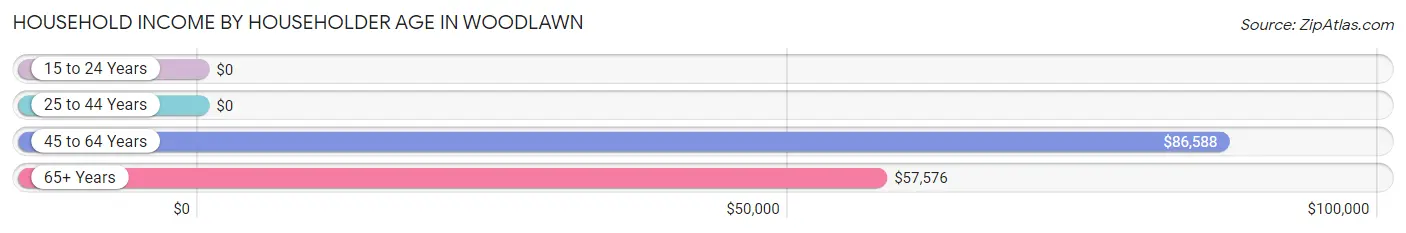
| Income Bracket | # Households | Median Income |
| 15 to 24 Years | 0 (0.0%) | $0 |
| 25 to 44 Years | 57 (10.9%) | $0 |
| 45 to 64 Years | 229 (44.0%) | $86,588 |
| 65+ Years | 235 (45.1%) | $57,576 |
| Total | 521 (100.0%) | $66,023 |
Poverty in Woodlawn
Income Below Poverty by Sex and Age in Woodlawn
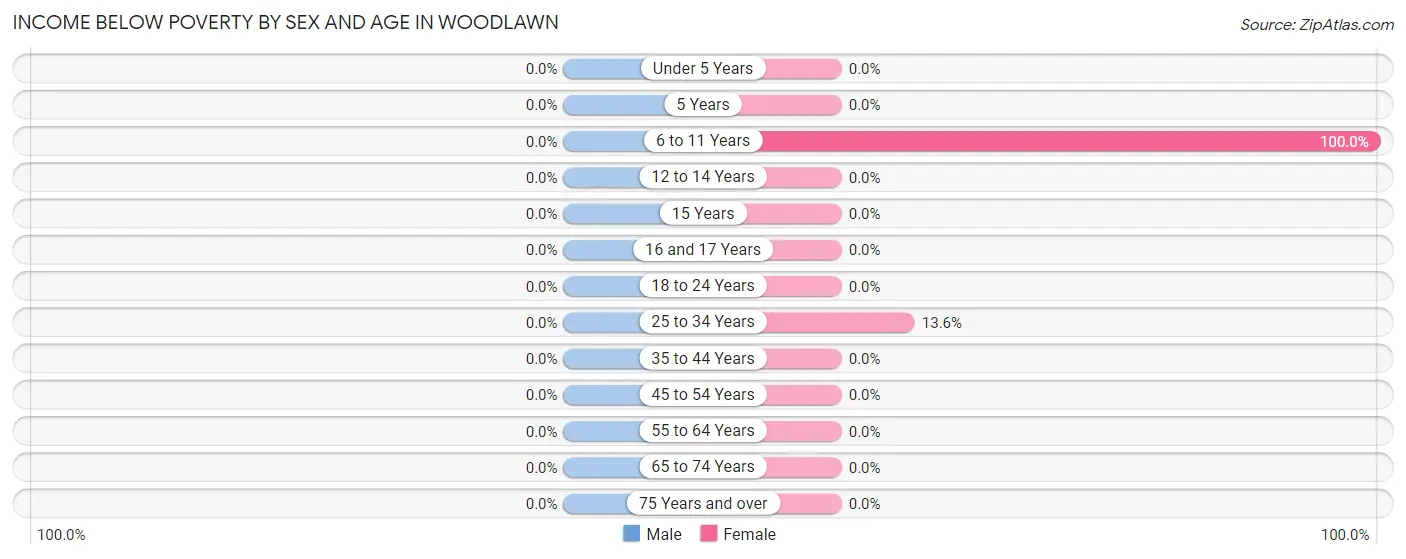
| Age Bracket | Male | Female |
| Under 5 Years | 0 (0.0%) | 0 (0.0%) |
| 5 Years | 0 (0.0%) | 0 (0.0%) |
| 6 to 11 Years | 0 (0.0%) | 18 (100.0%) |
| 12 to 14 Years | 0 (0.0%) | 0 (0.0%) |
| 15 Years | 0 (0.0%) | 0 (0.0%) |
| 16 and 17 Years | 0 (0.0%) | 0 (0.0%) |
| 18 to 24 Years | 0 (0.0%) | 0 (0.0%) |
| 25 to 34 Years | 0 (0.0%) | 8 (13.6%) |
| 35 to 44 Years | 0 (0.0%) | 0 (0.0%) |
| 45 to 54 Years | 0 (0.0%) | 0 (0.0%) |
| 55 to 64 Years | 0 (0.0%) | 0 (0.0%) |
| 65 to 74 Years | 0 (0.0%) | 0 (0.0%) |
| 75 Years and over | 0 (0.0%) | 0 (0.0%) |
| Total | 0 (0.0%) | 26 (5.4%) |
Income Above Poverty by Sex and Age in Woodlawn
According to the poverty statistics in Woodlawn, males aged under 5 years and females aged under 5 years are the age groups that are most secure financially, with 100.0% of males and 100.0% of females in these age groups living above the poverty line.
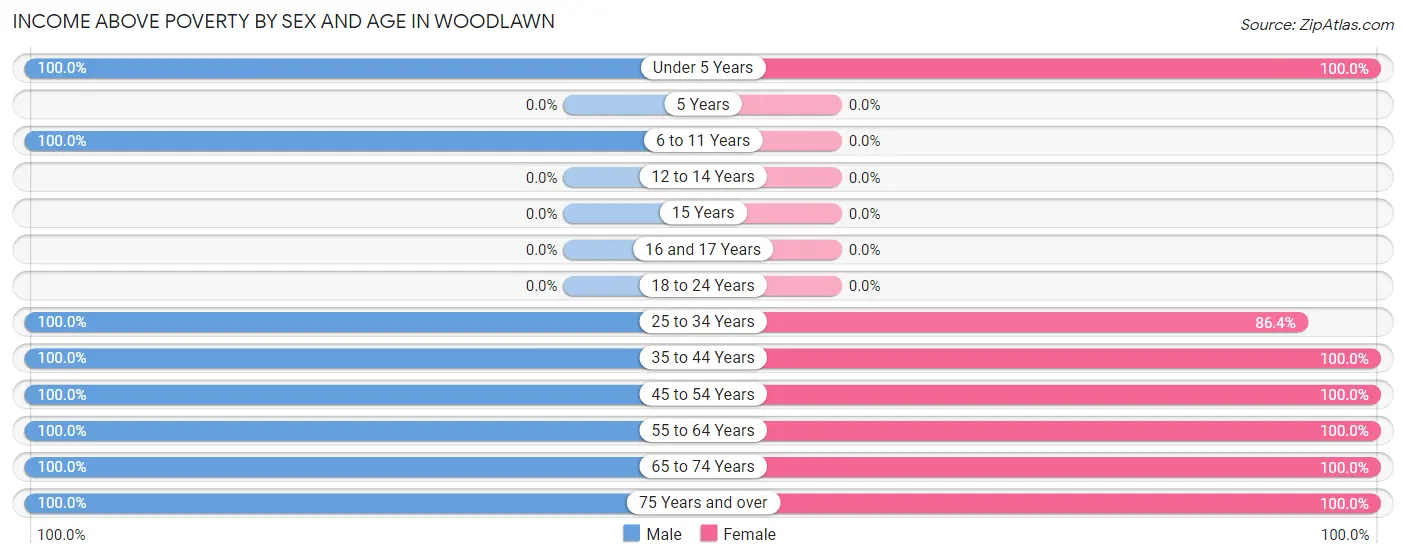
| Age Bracket | Male | Female |
| Under 5 Years | 19 (100.0%) | 10 (100.0%) |
| 5 Years | 0 (0.0%) | 0 (0.0%) |
| 6 to 11 Years | 19 (100.0%) | 0 (0.0%) |
| 12 to 14 Years | 0 (0.0%) | 0 (0.0%) |
| 15 Years | 0 (0.0%) | 0 (0.0%) |
| 16 and 17 Years | 0 (0.0%) | 0 (0.0%) |
| 18 to 24 Years | 0 (0.0%) | 0 (0.0%) |
| 25 to 34 Years | 74 (100.0%) | 51 (86.4%) |
| 35 to 44 Years | 24 (100.0%) | 12 (100.0%) |
| 45 to 54 Years | 65 (100.0%) | 89 (100.0%) |
| 55 to 64 Years | 75 (100.0%) | 114 (100.0%) |
| 65 to 74 Years | 147 (100.0%) | 164 (100.0%) |
| 75 Years and over | 46 (100.0%) | 12 (100.0%) |
| Total | 469 (100.0%) | 452 (94.6%) |
Income Below Poverty Among Married-Couple Families in Woodlawn
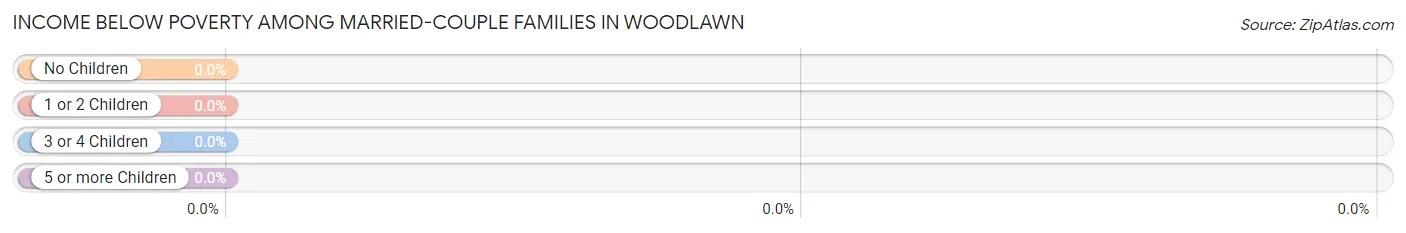
| Children | Above Poverty | Below Poverty |
| No Children | 289 (100.0%) | 0 (0.0%) |
| 1 or 2 Children | 32 (100.0%) | 0 (0.0%) |
| 3 or 4 Children | 0 (0.0%) | 0 (0.0%) |
| 5 or more Children | 0 (0.0%) | 0 (0.0%) |
| Total | 321 (100.0%) | 0 (0.0%) |
Income Below Poverty Among Single-Parent Households in Woodlawn
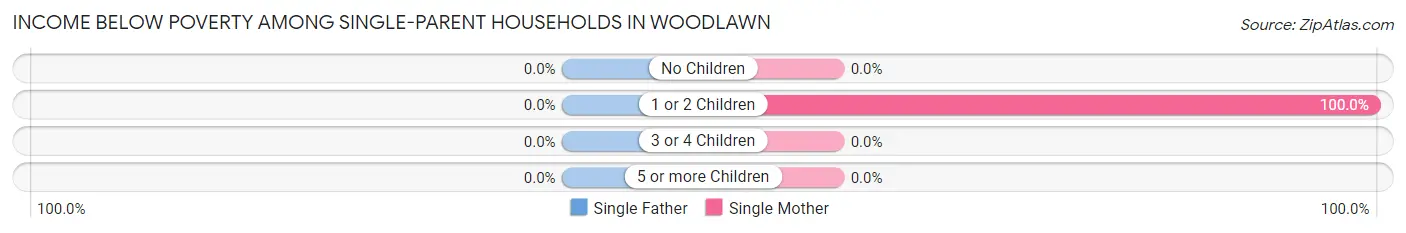
| Children | Single Father | Single Mother |
| No Children | 0 (0.0%) | 0 (0.0%) |
| 1 or 2 Children | 0 (0.0%) | 8 (100.0%) |
| 3 or 4 Children | 0 (0.0%) | 0 (0.0%) |
| 5 or more Children | 0 (0.0%) | 0 (0.0%) |
| Total | 0 (0.0%) | 8 (25.8%) |
Income Below Poverty Among Married-Couple vs Single-Parent Households in Woodlawn
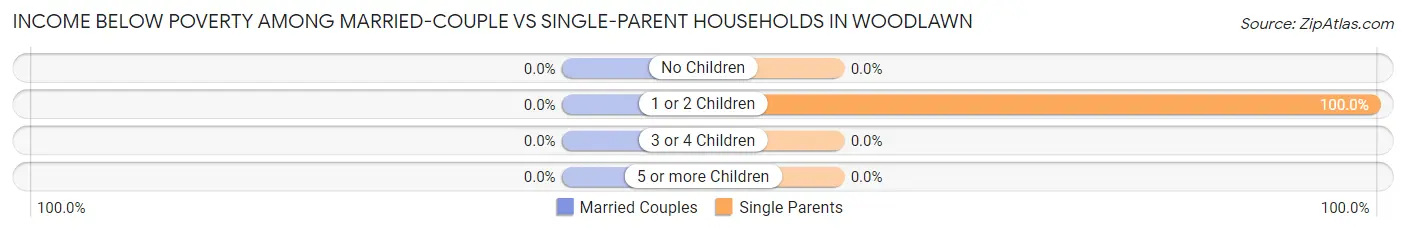
| Children | Married-Couple Families | Single-Parent Households |
| No Children | 0 (0.0%) | 0 (0.0%) |
| 1 or 2 Children | 0 (0.0%) | 8 (100.0%) |
| 3 or 4 Children | 0 (0.0%) | 0 (0.0%) |
| 5 or more Children | 0 (0.0%) | 0 (0.0%) |
| Total | 0 (0.0%) | 8 (19.1%) |
Race in Woodlawn
The most populous races in Woodlawn are White / Caucasian (631 | 66.6%), Black / African American (120 | 12.7%), and Two or more Races (100 | 10.6%).
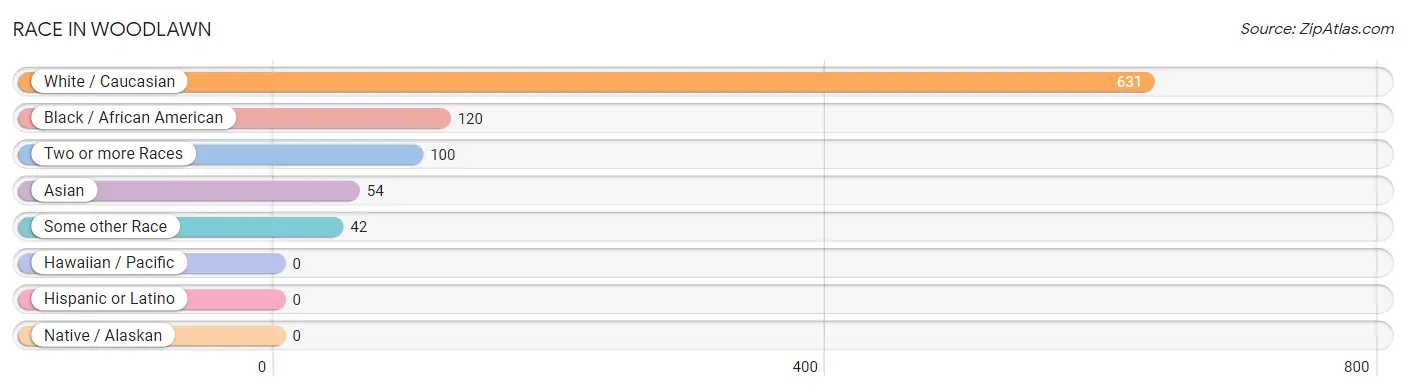
| Race | # Population | % Population |
| Asian | 54 | 5.7% |
| Black / African American | 120 | 12.7% |
| Hawaiian / Pacific | 0 | 0.0% |
| Hispanic or Latino | 0 | 0.0% |
| Native / Alaskan | 0 | 0.0% |
| White / Caucasian | 631 | 66.6% |
| Two or more Races | 100 | 10.6% |
| Some other Race | 42 | 4.4% |
| Total | 947 | 100.0% |
Ancestry in Woodlawn
The most populous ancestries reported in Woodlawn are German (106 | 11.2%), Irish (96 | 10.1%), English (70 | 7.4%), Thai (54 | 5.7%), and French (42 | 4.4%), together accounting for 38.9% of all Woodlawn residents.
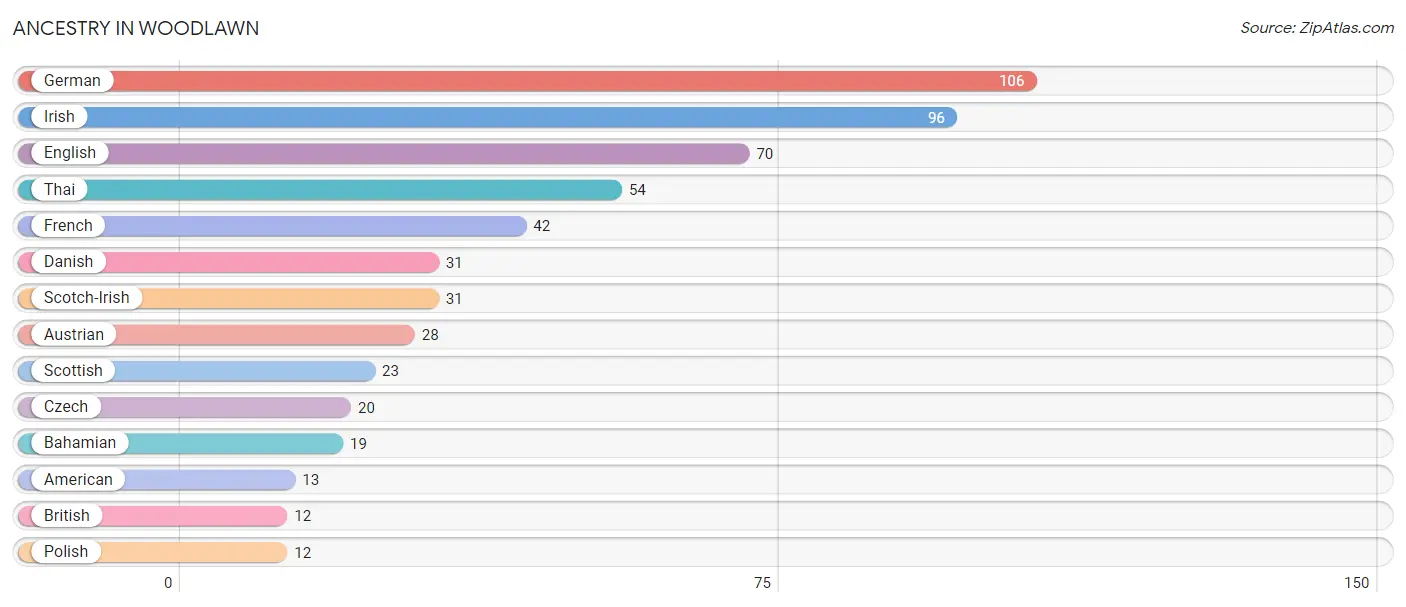
| Ancestry | # Population | % Population |
| American | 13 | 1.4% |
| Austrian | 28 | 3.0% |
| Bahamian | 19 | 2.0% |
| British | 12 | 1.3% |
| Czech | 20 | 2.1% |
| Danish | 31 | 3.3% |
| English | 70 | 7.4% |
| French | 42 | 4.4% |
| German | 106 | 11.2% |
| Irish | 96 | 10.1% |
| Polish | 12 | 1.3% |
| Scotch-Irish | 31 | 3.3% |
| Scottish | 23 | 2.4% |
| Thai | 54 | 5.7% | View All 14 Rows |
Immigrants in Woodlawn
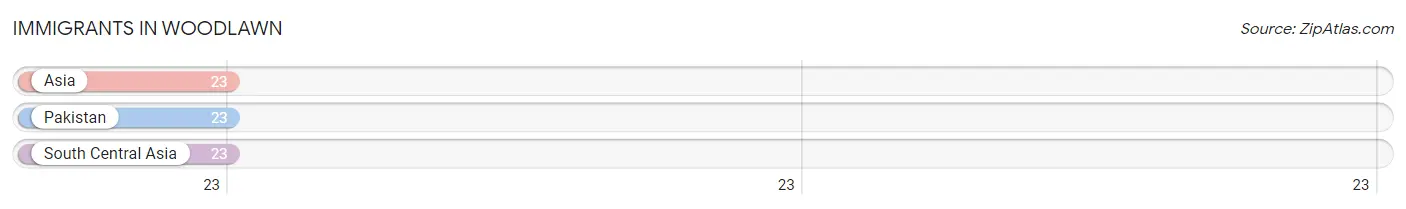
The most numerous immigrant groups reported in Woodlawn came from Asia (23 | 2.4%), Pakistan (23 | 2.4%), and South Central Asia (23 | 2.4%), together accounting for 7.3% of all Woodlawn residents.
| Immigration Origin | # Population | % Population |
| Asia | 23 | 2.4% |
| Pakistan | 23 | 2.4% |
| South Central Asia | 23 | 2.4% | View All 3 Rows |
Sex and Age in Woodlawn
Sex and Age in Woodlawn
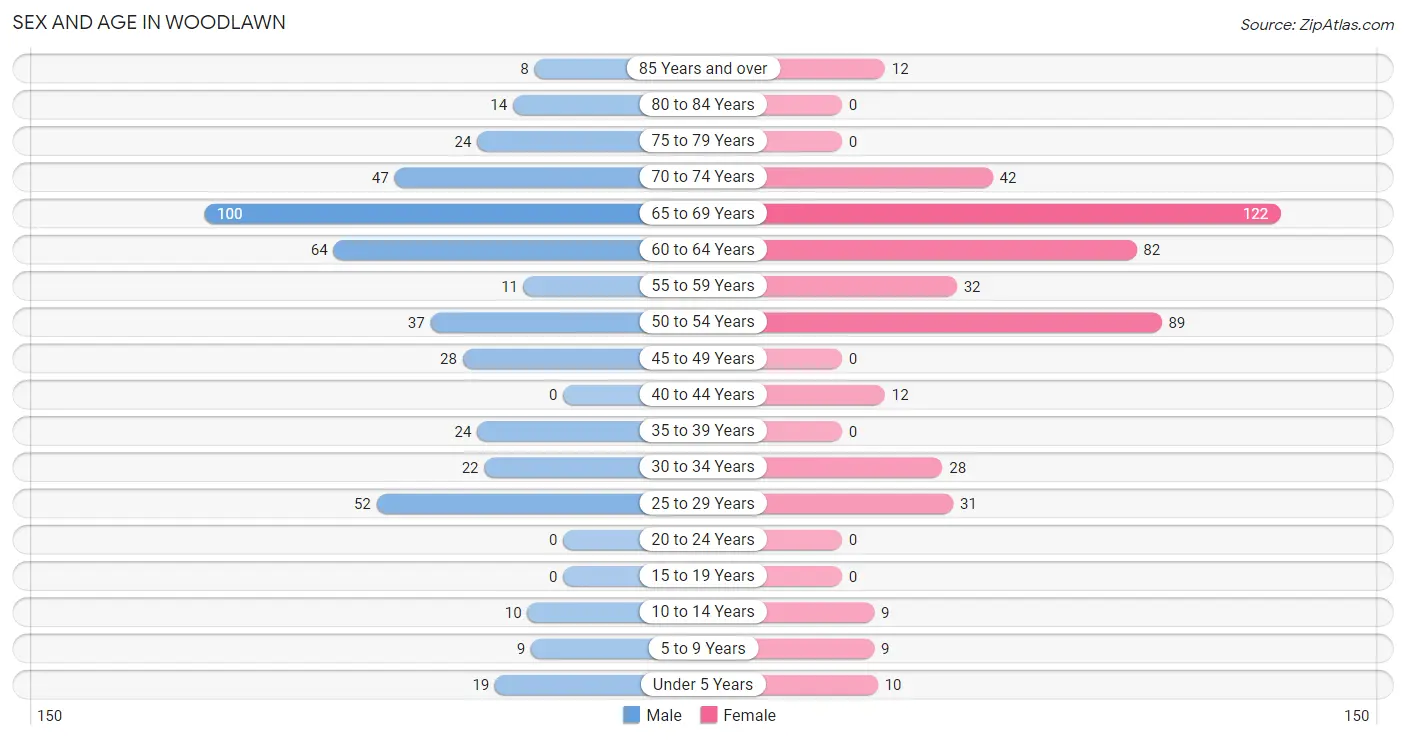
The most populous age groups in Woodlawn are 65 to 69 Years (100 | 21.3%) for men and 65 to 69 Years (122 | 25.5%) for women.
| Age Bracket | Male | Female |
| Under 5 Years | 19 (4.1%) | 10 (2.1%) |
| 5 to 9 Years | 9 (1.9%) | 9 (1.9%) |
| 10 to 14 Years | 10 (2.1%) | 9 (1.9%) |
| 15 to 19 Years | 0 (0.0%) | 0 (0.0%) |
| 20 to 24 Years | 0 (0.0%) | 0 (0.0%) |
| 25 to 29 Years | 52 (11.1%) | 31 (6.5%) |
| 30 to 34 Years | 22 (4.7%) | 28 (5.9%) |
| 35 to 39 Years | 24 (5.1%) | 0 (0.0%) |
| 40 to 44 Years | 0 (0.0%) | 12 (2.5%) |
| 45 to 49 Years | 28 (6.0%) | 0 (0.0%) |
| 50 to 54 Years | 37 (7.9%) | 89 (18.6%) |
| 55 to 59 Years | 11 (2.4%) | 32 (6.7%) |
| 60 to 64 Years | 64 (13.7%) | 82 (17.2%) |
| 65 to 69 Years | 100 (21.3%) | 122 (25.5%) |
| 70 to 74 Years | 47 (10.0%) | 42 (8.8%) |
| 75 to 79 Years | 24 (5.1%) | 0 (0.0%) |
| 80 to 84 Years | 14 (3.0%) | 0 (0.0%) |
| 85 Years and over | 8 (1.7%) | 12 (2.5%) |
| Total | 469 (100.0%) | 478 (100.0%) |
Families and Households in Woodlawn
Median Family Size in Woodlawn
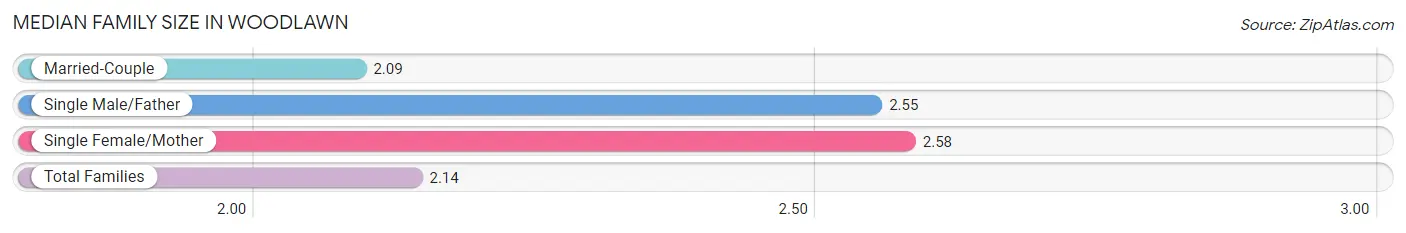
The median family size in Woodlawn is 2.14 persons per family, with single female/mother families (31 | 8.5%) accounting for the largest median family size of 2.58 persons per family. On the other hand, married-couple families (321 | 88.4%) represent the smallest median family size with 2.09 persons per family.
| Family Type | # Families | Family Size |
| Married-Couple | 321 (88.4%) | 2.09 |
| Single Male/Father | 11 (3.0%) | 2.55 |
| Single Female/Mother | 31 (8.5%) | 2.58 |
| Total Families | 363 (100.0%) | 2.14 |
Median Household Size in Woodlawn
| Household Type | # Households | Household Size |
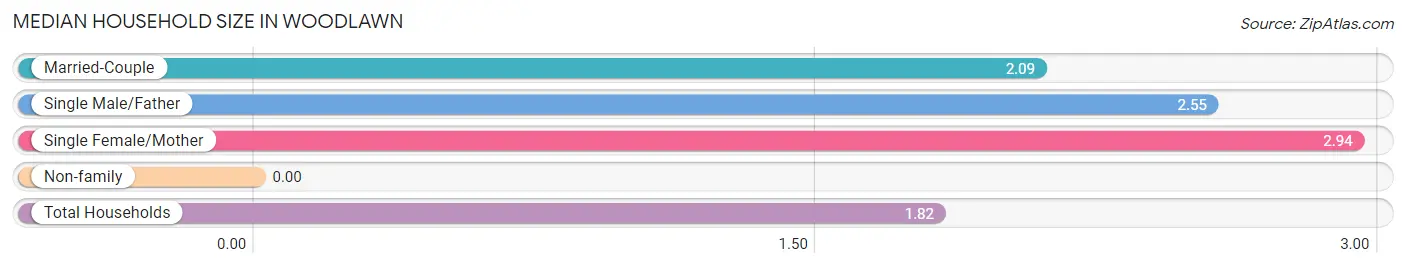
| Married-Couple | 321 (61.6%) | 2.09 |
| Single Male/Father | 11 (2.1%) | 2.55 |
| Single Female/Mother | 31 (5.9%) | 2.94 |
| Non-family | 158 (30.3%) | - |
| Total Households | 521 (100.0%) | 1.82 |
Household Size by Marriage Status in Woodlawn
Out of a total of 521 households in Woodlawn, 363 (69.7%) are family households, while 158 (30.3%) are nonfamily households. The most numerous type of family households are 2-person households, comprising 312, and the most common type of nonfamily households are 1-person households, comprising 158.
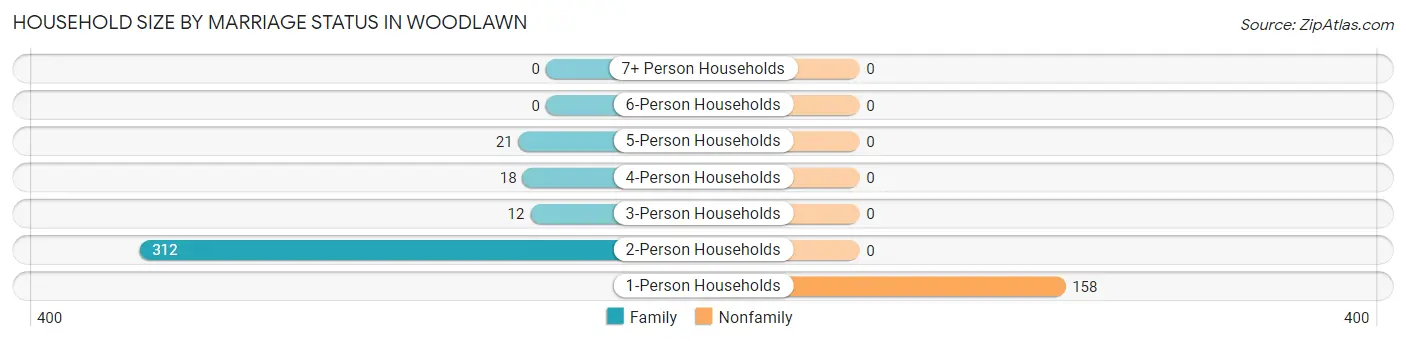
| Household Size | Family Households | Nonfamily Households |
| 1-Person Households | - | 158 (30.3%) |
| 2-Person Households | 312 (59.9%) | 0 (0.0%) |
| 3-Person Households | 12 (2.3%) | 0 (0.0%) |
| 4-Person Households | 18 (3.5%) | 0 (0.0%) |
| 5-Person Households | 21 (4.0%) | 0 (0.0%) |
| 6-Person Households | 0 (0.0%) | 0 (0.0%) |
| 7+ Person Households | 0 (0.0%) | 0 (0.0%) |
| Total | 363 (69.7%) | 158 (30.3%) |
Female Fertility in Woodlawn
Fertility by Age in Woodlawn
Average fertility rate in Woodlawn is 118.0 births per 1,000 women. Women in the age bracket of 20 to 34 years have the highest fertility rate with 169.0 births per 1,000 women. Women in the age bracket of 20 to 34 years acount for 100.0% of all women with births.
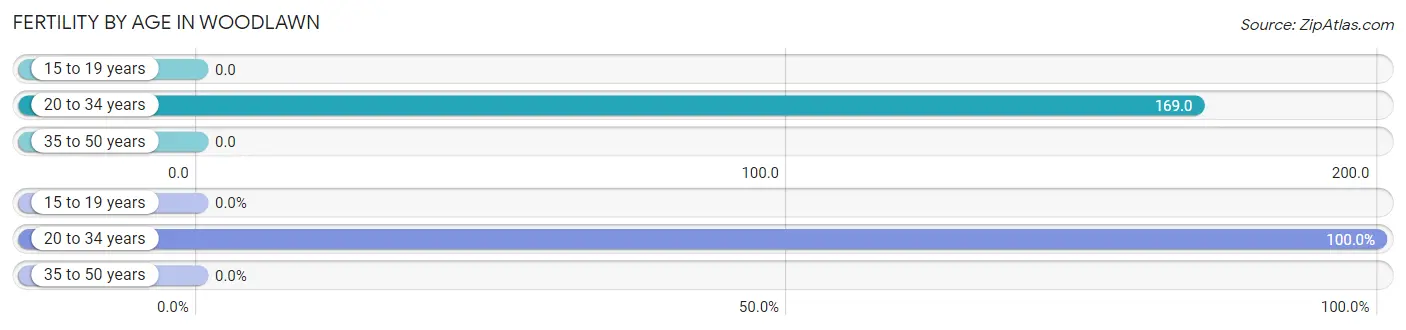
| Age Bracket | Women with Births | Births / 1,000 Women |
| 15 to 19 years | 0 (0.0%) | 0.0 |
| 20 to 34 years | 10 (100.0%) | 169.0 |
| 35 to 50 years | 0 (0.0%) | 0.0 |
| Total | 10 (100.0%) | 118.0 |
Fertility by Age by Marriage Status in Woodlawn
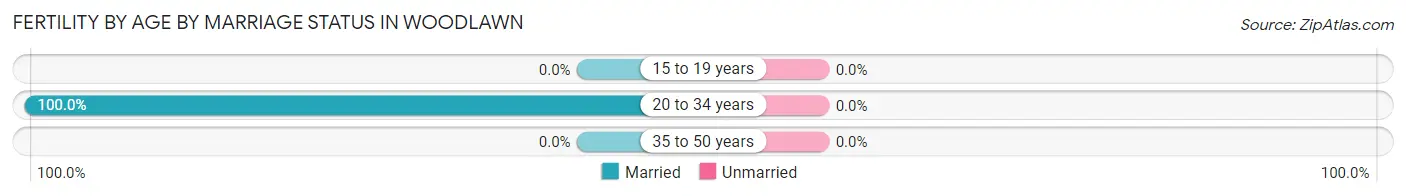
| Age Bracket | Married | Unmarried |
| 15 to 19 years | 0 (0.0%) | 0 (0.0%) |
| 20 to 34 years | 10 (100.0%) | 0 (0.0%) |
| 35 to 50 years | 0 (0.0%) | 0 (0.0%) |
| Total | 10 (100.0%) | 0 (0.0%) |
Fertility by Education in Woodlawn
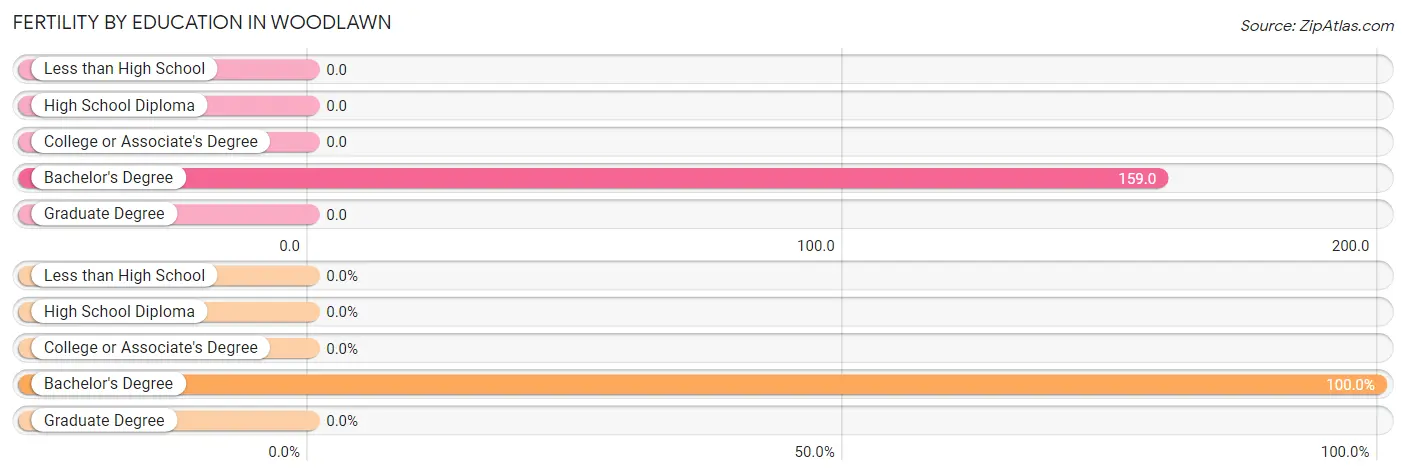
| Educational Attainment | Women with Births | Births / 1,000 Women |
| Less than High School | 0 (0.0%) | 0.0 |
| High School Diploma | 0 (0.0%) | 0.0 |
| College or Associate's Degree | 0 (0.0%) | 0.0 |
| Bachelor's Degree | 10 (100.0%) | 159.0 |
| Graduate Degree | 0 (0.0%) | 0.0 |
| Total | 10 (100.0%) | 118.0 |
Fertility by Education by Marriage Status in Woodlawn
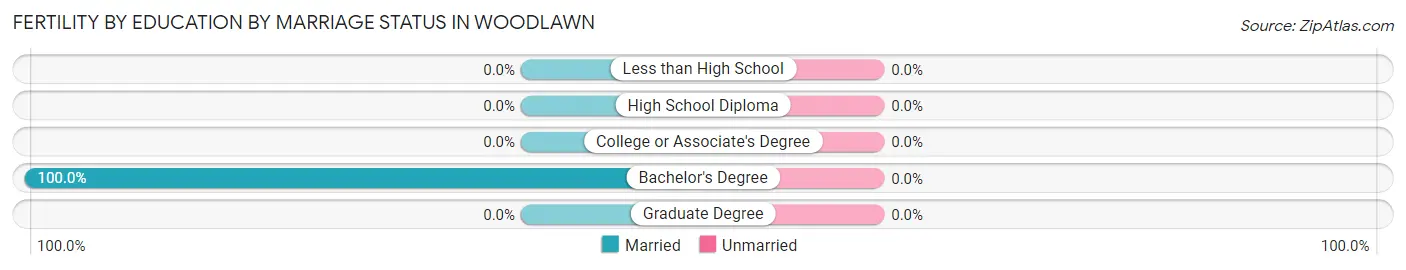
| Educational Attainment | Married | Unmarried |
| Less than High School | 0 (0.0%) | 0 (0.0%) |
| High School Diploma | 0 (0.0%) | 0 (0.0%) |
| College or Associate's Degree | 0 (0.0%) | 0 (0.0%) |
| Bachelor's Degree | 10 (100.0%) | 0 (0.0%) |
| Graduate Degree | 0 (0.0%) | 0 (0.0%) |
| Total | 10 (100.0%) | 0 (0.0%) |
Employment Characteristics in Woodlawn
Employment by Class of Employer in Woodlawn
Among the 426 employed individuals in Woodlawn, private company employees (306 | 71.8%), local government employees (40 | 9.4%), and not-for-profit organizations (38 | 8.9%) make up the most common classes of employment.
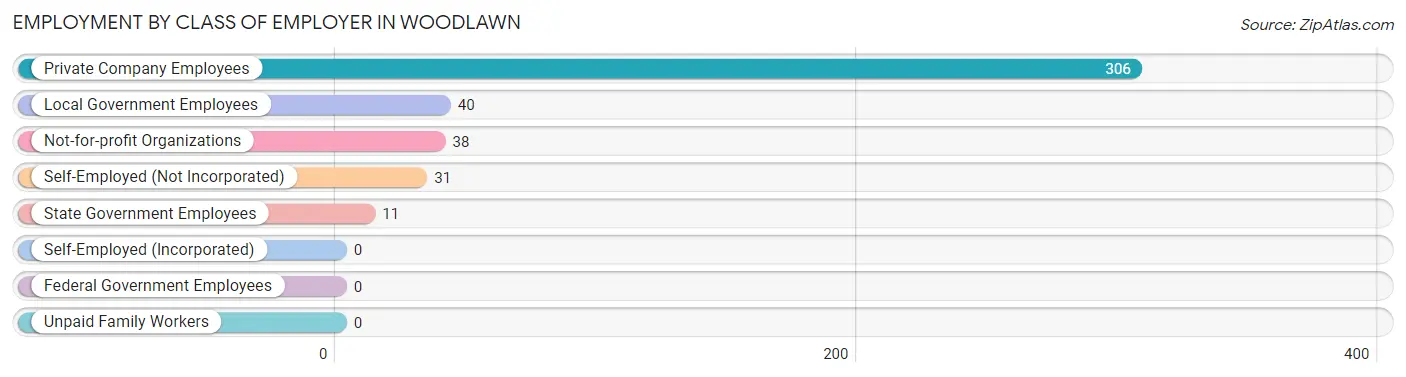
| Employer Class | # Employees | % Employees |
| Private Company Employees | 306 | 71.8% |
| Self-Employed (Incorporated) | 0 | 0.0% |
| Self-Employed (Not Incorporated) | 31 | 7.3% |
| Not-for-profit Organizations | 38 | 8.9% |
| Local Government Employees | 40 | 9.4% |
| State Government Employees | 11 | 2.6% |
| Federal Government Employees | 0 | 0.0% |
| Unpaid Family Workers | 0 | 0.0% |
| Total | 426 | 100.0% |
Employment Status by Age in Woodlawn
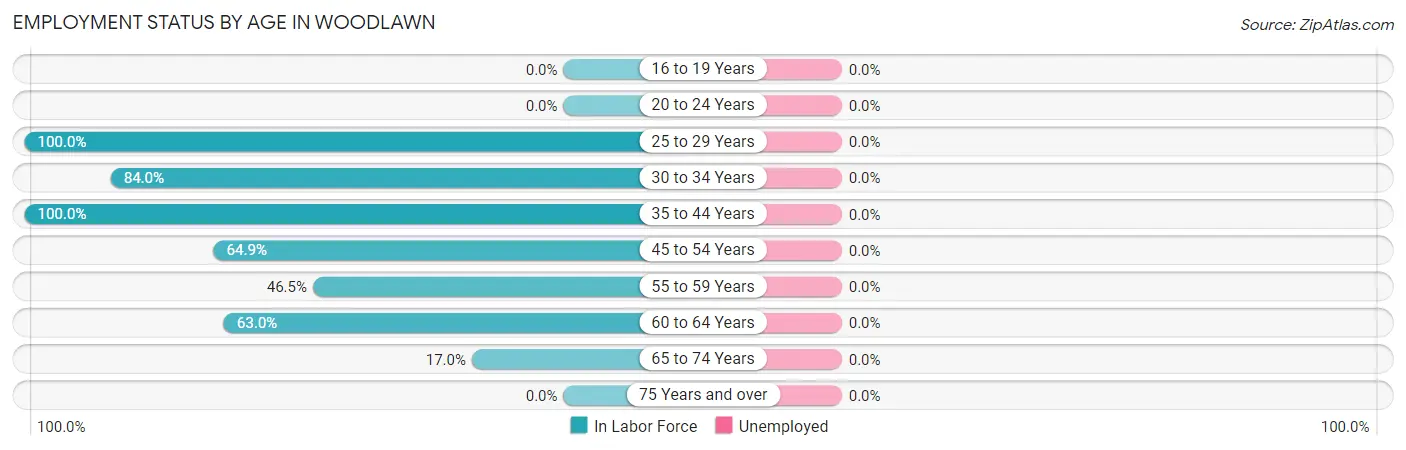
| Age Bracket | In Labor Force | Unemployed |
| 16 to 19 Years | 0 (0.0%) | 0 (0.0%) |
| 20 to 24 Years | 0 (0.0%) | 0 (0.0%) |
| 25 to 29 Years | 83 (100.0%) | 0 (0.0%) |
| 30 to 34 Years | 42 (84.0%) | 0 (0.0%) |
| 35 to 44 Years | 36 (100.0%) | 0 (0.0%) |
| 45 to 54 Years | 100 (64.9%) | 0 (0.0%) |
| 55 to 59 Years | 20 (46.5%) | 0 (0.0%) |
| 60 to 64 Years | 92 (63.0%) | 0 (0.0%) |
| 65 to 74 Years | 53 (17.0%) | 0 (0.0%) |
| 75 Years and over | 0 (0.0%) | 0 (0.0%) |
| Total | 426 (48.4%) | 0 (0.0%) |
Employment Status by Educational Attainment in Woodlawn
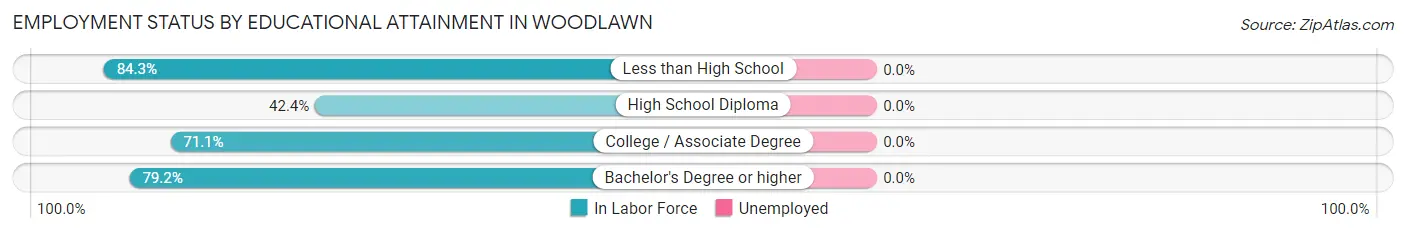
| Educational Attainment | In Labor Force | Unemployed |
| Less than High School | 43 (84.3%) | 0 (0.0%) |
| High School Diploma | 28 (42.4%) | 0 (0.0%) |
| College / Associate Degree | 96 (71.1%) | 0 (0.0%) |
| Bachelor's Degree or higher | 206 (79.2%) | 0 (0.0%) |
| Total | 373 (72.9%) | 0 (0.0%) |
Employment Occupations by Sex in Woodlawn
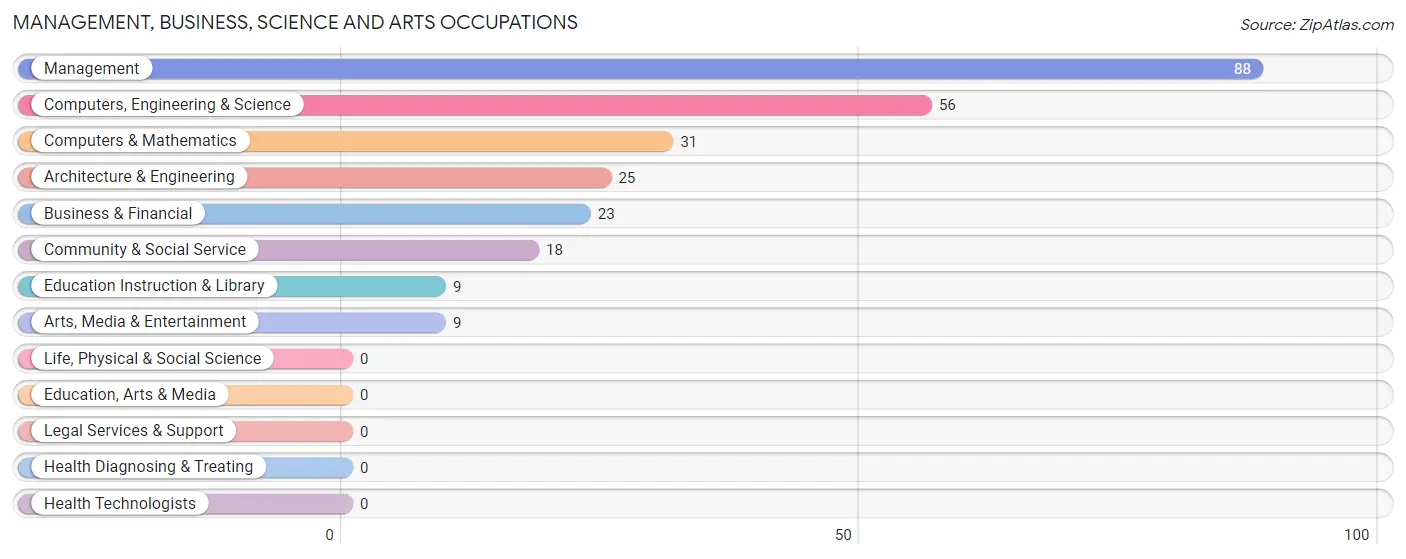
Management, Business, Science and Arts Occupations
The most common Management, Business, Science and Arts occupations in Woodlawn are Management (88 | 20.7%), Computers, Engineering & Science (56 | 13.2%), Computers & Mathematics (31 | 7.3%), Architecture & Engineering (25 | 5.9%), and Business & Financial (23 | 5.4%).
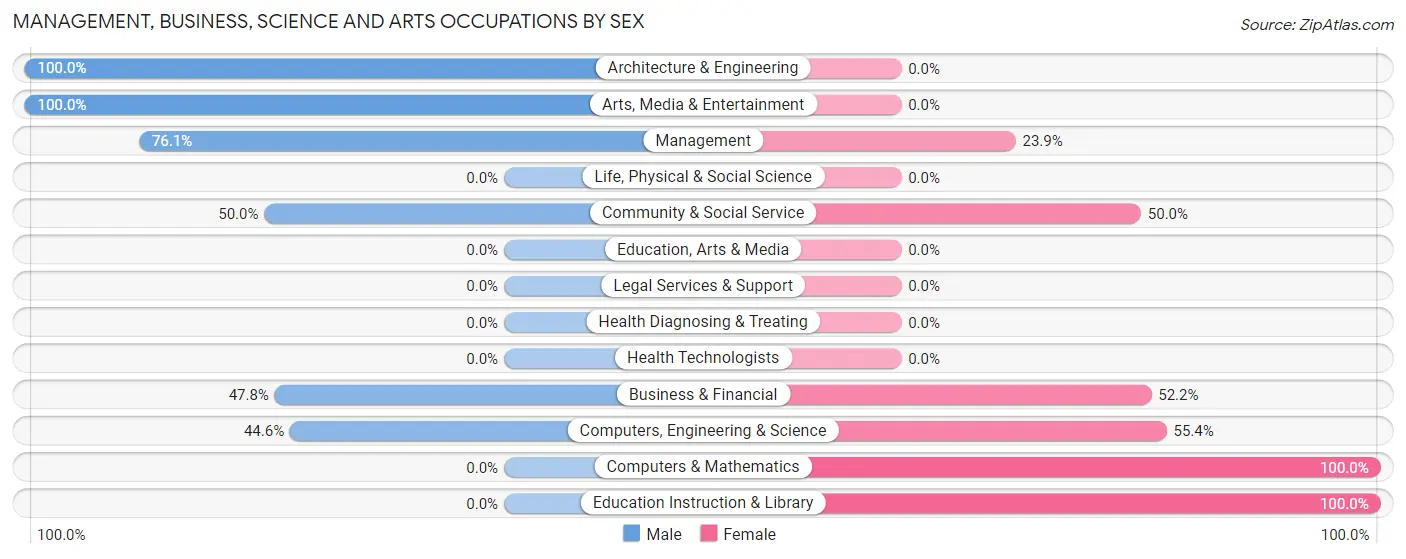
Management, Business, Science and Arts Occupations by Sex
Within the Management, Business, Science and Arts occupations in Woodlawn, the most male-oriented occupations are Architecture & Engineering (100.0%), Arts, Media & Entertainment (100.0%), and Management (76.1%), while the most female-oriented occupations are Computers & Mathematics (100.0%), Education Instruction & Library (100.0%), and Computers, Engineering & Science (55.4%).
| Occupation | Male | Female |
| Management | 67 (76.1%) | 21 (23.9%) |
| Business & Financial | 11 (47.8%) | 12 (52.2%) |
| Computers, Engineering & Science | 25 (44.6%) | 31 (55.4%) |
| Computers & Mathematics | 0 (0.0%) | 31 (100.0%) |
| Architecture & Engineering | 25 (100.0%) | 0 (0.0%) |
| Life, Physical & Social Science | 0 (0.0%) | 0 (0.0%) |
| Community & Social Service | 9 (50.0%) | 9 (50.0%) |
| Education, Arts & Media | 0 (0.0%) | 0 (0.0%) |
| Legal Services & Support | 0 (0.0%) | 0 (0.0%) |
| Education Instruction & Library | 0 (0.0%) | 9 (100.0%) |
| Arts, Media & Entertainment | 9 (100.0%) | 0 (0.0%) |
| Health Diagnosing & Treating | 0 (0.0%) | 0 (0.0%) |
| Health Technologists | 0 (0.0%) | 0 (0.0%) |
| Total (Category) | 112 (60.5%) | 73 (39.5%) |
| Total (Overall) | 247 (58.0%) | 179 (42.0%) |
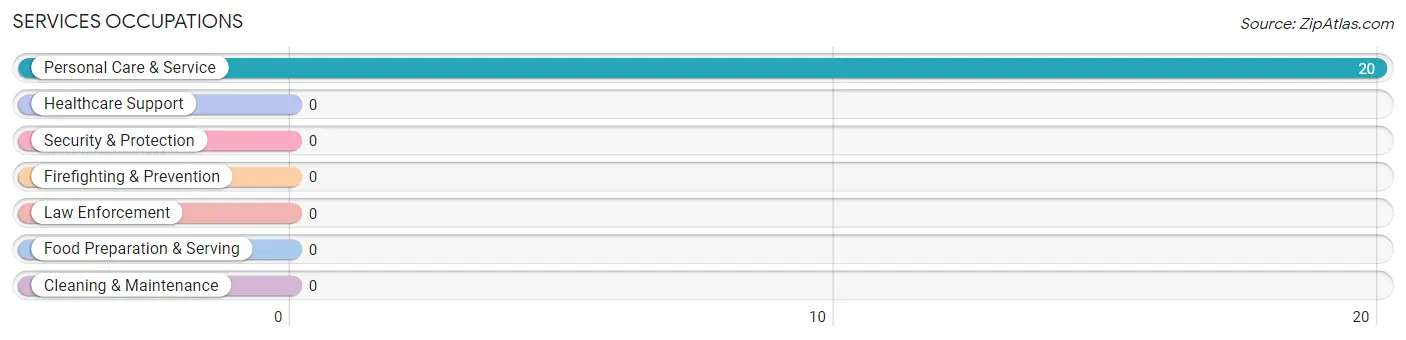
Services Occupations
The most common Services occupations in Woodlawn are , and Personal Care & Service (20 | 4.7%).
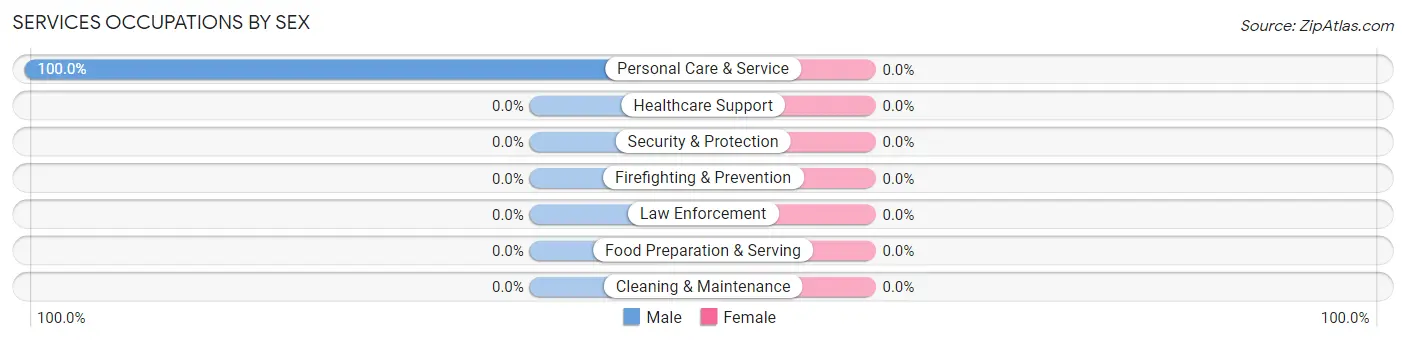
Services Occupations by Sex
| Occupation | Male | Female |
| Healthcare Support | 0 (0.0%) | 0 (0.0%) |
| Security & Protection | 0 (0.0%) | 0 (0.0%) |
| Firefighting & Prevention | 0 (0.0%) | 0 (0.0%) |
| Law Enforcement | 0 (0.0%) | 0 (0.0%) |
| Food Preparation & Serving | 0 (0.0%) | 0 (0.0%) |
| Cleaning & Maintenance | 0 (0.0%) | 0 (0.0%) |
| Personal Care & Service | 20 (100.0%) | 0 (0.0%) |
| Total (Category) | 20 (100.0%) | 0 (0.0%) |
| Total (Overall) | 247 (58.0%) | 179 (42.0%) |
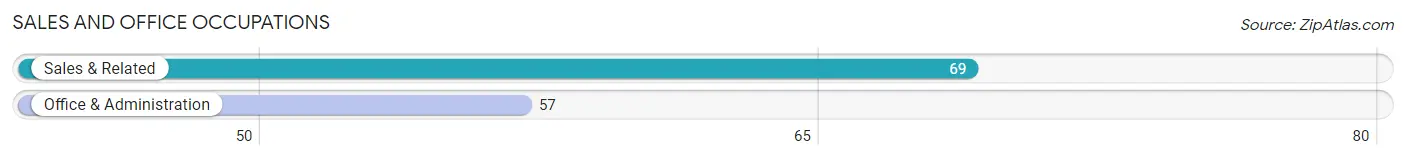
Sales and Office Occupations
The most common Sales and Office occupations in Woodlawn are Sales & Related (69 | 16.2%), and Office & Administration (57 | 13.4%).
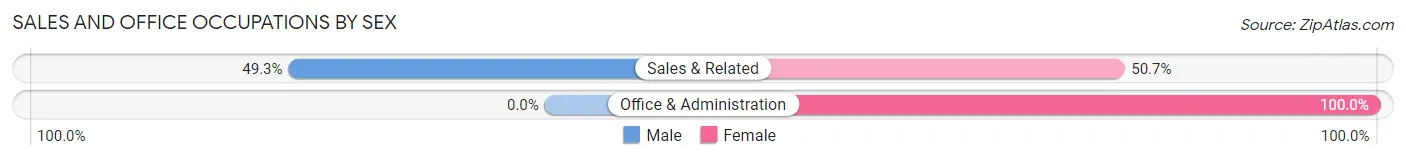
Sales and Office Occupations by Sex
| Occupation | Male | Female |
| Sales & Related | 34 (49.3%) | 35 (50.7%) |
| Office & Administration | 0 (0.0%) | 57 (100.0%) |
| Total (Category) | 34 (27.0%) | 92 (73.0%) |
| Total (Overall) | 247 (58.0%) | 179 (42.0%) |
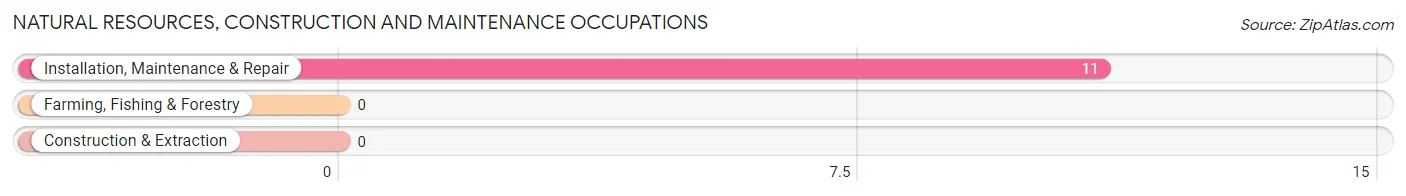
Natural Resources, Construction and Maintenance Occupations
The most common Natural Resources, Construction and Maintenance occupations in Woodlawn are , and Installation, Maintenance & Repair (11 | 2.6%).
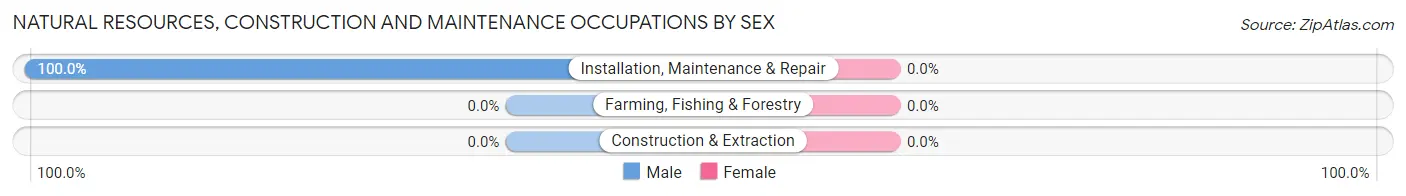
Natural Resources, Construction and Maintenance Occupations by Sex
| Occupation | Male | Female |
| Farming, Fishing & Forestry | 0 (0.0%) | 0 (0.0%) |
| Construction & Extraction | 0 (0.0%) | 0 (0.0%) |
| Installation, Maintenance & Repair | 11 (100.0%) | 0 (0.0%) |
| Total (Category) | 11 (100.0%) | 0 (0.0%) |
| Total (Overall) | 247 (58.0%) | 179 (42.0%) |
Production, Transportation and Moving Occupations
The most common Production, Transportation and Moving occupations in Woodlawn are Transportation (53 | 12.4%), and Material Moving (31 | 7.3%).
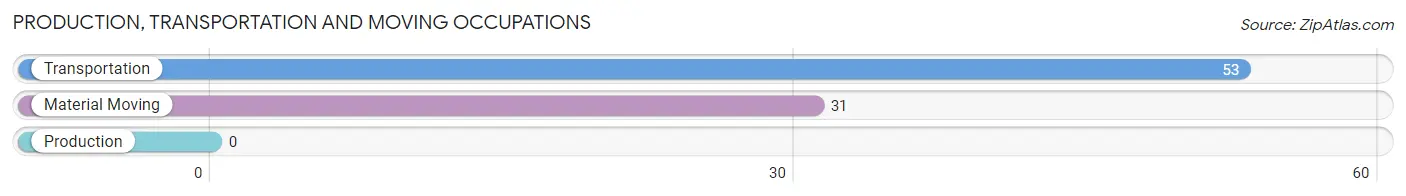
Production, Transportation and Moving Occupations by Sex
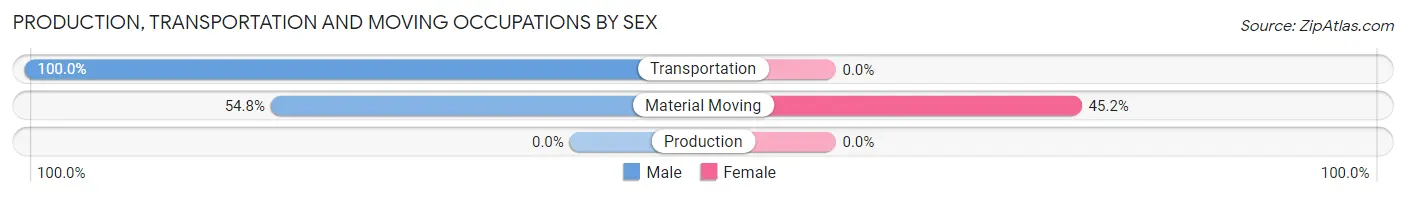
| Occupation | Male | Female |
| Production | 0 (0.0%) | 0 (0.0%) |
| Transportation | 53 (100.0%) | 0 (0.0%) |
| Material Moving | 17 (54.8%) | 14 (45.2%) |
| Total (Category) | 70 (83.3%) | 14 (16.7%) |
| Total (Overall) | 247 (58.0%) | 179 (42.0%) |
Employment Industries by Sex in Woodlawn
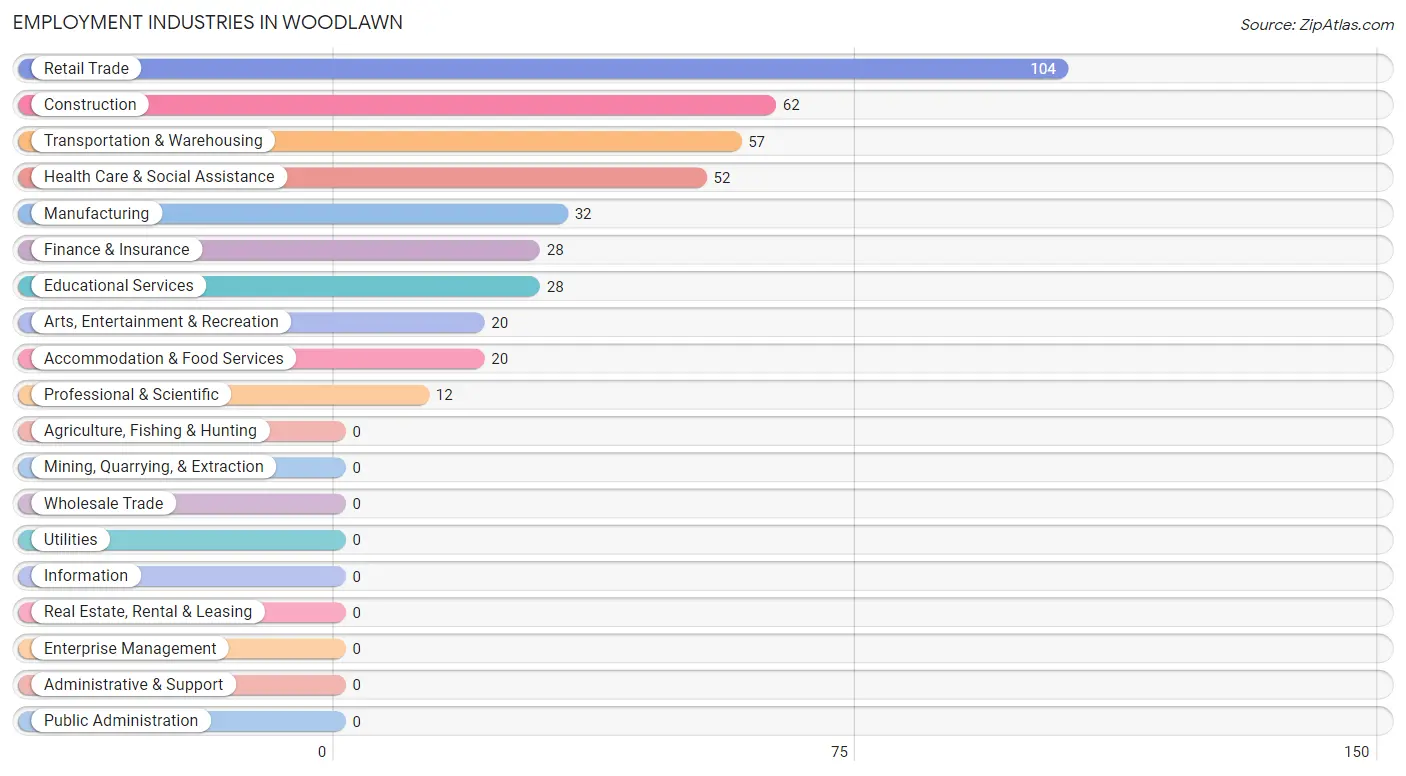
Employment Industries in Woodlawn
The major employment industries in Woodlawn include Retail Trade (104 | 24.4%), Construction (62 | 14.5%), Transportation & Warehousing (57 | 13.4%), Health Care & Social Assistance (52 | 12.2%), and Manufacturing (32 | 7.5%).
Employment Industries by Sex in Woodlawn
The Woodlawn industries that see more men than women are Construction (100.0%), Arts, Entertainment & Recreation (100.0%), and Accommodation & Food Services (100.0%), whereas the industries that tend to have a higher number of women are Finance & Insurance (100.0%), Professional & Scientific (100.0%), and Educational Services (100.0%).
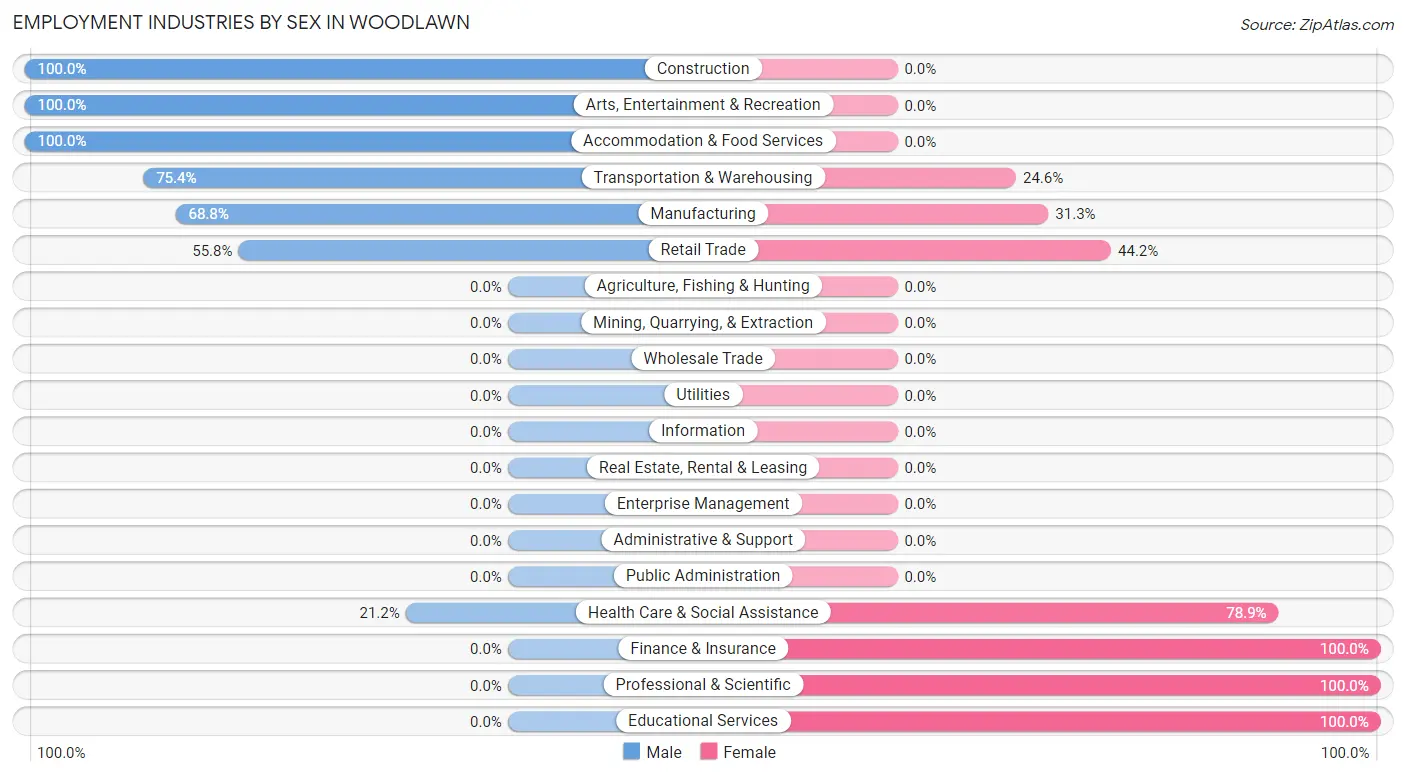
| Industry | Male | Female |
| Agriculture, Fishing & Hunting | 0 (0.0%) | 0 (0.0%) |
| Mining, Quarrying, & Extraction | 0 (0.0%) | 0 (0.0%) |
| Construction | 62 (100.0%) | 0 (0.0%) |
| Manufacturing | 22 (68.8%) | 10 (31.2%) |
| Wholesale Trade | 0 (0.0%) | 0 (0.0%) |
| Retail Trade | 58 (55.8%) | 46 (44.2%) |
| Transportation & Warehousing | 43 (75.4%) | 14 (24.6%) |
| Utilities | 0 (0.0%) | 0 (0.0%) |
| Information | 0 (0.0%) | 0 (0.0%) |
| Finance & Insurance | 0 (0.0%) | 28 (100.0%) |
| Real Estate, Rental & Leasing | 0 (0.0%) | 0 (0.0%) |
| Professional & Scientific | 0 (0.0%) | 12 (100.0%) |
| Enterprise Management | 0 (0.0%) | 0 (0.0%) |
| Administrative & Support | 0 (0.0%) | 0 (0.0%) |
| Educational Services | 0 (0.0%) | 28 (100.0%) |
| Health Care & Social Assistance | 11 (21.1%) | 41 (78.8%) |
| Arts, Entertainment & Recreation | 20 (100.0%) | 0 (0.0%) |
| Accommodation & Food Services | 20 (100.0%) | 0 (0.0%) |
| Public Administration | 0 (0.0%) | 0 (0.0%) |
| Total | 247 (58.0%) | 179 (42.0%) |
Education in Woodlawn
School Enrollment in Woodlawn
The most common levels of schooling among the 46 students in Woodlawn are middle school (19 | 41.3%), elementary school (18 | 39.1%), and nursery / preschool (9 | 19.6%).
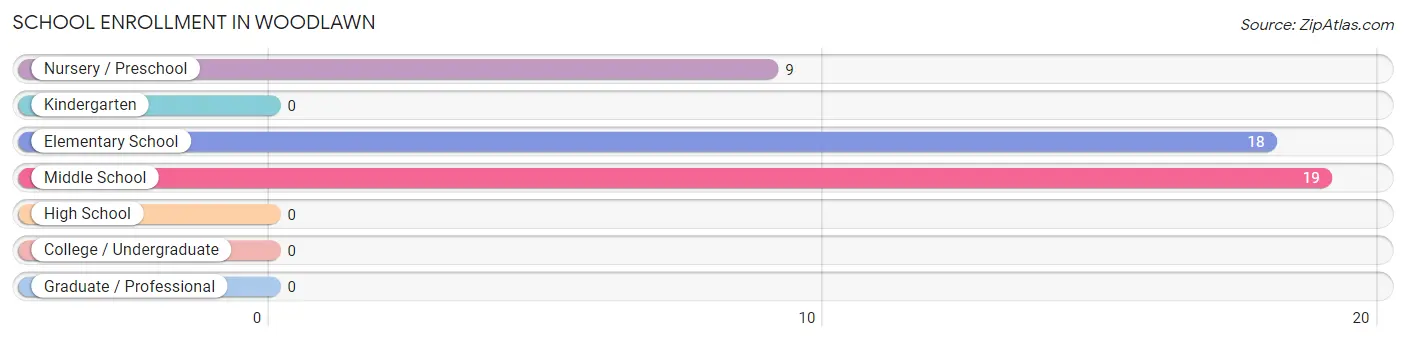
| School Level | # Students | % Students |
| Nursery / Preschool | 9 | 19.6% |
| Kindergarten | 0 | 0.0% |
| Elementary School | 18 | 39.1% |
| Middle School | 19 | 41.3% |
| High School | 0 | 0.0% |
| College / Undergraduate | 0 | 0.0% |
| Graduate / Professional | 0 | 0.0% |
| Total | 46 | 100.0% |
School Enrollment by Age by Funding Source in Woodlawn
Out of a total of 46 students who are enrolled in schools in Woodlawn, 9 (19.6%) attend a private institution, while the remaining 37 (80.4%) are enrolled in public schools. The age group of 3 to 4 year olds has the highest likelihood of being enrolled in private schools, with 9 (100.0% in the age bracket) enrolled. Conversely, the age group of 5 to 9 year old has the lowest likelihood of being enrolled in a private school, with 18 (100.0% in the age bracket) attending a public institution.
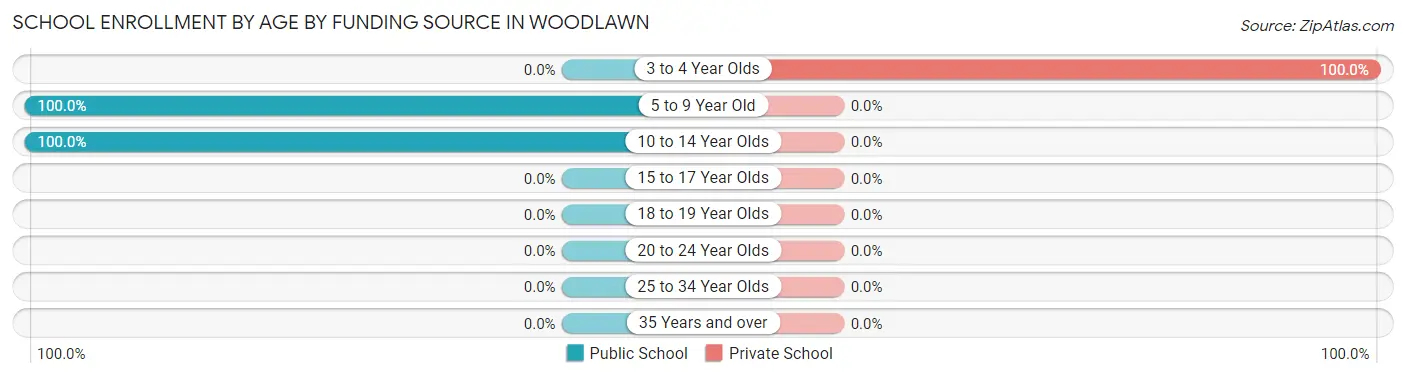
| Age Bracket | Public School | Private School |
| 3 to 4 Year Olds | 0 (0.0%) | 9 (100.0%) |
| 5 to 9 Year Old | 18 (100.0%) | 0 (0.0%) |
| 10 to 14 Year Olds | 19 (100.0%) | 0 (0.0%) |
| 15 to 17 Year Olds | 0 (0.0%) | 0 (0.0%) |
| 18 to 19 Year Olds | 0 (0.0%) | 0 (0.0%) |
| 20 to 24 Year Olds | 0 (0.0%) | 0 (0.0%) |
| 25 to 34 Year Olds | 0 (0.0%) | 0 (0.0%) |
| 35 Years and over | 0 (0.0%) | 0 (0.0%) |
| Total | 37 (80.4%) | 9 (19.6%) |
Educational Attainment by Field of Study in Woodlawn
Arts & humanities (60 | 19.1%), bio, nature & agricultural (53 | 16.9%), multidisciplinary studies (42 | 13.4%), business (40 | 12.7%), and science & technology (28 | 8.9%) are the most common fields of study among 314 individuals in Woodlawn who have obtained a bachelor's degree or higher.
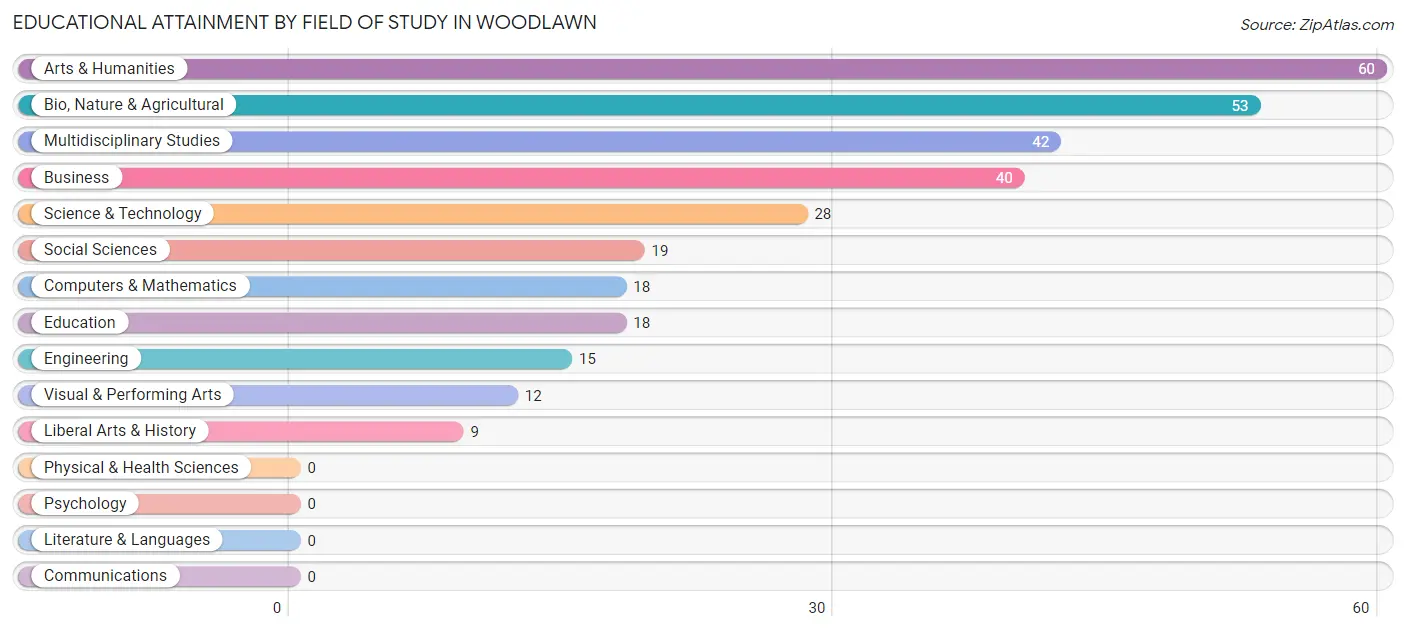
| Field of Study | # Graduates | % Graduates |
| Computers & Mathematics | 18 | 5.7% |
| Bio, Nature & Agricultural | 53 | 16.9% |
| Physical & Health Sciences | 0 | 0.0% |
| Psychology | 0 | 0.0% |
| Social Sciences | 19 | 6.0% |
| Engineering | 15 | 4.8% |
| Multidisciplinary Studies | 42 | 13.4% |
| Science & Technology | 28 | 8.9% |
| Business | 40 | 12.7% |
| Education | 18 | 5.7% |
| Literature & Languages | 0 | 0.0% |
| Liberal Arts & History | 9 | 2.9% |
| Visual & Performing Arts | 12 | 3.8% |
| Communications | 0 | 0.0% |
| Arts & Humanities | 60 | 19.1% |
| Total | 314 | 100.0% |
Transportation & Commute in Woodlawn
Vehicle Availability by Sex in Woodlawn
The most prevalent vehicle ownership categories in Woodlawn are males with 2 vehicles (146, accounting for 59.1%) and females with 2 vehicles (99, making up 81.6%).
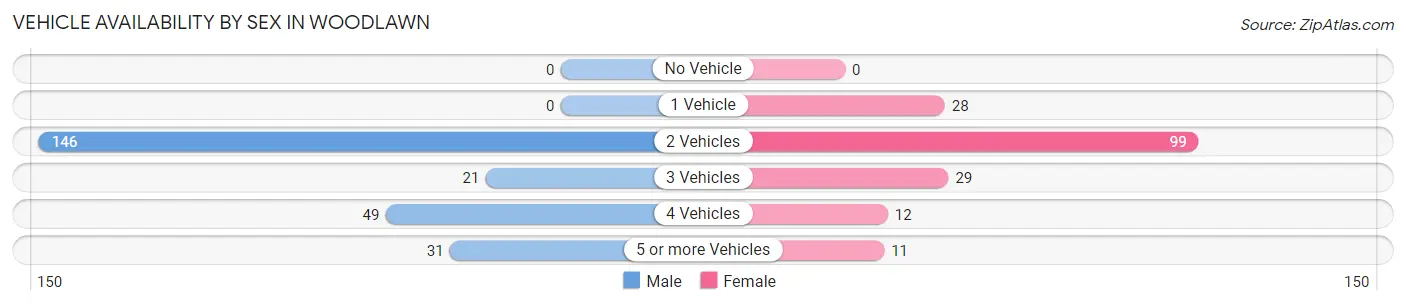
| Vehicles Available | Male | Female |
| No Vehicle | 0 (0.0%) | 0 (0.0%) |
| 1 Vehicle | 0 (0.0%) | 28 (15.6%) |
| 2 Vehicles | 146 (59.1%) | 99 (55.3%) |
| 3 Vehicles | 21 (8.5%) | 29 (16.2%) |
| 4 Vehicles | 49 (19.8%) | 12 (6.7%) |
| 5 or more Vehicles | 31 (12.6%) | 11 (6.1%) |
| Total | 247 (100.0%) | 179 (100.0%) |
Commute Time in Woodlawn
The most frequently occuring commute durations in Woodlawn are 30 to 34 minutes (83 commuters, 21.8%), 40 to 44 minutes (67 commuters, 17.6%), and 45 to 59 minutes (64 commuters, 16.8%).
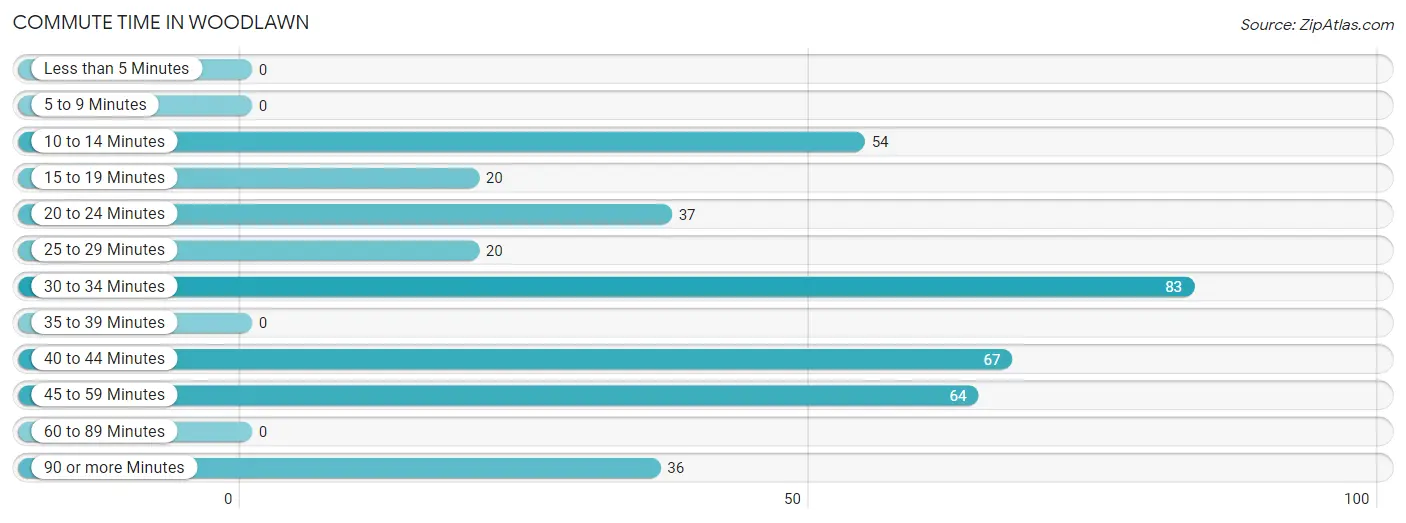
| Commute Time | # Commuters | % Commuters |
| Less than 5 Minutes | 0 | 0.0% |
| 5 to 9 Minutes | 0 | 0.0% |
| 10 to 14 Minutes | 54 | 14.2% |
| 15 to 19 Minutes | 20 | 5.2% |
| 20 to 24 Minutes | 37 | 9.7% |
| 25 to 29 Minutes | 20 | 5.2% |
| 30 to 34 Minutes | 83 | 21.8% |
| 35 to 39 Minutes | 0 | 0.0% |
| 40 to 44 Minutes | 67 | 17.6% |
| 45 to 59 Minutes | 64 | 16.8% |
| 60 to 89 Minutes | 0 | 0.0% |
| 90 or more Minutes | 36 | 9.5% |
Commute Time by Sex in Woodlawn
The most common commute times in Woodlawn are 45 to 59 minutes (54 commuters, 24.1%) for males and 30 to 34 minutes (63 commuters, 40.1%) for females.
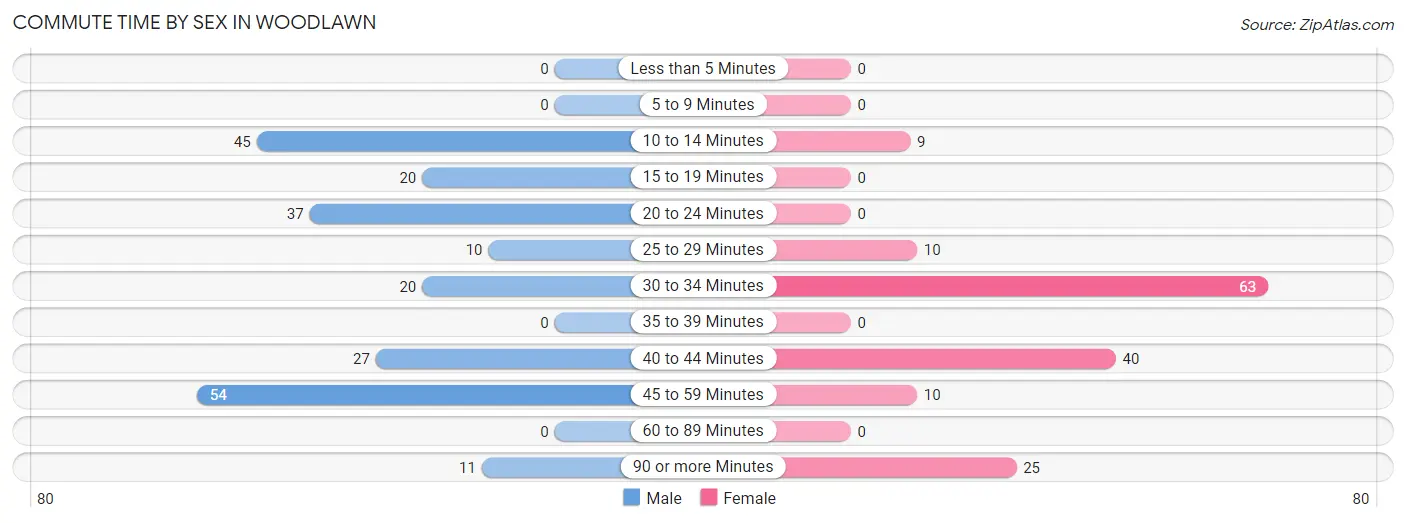
| Commute Time | Male | Female |
| Less than 5 Minutes | 0 (0.0%) | 0 (0.0%) |
| 5 to 9 Minutes | 0 (0.0%) | 0 (0.0%) |
| 10 to 14 Minutes | 45 (20.1%) | 9 (5.7%) |
| 15 to 19 Minutes | 20 (8.9%) | 0 (0.0%) |
| 20 to 24 Minutes | 37 (16.5%) | 0 (0.0%) |
| 25 to 29 Minutes | 10 (4.5%) | 10 (6.4%) |
| 30 to 34 Minutes | 20 (8.9%) | 63 (40.1%) |
| 35 to 39 Minutes | 0 (0.0%) | 0 (0.0%) |
| 40 to 44 Minutes | 27 (12.0%) | 40 (25.5%) |
| 45 to 59 Minutes | 54 (24.1%) | 10 (6.4%) |
| 60 to 89 Minutes | 0 (0.0%) | 0 (0.0%) |
| 90 or more Minutes | 11 (4.9%) | 25 (15.9%) |
Time of Departure to Work by Sex in Woodlawn
The most frequent times of departure to work in Woodlawn are 7:00 AM to 7:29 AM (95, 42.4%) for males and 5:30 AM to 5:59 AM (40, 25.5%) for females.
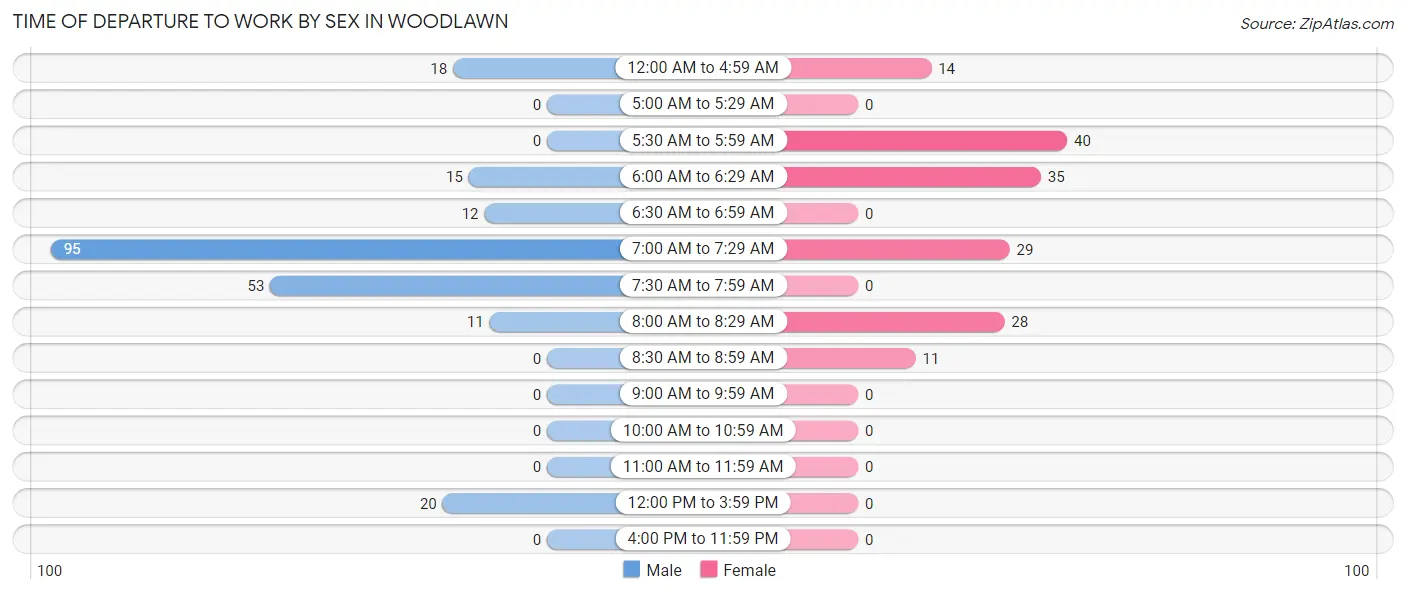
| Time of Departure | Male | Female |
| 12:00 AM to 4:59 AM | 18 (8.0%) | 14 (8.9%) |
| 5:00 AM to 5:29 AM | 0 (0.0%) | 0 (0.0%) |
| 5:30 AM to 5:59 AM | 0 (0.0%) | 40 (25.5%) |
| 6:00 AM to 6:29 AM | 15 (6.7%) | 35 (22.3%) |
| 6:30 AM to 6:59 AM | 12 (5.4%) | 0 (0.0%) |
| 7:00 AM to 7:29 AM | 95 (42.4%) | 29 (18.5%) |
| 7:30 AM to 7:59 AM | 53 (23.7%) | 0 (0.0%) |
| 8:00 AM to 8:29 AM | 11 (4.9%) | 28 (17.8%) |
| 8:30 AM to 8:59 AM | 0 (0.0%) | 11 (7.0%) |
| 9:00 AM to 9:59 AM | 0 (0.0%) | 0 (0.0%) |
| 10:00 AM to 10:59 AM | 0 (0.0%) | 0 (0.0%) |
| 11:00 AM to 11:59 AM | 0 (0.0%) | 0 (0.0%) |
| 12:00 PM to 3:59 PM | 20 (8.9%) | 0 (0.0%) |
| 4:00 PM to 11:59 PM | 0 (0.0%) | 0 (0.0%) |
| Total | 224 (100.0%) | 157 (100.0%) |
Housing Occupancy in Woodlawn
Occupancy by Ownership in Woodlawn
Of the total 521 dwellings in Woodlawn, owner-occupied units account for 482 (92.5%), while renter-occupied units make up 39 (7.5%).
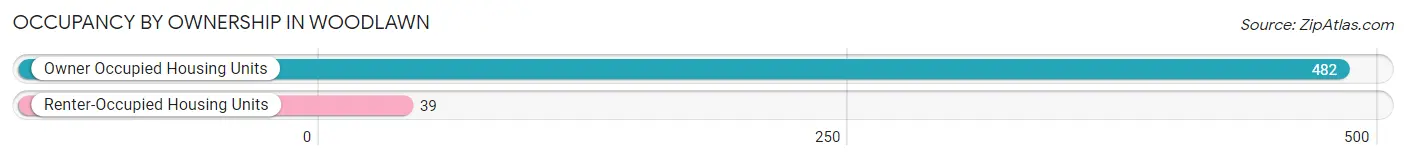
| Occupancy | # Housing Units | % Housing Units |
| Owner Occupied Housing Units | 482 | 92.5% |
| Renter-Occupied Housing Units | 39 | 7.5% |
| Total Occupied Housing Units | 521 | 100.0% |
Occupancy by Household Size in Woodlawn
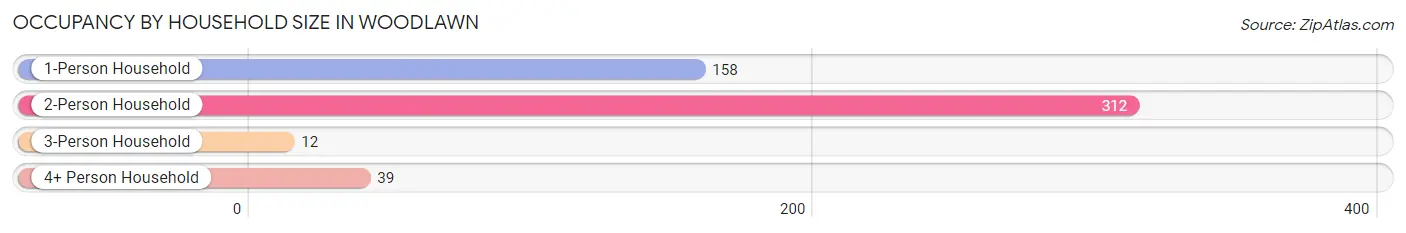
| Household Size | # Housing Units | % Housing Units |
| 1-Person Household | 158 | 30.3% |
| 2-Person Household | 312 | 59.9% |
| 3-Person Household | 12 | 2.3% |
| 4+ Person Household | 39 | 7.5% |
| Total Housing Units | 521 | 100.0% |
Occupancy by Ownership by Household Size in Woodlawn
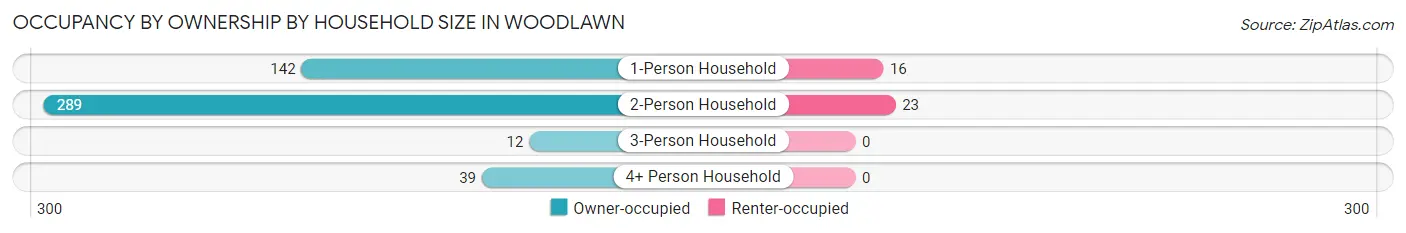
| Household Size | Owner-occupied | Renter-occupied |
| 1-Person Household | 142 (89.9%) | 16 (10.1%) |
| 2-Person Household | 289 (92.6%) | 23 (7.4%) |
| 3-Person Household | 12 (100.0%) | 0 (0.0%) |
| 4+ Person Household | 39 (100.0%) | 0 (0.0%) |
| Total Housing Units | 482 (92.5%) | 39 (7.5%) |
Occupancy by Educational Attainment in Woodlawn
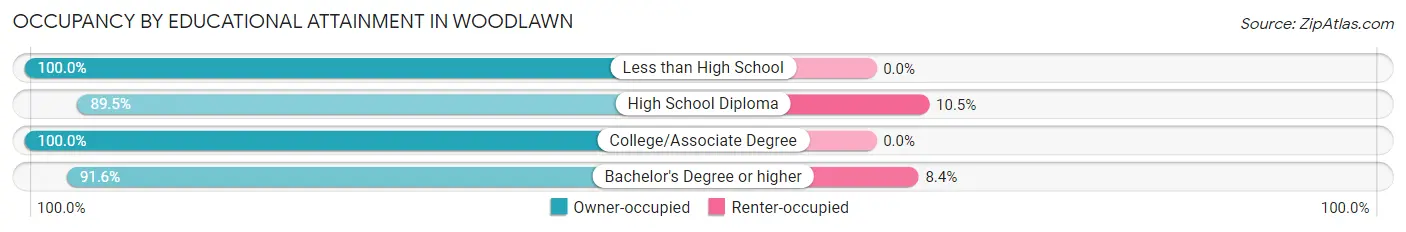
| Household Size | Owner-occupied | Renter-occupied |
| Less than High School | 51 (100.0%) | 0 (0.0%) |
| High School Diploma | 196 (89.5%) | 23 (10.5%) |
| College/Associate Degree | 60 (100.0%) | 0 (0.0%) |
| Bachelor's Degree or higher | 175 (91.6%) | 16 (8.4%) |
Occupancy by Age of Householder in Woodlawn
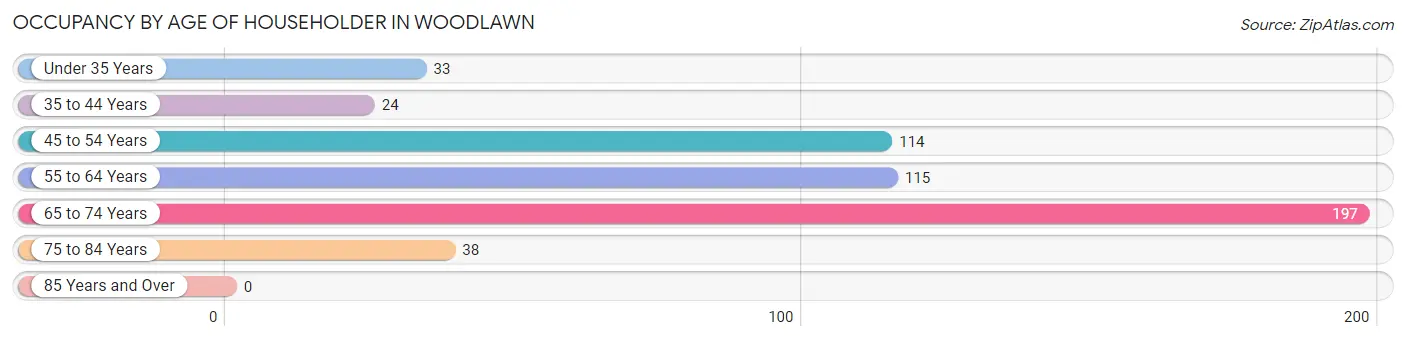
| Age Bracket | # Households | % Households |
| Under 35 Years | 33 | 6.3% |
| 35 to 44 Years | 24 | 4.6% |
| 45 to 54 Years | 114 | 21.9% |
| 55 to 64 Years | 115 | 22.1% |
| 65 to 74 Years | 197 | 37.8% |
| 75 to 84 Years | 38 | 7.3% |
| 85 Years and Over | 0 | 0.0% |
| Total | 521 | 100.0% |
Housing Finances in Woodlawn
Median Income by Occupancy in Woodlawn
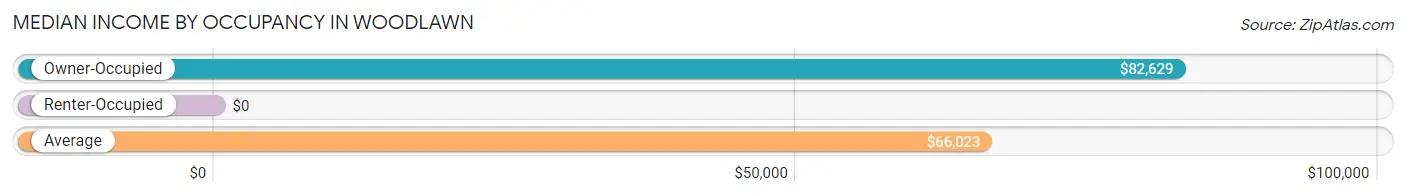
| Occupancy Type | # Households | Median Income |
| Owner-Occupied | 482 (92.5%) | $82,629 |
| Renter-Occupied | 39 (7.5%) | $0 |
| Average | 521 (100.0%) | $66,023 |
Occupancy by Householder Income Bracket in Woodlawn
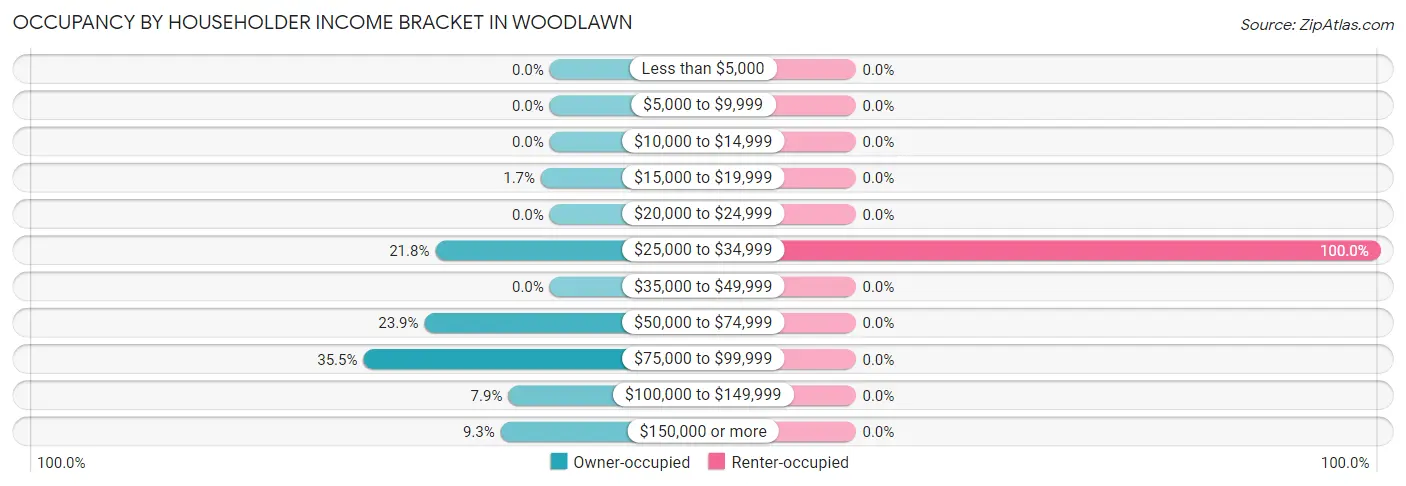
| Income Bracket | Owner-occupied | Renter-occupied |
| Less than $5,000 | 0 (0.0%) | 0 (0.0%) |
| $5,000 to $9,999 | 0 (0.0%) | 0 (0.0%) |
| $10,000 to $14,999 | 0 (0.0%) | 0 (0.0%) |
| $15,000 to $19,999 | 8 (1.7%) | 0 (0.0%) |
| $20,000 to $24,999 | 0 (0.0%) | 0 (0.0%) |
| $25,000 to $34,999 | 105 (21.8%) | 39 (100.0%) |
| $35,000 to $49,999 | 0 (0.0%) | 0 (0.0%) |
| $50,000 to $74,999 | 115 (23.9%) | 0 (0.0%) |
| $75,000 to $99,999 | 171 (35.5%) | 0 (0.0%) |
| $100,000 to $149,999 | 38 (7.9%) | 0 (0.0%) |
| $150,000 or more | 45 (9.3%) | 0 (0.0%) |
| Total | 482 (100.0%) | 39 (100.0%) |
Monthly Housing Cost Tiers in Woodlawn
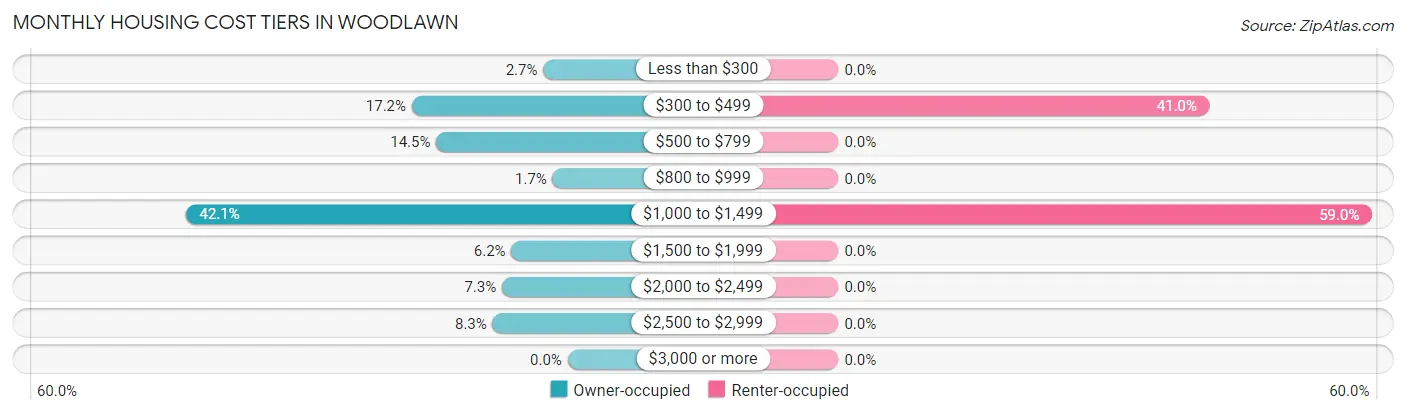
| Monthly Cost | Owner-occupied | Renter-occupied |
| Less than $300 | 13 (2.7%) | 0 (0.0%) |
| $300 to $499 | 83 (17.2%) | 16 (41.0%) |
| $500 to $799 | 70 (14.5%) | 0 (0.0%) |
| $800 to $999 | 8 (1.7%) | 0 (0.0%) |
| $1,000 to $1,499 | 203 (42.1%) | 23 (59.0%) |
| $1,500 to $1,999 | 30 (6.2%) | 0 (0.0%) |
| $2,000 to $2,499 | 35 (7.3%) | 0 (0.0%) |
| $2,500 to $2,999 | 40 (8.3%) | 0 (0.0%) |
| $3,000 or more | 0 (0.0%) | 0 (0.0%) |
| Total | 482 (100.0%) | 39 (100.0%) |
Physical Housing Characteristics in Woodlawn
Housing Structures in Woodlawn
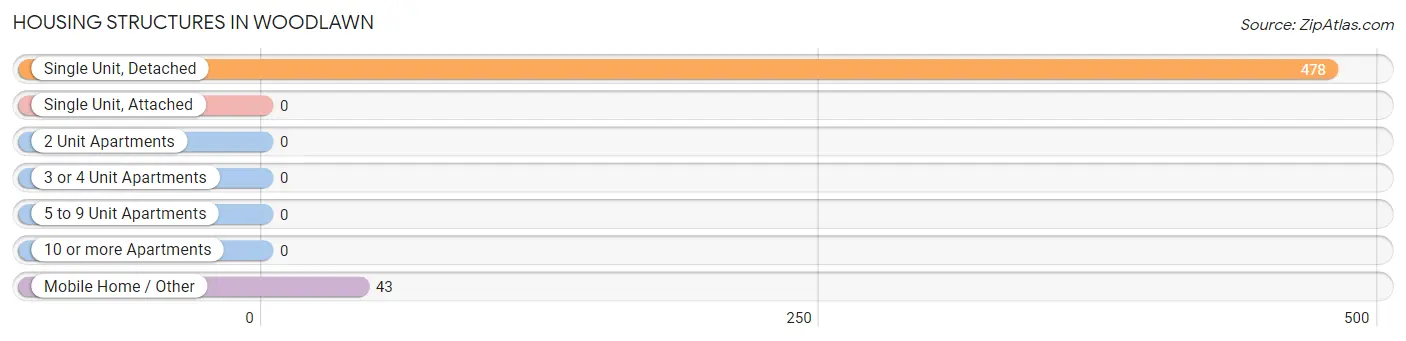
| Structure Type | # Housing Units | % Housing Units |
| Single Unit, Detached | 478 | 91.7% |
| Single Unit, Attached | 0 | 0.0% |
| 2 Unit Apartments | 0 | 0.0% |
| 3 or 4 Unit Apartments | 0 | 0.0% |
| 5 to 9 Unit Apartments | 0 | 0.0% |
| 10 or more Apartments | 0 | 0.0% |
| Mobile Home / Other | 43 | 8.3% |
| Total | 521 | 100.0% |
Housing Structures by Occupancy in Woodlawn
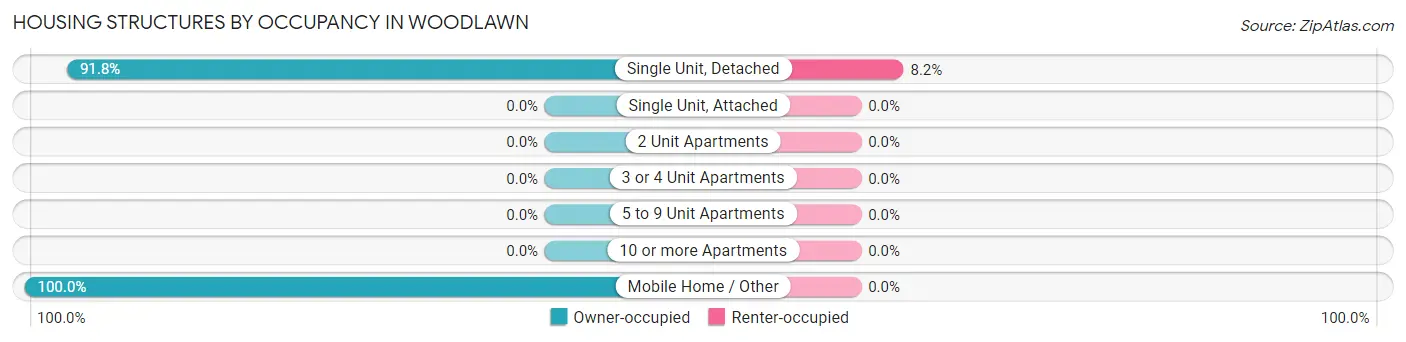
| Structure Type | Owner-occupied | Renter-occupied |
| Single Unit, Detached | 439 (91.8%) | 39 (8.2%) |
| Single Unit, Attached | 0 (0.0%) | 0 (0.0%) |
| 2 Unit Apartments | 0 (0.0%) | 0 (0.0%) |
| 3 or 4 Unit Apartments | 0 (0.0%) | 0 (0.0%) |
| 5 to 9 Unit Apartments | 0 (0.0%) | 0 (0.0%) |
| 10 or more Apartments | 0 (0.0%) | 0 (0.0%) |
| Mobile Home / Other | 43 (100.0%) | 0 (0.0%) |
| Total | 482 (92.5%) | 39 (7.5%) |
Housing Structures by Number of Rooms in Woodlawn
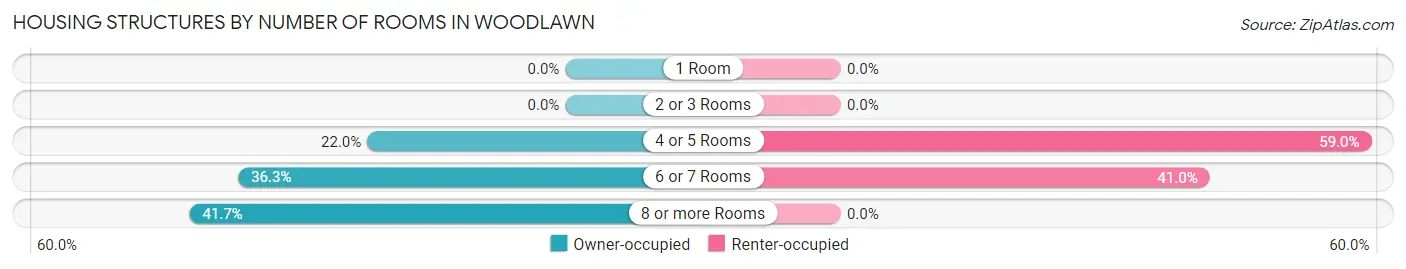
| Number of Rooms | Owner-occupied | Renter-occupied |
| 1 Room | 0 (0.0%) | 0 (0.0%) |
| 2 or 3 Rooms | 0 (0.0%) | 0 (0.0%) |
| 4 or 5 Rooms | 106 (22.0%) | 23 (59.0%) |
| 6 or 7 Rooms | 175 (36.3%) | 16 (41.0%) |
| 8 or more Rooms | 201 (41.7%) | 0 (0.0%) |
| Total | 482 (100.0%) | 39 (100.0%) |
Housing Structure by Heating Type in Woodlawn
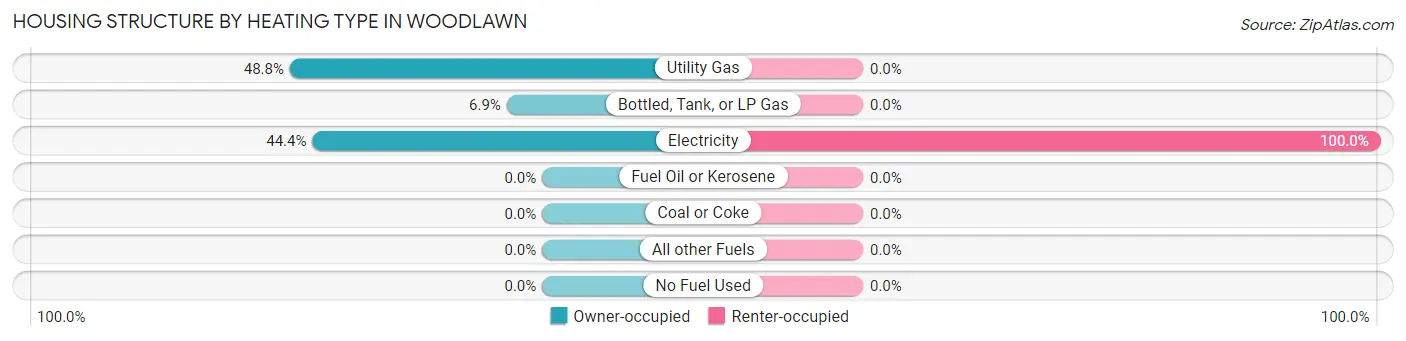
| Heating Type | Owner-occupied | Renter-occupied |
| Utility Gas | 235 (48.8%) | 0 (0.0%) |
| Bottled, Tank, or LP Gas | 33 (6.9%) | 0 (0.0%) |
| Electricity | 214 (44.4%) | 39 (100.0%) |
| Fuel Oil or Kerosene | 0 (0.0%) | 0 (0.0%) |
| Coal or Coke | 0 (0.0%) | 0 (0.0%) |
| All other Fuels | 0 (0.0%) | 0 (0.0%) |
| No Fuel Used | 0 (0.0%) | 0 (0.0%) |
| Total | 482 (100.0%) | 39 (100.0%) |
Household Vehicle Usage in Woodlawn
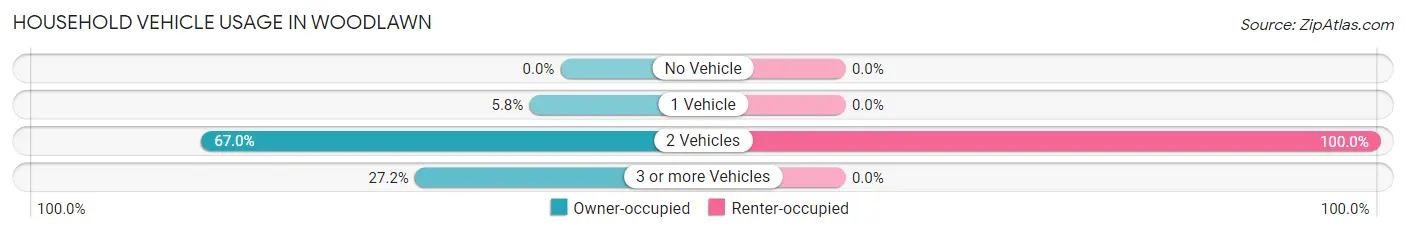
| Vehicles per Household | Owner-occupied | Renter-occupied |
| No Vehicle | 0 (0.0%) | 0 (0.0%) |
| 1 Vehicle | 28 (5.8%) | 0 (0.0%) |
| 2 Vehicles | 323 (67.0%) | 39 (100.0%) |
| 3 or more Vehicles | 131 (27.2%) | 0 (0.0%) |
| Total | 482 (100.0%) | 39 (100.0%) |
Real Estate & Mortgages in Woodlawn
Real Estate and Mortgage Overview in Woodlawn
| Characteristic | Without Mortgage | With Mortgage |
| Housing Units | 147 | 335 |
| Median Property Value | - | - |
| Median Household Income | $82,917 | $45 |
| Monthly Housing Costs | $438 | $0 |
| Real Estate Taxes | - | - |
Property Value by Mortgage Status in Woodlawn
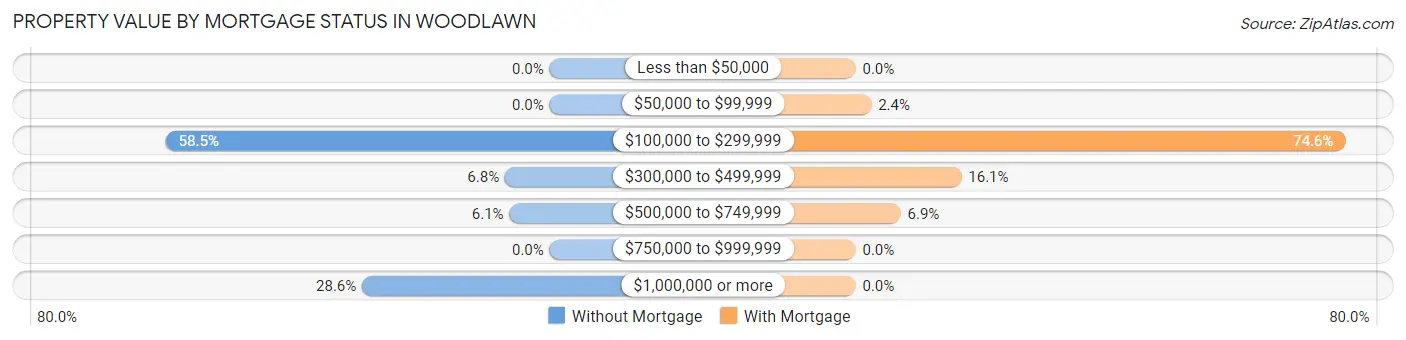
| Property Value | Without Mortgage | With Mortgage |
| Less than $50,000 | 0 (0.0%) | 0 (0.0%) |
| $50,000 to $99,999 | 0 (0.0%) | 8 (2.4%) |
| $100,000 to $299,999 | 86 (58.5%) | 250 (74.6%) |
| $300,000 to $499,999 | 10 (6.8%) | 54 (16.1%) |
| $500,000 to $749,999 | 9 (6.1%) | 23 (6.9%) |
| $750,000 to $999,999 | 0 (0.0%) | 0 (0.0%) |
| $1,000,000 or more | 42 (28.6%) | 0 (0.0%) |
| Total | 147 (100.0%) | 335 (100.0%) |
Household Income by Mortgage Status in Woodlawn
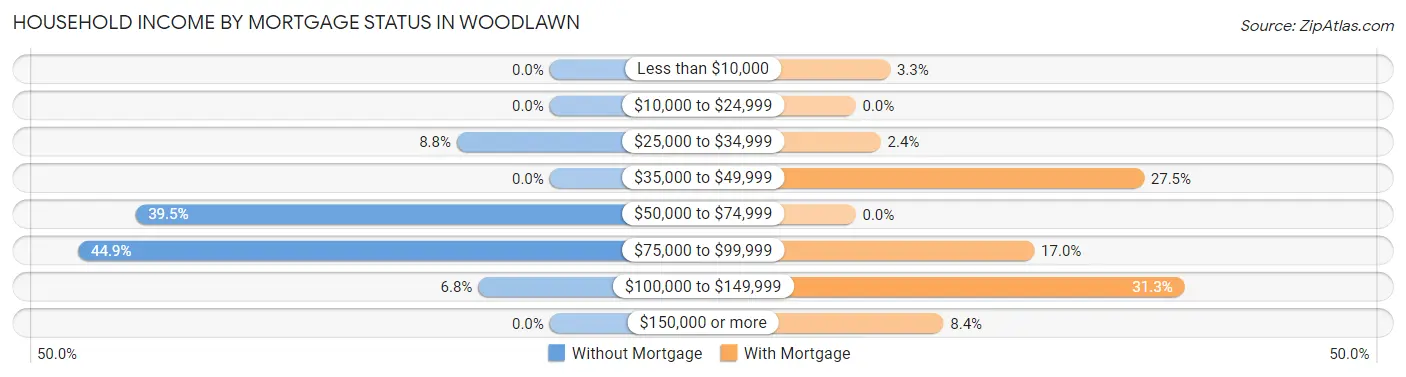
| Household Income | Without Mortgage | With Mortgage |
| Less than $10,000 | 0 (0.0%) | 11 (3.3%) |
| $10,000 to $24,999 | 0 (0.0%) | 0 (0.0%) |
| $25,000 to $34,999 | 13 (8.8%) | 8 (2.4%) |
| $35,000 to $49,999 | 0 (0.0%) | 92 (27.5%) |
| $50,000 to $74,999 | 58 (39.5%) | 0 (0.0%) |
| $75,000 to $99,999 | 66 (44.9%) | 57 (17.0%) |
| $100,000 to $149,999 | 10 (6.8%) | 105 (31.3%) |
| $150,000 or more | 0 (0.0%) | 28 (8.4%) |
| Total | 147 (100.0%) | 335 (100.0%) |
Property Value to Household Income Ratio in Woodlawn
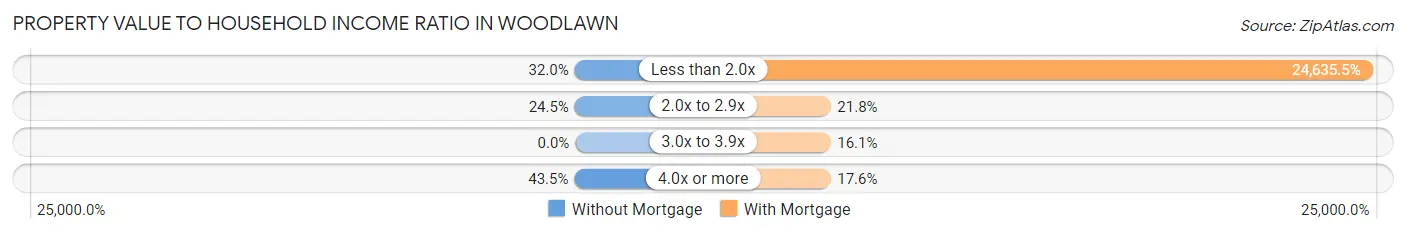
| Value-to-Income Ratio | Without Mortgage | With Mortgage |
| Less than 2.0x | 47 (32.0%) | 82,529 (24,635.5%) |
| 2.0x to 2.9x | 36 (24.5%) | 73 (21.8%) |
| 3.0x to 3.9x | 0 (0.0%) | 54 (16.1%) |
| 4.0x or more | 64 (43.5%) | 59 (17.6%) |
| Total | 147 (100.0%) | 335 (100.0%) |
Real Estate Taxes by Mortgage Status in Woodlawn
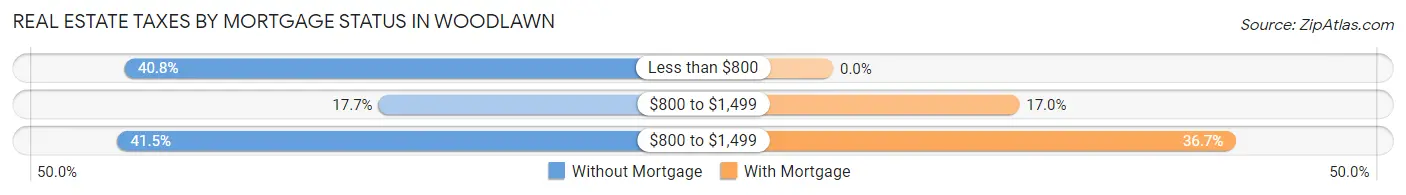
| Property Taxes | Without Mortgage | With Mortgage |
| Less than $800 | 60 (40.8%) | 0 (0.0%) |
| $800 to $1,499 | 26 (17.7%) | 57 (17.0%) |
| $800 to $1,499 | 61 (41.5%) | 123 (36.7%) |
| Total | 147 (100.0%) | 335 (100.0%) |
Health & Disability in Woodlawn
Health Insurance Coverage by Age in Woodlawn
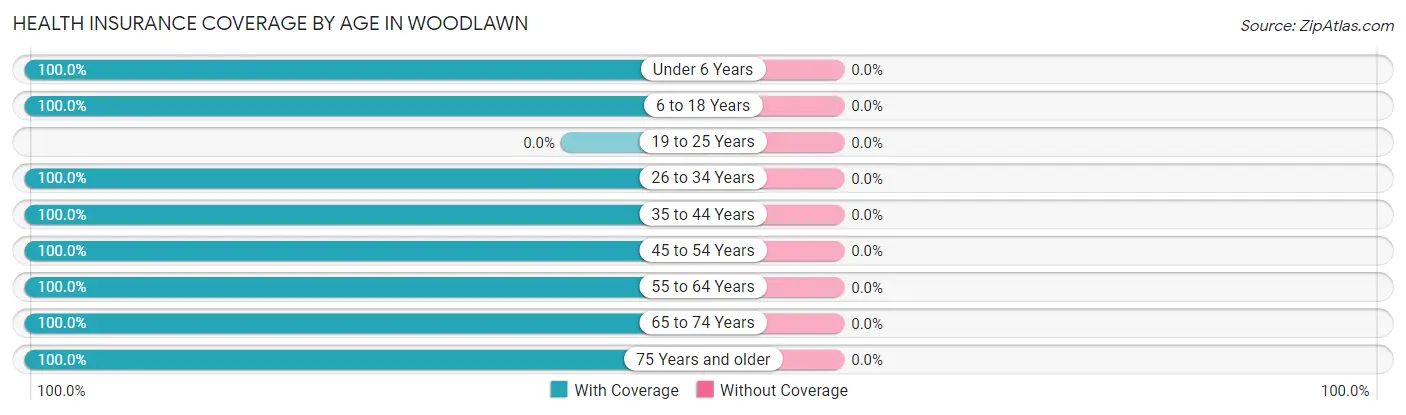
| Age Bracket | With Coverage | Without Coverage |
| Under 6 Years | 29 (100.0%) | 0 (0.0%) |
| 6 to 18 Years | 37 (100.0%) | 0 (0.0%) |
| 19 to 25 Years | 0 (0.0%) | 0 (0.0%) |
| 26 to 34 Years | 133 (100.0%) | 0 (0.0%) |
| 35 to 44 Years | 36 (100.0%) | 0 (0.0%) |
| 45 to 54 Years | 154 (100.0%) | 0 (0.0%) |
| 55 to 64 Years | 189 (100.0%) | 0 (0.0%) |
| 65 to 74 Years | 311 (100.0%) | 0 (0.0%) |
| 75 Years and older | 58 (100.0%) | 0 (0.0%) |
| Total | 947 (100.0%) | 0 (0.0%) |
Health Insurance Coverage by Citizenship Status in Woodlawn
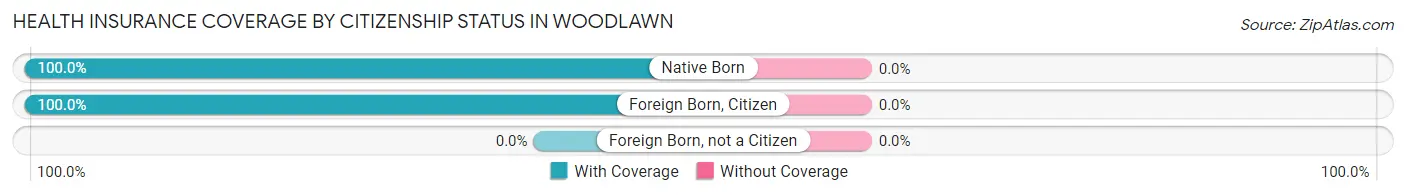
| Citizenship Status | With Coverage | Without Coverage |
| Native Born | 29 (100.0%) | 0 (0.0%) |
| Foreign Born, Citizen | 37 (100.0%) | 0 (0.0%) |
| Foreign Born, not a Citizen | 0 (0.0%) | 0 (0.0%) |
Health Insurance Coverage by Household Income in Woodlawn
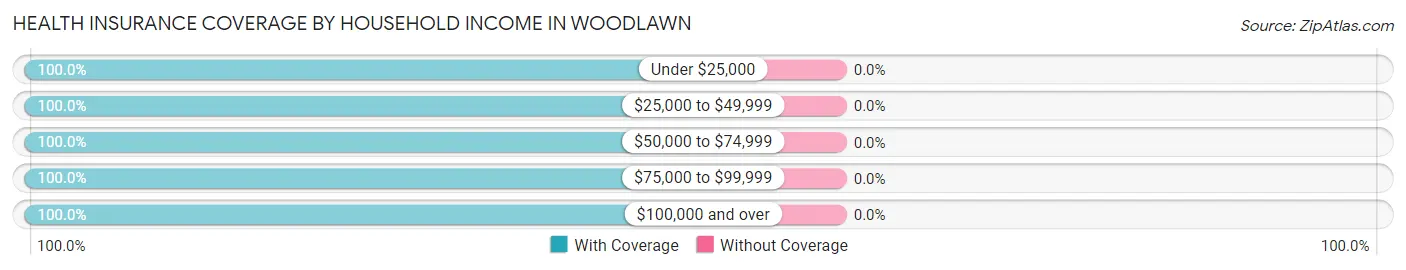
| Household Income | With Coverage | Without Coverage |
| Under $25,000 | 37 (100.0%) | 0 (0.0%) |
| $25,000 to $49,999 | 238 (100.0%) | 0 (0.0%) |
| $50,000 to $74,999 | 174 (100.0%) | 0 (0.0%) |
| $75,000 to $99,999 | 285 (100.0%) | 0 (0.0%) |
| $100,000 and over | 213 (100.0%) | 0 (0.0%) |
Public vs Private Health Insurance Coverage by Age in Woodlawn
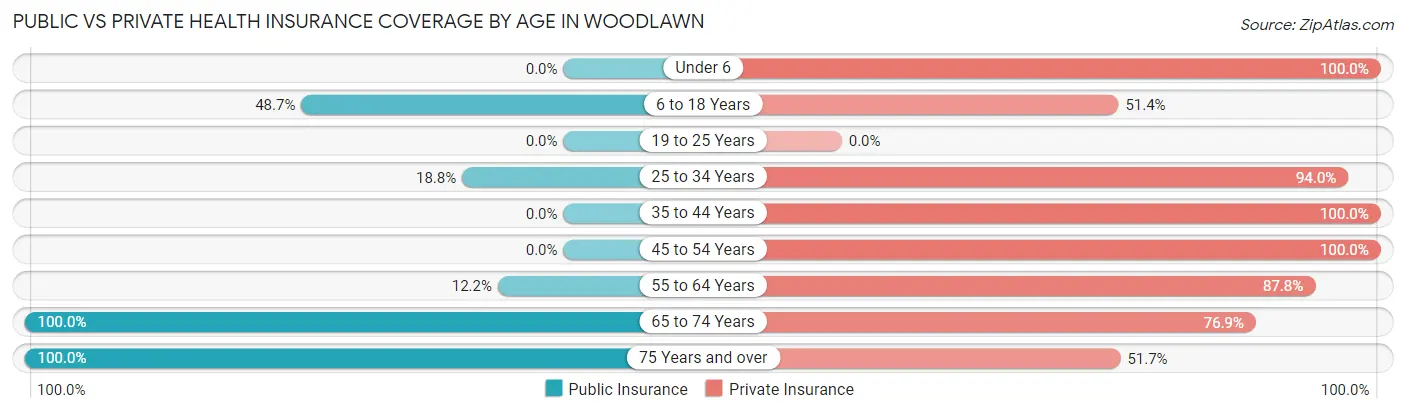
| Age Bracket | Public Insurance | Private Insurance |
| Under 6 | 0 (0.0%) | 29 (100.0%) |
| 6 to 18 Years | 18 (48.6%) | 19 (51.3%) |
| 19 to 25 Years | 0 (0.0%) | 0 (0.0%) |
| 25 to 34 Years | 25 (18.8%) | 125 (94.0%) |
| 35 to 44 Years | 0 (0.0%) | 36 (100.0%) |
| 45 to 54 Years | 0 (0.0%) | 154 (100.0%) |
| 55 to 64 Years | 23 (12.2%) | 166 (87.8%) |
| 65 to 74 Years | 311 (100.0%) | 239 (76.8%) |
| 75 Years and over | 58 (100.0%) | 30 (51.7%) |
| Total | 435 (45.9%) | 798 (84.3%) |
Disability Status by Sex by Age in Woodlawn
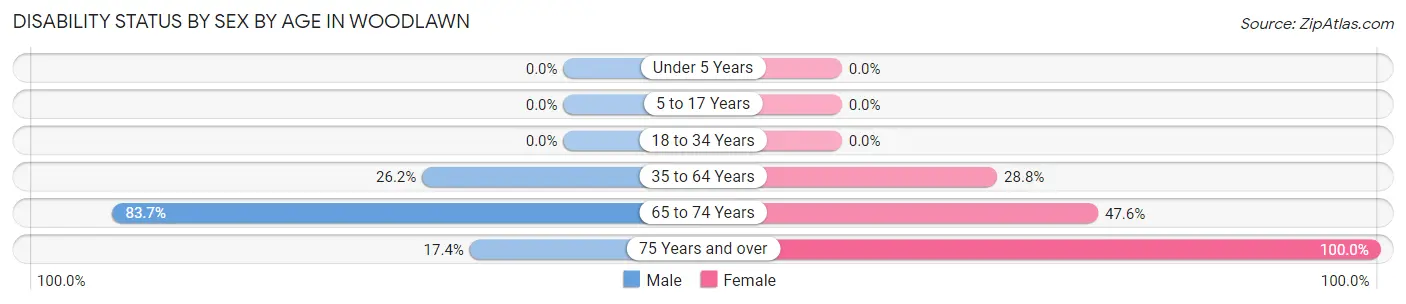
| Age Bracket | Male | Female |
| Under 5 Years | 0 (0.0%) | 0 (0.0%) |
| 5 to 17 Years | 0 (0.0%) | 0 (0.0%) |
| 18 to 34 Years | 0 (0.0%) | 0 (0.0%) |
| 35 to 64 Years | 43 (26.2%) | 62 (28.8%) |
| 65 to 74 Years | 123 (83.7%) | 78 (47.6%) |
| 75 Years and over | 8 (17.4%) | 12 (100.0%) |
Disability Class by Sex by Age in Woodlawn
Disability Class: Hearing Difficulty
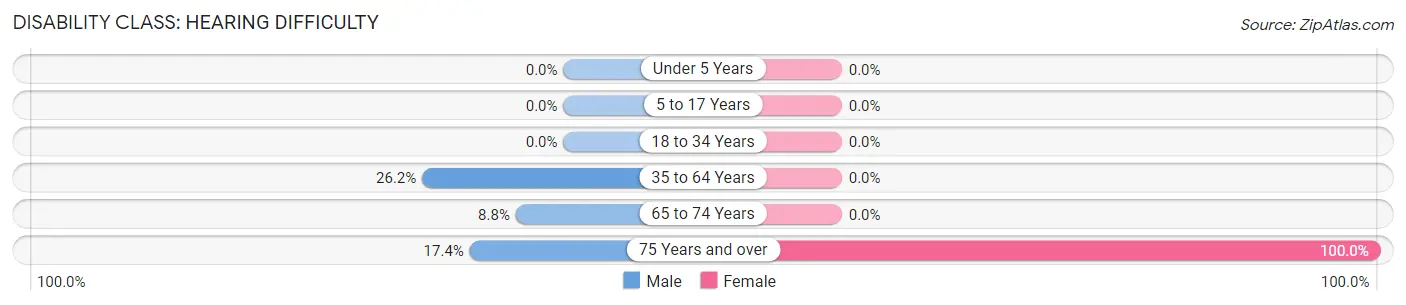
| Age Bracket | Male | Female |
| Under 5 Years | 0 (0.0%) | 0 (0.0%) |
| 5 to 17 Years | 0 (0.0%) | 0 (0.0%) |
| 18 to 34 Years | 0 (0.0%) | 0 (0.0%) |
| 35 to 64 Years | 43 (26.2%) | 0 (0.0%) |
| 65 to 74 Years | 13 (8.8%) | 0 (0.0%) |
| 75 Years and over | 8 (17.4%) | 12 (100.0%) |
Disability Class: Vision Difficulty
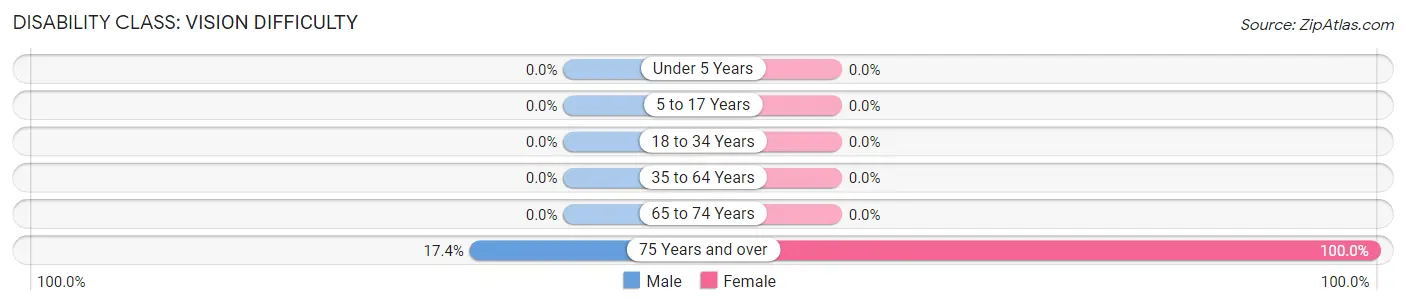
| Age Bracket | Male | Female |
| Under 5 Years | 0 (0.0%) | 0 (0.0%) |
| 5 to 17 Years | 0 (0.0%) | 0 (0.0%) |
| 18 to 34 Years | 0 (0.0%) | 0 (0.0%) |
| 35 to 64 Years | 0 (0.0%) | 0 (0.0%) |
| 65 to 74 Years | 0 (0.0%) | 0 (0.0%) |
| 75 Years and over | 8 (17.4%) | 12 (100.0%) |
Disability Class: Cognitive Difficulty
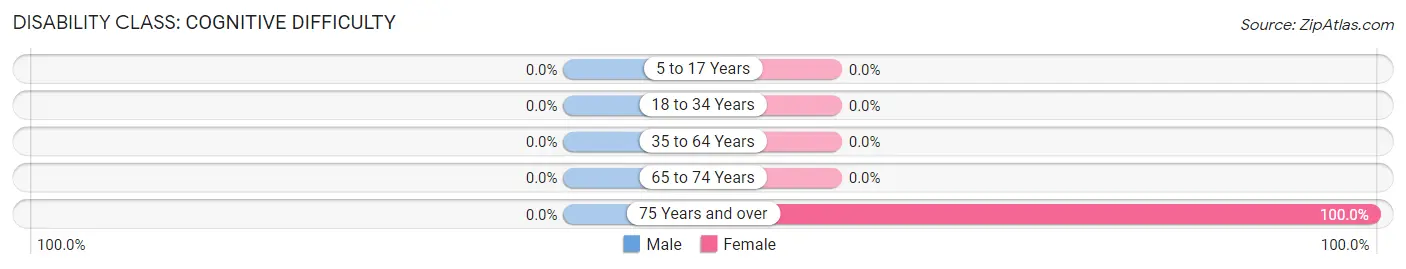
| Age Bracket | Male | Female |
| 5 to 17 Years | 0 (0.0%) | 0 (0.0%) |
| 18 to 34 Years | 0 (0.0%) | 0 (0.0%) |
| 35 to 64 Years | 0 (0.0%) | 0 (0.0%) |
| 65 to 74 Years | 0 (0.0%) | 0 (0.0%) |
| 75 Years and over | 0 (0.0%) | 12 (100.0%) |
Disability Class: Ambulatory Difficulty
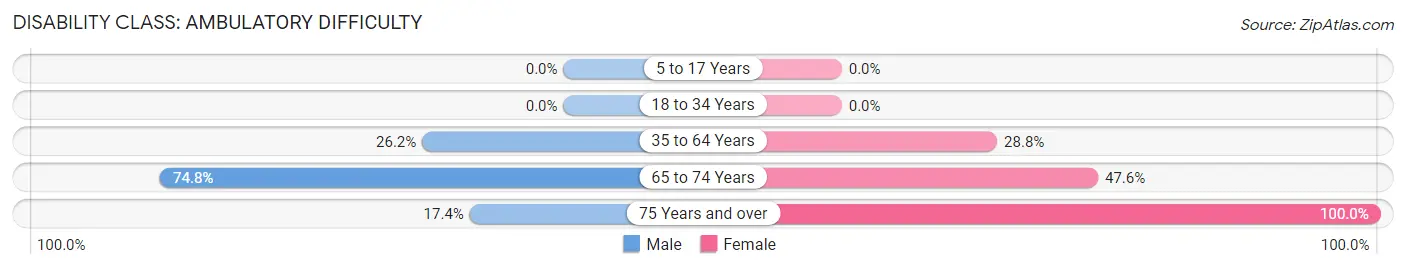
| Age Bracket | Male | Female |
| 5 to 17 Years | 0 (0.0%) | 0 (0.0%) |
| 18 to 34 Years | 0 (0.0%) | 0 (0.0%) |
| 35 to 64 Years | 43 (26.2%) | 62 (28.8%) |
| 65 to 74 Years | 110 (74.8%) | 78 (47.6%) |
| 75 Years and over | 8 (17.4%) | 12 (100.0%) |
Disability Class: Self-Care Difficulty
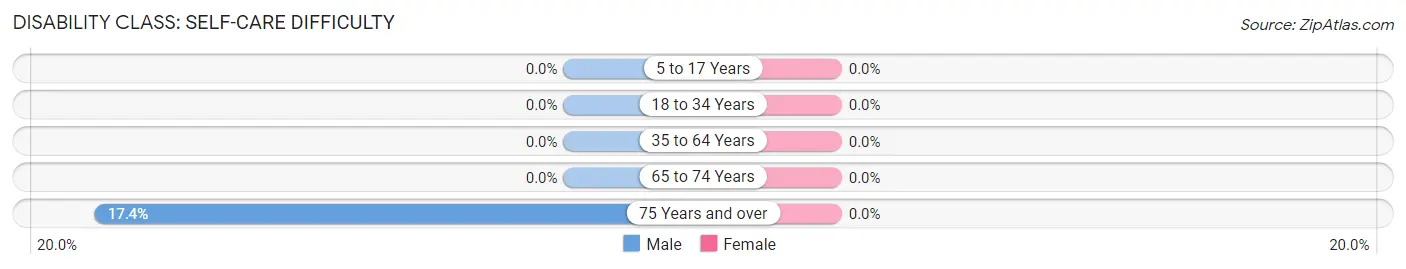
| Age Bracket | Male | Female |
| 5 to 17 Years | 0 (0.0%) | 0 (0.0%) |
| 18 to 34 Years | 0 (0.0%) | 0 (0.0%) |
| 35 to 64 Years | 0 (0.0%) | 0 (0.0%) |
| 65 to 74 Years | 0 (0.0%) | 0 (0.0%) |
| 75 Years and over | 8 (17.4%) | 0 (0.0%) |
Technology Access in Woodlawn
Computing Device Access in Woodlawn
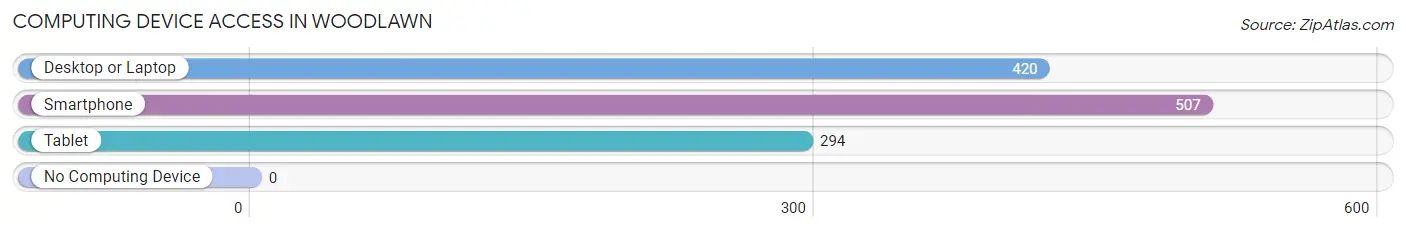
| Device Type | # Households | % Households |
| Desktop or Laptop | 420 | 80.6% |
| Smartphone | 507 | 97.3% |
| Tablet | 294 | 56.4% |
| No Computing Device | 0 | 0.0% |
| Total | 521 | 100.0% |
Internet Access in Woodlawn
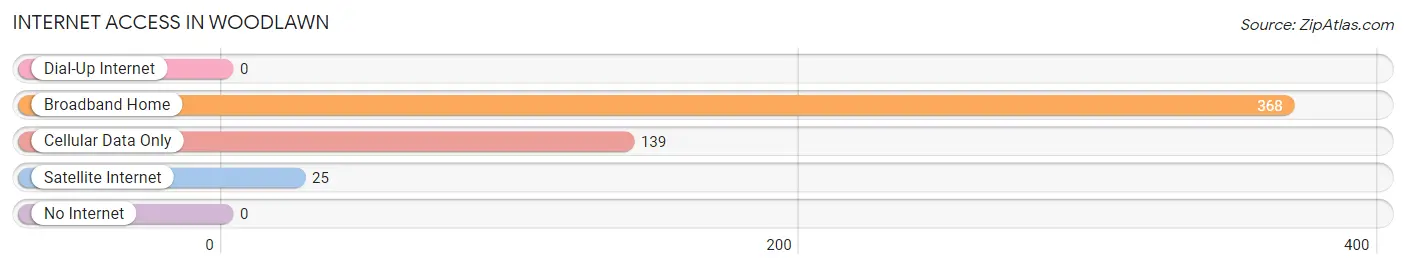
| Internet Type | # Households | % Households |
| Dial-Up Internet | 0 | 0.0% |
| Broadband Home | 368 | 70.6% |
| Cellular Data Only | 139 | 26.7% |
| Satellite Internet | 25 | 4.8% |
| No Internet | 0 | 0.0% |
| Total | 521 | 100.0% |
Woodlawn Summary
Woodlawn is a small unincorporated community located in the western part of North Carolina, in the foothills of the Blue Ridge Mountains. It is situated in the Catawba County, and is part of the Hickory-Lenoir-Morganton Metropolitan Statistical Area. The population of Woodlawn was estimated to be around 1,000 in 2020.
History
Woodlawn was first settled in the early 1800s by a group of settlers from the nearby town of Catawba. The settlers were attracted to the area due to its fertile soil and abundant natural resources. The town was originally known as “Woodlawn” due to the abundance of trees in the area. The town was officially incorporated in 1883.
In the late 1800s, the town began to grow and prosper due to the development of the railroad. The railroad allowed for the transportation of goods and people to and from the town. This allowed for the growth of the local economy and the development of businesses.
In the early 1900s, the town experienced a period of decline due to the Great Depression. However, the town was able to recover and continue to grow in the following decades.
Geography
Woodlawn is located in the foothills of the Blue Ridge Mountains in western North Carolina. The town is situated in the Catawba County, and is part of the Hickory-Lenoir-Morganton Metropolitan Statistical Area. The town is located at an elevation of 1,000 feet above sea level.
The town is surrounded by the Catawba River to the north, the Broad River to the east, and the South Fork Catawba River to the south. The town is also located near the towns of Hickory, Lenoir, and Morganton.
Economy
The economy of Woodlawn is largely based on agriculture and tourism. The town is home to several farms, which produce a variety of crops, including corn, soybeans, and tobacco. The town is also home to several wineries, which produce a variety of wines.
The town is also home to several small businesses, including restaurants, shops, and other services. The town is also home to several manufacturing companies, which produce a variety of products, including furniture, textiles, and automotive parts.
Demographics
The population of Woodlawn was estimated to be around 1,000 in 2020. The town is predominantly white, with a small African American population. The median household income in the town is around $35,000. The town has a low unemployment rate, with only 4.2% of the population unemployed.
Conclusion
Woodlawn is a small unincorporated community located in the western part of North Carolina, in the foothills of the Blue Ridge Mountains. The town has a long history, and has experienced periods of growth and decline. The town is largely based on agriculture and tourism, and is home to several small businesses. The population of Woodlawn is predominantly white, with a small African American population. The town has a low unemployment rate, and the median household income is around $35,000.
Common Questions
What is Per Capita Income in Woodlawn?
Per Capita income in Woodlawn is $39,314.
What is the Median Family Income in Woodlawn?
Median Family Income in Woodlawn is $65,795.
What is the Median Household income in Woodlawn?
Median Household Income in Woodlawn is $66,023.
What is Income or Wage Gap in Woodlawn?
Income or Wage Gap in Woodlawn is 50.2%.
Women in Woodlawn earn 49.8 cents for every dollar earned by a man.
What is Inequality or Gini Index in Woodlawn?
Inequality or Gini Index in Woodlawn is 0.32.
What is the Total Population of Woodlawn?
Total Population of Woodlawn is 947.
What is the Total Male Population of Woodlawn?
Total Male Population of Woodlawn is 469.
What is the Total Female Population of Woodlawn?
Total Female Population of Woodlawn is 478.
What is the Ratio of Males per 100 Females in Woodlawn?
There are 98.12 Males per 100 Females in Woodlawn.
What is the Ratio of Females per 100 Males in Woodlawn?
There are 101.92 Females per 100 Males in Woodlawn.
What is the Median Population Age in Woodlawn?
Median Population Age in Woodlawn is 61.2 Years.
What is the Average Family Size in Woodlawn
Average Family Size in Woodlawn is 2.1 People.
What is the Average Household Size in Woodlawn
Average Household Size in Woodlawn is 1.8 People.
How Large is the Labor Force in Woodlawn?
There are 426 People in the Labor Forcein in Woodlawn.
What is the Percentage of People in the Labor Force in Woodlawn?
48.4% of People are in the Labor Force in Woodlawn.