Tallassee, AL Map & Demographics
Tallassee Map
Tallassee Overview
$27,014
PER CAPITA INCOME
$60,682
AVG FAMILY INCOME
$48,531
AVG HOUSEHOLD INCOME
43.3%
WAGE / INCOME GAP [ % ]
56.7¢/ $1
WAGE / INCOME GAP [ $ ]
0.46
INEQUALITY / GINI INDEX
5,174
TOTAL POPULATION
2,320
MALE POPULATION
2,854
FEMALE POPULATION
81.29
MALES / 100 FEMALES
123.02
FEMALES / 100 MALES
40.6
MEDIAN AGE
3.0
AVG FAMILY SIZE
2.4
AVG HOUSEHOLD SIZE
2,423
LABOR FORCE [ PEOPLE ]
54.2%
PERCENT IN LABOR FORCE
8.5%
UNEMPLOYMENT RATE
Tallassee Zip Codes
Tallassee Area Codes
Income in Tallassee
Income Overview in Tallassee
Per Capita Income in Tallassee is $27,014, while median incomes of families and households are $60,682 and $48,531 respectively.
| Characteristic | Number | Measure |
| Per Capita Income | 5,174 | $27,014 |
| Median Family Income | 1,400 | $60,682 |
| Mean Family Income | 1,400 | $78,876 |
| Median Household Income | 2,069 | $48,531 |
| Mean Household Income | 2,069 | $64,287 |
| Income Deficit | 1,400 | $0 |
| Wage / Income Gap (%) | 5,174 | 43.32% |
| Wage / Income Gap ($) | 5,174 | 56.68¢ per $1 |
| Gini / Inequality Index | 5,174 | 0.46 |
Earnings by Sex in Tallassee
Average Earnings in Tallassee are $24,893, $28,573 for men and $16,196 for women, a difference of 43.3%.
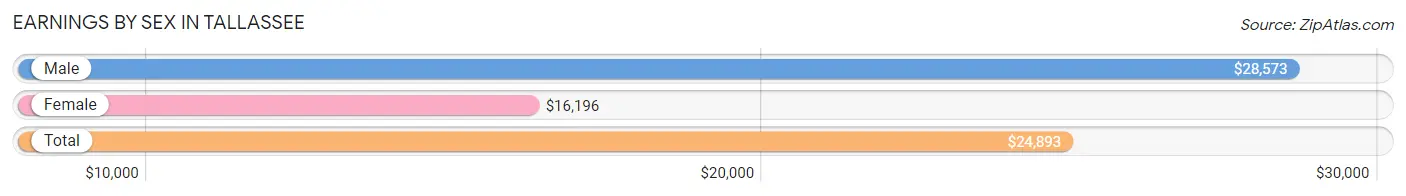
| Sex | Number | Average Earnings |
| Male | 1,384 (54.2%) | $28,573 |
| Female | 1,168 (45.8%) | $16,196 |
| Total | 2,552 (100.0%) | $24,893 |
Earnings by Sex by Income Bracket in Tallassee
The most common earnings brackets in Tallassee are $22,500 to $24,999 for men (326 | 23.5%) and $2,499 or less for women (160 | 13.7%).
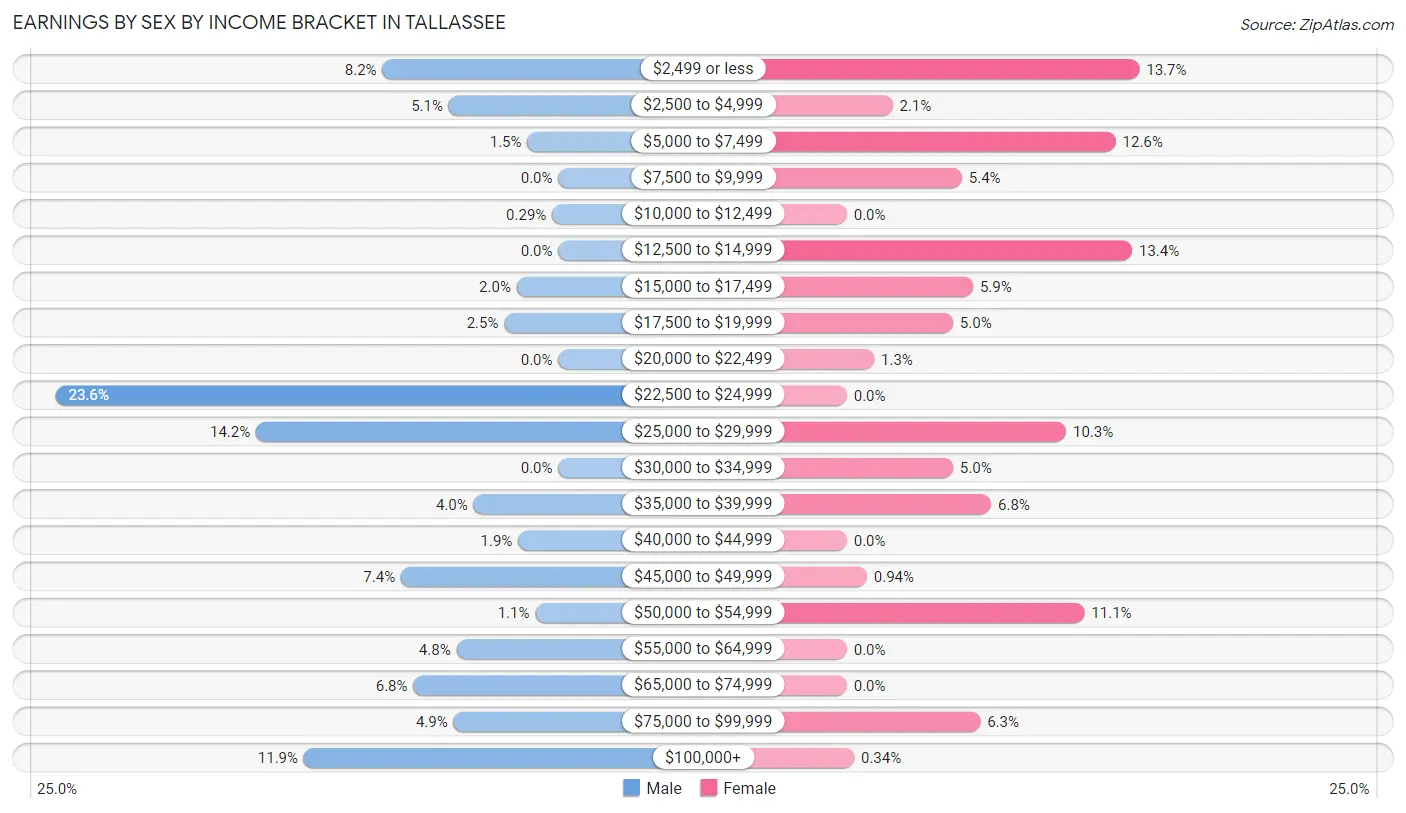
| Income | Male | Female |
| $2,499 or less | 114 (8.2%) | 160 (13.7%) |
| $2,500 to $4,999 | 71 (5.1%) | 25 (2.1%) |
| $5,000 to $7,499 | 20 (1.5%) | 147 (12.6%) |
| $7,500 to $9,999 | 0 (0.0%) | 63 (5.4%) |
| $10,000 to $12,499 | 4 (0.3%) | 0 (0.0%) |
| $12,500 to $14,999 | 0 (0.0%) | 156 (13.4%) |
| $15,000 to $17,499 | 27 (1.9%) | 69 (5.9%) |
| $17,500 to $19,999 | 35 (2.5%) | 58 (5.0%) |
| $20,000 to $22,499 | 0 (0.0%) | 15 (1.3%) |
| $22,500 to $24,999 | 326 (23.5%) | 0 (0.0%) |
| $25,000 to $29,999 | 196 (14.2%) | 120 (10.3%) |
| $30,000 to $34,999 | 0 (0.0%) | 58 (5.0%) |
| $35,000 to $39,999 | 55 (4.0%) | 79 (6.8%) |
| $40,000 to $44,999 | 26 (1.9%) | 0 (0.0%) |
| $45,000 to $49,999 | 102 (7.4%) | 11 (0.9%) |
| $50,000 to $54,999 | 15 (1.1%) | 130 (11.1%) |
| $55,000 to $64,999 | 66 (4.8%) | 0 (0.0%) |
| $65,000 to $74,999 | 94 (6.8%) | 0 (0.0%) |
| $75,000 to $99,999 | 68 (4.9%) | 73 (6.2%) |
| $100,000+ | 165 (11.9%) | 4 (0.3%) |
| Total | 1,384 (100.0%) | 1,168 (100.0%) |
Earnings by Sex by Educational Attainment in Tallassee
Average earnings in Tallassee are $47,871 for men and $22,083 for women, a difference of 53.9%. Men with an educational attainment of bachelor's degree enjoy the highest average annual earnings of $98,214, while those with high school diploma education earn the least with $29,714. Women with an educational attainment of high school diploma earn the most with the average annual earnings of $17,833, while those with high school diploma education have the smallest earnings of $17,833.
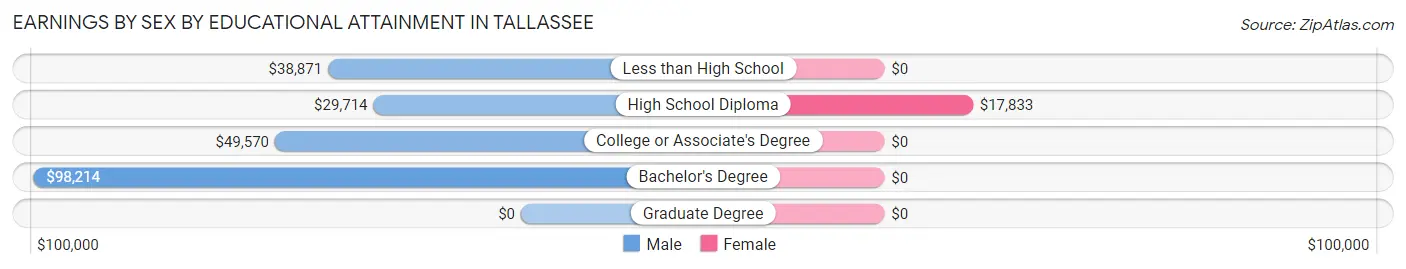
| Educational Attainment | Male Income | Female Income |
| Less than High School | $38,871 | $0 |
| High School Diploma | $29,714 | $17,833 |
| College or Associate's Degree | $49,570 | $0 |
| Bachelor's Degree | $98,214 | $0 |
| Graduate Degree | - | - |
| Total | $47,871 | $22,083 |
Family Income in Tallassee
Family Income Brackets in Tallassee
According to the Tallassee family income data, there are 365 families falling into the $50,000 to $74,999 income range, which is the most common income bracket and makes up 26.1% of all families.
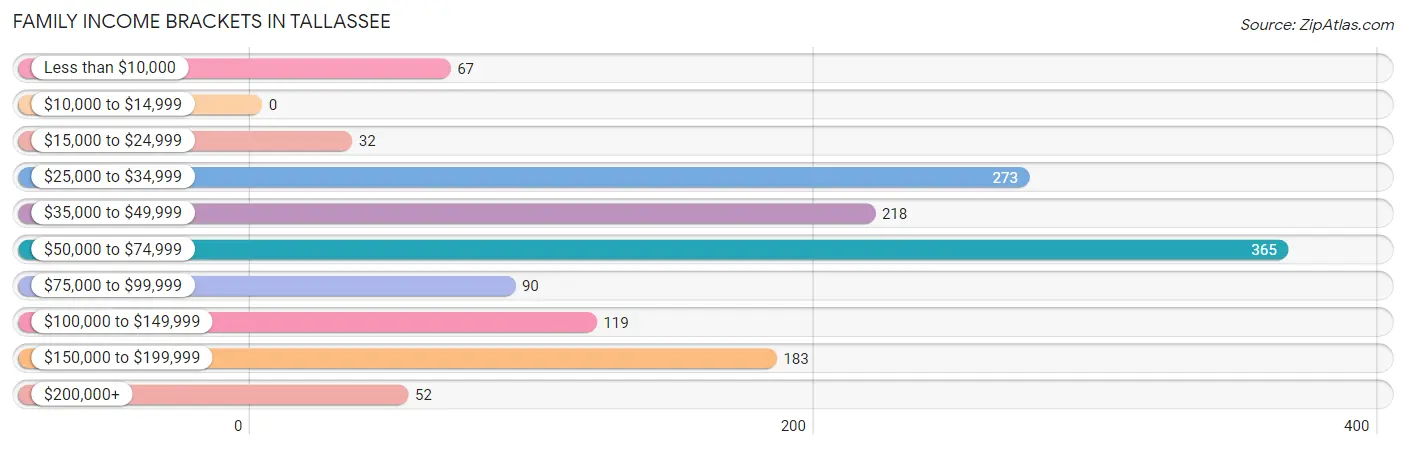
| Income Bracket | # Families | % Families |
| Less than $10,000 | 67 | 4.8% |
| $10,000 to $14,999 | 0 | 0.0% |
| $15,000 to $24,999 | 32 | 2.3% |
| $25,000 to $34,999 | 273 | 19.5% |
| $35,000 to $49,999 | 218 | 15.6% |
| $50,000 to $74,999 | 365 | 26.1% |
| $75,000 to $99,999 | 90 | 6.4% |
| $100,000 to $149,999 | 119 | 8.5% |
| $150,000 to $199,999 | 183 | 13.1% |
| $200,000+ | 52 | 3.7% |
Family Income by Famaliy Size in Tallassee
4-person families (128 | 9.1%) account for the highest median family income in Tallassee with $80,179 per family, while 2-person families (617 | 44.1%) have the highest median income of $31,230 per family member.
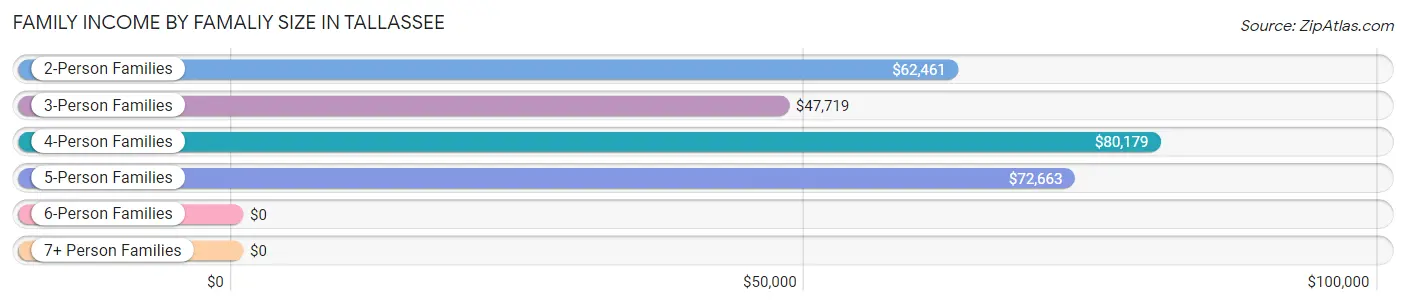
| Income Bracket | # Families | Median Income |
| 2-Person Families | 617 (44.1%) | $62,461 |
| 3-Person Families | 588 (42.0%) | $47,719 |
| 4-Person Families | 128 (9.1%) | $80,179 |
| 5-Person Families | 67 (4.8%) | $72,663 |
| 6-Person Families | 0 (0.0%) | $0 |
| 7+ Person Families | 0 (0.0%) | $0 |
| Total | 1,400 (100.0%) | $60,682 |
Family Income by Number of Earners in Tallassee
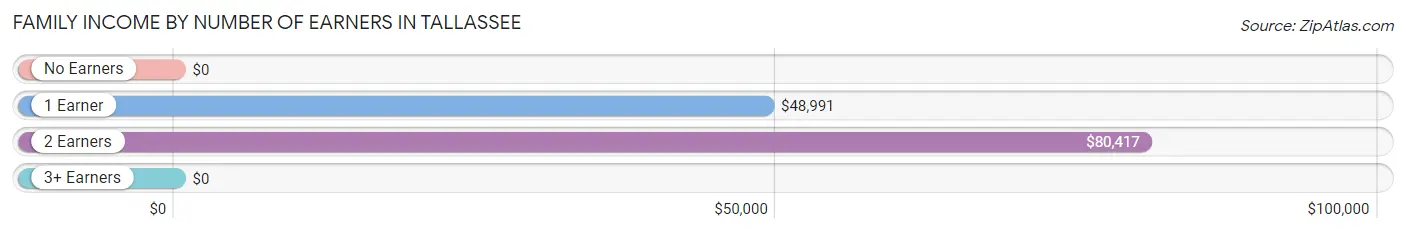
| Number of Earners | # Families | Median Income |
| No Earners | 148 (10.6%) | $0 |
| 1 Earner | 606 (43.3%) | $48,991 |
| 2 Earners | 603 (43.1%) | $80,417 |
| 3+ Earners | 43 (3.1%) | $0 |
| Total | 1,400 (100.0%) | $60,682 |
Household Income in Tallassee
Household Income Brackets in Tallassee
With 480 households falling in the category, the $50,000 to $74,999 income range is the most frequent in Tallassee, accounting for 23.2% of all households. In contrast, only 52 households (2.5%) fall into the $200,000+ income bracket, making it the least populous group.
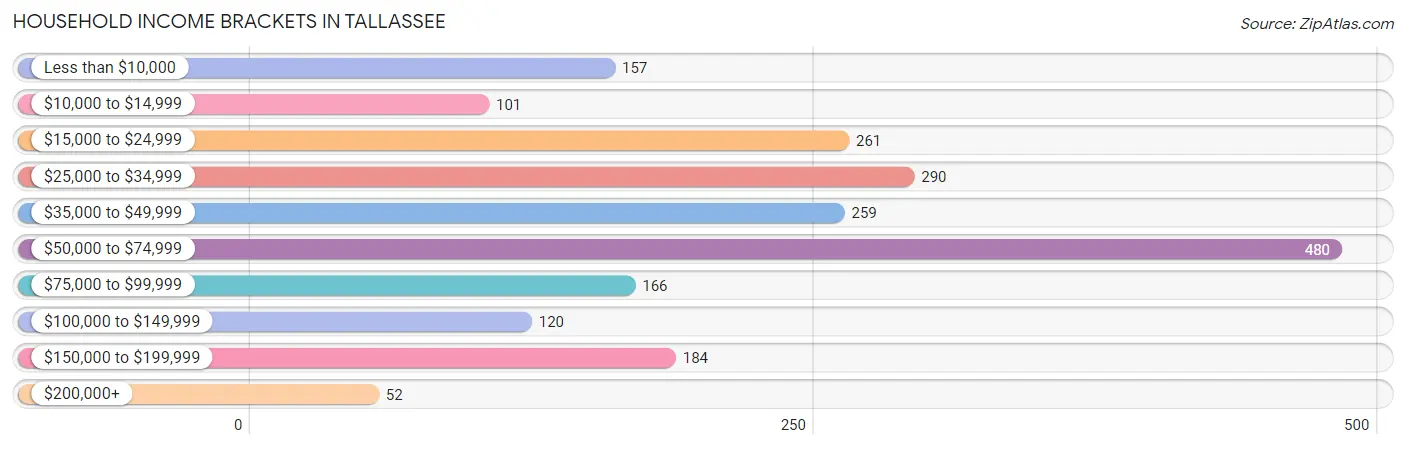
| Income Bracket | # Households | % Households |
| Less than $10,000 | 157 | 7.6% |
| $10,000 to $14,999 | 101 | 4.9% |
| $15,000 to $24,999 | 261 | 12.6% |
| $25,000 to $34,999 | 290 | 14.0% |
| $35,000 to $49,999 | 259 | 12.5% |
| $50,000 to $74,999 | 480 | 23.2% |
| $75,000 to $99,999 | 166 | 8.0% |
| $100,000 to $149,999 | 120 | 5.8% |
| $150,000 to $199,999 | 184 | 8.9% |
| $200,000+ | 52 | 2.5% |
Household Income by Householder Age in Tallassee
The median household income in Tallassee is $48,531, with the highest median household income of $63,117 found in the 25 to 44 years age bracket for the primary householder. A total of 677 households (32.7%) fall into this category.
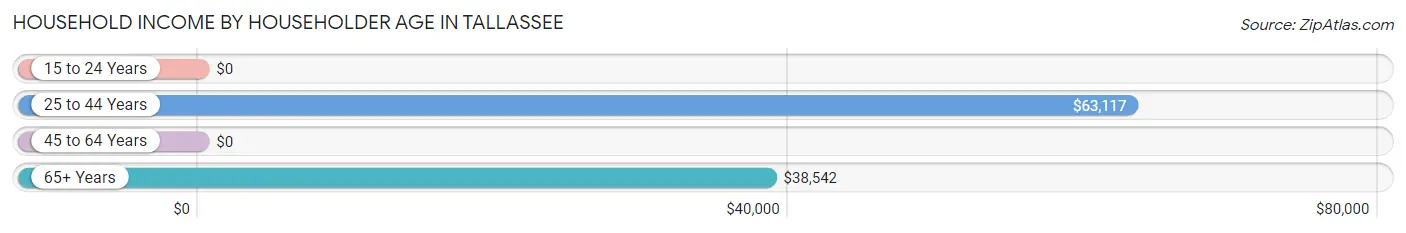
| Income Bracket | # Households | Median Income |
| 15 to 24 Years | 0 (0.0%) | $0 |
| 25 to 44 Years | 677 (32.7%) | $63,117 |
| 45 to 64 Years | 703 (34.0%) | $0 |
| 65+ Years | 689 (33.3%) | $38,542 |
| Total | 2,069 (100.0%) | $48,531 |
Poverty in Tallassee
Income Below Poverty by Sex and Age in Tallassee
With 3.8% poverty level for males and 11.6% for females among the residents of Tallassee, under 5 year old males and 25 to 34 year old females are the most vulnerable to poverty, with 15 males (26.3%) and 98 females (24.8%) in their respective age groups living below the poverty level.

| Age Bracket | Male | Female |
| Under 5 Years | 15 (26.3%) | 22 (7.3%) |
| 5 Years | 0 (0.0%) | 0 (0.0%) |
| 6 to 11 Years | 0 (0.0%) | 13 (17.6%) |
| 12 to 14 Years | 0 (0.0%) | 0 (0.0%) |
| 15 Years | 0 (0.0%) | 0 (0.0%) |
| 16 and 17 Years | 0 (0.0%) | 0 (0.0%) |
| 18 to 24 Years | 22 (4.3%) | 49 (23.0%) |
| 25 to 34 Years | 0 (0.0%) | 98 (24.8%) |
| 35 to 44 Years | 0 (0.0%) | 55 (15.9%) |
| 45 to 54 Years | 14 (8.3%) | 28 (10.0%) |
| 55 to 64 Years | 20 (6.4%) | 13 (3.4%) |
| 65 to 74 Years | 0 (0.0%) | 33 (10.2%) |
| 75 Years and over | 16 (21.6%) | 11 (3.5%) |
| Total | 87 (3.8%) | 322 (11.6%) |
Income Above Poverty by Sex and Age in Tallassee
According to the poverty statistics in Tallassee, males aged 6 to 11 years and females aged 5 years are the age groups that are most secure financially, with 100.0% of males and 100.0% of females in these age groups living above the poverty line.
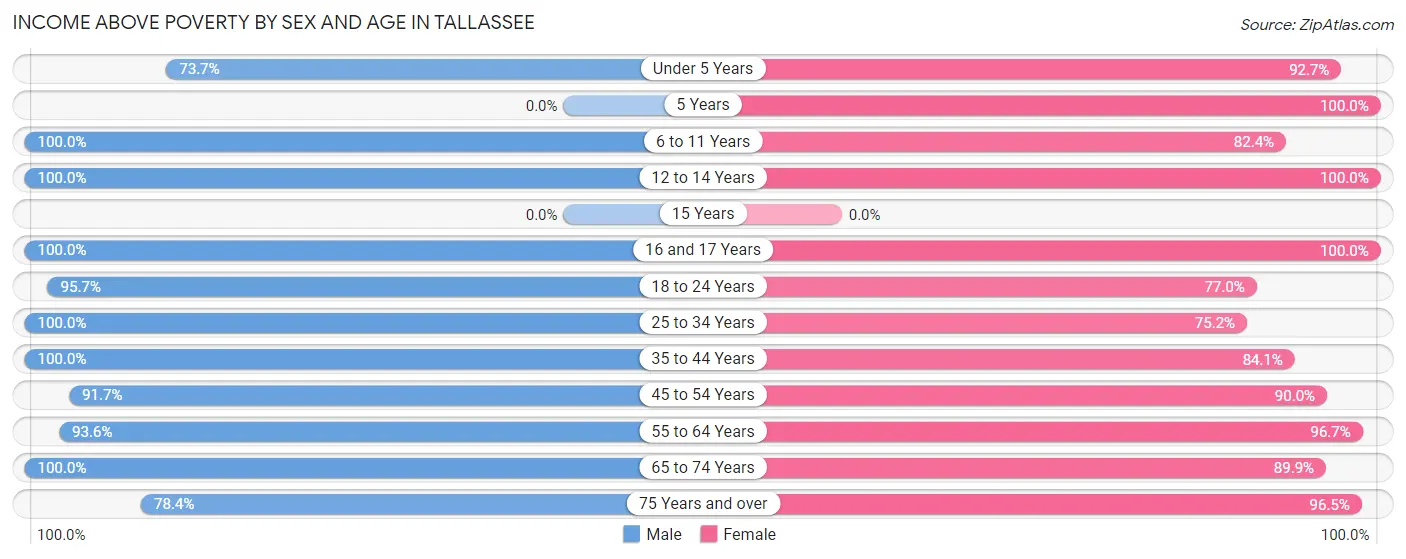
| Age Bracket | Male | Female |
| Under 5 Years | 42 (73.7%) | 279 (92.7%) |
| 5 Years | 0 (0.0%) | 22 (100.0%) |
| 6 to 11 Years | 97 (100.0%) | 61 (82.4%) |
| 12 to 14 Years | 110 (100.0%) | 43 (100.0%) |
| 15 Years | 0 (0.0%) | 0 (0.0%) |
| 16 and 17 Years | 112 (100.0%) | 81 (100.0%) |
| 18 to 24 Years | 492 (95.7%) | 164 (77.0%) |
| 25 to 34 Years | 301 (100.0%) | 297 (75.2%) |
| 35 to 44 Years | 231 (100.0%) | 290 (84.1%) |
| 45 to 54 Years | 155 (91.7%) | 253 (90.0%) |
| 55 to 64 Years | 292 (93.6%) | 375 (96.7%) |
| 65 to 74 Years | 300 (100.0%) | 292 (89.8%) |
| 75 Years and over | 58 (78.4%) | 302 (96.5%) |
| Total | 2,190 (96.2%) | 2,459 (88.4%) |
Income Below Poverty Among Married-Couple Families in Tallassee
The poverty statistics for married-couple families in Tallassee show that 3.4% or 20 of the total 595 families live below the poverty line. Families with no children have the highest poverty rate of 5.6%, comprising of 20 families. On the other hand, families with 1 or 2 children have the lowest poverty rate of 0.0%, which includes 0 families.
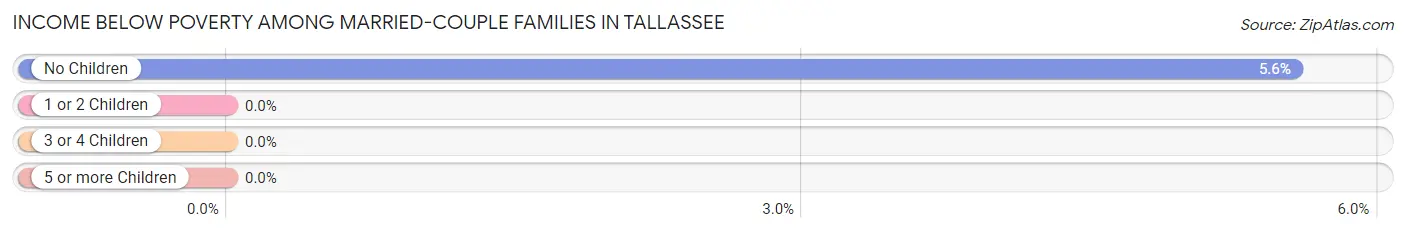
| Children | Above Poverty | Below Poverty |
| No Children | 340 (94.4%) | 20 (5.6%) |
| 1 or 2 Children | 223 (100.0%) | 0 (0.0%) |
| 3 or 4 Children | 12 (100.0%) | 0 (0.0%) |
| 5 or more Children | 0 (0.0%) | 0 (0.0%) |
| Total | 575 (96.6%) | 20 (3.4%) |
Income Below Poverty Among Single-Parent Households in Tallassee
According to the poverty data in Tallassee, 4.7% or 14 single-father households and 9.3% or 47 single-mother households are living below the poverty line. Among single-father households, those with no children have the highest poverty rate, with 14 households (5.6%) experiencing poverty. Likewise, among single-mother households, those with no children have the highest poverty rate, with 20 households (10.6%) falling below the poverty line.
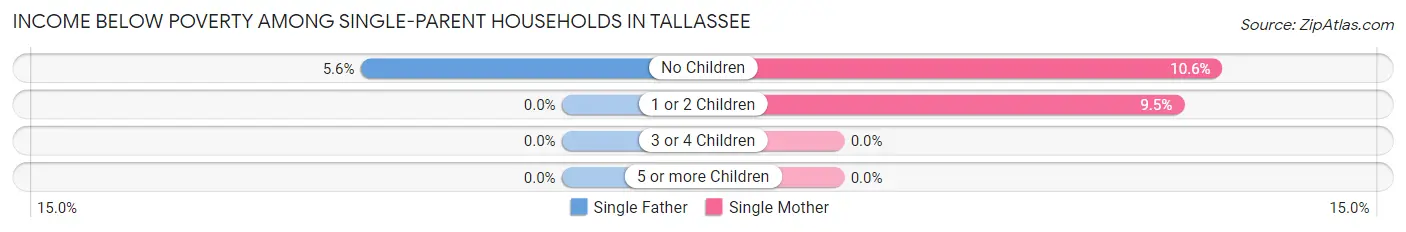
| Children | Single Father | Single Mother |
| No Children | 14 (5.6%) | 20 (10.6%) |
| 1 or 2 Children | 0 (0.0%) | 27 (9.5%) |
| 3 or 4 Children | 0 (0.0%) | 0 (0.0%) |
| 5 or more Children | 0 (0.0%) | 0 (0.0%) |
| Total | 14 (4.7%) | 47 (9.3%) |
Income Below Poverty Among Married-Couple vs Single-Parent Households in Tallassee
The poverty data for Tallassee shows that 20 of the married-couple family households (3.4%) and 61 of the single-parent households (7.6%) are living below the poverty level. Within the married-couple family households, those with no children have the highest poverty rate, with 20 households (5.6%) falling below the poverty line. Among the single-parent households, those with 1 or 2 children have the highest poverty rate, with 27 household (8.1%) living below poverty.
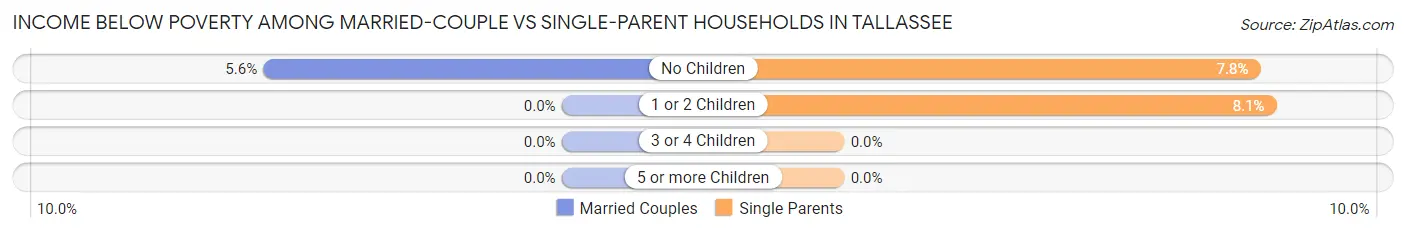
| Children | Married-Couple Families | Single-Parent Households |
| No Children | 20 (5.6%) | 34 (7.8%) |
| 1 or 2 Children | 0 (0.0%) | 27 (8.1%) |
| 3 or 4 Children | 0 (0.0%) | 0 (0.0%) |
| 5 or more Children | 0 (0.0%) | 0 (0.0%) |
| Total | 20 (3.4%) | 61 (7.6%) |
Race in Tallassee
The most populous races in Tallassee are White / Caucasian (3,442 | 66.5%), Black / African American (1,575 | 30.4%), and Two or more Races (148 | 2.9%).
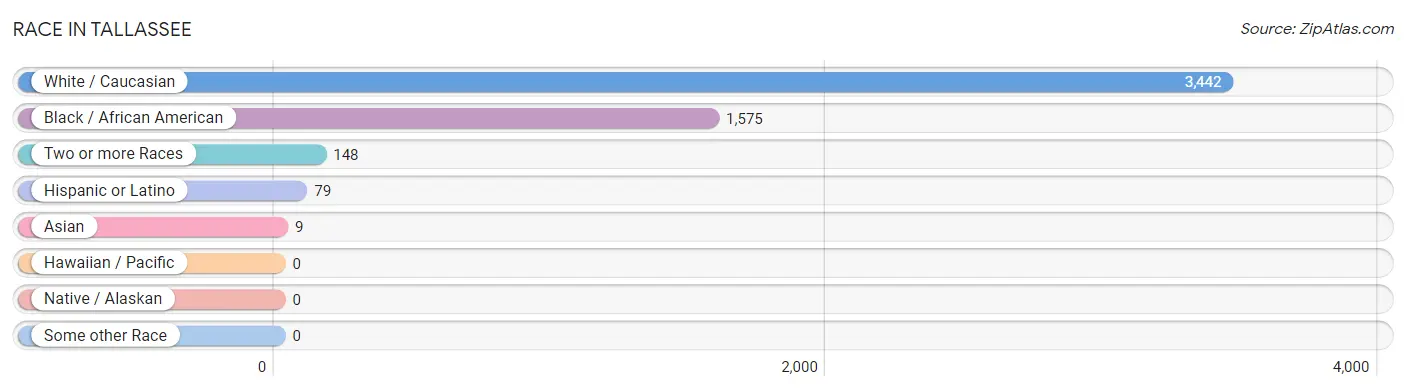
| Race | # Population | % Population |
| Asian | 9 | 0.2% |
| Black / African American | 1,575 | 30.4% |
| Hawaiian / Pacific | 0 | 0.0% |
| Hispanic or Latino | 79 | 1.5% |
| Native / Alaskan | 0 | 0.0% |
| White / Caucasian | 3,442 | 66.5% |
| Two or more Races | 148 | 2.9% |
| Some other Race | 0 | 0.0% |
| Total | 5,174 | 100.0% |
Ancestry in Tallassee
The most populous ancestries reported in Tallassee are American (1,005 | 19.4%), English (653 | 12.6%), Irish (406 | 7.9%), German (255 | 4.9%), and Scotch-Irish (141 | 2.7%), together accounting for 47.6% of all Tallassee residents.
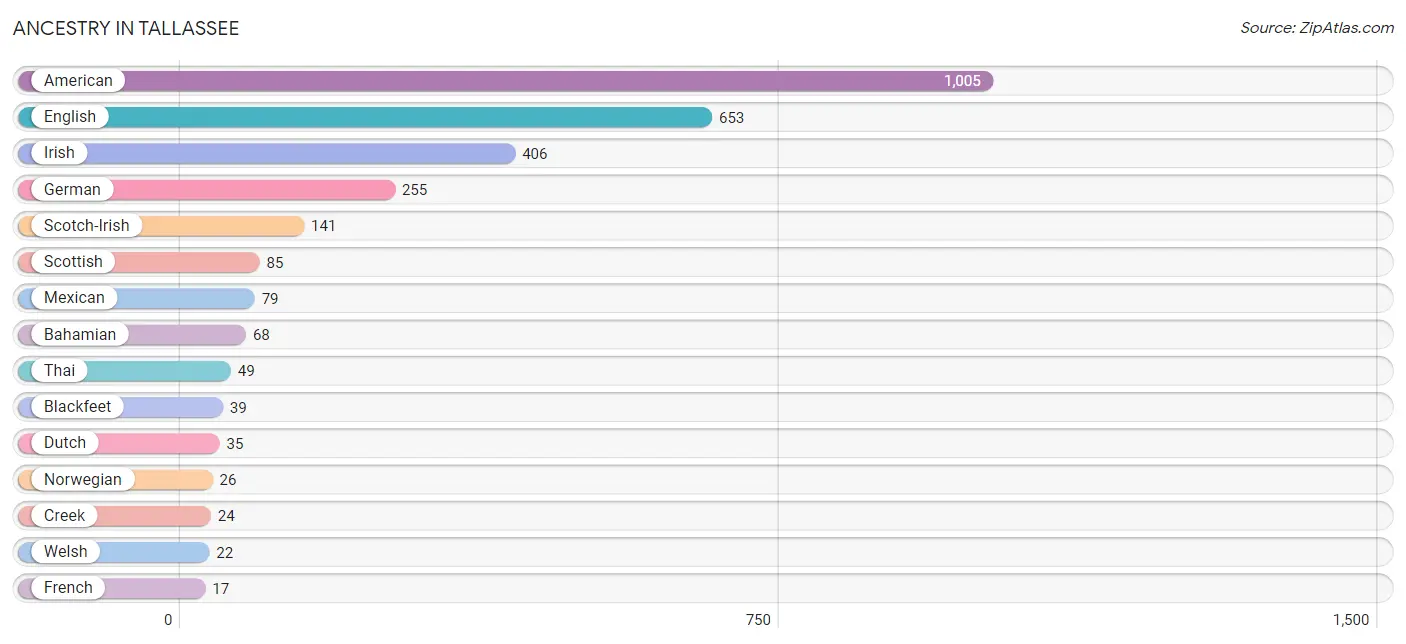
| Ancestry | # Population | % Population |
| African | 7 | 0.1% |
| American | 1,005 | 19.4% |
| Bahamian | 68 | 1.3% |
| Blackfeet | 39 | 0.7% |
| Cherokee | 10 | 0.2% |
| Creek | 24 | 0.5% |
| Dutch | 35 | 0.7% |
| English | 653 | 12.6% |
| European | 13 | 0.3% |
| French | 17 | 0.3% |
| German | 255 | 4.9% |
| Indian (Asian) | 9 | 0.2% |
| Irish | 406 | 7.9% |
| Mexican | 79 | 1.5% |
| Norwegian | 26 | 0.5% |
| Scotch-Irish | 141 | 2.7% |
| Scottish | 85 | 1.6% |
| Subsaharan African | 7 | 0.1% |
| Thai | 49 | 0.9% |
| Welsh | 22 | 0.4% | View All 20 Rows |
Immigrants in Tallassee
The most numerous immigrant groups reported in Tallassee came from Latin America (75 | 1.5%), Bahamas (68 | 1.3%), Caribbean (68 | 1.3%), Central America (7 | 0.1%), and Mexico (7 | 0.1%), together accounting for 4.3% of all Tallassee residents.
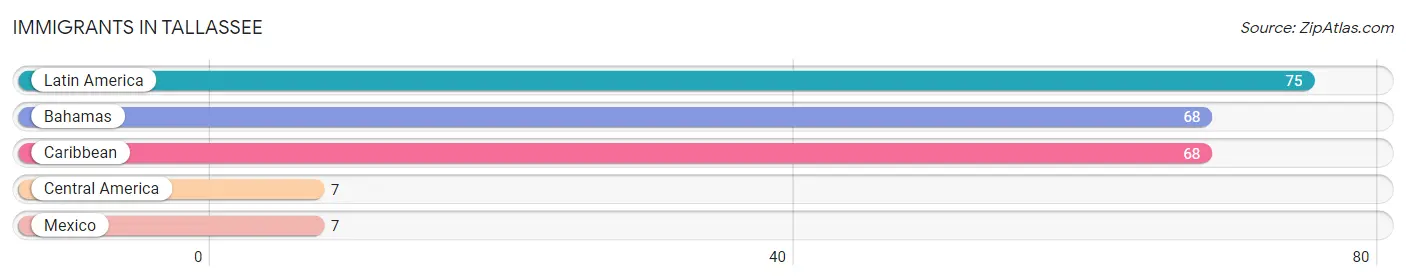
| Immigration Origin | # Population | % Population |
| Bahamas | 68 | 1.3% |
| Caribbean | 68 | 1.3% |
| Central America | 7 | 0.1% |
| Latin America | 75 | 1.5% |
| Mexico | 7 | 0.1% | View All 5 Rows |
Sex and Age in Tallassee
Sex and Age in Tallassee
The most populous age groups in Tallassee are 15 to 19 Years (464 | 20.0%) for men and Under 5 Years (301 | 10.5%) for women.
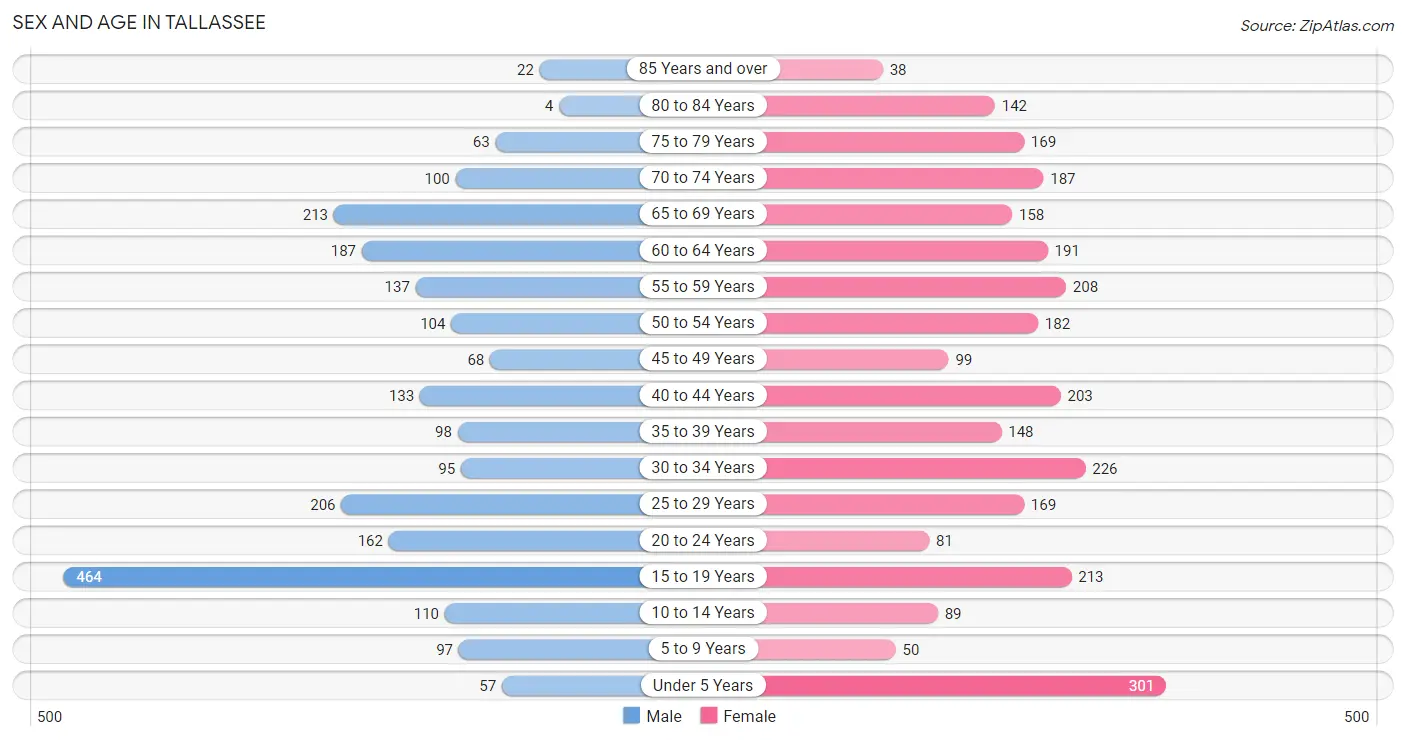
| Age Bracket | Male | Female |
| Under 5 Years | 57 (2.5%) | 301 (10.5%) |
| 5 to 9 Years | 97 (4.2%) | 50 (1.8%) |
| 10 to 14 Years | 110 (4.7%) | 89 (3.1%) |
| 15 to 19 Years | 464 (20.0%) | 213 (7.5%) |
| 20 to 24 Years | 162 (7.0%) | 81 (2.8%) |
| 25 to 29 Years | 206 (8.9%) | 169 (5.9%) |
| 30 to 34 Years | 95 (4.1%) | 226 (7.9%) |
| 35 to 39 Years | 98 (4.2%) | 148 (5.2%) |
| 40 to 44 Years | 133 (5.7%) | 203 (7.1%) |
| 45 to 49 Years | 68 (2.9%) | 99 (3.5%) |
| 50 to 54 Years | 104 (4.5%) | 182 (6.4%) |
| 55 to 59 Years | 137 (5.9%) | 208 (7.3%) |
| 60 to 64 Years | 187 (8.1%) | 191 (6.7%) |
| 65 to 69 Years | 213 (9.2%) | 158 (5.5%) |
| 70 to 74 Years | 100 (4.3%) | 187 (6.6%) |
| 75 to 79 Years | 63 (2.7%) | 169 (5.9%) |
| 80 to 84 Years | 4 (0.2%) | 142 (5.0%) |
| 85 Years and over | 22 (0.9%) | 38 (1.3%) |
| Total | 2,320 (100.0%) | 2,854 (100.0%) |
Families and Households in Tallassee
Median Family Size in Tallassee
The median family size in Tallassee is 3.03 persons per family, with married-couple families (595 | 42.5%) accounting for the largest median family size of 3.14 persons per family. On the other hand, single male/father families (300 | 21.4%) represent the smallest median family size with 2.82 persons per family.
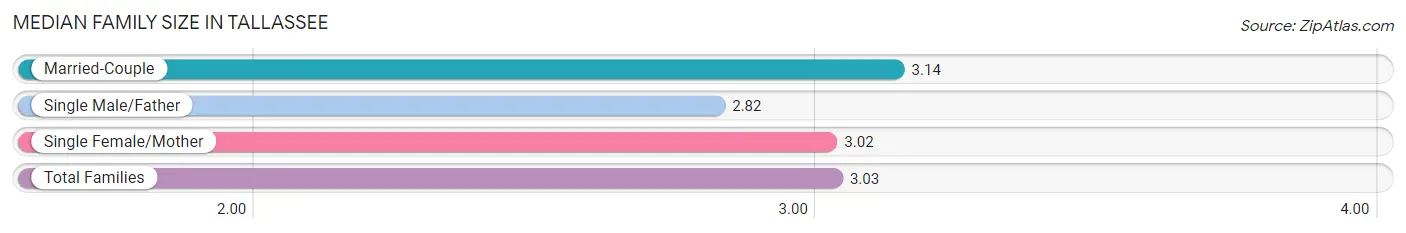
| Family Type | # Families | Family Size |
| Married-Couple | 595 (42.5%) | 3.14 |
| Single Male/Father | 300 (21.4%) | 2.82 |
| Single Female/Mother | 505 (36.1%) | 3.02 |
| Total Families | 1,400 (100.0%) | 3.03 |
Median Household Size in Tallassee
The median household size in Tallassee is 2.44 persons per household, with married-couple households (595 | 28.8%) accounting for the largest median household size of 3.14 persons per household. non-family households (669 | 32.3%) represent the smallest median household size with 1.03 persons per household.
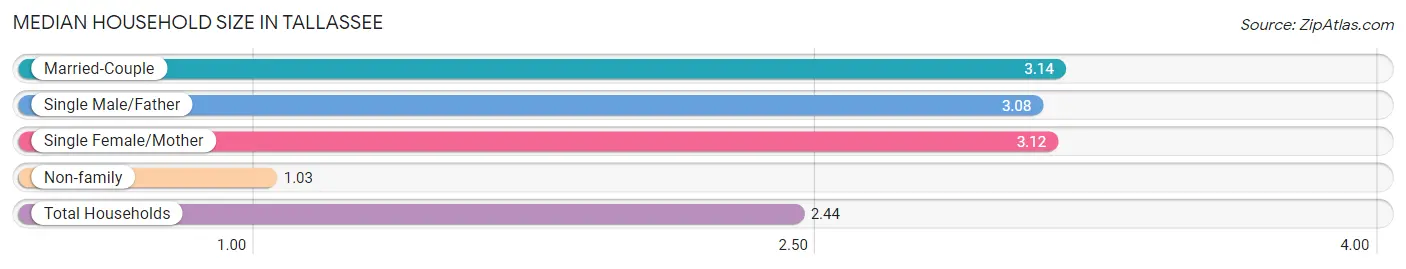
| Household Type | # Households | Household Size |
| Married-Couple | 595 (28.8%) | 3.14 |
| Single Male/Father | 300 (14.5%) | 3.08 |
| Single Female/Mother | 505 (24.4%) | 3.12 |
| Non-family | 669 (32.3%) | 1.03 |
| Total Households | 2,069 (100.0%) | 2.44 |
Household Size by Marriage Status in Tallassee
Out of a total of 2,069 households in Tallassee, 1,400 (67.7%) are family households, while 669 (32.3%) are nonfamily households. The most numerous type of family households are 3-person households, comprising 608, and the most common type of nonfamily households are 1-person households, comprising 648.
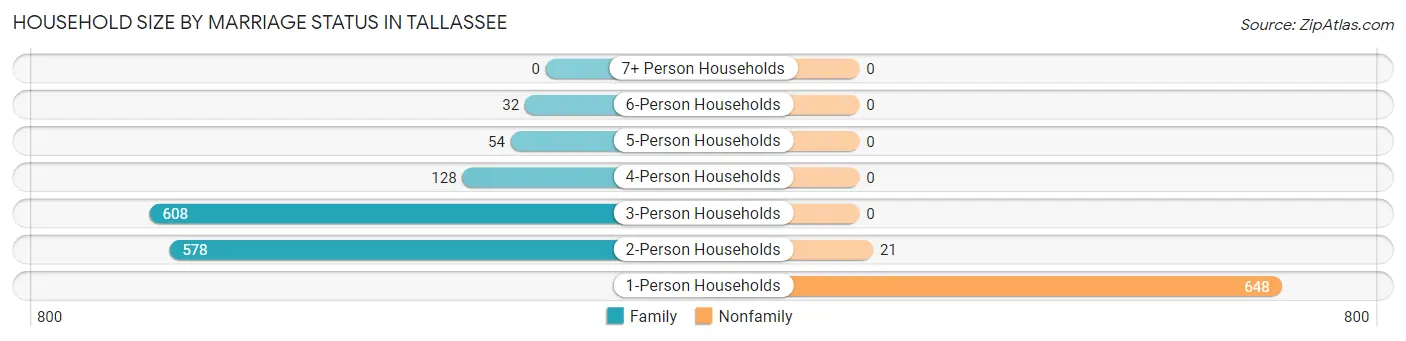
| Household Size | Family Households | Nonfamily Households |
| 1-Person Households | - | 648 (31.3%) |
| 2-Person Households | 578 (27.9%) | 21 (1.0%) |
| 3-Person Households | 608 (29.4%) | 0 (0.0%) |
| 4-Person Households | 128 (6.2%) | 0 (0.0%) |
| 5-Person Households | 54 (2.6%) | 0 (0.0%) |
| 6-Person Households | 32 (1.5%) | 0 (0.0%) |
| 7+ Person Households | 0 (0.0%) | 0 (0.0%) |
| Total | 1,400 (67.7%) | 669 (32.3%) |
Female Fertility in Tallassee
Fertility by Age in Tallassee
Average fertility rate in Tallassee is 94.0 births per 1,000 women. Women in the age bracket of 20 to 34 years have the highest fertility rate with 225.0 births per 1,000 women. Women in the age bracket of 20 to 34 years acount for 100.0% of all women with births.
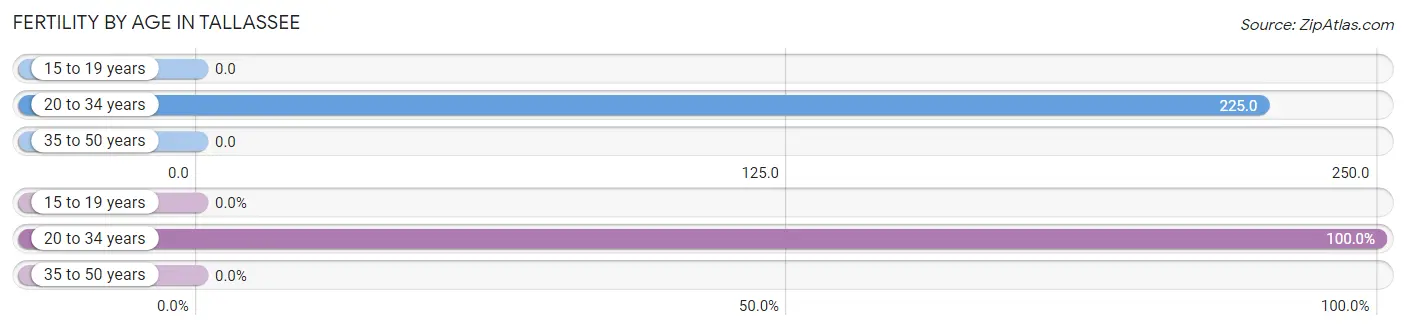
| Age Bracket | Women with Births | Births / 1,000 Women |
| 15 to 19 years | 0 (0.0%) | 0.0 |
| 20 to 34 years | 107 (100.0%) | 225.0 |
| 35 to 50 years | 0 (0.0%) | 0.0 |
| Total | 107 (100.0%) | 94.0 |
Fertility by Age by Marriage Status in Tallassee
53.3% of women with births (107) in Tallassee are married. The highest percentage of unmarried women with births falls into 20 to 34 years age bracket with 46.7% of them unmarried at the time of birth, while the lowest percentage of unmarried women with births belong to 20 to 34 years age bracket with 46.7% of them unmarried.
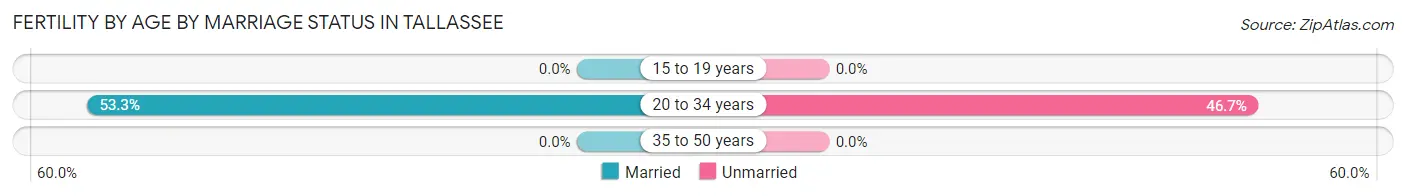
| Age Bracket | Married | Unmarried |
| 15 to 19 years | 0 (0.0%) | 0 (0.0%) |
| 20 to 34 years | 57 (53.3%) | 50 (46.7%) |
| 35 to 50 years | 0 (0.0%) | 0 (0.0%) |
| Total | 57 (53.3%) | 50 (46.7%) |
Fertility by Education in Tallassee
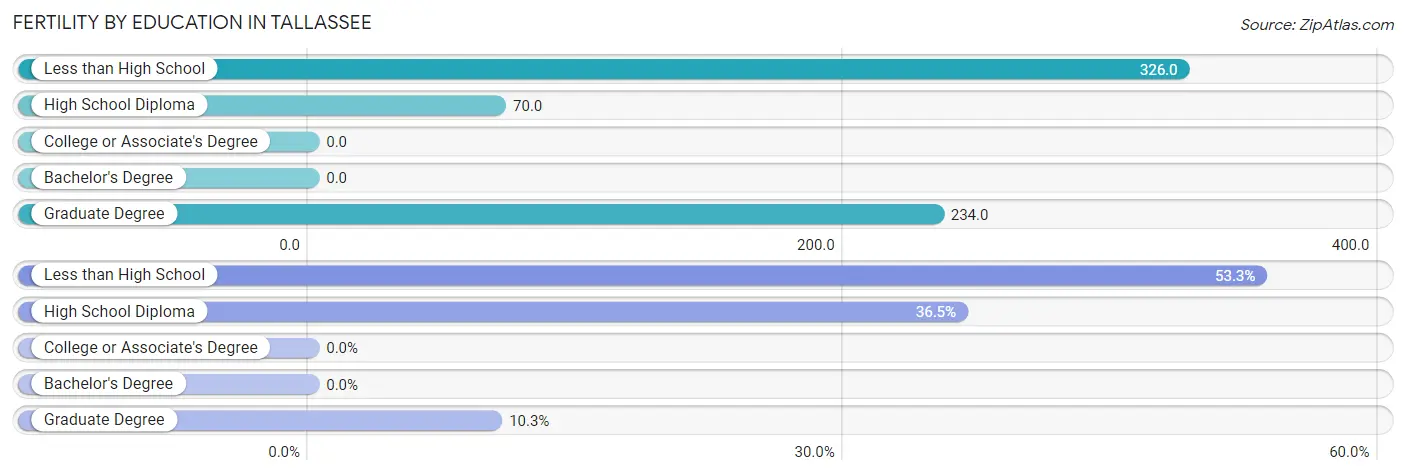
| Educational Attainment | Women with Births | Births / 1,000 Women |
| Less than High School | 57 (53.3%) | 326.0 |
| High School Diploma | 39 (36.4%) | 70.0 |
| College or Associate's Degree | 0 (0.0%) | 0.0 |
| Bachelor's Degree | 0 (0.0%) | 0.0 |
| Graduate Degree | 11 (10.3%) | 234.0 |
| Total | 107 (100.0%) | 94.0 |
Fertility by Education by Marriage Status in Tallassee
46.7% of women with births in Tallassee are unmarried. Women with the educational attainment of less than high school are most likely to be married with 100.0% of them married at childbirth, while women with the educational attainment of high school diploma are least likely to be married with 100.0% of them unmarried at childbirth.
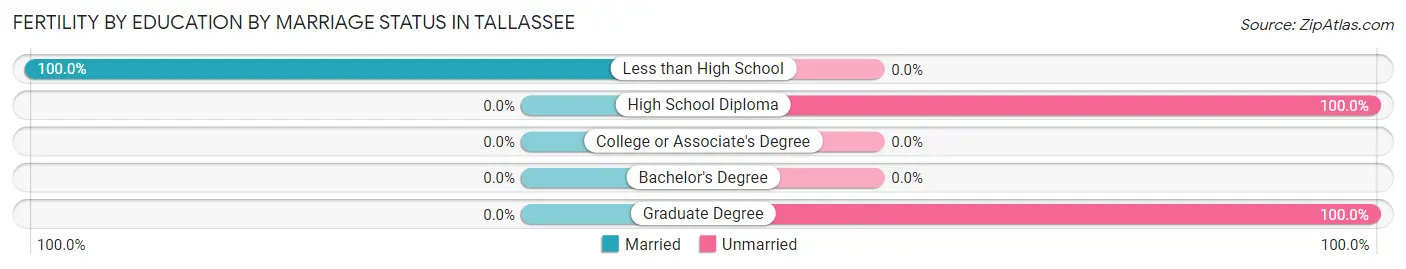
| Educational Attainment | Married | Unmarried |
| Less than High School | 57 (100.0%) | 0 (0.0%) |
| High School Diploma | 0 (0.0%) | 39 (100.0%) |
| College or Associate's Degree | 0 (0.0%) | 0 (0.0%) |
| Bachelor's Degree | 0 (0.0%) | 0 (0.0%) |
| Graduate Degree | 0 (0.0%) | 11 (100.0%) |
| Total | 57 (53.3%) | 50 (46.7%) |
Employment Characteristics in Tallassee
Employment by Class of Employer in Tallassee
Among the 2,216 employed individuals in Tallassee, private company employees (1,884 | 85.0%), self-employed (not incorporated) (101 | 4.6%), and federal government employees (92 | 4.2%) make up the most common classes of employment.
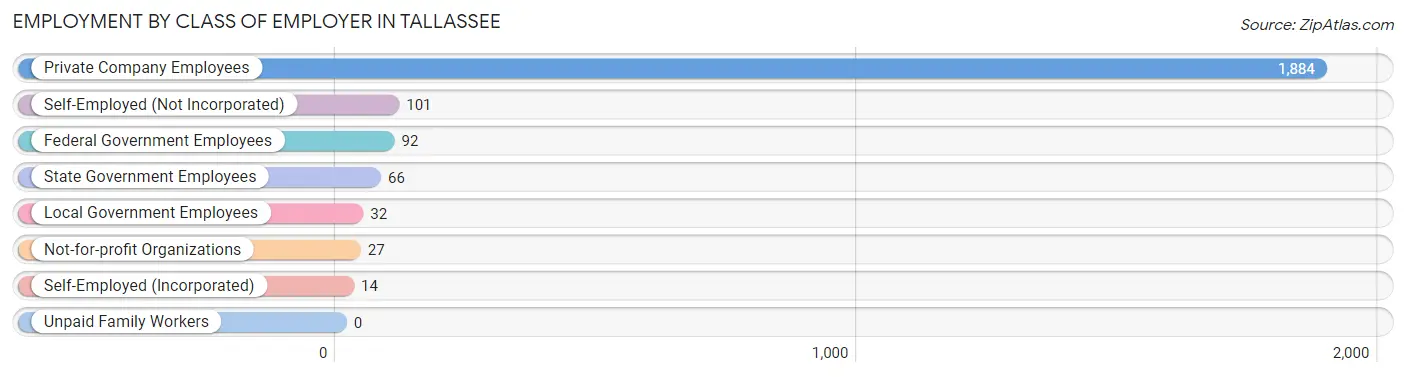
| Employer Class | # Employees | % Employees |
| Private Company Employees | 1,884 | 85.0% |
| Self-Employed (Incorporated) | 14 | 0.6% |
| Self-Employed (Not Incorporated) | 101 | 4.6% |
| Not-for-profit Organizations | 27 | 1.2% |
| Local Government Employees | 32 | 1.4% |
| State Government Employees | 66 | 3.0% |
| Federal Government Employees | 92 | 4.2% |
| Unpaid Family Workers | 0 | 0.0% |
| Total | 2,216 | 100.0% |
Employment Status by Age in Tallassee
According to the labor force statistics for Tallassee, out of the total population over 16 years of age (4,470), 54.2% or 2,423 individuals are in the labor force, with 8.5% or 206 of them unemployed. The age group with the highest labor force participation rate is 25 to 29 years, with 96.3% or 361 individuals in the labor force. Within the labor force, the 20 to 24 years age range has the highest percentage of unemployed individuals, with 41.9% or 83 of them being unemployed.
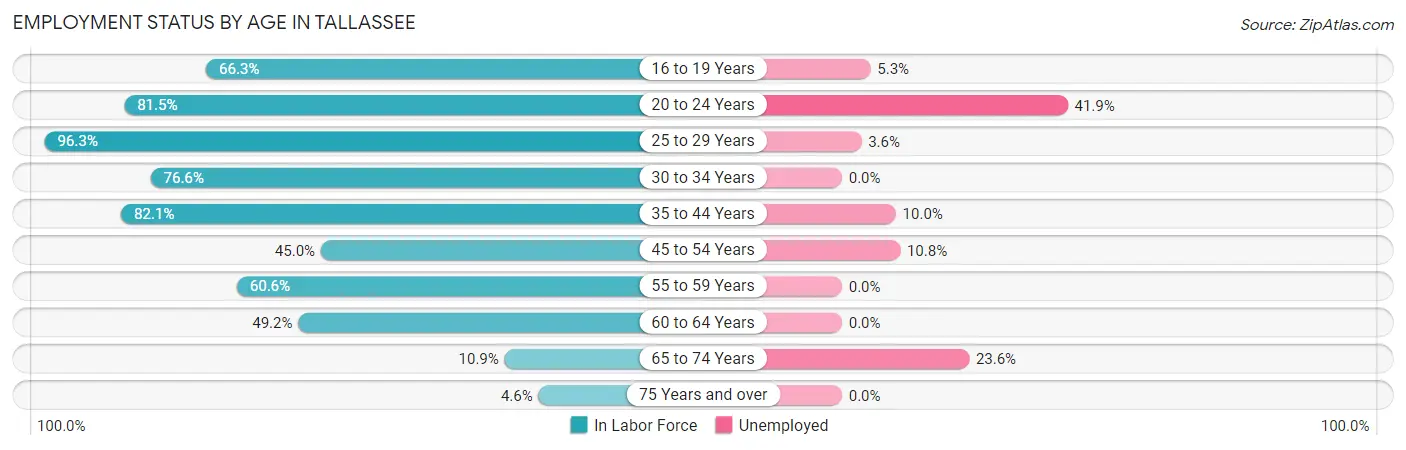
| Age Bracket | In Labor Force | Unemployed |
| 16 to 19 Years | 449 (66.3%) | 24 (5.3%) |
| 20 to 24 Years | 198 (81.5%) | 83 (41.9%) |
| 25 to 29 Years | 361 (96.3%) | 13 (3.6%) |
| 30 to 34 Years | 246 (76.6%) | 0 (0.0%) |
| 35 to 44 Years | 478 (82.1%) | 48 (10.0%) |
| 45 to 54 Years | 204 (45.0%) | 22 (10.8%) |
| 55 to 59 Years | 209 (60.6%) | 0 (0.0%) |
| 60 to 64 Years | 186 (49.2%) | 0 (0.0%) |
| 65 to 74 Years | 72 (10.9%) | 17 (23.6%) |
| 75 Years and over | 20 (4.6%) | 0 (0.0%) |
| Total | 2,423 (54.2%) | 206 (8.5%) |
Employment Status by Educational Attainment in Tallassee
According to labor force statistics for Tallassee, 68.6% of individuals (1,683) out of the total population between 25 and 64 years of age (2,454) are in the labor force, with 4.9% or 82 of them being unemployed. The group with the highest labor force participation rate are those with the educational attainment of college / associate degree, with 80.7% or 650 individuals in the labor force. Within the labor force, individuals with less than high school education have the highest percentage of unemployment, with 23.3% or 21 of them being unemployed.
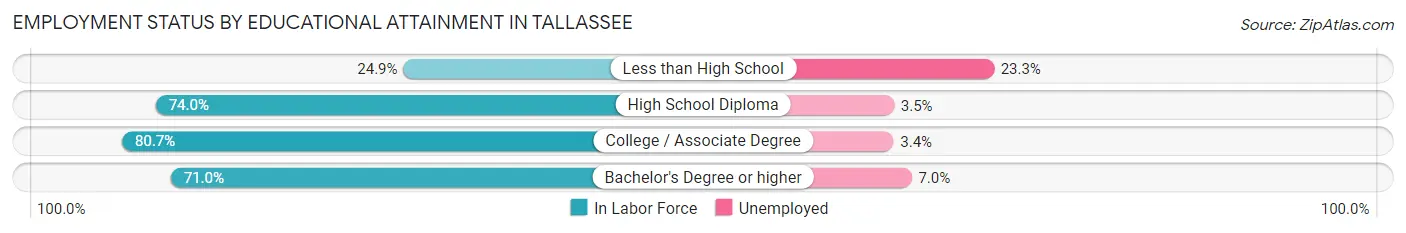
| Educational Attainment | In Labor Force | Unemployed |
| Less than High School | 90 (24.9%) | 84 (23.3%) |
| High School Diploma | 743 (74.0%) | 35 (3.5%) |
| College / Associate Degree | 650 (80.7%) | 27 (3.4%) |
| Bachelor's Degree or higher | 201 (71.0%) | 20 (7.0%) |
| Total | 1,683 (68.6%) | 120 (4.9%) |
Employment Occupations by Sex in Tallassee
Management, Business, Science and Arts Occupations
The most common Management, Business, Science and Arts occupations in Tallassee are Management (152 | 6.9%), Health Diagnosing & Treating (152 | 6.9%), Business & Financial (135 | 6.1%), Health Technologists (77 | 3.5%), and Community & Social Service (47 | 2.1%).
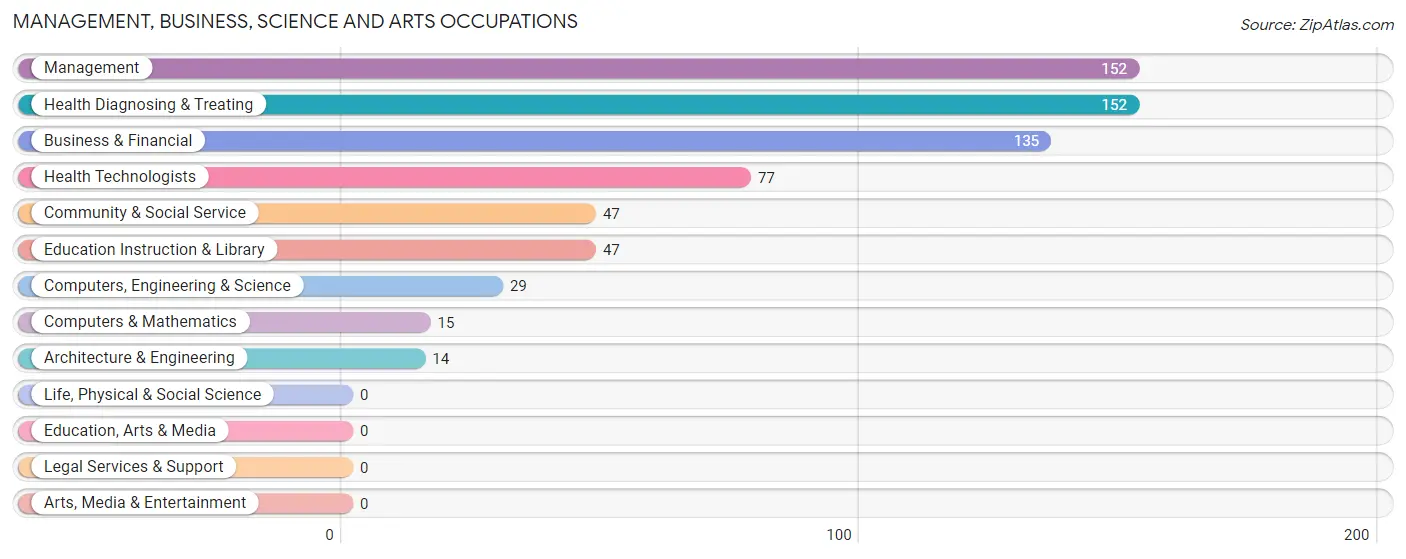
Management, Business, Science and Arts Occupations by Sex
Within the Management, Business, Science and Arts occupations in Tallassee, the most male-oriented occupations are Computers, Engineering & Science (100.0%), Computers & Mathematics (100.0%), and Architecture & Engineering (100.0%), while the most female-oriented occupations are Community & Social Service (100.0%), Education Instruction & Library (100.0%), and Health Technologists (100.0%).
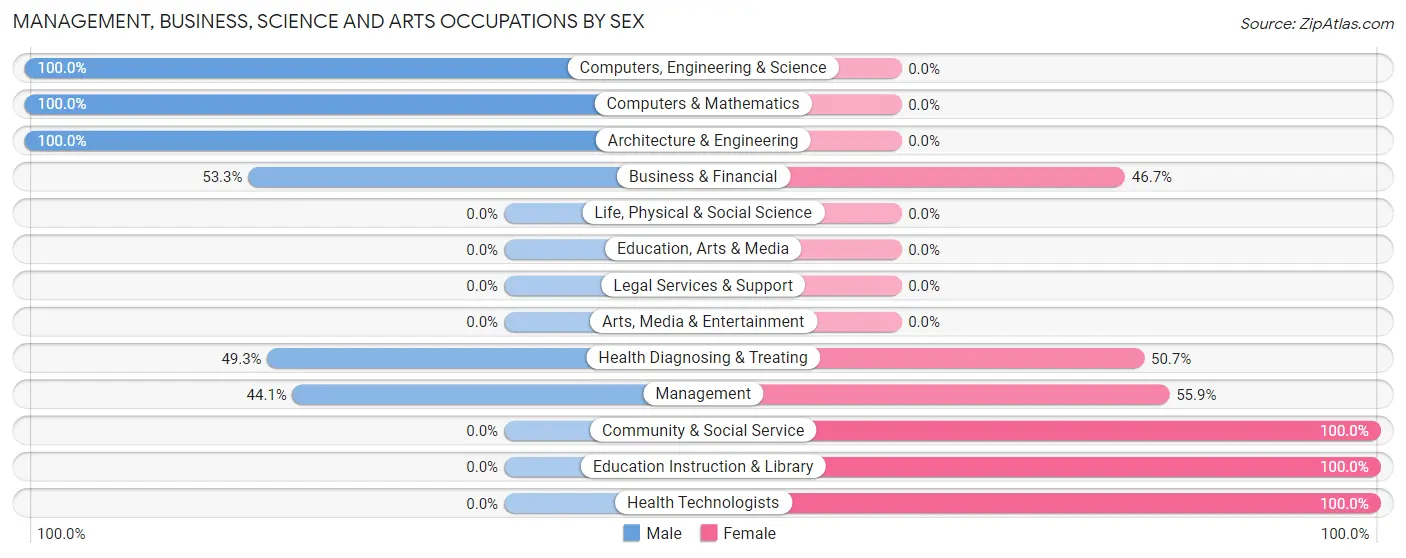
| Occupation | Male | Female |
| Management | 67 (44.1%) | 85 (55.9%) |
| Business & Financial | 72 (53.3%) | 63 (46.7%) |
| Computers, Engineering & Science | 29 (100.0%) | 0 (0.0%) |
| Computers & Mathematics | 15 (100.0%) | 0 (0.0%) |
| Architecture & Engineering | 14 (100.0%) | 0 (0.0%) |
| Life, Physical & Social Science | 0 (0.0%) | 0 (0.0%) |
| Community & Social Service | 0 (0.0%) | 47 (100.0%) |
| Education, Arts & Media | 0 (0.0%) | 0 (0.0%) |
| Legal Services & Support | 0 (0.0%) | 0 (0.0%) |
| Education Instruction & Library | 0 (0.0%) | 47 (100.0%) |
| Arts, Media & Entertainment | 0 (0.0%) | 0 (0.0%) |
| Health Diagnosing & Treating | 75 (49.3%) | 77 (50.7%) |
| Health Technologists | 0 (0.0%) | 77 (100.0%) |
| Total (Category) | 243 (47.2%) | 272 (52.8%) |
| Total (Overall) | 1,269 (57.3%) | 947 (42.7%) |
Services Occupations
The most common Services occupations in Tallassee are Cleaning & Maintenance (107 | 4.8%), Food Preparation & Serving (31 | 1.4%), Healthcare Support (27 | 1.2%), Security & Protection (19 | 0.9%), and Firefighting & Prevention (19 | 0.9%).
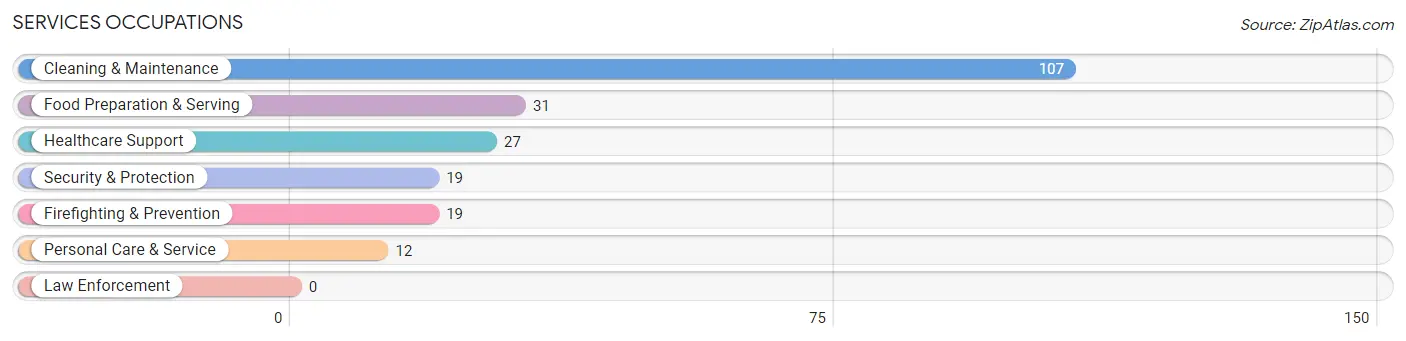
Services Occupations by Sex
Within the Services occupations in Tallassee, the most male-oriented occupations are Security & Protection (100.0%), Firefighting & Prevention (100.0%), and Food Preparation & Serving (100.0%), while the most female-oriented occupations are Healthcare Support (100.0%), Personal Care & Service (100.0%), and Cleaning & Maintenance (42.1%).
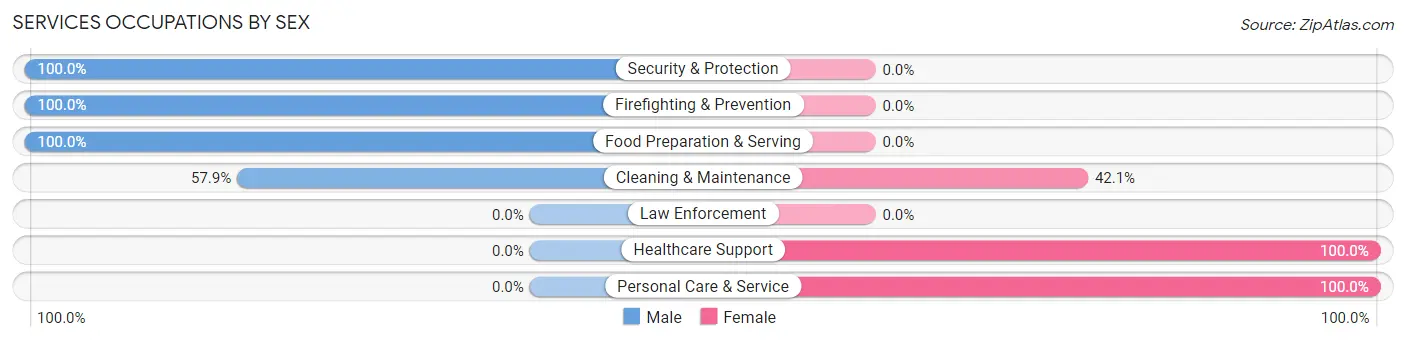
| Occupation | Male | Female |
| Healthcare Support | 0 (0.0%) | 27 (100.0%) |
| Security & Protection | 19 (100.0%) | 0 (0.0%) |
| Firefighting & Prevention | 19 (100.0%) | 0 (0.0%) |
| Law Enforcement | 0 (0.0%) | 0 (0.0%) |
| Food Preparation & Serving | 31 (100.0%) | 0 (0.0%) |
| Cleaning & Maintenance | 62 (57.9%) | 45 (42.1%) |
| Personal Care & Service | 0 (0.0%) | 12 (100.0%) |
| Total (Category) | 112 (57.1%) | 84 (42.9%) |
| Total (Overall) | 1,269 (57.3%) | 947 (42.7%) |
Sales and Office Occupations
The most common Sales and Office occupations in Tallassee are Sales & Related (257 | 11.6%), and Office & Administration (233 | 10.5%).
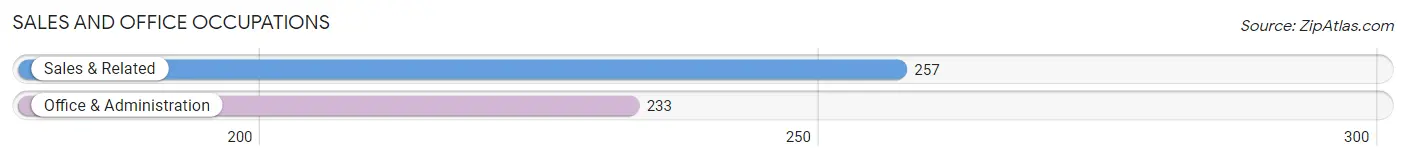
Sales and Office Occupations by Sex
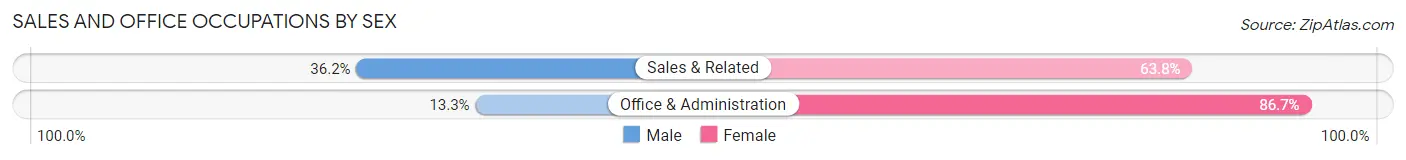
| Occupation | Male | Female |
| Sales & Related | 93 (36.2%) | 164 (63.8%) |
| Office & Administration | 31 (13.3%) | 202 (86.7%) |
| Total (Category) | 124 (25.3%) | 366 (74.7%) |
| Total (Overall) | 1,269 (57.3%) | 947 (42.7%) |
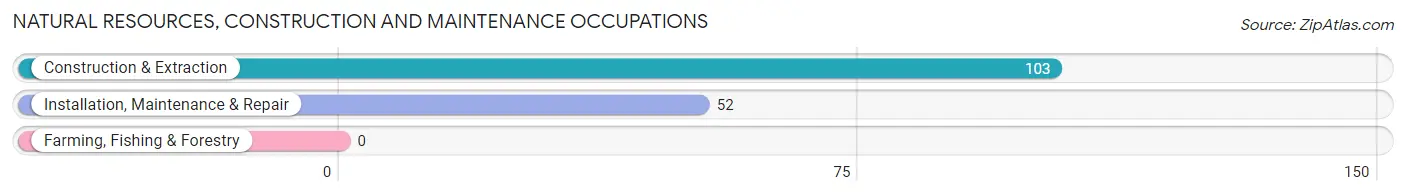
Natural Resources, Construction and Maintenance Occupations
The most common Natural Resources, Construction and Maintenance occupations in Tallassee are Construction & Extraction (103 | 4.6%), and Installation, Maintenance & Repair (52 | 2.4%).
Natural Resources, Construction and Maintenance Occupations by Sex
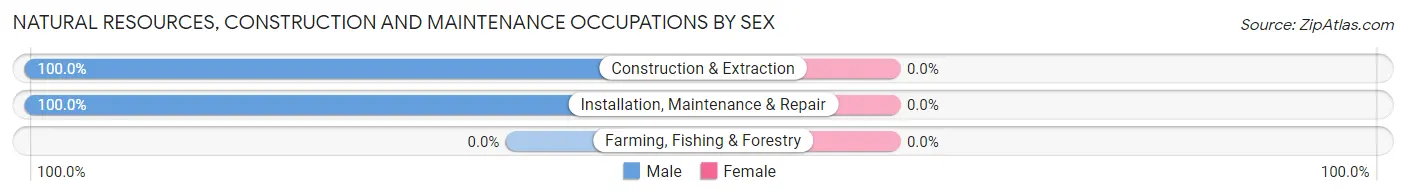
| Occupation | Male | Female |
| Farming, Fishing & Forestry | 0 (0.0%) | 0 (0.0%) |
| Construction & Extraction | 103 (100.0%) | 0 (0.0%) |
| Installation, Maintenance & Repair | 52 (100.0%) | 0 (0.0%) |
| Total (Category) | 155 (100.0%) | 0 (0.0%) |
| Total (Overall) | 1,269 (57.3%) | 947 (42.7%) |
Production, Transportation and Moving Occupations
The most common Production, Transportation and Moving occupations in Tallassee are Material Moving (406 | 18.3%), Transportation (247 | 11.2%), and Production (207 | 9.3%).
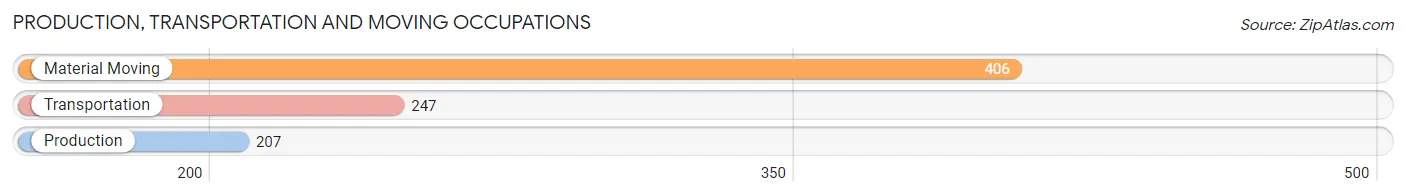
Production, Transportation and Moving Occupations by Sex
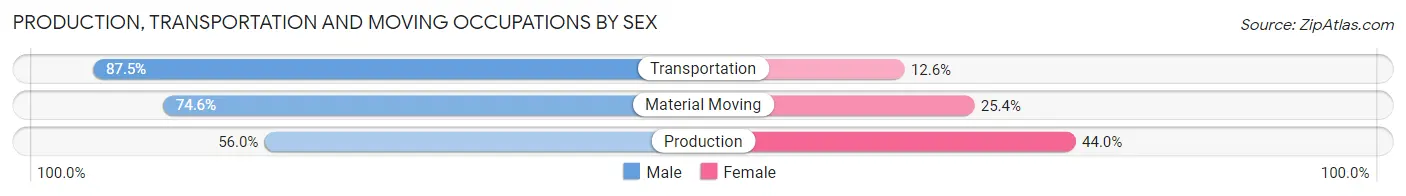
| Occupation | Male | Female |
| Production | 116 (56.0%) | 91 (44.0%) |
| Transportation | 216 (87.5%) | 31 (12.6%) |
| Material Moving | 303 (74.6%) | 103 (25.4%) |
| Total (Category) | 635 (73.8%) | 225 (26.2%) |
| Total (Overall) | 1,269 (57.3%) | 947 (42.7%) |
Employment Industries by Sex in Tallassee
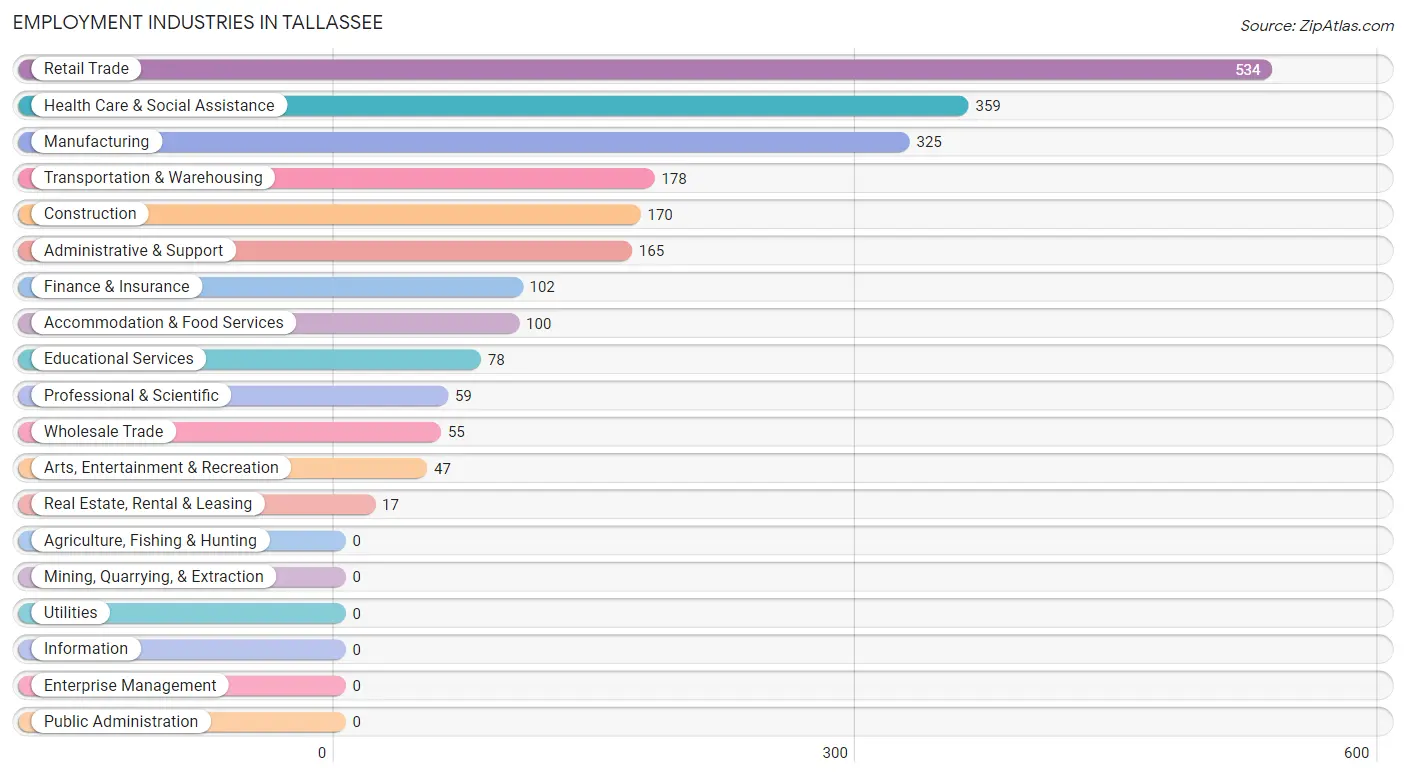
Employment Industries in Tallassee
The major employment industries in Tallassee include Retail Trade (534 | 24.1%), Health Care & Social Assistance (359 | 16.2%), Manufacturing (325 | 14.7%), Transportation & Warehousing (178 | 8.0%), and Construction (170 | 7.7%).
Employment Industries by Sex in Tallassee
The Tallassee industries that see more men than women are Wholesale Trade (100.0%), Transportation & Warehousing (100.0%), and Professional & Scientific (100.0%), whereas the industries that tend to have a higher number of women are Finance & Insurance (100.0%), Real Estate, Rental & Leasing (100.0%), and Educational Services (100.0%).
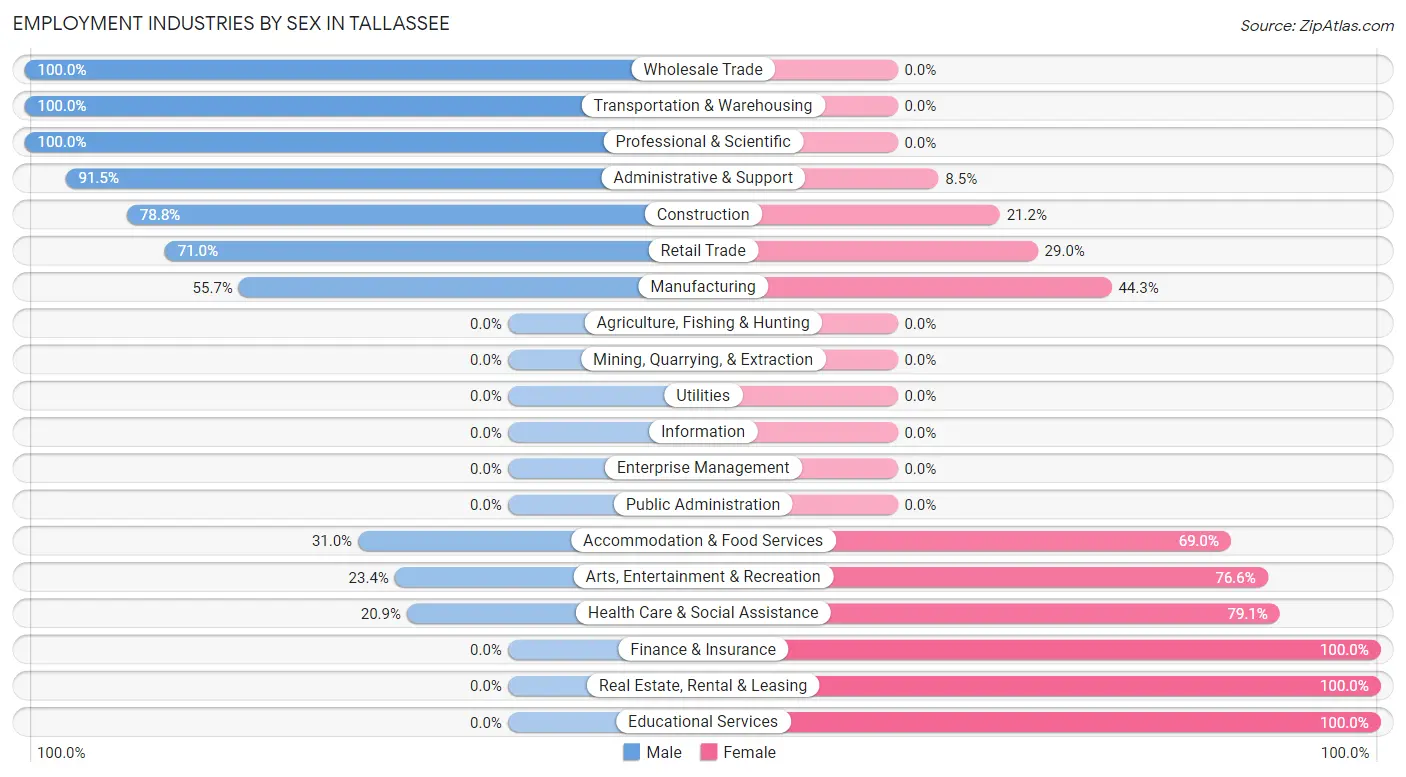
| Industry | Male | Female |
| Agriculture, Fishing & Hunting | 0 (0.0%) | 0 (0.0%) |
| Mining, Quarrying, & Extraction | 0 (0.0%) | 0 (0.0%) |
| Construction | 134 (78.8%) | 36 (21.2%) |
| Manufacturing | 181 (55.7%) | 144 (44.3%) |
| Wholesale Trade | 55 (100.0%) | 0 (0.0%) |
| Retail Trade | 379 (71.0%) | 155 (29.0%) |
| Transportation & Warehousing | 178 (100.0%) | 0 (0.0%) |
| Utilities | 0 (0.0%) | 0 (0.0%) |
| Information | 0 (0.0%) | 0 (0.0%) |
| Finance & Insurance | 0 (0.0%) | 102 (100.0%) |
| Real Estate, Rental & Leasing | 0 (0.0%) | 17 (100.0%) |
| Professional & Scientific | 59 (100.0%) | 0 (0.0%) |
| Enterprise Management | 0 (0.0%) | 0 (0.0%) |
| Administrative & Support | 151 (91.5%) | 14 (8.5%) |
| Educational Services | 0 (0.0%) | 78 (100.0%) |
| Health Care & Social Assistance | 75 (20.9%) | 284 (79.1%) |
| Arts, Entertainment & Recreation | 11 (23.4%) | 36 (76.6%) |
| Accommodation & Food Services | 31 (31.0%) | 69 (69.0%) |
| Public Administration | 0 (0.0%) | 0 (0.0%) |
| Total | 1,269 (57.3%) | 947 (42.7%) |
Education in Tallassee
School Enrollment in Tallassee
The most common levels of schooling among the 652 students in Tallassee are middle school (213 | 32.7%), high school (189 | 29.0%), and elementary school (87 | 13.3%).
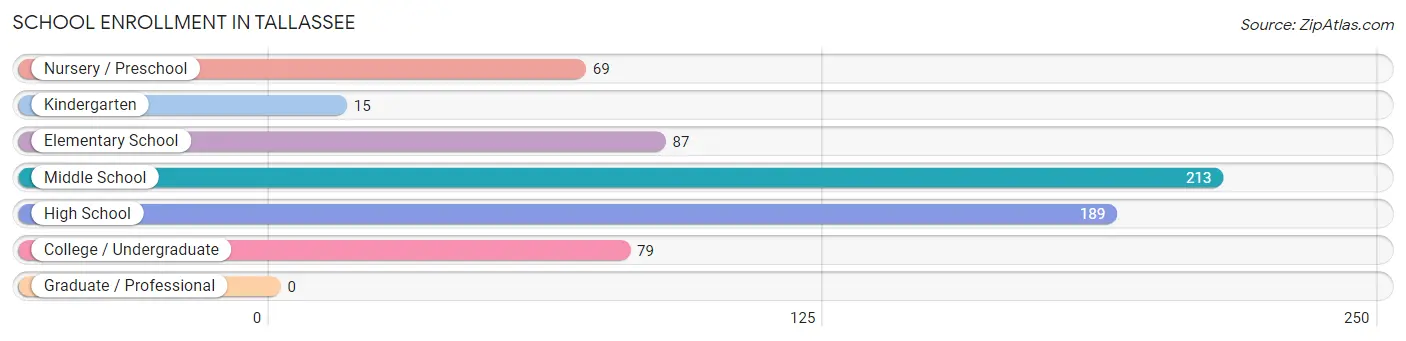
| School Level | # Students | % Students |
| Nursery / Preschool | 69 | 10.6% |
| Kindergarten | 15 | 2.3% |
| Elementary School | 87 | 13.3% |
| Middle School | 213 | 32.7% |
| High School | 189 | 29.0% |
| College / Undergraduate | 79 | 12.1% |
| Graduate / Professional | 0 | 0.0% |
| Total | 652 | 100.0% |
School Enrollment by Age by Funding Source in Tallassee
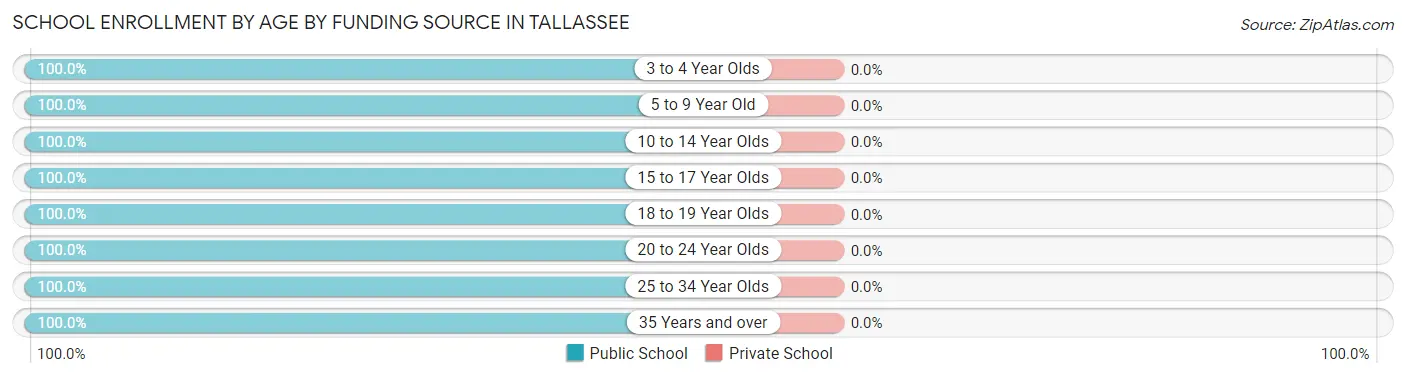
| Age Bracket | Public School | Private School |
| 3 to 4 Year Olds | 69 (100.0%) | 0 (0.0%) |
| 5 to 9 Year Old | 125 (100.0%) | 0 (0.0%) |
| 10 to 14 Year Olds | 199 (100.0%) | 0 (0.0%) |
| 15 to 17 Year Olds | 141 (100.0%) | 0 (0.0%) |
| 18 to 19 Year Olds | 39 (100.0%) | 0 (0.0%) |
| 20 to 24 Year Olds | 20 (100.0%) | 0 (0.0%) |
| 25 to 34 Year Olds | 36 (100.0%) | 0 (0.0%) |
| 35 Years and over | 23 (100.0%) | 0 (0.0%) |
| Total | 652 (100.0%) | 0 (0.0%) |
Educational Attainment by Field of Study in Tallassee
Business (95 | 20.4%), psychology (62 | 13.3%), science & technology (62 | 13.3%), education (62 | 13.3%), and bio, nature & agricultural (59 | 12.7%) are the most common fields of study among 465 individuals in Tallassee who have obtained a bachelor's degree or higher.
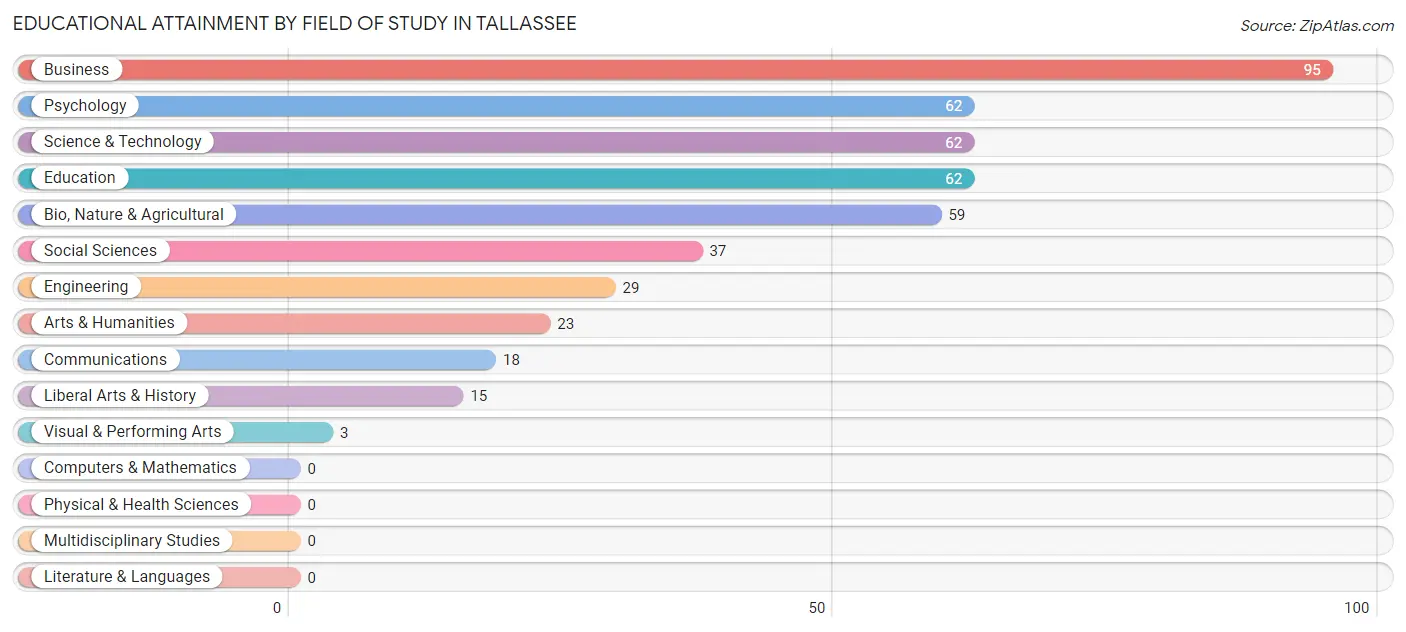
| Field of Study | # Graduates | % Graduates |
| Computers & Mathematics | 0 | 0.0% |
| Bio, Nature & Agricultural | 59 | 12.7% |
| Physical & Health Sciences | 0 | 0.0% |
| Psychology | 62 | 13.3% |
| Social Sciences | 37 | 8.0% |
| Engineering | 29 | 6.2% |
| Multidisciplinary Studies | 0 | 0.0% |
| Science & Technology | 62 | 13.3% |
| Business | 95 | 20.4% |
| Education | 62 | 13.3% |
| Literature & Languages | 0 | 0.0% |
| Liberal Arts & History | 15 | 3.2% |
| Visual & Performing Arts | 3 | 0.6% |
| Communications | 18 | 3.9% |
| Arts & Humanities | 23 | 5.0% |
| Total | 465 | 100.0% |
Transportation & Commute in Tallassee
Vehicle Availability by Sex in Tallassee
The most prevalent vehicle ownership categories in Tallassee are males with 2 vehicles (628, accounting for 49.5%) and females with 2 vehicles (376, making up 66.3%).
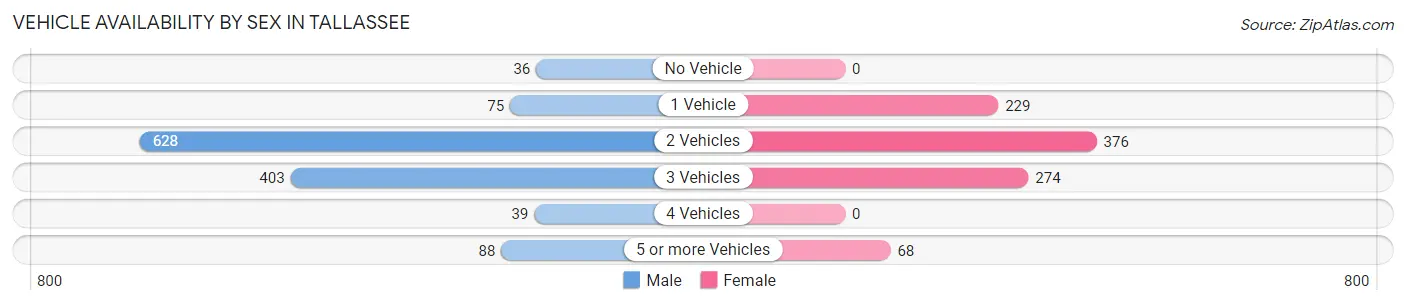
| Vehicles Available | Male | Female |
| No Vehicle | 36 (2.8%) | 0 (0.0%) |
| 1 Vehicle | 75 (5.9%) | 229 (24.2%) |
| 2 Vehicles | 628 (49.5%) | 376 (39.7%) |
| 3 Vehicles | 403 (31.8%) | 274 (28.9%) |
| 4 Vehicles | 39 (3.1%) | 0 (0.0%) |
| 5 or more Vehicles | 88 (6.9%) | 68 (7.2%) |
| Total | 1,269 (100.0%) | 947 (100.0%) |
Commute Time in Tallassee
The most frequently occuring commute durations in Tallassee are less than 5 minutes (527 commuters, 24.5%), 5 to 9 minutes (416 commuters, 19.4%), and 45 to 59 minutes (334 commuters, 15.6%).
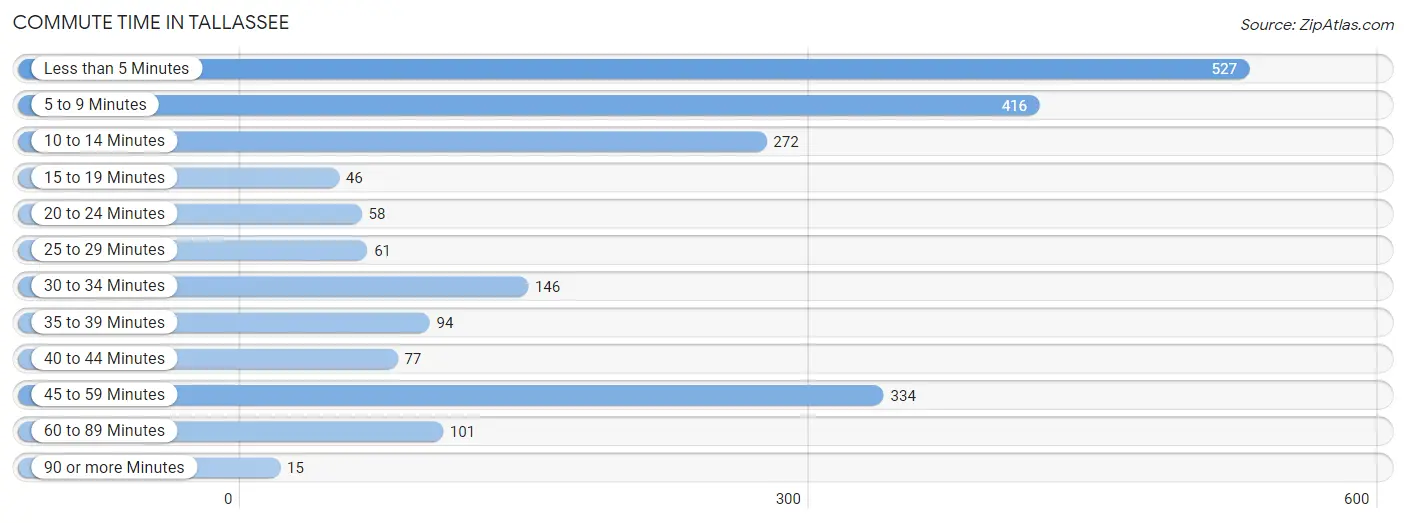
| Commute Time | # Commuters | % Commuters |
| Less than 5 Minutes | 527 | 24.5% |
| 5 to 9 Minutes | 416 | 19.4% |
| 10 to 14 Minutes | 272 | 12.7% |
| 15 to 19 Minutes | 46 | 2.1% |
| 20 to 24 Minutes | 58 | 2.7% |
| 25 to 29 Minutes | 61 | 2.8% |
| 30 to 34 Minutes | 146 | 6.8% |
| 35 to 39 Minutes | 94 | 4.4% |
| 40 to 44 Minutes | 77 | 3.6% |
| 45 to 59 Minutes | 334 | 15.6% |
| 60 to 89 Minutes | 101 | 4.7% |
| 90 or more Minutes | 15 | 0.7% |
Commute Time by Sex in Tallassee
The most common commute times in Tallassee are less than 5 minutes (443 commuters, 34.9%) for males and 5 to 9 minutes (344 commuters, 39.2%) for females.
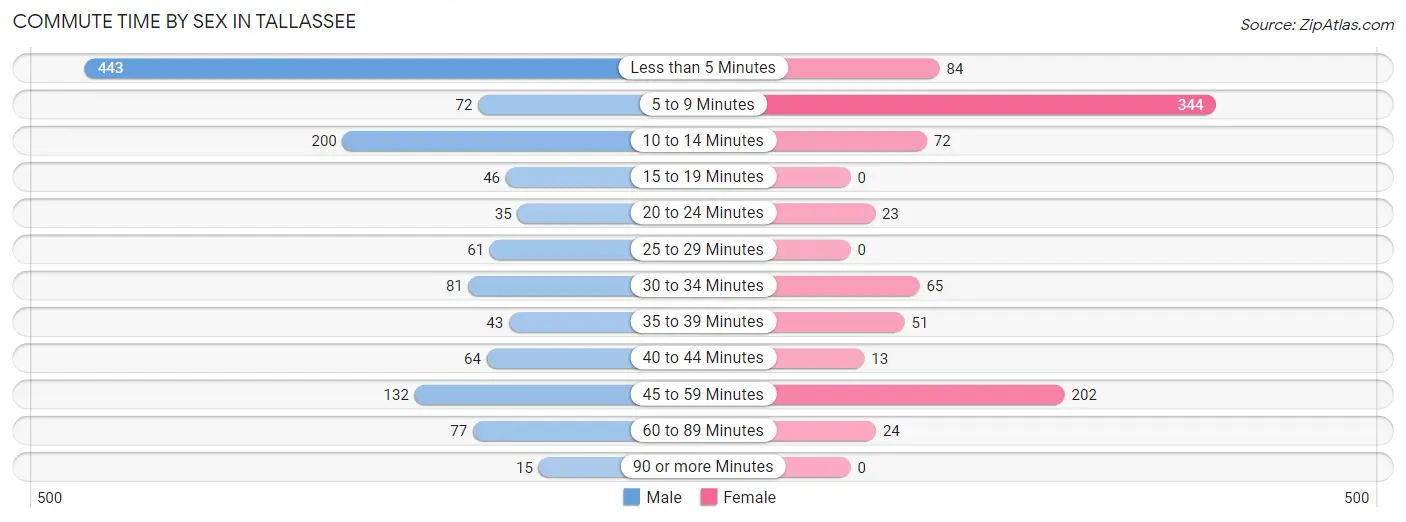
| Commute Time | Male | Female |
| Less than 5 Minutes | 443 (34.9%) | 84 (9.6%) |
| 5 to 9 Minutes | 72 (5.7%) | 344 (39.2%) |
| 10 to 14 Minutes | 200 (15.8%) | 72 (8.2%) |
| 15 to 19 Minutes | 46 (3.6%) | 0 (0.0%) |
| 20 to 24 Minutes | 35 (2.8%) | 23 (2.6%) |
| 25 to 29 Minutes | 61 (4.8%) | 0 (0.0%) |
| 30 to 34 Minutes | 81 (6.4%) | 65 (7.4%) |
| 35 to 39 Minutes | 43 (3.4%) | 51 (5.8%) |
| 40 to 44 Minutes | 64 (5.0%) | 13 (1.5%) |
| 45 to 59 Minutes | 132 (10.4%) | 202 (23.0%) |
| 60 to 89 Minutes | 77 (6.1%) | 24 (2.7%) |
| 90 or more Minutes | 15 (1.2%) | 0 (0.0%) |
Time of Departure to Work by Sex in Tallassee
The most frequent times of departure to work in Tallassee are 5:00 AM to 5:29 AM (417, 32.9%) for males and 7:30 AM to 7:59 AM (135, 15.4%) for females.
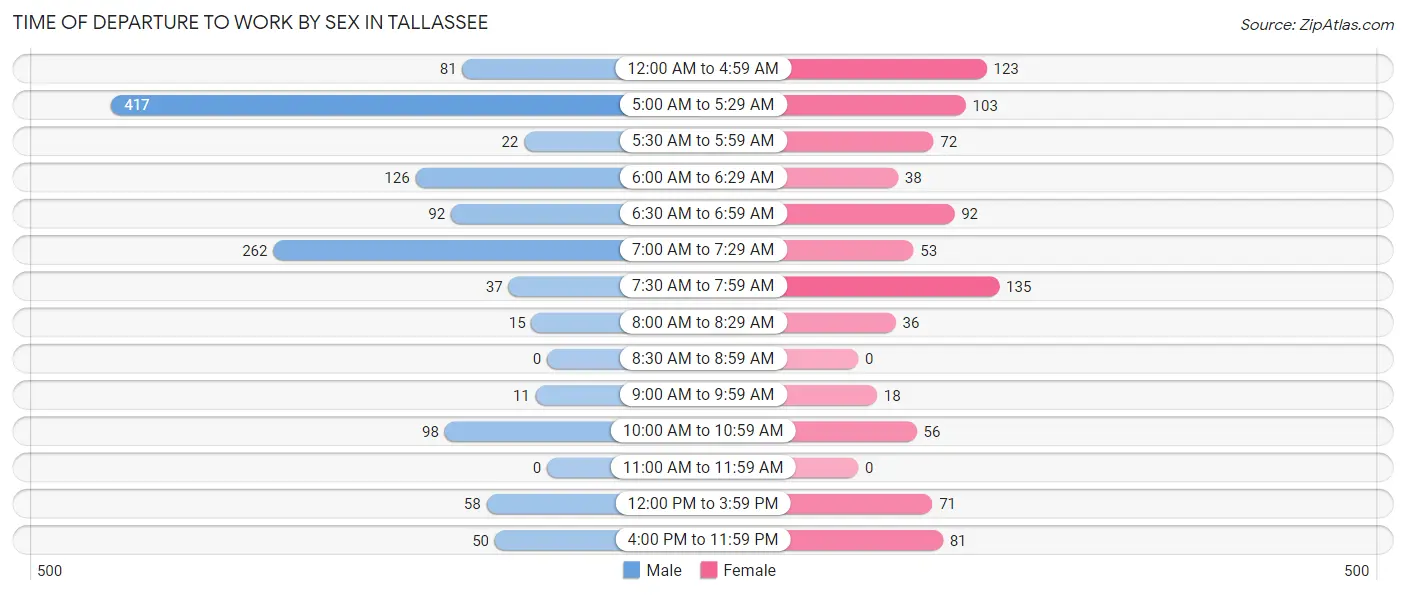
| Time of Departure | Male | Female |
| 12:00 AM to 4:59 AM | 81 (6.4%) | 123 (14.0%) |
| 5:00 AM to 5:29 AM | 417 (32.9%) | 103 (11.7%) |
| 5:30 AM to 5:59 AM | 22 (1.7%) | 72 (8.2%) |
| 6:00 AM to 6:29 AM | 126 (9.9%) | 38 (4.3%) |
| 6:30 AM to 6:59 AM | 92 (7.2%) | 92 (10.5%) |
| 7:00 AM to 7:29 AM | 262 (20.6%) | 53 (6.0%) |
| 7:30 AM to 7:59 AM | 37 (2.9%) | 135 (15.4%) |
| 8:00 AM to 8:29 AM | 15 (1.2%) | 36 (4.1%) |
| 8:30 AM to 8:59 AM | 0 (0.0%) | 0 (0.0%) |
| 9:00 AM to 9:59 AM | 11 (0.9%) | 18 (2.1%) |
| 10:00 AM to 10:59 AM | 98 (7.7%) | 56 (6.4%) |
| 11:00 AM to 11:59 AM | 0 (0.0%) | 0 (0.0%) |
| 12:00 PM to 3:59 PM | 58 (4.6%) | 71 (8.1%) |
| 4:00 PM to 11:59 PM | 50 (3.9%) | 81 (9.2%) |
| Total | 1,269 (100.0%) | 878 (100.0%) |
Housing Occupancy in Tallassee
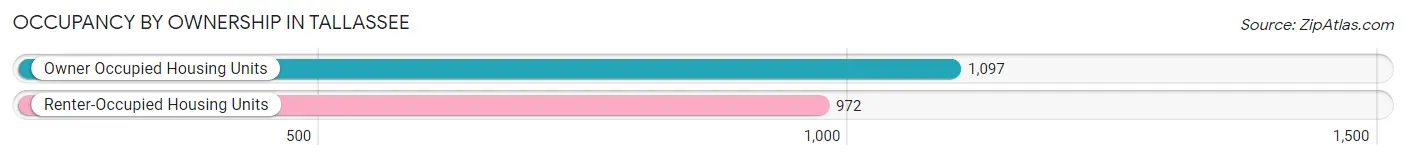
Occupancy by Ownership in Tallassee
Of the total 2,069 dwellings in Tallassee, owner-occupied units account for 1,097 (53.0%), while renter-occupied units make up 972 (47.0%).
| Occupancy | # Housing Units | % Housing Units |
| Owner Occupied Housing Units | 1,097 | 53.0% |
| Renter-Occupied Housing Units | 972 | 47.0% |
| Total Occupied Housing Units | 2,069 | 100.0% |
Occupancy by Household Size in Tallassee
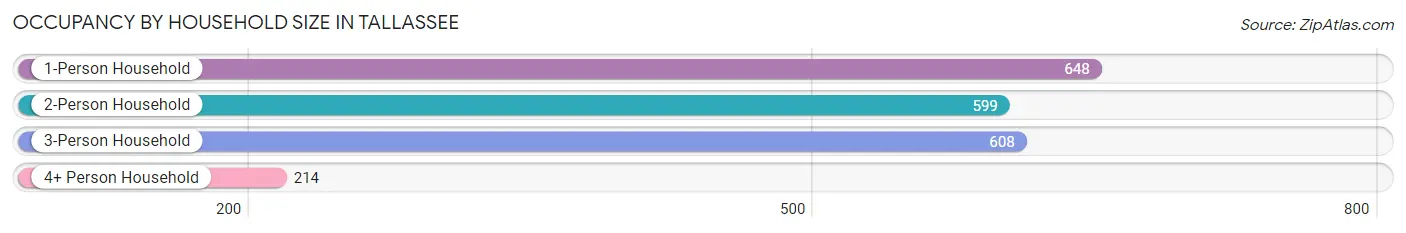
| Household Size | # Housing Units | % Housing Units |
| 1-Person Household | 648 | 31.3% |
| 2-Person Household | 599 | 28.9% |
| 3-Person Household | 608 | 29.4% |
| 4+ Person Household | 214 | 10.3% |
| Total Housing Units | 2,069 | 100.0% |
Occupancy by Ownership by Household Size in Tallassee
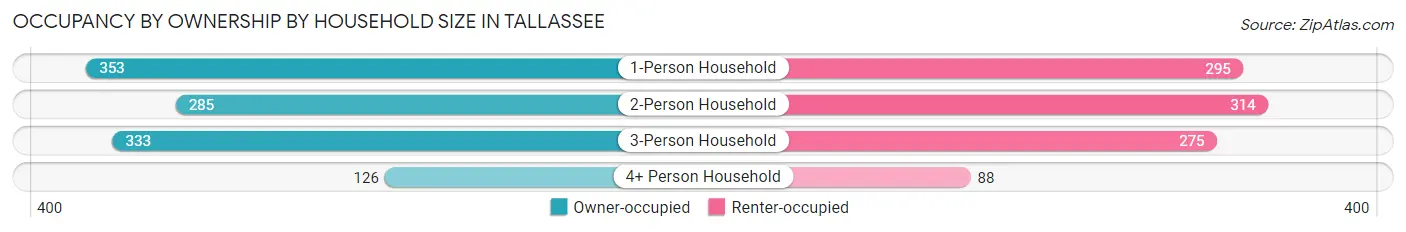
| Household Size | Owner-occupied | Renter-occupied |
| 1-Person Household | 353 (54.5%) | 295 (45.5%) |
| 2-Person Household | 285 (47.6%) | 314 (52.4%) |
| 3-Person Household | 333 (54.8%) | 275 (45.2%) |
| 4+ Person Household | 126 (58.9%) | 88 (41.1%) |
| Total Housing Units | 1,097 (53.0%) | 972 (47.0%) |
Occupancy by Educational Attainment in Tallassee
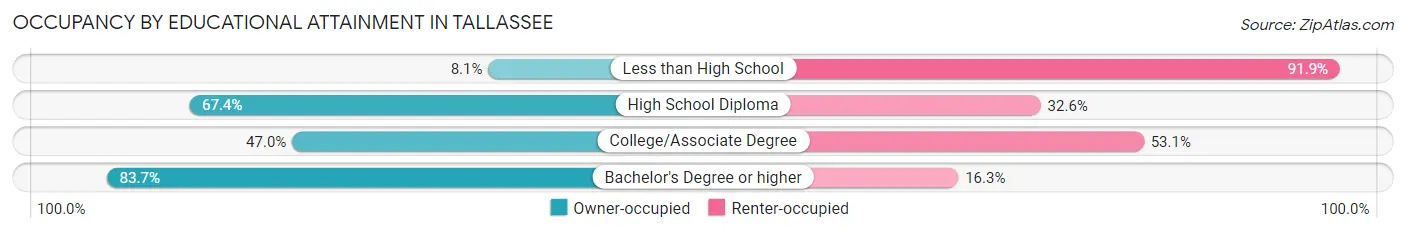
| Household Size | Owner-occupied | Renter-occupied |
| Less than High School | 25 (8.1%) | 285 (91.9%) |
| High School Diploma | 558 (67.4%) | 270 (32.6%) |
| College/Associate Degree | 339 (46.9%) | 383 (53.0%) |
| Bachelor's Degree or higher | 175 (83.7%) | 34 (16.3%) |
Occupancy by Age of Householder in Tallassee
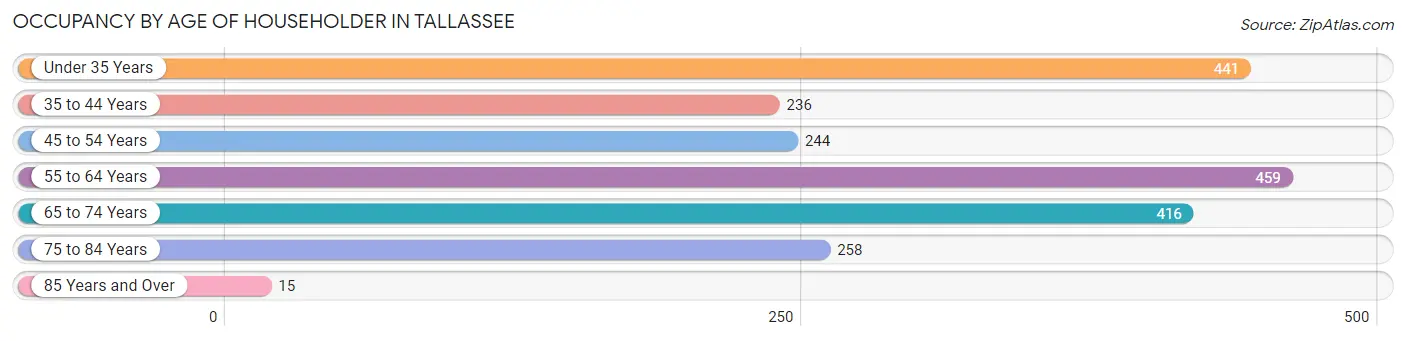
| Age Bracket | # Households | % Households |
| Under 35 Years | 441 | 21.3% |
| 35 to 44 Years | 236 | 11.4% |
| 45 to 54 Years | 244 | 11.8% |
| 55 to 64 Years | 459 | 22.2% |
| 65 to 74 Years | 416 | 20.1% |
| 75 to 84 Years | 258 | 12.5% |
| 85 Years and Over | 15 | 0.7% |
| Total | 2,069 | 100.0% |
Housing Finances in Tallassee
Median Income by Occupancy in Tallassee
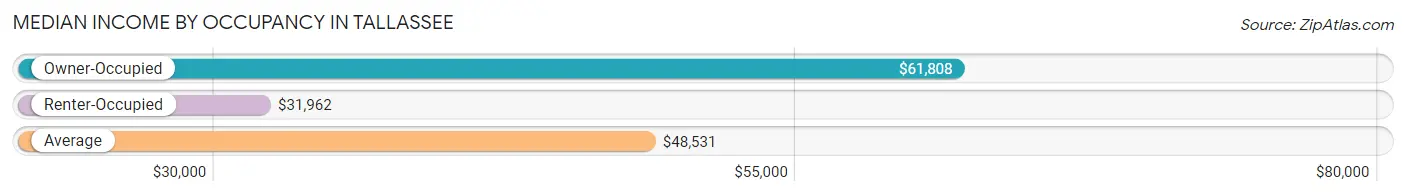
| Occupancy Type | # Households | Median Income |
| Owner-Occupied | 1,097 (53.0%) | $61,808 |
| Renter-Occupied | 972 (47.0%) | $31,962 |
| Average | 2,069 (100.0%) | $48,531 |
Occupancy by Householder Income Bracket in Tallassee
| Income Bracket | Owner-occupied | Renter-occupied |
| Less than $5,000 | 54 (4.9%) | 73 (7.5%) |
| $5,000 to $9,999 | 31 (2.8%) | 0 (0.0%) |
| $10,000 to $14,999 | 101 (9.2%) | 0 (0.0%) |
| $15,000 to $19,999 | 29 (2.6%) | 82 (8.4%) |
| $20,000 to $24,999 | 42 (3.8%) | 108 (11.1%) |
| $25,000 to $34,999 | 27 (2.5%) | 262 (27.0%) |
| $35,000 to $49,999 | 142 (12.9%) | 117 (12.0%) |
| $50,000 to $74,999 | 336 (30.6%) | 144 (14.8%) |
| $75,000 to $99,999 | 103 (9.4%) | 63 (6.5%) |
| $100,000 to $149,999 | 119 (10.8%) | 0 (0.0%) |
| $150,000 or more | 113 (10.3%) | 123 (12.7%) |
| Total | 1,097 (100.0%) | 972 (100.0%) |
Monthly Housing Cost Tiers in Tallassee
| Monthly Cost | Owner-occupied | Renter-occupied |
| Less than $300 | 178 (16.2%) | 50 (5.1%) |
| $300 to $499 | 191 (17.4%) | 78 (8.0%) |
| $500 to $799 | 289 (26.3%) | 189 (19.4%) |
| $800 to $999 | 113 (10.3%) | 211 (21.7%) |
| $1,000 to $1,499 | 240 (21.9%) | 345 (35.5%) |
| $1,500 to $1,999 | 51 (4.6%) | 0 (0.0%) |
| $2,000 to $2,499 | 35 (3.2%) | 0 (0.0%) |
| $2,500 to $2,999 | 0 (0.0%) | 0 (0.0%) |
| $3,000 or more | 0 (0.0%) | 0 (0.0%) |
| Total | 1,097 (100.0%) | 972 (100.0%) |
Physical Housing Characteristics in Tallassee
Housing Structures in Tallassee
| Structure Type | # Housing Units | % Housing Units |
| Single Unit, Detached | 1,696 | 82.0% |
| Single Unit, Attached | 0 | 0.0% |
| 2 Unit Apartments | 55 | 2.7% |
| 3 or 4 Unit Apartments | 151 | 7.3% |
| 5 to 9 Unit Apartments | 0 | 0.0% |
| 10 or more Apartments | 62 | 3.0% |
| Mobile Home / Other | 105 | 5.1% |
| Total | 2,069 | 100.0% |
Housing Structures by Occupancy in Tallassee
| Structure Type | Owner-occupied | Renter-occupied |
| Single Unit, Detached | 1,067 (62.9%) | 629 (37.1%) |
| Single Unit, Attached | 0 (0.0%) | 0 (0.0%) |
| 2 Unit Apartments | 0 (0.0%) | 55 (100.0%) |
| 3 or 4 Unit Apartments | 0 (0.0%) | 151 (100.0%) |
| 5 to 9 Unit Apartments | 0 (0.0%) | 0 (0.0%) |
| 10 or more Apartments | 0 (0.0%) | 62 (100.0%) |
| Mobile Home / Other | 30 (28.6%) | 75 (71.4%) |
| Total | 1,097 (53.0%) | 972 (47.0%) |
Housing Structures by Number of Rooms in Tallassee
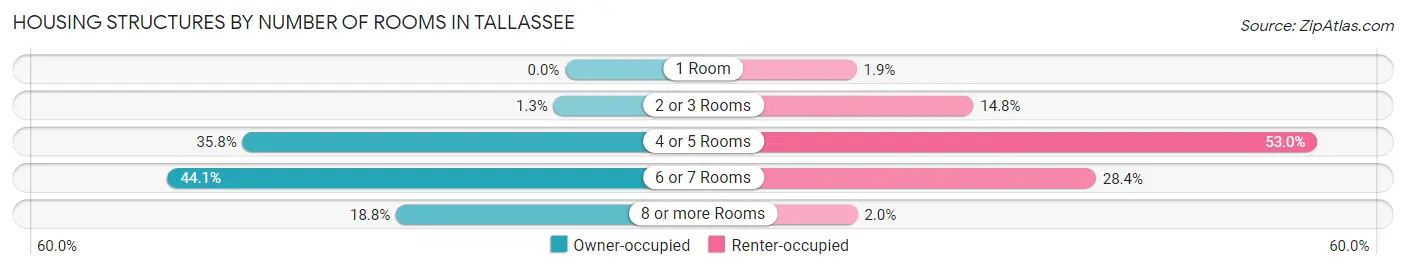
| Number of Rooms | Owner-occupied | Renter-occupied |
| 1 Room | 0 (0.0%) | 18 (1.8%) |
| 2 or 3 Rooms | 14 (1.3%) | 144 (14.8%) |
| 4 or 5 Rooms | 393 (35.8%) | 515 (53.0%) |
| 6 or 7 Rooms | 484 (44.1%) | 276 (28.4%) |
| 8 or more Rooms | 206 (18.8%) | 19 (1.9%) |
| Total | 1,097 (100.0%) | 972 (100.0%) |
Housing Structure by Heating Type in Tallassee
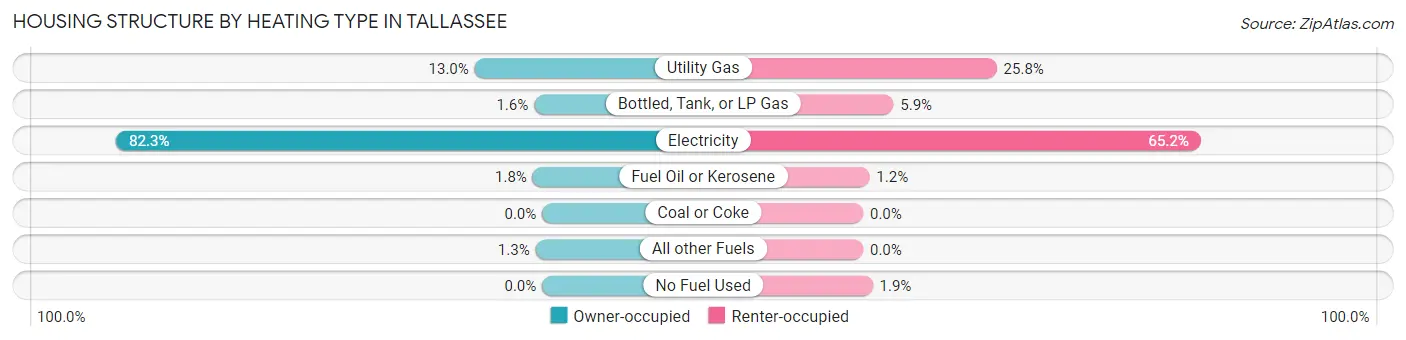
| Heating Type | Owner-occupied | Renter-occupied |
| Utility Gas | 143 (13.0%) | 251 (25.8%) |
| Bottled, Tank, or LP Gas | 17 (1.5%) | 57 (5.9%) |
| Electricity | 903 (82.3%) | 634 (65.2%) |
| Fuel Oil or Kerosene | 20 (1.8%) | 12 (1.2%) |
| Coal or Coke | 0 (0.0%) | 0 (0.0%) |
| All other Fuels | 14 (1.3%) | 0 (0.0%) |
| No Fuel Used | 0 (0.0%) | 18 (1.8%) |
| Total | 1,097 (100.0%) | 972 (100.0%) |
Household Vehicle Usage in Tallassee
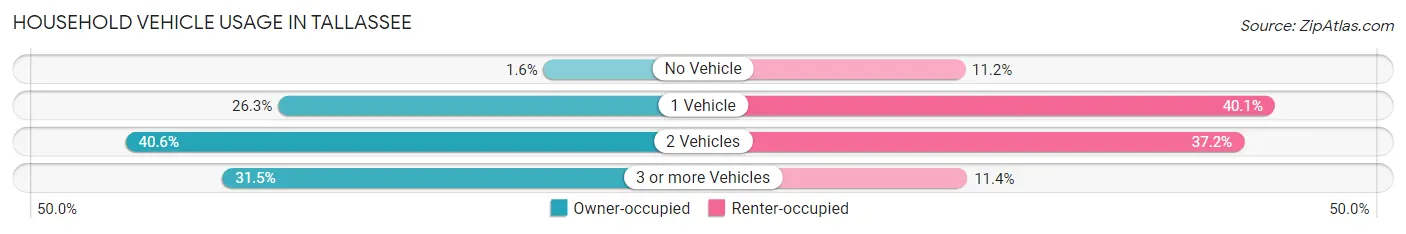
| Vehicles per Household | Owner-occupied | Renter-occupied |
| No Vehicle | 17 (1.5%) | 109 (11.2%) |
| 1 Vehicle | 289 (26.3%) | 390 (40.1%) |
| 2 Vehicles | 445 (40.6%) | 362 (37.2%) |
| 3 or more Vehicles | 346 (31.5%) | 111 (11.4%) |
| Total | 1,097 (100.0%) | 972 (100.0%) |
Real Estate & Mortgages in Tallassee
Real Estate and Mortgage Overview in Tallassee
| Characteristic | Without Mortgage | With Mortgage |
| Housing Units | 624 | 473 |
| Median Property Value | $127,200 | $157,200 |
| Median Household Income | $61,181 | $52 |
| Monthly Housing Costs | $464 | $0 |
| Real Estate Taxes | $399 | $75 |
Property Value by Mortgage Status in Tallassee
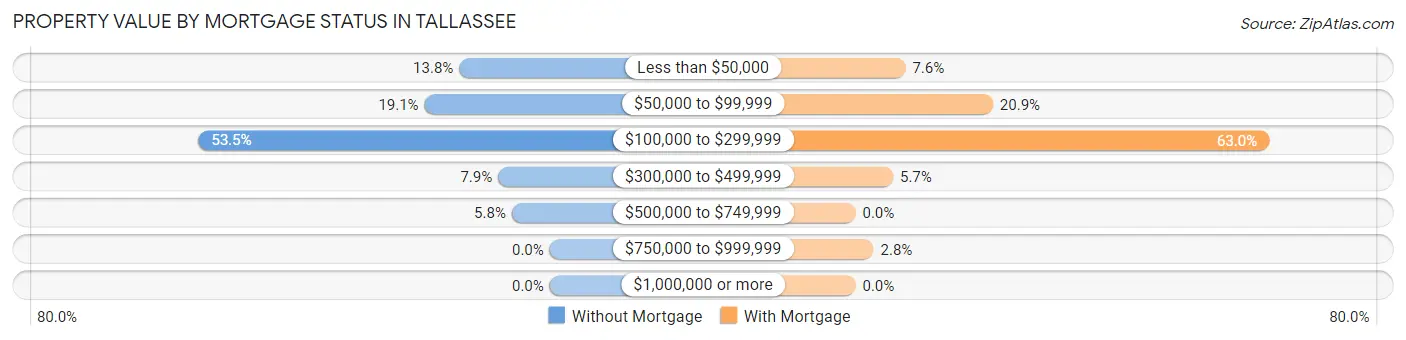
| Property Value | Without Mortgage | With Mortgage |
| Less than $50,000 | 86 (13.8%) | 36 (7.6%) |
| $50,000 to $99,999 | 119 (19.1%) | 99 (20.9%) |
| $100,000 to $299,999 | 334 (53.5%) | 298 (63.0%) |
| $300,000 to $499,999 | 49 (7.9%) | 27 (5.7%) |
| $500,000 to $749,999 | 36 (5.8%) | 0 (0.0%) |
| $750,000 to $999,999 | 0 (0.0%) | 13 (2.8%) |
| $1,000,000 or more | 0 (0.0%) | 0 (0.0%) |
| Total | 624 (100.0%) | 473 (100.0%) |
Household Income by Mortgage Status in Tallassee
| Household Income | Without Mortgage | With Mortgage |
| Less than $10,000 | 24 (3.8%) | 0 (0.0%) |
| $10,000 to $24,999 | 158 (25.3%) | 61 (12.9%) |
| $25,000 to $34,999 | 27 (4.3%) | 14 (3.0%) |
| $35,000 to $49,999 | 20 (3.2%) | 0 (0.0%) |
| $50,000 to $74,999 | 182 (29.2%) | 122 (25.8%) |
| $75,000 to $99,999 | 86 (13.8%) | 154 (32.6%) |
| $100,000 to $149,999 | 66 (10.6%) | 17 (3.6%) |
| $150,000 or more | 61 (9.8%) | 53 (11.2%) |
| Total | 624 (100.0%) | 473 (100.0%) |
Property Value to Household Income Ratio in Tallassee
| Value-to-Income Ratio | Without Mortgage | With Mortgage |
| Less than 2.0x | 250 (40.1%) | 62,590 (13,232.6%) |
| 2.0x to 2.9x | 140 (22.4%) | 155 (32.8%) |
| 3.0x to 3.9x | 57 (9.1%) | 189 (40.0%) |
| 4.0x or more | 177 (28.4%) | 35 (7.4%) |
| Total | 624 (100.0%) | 473 (100.0%) |
Real Estate Taxes by Mortgage Status in Tallassee
| Property Taxes | Without Mortgage | With Mortgage |
| Less than $800 | 389 (62.3%) | 14 (3.0%) |
| $800 to $1,499 | 57 (9.1%) | 371 (78.4%) |
| $800 to $1,499 | 0 (0.0%) | 27 (5.7%) |
| Total | 624 (100.0%) | 473 (100.0%) |
Health & Disability in Tallassee
Health Insurance Coverage by Age in Tallassee
| Age Bracket | With Coverage | Without Coverage |
| Under 6 Years | 358 (94.2%) | 22 (5.8%) |
| 6 to 18 Years | 619 (90.5%) | 65 (9.5%) |
| 19 to 25 Years | 536 (90.1%) | 59 (9.9%) |
| 26 to 34 Years | 564 (85.3%) | 97 (14.7%) |
| 35 to 44 Years | 511 (88.7%) | 65 (11.3%) |
| 45 to 54 Years | 315 (70.0%) | 135 (30.0%) |
| 55 to 64 Years | 664 (94.9%) | 36 (5.1%) |
| 65 to 74 Years | 625 (100.0%) | 0 (0.0%) |
| 75 Years and older | 387 (100.0%) | 0 (0.0%) |
| Total | 4,579 (90.5%) | 479 (9.5%) |
Health Insurance Coverage by Citizenship Status in Tallassee
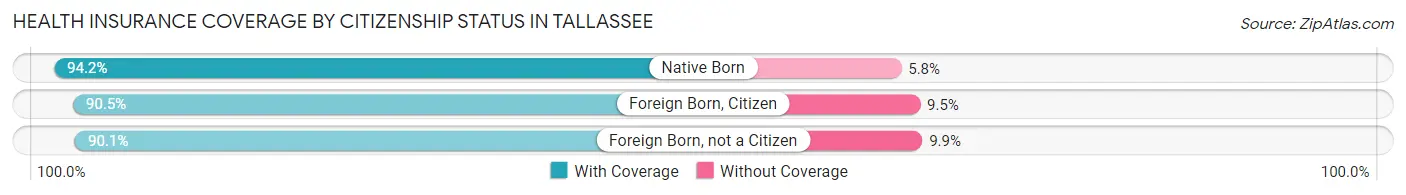
| Citizenship Status | With Coverage | Without Coverage |
| Native Born | 358 (94.2%) | 22 (5.8%) |
| Foreign Born, Citizen | 619 (90.5%) | 65 (9.5%) |
| Foreign Born, not a Citizen | 536 (90.1%) | 59 (9.9%) |
Health Insurance Coverage by Household Income in Tallassee
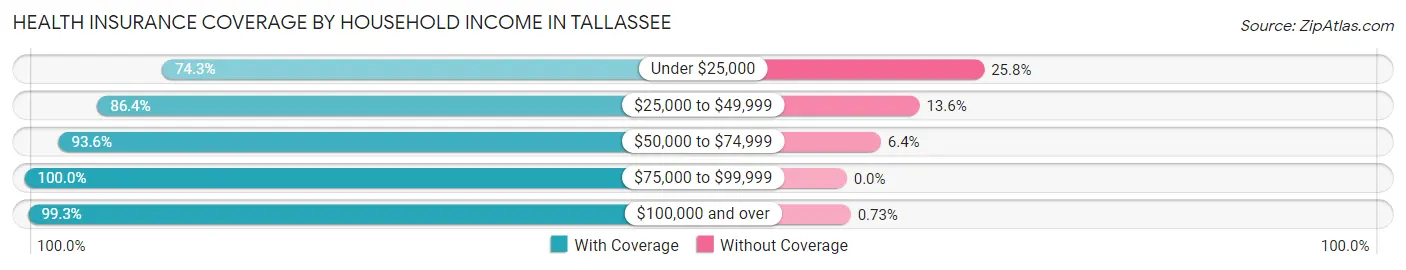
| Household Income | With Coverage | Without Coverage |
| Under $25,000 | 496 (74.3%) | 172 (25.8%) |
| $25,000 to $49,999 | 1,306 (86.4%) | 206 (13.6%) |
| $50,000 to $74,999 | 1,365 (93.6%) | 93 (6.4%) |
| $75,000 to $99,999 | 318 (100.0%) | 0 (0.0%) |
| $100,000 and over | 1,094 (99.3%) | 8 (0.7%) |
Public vs Private Health Insurance Coverage by Age in Tallassee
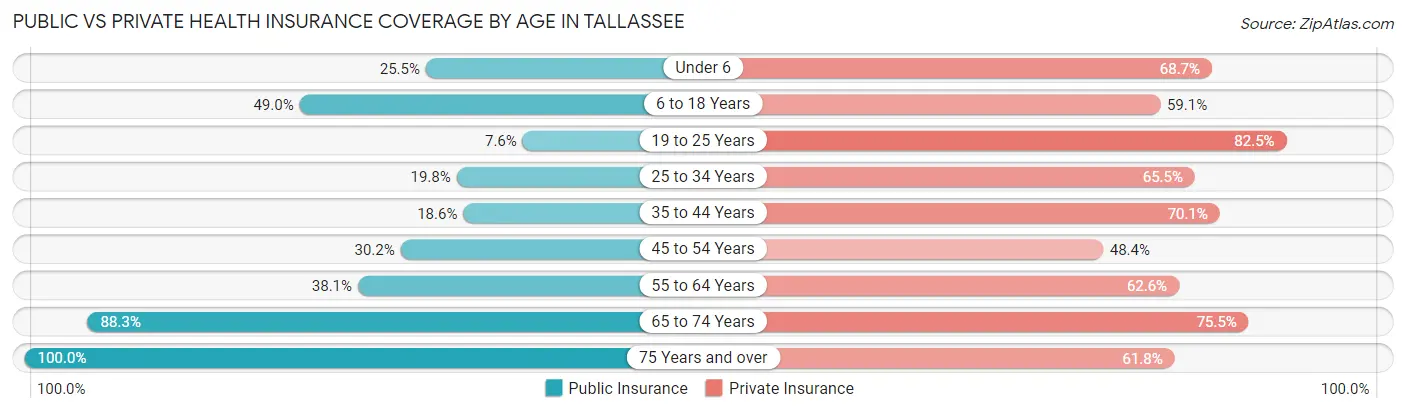
| Age Bracket | Public Insurance | Private Insurance |
| Under 6 | 97 (25.5%) | 261 (68.7%) |
| 6 to 18 Years | 335 (49.0%) | 404 (59.1%) |
| 19 to 25 Years | 45 (7.6%) | 491 (82.5%) |
| 25 to 34 Years | 131 (19.8%) | 433 (65.5%) |
| 35 to 44 Years | 107 (18.6%) | 404 (70.1%) |
| 45 to 54 Years | 136 (30.2%) | 218 (48.4%) |
| 55 to 64 Years | 267 (38.1%) | 438 (62.6%) |
| 65 to 74 Years | 552 (88.3%) | 472 (75.5%) |
| 75 Years and over | 387 (100.0%) | 239 (61.8%) |
| Total | 2,057 (40.7%) | 3,360 (66.4%) |
Disability Status by Sex by Age in Tallassee
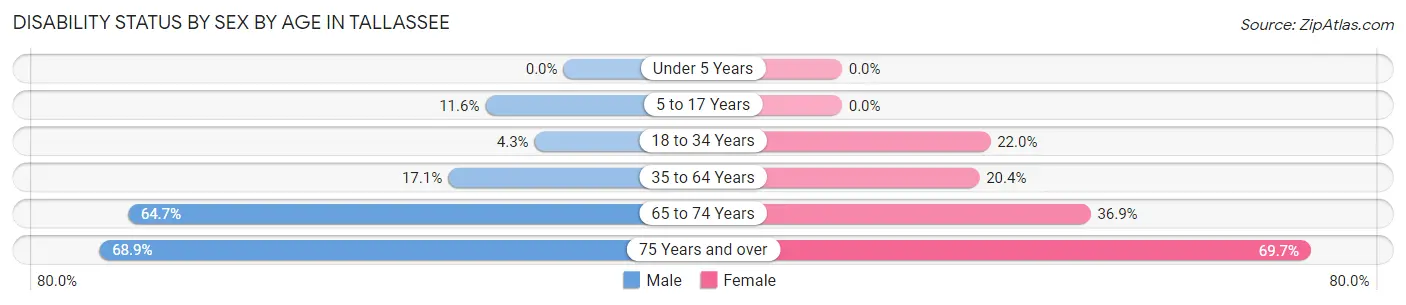
| Age Bracket | Male | Female |
| Under 5 Years | 0 (0.0%) | 0 (0.0%) |
| 5 to 17 Years | 37 (11.6%) | 0 (0.0%) |
| 18 to 34 Years | 35 (4.3%) | 134 (22.0%) |
| 35 to 64 Years | 122 (17.1%) | 207 (20.4%) |
| 65 to 74 Years | 194 (64.7%) | 120 (36.9%) |
| 75 Years and over | 51 (68.9%) | 218 (69.7%) |
Disability Class by Sex by Age in Tallassee
Disability Class: Hearing Difficulty
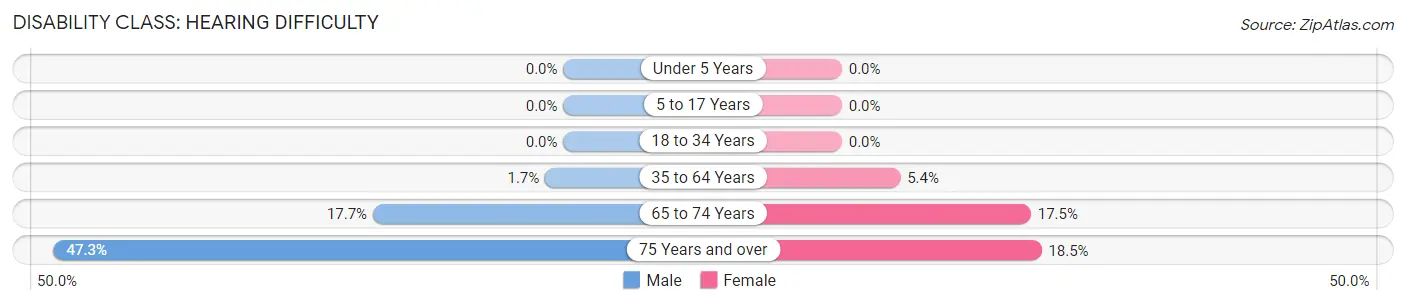
| Age Bracket | Male | Female |
| Under 5 Years | 0 (0.0%) | 0 (0.0%) |
| 5 to 17 Years | 0 (0.0%) | 0 (0.0%) |
| 18 to 34 Years | 0 (0.0%) | 0 (0.0%) |
| 35 to 64 Years | 12 (1.7%) | 55 (5.4%) |
| 65 to 74 Years | 53 (17.7%) | 57 (17.5%) |
| 75 Years and over | 35 (47.3%) | 58 (18.5%) |
Disability Class: Vision Difficulty
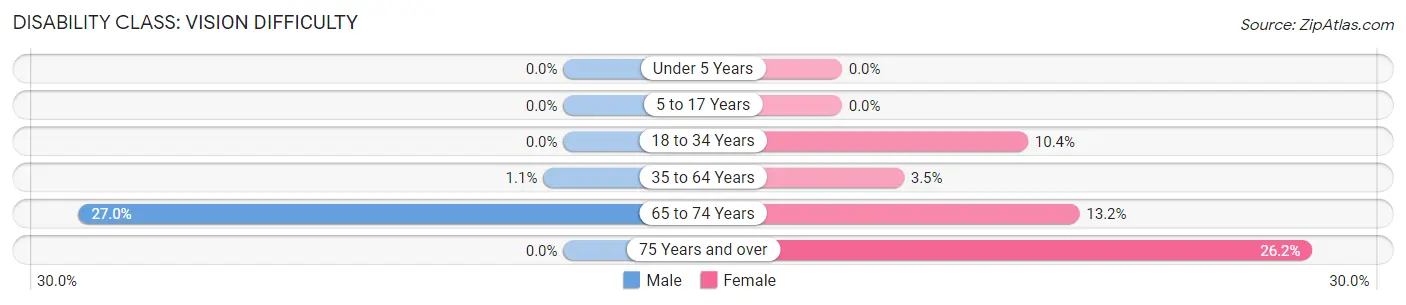
| Age Bracket | Male | Female |
| Under 5 Years | 0 (0.0%) | 0 (0.0%) |
| 5 to 17 Years | 0 (0.0%) | 0 (0.0%) |
| 18 to 34 Years | 0 (0.0%) | 63 (10.4%) |
| 35 to 64 Years | 8 (1.1%) | 35 (3.5%) |
| 65 to 74 Years | 81 (27.0%) | 43 (13.2%) |
| 75 Years and over | 0 (0.0%) | 82 (26.2%) |
Disability Class: Cognitive Difficulty
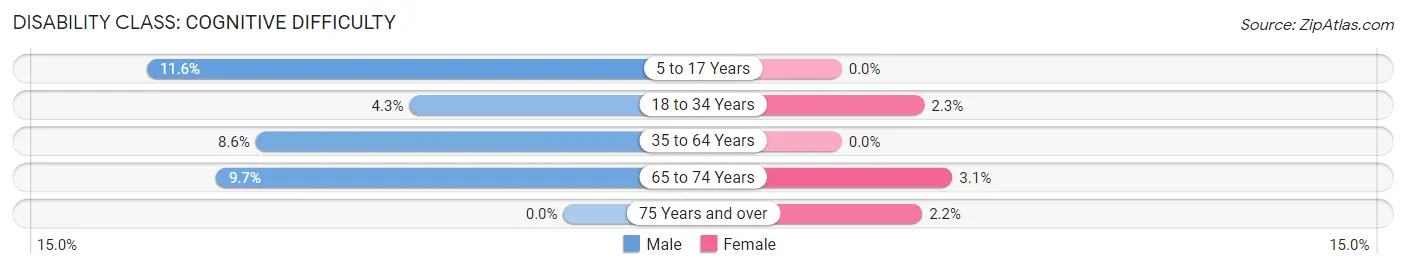
| Age Bracket | Male | Female |
| 5 to 17 Years | 37 (11.6%) | 0 (0.0%) |
| 18 to 34 Years | 35 (4.3%) | 14 (2.3%) |
| 35 to 64 Years | 61 (8.6%) | 0 (0.0%) |
| 65 to 74 Years | 29 (9.7%) | 10 (3.1%) |
| 75 Years and over | 0 (0.0%) | 7 (2.2%) |
Disability Class: Ambulatory Difficulty
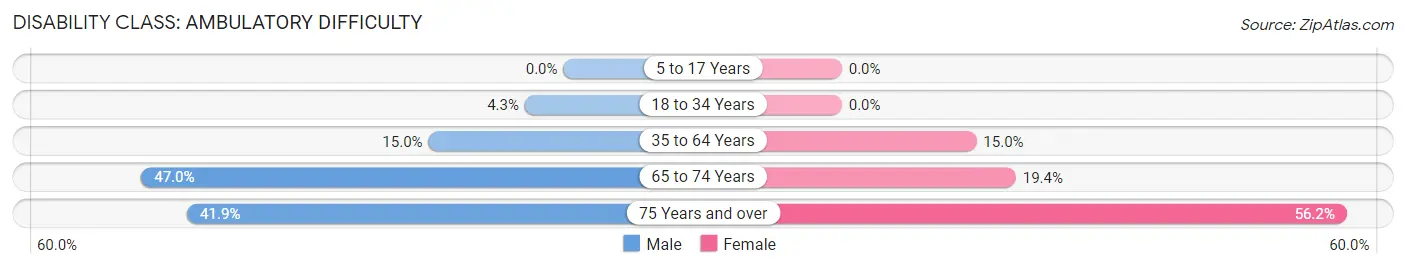
| Age Bracket | Male | Female |
| 5 to 17 Years | 0 (0.0%) | 0 (0.0%) |
| 18 to 34 Years | 35 (4.3%) | 0 (0.0%) |
| 35 to 64 Years | 107 (15.0%) | 152 (15.0%) |
| 65 to 74 Years | 141 (47.0%) | 63 (19.4%) |
| 75 Years and over | 31 (41.9%) | 176 (56.2%) |
Disability Class: Self-Care Difficulty
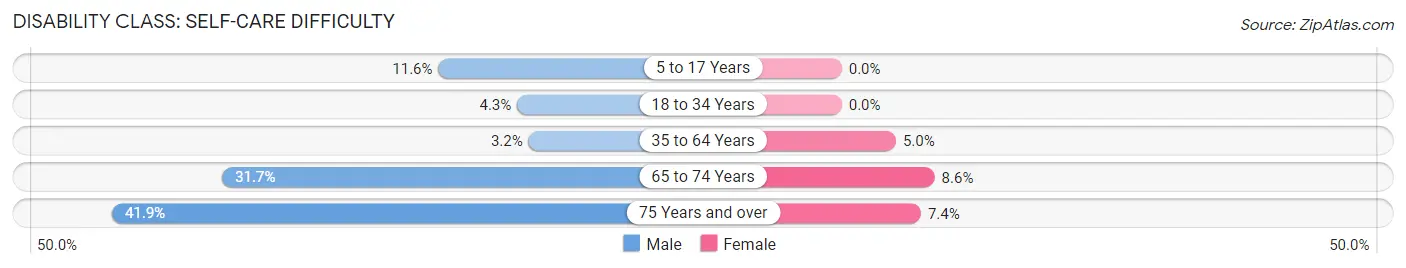
| Age Bracket | Male | Female |
| 5 to 17 Years | 37 (11.6%) | 0 (0.0%) |
| 18 to 34 Years | 35 (4.3%) | 0 (0.0%) |
| 35 to 64 Years | 23 (3.2%) | 51 (5.0%) |
| 65 to 74 Years | 95 (31.7%) | 28 (8.6%) |
| 75 Years and over | 31 (41.9%) | 23 (7.3%) |
Technology Access in Tallassee
Computing Device Access in Tallassee
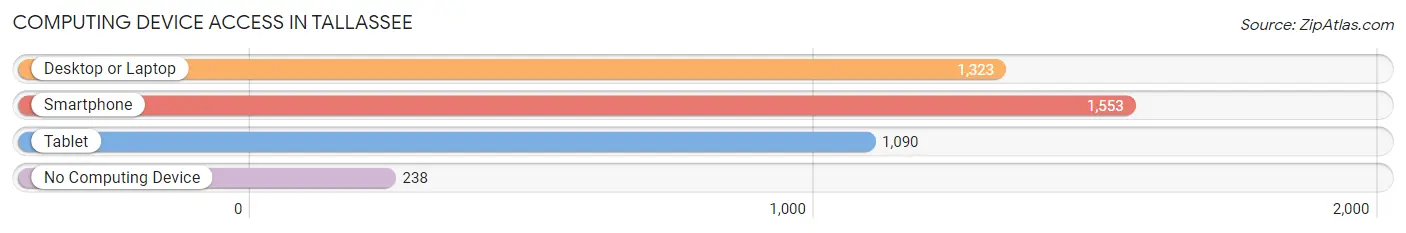
| Device Type | # Households | % Households |
| Desktop or Laptop | 1,323 | 63.9% |
| Smartphone | 1,553 | 75.1% |
| Tablet | 1,090 | 52.7% |
| No Computing Device | 238 | 11.5% |
| Total | 2,069 | 100.0% |
Internet Access in Tallassee
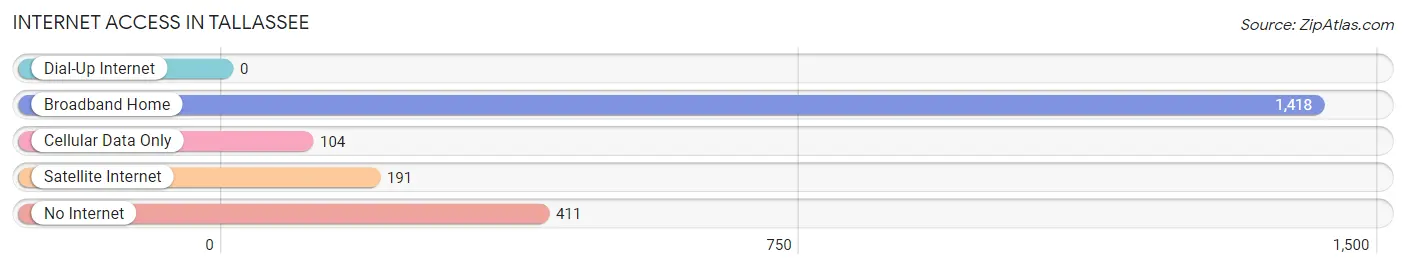
| Internet Type | # Households | % Households |
| Dial-Up Internet | 0 | 0.0% |
| Broadband Home | 1,418 | 68.5% |
| Cellular Data Only | 104 | 5.0% |
| Satellite Internet | 191 | 9.2% |
| No Internet | 411 | 19.9% |
| Total | 2,069 | 100.0% |
Tallassee Summary
Tallassee, Alabama is a small city located in Elmore County, Alabama. It is situated on the banks of the Tallapoosa River, approximately 20 miles east of Montgomery. The city has a population of approximately 4,500 people and is part of the Montgomery Metropolitan Statistical Area.
History
Tallassee was founded in 1838 by the Creek Indians, who named it “Tallasseehatchee”, meaning “town of the tall trees”. The city was originally a trading post for the Creek Indians, and was later used as a trading post for settlers. In 1842, the city was incorporated and the name was changed to Tallassee.
During the Civil War, Tallassee was a major manufacturing center for the Confederate Army. The city was home to several factories that produced ammunition, uniforms, and other supplies for the Confederate Army. After the war, the city experienced a period of economic decline, but was able to recover and become a major industrial center in the late 19th century.
Geography
Tallassee is located in Elmore County, Alabama, approximately 20 miles east of Montgomery. The city is situated on the banks of the Tallapoosa River, and is surrounded by rolling hills and forests. The city has a total area of 8.2 square miles, with a population density of 545 people per square mile.
Economy
Tallassee’s economy is largely based on manufacturing and agriculture. The city is home to several factories that produce a variety of products, including textiles, paper products, and automotive parts. The city is also home to several agricultural businesses, including poultry farms, cattle farms, and timber operations.
Demographics
As of the 2010 census, Tallassee had a population of 4,500 people. The racial makeup of the city was 79.2% White, 17.3% African American, 0.3% Native American, 0.7% Asian, 0.1% Pacific Islander, and 2.4% from other races. The median household income was $31,250, and the median family income was $37,500.
Conclusion
Tallassee, Alabama is a small city located in Elmore County, Alabama. It is situated on the banks of the Tallapoosa River, approximately 20 miles east of Montgomery. The city has a population of approximately 4,500 people and is part of the Montgomery Metropolitan Statistical Area. The city’s economy is largely based on manufacturing and agriculture, and the city is home to several factories that produce a variety of products. The racial makeup of the city is 79.2% White, 17.3% African American, 0.3% Native American, 0.7% Asian, 0.1% Pacific Islander, and 2.4% from other races. The median household income was $31,250, and the median family income was $37,500.
Common Questions
What is Per Capita Income in Tallassee?
Per Capita income in Tallassee is $27,014.
What is the Median Family Income in Tallassee?
Median Family Income in Tallassee is $60,682.
What is the Median Household income in Tallassee?
Median Household Income in Tallassee is $48,531.
What is Income or Wage Gap in Tallassee?
Income or Wage Gap in Tallassee is 43.3%.
Women in Tallassee earn 56.7 cents for every dollar earned by a man.
What is Inequality or Gini Index in Tallassee?
Inequality or Gini Index in Tallassee is 0.46.
What is the Total Population of Tallassee?
Total Population of Tallassee is 5,174.
What is the Total Male Population of Tallassee?
Total Male Population of Tallassee is 2,320.
What is the Total Female Population of Tallassee?
Total Female Population of Tallassee is 2,854.
What is the Ratio of Males per 100 Females in Tallassee?
There are 81.29 Males per 100 Females in Tallassee.
What is the Ratio of Females per 100 Males in Tallassee?
There are 123.02 Females per 100 Males in Tallassee.
What is the Median Population Age in Tallassee?
Median Population Age in Tallassee is 40.6 Years.
What is the Average Family Size in Tallassee
Average Family Size in Tallassee is 3.0 People.
What is the Average Household Size in Tallassee
Average Household Size in Tallassee is 2.4 People.
How Large is the Labor Force in Tallassee?
There are 2,423 People in the Labor Forcein in Tallassee.
What is the Percentage of People in the Labor Force in Tallassee?
54.2% of People are in the Labor Force in Tallassee.
What is the Unemployment Rate in Tallassee?
Unemployment Rate in Tallassee is 8.5%.